Research Institute of Industrial Economics P.O. Box 55665 SE-102 15 Stockholm, Sweden [email protected] www.ifn.se IFN Working Paper No. 1326, 2020 CEO Health Matti Keloharju, Samuli Knüpfer and Joacim Tåg

Welcome message from author
This document is posted to help you gain knowledge. Please leave a comment to let me know what you think about it! Share it to your friends and learn new things together.
Transcript

Research Institute of Industrial Economics
P.O. Box 55665
SE-102 15 Stockholm, Sweden
www.ifn.se
IFN Working Paper No. 1326, 2020
CEO Health Matti Keloharju, Samuli Knüpfer and Joacim Tåg

CEO Health*
Matti Keloharju
Aalto University School of Business, CEPR, and IFN
Samuli Knüpfer
BI Norwegian Business School and IFN
Joacim Tåg
Research Institute of Industrial Economics (IFN)
November 2021
Abstract
Using comprehensive data on 28 cohorts in Sweden, we analyze CEO health and its determinants and consequences. We find CEOs are in much better health than the population and on par with other high-skill professionals. These results apply in particular to mental health and to CEOs of larger companies. We explore three channels which could account for CEOs’ robust health. First, we find health predicts appointment to a CEO position. Second, the CEO position has no discernible impact on the health of its holder. Third, poor health is associated with greater CEO turnover. Here, both contemporaneous health and health at the time of appointment matter. These results are consistent with boards appointing CEOs with health robust enough to withstand the pressures of the job, correcting mismatches occurring at the time of appointment, and responding expediently to health shocks. Poor CEO health also has adverse consequences: we find a statistically significant association between mental health and corporate performance. This result can be traced to smaller-firm CEOs, for whom a one standard deviation deterioration in mental health translates into a performance reduction of 8% relative to the mean. These results suggest board oversight has enough friction for CEO health to affect performance. Keywords: CEOs, physical health, mental health, appointments, turnover, performance
* Corresponding author: Matti Keloharju, Aalto University School of Business, P.O. Box 21220, FI-00076 Aalto,
Finland, tel. +358-40-353-8043, e-mail [email protected]. We thank Johan Hombert, Petra Persson, and seminar and conference participants at the Aalto University School of Business, BI Norwegian Business School, Humboldt University Berlin, IFN, Jönköping International Business School, Karolinska Institutet, Lund University, Stockholm School of Economics, Toulouse School of Economics, University of Bologna, University of Hannover, University of Portsmouth, University of Southampton, and AFA, EFA, FEBS, and Labor and Finance Conference at the University of Chicago for valuable comments and suggestions, and the Academy of Finland, Jan Wallanders och Tom Hedelius stiftelse, Marianne and Marcus Wallenberg Foundation (2015.0048, 2020.0049), and Vinnova for financial support. Alexandra Allard, Teodor Duevski, Otso Hao, Glenn Nielsen, and Hedda Nielsen provided excellent research assistance. Declarations of interest: none.
1
1. Introduction
Boards of directors appoint Chief Executive Officers (CEOs) with knowledge of their traits,
skill sets, and the types of policies they are likely to adopt. The screening of CEO candidates may
be far from perfect, however.1 Sometimes, the CEO turns out to be a poor fit with the firm, resulting
in a clash of vision or personalities with the board. Other times, the qualifications of the CEO turn
out to be worse than what they seemed on paper, or the candidate withholds important information
on her ability to meet the challenges of the job. One potentially important piece of such information
is health.2 Health is a personal matter, and thus hard to verify at the time of hiring. Its private nature
also limits board’s ability to know how healthy the CEO is while in the job, and whether lackluster
firm performance is a result of poor CEO health.
Despite the potential importance of health on executive careers and firm performance, little
evidence exists on executives’ health and in particular on their mental health. In a recent review of
literature on leaders’ mental health, Barling and Cloutier (2017) conclude that “little is known about
leaders’ physical health” and that “leaders’ mental health remains largely unexplored.” The dearth
of evidence reflects lack of data: the executive may not wish to disclose the details of her condition
even if it is value relevant.3
1 The assignment models in Gabaix and Landier (2008), Terviö (2008), and Bandiera et al. (2015) assume a
frictionless executive labor market. Bandiera et al. (2020) use a model in which CEOs have private information about their types and show mismatches are quantitatively important in the data. Adams, Hermalin, and Weisbach (2010) and Hermalin and Weisbach (2017) provide surveys on the role of boards in corporate governance and on top executive assessment.
2 The financial press has reported many examples where the top executive of a large firm has been unable to function due to a health crisis. These examples include CEOs of Akzo, Lloyds, Pfizer, and Tokyo Electric Power taking leave or resigning due to fatigue, stress, overwork, and lack of sleep (Goff and Jenkins, 2011; Hill, 2012).
3 In the recent death of Fiat Chrysler’s Sergio Marchionne, the public and the company were not informed of the seriousness of the CEO’s health problems until he was on his deathbed (Ball and Sylvers, 2018; Coppola, Ebhardt, Campbell, 2018). Larcker and Tayan (2011) describe the deficiencies in the disclosure of former Apple CEO Steve Jobs’s health.
2
In this paper, we study CEO health using a unique combination of career, health, and firm data
from 28 cohorts of the Swedish population. Our data include comprehensive and objective health
information: we have data on every hospitalization, every open care treatment offered by a
specialized doctor, and every filled prescription in the entire country.4 Of the four million
individuals in our data, 40,000 served as CEO during the 2006–15 sample period.
Given the paucity of evidence on CEO health, we first analyze how health enters the decision
to hire a person in the CEO role. We document how CEOs’ health differs from the population and
other high-skill professionals and study whether such differences reflect health or other predictors
of CEO appointments. Addressing these questions is informative about how the CEO labor market
assigns executives to firms and what makes an executive climb the corporate ladder.
Using quasi-experiments involving CEO promotions and retirement, we then ask how the CEO
job affects health. These analyses tell us whether CEOs have health robust enough to withstand the
pressures of the job. Finally, we study to what extent mental and physical health predict CEO
turnover, and whether we can explain firm performance with CEO health. These questions inform
us about the frictions in the firms’ responses to CEOs’ health problems.
We follow a common practice in the medical literature of measuring health using a comorbidity
index. Taking into account the fact that many conditions co-occur in a given patient, comorbidity
indices pool various conditions into broader categories—in our case, into 18 physical and four
mental condition categories. Of these conditions, mental disorders are of particular interest because
of their serious effects on productivity and the stigma associated with them (Bharadwaj, Pai, and
4 Johnston, Propper, and Shields (2009) find that objective health measures explain economic outcomes better than
subjective measures.

3
Suziedelyte, 2017). Because of this stigma, information on top leaders’ mental health is particularly
hard to obtain.
Because most of our medical data come from prescriptions, we choose the Rx-Risk comorbidity
index as our main specification. This index, used before e.g. in Fishman et al. (2003) and Katon et
al. (2009), has been designed to use prescription data. It captures a wide array of conditions that are
chronic in nature. We estimate the weights for the comorbidity categories in the general population
in labor force by regressing the number of days on sick leave in a year on lagged dummies for the
comorbidity categories. Because of the wide range of health data in our disposal, the R-squared of
this regression is over twice of that using hospitalizations alone, making our analyses more
informative than those based on a narrower set of health indicators. The predicted values of this
regression are then used to generate health index values for our research subjects. Our use of
predicted values, in lieu of actual absences from work, circumvents challenges arising from potential
occupational differences in sick leave.
We start our analysis by studying how healthy CEOs are. We find they are considerably
healthier than other members of their cohort and gender: the population at large has on average 57%
higher predicted number of sick days than CEOs. Compared with the population, CEOs suffer less
from mental diseases than physical diseases. Their health also compares favorably with that of
lawyers, and it is on par with that of engineers, and finance professionals. CEOs of larger firms have
better health than any of these high-skill occupations.
These comparisons combine three channels: the role of health in making it to the top, the impact
of the CEO job on health, and CEO health problems leading to turnover. We study the first channel
by estimating the association of health with the number of years it takes for an individual to assume
a CEO position for the first time. In these analyses, we isolate the effect of health by controlling for

4
early-life physical condition, traits, and education.5 We find health and in particular mental health
explains CEO appointments. Our estimates imply a one-standard deviation change in the health
index is associated with a 19% change in the hazard of becoming a CEO. This effect is almost as
large as that of a one-standard deviation change in cognitive ability, and over one-quarter of the
effect of a one-standard deviation change in non-cognitive ability. Selection of healthier individuals
to CEO positions thus appears to be an important driver of the superior health of CEOs compared
to the population.
We next study the second channel by asking how the CEO job affects health. Some individuals
appointed to the CEO position may find the demands of the job overwhelming, which can have
adverse effects on health and narrow the CEO-population health difference. On the other hand, the
higher income, higher social standing, and better job control that comes with the CEO job can
compensate for some of the adverse health effects and positively contribute to the CEO health
premium over the population.6 We design a quasi-experiment that allows us to investigate the impact
of becoming a CEO on health. This analysis takes advantage of CEO promotions in which we can
identify two or more executives as potential contenders for the CEO position. Because the
contenders come from the same firm and can be followed before and after the CEO promotion, this
setting helps to account for firm- and individual-level differences in health.
We find executives appointed to CEO position seem to manage the demands of their new job
well: Their health develops in a manner similar to the executives not promoted to the CEO position.
In another quasi-experiment focusing on the end of the CEO career, we find that the health of retiring
CEOs develops similarly after the typical retirement age as that of the retiring work force in general.
5 See, for example, Cutler and Lleras-Muney (2008) for a review of the literature on early-life origins of health. 6 See, for example, Viscusi (1993) for a review on the literature on the value of health, and Frydman and Jenter (2010)
and Murphy (2013) for reviews on CEO pay.

5
We also find no evidence of differential trends in health prior to CEO promotions or retirement,
which suggests the effects can be given a causal interpretation. These results are consistent with the
executive labor market matching the right people to the right jobs, and suggest the CEO-population
health difference is not substantially affected by on-the-job effects.
The third and final channel contributing to the CEO-population health difference involves the
firms’ response to the incumbent CEO’s health problems. Other things being equal, we would expect
boards to be more inclined to dismiss CEOs who are mentally or physically less fit to run the firm.
We find that poor health—in particular, poor mental health—is highly significantly associated with
greater CEO turnover, even when controlling for public performance signals observable to the
board. Here, both contemporaneous health and health at the time of appointment matter. Thus, even
if an individual’s poor health goes unnoticed by the board at the time of appointment, she continues
to face a greater turnover risk while on the job. This result is consistent with boards correcting
health-related mismatches that occurred at the time of appointment.
The above three channels produce a pool of CEOs in good health. Nevertheless, we find CEOs
are not superhumans. They are treated for cancer, hyperlipidemia, rheumatoid arthritis, and gout
about as often as the age-gender equivalent member of the population. Some of these conditions
also expose them to other health shocks.7 Although their mental health is considerably better than
that of the population, each year 6% of them receive treatment for anxiety and tension, and 4% for
depression.
We assess whether these CEO health problems correlate with corporate performance by
regressing operating performance on the CEO’s health index and controls for firm and CEO
7 For example, the meta-analysis of Zhang et al. (2020) finds that underlying conditions such as heart disease,
respiratory diseases, and diabetes significantly increase the mortality of Covid-19. Booth et al. (2003), Badawi and Ryoo (2016), and Mertz et al. (2013) report similar evidence for severe acute respiratory syndrome (SARS), Middle East respiratory syndrome (MERS), and influenza, respectively.
6
characteristics. We find a statistically significant association between mental health and
performance. This result can be traced to smaller-firm CEOs, for whom a one standard deviation
deterioration in mental health translates into a performance reduction of 8% relative to the mean.
The relationship between physical health and performance in all firms regardless of size, and mental
health and performance among larger-firm CEOs, are of the expected sign but not statistically
significant at conventional levels. These results suggest board oversight has enough friction for CEO
health to affect performance. Boards may emphasize other signals of CEO quality, learn gradually
about the performance consequences of CEO health problems, incur personal costs from firing a
CEO, or retain an unhealthy CEO because finding a replacement and breaking her in is costly
(Taylor, 2010; Jenter and Lewellen, 2020).
Given the sensitivity of health matters and their potential implications for CEO careers, we
consider the possibility that CEOs avoid the use of the medical services altogether or in particular
in Sweden, minimizing the likelihood they will end up in centralized (though strictly confidential)
registers. To address this possibility, we study the association between our health metrics and
mortality, an outcome that does not suffer from any reporting bias. If CEOs refrained from using
medical services due to privacy reasons, regressing mortality on the health index would return a
weaker association for CEOs than for the population and make CEOs’ mortality appear higher than
that predicted by their health index. This is not what we see in the data; in fact, we find evidence of
the opposite. This suggests CEOs are healthier than what is predicted by their health index, perhaps
because they have better access to medical care or are more prone to seek help when necessary. This
not only speaks against CEOs’ heightened aversion to record-keeping, but also suggests our results
based on the health index can be viewed as conservative.
Our results have the following implications. First, the generally good CEO health and the lack
of a discernible effect of CEO promotions and retirement on health suggest the anecdotes on the
7
health crises of individual CEOs (some of which are listed in the second footnote) likely are just
anecdotes. Thus, there does not appear to be a widespread “CEO health crisis”. Second, the
association between CEO health and turnover is strong, even when we account for publicly
observable performance signals. Despite this relation, CEO health appears to matter for firm
performance, at least in smaller firms. These companies may benefit from improvements in
corporate wellness plans (Grobart, 2017), and the oft-neglected succession and contingency plans
that assign emergency backups for the CEO (Bennedsen et al, 2020; Cheng et al., 2020).
Our paper is related to three strands of literature. First, it is related to a small but growing
literature on executive health. Holland and Lel (2017) find publicly known CEO health shocks to
have a negative effect on firm value, while Limbach and Sonnenburg (2015) find good CEO
physical condition, as witnessed by finishing a marathon, to be positively associated with firm value.
Borgschulte et al. (2021) find that CEOs who serve under stricter corporate governance regimes
face poorer long-term health outcomes, reflected in an earlier age of death.
The study closest to ours is by Bennedsen, Pérez-González, and Wolfenzon (2020) who merge
register data on hospitalizations with firm data and find CEO hospitalizations to be associated with
lower firm performance and investment. Our study differs from theirs in the research questions
addressed, in its greater focus on mental health, and more comprehensive assessment of health using
drug prescriptions and specialized care. Although the hospitalizations studied in Bennedsen et al.
allow analyzing the impact of severe health shocks, they do not lend themselves to characterizing
CEO health in general. The wide spectrum of health issues captured by our measures, and the
comprehensive data on the population, makes it possible to compare CEOs to the population and its
interesting subgroups, and to understand the drivers of these differences. For the first time in the
literature, we analyze the selection of individuals in the CEO position based on health, investigate
how CEO health develops around promotions and retirement, study how a comprehensive

8
assessment of CEO health at appointment and during tenure is associated with turnover, and how
firm performance associates with CEO health issues that do not necessarily lead to hospitalizations.
These analyses reveal the vast majority of CEOs do not experience severe health problems
resulting in hospitalizations. In addition, boards appear to be attentive to a host of CEO health issues
that do not involve a hospitalization: for example, our results are the strongest for mental conditions,
which rarely require inpatient care. Taking this wider perspective suggests the aggregate value
losses resulting from CEOs’ health problems are not as large as one could perhaps extrapolate from
previous work.
Second, our paper is related to the literature on executive traits. Kaplan, Klebanov, and
Sorenson (2012), Gow et al. (2016), and Kaplan and Sorenson (2021) study the personal
characteristics of CEO candidates and CEOs and their association with corporate performance and
policies. Green, Jame, and Lock (2019) find extroverted CEOs to have better career outcomes.
Adams, Keloharju, and Knüpfer (2018) find cognitive ability, noncognitive ability, and height to be
associated with the likelihood to become a CEO, assignment of the executive to a larger company,
and corporate policies. We expand this literature by showing health is an important trait that makes
CEOs different and affects their climb in the corporate ladder.
Third, our paper is related to a vast literature linking long-term stress to various medical
conditions, and medical conditions to work performance. Cohen, Janicki-Deverts, and Miller
(2007), Thoits (2010), Cesarini et al. (2016) and Persson and Rossin-Slater (2018) review the
literature on the link between long-term stress and medical conditions. Ford et al. (2011) report the
results of a meta analysis on the strength of the link between various medical conditions and work
performance; Garcia-Gomez, Maug, and Obernberger (2020) offer a more recent review of the
literature from the finance perspective. Given the challenging nature of CEOs’ work, health could
matter more to their productivity than to the productivity of rank-and-file employees.

9
2. Data
The sample consists of individuals born between 1951 and 1978 who lived in Sweden in 2006–
15. Our data set combines information on individuals and firms from three sources.
Statistics Sweden. The bulk of these data come from the LISA database that covers the whole
Swedish population of individuals who are at least 16 years old and reside in Sweden at the end of
each year. This database integrates information from registers held by various government
authorities and covers for most variables the years 1990–2015. We extract information on labor and
total income, wealth, field and level of education, profession, career, family relationships, and
mortality, complementing the LISA database with data from the Multigenerational Register and the
Wealth Register. The family records allow us to map each individual to their partners, children,
parents, and siblings. We identify the executives other than CEOs based on their international ISCO-
88 (COM) classification of occupations (codes 122 and 123).8
The Swedish Companies Registration Office. The Swedish Companies Registration Office
keeps track of all companies, both public and private, and their CEOs and directors. The firm data
are available for all corporate entities that have a limited liability structure (“aktiebolag”) and report
having appointed a CEO (“verkställande direktör”), excluding financial firms that operate as banks
or insurance companies. These data record various financial-statement items, including sales and
the number of employees. By law, each firm must supply this information to the registration office
8 The ISCO-88 (COM) code 122 corresponds to “production and operations managers” and the code 123 to “other
specialist managers.” The occupation data available from the LISA database come mainly from the official wage-statistics survey (Lönestrukturstatistiken). Statistics Sweden also undertakes surveys of smaller firms that are not included in the official wage survey. The sampling design in the supplementary surveys is a rolling panel and all eligible firms are surveyed at least once every five years. Occupation information is available for each year, but the information may not be accurate for each year. To ensure we have accurate occupation information for every year, we require that the information be collected in the relevant year or earlier and for the correct employer-employee link.

10
within seven months from the end of the fiscal year. Financial penalties and the threat of forced
liquidation discourage late filing.
The data reports the starting and ending dates for CEOs in each firm. When the starting date is
missing, we assume the CEO was appointed in 1990. To map starting dates to annual data, we use
the first of November each year, the date when the individual firm-workers links are recorded in the
Statistics Sweden data. When CEO spells are overlapping in a given year for a given individual, we
only keep the spell in the firm with the highest total assets during the spell. To confine our analysis
to large enough firms, we only keep CEO spells that at least one point during our sample period
(2006–15) fulfill the following two criteria simultaneously: the firm a) reports information on total
assets exceeding 1M SEK, and b) has 5 or more employees. These sample criteria avoid starting
CEO spells only due to a firm growing beyond a certain threshold.
The National Board of Health and Welfare. Our health data come from the National Board of
Health and Welfare, which maintains comprehensive records of hospital visits, open care offered
by specialized doctors (from here on, specialized care), and prescriptions in Sweden. The hospital
and specialized care data include primary and secondary diagnoses along with the associated four-
digit ICD-10 codes for each diagnosis. The prescription data include all prescriptions along with the
associated ATC-code with at least four digits. These ATC codes are further translated into diagnoses
using established medical literature. All three data sets cover the years 2006–15. Appendix 1 offers
a short description of the health care system in Sweden.
Military Archives. The Military Archives stores information on the cognitive, non-cognitive,
and physical characteristics of all conscripts. The purpose of the data collection is to assess whether
conscripts are physically and mentally fit to serve in the military and suitable for training for
leadership or specialist positions. The examination spans two days and takes place at age 18.
Lindqvist and Vestman (2011) offer a comprehensive description of the testing procedure. These
11
data are available for Swedish males drafted in 1970–1996. Military service was mandatory in
Sweden during this period, so the test pool includes virtually all Swedish men born between 1951
and 1978.
3. CEO health compared to the population and high-skill professionals
3.1. Descriptive statistics
Table 1 Panel A reports descriptive statistics on the sample individuals. We are primarily
interested is CEOs, which we divide into two groups: those running companies with less than SEK
100 million of total assets (small-firm CEOs, about 90% of the CEO observations; SEK 1 ≈ USD
0.12) and those above (larger-firm CEOs, about 10% of the CEO observations). For benchmarking
purposes, we also report on the results for three other high-skill professional categories: lawyers,
engineers, and finance professionals. Here, we have defined finance professionals as professionals
who work in the finance industry and have a university degree.
Our analysis focuses on individuals who were 38–64 years old during our sample period 2006–
15. CEOs are on average in their late forties, i.e., 1–3 years older than the population average of 46
years. They are also much more likely to be men, better educated, and earn three to eight times as
much as the population on average.
Table 1 Panel B reports on a subsample of men for which we have additional trait information
from the military enlistment at age 18. Consistent with Adams, Keloharju, and Knüpfer (2018),
CEOs have higher cognitive and non-cognitive ability and are taller than the population. They also
possess better cardiovascular fitness and muscle strength and are slightly slimmer than the
population. All of these traits improve in firm size. Larger-firm CEOs compare favorably with the
other high-skill professions in almost all traits.

12
Table IA1 reports on descriptive statistics on the sample firms. Their mean total assets are SEK
200 million, i.e. about USD 24 million. Just 0.7% of the firms are publicly traded. Government
owned firms account for less than 3% of the firms.
3.2. Differences in health between CEOs and the population
Table 2 studies the health outcomes of the sample individuals. This analysis reports on 22
conditions that can be expected to have a significant and persistent impact on productivity, are
sufficiently different from one another to be considered independently, and can be tracked using
prescription and diagnosis data. The conditions are a subset of the 26 constituents of the Rx-Risk
Comorbidity Index, a chronic disease index designed to assess the health of a patient on the basis of
the ATC codes in prescription data.9 The index, used e.g. in Fishman et al (2003) and Katon et al
(2009), takes into account the fact that many conditions co-occur in a given patient, pooling various
conditions into broader categories. Each comorbidity category is dichotomous—it is either present
or it is not.
Apart from prescriptions, Table 2 uses the diagnosis information embedded in the
hospitalization data to assess health outcomes. We assign a condition to an individual in a year if
she has that condition in that year either according to prescription or hospitalization data. To our
knowledge, no direct translation of the Rx-Risk categories to ICD codes is available. We use the
medical literature listed in Table IA2 for this translation.
9 Table IA2 reports the mapping of the Rx-Risk comorbidity categories to ATC data. The mapping follows Quinzler
et al. (2019) except when the codes in Quinzler et al. are at a finer level than in our ATC data. In these cases, we use a coarser ATC specification unless this results in an overlap between different comorbidity categories in the index, in which case we omit the codes in question. For four rare conditions (HIV, cystic fibrosis, transplant, and ESRD), the use of coarser ATC data generates an incidence rate that materially differs from that of the population in Sweden. We drop these conditions from the index.

13
The first column of Table 2 Panel A reports on the yearly incidence of the 22 conditions in the
population, separated to four mental and 18 physical health diagnoses. The remaining seven
columns report on the age- and gender-adjusted incidence of these conditions relative to the
population in the high-skill professional groups.10 Age and gender adjusting is important because
the groups vary in age and gender, which again are associated with the incidence of the conditions.
Our results show the high-skill professional groups have a lower incidence of almost all
conditions than the population on average. For example, the age- and gender-adjusted incidence of
depression among larger-firm CEOs is 50% of the population average, while the corresponding
incidence among lawyers is 76%. The few conditions whose incidence among CEOs is comparable
to the population include hyperlipidemia, rheumatoid arthritis, cancer, and gout.
To get a more holistic idea of the health of CEOs, we aggregate the data on individual
conditions to a health index, computed separately for the population and for each high-skill
professional group. Given that the conditions vary in severity, we wish to avoid using unweighted
metrics such as the number of prescriptions or hospitalizations, and rather weigh the conditions
according to how taxing they are for the individual. We achieve this by calibrating a health index
following established medical literature. Because our data is richer in outcomes and represents a
different population than those of readily available indices, we calibrate the index weights ourselves
rather that use the weights estimated in previous studies.
We estimate the index weights by regressing the number of days on sick leave in a year—a key
health outcome, used e.g. in de Vroome et al. (2015) and, Zhang, McLeod, and Koehoorn (2016)—
on one-year lagged dummies for the comorbidity categories.11 We estimate this regression using
10 Table IA3 reports the incidence of these conditions in the high-skill professional groups without age and gender
adjustment. 11 The convention of using a one-year lag is common in the medical literature. See, e.g. Gagne et al. (2011) and
Lemke, Weiner, and Clark (2012).

14
data for all individuals born in 1951–78 who are in the work force and use the coefficients, listed in
Table IA4, to generate predicted health index values for our research subjects. Thus, the weighing
is immune to CEOs possibly being less likely to take sick leave than the population in general.
For each comorbidity category, the regression includes three mutually exclusive variables that
indicate the diagnoses related to whether the category appears in prescription data only, specialized
care data but not in hospitalization data, or in hospitalization data. In addition, consistent e.g. with
Charlson et al. (1987) and Elixhauser et al. (1998), the regression includes controls for age and
gender. Almost all coefficients are positive and highly significant. The most important exception to
this rule is hyperlipidemia, which takes a significantly negative coefficient in specialized care and
prescriptions data. Pratt et al. (2018) also finds that hyperlipidemia retains a negative coefficient in
an index regression similar to ours. The R-squared of the model, 10.5%, is in the same ballpark as
that for similar models in the medical literature (see, e.g., Newhouse et al., 1989 and Fishman, 2003).
If we estimated the same regression using hospitalization data alone, the R-squared would be less
than half of this, 4.1%. Therefore, having access to more comprehensive health data allows us to
gauge the health of the sample individuals much more precisely.
Table 2 Panel B reports on the health index for each group, adjusted for age and gender. The
average member of the population takes 6.9 days of sick leave every year, of which 3.6 days are due
to mental health and 3.3 days due to physical health. CEOs and in particular larger-firm CEOs
exhibit better health than the other high-skill professional groups or the population. For larger-firm
CEOs, the predicted number of sick leave days is 56% of that of the population. This compares
favorably with the other high-skill professional groups, for whom the predicted number of sick days
is 62–73% of that of the population.
Decomposing the health index into its mental and physical health components suggests that
CEOs differ from the population and from the other high-skill categories more in their mental health.
15
For larger-firm CEOs, for example, the mental health index is 50% of the population whereas the
physical health index is 62% of that of the population. Larger-firm CEOs have a 7-percentage point
lower mental health index value than any of the other professional categories, whereas the
corresponding difference for physical health is 5 percentage points. The health of small-firm CEOs
echoes this result. Their mental health is about the same or better than that of the other professional
categories, whereas their physical health is less good than that of engineers and finance
professionals. Figure 1 summarizes the results of Table 2 Panel B. Table IA5 reports a correlation
table including the health indices and the variables reported in Table 1.
The above results are not sensitive to the health outcome measure. In Table IA6 we calculate
the health indices using two alternative health-related outcomes—early retirement and mortality—
and find at least as strong results as in Table 2. CEOs have better overall health than any of the other
high-skill professional categories, and they outperform their peers in particular in mental health.
Does the importance of CEO health increase in firm size? Figure 2 studies assignment by
sorting newly appointed CEOs into 50 bins on firm’s total assets and reporting the age and gender
adjusted average CEO health index value for each bin. Panel A plots for each bin the CEOs’ average
mental health index value, scaled by the corresponding mental health index value for the population.
Panel B plots the same relationship for physical health, and Panel C for the combined mental and
physical health index. In each panel, the CEO health index value decreases about linearly in firm
size. Consistent with Table 2 Panel B and Figure 1, CEOs differ more from the population in mental
health than in physical health.
The fact that CEO health improves in firm size suggests CEOs may be selected to their positions
based on health. This interpretation is consistent with assignment theories in which positive
assortative matching of the “best” CEOs to largest firms maximizes value (Gabaix and Landier,
2008; Terviö, 2008).
16
3.3. Are health records of CEOs comparable to those of the population?
The robust health we report for CEOs in Table 2 could be due to them avoiding the use of
medical services altogether or in particular in their home country (see, for example, Babitch et al.,
2012, for a review of the evidence on cross-sectional differences in health care use). To analyze
whether our results are affected by CEOs’ register aversion, we correlate measured health with
mortality—an observable outcome intimately related to true health.
We estimate a regression that explains mortality with the health index, CEO dummy, and their
interaction. If the health index mapped CEOs’ health advantage to mortality perfectly, both the CEO
main effect and the interaction effect would by construction be zero. Likewise, if CEOs were more
likely than the population to refrain from using medical services due to privacy reasons, the health
index would return a weaker association for CEOs compared to the population. This weaker
correlation would also make the CEOs’ mortality appear higher than that predicted by their health
index. We test these hypotheses in Table 3.
For each individual, the dependent variable counts the number of years until death over the
2007–15 period and the independent variables measure health in 2006. We estimate a Cox
proportional hazards model that assumes censoring after the last sample year. We divide the sample
into CEOs and non-CEOs based on an individual holding a CEO position in 2006. The regression
also includes age and gender indicators. In the first column mental and physical components enter
separately, while in column 2 we use the combined health index.
Column 1 finds that both physical and mental health are highly significantly related to mortality
(t-values 57 and 52, respectively). Column 2 finds that the combined health index variable retains a
t-value of 97, making it even more significantly related to mortality than its subcomponents. The
most relevant results relate to the coefficient of the CEO dummy and its interactions with the health

17
index. The interactions are positive, and two of them statistically significant. In specification 1, the
interaction with physical health (0.010; t = 2.5) suggests that for CEOs, the health index is 30%
more predictive of mortality than for the population at large. Specification 2 documents an even
stronger interaction between the pooled health index and CEO status. The CEOs’ stronger
predictability of mortality translates into them recording a significantly lower mortality when judged
against the prediction emanating from their health index (t = –8.4 in specification 2).
These results reject the hypothesis that CEOs would be more averse to record keeping than the
population. Instead, they are consistent with CEOs having better access to medical care, being
medically more literate, or being more prone to seek help when necessary. What all these scenarios
have in common is that they make CEOs more likely to enter health registers—and thus appear less
healthy. Therefore, our results can be viewed as conservative representations of the true health of
CEOs.
4. Determinants and consequences of CEO health
4.1. How does health affect CEO appointments?
The CEO health advantage documented in Table 2 combines the role of health in making it to
the top, the impact of the CEO job on health, and CEO health problems leading to turnover. We
study the first channel by analyzing in Table 4 the association of health with the number of years it
takes for an individual to assume the position as a CEO for the first time. We estimate a Cox
proportional hazards model that assumes censoring after the last sample year to account for the fact
that some of our sample subjects may assume a CEO position only after the end of the sample
period. The three first columns decompose health into mental and physical components, while
columns 4–6 study them jointly.

18
Column 1 runs the analysis in the entire population. Apart from indices for mental and physical
health in each year, the regressors include indicators for age, gender, and year. Results suggest
mental and physical health indices are associated with the hazard to become a CEO (t-values –27
and –14, respectively): the better the health, the sooner the individual becomes a CEO. The
coefficient for mental health (–0.036) has a higher absolute value than that for physical health (–
0.021), suggesting that mental health is an even more important predictor of CEO appointment than
physical health.
We narrow our sample to individuals for whom we have data on mandatory military enlistment
at age 18. This allows us to control for many early-life predictors of CEO appointments: education,
cognitive ability, non-cognitive ability, height, cardiovascular fitness, muscle strength, and the body
mass index (see Adams et al. (2018) for an analysis of how early-life variables predict CEO
appointments).
Column 2 in Table 4 reports the results of column 1’s specification in the military subsample.
The coefficients in this sample are statistically highly significant but somewhat smaller than in
column 1. They also retain the ranking of the importance of mental health compared to physical
health. Column 3 adds early-life controls to the regression equation. All controls are of the expected
sign and, except for physical fitness, statistically significant at least at the 5% level. The mental and
physical health coefficient sizes decrease from column 2 by 27% and 34% respectively, but remain
highly significant (t-values –11 and –5, respectively). These numbers imply a one-standard
deviation change in the mental health index decreases the hazard of becoming a CEO by
(𝑒 . ) . − 1 = −24%. For the physical health index, this magnitude equals (e . ) . −
1 = −11%. For comparison, the corresponding one-standard deviation effect sizes range from 1.3%
to 9% for the measures of early-life physical condition. Cognitive and non-cognitive abilities show
effects of 21% and 68%, respectively, whereas university education increases the hazard by 42%.

19
Columns 4–6 report on the association between pooled physical and mental health and CEO
appointments. The results mirror those reported in columns 1–3. In each specification the combined
health variable retains a coefficient that is close to the mean of its subcomponents. The combined
health variable less noisily associates with the likelihood of appointment than its subcomponents,
commanding t-values that range from –32 in column 1 to –13 in column 3. All in all, these results
suggest health and in particular mental health is an important predictor of CEO appointments and
this relation is difficult to capture with early-life correlates of CEO appointments.
4.2. Changes in health around CEO promotions and retirement
The second channel that can contribute to the CEO health advantage we document in Table 2
involves the effect of the CEO job on health. Insufficient screening along the health dimension
would result in promotions of executives that struggle with the demands of the CEO job. All else
equal, such demands would make an executive promoted to a CEO position more likely to
experience health problems (e.g., Schnall et al., 1994). However, the CEO job is also associated
with higher income, higher social standing, and better job control, which can contribute to more
robust health (e.g., Marmot et al., 1991, 1997; Karasek, 1979). To study these effects, we apply a
difference-in-differences framework, where we compare the health of appointed CEOs to that of
their peers before and after the appointment.
To accurately measure the peer group and to control for the work environment, we focus on
CEO appointments in which we can identify the most likely contenders for the CEO position. Here,
we define this group as the four highest paid executives in the same firm in the year prior to the

20
turnover and the person appointed to the position in case of external appointment.12 Our analysis
regresses the health index of each job contender on CEO appointment indicator, an indicator for the
period after appointment, and their interaction. Our regressions also control for age, gender, and
year, and we include fixed effects for each CEO turnover event. These fixed effects identify the
effect of becoming a CEO from within-firm variation and thus keep the firm’s working environment
and the demands on all of its most important executives constant.13
Table 5 reports the results of the analysis. We run six regressions across two dimensions: the
length of the post-appointment period (two or four years) and the components of the health index
(mental, physical, or both). The analysis produces two kinds of results. First, individuals appointed
to the CEO position have similar health as their peers. All the health index differences between the
CEO and her peers are insignificant at conventional levels. Second, and more importantly, the health
of the individuals who are appointed to the CEO position develops similarly to that of their peers.
The interaction term is insignificant at conventional levels for all health components, regardless of
the length of the time period in which we measure the health post appointment. The 95% confidence
intervals of the largest health index estimates (for mental health index, in the fourth specification,
(−0.07, 0.30); for physical health index, in the fifth specification, (−0.33, 0.14)) allow us to reject
effects larger than 3% of one standard deviation in the mental or physical health index (the standard
deviations are 10.4 and 9.2 days, respectively). These results suggest the CEO position has no
discernible impact on the health of its holder.
Table IA7 confirms we successfully identify events in which an individual becomes a CEO.
Replacing the health indices with logged income, it shows the individual appointed to CEO enjoys
12 The setting reminds that of Olenski et al. (2015) and Borgschulte and Vogler (2019) who compare the mortality of
elected political leaders to that of their runners-up. If there are only two or three individuals in the firm with an executive status, we take the actual number of executives.
13 We obtain similar results from regressions that remove these fixed effects.

21
10%–12% higher pay after the appointment compared to the mean pay in our sample. Figure IA1
plots the raw health indices used in the regressions in Table 5 as a function of event time. Panels A
and B show there are no discernible differences in the pre-trends in health prior to the CEO
appointment. These figures also corroborate the regression results by showing no clear differences
in the development of health of the two groups of individuals.
Table 6 complements the analysis in Table 5 by studying what happens to CEOs’ health after
they leave the CEO position compared with other members of the work force. To minimize the
effect of health-related retirements on our analysis, we focus on changes in health around the time
when individuals typically retire. More specifically, we narrow our sample to 681,000 individuals
(of whom 2,600 are CEOs) who are born in 1942–48. The retirement sample does not overlap with
the core sample analyzed in the earlier tables, which consists of cohorts born in 1951–78.
Panel A reports on descriptive statistics on the individuals in the retirement sample at the age
of 64, i.e. two years before the median retirement age of 66. 92% of the retiring CEOs are men, and
they earn on average about four times as much as retiring non-CEOs do. Panel B reports on
difference-in-difference regressions that explain predicted days of sick leave with an indicator for
CEOs. This indicator is interacted with a dummy variable for the years after the median retirement
age of 66. All regressions additionally include year and gender indicators; the construction of the
sample around the age of 66 requires the removal of age indicators.
Consistent with Table 2, the main effects for the CEO indicator are negative and statistically
highly significant with t-values ranging from –5 to –10. This suggests that retiring CEOs have on
average better health than the population in labor force. The post-retirement dummy is also positive
and highly significant, indicating the worsening of health over time. The variable of our primary
interest, the interaction between CEOs and post-retirement, takes a positive coefficient for the
physical health index, while the sign for the mental health index depends on the specification. These

22
results and the results for the overall health index are not statistically significant at conventional
levels. These results suggest that the health of individuals who retire from the CEO position
develops similarly after retirement as that of the average member of the work force.
Panels C and D in Figure IA1 show health of CEOs and other individuals develop in similar
ways prior to retirement. These figures also confirm the notion CEOs are in better health prior to
retirement. This health advantage also survives in the years after retirement.
4.3. How does health affect CEO turnover?
The third and final channel contributing to the CEO-population health difference involves the
firms’ response to the incumbent CEO’s health problems. We gauge this response by testing whether
CEOs leave the company sooner when facing health problems. Our analysis benefits from the fact
that each individual appearing in the sample has been selected by the board to run a firm, which
makes the individuals more homogenous in terms of potential non-health-related correlates of
health.
Table 7 Panel A reports results from a survival analysis that explains the number of years it
takes a CEO to leave her current company with her health index and control variables in the previous
year. Like in Table 3 and 4, we estimate a Cox proportional hazards model that assumes right-
censoring after the last sample year.14 Here, we count CEO tenure from the start of the CEO spell;
when data on the start of the spell is missing, we assume left-censoring before 1990. Our main
variable of interest is the health index, which we decompose into mental and physical health
components. The firm-level control variables include firm size, sales growth, operating return on
assets, indicators for firms managed or owned by at least two members of the same family, listed
14 Campbell et al. (2011) and Jenter and Kanaan (2015) also estimate duration models to study CEO turnover.

23
and government held firms, and industry. All regressions include tenure and year, age, and gender
indicators. The two rightmost specifications additionally control for early-life traits and the level of
education by focusing on the subsample for which we have data from the military enlistment. Table
IA8 reports a correlation table on the variables employed in the turnover analysis.
We find that CEO’s health, in particular mental health, is highly significantly associated with
the time it takes for her to leave the company. This association is also economically significant. In
specification 2, for example, a one standard deviation change in mental health is associated with a
7.3% greater turnover hazard (t = 11.9), and a one standard deviation change in physical health is
associated with a 2.8% increase in turnover hazard (t = 3.8). Combined, their association with CEO
turnover hazard is almost one-half of that of the operating return on assets (−21.4%), a strong
predictor of turnover (e.g., Denis and Denis, 1995). The strength of the turnover-health relation is
similar in all four specifications. All in all, these results are consistent with Bennedsen at al. (2020)
and suggestive of boards responding to CEO health problems.
How do boards respond to mismatches that occur at the time of appointment? Table 7 Panel B
studies this by regressing the time from appointment to leaving the company on the health index at
the time of appointment. To the extent that firms’ tastes for CEO health do not vary in a significant
way, the health index can be thought of representing mismatch between the CEO and the firm,
perhaps because the board did not notice her true state of health at the time of appointment. The
sample is much smaller than that in Table 7 Panel A, because CEO health at appointment is not
available prior to 2006. Otherwise, the structure of the test is identical to that of Panel A.
We find that mental health at appointment significantly predicts CEO turnover. In specification
2, for example, a one standard deviation change in mental health at appointment is associated with
a 4.6% greater turnover hazard (t = 4.0). The results are even stronger in the subsample controlling
for early-life traits. In specification 4, a one standard deviation change in mental health at

24
appointment is associated with a 5.2% greater turnover hazard (t = 4.0), whereas a one standard
deviation change in physical health is associated with 3.0% greater turnover hazard (t = 2.1). The
mental component retains a larger coefficient in all specifications, and the difference is statistically
significant at the 5% level in the two first specifications. All in all, these results suggest that even if
the board underestimates the effect of a CEO candidate’s health on productivity, or she manages to
win the job by concealing her poor health, the board is ultimately likely to figure out her true
productivity and replace her if necessary.
4.4. Does CEO health affect firm performance?
Our evidence so far shows health plays an important role in CEO hiring and firing decisions.
Nevertheless, imperfect screening at the appointment stage and frictions in the CEO dismissal
process can make CEO health consequential for corporate performance. We assess this possibility
by studying the association between CEO health and corporate performance. In line with previous
literature (e.g., Bertrand and Schoar, 2003, and Bennedsen et al., 2020), we measure corporate
performance by the operating return on assets (OROA).
Table 8 Panel A reports regressions that explain a firm characteristic in a year with its CEO’s
health index and control variables in the previous year. The firm-level control variables include firm
size and indicators for firms managed or owned by at least two members of the same family, listed
firms, government held firms, and industry. All regressions include year, age, and gender indicators.
Consistent with Bennedsen et al. (2020), we find a negative association between the health
indices and OROA. Column 1 reports deterioration of the mental (physical) health index by one
standard deviation is associated with a 0.62% (0.11%) decrease in OROA. Given that the average
OROA is 8.11%, these figures translate into a performance reduction of 8% (1.4%) relative to the

25
mean. The coefficient for OROA is statistically significant for mental health (t = –3.1) but not for
physical health (t = –1.2). These results are in line with our earlier results on the relative strength of
the mental and physical health components.
Columns 2 and 3 divide the sample into two based on firm size: companies with less than 100
million SEK of total assets, and those with more. The coefficients are considerably larger for small
than for larger firms: for mental health, for example, the performance effects corresponding to a one
standard deviation deterioration in the health index are –0.65% (t = –3.0) and –0.25% (t = –0.6),
respectively. The difference between the corresponding regression coefficients (t = 0.9) is not
significant at conventional levels, an indication that the health-performance relationship is noisy.
Table IA9 corroborates this finding by showing that the pairwise correlations between the health
indices and OROA are less than 0.01, i.e. considerably lower than the corresponding correlations
between the health indices and CEO turnover which range from 0.02 to 0.06 in Table IA8 Panel A
and B.
What is the economic significance of these performance findings? The statistically significant
results can be traced to the mental health of small-firm CEOs. For the average small firm, a one
standard deviation change in the mental health index predicts an operating performance change of
–0.65% × SEK 16 million = SEK –104,000, which corresponds to one and a half months’ CEO pay
(104,000 / 858,000 * 12 = 1.45). We consider this outcome neither trivial nor dramatic; the fact that
physical health issues are more common among CEOs than mental health issues, and that the
physical health index is not statistically significantly associated with performance, suggests it is not
possible to detect a discernable health-performance effect for the typical firm. All in all, our results
suggest that health-related corporate governance has enough friction to affect firm performance, but
the magnitude of these consequences is limited.

26
5. Conclusion
Despite the important role CEOs play in the economy, little is known of their health. We study
the health of CEOs by using a unique combination of data on specialized care, hospitalizations, drug
prescriptions, and labor market outcomes of 28 cohorts in Sweden.
We find health predicts appointment to a CEO position, even when early-life physical
condition, traits, and education are controlled for. Healthier CEOs also run larger corporations and
are significantly less likely to leave their position. Despite of the challenges associated with the job,
the health of the individuals selected to the CEO job develops similarly as that of their peers. This
result is consistent with the idea that boards are successful in selecting CEOs with health robust
enough to withstand the pressures of the job. Both contemporaneous health and health at
appointment associate with turnover, suggesting that boards respond to health problems and correct
mismatches occurring at the time of appointment.
The important role of health in CEO hiring and firing leads us to ask whether there is enough
friction for CEO health to affect firm performance. This appears to be the case: we find a statistically
significant correlation between CEO mental health (but not physical health) and corporate
performance. However, this relationship is clearly noisier than the corresponding relationship
between health and CEO turnover.
Taken together, our results offer some comforting news on CEO health and its implications to
firms. CEOs generally have good health and are resilient to the demands of their job, and boards
appear to be attentive to CEO health problems. These results suggest the aggregate value losses
from CEOs’ health problems likely are smaller than what one could extrapolate from the small set
of earlier work in this important area.

27
References
Adams, Renée, Benjamin Hermalin, and Michael Weisbach, 2010, The Role of Boards of Directors
in Corporate Governance: A Conceptual Framework and Survey, Journal of Economic
Literature 48(1), 58–107.
Adams, Renée, Matti Keloharju, and Samuli Knüpfer, 2018, Are CEOs Born Leaders? Lessons from
Traits of a Million Individuals, Journal of Financial Economics 130, 392–408.
Avdic, Daniel, 2016, Improving Efficiency or Impairing Access? Health Care Consolidation and
Quality of Care: Evidence from Emergency Hospital Closures in Sweden, Journal of Health
Economics 48, 44–60.
Christopher Auld, M., and Nirmal Sidhu, 2005, Schooling, Cognitive Ability and Health, Health
Economics 14(10), 1019–1034.
Babitsch, Birgit, Daniela Gohl, and Thomas Von Lengerke, 2012, Re-Revisiting Andersen’s
Behavioral Model of Health Services Use: A Systematic Review of Studies from 1998–2011,
GMS Psycho-Social-Medicine 9.
Badawi, Alaa, and Seung Gwan Ryoo, 2016, Prevalence of Comorbidities in the Middle East
Respiratory Syndrome Coronavirus (MERS-CoV): A Systematic Review and Meta-analysis,
International Journal of Infectious Diseases 49, 129–133.
Ball, Deborah and Eric Sylvers, 2018, Fiat Chrysler’s Sergio Marchionne Was Seriously Ill for Over
a Year Before Dying, Wall Street Journal, July 26, https://www.wsj.com/articles/fiat-chryslers-
sergio-marchionne-was-seriously-ill-for-a-year-before-dying-1532620292.
Bandiera, Oriana, Luigi Guiso, Andrea Prat, and Raffaella Sadun, 2015, Matching Firms, Managers,
and Incentives, Journal of Labor Economics 33, 623–681.
Bandiera, Oriana, Stephen Hansen, Andrea Prat, and Raffaella Sadun, 2020, CEO Behavior and
Firm Performance, Journal of Political Economy 128(4), 1325–1369.
Barling, Julian, and Anika Cloutier, 2017, Leaders’ Mental Health at Work: Empirical,
Methodological, and Policy Directions, Journal of Occupational Health Psychology 22, 394–
406.
28
Bennedsen, Morten, Francisco Pérez-González, and Daniel Wolfenzon, 2020, Do CEOs Matter?
Evidence from Hospitalization Events, Journal of Finance 75(4), 1877–1911.
Bertrand, Marianne and Antoinette Schoar, 2003, Managing with Style: The Effect of Managers on
Firm Policies, Quarterly Journal of Economics 118(4), 1169–1208.
Bharadwaj, Prashant, Mallesh M. Pai, and Agne Suziedelyte, 2017, Mental Health Stigma,
Economics Letters 159, 57–60.
Booth, Christopher M., Larissa M. Matukas, George A. Tomlinson, Anita R. Rachlis, David B.
Rose, Hy A. Dwosh, Sharon L. Walmsley et al., 2003, Clinical Features and Short-term
Outcomes of 144 Patients with SARS in the Greater Toronto Area, Journal of the American
Medical Association 289(21), 2801–2809.
Borgschulte, Mark, Marius Guenzel, Canyao Liu, and Ulrike Malmendier, 2021, CEO Stress,
Aging, and Death, NBER working paper 28550.
Borgschulte, Mark, and Jacob Vogler, 2019, Run for Your Life? The Effect of Close Elections on
the Life Expectancy of Politicians, Journal of Economic Behavior and Organization 167, 18–
32.
Campbell, T. Colin, Michael Gallmeyer, Shane A. Johnson, Jessica Rutherford, and Brooke W.
Stanley, 2011, CEO Optimism and Forced Turnover, Journal of Financial Economics 101(3),
695–712.
Case, Anne, and Christina Paxson, 2011, The Long Reach of Childhood Health and Circumstance:
Evidence from the Whitehall II Study, Economic Journal 121(554), F183–F204.
Cesarini, David, Erik Lindqvist, Robert Östling, and Björn Wallace, 2016, Wealth, Health, and
Child Development: Evidence from Administrative Data on Swedish Lottery Players, Quarterly
Journal of Economics 131(2), 687–738.
Charlson, Mary E., Peter Pompei, Kathy L. Ales, and C. Ronald MacKenzie, 1987, A New Method
of Classifying Prognostic Comorbidity in Longitudinal Studies: Development and Validation,
Journal of Chronic Diseases 40(5), 373–383.
Cheng, J. Yo-Jud, Boris Groysberg, and Paul Healy, 2020, Your CEO Succession Plan Can’t Wait,
Harvard Business Review Digital Articles.

29
Cohen, Sheldon, Denise Janicki-Deverts, and Gregory E. Miller, 2007, Psychological Stress and
Disease, Journal of the American Medical Association 298(14), 1685–1687.
Coppola, Cabrielle, Tommaso Ebhardt, and Matthew Campbell, 2018, Fiat Says It Didn't Know
About CEO's Illness as Queries Surface, Bloomberg, July 26, https://www.bloomberg.com/
news/articles/2018-07-26/marchionne-had-been-seriously-ill-for-a-year-hospital-discloses.
Custódio, Cláudia, Miguel A. Ferreira, and Pedro Matos, 2013, Generalists versus Specialists:
Lifetime Work experience and Chief Executive Officer Pay, Journal of Financial Economics
108(2), 471−492.
Custódio, Cláudia and Daniel Metzger, 2013, How Do CEOs Matter? The Effect of Industry
Expertise on Acquisition Returns, Review of Financial Studies 26(8), 2008–2047.
Cutler, David and Adriana Lleras-Muney, 2008, Education and Health: Evaluating Theories and
Evidence, in: J. House, R. Schoeni, G. Kaplan, and H. Pollack, Making Americans Healthier:
Social and Economic Policy as Health Policy, New York: Russell Sage Foundation.
Denis, Diane and David Denis, 1995, Performance Changes Following Top Management
Dismissals, Journal of Finance 50(4), 1029–1057.
De Vroome, Ernest, Kimi Uegaki, Catharina Ploeg, Daniela Treutlein, Romy Steenbeek, Marjolein
Weerd, and Seth Bossche, 2015, Burden of Sickness Absence Due to Chronic Disease in the
Dutch Workforce from 2007 to 2011, Journal of Occupational Rehabilitation 25(4), 675–684.
Elixhauser, Anne, Claudia Steiner, D. Robert Harris, and Rosanna M. Coffey, 1998, Comorbidity
Measures for Use with Administrative Data, Medical Care 36(1), 8–27.
Elovainio, Marko, Jane E. Ferrie, Archana Singh-Manoux, Martin Shipley, G. David Batty, Jenny
Head, Mark Hamer, Markus Jokela, Marianna Virtanen, Eric Brunner, Michael G. Marmot, and
Mika Kivimäki, 2011, Socioeconomic Differences in Cardiometabolic Factors: Social
Causation or Health-Related Selection? Evidence from the Whitehall II Cohort Study, 1991–
2004, American Journal of Epidemiology 174(7), 779–789.
Eriksson, Johan G., Tom Forsen, Jaakko Tuomilehto, Clive Osmond, and David JP Barker, 2001,
Early Growth and Coronary Heart Disease in Later Life: Longitudinal Study, BMJ 322(7292),
949–953.

30
Fishman, Paul, Michael Goodman, Mark Hornbrook, Richard Meenan, Donald Bachman, and
Maureen O’Keeffe Rosetti, 2003, Risk Adjustment Using Automated Ambulatory Pharmacy
Data: The RxRisk Model, Medical Care 41(1): 84–99.
Ford, Michael T., Christopher P. Cerasoli, Jennifer A. Higgins, and Andrew L. Decesare, 2011,
Relationships between Psychological, Physical, and Behavioural Health and Work
Performance: A Review and Meta-analysis, Work & Stress 25, 185–204.
Frydman, Carola, and Dirk Jenter, 2010, CEO Compensation, Annual Review of Financial
Economics 2(1), 75–102.
Gabaix, Xavier, and Augustin Landier, 2008, Why Has CEO Pay Increased So Much? Quarterly
Journal of Economics 123(1), 49–100.
Gagne, Joshua, Robert Glynn, Jerry Avorn, Raisa Levin, and Sebastian Schneeweiss, 2011, A
Combined Comorbidity Score Predicted Mortality in Elderly Patients Better than Existing
Scores, Journal of Clinical Epidemiology 64(7), 749–759.
Garcia-Gomez, Pilar, Ernst Maug, and Stefan Obernberger, 2020, Private Equity Buyouts and
Employee Health, University of Mannheim working paper.
Goff, Sharlene and Patrick Jenkins, 2011, No Clear-Cut Alternative to Horta-Osório, Financial
Times, November 3, https://www.ft.com/content/23bc63ec-062d-11e1-ad0e-00144feabdc0.
Gow, Ian D., Steven N. Kaplan, David F. Larcker, and Anastasia A. Zakolyukina, 2016, CEO
Personality and Firm Policies, NBER working paper 22435.
Green, T. Clifton, Russell E. Jame, and Brandon Lock, 2019, Executive Extraversion: Career and
Firm Outcomes, Accounting Review 94(3), 177–204.
Grobart, Sam, 2017. The Two-Day, $5,000 C-Suite Physical, Bloomberg Businessweek, January 18,
https://www.bloomberg.com/news/articles/2017-01-18/the-two-day-5-000-c-suite-physical.
Grönqvist, Hans, Per Johansson, and Susan Niknami, 2012, Income Inequality and Health: Lessons
from a Refugee Residential Assignment Program, Journal of Health Economics 31(4), 617–
629.
31
Halfon, Patricia, Yves Eggli, Anne Decollogny, and Erol Seker, 2013, Disease Identification Based
on Ambulatory Drugs Dispensation and In-hospital ICD-10 Diagnoses: A Comparison, BMC
Health Services Research 13(1), 453–484.
Hermalin, Benjamin, and Michael Weisbach, 2017, Assessing Managerial Ability: Implications for
Corporate Governance, in: The Handbook of the Economics of Corporate Governance, vol. 1,
pp. 93–176, Elsevier.
Hill, Andrew, 2012, Executive Sick List Reflects Demands, Financial Times, September 21,
https://www.ft.com/content/d97a4c10-027d-11e2-9e53-00144feabdc0.
Holland, Sara B, and Ugur Lel, 2017, In Sickness and in Health: Firm Performance and Managerial
Health, University of Georgia working paper.
Jenter, Dirk, and Fadi Kanaan, 2015, CEO Turnover and Relative Performance Evaluation, Journal
of Finance 70(5), 2155–2184.
Jenter, Dirk, and Katharina Lewellen, 2021, Performance-Induced CEO Turnover, Review of
Financial Studies 34(2), 569–617.
Johnson, Jeffrey V., and Ellen M. Hall, 1988, Job Strain, Work Place Social Support, and
Cardiovascular Disease: A Cross-Sectional Study of a Random Sample of the Swedish Working
Population, American Journal of Public Health 78(10), 1336–1342.
Johnston, David W., Carol Propper, and Michael A. Shields, 2009, Comparing Subjective and
Objective Measures of Health: Evidence from Hypertension for the Income/health Gradient,
Journal of Health Economics 28(3), 540−552.
Kaestner, Robert, and Kevin Callison, 2011, Adolescent Cognitive and Noncognitive Correlates of
Adult Health, Journal of Human Capital 5(1), 29−69.
Kaplan, Steven, Mark Klebanov, and Morten Sorensen, 2012, Which CEO Characteristics and
Abilities Matter? Journal of Finance 67(3), 973−1007.
Kaplan, Steven, and Morten Sorensen, 2021, Are CEOs Different?, Journal of Finance 76(4),
1773−1811.
Karasek Jr, Robert A., 1979, Job Demands, Job Decision Latitude, and Mental Strain: Implications
for Job Redesign, Administrative Science Quarterly 24(2), 285–308.

32
Katon, Wayne, Joan Russo, Elizabeth Lin, Susan Heckbert, Paul Ciechanowski, Evette Ludman,
and Michael Von Korff, 2006, Depression and Diabetes: Factors Associated with Major
Depression at Five-year Follow-up, Psychosomatics 50(6), 570–579.
Larcker, David F. and Brian Tayan, 2011, CEO Health Disclosure at Apple: A Public or Private
Matter? Stanford closer look series.
Larsson, Henrik, Eleonore Ryden, Marcus Boman, Niklas Långström, Paul Lichtenstein, and Mikael
Landen, 2013, Risk of Bipolar Disorder and Schizophrenia in Relatives of People with
Attention-Deficit Hyperactivity Disorder, British Journal of Psychiatry 203(2), 103–106.
Lemke, Klaus W., Jonathan P. Weiner, and Jeanne M. Clark, 2012, Development and Validation of
a Model for Predicting Inpatient Hospitalization, Medical Care 50(2), 131–139.
Limbach, Peter and Florian Sonnenburg, 2015, Does CEO Fitness Matter? University of Cologne
working paper.
Marmot, Michael G., Hans Bosma, Harry Hemingway, Eric Brunner, and Stephen Stansfeld, 1997,
Contribution of Job Control and Other Risk Factors to Social Variations in Coronary Heart
Disease Incidence, Lancet 350(9073), 235–239.
Marmot, Michael G., Stephen Stansfeld, Chandra Patel, Fiona North, Jenny Head, Ian White, Eric
Brunner, Amanda Feeney, and G. Davey Smith, 1991, Health Inequalities among British Civil
Servants: The Whitehall II study, Lancet 337(8754), 1387–1393.
Mertz, Dominik, Tae Hyong Kim, Jennie Johnstone, Po-Po Lam, Stefan P. Kuster, Shaza A. Fadel,
Dat Tran, Eduardo Fernandez, Neera Bhatnagar, and Mark Loeb, 2013, Populations at Risk for
Severe or Complicated Influenza Illness: Systematic Review and Meta-analysis, BMJ 347,
f5061.
Miller, Mark R., and Roger M. Wadsworth, 2009, Understanding Organic Nitrates–A Vein Hope?
British Journal of Pharmacology 157(4), 565–567.
Murphy, Kevin, 2013, Executive Compensation: Where We Are, and How We Got There, in:
Handbook of the Economics of Finance, vol. 2, pp. 211–356, Elsevier.
33
Murphy Kevin J., and Jan Zábojník, 2004, CEO Pay and Appointments: A Market-Based
Explanation for Recent Trends, American Economic Review Papers and Proceedings 94(2),
192–196.
Newhouse, Joseph P., Willard G. Manning, Emmett B. Keeler, and Elizabeth M. Sloss, 1989,
Adjusting Capitation Rates Using Objective Health Measures and Prior Utilization, Health Care
Financing Review 10(3), 41–54.
Nilsson, Anton, and Alexander Paul, 2018, Patient Cost-sharing, Socioeconomic Status, and
Children’s Health Care Utilization, Journal of Health Economics 59, 109–124.
Olenski, Andrew R., Matthew V. Abola, and Anupam B. Jena, 2015, Do Heads of Government Age
More Quickly? Observational Study Comparing Mortality between Elected Leaders and
Runners-up in National Elections of 17 Countries, BMJ 351, h6424.
Oyer, Paul, 2008, The Making of an Investment Banker: Stock Market Shocks, Career Choice, and
Lifetime Income, Journal of Finance 63(6), 2601–2628.
Persson, Petra, and Maya Rossin-Slater, 2018, Family Ruptures, Stress, and the Mental Health of
the Next Generation, American Economic Review 108(4-5), 1214–1252.
Quan, Hude Duncan, Vijaya A. Sundararajan, Patricia E. Halfon, Andrew Fong, Bernard Burnand,
Jean-Christophe Luthi, L. Saunders, Cynthia Beck, Thomas Feasby, and William Ghali, 2005,
Coding Algorithms for Defining Comorbidities in ICD-9-CM and ICD-10 Administrative Data,
Medical Care 43(11), 1130–1139.
Quinzler, Renate, Michael H. Freitag, Birgitt Wiese, Martin Beyer, Hermann Brenner, Anne
Dahlhaus, Angela Döring, Tobias Freund, Margit Heier, Hildtraud Knopf, Melanie Luppa, Jana
Prokein, Steffi G. Riedel-Heller, Ingmar Schäfer, Christa Scheidt-Nave, Martin Scherer, Ben
Schöttker, Joachim Szecsenyi, Petra Thürmann, Hendrik van den Bussche, Jochen Gensichen,
Walter E. Haefeli, 2019, A Novel Superior Medication-Based Chronic Disease Score Predicted
All-Cause Mortality in Independent Geriatric Cohorts, Journal of Clinical Epidemiology 105,
112–124.
Schnall, Peter L., Paul A. Landsbergis, and Dean Baker, 1994, Job Strain and Cardiovascular
Disease, Annual Review of Public Health 15(1), 381–411.

34
Schoar, Antoinette, and Luo Zuo, 2017, Shaped by Booms and Busts: How the Economy Impacts
CEO Careers and Management Styles, Review of Financial Studies 30(5), 1425–1456.
Schäfer, Ingmar, Eike-Christin von Leitner, Gerhard Schön, Daniela Koller, Heike Hansen, Tina
Kolonko, Hanna Kaduszkiewicz, Karl Wegscheider, Gerd Glaeske, and Hendrik van den
Bussche, 2010, Multimorbidity Patterns in the Elderly: A New Approach of Disease Clustering
Identifies Complex Interrelations between Chronic Conditions, PloS One 5(12), e15941.
Seidler, Andreas, Mandy Wagner, Melanie Schubert, Patrik Dröge, Karin Römer, Jörn Pons-
Kühnemann, Enno Swart, Hajo Zeeb, and Janice Hegewald, 2016, Aircraft, Road and Railway
Traffic Noise as Risk Factors for Heart Failure and Hypertensive Heart Disease—A Case-
control Study Based on Secondary Data, International Journal of Hygiene and Environmental
Health 219(8), 749–758.
Taylor, Lucian A., 2010, Why Are CEOs Rarely Fired? Evidence from Structural Estimation,
Journal of Finance 65(6), 2051–2087.
Terviö, Marko, 2008, The Difference That CEOs Make: An Assignment Model Approach,
American Economic Review 98(3), 642–668.
Thoits, Peggy A., 2010, Stress and Health: Major Findings and Policy Implications, Journal of
Health and Social Behavior 51(S) S41–S53.
Tonelli, Marcello, Natasha Wiebe, Martin Fortin, Bruce Guthrie, Brenda R. Hemmelgarn, Matthew
T. James, Scott W. Klarenbach, Richard Lewanczuk, Braden J Manns, Paul Ronksley, Peter
Sargious, Sharon Straus, and Hude Quan, 2015, Methods for Identifying 30 Chronic Conditions:
Application to Administrative Data, BMC Medical Informatics and Decision Making 15(1), 31–
41.
Viscusi, W. Kip, 1993, The Value of Risks to Life and Health, Journal of Economic Literature
31(4), 1912–1946.
Wils, Regitze Sølling, Ditte Resendal Gotfredsen, Carsten Hjorthøj, Stephen F. Austin, Nikolai
Albert, Rikke Gry Secher, Anne Amalie Elgaard Thorup, Ole Mors, and Merete Nordentoft,
2017, Antipsychotic Medication and Remission of Psychotic Symptoms 10 Years after a First-
Episode Psychosis, Schizophrenia Research 182, 42–48.

35
Zhang, Wei, Christopher McLeod, and Mieke Koehoorn, 2016, The Relationship between Chronic
Conditions and Absenteeism and Associated Costs in Canada, Scandinavian Journal of Work,
Environment & Health 42(5), 413–422.
Zheng, Zhaohai, Fang Peng, Buyun Xu, Jingjing Zhao, Huahua Liu, Jiahao Peng, Qingsong Lie,
Chongfu Jiang, Yan Zhou, Shuqing Liu, Chunji Ye, Peng Zhang, Yangbo Xing, Hangyuan Guo,
and Weiliang Tang, 2020, Risk Factors of Critical & Mortal COVID-19 Cases: A Systematic
Literature Review and Meta-Analysis, Journal of Infection 81(2), e16-e25.
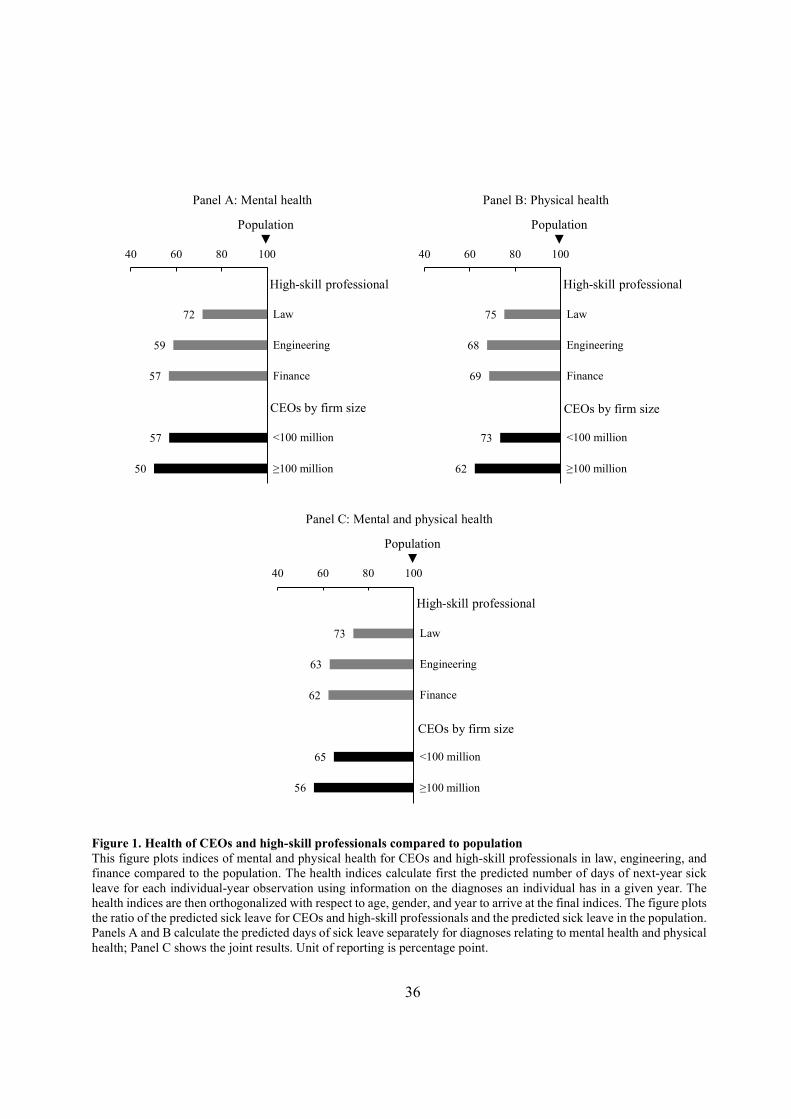
36
Figure 1. Health of CEOs and high-skill professionals compared to population This figure plots indices of mental and physical health for CEOs and high-skill professionals in law, engineering, and finance compared to the population. The health indices calculate first the predicted number of days of next-year sick leave for each individual-year observation using information on the diagnoses an individual has in a given year. The health indices are then orthogonalized with respect to age, gender, and year to arrive at the final indices. The figure plots the ratio of the predicted sick leave for CEOs and high-skill professionals and the predicted sick leave in the population. Panels A and B calculate the predicted days of sick leave separately for diagnoses relating to mental health and physical health; Panel C shows the joint results. Unit of reporting is percentage point.
72
59
57
57
50
40 60 80 100
Law
Engineering
Finance
<100 million
≥100 million
Panel A: Mental health
High-skill professional
CEOs by firm size
Population▼
75
68
69
73
62
40 60 80 100
Law
Engineering
Finance
<100 million
≥100 million
Panel B: Physical health
High-skill professional
CEOs by firm size
Population▼
73
63
62
65
56
40 60 80 100
Law
Engineering
Finance
<100 million
≥100 million
Panel C: Mental and physical health
High-skill professional
CEOs by firm size
Population▼

37
Figure 2. Health of newly appointed CEOs in firms of different size This figure plots indices of mental and physical health for newly appointed CEOs in firms of different size. The firms are divided into 2% bins according to their total assets and the averages of health indices, measured one year prior to CEO appointment, are shown in each bin. In these bins, each firm-CEO pair is the unit of observation. The health indices calculate first the predicted number of days of next-year sick leave for each individual-year observation using information on the diagnoses an individual has in a given year. The health indices are then orthogonalized with respect to age, gender, and year to arrive at the final indices. The figure plots the ratio of the predicted sick leave for CEOs in each firm-size category and the predicted sick leave in the population. Panels A and B plot the mental and physical health indices separately whereas Panel C combines the mental and physical health diagnoses into one index. The linear regression line accompanies each plot. The unit of reporting is percentage points.
20
40
60
80
100
0 20 40 60 80 100
Firm size percentile, %
Panel A: Mental health
◄ Population
20
40
60
80
100
0 20 40 60 80 100
Firm size percentile, %
Panel B: Physical health
◄ Population
20
40
60
80
100
0 20 40 60 80 100
Firm size percentile, %
Panel C: Mental and physical health
◄ Population
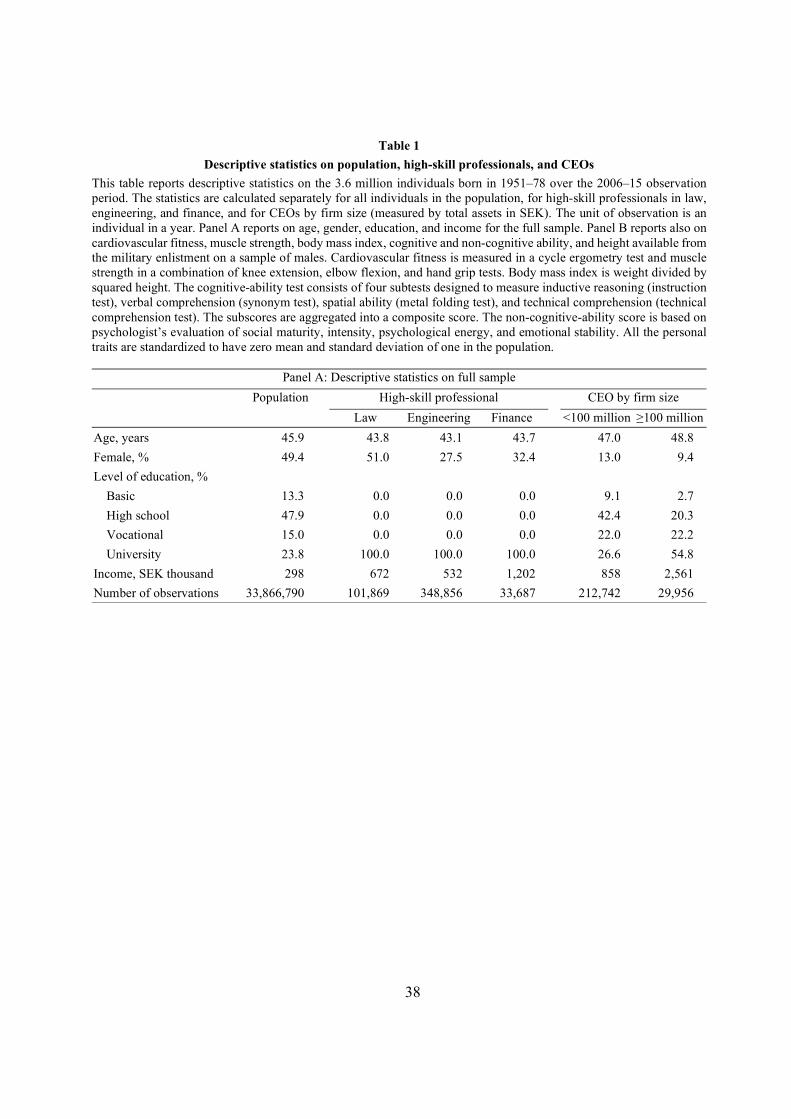
38
Table 1
Descriptive statistics on population, high-skill professionals, and CEOs
This table reports descriptive statistics on the 3.6 million individuals born in 1951–78 over the 2006–15 observation period. The statistics are calculated separately for all individuals in the population, for high-skill professionals in law, engineering, and finance, and for CEOs by firm size (measured by total assets in SEK). The unit of observation is an individual in a year. Panel A reports on age, gender, education, and income for the full sample. Panel B reports also on cardiovascular fitness, muscle strength, body mass index, cognitive and non-cognitive ability, and height available from the military enlistment on a sample of males. Cardiovascular fitness is measured in a cycle ergometry test and muscle strength in a combination of knee extension, elbow flexion, and hand grip tests. Body mass index is weight divided by squared height. The cognitive-ability test consists of four subtests designed to measure inductive reasoning (instruction test), verbal comprehension (synonym test), spatial ability (metal folding test), and technical comprehension (technical comprehension test). The subscores are aggregated into a composite score. The non-cognitive-ability score is based on psychologist’s evaluation of social maturity, intensity, psychological energy, and emotional stability. All the personal traits are standardized to have zero mean and standard deviation of one in the population.
Panel A: Descriptive statistics on full sample
Population High-skill professional CEO by firm size
Law Engineering Finance <100 million ≥100 million
Age, years 45.9 43.8 43.1 43.7 47.0 48.8
Female, % 49.4 51.0 27.5 32.4 13.0 9.4
Level of education, % Basic 13.3 0.0 0.0 0.0 9.1 2.7
High school 47.9 0.0 0.0 0.0 42.4 20.3
Vocational 15.0 0.0 0.0 0.0 22.0 22.2
University 23.8 100.0 100.0 100.0 26.6 54.8
Income, SEK thousand 298 672 532 1,202 858 2,561
Number of observations 33,866,790 101,869 348,856 33,687 212,742 29,956

39
Panel B: Subsample of men with data on early-life traits
Population High-skill professional CEO by firm size
Law Engineering Finance <100 million ≥100 million
Age, years 46.2 45.4 43.4 43.6 46.9 48.8
Level of education, % Basic 12.8 0.0 0.0 0.0 9.5 2.5
High school 51.7 0.0 0.0 0.0 44.0 20.4
Vocational 16.1 0.0 0.0 0.0 22.2 21.8
University 19.4 100.0 100.0 100.0 24.4 55.3
Income, SEK thousand 389 828 570 1,485 844 2,372
Cognitive ability, % sd -0.3 77.0 105.0 73.2 39.2 72.4
Non-cognitive ability, % sd 0.3 59.4 40.4 68.1 54.7 88.8
Height, % sd 0.2 23.6 20.0 23.7 16.7 37.5
Cardiovascular fitness, % sd 0.3 31.3 34.7 44.3 25.1 49.5
Muscle strength, % sd 0.2 -10.9 -2.0 -2.1 16.6 18.0
Body mass index, % sd -0.2 -14.6 -18.5 -19.7 -0.3 -1.7
Number of observations 11,952,139 42,873 203,693 19,400 153,343 23,242

40
Table 2
CEO health compared to population and high-skill professionals
This table reports on health of the 3.6 million individuals born in 1951–78 over the 2006–15 observation period. The statistics are calculated separately for all individuals in the population, for high-skill professionals in law, engineering, and finance, and for CEOs by the firm’s total assets in SEK. The unit of observation is an individual in a year. Panel A reports the annual incidence of diagnoses, broken down into the Rx-Risk categories detailed in Table IA1. Diagnoses in the hospitalization, specialized care, and drug prescription registers enter the calculation. The panel reports the ratio of the incidence of diagnoses, adjusted for age and gender, among CEOs and high-skill professionals compared with the population. The ratio is negative for psychotic illness for larger-firm CEOs because these firms have so few CEOs with diagnosed psychotic illness, producing a negative adjusted incidence after age and gender adjustment. Panel B aggregates the incidence of diagnoses listed in Panel A into health indices based on sick leave. These indices calculate first the predicted number of days of next-year sick leave for each individual-year observation using information on the diagnoses an individual has in the current year (these regressions are reported in Table IA3). The health indices are then orthogonalized with respect to age, gender, and year. The panel reports the ratio of the predicted sick leave for CEOs and high-skill professionals and the predicted sick leave in the population.
Panel A: Annual incidence of diagnoses in population, and age-gender-adjusted incidence relative to population
Inci-dence in popula-tion, %
Age-gender-adjusted incidence relative to population, %
High-skill professional CEO by firm size
Law Engi-neering
Finance <100 million
≥100 million
Mental health diagnosis 16.1 79.5 66.6 69.1 69.8 64.3
Anxiety and tension 10.4 82.0 62.5 72.3 73.1 73.3
Depression 10.2 75.6 67.2 59.7 62.0 49.7
Psychotic illness 1.6 37.4 30.7 23.3 6.2 -1.7
Bipolar disorder 0.5 56.2 57.5 47.4 38.5 14.6
Physical health diagnosis 32.3 89.0 80.0 86.0 92.8 88.4
Hypertension 8.7 83.4 70.5 69.4 93.2 81.8
Gastric acid disorder 8.1 58.9 61.6 59.9 79.5 64.8
Heart disease, hypertension 6.1 84.5 69.8 76.0 79.8 60.5
Hyperlipidemia 5.3 88.1 68.6 74.5 95.6 91.4
Rheumatoid arthritis 4.3 87.6 78.0 95.2 106.9 107.2
Coronary, peripheral vascular disease 4.1 89.6 67.9 71.8 79.5 65.6
Thyroid disorder 3.9 98.2 99.8 101.1 87.4 78.5
Liver disease 3.8 83.5 78.6 85.8 78.4 74.3
Diabetes 3.1 61.9 55.6 43.1 60.0 13.9
Asthma 5.9 92.4 85.2 89.4 91.7 80.2
Cardiac disease 2.8 71.0 67.8 65.7 70.8 50.5
Epilepsy 2.2 53.3 43.0 38.3 41.7 25.6
Malignancies 1.9 111.0 105.6 110.8 92.3 101.4
Gout 0.5 86.4 50.3 45.7 114.2 72.5
Irritable bowel syndrome 0.5 80.8 78.4 80.7 82.7 80.7
Parkinson's disease 0.4 65.6 71.5 49.3 66.5 38.9
Renal disease 0.2 84.7 63.0 59.9 55.0 40.1
Tuberculosis 0.04 29.7 24.6 29.2 51.5 37.9
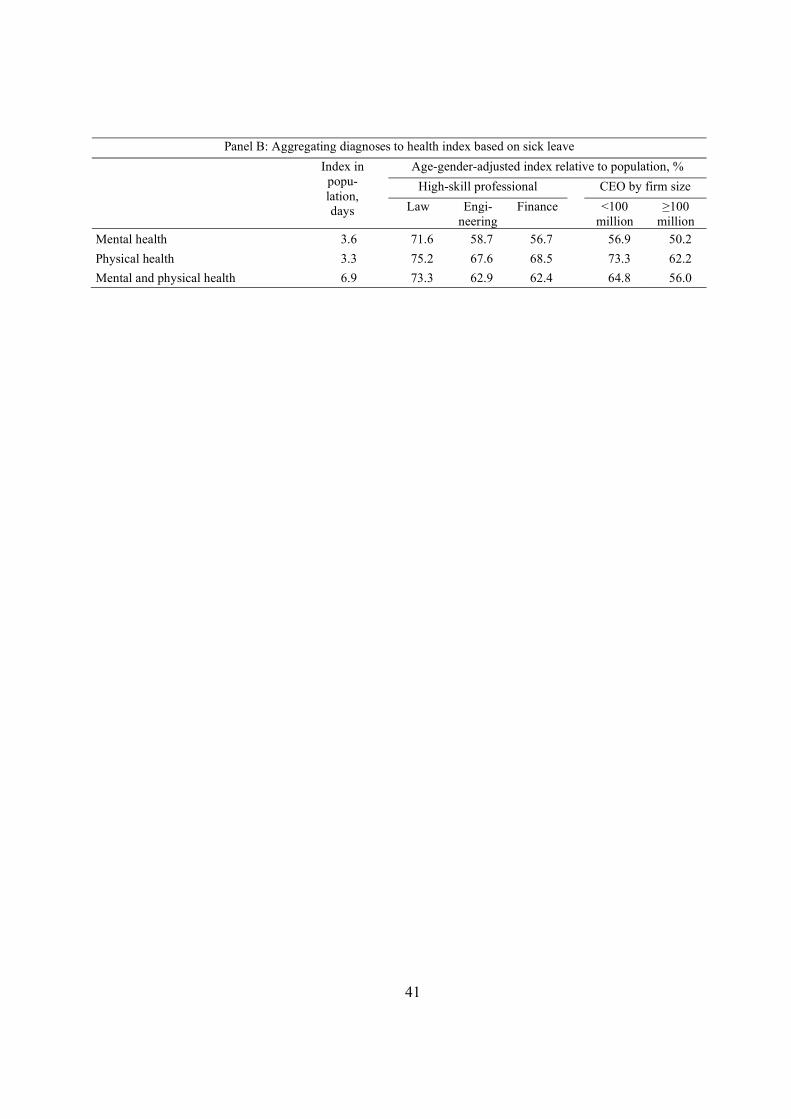
41
Panel B: Aggregating diagnoses to health index based on sick leave
Index in popu-lation, days
Age-gender-adjusted index relative to population, %
High-skill professional CEO by firm size
Law Engi-neering
Finance <100 million
≥100 million
Mental health 3.6 71.6 58.7 56.7 56.9 50.2
Physical health 3.3 75.2 67.6 68.5 73.3 62.2
Mental and physical health 6.9 73.3 62.9 62.4 64.8 56.0

42
Table 3
Health and mortality
This table reports results on a survival analysis that explains mortality with the health indices constructed from predicted days of sick leave, defined in Table 2. The dependent variable counts the number of years until death for each individual over the 2007–15 period and the independent variables measure the individual’s health in 2006. The table estimates a Cox proportional hazards model that assumes censoring after the last sample year. The sample is divided into CEOs and non-CEOs based on an individual holding a CEO position in 2006. All regressions include age and gender indicators. The unit of observation is an individual, the table reports the coefficients of the duration model, and the t-values below coefficients are based on robust standard errors.
Dependent variable Years to death Mental and physical
health separately Mental and physical
health jointly
Specification 1 2
Mental health 0.021 (52.1) Physical health 0.033 (56.8) Mental health × CEO 0.002 (0.2) Physical health × CEO 0.010 (2.5) Mental and physical health 0.028 (97.0) Mental and physical health × CEO 0.010 (2.9) CEO -0.676 -0.687 (-8.3) (-8.4) Controls Age Yes Yes Gender Yes Yes Mean dependent variable 8.94 8.94 Number of observations 3,337,707 3,337,707
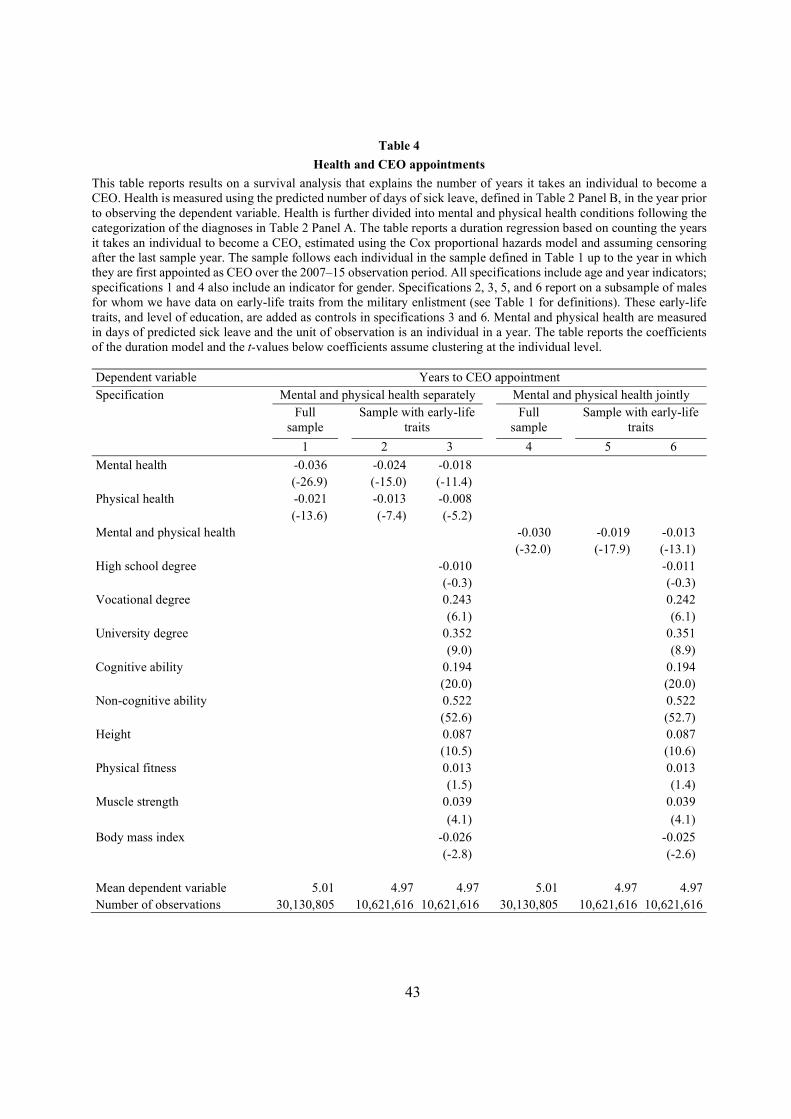
43
Table 4
Health and CEO appointments
This table reports results on a survival analysis that explains the number of years it takes an individual to become a CEO. Health is measured using the predicted number of days of sick leave, defined in Table 2 Panel B, in the year prior to observing the dependent variable. Health is further divided into mental and physical health conditions following the categorization of the diagnoses in Table 2 Panel A. The table reports a duration regression based on counting the years it takes an individual to become a CEO, estimated using the Cox proportional hazards model and assuming censoring after the last sample year. The sample follows each individual in the sample defined in Table 1 up to the year in which they are first appointed as CEO over the 2007–15 observation period. All specifications include age and year indicators; specifications 1 and 4 also include an indicator for gender. Specifications 2, 3, 5, and 6 report on a subsample of males for whom we have data on early-life traits from the military enlistment (see Table 1 for definitions). These early-life traits, and level of education, are added as controls in specifications 3 and 6. Mental and physical health are measured in days of predicted sick leave and the unit of observation is an individual in a year. The table reports the coefficients of the duration model and the t-values below coefficients assume clustering at the individual level. Dependent variable Years to CEO appointment Specification Mental and physical health separately Mental and physical health jointly Full
sample Sample with early-life
traits Full
sample Sample with early-life
traits
1 2 3 4 5 6
Mental health -0.036 -0.024 -0.018 (-26.9) (-15.0) (-11.4) Physical health -0.021 -0.013 -0.008 (-13.6) (-7.4) (-5.2) Mental and physical health -0.030 -0.019 -0.013 (-32.0) (-17.9) (-13.1) High school degree -0.010 -0.011 (-0.3) (-0.3) Vocational degree 0.243 0.242 (6.1) (6.1) University degree 0.352 0.351 (9.0) (8.9) Cognitive ability 0.194 0.194 (20.0) (20.0) Non-cognitive ability 0.522 0.522 (52.6) (52.7) Height 0.087 0.087 (10.5) (10.6) Physical fitness 0.013 0.013 (1.5) (1.4) Muscle strength 0.039 0.039
(4.1) (4.1) Body mass index -0.026 -0.025 (-2.8) (-2.6) Mean dependent variable 5.01 4.97 4.97 5.01 4.97 4.97 Number of observations 30,130,805 10,621,616 10,621,616 30,130,805 10,621,616 10,621,616

44
Table 5
CEO health before and after appointment
This table reports results of an event study that estimates the impact of becoming a CEO on health. The dependent variable is predicted days of sick leave, defined in Table 2. The independent variables are indicators for years around a CEO turnover event interacted with indicators for an executive appointed to a CEO position. The sample includes the four highest paid executives in the firm in the year prior to the CEO turnover and the person appointed as the CEO in case of an external appointment. We further require that none of these people have been in a CEO position prior to the turnover event. Specifications 1–3 (4–6) include events in which the executives can be followed for two years prior and two (four) years after CEO turnover. All regressions include year, age, and gender indicators, and fixed effects for each CEO turnover event. The unit of observation is an individual in a year and the t-values below coefficients assume clustering at the level of the CEO turnover event. The unit of reporting is days.
Dependent variable Predicted sick leave, days Follow-up period Two years Four years Specification Mental
health Physical health
Both Mental health
Physical health
Both
1 2 3 4 5 6
After appointment 0.02 0.08 0.11 0.01 0.05 0.05 (0.3) (1.0) (0.8) (0.1) (0.5) (0.4) Appointed to CEO -0.06 -0.04 -0.09 -0.09 0.08 -0.01 (-0.3) (-0.3) (-0.4) (-0.5) (0.5) (0.0) Appointed to CEO × After 0.02 -0.07 -0.05 0.12 -0.09 0.02 (0.3) (-0.7) (-0.4) (1.2) (-0.8) (0.1) Controls
Age Yes Yes Yes Yes Yes Yes Gender Yes Yes Yes Yes Yes Yes Year Yes Yes Yes Yes Yes Yes Turnover event FE Yes Yes Yes Yes Yes Yes
Mean dependent variable 1.28 1.86 3.14 1.31 1.96 3.27
Adjusted R2 0.150 0.114 0.143 0.163 0.107 0.140
Number of observations 66,210 66,210 66,210 60,416 60,416 60,416

45
Table 6
CEO health before and after retirement
This table reports on health before and after retirement, both for CEOs and non-CEOs. The sample consists of individuals who are born in 1942–48. These individuals do not belong to the core sample in Tables 1–5 because they are born before the earliest year an individual can enter the core sample. Panel A reports on descriptive statistics on these individuals. Panel B reports on regressions that explain predicted days of sick leave, defined in Table 2, with an indicator for CEOs. This indicator is interacted with a dummy variable for the years after the median retirement age of 66. All regressions include year and gender indicators (the construction of the sample around the age of 66 requires the removal of age indicators). The unit of observation is an individual in a year, the t-values below coefficients assume clustering at the individual level, and the unit of reporting is days.
Panel A: Descriptive statistics on retirement sample
Non-CEO CEO
Age, years 64.0 64.0
Female, % 50.6 8.1
Level of education, % Basic 29.6 18.1
High school 43.1 42.9
Vocational 6.3 10.5
University 21.1 28.4
Income, SEK thousand 301 1,145
Number of individuals 678,633 2,626
Panel B: Effect of retirement on health Dependent variable Predicted sick leave, days Follow-up period Two years Four years Specification Mental
health Physical health
Both Mental health
Physical health
Both
1 2 3 4 5 6
After retirement 0.18 1.69 1.87 0.10 1.27 1.37 (12.1) (69.8) (59.3) (4.3) (35.0) (28.3) CEO -1.07 -1.16 -2.23 -0.99 -1.17 -2.16 (-9.9) (-5.4) (-8.7) (-7.5) (-4.6) (-7.1) CEO × After retirement 0.03 0.26 0.29 -0.11 0.29 0.17 (0.3) (1.0) (1.0) (-1.1) (1.1) (0.58) Controls
Gender Yes Yes Yes Yes Yes Yes Year Yes Yes Yes Yes Yes Yes
Mean dependent variable 4.19 8.88 13.08 4.21 9.30 13.51
Adjusted R2 0.015 0.005 0.005 0.017 0.009 0.009
Number of observations 3,405,218 3,405,218 3,405,218 3,021,683 3,021,683 3,021,683

46
Table 7
CEO health and turnover
Panel A reports results on a survival analysis that explains the number of years it takes for a CEO to leave her current company. The dependent variable is the CEO tenure and it is measured from the year 1990 onwards. The table estimates a Cox proportional hazards model assuming censoring after the last sample year. The mental and physical health indices, lagged by one year, are calculated separately based on the diagnoses listed in Table 2. The unit of observation is a year of a CEO’s spell at a firm. Panel B repeats the analysis of Panel A for CEOs appointed after 2006, regressing the number of years to turnover on mental and physical health at the time of appointment. The firm characteristics, lagged by one year, are logged total assets (measured in SEK), operating return on assets, sales growth calculated as relative change from last year, an indicator for firms either managed or owned by at least two members of the same family, and indicators for listed companies and firms fully owned by the national, regional, or local government. OROA and sales growth are winsorized at the 5 and 95 percentiles. All regressions include age, year, and gender indicators, and indicators for industry based on two-digit SNI codes. The two rightmost specifications additionally control for early-life traits and the level of education, defined in Table 1. The t-values below coefficients assume clustering at the CEO level. Coefficients for mental and physical health are multiplied by one hundred whereas the other coefficients enter the table in their natural unit.
Panel A: Contemporaneous health Dependent variable Years to CEO turnover Sample Full sample Sample with early-life traits Specification 1 2 3 4 Mental health 1.29 1.32 1.47 1.44 (11.7) (11.9) (11.0) (10.9) Physical health 0.32 0.39 0.35 0.39 (3.1) (3.8) (2.9) (3.2) Logged assets 0.20 0.17 (45.0) (31.3) OROA -1.28 -1.27 (-34.3) (-28.2) Sales growth -0.07 -0.06 (-7.1) (-5.9) Family firm, family managed -0.14 -0.13 (-4.2) (-3.5) Family firm, not family managed -1.23 -1.27 (-19.6) (-16.6) Listed firm -0.24 -0.30 (-3.4) (-3.7) Government-owned firm -0.34 -0.39 (-7.2) (-6.9) Controls
Age Yes Yes Yes Yes Gender Yes Yes Yes Yes Year Yes Yes Yes Yes Industry Yes Yes Yes Yes Early-life traits and education No No Yes Yes
Mean dependent variable 7.40 7.40 7.68 7.68 Number of observations 183,428 183,428 132,659 132,659

47
Panel B: Health at appointment Dependent variable Years to CEO turnover Sample Full sample Sample with early-life traits Specification 1 2 3 4 Mental health at appointment 0.76 0.84 1.00 1.01 (3.4) (4.0) (3.7) (4.0) Physical health at appointment 0.12 0.22 0.40 0.47 (0.6) (1.1) (1.8) (2.1) Logged assets 0.13 0.11 (20.9) (14.0) OROA -1.18 -1.14 (-22.8) (-17.6) Sales growth 0.00 0.02 (0.3) (1.3) Family firm, family managed -0.22 -0.23 (-4.8) (-4.1) Family firm, not family managed -1.23 -1.16 (-10.3) (-8.1) Listed firm -0.04 -0.10 (-0.5) (-1.1) Government-owned firm -0.32 -0.44 (-5.0) (-5.3) Controls
Age Yes Yes Yes Yes Gender Yes Yes Yes Yes Year Yes Yes Yes Yes Industry Yes Yes Yes Yes Early-life traits and education No No Yes Yes
Mean dependent variable 2.74 2.74 2.77 2.77 Number of observations 58,481 58,481 40,914 40,914

48
Table 8
CEO health and firm performance
This table reports regressions that explain firm performance in a year with the firm’s CEO’s predicted sick leave and control variables in the previous year. The firm characteristics are logged total assets (measured in SEK), an indicator for firms either managed or owned by at least two members of the same family, and indicators for listed companies and firms fully owned by the national, regional, or local government. The operating return on assets, OROA, is winsorized at the 5 and 95 percentiles. The first specification includes all firms whereas the remaining two specifications use a 100-million-cutoff for total assets to split the sample. All regressions include year, age, and gender indicators, and indicators for industry based on two-digit SNI codes. The unit of observation is a CEO-firm in a year and the t-values below coefficients assume clustering at the CEO level. The coefficients, mean dependent variable, and change per one standard deviation in health are multiplied by one hundred.
Dependent variable OROA All firms Firms by size
Total assets <100 million
Total assets ≥100 million
Specification 1 2 3 Mental health -0.038 -0.039 -0.015 (-3.1) (-3.0) (-0.6) Physical health -0.012 -0.013 -0.003 (-1.2) (-1.2) (-0.2) Logged assets -0.057 0.235 0.013 (-0.9) (2.4) (0.1) Family firm, not family managed 0.138 0.003 0.475 (0.5) (0.01) (1.0) Family firm, family managed -0.351 -0.478 0.731 (-1.4) (-1.9) (1.1) Listed firm -14.407 -24.363 -5.272 (-12.1) (-10.9) (-5.8) Government-owned firm -5.789 -9.735 -0.352 (-9.5) (-9.1) (-0.6) Controls
Age Yes Yes Yes Gender Yes Yes Yes Year Yes Yes Yes Industry Yes Yes Yes
Change per sd in mental health -0.62 -0.65 -0.25 Change per sd in physical health -0.11 -0.11 -0.02
Mean dependent variable 8.11 8.44 4.02
Adjusted R2 0.024 0.025 0.136
Number of observations 183,428 164,573 18,855

Internet Appendix for
CEO Health
Matti Keloharju
Aalto University School of Business, CEPR, and IFN
Samuli Knüpfer
BI Norwegian Business School and IFN
Joacim Tåg
Research Institute of Industrial Economics (IFN)
November 2021

1
Figure IA1. Health around CEO appointment and retirement This figure plots the raw data on the indices of mental and physical health used in Tables 5 and 6. The health indices calculate the predicted number of days of next-year sick leave for each individual-year observation using information on the diagnoses an individual has in a given year. Panels A and B plot the health indices around CEO appointments, separately for executives who were and were not appointed to CEOs. Panels C and D plot the health indices around the median retirement age of 66 separately for people in and not in a CEO position prior to retirement. Unit of reporting is days.
0
1
2
3
-2 -1 0 1 2 3 4
Time relative to appointment
Panel A: Mental health
Appointed
Not appointed
0
1
2
3
-2 -1 0 1 2 3 4
Time relative to appointment
Panel B: Physical health
Appointed
Not appointed
0
4
8
12
-2 -1 0 1 2 3 4
Time relative to retirement
Panel C: Mental health
CEONon-CEO
0
4
8
12
-2 -1 0 1 2 3 4
Time relative to retirement
Panel D: Physical health
CEONon-CEO

2
Table IA1
Descriptive statistics on firms
This table reports average firm characteristics for all sample firms, small firms, and larger firms. The firm characteristics are total assets (measured in SEK), operating return on assets, sales growth calculated as relative change from last year, an indicator for firms either managed or owned by at least two members of the same family, and indicators for listed companies and firms fully owned by the national, regional, or local government. OROA and sales growth are winsorized at the 5 and 95 percentiles.
All CEOs CEOs by firm size
Total assets <100 million
Total assets ≥100 million
Total assets, million SEK 199.20 15.97 1,798.50
Family firm, not family managed 0.143 0.138 0.184
Family firm, family managed 0.071 0.076 0.028
Listed firm 0.007 0.003 0.043
Government-owned firm 0.027 0.012 0.160
Sales growth 0.216 0.219 0.190
OROA 0.083 0.086 0.056
Number of observations 183,428 164,573 18,855

3
Table IA2
Defining Rx-Risk comorbidity classes using ATC and ICD-10 codes
This table reports the correspondence of the Rx-Risk comorbidity classes reported in Table 2 Panels A and B and used to construct the health indices in Table 2 Panel C to the ATC codes observed in the drug prescription data and the ICD-10 codes in the specialized care and hospitalization data. We follow Quinzler et al. (2019) in mapping the ATC codes into Rx-Risk comorbidity categories, except when the codes in Quinzler et al. are at a finer level than in our ATC data. In these cases, we use a coarser ATC specification unless this results in an overlap between different comorbidity categories in the index, in which case we omit the codes in question. For four rare conditions (HIV, cystic fibrosis, ESRD, and transplant), the use of coarser ATC data generates an incidence rate that materially differs from that of the population in Sweden. We drop these conditions from the index. To our knowledge, no direct translation of the Rx-Risk categories to ICD codes is available, so we use the medical literature for this translation. RxRisk class Assigned ATC codes1 Assigned ICD-10 codes Reference for ICD-10
assignment Anxiety and tension N05B, N05C F40-F41 Schafer et al. (2010) Asthma R03BA01, R03BA02,
R03BA05, R03BA07, R03BA08, R03A-R03D
J45 Tonelli et al. (2015)
Bipolar disorder N05AN01 F30-F31 Larsson et al. (2013) Cardiac disease C01B, C01D, C03C, C03E I20, I44-I49, I50 Halfon (2013); Miller
and Wadsworth (2009)2
Coronary, peripheral vascular disease
B01A, C04A I21-I25, I70, I71, I73.1, I73.8, I73.9, I77.1 ,I79.0, I79.2, K55.1, K55.8, K55.9, Z95.8, Z95.9
Eriksson et al. (2001); Quan et al. (2005)3
Depression N06A F32-F33 Schafer et al. (2010) Diabetes A10A, A10B E10-E14 Tonelli et al. (2015) Epilepsy N03A G40-G41 Tonelli et al. (2015) Gastric acid disorder A02B K20-K31, not K230 and K231 Halfon et al. (2013)4
Gout M04A M10 Halfon et al. (2013) Heart disease, hypertension
C07A, C07F, C07, C08 I11 Seidler et al. (2016)
Hyperlipidemia C10A, C10B E780-E785 Halfon et al. (2013) Hypertension C02, C02C, C03A, C03D,
C09A-C09D, C09X I10, I12-I13, I15 Tonelli et al. (2015)5
Irritable bowel syndrome A07A K58 Tonelli et al. (2015) Liver disease A05B, A06A B18, I85, I86.4, I98.2, K70,
K71.1, K71.3-K71.5, K71.7, K72-K74, K76.0, K76.2-K76.9, Z94.4
Quan et al. (2005) (Elixhauser mapping)
Malignancies C05B, L01A, L01B, L01D, L01X, L02A, L02B, L03A, L04A
C00-C97 Halfon et al. (2013)
Parkinson‘s disease N04B G20-G22 Tonelli et al. (2015)

4
Table IA2 continued
RxRisk Class Assigned ATC Codes1 Assigned ICD-10 Codes Reference for ICD-10 Assignment
Psychotic illness N06, N05AA01, N05AA02, N05AA04, N05AA06, N05AB01, N05AB02, NO5AB03, N05AB04, N05AB06, N05AC01, N05AC02, N05AD01, N05AD03, N05AD05, N05AD08, N05AE04, N05AE03, N05AF01, N05AF03, N05AF05, N05AG01, N05AG02, N05AH01, N05AH02, N05AH03, N05AH04, N05AL01, N05AL03, N05AL05, N05AX08, N05AX12, N05AX13
F20-F29 Wils et al. (2017)
Renal disease V03A I12.0, I13.1, N03.2-N03.7, N05.2–N05.7, N18 (except N18.5), N19, N25.0, Z49.0-Z49.2, Z94.0, Z99.2
Quan et al. (2005)
Rheumatoid arthritis H02, H02A, M01B, M01C M05, M06, M31.5, M32-M34, M35.1, M35.3, M36.0
Tonelli et al. (2015)
Thyroid disorder H03A E00-E07 Halfon et al. (2013) Tuberculosis J04A A15-A19, B90, K230, K673,
K930, M011, M490, M900, N330, N740, N741, O980, P370
Halfon et al. (2013)
1 Using Quinzler et al. (2019), but truncating to coarser ATC codes whenever Quinzler et al. (2019) uses a more granular ATC code than our data allows.
2 The medication list in Halfon (2013) is used to map I44–I49 and I50. C01D includes organic nitrates which according to e.g. Miller and Wadsworth (2009) are mainly used to treat Angina Pectoris [ICD-10: I20].
3 ICD codes corresponding to coronary heart disease come from Eriksson et al. (2001), excluding I20 that is included in “Cardiac disease”. ICD-codes for peripheral vascular disease come from Quan et al. (2005).
4 The ICD codes are found by comparing the medication list in Halfon et al. (2013) to that in Quinzler et al. (2019). 5 Excluding hypertensive heart disease [ICD-10: I11] from the list in Tonelli et al. (2015).

5
Table IA3
Incidence of diagnoses
This table reports the annual incidence of diagnoses concerning mental and physical health, broken down into the Rx-Risk categories detailed in Table IA2, on the 3.6 million individuals born in 1951–78 over the 2006–15 observation period. Diagnoses in the specialized care, hospitalization and drug prescription registers enter the calculation. The statistics are calculated separately for all individuals in the population, for high-skill professionals in law, engineering, and finance, and for CEOs by firm size (measured by total assets in SEK). The unit of observation is an individual in a year.
Annual incidence of diagnoses in population
Inci-dence in popula-tion, %
Incidence for CEOs and high-skill professionals, %
High-skill professional CEO by firm size
Law Engi-neering
Finance <100 million
≥100 million
Mental health diagnosis 16.1 12.1 7.8 9.2 8.5 8.1
Anxiety and tension 10.4 7.9 4.5 6.1 6.0 6.5
Depression 10.2 7.5 5.1 5.0 4.2 3.0
Psychotic illness 1.6 0.5 0.4 0.3 0.1 0.1
Bipolar disorder 0.5 0.3 0.2 0.2 0.1 0.02
Physical health diagnosis 32.3 26.3 20.7 23.9 27.9 28.7
Hypertension 8.7 5.7 4.4 4.6 9.1 9.7
Gastric acid disorder 8.1 4.2 3.4 3.7 5.5 4.8
Heart disease 6.1 4.1 2.8 3.2 5.0 4.8
Hyperlipidemia 5.3 3.6 2.8 3.0 6.1 7.0
Rheumatoid arthritis 4.3 3.6 2.7 3.6 3.9 4.1
Coronary, peripheral vascular disease 4.1 3.0 2.1 2.3 3.8 4.0
Thyroid disorder 3.9 3.7 2.3 2.9 1.4 1.2
Liver disease 3.8 2.9 2.3 2.8 2.4 2.5
Diabetes 3.1 1.5 1.4 1.1 2.3 1.4
Asthma 5.9 5.3 4.2 4.8 4.5 3.8
Cardiac disease 2.8 1.5 1.2 1.1 2.0 1.9
Epilepsy 2.2 1.1 0.7 0.7 0.8 0.5
Malignancies 1.9 1.9 1.4 1.6 1.3 1.6
Gout 0.5 0.3 0.3 0.2 0.8 0.7
Irritable bowel syndrome 0.5 0.4 0.2 0.3 0.2 0.2
Parkinson's disease 0.4 0.2 0.1 0.1 0.2 0.1
Renal disease 0.2 0.2 0.1 0.1 0.2 0.2
Tuberculosis 0.04 0.01 0.01 0.01 0.02 0.02
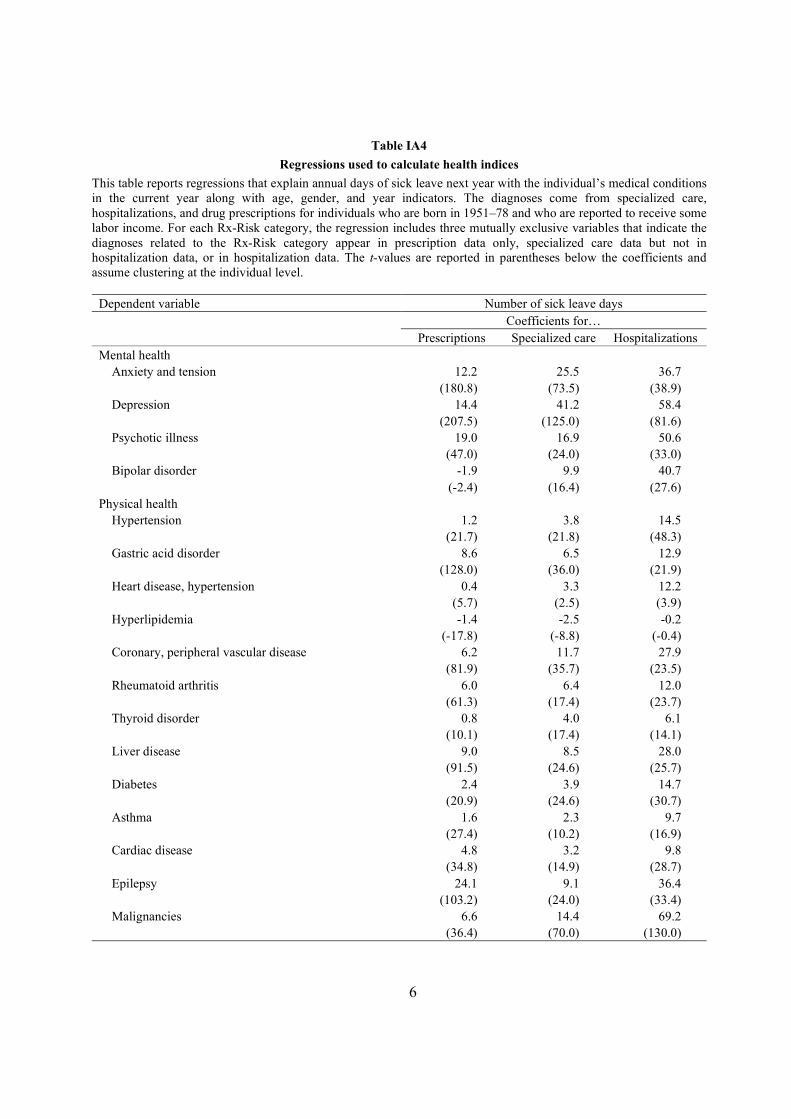
6
Table IA4
Regressions used to calculate health indices
This table reports regressions that explain annual days of sick leave next year with the individual’s medical conditions in the current year along with age, gender, and year indicators. The diagnoses come from specialized care, hospitalizations, and drug prescriptions for individuals who are born in 1951–78 and who are reported to receive some labor income. For each Rx-Risk category, the regression includes three mutually exclusive variables that indicate the diagnoses related to the Rx-Risk category appear in prescription data only, specialized care data but not in hospitalization data, or in hospitalization data. The t-values are reported in parentheses below the coefficients and assume clustering at the individual level.
Dependent variable Number of sick leave days Coefficients for… Prescriptions Specialized care Hospitalizations
Mental health Anxiety and tension 12.2 25.5 36.7
(180.8) (73.5) (38.9) Depression 14.4 41.2 58.4
(207.5) (125.0) (81.6) Psychotic illness 19.0 16.9 50.6
(47.0) (24.0) (33.0) Bipolar disorder -1.9 9.9 40.7
(-2.4) (16.4) (27.6) Physical health
Hypertension 1.2 3.8 14.5 (21.7) (21.8) (48.3)
Gastric acid disorder 8.6 6.5 12.9 (128.0) (36.0) (21.9)
Heart disease, hypertension 0.4 3.3 12.2 (5.7) (2.5) (3.9)
Hyperlipidemia -1.4 -2.5 -0.2 (-17.8) (-8.8) (-0.4)
Coronary, peripheral vascular disease 6.2 11.7 27.9 (81.9) (35.7) (23.5)
Rheumatoid arthritis 6.0 6.4 12.0 (61.3) (17.4) (23.7)
Thyroid disorder 0.8 4.0 6.1 (10.1) (17.4) (14.1)
Liver disease 9.0 8.5 28.0 (91.5) (24.6) (25.7)
Diabetes 2.4 3.9 14.7 (20.9) (24.6) (30.7)
Asthma 1.6 2.3 9.7 (27.4) (10.2) (16.9) Cardiac disease 4.8 3.2 9.8
(34.8) (14.9) (28.7) Epilepsy 24.1 9.1 36.4
(103.2) (24.0) (33.4) Malignancies 6.6 14.4 69.2
(36.4) (70.0) (130.0)

7
Table IA4 continued Coefficients for… Prescriptions Specialized care Hospitalizations
Irritable bowel syndrome 4.0 4.7 9.0 (14.8) (5.9) (4.2) Gout 9.7 3.2 19.7
(30.2) (6.5) (8.6)
Parkinson's disease 7.8 37.4 66.4 (20.4) (23.9) (14.7)
Renal disease 37.2 7.8 50.3 (15.5) (13.9) (30.7)
Tuberculosis 28.1 7.2 24.1 (18.3) (5.1) (6.2) Mean dependent variable 8.71
Adjusted R2 0.105
Number of observations 25,563,310
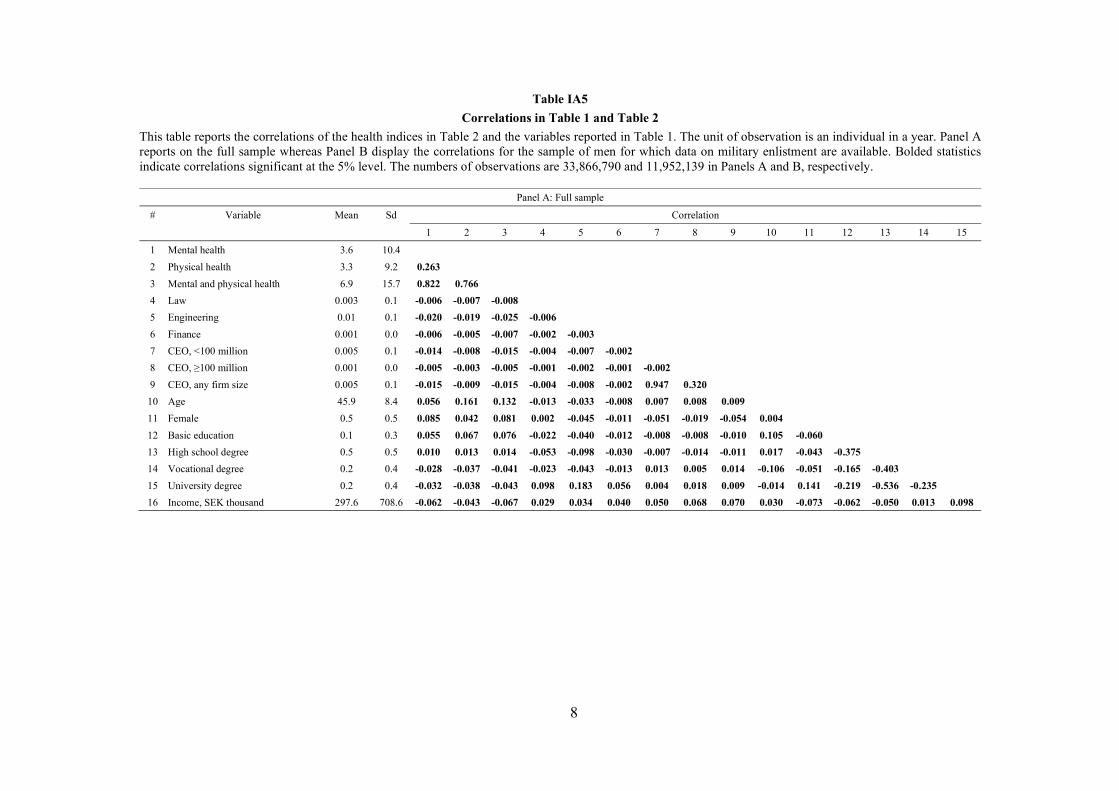
8
Table IA5
Correlations in Table 1 and Table 2
This table reports the correlations of the health indices in Table 2 and the variables reported in Table 1. The unit of observation is an individual in a year. Panel A reports on the full sample whereas Panel B display the correlations for the sample of men for which data on military enlistment are available. Bolded statistics indicate correlations significant at the 5% level. The numbers of observations are 33,866,790 and 11,952,139 in Panels A and B, respectively.
Panel A: Full sample
# Variable Mean Sd Correlation
1 2 3 4 5 6 7 8 9 10 11 12 13 14 15
1 Mental health 3.6 10.4
2 Physical health 3.3 9.2 0.263
3 Mental and physical health 6.9 15.7 0.822 0.766
4 Law 0.003 0.1 -0.006 -0.007 -0.008
5 Engineering 0.01 0.1 -0.020 -0.019 -0.025 -0.006
6 Finance 0.001 0.0 -0.006 -0.005 -0.007 -0.002 -0.003
7 CEO, <100 million 0.005 0.1 -0.014 -0.008 -0.015 -0.004 -0.007 -0.002
8 CEO, ≥100 million 0.001 0.0 -0.005 -0.003 -0.005 -0.001 -0.002 -0.001 -0.002
9 CEO, any firm size 0.005 0.1 -0.015 -0.009 -0.015 -0.004 -0.008 -0.002 0.947 0.320
10 Age 45.9 8.4 0.056 0.161 0.132 -0.013 -0.033 -0.008 0.007 0.008 0.009
11 Female 0.5 0.5 0.085 0.042 0.081 0.002 -0.045 -0.011 -0.051 -0.019 -0.054 0.004
12 Basic education 0.1 0.3 0.055 0.067 0.076 -0.022 -0.040 -0.012 -0.008 -0.008 -0.010 0.105 -0.060
13 High school degree 0.5 0.5 0.010 0.013 0.014 -0.053 -0.098 -0.030 -0.007 -0.014 -0.011 0.017 -0.043 -0.375
14 Vocational degree 0.2 0.4 -0.028 -0.037 -0.041 -0.023 -0.043 -0.013 0.013 0.005 0.014 -0.106 -0.051 -0.165 -0.403
15 University degree 0.2 0.4 -0.032 -0.038 -0.043 0.098 0.183 0.056 0.004 0.018 0.009 -0.014 0.141 -0.219 -0.536 -0.235
16 Income, SEK thousand 297.6 708.6 -0.062 -0.043 -0.067 0.029 0.034 0.040 0.050 0.068 0.070 0.030 -0.073 -0.062 -0.050 0.013 0.098

9
Panel B: Subsample of men with data on early-life traits
# Variable Mean Sd Correlation
1 2 3 4 5 6 7 8 9 10 11 12 13 14 15 16 17 18 19 20
1 Mental health 2.4 8.7
2 Physical health 2.7 8.4 0.237
3 Mental and physical health 5.1 13.5 0.794 0.779
4 Law 0.004 0.1 -0.003 -0.005 -0.005
5 Engineering 0.02 0.1 -0.017 -0.020 -0.024 -0.008
6 Finance 0.002 0.0 -0.005 -0.005 -0.006 -0.002 -0.005
7 CEO, <100 million 0.01 0.1 -0.013 -0.007 -0.012 -0.006 -0.013 -0.004
8 CEO, ≥100 million 0.001 0.0 -0.005 -0.002 -0.004 -0.002 -0.005 -0.001 -0.003
9 CEO, any firm size 0.01 0.1 -0.013 -0.007 -0.013 -0.006 -0.014 -0.004 0.943 0.328
10 Age 46.2 8.3 0.056 0.181 0.149 -0.006 -0.044 -0.013 0.008 0.011 0.012
11 Basic education 0.1 0.3 0.036 0.060 0.061 -0.023 -0.051 -0.015 -0.010 -0.011 -0.013 0.171
12 High school degree 0.5 0.5 0.007 0.010 0.011 -0.062 -0.136 -0.042 -0.015 -0.022 -0.022 -0.027 -0.397
13 Vocational degree 0.2 0.4 -0.020 -0.032 -0.032 -0.026 -0.058 -0.018 0.017 0.005 0.017 -0.080 -0.168 -0.453
14 University degree 0.2 0.4 -0.021 -0.034 -0.035 0.122 0.269 0.082 0.013 0.032 0.022 -0.036 -0.188 -0.507 -0.215
15 Income, SEK thousand 389.2 1,050.2 -0.040 -0.026 -0.042 0.025 0.023 0.042 0.043 0.066 0.063 0.015 -0.042 -0.062 0.022 0.093
16 Cognitive ability 0.0 1.0 -0.055 -0.047 -0.065 0.047 0.139 0.030 0.040 0.025 0.046 0.005 -0.262 -0.282 0.232 0.364 0.089
17 Non-cognitive ability 0.0 1.0 -0.085 -0.046 -0.084 0.036 0.053 0.028 0.055 0.031 0.062 0.005 -0.181 -0.141 0.138 0.203 0.086 0.367
18 Height 0.0 1.0 -0.013 -0.008 -0.013 0.014 0.026 0.009 0.016 0.013 0.020 -0.001 -0.063 -0.063 0.050 0.086 0.031 0.151 0.119
19 Physical fitness 0.0 1.0 -0.046 -0.034 -0.051 0.019 0.045 0.018 0.025 0.017 0.029 -0.0003 -0.125 -0.098 0.085 0.151 0.047 0.185 0.411 0.154
20 Muscle strength 0.0 1.0 -0.020 0.004 -0.010 -0.007 -0.003 -0.001 0.016 0.006 0.018 0.001 0.008 0.010 0.007 -0.026 0.012 0.052 0.226 0.236 0.256
21 Body mass index 0.0 1.0 -0.013 0.054 0.025 -0.009 -0.024 -0.008 -0.0002 -0.001 -0.0003 -0.0004 0.032 0.041 -0.019 -0.061 -0.009 -0.061 0.055 -0.032 0.060 0.411

10
Table IA6
Alternative health indices based on early retirement and mortality
This table reports results in Table 2 Panel C using health indices based on early retirement (Panel A) and mortality (Panel B). These indices regress indicators for an individual receiving early retirement benefits in a year or an individual being deceased in a year against all the diagnosis indicators defined in Table 2. The sample includes individuals who are born in 1951–78. Health index in Panel A is reported percentage points whereas its unit in Panel B is basis points.
Panel A: Health index based on early retirement
Index in popu-
lation, %
Age-gender-adjusted index relative to population, %
High-skill professional CEO by firm size
Law Engi-neering
Finance <100 million
≥100 million
Mental health 1.8 64.0 52.3 52.0 46.5 40.8
Physical health 1.6 67.9 62.4 60.7 67.0 48.8
Mental and physical health 3.5 65.9 57.0 56.1 56.2 44.6
Panel B: Health index based on mortality
Index in popu-lation,
‱
Age-gender-adjusted index relative to population, %
High-skill professional CEO by firm size
Law Engi-neering
Finance <100 million
≥100 million
Mental health 3.1 69.5 52.6 58.4 54.9 53.9
Physical health 13.1 82.2 71.7 74.4 70.1 66.1
Mental and physical health 16.2 79.8 68.1 71.3 67.2 63.8
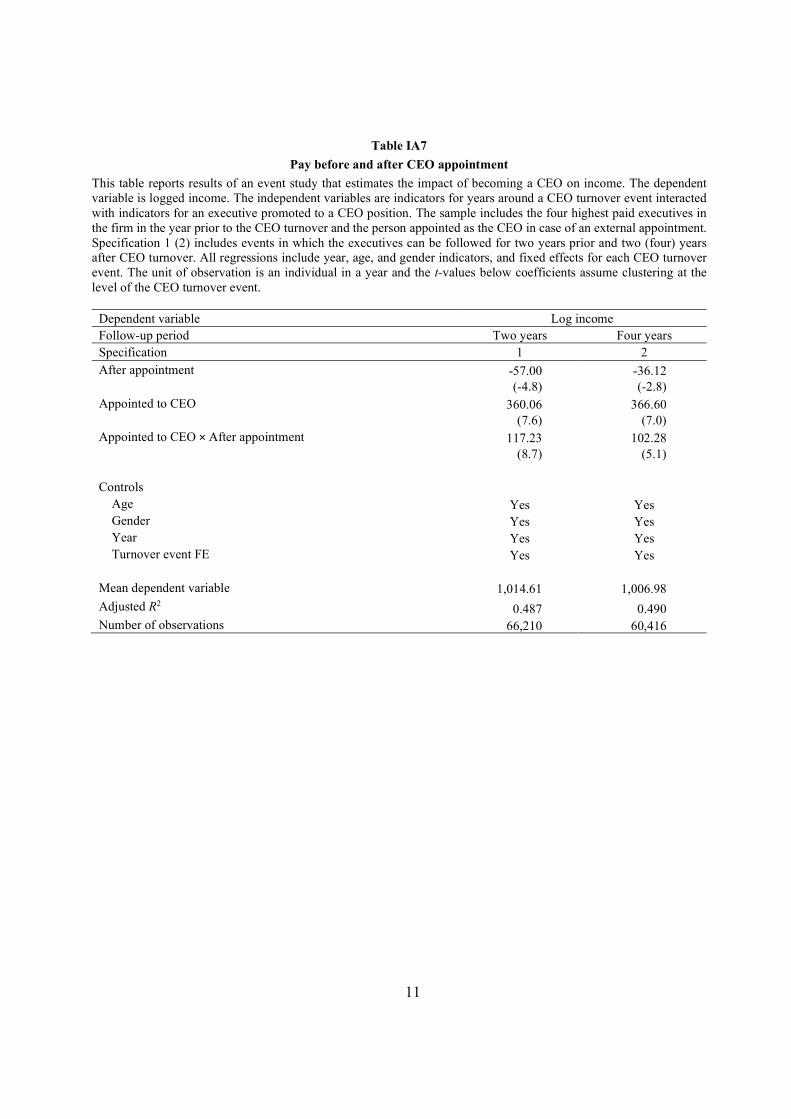
11
Table IA7
Pay before and after CEO appointment
This table reports results of an event study that estimates the impact of becoming a CEO on income. The dependent variable is logged income. The independent variables are indicators for years around a CEO turnover event interacted with indicators for an executive promoted to a CEO position. The sample includes the four highest paid executives in the firm in the year prior to the CEO turnover and the person appointed as the CEO in case of an external appointment. Specification 1 (2) includes events in which the executives can be followed for two years prior and two (four) years after CEO turnover. All regressions include year, age, and gender indicators, and fixed effects for each CEO turnover event. The unit of observation is an individual in a year and the t-values below coefficients assume clustering at the level of the CEO turnover event.
Dependent variable Log income Follow-up period Two years Four years Specification 1 2 After appointment -57.00 -36.12 (-4.8) (-2.8) Appointed to CEO 360.06 366.60 (7.6) (7.0) Appointed to CEO × After appointment 117.23 102.28 (8.7) (5.1) Controls
Age Yes Yes Gender Yes Yes Year Yes Yes Turnover event FE Yes Yes
Mean dependent variable 1,014.61 1,006.98 Adjusted R2 0.487 0.490 Number of observations 66,210 60,416
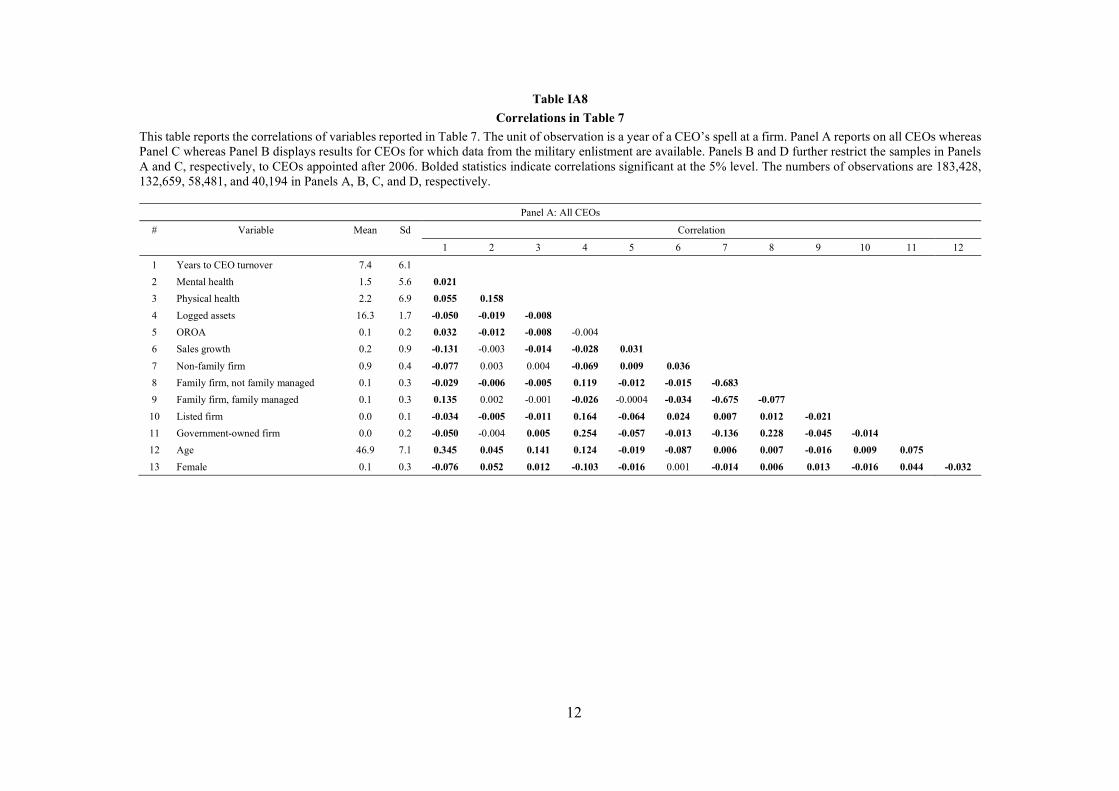
12
Table IA8
Correlations in Table 7
This table reports the correlations of variables reported in Table 7. The unit of observation is a year of a CEO’s spell at a firm. Panel A reports on all CEOs whereas Panel C whereas Panel B displays results for CEOs for which data from the military enlistment are available. Panels B and D further restrict the samples in Panels A and C, respectively, to CEOs appointed after 2006. Bolded statistics indicate correlations significant at the 5% level. The numbers of observations are 183,428, 132,659, 58,481, and 40,194 in Panels A, B, C, and D, respectively.
Panel A: All CEOs
# Variable Mean Sd Correlation
1 2 3 4 5 6 7 8 9 10 11 12
1 Years to CEO turnover 7.4 6.1
2 Mental health 1.5 5.6 0.021
3 Physical health 2.2 6.9 0.055 0.158
4 Logged assets 16.3 1.7 -0.050 -0.019 -0.008
5 OROA 0.1 0.2 0.032 -0.012 -0.008 -0.004
6 Sales growth 0.2 0.9 -0.131 -0.003 -0.014 -0.028 0.031
7 Non-family firm 0.9 0.4 -0.077 0.003 0.004 -0.069 0.009 0.036
8 Family firm, not family managed 0.1 0.3 -0.029 -0.006 -0.005 0.119 -0.012 -0.015 -0.683
9 Family firm, family managed 0.1 0.3 0.135 0.002 -0.001 -0.026 -0.0004 -0.034 -0.675 -0.077
10 Listed firm 0.0 0.1 -0.034 -0.005 -0.011 0.164 -0.064 0.024 0.007 0.012 -0.021
11 Government-owned firm 0.0 0.2 -0.050 -0.004 0.005 0.254 -0.057 -0.013 -0.136 0.228 -0.045 -0.014
12 Age 46.9 7.1 0.345 0.045 0.141 0.124 -0.019 -0.087 0.006 0.007 -0.016 0.009 0.075
13 Female 0.1 0.3 -0.076 0.052 0.012 -0.103 -0.016 0.001 -0.014 0.006 0.013 -0.016 0.044 -0.032
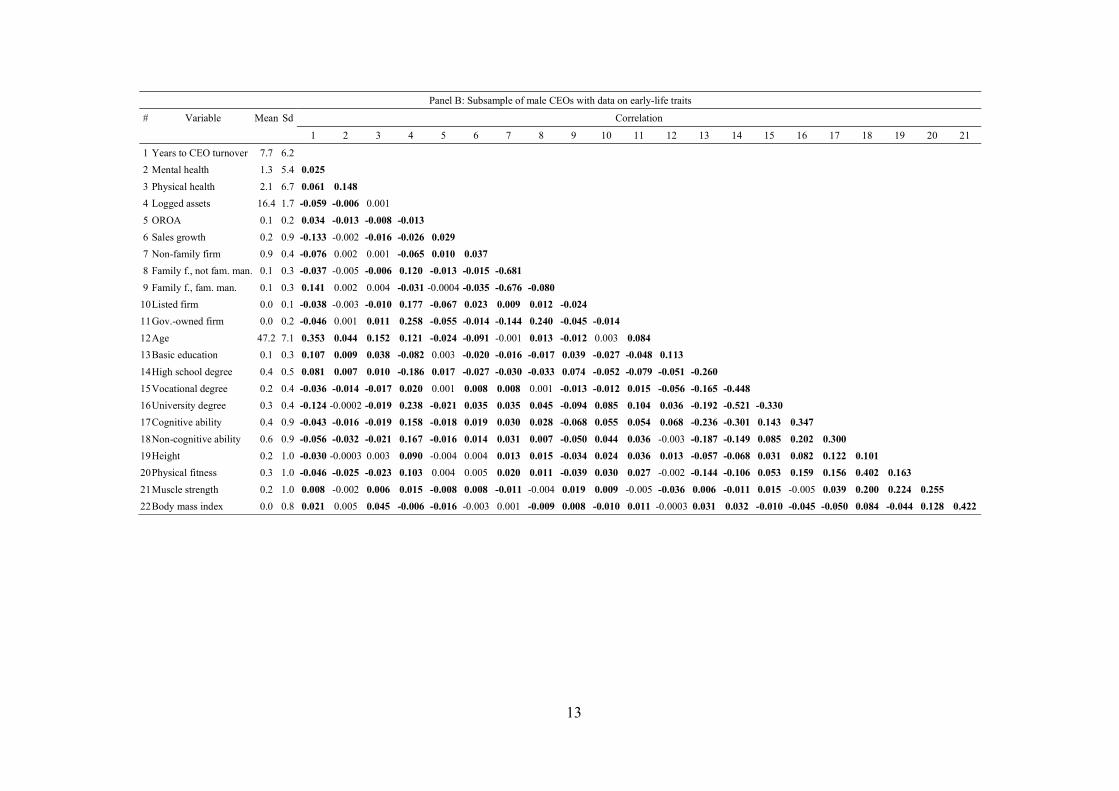
13
Panel B: Subsample of male CEOs with data on early-life traits
# Variable Mean Sd Correlation
1 2 3 4 5 6 7 8 9 10 11 12 13 14 15 16 17 18 19 20 21
1 Years to CEO turnover 7.7 6.2
2 Mental health 1.3 5.4 0.025
3 Physical health 2.1 6.7 0.061 0.148
4 Logged assets 16.4 1.7 -0.059 -0.006 0.001
5 OROA 0.1 0.2 0.034 -0.013 -0.008 -0.013
6 Sales growth 0.2 0.9 -0.133 -0.002 -0.016 -0.026 0.029
7 Non-family firm 0.9 0.4 -0.076 0.002 0.001 -0.065 0.010 0.037
8 Family f., not fam. man. 0.1 0.3 -0.037 -0.005 -0.006 0.120 -0.013 -0.015 -0.681
9 Family f., fam. man. 0.1 0.3 0.141 0.002 0.004 -0.031 -0.0004 -0.035 -0.676 -0.080
10 Listed firm 0.0 0.1 -0.038 -0.003 -0.010 0.177 -0.067 0.023 0.009 0.012 -0.024
11 Gov.-owned firm 0.0 0.2 -0.046 0.001 0.011 0.258 -0.055 -0.014 -0.144 0.240 -0.045 -0.014
12 Age 47.2 7.1 0.353 0.044 0.152 0.121 -0.024 -0.091 -0.001 0.013 -0.012 0.003 0.084
13 Basic education 0.1 0.3 0.107 0.009 0.038 -0.082 0.003 -0.020 -0.016 -0.017 0.039 -0.027 -0.048 0.113
14 High school degree 0.4 0.5 0.081 0.007 0.010 -0.186 0.017 -0.027 -0.030 -0.033 0.074 -0.052 -0.079 -0.051 -0.260
15 Vocational degree 0.2 0.4 -0.036 -0.014 -0.017 0.020 0.001 0.008 0.008 0.001 -0.013 -0.012 0.015 -0.056 -0.165 -0.448
16 University degree 0.3 0.4 -0.124 -0.0002 -0.019 0.238 -0.021 0.035 0.035 0.045 -0.094 0.085 0.104 0.036 -0.192 -0.521 -0.330
17 Cognitive ability 0.4 0.9 -0.043 -0.016 -0.019 0.158 -0.018 0.019 0.030 0.028 -0.068 0.055 0.054 0.068 -0.236 -0.301 0.143 0.347
18 Non-cognitive ability 0.6 0.9 -0.056 -0.032 -0.021 0.167 -0.016 0.014 0.031 0.007 -0.050 0.044 0.036 -0.003 -0.187 -0.149 0.085 0.202 0.300
19 Height 0.2 1.0 -0.030 -0.0003 0.003 0.090 -0.004 0.004 0.013 0.015 -0.034 0.024 0.036 0.013 -0.057 -0.068 0.031 0.082 0.122 0.101
20 Physical fitness 0.3 1.0 -0.046 -0.025 -0.023 0.103 0.004 0.005 0.020 0.011 -0.039 0.030 0.027 -0.002 -0.144 -0.106 0.053 0.159 0.156 0.402 0.163
21 Muscle strength 0.2 1.0 0.008 -0.002 0.006 0.015 -0.008 0.008 -0.011 -0.004 0.019 0.009 -0.005 -0.036 0.006 -0.011 0.015 -0.005 0.039 0.200 0.224 0.255
22 Body mass index 0.0 0.8 0.021 0.005 0.045 -0.006 -0.016 -0.003 0.001 -0.009 0.008 -0.010 0.011 -0.0003 0.031 0.032 -0.010 -0.045 -0.050 0.084 -0.044 0.128 0.422

14
Panel C: CEOs appointed after 2006
# Variable Mean Sd Correlation
1 2 3 4 5 6 7 8 9 10 11 12
1 Years to CEO turnover 2.7 1.8
2 Mental health at appointment 1.4 5.4 0.014
3 Physical health at appointment 2.0 6.8 0.032 0.145
4 Logged assets 16.8 1.8 -0.025 -0.034 -0.012
5 OROA 0.1 0.2 0.062 -0.008 -0.004 -0.007
6 Sales growth 0.2 0.9 -0.113 0.001 -0.010 -0.037 0.019
7 Non-family firm 0.9 0.3 -0.024 0.012 0.011 -0.050 -0.001 0.026
8 Family firm, not family managed 0.1 0.3 -0.008 -0.013 -0.010 0.098 -0.010 -0.014 -0.798
9 Family firm, family managed 0.0 0.2 0.051 -0.001 -0.004 -0.053 0.0163 -0.023 -0.553 -0.061
10 Listed firm 0.0 0.1 -0.020 -0.002 -0.013 0.165 -0.072 0.016 0.014 -0.004 -0.018
11 Government-owned firm 0.0 0.2 -0.009 -0.007 0.003 0.264 -0.047 -0.016 -0.174 0.239 -0.042 -0.021
12 Age 46.1 7.0 0.153 0.046 0.128 0.113 -0.028 -0.040 0.010 0.007 -0.025 0.019 0.091
13 Female 0.2 0.4 -0.021 0.059 0.011 -0.085 0.002 -0.009 -0.017 0.001 0.026 -0.019 0.049 -0.020
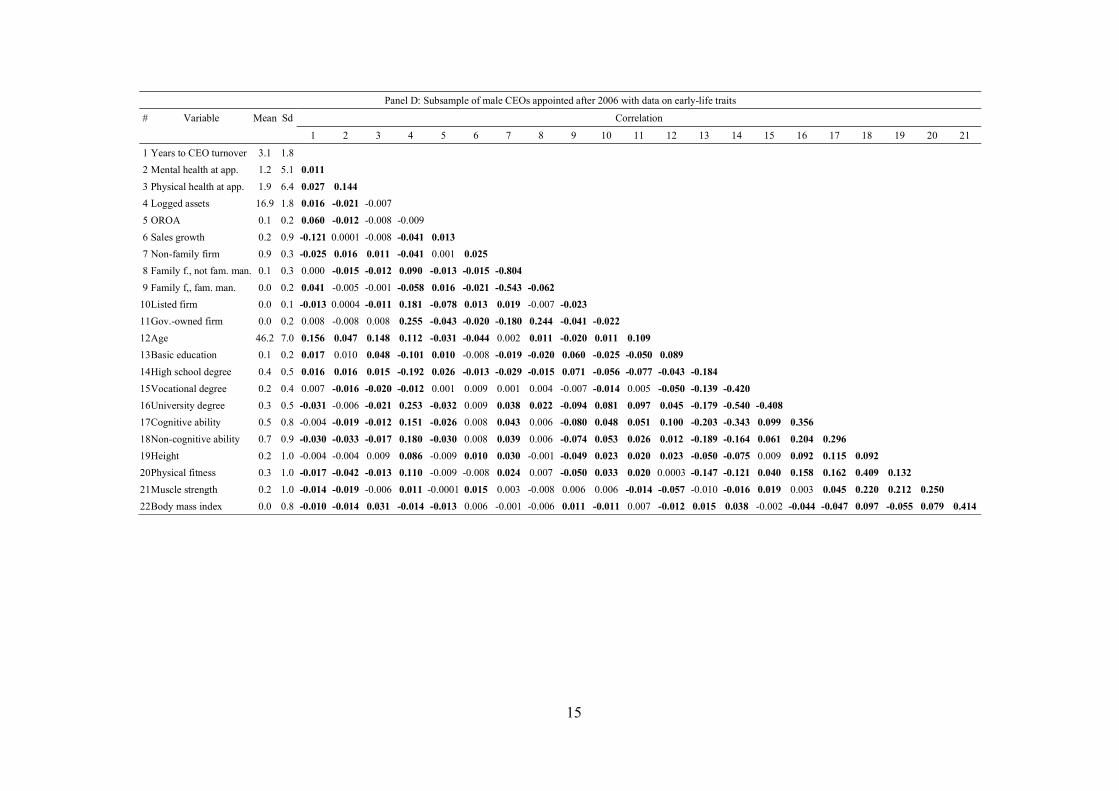
15
Panel D: Subsample of male CEOs appointed after 2006 with data on early-life traits
# Variable Mean Sd Correlation
1 2 3 4 5 6 7 8 9 10 11 12 13 14 15 16 17 18 19 20 21
1 Years to CEO turnover 3.1 1.8
2 Mental health at app. 1.2 5.1 0.011
3 Physical health at app. 1.9 6.4 0.027 0.144
4 Logged assets 16.9 1.8 0.016 -0.021 -0.007
5 OROA 0.1 0.2 0.060 -0.012 -0.008 -0.009
6 Sales growth 0.2 0.9 -0.121 0.0001 -0.008 -0.041 0.013
7 Non-family firm 0.9 0.3 -0.025 0.016 0.011 -0.041 0.001 0.025
8 Family f., not fam. man. 0.1 0.3 0.000 -0.015 -0.012 0.090 -0.013 -0.015 -0.804
9 Family f,, fam. man. 0.0 0.2 0.041 -0.005 -0.001 -0.058 0.016 -0.021 -0.543 -0.062
10 Listed firm 0.0 0.1 -0.013 0.0004 -0.011 0.181 -0.078 0.013 0.019 -0.007 -0.023
11 Gov.-owned firm 0.0 0.2 0.008 -0.008 0.008 0.255 -0.043 -0.020 -0.180 0.244 -0.041 -0.022
12 Age 46.2 7.0 0.156 0.047 0.148 0.112 -0.031 -0.044 0.002 0.011 -0.020 0.011 0.109
13 Basic education 0.1 0.2 0.017 0.010 0.048 -0.101 0.010 -0.008 -0.019 -0.020 0.060 -0.025 -0.050 0.089
14 High school degree 0.4 0.5 0.016 0.016 0.015 -0.192 0.026 -0.013 -0.029 -0.015 0.071 -0.056 -0.077 -0.043 -0.184
15 Vocational degree 0.2 0.4 0.007 -0.016 -0.020 -0.012 0.001 0.009 0.001 0.004 -0.007 -0.014 0.005 -0.050 -0.139 -0.420
16 University degree 0.3 0.5 -0.031 -0.006 -0.021 0.253 -0.032 0.009 0.038 0.022 -0.094 0.081 0.097 0.045 -0.179 -0.540 -0.408
17 Cognitive ability 0.5 0.8 -0.004 -0.019 -0.012 0.151 -0.026 0.008 0.043 0.006 -0.080 0.048 0.051 0.100 -0.203 -0.343 0.099 0.356
18 Non-cognitive ability 0.7 0.9 -0.030 -0.033 -0.017 0.180 -0.030 0.008 0.039 0.006 -0.074 0.053 0.026 0.012 -0.189 -0.164 0.061 0.204 0.296
19 Height 0.2 1.0 -0.004 -0.004 0.009 0.086 -0.009 0.010 0.030 -0.001 -0.049 0.023 0.020 0.023 -0.050 -0.075 0.009 0.092 0.115 0.092
20 Physical fitness 0.3 1.0 -0.017 -0.042 -0.013 0.110 -0.009 -0.008 0.024 0.007 -0.050 0.033 0.020 0.0003 -0.147 -0.121 0.040 0.158 0.162 0.409 0.132
21 Muscle strength 0.2 1.0 -0.014 -0.019 -0.006 0.011 -0.0001 0.015 0.003 -0.008 0.006 0.006 -0.014 -0.057 -0.010 -0.016 0.019 0.003 0.045 0.220 0.212 0.250
22 Body mass index 0.0 0.8 -0.010 -0.014 0.031 -0.014 -0.013 0.006 -0.001 -0.006 0.011 -0.011 0.007 -0.012 0.015 0.038 -0.002 -0.044 -0.047 0.097 -0.055 0.079 0.414

16
Table IA9
Correlations in Table 8
This table reports the correlations of variables reported in Table 8. The unit of observation is a CEO-firm in a year. Bolded statistics indicate correlations significant at the 5% level. The number of observations is 183,428.
# Variable Mean Sd Correlation
1 2 3 4 5 6 7 8 9 10
1 OROA 0.1 0.2
2 Mental health 1.5 5.6 -0.009
3 Physical health 2.2 6.9 -0.006 0.158
4 Logged assets 16.3 1.7 -0.037 -0.019 -0.008
5 Non-family firm 0.9 0.4 0.013 0.003 0.004 -0.069
6 Family firm, not family managed 0.1 0.3 -0.013 -0.006 -0.005 0.119 -0.683
7 Family firm, family managed 0.1 0.3 -0.005 0.002 -0.001 -0.026 -0.675 -0.077
8 Listed firm 0.0 0.1 -0.059 -0.005 -0.011 0.164 0.007 0.012 -0.021
9 Government-owned firm 0.0 0.2 -0.052 -0.004 0.005 0.254 -0.136 0.228 -0.045 -0.014
10 Age 46.9 7.2 -0.016 0.045 0.141 0.125 0.006 0.007 -0.015 0.009 0.075
11 Female 0.1 0.3 -0.013 0.052 0.012 -0.103 -0.014 0.006 0.013 -0.016 0.044 -0.031

17
Appendix 1. Institutional details on health care in Sweden
In Sweden, all residents are entitled to publicly funded, affordable health care. County councils
are the major financiers and providers of health care. Patient fees only account for about 3 percent
of the total revenues; for example, the daily fee for staying at a public hospital is about USD 15
(Grönqvist et al., 2012). Supplemental private health insurance is available, but uncommon. Almost
all hospitals are public hospitals (Nilsson and Paul, 2018).
When a patient wishes to visit a health care provider due to a new health problem, she first calls
her local health care center. An appointment cannot be made by the patient alone; rather, the nurse
answering the phone acts as a gatekeeper and provides advice when needed. The gatekeeper is only
able to make an appointment with the local health care center. If the patient needs to see a specialist,
she will need to visit a general practitioner at the local health care center and obtain a referral
(Nilsson and Paul, 2018). Likewise, the place of residence largely determines the hospital the patient
will be admitted to when in need of health care (Advic, 2016).
Related Documents