CenturyLink NYSE: CTL

Century Link (CTL) equity recommendation
Jul 08, 2015
Equity research presentation of Century Link (CTL) for Student Managed Investment Fund.
Welcome message from author
This document is posted to help you gain knowledge. Please leave a comment to let me know what you think about it! Share it to your friends and learn new things together.
Transcript

CenturyLink
NYSE: CTL

Business
• Integrated Communications company • Provide a broad array of communications services
including voice, internet, data and video service– Fiber transport– Wholesale communications services– Competitive local exchange carrier service– Security monitoring– Other communications, professional and business
information services
• 2010: 4th largest local exchange telephone company

Services
• Voice: fixed monthly charge– Local calling service– Enhanced voice services– Long distance service– Anticipate 7-7.5% access line loss
• Data: monthly recurring charges– Broadband High-speed Internet access– Business data transmission services
• Dedicated equipment for transmitting large amounts of data
– Switched digital television services: 20% of lines
• Network Access– Wholesale services to carriers and customers
Basic Information
Market Cap 23.01 Bil
Fiscal Yearend December 31
Last Earnings Announcements November 2
Next Earnings Announcements February 15
Institutional Ownership 76.57%
Insider Ownership .57%
# of Analysts 24
S&P Quality Ranking

Competition
• AT&T Inc
– 169.72B
• Verizon Communications Inc
– 103.22B
• Comcast Corp
– 58.26B

Mergers & Acquisitions
• Embarq Corp – July 2009
– Home phone service, high-speed Internet, wireless, and satellite TV
– Wireline Voice, Cable Video & Communication Equipment
• Zillion TV Corp – February 2010
– Television Broadcasting service

Mergers & Acquisitions
• Qwest Communications International – April 2011
– Fiber-optic network, high-speed internet and digital home phone services
– Network, data & voice for small & large businesses, government agencies & wholesale customers
– Networx: largest communication services contract in world
– Qwest serves 95% of Fortune 500
– Created 173,000-mile fiber network

Mergers & Acquisitions
• SAVVIS Inc – July 2011– Cloud infrastructure and hosted IT solutions for enterprises
– 2,500 unique clients• 32 of the top 100 companies in the Fortune 500
– Achieve global scale as a managed hosting and colocation provider
– Accelerate ability to deliver quality managed hosting and cloud capabilities to business customers
– 48 data centers located in North America, Europe, and Asia
– 207,000-mile fiber network nationally
– 190,000 mile global access network
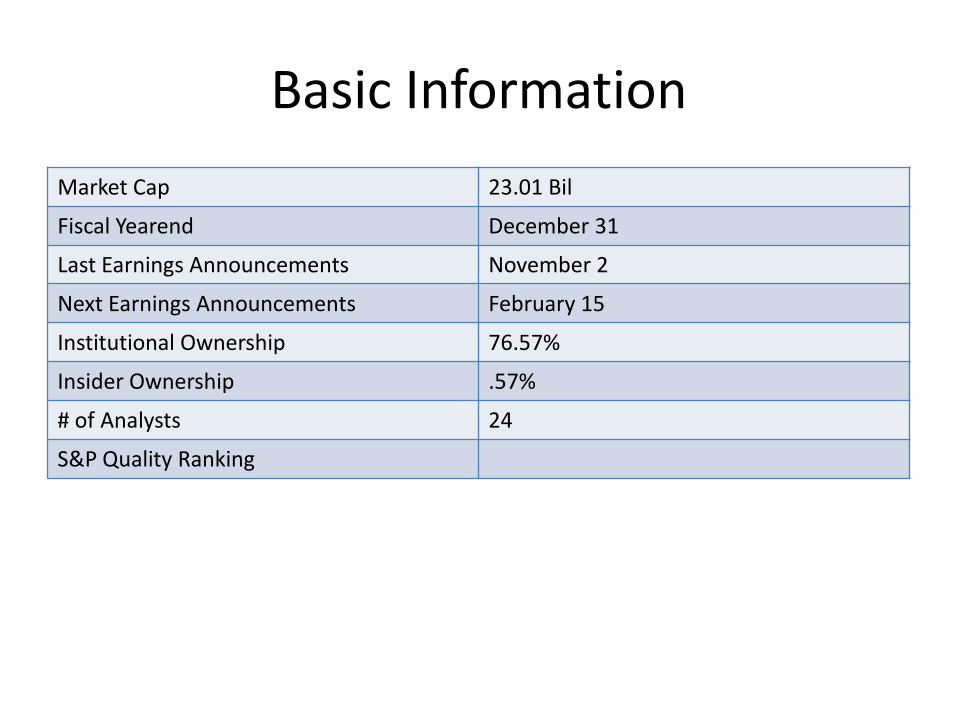
Management Discussion
• Embarq substantially expanded size & scope– Consolidated results begin July 1, 2009
– Previous year comparisons less meaningful
• Revenue declines in Voice and Network Access– Declines in access lines, intrastate access rates,
minutes of use and federal support funds
– Bundle & provide new services
– Provide premium service to higher % of customers
– Increase usage of networks
– Market to new customers

Risk Factors
• Continued access line losses– Competition and wireless/broadband substitution
• Technological & regulatory changes increasing competition– Wireless providers, Cable television operators, VoIP &
broadband providers
• Network disruptions or system failures
• Limited number of key suppliers and vendors
• PP&E located on property owned by 3rd parties

Capital Structure
Qwest acquisition included $11.947 billion of long-term debt


Industry Structure
• “The firm should have the financial flexibility to adapt as the telecom industry changes while maintaining its dividend. While the Qwest and Embarq deals brought exposure to more competitive markets, a significant portion of CenturyLink's service territory is rural.”

• "The small business segment is even more competitive among ISPs, highlighting the need for providers to develop strong marketing strategies to ensure they can retain and grow market share."
Industry Structure

“The industry is highly concentrated: the 50 largest companies generate about 90 percent of revenue.”
Industry Depends Highly on Regulatory Decisions — “The FCC regulates the interstate activities of telecom providers, including pricing and operations, while state public utility commissions (PUCs) regulate similar matters at the state level.”
Industry Structure
http://subscriber.hoovers.com/H/industry360/overview.html?industryId=1577

(un?)Competitive Advantages
“While CenturyLink's financial position is better than that of many peers, it still isn't great, especially considering its unfunded postretirement benefit obligations and the cash it will pay for Savvis.”
Enterprise Cloud Computing:Should they be diversifying into this industry?

Competitive Advantages

Competitive Advantages
• “CenturyLink, which merged with Qwest in April 2011, ranked as the third largest business ISP at 7 percent share.”

Competitive Advantages

Industries
Good.

Large Cities

Summary
• Rural/small market dominance
• Very competitive market
• Government reg. (good…)
• Alpha – expansion to larger markets
• Alpha – different markets
• Diversification, making sure they aren’t going to be left behind

CenturyLink Income Statement
FQ3 2011 FQ3 2010 FQ3 2009 FQ3 2008 FQ3 2007 FQ3 2011 FQ3 2010 FQ3 2009 FQ3 2008 FQ3 2007
9/30/2011 9/30/2010 9/30/2009 9/30/2008 9/30/2007 9/30/2011 9/30/2010 9/30/2009 9/30/2008 9/30/2007
Revenue 12,419.70 7,149.49 3,788.13 2,613.36 2,607.37
- Cost of Revenue 4,921.43 2,483.96 1,391.02 970.71 909.48 39.6% 34.7% 36.7% 37.1% 34.9%
Gross Profit 7,498.27 4,665.52 2,397.11 1,642.65 1,697.89 60.4% 65.3% 63.3% 62.9% 65.1%
- Operating Expenses 5,537.60 2,550.95 1,527.91 928.76 900.11 44.6% 35.7% 40.3% 35.5% 34.5%
Operating Income 1,960.67 2,114.57 869.21 713.88 797.78 15.8% 29.6% 22.9% 27.3% 30.6%
- Interest Expense 867.96 553.25 290.84 201.87 207.18 7.0% 7.7% 7.7% 7.7% 7.9%
- Foreign Exchange Losses (Gains) 0 0 0 0 0 0.0% 0.0% 0.0% 0.0% 0.0%
- Net Non-Operating Losses (Gains) -4.38 44.85 -30.7 -36.08 -18.83 0.0% 0.6% -0.8% -1.4% -0.7%
Pretax Income 1,097.09 1,516.47 609.06 548.09 609.43 8.8% 21.2% 16.1% 21.0% 23.4%
- Income Tax Expense 418.14 565.63 224.24 167.39 233.86 3.4% 7.9% 5.9% 6.4% 9.0%
Income Before XO Items 678.95 950.83 384.83 380.69 375.57 5.5% 13.3% 10.2% 14.6% 14.4%
- Extraordinary Loss Net of Tax 0 -2.74 -133.21 0 0 0.0% 0.0% -3.5% 0.0% 0.0%
- Minority Interests 0.69 0.8 0.94 0 0 0.0% 0.0% 0.0% 0.0% 0.0%
Net Income 678.26 952.78 517.1 380.69 375.57 5.5% 13.3% 13.7% 14.6% 14.4%

CenturyLink Balance SheetFQ3 2011 FQ3 2010 FQ3 2009 FQ3 2008 FQ3 2007 FQ3 2011 FQ3 2010 FQ3 2009 FQ3 2008 FQ3 2007
9/30/2011 9/30/2010 9/30/2009 9/30/2008 9/30/2007 10/1/2011 10/2/2010 10/3/2009 9/30/2008 9/30/2007
Assets
+ Cash & Near Cash Items 1,123.00 243.06 531.19 258.96 58.71 2.0% 1.1% 2.3% 3.1% 0.7%
+ Accounts & Notes Receivable 1,998.00 749.65 670.73 214.01 233.96 3.5% 3.4% 2.9% 2.6% 2.8%
+ Inventories 0.00 35.14 43.37 9.28 7.69 0.0% 0.2% 0.2% 0.1% 0.1%
+ Other Current Assets 687.00 199.26 212.97 26.53 27.52 1.2% 0.9% 0.9% 0.3% 0.3%
Total Current Assets 3,808.00 1,227.11 1,458.26 508.78 327.88 6.7% 5.5% 6.4% 6.1% 4.0%
+ Net Fixed Assets 19,290.00 8,801.74 9,363.19 2,915.35 3,144.82 34.0% 39.6% 40.8% 35.2% 38.2%
+ Other Long-Term Assets 33,637.00 12,191.36 12,135.62 4,848.77 4,759.95 59.3% 54.9% 52.9% 58.6% 57.8%
Total Long-Term Assets 52,927.00 20,993.10 21,498.81 7,764.12 7,904.77 93.3% 94.5% 93.6% 93.9% 96.0%
Total Assets 56,735.00 22,220.21 22,957.06 8,272.90 8,232.65
Liabilities and Equity
+ Accounts Payable 1,360.00 292.68 331.69 98.74 97.91 2.4% 1.3% 1.4% 1.2% 1.2%
+ Short-Term Borrowings 1,034.00 496.55 769.48 45.36 254.90 1.8% 2.2% 3.4% 0.5% 3.1%
+ Other Short-Term Liabilities 2,343.00 860.50 1,048.10 330.62 327.11 4.1% 3.9% 4.6% 4.0% 4.0%
Total Current Liabilities 4,737.00 1,649.73 2,149.28 474.71 679.92 8.3% 7.4% 9.4% 5.7% 8.3%
+ Long-Term Borrowings 21,142.00 7,061.74 7,454.52 3,299.27 2,747.58 37.3% 31.8% 32.5% 39.9% 33.4%
+ Other Long-Term Liabilities 8,880.00 3,902.88 3,989.24 1,302.68 1,440.74 15.7% 17.6% 17.4% 15.7% 17.5%
Total Long-Term Liabilities 30,022.00 10,964.63 11,443.76 4,601.95 4,188.31 52.9% 49.3% 49.8% 55.6% 50.9%
Total Liabilities 34,759.00 12,614.36 13,593.03 5,076.66 4,868.23 61.3% 56.8% 59.2% 61.4% 59.1%
+ Total Prefered Equity 0.00 0.24 0.24 0.24 7.35 0.0% 0.0% 0.0% 0.0% 0.1%
+ Minority Interest 0.00 6.70 6.73 0.00 0.00 0.0% 0.0% 0.0% 0.0% 0.0%
+ Share Capital & APIC 19,471.00 6,389.82 6,256.42 126.46 308.18 34.3% 28.8% 27.3% 1.5% 3.7%
+ Retained Earnings 2,505.00 3,209.10 3,100.65 3,069.54 3,048.89 4.4% 14.4% 13.5% 37.1% 37.0%
Total Equity 21,976.00 9,605.85 9,364.03 3,196.24 3,364.42 38.7% 43.2% 40.8% 38.6% 40.9%
Total Liabilities & Equity 56,735.00 22,220.21 22,957.06 8,272.90 8,232.65

CenturyLink Cash FlowsFQ3 2011 FQ3 2010 FQ3 2009 FQ3 2008 FQ3 2007 FQ3 2011 FQ3 2010 FQ3 2009 FQ3 2008 FQ3 2007
10/1/2011 10/2/2010 10/3/2009 9/30/2008 9/30/2007 10/1/2011 10/2/2010 10/3/2009 9/30/2008 9/30/2007
Cash from Operating Activities
+ Net Income 678.26 952.78 517.10 380.69 375.57
+ Depreciation & Amortization 3,135.57 1,425.38 747.12 532.54 525.98 462.3% 149.6% 139.9% 140.0% 140.0%
+ Other Non-Cash Adjustments 101.30 12.01 (184.31) 60.54 63.23 14.9% 1.3% 15.9% 16.8% 16.8%
+ Changes in Non-Cash Capital 121.11 (297.22) 67.91 (65.99) 42.87 17.9% -31.2% -17.3% 11.4% 11.4%
Cash from Operations 4,036.24 2,092.95 1,147.83 907.79 1,007.64 595.1% 219.7% 238.5% 268.3% 268.3%
Cash from Investing Activities
+ Disposal of Fixed Assets 0.00 0.00 0.00 0.00 8.23
+ Capital Expenditures (1,774.99) (937.42) (518.94) (326.75) (291.20) -261.7% -98.4% -85.8% -77.5% -77.5%
+ Other Investing Activities (1,235.20) (2.23) 79.53 (96.79) (301.75) -182.1% -0.2% -25.4% -80.3% -80.3%
Cash from Investing Activities (3,010.19) (939.65) (439.41) (423.54) (584.73) -443.8% -98.6% -111.3% -155.7% -155.7%
Cash from Financing Activities
+ Dividends Paid (1,326.34) (867.74) (421.08) (157.36) (29.07) -195.6% -91.1% -41.3% -7.7% -7.7%
+ Change in Short-Term Borrowings 0.00 0.00 0.00 23.00 (23.00) 0.0% 0.0% 6.0% -6.1% -6.1%
+ Increase in Long-Term Borrowings 3,232.80 0.00 644.42 563.12 764.84 476.6% 0.0% 147.9% 203.6% 203.6%
+ Decrease in Long-Term Borrowings (2,111.51) (665.45) (656.71) (281.94) (729.39) -311.3% -69.8% -74.1% -194.2% -194.2%
+ Increase in Capital Stocks 160.71 101.24 18.04 15.79 88.14 23.7% 10.6% 4.1% 23.5% 23.5%
+ Decrease in Capital Stocks (33.19) (20.79) (8.78) (469.43) (470.84) -4.9% -2.2% -123.3% -125.4% -125.4%
+ Other Financing Activities (68.64) 11.05 (12.08) 22.81 2.43 -10.1% 1.2% 6.0% 0.6% 0.6%
Cash from Financing Activities (146.17) (1,441.69) (436.19) (284.01) (396.90) -21.6% -151.3% -74.6% -105.7% -105.7%
Net Changes in Cash 879.88 (288.38) 272.23 200.24 26.02 129.7% -30.3% 52.6% 6.9% 6.9%

CenturyLink Enterprise Value
11/18/2011 10/1/2011 10/2/2010 10/3/2009 9/30/2008 9/30/2007
Market cap 23005.80 20449.18 11943.94 9994.89 3689.88 5138.69
+ Preferred Equity 0.00 0.00 0.24 0.24 0.87 7.35
+ Minority Interest 0.00 0.00 6.70 6.73 0.00 0.00
+ Total Debt 22176.00 22176.00 7558.30 8224.00 3061.59 3002.47
- Cash & Cash Equiv 1123.00 1123.00 243.06 531.19 63.90 58.71
Enterprise Value 44058.80 41058.80 19266.11 17694.67 6688.44 8089.80

Liquidity Ratios
Current Ratio
Quick Ratio

Activity RatiosAsset Turnover
A/R Turnover

Leverage Ratios
Debt/Equity
Debt/Assets
Financial Leverage

Profitability RatiosGross Margin
Operating Margin
Profit Margin

ROA
ROE
ROC

Dupont Analysis

CenturyLink Inc.- Piotroski Breakdown
Qualification Score
1. Positive Net Income 1
2. Positive Cash Flow from Operations 1
3. Increase of Return of Assets 1(by 5 bp)
4. Cash Flow from Operations > Net Income 1
5. Decrease in Long-Term Debt to Assets 0
6. Increase in Current Ratio 1
7. Decrease in Shares Outstanding 0
8. Increase in Gross Margin 1
9. Increase in Asset Turnover 0
Total Score 6/9
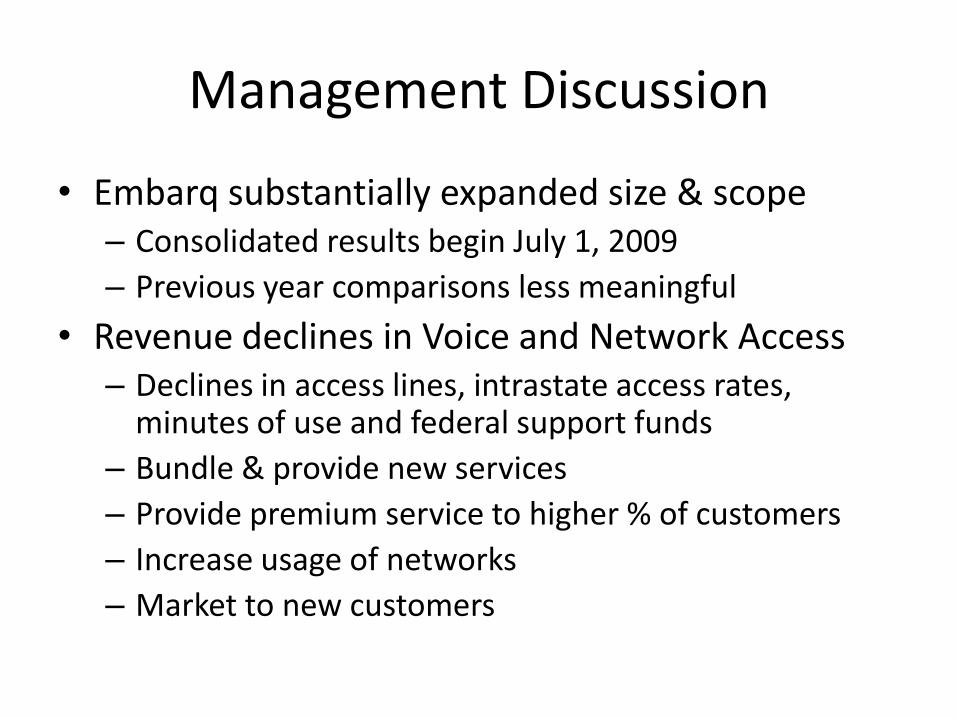
Price Multiples
Price/Earnings Ratio
Price/Book Ratio
Price/Sales Ratio
Price/ Operating Cash Flow

Analyst Coverage

Earning Surprise - Quarterly

Earning Surprise - Annually

Earning Surprise - Matrix
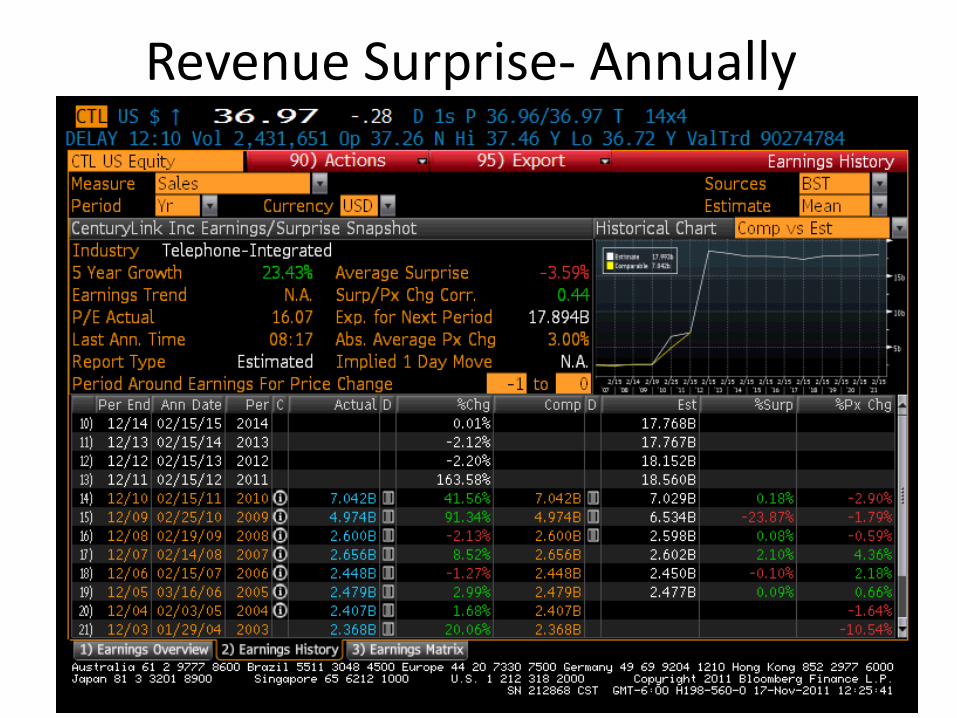
Revenue Surprise- Annually

Revenue Surprise - Matrix

Growth RatesRevenue Growth
EPS Growth
Asset Growth

DividendsDividend Yield
Dividend Payout
Dividend CoverageIncome before XO/Cash Common Dividends

Dividends
AT&T 5.9% 77% 92%Verizon Communications
5.4% 20% 21%
Windstream Corporation
8.5% 118% 534%
CenturyLink 7.7% 49% 63%Frontier Communications
13.7% 60% 90%
Source: S&P Capital IQ.
Company Dividend YieldFCF Payout (unlevered)Most Recent Quarter’s
FCF Payout (levered)Most Recent Quarter’s

6-Month Comparative vs. Peers

2-Year Comparative vs. Peers

5-Year Comparative vs. Peers

6-month Comparative vs. Index

2-Year Comparative vs. Index

5-Year Comparative vs. Index
Related Documents