CENTRAL OREGON STRATEGIC TRANSPORTATION OPTIONS PLAN | Technical Report Central Oregon Intergovernmental Council Central Oregon Intergovernmental Council CENTRAL OREGON STRATEGIC TRANSPORTATION OPTIONS PLAN Final Report – Approved by the COIC Board July 11, 2013 July 2013

Welcome message from author
This document is posted to help you gain knowledge. Please leave a comment to let me know what you think about it! Share it to your friends and learn new things together.
Transcript
CENTRAL OREGON STRATEGIC TRANSPORTATION OPTIONS PLAN | Technical Report
Central Oregon Intergovernmental Council
COIC - Nelson\Nygaard Consulting Associates Inc. – DKS Associates | i
Central Oregon Intergovernmental Council
CENTRAL OREGON STRATEGIC TRANSPORTATION OPTIONS PLAN
Final Report – Approved by the COIC Board July 11, 2013
July 2013
CENTRAL OREGON STRATEGIC TRANSPORTATION OPTIONS PLAN | Final Report
Central Oregon Intergovernmental Council
COIC - Nelson\Nygaard Consulting Associates Inc. – DKS Associates | i
Table of Contents
Page
1. Introduction ......................................................................................................................1-1
2. Traffic Reduction Strategies ............................................................................................2-3 Strategy Effectiveness .......................................................................................................................... 2-3 Strategy Costs ........................................................................................................................................ 2-7 Regional Market Applicability ............................................................................................................ 2-8
3. Analysis Methodology ....................................................................................................3-1 Data Collection ....................................................................................................................................... 3-1 Analysis Conditions and Assumptions ................................................................................................. 3-2 Analysis Methods ................................................................................................................................... 3-4
4. Outreach and Engagement ..............................................................................................4-1 Policy Board............................................................................................................................................ 4-1 Integrated Stakeholder/Technical Committee Meetings ............................................................... 4-2 Other Outreach ...................................................................................................................................... 4-3
5. Baseline Conditions .........................................................................................................5-1 Transit and TDM Program Overview ................................................................................................. 5-1 Segment Overviews .............................................................................................................................. 5-4 Baseline Travel Demand Results ....................................................................................................... 5-17
6. Analysis Scenarios ..........................................................................................................6-1 Analysis Scenarios ................................................................................................................................. 6-1 Scenario Definition and Assumptions ................................................................................................. 6-4
7. Analysis Results & implications .....................................................................................7-1 Results ....................................................................................................................................................... 7-1 Key Findings .......................................................................................................................................... 7-15 Policy Implications and Next Steps .................................................................................................. 7-17
APPENDIX A Transportation Options
APPENDIX B Non-Financially Committed Highway Projects
APPENDIX C Commuter Rail Crossing Improvement Maps
APPENDIX D Scenario Results by Corridor
APPENDIX E Baseline Conditions and First Intersection Traffic Analysis
APPENDIX F Intercommunity Trip Tables
APPENDIX G Transit-Supportive Land Use Strategies
This project is partially funded by a grant from the Transportation and Growth Management (TGM) Program, a joint program of the Oregon Department of Transportation and the Oregon Department of Land Conservation and Development. This TGM Grant is financed, in part, by federal Safe, Accountable, Flexible, Efficient Transportation Equity Act: A Legacy for Users
(SAFETEA-LU), local government, and State of Oregon funds.
The contents of this document do not necessarily reflect views or policies of the State of Oregon
CENTRAL OREGON STRATEGIC TRANSPORTATION OPTIONS PLAN | Final Report
Central Oregon Intergovernmental Council
COIC - Nelson\Nygaard Consulting Associates Inc. – DKS Associates | ii
Table of Figures
Page
Figure 2-1 Factors that Influence the Effectiveness of Transit and Vanpool Strategies ............. 2-4
Figure 2-2 Range of Effectiveness for Transportation Options ....................................................... 2-4
Figure 2-3 Strategy Costs ....................................................................................................................... 2-8
Figure 2-4 Preliminary Corridor-Level Market Assessment .............................................................. 2-9
Figure 3-1 Analysis Assumptions ............................................................................................................ 3-3
Figure 4-1 COIC Board Members ......................................................................................................... 4-1
Figure 4-2 Stakeholder/Technical Committee Members .................................................................. 4-2
Figure 5-1 Sisters to Redmond Transit Schedule ................................................................................. 5-4
Figure 5-2 Sisters to Redmond Transit Use .......................................................................................... 5-5
Figure 5-3 Sisters to Redmond TDM Activity ....................................................................................... 5-5
Figure 5-4 Redmond to Prineville Transit Schedule ............................................................................ 5-6
Figure 5-5 Redmond to Prineville Transit Use ..................................................................................... 5-7
Figure 5-6 Redmond to Prineville TDM Activity ................................................................................. 5-7
Figure 5-7 Madras to Redmond Transit Schedule .............................................................................. 5-8
Figure 5-8 Madras to Redmond Transit Use ....................................................................................... 5-8
Figure 5-9 Madras to Redmond TDM Activity .................................................................................... 5-9
Figure 5-10 Redmond to Bend Transit Schedule ................................................................................. 5-10
Figure 5-11 Redmond to Bend Transit Use .......................................................................................... 5-10
Figure 5-12 Redmond to Bend TDM Activity ....................................................................................... 5-11
Figure 5-13 Bend to La Pine Financially-Committed Highway Projects ......................................... 5-12
Figure 5-14 Bend to La Pine Transit Schedule ..................................................................................... 5-12
Figure 5-15 Bend to La Pine Transit Use .............................................................................................. 5-13
Figure 5-16 Bend to La Pine TDM Activity ........................................................................................... 5-13
Figure 5-17 Culver to Madras to Transit Schedule ............................................................................ 5-15
Figure 5-18 Culver to Madras Transit Use ........................................................................................... 5-15
Figure 5-19 Sisters to Redmond TDM Activity ..................................................................................... 5-16
Figure 5-20 2030 Traffic Volumes and VMT by Corridor ............................................................... 5-17
Figure 5-21 2030 Intercommunity Traffic Share and Number of Vehicle Trips by Corridor .... 5-18
Figure 5-22 2030 Intercommunity Trip Purposes by Corridor ......................................................... 5-19
Figure 6-1 Analysis Scenarios ................................................................................................................ 6-3
Figure 6-2 Baseline Transit Services ...................................................................................................... 6-4
Figure 6-3 Assessment of Vanpool Market Potential......................................................................... 6-5
Figure 6-4 Vanpool Scenario Characteristics ...................................................................................... 6-6
Figure 6-5 Vanpool Mode Shift Assumptions – High and Moderate Vanpool Scenarios .......... 6-6
Figure 6-6 Vanpools, Other Assumptions ............................................................................................. 6-6
Figure 6-7 Assessment of Transit Market Potential ............................................................................ 6-7
Figure 6-8 Transit Scenario Characteristics ......................................................................................... 6-7
Figure 6-9 “Moderate” and “High” Transit Scenario Service Levels .............................................. 6-8
Figure 6-10 Transit Mode Shift Assumptions by Corridor and Scenario .......................................... 6-9
Figure 6-11 Transit Scenario, Other Assumptions ................................................................................. 6-9
Figure 6-12 Central Oregon Rail Map ................................................................................................. 6-11
Figure 6-13 Commuter Rail Scenario Total Mode Shift Assumptions .............................................. 6-13

CENTRAL OREGON STRATEGIC TRANSPORTATION OPTIONS PLAN | Final Report
Central Oregon Intergovernmental Council
COIC - Nelson\Nygaard Consulting Associates Inc. – DKS Associates | iii
Figure 6-14 Detailed Capital Cost Assumptions ................................................................................. 6-14
Figure 6-15 Summary of Commuter Rail Scenario Characteristics, Madras-Bend ....................... 6-15
Figure 6-16 Assessment of Vanpool and Transit Market Potential ................................................. 6-16
Figure 6-17 Reach-Out Scenario Total Mode Shift Assumptions ..................................................... 6-17
Figure 7-1 Change in Number of Trips................................................................................................. 7-2
Figure 7-2 Monetary User Costs by Mode and Corridor ................................................................. 7-2
Figure 7-3 Total Aggregate Monetary User Costs and Benefits .................................................... 7-3
Figure 7-4 Distribution of Monetary User Benefits by Corridor and Scenario ............................ 7-3
Figure 7-5 Transportation System Impacts .......................................................................................... 7-5
Figure 7-6 VMT, Fuel Consumption, and GhG Emissions ................................................................... 7-6
Figure 7-7 Net Reduction in Injuries and Fatalities, 20-Year Period.............................................. 7-8
Figure 7-8 Daily Vehicle Trips Reduced by Corridor ........................................................................ 7-9
Figure 7-9 Traffic Operations Impacts at First/Downstream Intersections .................................... 7-9
Figure 7-10 Percentage Change in PM Peak Traffic Volumes, Redmond-Bend .......................... 7-10
Figure 7-11 Travel Cost with “High” VMT Fee Relative to Driving and Transit Costs ................. 7-11
Figure 7-12 Effects of 1.2 and 4.8 Cent per Mile VMT Fees with Baseline and High Transit Scenarios .............................................................................................................................. 7-12
Figure 7-13 Summary of Results ............................................................................................................. 7-13
CENTRAL OREGON STRATEGIC TRANSPORTATION OPTIONS PLAN | Final Report
Central Oregon Intergovernmental Council
COIC – Nelson\Nygaard Consulting Associates Inc. – DKS Associates | 1-1
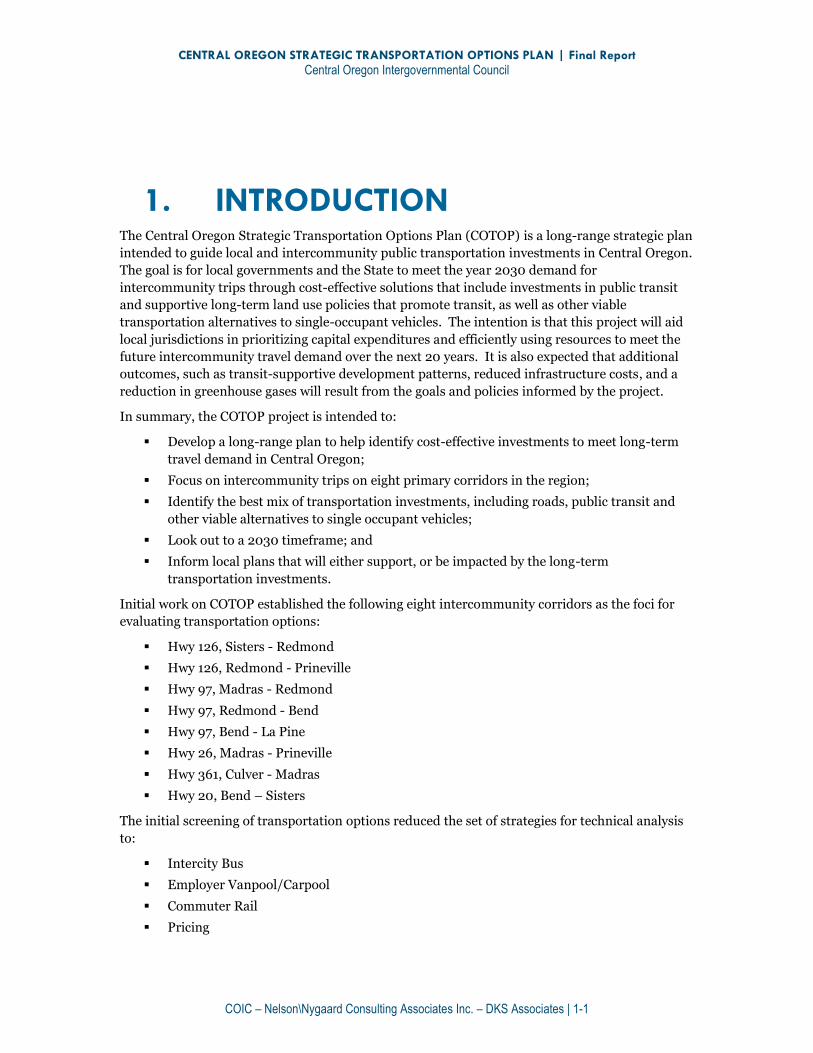
1. INTRODUCTION The Central Oregon Strategic Transportation Options Plan (COTOP) is a long-range strategic plan
intended to guide local and intercommunity public transportation investments in Central Oregon.
The goal is for local governments and the State to meet the year 2030 demand for
intercommunity trips through cost-effective solutions that include investments in public transit
and supportive long-term land use policies that promote transit, as well as other viable
transportation alternatives to single-occupant vehicles. The intention is that this project will aid
local jurisdictions in prioritizing capital expenditures and efficiently using resources to meet the
future intercommunity travel demand over the next 20 years. It is also expected that additional
outcomes, such as transit-supportive development patterns, reduced infrastructure costs, and a
reduction in greenhouse gases will result from the goals and policies informed by the project.
In summary, the COTOP project is intended to:
Develop a long-range plan to help identify cost-effective investments to meet long-term
travel demand in Central Oregon;
Focus on intercommunity trips on eight primary corridors in the region;
Identify the best mix of transportation investments, including roads, public transit and
other viable alternatives to single occupant vehicles;
Look out to a 2030 timeframe; and
Inform local plans that will either support, or be impacted by the long-term
transportation investments.
Initial work on COTOP established the following eight intercommunity corridors as the foci for
evaluating transportation options:
Hwy 126, Sisters - Redmond
Hwy 126, Redmond - Prineville
Hwy 97, Madras - Redmond
Hwy 97, Redmond - Bend
Hwy 97, Bend - La Pine
Hwy 26, Madras - Prineville
Hwy 361, Culver - Madras
Hwy 20, Bend – Sisters
The initial screening of transportation options reduced the set of strategies for technical analysis
to:
Intercity Bus
Employer Vanpool/Carpool
Commuter Rail
Pricing

CENTRAL OREGON STRATEGIC TRANSPORTATION OPTIONS PLAN | Final Report
Central Oregon Intergovernmental Council
COIC – Nelson\Nygaard Consulting Associates Inc. – DKS Associates | 1-2
The COTOP technical analysis evaluated investments in these transportation options, attempting
to see if such investments could diminish the need for capacity-enhancing roadway projects in the
eight identified study corridors. The analysis looked at expected conditions in the year 2030. The
additional investments in transportation options were evaluated against a baseline case for the
year 2030. The baseline conditions assumed the realization of financially committed-to projects
and planned investments. It should be noted that other factors that influence mode choice, such
as fuel costs and land use patterns, were not assumed to change as the focus of this plan is to
evaluate investment choices, rather than to project future travel demand.
This report presents the technical analysis conducted for the COTOP project, the project findings,
and the analysis results and implications. The report includes the following key elements:
Traffic Reduction Strategies (Chapter 2). Summarizes the transportation options
under consideration, their applicability in specific travel sheds, and their ability to reduce
single-occupant vehicle trips.
Analysis Methodology (Chapter 3). Summarizes the data and assumptions used to
develop the baseline case and to evaluate the application of transportation options in the
primary corridors in Central Oregon.
Baseline Conditions (Chapter 5). Documents the baseline conditions used to
compare future conditions when evaluating the alternative scenarios.
Analysis Scenarios (Chapter 6). Defines the scenarios analyzed in terms of the mix
of transportation options and strategy effectiveness in each corridor.
Analysis Results (Chapter 7). Presents the findings from the evaluation of scenarios,
identifying the costs and benefits associated with alternative transportation investments,
as well as future study and implementation implications.
CENTRAL OREGON STRATEGIC TRANSPORTATION OPTIONS PLAN | Final Report
Central Oregon Intergovernmental Council
COIC – Nelson\Nygaard Consulting Associates Inc. – DKS Associates | 2-3
2. TRAFFIC REDUCTION STRATEGIES
Each of the four transportation options identified for analysis in the COTOP project can be an
effective strategy for reducing single-occupant vehicle (SOV) trips and overall vehicle miles
traveled (VMT). This chapter describes the target market characteristics for these strategies,
which fall into two main categories: transit services and transportation demand management
(TDM) programs.
Intercity bus and commuter rail are public transit solutions that offer an alternative to the
automobile for intercommunity travel.
Vanpools perform a similar transportation function to transit, but are typically
considered a ridesharing and TDM strategy for reducing automobile travel demand in
applicable markets.
Pricing is not a direct transportation service but is an effective TDM strategy for
eliminating SOV trips or shifting automobile travel to less congested time periods.
The following sections summarize each strategy and its ability to impact mode share in a corridor.
STRATEGY EFFECTIVENESS
Each strategy has varying levels of effectiveness with respect to shifting travelers away from SOV
trips. The nature of the intercity trip, the built environment at each end, supportive investments
in services, and/or incentives greatly influence strategy effectiveness. Figure 2-1 below provides
an assessment of the factors that influence the three direct transportation options under
consideration. These factors include trip distance, the concentration of employment, the
frequency of the transit service being provided, and presence of supportive facilities, such as local
transit connections, bicycle and pedestrian connectivity, and park and ride facilities. For example,
vanpools perform best when the trip distance is long (longer than 15 miles each way) and
employees and employment sites are concentrated in one area. The presence and quality of local
transit connections play less of a role in the effectiveness of vanpools because employees are
typically picked up and dropped off at or in close proximity to their home and work. The
effectiveness of pricing strategies will be addressed in a separate discussion at the end of this
section.
This chapter is based on a more comprehensive review of the applicability and effectiveness of each strategy that was initially provided in Technical Memorandum 2. The full technical memo is included as Appendix A of this report.
CENTRAL OREGON STRATEGIC TRANSPORTATION OPTIONS PLAN | Final Report
Central Oregon Intergovernmental Council
COIC – Nelson\Nygaard Consulting Associates Inc. – DKS Associates | 2-4
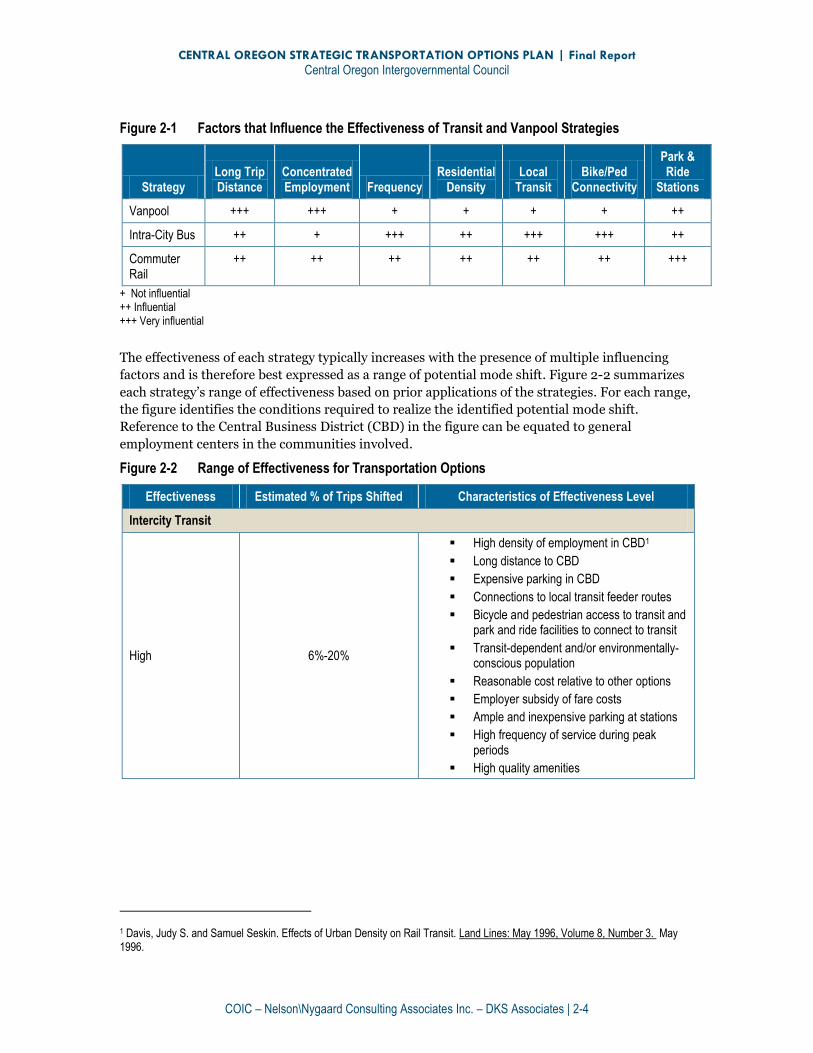
Figure 2-1 Factors that Influence the Effectiveness of Transit and Vanpool Strategies
Strategy Long Trip Distance
Concentrated Employment Frequency
Residential Density
Local Transit
Bike/Ped Connectivity
Park & Ride
Stations
Vanpool +++ +++ + + + + ++
Intra-City Bus ++ + +++ ++ +++ +++ ++
Commuter Rail
++ ++ ++ ++ ++ ++ +++
+ Not influential ++ Influential +++ Very influential
The effectiveness of each strategy typically increases with the presence of multiple influencing
factors and is therefore best expressed as a range of potential mode shift. Figure 2-2 summarizes
each strategy’s range of effectiveness based on prior applications of the strategies. For each range,
the figure identifies the conditions required to realize the identified potential mode shift.
Reference to the Central Business District (CBD) in the figure can be equated to general
employment centers in the communities involved.
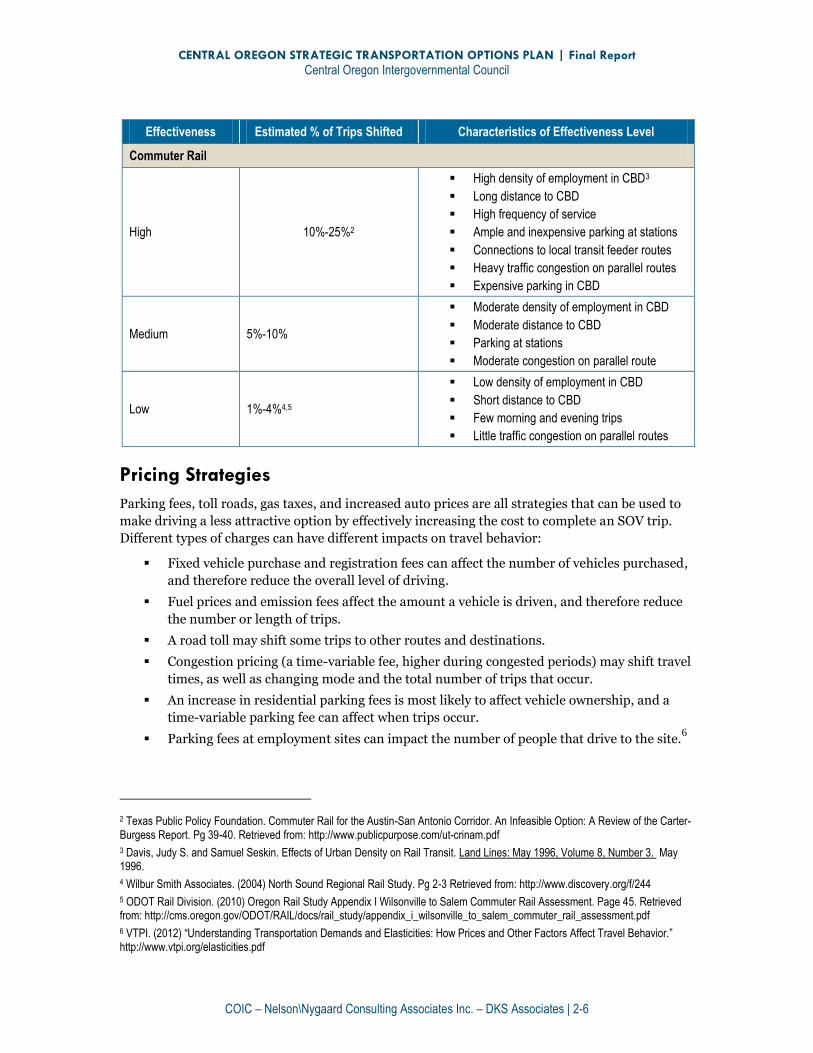
Figure 2-2 Range of Effectiveness for Transportation Options
Effectiveness Estimated % of Trips Shifted Characteristics of Effectiveness Level
Intercity Transit
High 6%-20%
High density of employment in CBD1
Long distance to CBD
Expensive parking in CBD
Connections to local transit feeder routes
Bicycle and pedestrian access to transit and park and ride facilities to connect to transit
Transit-dependent and/or environmentally-conscious population
Reasonable cost relative to other options
Employer subsidy of fare costs
Ample and inexpensive parking at stations
High frequency of service during peak periods
High quality amenities
1 Davis, Judy S. and Samuel Seskin. Effects of Urban Density on Rail Transit. Land Lines: May 1996, Volume 8, Number 3. May 1996.

CENTRAL OREGON STRATEGIC TRANSPORTATION OPTIONS PLAN | Final Report
Central Oregon Intergovernmental Council
COIC – Nelson\Nygaard Consulting Associates Inc. – DKS Associates | 2-5
Effectiveness Estimated % of Trips Shifted Characteristics of Effectiveness Level
Intercity Transit, continued
Medium 4%-5%
Medium density of employment in CBD
Connections to local transit feeder routes
Inexpensive parking at stations
Frequent service during peak periods
Transit-dependent and/or environmentally-conscious population
Few employers subsidize fares
Low amenity service
Low 2%-3%
Dispersed employment centers
Inconvenient connections to local transit feeder routes
Inexpensive, ample parking in CBD
Auto-dependent population
Vanpools
High 10%-15%
Commute distances more than 15 miles one-way
Employer offers information and encouragement, and a selection of the following types of incentives, where applicable:
Guaranteed/emergency ride home program
Priority vanpool parking
HOV lanes, where applicable
Non-cash incentives where employees are recognized or rewarded in the form of gift cards, for example, for vanpool participation
Financial incentives or rewards for first time vanpoolers (4-6 months) or on an ongoing basis
Market rate parking
Parking cash out policy
Medium 5%-10%
Commute distances more than 15 miles one-way
Employer offers information and encouragement, and a selection of the following types of incentives, where applicable:
Guaranteed/emergency ride home program
Priority vanpool parking
HOV lanes, where applicable
Non-cash incentives where employees are recognized or rewarded in the form of gift cards, for example, for vanpool participation
Ridematching services
Low <1%-5%
Commute distances less than 15 miles one-way
Employer offers information and encouragement only
CENTRAL OREGON STRATEGIC TRANSPORTATION OPTIONS PLAN | Final Report
Central Oregon Intergovernmental Council
COIC – Nelson\Nygaard Consulting Associates Inc. – DKS Associates | 2-6
Effectiveness Estimated % of Trips Shifted Characteristics of Effectiveness Level
Commuter Rail
High 10%-25%2
High density of employment in CBD3
Long distance to CBD
High frequency of service
Ample and inexpensive parking at stations
Connections to local transit feeder routes
Heavy traffic congestion on parallel routes
Expensive parking in CBD
Medium 5%-10%
Moderate density of employment in CBD
Moderate distance to CBD
Parking at stations
Moderate congestion on parallel route
Low 1%-4%4,5
Low density of employment in CBD
Short distance to CBD
Few morning and evening trips
Little traffic congestion on parallel routes
Pricing Strategies
Parking fees, toll roads, gas taxes, and increased auto prices are all strategies that can be used to
make driving a less attractive option by effectively increasing the cost to complete an SOV trip.
Different types of charges can have different impacts on travel behavior:
Fixed vehicle purchase and registration fees can affect the number of vehicles purchased,
and therefore reduce the overall level of driving.
Fuel prices and emission fees affect the amount a vehicle is driven, and therefore reduce
the number or length of trips.
A road toll may shift some trips to other routes and destinations.
Congestion pricing (a time-variable fee, higher during congested periods) may shift travel
times, as well as changing mode and the total number of trips that occur.
An increase in residential parking fees is most likely to affect vehicle ownership, and a
time-variable parking fee can affect when trips occur.
Parking fees at employment sites can impact the number of people that drive to the site.6
2 Texas Public Policy Foundation. Commuter Rail for the Austin-San Antonio Corridor. An Infeasible Option: A Review of the Carter-Burgess Report. Pg 39-40. Retrieved from: http://www.publicpurpose.com/ut-crinam.pdf
3 Davis, Judy S. and Samuel Seskin. Effects of Urban Density on Rail Transit. Land Lines: May 1996, Volume 8, Number 3. May 1996.
4 Wilbur Smith Associates. (2004) North Sound Regional Rail Study. Pg 2-3 Retrieved from: http://www.discovery.org/f/244
5 ODOT Rail Division. (2010) Oregon Rail Study Appendix I Wilsonville to Salem Commuter Rail Assessment. Page 45. Retrieved from: http://cms.oregon.gov/ODOT/RAIL/docs/rail_study/appendix_i_wilsonville_to_salem_commuter_rail_assessment.pdf
6 VTPI. (2012) “Understanding Transportation Demands and Elasticities: How Prices and Other Factors Affect Travel Behavior.” http://www.vtpi.org/elasticities.pdf
CENTRAL OREGON STRATEGIC TRANSPORTATION OPTIONS PLAN | Final Report
Central Oregon Intergovernmental Council
COIC – Nelson\Nygaard Consulting Associates Inc. – DKS Associates | 2-7
Many of the pricing strategies are hard to implement at the corridor level, especially if alternate
routes are not equally priced. Similarly, fuel taxes and other surcharges are difficult to implement
locally if the entire region or state has much lower fuel prices. Pricing strategies—such as a vehicle
mile charge—may be implemented at the regional or statewide scale. Congestion pricing and/or
tolling are long-term strategies that could be applicable at the local level.
The effectiveness of pricing depends largely on the local context—e.g., the presence of other viable
travel options. Various international studies indicate that the long-term elasticity7 of vehicle travel
with respect to fuel price, for example, averages about –0.2 to –0.3, meaning that a 10% price
increase in price reduces vehicle travel 2-3% over the long-run.8 Another study conducted by the
Oregon Department of Transportation (ODOT) in 2007 analyzed the feasibility of implementing a
Mileage Fee—a distance-traveled charge (also known as a VMT fee or per-mile charge) imposed
according to the amount a vehicle uses the road system. The project tested a 1.2 cent per mile fee.9
The pilot study found that drivers reduced peak period travel by roughly 22% as a result of the
increased fee. Other research indicates that travelers tend to be particularly sensitive to visible
and frequent prices, such as road tolls, parking fees, and public transit fares, as opposed to less
visible pricing, such as fluctuations in fuel costs.10
In summary, the effectiveness of pricing fluctuates considerably, but the following conclusions
can be made:
Higher-value travel, such as business and commute travel, tends to be less price sensitive
than lower-value travel.
Wealthy people tend to be less sensitive to pricing and more sensitive to service quality
than lower-income people.
Prices tend to affect consumption (i.e., the number of SOV trips taken), in proportion to
transportation costs’ share of the household budget.
Consumers tend to be more responsive to price changes they consider permanent, such as
tax increases, compared with oil market fluctuations perceived as temporary.
Pricing impacts tend to increase over time. Short-run (first year) effects are typically a
third of long-run (more than five year) effects.
Travel tends to be more price-sensitive if travelers have better options, including different
routes, modes and destinations.
STRATEGY COSTS
Each strategy is associated with two types of costs. User costs are those borne by the traveler and
can be equated to out-of-pocket costs. These are typically in the form of transit and vanpool fares,
or automobile user fees and fuel costs. In addition, implementing the strategy requires society to
incur operating costs and/or capital investments. These societal costs are typically borne by the
7 Elasticity refers to the effect of a change in price on consumption. For example, a low elasticity means that a change in price causes relatively small changes in consumption; a high elasticity means that a change in price causes a relatively large change in consumption.
8 VTPI. (2012) Changing Vehicle Travel Price Sensitivities: The Rebounding Effect. http://www.vtpi.org/VMT_Elasticities.pdf
9 ODOT. (2007) Oregon’s Mileage Fee Concept and Road User Fee Pilot Program. http://cms.oregon.egov.com/ODOT/HWY/RUFPP/docs/rufpp_finalreport.pdf
10 VTPI. (2012) Changing Vehicle Travel Price Sensitivities: The Rebounding Effect. http://www.vtpi.org/VMT_Elasticities.pdf
CENTRAL OREGON STRATEGIC TRANSPORTATION OPTIONS PLAN | Final Report
Central Oregon Intergovernmental Council
COIC – Nelson\Nygaard Consulting Associates Inc. – DKS Associates | 2-8
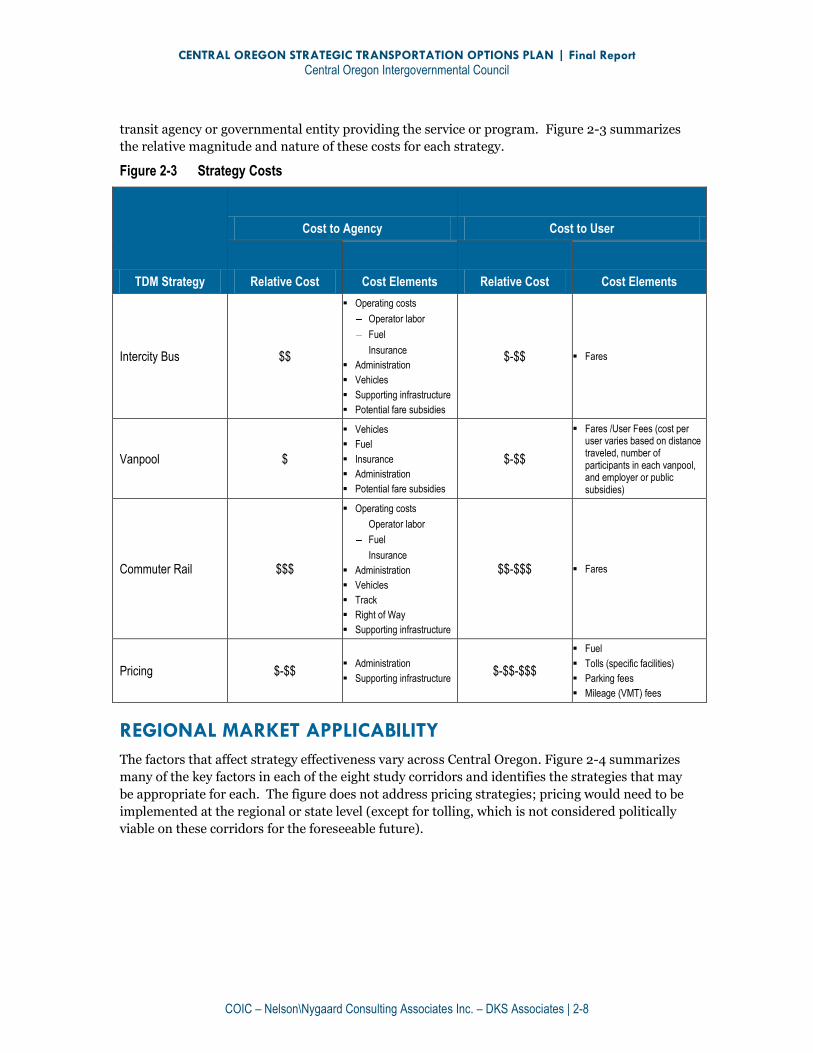
transit agency or governmental entity providing the service or program. Figure 2-3 summarizes
the relative magnitude and nature of these costs for each strategy.
Figure 2-3 Strategy Costs
TDM Strategy
Cost to Agency Cost to User
Relative Cost Cost Elements Relative Cost Cost Elements
Intercity Bus $$
Operating costs
Operator labor
Fuel
Insurance
Administration
Vehicles
Supporting infrastructure
Potential fare subsidies
$-$$ Fares
Vanpool $
Vehicles
Fuel
Insurance
Administration
Potential fare subsidies
$-$$
Fares /User Fees (cost per user varies based on distance traveled, number of participants in each vanpool, and employer or public subsidies)
Commuter Rail $$$
Operating costs
Operator labor
Fuel
Insurance
Administration
Vehicles
Track
Right of Way
Supporting infrastructure
$$-$$$ Fares
Pricing $-$$ Administration
Supporting infrastructure $-$$-$$$
Fuel
Tolls (specific facilities)
Parking fees
Mileage (VMT) fees
REGIONAL MARKET APPLICABILITY
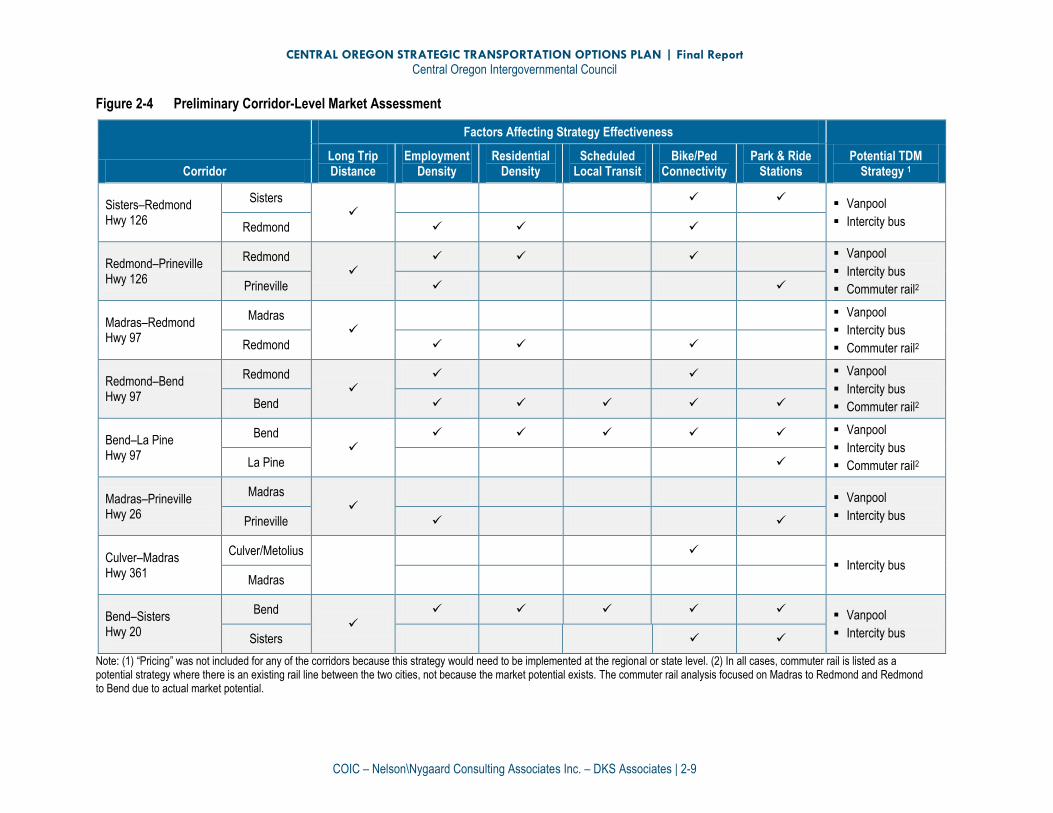
The factors that affect strategy effectiveness vary across Central Oregon. Figure 2-4 summarizes
many of the key factors in each of the eight study corridors and identifies the strategies that may
be appropriate for each. The figure does not address pricing strategies; pricing would need to be
implemented at the regional or state level (except for tolling, which is not considered politically
viable on these corridors for the foreseeable future).
CENTRAL OREGON STRATEGIC TRANSPORTATION OPTIONS PLAN | Final Report
Central Oregon Intergovernmental Council
COIC – Nelson\Nygaard Consulting Associates Inc. – DKS Associates | 2-9
Figure 2-4 Preliminary Corridor-Level Market Assessment
Corridor
Factors Affecting Strategy Effectiveness
Potential TDM Strategy 1
Long Trip Distance
Employment Density
Residential Density
Scheduled Local Transit
Bike/Ped Connectivity
Park & Ride Stations
Sisters–Redmond Hwy 126
Sisters
Vanpool
Intercity bus Redmond
Redmond–Prineville Hwy 126
Redmond
Vanpool
Intercity bus
Commuter rail2 Prineville
Madras–Redmond Hwy 97
Madras
Vanpool
Intercity bus
Commuter rail2 Redmond
Redmond–Bend Hwy 97
Redmond
Vanpool
Intercity bus
Commuter rail2 Bend
Bend–La Pine Hwy 97
Bend
Vanpool
Intercity bus
Commuter rail2 La Pine
Madras–Prineville Hwy 26
Madras
Vanpool
Intercity bus Prineville
Culver–Madras Hwy 361
Culver/Metolius
Intercity bus
Madras
Bend–Sisters Hwy 20
Bend
Vanpool
Intercity bus Sisters
Note: (1) “Pricing” was not included for any of the corridors because this strategy would need to be implemented at the regional or state level. (2) In all cases, commuter rail is listed as a potential strategy where there is an existing rail line between the two cities, not because the market potential exists. The commuter rail analysis focused on Madras to Redmond and Redmond to Bend due to actual market potential.

CENTRAL OREGON STRATEGIC TRANSPORTATION OPTIONS PLAN | Final Report
Central Oregon Intergovernmental Council
COIC – Nelson\Nygaard Consulting Associates Inc. – DKS Associates | 3-1
3. ANALYSIS METHODOLOGY The evaluation of transportation alternatives compared different investment scenarios to a 2030
baseline case. The different investment scenarios are packages of roadway, public transit, and
other investments. The baseline scenario represents the future conditions if currently available
(as of August 2012) facilities and services are maintained, and committed-to investments are
realized. This chapter presents the data and methods that were used during the analysis of
transportation options for COTOP. It details the data sources that were relied upon, the
underlying assumptions used, and the methodologies employed during the study.
DATA COLLECTION
The following sections summarize the data sources and individual datasets that were the basis for
the COTOP transportation options analysis.
Data Sources
ODOT Transportation Planning Analysis Unit (TPAU)
Bend Metropolitan Planning Organization (MPO)
Cascades East Transit service and trip data
Local Comprehensive Plans/Transportation System Plans (TSPs)
Other Regional and MPO Data for Oregon
US Census Journey to Work
Applicable national studies on transit, greenhouse gas reduction, etc.
Specific Data Used for the Analysis
Highway lane miles and Average Annual Daily Trips: ODOT
Public Transit Supply Levels: Ridership and route information including from Cascades
East Transit, Bend Dial-a-Ride, Breeze for inter-city travel
Intercity travel demand (weekday daily and PM peak hour) by trip purpose: estimated
from ODOT Deschutes County Travel Demand Model for 2003 and 2030.
Vehicle Miles Traveled (VMT)/Average Weekday Trips on intercity arterials: ODOT, Bend
MPO
Employment data (i.e. number of employees that commute from another city):
Longitudinal Employer-Household Dynamics (LEHD)
Planned capital roadway improvements (i.e. interchanges, new arterials): TSPs,
Comprehensive Plans, and interviews with ODOT/County staff
Infrastructure costs: Road departments and ODOT will provide typical costs

CENTRAL OREGON STRATEGIC TRANSPORTATION OPTIONS PLAN | Final Report
Central Oregon Intergovernmental Council
COIC – Nelson\Nygaard Consulting Associates Inc. – DKS Associates | 3-2
Travel forecasts and infrastructure needs: TSPs, Comprehensive Plans, and interviews
with ODOT/County staff
Greenhouse gas emissions for transit: APTA Climate Change Standards Working Group
Recommended Practice for Quantifying Greenhouse Gas Emissions from Transit August,
2008
Potential Scenarios for Transportation Strategies: City, County and State TSPs (including
the State Rail Plan), Comprehensive Plans, interviews with Staff, as well as literature
review
ANALYSIS CONDITIONS AND ASSUMPTIONS
The following conditions framed the study and provided constraints on the analysis and/or filled
in informational gaps where data may be lacking.
Analysis was based on highway travel between cities within the project area. Cities
include: Madras, Sisters, Redmond, Prineville, Bend, La Pine, Culver, and Metolius. The
highways included for analysis (as data is available) include:
126, Sisters-Redmond (ODOT Hwy No. 15)
126, Redmond to Prineville (ODOT Hwy No. 41)
97, Madras-Redmond (ODOT Hwy No. 4)
97, Redmond-Bend (ODOT Hwy No. 4)
97, Bend-La Pine (ODOT Hwy No. 4)
26, Madras-Prineville (ODOT Hwy No. 360)
20, Bend-Sisters (ODOT Hwy No. 17)
361, Culver-Madras (ODOT Hwy No. 361)
Vehicle occupancy factors were commensurate with travel demand model parameters for
the identified corridors.
The State of Oregon GreenSTEP methodology currently being developed by TPAU was
not used for this project, as it is not completely tested at the time of this study and is more
complex than is required for the “30,000 foot level” analysis required by this project.
ODOT sources were used for vehicle classification.
No adjustments for trips passing through a city (i.e., La Pine to Madras) were made.
The most accurate data available were obtained and were the basis for the analysis; on
the premise that some data consists of averages or other estimates, the analysis
techniques strive for overall consistency for true comparative purposes, rather than a
high degree of precision (in keeping with the “30,000 foot view”).
The primary goal of the analysis is application of a consistent methodology to
demonstrate a percentage of change for the scenario analysis.
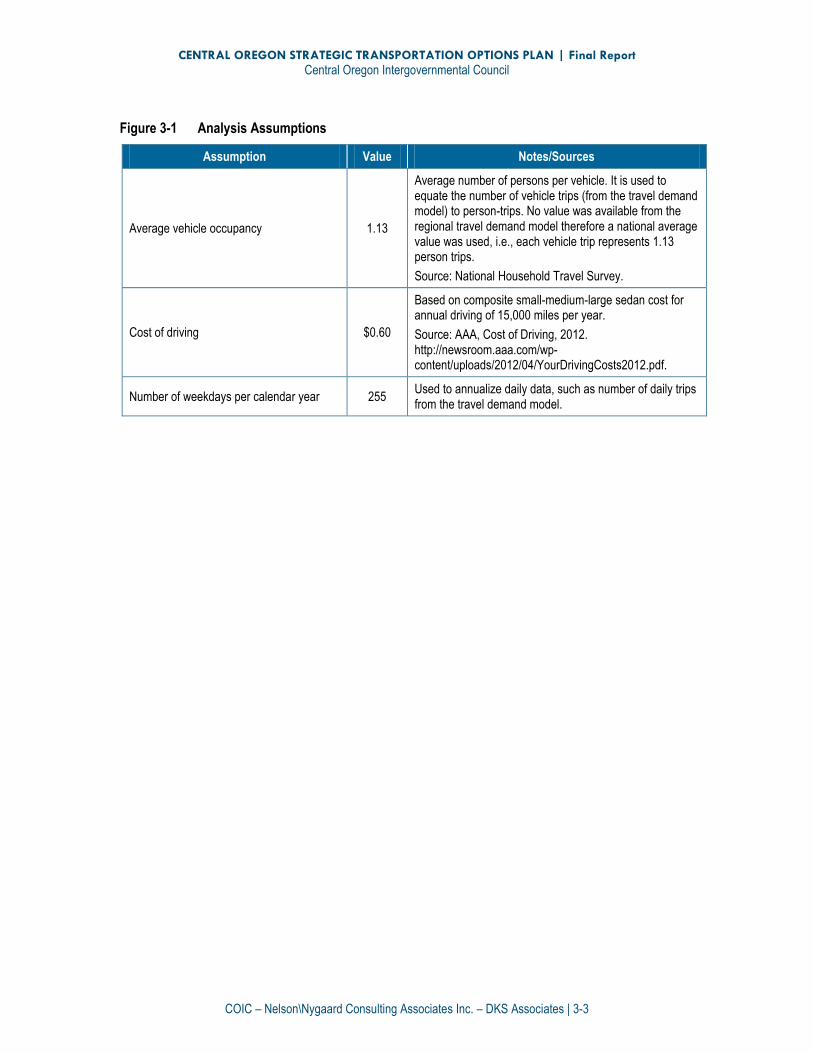
Figure 3-1 documents the general assumptions that are not specific to any one scenario. Chapter 5
documents scenario or mode-specific assumptions in further detail.
CENTRAL OREGON STRATEGIC TRANSPORTATION OPTIONS PLAN | Final Report
Central Oregon Intergovernmental Council
COIC – Nelson\Nygaard Consulting Associates Inc. – DKS Associates | 3-3
Figure 3-1 Analysis Assumptions
Assumption Value Notes/Sources
Average vehicle occupancy 1.13
Average number of persons per vehicle. It is used to equate the number of vehicle trips (from the travel demand model) to person-trips. No value was available from the regional travel demand model therefore a national average value was used, i.e., each vehicle trip represents 1.13 person trips.
Source: National Household Travel Survey.
Cost of driving $0.60
Based on composite small-medium-large sedan cost for annual driving of 15,000 miles per year.
Source: AAA, Cost of Driving, 2012. http://newsroom.aaa.com/wp-content/uploads/2012/04/YourDrivingCosts2012.pdf.
Number of weekdays per calendar year 255 Used to annualize daily data, such as number of daily trips from the travel demand model.
CENTRAL OREGON STRATEGIC TRANSPORTATION OPTIONS PLAN | Final Report
Central Oregon Intergovernmental Council
COIC – Nelson\Nygaard Consulting Associates Inc. – DKS Associates | 3-4
ANALYSIS METHODS
This section describes the methods that were used to evaluate and compare potential
transportation options for the Central Oregon region.
Analysis Scenarios
Baseline Scenario
The COTOP analysis evaluated potential long-term transportation investments by analyzing the
costs and benefits of different packages of transportation options against each other and against a
baseline scenario. The baseline scenario was defined as currently committed roadway, public
transit and other transportation options. The update to Technical Report 2 defines this baseline
scenario combining existing transportation projects, programs and services along with any
pending financially-committed projects.
Alternative Scenarios
As part of the COTOP project, the project team working with the study’s Technical Advisory
Committee (TAC) and Policy Group (COIC Board and ODOT Region 4 Representative) developed
different long-term alternative scenarios. These alternative scenarios were packages or suites of
individual investments selected to:
Represent a cost-effective mix of transportation investments;
Focus investments toward a few key strategic options;
Tailor investments to individual corridor demands and characteristics; and
Highlight the sensitivity of key investment strategies in their effectiveness in meeting
regional transportation needs.
The alternative scenarios were built on packages of the following strategic investments. The
COTOP policy and advisory committees selected this set of strategies for further analysis. These
are:
Intercity Bus
Vanpool/Carpool
Commuter Rail
Pricing
The ridesharing (vanpool/carpool) and pricing strategies are key TDM approaches. When
creating the investment packages, additional, supporting TDM strategies (such as employer
transit pass and guaranteed/emergency ride home programs) were included as appropriate to
maximize the effectiveness of the TDM and public transit strategies. The packages specify the
level of investment, including the span and level of service for transit options. The final packages
are described in Chapter 5.
CENTRAL OREGON STRATEGIC TRANSPORTATION OPTIONS PLAN | Final Report
Central Oregon Intergovernmental Council
COIC – Nelson\Nygaard Consulting Associates Inc. – DKS Associates | 3-5
Key Measures
The following measures were used to evaluate the relative benefits and costs associated with the
baseline and alternative scenarios. Each provides a quantitative and consistent performance
measure across the alternatives and provides a basis for analyzing the implications of the various
packages and their constituent strategies.
Trip Forecasts
Trip forecasts were used to both provide inputs into other performance measures as well as to
estimate changes in travel demand in the study corridors. Data from County TSPs and ODOT’s
Deschutes County Travel Demand model were used to predict 2030 regional intercommunity trip
generation, based on the conditions assumed in existing planning documents (i.e., land use
patterns, capacity improvement projects, etc.). It should be noted that the alternative scenarios
are packages of different transportation options and that the future land use demographics
determining travel demand are assumed to be constant. Total daily intercommunity travel
demand for all modes (combined) was assumed to be constant across scenarios.
Where study locations were not adequately represented within the Deschutes County travel
demand model, estimates from prior studies were utilized. Mode shifts from baseline automobile
travel to other options was a key attribute of trip generation forecasts. For the alternative
scenarios, mode shifts were estimated by post processing model results to estimate the impacts of
the selected mix of transportation strategies.
VMT Reduction
Vehicle miles traveled (VMT) was calculated by multiplying daily intercommunity traffic volume
by the highway segment length per the Deschutes County regional travel demand model. Traffic
volumes for years not available in the travel demand model were interpolated as necessary.
Greenhouse Gas Reduction
Where possible, the consultant team relied on existing analytical tools to estimate the extent of
GhG reductions. These were derived, to the extent feasible, from standard methodologies
including guidance from the U.S. Environmental Protection Agency (EPA)11 and American Public
Transportation Association (APTA)12, and previous publications such as Moving Cooler: An
Analysis of Transportation Strategies for Reducing Greenhouse Gas Emissions13, and the
technical appendices for that study. Estimated VMT is the primary input used in calculating GhG
emissions. A key assumption is future fuel efficiency, which was based on the U.S. Energy
Administration (EIA) projection14 of 27.1 MPG for 2030 combined ”on-the-road” fuel efficiency
estimate for all cars and light trucks in 2030. The basic calculation is as follows:
11 U.S. EPA, Greenhouse Gas Emissions from a Typical Passenger Vehicle, December 2011, http://www.epa.gov/otaq/climate/documents/420f11041.pdf
12 APTA, Recommended Practice for Quantifying Greenhouse Gas Emissions from Transit, August 2009, http://www.apta.com/resources/hottopics/sustainability/Documents/Quantifying-Greenhouse-Gas-Emissions-APTA-Recommended-Practices.pdf
13 http://movingcooler.info/
14 U.S. EIA, 2012 EIA Energy Outlook, Table A7, http://www.eia.gov/forecasts/aeo/pdf/0383%282012%29.pdf
CENTRAL OREGON STRATEGIC TRANSPORTATION OPTIONS PLAN | Final Report
Central Oregon Intergovernmental Council
COIC – Nelson\Nygaard Consulting Associates Inc. – DKS Associates | 3-6
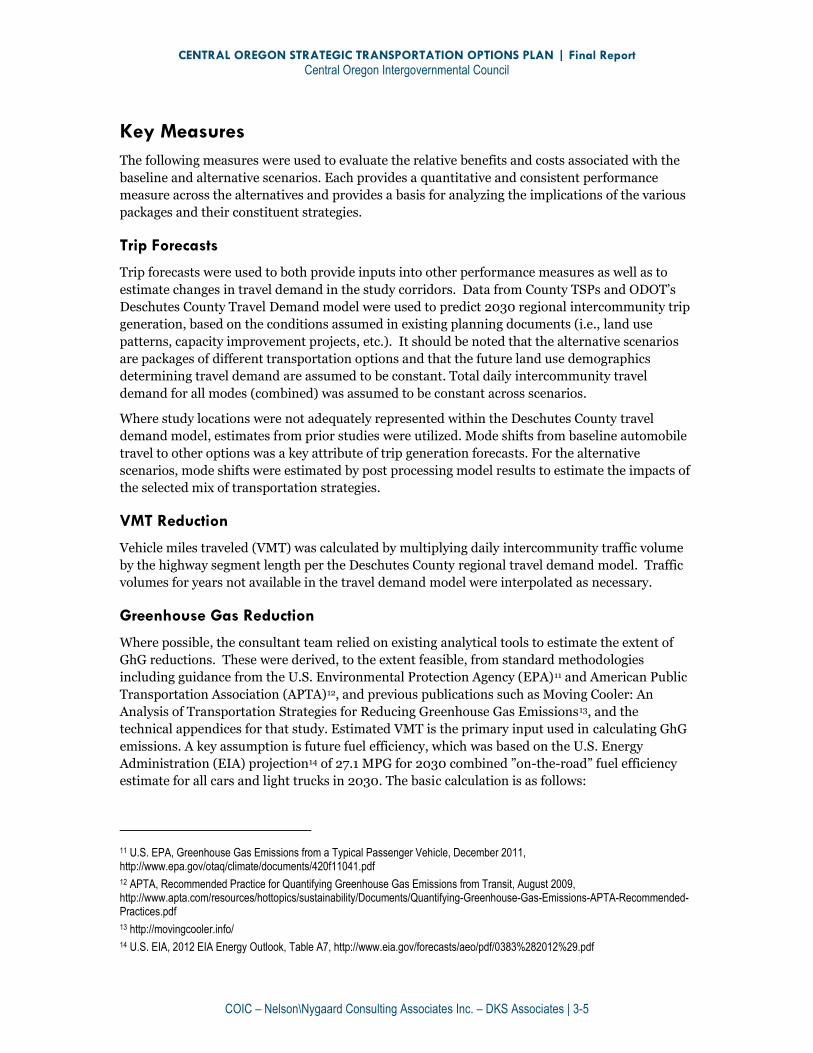
VMT * 8,887 grams CO2/gallon (based on 2012-2016 EPA standards) / 27.1
Miles/Gallon (EIA predicted 2030 average) * 1.05 (adjustment factor to
include GhGs other than CO2, typically 1-5%) / 1,000,000 grams/metric ton
= metric tons of Co2e per highway segment
As a point of reference, Technical Report #1 prepared under Task 2B of TGM project 4A-0915
estimated current greenhouse gas emissions in the eight study corridors. These values, or
updates based on the methodologies employed in this study, were used to show potential future-
year reductions between a 1990 baseline and future year alternative scenarios.
User Benefits
User benefits and costs were developed to evaluate monetary and non-monetary costs and savings
for users of the regional transportation system. User costs include:
Out-of-pocket transportation costs comparing automobile-based costs to fares/fees for
those shifting to transportation options. Automobile costs are based on the AAA 2012
Cost of Driving publication, which includes a gasoline cost of $3.36 per gallon in the
overall cost of 60 cents per mile.16
Corridor congestion cost comparing corridor volume-to-capacity (V/C) ratios and city-to-
city speeds across the alternatives.
Mobility and access considerations for different population segments, e.g., persons that
may not utilize SOVs.
Transportation System Costs
The one-time capital and ongoing operating costs were evaluated for each of the alternatives. For
each package, the capital costs included any road projects included above and beyond the baseline
set of projects, transit vehicles, and supporting infrastructure. These costs were based on existing
TSPs, ODOT information, and cost information obtained from existing intercity transit providers.
Where costs are not available, the TAC and ODOT will provide guidance on the extent and cost of
typical infrastructure improvements needed to accommodate the projected travel demand.
Similarly, for each package, operating costs will included any additional fuel and labor (operators
and support staff) for increased transit services and TDM programs.
In-Community Impacts
As detailed in Chapter 4, the study area corridors are not expected to experience significant delay
between terminating cities. As a result the ability of transportation options strategies to mitigate
the need for roadway projects in these corridors is diminished. In response the consultant team
supplemented the analysis methodology with an analysis of how investments in transportation
options can affect travel demand on potentially congested roadway segments on or at the
periphery of a terminating city (and carrying combined inter- and intra-community traffic),
possibly eliminating the need for roadway projects downstream of the “first intersection” in the
15 Project 4A-09 is a previous, incomplete, incarnation of this project.
16 AAA, Your Driving Costs, 2012. http://westerncentralny.aaa.com/files/news-room/aaa_yourdrivingcosts_2012.pdf. Assumption is for an average passenger car and 15,000 miles driven per year. This estimate is consistent with other sources including the US Department of Transportation.

CENTRAL OREGON STRATEGIC TRANSPORTATION OPTIONS PLAN | Final Report
Central Oregon Intergovernmental Council
COIC – Nelson\Nygaard Consulting Associates Inc. – DKS Associates | 3-7
community. This evaluation analyzed the ability for investments in transportation options to
reduce traffic and improve associated intersection level of service on key in-community segments
where roadway improvement projects are being considered.
For this additional analysis, the consultant team identified locations where changes in intercity
traffic patterns may have significant effects on planning of potential roadway capacity
improvement projects. By utilizing the Deschutes County travel demand model to identify the
share of intercity traffic on a given roadway, the consultant team determined locations where
COTOP projects and strategies may have the largest effect. This analysis was combined with
locating roadway segments where congestion (as measured by roadway volume-to-capacity ratio)
is anticipated in the 2030 PM peak hour. Combining these two elements (congestion and
intercity traffic) provided a means to identify potential locations where COTOP strategies could
shift enough motor vehicle demand from SOV travel to mitigate the need for constructing a
capital improvement project within the planning horizon. The approach was geared towards
finding locations that are "on the margin" of meeting mobility standards in the 2030 horizon year.
By applying this systematic approach, the consultant team was able to analyze a broader
geographic area, including in-community intersections that have been identified as potential
"choke points" in the transportation system.
CENTRAL OREGON STRATEGIC TRANSPORTATION OPTIONS PLAN | Final Report
Central Oregon Intergovernmental Council
COIC – Nelson\Nygaard Consulting Associates Inc. – DKS Associates | 4-1
4. OUTREACH AND ENGAGEMENT The intent of the Central Oregon Strategic Transportation Options Plan was to start a regional
conversation about how to develop data and benchmarks for investments across the spectrum of
multi-modal transportation and mobility needs. COTOP was not designed with specific
implementation outcomes in mind. This reality, plus the fact that the analysis was highly-
technical and somewhat esoteric, made it apparent to the project management team that
extensive public outreach would be difficult to generate interest in, potentially confusing, and not
very useful.
Therefore, general public outreach was limited. However, stakeholder and technical review, as
well as review by elected officials, was critical to ensuring that the findings were legitimate,
understandable, and useful. This was accomplished by the development of an integrated
Stakeholder/Technical committee, the designation of the COIC Board as the Policy Board for the
project, and additional outreach to transportation organizations in the region.
POLICY BOARD
The COIC Board served as the “Policy Board” for the COTOP process. The Board is comprised of
appointed elected officials from the region’s cities and counties, as well as private-sector
appointments.
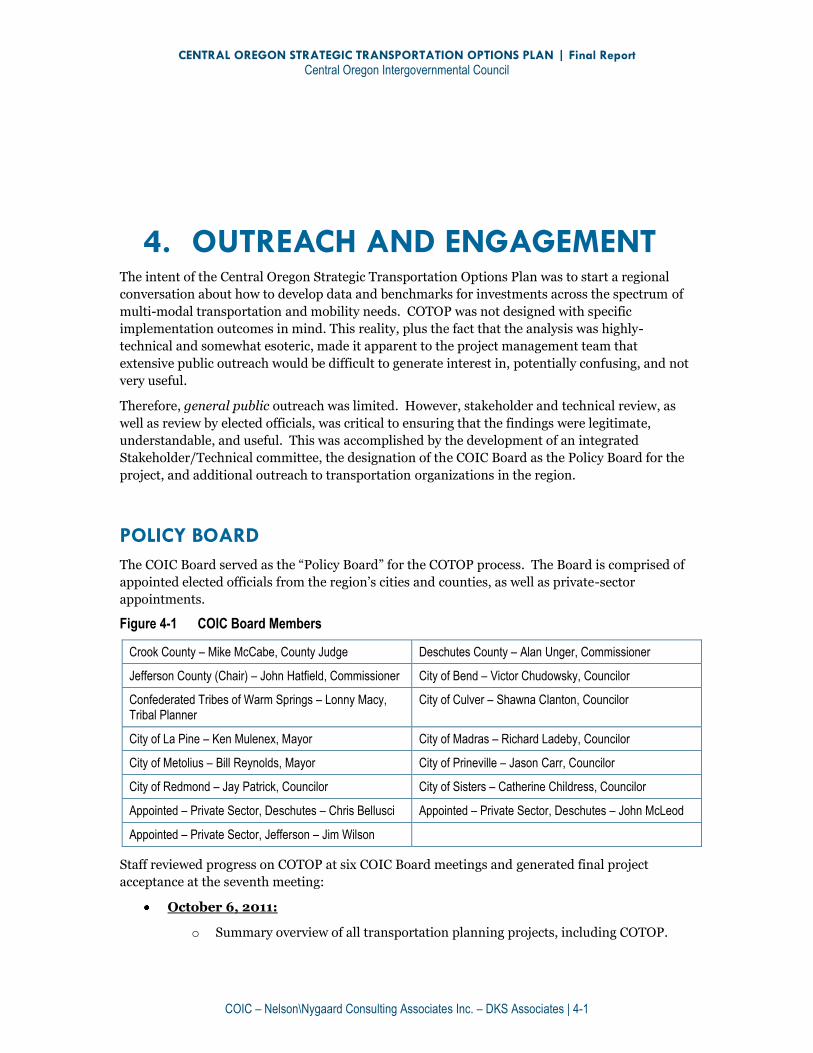
Figure 4-1 COIC Board Members
Crook County – Mike McCabe, County Judge Deschutes County – Alan Unger, Commissioner
Jefferson County (Chair) – John Hatfield, Commissioner City of Bend – Victor Chudowsky, Councilor
Confederated Tribes of Warm Springs – Lonny Macy, Tribal Planner
City of Culver – Shawna Clanton, Councilor
City of La Pine – Ken Mulenex, Mayor City of Madras – Richard Ladeby, Councilor
City of Metolius – Bill Reynolds, Mayor City of Prineville – Jason Carr, Councilor
City of Redmond – Jay Patrick, Councilor City of Sisters – Catherine Childress, Councilor
Appointed – Private Sector, Deschutes – Chris Bellusci Appointed – Private Sector, Deschutes – John McLeod
Appointed – Private Sector, Jefferson – Jim Wilson
Staff reviewed progress on COTOP at six COIC Board meetings and generated final project
acceptance at the seventh meeting:
October 6, 2011:
o Summary overview of all transportation planning projects, including COTOP.
CENTRAL OREGON STRATEGIC TRANSPORTATION OPTIONS PLAN | Final Report
Central Oregon Intergovernmental Council
COIC – Nelson\Nygaard Consulting Associates Inc. – DKS Associates | 4-2
November 11, 2011:
o Provided an overview of the purpose and desired outcomes of the project;
o Discussed the potential policy scenarios for analysis.
December 1, 2011:
o Discussed and settled on the five proposed policy scenarios for analysis: base
case, transit, vanpool, pricing, and commuter rail.
September 6, 2012:
o Update on project status, approved the final project methodology.
October 4, 2012:
o Overview of the project and status as per request at the prior Board meeting.
May 2, 2013:
o Discussion/summary of findings;
o Prepared the Board for acceptance of the findings at the July Board Meeting;
o Discussed ideas for future study.
July 11, 2013 :
o Final presentation and acceptance of final Plan
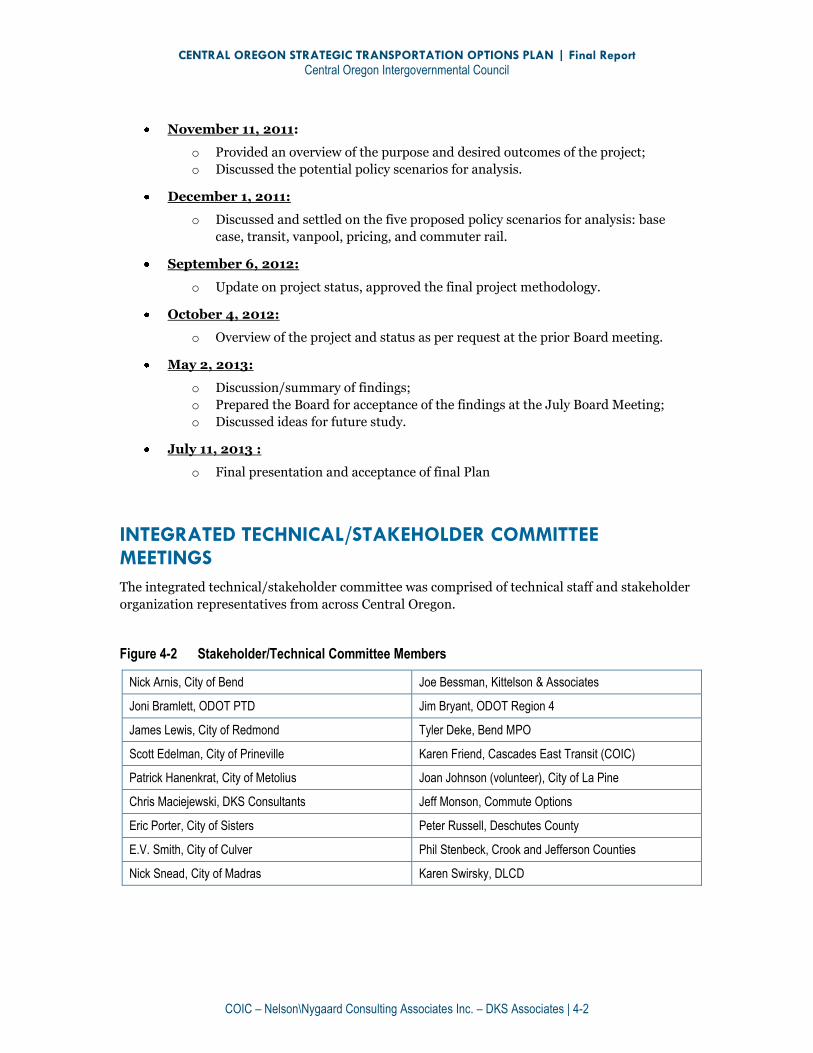
INTEGRATED TECHNICAL/STAKEHOLDER COMMITTEE MEETINGS
The integrated technical/stakeholder committee was comprised of technical staff and stakeholder
organization representatives from across Central Oregon.
Figure 4-2 Stakeholder/Technical Committee Members
Nick Arnis, City of Bend Joe Bessman, Kittelson & Associates
Joni Bramlett, ODOT PTD Jim Bryant, ODOT Region 4
James Lewis, City of Redmond Tyler Deke, Bend MPO
Scott Edelman, City of Prineville Karen Friend, Cascades East Transit (COIC)
Patrick Hanenkrat, City of Metolius Joan Johnson (volunteer), City of La Pine
Chris Maciejewski, DKS Consultants Jeff Monson, Commute Options
Eric Porter, City of Sisters Peter Russell, Deschutes County
E.V. Smith, City of Culver Phil Stenbeck, Crook and Jefferson Counties
Nick Snead, City of Madras Karen Swirsky, DLCD

CENTRAL OREGON STRATEGIC TRANSPORTATION OPTIONS PLAN | Final Report
Central Oregon Intergovernmental Council
COIC – Nelson\Nygaard Consulting Associates Inc. – DKS Associates | 4-3
The integrated stakeholder/technical committee met three times during the project:
May 16, 2012
o Reviewed/discussed overall purpose of project
o Reviewed and provided feedback on the methodology memo
o Reviewed the trip forecasting/travel demand model process
o Reviewed base case and traffic reduction scenarios – “Alternative Scenarios” -
profiles and effectiveness assumptions
November 30, 2012
o Reviewed/discussed trip forecasting/travel demand model findings
o Reviewed/confirmed base case conditions
o Reviewed/confirmed final alternative scenarios composition/profile and
effectiveness estimates
March 8, 2013
o Reviewed alternative scenarios analysis findings
o Discussed study limitations
o Discussed policy implications and ideas for further study
OTHER OUTREACH
In addition to the engagement outlined above, project staff made presentations at the following
forums:
Central Oregon Area Commission on Transportation – July 12, 2012:
Presented on the overall purpose and objectives of COTOP.
Oregon Public Transit Conference – September 10, 2012: Delivered presentation
entitled “Planning for Transit at the Regional Scale – Multi-Community and Multi-
Modal.” Presented COTOP as an example of a multi-modal transportation planning
process utilizing multiple measures (not just cost-benefit) to determine appropriate mix
of transportation investments.
Bend Metropolitan Planning Organization Policy Board – September 20,
2012: Presented on the overall project purpose, methodology, and the alternative
scenarios.
Statewide Transportation Options Working Group – November 2, 2012:
Presented a shorter version of the OPTC Conference presentation, outlining COTOP as a
model for multi-modal investment planning.
Central Oregon Area Commission on Transportation – March 14, 2013:
Presented draft findings and policy implications to the entire COACT Group. Discussed
ideas for future study, including similar analysis of local transportation networks (which
have higher congestion and capacity constraints).
General Public Outreach; TXT L8R/Commute Options Event at Les Schwab
Amphitheater – June 9, 2013: Tabled at the event and provided information on the
outcomes of COTOP and the Park and Ride Lot Plan. Surveyed willing participants on
their willingness to use the 4 alternative scenarios for intercommunity travel.
CENTRAL OREGON STRATEGIC TRANSPORTATION OPTIONS PLAN | Final Report
Central Oregon Intergovernmental Council
COIC – Nelson\Nygaard Consulting Associates Inc. – DKS Associates | 5-1
5. BASELINE CONDITIONS This chapter summarizes expected year 2030 conditions for each intercommunity road segment
in the scope of this project. The base case includes anticipated highway conditions, and
anticipated levels of alternative transportation services (transit, carpool/vanpool, etc.) and use.
The resulting anticipated travel demand is derived from the Deschutes County travel demand
model. Highway facilities are assumed to be static to current (August 2012) conditions with the
exception of financially-committed projects. Investments in and consumer use of transportation
options, including transit, carpool/vanpool, and commuter rail, all of which will be analyzed as
potential options in this planning process, are assumed to be static with current conditions
(August 2012) due to the lack of any current financial commitments to increasing investment in
these programs.17
The chapter is organized as follows:
Overview of current transit and TDM program conditions
Segment-level summary of baseline conditions including any financially-committed
highway projects that are expected to be in place by 203018
Resulting baseline travel demand data
TRANSIT AND TDM PROGRAM OVERVIEW
Transit Service Overview
Regionally, public transportation is provided by Cascades East Transit (CET), which is operated
by the Central Oregon Intergovernmental Council (COIC). CET service is offered within and
between the eight incorporated cities of Central Oregon. CET provides the following types of
service across the region:
Bend Fixed Route and Complementary Dial-A-Ride
CET provides seven fixed routes in Bend, with service running from approximately 6:15 am to
approximately 6:20 pm. There are timed transfers between all local routes at Hawthorne Station,
which is also the hub for the Bend-Redmond and Bend-La Pine shuttles. CET also offers
complementary paratransit (DAR) available to any eligible individual (persons with disabilities
and low-income senior citizens) within city limits. Routes run at 40-minute headways from
17 In reality, while service levels may remain the same without additional investment, it is likely that the use of transit, carpool/vanpool will increase over time due to other factors such as rising gas prices and increased awareness of and familiarity with public transit and other transportation options.
18 Appendix B contains a list of non-financially committed highway improvement projects that have been proposed in city/county Transportation System Plans as necessary for implementation by 2030.
CENTRAL OREGON STRATEGIC TRANSPORTATION OPTIONS PLAN | Final Report
Central Oregon Intergovernmental Council
COIC – Nelson\Nygaard Consulting Associates Inc. – DKS Associates | 5-2
Monday to Friday, and operate from 8 am to 5 pm with 80-minute headways on Saturdays. Route
11 has several gaps in service hours on weekdays and does not operate on Saturdays.
Local General Public Dial-A-Ride
CET provides local dial-a-ride (reservation-based) service to the general public in the seven other
incorporated cities in Central Oregon: Culver, La Pine, Madras, Metolius, Prineville, Redmond,
and Sisters. Service hours vary from community to community, but are generally 7 am to 5:30
pm, Monday through Friday. The exception is Sisters, where service is only offered on Tuesdays,
from 9 am to 3:30pm. Service areas are generally the designated urban growth boundary (UGB)
in all communities, except for Sisters and La Pine, where local settlement patterns justify a
broader service area that includes large unincorporated areas.
Community Connector Shuttles
CET provides fixed-schedule Community Connector Shuttles connecting all eight incorporated
cities, and Warm Springs.19 The shuttles run Monday through Friday, on various schedules. The
shuttles all pick up and drop off at central transit hubs in each community, from which riders can
transfer to local transit services. The details of shuttle service and usage for each COTOP
intercommunity road segment are provided with the road segment information later in this
section.
TDM Program Overview
Commute Options for Central Oregon is the region’s TDM program advocate and provider, and
offers several programs of significance to the COTOP analysis, including vanpool programs,
carpool ridematching (as regional administrators of the tri-state Drive Less Connect program),
park and ride lot development and marketing, and a transportation options rewards program.
Advocacy and Outreach
Commute Options has been the primary regional organization advocating for non-SOV modes
since the early 1990s, and has worked to promote non-SOV infrastructure (e.g., park and ride lots,
bike corrals, pedestrian facilities, etc.); public transportation and carpool/vanpool programs;
outreach to citizens and organizations; policy advocacy to local governments and state agencies;
and more recently the Safe Routes to Schools program and transportation Health Impact
Assessment policy advocacy.
Drive Less Connect Regional Administrator
Drive Less Connect (DLC) is a tri-state (OR, WA, ID) online rideshare and TDM tracking program
that helps interested users organize carpools, identify “bike buddies,” and track out-of-pocket
savings accrued from non-SOV trips. It is also the reporting basis for the rewards program
described in the next section. Data on non-SOV trip origin-destination pairs can be queried from
the system. However, DLC is a self-reporting system being used by a relatively small number of
users and the numbers cannot be taken as a measure of actual activity. Unfortunately, there are
19 As of the publication of this report, the Warm Springs shuttle is not operating due to funding constraints, but it is expected to resume operations later in 2013.
CENTRAL OREGON STRATEGIC TRANSPORTATION OPTIONS PLAN | Final Report
Central Oregon Intergovernmental Council
COIC – Nelson\Nygaard Consulting Associates Inc. – DKS Associates | 5-3
no other sources of information for carpool or vanpool use in the region, and the statewide
administrators noted that they as yet have no basis for estimating actual numbers from DLC data.
Commute Options Partners (COPs) and Reward Program
Commute Options enlists the involvement of area businesses, non-profits, and government
agencies as TDM partners. Interested organizations pay a fee of $50-$500 depending on number
of employees, and designate an Employee Transportation Coordinator (ETC) to act as a liaison
with Commute Options and to oversee TDM activities and rewards programs. The ETC is trained
to register employees into the Drive Less Connect online database, and assists employees with
reporting their non-SOV commute (and other) trips. The COPs fee helps pay for a rewards
program in which employees are eligible to receive $25 gift certificates to area businesses after
every 45 non-SOV work round trips (home to work and back). Only employees of COPs are
eligible receive this award.20 Commute Options staff noted that the Bend MPO area has the
highest rate of per-capita DLC registrations statewide, and the highest percentage of active
participants (registrants become categorized as “inactive” after a few weeks of inactivity) due to
the fact that they are able to offer a rewards program.
Vanpool Program
Commute Options does not directly provide vanpool services, however it assists interested
employers and employees in accessing the vanpool programs offered by Enterprise and V-Ride, in
which companies lease vans that are then driven by vanpool participants. Currently, V-Ride
leases nine vans serving 91 US Forest Service employees; Enterprise leases one van serving 13
riders, and Sunriver Resort operates their own van serving nine employees.
20 COPs fees don’t cover the entire cost of purchasing the gift certificates; other sources include the City of Bend. In the past, ODOT supported the rewards program, but has since moved away from these sorts of investments across the state.
CENTRAL OREGON STRATEGIC TRANSPORTATION OPTIONS PLAN | Final Report
Central Oregon Intergovernmental Council
COIC – Nelson\Nygaard Consulting Associates Inc. – DKS Associates | 5-4
SEGMENT OVERVIEWS
Information for this section was obtained from interviews with COTOP TAC members, regional
TSPs, Cascades East Transit data, Drive Less Connect data, and interviews with Commute
Options for Central Oregon. Following are overviews of highway projects, transit service and use,
and TDM program activity for each COTOP intercommunity road segment. Transit service is
current as of July 2012.21 “First intersections” are the community-designated point at which the
intercommunity corridor first interacts with the local transportation network. These intersections
form the boundaries of the intercommunity road segments under study.
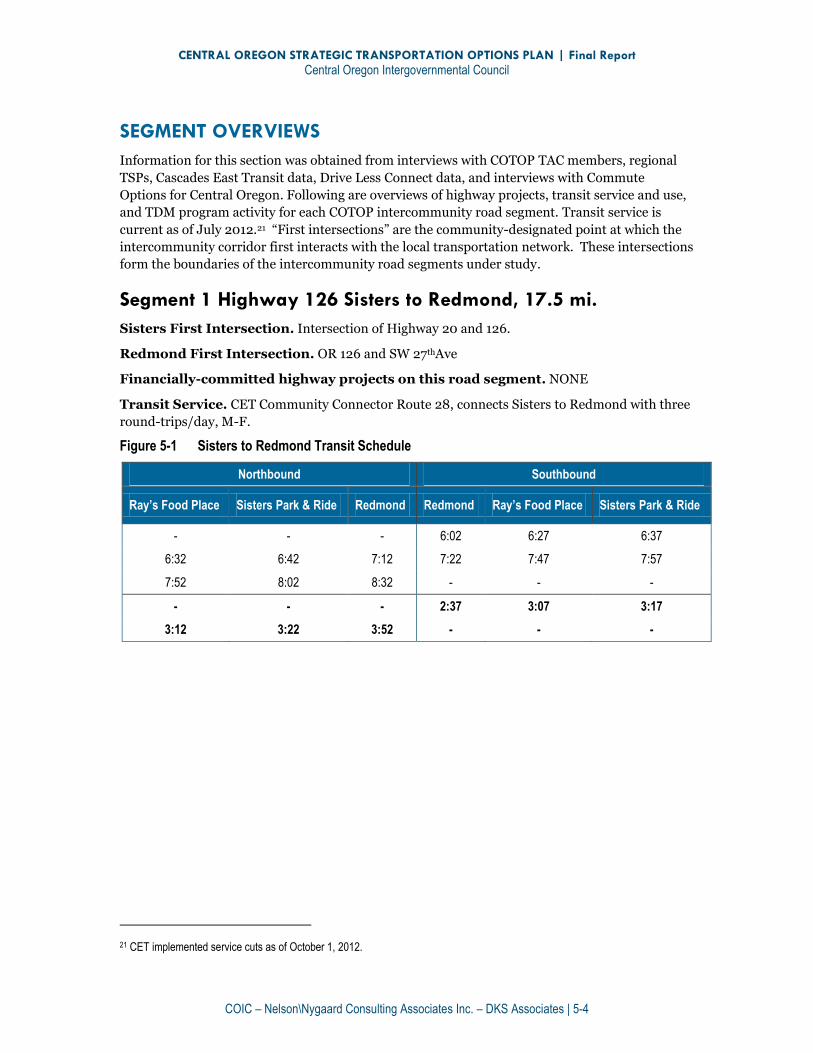
Segment 1 Highway 126 Sisters to Redmond, 17.5 mi.
Sisters First Intersection. Intersection of Highway 20 and 126.
Redmond First Intersection. OR 126 and SW 27thAve
Financially-committed highway projects on this road segment. NONE
Transit Service. CET Community Connector Route 28, connects Sisters to Redmond with three
round-trips/day, M-F.
Figure 5-1 Sisters to Redmond Transit Schedule
Northbound Southbound
Ray’s Food Place Sisters Park & Ride Redmond Redmond Ray’s Food Place Sisters Park & Ride
- - - 6:02 6:27 6:37
6:32 6:42 7:12 7:22 7:47 7:57
7:52 8:02 8:32 - - -
- - - 2:37 3:07 3:17
3:12 3:22 3:52 - - -
21 CET implemented service cuts as of October 1, 2012.

CENTRAL OREGON STRATEGIC TRANSPORTATION OPTIONS PLAN | Final Report
Central Oregon Intergovernmental Council
COIC – Nelson\Nygaard Consulting Associates Inc. – DKS Associates | 5-5
Figure 5-2 Sisters to Redmond Transit Use
Month, Year # Trips
Jan, 2011 239
Feb, 2011 213
Mar, 2011 204
Apr, 2011 180
May, 2011 216
June,2011 110
July, 2011 87
Aug, 2011 118
Sep, 2011 207
Oct, 2011 219
Nov, 2011 127
Dec, 2011 263
Jan, 2012 412
Feb, 2012 318
Mar, 2012 269
Apr, 2012 379
May, 2012 312
June, 2012 190
July, 2012 170
Sisters-Redmond Shuttle
Trips
Park and Ride Lots serving this segment. Sisters Pumphouse Park and Ride (591 E
Highway 20 Sisters) - Six spaces.
TDM Activity. The following activity is as-reported in the Drive Less Connect database, a self-
reporting system that does not necessarily indicate actual TDM activity, but rather indicates the
participation of users in the database for each corridor. It may also indicate the relative degree of
participation in TDM activities between the different corridors.
Figure 5-3 Sisters to Redmond TDM Activity
Trip Origin Trip Destination Mode Trip Count
Redmond Sisters Carpool 79
Source: Drive Less Connect database (9/6/2011 – 9/30/2012)
-
50
100
150
200
250
300
350
400
450
Sisters-Redmond Shuttle Trips, 1/11 to 7/12

CENTRAL OREGON STRATEGIC TRANSPORTATION OPTIONS PLAN | Final Report
Central Oregon Intergovernmental Council
COIC – Nelson\Nygaard Consulting Associates Inc. – DKS Associates | 5-6
Segment 2 Highway 126 Redmond to Prineville, 15.0 mi.
Redmond First Intersection. Highway126 and SE 9th
Prineville First Intersection. Highway 126 and Tom McCall
Financially-committed highway projects on this road segment. NONE
Transit Service. CET Community Connector Route 26 connects Prineville and Redmond with 5
round trips/day, M-F.
Figure 5-4 Redmond to Prineville Transit Schedule
Westbound
Juniper Canyon Fire Hall
School Bus Turnaround
Stryker Park Prineville Park
& Ride Powell Butte
Church Redmond
5:00 - 5:13 5:19 5:33 5:45
- - 6:36 6:50 7:01 7:15
7:02 7:07 7:56 8:05 8:16 8:30
- - 9:11 9:20 9:33 9:45
- - 3:18 3:27 - 3:40
3:37 3:42 4:38 4:47 - 5:10
Eastbound
Redmond Powell Butte
Church Stryker Park
Prineville Park & Ride
School Bus Turnaround
Juniper Cnyn Fire Hall
6:02 - 6:31 6:45 7:02 7:07
7:22 - 7:51 8:00 - -
8:37 - 9:06 9:15 - -
2:42 2:55 3:13 3:22 3:37 3:42
4:02 4:15 4:33 4:42
CENTRAL OREGON STRATEGIC TRANSPORTATION OPTIONS PLAN | Final Report
Central Oregon Intergovernmental Council
COIC – Nelson\Nygaard Consulting Associates Inc. – DKS Associates | 5-7
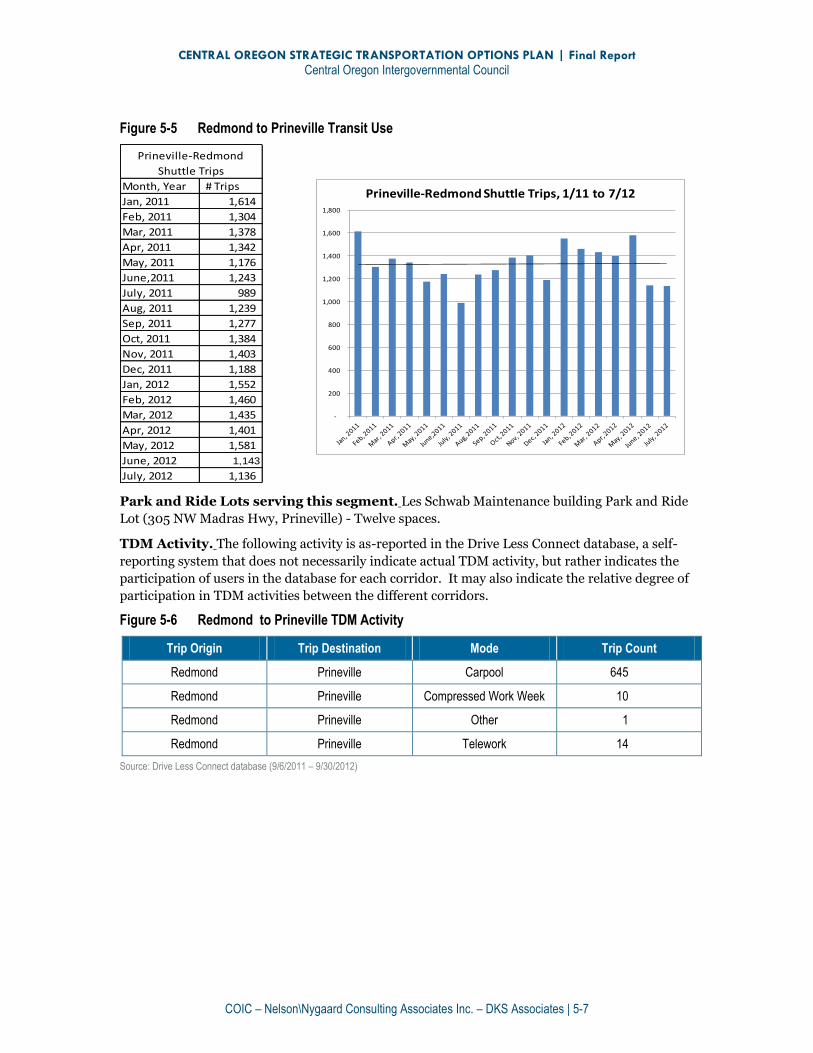
Figure 5-5 Redmond to Prineville Transit Use
Month, Year # Trips
Jan, 2011 1,614
Feb, 2011 1,304
Mar, 2011 1,378
Apr, 2011 1,342
May, 2011 1,176
June,2011 1,243
July, 2011 989
Aug, 2011 1,239
Sep, 2011 1,277
Oct, 2011 1,384
Nov, 2011 1,403
Dec, 2011 1,188
Jan, 2012 1,552
Feb, 2012 1,460
Mar, 2012 1,435
Apr, 2012 1,401
May, 2012 1,581
June, 2012 1,143
July, 2012 1,136
Prineville-Redmond
Shuttle Trips
Park and Ride Lots serving this segment. Les Schwab Maintenance building Park and Ride
Lot (305 NW Madras Hwy, Prineville) - Twelve spaces.
TDM Activity. The following activity is as-reported in the Drive Less Connect database, a self-
reporting system that does not necessarily indicate actual TDM activity, but rather indicates the
participation of users in the database for each corridor. It may also indicate the relative degree of
participation in TDM activities between the different corridors.
Figure 5-6 Redmond to Prineville TDM Activity
Trip Origin Trip Destination Mode Trip Count
Redmond Prineville Carpool 645
Redmond Prineville Compressed Work Week 10
Redmond Prineville Other 1
Redmond Prineville Telework 14
Source: Drive Less Connect database (9/6/2011 – 9/30/2012)
-
200
400
600
800
1,000
1,200
1,400
1,600
1,800
Prineville-Redmond Shuttle Trips, 1/11 to 7/12
CENTRAL OREGON STRATEGIC TRANSPORTATION OPTIONS PLAN | Final Report
Central Oregon Intergovernmental Council
COIC – Nelson\Nygaard Consulting Associates Inc. – DKS Associates | 5-8
Segment 3 Highway 97 Madras to Redmond, 22.0 mi.
Madras First Intersection. Intersection of US 97, US 26, and Colfax Road
Redmond First Intersection. Re-route/Business 97 and 6th St
Financially-committed highway projects on this road segment. NONE
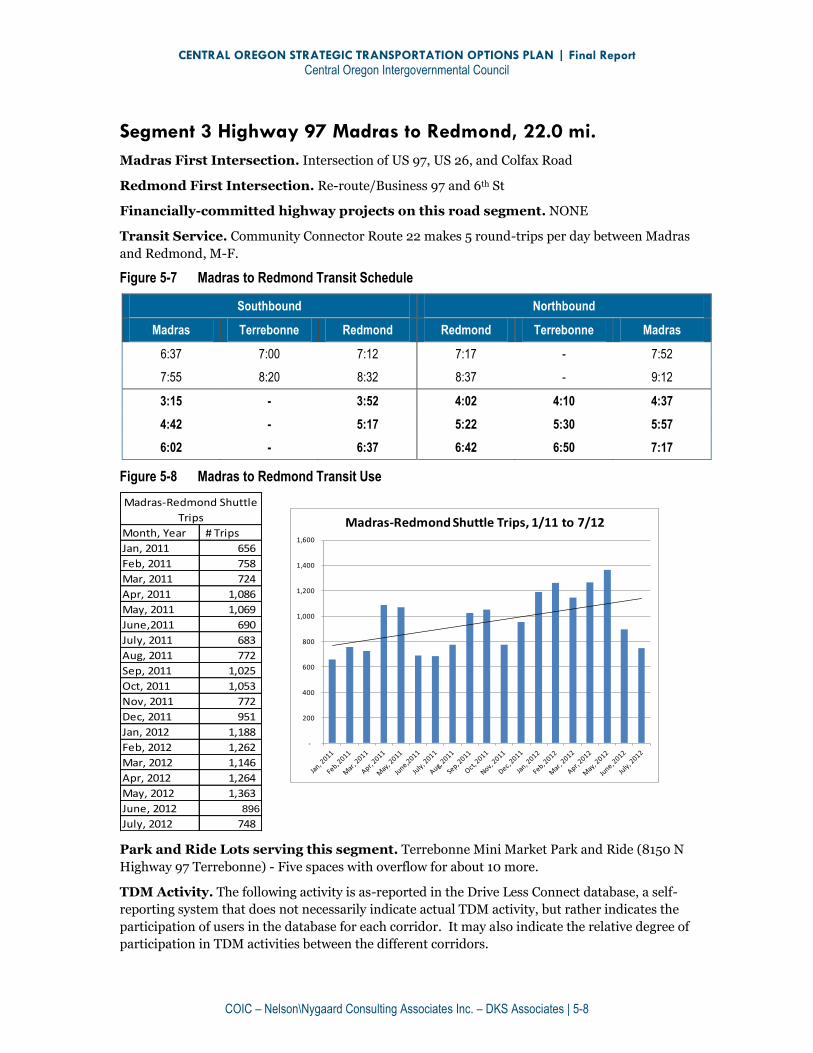
Transit Service. Community Connector Route 22 makes 5 round-trips per day between Madras
and Redmond, M-F.
Figure 5-7 Madras to Redmond Transit Schedule
Southbound Northbound
Madras Terrebonne Redmond Redmond Terrebonne Madras
6:37 7:00 7:12 7:17 - 7:52
7:55 8:20 8:32 8:37 - 9:12
3:15 - 3:52 4:02 4:10 4:37
4:42 - 5:17 5:22 5:30 5:57
6:02 - 6:37 6:42 6:50 7:17
Figure 5-8 Madras to Redmond Transit Use
Month, Year # Trips
Jan, 2011 656
Feb, 2011 758
Mar, 2011 724
Apr, 2011 1,086
May, 2011 1,069
June,2011 690
July, 2011 683
Aug, 2011 772
Sep, 2011 1,025
Oct, 2011 1,053
Nov, 2011 772
Dec, 2011 951
Jan, 2012 1,188
Feb, 2012 1,262
Mar, 2012 1,146
Apr, 2012 1,264
May, 2012 1,363
June, 2012 896
July, 2012 748
Madras-Redmond Shuttle
Trips
Park and Ride Lots serving this segment. Terrebonne Mini Market Park and Ride (8150 N
Highway 97 Terrebonne) - Five spaces with overflow for about 10 more.
TDM Activity. The following activity is as-reported in the Drive Less Connect database, a self-
reporting system that does not necessarily indicate actual TDM activity, but rather indicates the
participation of users in the database for each corridor. It may also indicate the relative degree of
participation in TDM activities between the different corridors.
-
200
400
600
800
1,000
1,200
1,400
1,600
Madras-Redmond Shuttle Trips, 1/11 to 7/12

CENTRAL OREGON STRATEGIC TRANSPORTATION OPTIONS PLAN | Final Report
Central Oregon Intergovernmental Council
COIC – Nelson\Nygaard Consulting Associates Inc. – DKS Associates | 5-9
Figure 5-9 Madras to Redmond TDM Activity
Trip Origin Trip Destination Mode Trip Count
Redmond Madras Carpool 393
Source: Drive Less Connect database (9/6/2011 – 9/30/2012)
CENTRAL OREGON STRATEGIC TRANSPORTATION OPTIONS PLAN | Final Report
Central Oregon Intergovernmental Council
COIC – Nelson\Nygaard Consulting Associates Inc. – DKS Associates | 5-10
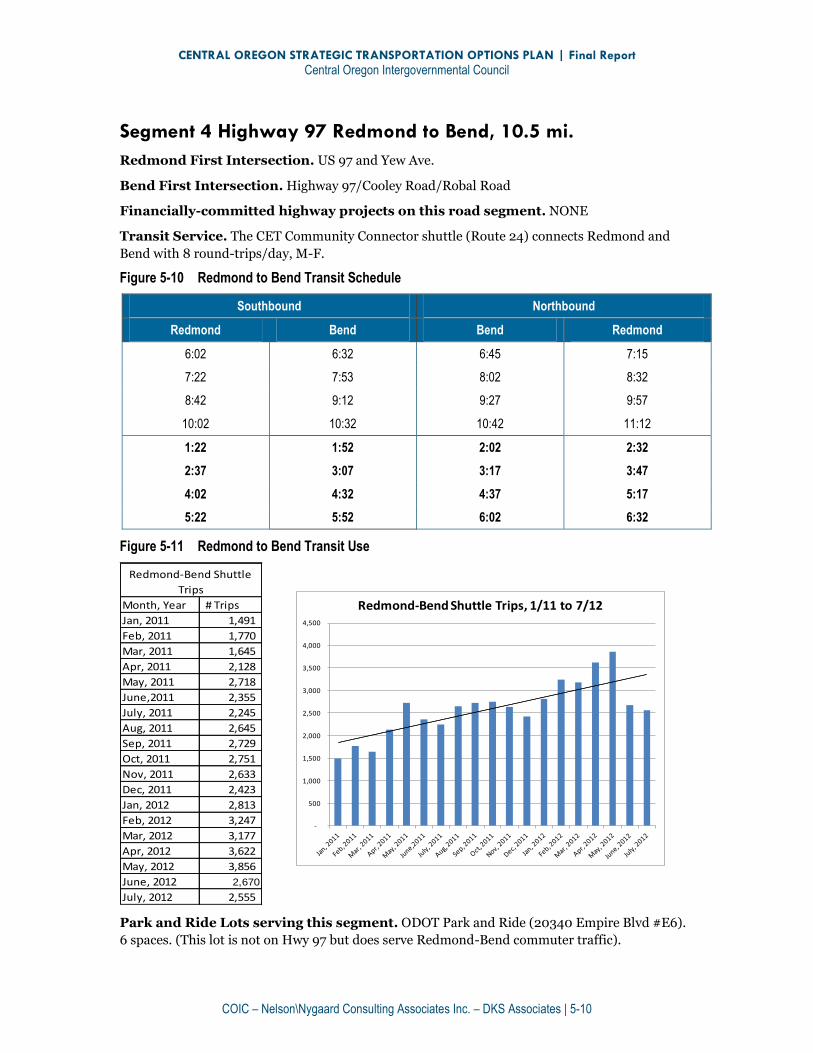
Segment 4 Highway 97 Redmond to Bend, 10.5 mi.
Redmond First Intersection. US 97 and Yew Ave.
Bend First Intersection. Highway 97/Cooley Road/Robal Road
Financially-committed highway projects on this road segment. NONE
Transit Service. The CET Community Connector shuttle (Route 24) connects Redmond and
Bend with 8 round-trips/day, M-F.
Figure 5-10 Redmond to Bend Transit Schedule
Southbound Northbound
Redmond Bend Bend Redmond
6:02 6:32 6:45 7:15
7:22 7:53 8:02 8:32
8:42 9:12 9:27 9:57
10:02 10:32 10:42 11:12
1:22 1:52 2:02 2:32
2:37 3:07 3:17 3:47
4:02 4:32 4:37 5:17
5:22 5:52 6:02 6:32
Figure 5-11 Redmond to Bend Transit Use
Month, Year # Trips
Jan, 2011 1,491
Feb, 2011 1,770
Mar, 2011 1,645
Apr, 2011 2,128
May, 2011 2,718
June,2011 2,355
July, 2011 2,245
Aug, 2011 2,645
Sep, 2011 2,729
Oct, 2011 2,751
Nov, 2011 2,633
Dec, 2011 2,423
Jan, 2012 2,813
Feb, 2012 3,247
Mar, 2012 3,177
Apr, 2012 3,622
May, 2012 3,856
June, 2012 2,670
July, 2012 2,555
Redmond-Bend Shuttle
Trips
Park and Ride Lots serving this segment. ODOT Park and Ride (20340 Empire Blvd #E6).
6 spaces. (This lot is not on Hwy 97 but does serve Redmond-Bend commuter traffic).
-
500
1,000
1,500
2,000
2,500
3,000
3,500
4,000
4,500
Redmond-Bend Shuttle Trips, 1/11 to 7/12

CENTRAL OREGON STRATEGIC TRANSPORTATION OPTIONS PLAN | Final Report
Central Oregon Intergovernmental Council
COIC – Nelson\Nygaard Consulting Associates Inc. – DKS Associates | 5-11
TDM Activity. The following activity is as-reported in the Drive Less Connect database, a self-
reporting system that does not necessarily indicate actual TDM activity, but rather indicates the
participation of users in the database for each corridor. It may also indicate the relative degree of
participation in TDM activities between the different corridors.
Figure 5-12 Redmond to Bend TDM Activity
Trip Origin Trip Destination Mode Trip Count
Bend Redmond Bike 188
Bend Redmond Carpool 4970
Bend Redmond Compressed Work Week 21
Bend Redmond Other 2
Bend Redmond Telework 104
Source: Drive Less Connect database (9/6/2011 – 9/30/2012)

CENTRAL OREGON STRATEGIC TRANSPORTATION OPTIONS PLAN | Final Report
Central Oregon Intergovernmental Council
COIC – Nelson\Nygaard Consulting Associates Inc. – DKS Associates | 5-12
Segment 5 Highway 97 Bend to La Pine, 23.7 mi.
Bend First Intersection. S. Highway 97/3rd St. “Y”/Murphy Overcrossing
La Pine First Intersection. Highway 97 and Burgess Road
Financially-committed highway projects on this road segment.
Figure 5-13 Bend to La Pine Financially-Committed Highway Projects
Jurisdition Project Issue Estimated
Cost
Bend Murphy Overcrossing project – grade-separated flyover. More at: http://bendoregon.gov/index.aspx?page=142
Safety; E-W connectivity from Brookswood to 15th.
$50 million
La Pine
1st and 97 intersection improvement – eliminate road lanes (“road diet” through re-striping narrowing), install permanent speed indicator, realignment of 1st and Reed to improve alignment, 4-way signalization
Safety, capacity $1.3 million
Note: $25 million of the Murphy Overcrossing is financially committed to complete the overcrossing and the connection to Brookswood. Remaining work is to complete the connection to 15th St. ODOT has come up with funding for the “road diet” portion of the 1st and 97 project.
Transit Service. CET Community Connector Route 30 connects Bend and La Pine with 3
roundtrips/day, M-F
Figure 5-14 Bend to La Pine Transit Schedule
Northbound Southbound
La Pine Wickiup Jct. Park & Ride Bend Bend WickiupJct Park & Ride La Pine
6:45 6:55 7:35 7:40 8:20 8:30
8:17 8:25 9:05 - - -
- - - 3:42 4:22 4:32
4:17 4:27 5:07 5:20 6:00 6:10
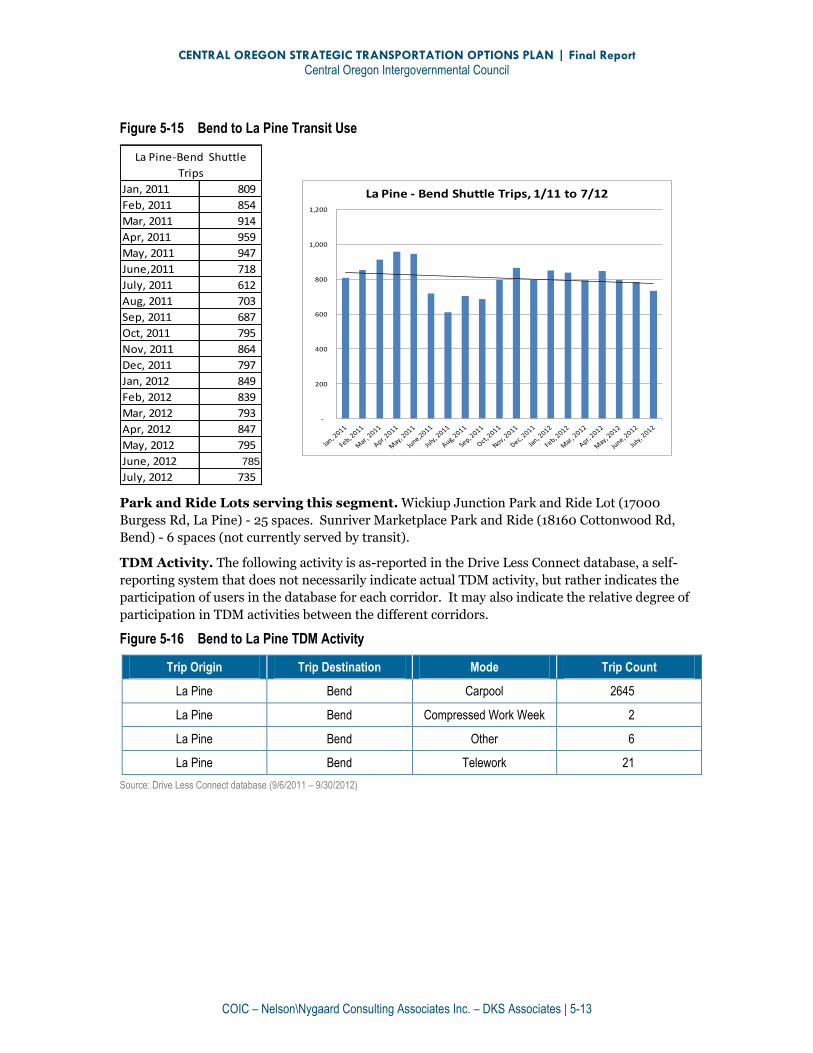
CENTRAL OREGON STRATEGIC TRANSPORTATION OPTIONS PLAN | Final Report
Central Oregon Intergovernmental Council
COIC – Nelson\Nygaard Consulting Associates Inc. – DKS Associates | 5-13
Figure 5-15 Bend to La Pine Transit Use
Jan, 2011 809
Feb, 2011 854
Mar, 2011 914
Apr, 2011 959
May, 2011 947
June,2011 718
July, 2011 612
Aug, 2011 703
Sep, 2011 687
Oct, 2011 795
Nov, 2011 864
Dec, 2011 797
Jan, 2012 849
Feb, 2012 839
Mar, 2012 793
Apr, 2012 847
May, 2012 795
June, 2012 785
July, 2012 735
La Pine-Bend Shuttle
Trips
Park and Ride Lots serving this segment. Wickiup Junction Park and Ride Lot (17000
Burgess Rd, La Pine) - 25 spaces. Sunriver Marketplace Park and Ride (18160 Cottonwood Rd,
Bend) - 6 spaces (not currently served by transit).
TDM Activity. The following activity is as-reported in the Drive Less Connect database, a self-
reporting system that does not necessarily indicate actual TDM activity, but rather indicates the
participation of users in the database for each corridor. It may also indicate the relative degree of
participation in TDM activities between the different corridors.
Figure 5-16 Bend to La Pine TDM Activity
Trip Origin Trip Destination Mode Trip Count
La Pine Bend Carpool 2645
La Pine Bend Compressed Work Week 2
La Pine Bend Other 6
La Pine Bend Telework 21
Source: Drive Less Connect database (9/6/2011 – 9/30/2012)
-
200
400
600
800
1,000
1,200
La Pine - Bend Shuttle Trips, 1/11 to 7/12
CENTRAL OREGON STRATEGIC TRANSPORTATION OPTIONS PLAN | Final Report
Central Oregon Intergovernmental Council
COIC – Nelson\Nygaard Consulting Associates Inc. – DKS Associates | 5-14
Segment 6 Highway 26 Madras to Prineville, 25.8 mi.
Madras First Intersection. Highway 97 and 26 and Colfax Lane
Prineville First Intersection. Highway 26 and 9th St.22
Financially-committed highway projects on this road segment. NONE
Transit Service. There is no regularly scheduled transit service on this segment.
Park and Ride Lots serving this segment. Les Schwab Maintenance building Park and Ride
Lot (305 NW Madras Hwy, Prineville) - Twelve spaces.
TDM Activity. There was no activity-reported in the Drive Less Connect database, a self-
reporting system that does not necessarily indicate actual TDM activity, but rather indicates the
participation of users in the database for each corridor. It may also indicate the relative degree of
participation in TDM activities between the different corridors.
22 May need to use Highway 26 and 126 “Y” b/c of lack of data at 9th St.

CENTRAL OREGON STRATEGIC TRANSPORTATION OPTIONS PLAN | Final Report
Central Oregon Intergovernmental Council
COIC – Nelson\Nygaard Consulting Associates Inc. – DKS Associates | 5-15
Segment 7 Highway 361 Culver To Madras, 7.5 mi.
Madras First Intersection. Highway 361 and SW Fairgrounds Rd
Metolius First Intersection North. Dover and Jefferson Ave ( Hwy 361 )
Metolius First Intersection South. 9th and Jefferson Ave ( Hwy 361 )
Culver First Intersection. SW Culver Highway and A Street
Financially-committed highway projects on this road segment. NONE
Transit Service. CET Community Connector Route 21 connects Culver, Metolius, and Madras
with two one-way northbound trips and two one-way southbound trips/day, M-F. Note: this
shuttle requires a reservation (requirement eliminated as of October 1, 2012).
Figure 5-17 Culver to Madras to Transit Schedule
Northbound Southbound
Madras Metolius Culver Culver Metolius Madras
- - - 7:35 7:46 7:52
- - - 10:08 10:19 10:25
3:17 3:23 3:34 - - -
4:42 4:48 4:59 - - -
This service is operated as part of the Madras local DAR system. CET only began gathering data
on Culver-Metolius-Madras shuttle trips in July 2012.
Figure 5-18 Culver to Madras Transit Use
July, 2012 175
Aug, 2012 129
Sep, 2012 434
C&M/Madras Shuttle Rides
Park and Ride Lots serving this segment. There are no officially-designated, signed P&R
lots serving this segment.
TDM Activity. There was no activity-reported in the Drive Less Connect database, a self-
reporting system that does not necessarily indicate actual TDM activity, but rather indicates the
participation of users in the database for each corridor. It may also indicate the relative degree of
participation in TDM activities between the different corridors.
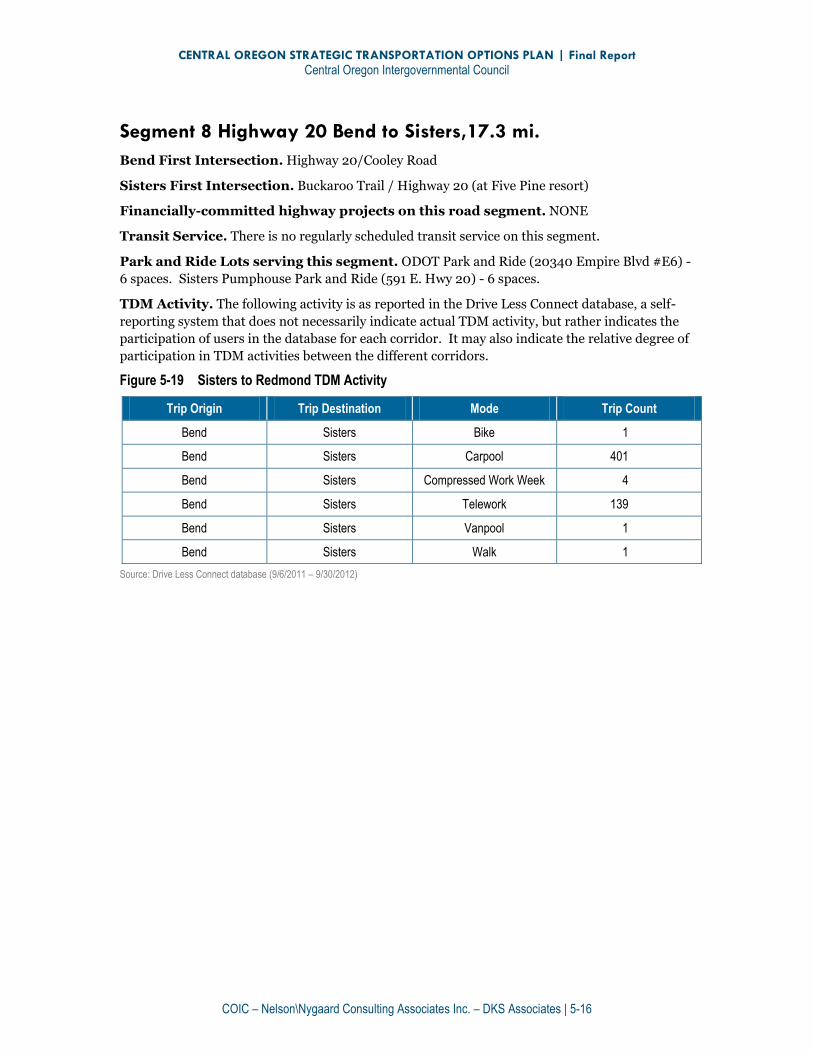
CENTRAL OREGON STRATEGIC TRANSPORTATION OPTIONS PLAN | Final Report
Central Oregon Intergovernmental Council
COIC – Nelson\Nygaard Consulting Associates Inc. – DKS Associates | 5-16
Segment 8 Highway 20 Bend to Sisters,17.3 mi.
Bend First Intersection. Highway 20/Cooley Road
Sisters First Intersection. Buckaroo Trail / Highway 20 (at Five Pine resort)
Financially-committed highway projects on this road segment. NONE
Transit Service. There is no regularly scheduled transit service on this segment.
Park and Ride Lots serving this segment. ODOT Park and Ride (20340 Empire Blvd #E6) -
6 spaces. Sisters Pumphouse Park and Ride (591 E. Hwy 20) - 6 spaces.
TDM Activity. The following activity is as reported in the Drive Less Connect database, a self-
reporting system that does not necessarily indicate actual TDM activity, but rather indicates the
participation of users in the database for each corridor. It may also indicate the relative degree of
participation in TDM activities between the different corridors.
Figure 5-19 Sisters to Redmond TDM Activity
Trip Origin Trip Destination Mode Trip Count
Bend Sisters Bike 1
Bend Sisters Carpool 401
Bend Sisters Compressed Work Week 4
Bend Sisters Telework 139
Bend Sisters Vanpool 1
Bend Sisters Walk 1
Source: Drive Less Connect database (9/6/2011 – 9/30/2012)
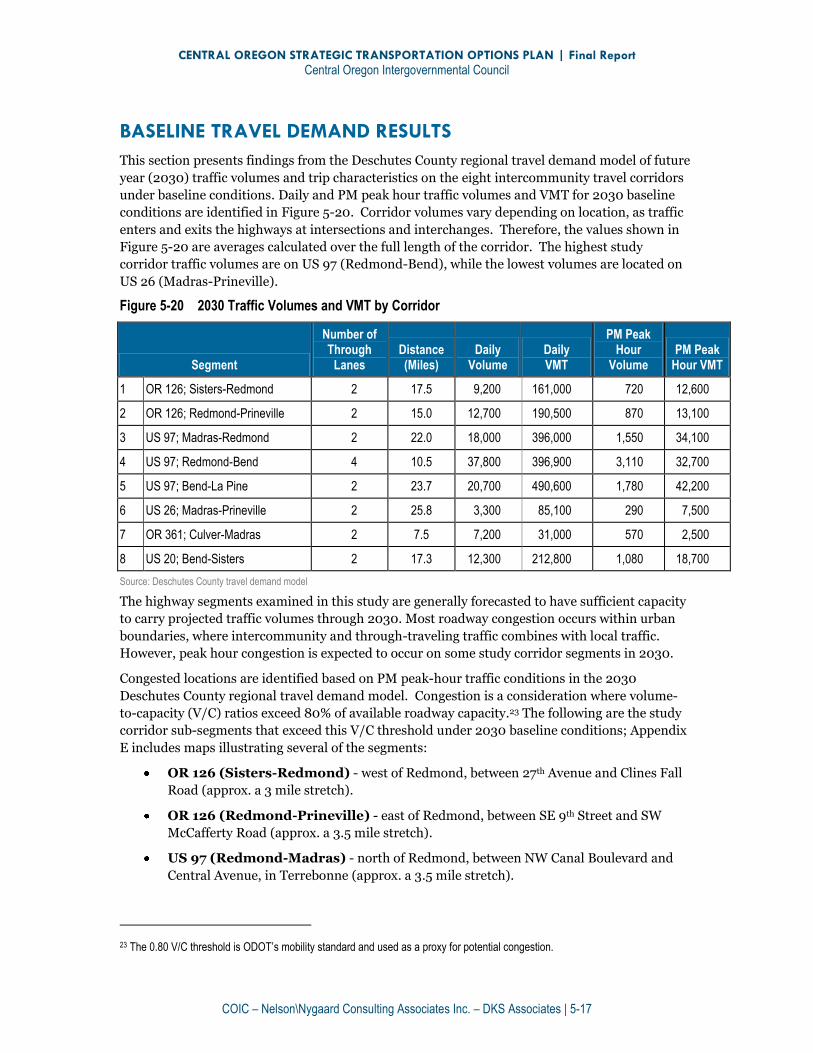
CENTRAL OREGON STRATEGIC TRANSPORTATION OPTIONS PLAN | Final Report
Central Oregon Intergovernmental Council
COIC – Nelson\Nygaard Consulting Associates Inc. – DKS Associates | 5-17
BASELINE TRAVEL DEMAND RESULTS
This section presents findings from the Deschutes County regional travel demand model of future
year (2030) traffic volumes and trip characteristics on the eight intercommunity travel corridors
under baseline conditions. Daily and PM peak hour traffic volumes and VMT for 2030 baseline
conditions are identified in Figure 5-20. Corridor volumes vary depending on location, as traffic
enters and exits the highways at intersections and interchanges. Therefore, the values shown in
Figure 5-20 are averages calculated over the full length of the corridor. The highest study
corridor traffic volumes are on US 97 (Redmond-Bend), while the lowest volumes are located on
US 26 (Madras-Prineville).
Figure 5-20 2030 Traffic Volumes and VMT by Corridor
Segment
Number of Through
Lanes Distance (Miles)
Daily Volume
Daily VMT
PM Peak Hour
Volume PM Peak
Hour VMT
1 OR 126; Sisters-Redmond 2 17.5 9,200 161,000 720 12,600
2 OR 126; Redmond-Prineville 2 15.0 12,700 190,500 870 13,100
3 US 97; Madras-Redmond 2 22.0 18,000 396,000 1,550 34,100
4 US 97; Redmond-Bend 4 10.5 37,800 396,900 3,110 32,700
5 US 97; Bend-La Pine 2 23.7 20,700 490,600 1,780 42,200
6 US 26; Madras-Prineville 2 25.8 3,300 85,100 290 7,500
7 OR 361; Culver-Madras 2 7.5 7,200 31,000 570 2,500
8 US 20; Bend-Sisters 2 17.3 12,300 212,800 1,080 18,700
Source: Deschutes County travel demand model
The highway segments examined in this study are generally forecasted to have sufficient capacity
to carry projected traffic volumes through 2030. Most roadway congestion occurs within urban
boundaries, where intercommunity and through-traveling traffic combines with local traffic.
However, peak hour congestion is expected to occur on some study corridor segments in 2030.
Congested locations are identified based on PM peak-hour traffic conditions in the 2030
Deschutes County regional travel demand model. Congestion is a consideration where volume-
to-capacity (V/C) ratios exceed 80% of available roadway capacity.23 The following are the study
corridor sub-segments that exceed this V/C threshold under 2030 baseline conditions; Appendix
E includes maps illustrating several of the segments:
OR 126 (Sisters-Redmond) - west of Redmond, between 27th Avenue and Clines Fall
Road (approx. a 3 mile stretch).
OR 126 (Redmond-Prineville) - east of Redmond, between SE 9th Street and SW
McCafferty Road (approx. a 3.5 mile stretch).
US 97 (Redmond-Madras) - north of Redmond, between NW Canal Boulevard and
Central Avenue, in Terrebonne (approx. a 3.5 mile stretch).
23 The 0.80 V/C threshold is ODOT’s mobility standard and used as a proxy for potential congestion.
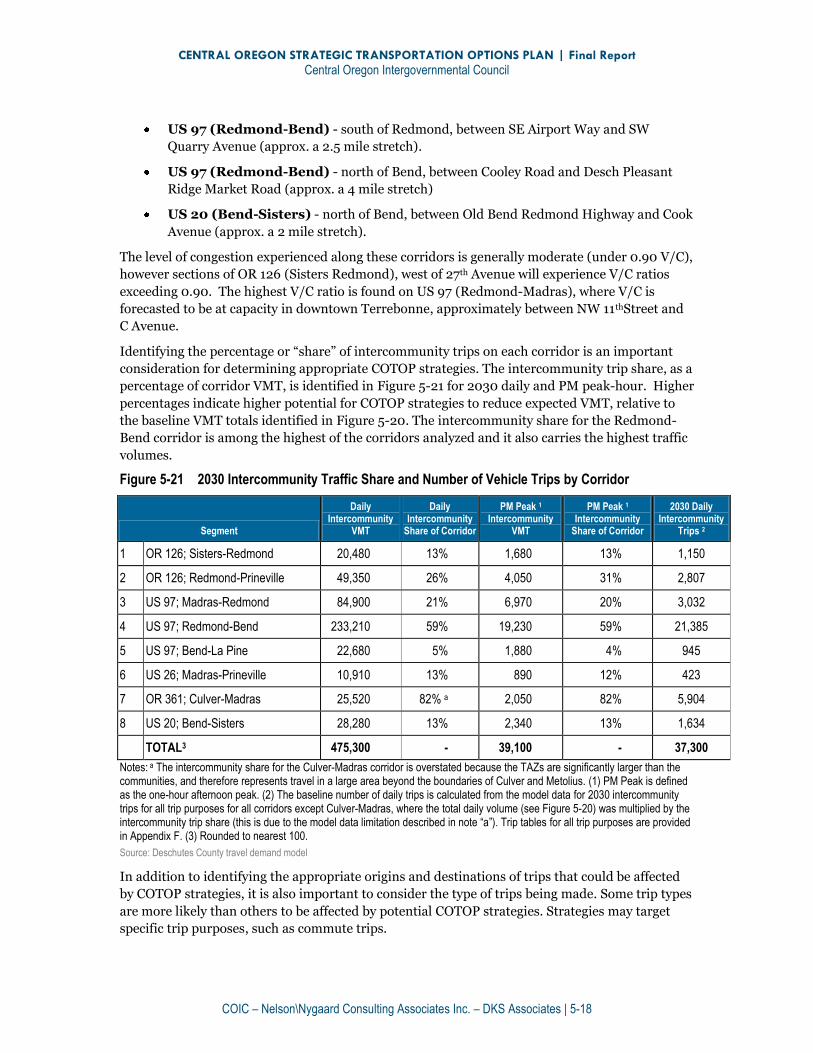
CENTRAL OREGON STRATEGIC TRANSPORTATION OPTIONS PLAN | Final Report
Central Oregon Intergovernmental Council
COIC – Nelson\Nygaard Consulting Associates Inc. – DKS Associates | 5-18
US 97 (Redmond-Bend) - south of Redmond, between SE Airport Way and SW
Quarry Avenue (approx. a 2.5 mile stretch).
US 97 (Redmond-Bend) - north of Bend, between Cooley Road and Desch Pleasant
Ridge Market Road (approx. a 4 mile stretch)
US 20 (Bend-Sisters) - north of Bend, between Old Bend Redmond Highway and Cook
Avenue (approx. a 2 mile stretch).
The level of congestion experienced along these corridors is generally moderate (under 0.90 V/C),
however sections of OR 126 (Sisters Redmond), west of 27th Avenue will experience V/C ratios
exceeding 0.90. The highest V/C ratio is found on US 97 (Redmond-Madras), where V/C is
forecasted to be at capacity in downtown Terrebonne, approximately between NW 11thStreet and
C Avenue.
Identifying the percentage or “share” of intercommunity trips on each corridor is an important
consideration for determining appropriate COTOP strategies. The intercommunity trip share, as a
percentage of corridor VMT, is identified in Figure 5-21 for 2030 daily and PM peak-hour. Higher
percentages indicate higher potential for COTOP strategies to reduce expected VMT, relative to
the baseline VMT totals identified in Figure 5-20. The intercommunity share for the Redmond-
Bend corridor is among the highest of the corridors analyzed and it also carries the highest traffic
volumes.
Figure 5-21 2030 Intercommunity Traffic Share and Number of Vehicle Trips by Corridor
Segment
Daily Intercommunity
VMT
Daily Intercommunity
Share of Corridor
PM Peak 1 Intercommunity
VMT
PM Peak 1
Intercommunity Share of Corridor
2030 Daily Intercommunity
Trips 2
1 OR 126; Sisters-Redmond 20,480 13% 1,680 13% 1,150
2 OR 126; Redmond-Prineville 49,350 26% 4,050 31% 2,807
3 US 97; Madras-Redmond 84,900 21% 6,970 20% 3,032
4 US 97; Redmond-Bend 233,210 59% 19,230 59% 21,385
5 US 97; Bend-La Pine 22,680 5% 1,880 4% 945
6 US 26; Madras-Prineville 10,910 13% 890 12% 423
7 OR 361; Culver-Madras 25,520 82% a 2,050 82% 5,904
8 US 20; Bend-Sisters 28,280 13% 2,340 13% 1,634
TOTAL3 475,300 - 39,100 - 37,300
Notes: a The intercommunity share for the Culver-Madras corridor is overstated because the TAZs are significantly larger than the communities, and therefore represents travel in a large area beyond the boundaries of Culver and Metolius. (1) PM Peak is defined as the one-hour afternoon peak. (2) The baseline number of daily trips is calculated from the model data for 2030 intercommunity trips for all trip purposes for all corridors except Culver-Madras, where the total daily volume (see Figure 5-20) was multiplied by the intercommunity trip share (this is due to the model data limitation described in note “a”). Trip tables for all trip purposes are provided in Appendix F. (3) Rounded to nearest 100.
Source: Deschutes County travel demand model
In addition to identifying the appropriate origins and destinations of trips that could be affected
by COTOP strategies, it is also important to consider the type of trips being made. Some trip types
are more likely than others to be affected by potential COTOP strategies. Strategies may target
specific trip purposes, such as commute trips.
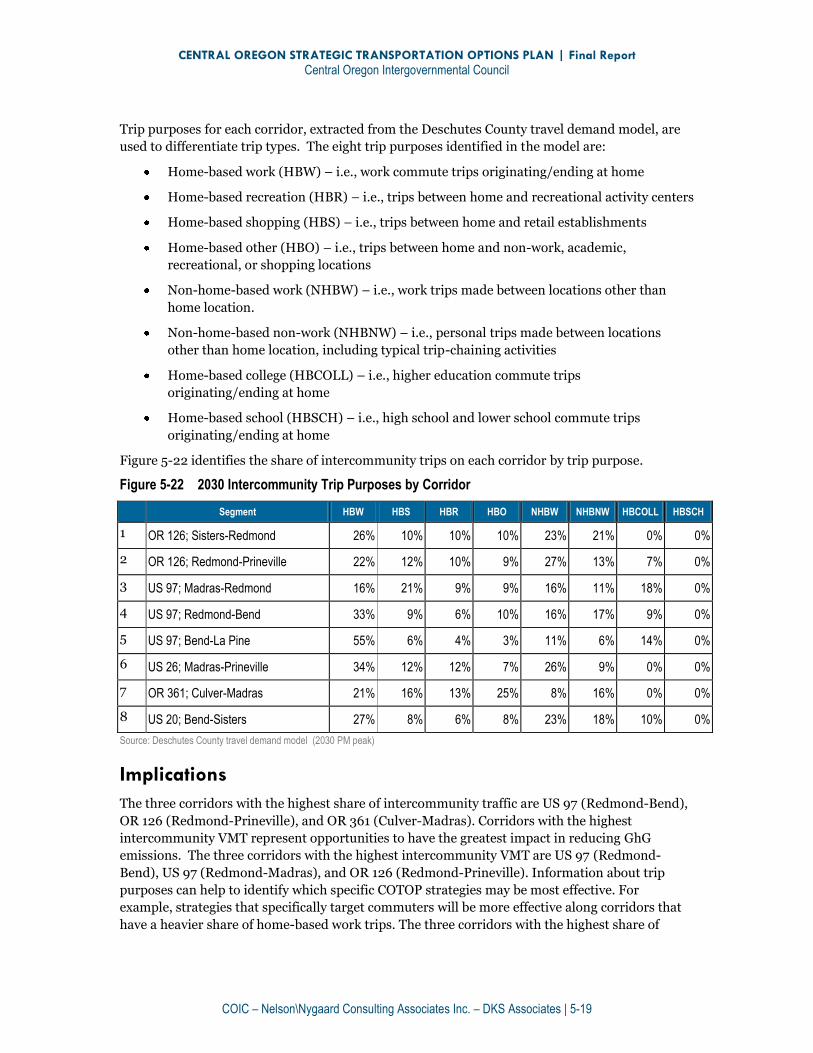
CENTRAL OREGON STRATEGIC TRANSPORTATION OPTIONS PLAN | Final Report
Central Oregon Intergovernmental Council
COIC – Nelson\Nygaard Consulting Associates Inc. – DKS Associates | 5-19
Trip purposes for each corridor, extracted from the Deschutes County travel demand model, are
used to differentiate trip types. The eight trip purposes identified in the model are:
Home-based work (HBW) – i.e., work commute trips originating/ending at home
Home-based recreation (HBR) – i.e., trips between home and recreational activity centers
Home-based shopping (HBS) – i.e., trips between home and retail establishments
Home-based other (HBO) – i.e., trips between home and non-work, academic,
recreational, or shopping locations
Non-home-based work (NHBW) – i.e., work trips made between locations other than
home location.
Non-home-based non-work (NHBNW) – i.e., personal trips made between locations
other than home location, including typical trip-chaining activities
Home-based college (HBCOLL) – i.e., higher education commute trips
originating/ending at home
Home-based school (HBSCH) – i.e., high school and lower school commute trips
originating/ending at home
Figure 5-22 identifies the share of intercommunity trips on each corridor by trip purpose.
Figure 5-22 2030 Intercommunity Trip Purposes by Corridor
Segment HBW HBS HBR HBO NHBW NHBNW HBCOLL HBSCH
1 OR 126; Sisters-Redmond 26% 10% 10% 10% 23% 21% 0% 0%
2 OR 126; Redmond-Prineville 22% 12% 10% 9% 27% 13% 7% 0%
3 US 97; Madras-Redmond 16% 21% 9% 9% 16% 11% 18% 0%
4 US 97; Redmond-Bend 33% 9% 6% 10% 16% 17% 9% 0%
5 US 97; Bend-La Pine 55% 6% 4% 3% 11% 6% 14% 0%
6 US 26; Madras-Prineville 34% 12% 12% 7% 26% 9% 0% 0%
7 OR 361; Culver-Madras 21% 16% 13% 25% 8% 16% 0% 0%
8 US 20; Bend-Sisters 27% 8% 6% 8% 23% 18% 10% 0%
Source: Deschutes County travel demand model (2030 PM peak)
Implications
The three corridors with the highest share of intercommunity traffic are US 97 (Redmond-Bend),
OR 126 (Redmond-Prineville), and OR 361 (Culver-Madras). Corridors with the highest
intercommunity VMT represent opportunities to have the greatest impact in reducing GhG
emissions. The three corridors with the highest intercommunity VMT are US 97 (Redmond-
Bend), US 97 (Redmond-Madras), and OR 126 (Redmond-Prineville). Information about trip
purposes can help to identify which specific COTOP strategies may be most effective. For
example, strategies that specifically target commuters will be more effective along corridors that
have a heavier share of home-based work trips. The three corridors with the highest share of

CENTRAL OREGON STRATEGIC TRANSPORTATION OPTIONS PLAN | Final Report
Central Oregon Intergovernmental Council
COIC – Nelson\Nygaard Consulting Associates Inc. – DKS Associates | 5-20
intercommunity home-based work trips are US 97 (Redmond-Bend), US 97 (Bend-La Pine), and
US 26 (Madras-Prineville).
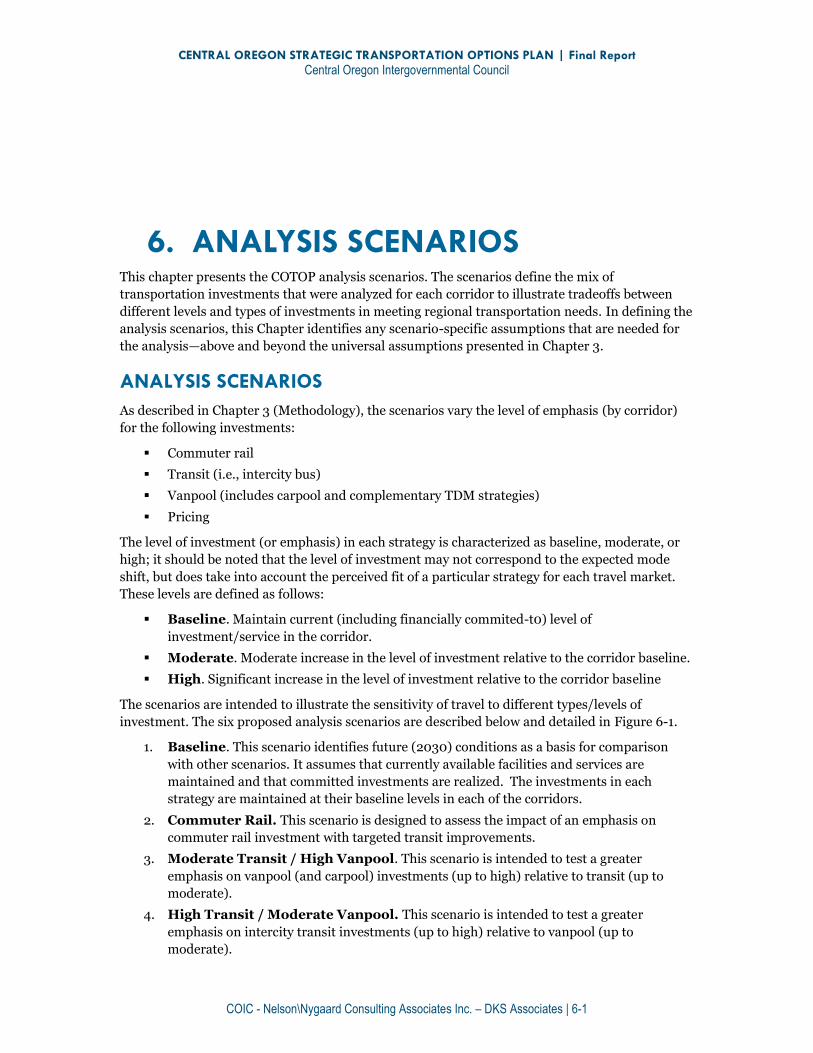
CENTRAL OREGON STRATEGIC TRANSPORTATION OPTIONS PLAN | Final Report
Central Oregon Intergovernmental Council
COIC - Nelson\Nygaard Consulting Associates Inc. – DKS Associates | 6-1
6. ANALYSIS SCENARIOS This chapter presents the COTOP analysis scenarios. The scenarios define the mix of
transportation investments that were analyzed for each corridor to illustrate tradeoffs between
different levels and types of investments in meeting regional transportation needs. In defining the
analysis scenarios, this Chapter identifies any scenario-specific assumptions that are needed for
the analysis—above and beyond the universal assumptions presented in Chapter 3.
ANALYSIS SCENARIOS
As described in Chapter 3 (Methodology), the scenarios vary the level of emphasis (by corridor)
for the following investments:
Commuter rail
Transit (i.e., intercity bus)
Vanpool (includes carpool and complementary TDM strategies)
Pricing
The level of investment (or emphasis) in each strategy is characterized as baseline, moderate, or
high; it should be noted that the level of investment may not correspond to the expected mode
shift, but does take into account the perceived fit of a particular strategy for each travel market.
These levels are defined as follows:
Baseline. Maintain current (including financially commited-t0) level of
investment/service in the corridor.
Moderate. Moderate increase in the level of investment relative to the corridor baseline.
High. Significant increase in the level of investment relative to the corridor baseline
The scenarios are intended to illustrate the sensitivity of travel to different types/levels of
investment. The six proposed analysis scenarios are described below and detailed in Figure 6-1.
1. Baseline. This scenario identifies future (2030) conditions as a basis for comparison
with other scenarios. It assumes that currently available facilities and services are
maintained and that committed investments are realized. The investments in each
strategy are maintained at their baseline levels in each of the corridors.
2. Commuter Rail. This scenario is designed to assess the impact of an emphasis on
commuter rail investment with targeted transit improvements.
3. Moderate Transit / High Vanpool. This scenario is intended to test a greater
emphasis on vanpool (and carpool) investments (up to high) relative to transit (up to
moderate).
4. High Transit / Moderate Vanpool. This scenario is intended to test a greater
emphasis on intercity transit investments (up to high) relative to vanpool (up to
moderate).
CENTRAL OREGON STRATEGIC TRANSPORTATION OPTIONS PLAN | Final Report
Central Oregon Intergovernmental Council
COIC - Nelson\Nygaard Consulting Associates Inc. – DKS Associates | 6-2
5. Assessment of In-Community (First Intersection) Tradeoffs. This scenario was
added to the initial set of analysis scenarios to test the effect of transportation
investments on conditions downstream, i.e., closer to the center of the community, of the
“first intersection” in a corridor. This approach captures the impacts/benefits of
transportation investments on traffic operations and the need for roadway projects
at/near the current first intersection. The project team focused this analysis on the
Redmond-Bend corridor, including the Cooley Road and Robal Road intersections on the
north side of Bend and the Odem Medo Road and Veterans Way intersections on the
south side of Redmond. These analysis locations were selected due to their relatively high
V/C ratios and the potential for transportation option investments to have a measurable
impact in terms of reduced travel demand. The availability of existing localized traffic
data/analysis was also a factor in determining which of the TSP-identified intersection
projects could be incorporated into the analysis.
6. Pricing. The final scenario evaluates the system-wide impacts of pricing roadway travel.
Given that there is no appreciable congestion by 2030 within any of the intercity travel
corridors, this scenario analyzed a pricing strategy based on a posited vehicle miles
traveled (VMT) tax contemplated for statewide implementation to replace the gas tax.
Two levels are considered to test sensitivity to the level of such a tax, both the gas tax
replacement level evaluated by the state in 2007 and a level four times as high, and
applied to baseline transit service levels and those in the high transit scenario.
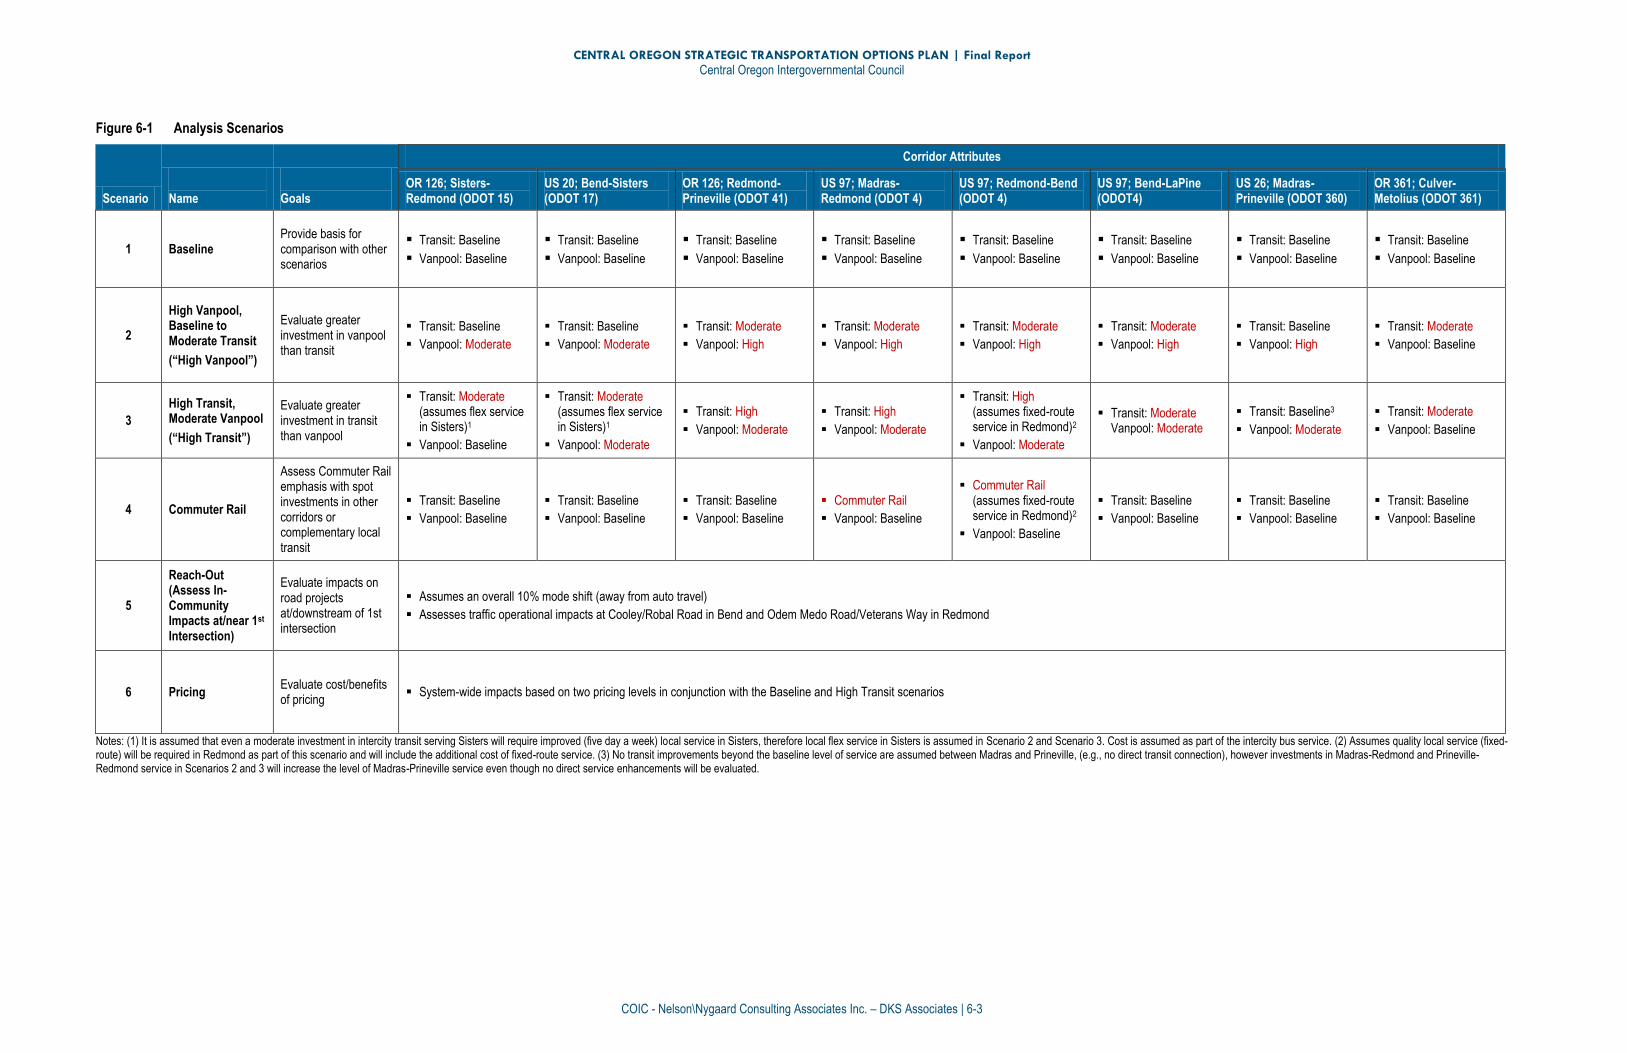
CENTRAL OREGON STRATEGIC TRANSPORTATION OPTIONS PLAN | Final Report
Central Oregon Intergovernmental Council
COIC - Nelson\Nygaard Consulting Associates Inc. – DKS Associates | 6-3
Figure 6-1 Analysis Scenarios
Scenario
Name
Goals
Corridor Attributes
OR 126; Sisters-Redmond (ODOT 15)
US 20; Bend-Sisters (ODOT 17)
OR 126; Redmond-Prineville (ODOT 41)
US 97; Madras-Redmond (ODOT 4)
US 97; Redmond-Bend (ODOT 4)
US 97; Bend-LaPine (ODOT4)
US 26; Madras-Prineville (ODOT 360)
OR 361; Culver-Metolius (ODOT 361)
1 Baseline Provide basis for comparison with other scenarios
Transit: Baseline
Vanpool: Baseline
Transit: Baseline
Vanpool: Baseline
Transit: Baseline
Vanpool: Baseline
Transit: Baseline
Vanpool: Baseline
Transit: Baseline
Vanpool: Baseline
Transit: Baseline
Vanpool: Baseline
Transit: Baseline
Vanpool: Baseline
Transit: Baseline
Vanpool: Baseline
2
High Vanpool, Baseline to Moderate Transit
(“High Vanpool”)
Evaluate greater investment in vanpool than transit
Transit: Baseline
Vanpool: Moderate
Transit: Baseline
Vanpool: Moderate
Transit: Moderate
Vanpool: High
Transit: Moderate
Vanpool: High
Transit: Moderate
Vanpool: High
Transit: Moderate
Vanpool: High
Transit: Baseline
Vanpool: High
Transit: Moderate
Vanpool: Baseline
3
High Transit, Moderate Vanpool
(“High Transit”)
Evaluate greater investment in transit than vanpool
Transit: Moderate (assumes flex service in Sisters)1
Vanpool: Baseline
Transit: Moderate (assumes flex service in Sisters)1
Vanpool: Moderate
Transit: High
Vanpool: Moderate
Transit: High
Vanpool: Moderate
Transit: High (assumes fixed-route service in Redmond)2
Vanpool: Moderate
Transit: Moderate Vanpool: Moderate
Transit: Baseline3
Vanpool: Moderate
Transit: Moderate
Vanpool: Baseline
4 Commuter Rail
Assess Commuter Rail emphasis with spot investments in other corridors or complementary local transit
Transit: Baseline
Vanpool: Baseline
Transit: Baseline
Vanpool: Baseline
Transit: Baseline
Vanpool: Baseline
Commuter Rail
Vanpool: Baseline
Commuter Rail (assumes fixed-route service in Redmond)2
Vanpool: Baseline
Transit: Baseline
Vanpool: Baseline
Transit: Baseline
Vanpool: Baseline
Transit: Baseline
Vanpool: Baseline
5
Reach-Out (Assess In-Community Impacts at/near 1st Intersection)
Evaluate impacts on road projects at/downstream of 1st intersection
Assumes an overall 10% mode shift (away from auto travel)
Assesses traffic operational impacts at Cooley/Robal Road in Bend and Odem Medo Road/Veterans Way in Redmond
6 Pricing Evaluate cost/benefits of pricing
System-wide impacts based on two pricing levels in conjunction with the Baseline and High Transit scenarios
Notes: (1) It is assumed that even a moderate investment in intercity transit serving Sisters will require improved (five day a week) local service in Sisters, therefore local flex service in Sisters is assumed in Scenario 2 and Scenario 3. Cost is assumed as part of the intercity bus service. (2) Assumes quality local service (fixed-route) will be required in Redmond as part of this scenario and will include the additional cost of fixed-route service. (3) No transit improvements beyond the baseline level of service are assumed between Madras and Prineville, (e.g., no direct transit connection), however investments in Madras-Redmond and Prineville-Redmond service in Scenarios 2 and 3 will increase the level of Madras-Prineville service even though no direct service enhancements will be evaluated.

CENTRAL OREGON STRATEGIC TRANSPORTATION OPTIONS PLAN | Final Report
Central Oregon Intergovernmental Council
COIC - Nelson\Nygaard Consulting Associates Inc. – DKS Associates | 6-4
SCENARIO DEFINITION AND ASSUMPTIONS
This section provides additional detail on each scenario and identifies scenario-specific
assumptions (the general effectiveness and applicability of different strategies are discussed in
Chapter 2 and general methodology is described in Chapter 3).
1. Baseline
The Baseline scenario is intended to provide a basis for comparing subsequent scenarios to 2030
travel demand (see Chapter 4) assuming existing vanpool programs and transit services, with no
changes to the current levels of investment. Figure 6-2 illustrates baseline transit conditions (as of
August 2012), based on current CET service levels. Existing vanpools in the region are limited and
data about them is inconsistent, therefore for purpose of comparison the baseline assumes no
existing vanpools.
Figure 6-2 Baseline Transit Services
Legend: MI = One-way corridor distance in miles VP R/T = Vanpool daily round trips (in addition to existing) BUS R/T = Transit daily round trips (total) SVC SPAN = Service span (number of service hours that transit service
operates)
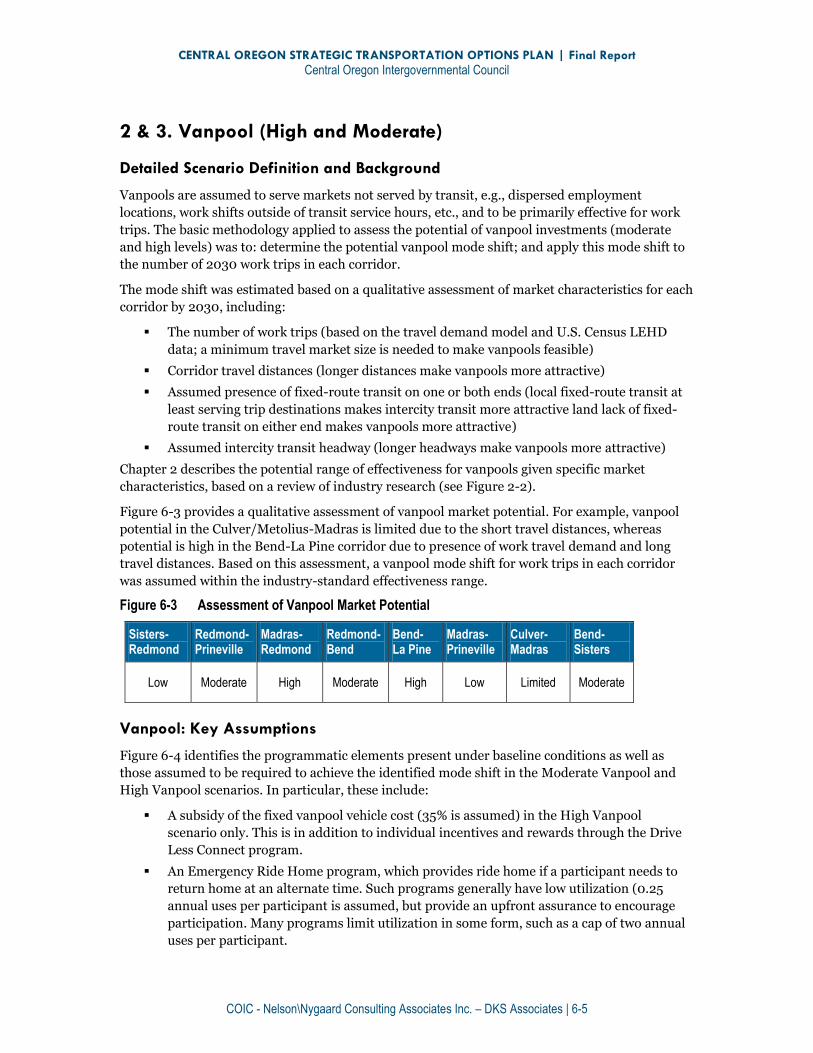
CENTRAL OREGON STRATEGIC TRANSPORTATION OPTIONS PLAN | Final Report
Central Oregon Intergovernmental Council
COIC - Nelson\Nygaard Consulting Associates Inc. – DKS Associates | 6-5
2 & 3. Vanpool (High and Moderate)
Detailed Scenario Definition and Background
Vanpools are assumed to serve markets not served by transit, e.g., dispersed employment
locations, work shifts outside of transit service hours, etc., and to be primarily effective for work
trips. The basic methodology applied to assess the potential of vanpool investments (moderate
and high levels) was to: determine the potential vanpool mode shift; and apply this mode shift to
the number of 2030 work trips in each corridor.
The mode shift was estimated based on a qualitative assessment of market characteristics for each
corridor by 2030, including:
The number of work trips (based on the travel demand model and U.S. Census LEHD
data; a minimum travel market size is needed to make vanpools feasible)
Corridor travel distances (longer distances make vanpools more attractive)
Assumed presence of fixed-route transit on one or both ends (local fixed-route transit at
least serving trip destinations makes intercity transit more attractive land lack of fixed-
route transit on either end makes vanpools more attractive)
Assumed intercity transit headway (longer headways make vanpools more attractive)
Chapter 2 describes the potential range of effectiveness for vanpools given specific market
characteristics, based on a review of industry research (see Figure 2-2).
Figure 6-3 provides a qualitative assessment of vanpool market potential. For example, vanpool
potential in the Culver/Metolius-Madras is limited due to the short travel distances, whereas
potential is high in the Bend-La Pine corridor due to presence of work travel demand and long
travel distances. Based on this assessment, a vanpool mode shift for work trips in each corridor
was assumed within the industry-standard effectiveness range.
Figure 6-3 Assessment of Vanpool Market Potential
Sisters-Redmond
Redmond-Prineville
Madras-Redmond
Redmond-Bend
Bend- La Pine
Madras-Prineville
Culver- Madras
Bend-Sisters
Low Moderate High Moderate High Low Limited Moderate
Vanpool: Key Assumptions
Figure 6-4 identifies the programmatic elements present under baseline conditions as well as
those assumed to be required to achieve the identified mode shift in the Moderate Vanpool and
High Vanpool scenarios. In particular, these include:
A subsidy of the fixed vanpool vehicle cost (35% is assumed) in the High Vanpool
scenario only. This is in addition to individual incentives and rewards through the Drive
Less Connect program.
An Emergency Ride Home program, which provides ride home if a participant needs to
return home at an alternate time. Such programs generally have low utilization (0.25
annual uses per participant is assumed, but provide an upfront assurance to encourage
participation. Many programs limit utilization in some form, such as a cap of two annual
uses per participant.
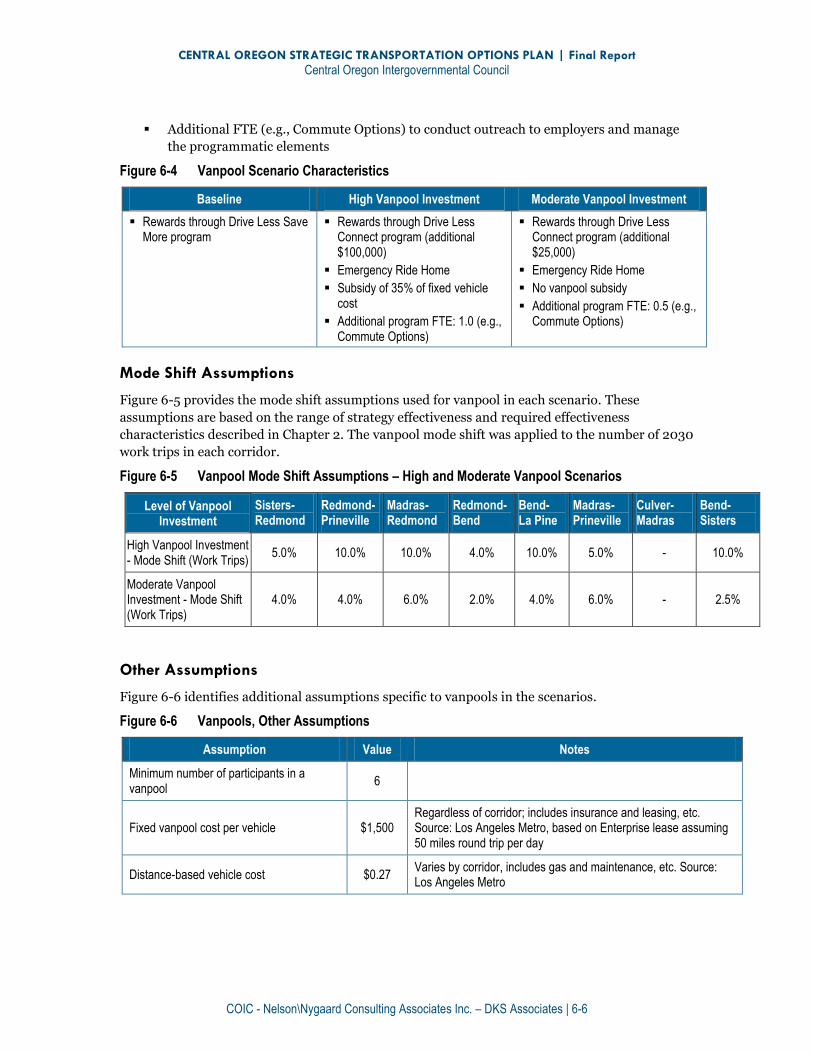
CENTRAL OREGON STRATEGIC TRANSPORTATION OPTIONS PLAN | Final Report
Central Oregon Intergovernmental Council
COIC - Nelson\Nygaard Consulting Associates Inc. – DKS Associates | 6-6
Additional FTE (e.g., Commute Options) to conduct outreach to employers and manage
the programmatic elements
Figure 6-4 Vanpool Scenario Characteristics
Baseline High Vanpool Investment Moderate Vanpool Investment
Rewards through Drive Less Save More program
Rewards through Drive Less Connect program (additional $100,000)
Emergency Ride Home
Subsidy of 35% of fixed vehicle cost
Additional program FTE: 1.0 (e.g., Commute Options)
Rewards through Drive Less Connect program (additional $25,000)
Emergency Ride Home
No vanpool subsidy
Additional program FTE: 0.5 (e.g., Commute Options)
Mode Shift Assumptions
Figure 6-5 provides the mode shift assumptions used for vanpool in each scenario. These
assumptions are based on the range of strategy effectiveness and required effectiveness
characteristics described in Chapter 2. The vanpool mode shift was applied to the number of 2030
work trips in each corridor.
Figure 6-5 Vanpool Mode Shift Assumptions – High and Moderate Vanpool Scenarios
Level of Vanpool Investment
Sisters-Redmond
Redmond-Prineville
Madras-Redmond
Redmond-Bend
Bend- La Pine
Madras-Prineville
Culver- Madras
Bend-Sisters
High Vanpool Investment - Mode Shift (Work Trips)
5.0% 10.0% 10.0% 4.0% 10.0% 5.0% - 10.0%
Moderate Vanpool Investment - Mode Shift (Work Trips)
4.0% 4.0% 6.0% 2.0% 4.0% 6.0% - 2.5%
Other Assumptions
Figure 6-6 identifies additional assumptions specific to vanpools in the scenarios.
Figure 6-6 Vanpools, Other Assumptions
Assumption Value Notes
Minimum number of participants in a vanpool
6
Fixed vanpool cost per vehicle $1,500 Regardless of corridor; includes insurance and leasing, etc. Source: Los Angeles Metro, based on Enterprise lease assuming 50 miles round trip per day
Distance-based vehicle cost $0.27 Varies by corridor, includes gas and maintenance, etc. Source: Los Angeles Metro
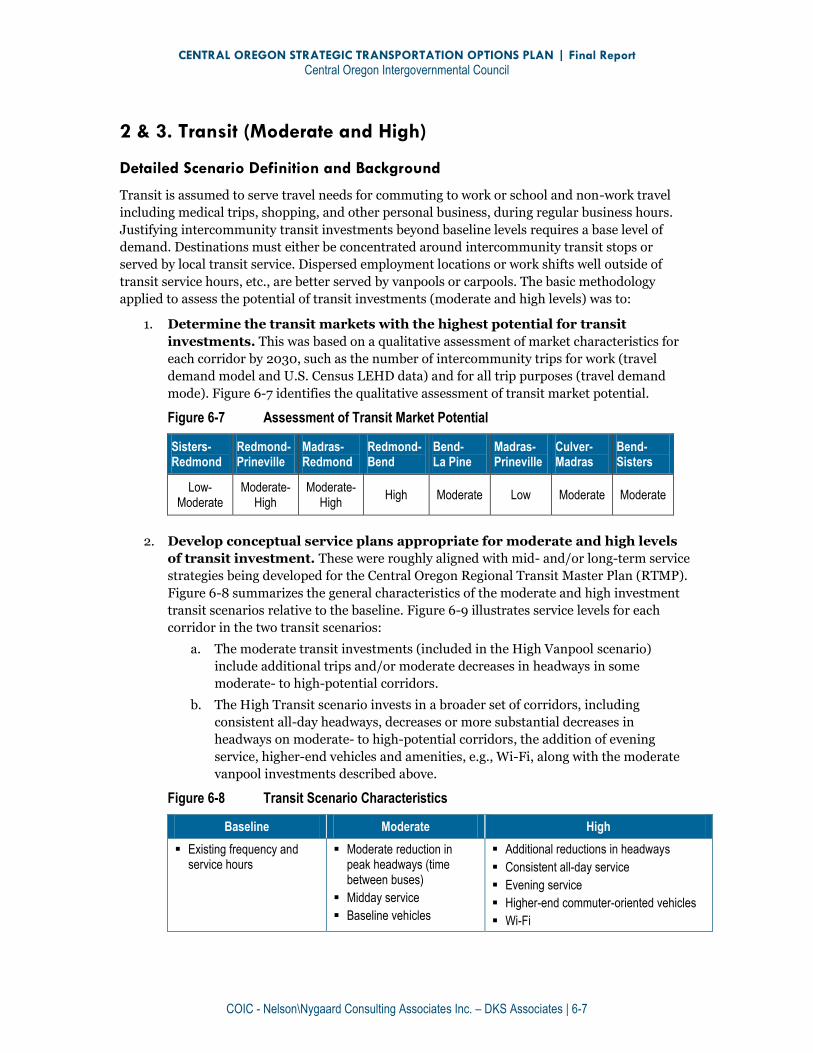
CENTRAL OREGON STRATEGIC TRANSPORTATION OPTIONS PLAN | Final Report
Central Oregon Intergovernmental Council
COIC - Nelson\Nygaard Consulting Associates Inc. – DKS Associates | 6-7
2 & 3. Transit (Moderate and High)
Detailed Scenario Definition and Background
Transit is assumed to serve travel needs for commuting to work or school and non-work travel
including medical trips, shopping, and other personal business, during regular business hours.
Justifying intercommunity transit investments beyond baseline levels requires a base level of
demand. Destinations must either be concentrated around intercommunity transit stops or
served by local transit service. Dispersed employment locations or work shifts well outside of
transit service hours, etc., are better served by vanpools or carpools. The basic methodology
applied to assess the potential of transit investments (moderate and high levels) was to:
1. Determine the transit markets with the highest potential for transit
investments. This was based on a qualitative assessment of market characteristics for
each corridor by 2030, such as the number of intercommunity trips for work (travel
demand model and U.S. Census LEHD data) and for all trip purposes (travel demand
mode). Figure 6-7 identifies the qualitative assessment of transit market potential.
Figure 6-7 Assessment of Transit Market Potential
Sisters-Redmond
Redmond-Prineville
Madras-Redmond
Redmond-Bend
Bend- La Pine
Madras-Prineville
Culver-Madras
Bend-Sisters
Low-Moderate
Moderate-High
Moderate-High
High Moderate Low Moderate Moderate
2. Develop conceptual service plans appropriate for moderate and high levels
of transit investment. These were roughly aligned with mid- and/or long-term service
strategies being developed for the Central Oregon Regional Transit Master Plan (RTMP).
Figure 6-8 summarizes the general characteristics of the moderate and high investment
transit scenarios relative to the baseline. Figure 6-9 illustrates service levels for each
corridor in the two transit scenarios:
a. The moderate transit investments (included in the High Vanpool scenario)
include additional trips and/or moderate decreases in headways in some
moderate- to high-potential corridors.
b. The High Transit scenario invests in a broader set of corridors, including
consistent all-day headways, decreases or more substantial decreases in
headways on moderate- to high-potential corridors, the addition of evening
service, higher-end vehicles and amenities, e.g., Wi-Fi, along with the moderate
vanpool investments described above.
Figure 6-8 Transit Scenario Characteristics
Baseline Moderate High
Existing frequency and service hours
Moderate reduction in peak headways (time between buses)
Midday service
Baseline vehicles
Additional reductions in headways
Consistent all-day service
Evening service
Higher-end commuter-oriented vehicles
Wi-Fi

CENTRAL OREGON STRATEGIC TRANSPORTATION OPTIONS PLAN | Final Report
Central Oregon Intergovernmental Council
COIC - Nelson\Nygaard Consulting Associates Inc. – DKS Associates | 6-8
Figure 6-9 “Moderate” and “High” Transit Scenario Service Levels
“Moderate” Transit Scenario Service Levels
“High” Transit Scenario Service Levels
Legend: MI = One-way corridor distance in miles VP R/T = Vanpool daily round trips (in addition to existing) BUS R/T = Transit daily round trips (total) SVC SPAN = Service span (number of service hours that
transit service operates)
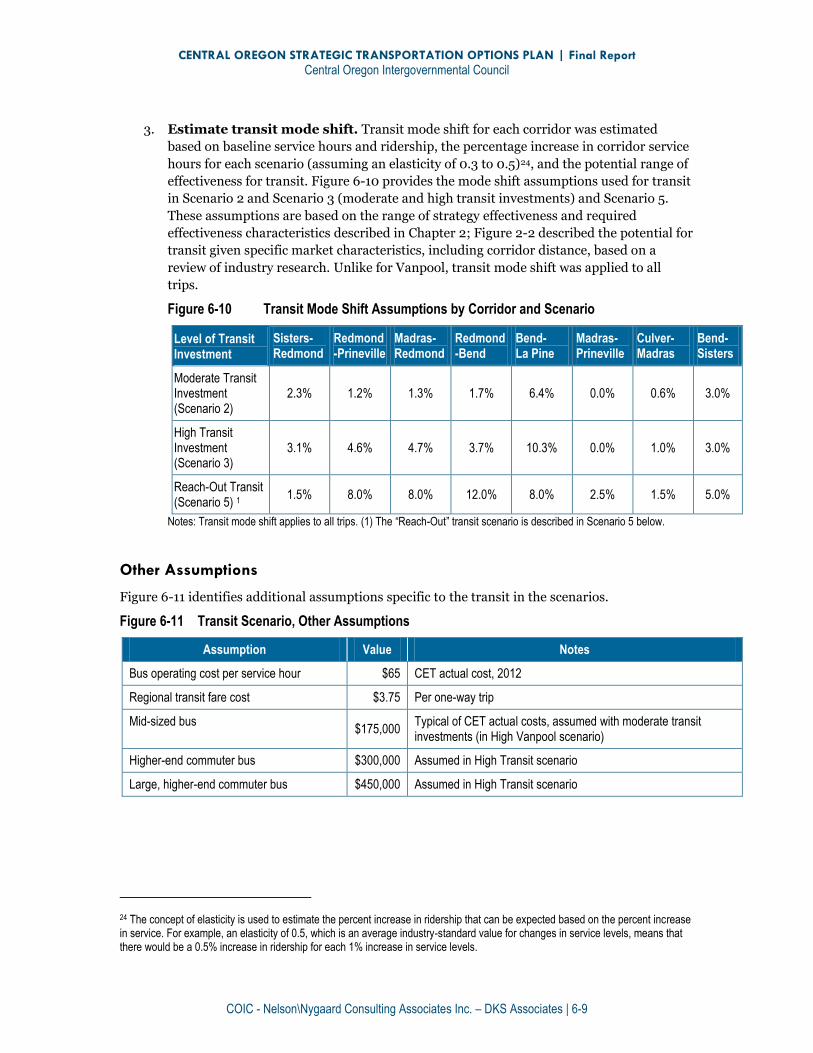
CENTRAL OREGON STRATEGIC TRANSPORTATION OPTIONS PLAN | Final Report
Central Oregon Intergovernmental Council
COIC - Nelson\Nygaard Consulting Associates Inc. – DKS Associates | 6-9
3. Estimate transit mode shift. Transit mode shift for each corridor was estimated
based on baseline service hours and ridership, the percentage increase in corridor service
hours for each scenario (assuming an elasticity of 0.3 to 0.5)24, and the potential range of
effectiveness for transit. Figure 6-10 provides the mode shift assumptions used for transit
in Scenario 2 and Scenario 3 (moderate and high transit investments) and Scenario 5.
These assumptions are based on the range of strategy effectiveness and required
effectiveness characteristics described in Chapter 2; Figure 2-2 described the potential for
transit given specific market characteristics, including corridor distance, based on a
review of industry research. Unlike for Vanpool, transit mode shift was applied to all
trips.
Figure 6-10 Transit Mode Shift Assumptions by Corridor and Scenario
Level of Transit Investment
Sisters-Redmond
Redmond-Prineville
Madras-Redmond
Redmond-Bend
Bend- La Pine
Madras-Prineville
Culver-Madras
Bend-Sisters
Moderate Transit Investment (Scenario 2)
2.3% 1.2% 1.3% 1.7% 6.4% 0.0% 0.6% 3.0%
High Transit Investment (Scenario 3)
3.1% 4.6% 4.7% 3.7% 10.3% 0.0% 1.0% 3.0%
Reach-Out Transit (Scenario 5) 1
1.5% 8.0% 8.0% 12.0% 8.0% 2.5% 1.5% 5.0%
Notes: Transit mode shift applies to all trips. (1) The “Reach-Out” transit scenario is described in Scenario 5 below.
Other Assumptions
Figure 6-11 identifies additional assumptions specific to the transit in the scenarios.
Figure 6-11 Transit Scenario, Other Assumptions
Assumption Value Notes
Bus operating cost per service hour $65 CET actual cost, 2012
Regional transit fare cost $3.75 Per one-way trip
Mid-sized bus $175,000
Typical of CET actual costs, assumed with moderate transit investments (in High Vanpool scenario)
Higher-end commuter bus $300,000 Assumed in High Transit scenario
Large, higher-end commuter bus $450,000 Assumed in High Transit scenario
24 The concept of elasticity is used to estimate the percent increase in ridership that can be expected based on the percent increase in service. For example, an elasticity of 0.5, which is an average industry-standard value for changes in service levels, means that there would be a 0.5% increase in ridership for each 1% increase in service levels.
CENTRAL OREGON STRATEGIC TRANSPORTATION OPTIONS PLAN | Final Report
Central Oregon Intergovernmental Council
COIC - Nelson\Nygaard Consulting Associates Inc. – DKS Associates | 6-10
4. Commuter Rail
Detailed Scenario Definition and Background
The Oregon Rail Plan (2001) provides the following assessment of rail service on the BNSF north-
south mainline through Central Oregon, which includes La Pine to Bend:
The BNSF north-south rail route from Chemult through Bend to the
Columbia River constitutes an important freight movement resource
through central Oregon. It has accommodated passenger trains when it was
necessary to detour the Coast Starlight from its regular route. The line
occasionally is used for special passenger excursion operations. However,
the light population density along the line and its slow, circuitous route
through the Deschutes River Canyon render it infeasible for regular
intercity service. Central Oregon communities are probably better served by
more direct bus and air transportation between the Willamette Valley and
Central Oregon.
This analysis nevertheless assesses the benefits of commuter rail investment in the potential
commuter rail markets along the BNSF mainline through Central Oregon (see Figure 6-12). The
following potential commuter rail corridors were considered: Madras-Redmond, Redmond-Bend,
and Bend-La Pine—and the City of Prineville Railway (COPR), a spur line between Redmond-
Prineville, connecting to the BNSF mainline at Prineville Junction.25 However, it should be
emphasized that it is not a study of the operational feasibility of passenger rail or the ability to
integrate passenger rail operations with existing freight operations and the capital cost estimates
provided are highly conceptual.
The following criteria for passenger rail service, defined in the Oregon Rail Plan (2001), were used
to identify the corridors for consideration in the scenarios.26 (An initial analysis of the defined
COTOP scenario against these criteria is provided at the end of the Commuter Rail section of this
chapter.)
Patronage. Minimum average occupancy of about 75 passengers per train. Occupancy
might be lower at the extreme end of a run, but average occupancy should justify the
operation of a train with at least 180 seats (typically a three-car train).
Cost Recovery. Typical train operating costs are about $26 per mile. A new rail service
should be expected to attain a 30-40% farebox recovery ratio.
Running Time. Rail service has to be reasonably competitive with auto driving times to
be successful, i.e., a trip on Highway 97 in this case.
The following two segments were included in the scenario:
Redmond-Bend: The Redmond-Bend segment has the strongest travel demand and
would likely be the minimal operable segment (MOS) of any future potential commuter
rail investment.
Madras-Redmond: While more marginal in terms of travel demand, a Madras-
Redmond segment is also included as it would serve travel demand from Madras-
25 See ODOT, Oregon Rail Study, July 2010. Figure 3.11A/B (Pages 46-47) for a description of the COPR.
26 ODOT, Oregon Rail Plan, 2001. See Chapter 3: Passenger Element, p. 97.
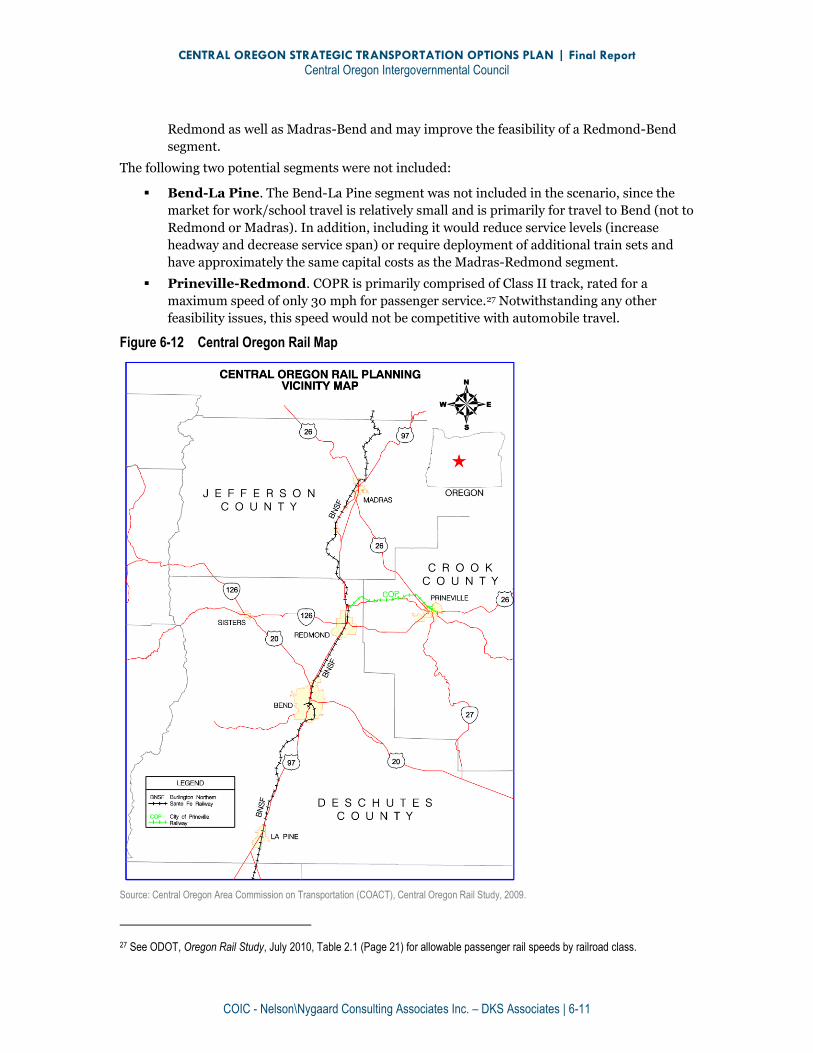
CENTRAL OREGON STRATEGIC TRANSPORTATION OPTIONS PLAN | Final Report
Central Oregon Intergovernmental Council
COIC - Nelson\Nygaard Consulting Associates Inc. – DKS Associates | 6-11
Redmond as well as Madras-Bend and may improve the feasibility of a Redmond-Bend
segment.
The following two potential segments were not included:
Bend-La Pine. The Bend-La Pine segment was not included in the scenario, since the
market for work/school travel is relatively small and is primarily for travel to Bend (not to
Redmond or Madras). In addition, including it would reduce service levels (increase
headway and decrease service span) or require deployment of additional train sets and
have approximately the same capital costs as the Madras-Redmond segment.
Prineville-Redmond. COPR is primarily comprised of Class II track, rated for a
maximum speed of only 30 mph for passenger service.27 Notwithstanding any other
feasibility issues, this speed would not be competitive with automobile travel.
Figure 6-12 Central Oregon Rail Map
Source: Central Oregon Area Commission on Transportation (COACT), Central Oregon Rail Study, 2009.
27 See ODOT, Oregon Rail Study, July 2010, Table 2.1 (Page 21) for allowable passenger rail speeds by railroad class.

CENTRAL OREGON STRATEGIC TRANSPORTATION OPTIONS PLAN | Final Report
Central Oregon Intergovernmental Council
COIC - Nelson\Nygaard Consulting Associates Inc. – DKS Associates | 6-12
Key Assumptions
Operating Assumptions
The analysis includes the following operating assumptions specific to Commuter Rail.
A conceptual operating plan for commuter rail between Madras and Bend assumes peak
headways of 80 minutes and off-peak headways of 160 minutes over a service span of 12
hours per day (20 revenue hours). This requires two train sets for peak service and one
off-peak, plus one spare (3 total).
In the Madras-Redmond segment, four stops are assumed in addition to the northern
terminus in the central part of Madras: Metolius, Culver, Terrebonne, and Redmond
In the Redmond-Bend segment, two stops are assumed between the central Redmond
stop and the southern terminus in the central part Bend: south part of Redmond and
north part of Bend.
An average operating speed of 45 miles per hour is assumed. Class I railroads, such as
BNSF, have mainline track that meet Class 3 or 4 track standards, supporting passenger
train speeds of up to 60 to 80 miles per hour. However, grades and curves reduce train
speeds and commuter rail lines must decelerate and accelerate at stop locations. An
average dwell time of 2 minutes is assumed at each stop, including acceleration and
deceleration. This could potentially be reduced to as little as 60-75 seconds.
As identified in Chapter 2, the operating costs for commuter rail operations are highly
variable. An approximately middle-of-the-road average operating cost of $833 per hour
was assumed, based on TriMet’s WES service in the Portland region. Appendix A (See
Figure 6) provides data additional commuter rail services.
Capital Assumptions
It should be emphasized that capital costs are highly conceptual. They do not represent a detailed
analysis of each corridor but rather are intended to quantify order-of-magnitude costs and
benefits for the purpose of comparison with other transportation investments.
Capital costs were estimated using unit costs from other studies. Figure 6-14 provides a
breakdown of capital cost assumptions. Unit costs are primarily based on a study of the
Wilsonville to Salem corridor included in the Oregon Rail Study (2010). The general approach
drawn from the Wilsonville-Salem corridor is to replace/upgrade track and ties, allowing
increased speeds, and provide sidings and passing tracks for bidirectional operation and
interoperability of freight and passenger rail operations. Crossing upgrade costs are based on the
Central Oregon Rail Study (2009); these represent a substantial portion of the cost. Owing in
large measure to these costs, the overall per-mile cost of $15.8 million exceeds the Wilsonville-
Salem corridor estimate of $11.3 to $13.3 million per mile.
Mode Shift Assumptions
Mode shift of 10% of intercommunity trips from Madras-Redmond and 5% of intercommunity
from Redmond-Bend is assumed. These assumptions are based on the range of strategy
effectiveness and required effectiveness characteristics described in Chapter 2.
Figure 6 in Appendix A provides data for several additional commuter rail services (page A-1).
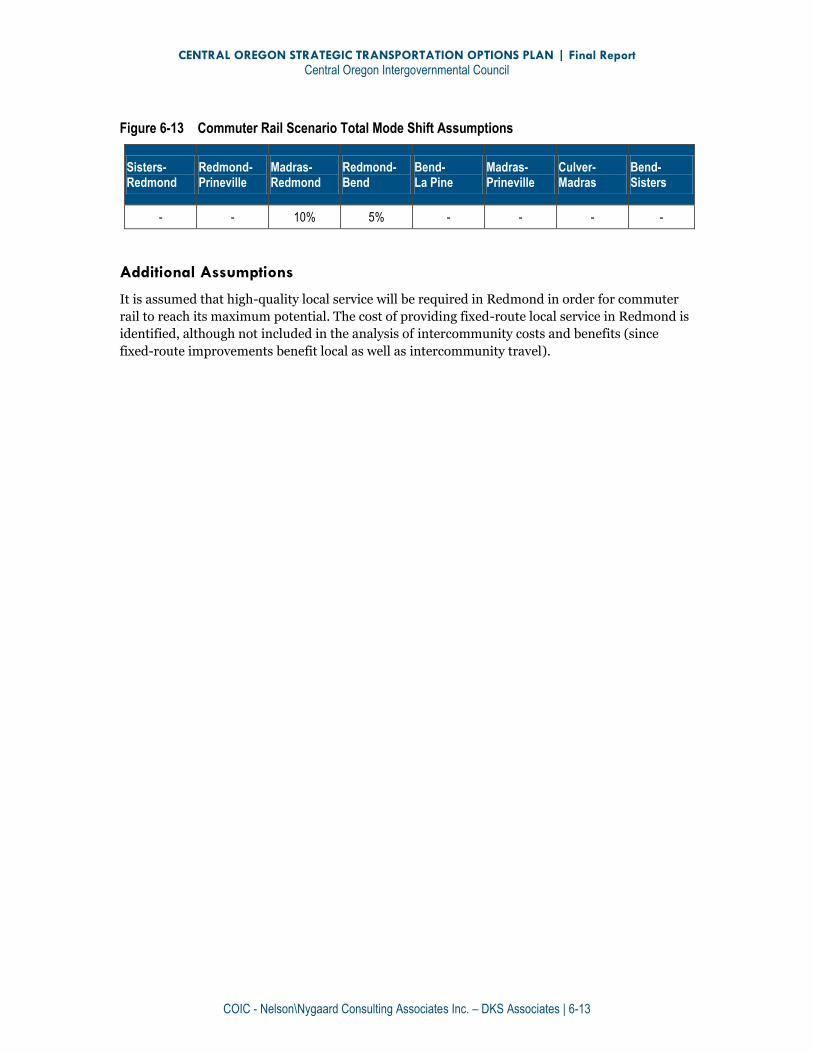
CENTRAL OREGON STRATEGIC TRANSPORTATION OPTIONS PLAN | Final Report
Central Oregon Intergovernmental Council
COIC - Nelson\Nygaard Consulting Associates Inc. – DKS Associates | 6-13
Figure 6-13 Commuter Rail Scenario Total Mode Shift Assumptions
Sisters-Redmond
Redmond-Prineville
Madras-Redmond
Redmond-Bend
Bend- La Pine
Madras-Prineville
Culver-Madras
Bend-Sisters
- - 10% 5% - - - -
Additional Assumptions
It is assumed that high-quality local service will be required in Redmond in order for commuter
rail to reach its maximum potential. The cost of providing fixed-route local service in Redmond is
identified, although not included in the analysis of intercommunity costs and benefits (since
fixed-route improvements benefit local as well as intercommunity travel).
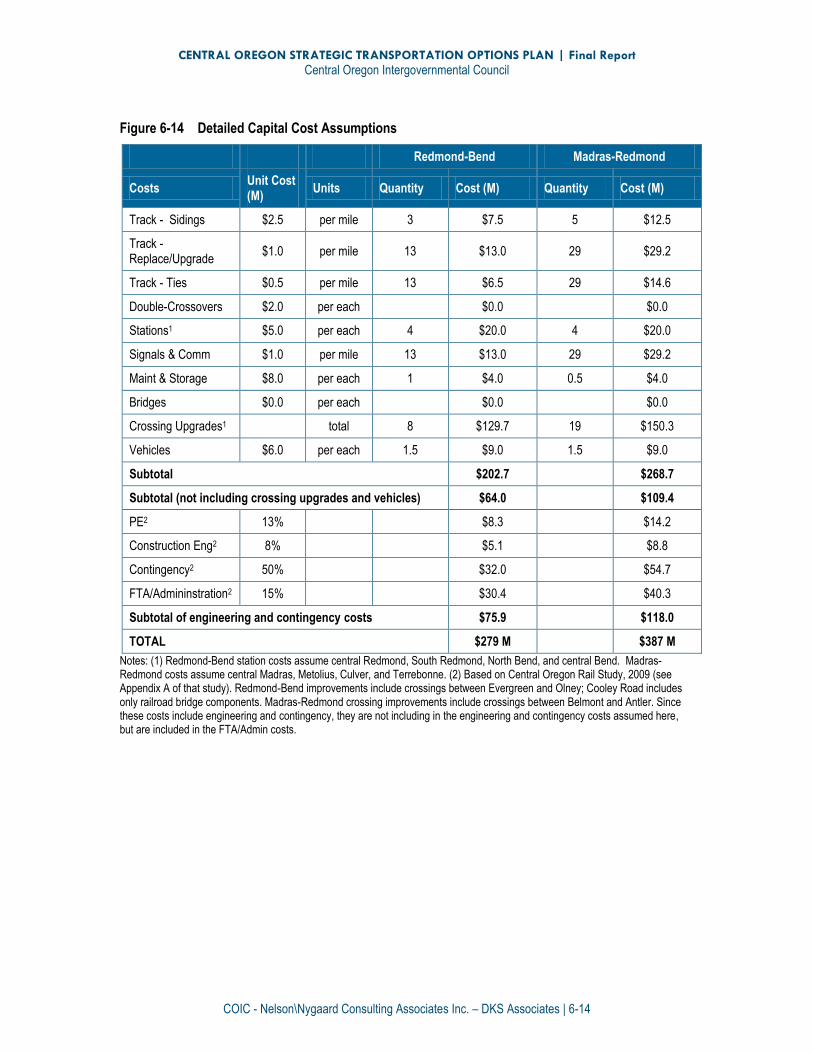
CENTRAL OREGON STRATEGIC TRANSPORTATION OPTIONS PLAN | Final Report
Central Oregon Intergovernmental Council
COIC - Nelson\Nygaard Consulting Associates Inc. – DKS Associates | 6-14
Figure 6-14 Detailed Capital Cost Assumptions
Redmond-Bend Madras-Redmond
Costs Unit Cost (M)
Units Quantity Cost (M) Quantity Cost (M)
Track - Sidings $2.5 per mile 3 $7.5 5 $12.5
Track - Replace/Upgrade
$1.0 per mile 13 $13.0 29 $29.2
Track - Ties $0.5 per mile 13 $6.5 29 $14.6
Double-Crossovers $2.0 per each $0.0 $0.0
Stations1 $5.0 per each 4 $20.0 4 $20.0
Signals & Comm $1.0 per mile 13 $13.0 29 $29.2
Maint & Storage $8.0 per each 1 $4.0 0.5 $4.0
Bridges $0.0 per each $0.0 $0.0
Crossing Upgrades1 total 8 $129.7 19 $150.3
Vehicles $6.0 per each 1.5 $9.0 1.5 $9.0
Subtotal $202.7 $268.7
Subtotal (not including crossing upgrades and vehicles) $64.0 $109.4
PE2 13% $8.3 $14.2
Construction Eng2 8% $5.1 $8.8
Contingency2 50% $32.0 $54.7
FTA/Admininstration2 15% $30.4 $40.3
Subtotal of engineering and contingency costs $75.9 $118.0
TOTAL $279 M $387 M
Notes: (1) Redmond-Bend station costs assume central Redmond, South Redmond, North Bend, and central Bend. Madras-Redmond costs assume central Madras, Metolius, Culver, and Terrebonne. (2) Based on Central Oregon Rail Study, 2009 (see Appendix A of that study). Redmond-Bend improvements include crossings between Evergreen and Olney; Cooley Road includes only railroad bridge components. Madras-Redmond crossing improvements include crossings between Belmont and Antler. Since these costs include engineering and contingency, they are not including in the engineering and contingency costs assumed here, but are included in the FTA/Admin costs.
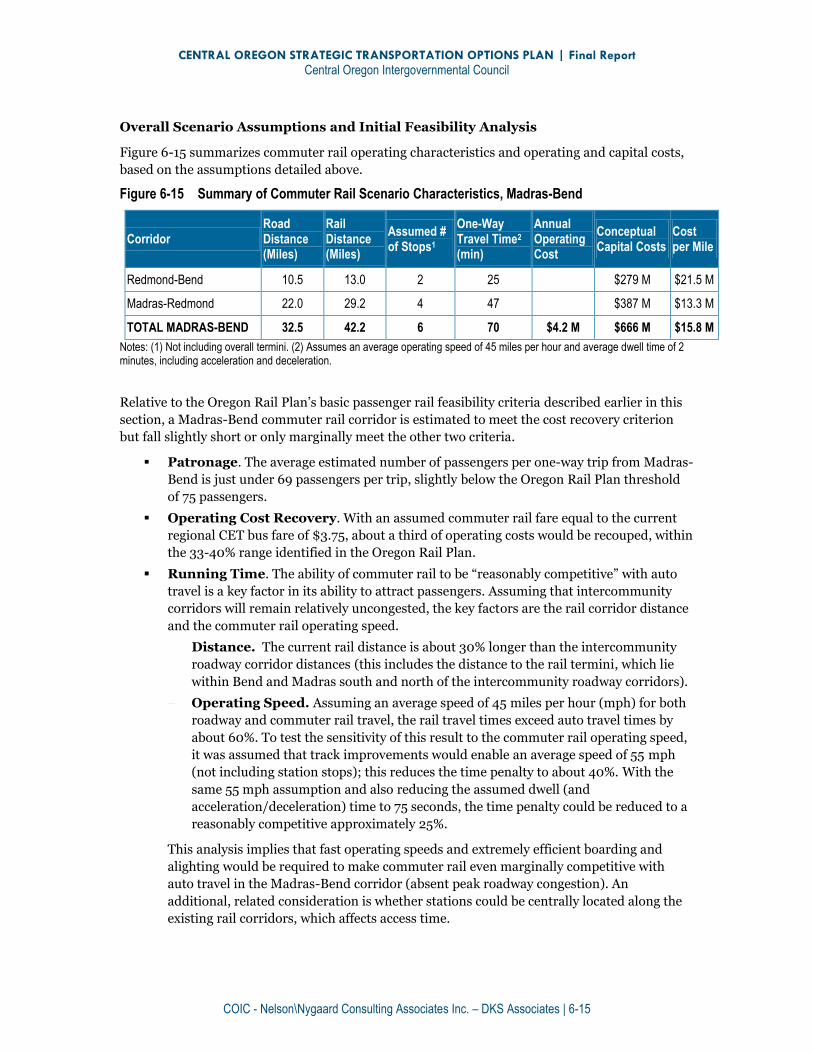
CENTRAL OREGON STRATEGIC TRANSPORTATION OPTIONS PLAN | Final Report
Central Oregon Intergovernmental Council
COIC - Nelson\Nygaard Consulting Associates Inc. – DKS Associates | 6-15
Overall Scenario Assumptions and Initial Feasibility Analysis
Figure 6-15 summarizes commuter rail operating characteristics and operating and capital costs,
based on the assumptions detailed above.
Figure 6-15 Summary of Commuter Rail Scenario Characteristics, Madras-Bend
Corridor Road Distance (Miles)
Rail Distance (Miles)
Assumed # of Stops1
One-Way Travel Time2 (min)
Annual Operating Cost
Conceptual Capital Costs
Cost per Mile
Redmond-Bend 10.5 13.0 2 25 $279 M $21.5 M
Madras-Redmond 22.0 29.2 4 47 $387 M $13.3 M
TOTAL MADRAS-BEND 32.5 42.2 6 70 $4.2 M $666 M $15.8 M
Notes: (1) Not including overall termini. (2) Assumes an average operating speed of 45 miles per hour and average dwell time of 2 minutes, including acceleration and deceleration.
Relative to the Oregon Rail Plan’s basic passenger rail feasibility criteria described earlier in this
section, a Madras-Bend commuter rail corridor is estimated to meet the cost recovery criterion
but fall slightly short or only marginally meet the other two criteria.
Patronage. The average estimated number of passengers per one-way trip from Madras-
Bend is just under 69 passengers per trip, slightly below the Oregon Rail Plan threshold
of 75 passengers.
Operating Cost Recovery. With an assumed commuter rail fare equal to the current
regional CET bus fare of $3.75, about a third of operating costs would be recouped, within
the 33-40% range identified in the Oregon Rail Plan.
Running Time. The ability of commuter rail to be “reasonably competitive” with auto
travel is a key factor in its ability to attract passengers. Assuming that intercommunity
corridors will remain relatively uncongested, the key factors are the rail corridor distance
and the commuter rail operating speed.
Distance. The current rail distance is about 30% longer than the intercommunity
roadway corridor distances (this includes the distance to the rail termini, which lie
within Bend and Madras south and north of the intercommunity roadway corridors).
Operating Speed. Assuming an average speed of 45 miles per hour (mph) for both
roadway and commuter rail travel, the rail travel times exceed auto travel times by
about 60%. To test the sensitivity of this result to the commuter rail operating speed,
it was assumed that track improvements would enable an average speed of 55 mph
(not including station stops); this reduces the time penalty to about 40%. With the
same 55 mph assumption and also reducing the assumed dwell (and
acceleration/deceleration) time to 75 seconds, the time penalty could be reduced to a
reasonably competitive approximately 25%.
This analysis implies that fast operating speeds and extremely efficient boarding and
alighting would be required to make commuter rail even marginally competitive with
auto travel in the Madras-Bend corridor (absent peak roadway congestion). An
additional, related consideration is whether stations could be centrally located along the
existing rail corridors, which affects access time.
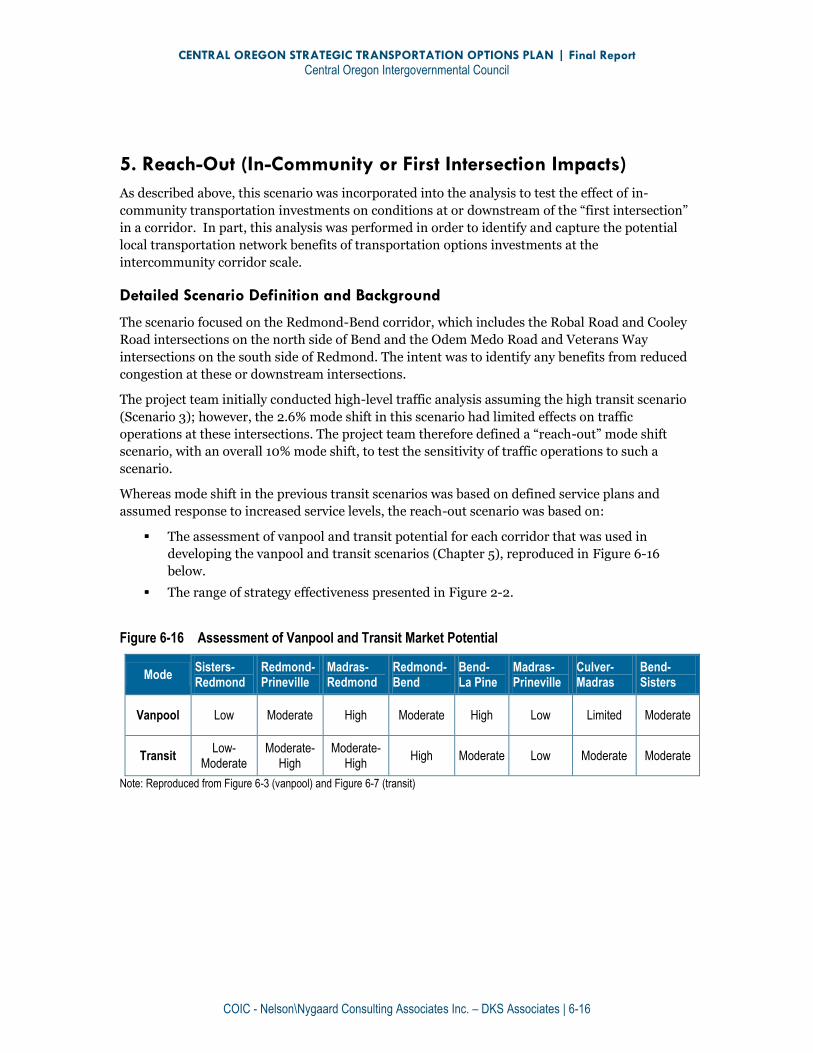
CENTRAL OREGON STRATEGIC TRANSPORTATION OPTIONS PLAN | Final Report
Central Oregon Intergovernmental Council
COIC - Nelson\Nygaard Consulting Associates Inc. – DKS Associates | 6-16
5. Reach-Out (In-Community or First Intersection Impacts)
As described above, this scenario was incorporated into the analysis to test the effect of in-
community transportation investments on conditions at or downstream of the “first intersection”
in a corridor. In part, this analysis was performed in order to identify and capture the potential
local transportation network benefits of transportation options investments at the
intercommunity corridor scale.
Detailed Scenario Definition and Background
The scenario focused on the Redmond-Bend corridor, which includes the Robal Road and Cooley
Road intersections on the north side of Bend and the Odem Medo Road and Veterans Way
intersections on the south side of Redmond. The intent was to identify any benefits from reduced
congestion at these or downstream intersections.
The project team initially conducted high-level traffic analysis assuming the high transit scenario
(Scenario 3); however, the 2.6% mode shift in this scenario had limited effects on traffic
operations at these intersections. The project team therefore defined a “reach-out” mode shift
scenario, with an overall 10% mode shift, to test the sensitivity of traffic operations to such a
scenario.
Whereas mode shift in the previous transit scenarios was based on defined service plans and
assumed response to increased service levels, the reach-out scenario was based on:
The assessment of vanpool and transit potential for each corridor that was used in
developing the vanpool and transit scenarios (Chapter 5), reproduced in Figure 6-16
below.
The range of strategy effectiveness presented in Figure 2-2.
Figure 6-16 Assessment of Vanpool and Transit Market Potential
Mode Sisters-Redmond
Redmond-Prineville
Madras-Redmond
Redmond-Bend
Bend- La Pine
Madras-Prineville
Culver- Madras
Bend-Sisters
Vanpool Low Moderate High Moderate High Low Limited Moderate
Transit Low-
Moderate Moderate-
High Moderate-
High High Moderate Low Moderate Moderate
Note: Reproduced from Figure 6-3 (vanpool) and Figure 6-7 (transit)
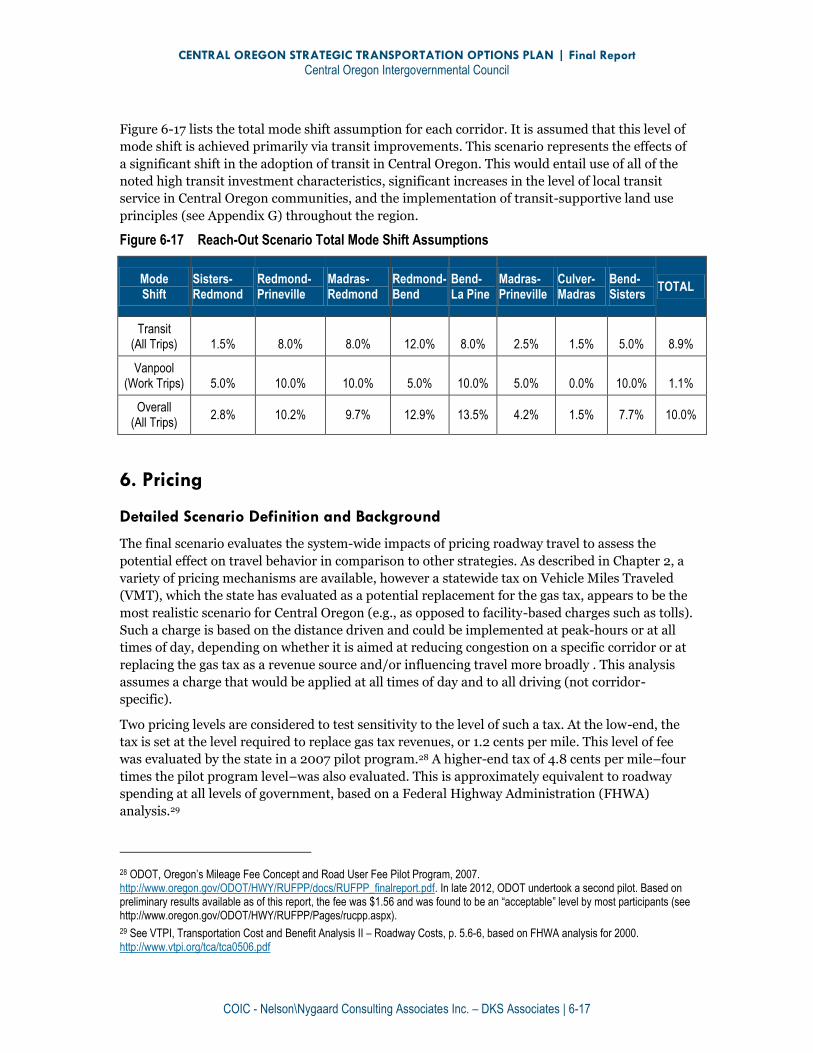
CENTRAL OREGON STRATEGIC TRANSPORTATION OPTIONS PLAN | Final Report
Central Oregon Intergovernmental Council
COIC - Nelson\Nygaard Consulting Associates Inc. – DKS Associates | 6-17
Figure 6-17 lists the total mode shift assumption for each corridor. It is assumed that this level of
mode shift is achieved primarily via transit improvements. This scenario represents the effects of
a significant shift in the adoption of transit in Central Oregon. This would entail use of all of the
noted high transit investment characteristics, significant increases in the level of local transit
service in Central Oregon communities, and the implementation of transit-supportive land use
principles (see Appendix G) throughout the region.
Figure 6-17 Reach-Out Scenario Total Mode Shift Assumptions
Mode Shift
Sisters-Redmond
Redmond-Prineville
Madras-Redmond
Redmond-Bend
Bend- La Pine
Madras-Prineville
Culver-Madras
Bend-Sisters
TOTAL
Transit (All Trips) 1.5% 8.0% 8.0% 12.0% 8.0% 2.5% 1.5% 5.0% 8.9%
Vanpool (Work Trips) 5.0% 10.0% 10.0% 5.0% 10.0% 5.0% 0.0% 10.0% 1.1%
Overall (All Trips)
2.8% 10.2% 9.7% 12.9% 13.5% 4.2% 1.5% 7.7% 10.0%
6. Pricing
Detailed Scenario Definition and Background
The final scenario evaluates the system-wide impacts of pricing roadway travel to assess the
potential effect on travel behavior in comparison to other strategies. As described in Chapter 2, a
variety of pricing mechanisms are available, however a statewide tax on Vehicle Miles Traveled
(VMT), which the state has evaluated as a potential replacement for the gas tax, appears to be the
most realistic scenario for Central Oregon (e.g., as opposed to facility-based charges such as tolls).
Such a charge is based on the distance driven and could be implemented at peak-hours or at all
times of day, depending on whether it is aimed at reducing congestion on a specific corridor or at
replacing the gas tax as a revenue source and/or influencing travel more broadly . This analysis
assumes a charge that would be applied at all times of day and to all driving (not corridor-
specific).
Two pricing levels are considered to test sensitivity to the level of such a tax. At the low-end, the
tax is set at the level required to replace gas tax revenues, or 1.2 cents per mile. This level of fee
was evaluated by the state in a 2007 pilot program.28 A higher-end tax of 4.8 cents per mile–four
times the pilot program level–was also evaluated. This is approximately equivalent to roadway
spending at all levels of government, based on a Federal Highway Administration (FHWA)
analysis.29
28 ODOT, Oregon’s Mileage Fee Concept and Road User Fee Pilot Program, 2007. http://www.oregon.gov/ODOT/HWY/RUFPP/docs/RUFPP_finalreport.pdf. In late 2012, ODOT undertook a second pilot. Based on preliminary results available as of this report, the fee was $1.56 and was found to be an “acceptable” level by most participants (see http://www.oregon.gov/ODOT/HWY/RUFPP/Pages/rucpp.aspx).
29 See VTPI, Transportation Cost and Benefit Analysis II – Roadway Costs, p. 5.6-6, based on FHWA analysis for 2000. http://www.vtpi.org/tca/tca0506.pdf
CENTRAL OREGON STRATEGIC TRANSPORTATION OPTIONS PLAN | Final Report
Central Oregon Intergovernmental Council
COIC - Nelson\Nygaard Consulting Associates Inc. – DKS Associates | 6-18
According to the AAA, the overall cost of driving was 60 cents per mile in 2012, of which 12 cents
per mile consists of gasoline costs.30 Other costs include both fixed and variable costs (insurance,
maintenance, etc.). The low and high VMT fee levels analyzed in this scenario comprise between
2% to 8% of corridor travel costs.
Two sets of elasticity31 and transit service level assumptions were used to estimate the response of
drivers to increased driving costs, and were tested with both a low and high fee.
It was assumed that without good transportation options available, there would be
relatively low driver response (inelastic). Baseline transit service levels were used to
represent this case, along with a lower-end elasticity of -0.1.
If good transportation options are available, represented by the high transit scenario,
driver response would be greater and a higher-end elasticity of -0.3 was used. This higher
elasticity is also representative of long-term impacts, where drivers have the opportunity
to adapt to the higher driving cost and adjust travel behavior.
30 AAA, Cost of Driving, 2012 31 For example, see VTPI, Transportation Elasticities, Table 3, http://www.vtpi.org/tdm/tdm11.htm#_Toc161022575

CENTRAL OREGON STRATEGIC TRANSPORTATION OPTIONS PLAN | Final Report
Central Oregon Intergovernmental Council
COIC - Nelson\Nygaard Consulting Associates Inc. – DKS Associates | 7-1
7. ANALYSIS RESULTS & IMPLICATIONS
After incorporating input from the TAC on the broad definition of the analysis scenarios described
in Figure 6-1, the consultant team developed the more detailed scenario definition described in
Chapter 5. Using the baseline data from the travel demand model, e.g., vehicles miles traveled
(VMT), total number of trips, etc., the analysis applied assumptions for potential mode shift
realized from the alternative transportation investments/strategies and analyzed each scenario.
This chapter presents findings from the analysis, organized into the following benefit and cost
categories:
Travel Demand Reductions
User Cost and Benefits
Transportation System Impacts
Energy and Environment Impacts
Access and Mobility Improvements
First Intersection Impacts
Transportation Pricing Impacts
RESULTS
This section presents the COTOP scenario analysis results. The results focus on the vanpool,
transit, and commuter rail scenarios, showing results for the first intersection (reach-out transit)
scenario when relevant. A subsequent section discusses results from the pricing scenarios in
further detail. Additional results at the corridor-level are included in Appendix D.
Travel Demand Reductions
Figure 7-1 describes the changes in single-occupant (SOV) travel demand relative to the baseline:
Between 800 and 1,300 daily vehicle trips are eliminated in the Moderate and High
Transit scenarios, representing between about 900 to 1,500 people shifting to vanpool or
transit modes—a mode shift of between 2.5% to nearly 4.0%— in these scenarios.
The Commuter Rail scenario achieves nearly an equivalent mode shift to the High Transit
scenario, but the transportation investments and mode shift is focused on two specific
corridors.
With a 10% mode shift in the reach-out transit scenario, over 3,700 person trips would
shift to vanpool and transit modes.
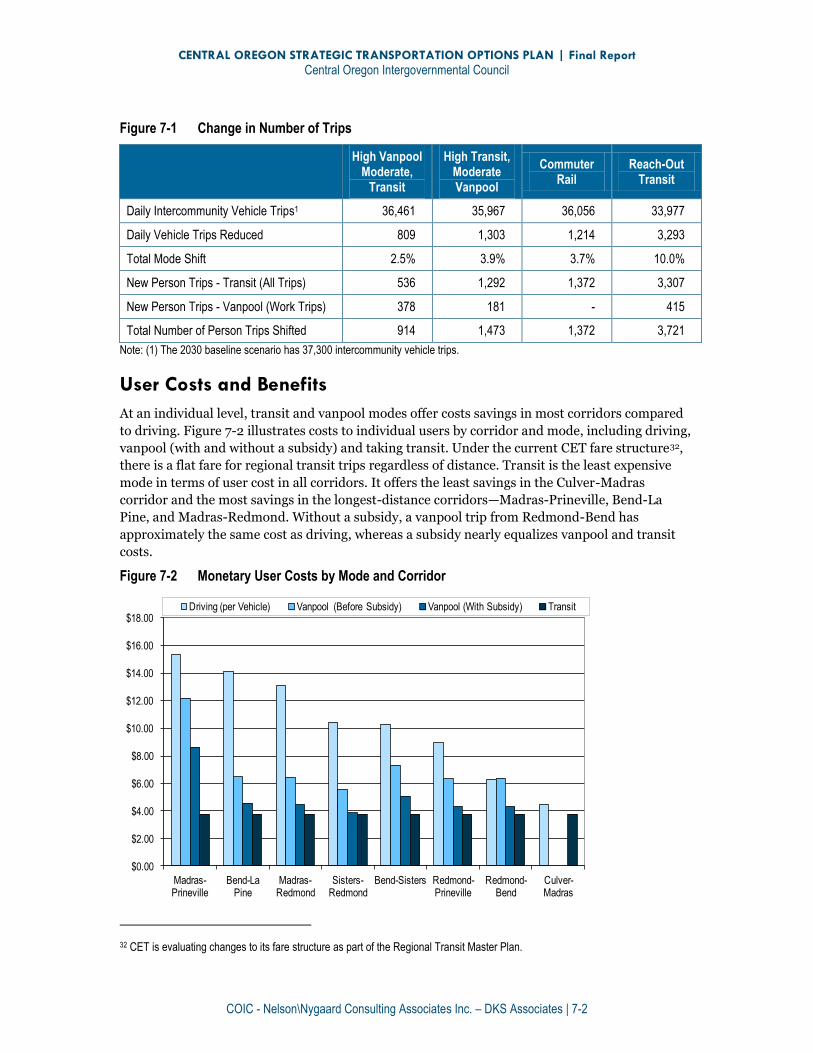
CENTRAL OREGON STRATEGIC TRANSPORTATION OPTIONS PLAN | Final Report
Central Oregon Intergovernmental Council
COIC - Nelson\Nygaard Consulting Associates Inc. – DKS Associates | 7-2
Figure 7-1 Change in Number of Trips
High Vanpool Moderate,
Transit
High Transit, Moderate Vanpool
Commuter Rail
Reach-Out Transit
Daily Intercommunity Vehicle Trips1 36,461 35,967 36,056 33,977
Daily Vehicle Trips Reduced 809 1,303 1,214 3,293
Total Mode Shift 2.5% 3.9% 3.7% 10.0%
New Person Trips - Transit (All Trips) 536 1,292 1,372 3,307
New Person Trips - Vanpool (Work Trips) 378 181 - 415
Total Number of Person Trips Shifted 914 1,473 1,372 3,721
Note: (1) The 2030 baseline scenario has 37,300 intercommunity vehicle trips.
User Costs and Benefits
At an individual level, transit and vanpool modes offer costs savings in most corridors compared
to driving. Figure 7-2 illustrates costs to individual users by corridor and mode, including driving,
vanpool (with and without a subsidy) and taking transit. Under the current CET fare structure32,
there is a flat fare for regional transit trips regardless of distance. Transit is the least expensive
mode in terms of user cost in all corridors. It offers the least savings in the Culver-Madras
corridor and the most savings in the longest-distance corridors—Madras-Prineville, Bend-La
Pine, and Madras-Redmond. Without a subsidy, a vanpool trip from Redmond-Bend has
approximately the same cost as driving, whereas a subsidy nearly equalizes vanpool and transit
costs.
Figure 7-2 Monetary User Costs by Mode and Corridor
32 CET is evaluating changes to its fare structure as part of the Regional Transit Master Plan.
$0.00
$2.00
$4.00
$6.00
$8.00
$10.00
$12.00
$14.00
$16.00
$18.00
Madras-Prineville
Bend-La Pine
Madras-Redmond
Sisters-Redmond
Bend-Sisters Redmond-Prineville
Redmond-Bend
Culver-Madras
Driving (per Vehicle) Vanpool (Before Subsidy) Vanpool (With Subsidy) Transit
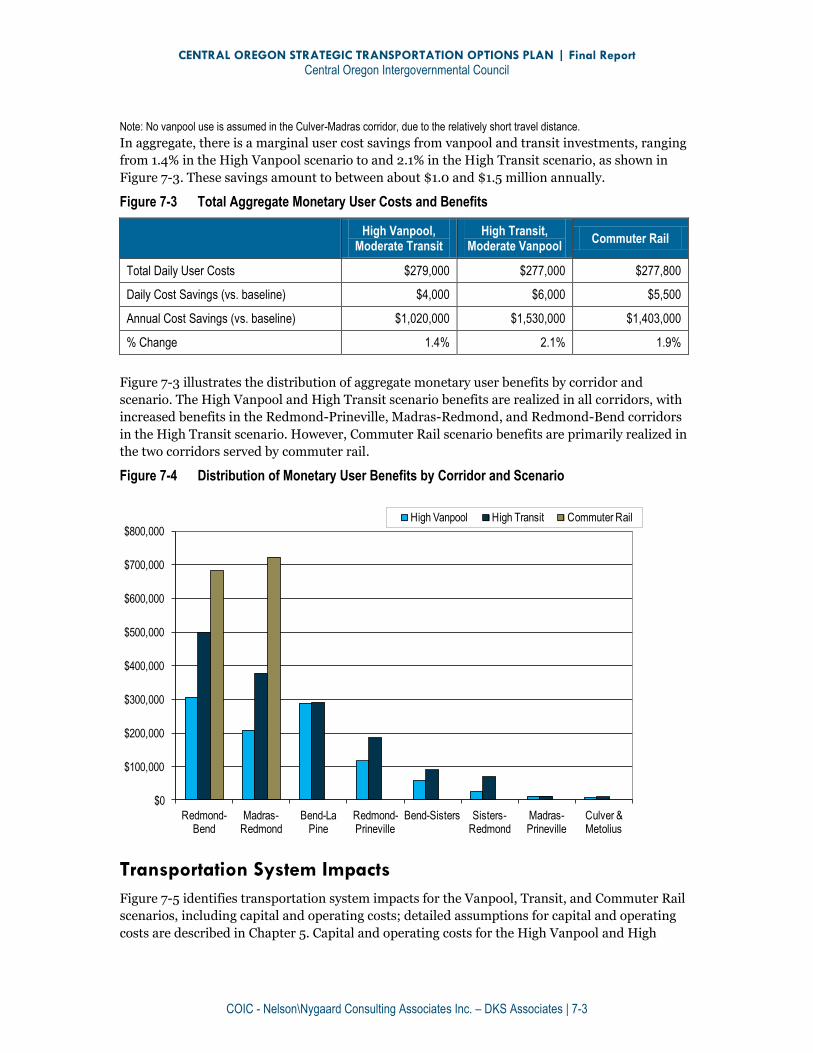
CENTRAL OREGON STRATEGIC TRANSPORTATION OPTIONS PLAN | Final Report
Central Oregon Intergovernmental Council
COIC - Nelson\Nygaard Consulting Associates Inc. – DKS Associates | 7-3
Note: No vanpool use is assumed in the Culver-Madras corridor, due to the relatively short travel distance.
In aggregate, there is a marginal user cost savings from vanpool and transit investments, ranging
from 1.4% in the High Vanpool scenario to and 2.1% in the High Transit scenario, as shown in
Figure 7-3. These savings amount to between about $1.0 and $1.5 million annually.
Figure 7-3 Total Aggregate Monetary User Costs and Benefits
High Vanpool, Moderate Transit
High Transit, Moderate Vanpool
Commuter Rail
Total Daily User Costs $279,000 $277,000 $277,800
Daily Cost Savings (vs. baseline) $4,000 $6,000 $5,500
Annual Cost Savings (vs. baseline) $1,020,000 $1,530,000 $1,403,000
% Change 1.4% 2.1% 1.9%
Figure 7-3 illustrates the distribution of aggregate monetary user benefits by corridor and
scenario. The High Vanpool and High Transit scenario benefits are realized in all corridors, with
increased benefits in the Redmond-Prineville, Madras-Redmond, and Redmond-Bend corridors
in the High Transit scenario. However, Commuter Rail scenario benefits are primarily realized in
the two corridors served by commuter rail.
Figure 7-4 Distribution of Monetary User Benefits by Corridor and Scenario
Transportation System Impacts
Figure 7-5 identifies transportation system impacts for the Vanpool, Transit, and Commuter Rail
scenarios, including capital and operating costs; detailed assumptions for capital and operating
costs are described in Chapter 5. Capital and operating costs for the High Vanpool and High
$0
$100,000
$200,000
$300,000
$400,000
$500,000
$600,000
$700,000
$800,000
Redmond-Bend
Madras-Redmond
Bend-La Pine
Redmond-Prineville
Bend-Sisters Sisters-Redmond
Madras-Prineville
Culver & Metolius
High Vanpool High Transit Commuter Rail
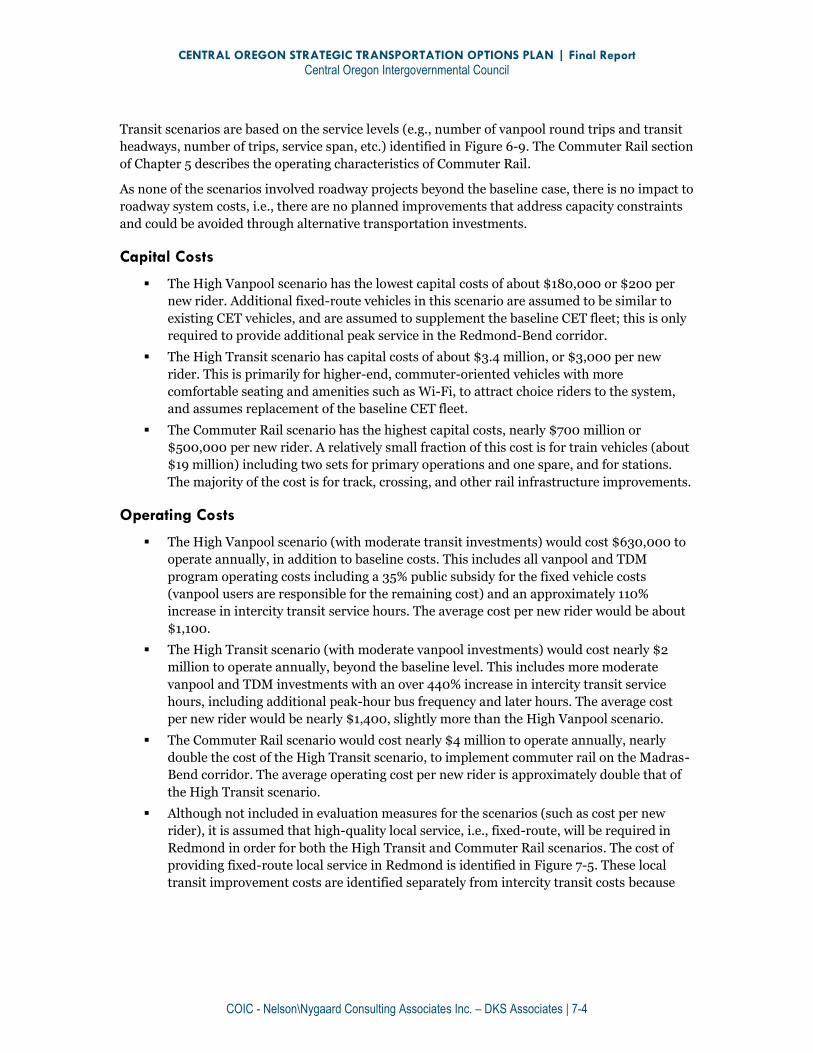
CENTRAL OREGON STRATEGIC TRANSPORTATION OPTIONS PLAN | Final Report
Central Oregon Intergovernmental Council
COIC - Nelson\Nygaard Consulting Associates Inc. – DKS Associates | 7-4
Transit scenarios are based on the service levels (e.g., number of vanpool round trips and transit
headways, number of trips, service span, etc.) identified in Figure 6-9. The Commuter Rail section
of Chapter 5 describes the operating characteristics of Commuter Rail.
As none of the scenarios involved roadway projects beyond the baseline case, there is no impact to
roadway system costs, i.e., there are no planned improvements that address capacity constraints
and could be avoided through alternative transportation investments.
Capital Costs
The High Vanpool scenario has the lowest capital costs of about $180,000 or $200 per
new rider. Additional fixed-route vehicles in this scenario are assumed to be similar to
existing CET vehicles, and are assumed to supplement the baseline CET fleet; this is only
required to provide additional peak service in the Redmond-Bend corridor.
The High Transit scenario has capital costs of about $3.4 million, or $3,000 per new
rider. This is primarily for higher-end, commuter-oriented vehicles with more
comfortable seating and amenities such as Wi-Fi, to attract choice riders to the system,
and assumes replacement of the baseline CET fleet.
The Commuter Rail scenario has the highest capital costs, nearly $700 million or
$500,000 per new rider. A relatively small fraction of this cost is for train vehicles (about
$19 million) including two sets for primary operations and one spare, and for stations.
The majority of the cost is for track, crossing, and other rail infrastructure improvements.
Operating Costs
The High Vanpool scenario (with moderate transit investments) would cost $630,000 to
operate annually, in addition to baseline costs. This includes all vanpool and TDM
program operating costs including a 35% public subsidy for the fixed vehicle costs
(vanpool users are responsible for the remaining cost) and an approximately 110%
increase in intercity transit service hours. The average cost per new rider would be about
$1,100.
The High Transit scenario (with moderate vanpool investments) would cost nearly $2
million to operate annually, beyond the baseline level. This includes more moderate
vanpool and TDM investments with an over 440% increase in intercity transit service
hours, including additional peak-hour bus frequency and later hours. The average cost
per new rider would be nearly $1,400, slightly more than the High Vanpool scenario.
The Commuter Rail scenario would cost nearly $4 million to operate annually, nearly
double the cost of the High Transit scenario, to implement commuter rail on the Madras-
Bend corridor. The average operating cost per new rider is approximately double that of
the High Transit scenario.
Although not included in evaluation measures for the scenarios (such as cost per new
rider), it is assumed that high-quality local service, i.e., fixed-route, will be required in
Redmond in order for both the High Transit and Commuter Rail scenarios. The cost of
providing fixed-route local service in Redmond is identified in Figure 7-5. These local
transit improvement costs are identified separately from intercity transit costs because

CENTRAL OREGON STRATEGIC TRANSPORTATION OPTIONS PLAN | Final Report
Central Oregon Intergovernmental Council
COIC - Nelson\Nygaard Consulting Associates Inc. – DKS Associates | 7-5
these local improvements are not intrinsic to the alternative scenarios, but as indicated,
are required to realize the cited benefits.33
Figure 7-5 Transportation System Impacts
High Vanpool, Moderate Transit,
High Transit, Moderate Vanpool
Commuter Rail
Capital Costs
Programmed Road System Costs No impact
Transit Capital $180,000 $4,350,000 $685,000,000
Capital Cost per New Rider $200 $3,000 $499,000
Operating Costs
Transit Operating Cost - Annual $630,000 $1,980,000 $3,900,000
Vanpool/TDM Operating Cost - Annual 1 $380,000 $60,000 -
Transit Operating Cost per New Rider - Annual $1,180 $1,530 $2,850
Vanpool/TDM Operating Cost per New Rider - Annual $995 $355 -
Average Scenario Cost per new Rider - Annual $1,100 $1,390 $2,850
Total Intercity Operating Costs - Annual $1,010,000 $2,040,000 $3,900,000
Additional Redmond Fixed-Route Operating Costs 2 - $450,000 $255,000
Total Operating Costs (including Redmond Fixed Route) $1,010,000 $2,490,000 $4,155,000
Notes: (1) TDM costs include program staffing, emergency ride home program, and funding for incentives/rewards under the Drive Less Connect program. (2) Cost of fixed-route service in Redmond, in addition to baseline local demand-response service, required to complement High Transit or Commuter Rail scenarios. A lower cost is assumed in the Commuter Rail scenario due to a shorter daily service span.
33 Any such local improvements would be implemented as part of the Redmond Transit Master Plan.

CENTRAL OREGON STRATEGIC TRANSPORTATION OPTIONS PLAN | Final Report
Central Oregon Intergovernmental Council
COIC - Nelson\Nygaard Consulting Associates Inc. – DKS Associates | 7-6
Energy and Environment Impacts
Figure 7-6 describes the effects of each scenario on fuel consumption and greenhouse gas (GhG)
emissions relative to the Baseline scenario. These effects are related to reductions in VMT that
range from 2.7% in the High Vanpool scenario to 4.3% in the High Transit scenario.
The High Vanpool scenario reduces GhG emissions by 2.2% and net GhG emissions
(accounting for emissions from added vanpool and transit service) by 1.7%.
The High Transit scenario reduces GhG emissions by 3.4% and net GhG emissions by
2.7%.
Commuter Rail scenario GhG emissions reductions fall between the level of High Vanpool
and High Transit scenario reductions.
Figure 7-6 VMT, Fuel Consumption, and GhG Emissions
High Vanpool, Moderate
Transit
High Transit, Moderate Vanpool
Commuter Rail
Reach-Out Transit
VMT and Fuel Consumption
Daily VMT 1 462,400 455,000 457,500 399,400
Daily VMT Reduced 12,973 20,401 17,891 46,236
Daily Fuel Consumption Reduced - LDV 2 463 729 639 1,651
Annual VMT Reduced 3,308,000 5,202,000 4,562,000 11,790,000
% Change from baseline 2.7% 4.3% 3.8% 10%
GhG Emissions
Daily GHG Emissions (MT CO2e) – LDV 3 147 144 145 127
Daily GhG Emissions Reduced - LDV 4.1 6.5 5.7 14.7
Annual GhG Emissions 37,400 36,800 37,000 32,300
Annual GhG Emissions Reduced 1,050 1,650 1,450 3,740
% Change from baseline (GhG Emissions) 2.2% 3.4% 3.0% 7.7%
Net Daily GhG Emissions Reduced 4 3.2 5.2 4.1 -
Net Annual GhG Emissions Reduced 820 1,330 1,050 -
% Change from baseline (Net GhG Emissions) 1.7% 2.7% 2.2% -
Notes: (1) The 2030 baseline scenario has 475,400 daily intercommunity VMT. (2) LDV = Light-Duty Vehicles, such as passenger cars and light trucks. Fuel consumption is estimated based on VMT and US Energy Information Administration 2011 Energy Outlook, Fuel Efficiency for 2030 Light Duty Stock. (3) Metric Tons of CO2 equivalent emissions. (4) Net emissions account for increased emissions due to new vanpool, transit, or commuter rail trips. Transit emissions assume 2002 transit bus fuel efficiency, which would likely improve by 2030.
CENTRAL OREGON STRATEGIC TRANSPORTATION OPTIONS PLAN | Final Report
Central Oregon Intergovernmental Council
COIC - Nelson\Nygaard Consulting Associates Inc. – DKS Associates | 7-7
Access and Mobility Improvements
Changes to access and mobility are assessed qualitatively for each scenario, addressing both
“choice” and “transit-dependent” riders:
The High Vanpool scenario provides moderate improvements for both choice and transit-
dependent riders. Vanpools provide an additional option and incentives for work trips
and are assumed to primarily benefit choice riders, although transit-dependent riders
may also be able to benefit. Moderate transit improvements primarily benefit transit-
dependent riders by providing more consistent service throughout the day, although
choice riders also benefit from improved peak frequency.
The High Transit scenario provides the broadest improvements to both categories of
potential riders. It provides both consistent service throughout the day and increased
peak frequency across most corridors, and provides new service on the Sisters-Bend
corridor. Extending transit service hours into the later evening can serve workers with
later shifts and enable a broader reliance on transit beyond the regular work day. This
scenario also maintains a moderate level of vanpool services, enabling non-single
occupant vehicle transportation options to more dispersed employment sites or jobs with
work shifts that are outside of the expanded transit service hours under this scenario.
Commuter rail provides the narrowest benefits in terms of corridors served. Although
several stops are assumed in both commuter rail corridors, which would be similar to the
number of stops likely to be provided on intercity bus service, stop locations are less
flexible and in some cases in more disperse locations, creating access challenges. The
more limited benefits may be attractive to those riders who are served by commuter rail
stations, but are assumed to primarily benefit choice riders.
Additional benefits are described in the sub-sections below.
Public Health
General benefits from increased transit use include increased physical activity from walking or
bicycling. The Centers for Disease Control (CDC) recommends that adults have at least 150
minutes per week of moderate physical activity—an average of 22 minutes per day—and suggests
that this level of activity can be attained in a 10-minute walk, three times a day, five days a week,34
such as through walking and bicycling as part of commuting or everyday routines.35 Although not
quantified as part of this report, various studies have found that transit users are more likely to
take more frequent and longer walking trips; most transit trips involve walking on at least one
end of the trip.36
Safety Benefits
Statistics show that transit is a relatively safe mode of travel compared to passenger vehicles. The
American Public Transit Association (APTA) estimated the rate of fatal accidents per transit
34 Centers for Disease Control and Prevention (CDC), http://www.cdc.gov/physicalactivity/everyone/guidelines/adults.html
35 CDC, http://www.cdc.gov/nccdphp/dnpa/physical/stats/metropolitan.htm
36 Victoria Transport Policy Institute, Public Transit Benefits and Costs, 2012, p. 43. http://www.vtpi.org/tranben.pdf
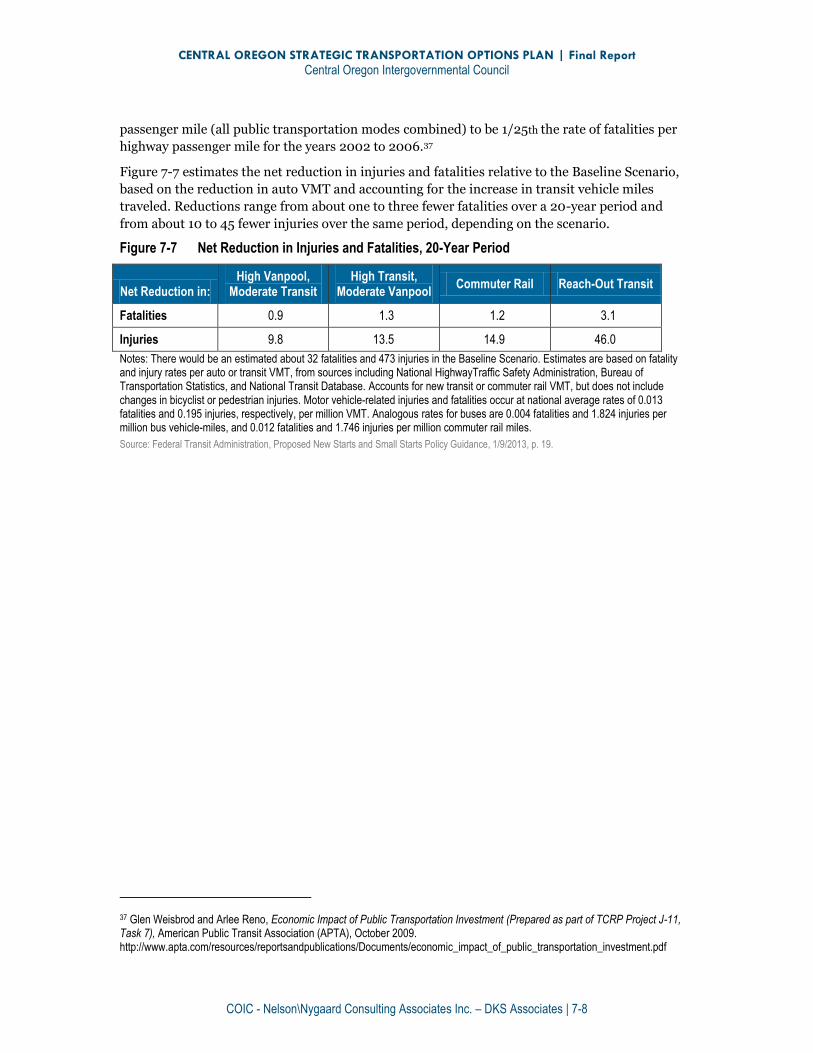
CENTRAL OREGON STRATEGIC TRANSPORTATION OPTIONS PLAN | Final Report
Central Oregon Intergovernmental Council
COIC - Nelson\Nygaard Consulting Associates Inc. – DKS Associates | 7-8
passenger mile (all public transportation modes combined) to be 1/25th the rate of fatalities per
highway passenger mile for the years 2002 to 2006.37
Figure 7-7 estimates the net reduction in injuries and fatalities relative to the Baseline Scenario,
based on the reduction in auto VMT and accounting for the increase in transit vehicle miles
traveled. Reductions range from about one to three fewer fatalities over a 20-year period and
from about 10 to 45 fewer injuries over the same period, depending on the scenario.
Figure 7-7 Net Reduction in Injuries and Fatalities, 20-Year Period
Net Reduction in: High Vanpool,
Moderate Transit High Transit,
Moderate Vanpool Commuter Rail Reach-Out Transit
Fatalities 0.9 1.3 1.2 3.1
Injuries 9.8 13.5 14.9 46.0
Notes: There would be an estimated about 32 fatalities and 473 injuries in the Baseline Scenario. Estimates are based on fatality and injury rates per auto or transit VMT, from sources including National HighwayTraffic Safety Administration, Bureau of Transportation Statistics, and National Transit Database. Accounts for new transit or commuter rail VMT, but does not include changes in bicyclist or pedestrian injuries. Motor vehicle-related injuries and fatalities occur at national average rates of 0.013 fatalities and 0.195 injuries, respectively, per million VMT. Analogous rates for buses are 0.004 fatalities and 1.824 injuries per million bus vehicle-miles, and 0.012 fatalities and 1.746 injuries per million commuter rail miles.
Source: Federal Transit Administration, Proposed New Starts and Small Starts Policy Guidance, 1/9/2013, p. 19.
37 Glen Weisbrod and Arlee Reno, Economic Impact of Public Transportation Investment (Prepared as part of TCRP Project J-11, Task 7), American Public Transit Association (APTA), October 2009. http://www.apta.com/resources/reportsandpublications/Documents/economic_impact_of_public_transportation_investment.pdf

CENTRAL OREGON STRATEGIC TRANSPORTATION OPTIONS PLAN | Final Report
Central Oregon Intergovernmental Council
COIC - Nelson\Nygaard Consulting Associates Inc. – DKS Associates | 7-9
Reach-Out Transit (In-Community or First Intersection Impacts)
As described in Chapter 5, this scenario tested the effects of an overall 10% mode shift away from
auto travel, to assess the effects on in-community traffic operations at the “first” and downstream
intersections; these represent the endpoints of the intercity corridor analyzed and intersections
closer to the center of the community. The scenario was intended to demonstrate the results of an
order-of-magnitude increase in transit use.
Figure 7-8 shows the resulting number of vehicle trips reduced for each corridor. As described in
the definition of this scenario provided in Chapter 5, the underlying mode shift assumptions are
based on the range of strategy effectiveness (Chapter 2) and the assessment of vanpool and transit
market potential (Chapter 5).
Figure 7-8 Daily Vehicle Trips Reduced by Corridor
Sisters-Redmond
Redmond - Prineville
Madras-Redmond
Redmond-Bend
Bend-La Pine
Madras-Prineville
Culver - Madras
Bend-Sisters
TOTAL
28 255 261 2,432 113 15 78 111 3,293
Figure 7-10 illustrates the change in PM peak period traffic volumes for the US 97 corridor
between Redmond and Bend. The line thickness represents the number of vehicles and line color
illustrates the change in traffic volumes, e.g., red represents an up to 5% reduction in peak period
traffic volumes. Additional modeling results are included in Appendix E.
The traffic operations impacts of these vehicle trip reductions were assessed for the Redmond-
Bend corridor. Figure 7-9 identifies these impacts at the first and downstream intersections along
US 97 in Redmond and Bend for the PM peak period, including vehicle to capacity ratio (V/C),
intersection level-of-service (LOS), and average intersection delay in seconds. The effects were
limited at the Redmond intersections, with only a one second reduction in delay. However, delay
at the Cooley and Robal Road intersections in Bend was reduced by 13 and 14 seconds, including a
change from LOS F to LOS E at Robal Road.
Figure 7-9 Traffic Operations Impacts at First/Downstream Intersections
Intersection Before After Avg.
Delay
Savings
Analysis
Year V/C LOS Avg. Delay V/C LOS Avg. Delay
Robal/US 97 1.04 F 92 1.01 E 77 14 2027
Cooley/US 97 1.35 F 157 1.32 F 144 13 2027
Odem Medo/US 97 0.81 C 26 0.80 C 25 1 2030
Veterans Way/US 97 1.01 D 44 0.97 D 43 1 2030
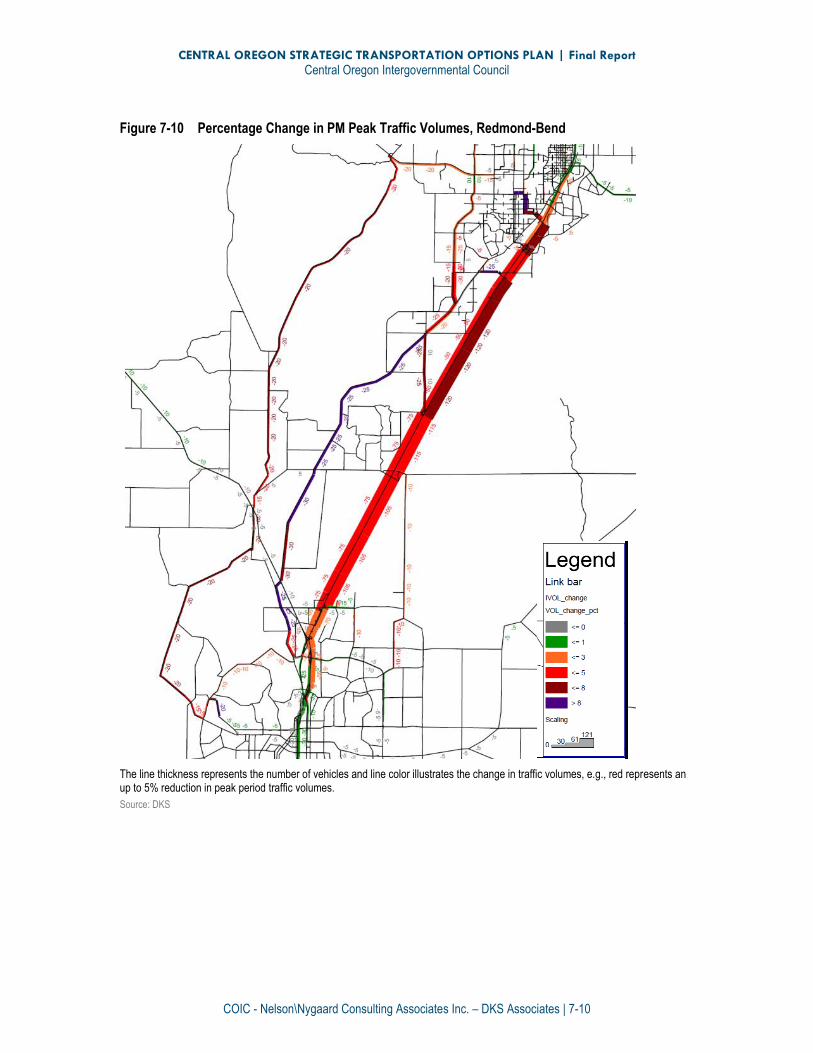
CENTRAL OREGON STRATEGIC TRANSPORTATION OPTIONS PLAN | Final Report
Central Oregon Intergovernmental Council
COIC - Nelson\Nygaard Consulting Associates Inc. – DKS Associates | 7-10
Figure 7-10 Percentage Change in PM Peak Traffic Volumes, Redmond-Bend
The line thickness represents the number of vehicles and line color illustrates the change in traffic volumes, e.g., red represents an up to 5% reduction in peak period traffic volumes.
Source: DKS
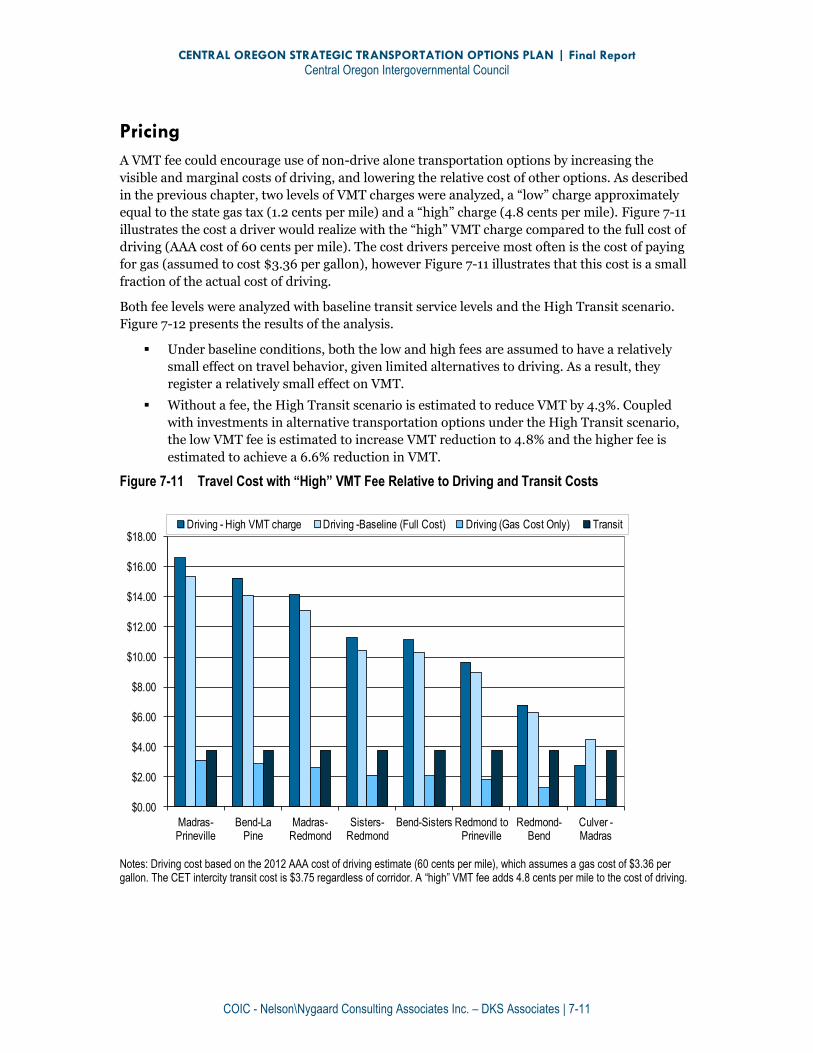
CENTRAL OREGON STRATEGIC TRANSPORTATION OPTIONS PLAN | Final Report
Central Oregon Intergovernmental Council
COIC - Nelson\Nygaard Consulting Associates Inc. – DKS Associates | 7-11
Pricing
A VMT fee could encourage use of non-drive alone transportation options by increasing the
visible and marginal costs of driving, and lowering the relative cost of other options. As described
in the previous chapter, two levels of VMT charges were analyzed, a “low” charge approximately
equal to the state gas tax (1.2 cents per mile) and a “high” charge (4.8 cents per mile). Figure 7-11
illustrates the cost a driver would realize with the “high” VMT charge compared to the full cost of
driving (AAA cost of 60 cents per mile). The cost drivers perceive most often is the cost of paying
for gas (assumed to cost $3.36 per gallon), however Figure 7-11 illustrates that this cost is a small
fraction of the actual cost of driving.
Both fee levels were analyzed with baseline transit service levels and the High Transit scenario.
Figure 7-12 presents the results of the analysis.
Under baseline conditions, both the low and high fees are assumed to have a relatively
small effect on travel behavior, given limited alternatives to driving. As a result, they
register a relatively small effect on VMT.
Without a fee, the High Transit scenario is estimated to reduce VMT by 4.3%. Coupled
with investments in alternative transportation options under the High Transit scenario,
the low VMT fee is estimated to increase VMT reduction to 4.8% and the higher fee is
estimated to achieve a 6.6% reduction in VMT.
Figure 7-11 Travel Cost with “High” VMT Fee Relative to Driving and Transit Costs
Notes: Driving cost based on the 2012 AAA cost of driving estimate (60 cents per mile), which assumes a gas cost of $3.36 per gallon. The CET intercity transit cost is $3.75 regardless of corridor. A “high” VMT fee adds 4.8 cents per mile to the cost of driving.
$0.00
$2.00
$4.00
$6.00
$8.00
$10.00
$12.00
$14.00
$16.00
$18.00
Madras-Prineville
Bend-La Pine
Madras-Redmond
Sisters-Redmond
Bend-Sisters Redmond to Prineville
Redmond-Bend
Culver -Madras
Driving - High VMT charge Driving -Baseline (Full Cost) Driving (Gas Cost Only) Transit
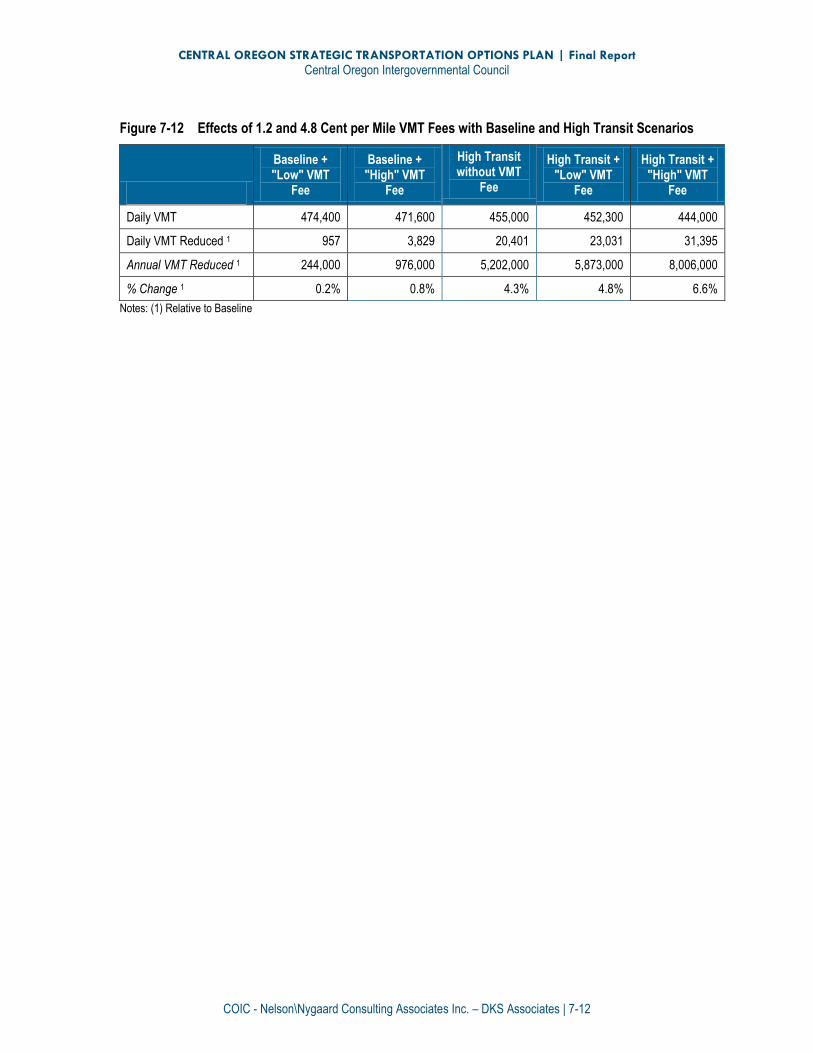
CENTRAL OREGON STRATEGIC TRANSPORTATION OPTIONS PLAN | Final Report
Central Oregon Intergovernmental Council
COIC - Nelson\Nygaard Consulting Associates Inc. – DKS Associates | 7-12
Figure 7-12 Effects of 1.2 and 4.8 Cent per Mile VMT Fees with Baseline and High Transit Scenarios
Baseline + "Low" VMT
Fee
Baseline + "High" VMT
Fee
High Transit without VMT
Fee
High Transit + "Low" VMT
Fee
High Transit + "High" VMT
Fee
Daily VMT 474,400 471,600 455,000 452,300 444,000
Daily VMT Reduced 1 957 3,829 20,401 23,031 31,395
Annual VMT Reduced 1 244,000 976,000 5,202,000 5,873,000 8,006,000
% Change 1 0.2% 0.8% 4.3% 4.8% 6.6%
Notes: (1) Relative to Baseline
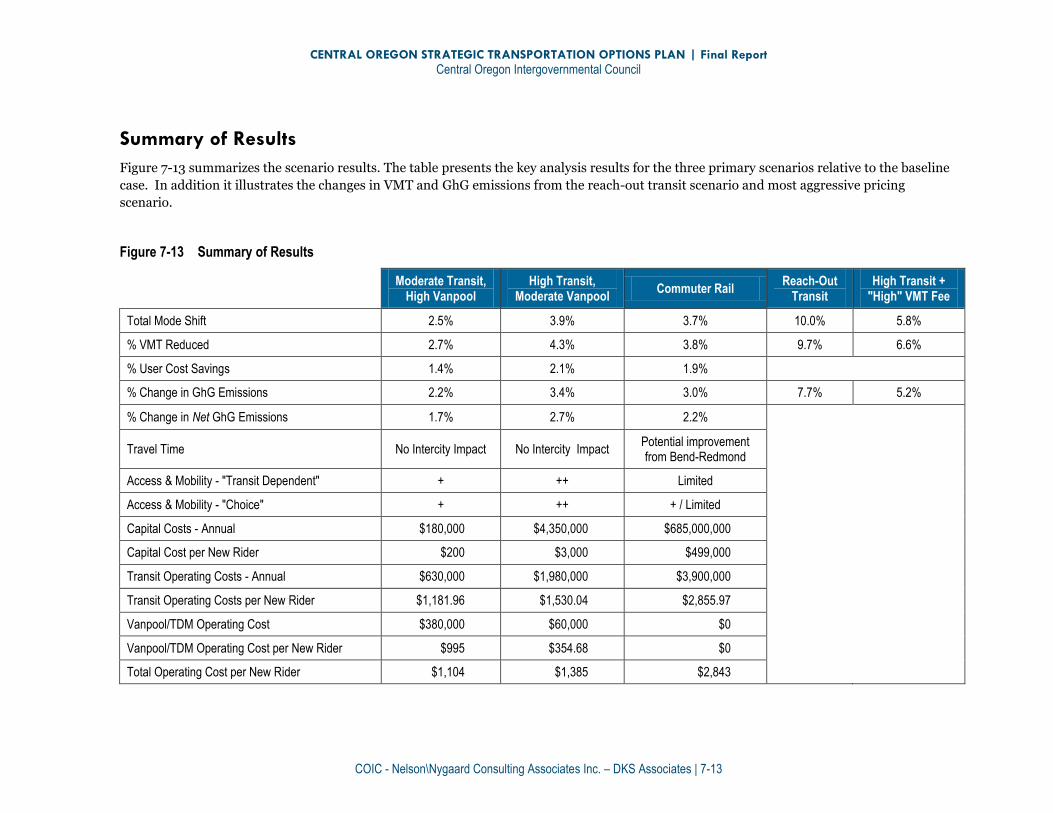
CENTRAL OREGON STRATEGIC TRANSPORTATION OPTIONS PLAN | Final Report
Central Oregon Intergovernmental Council
COIC - Nelson\Nygaard Consulting Associates Inc. – DKS Associates | 7-13
Summary of Results
Figure 7-13 summarizes the scenario results. The table presents the key analysis results for the three primary scenarios relative to the baseline
case. In addition it illustrates the changes in VMT and GhG emissions from the reach-out transit scenario and most aggressive pricing
scenario.
Figure 7-13 Summary of Results
Moderate Transit, High Vanpool
High Transit, Moderate Vanpool
Commuter Rail Reach-Out
Transit High Transit +
"High" VMT Fee
Total Mode Shift 2.5% 3.9% 3.7% 10.0% 5.8%
% VMT Reduced 2.7% 4.3% 3.8% 9.7% 6.6%
% User Cost Savings 1.4% 2.1% 1.9%
% Change in GhG Emissions 2.2% 3.4% 3.0% 7.7% 5.2%
% Change in Net GhG Emissions 1.7% 2.7% 2.2%
Travel Time No Intercity Impact No Intercity Impact Potential improvement from Bend-Redmond
Access & Mobility - "Transit Dependent" + ++ Limited
Access & Mobility - "Choice" + ++ + / Limited
Capital Costs - Annual $180,000 $4,350,000 $685,000,000
Capital Cost per New Rider $200 $3,000 $499,000
Transit Operating Costs - Annual $630,000 $1,980,000 $3,900,000
Transit Operating Costs per New Rider $1,181.96 $1,530.04 $2,855.97
Vanpool/TDM Operating Cost $380,000 $60,000 $0
Vanpool/TDM Operating Cost per New Rider $995 $354.68 $0
Total Operating Cost per New Rider $1,104 $1,385 $2,843


CENTRAL OREGON STRATEGIC TRANSPORTATION OPTIONS PLAN | Final Report
Central Oregon Intergovernmental Council
COIC - Nelson\Nygaard Consulting Associates Inc. – DKS Associates | 7-15
KEY FINDINGS
The ability of intercity transportation strategies to influence capacity is limited by several factors:
Central Oregon intercommunity corridors are expected to remain relatively
uncongested. Significant capacity constraints are not forecasted between cities even by
the 2030 time horizon. The relative lack of congestion eliminates some potential means
of encouraging mode shift, such as providing travel time improvements to high-
occupancy vehicles including transit and vanpools, e.g., preferential use of right-of-way;
this implies that other factors (incentives) are needed to balance the higher access times
associated with transit and vanpool use. The relative lack of congestion also means that
applying pricing strategies for specific corridors is not a viable means of encouraging
mode shift.
The impact of shifting intercommunity trips on reducing congestion is
relatively small. In part, this is because intercommunity trips38 are not the dominant
use of those corridors; i.e., a large share of trips are through trips (e.g., with an origin
and/or destination outside of Central Oregon or in a rural area) or are for a purpose such
as freight. Such travel is not affected by vanpool, TDM, and transit strategies. Therefore, a
large mode shift for intercommunity trips is required to register an effect on congestion.
Even with a significant mode shift in the “Reach-Out” scenario, impact on downstream
congestion/vehicle delay is fairly minor though not insignificant.
Based on the “30,000-foot” study approach, the analysis applied industry-standard effectiveness
of different transportation strategies to demonstrate the distinctions between the strategies. The
following findings apply to specific intercommunity corridors:
A high level of investment in the Redmond-Bend corridor is cost-effective.
Strategies to shift vehicle trips in this corridor can have a high impact due to the high
share of intercommunity trips.
However, the level of intercommunity trip demand in some corridors does
not warrant investment even by 2030. For example, there are relatively few work
trips in the Madras-Prineville corridor; the Sisters-Redmond corridor currently also has
limited potential, but the travel demand model indicates increased future potential (by
2030). In the short-term, the Sisters-Bend corridor appears to be more promising based
on overall travel demand and the number of work trips than Sisters-Redmond.
Shifting trips on the longer-distance corridors can have the highest benefit in
terms of VMT reduction and related benefits, assuming that sufficient demand is
present, e.g., La Pine-Bend and Madras-Redmond.
Current Community Connector fares are not as competitive with driving in
shorter-distance corridors, e.g., Culver-Metolius. This issue is being considered in
the fare study being conducted as part of the Regional Transit Master Plan.
Corridor investments realize benefits for travel on corridors other than
those analyzed directly, e.g., improved service levels from Prineville-Redmond and
Redmond-Bend could be used for intercommunity travel between Prineville and Bend.
38 Trips with an origin in one of the COTOP corridor communities and a destination in another.
CENTRAL OREGON STRATEGIC TRANSPORTATION OPTIONS PLAN | Final Report
Central Oregon Intergovernmental Council
COIC - Nelson\Nygaard Consulting Associates Inc. – DKS Associates | 7-16
The analysis yielded the following conclusions about different potential strategies:
Vanpool investments are a relatively low-cost (and underutilized) means of
providing mobility for peak-hour trips and could yield benefits in the region.
Vanpools complement transit particularly on lower-demand travel corridors, to/from
dispersed work sites or employment centers, and for work shifts/schedules that are
difficult to serve with transit. The limited number of existing vanpools in the region are
subsidized by employers; providing a public subsidy (in some form) or encouraging
additional employer subsidies, along with related TDM investments (e.g.,
rewards/incentive and emergency ride home programs) could have a broad regional
impact with a comparable operating cost per new user as transit and very little upfront
public capital investment required.
Commuter rail approaches the benefits of the “High Transit” scenario but
focuses resources in a limited part of region (i.e., US 97 corridor between
Madras and Bend) and would have a number of challenges:
Capital costs, e.g., capital cost per new rider, are likely to be prohibitively high to
achieve the operating speeds necessary to be reasonably competitive with driving
times on the current rail alignment, even if the scope of crossing improvements
identified in the Central Oregon Rail Study can be reduced.
Overall operating cost and operating cost per trip are also likely to be high due to low
economies of scale. Typically, the high capital cost of rail investments is in part
justified based on increased operating efficiencies (i.e., reduced operating costs per
rider). Based on this analysis, not only is the capital cost per new rider an order-of-
magnitude higher than other transit investments, the operating cost per rider is also
higher.
The existing alignment is not the most direct or well-aligned with land uses. As such,
in addition to reducing the benefits of exclusive transit right-of-way, other benefits
often attributed to rail, such as economic development or increased property values,
will be more difficult to realize.
Shared use of the freight right-of-way is also a critical element that would need to be
negotiated.
A broad pricing policy (e.g., VMT-based driving fee) could be an effective
complement to a high level of transit investment. A relatively high fee would
make the cost of driving more visible and increase the marginal cost of driving. However,
quality transportation options are needed for a VMT fee to effect vehicle trip reduction. A
relatively low fee, such as one intended solely to replace gas tax revenues, would likely
have a relatively small impact, particularly without expanded transportation options.
A number of local factors influence the viability of intercommunity vanpool and transit strategies,
including:
Intercommunity transit investments require enhancements to local
connecting transit, e.g., frequent fixed-route service. This is particularly true in
Redmond and Bend, which have high-demand local destinations. Local access
improvements are also critical and can improve the viability of intercity transit,
particularly in smaller communities. Effective local public transportation can also
complement ridesharing and make ridesharing more effective.
CENTRAL OREGON STRATEGIC TRANSPORTATION OPTIONS PLAN | Final Report
Central Oregon Intergovernmental Council
COIC - Nelson\Nygaard Consulting Associates Inc. – DKS Associates | 7-17
Transit-supportive and walkable land use and community/urban form,
parking constraints/cost, etc., are key factors in transit effectiveness.
Appendix G highlights many of the transit-supportive land use strategies available to
local jurisdictions. The mode shifts associated with scenarios tested in this analysis were
conservative for the most part given the limited application of these land use strategies in
the region.
Vanpool and transit investments have the ability to impact local traffic
operations at and downstream of the “first intersections” that defined the
intercommunity corridors for this analysis. The Reach-Out scenario tested a high mode
shift and conducted a high-level traffic analysis at key intersections in the Redmond-Bend
corridor to demonstrate the mode shift threshold for and magnitude of such an impact.
The overall conclusion of the COTOP technical analysis is that it is difficult to justify
transit/vanpool investments based on expected capacity constraints in the region and congestion
reduction opportunities; however transit/vanpool investments do provide lower-cost mobility
options and other user/societal benefits (household travel costs, reduction in VMT/GhG
emissions, etc.). A similar analysis could have different conclusions and implications if the study
area corridors were experiencing congestion. Likewise, if the study was conducted within a local
community transportation network, where congestion issues are a more significant factor and
higher intensities of transit operations are possible, the potential to shift trips to transit could
have an impact on the need for roadway investments.
POLICY IMPLICATIONS AND NEXT STEPS
This analysis does not replace the need to balance different policy choices and the inherent
tradeoffs between them. Such choices include whether/how to concentrate transit on high-
demand and/or long-distance connections to maximize benefits or allocate the region’s limited
resources broadly to serve the highest-need residents across the region.
Future studies and strategies could potentially:
Evaluate how to direct TDM investments to best complement and allow the most efficient
use of transit resources; for example, how to better utilize Drive Less Connect to improve
mobility (volunteerism)
Determine how pricing can become an effective TDM tool in practice, e.g., by making
driving costs more visible and reducing relative cost of using transportation options (as
opposed to pricing being just a gas tax replacement)
Study the effectiveness of different transportation investment strategies related to local
travel, e.g., in Bend and Redmond:
Address what transit can do to mitigate specific local intersection impacts
Explore the relative benefits of providing transit and/or freight with priority on congested
roadways or intersections, e.g., in terms of person throughput or monetary benefits of
reducing intersection or roadway delay through signal priority or queue jumps
Implementation Concepts
The following implementation ideas should be considered by ODOT, local governments, and
other bodies such as the Central Oregon Area Commission on Transportation:
CENTRAL OREGON STRATEGIC TRANSPORTATION OPTIONS PLAN | Final Report
Central Oregon Intergovernmental Council
COIC - Nelson\Nygaard Consulting Associates Inc. – DKS Associates | 7-18
There does not appear to be a need to make significant investments in intercommunity
corridor capacity through 2030. This finding does not apply to more-local needs, such as
intersection improvements, or other considerations such as safety, freight mobility, or
access to key destinations, which were outside the scope of this study.
If there is a need to increase capacity on the Bend-Redmond corridor between now and
2030 (i.e. if travel demand increases more than anticipated), significant increases in
transit and vanpool investment would be a viable tool for shifting travel demand from
SOVs due to the high % of intercommunity travel on the corridor.
Consider a strategic package of investments in marketing and incentives to expand the
provision of vanpools, which appear to be under-utilized in the region, and which require
only modest investment in operations and capital.
When planning services and weighing investment options, CET managers should
consider the interaction between potential Community Connector shuttle ridership and
the provision of local fixed-route services. In other words, sufficient local service on
either end will be required to support CC shuttle ridership.
CET should consider moving service from the Sisters-Redmond corridor to the Sisters-
Bend corridor due to the considerably-higher market potential on the latter (this is
already proposed in the draft Regional Transit Master Plan).
Local governments could consider the development of transit-supportive and walkable
land use and community/urban form when updating Transportation System Plans and
Comprehensive Plans as a complement to developing more robust non-SOV
transportation options.
Invest in the Drive Less Connect program to expand outreach demonstrating to inter-
community travelers the cost savings of shifting to vanpool or transit.
Shelve any plans to consider commuter rail investments, at least through 2030, unless
fundamental underlying factors change39, due to the extremely high ratio of capital costs
per new passengers as compared to transit and vanpool programs. Although thresholds
were not developed as part of the scope of this project, regional population and
employment whole numbers and densities would have to increase considerably before
commuter rail would approach reasonable cost/benefit calculations.
If federal, state, or local policies to reduce GHGs and/or VMTs become more aggressive,
including either tangible incentives or penalties, focusing transit and vanpool
investments on the longer-distance corridors and Bend-Redmond will produce the best
results.
If federal, state, or local public health policies become more aggressive, including either
tangible incentives or penalties, implementation of more fixed-route types of service
(both intercommunity and local) should be considered as part of the overall strategy.
Consideration should be given to whether or not groups like the Central Oregon Area
Commission on Transportation (COACT) should support VMT-based pricing as a
replacement for the gas tax, which is generating less revenue over time due to increases in
39 E.g. vast increases in regional population or gas prices, extremely high VMT fees, etc.

CENTRAL OREGON STRATEGIC TRANSPORTATION OPTIONS PLAN | Final Report
Central Oregon Intergovernmental Council
COIC - Nelson\Nygaard Consulting Associates Inc. – DKS Associates | 7-19
average gas mileage. This study shows that VMT pricing will demonstrably help shift
users to non-SOV modes. In order to close the loop on this model, VMT pricing revenues
should, unlike the current state gas tax, be allowed for expenditure on transit, vanpools,
and other non-SOV programs and projects.
Related Documents