BEESL-R01-09-09-COE-TAD-Final Report Page 1 of 25 Creating Innovations to improve built and urban environments CENTER OF EXCELLENCE-TECHNOLOGY APPLICATION and DEVELOPMENT (COE-TAD) FINAL SUMMARY REPORT Air Cleaning Technologies for Indoor Air Quality (ACT-IAQ): Growing Fresh and Clean Air Project Director: Martin Mittelmark Address: Phytofilter Technologies, Inc., Saratoga Springs, NY Phone: 1- 518-507-6399 Email: [email protected] Principal Investigator: Jianshun (Jensen) S. Zhang Department: Mechanical and Aerospace Engineering Address: 149 Link Hall Syracuse University Syracuse, NY 13244-1240 Phone: 1-315-443-1366 Email: [email protected] Research Assistant: Zhiqiang Wang Email: [email protected] Building Energy and Environmental Systems Laboratory (http://BEESL.syr.edu/) Ref: COE-TAD Internal Report No. BEESL-R01-09-09-COE-TAD-Final Report Distribution: Syracuse COE

Welcome message from author
This document is posted to help you gain knowledge. Please leave a comment to let me know what you think about it! Share it to your friends and learn new things together.
Transcript
BEESL-R01-09-09-COE-TAD-Final Report Page 1 of 25
Creating Innovations to improve built and urban environments
CENTER OF EXCELLENCE-TECHNOLOGY APPLICATION and
DEVELOPMENT (COE-TAD)
FINAL SUMMARY REPORT
Air Cleaning Technologies for Indoor Air Quality (ACT-IAQ): Growing Fresh and Clean Air
Project Director: Martin Mittelmark Address: Phytofilter Technologies, Inc.,
Saratoga Springs, NY Phone: 1- 518-507-6399
Email: [email protected]
Principal Investigator: Jianshun (Jensen) S. Zhang Department: Mechanical and Aerospace Engineering Address: 149 Link Hall
Syracuse University Syracuse, NY 13244-1240
Phone: 1-315-443-1366 Email: [email protected]
Research Assistant: Zhiqiang Wang Email: [email protected]
Building Energy and Environmental Systems Laboratory (http://BEESL.syr.edu/) Ref: COE-TAD Internal Report No. BEESL-R01-09-09-COE-TAD-Final Report Distribution: Syracuse COE
martin
Highlight
martin
Highlight
martin
Highlight
BEESL-R01-09-09-COE-TAD-Final Report Page 2 of 25
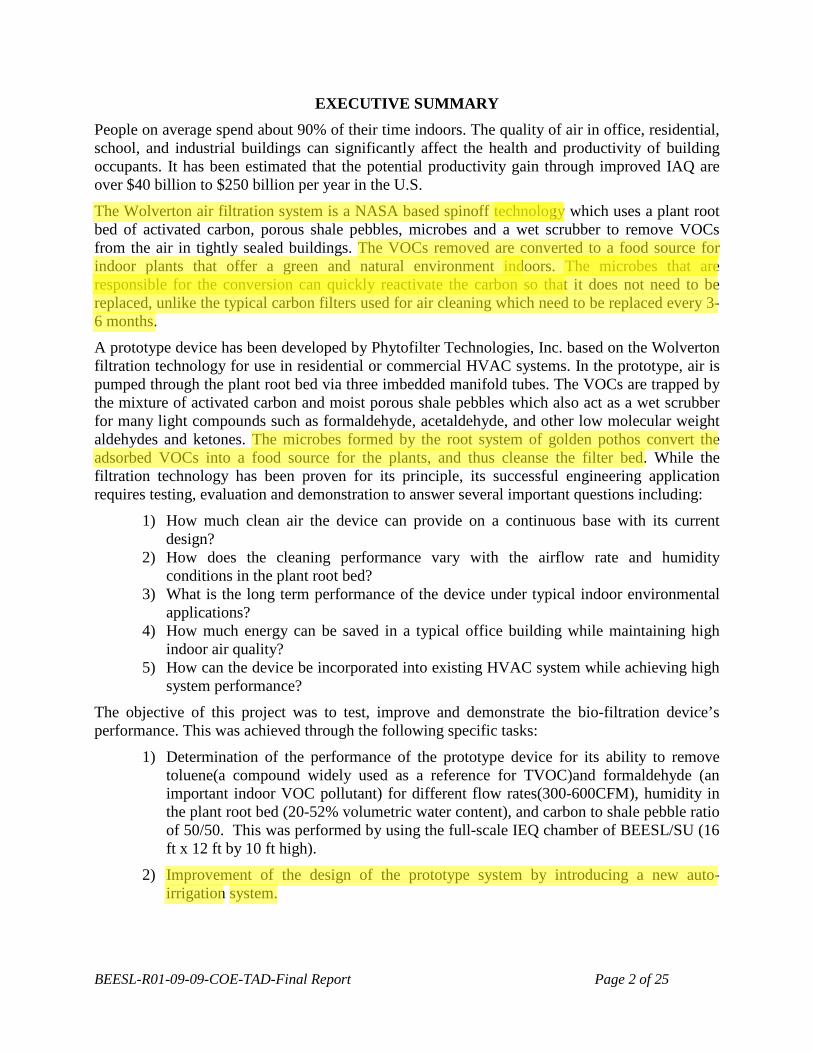
EXECUTIVE SUMMARY People on average spend about 90% of their time indoors. The quality of air in office, residential, school, and industrial buildings can significantly affect the health and productivity of building occupants. It has been estimated that the potential productivity gain through improved IAQ are over $40 billion to $250 billion per year in the U.S.
The Wolverton air filtration system is a NASA based spinoff technology which uses a plant root bed of activated carbon, porous shale pebbles, microbes and a wet scrubber to remove VOCs from the air in tightly sealed buildings. The VOCs removed are converted to a food source for indoor plants that offer a green and natural environment indoors. The microbes that are responsible for the conversion can quickly reactivate the carbon so that it does not need to be replaced, unlike the typical carbon filters used for air cleaning which need to be replaced every 3-6 months.
A prototype device has been developed by Phytofilter Technologies, Inc. based on the Wolverton filtration technology for use in residential or commercial HVAC systems. In the prototype, air is pumped through the plant root bed via three imbedded manifold tubes. The VOCs are trapped by the mixture of activated carbon and moist porous shale pebbles which also act as a wet scrubber for many light compounds such as formaldehyde, acetaldehyde, and other low molecular weight aldehydes and ketones. The microbes formed by the root system of golden pothos convert the adsorbed VOCs into a food source for the plants, and thus cleanse the filter bed. While the filtration technology has been proven for its principle, its successful engineering application requires testing, evaluation and demonstration to answer several important questions including:
1) How much clean air the device can provide on a continuous base with its current design?
2) How does the cleaning performance vary with the airflow rate and humidity conditions in the plant root bed?
3) What is the long term performance of the device under typical indoor environmental applications?
4) How much energy can be saved in a typical office building while maintaining high indoor air quality?
5) How can the device be incorporated into existing HVAC system while achieving high system performance?
The objective of this project was to test, improve and demonstrate the bio-filtration device’s performance. This was achieved through the following specific tasks:
1) Determination of the performance of the prototype device for its ability to remove toluene(a compound widely used as a reference for TVOC)and formaldehyde (an important indoor VOC pollutant) for different flow rates(300-600CFM), humidity in the plant root bed (20-52% volumetric water content), and carbon to shale pebble ratio of 50/50. This was performed by using the full-scale IEQ chamber of BEESL/SU (16 ft x 12 ft by 10 ft high).
2) Improvement of the design of the prototype system by introducing a new auto-irrigation system.
martin
Highlight
martin
Highlight
martin
Highlight
martin
Highlight
martin
Highlight
martin
Highlight
martin
Highlight
martin
Highlight
martin
Highlight
martin
Highlight
BEESL-R01-09-09-COE-TAD-Final Report Page 3 of 25
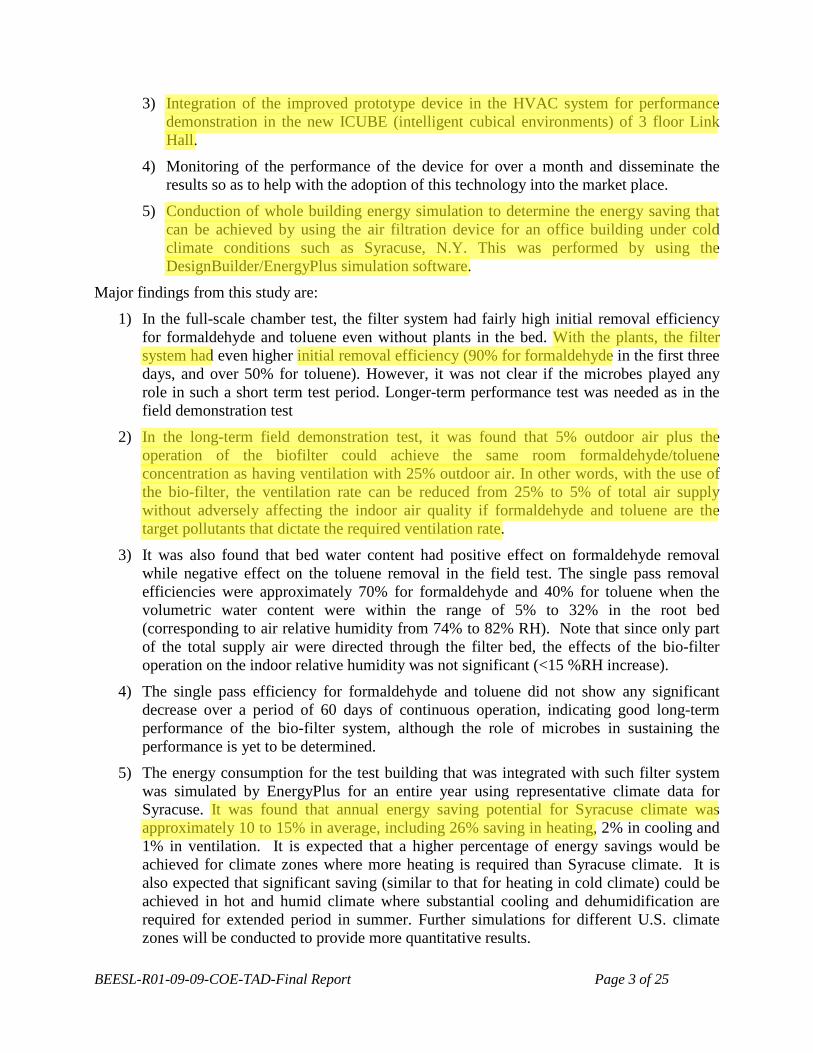
3) Integration of the improved prototype device in the HVAC system for performance demonstration in the new ICUBE (intelligent cubical environments) of 3 floor Link Hall.
4) Monitoring of the performance of the device for over a month and disseminate the results so as to help with the adoption of this technology into the market place.
5) Conduction of whole building energy simulation to determine the energy saving that can be achieved by using the air filtration device for an office building under cold climate conditions such as Syracuse, N.Y. This was performed by using the DesignBuilder/EnergyPlus simulation software.
Major findings from this study are:
1) In the full-scale chamber test, the filter system had fairly high initial removal efficiency for formaldehyde and toluene even without plants in the bed. With the plants, the filter system had even higher initial removal efficiency (90% for formaldehyde in the first three days, and over 50% for toluene). However, it was not clear if the microbes played any role in such a short term test period. Longer-term performance test was needed as in the field demonstration test
2) In the long-term field demonstration test, it was found that 5% outdoor air plus the operation of the biofilter could achieve the same room formaldehyde/toluene concentration as having ventilation with 25% outdoor air. In other words, with the use of the bio-filter, the ventilation rate can be reduced from 25% to 5% of total air supply without adversely affecting the indoor air quality if formaldehyde and toluene are the target pollutants that dictate the required ventilation rate.
3) It was also found that bed water content had positive effect on formaldehyde removal while negative effect on the toluene removal in the field test. The single pass removal efficiencies were approximately 70% for formaldehyde and 40% for toluene when the volumetric water content were within the range of 5% to 32% in the root bed (corresponding to air relative humidity from 74% to 82% RH). Note that since only part of the total supply air were directed through the filter bed, the effects of the bio-filter operation on the indoor relative humidity was not significant (<15 %RH increase).
4) The single pass efficiency for formaldehyde and toluene did not show any significant decrease over a period of 60 days of continuous operation, indicating good long-term performance of the bio-filter system, although the role of microbes in sustaining the performance is yet to be determined.
5) The energy consumption for the test building that was integrated with such filter system was simulated by EnergyPlus for an entire year using representative climate data for Syracuse. It was found that annual energy saving potential for Syracuse climate was approximately 10 to 15% in average, including 26% saving in heating, 2% in cooling and 1% in ventilation. It is expected that a higher percentage of energy savings would be achieved for climate zones where more heating is required than Syracuse climate. It is also expected that significant saving (similar to that for heating in cold climate) could be achieved in hot and humid climate where substantial cooling and dehumidification are required for extended period in summer. Further simulations for different U.S. climate zones will be conducted to provide more quantitative results.
martin
Highlight
martin
Highlight
martin
Highlight
martin
Highlight
martin
Highlight
martin
Highlight
martin
Highlight
martin
Highlight
martin
Highlight
BEESL-R01-09-09-COE-TAD-Final Report Page 4 of 25
TABLE OF CONTENT EXECUTIVE SUMMARY .............................................................................................................. 2
TABLE OF CONTENT ................................................................................................................... 4
1. INTRODUCTION ........................................................................................................................ 5
2. METHODS ................................................................................................................................... 7
3. RESULTS AND DISCUSSIONS ................................................................................................ 8
3.1 Prototype Improvement and Laboratory Evaluation .............................................................. 8
3.1.1 Prototype Improvement ................................................................................................. 8
3.1.2 Laboratory Evaluation ................................................................................................... 8
3.2 Full-scale Field Performance Demonstration ....................................................................... 12
3.2.1 Test method ................................................................................................................. 12
3.2.2 Test Results ................................................................................................................. 13
3.3 Simulation and Analysis of the Potential Energy Savings via Air Cleaning........................ 15
3.3.1 Model description ........................................................................................................ 15
3.3.2 Simulation Results ....................................................................................................... 16
3.4 Mechanistic Modeling of the Performance of the Bio-filtration System ............................. 17
3.5 Conclusions .......................................................................................................................... 18
APPENDIX A FULL-SCALE CHAMBER PULL-DOWN TEST PROCEDURE ...................... 20
A.1 Test facility and instrument ................................................................................................. 20
A.2 Test procedure ..................................................................................................................... 20
A.3 Calculation of CADR and Removal Efficiency .................................................................. 21
APPENDIX B FULL-SCALE FIELD APPLICATION TEST PROCEDURE............................. 24
B.1 Source introduction .............................................................................................................. 24
B.2 VOCs identification ............................................................................................................. 24
B.3 Filter bed single pass efficiency measurement .................................................................... 25
B.3.1 Test procedure ............................................................................................................. 25
B.4 Test room contaminants concentration monitoring ............................................................. 26
B.4.1 Test procedure ............................................................................................................. 26
BEESL-R01-09-09-COE-TAD-Final Report Page 5 of 25
1. INTRODUCTION Test results from a previous NYSERDA, National Grid, NYIEQ and SU-sponsored project on the performance evaluation of existing air cleaning technologies show that none of the currently available air cleaning products can effectively remove all types of volatile organic compounds typically found in office and residential buildings. Technologies used in these products included: sorption by activated carbon, ultraviolet photocatalytic oxidization or UV-PCO, plasma ionization, ozone ionization, and soil filtration. Failure of the existing products in removing the indoor pollutants include inadequate selection of filter media, poor airflow management inside the cleaning devices, insufficient catalytic reaction surface area, or poor distribution of UV light irradiation. Therefore, it is necessary to develop an integrated technology in which a combination of different filtration media or air cleaning technologies may be used for removing targeted contaminants for a given indoor environment.
The Wolverton air filtration system, a NASA based spinoff technology, presents a unique opportunity for developing and commercializing such an integrated air cleaning device. It uses a plant root bed of activated carbon, porous shale pebbles, microbes and a wet scrubber to remove VOCs and radon from the air in tightly sealed buildings. The VOCs removed are converted into a food source for the indoor plants that also offer a green and natural environment indoors. The microbes that are responsible for the conversion can quickly reactivate the carbon eliminating the need for replacement unlike the typical carbon filters used for air cleaning which need to be replaced every 3-6 months.
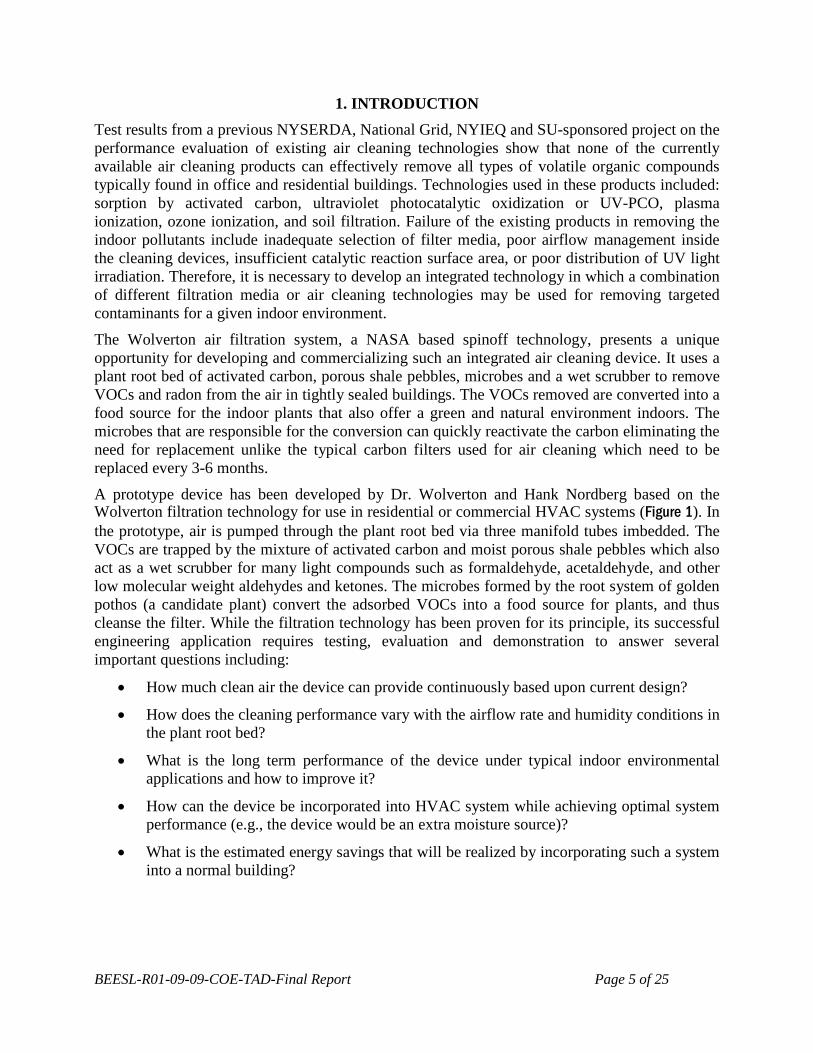
A prototype device has been developed by Dr. Wolverton and Hank Nordberg based on the Wolverton filtration technology for use in residential or commercial HVAC systems (Figure 1). In the prototype, air is pumped through the plant root bed via three manifold tubes imbedded. The VOCs are trapped by the mixture of activated carbon and moist porous shale pebbles which also act as a wet scrubber for many light compounds such as formaldehyde, acetaldehyde, and other low molecular weight aldehydes and ketones. The microbes formed by the root system of golden pothos (a candidate plant) convert the adsorbed VOCs into a food source for plants, and thus cleanse the filter. While the filtration technology has been proven for its principle, its successful engineering application requires testing, evaluation and demonstration to answer several important questions including:
• How much clean air the device can provide continuously based upon current design?
• How does the cleaning performance vary with the airflow rate and humidity conditions in the plant root bed?
• What is the long term performance of the device under typical indoor environmental applications and how to improve it?
• How can the device be incorporated into HVAC system while achieving optimal system performance (e.g., the device would be an extra moisture source)?
• What is the estimated energy savings that will be realized by incorporating such a system into a normal building?
BEESL-R01-09-09-COE-TAD-Final Report Page 6 of 25
Activated carbon Shale pebbles Microbes
Purified air
Room/HVACreturn air
Water level
Activated carbon Shale pebbles Microbes
Purified air
Room/HVACreturn air
Water level
Figure 1 Principle of a Wolverton filtration system
The filtration bed is the plant’s root and “soil” system consisting of activated carbon, special porous shale pebbles, plant’s roots, microbes and moisture transported via the porous shale pebbles. Room or HVAC return air is drawn through the filtration bed by the negative pressure created in three perforated tubes, which are manifolded and connected to a fan for air delivery. As air passes through the filtration bed, VOCs in the air are adsorbed by activated carbon and/or trapped in shale pebbles, the microbes in the plant’s root system convert the VOCs into food for the plant and regenerate the filtration bed for adsorbing/trapping VOCs. The purified air can be delivered to occupied spaces directly or via the conventional/existing HVAC system.
The objective of this study was to test, improve and demonstrate the bio-filtration device’s performance for removing volatile organic compounds in indoor air and potential for saving energy while achieving good indoor air quality.
BEESL-R01-09-09-COE-TAD-Final Report Page 7 of 25
2. METHODS To achieve the study objectives, we performed the following tasks:
1) Determination of the performance of the prototype device for its ability to remove toluene (a compound widely used as a reference for TVOC) and formaldehyde (an important indoor VOC pollutant) for different flow rates (300-600CFM), humidity in the plant root bed (20-52% volumetric water content), and carbon to shale pebble ratio of 50/50. This was performed by using the full-scale IEQ chamber of BEESL/SU (16 ft x 12 ft by 10 ft high).
2) Improvement of the design of the prototype system by introducing a new auto-irrigation system.
3) Integration of the improved prototype device in the HVAC system for performance demonstration in the new ICUBE (intelligent cubical environments) of 3 floor Link Hall.
4) Monitoring of the performance of the device for over a month and disseminate the results so as to help with the adoption of this technology into the market place.
5) Conduction of whole building energy simulation to determine the energy saving that can be achieved by using the air filtration device for an office building under cold climate conditions such as Syracuse, N.Y. This was performed by using the DesignBuilder/EnergyPlus simulation software.
The study was focused on the removal of important volatile organic compounds that have most significant impact on IAQ including formaldehyde (a carcinogen) and toluene (which represents different type of chemical classes of VOCs typically found indoors).
BEESL-R01-09-09-COE-TAD-Final Report Page 8 of 25
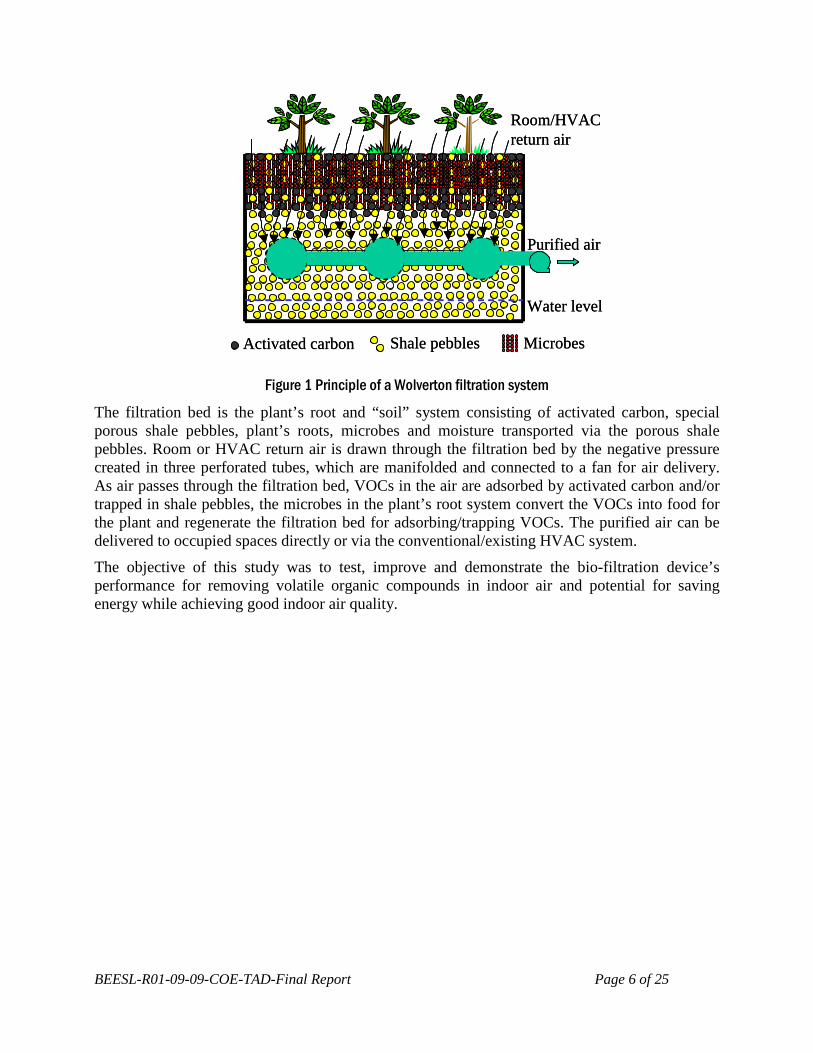
3. RESULTS AND DISCUSSIONS 3.1 Prototype Improvement and Laboratory Evaluation 3.1.1 Prototype Improvement From the preliminary tests conducted in the full-scale IEQ chamber, it was found that with the original design, the plant in the bed could not obtain sufficient water from the bottom by “capillary effect” due to relatively strong air flow through the root bed, coming from the top. Modification was made on the prototype by adding irrigation water at the top, and the irrigation water was recirculated to avoid the loss of microbial in the root system. Figure 2 shows the modified filter system.
(a) Schematic (b) Real photo
Figure 2 Modified bio-filtration system
3.1.2 Laboratory Evaluation a. VOC removal performance test of the bio-filter system without plants The tests for characterizing the performance of the media filter in terms of VOC removal were carried out in a full-scale stainless steel environmental chamber, which has a dimension of 16 ft long x 12 ft wide x 10 ft high (4.84 m long x 3.63 m wide x 3.05 m high) and an interior volume of 1920 ft3
(54.4 m3). An INNOVA 1312 Photoacoustic Multi-gas Monitor was used for online measurements of the concentration of toluene equivalent (TVOCtoluene), the concentration of formaldehyde (Cformal), and the concentration of tracer gas (SF
6). The detailed chamber pull-down
test procedure can be found in Appendix A.
The formal VOC removal performance tests were conducted at 3 air flow rates through the filter bed (150 CFM, 350 CFM and 550 CFM), and 3 volumetric water content(VWC) set-points for the media (50%, 35% and 20% VWC), totally 9 different combinations. The air flow rate through the filter bed was adjusted by varying the speed of the fan and an orifice located in the inlet of the
BEESL-R01-09-09-COE-TAD-Final Report Page 9 of 25
fan, and the moisture of the media is controlled by a soil water content sensor with range from 0 to 50% VWC. Results are summarized in the following sections:
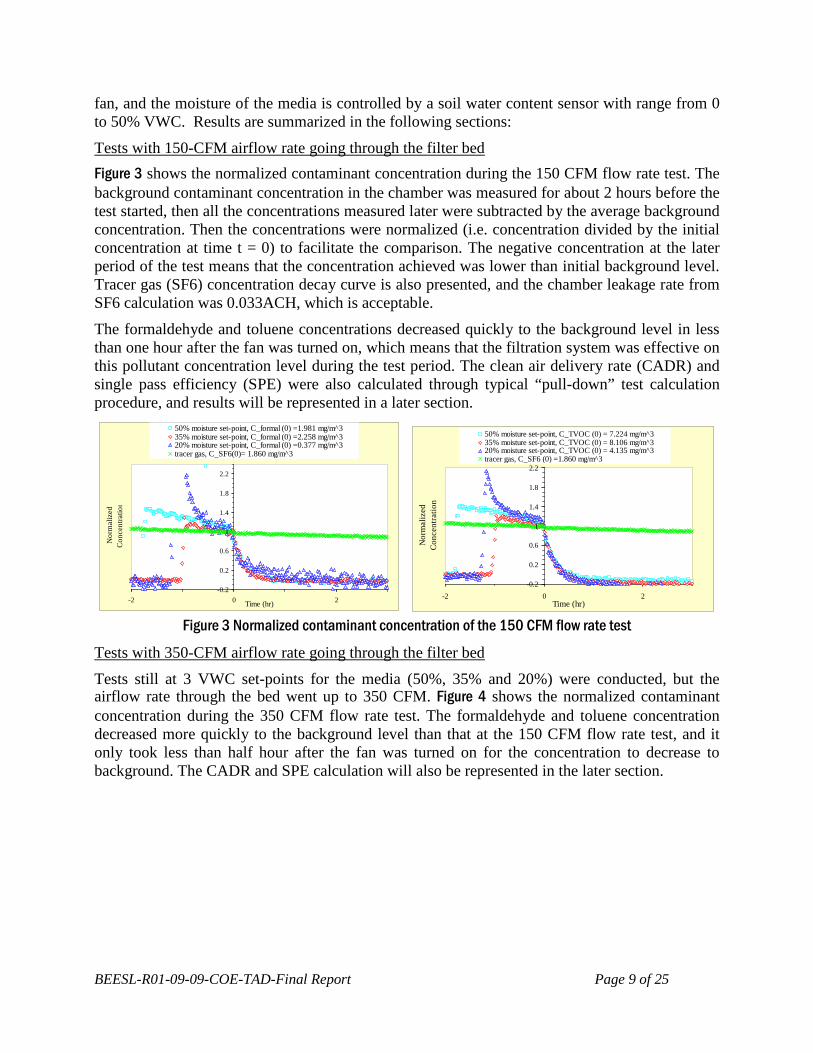
Tests with 150-CFM airflow rate going through the filter bed Figure 3 shows the normalized contaminant concentration during the 150 CFM flow rate test. The background contaminant concentration in the chamber was measured for about 2 hours before the test started, then all the concentrations measured later were subtracted by the average background concentration. Then the concentrations were normalized (i.e. concentration divided by the initial concentration at time t = 0) to facilitate the comparison. The negative concentration at the later period of the test means that the concentration achieved was lower than initial background level. Tracer gas (SF6) concentration decay curve is also presented, and the chamber leakage rate from SF6 calculation was 0.033ACH, which is acceptable.
The formaldehyde and toluene concentrations decreased quickly to the background level in less than one hour after the fan was turned on, which means that the filtration system was effective on this pollutant concentration level during the test period. The clean air delivery rate (CADR) and single pass efficiency (SPE) were also calculated through typical “pull-down” test calculation procedure, and results will be represented in a later section.
-0.2
0.2
0.6
1
1.4
1.8
2.2
-2 0 2Time (hr)
Nor
mal
ized
Con
cent
ratio
n
50% moisture set-point, C_formal (0) =1.981 mg/m^335% moisture set-point, C_formal (0) =2.258 mg/m^320% moisture set-point, C_formal (0) =0.377 mg/m^3tracer gas, C_SF6(0)= 1.860 mg/m^3
-0.2
0.2
0.6
1
1.4
1.8
2.2
-2 0 2Time (hr)
Nor
mal
ized
Conc
entra
tion
50% moisture set-point, C_TVOC (0) = 7.224 mg/m^335% moisture set-point, C_TVOC (0) = 8.106 mg/m^320% moisture set-point, C_TVOC (0) = 4.135 mg/m^3tracer gas, C_SF6 (0) =1.860 mg/m^3
Figure 3 Normalized contaminant concentration of the 150 CFM flow rate test
Tests with 350-CFM airflow rate going through the filter bed
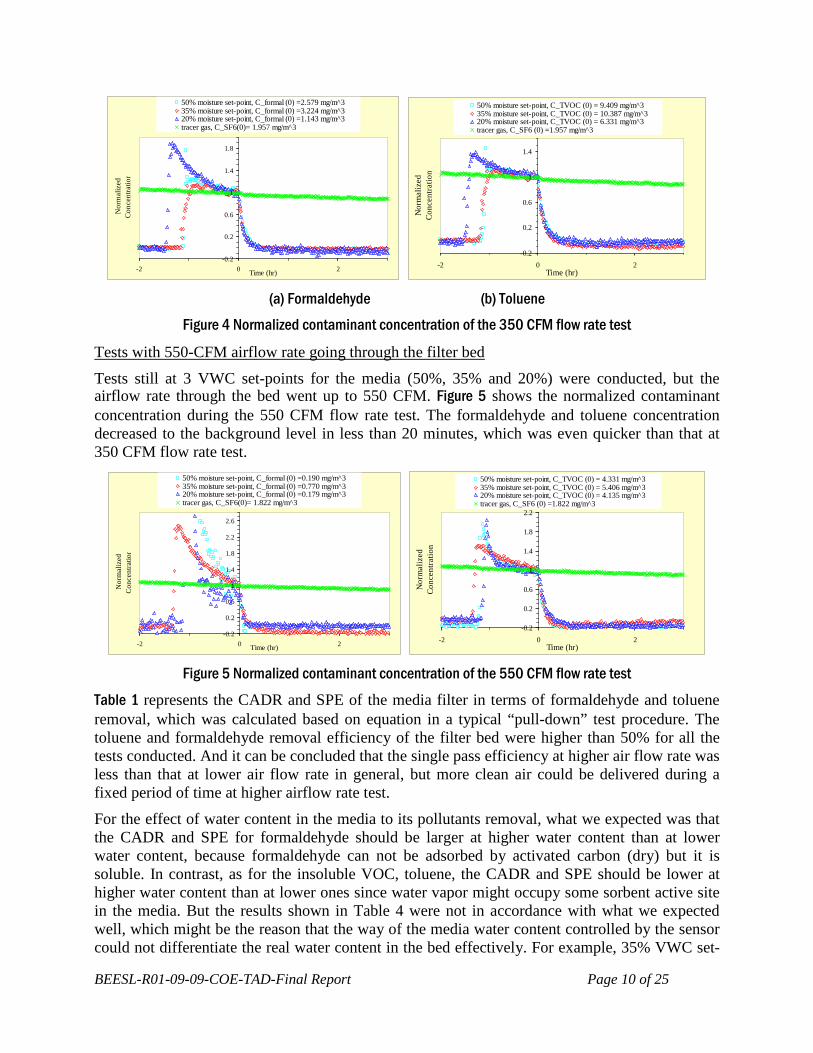
Tests still at 3 VWC set-points for the media (50%, 35% and 20%) were conducted, but the airflow rate through the bed went up to 350 CFM. Figure 4 shows the normalized contaminant concentration during the 350 CFM flow rate test. The formaldehyde and toluene concentration decreased more quickly to the background level than that at the 150 CFM flow rate test, and it only took less than half hour after the fan was turned on for the concentration to decrease to background. The CADR and SPE calculation will also be represented in the later section.
BEESL-R01-09-09-COE-TAD-Final Report Page 10 of 25
-0.2
0.2
0.6
1
1.4
1.8
-2 0 2Time (hr)
Nor
mal
ized
Con
cent
ratio
n
50% moisture set-point, C_formal (0) =2.579 mg/m^335% moisture set-point, C_formal (0) =3.224 mg/m^320% moisture set-point, C_formal (0) =1.143 mg/m^3tracer gas, C_SF6(0)= 1.957 mg/m^3
-0.2
0.2
0.6
1
1.4
-2 0 2Time (hr)
Nor
mal
ized
Conc
entra
tion
50% moisture set-point, C_TVOC (0) = 9.409 mg/m^335% moisture set-point, C_TVOC (0) = 10.387 mg/m^320% moisture set-point, C_TVOC (0) = 6.331 mg/m^3tracer gas, C_SF6 (0) =1.957 mg/m^3
(a) Formaldehyde (b) Toluene
Figure 4 Normalized contaminant concentration of the 350 CFM flow rate test
Tests with 550-CFM airflow rate going through the filter bed
Tests still at 3 VWC set-points for the media (50%, 35% and 20%) were conducted, but the airflow rate through the bed went up to 550 CFM. Figure 5 shows the normalized contaminant concentration during the 550 CFM flow rate test. The formaldehyde and toluene concentration decreased to the background level in less than 20 minutes, which was even quicker than that at 350 CFM flow rate test.
-0.2
0.2
0.6
1
1.4
1.8
2.2
2.6
-2 0 2Time (hr)
Nor
mal
ized
Con
cent
ratio
n
50% moisture set-point, C_formal (0) =0.190 mg/m^335% moisture set-point, C_formal (0) =0.770 mg/m^320% moisture set-point, C_formal (0) =0.179 mg/m^3tracer gas, C_SF6(0)= 1.822 mg/m^3
-0.2
0.2
0.6
1
1.4
1.8
2.2
-2 0 2Time (hr)
Nor
mal
ized
Conc
entra
tion
50% moisture set-point, C_TVOC (0) = 4.331 mg/m^335% moisture set-point, C_TVOC (0) = 5.406 mg/m^320% moisture set-point, C_TVOC (0) = 4.135 mg/m^3tracer gas, C_SF6 (0) =1.822 mg/m^3
Figure 5 Normalized contaminant concentration of the 550 CFM flow rate test
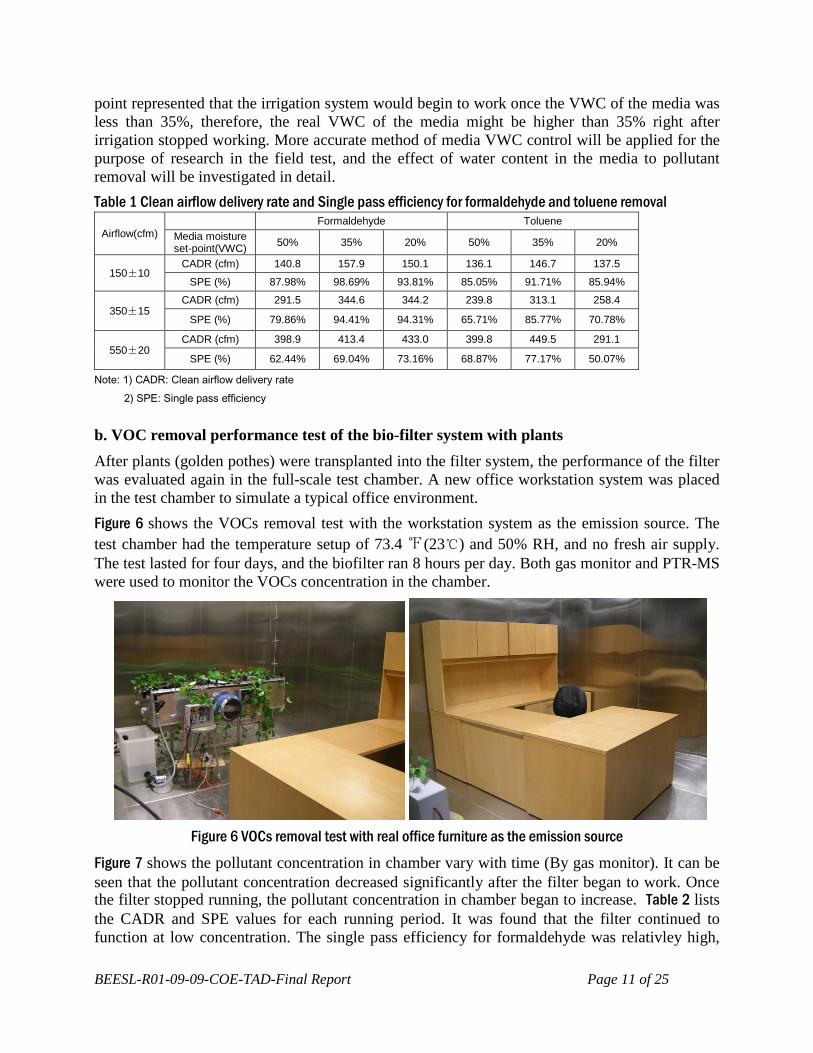
Table 1 represents the CADR and SPE of the media filter in terms of formaldehyde and toluene removal, which was calculated based on equation in a typical “pull-down” test procedure. The toluene and formaldehyde removal efficiency of the filter bed were higher than 50% for all the tests conducted. And it can be concluded that the single pass efficiency at higher air flow rate was less than that at lower air flow rate in general, but more clean air could be delivered during a fixed period of time at higher airflow rate test.
For the effect of water content in the media to its pollutants removal, what we expected was that the CADR and SPE for formaldehyde should be larger at higher water content than at lower water content, because formaldehyde can not be adsorbed by activated carbon (dry) but it is soluble. In contrast, as for the insoluble VOC, toluene, the CADR and SPE should be lower at higher water content than at lower ones since water vapor might occupy some sorbent active site in the media. But the results shown in Table 4 were not in accordance with what we expected well, which might be the reason that the way of the media water content controlled by the sensor could not differentiate the real water content in the bed effectively. For example, 35% VWC set-
BEESL-R01-09-09-COE-TAD-Final Report Page 11 of 25
point represented that the irrigation system would begin to work once the VWC of the media was less than 35%, therefore, the real VWC of the media might be higher than 35% right after irrigation stopped working. More accurate method of media VWC control will be applied for the purpose of research in the field test, and the effect of water content in the media to pollutant removal will be investigated in detail. Table 1 Clean airflow delivery rate and Single pass efficiency for formaldehyde and toluene removal
Airflow(cfm) Formaldehyde Toluene
Media moisture set-point(VWC) 50% 35% 20% 50% 35% 20%
150±10 CADR (cfm) 140.8 157.9 150.1 136.1 146.7 137.5
SPE (%) 87.98% 98.69% 93.81% 85.05% 91.71% 85.94%
350±15 CADR (cfm) 291.5 344.6 344.2 239.8 313.1 258.4
SPE (%) 79.86% 94.41% 94.31% 65.71% 85.77% 70.78%
550±20 CADR (cfm) 398.9 413.4 433.0 399.8 449.5 291.1
SPE (%) 62.44% 69.04% 73.16% 68.87% 77.17% 50.07%
Note: 1) CADR: Clean airflow delivery rate 2) SPE: Single pass efficiency
b. VOC removal performance test of the bio-filter system with plants After plants (golden pothes) were transplanted into the filter system, the performance of the filter was evaluated again in the full-scale test chamber. A new office workstation system was placed in the test chamber to simulate a typical office environment. Figure 6 shows the VOCs removal test with the workstation system as the emission source. The test chamber had the temperature setup of 73.4 ℉(23℃) and 50% RH, and no fresh air supply. The test lasted for four days, and the biofilter ran 8 hours per day. Both gas monitor and PTR-MS were used to monitor the VOCs concentration in the chamber.
Figure 6 VOCs removal test with real office furniture as the emission source
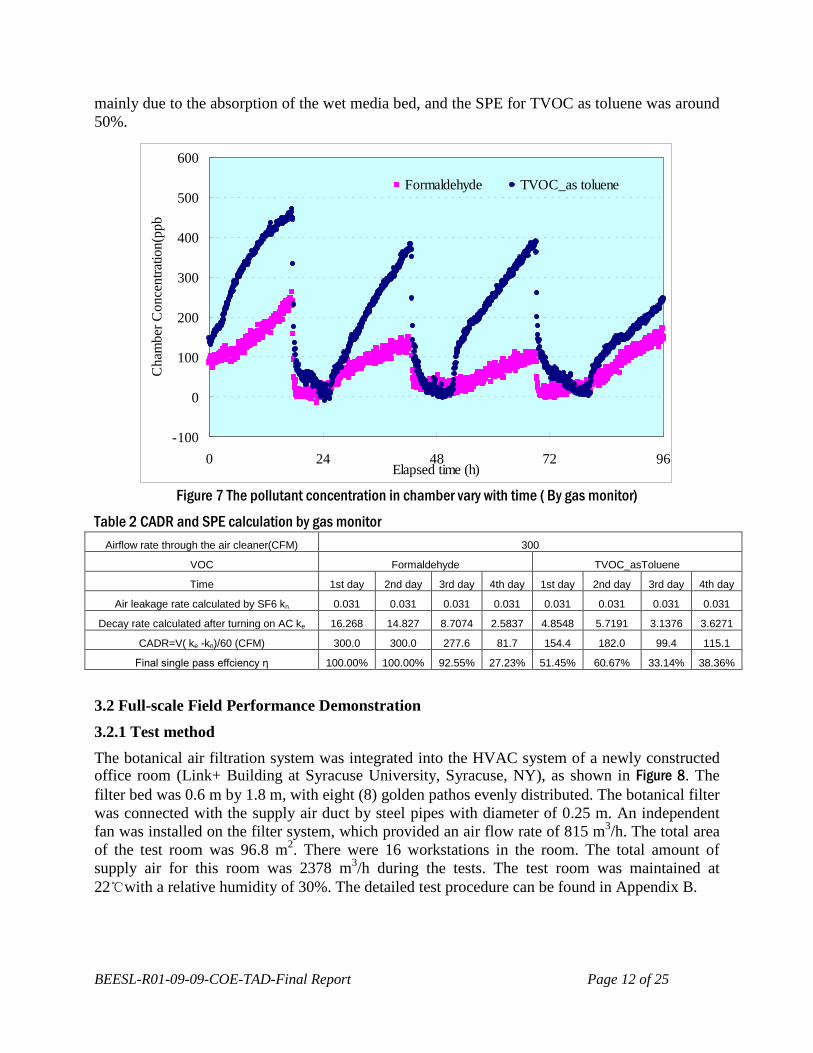
Figure 7 shows the pollutant concentration in chamber vary with time (By gas monitor). It can be seen that the pollutant concentration decreased significantly after the filter began to work. Once the filter stopped running, the pollutant concentration in chamber began to increase. Table 2 lists the CADR and SPE values for each running period. It was found that the filter continued to function at low concentration. The single pass efficiency for formaldehyde was relativley high,
BEESL-R01-09-09-COE-TAD-Final Report Page 12 of 25
mainly due to the absorption of the wet media bed, and the SPE for TVOC as toluene was around 50%.
-100
0
100
200
300
400
500
600
0 24 48 72 96Elapsed time (h)
Cha
mbe
r Con
cent
ratio
n(pp
b)
Formaldehyde TVOC_as toluene
Figure 7 The pollutant concentration in chamber vary with time ( By gas monitor)
Table 2 CADR and SPE calculation by gas monitor
Airflow rate through the air cleaner(CFM) 300
VOC Formaldehyde TVOC_asToluene
Time 1st day 2nd day 3rd day 4th day 1st day 2nd day 3rd day 4th day
Air leakage rate calculated by SF6 kn 0.031 0.031 0.031 0.031 0.031 0.031 0.031 0.031
Decay rate calculated after turning on AC ke 16.268 14.827 8.7074 2.5837 4.8548 5.7191 3.1376 3.6271
CADR=V( ke -kn)/60 (CFM) 300.0 300.0 277.6 81.7 154.4 182.0 99.4 115.1
Final single pass effciency η 100.00% 100.00% 92.55% 27.23% 51.45% 60.67% 33.14% 38.36%
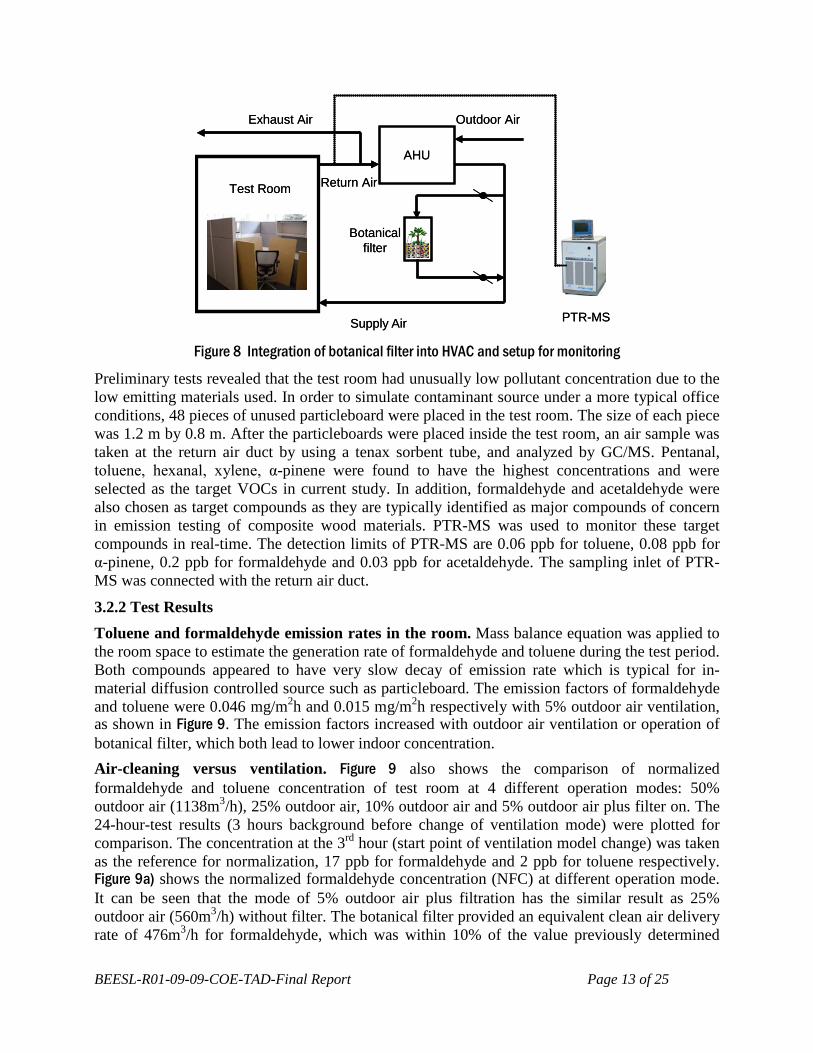
3.2 Full-scale Field Performance Demonstration 3.2.1 Test method The botanical air filtration system was integrated into the HVAC system of a newly constructed office room (Link+ Building at Syracuse University, Syracuse, NY), as shown in Figure 8. The filter bed was 0.6 m by 1.8 m, with eight (8) golden pathos evenly distributed. The botanical filter was connected with the supply air duct by steel pipes with diameter of 0.25 m. An independent fan was installed on the filter system, which provided an air flow rate of 815 m3/h. The total area of the test room was 96.8 m2. There were 16 workstations in the room. The total amount of supply air for this room was 2378 m3/h during the tests. The test room was maintained at 22℃with a relative humidity of 30%. The detailed test procedure can be found in Appendix B.
BEESL-R01-09-09-COE-TAD-Final Report Page 13 of 25
Test Room Return Air
Supply Air
AHU
Outdoor AirExhaust Air
Botanicalfilter
PTR-MS
Test Room Return Air
Supply Air
AHU
Outdoor AirExhaust Air
Botanicalfilter
PTR-MS
Figure 8 Integration of botanical filter into HVAC and setup for monitoring
Preliminary tests revealed that the test room had unusually low pollutant concentration due to the low emitting materials used. In order to simulate contaminant source under a more typical office conditions, 48 pieces of unused particleboard were placed in the test room. The size of each piece was 1.2 m by 0.8 m. After the particleboards were placed inside the test room, an air sample was taken at the return air duct by using a tenax sorbent tube, and analyzed by GC/MS. Pentanal, toluene, hexanal, xylene, α-pinene were found to have the highest concentrations and were selected as the target VOCs in current study. In addition, formaldehyde and acetaldehyde were also chosen as target compounds as they are typically identified as major compounds of concern in emission testing of composite wood materials. PTR-MS was used to monitor these target compounds in real-time. The detection limits of PTR-MS are 0.06 ppb for toluene, 0.08 ppb for α-pinene, 0.2 ppb for formaldehyde and 0.03 ppb for acetaldehyde. The sampling inlet of PTR-MS was connected with the return air duct.
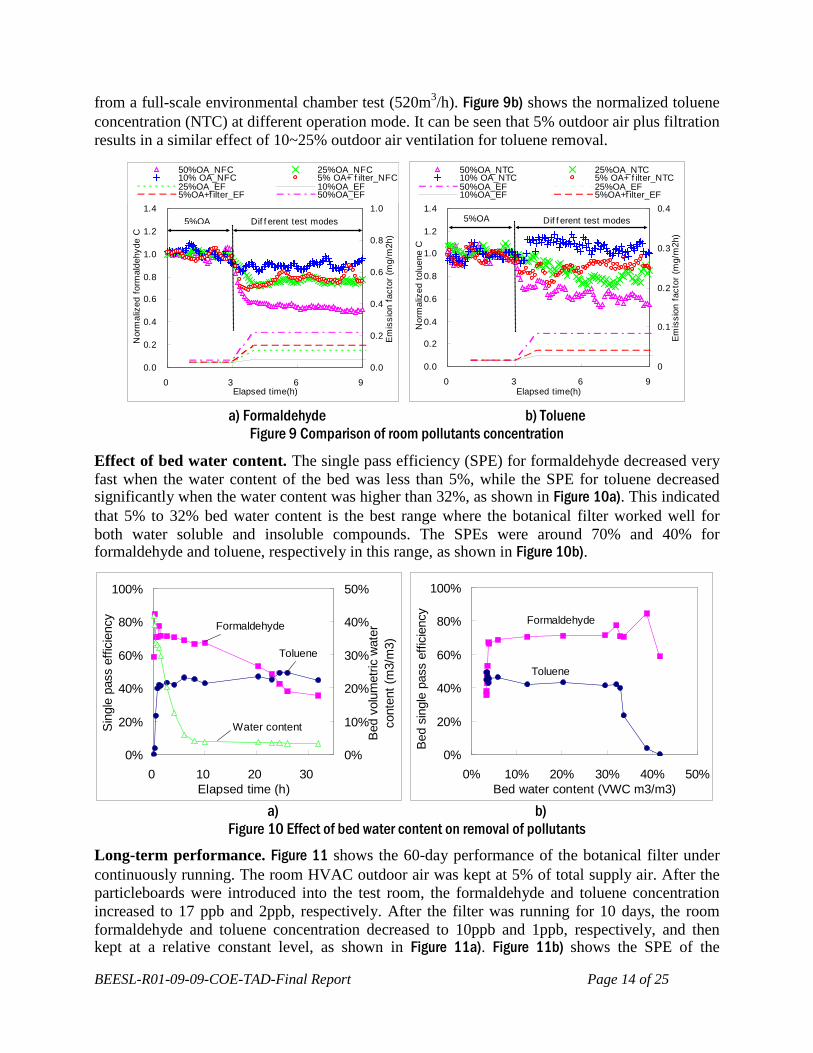
3.2.2 Test Results Toluene and formaldehyde emission rates in the room. Mass balance equation was applied to the room space to estimate the generation rate of formaldehyde and toluene during the test period. Both compounds appeared to have very slow decay of emission rate which is typical for in-material diffusion controlled source such as particleboard. The emission factors of formaldehyde and toluene were 0.046 mg/m2h and 0.015 mg/m2h respectively with 5% outdoor air ventilation, as shown in Figure 9. The emission factors increased with outdoor air ventilation or operation of botanical filter, which both lead to lower indoor concentration. Air-cleaning versus ventilation. Figure 9 also shows the comparison of normalized formaldehyde and toluene concentration of test room at 4 different operation modes: 50% outdoor air (1138m3/h), 25% outdoor air, 10% outdoor air and 5% outdoor air plus filter on. The 24-hour-test results (3 hours background before change of ventilation mode) were plotted for comparison. The concentration at the 3rd hour (start point of ventilation model change) was taken as the reference for normalization, 17 ppb for formaldehyde and 2 ppb for toluene respectively. Figure 9a) shows the normalized formaldehyde concentration (NFC) at different operation mode. It can be seen that the mode of 5% outdoor air plus filtration has the similar result as 25% outdoor air (560m3/h) without filter. The botanical filter provided an equivalent clean air delivery rate of 476m3/h for formaldehyde, which was within 10% of the value previously determined
BEESL-R01-09-09-COE-TAD-Final Report Page 14 of 25
from a full-scale environmental chamber test (520m3/h). Figure 9b) shows the normalized toluene concentration (NTC) at different operation mode. It can be seen that 5% outdoor air plus filtration results in a similar effect of 10~25% outdoor air ventilation for toluene removal.
0.0
0.2
0.4
0.6
0.8
1.0
1.2
1.4
0 3 6 9Elapsed time(h)
Nor
mal
ized
for
mal
dehy
de C
0.0
0.2
0.4
0.6
0.8
1.0
Em
issi
on f
acto
r (m
g/m
2h)
50%OA_NFC 25%OA_NFC10% OA_NFC 5% OA+ f ilter_NFC25%OA_EF 10%OA_EF5%OA+f ilter_EF 50%OA_EF
5%OA Dif f erent test modes
0.0
0.2
0.4
0.6
0.8
1.0
1.2
1.4
0 3 6 9Elapsed time(h)
Nor
mal
ized
tol
uene
C
0
0.1
0.2
0.3
0.4
Em
issi
on f
acto
r (m
g/m
2h)
50%OA_NTC 25%OA_NTC10% OA_NTC 5% OA+ f ilter_NTC50%OA_EF 25%OA_EF10%OA_EF 5%OA+f ilter_EF
5%OA Dif f erent test modes
a) Formaldehyde b) Toluene
Figure 9 Comparison of room pollutants concentration
Effect of bed water content. The single pass efficiency (SPE) for formaldehyde decreased very fast when the water content of the bed was less than 5%, while the SPE for toluene decreased significantly when the water content was higher than 32%, as shown in Figure 10a). This indicated that 5% to 32% bed water content is the best range where the botanical filter worked well for both water soluble and insoluble compounds. The SPEs were around 70% and 40% for formaldehyde and toluene, respectively in this range, as shown in Figure 10b).
0%
20%
40%
60%
80%
100%
0 10 20 30Elapsed time (h)
Sing
le p
ass
effic
ienc
y
0%
10%
20%
30%
40%
50%
Bed
volu
met
ric w
ater
cont
ent (
m3/
m3)
Formaldehyde
Toluene
Water content
0%
20%
40%
60%
80%
100%
0% 10% 20% 30% 40% 50%Bed water content (VWC m3/m3)
Bed
sing
le p
ass
effic
ienc
y
Formaldehyde
Toluene
a) b)
Figure 10 Effect of bed water content on removal of pollutants
Long-term performance. Figure 11 shows the 60-day performance of the botanical filter under continuously running. The room HVAC outdoor air was kept at 5% of total supply air. After the particleboards were introduced into the test room, the formaldehyde and toluene concentration increased to 17 ppb and 2ppb, respectively. After the filter was running for 10 days, the room formaldehyde and toluene concentration decreased to 10ppb and 1ppb, respectively, and then kept at a relative constant level, as shown in Figure 11a). Figure 11b) shows the SPE of the
BEESL-R01-09-09-COE-TAD-Final Report Page 15 of 25
botanical filter on formaldehyde and toluene during the test period as well as the water content of the media bed. The SPE for formaldehyde almost kept at constant, around 70%. The SPE for toluene was negatively influenced by the water content in the bed, but was still kept at 40% 45 days after. Note that without the botanical filter, concentrations in the spaces would have been 30% higher than current results, due to the continuous generation of toluene and formaldehyde by the sources.
0.1
1.0
10.0
100.0
0 20 40 60 80Elapsed time (day s)
Roo
m c
once
ntra
tion
(ppb
)
Formaldehy de Toluene
0%
20%
40%
60%
80%
100%
1 2 3 4 5 6 9 10 16 19 24 35 38 41 44 47 51Elapsed time (d)
Sin
gle
pass
eff
icie
ncy
0%
10%
20%
30%
40%
50%
wat
er c
onte
nt (
%V
WC
)
Forlmaldehy de Toluene bed water content
a) Room pollutant concentration b) bed single pass efficiency
Figure 11 Botanical filter 60-day performance
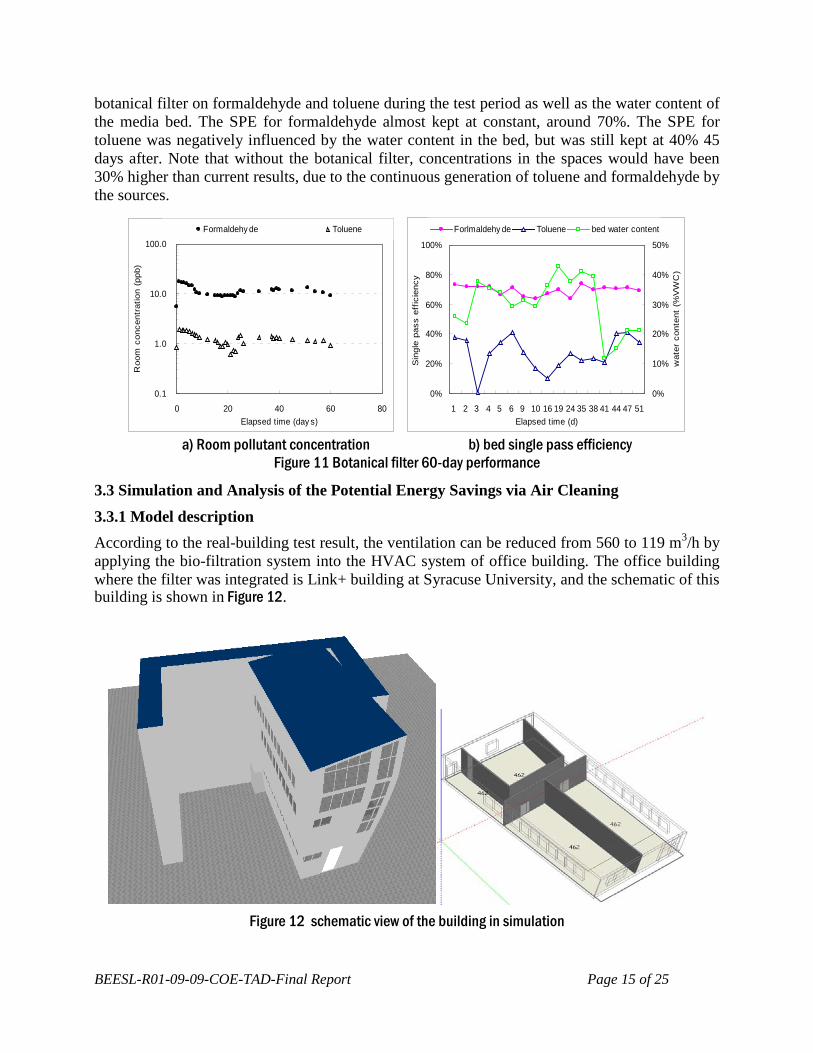
3.3 Simulation and Analysis of the Potential Energy Savings via Air Cleaning 3.3.1 Model description According to the real-building test result, the ventilation can be reduced from 560 to 119 m3/h by applying the bio-filtration system into the HVAC system of office building. The office building where the filter was integrated is Link+ building at Syracuse University, and the schematic of this building is shown in Figure 12.
Figure 12 schematic view of the building in simulation
BEESL-R01-09-09-COE-TAD-Final Report Page 16 of 25
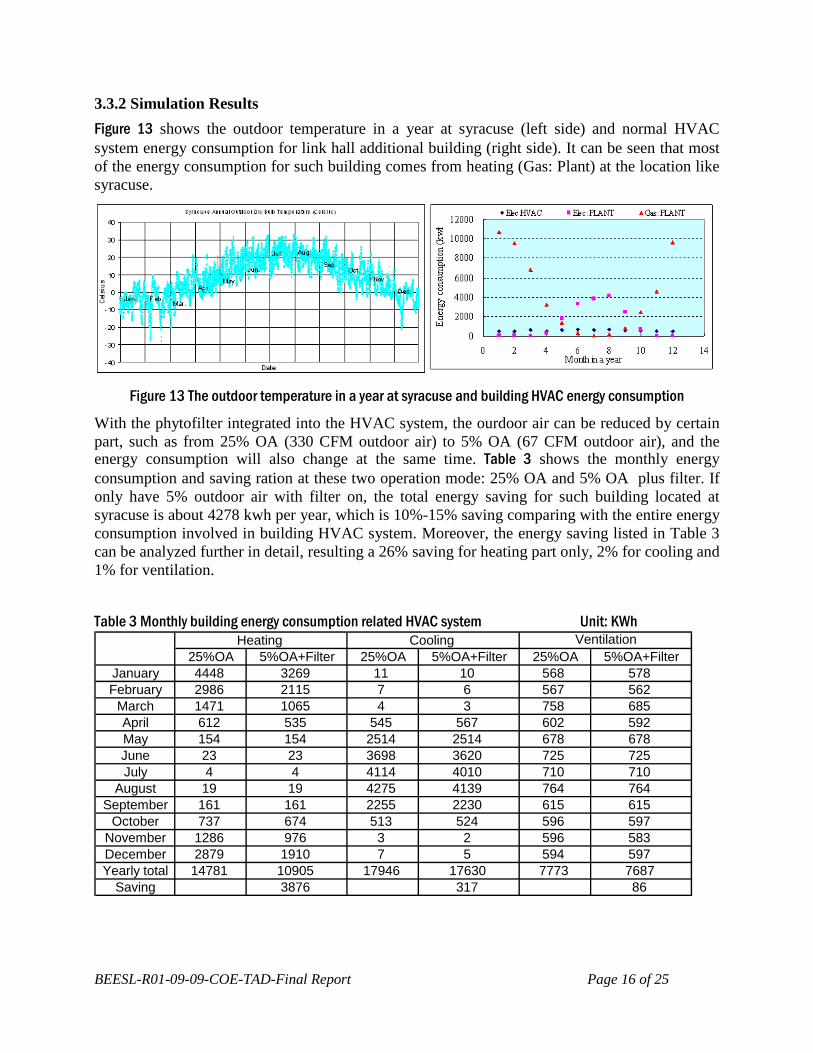
3.3.2 Simulation Results Figure 13 shows the outdoor temperature in a year at syracuse (left side) and normal HVAC system energy consumption for link hall additional building (right side). It can be seen that most of the energy consumption for such building comes from heating (Gas: Plant) at the location like syracuse.
Figure 13 The outdoor temperature in a year at syracuse and building HVAC energy consumption
With the phytofilter integrated into the HVAC system, the ourdoor air can be reduced by certain part, such as from 25% OA (330 CFM outdoor air) to 5% OA (67 CFM outdoor air), and the energy consumption will also change at the same time. Table 3 shows the monthly energy consumption and saving ration at these two operation mode: 25% OA and 5% OA plus filter. If only have 5% outdoor air with filter on, the total energy saving for such building located at syracuse is about 4278 kwh per year, which is 10%-15% saving comparing with the entire energy consumption involved in building HVAC system. Moreover, the energy saving listed in Table 3 can be analyzed further in detail, resulting a 26% saving for heating part only, 2% for cooling and 1% for ventilation.
Table 3 Monthly building energy consumption related HVAC system Unit: KWh
25%OA 5%OA+Filter 25%OA 5%OA+Filter 25%OA 5%OA+FilterJanuary 4448 3269 11 10 568 578February 2986 2115 7 6 567 562
March 1471 1065 4 3 758 685April 612 535 545 567 602 592May 154 154 2514 2514 678 678June 23 23 3698 3620 725 725July 4 4 4114 4010 710 710
August 19 19 4275 4139 764 764September 161 161 2255 2230 615 615
October 737 674 513 524 596 597November 1286 976 3 2 596 583December 2879 1910 7 5 594 597Yearly total 14781 10905 17946 17630 7773 7687
Saving 3876 317 86
Heating Cooling Ventilation
BEESL-R01-09-09-COE-TAD-Final Report Page 17 of 25
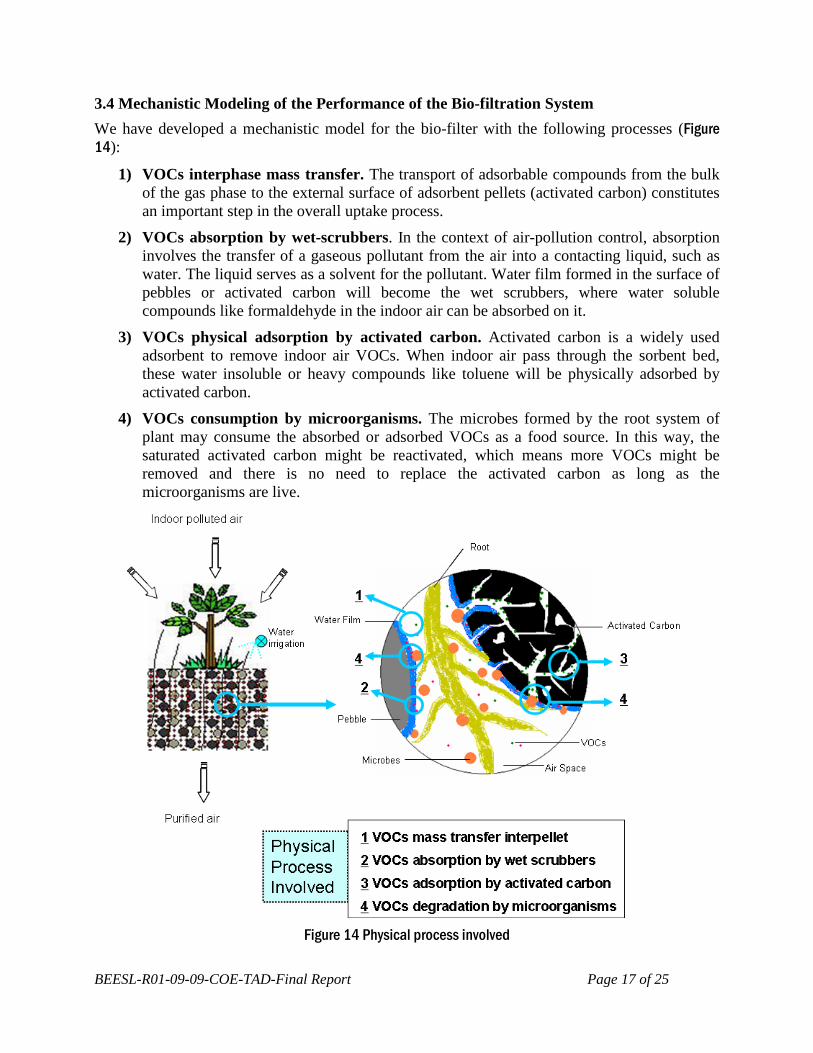
3.4 Mechanistic Modeling of the Performance of the Bio-filtration System We have developed a mechanistic model for the bio-filter with the following processes (Figure 14):
1) VOCs interphase mass transfer. The transport of adsorbable compounds from the bulk of the gas phase to the external surface of adsorbent pellets (activated carbon) constitutes an important step in the overall uptake process.
2) VOCs absorption by wet-scrubbers. In the context of air-pollution control, absorption involves the transfer of a gaseous pollutant from the air into a contacting liquid, such as water. The liquid serves as a solvent for the pollutant. Water film formed in the surface of pebbles or activated carbon will become the wet scrubbers, where water soluble compounds like formaldehyde in the indoor air can be absorbed on it.
3) VOCs physical adsorption by activated carbon. Activated carbon is a widely used adsorbent to remove indoor air VOCs. When indoor air pass through the sorbent bed, these water insoluble or heavy compounds like toluene will be physically adsorbed by activated carbon.
4) VOCs consumption by microorganisms. The microbes formed by the root system of plant may consume the absorbed or adsorbed VOCs as a food source. In this way, the saturated activated carbon might be reactivated, which means more VOCs might be removed and there is no need to replace the activated carbon as long as the microorganisms are live.
Figure 14 Physical process involved
BEESL-R01-09-09-COE-TAD-Final Report Page 18 of 25
The major assumptions in the model include:
1) The adsorption process is isothermal, and no temperature change;
2) The axial dispersion in the sorbent bed is neglected due to dominating bulk flow effect (convection);
3) The air velocity through the sorbent bed is constant and even;
4) The sorbent pellet has spherical shape;
5) The partition coefficient is constant;
6) Microbes grow by geometric series with enough carbon source or nutrient.
7) The moisture content in the bed is even in the horizontal direction.
The new mathematic model will be implemented in the next version of CHAMPS-BES. 3.5 Conclusions 1) In the full-scale chamber test, the filter system had fairly high initial removal efficiency for formaldehyde and toluene even without plants in the bed. With the plants, the filter system had even higher initial removal efficiency (90% for formaldehyde in the first three days, and over 50% for toluene). However, it was not clear if the microbes played any role in such a short term test period. Longer-term performance test is needed as in the field demonstration test.
2) In the long-term field demonstration test, it was found that 5% outdoor air plus the operation of the biofilter could achieve the same room formaldehyde/toluene concentration as having ventilation with 25% outdoor air. In other words, with the use of the bio-filter, the ventilation rate can be reduced from 25% to 5% of total air supply without adversely affecting the indoor air quality if formaldehyde and toluene are the target pollutants that dictate the required ventilation rate.
3) The effect of bed water content to the removal of formaldehyde/toluene was also studied in the field demonstration test. It was found that bed water content had positive effect on formaldehyde removal while negative effect on the toluene removal. The single pass removal efficiencies were approximately 70% for formaldehyde and 40% for toluene when the volumetric water content were within the range of 5% to 32% in the root bed (corresponding to air relative humidity from 74% to 82% RH). Note that since only part of the total supply air were directed through the filter bed, the effects of the bio-filter operation on the indoor relative humidity was not significant (<15 %RH increase).
4) The single pass efficiency for formaldehyde and toluene did not show any significant decrease over a period of 60 days of continuous operation, indicating good long-term performance of the bio-filter system, although the role of microbes in sustaining the performance is yet to be determined. 5) The energy consumption for the building that was integrated with such filter system was simulated by EnergyPlus. It was found that yearly energy saving potential for Syracuse climate was approximately 10 to 15% in average. The energy saving was 26% for heating, 2% for cooling and 1% for ventilation. It is expected that a higher percentage of energy savings would be achieved for climate zones where more heating is required than Syracuse climate. It is also expected that significant saving (similar to that for heating in cold climate) could be achieved in

BEESL-R01-09-09-COE-TAD-Final Report Page 19 of 25
hot and humid climate where substantial cooling and dehumidification are required for extended period in summer. Further simulations for different U.S. climate zones will be conducted to provide more quantitative results.
BEESL-R01-09-09-COE-TAD-Final Report Page 20 of 25
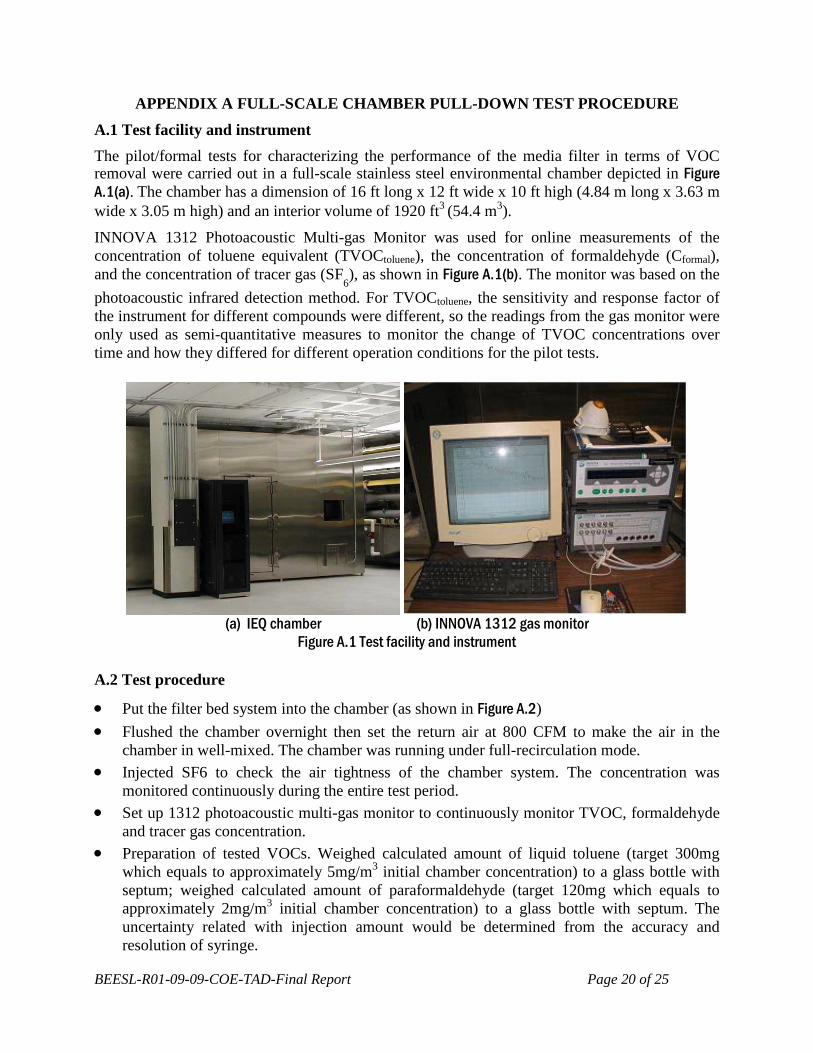
APPENDIX A FULL-SCALE CHAMBER PULL-DOWN TEST PROCEDURE A.1 Test facility and instrument The pilot/formal tests for characterizing the performance of the media filter in terms of VOC removal were carried out in a full-scale stainless steel environmental chamber depicted in Figure A.1(a). The chamber has a dimension of 16 ft long x 12 ft wide x 10 ft high (4.84 m long x 3.63 m wide x 3.05 m high) and an interior volume of 1920 ft3
(54.4 m3).
INNOVA 1312 Photoacoustic Multi-gas Monitor was used for online measurements of the concentration of toluene equivalent (TVOCtoluene), the concentration of formaldehyde (Cformal), and the concentration of tracer gas (SF
6), as shown in Figure A.1(b). The monitor was based on the
photoacoustic infrared detection method. For TVOCtoluene, the sensitivity and response factor of the instrument for different compounds were different, so the readings from the gas monitor were only used as semi-quantitative measures to monitor the change of TVOC concentrations over time and how they differed for different operation conditions for the pilot tests.
(a) IEQ chamber (b) INNOVA 1312 gas monitor
Figure A.1 Test facility and instrument
A.2 Test procedure
• Put the filter bed system into the chamber (as shown in Figure A.2) • Flushed the chamber overnight then set the return air at 800 CFM to make the air in the
chamber in well-mixed. The chamber was running under full-recirculation mode. • Injected SF6 to check the air tightness of the chamber system. The concentration was
monitored continuously during the entire test period. • Set up 1312 photoacoustic multi-gas monitor to continuously monitor TVOC, formaldehyde
and tracer gas concentration. • Preparation of tested VOCs. Weighed calculated amount of liquid toluene (target 300mg
which equals to approximately 5mg/m3 initial chamber concentration) to a glass bottle with septum; weighed calculated amount of paraformaldehyde (target 120mg which equals to approximately 2mg/m3 initial chamber concentration) to a glass bottle with septum. The uncertainty related with injection amount would be determined from the accuracy and resolution of syringe.
BEESL-R01-09-09-COE-TAD-Final Report Page 21 of 25
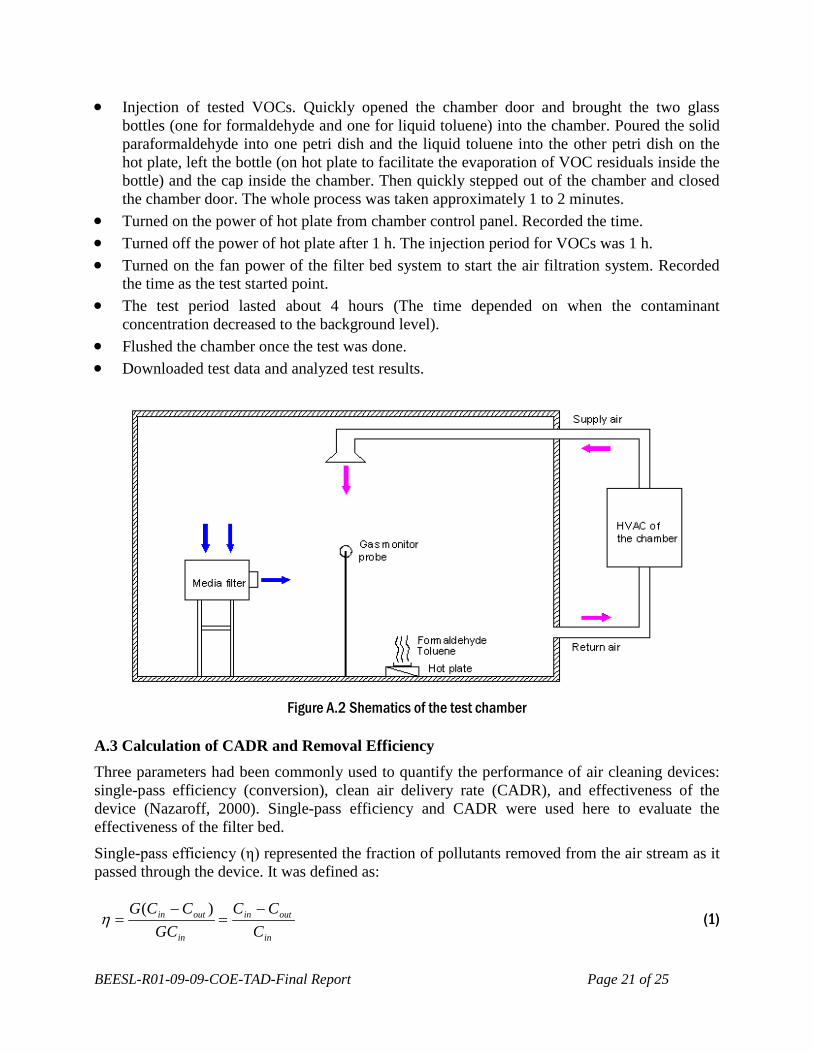
• Injection of tested VOCs. Quickly opened the chamber door and brought the two glass bottles (one for formaldehyde and one for liquid toluene) into the chamber. Poured the solid paraformaldehyde into one petri dish and the liquid toluene into the other petri dish on the hot plate, left the bottle (on hot plate to facilitate the evaporation of VOC residuals inside the bottle) and the cap inside the chamber. Then quickly stepped out of the chamber and closed the chamber door. The whole process was taken approximately 1 to 2 minutes.
• Turned on the power of hot plate from chamber control panel. Recorded the time. • Turned off the power of hot plate after 1 h. The injection period for VOCs was 1 h. • Turned on the fan power of the filter bed system to start the air filtration system. Recorded
the time as the test started point. • The test period lasted about 4 hours (The time depended on when the contaminant
concentration decreased to the background level). • Flushed the chamber once the test was done. • Downloaded test data and analyzed test results.
Figure A.2 Shematics of the test chamber
A.3 Calculation of CADR and Removal Efficiency Three parameters had been commonly used to quantify the performance of air cleaning devices: single-pass efficiency (conversion), clean air delivery rate (CADR), and effectiveness of the device (Nazaroff, 2000). Single-pass efficiency and CADR were used here to evaluate the effectiveness of the filter bed.
Single-pass efficiency (η) represented the fraction of pollutants removed from the air stream as it passed through the device. It was defined as:
in
outin
in
outin
CCC
GCCCG −
=−
=)(
η (1)
BEESL-R01-09-09-COE-TAD-Final Report Page 22 of 25
Where, C
in = contaminant concentration at the inlet of air cleaner, mg/m
3 for VOC and number of
particles/cm3
for particulates. C
out = contaminant concentration at the outlet of air cleaner, mg/m
3 for VOC and number of
particles /cm3
for particulates. G = airflow rate through the air cleaner, CFM or m
3/h.
CADR represents the “effective” clean airflow rate delivered by the air cleaner. It is defined as:
dEGCADR ⋅⋅=η (2)
Where, Ed
= short-circuiting factor of the air cleaner, Ed=Cin/C, where C is average concentration in the test chamber (E
d = 1 under well-mixed condition).
CADR was calculated from the test results. The analysis was based on the well-mixed single zone model. Assuming that the air was well mixed in chamber and the contaminant removal mechanisms other than air cleaning (e.g. surface deposition effect and chamber leakage effect) were the same with and without air cleaner operating and can be characterized by a first-order rate constant k
n, the mass conservation of contaminant can be written as:
CCADRVkdtdCV n ⋅+−= )( , (C=C0 at t=0) (3a)
Or
CkCV
CADRkdtdC
en ⋅−=⋅+−= )( (3b)
Where, V - volume of the testing chamber system, ft
3 or m
3,
kn
– contaminant concentration decay rate without air cleaner operating (chamber effects), min-1
or h-1
, k
e – total contaminant concentration decay rate with air cleaner operating, min
-1 or h
-1,
C0
– Initial contaminant concentration inside the chamber, mg/m3
for VOC and number of
particles/cm3
for particulates. If CADR did not change during the test period, an analytical solution could be obtained from Equation (3) as:
tktV
CADRke
n eCeCC −+−⋅=⋅= 0
)(
0 (4)
BEESL-R01-09-09-COE-TAD-Final Report Page 23 of 25
CADR was then determined by linear regression of ln (C/C0) vs. t from the measured
concentration decay curve:
)( ne kkVCADR −= (5)
After the CADR was calculated, together with measured the airflow rate through the air cleaner, the removal efficiency can then be calculated by dividing the CADR by the airflow rate through the air cleaner. This calculated removal efficiency was the same as the single-pass efficiency defined in Equation (1) since the air in the chamber was well-mixed.
The step-by-step data analysis procedure for VOCs was summarized as follows:
1. Calculated kn
based on the measured tracer gas concentration decay or contaminant concentration decay before time zero (if the contaminant decay during the static period did not match the SF6 decay very well);
2. Calculated k
e by linear regression of ln (C/C
0) vs. t from measured concentration decay
curve after turning on the air cleaner (dynamic period); 3. Calculated CADR according to Equation (5); 4. Determined the removal efficiency by dividing the calculated CADR value by the
measured airflow rate through the air cleaner.
BEESL-R01-09-09-COE-TAD-Final Report Page 24 of 25
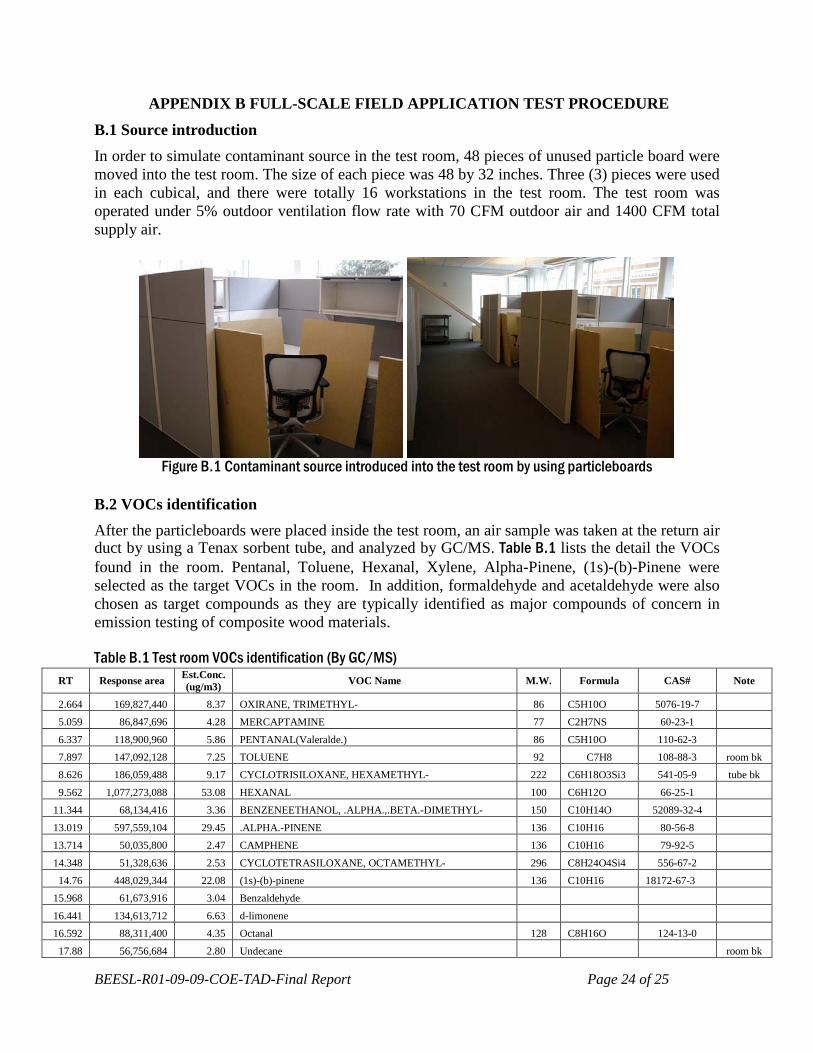
APPENDIX B FULL-SCALE FIELD APPLICATION TEST PROCEDURE B.1 Source introduction In order to simulate contaminant source in the test room, 48 pieces of unused particle board were moved into the test room. The size of each piece was 48 by 32 inches. Three (3) pieces were used in each cubical, and there were totally 16 workstations in the test room. The test room was operated under 5% outdoor ventilation flow rate with 70 CFM outdoor air and 1400 CFM total supply air.
Figure B.1 Contaminant source introduced into the test room by using particleboards
B.2 VOCs identification After the particleboards were placed inside the test room, an air sample was taken at the return air duct by using a Tenax sorbent tube, and analyzed by GC/MS. Table B.1 lists the detail the VOCs found in the room. Pentanal, Toluene, Hexanal, Xylene, Alpha-Pinene, (1s)-(b)-Pinene were selected as the target VOCs in the room. In addition, formaldehyde and acetaldehyde were also chosen as target compounds as they are typically identified as major compounds of concern in emission testing of composite wood materials. Table B.1 Test room VOCs identification (By GC/MS)
RT Response area Est.Conc. (ug/m3) VOC Name M.W. Formula CAS# Note
2.664 169,827,440 8.37 OXIRANE, TRIMETHYL- 86 C5H10O 5076-19-7 5.059 86,847,696 4.28 MERCAPTAMINE 77 C2H7NS 60-23-1
6.337 118,900,960 5.86 PENTANAL(Valeralde.) 86 C5H10O 110-62-3 7.897 147,092,128 7.25 TOLUENE 92 C7H8 108-88-3 room bk 8.626 186,059,488 9.17 CYCLOTRISILOXANE, HEXAMETHYL- 222 C6H18O3Si3 541-05-9 tube bk
9.562 1,077,273,088 53.08 HEXANAL 100 C6H12O 66-25-1 11.344 68,134,416 3.36 BENZENEETHANOL, .ALPHA.,.BETA.-DIMETHYL- 150 C10H14O 52089-32-4
13.019 597,559,104 29.45 .ALPHA.-PINENE 136 C10H16 80-56-8 13.714 50,035,800 2.47 CAMPHENE 136 C10H16 79-92-5
14.348 51,328,636 2.53 CYCLOTETRASILOXANE, OCTAMETHYL- 296 C8H24O4Si4 556-67-2 14.76 448,029,344 22.08 (1s)-(b)-pinene 136 C10H16 18172-67-3
15.968 61,673,916 3.04 Benzaldehyde
16.441 134,613,712 6.63 d-limonene 16.592 88,311,400 4.35 Octanal 128 C8H16O 124-13-0
17.88 56,756,684 2.80 Undecane room bk
BEESL-R01-09-09-COE-TAD-Final Report Page 25 of 25
18.897 108,563,536 5.35 P-TRIMETHYLSILYLOXYPHENYL-BIS(TRIMETHYLS 370 C17H34O3Si3 1000079-08-1 19.249 79,402,592 3.91 Nonanal 142 C9H18O 124-19-6 21.382 95,913,080 4.73 PENTADECANAL- 226 C15H30O 2765-11-9
21.518 240,076,816 11.83 2-PROPENOIC ACID, 6-METHYLHEPTYL ESTER 184 C11H20O2 54774-91-3
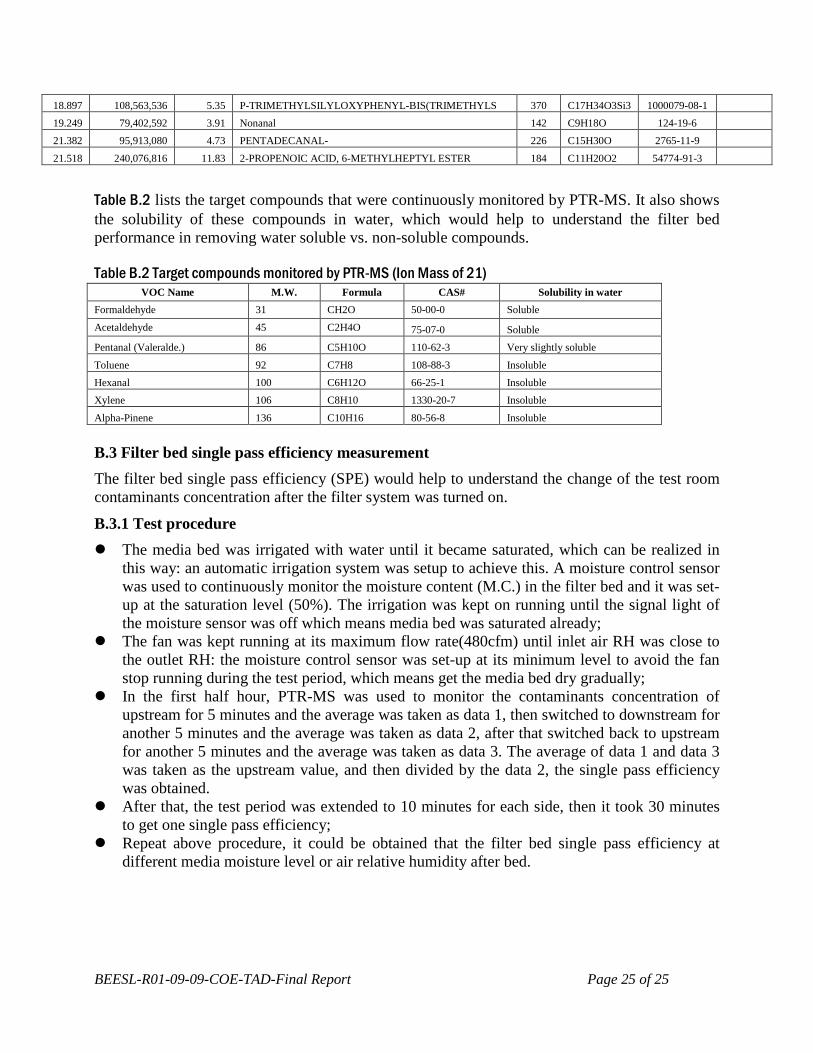
Table B.2 lists the target compounds that were continuously monitored by PTR-MS. It also shows the solubility of these compounds in water, which would help to understand the filter bed performance in removing water soluble vs. non-soluble compounds. Table B.2 Target compounds monitored by PTR-MS (Ion Mass of 21)
VOC Name M.W. Formula CAS# Solubility in water Formaldehyde 31 CH2O 50-00-0 Soluble
Acetaldehyde 45 C2H4O 75-07-0 Soluble Pentanal (Valeralde.) 86 C5H10O 110-62-3 Very slightly soluble
Toluene 92 C7H8 108-88-3 Insoluble Hexanal 100 C6H12O 66-25-1 Insoluble Xylene 106 C8H10 1330-20-7 Insoluble
Alpha-Pinene 136 C10H16 80-56-8 Insoluble
B.3 Filter bed single pass efficiency measurement The filter bed single pass efficiency (SPE) would help to understand the change of the test room contaminants concentration after the filter system was turned on.
B.3.1 Test procedure The media bed was irrigated with water until it became saturated, which can be realized in
this way: an automatic irrigation system was setup to achieve this. A moisture control sensor was used to continuously monitor the moisture content (M.C.) in the filter bed and it was set-up at the saturation level (50%). The irrigation was kept on running until the signal light of the moisture sensor was off which means media bed was saturated already;
The fan was kept running at its maximum flow rate(480cfm) until inlet air RH was close to the outlet RH: the moisture control sensor was set-up at its minimum level to avoid the fan stop running during the test period, which means get the media bed dry gradually;
In the first half hour, PTR-MS was used to monitor the contaminants concentration of upstream for 5 minutes and the average was taken as data 1, then switched to downstream for another 5 minutes and the average was taken as data 2, after that switched back to upstream for another 5 minutes and the average was taken as data 3. The average of data 1 and data 3 was taken as the upstream value, and then divided by the data 2, the single pass efficiency was obtained.
After that, the test period was extended to 10 minutes for each side, then it took 30 minutes to get one single pass efficiency;
Repeat above procedure, it could be obtained that the filter bed single pass efficiency at different media moisture level or air relative humidity after bed.
BEESL-R01-09-09-COE-TAD-Final Report Page 26 of 25
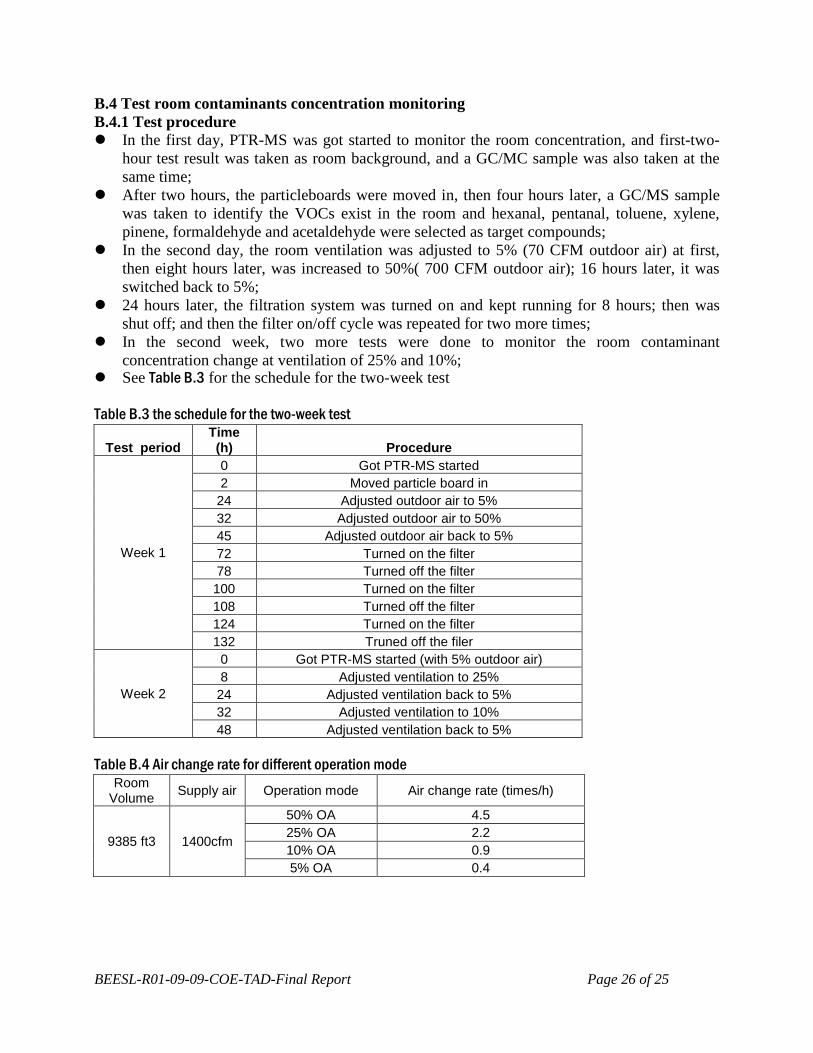
B.4 Test room contaminants concentration monitoring B.4.1 Test procedure In the first day, PTR-MS was got started to monitor the room concentration, and first-two-
hour test result was taken as room background, and a GC/MC sample was also taken at the same time;
After two hours, the particleboards were moved in, then four hours later, a GC/MS sample was taken to identify the VOCs exist in the room and hexanal, pentanal, toluene, xylene, pinene, formaldehyde and acetaldehyde were selected as target compounds;
In the second day, the room ventilation was adjusted to 5% (70 CFM outdoor air) at first, then eight hours later, was increased to 50%( 700 CFM outdoor air); 16 hours later, it was switched back to 5%;
24 hours later, the filtration system was turned on and kept running for 8 hours; then was shut off; and then the filter on/off cycle was repeated for two more times;
In the second week, two more tests were done to monitor the room contaminant concentration change at ventilation of 25% and 10%;
See Table B.3 for the schedule for the two-week test Table B.3 the schedule for the two-week test
Test period Time (h) Procedure
Week 1
0 Got PTR-MS started 2 Moved particle board in
24 Adjusted outdoor air to 5% 32 Adjusted outdoor air to 50% 45 Adjusted outdoor air back to 5% 72 Turned on the filter 78 Turned off the filter 100 Turned on the filter 108 Turned off the filter 124 Turned on the filter 132 Truned off the filer
Week 2
0 Got PTR-MS started (with 5% outdoor air) 8 Adjusted ventilation to 25%
24 Adjusted ventilation back to 5% 32 Adjusted ventilation to 10% 48 Adjusted ventilation back to 5%
Table B.4 Air change rate for different operation mode
Room Volume Supply air Operation mode Air change rate (times/h)
9385 ft3 1400cfm
50% OA 4.5 25% OA 2.2 10% OA 0.9 5% OA 0.4
Related Documents