ICICI Securities | Retail Research 1 ICICI Securities – Retail Equity Research Sector Update January 5, 2021 Cement Well geared up to ride on uptick in capex cycle… Against the backdrop of weak sentiments due to the pandemic, the operating performance of the cement sector in H1FY21 improved sharply led by strong demand from rural segment, improved pricing environment along with benign costs. The improved business environment led by lower interest rates and improved liquidity has also led to re-instatement of capex plans by major companies that were halted earlier post imposition of lockdown in April 2020. All-India asset utilisation also crossed 80% mark in October-November 2020 vs. 69% in Q2FY21 with plant utilisation in the eastern and central region remaining even higher led by strong demand. Against the likely new capacity additions of 54 MT in FY21E-23E, the same is now being revised upwards to 69 MT in the same period with improved business outlook. Though the quantum of additions has increased by ~15 MT, it may be a lesser worry (against history) given these announcements are from incumbents (no new players are entering the segment) and the industry has seen meaningful consolidation over the past few years. The new additions may very well get absorbed in our view as the sector remains the best proxy to ride India’s infra and real estate growth story. Demand growth to outpace supply growth leading to better asset utilisation While we expect capacity addition CAGR of 4.2% in FY21-23E, demand growth (6.3% CAGR) is expected to far exceed the supply growth during the same period. Despite a slowdown in housing in the past seven years, cement demand has registered demand CAGR of 5.9% in FY12-19. The housing segment is now showing visible pick-up that is being fuelled partially by lower interest rates. It remained the backbone of cement demand during the previous bull cycle of 2003-08. Nevertheless, housing will remain the key volume contributor. Infrastructure is also expected to expand its share in the next five years with rising investments by the central government on roads, railways and irrigation. As India seeks to build infrastructure that can fulfil its ambitions of expanding into a $5-trillion economy by the middle of the next decade, consumption of cement is set to increase sharply in the country, which is the world’s second biggest market for the primary building material. Volume led growth to push sector RoCE further upward in FY21E-23E The year FY20-21 is likely to witness a sharp rebound in margins led by price hikes and a benign cost environment. However, with a rise in cost of key inputs like petcoke and fuel, the pace of margin expansion is expected to taper down. On the other hand, with a sharp volume rebound, we expect sector RoCE to rebound sharply to over 17% by FY23E from 13.3% in FY20, led by likely volume CAGR of 6.2% to 252 MT (I-direct coverage) with FY22E sales volume likely to be in the double digits ie. at 15.4% due to lower base. Valuation & Outlook While the recent run-up in cement stocks is already factoring in some of this upside, we expect the outlook to remain strong as the sector is likely to witness strong demand not only from infra and construction but from real estate as well due to improved affordability and lower interest rates. We introduce FY23E earnings estimates for our cement universe. We continue to prefer UltraTech, ACC and Shree Cement among large caps followed by Ramco and JK Lakshmi Cement in the midcap space. Recommendation Matrix New Company CMP Old New Old New ACC 1,640 Buy Buy 1,850 1,950 18.9 Ambuja 252 Hold Hold 265 280 11.1 UltraTech 5,340 Buy Buy 5,800 6,150 15.2 Shree 23900 Buy Buy 27500 28000 17.2 Heidelberg 230 Buy Buy 200 265 15.2 JK 2,090 Hold Buy 2,100 2,450 17.2 JKLakshm 342 Buy Buy 335 450 31.6 Star 107 Buy Buy 105 125 16.8 Ramco 798 Buy Buy 1,000 1,000 25.3 Birla Corp 732 Buy Buy 610 925 26.4 Orient 89 Buy Buy 75 105 18.0 Mangalam 262 Hold Buy 165 325 24.0 Rating Upside (%) TP Research Analyst Rashesh Shah [email protected]

Welcome message from author
This document is posted to help you gain knowledge. Please leave a comment to let me know what you think about it! Share it to your friends and learn new things together.
Transcript
ICICI Securities | Retail Research 1
ICIC
I S
ecurit
ies –
Retail E
quit
y R
esearch
Sector U
pdate
January 5, 2021
Cement
Well geared up to ride on uptick in capex cycle…
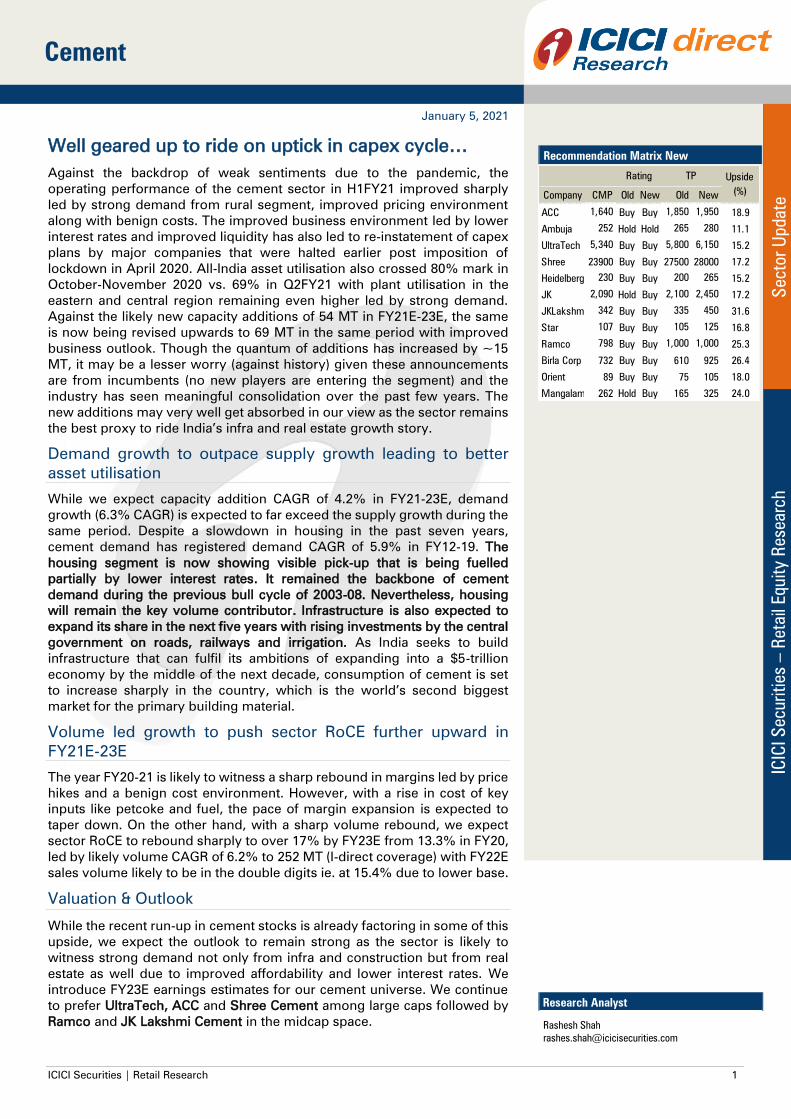
Against the backdrop of weak sentiments due to the pandemic, the
operating performance of the cement sector in H1FY21 improved sharply
led by strong demand from rural segment, improved pricing environment
along with benign costs. The improved business environment led by lower
interest rates and improved liquidity has also led to re-instatement of capex
plans by major companies that were halted earlier post imposition of
lockdown in April 2020. All-India asset utilisation also crossed 80% mark in
October-November 2020 vs. 69% in Q2FY21 with plant utilisation in the
eastern and central region remaining even higher led by strong demand.
Against the likely new capacity additions of 54 MT in FY21E-23E, the same
is now being revised upwards to 69 MT in the same period with improved
business outlook. Though the quantum of additions has increased by ~15
MT, it may be a lesser worry (against history) given these announcements
are from incumbents (no new players are entering the segment) and the
industry has seen meaningful consolidation over the past few years. The
new additions may very well get absorbed in our view as the sector remains
the best proxy to ride India’s infra and real estate growth story.
Demand growth to outpace supply growth leading to better
asset utilisation
While we expect capacity addition CAGR of 4.2% in FY21-23E, demand
growth (6.3% CAGR) is expected to far exceed the supply growth during the
same period. Despite a slowdown in housing in the past seven years,
cement demand has registered demand CAGR of 5.9% in FY12-19. The
housing segment is now showing visible pick-up that is being fuelled
partially by lower interest rates. It remained the backbone of cement
demand during the previous bull cycle of 2003-08. Nevertheless, housing
will remain the key volume contributor. Infrastructure is also expected to
expand its share in the next five years with rising investments by the central
government on roads, railways and irrigation. As India seeks to build
infrastructure that can fulfil its ambitions of expanding into a $5-trillion
economy by the middle of the next decade, consumption of cement is set
to increase sharply in the country, which is the world’s second biggest
market for the primary building material.
Volume led growth to push sector RoCE further upward in
FY21E-23E
The year FY20-21 is likely to witness a sharp rebound in margins led by price
hikes and a benign cost environment. However, with a rise in cost of key
inputs like petcoke and fuel, the pace of margin expansion is expected to
taper down. On the other hand, with a sharp volume rebound, we expect
sector RoCE to rebound sharply to over 17% by FY23E from 13.3% in FY20,
led by likely volume CAGR of 6.2% to 252 MT (I-direct coverage) with FY22E
sales volume likely to be in the double digits ie. at 15.4% due to lower base.
Valuation & Outlook
While the recent run-up in cement stocks is already factoring in some of this
upside, we expect the outlook to remain strong as the sector is likely to
witness strong demand not only from infra and construction but from real
estate as well due to improved affordability and lower interest rates. We
introduce FY23E earnings estimates for our cement universe. We continue
to prefer UltraTech, ACC and Shree Cement among large caps followed by
Ramco and JK Lakshmi Cement in the midcap space.
Recommendation Matrix New
Company CMP Old New Old New
ACC 1,640 Buy Buy 1,850 1,950 18.9
Ambuja 252 Hold Hold 265 280 11.1
UltraTech 5,340 Buy Buy 5,800 6,150 15.2
Shree 23900 Buy Buy 27500 28000 17.2
Heidelberg 230 Buy Buy 200 265 15.2
JK 2,090 Hold Buy 2,100 2,450 17.2
JKLakshmi 342 Buy Buy 335 450 31.6
Star 107 Buy Buy 105 125 16.8
Ramco 798 Buy Buy 1,000 1,000 25.3
Birla Corp 732 Buy Buy 610 925 26.4
Orient 89 Buy Buy 75 105 18.0
Mangalam 262 Hold Buy 165 325 24.0
Rating Upside
(%)
TP
Research Analyst
Rashesh Shah
ICICI Securities | Retail Research 2
ICICI Direct Research
Sector Update | Cement
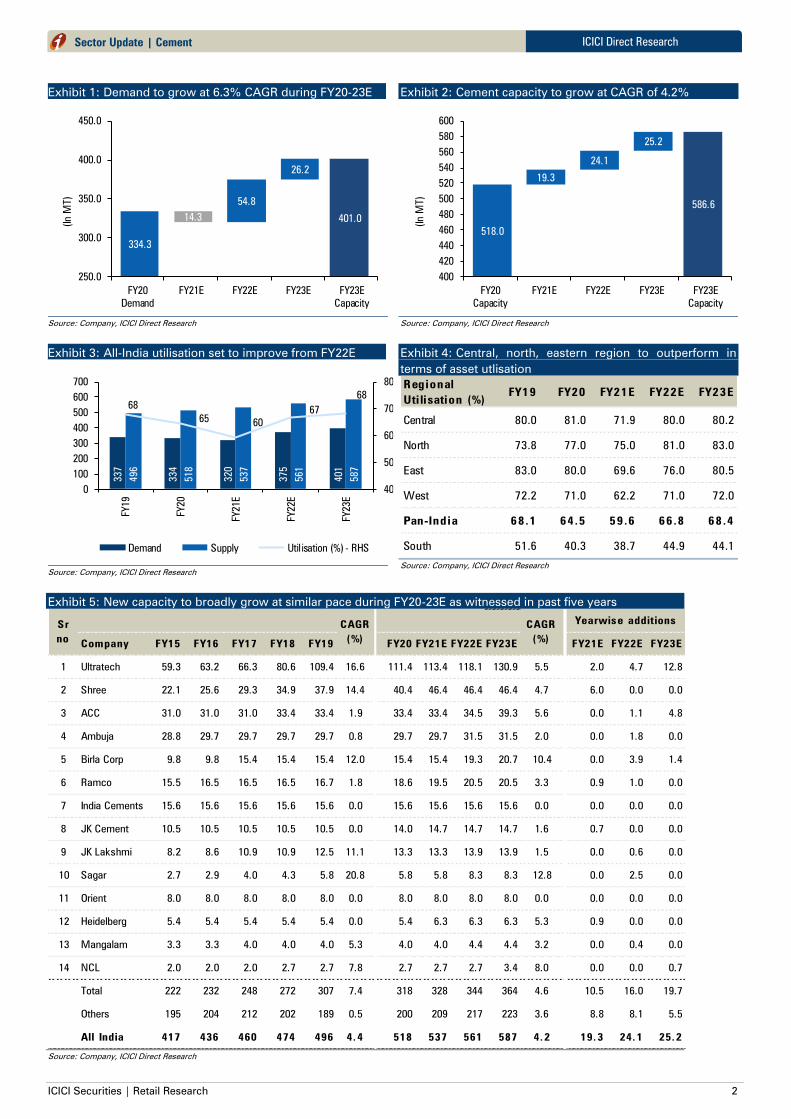
Exhibit 1: Demand to grow at 6.3% CAGR during FY20-23E
401.0
334.3
14.3
54.8
26.2
250.0
300.0
350.0
400.0
450.0
FY20
Demand
FY21E FY22E FY23E FY23E
Capacity
(In
M
T)
Source: Company, ICICI Direct Research
Exhibit 2: Cement capacity to grow at CAGR of 4.2%
586.6
518.0
19.3
24.1
25.2
400
420
440
460
480
500
520
540
560
580
600
FY20
Capacity
FY21E FY22E FY23E FY23E
Capacity
(In
M
T)
Source: Company, ICICI Direct Research
Exhibit 3: All-India utilisation set to improve from FY22E
337
334
320
375
401
496
518
537
561
587
68
6560
67
68
40
50
60
70
80
0
100
200
300
400
500
600
700
FY19
FY20
FY21E
FY22E
FY23E
Demand Supply Util isation (%) - RHS
Source: Company, ICICI Direct Research
Exhibit 4: Central, north, eastern region to outperform in
terms of asset utlisation
Regional
Uti lisation (%)
FY19 FY20 FY21E FY22E FY23E
Central 80.0 81.0 71.9 80.0 80.2
North 73.8 77.0 75.0 81.0 83.0
East 83.0 80.0 69.6 76.0 80.5
West 72.2 71.0 62.2 71.0 72.0
Pan-India 68.1 64.5 59.6 66.8 68.4
South 51.6 40.3 38.7 44.9 44.1
Source: Company, ICICI Direct Research
Exhibit 5: New capacity to broadly grow at similar pace during FY20-23E as witnessed in past five years
Company FY15 FY16 FY17 FY18 FY19 FY20 FY21E FY22E FY23E FY21E FY22E FY23E
1 Ultratech 59.3 63.2 66.3 80.6 109.4 16.6 111.4 113.4 118.1 130.9 5.5 2.0 4.7 12.8
2 Shree 22.1 25.6 29.3 34.9 37.9 14.4 40.4 46.4 46.4 46.4 4.7 6.0 0.0 0.0
3 ACC 31.0 31.0 31.0 33.4 33.4 1.9 33.4 33.4 34.5 39.3 5.6 0.0 1.1 4.8
4 Ambuja 28.8 29.7 29.7 29.7 29.7 0.8 29.7 29.7 31.5 31.5 2.0 0.0 1.8 0.0
5 Birla Corp 9.8 9.8 15.4 15.4 15.4 12.0 15.4 15.4 19.3 20.7 10.4 0.0 3.9 1.4
6 Ramco 15.5 16.5 16.5 16.5 16.7 1.8 18.6 19.5 20.5 20.5 3.3 0.9 1.0 0.0
7 India Cements 15.6 15.6 15.6 15.6 15.6 0.0 15.6 15.6 15.6 15.6 0.0 0.0 0.0 0.0
8 JK Cement 10.5 10.5 10.5 10.5 10.5 0.0 14.0 14.7 14.7 14.7 1.6 0.7 0.0 0.0
9 JK Lakshmi 8.2 8.6 10.9 10.9 12.5 11.1 13.3 13.3 13.9 13.9 1.5 0.0 0.6 0.0
10 Sagar 2.7 2.9 4.0 4.3 5.8 20.8 5.8 5.8 8.3 8.3 12.8 0.0 2.5 0.0
11 Orient 8.0 8.0 8.0 8.0 8.0 0.0 8.0 8.0 8.0 8.0 0.0 0.0 0.0 0.0
12 Heidelberg 5.4 5.4 5.4 5.4 5.4 0.0 5.4 6.3 6.3 6.3 5.3 0.9 0.0 0.0
13 Mangalam 3.3 3.3 4.0 4.0 4.0 5.3 4.0 4.0 4.4 4.4 3.2 0.0 0.4 0.0
14 NCL 2.0 2.0 2.0 2.7 2.7 7.8 2.7 2.7 2.7 3.4 8.0 0.0 0.0 0.7
Total 222 232 248 272 307 7.4 318 328 344 364 4.6 10.5 16.0 19.7
Others 195 204 212 202 189 0.5 200 209 217 223 3.6 8.8 8.1 5.5
All India 417 436 460 474 496 4.4 518 537 561 587 4.2 19.3 24.1 25.2
Sr
no
CAGR
(%)
Yearwise additionsCAGR
(%)
Source: Company, ICICI Direct Research

ICICI Securities | Retail Research 3
ICICI Direct Research
Sector Update | Cement
Exhibit 6: East, central regions to witness higher capacity additions due to supply scarcity
Capacity (In MT) FY12 FY13 FY14 FY15 FY16 FY17 FY18 FY19 FY20 FY21E FY22E FY23E
FY20-23E
CAGR (%)
North 73 76 80 91 95 98 102 102 104 104 109 111 2.3
East 50 54 63 67 70 81 88 91 100 111 120 131 9.3
West 47 47 48 52 56 58 60 64 65 71 76 78 6.0
South 132 142 148 154 156 166 168 178 181 181 182 185 0.7
Central 49 52 55 54 59 57 56 61 68 71 75 82 6.6
Total 351 372 393 417 436 460 474 496 518 537 561 587 4.2
Source: Company, ICICI Direct Research
Exhibit 7: Expect demand CAGR of 6.3% in FY20-23E, marginally higher than 5.7% CAGR reported in FY12-19
Production
(In MT)
FY12 FY13 FY14 FY15 FY16 FY17 FY18 FY19 FY20 FY21E FY22E FY23E
FY20-23E
CAGR (%)
North 58 62 65 71 66 66 72 75 80 78 88 92 4.9
East 33 37 42 44 49 54 60 76 80 77 91 105 9.6
West 38 35 37 40 41 40 43 46 46 44 54 56 6.5
South 55 64 62 66 75 78 78 92 73 70 82 82 3.7
Central 46 48 50 50 53 43 45 49 55 51 60 66 6.3
Total 230 247 256 271 284 280 298 337 334 320 375 401 6.3
Source: Company, ICICI Direct Research
Exhibit 8: Asset utilisation to remain healthy in north, central, east region; Infra led recovery to improve utilisation in
south during FY20-23E
Utilisation (%) FY12 FY13 FY14 FY15 FY16 FY17 FY18 FY19 FY20 FY21E FY22E FY23E
North 79.3 82.2 81.3 78.4 69.0 67.0 70.9 73.8 77.0 75.0 81.0 83.0
East 64.8 67.7 67.2 66.6 69.6 66.5 67.8 83.0 80.0 69.6 76.0 80.5
West 82.3 74.8 76.5 75.8 73.8 68.6 71.4 72.2 71.0 62.2 71.0 72.0
South 41.8 45.1 42.2 42.7 48.0 47.0 46.5 51.6 40.3 38.7 44.9 44.1
Central 92.2 91.4 90.8 93.3 89.8 74.6 79.7 80.0 81.0 71.9 80.0 80.2
Pan-India 65.4 66.3 65.1 64.9 65.0 60.8 62.8 68.1 64.5 59.6 66.8 68.4
Source: Company, ICICI Direct Research
Utilisation levels in the east, central and northern regions are expected to
remain above 80% in FY21-23E despite capacity additions of over 52.4 MT
out of total expected addition of 68.4 MT during the same period. The key
demand drivers include strong rural and semi-urban housing demand. This
will be further aided by upcoming elections in West Bengal and Uttar
Pradesh. In the south, however, we expect a slower recovery in FY21-23E.
Demand in AP/Telangana is expected to rebound sharply in FY22E after two
consecutive years of demand decline with a sharp increase in infra activity.
Further, upcoming elections in Tamil Nadu would provide support to revive
infra demand in this region.
Exhibit 9: East, central region has higher potential to grow followed by north based on per capita consumption
Source: Company presentation, ICICI Direct Research
ICICI Securities | Retail Research 4
ICICI Direct Research
Sector Update | Cement
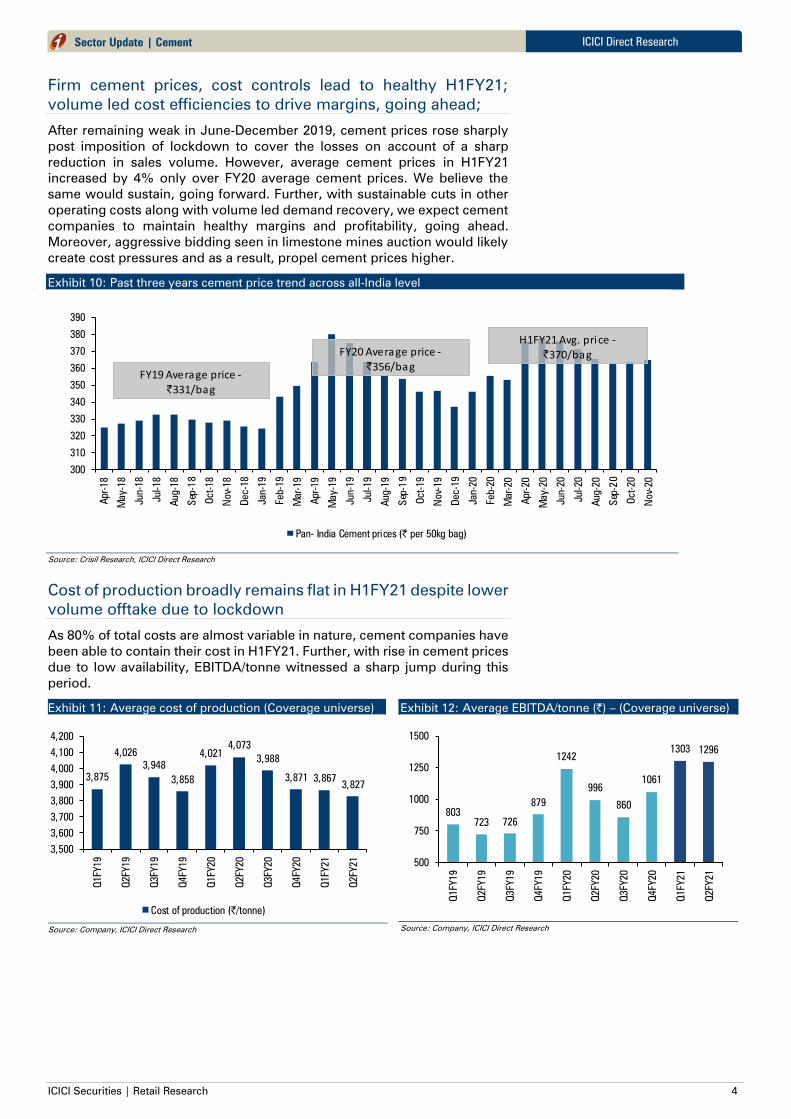
Firm cement prices, cost controls lead to healthy H1FY21;
volume led cost efficiencies to drive margins, going ahead;
After remaining weak in June-December 2019, cement prices rose sharply
post imposition of lockdown to cover the losses on account of a sharp
reduction in sales volume. However, average cement prices in H1FY21
increased by 4% only over FY20 average cement prices. We believe the
same would sustain, going forward. Further, with sustainable cuts in other
operating costs along with volume led demand recovery, we expect cement
companies to maintain healthy margins and profitability, going ahead.
Moreover, aggressive bidding seen in limestone mines auction would likely
create cost pressures and as a result, propel cement prices higher.
Exhibit 10: Past three years cement price trend across all-India level
300
310
320
330
340
350
360
370
380
390
Apr-18
May-18
Jun-18
Jul-18
Aug-18
Sep-1
8
Oct-18
Nov-18
Dec-18
Jan-19
Feb-19
Mar-19
Apr-19
May-19
Jun-19
Jul-19
Aug-19
Sep-1
9
Oct-19
Nov-19
Dec-19
Jan-20
Feb-20
Mar-20
Apr-20
May-20
Jun-20
Jul-20
Aug-20
Sep-2
0
Oct-20
Nov-20
Pan- India Cement prices (| per 50kg bag)
FY20 Average price -|356/bag
H1FY21 Avg. price -
|370/bag
FY19 Average price -
|331/bag
Source: Crisil Research, ICICI Direct Research
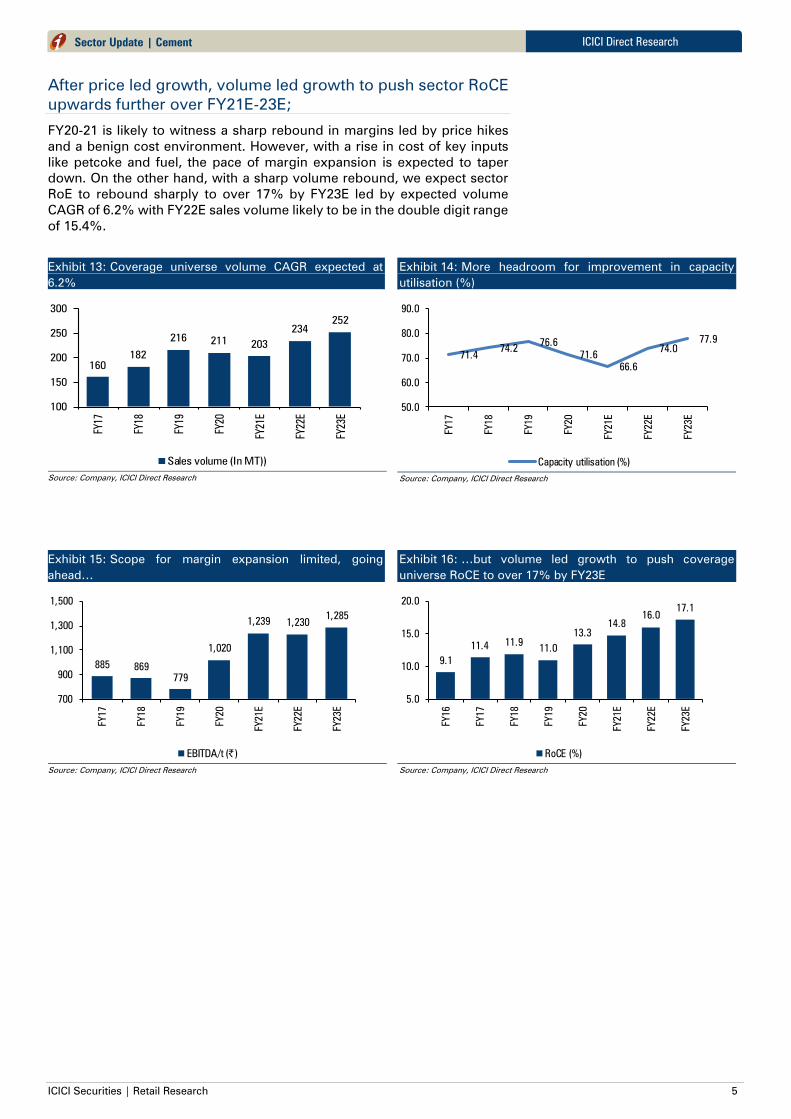
Cost of production broadly remains flat in H1FY21 despite lower
volume offtake due to lockdown
As 80% of total costs are almost variable in nature, cement companies have
been able to contain their cost in H1FY21. Further, with rise in cement prices
due to low availability, EBITDA/tonne witnessed a sharp jump during this
period.
Exhibit 11: Average cost of production (Coverage universe)
3,875
4,026
3,948
3,858
4,021
4,073
3,988
3,871 3,8673,827
3,500
3,600
3,700
3,800
3,900
4,000
4,100
4,200
Q1FY19
Q2FY19
Q3FY19
Q4FY19
Q1FY20
Q2FY20
Q3FY20
Q4FY20
Q1FY21
Q2FY21
Cost of production (|/tonne)
Source: Company, ICICI Direct Research
Exhibit 12: Average EBITDA/tonne (|) – (Coverage universe)
803
723 726
879
1242
996
860
1061
1303 1296
500
750
1000
1250
1500
Q1FY19
Q2FY19
Q3FY19
Q4FY19
Q1FY20
Q2FY20
Q3FY20
Q4FY20
Q1FY21
Q2FY21
Source: Company, ICICI Direct Research
ICICI Securities | Retail Research 5
ICICI Direct Research
Sector Update | Cement
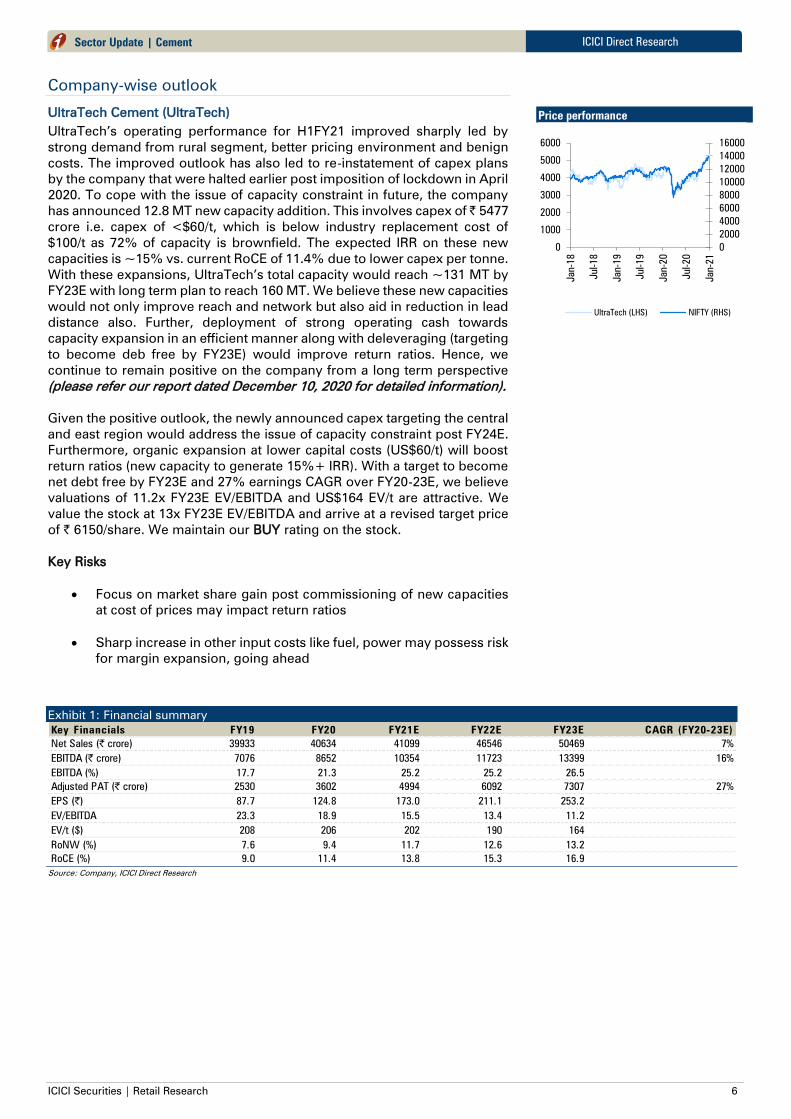
After price led growth, volume led growth to push sector RoCE
upwards further over FY21E-23E;
FY20-21 is likely to witness a sharp rebound in margins led by price hikes
and a benign cost environment. However, with a rise in cost of key inputs
like petcoke and fuel, the pace of margin expansion is expected to taper
down. On the other hand, with a sharp volume rebound, we expect sector
RoE to rebound sharply to over 17% by FY23E led by expected volume
CAGR of 6.2% with FY22E sales volume likely to be in the double digit range
of 15.4%.
Exhibit 13: Coverage universe volume CAGR expected at
6.2%
160
182
216211
203
234
252
100
150
200
250
300
FY17
FY18
FY19
FY20
FY21E
FY22E
FY23E
Sales volume (In MT))
Source: Company, ICICI Direct Research
Exhibit 14: More headroom for improvement in capacity
utilisation (%)
71.474.2
76.6
71.6
66.6
74.0
77.9
50.0
60.0
70.0
80.0
90.0
FY17
FY18
FY19
FY20
FY21E
FY22E
FY23E
Capacity utilisation (%)
Source: Company, ICICI Direct Research
Exhibit 15: Scope for margin expansion limited, going
ahead…
885 869
779
1,020
1,239 1,2301,285
700
900
1,100
1,300
1,500
FY17
FY18
FY19
FY20
FY21E
FY22E
FY23E
EBITDA/t (|)
Source: Company, ICICI Direct Research
Exhibit 16: …but volume led growth to push coverage
universe RoCE to over 17% by FY23E
9.1
11.411.9
11.0
13.3
14.8
16.0
17.1
5.0
10.0
15.0
20.0
FY16
FY17
FY18
FY19
FY20
FY21E
FY22E
FY23E
RoCE (%)
Source: Company, ICICI Direct Research
ICICI Securities | Retail Research 6
ICICI Direct Research
Sector Update | Cement
Company-wise outlook
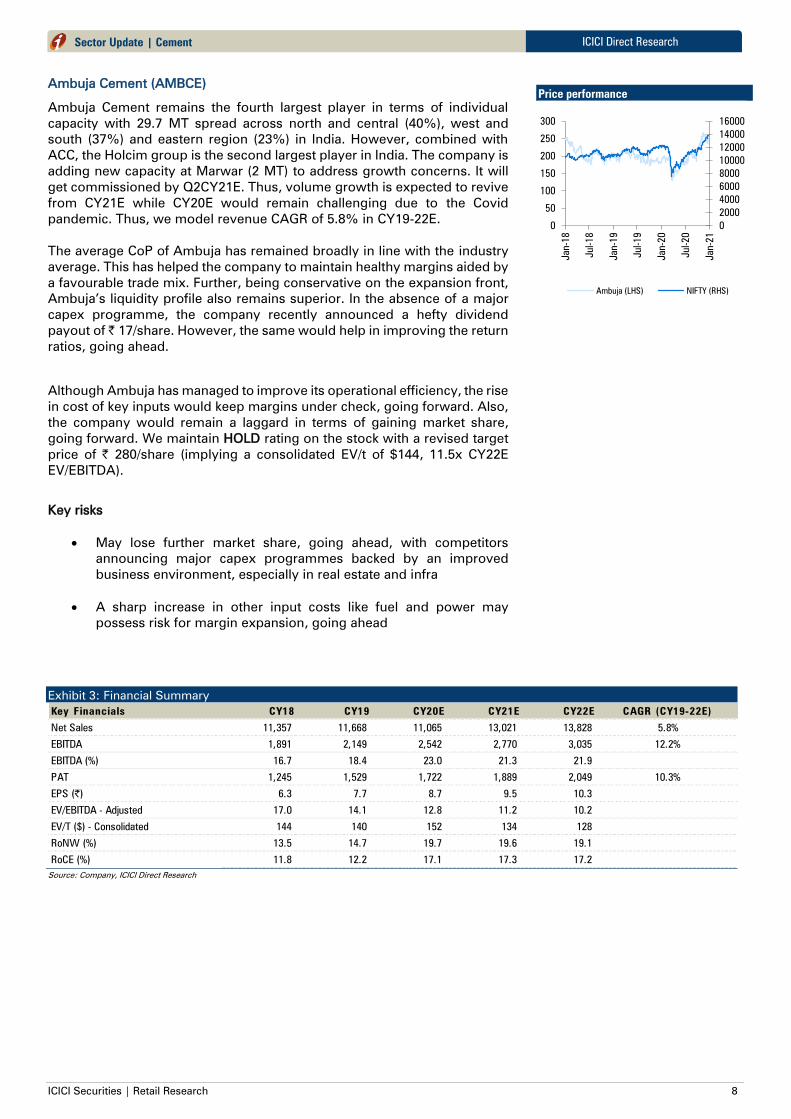
UltraTech Cement (UltraTech)
UltraTech’s operating performance for H1FY21 improved sharply led by
strong demand from rural segment, better pricing environment and benign
costs. The improved outlook has also led to re-instatement of capex plans
by the company that were halted earlier post imposition of lockdown in April
2020. To cope with the issue of capacity constraint in future, the company
has announced 12.8 MT new capacity addition. This involves capex of | 5477
crore i.e. capex of <$60/t, which is below industry replacement cost of
$100/t as 72% of capacity is brownfield. The expected IRR on these new
capacities is ~15% vs. current RoCE of 11.4% due to lower capex per tonne.
With these expansions, UltraTech’s total capacity would reach ~131 MT by
FY23E with long term plan to reach 160 MT. We believe these new capacities
would not only improve reach and network but also aid in reduction in lead
distance also. Further, deployment of strong operating cash towards
capacity expansion in an efficient manner along with deleveraging (targeting
to become deb free by FY23E) would improve return ratios. Hence, we
continue to remain positive on the company from a long term perspective
(please refer our report dated December 10, 2020 for detailed information).
Given the positive outlook, the newly announced capex targeting the central
and east region would address the issue of capacity constraint post FY24E.
Furthermore, organic expansion at lower capital costs (US$60/t) will boost
return ratios (new capacity to generate 15%+ IRR). With a target to become
net debt free by FY23E and 27% earnings CAGR over FY20-23E, we believe
valuations of 11.2x FY23E EV/EBITDA and US$164 EV/t are attractive. We
value the stock at 13x FY23E EV/EBITDA and arrive at a revised target price
of | 6150/share. We maintain our BUY rating on the stock.
Key Risks
Focus on market share gain post commissioning of new capacities
at cost of prices may impact return ratios
Sharp increase in other input costs like fuel, power may possess risk
for margin expansion, going ahead
Exhibit 1: Financial summary
Key Financials FY19 FY20 FY21E FY22E FY23E CAGR (FY20-23E)
Net Sales (| crore) 39933 40634 41099 46546 50469 7%
EBITDA (| crore) 7076 8652 10354 11723 13399 16%
EBITDA (%) 17.7 21.3 25.2 25.2 26.5
Adjusted PAT (| crore) 2530 3602 4994 6092 7307 27%
EPS (|) 87.7 124.8 173.0 211.1 253.2
EV/EBITDA 23.3 18.9 15.5 13.4 11.2
EV/t ($) 208 206 202 190 164
RoNW (%) 7.6 9.4 11.7 12.6 13.2
RoCE (%) 9.0 11.4 13.8 15.3 16.9
Source: Company, ICICI Direct Research
Price performance
0
2000
4000
6000
8000
10000
12000
14000
16000
0
1000
2000
3000
4000
5000
6000
Jan-18
Jul-18
Jan-19
Jul-19
Jan-20
Jul-20
Jan-21
UltraTech (LHS) NIFTY (RHS)

ICICI Securities | Retail Research 7
ICICI Direct Research
Sector Update | Cement
ACC (ACC)
Over the past five years, the company has lost market share to other large
players with no major new capacities coming in place during this period
either through the greenfield or the M&A route. While industry capacity grew
at 7% CAGR, the company managed to increase its capacity from 30.5 MT
to 33.4% at 2% CAGR during this period. As a result, ACC’s production share
declined from 14% in FY14 to 11% in FY20. To address this growth concern,
the company is adding 5.9 MT new cement capacity at a total capex of
| 3000 crore. This would be mainly funded through internal accruals.
However, the new capacity would likely come on stream only by the end of
CY22E.
The concern with respect to the hike in royalty fees from foreign promoter
is also now mitigated with revised technology and knowhow being kept at
1% only for the next two years. Another 1% hike could have led to ~11%
drop in profitability otherwise.
The structural issues with respect to CoP need to be addressed for
sustenance of healthy margins in the long run. On the positive side, strong
B/S and improved cash flow remains a key positive. Rolling over our
valuations to CY22E, we maintain our BUY rating with a revised target price
of | 1,950/share (valuing at 9x CY22E EV/EBITDA implying an EV/t of ~$113).
Key risks
ACC with capacity of 33.4 MT and oldest cement company remains
susceptible to volatility in margins due to its high cost of production
(CoP). The company closed CY19 with CoP remaining higher by over
15% than the industry average CoP of ~| 3960/tonne. Higher fuel
consumption, RM costs are key areas that need to be focus upon to
drive efficiency
ACC has higher share in the south market where cement prices
remain volatile. Any negative movement in cement prices may have
an impact on margins and profitability
Exhibit 2: Financial Summary
| crore CY18 CY19 CY20E CY21E CY22ECAGR (CY20-CY22E)
Net Sales 14478 15407 14149 16880 17611 11.6%
EBITDA 1724 2162 2639 3049 3394 13.4%
EBITDA Margins (%) 11.9 14.0 18.7 18.1 19.3
Adjusted Net Profit 1020 1378 1580 1831 2037 13.5%
EPS (|) 54.3 73.3 84.1 97.5 108.4
EV/EBITDA 16.2 12.2 10.3 8.7 7.5
EV/tonne ($) 119 113 116 97 93
RoNW 9.7 11.9 12.3 12.8 12.5
RoCE 14.2 17.4 17.8 18.6 18.2
RoIC 14.6 21.9 25.1 24.1 24.0
Source: Company, ICICI Direct Research
Price performance
0
2000
4000
6000
8000
10000
12000
14000
16000
0
500
1000
1500
2000
Jan-18
Jul-18
Jan-19
Jul-19
Jan-20
Jul-20
Jan-21
ACC (LHS) NIFTY (RHS)
ICICI Securities | Retail Research 8
ICICI Direct Research
Sector Update | Cement
Ambuja Cement (AMBCE)
Ambuja Cement remains the fourth largest player in terms of individual
capacity with 29.7 MT spread across north and central (40%), west and
south (37%) and eastern region (23%) in India. However, combined with
ACC, the Holcim group is the second largest player in India. The company is
adding new capacity at Marwar (2 MT) to address growth concerns. It will
get commissioned by Q2CY21E. Thus, volume growth is expected to revive
from CY21E while CY20E would remain challenging due to the Covid
pandemic. Thus, we model revenue CAGR of 5.8% in CY19-22E.
The average CoP of Ambuja has remained broadly in line with the industry
average. This has helped the company to maintain healthy margins aided by
a favourable trade mix. Further, being conservative on the expansion front,
Ambuja’s liquidity profile also remains superior. In the absence of a major
capex programme, the company recently announced a hefty dividend
payout of | 17/share. However, the same would help in improving the return
ratios, going ahead.
Although Ambuja has managed to improve its operational efficiency, the rise
in cost of key inputs would keep margins under check, going forward. Also,
the company would remain a laggard in terms of gaining market share,
going forward. We maintain HOLD rating on the stock with a revised target
price of | 280/share (implying a consolidated EV/t of $144, 11.5x CY22E
EV/EBITDA).
Key risks
May lose further market share, going ahead, with competitors
announcing major capex programmes backed by an improved
business environment, especially in real estate and infra
A sharp increase in other input costs like fuel and power may
possess risk for margin expansion, going ahead
Exhibit 3: Financial Summary
Key Financials CY18 CY19 CY20E CY21E CY22E CAGR (CY19-22E)
Net Sales 11,357 11,668 11,065 13,021 13,828 5.8%
EBITDA 1,891 2,149 2,542 2,770 3,035 12.2%
EBITDA (%) 16.7 18.4 23.0 21.3 21.9
PAT 1,245 1,529 1,722 1,889 2,049 10.3%
EPS (|) 6.3 7.7 8.7 9.5 10.3
EV/EBITDA - Adjusted 17.0 14.1 12.8 11.2 10.2
EV/T ($) - Consolidated 144 140 152 134 128
RoNW (%) 13.5 14.7 19.7 19.6 19.1
RoCE (%) 11.8 12.2 17.1 17.3 17.2
Source: Company, ICICI Direct Research
Price performance
0
2000
4000
6000
8000
10000
12000
14000
16000
0
50
100
150
200
250
300
Jan-18
Jul-18
Jan-19
Jul-19
Jan-20
Jul-20
Jan-21
Ambuja (LHS) NIFTY (RHS)
ICICI Securities | Retail Research 9
ICICI Direct Research
Sector Update | Cement
Shree Cement (SHRCEM)
Shree Cement has a strong presence in the north and eastern markets.
Tracking the data since FY07, Shree Cement has always reported double-
digit RoE, thus strongly indicating the management’s efficient capital
allocation. These healthy returns have been generated with net Debt/EBITDA
remaining below 1x throughout this period. We believe the same is going to
be maintained despite new announcement of capex of | 1000 crore with an
aim of doubling capacity in seven years.
Shree Cement has added capacities by entering non-core regions without
jeopardising its profitability and return ratios. We expect the company to
continue its leadership on costs. This would, in turn, help it to consistently
gain market share with improved profitability and return matrix. Thus, it
remains a long term structural play. Raising our multiple, we continue to
maintain our BUY rating on the company with a revised target price of
| 28,000/share (19.5x FY23E EV/EBITDA).
Key Risks
Focus on market share gain post commissioning of new capacities
at cost of prices may impact return ratios
Historically, the company used 100% petcoke for its fuel
requirement. Petcoke prices have remained lower till now. There
was a sharp increase of over 30% rise in petcoke prices in the past
six months. The company is now switching to coal for its fuel
requirement, which may impact its margins in the near term
Exhibit 4: Financial summary
Key Financials FY19 FY20 FY21E FY22E FY23E CAGR (FY20-23E)
Net Sales 11722 11904 12673 14997 16631 11.8%
EBITDA 2653 3675 4178 4651 5036 11.1%
EBITDA (%) 22.6 30.9 33.0 31.0 30.3
PAT 1108 1570 2207 2356 2538 17.4%
EPS (|) 318 435 611 653 703
EV/EBITDA 33.7 23.4 20.7 18.3 16.6
EV/Tonne ($) 297 253 239 235 230
RoNW 11.5 12.1 14.9 13.9 13.3
RoCE 11.5 13.8 17.6 17.7 17.1
Source: Company, ICICI Direct Research
Price performance
0
2000
4000
6000
8000
10000
12000
14000
16000
0
5000
10000
15000
20000
25000
30000
Jan-18
Jul-18
Jan-19
Jul-19
Jan-20
Jul-20
Jan-21
Shree Cement (LHS) NIFTY (RHS)
ICICI Securities | Retail Research 10
ICICI Direct Research
Sector Update | Cement
Ramco Cement (RAMCEM)
Incremental volumes coming up from additional capacities (2 MT already
commissioned and 1 MT Odisha GU commissioned in September 2020, 1
MT GU Kurnool in FY22E) would help Ramco to grow ahead of industry
growth in FY22E. The company is also commissioning a clinkering unit of
1.5 MT along with 9 MW WHRS in Jayanthipuram and 2.25 MT clinkering
unit in Kurnool before March 2021. Factoring in this new capacity, we model
12.1% revenue CAGR in FY20-23E. While newly commissioned grinding
units in Vizag, West Bengal and Odisha would lead to a reduction in transit
distance for the target markets in eastern India, the commissioning of 39 MW
WHRS in a phased manner would bring further efficiencies, going forward.
Ramco has spent | 1,920 crore towards capex in FY20. During H1FY21, the
company incurred | 685 crore. The balance capex to be incurred is | 881
crore to fund the ongoing capex (Odisha GU, Jayanthipuram clinker unit,
WHRS, Kurnool expansion). While debt levels would rise, debt/EBITDA
would improve from 2.8x in FY20 to 1.2x by FY23E. Average cost of interest
on debt for the company is 7.3%, much lower than RoCE. Hence, once capex
is complete, it would help improve RoE in double digits.
Long history of operations, brand equity, low cost producer and a healthy
B/S are factors that helped the company to raise debt at competitive rates.
We expect these factors to drive robust performance in future as well. We
maintain our BUY rating, valuing the company at 12x FY23E EV/EBITDA. We
arrive at a target price of | 1000/share (i.e. EV/t of $175).
Key Risks
Aggressive expansion strategy before stabilisation of new capacities
can put pressure on the return matrix in the medium term
Sharp increase in other input costs like fuel, power may possess risk
for margin expansion, going ahead
Exhibit 5: Financial summary
Key Financials FY19 FY20 FY21E FY22E FY23E CAGR (FY20-23E)
Net Sales 5146 5389 5306 6262 7591 12.1%
EBITDA 1055 1147 1679 1780 2140 23.1%
EBITDA (%) 20.5 21.3 31.6 28.4 28.2
PAT 523 604 857 881 1146 23.8%
EPS (|) 22 26 36 37 49
EV/EBITDA 21.1 20.7 14.3 13.2 10.5
EV/Tonne ($) 205 182 175 170 155
RoNW 11.7 12.3 15.0 13.4 14.8
RoCE 8.2 7.5 9.9 10.1 11.5
Source: Company, ICICI Direct Research
Price performance
0
2000
4000
6000
8000
10000
12000
14000
16000
0
200
400
600
800
1000
Jan-18
Jul-18
Jan-19
Jul-19
Jan-20
Jul-20
Jan-21
Ramco Cement (LHS) NIFTY (RHS)
ICICI Securities | Retail Research 11
ICICI Direct Research
Sector Update | Cement
JK Cement (JKCEME)
With the commissioning of split grinding unit of 0.7 MT at Balasinor, the
entire 4.2 MT has been commissioned this fiscal with total capex spend of
| 1577 crore. The newly added capacities include 1 MT grinding unit (GU)
each in Nimbahara and Mangrol along with 2.6 MT clinker plant, 1.5 MT GU
in Aligarh and 0.7 MT GU in Gujarat (Balasinor). The full volume benefit
potential is expected to get reflected in FY22E. Revenue CAGR is estimated
at 13.2% during the same period.
The next two years are expected to lead to healthy OCF generation due to
commissioning of these new capacities. The same would be majorly utilised
towards next phase of expansion at Panna (MP) for proposed ~3.5-4 MT
greenfield capacity. Hence, we expect debt levels to remain comfortable.
We expect the management’s efforts to improve cost efficiencies through
newly added capacities (4.2 MT) to drive profitability from Q4FY21E
onwards. Thus, we believe there is further scope for growth and margin
expansion. Rolling over our valuations to FY23E, we now upgrade the stock
from HOLD to BUY with a revised target price of | 2450/share (i.e. valuing at
11.5x FY23E EV/EBITDA).
Key Risks
Aggressive expansion strategy before stabilisation of new capacities
can put pressure on the return matrix in the medium term
Sharp increase in other input costs like fuel, power may possess risk
for margin expansion, going ahead
Exhibit 6: Financial summary
Key Financials FY19 FY20 FY21E FY22E FY23E CAGR (FY20-23E)
Net Sales 4981 5464 6048 7003 7828 12.7%
EBITDA 810 1182 1469 1714 1910 17.4%
EBITDA (%) 16.3 21.6 24.3 24.5 24.4
PAT 324 579 668 736 824 12.5%
EPS (|) 42.0 74.9 86.4 95.2 106.6
EV/EBITDA 24.7 17.7 14.4 12.5 11.7
EV/Tonne ($) 242 192 183 186 194
RoNW 11.2 18.5 18.0 16.9 15.9
RoCE 12.5 16.2 17.4 17.4 16.9
Source: Company, ICICI Direct Research
Price performance
0
2000
4000
6000
8000
10000
12000
14000
16000
0
500
1000
1500
2000
2500
Jan-18
Jul-18
Jan-19
Jul-19
Jan-20
Jul-20
Jan-21
JK Cement (LHS) NIFTY (RHS)

ICICI Securities | Retail Research 12
ICICI Direct Research
Sector Update | Cement
JK Lakshmi Cement (JKLAKS)
Being a predominantly north (8.2 MT capacity) and central (3.5 MT capacity)
player, the company has got a structural advantage of balanced supply and
demand environment in these two high growing regions. Further, self-
sufficiency in power, through captive power plant (CPP) of 54 MW, waste
heat recovery (WHR) plant of 14 MW and solar power plant of 6 MW has
helped JK Lakshmi to reduce reliance on costly grid power. The progress on
the WHRS Unit-III Project at Sirohi is going as per schedule and will be
commissioned by July 2021.
The company will now be adding cement capacity of 2.5 MT (1.5 MT clinker)
at its existing plant in Udaipur with total capex of | 1400 crore. The same is
likely to get commissioned by the end of Q3FY24E. Ramp up of capacities
in Durg in the past four years has led to co-generation of annual OCF of
over~| 400 crore. Further, with liquidity buffer of | 700 crore (including
liquid investments), we believe the company is in a better position to fund
this expansion.
While the B/S remains healthy with D/E of 0.6x, the growth concern beyond
FY23E is now being addressed with new capacity expansion. The company
is trading at an EV/t of $50/t and 4.5x FY23E EV/EBITDA, thus providing
valuation comfort. Rolling over our valuations to FY23E, we now revise our
target price to | 450/share (@ 6x FY23E EV/EBITDA) and maintain BUY rating
on the stock.
Key Risks
Delay in commissioning of new capacity may lead the company to
lose out opportunity to ride on surge in capex cycle beyond FY25E
Higher usage of petcoke for fuel requirement may possess risk to
margin expansion in the near term due to sharp surge in petcoke
prices
Exhibit 7: Financial summary
Key Financials FY19 FY20 FY21E FY22E FY23E CAGR (FY20-23E)
Net Sales 3882 4044 4179 4398 4705 5.2%
EBITDA 415 672 779 838 909 10.6%
EBITDA (%) 10.7 16.6 18.6 19.0 19.3
PAT 80 265 333 335 387 13.4%
EPS (|) 6.8 22.6 28.3 28.4 32.9
EV/EBITDA 12.7 7.4 6.2 5.7 4.5
EV/Tonne ($) 64 61 59 58 50
RoNW 5.2 15.5 16.0 15.2 15.0
RoCE 9.3 17.1 19.2 19.9 20.2
Source: Company, ICICI Direct Research
Price performance
0
2000
4000
6000
8000
10000
12000
14000
16000
0
100
200
300
400
500
Jan-18
Jul-18
Jan-19
Jul-19
Jan-20
Jul-20
Jan-21
JK Lakshmi Cement(LHS) NIFTY (RHS)

ICICI Securities | Retail Research 13
ICICI Direct Research
Sector Update | Cement
Heidelberg Cement (HEICEM)
Heidelberg (HCIL) had a weak balance sheet, which over time has
strengthened with debt brought under control. Debt/EBITDA may reduce to
0.5x by FY22E. HCIL has a strong brand presence and higher share in retail
trade. Thus, better realisations, investments in CPP and WHRMS to
rationalise costs have helped the company to rank among the best in the
industry on the EBITDA margins front (upwards of 20% since FY19). RoCE
is also among the best in industry, clocking in excess of 20% for two years
led by reducing debt. With no major capex planned by the company and
sufficient headroom for growth led by de-bottlenecking operations, we
expect debt to reduce further and return ratios to improve (25%+ RoCE and
RoIC), going forward.
HCIL is one of the companies that ticks all the right boxes – healthy
profitability, strong balance sheet, robust return ratios and strong retail
presence. While minor hiccups in the form of de-growth are expected in
FY21, the company is expected to rebound strongly in FY22E. Rolling our
valuations to FY23E, we revise our target price upwards to | 265/share and
maintain BUY rating (i.e. 8.5x FY23E EV/EBITDA, implying an EV/t of $130).
Key Risks
Risk of losing out market share to other players due to capacity
constraint may lead to loss of business opportunity though liquidity
profile will continue to remain superior
Volatility in prices of key raw materials like petcoke, freight may
weigh on margins
Exhibit 8: Financial summary
Key Financials FY19 FY20 FY21E FY22E FY23E CAGR (FY20-23E)
Net Sales 2109 2158 1938 2395 2721 8.0%
EBITDA 459 516 465 593 685 9.9%
EBITDA (%) 21.8 23.9 24.0 24.8 25.2
Net Profit 220 268 231 331 406 14.9%
EPS 9.7 11.8 10.2 14.6 17.9
EV/EBITDA 12.3 10.4 11.6 8.7 7.2
EV/Tonne ($) 150 139 123 117 113
RoNW 20.5 20.4 19.0 24.0 25.2
RoCE 21.8 22.3 20.3 27.5 31.6
Source: Company, ICICI Direct Research
Price performance
0
2000
4000
6000
8000
10000
12000
14000
16000
0
50
100
150
200
250
Jan-18
Jul-18
Jan-19
Jul-19
Jan-20
Jul-20
Jan-21
Heidelberg Cement (LHS) NIFTY (RHS)
ICICI Securities | Retail Research 14
ICICI Direct Research
Sector Update | Cement
Orient Cement (ORICEM)
Orient Cement mainly derives revenues largely from Maharashtra,
Telangana and Karnataka markets. A revival in these markets, particularly
Maharashtra and Telangana, would help the company improve its
performance better. Key factors driving cement demand over FY20-22E are:
a) strong rural demand, b) irrigation projects, c) housing projects in Andhra
Pradesh/Telangana and infrastructure projects like metro in Mumbai-Pune,
Mumbai-Nagpur Expressway, etc. Also, the pricing environment, especially
in the south, has improved sharply over the past nine months, which would
lead to better revenue and margins, going ahead.
The structural cost advantage and presence in rural centric market (least
affected by Covid) remain key positives for the company, which will guard
its earnings in the current uncertain times. At the CMP, the stock is available
at attractive valuations of 6.0x on FY23E EV/EBITDA. With the company’s
focus on strengthening B/S, we expect a re-rating of the stock, going
forward. We roll over our valuation multiple to FY23E and value the
company at 7.5x EV/EBITDA to arrive at a target price of | 105/share and
maintain BUY rating (i.e. at 7.5x FY23E EV/EBITDA, implied EV/tonne of
$60/tonne).
Key Risks
Delay or deferral of infrastructure projects by state governments in
Andhra Pradesh/Telangana can have negative impact on volumes
The promoter holding remains low at present
Exhibit 9: Financial summary
Key Financials FY19 FY20 FY21E FY22E FY23E CAGR (FY20-23E)
Net Sales 2522 2422 1996 2544 2744 4.3%
EBITDA 312 383 362 411 437 4.5%
EBITDA (%) 12.4 15.8 18.1 16.2 15.9
Net Profit 48 87 69 106 126 13.3%
EPS 2.3 4.2 3.3 5.2 6.1
EV/EBITDA 9.6 7.6 8.0 6.8 5.9
EV/Tonne ($) 54 52 52 50 46
RoNW 4.5 7.7 5.9 8.7 9.5
RoCE 7.9 10.7 9.8 12.2 13.1
Source: Company, ICICI Direct Research
Price performance
0
2000
4000
6000
8000
10000
12000
14000
0
20
40
60
80
100
120
140
160
Jan-18
Jul-18
Jan-19
Jul-19
Jan-20
Jul-20
Jan-21
Orient Cement (LHS) NIFTY (RHS)
ICICI Securities | Retail Research 15
ICICI Direct Research
Sector Update | Cement
Birla Corp (BIRCOR)
Birla Corp’s operating performance has improved significantly in the past
three years with EBITDA increasing to | 1,015/t in FY20 (FY19: | 733/t; FY18:
| 665/t), driven by a combination of an increase in realisations and reduction
in costs. Further, an increase in the proportion of higher-margin premium
cement (H1FY21: 46%, FY20: 40%, FY19: 37% of trade sales, respectively))
and blended cement (94%, 93%; 89%) in its mix along with the
implementation of cost-reduction measures such as waste heat recovery-
based and solar power plants to replace high-cost grid power and
construction of railway siding at Kundanganj (Uttar Pradesh), aided its
EBITDA.
Region wise, the company has a significant presence in the central (over
50% of sales), eastern (about 25%) and northern (about 20%) regions, and
a small presence in the western region. However, post the completion of its
integrated cement plant in Maharashtra in FY22, the company will be able to
generate around 20% of its sales from the western region, leading to a
balanced presence across the four regions.
While the ongoing expansion may increase the debt burden in the medium
term, the company’s healthy asset utilisations, healthy margin profile remain
key positives, which will help the company to maintain debt/EBITDA levels
at comfortable levels. We roll over our valuations to FY23E and revise our
target price upwards to | 925/share and maintain BUY rating. (ie. valuing at
7.5x FY23E EV/EBITDA, EV/t of $93/t).
Key Risks
Focus on market share gain post commissioning of new capacities
at cost of prices may impact return ratios
The ongoing legal battle between the Lodha and Birla group over
control of Birla Corporation could have a bearing on the key
business decisions as the matter is still pending in court
Exhibit 10: Financial summary
Key Financials FY19 FY20 FY21E FY22E FY23E CAGR (FY20-23E)
Net Sales 6549 6916 6079 7076 8378 6.6%
EBITDA 949 1336 1261 1460 1795 10.4%
EBITDA (%) 14.5 19.3 20.7 20.6 21.4
Net Profit 256 506 432 443 554 3.0%
EPS 33.2 65.7 56.1 57.6 71.9
EV/EBITDA 10.6 7.7 8.5 8.3 6.7
EV/Tonne ($) 93 95 98 89 83
RoNW 5.9 11.1 8.8 8.4 9.7
RoCE 7.8 11.4 9.4 9.0 9.8
Source: Company, ICICI Direct Research
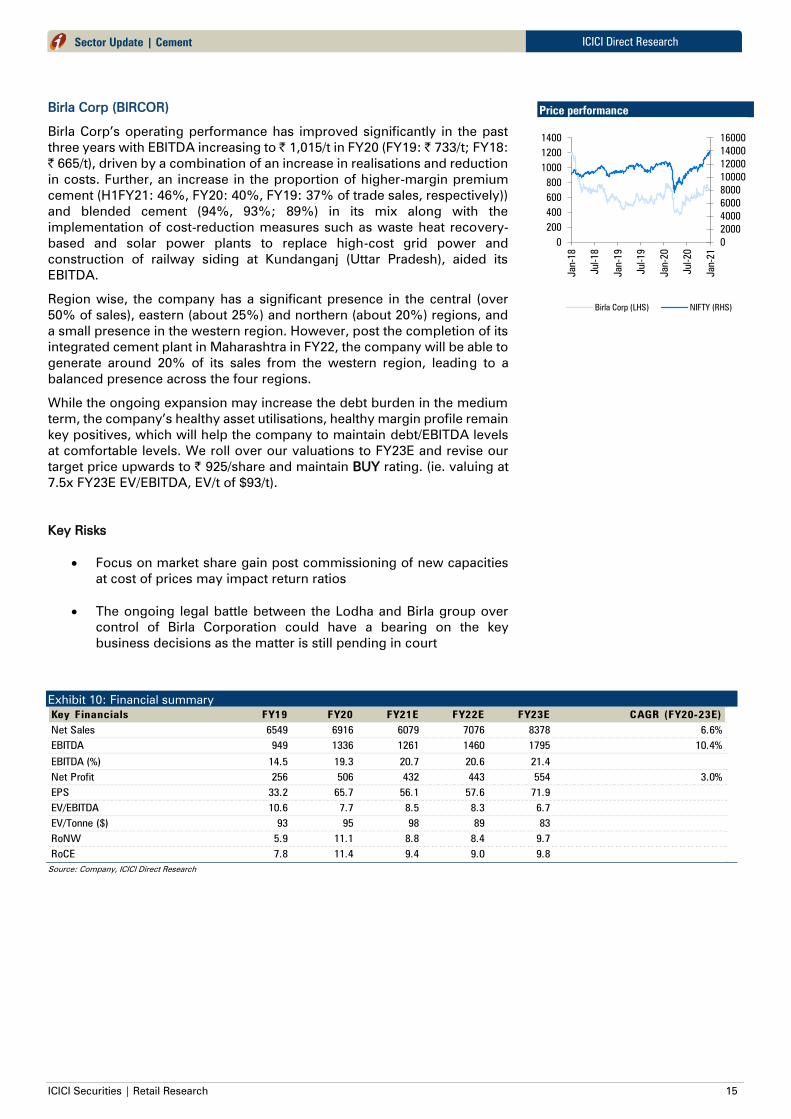
Price performance
0
2000
4000
6000
8000
10000
12000
14000
16000
0
200
400
600
800
1000
1200
1400
Jan-18
Jul-18
Jan-19
Jul-19
Jan-20
Jul-20
Jan-21
Birla Corp (LHS) NIFTY (RHS)
ICICI Securities | Retail Research 16
ICICI Direct Research
Sector Update | Cement
Star Cement (STACEM)
Star Cement being the leader in North East region (NER) with over ~24%
share remains a preferred play to ride the growth story of NER. Also, being
a brand leader, the company generates EBITDA/tonne of over ~| 1400/t,
which remains one of the highest among all major industry players.
With respect to capacity expansion, the company would be spending | 80
crore in FY21E on the Siliguri unit. It has also applied for various clearances
for setting up a clinker unit in Meghalaya and would be spending | 104 crore
on the new clinker unit in Lumshnong. This, along with the WHRMS unit,
would require Star to spend ~| 260 crore in FY21E. The Meghalaya plant is
expected to start operations in 2023. With cash equivalent of over | 280
crore and pending subsidy receivables of | 50 crore, the company is in a
better position to fund expansion without debt support.
The company continues to remain a leader in the NER. With commissioning
of new capacity, we expect Star Cement to return to a healthy growth
trajectory curve with RoCE inching upwards to 15% by FY23E. We now roll
over our valuation multiple to FY23E and revise our target price to
| 125/share and maintain BUY rating on the stock (i.e. valuing at ~8.5x
FY23E EV/EBITDA and EV/t of $95/t).
Key Risks
While the company has remained dominant player in NER region,
expansion of footprint to other key eastern regions may lead to
some moderation in operating margins as major key players are
present in these newer regions
Post end of benefit of key transport and other subsidies from FY24E
onwards, the margin may shrink to that extent unless the same is
recovered through price hikes
Exhibit 11: Financial summary
Key Financials FY19 FY20 FY21E FY22E FY23E CAGR (FY20-23E)
Net Sales 1,831 1,844 1,627 2,054 2,282 7.4%
EBITDA 455 424 365 452 514 6.6%
EBITDA (%) 24.8 23.0 22.5 22.0 22.5
PAT 299 286 200 276 309 2.7%
EPS (|) 7.2 6.9 4.8 6.7 7.5
EV/EBITDA 9.3 9.6 10.5 8.4 7.1
EV/T ($) 137 131 90 85 82
RoCE (%) 19.5 17.1 12.1 14.9 15.9
RoNW (%) 17.8 15.4 10.1 12.9 12.7
Source: Company, ICICI Direct Research
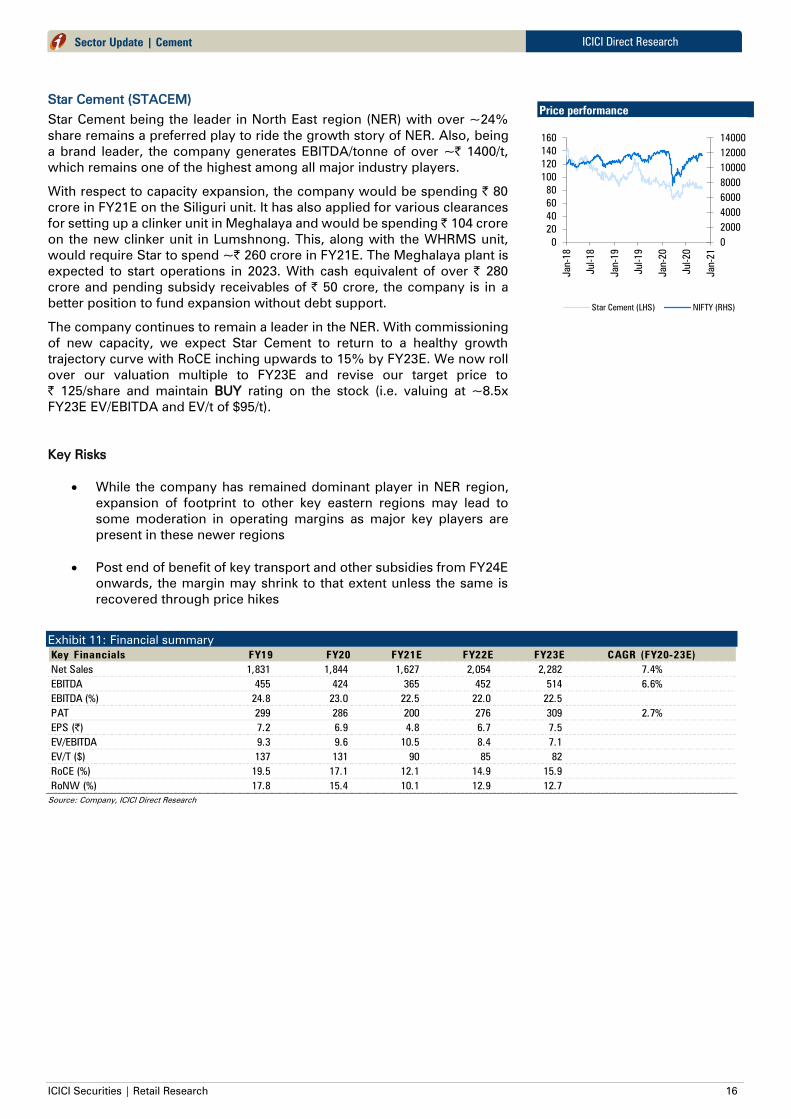
Price performance
0
2000
4000
6000
8000
10000
12000
14000
0
20
40
60
80
100
120
140
160
Jan-18
Jul-18
Jan-19
Jul-19
Jan-20
Jul-20
Jan-21
Star Cement (LHS) NIFTY (RHS)
ICICI Securities | Retail Research 17
ICICI Direct Research
Sector Update | Cement
Mangalam Cement (MANCEM)
Mangalam Cement (MCL) is a north based small cement player. It currently
has an installed cement capacity of 4.0 MT (0.75 MT grinding unit at Aligarh
commenced in September 2016), clinker capacity of 2.30 MT. The company
markets and sells its product under the brand name Birla Uttam Cement.
MCL’s product mix comprises both PPC and OPC.
The company has two units of coal based captive power plant with an
installed capacity of 35 MW in Kota, two units of wind based power with an
installed capacity of 13.65 MW in Jaisalmer and newly established 11 MW
WHRS plant in Kota ensuring continuous supply of power at competitive
rates. The captive power sources catered to about 72% of the company’s
power requirement in FY20 (77% in FY18), which increased to 83% in
H1FY21 after commissioning of WHRS plant in phases from January 2020 to
August 2020. The WHRS plant is expected to reduce power costs by ~| 25
crore per annum owing to its low operating cost of ~| 0.60 per unit of power
generated compared to | 6 per unit of power taken from the grid.
The company is also in the process of enhancement of its clinker capacity at
its existing facility at Morak, Rajasthan from 2.3 MT to 2.6 MT at a projected
cost of | 135 crore, which is to be funded through debt of | 100 crore and
balance from internal accruals. The same is expected to get commissioned
by Q1FY22E. With focus on bringing more efficiency by reducing the power
cost along with capacity expansion without putting much stress on balance
sheet, we believe valuations of $40 EV/tonne looks attractive. Hence, we
upgrade the stock from HOLD to BUY with a revised target price of |
325/share (i.e. valuing at 4.5x FY23E EV/EBITDA, $45tonne).
Key Risks
Higher share of non-retail segment may lead to low realisation per
tonne of cement
Volatility in prices of key raw materials like petcoke, freight may
weigh on margins
Exhibit 12: Financial summary
Key Financials FY19 FY20 FY21E FY22E FY23E CAGR (FY20-23E)
Net Sales 1195 1228 1241 1397 1596 9%
EBITDA 53 199 215 239 308 16%
EBITDA (%) 4.4 16.2 17.4 17.1 19.3
Net Profit -10 76 80 106 168 30%
EPS -3.7 28.4 29.8 39.6 63.1
EV/EBITDA 22.7 6.3 6.3 5.3 3.6
EV/Tonne ($) 43 45 48 45 39
RoNW -2.0 13.2 12.2 14.0 18.3
RoCE 3.2 13.8 13.4 14.0 18.5
Source: Company, ICICI Direct Research
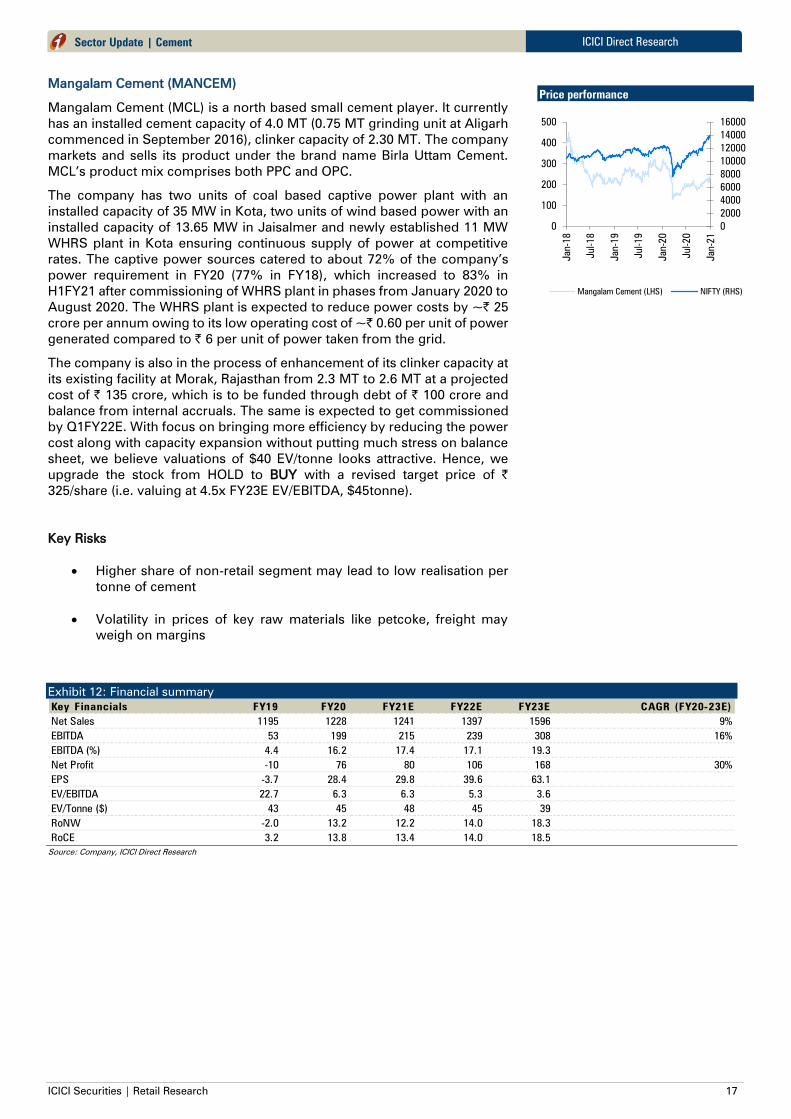
Price performance
0
2000
4000
6000
8000
10000
12000
14000
16000
0
100
200
300
400
500
Jan-18
Jul-18
Jan-19
Jul-19
Jan-20
Jul-20
Jan-21
Mangalam Cement (LHS) NIFTY (RHS)
ICICI Securities | Retail Research 18
ICICI Direct Research
Sector Update | Cement
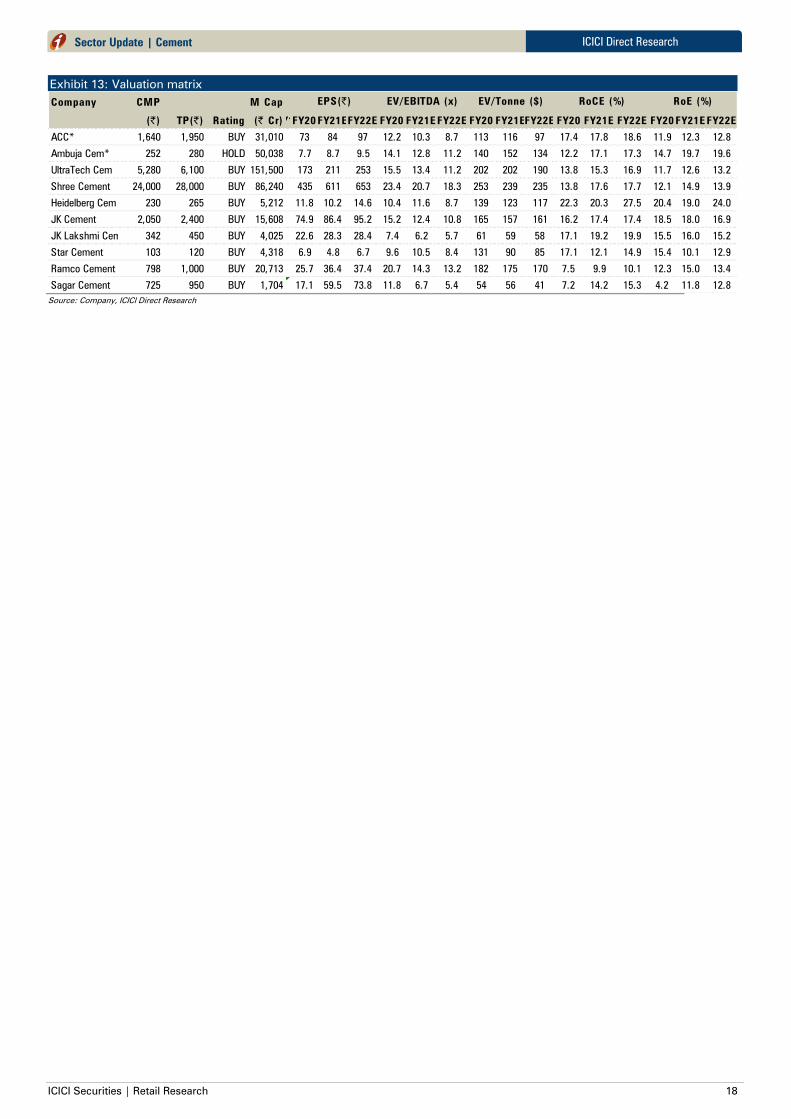
Exhibit 13: Valuation matrix
Company CMP M Cap
(|) TP(|) Rating (| Cr)FY18FY20 FY21EFY22E FY20 FY21E FY22E FY20 FY21EFY22E FY20 FY21E FY22E FY20 FY21E FY22E
ACC* 1,640 1,950 BUY 31,010 73 84 97 12.2 10.3 8.7 113 116 97 17.4 17.8 18.6 11.9 12.3 12.8
Ambuja Cem* 252 280 HOLD 50,038 7.7 8.7 9.5 14.1 12.8 11.2 140 152 134 12.2 17.1 17.3 14.7 19.7 19.6
UltraTech Cem 5,280 6,100 BUY 151,500 173 211 253 15.5 13.4 11.2 202 202 190 13.8 15.3 16.9 11.7 12.6 13.2
Shree Cement 24,000 28,000 BUY 86,240 435 611 653 23.4 20.7 18.3 253 239 235 13.8 17.6 17.7 12.1 14.9 13.9
Heidelberg Cem 230 265 BUY 5,212 11.8 10.2 14.6 10.4 11.6 8.7 139 123 117 22.3 20.3 27.5 20.4 19.0 24.0
JK Cement 2,050 2,400 BUY 15,608 74.9 86.4 95.2 15.2 12.4 10.8 165 157 161 16.2 17.4 17.4 18.5 18.0 16.9
JK Lakshmi Cem 342 450 BUY 4,025 22.6 28.3 28.4 7.4 6.2 5.7 61 59 58 17.1 19.2 19.9 15.5 16.0 15.2
Star Cement 103 120 BUY 4,318 6.9 4.8 6.7 9.6 10.5 8.4 131 90 85 17.1 12.1 14.9 15.4 10.1 12.9
Ramco Cement 798 1,000 BUY 20,713 25.7 36.4 37.4 20.7 14.3 13.2 182 175 170 7.5 9.9 10.1 12.3 15.0 13.4
Sagar Cement 725 950 BUY 1,704 17.1 59.5 73.8 11.8 6.7 5.4 54 56 41 7.2 14.2 15.3 4.2 11.8 12.8
EPS(|) EV/EBITDA (x) EV/Tonne ($) RoE (%)RoCE (%)
Source: Company, ICICI Direct Research
ICICI Securities | Retail Research 19
ICICI Direct Research
Sector Update | Cement
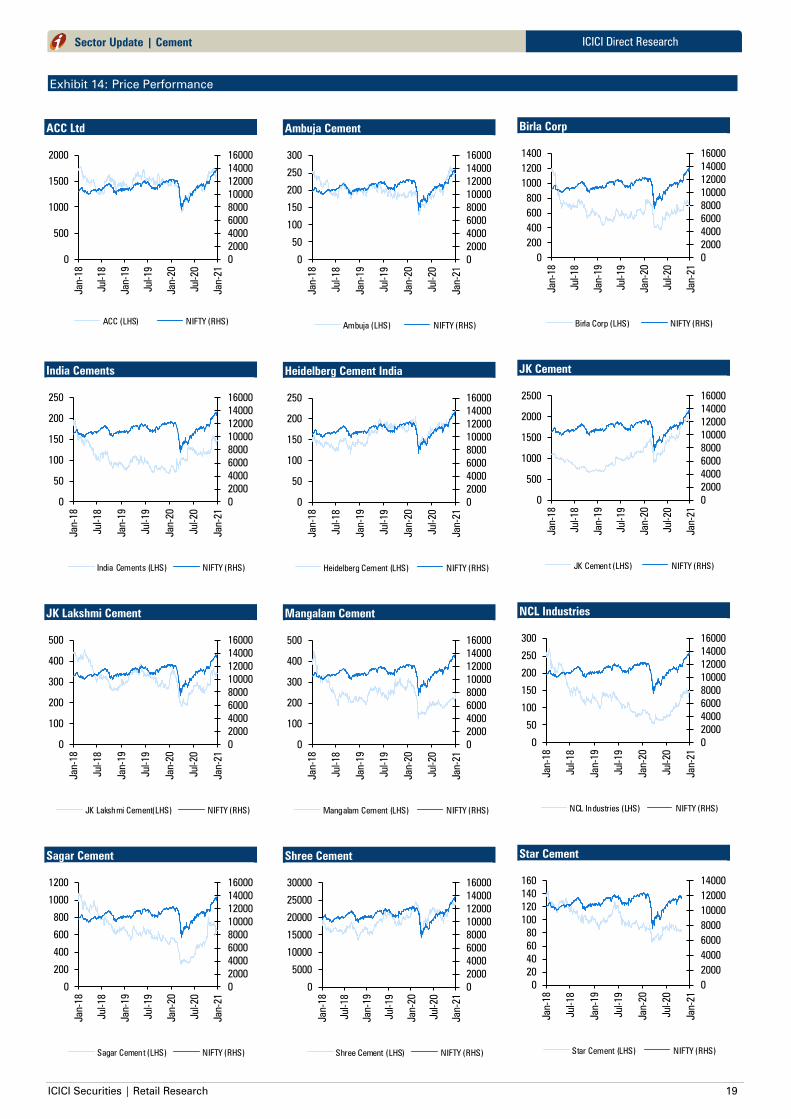
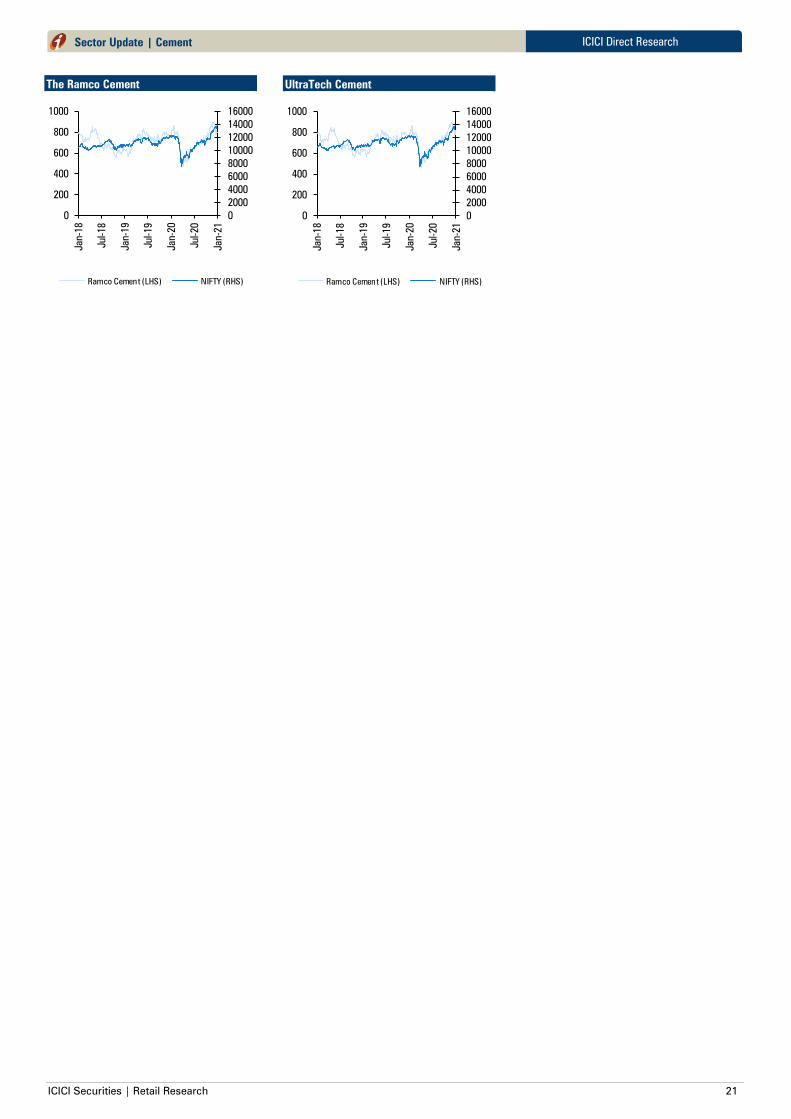
Exhibit 14: Price Performance
ACC Ltd
0
2000
4000
6000
8000
10000
12000
14000
16000
0
500
1000
1500
2000
Jan-18
Jul-18
Jan-19
Jul-19
Jan-20
Jul-20
Jan-21
ACC (LHS) NIFTY (RHS)
Ambuja Cement
0
2000
4000
6000
8000
10000
12000
14000
16000
0
50
100
150
200
250
300
Jan-18
Jul-18
Jan-19
Jul-19
Jan-20
Jul-20
Jan-21
Ambuja (LHS) NIFTY (RHS)
Birla Corp
0
2000
4000
6000
8000
10000
12000
14000
16000
0
200
400
600
800
1000
1200
1400
Jan-18
Jul-18
Jan-19
Jul-19
Jan-20
Jul-20
Jan-21
Birla Corp (LHS) NIFTY (RHS)
India Cements
0
2000
4000
6000
8000
10000
12000
14000
16000
0
50
100
150
200
250
Jan-18
Jul-18
Jan-19
Jul-19
Jan-20
Jul-20
Jan-21
India Cements (LHS) NIFTY (RHS)
Heidelberg Cement India
0
2000
4000
6000
8000
10000
12000
14000
16000
0
50
100
150
200
250
Jan-18
Jul-18
Jan-19
Jul-19
Jan-20
Jul-20
Jan-21
Heidelberg Cement (LHS) NIFTY (RHS)
JK Cement
0
2000
4000
6000
8000
10000
12000
14000
16000
0
500
1000
1500
2000
2500
Jan-18
Jul-18
Jan-19
Jul-19
Jan-20
Jul-20
Jan-21
JK Cement (LHS) NIFTY (RHS)
JK Lakshmi Cement
0
2000
4000
6000
8000
10000
12000
14000
16000
0
100
200
300
400
500
Jan-18
Jul-18
Jan-19
Jul-19
Jan-20
Jul-20
Jan-21
JK Lakshmi Cement(LHS) NIFTY (RHS)
Mangalam Cement
0
2000
4000
6000
8000
10000
12000
14000
16000
0
100
200
300
400
500
Jan-18
Jul-18
Jan-19
Jul-19
Jan-20
Jul-20
Jan-21
Mangalam Cement (LHS) NIFTY (RHS)
NCL Industries
0
2000
4000
6000
8000
10000
12000
14000
16000
0
50
100
150
200
250
300
Jan-18
Jul-18
Jan-19
Jul-19
Jan-20
Jul-20
Jan-21
NCL Industries (LHS) NIFTY (RHS)
Sagar Cement
0
2000
4000
6000
8000
10000
12000
14000
16000
0
200
400
600
800
1000
1200
Jan-18
Jul-18
Jan-19
Jul-19
Jan-20
Jul-20
Jan-21
Sagar Cement (LHS) NIFTY (RHS)
Shree Cement
0
2000
4000
6000
8000
10000
12000
14000
16000
0
5000
10000
15000
20000
25000
30000
Jan-18
Jul-18
Jan-19
Jul-19
Jan-20
Jul-20
Jan-21
Shree Cement (LHS) NIFTY (RHS)
Star Cement
0
2000
4000
6000
8000
10000
12000
14000
0
20
40
60
80
100
120
140
160
Jan-18
Jul-18
Jan-19
Jul-19
Jan-20
Jul-20
Jan-21
Star Cement (LHS) NIFTY (RHS)

ICICI Securities | Retail Research 20
ICICI Direct Research
Sector Update | Cement
RATING RATIONALE
ICICI Direct endeavors to provide objective opinions and recommendations. ICICI Direct assigns ratings to its
stocks according to their notional target price vs. current market price and then categorizes them as Buy, Hold,
Reduce and Sell. The performance horizon is two years unless specified and the notional target price is defined
as the analysts' valuation for a stock
Buy: >15%
Hold: -5% to 15%;
Reduce: -15% to -5%;
Sell: <-15%
Pankaj Pandey Head – Research [email protected]
ICICI Direct Research Desk,
ICICI Securities Limited,
1st Floor, Akruti Trade Centre,
Road No 7, MIDC,
Andheri (East)
Mumbai – 400 093
ICICI Securities | Retail Research 21
ICICI Direct Research
Sector Update | Cement
The Ramco Cement
0
2000
4000
6000
8000
10000
12000
14000
16000
0
200
400
600
800
1000
Jan-18
Jul-18
Jan-19
Jul-19
Jan-20
Jul-20
Jan-21
Ramco Cement (LHS) NIFTY (RHS)
UltraTech Cement
0
2000
4000
6000
8000
10000
12000
14000
16000
0
200
400
600
800
1000
Jan-18
Jul-18
Jan-19
Jul-19
Jan-20
Jul-20
Jan-21
Ramco Cement (LHS) NIFTY (RHS)
ICICI Securities | Retail Research 22
ICICI Direct Research
Sector Update | Cement
ANALYST CERTIFICATION
I/We, Rashesh Shah CA, Research Analyst, authors and the names subscribed to this report, hereby certify that all of the views expressed in this research report accurately reflect our views about the subject issuer(s) or securities.
We also certify that no part of our compensation was, is, or will be directly or indirectly related to the specific recommendation(s) or view(s) in this report. It is also confirmed that above mentioned Analysts of this report have not
received any compensation from the companies mentioned in the report in the preceding twelve months and do not serve as an officer, director or employee of the companies mentioned in the report
Terms & conditions and other disclosures:
ICICI Securities Limited (ICICI Securities) is a full-service, integrated investment banking and is, inter alia, engaged in the business of stock brokering and distribution of financial products. ICICI Securities is Sebi registered stock
broker, merchant banker, investment adviser, portfolio manager and Research Analyst. ICICI Securities is registered with Insurance Regulatory Development Authority of India Limited (IRDAI) as a composite corporate agent and with
PFRDA as a Point of Presence. ICICI Securities Limited Research Analyst SEBI Registration Number – INH000000990. ICICI Securities Limited SEBI Registration is INZ000183631 for stock broker. ICICI Securities is a subsidiary of
ICICI Bank which is India’s largest private sector bank and has its various subsidiaries engaged in businesses of housing finance, asset management, life insurance, general insurance, venture capital fund management, etc.
(“associates”), the details in respect of which are available on www.icicibank.com.
ICICI Securities is one of the leading merchant bankers/ underwriters of securities and participate in virtually all securities trading markets in India. We and our associates might have investment banking and other business relationship
with a significant percentage of companies covered by our Investment Research Department. ICICI Securities generally prohibits its analysts, persons reporting to analysts and their relatives from maintaining a financial interest in the
securities or derivatives of any companies that the analysts cover.
Recommendation in reports based on technical and derivative analysis centre on studying charts of a stock's price movement, outstanding positions, trading volume etc as opposed to focusing on a company's fundamentals and, as
such, may not match with the recommendation in fundamental reports. Investors may visit icicidirect.com to view the Fundamental and Technical Research Reports.
Our proprietary trading and investment businesses may make investment decisions that are inconsistent with the recommendations expressed herein.
ICICI Securities Limited has two independent equity research groups: Institutional Research and Retail Research. This report has been prepared by the Retail Research. The views and opinions expressed in this document may or may
not match or may be contrary with the views, estimates, rating, target price of the Institutional Research.
The information and opinions in this report have been prepared by ICICI Securities and are subject to change without any notice. The report and information contained herein is strictly confidential and meant solely for the selected
recipient and may not be altered in any way, transmitted to, copied or distributed, in part or in whole, to any other person or to the media or reproduced in any form, without prior written consent of ICICI Securities. While we would
endeavour to update the information herein on a reasonable basis, ICICI Securities is under no obligation to update or keep the information current. Also, there may be regulatory, compliance or other reasons that may prevent ICICI
Securities from doing so. Non-rated securities indicate that rating on a particular security has been suspended temporarily and such suspension is in compliance with applicable regulations and/or ICICI Securities policies, in
circumstances where ICICI Securities might be acting in an advisory capacity to this company, or in certain other circumstances.
This report is based on information obtained from public sources and sources believed to be reliable, but no independent verification has been made nor is its accuracy or completeness guaranteed. This report and information herein
is solely for informational purpose and shall not be used or considered as an offer document or solicitation of offer to buy or sell or subscribe for securities or other financial instruments. Though disseminated to all the customers
simultaneously, not all customers may receive this report at the same time. ICICI Securities will not treat recipients as customers by virtue of their receiving this report. Nothing in this report constitutes investment, legal, accounting
and tax advice or a representation that any investment or strategy is suitable or appropriate to your specific circumstances. The securities discussed and opinions expressed in this report may not be suitable for all investors, who
must make their own investment decisions, based on their own investment objectives, financial positions and needs of specific recipient. This may not be taken in substitution for the exercise of independent judgment by any recipient.
The recipient should independently evaluate the investment risks. The value and return on investment may vary because of changes in interest rates, foreign exchange rates or any other reason. ICICI Securities accepts no liabilities
whatsoever for any loss or damage of any kind arising out of the use of this report. Past performance is not necessarily a guide to future performance. Investors are advised to see Risk Disclosure Document to understand the risks
associated before investing in the securities markets. Actual results may differ materially from those set forth in projections. Forward-looking statements are not predictions and may be subject to change without notice.
ICICI Securities or its associates might have managed or co-managed public offering of securities for the subject company or might have been mandated by the subject company for any other assignment in the past twelve months.
ICICI Securities or its associates might have received any compensation from the companies mentioned in the report during the period preceding twelve months from the date of this report for services in respect of managing or co-
managing public offerings, corporate finance, investment banking or merchant banking, brokerage services or other advisory service in a merger or specific transaction.
ICICI Securities encourages independence in research report preparation and strives to minimize conflict in preparation of research report. ICICI Securities or its associates or its analysts did not receive any compensation or other
benefits from the companies mentioned in the report or third party in connection with preparation of the research report. Accordingly, neither ICICI Securities nor Research Analysts and their relatives have any material conflict of
interest at the time of publication of this report.
Compensation of our Research Analysts is not based on any specific merchant banking, investment banking or brokerage service transactions.
ICICI Securities or its subsidiaries collectively or Research Analysts or their relatives do not own 1% or more of the equity securities of the Company mentioned in the report as of the last day of the month preceding the publication of
the research report.
Since associates of ICICI Securities are engaged in various financial service businesses, they might have financial interests or beneficial ownership in various companies including the subject company/companies mentioned in this
report.
ICICI Securities may have issued other reports that are inconsistent with and reach different conclusion from the information presented in this report.
Neither the Research Analysts nor ICICI Securities have been engaged in market making activity for the companies mentioned in the report.
We submit that no material disciplinary action has been taken on ICICI Securities by any Regulatory Authority impacting Equity Research Analysis activities.
This report is not directed or intended for distribution to, or use by, any person or entity who is a citizen or resident of or located in any locality, state, country or other jurisdiction, where such distribution, publication, availability or
use would be contrary to law, regulation or which would subject ICICI Securities and affiliates to any registration or licensing requirement within such jurisdiction. The securities described herein may or may not be eligible for sale in
all jurisdictions or to certain category of investors. Persons in whose possession this document may come are required to inform themselves of and to observe such restriction.
Related Documents