LEARN FASTER, LEARN BETTER! BOOCs EPFL CELLULAR MECHANISMS OF BRAIN FUNCTION Carl Petersen Cellular Mechanisms of Brain Function Carl Petersen DOWNLOAD THE EBOOK

Welcome message from author
This document is posted to help you gain knowledge. Please leave a comment to let me know what you think about it! Share it to your friends and learn new things together.
Transcript
LEARN
FASTER,
LEARN
BETTER!
BOOCs EPFL
CELLULAR MECHANISMS OF BRAIN FUNCTION
Carl Petersen
Cellular Mechanisms of Brain Function
Carl Petersen
DOWNLOAD THE EBOOK

LEARN
FASTER,
LEARN
BETTER!
BOOCs EPFL
2
WEEK 1 1:40:24 W
EEK 2 1:48:05
WEEK 7
1:43:36
WEEK 6
2:09:28 W
EEK 5 1:33:50
WEEK 4 2:15:47
W
EEK
3 2
:01:
47
6
.3
6
.4
6.5
7.1
7.2 7.3 7.4 7.5 1.1 1.2 1.3 1.4 1.5 2.1 2.2 2.3 2.4 2.56.2 6.1 5.5 5.4 5.3 5.2 5.1 4.5 4.4 4.3 4.2 4
.1 3
.5 3.
4 3
.3
3.2
3.1
Cellular Mechanisms of Brain Function
Carl Petersen
LESSONS

LEARN
FASTER,
LEARN
BETTER!
BOOCs EPFL
3Cellular Mechanisms of Brain Function
Carl Petersen
CONTENT
WEEK 11.1 Introduction 51.2 The cell membrane 61.3 Ion channels 81.4 Membrane potential 111.5 Cable properties 14
WEEK 22.1 Voltage-gated channels 162.2 Voltage-gating kinetics 202.3 The action potential 232.4 Action potential propagation 272.5 Whole-cell recordings 30
WEEK 33.1 Synaptic transmission 323.2 Neurotransmitter release 353.3 Presynaptic dynamics 383.4 Presynaptic modulation 413.5 Electron microscopy 45
WEEK 44.1 Glutamate receptors 484.2 Postsynaptic potentials 514.3 Glutamatergic circuits 544.4 Synaptic plasticity 584.5 Dendritic spines 61
WEEK 55.1 GABAergic inhibition 645.2 Inhibitory synaptic conductances 665.3 Benzodiazepines 685.4 GABAergic projections 715.5 Neocortical inhibition 74
WEEK 66.1 Brain function and behavior 766.2 Man and mouse 786.3 Imaging the brain in action 816.4 In vivo electrophysiology 846.5 Controlling brain function 87

LEARN
FASTER,
LEARN
BETTER!
BOOCs EPFL
4 Cellular Mechanisms of Brain Function
Carl Petersen
WEEK 77.1 Sensorimotor interactions 907.2 Sensory perception 957.3 Learning 997.4 Brain dysfunction 1027.5 Concluding remarks 105
LEARN
FASTER,
LEARN
BETTER!
BOOCs EPFL
5Cellular Mechanisms of Brain Function
Carl Petersen
1.1 INTRODUCTION
Brain function governs our every thought and action, and its activity allows us to perceive the world and learn from our experiences. In order to begin to understand how the brain functions, it is necessary to grasp the mechanistic activity at the level of the brain’s irreducible components: neurons and synapses. The neurons are the excitable cells of the brain, and the synapses are the specializations where the neurons communicate with each other.
During this seven-week course, the basic principles of mammalian brain function will be assembled in a coherent and up-to-date description. The first three weeks (Weeks 1 to 3) will focus on the biophysics of neurons and synapses, exploring the electrical and chemical signals within and between neurons. Weeks 4 and 5 will discuss excitatory glutamatergic neurons and inhibitory GABAergic neurons respectively, and begin to consider how these different types of neurons are wired together into neuronal networks performing useful brain functions. With all this knowledge in hand, in the last two weeks of the course (Weeks 6 and 7), the final aim is to understand how neuronal activity can process sensorimotor information leading to subjective percepts and behavioral decisions, along with a discussion of the types of tools and methods available in modern neuroscience that are now beginning to provide causal insight into the cellular and synaptic basis of behavior and brain diseases.
Cellular Mechanisms of Brain Fu Prof. Carl Petersen
1.1 Introduction
LEARN
FASTER,
LEARN
BETTER!
BOOCs EPFL
6 Cellular Mechanisms of Brain Function
Carl Petersen
1.2 THE CELL MEMBRANE
THE PHOSPHOLIPID BILAYERLike every other organ of the body, the brain is made of many different types of cells, which perform diverse functions. Cells are thus a fundamental unit of brain organization, and, in order to understand brain function, we first need to study the function of individual brain cells.
A key defining feature of a cell is its membrane which separates its inside from the outside. Presumably, the membrane’s primary advantage is to offer a stable intracellular environment in which biochemical reactions can take place without being affected by changes in the extracellular milieu. However, the brain has especially evolved to take exquisite advantage of the electrical properties of the cell membrane, working on transmembrane currents and changing the electrical field across the membrane.
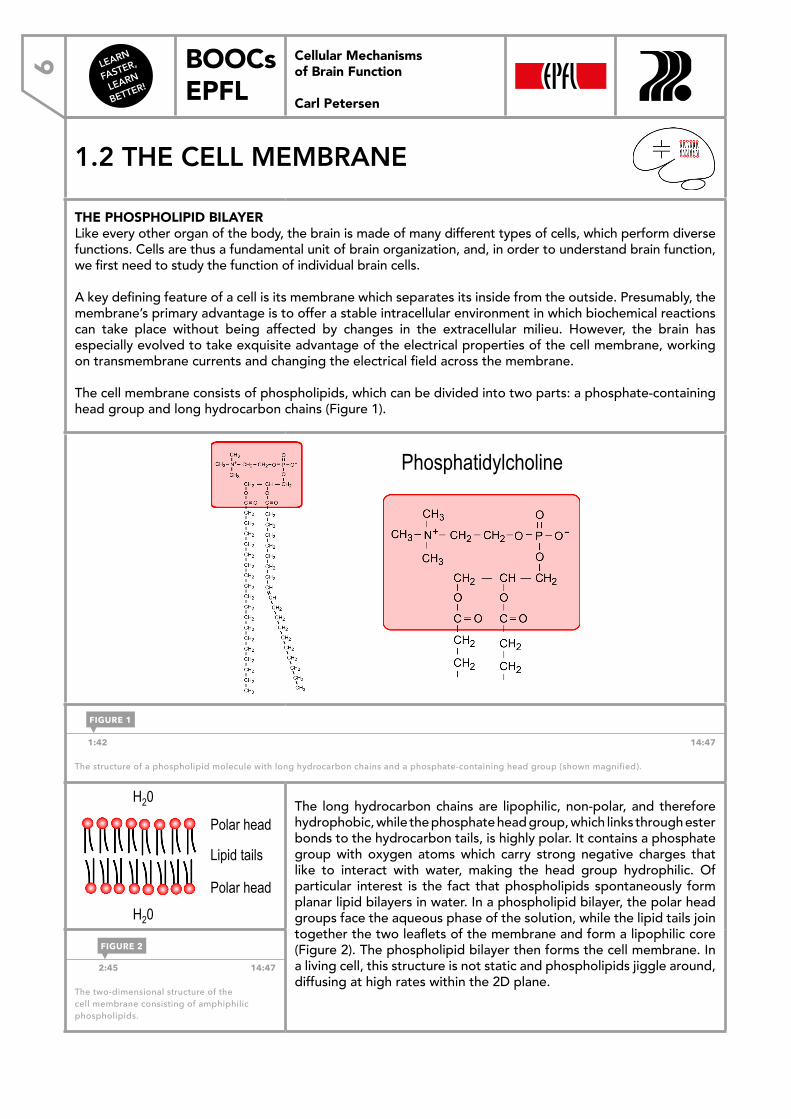
The cell membrane consists of phospholipids, which can be divided into two parts: a phosphate-containing head group and long hydrocarbon chains (Figure 1).
Cellular Mechanisms of Brain Function
Phospholipids
Phosphate head group - Polar, Hydrophilic Hydrocarbon tails - Non-polar, Lipophilic
Phosphatidylcholine
1:42 14:47
The structure of a phospholipid molecule with long hydrocarbon chains and a phosphate-containing head group (shown magnified).
Cellular Mechanisms of Brain Function
Phospholipid bilayers
Lipid tails
Polar head
H20
H20
Polar head
The long hydrocarbon chains are lipophilic, non-polar, and therefore hydrophobic, while the phosphate head group, which links through ester bonds to the hydrocarbon tails, is highly polar. It contains a phosphate group with oxygen atoms which carry strong negative charges that like to interact with water, making the head group hydrophilic. Of particular interest is the fact that phospholipids spontaneously form planar lipid bilayers in water. In a phospholipid bilayer, the polar head groups face the aqueous phase of the solution, while the lipid tails join together the two leaflets of the membrane and form a lipophilic core (Figure 2). The phospholipid bilayer then forms the cell membrane. In a living cell, this structure is not static and phospholipids jiggle around, diffusing at high rates within the 2D plane.
2:45 14:47
The two-dimensional structure of the cell membrane consisting of amphiphilic phospholipids.
FIGURE 1
FIGURE 2
1.2 The cell membrane
Cellular Mechanisms of Brain Function Prof. Carl Petersen
LEARN
FASTER,
LEARN
BETTER!
BOOCs EPFL
7Cellular Mechanisms of Brain Function
Carl Petersen
FIGURE 3
Cellular Mechanisms of Brain Function
Membrane capacitance
inside
outside
H20 K+
H20 Cl- Na+
Cl-
< 5 nm V = Q / C
+ + + +
- - - -
Lipid membrane
V, voltage; Q, charge; C, capacitance
MEMBRANE ELECTRICAL PROPERTIESThe most important feature of the phospholipid bilayer is that it is only permeable to lipophilic substances (gases, lipids, and small non-polar molecules), with a limited permeability to water and, most importantly, impermeable to ions (charged atoms) and other charged molecules. These charged ions are of high importance for the brain because they form the basis of electrical signaling in the nervous system.
The fact that the cell membrane is impermeable to ions means that there can be different concentrations of ions on the two sides of the cell membrane. In a typical cell, there is a high concentration of positively-charged potassium ions (K+) on the inside of a cell, whereas on the outside, the extracellular solution contains high concentrations of positively-charged sodium ions (Na+) and high concentrations of negatively-charged chloride ions (Cl–).
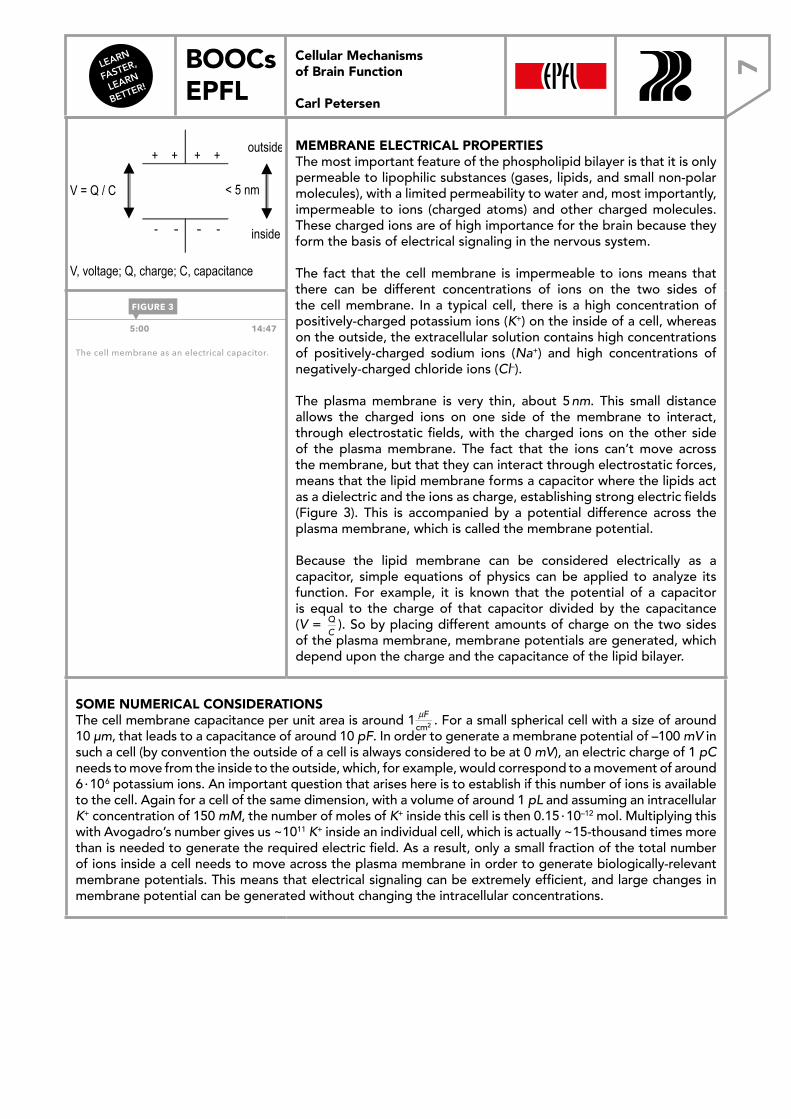
The plasma membrane is very thin, about 5 nm. This small distance allows the charged ions on one side of the membrane to interact, through electrostatic fields, with the charged ions on the other side of the plasma membrane. The fact that the ions can’t move across the membrane, but that they can interact through electrostatic forces, means that the lipid membrane forms a capacitor where the lipids act as a dielectric and the ions as charge, establishing strong electric fields (Figure 3). This is accompanied by a potential difference across the plasma membrane, which is called the membrane potential.
Because the lipid membrane can be considered electrically as a capacitor, simple equations of physics can be applied to analyze its function. For example, it is known that the potential of a capacitor is equal to the charge of that capacitor divided by the capacitance (V = Q
C). So by placing different amounts of charge on the two sides
of the plasma membrane, membrane potentials are generated, which depend upon the charge and the capacitance of the lipid bilayer.
5:00 14:47
The cell membrane as an electrical capacitor.
SOME NUMERICAL CONSIDERATIONSThe cell membrane capacitance per unit area is around 1 µF
cm2 . For a small spherical cell with a size of around 10 μm, that leads to a capacitance of around 10 pF. In order to generate a membrane potential of –100 mV in such a cell (by convention the outside of a cell is always considered to be at 0 mV), an electric charge of 1 pC needs to move from the inside to the outside, which, for example, would correspond to a movement of around 6 · 106 potassium ions. An important question that arises here is to establish if this number of ions is available to the cell. Again for a cell of the same dimension, with a volume of around 1 pL and assuming an intracellular K+ concentration of 150 mM, the number of moles of K+ inside this cell is then 0.15 · 10–12 mol. Multiplying this with Avogadro’s number gives us ~1011 K+ inside an individual cell, which is actually ~15-thousand times more than is needed to generate the required electric field. As a result, only a small fraction of the total number of ions inside a cell needs to move across the plasma membrane in order to generate biologically-relevant membrane potentials. This means that electrical signaling can be extremely efficient, and large changes in membrane potential can be generated without changing the intracellular concentrations.
LEARN
FASTER,
LEARN
BETTER!
BOOCs EPFL
8
Cellular Mechanisms of Brain Function
Single channel currents
Suzuki, Petersen & Petersen, 1985
Cellular Mechanisms of Brain Function
Single channel currents
Suzuki, Petersen & Petersen, 1985
1.3 ION CHANNELS
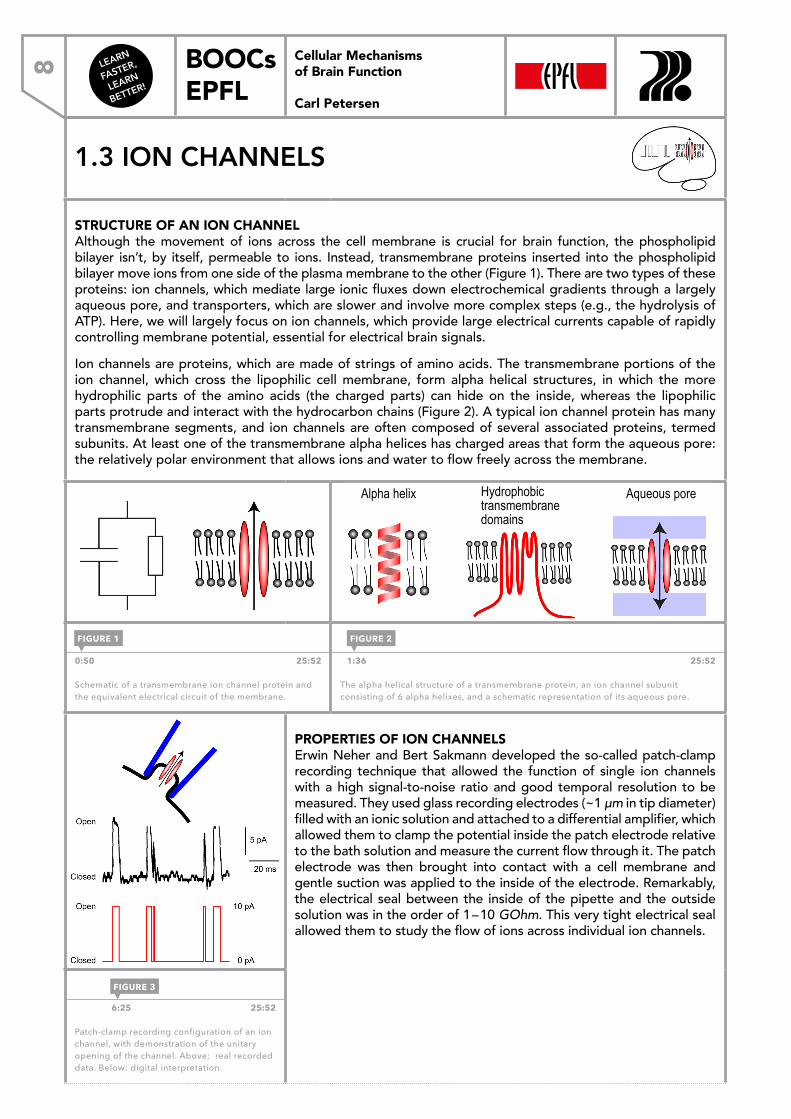
STRUCTURE OF AN ION CHANNEL Although the movement of ions across the cell membrane is crucial for brain function, the phospholipid bilayer isn’t, by itself, permeable to ions. Instead, transmembrane proteins inserted into the phospholipid bilayer move ions from one side of the plasma membrane to the other (Figure 1). There are two types of these proteins: ion channels, which mediate large ionic fluxes down electrochemical gradients through a largely aqueous pore, and transporters, which are slower and involve more complex steps (e.g., the hydrolysis of ATP). Here, we will largely focus on ion channels, which provide large electrical currents capable of rapidly controlling membrane potential, essential for electrical brain signals.Ion channels are proteins, which are made of strings of amino acids. The transmembrane portions of the ion channel, which cross the lipophilic cell membrane, form alpha helical structures, in which the more hydrophilic parts of the amino acids (the charged parts) can hide on the inside, whereas the lipophilic parts protrude and interact with the hydrocarbon chains (Figure 2). A typical ion channel protein has many transmembrane segments, and ion channels are often composed of several associated proteins, termed subunits. At least one of the transmembrane alpha helices has charged areas that form the aqueous pore: the relatively polar environment that allows ions and water to flow freely across the membrane.
Cellular Mechanisms of Brain Function
Ion channels
Cellular Mechanisms of Brain Function
Ion channels are transmembrane proteins
Alpha helix Hydrophobic transmembrane domains
Aqueous pore
0:50 25:52
Schematic of a transmembrane ion channel protein and the equivalent electrical circuit of the membrane.
1:36 25:52
The alpha helical structure of a transmembrane protein, an ion channel subunit consisting of 6 alpha helixes, and a schematic representation of its aqueous pore.
PROPERTIES OF ION CHANNELSErwin Neher and Bert Sakmann developed the so-called patch-clamp recording technique that allowed the function of single ion channels with a high signal-to-noise ratio and good temporal resolution to be measured. They used glass recording electrodes (~1 μm in tip diameter) filled with an ionic solution and attached to a differential amplifier, which allowed them to clamp the potential inside the patch electrode relative to the bath solution and measure the current flow through it. The patch electrode was then brought into contact with a cell membrane and gentle suction was applied to the inside of the electrode. Remarkably, the electrical seal between the inside of the pipette and the outside solution was in the order of 1 – 10 GOhm. This very tight electrical seal allowed them to study the flow of ions across individual ion channels.
6:25 25:52
Patch-clamp recording configuration of an ion channel, with demonstration of the unitary opening of the channel. Above: real recorded data. Below: digital interpretation.
FIGURE 1 FIGURE 2
FIGURE 3
Cellular Mechanisms of Brain Function
Carl Petersen
1.3 Ion channels
Cellular Mechanisms of Brain Function Prof. Carl Petersen
LEARN
FASTER,
LEARN
BETTER!
BOOCs EPFL
9
Cellular Mechanisms of Brain Function
Open probability
The probability of being in the open state is one of the key features of ion channel function that is highly regulated.
Low open probability
High open probability
= Open probability Time open + closed
Time open
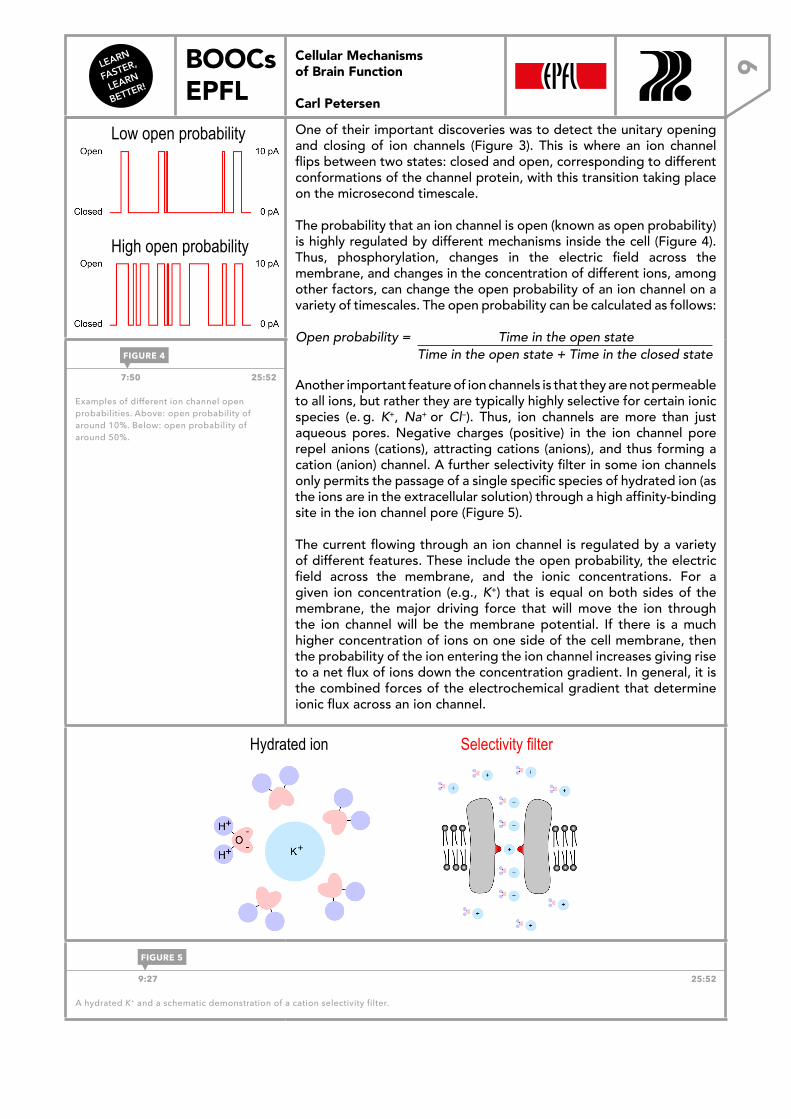
One of their important discoveries was to detect the unitary opening and closing of ion channels (Figure 3). This is where an ion channel flips between two states: closed and open, corresponding to different conformations of the channel protein, with this transition taking place on the microsecond timescale.
The probability that an ion channel is open (known as open probability) is highly regulated by different mechanisms inside the cell (Figure 4). Thus, phosphorylation, changes in the electric field across the membrane, and changes in the concentration of different ions, among other factors, can change the open probability of an ion channel on a variety of timescales. The open probability can be calculated as follows:
Open probability = Time in the open state Time in the open state + Time in the closed state
Another important feature of ion channels is that they are not permeable to all ions, but rather they are typically highly selective for certain ionic species (e. g. K+, Na+ or Cl–). Thus, ion channels are more than just aqueous pores. Negative charges (positive) in the ion channel pore repel anions (cations), attracting cations (anions), and thus forming a cation (anion) channel. A further selectivity filter in some ion channels only permits the passage of a single specific species of hydrated ion (as the ions are in the extracellular solution) through a high affinity-binding site in the ion channel pore (Figure 5).
The current flowing through an ion channel is regulated by a variety of different features. These include the open probability, the electric field across the membrane, and the ionic concentrations. For a given ion concentration (e.g., K+) that is equal on both sides of the membrane, the major driving force that will move the ion through the ion channel will be the membrane potential. If there is a much higher concentration of ions on one side of the cell membrane, then the probability of the ion entering the ion channel increases giving rise to a net flux of ions down the concentration gradient. In general, it is the combined forces of the electrochemical gradient that determine ionic flux across an ion channel.
7:50 25:52
Examples of different ion channel open probabilities. Above: open probability of around 10%. Below: open probability of around 50%.
Cellular Mechanisms of Brain Function
Ion selectivity
Hydrated ion Selectivity filter
9:27 25:52
A hydrated K+ and a schematic demonstration of a cation selectivity filter.
FIGURE 4
FIGURE 5
Cellular Mechanisms of Brain Function
Carl Petersen
LEARN
FASTER,
LEARN
BETTER!
BOOCs EPFL10
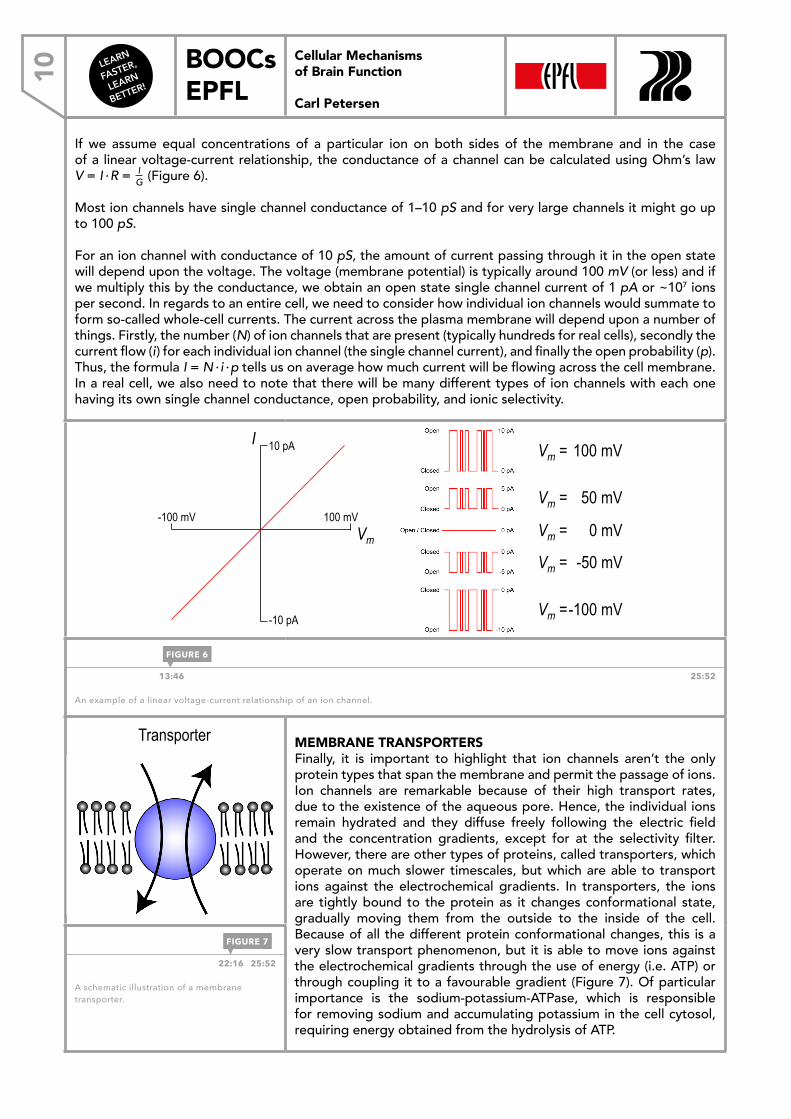
If we assume equal concentrations of a particular ion on both sides of the membrane and in the case of a linear voltage-current relationship, the conductance of a channel can be calculated using Ohm’s law V = I · R = I
G (Figure 6).
Most ion channels have single channel conductance of 1–10 pS and for very large channels it might go up to 100 pS.
For an ion channel with conductance of 10 pS, the amount of current passing through it in the open state will depend upon the voltage. The voltage (membrane potential) is typically around 100 mV (or less) and if we multiply this by the conductance, we obtain an open state single channel current of 1 pA or ~107 ions per second. In regards to an entire cell, we need to consider how individual ion channels would summate to form so-called whole-cell currents. The current across the plasma membrane will depend upon a number of things. Firstly, the number (N) of ion channels that are present (typically hundreds for real cells), secondly the current flow (i) for each individual ion channel (the single channel current), and finally the open probability (p). Thus, the formula I = N · i · p tells us on average how much current will be flowing across the cell membrane. In a real cell, we also need to note that there will be many different types of ion channels with each one having its own single channel conductance, open probability, and ionic selectivity.
Cellular Mechanisms of Brain Function
Single channel conductance
100 mV
50 mV
-100 mV
-50 mV
0 mV
Vm =
Vm =
Vm =
Vm =
Vm =
I
Vm
-100 mV
-10 pA
100 mV
10 pA
13:46 25:52
An example of a linear voltage-current relationship of an ion channel.
Cellular Mechanisms of Brain Function
Ion channels and transporters
Ion channel Transporter MEMBRANE TRANSPORTERSFinally, it is important to highlight that ion channels aren’t the only protein types that span the membrane and permit the passage of ions. Ion channels are remarkable because of their high transport rates, due to the existence of the aqueous pore. Hence, the individual ions remain hydrated and they diffuse freely following the electric field and the concentration gradients, except for at the selectivity filter. However, there are other types of proteins, called transporters, which operate on much slower timescales, but which are able to transport ions against the electrochemical gradients. In transporters, the ions are tightly bound to the protein as it changes conformational state, gradually moving them from the outside to the inside of the cell. Because of all the different protein conformational changes, this is a very slow transport phenomenon, but it is able to move ions against the electrochemical gradients through the use of energy (i.e. ATP) or through coupling it to a favourable gradient (Figure 7). Of particular importance is the sodium-potassium-ATPase, which is responsible for removing sodium and accumulating potassium in the cell cytosol, requiring energy obtained from the hydrolysis of ATP.
22:16 25:52
A schematic illustration of a membrane transporter.
FIGURE 7
FIGURE 6
Cellular Mechanisms of Brain Function
Carl Petersen
LEARN
FASTER,
LEARN
BETTER!
BOOCs EPFL 11
1.4 MEMBRANE POTENTIAL
Cellular Mechanisms of Brain Function
Nernst equilibrium potential
150 mM K+
5 mM K+
EK+ =
RT
zF ln
[K+]o
[K+]i
EK+ = 61.5 log10
5
150
EK+ = ~ -90 mV Inside -90 mV
Outside 0 mV
F = - q dV dx
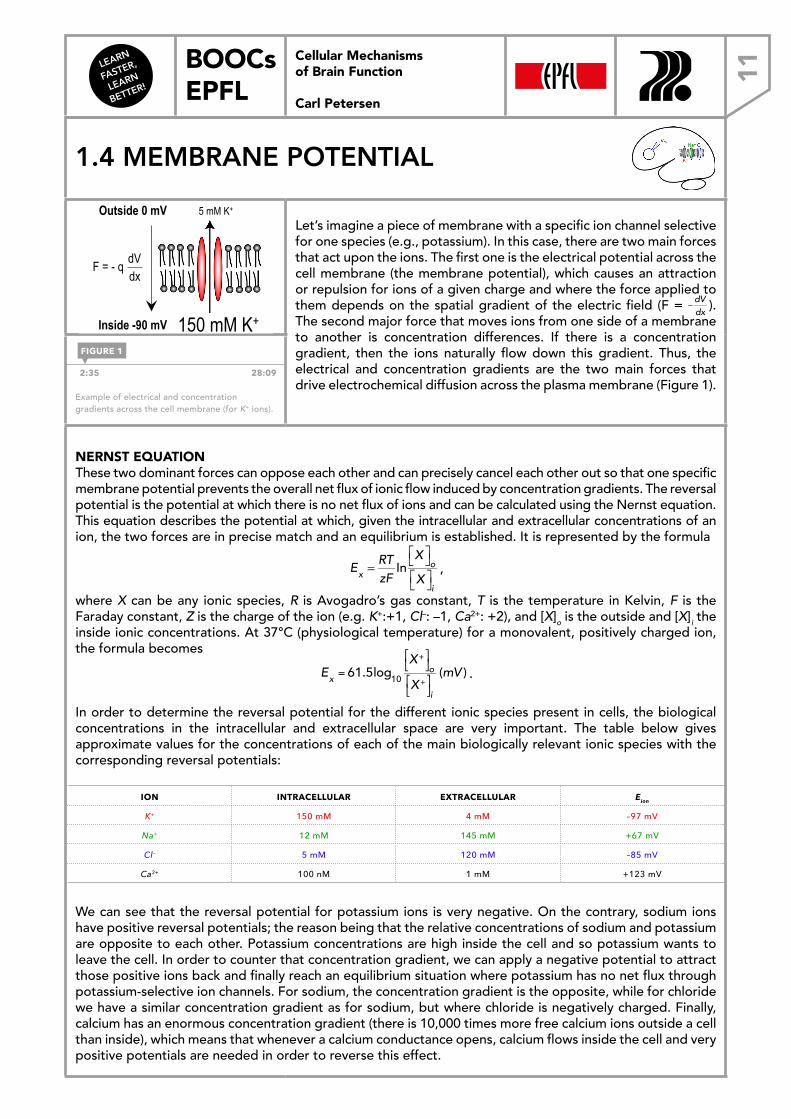
Let’s imagine a piece of membrane with a specific ion channel selective for one species (e.g., potassium). In this case, there are two main forces that act upon the ions. The first one is the electrical potential across the cell membrane (the membrane potential), which causes an attraction or repulsion for ions of a given charge and where the force applied to them depends on the spatial gradient of the electric field (F = F = −dV
dx).
The second major force that moves ions from one side of a membrane to another is concentration differences. If there is a concentration gradient, then the ions naturally flow down this gradient. Thus, the electrical and concentration gradients are the two main forces that drive electrochemical diffusion across the plasma membrane (Figure 1).
2:35 28:09
Example of electrical and concentration gradients across the cell membrane (for K+ ions).
NERNST EQUATION These two dominant forces can oppose each other and can precisely cancel each other out so that one specific membrane potential prevents the overall net flux of ionic flow induced by concentration gradients. The reversal potential is the potential at which there is no net flux of ions and can be calculated using the Nernst equation. This equation describes the potential at which, given the intracellular and extracellular concentrations of an ion, the two forces are in precise match and an equilibrium is established. It is represented by the formula
Ex = RTzF
InX⎡⎣ ⎤⎦oX⎡⎣ ⎤⎦i
,
where X can be any ionic species, R is Avogadro’s gas constant, T is the temperature in Kelvin, F is the Faraday constant, Z is the charge of the ion (e.g. K+:+1, Cl–: –1, Ca2+: +2), and [X]o is the outside and [X]i the inside ionic concentrations. At 37°C (physiological temperature) for a monovalent, positively charged ion, the formula becomes
Ex =61.5log10X+⎡⎣
⎤⎦o
X+⎡⎣
⎤⎦i
(mV ) .
In order to determine the reversal potential for the different ionic species present in cells, the biological concentrations in the intracellular and extracellular space are very important. The table below gives approximate values for the concentrations of each of the main biologically relevant ionic species with the corresponding reversal potentials:
ION INTRACELLULAR EXTRACELLULAR Eion
K+ 150 mM 4 mM –97 mV
Na+ 12 mM 145 mM +67 mV
Cl– 5 mM 120 mM –85 mV
Ca2+ 100 nM 1 mM +123 mV
We can see that the reversal potential for potassium ions is very negative. On the contrary, sodium ions have positive reversal potentials; the reason being that the relative concentrations of sodium and potassium are opposite to each other. Potassium concentrations are high inside the cell and so potassium wants to leave the cell. In order to counter that concentration gradient, we can apply a negative potential to attract those positive ions back and finally reach an equilibrium situation where potassium has no net flux through potassium-selective ion channels. For sodium, the concentration gradient is the opposite, while for chloride we have a similar concentration gradient as for sodium, but where chloride is negatively charged. Finally, calcium has an enormous concentration gradient (there is 10,000 times more free calcium ions outside a cell than inside), which means that whenever a calcium conductance opens, calcium flows inside the cell and very positive potentials are needed in order to reverse this effect.
FIGURE 1
Cellular Mechanisms of Brain Function
Carl Petersen
1.4 Membrane potenti
Cellular Mechanisms of Brain Function Prof. Carl Petersen
LEARN
FASTER,
LEARN
BETTER!
BOOCs EPFL12
Cellular Mechanisms of Brain Function
Electrical equivalent of a cell
Cellular Mechanisms of Brain Function
Electrical equivalent of a cell
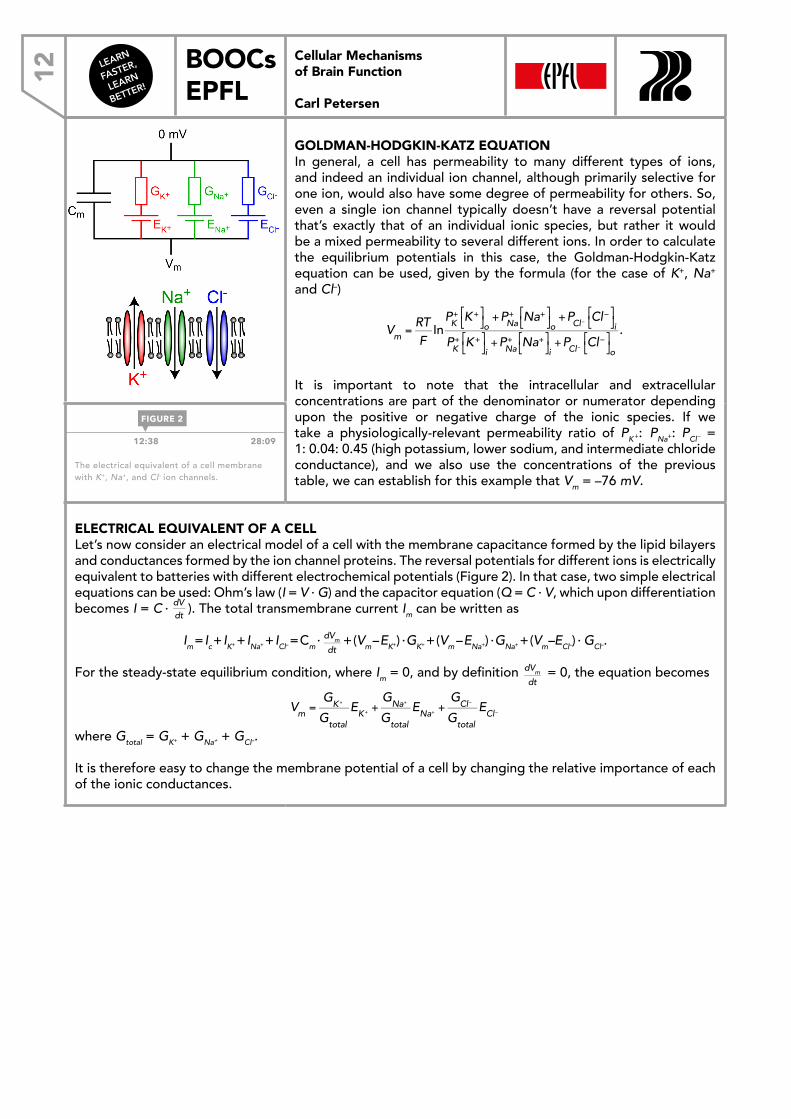
GOLDMAN-HODGKIN-KATZ EQUATION In general, a cell has permeability to many different types of ions, and indeed an individual ion channel, although primarily selective for one ion, would also have some degree of permeability for others. So, even a single ion channel typically doesn’t have a reversal potential that’s exactly that of an individual ionic species, but rather it would be a mixed permeability to several different ions. In order to calculate the equilibrium potentials in this case, the Goldman-Hodgkin-Katz equation can be used, given by the formula (for the case of K+, Na+ and Cl–)
Vm =RTF
InPK+ K+⎡⎣
⎤⎦o+PNa
+ Na+⎡⎣
⎤⎦o+PCl – Cl−⎡
⎣⎤⎦i
PK+ K+⎡⎣
⎤⎦i+PNa
+ Na+⎡⎣
⎤⎦i+PCl – Cl−⎡
⎣⎤⎦o
.
It is important to note that the intracellular and extracellular concentrations are part of the denominator or numerator depending upon the positive or negative charge of the ionic species. If we take a physiologically-relevant permeability ratio of PK+: PNa+: PCl– = 1: 0.04: 0.45 (high potassium, lower sodium, and intermediate chloride conductance), and we also use the concentrations of the previous table, we can establish for this example that Vm = –76 mV.
12:38 28:09
The electrical equivalent of a cell membrane with K+, Na+, and Cl– ion channels.
ELECTRICAL EQUIVALENT OF A CELLLet’s now consider an electrical model of a cell with the membrane capacitance formed by the lipid bilayers and conductances formed by the ion channel proteins. The reversal potentials for different ions is electrically equivalent to batteries with different electrochemical potentials (Figure 2). In that case, two simple electrical equations can be used: Ohm’s law (I = V · G) and the capacitor equation (Q = C · V, which upon differentiation becomes I = C · dV
dt). The total transmembrane current Im can be written as
Im = Ic + IK+ + INa+ + ICl– = Cm · dVm
dt+ (Vm – EK+) · GK+ + (Vm – ENa+) · GNa+ + (Vm–ECl–) · GCl–.
For the steady-state equilibrium condition, where Im = 0, and by definition dVm
dt = 0, the equation becomes
Vm =GK +
Gtotal
EK + +GNa+
Gtotal
ENa+ +GCl−
Gtotal
ECl−
where Gtotal = GK+ + GNa+ + GCl–.
It is therefore easy to change the membrane potential of a cell by changing the relative importance of each of the ionic conductances.
FIGURE 2
Cellular Mechanisms of Brain Function
Carl Petersen
LEARN
FASTER,
LEARN
BETTER!
BOOCs EPFL 13
MEMBRANE POTENTIAL DYNAMICSLet’s now think about the dynamics of membrane potential changes, considering the case where K+ channels are the only ones present and whose open probability suddenly increases (assuming a membrane potential of 0 mV initially). Due to the K+ concentration differences, K+ ions want to follow the concentration gradient and create a negative potential inside. The membrane potential will go towards the reversal potential for potassium, which is around –90 mV. However, the time course is characterized by specific dynamics. Again using the electrical equivalent model of the cell (taking into account Ohm’s law and the capacitor equation), one can derive the first order differential equation
Vm = EK+ – Rm · Cm · dVm
dtwith a solution
Vm = EK+ (1 – etτtτ
tτtτ ),
where τ is a membrane time constant, which is equal to R · C. What we can see from this equation is that at time zero, the membrane potential is indeed 0. At infinite time, the reversal potential for K+ is reached, and in between we have an exponential time course that is characterized by a time constant τ. So, the rate of change of the membrane potential in a cell is determined by a number of different factors. If the cell has a high resistance (low), i.e., a low conductance (high), then the time course is long (short), i.e., it takes a long (short) time to change. If the capacitance is high (low), then the same holds. This equation also shows that membrane potential doesn’t change instantaneously; rather it changes with a timescale that is equal to R · C.
Generally, by opening different ionic channels, the membrane potential can be driven towards different values (negative or positive) always following the timescale of the membrane time constant. If the membrane potential becomes more negative, the phenomenon is called hyperpolarization, and if it becomes more positive it is called depolarization. Thus, if a neuron is to be hyperpolarised, a Cl– or a K+ conductance can be opened, and if it is to be depolarised, a Na+ conductance can be opened.
Cellular Mechanisms of Brain Function
Carl Petersen
LEARN
FASTER,
LEARN
BETTER!
BOOCs EPFL14
Cellular Mechanisms of Brain Function
Leaky cables with capacitance
Cellular Mechanisms of Brain Function
Leaky cables with capacitance
1.5 CABLE PROPERTIES
Cellular Mechanisms of Brain Function
Cable properties of neurons
Typical cell Neuron
100 µm
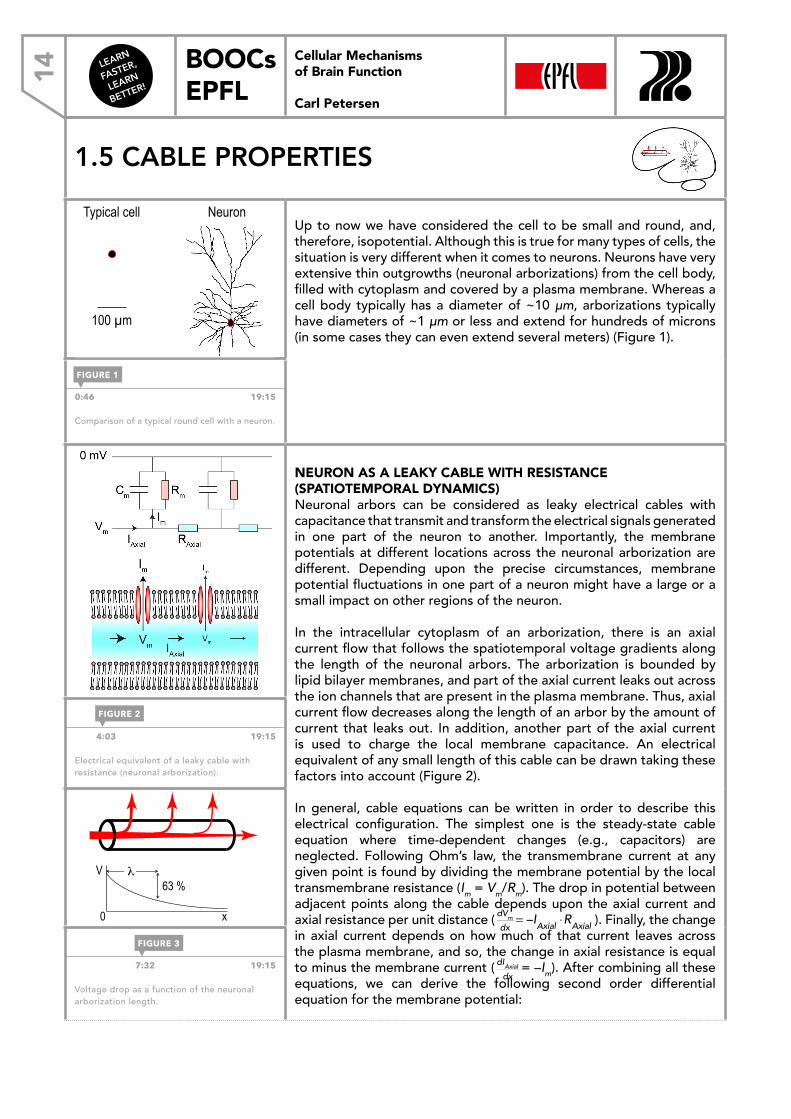
Up to now we have considered the cell to be small and round, and, therefore, isopotential. Although this is true for many types of cells, the situation is very different when it comes to neurons. Neurons have very extensive thin outgrowths (neuronal arborizations) from the cell body, filled with cytoplasm and covered by a plasma membrane. Whereas a cell body typically has a diameter of ~10 μm, arborizations typically have diameters of ~1 μm or less and extend for hundreds of microns (in some cases they can even extend several meters) (Figure 1).
0:46 19:15
Comparison of a typical round cell with a neuron.
NEURON AS A LEAKY CABLE WITH RESISTANCE (SPATIOTEMPORAL DYNAMICS)Neuronal arbors can be considered as leaky electrical cables with capacitance that transmit and transform the electrical signals generated in one part of the neuron to another. Importantly, the membrane potentials at different locations across the neuronal arborization are different. Depending upon the precise circumstances, membrane potential fluctuations in one part of a neuron might have a large or a small impact on other regions of the neuron.
In the intracellular cytoplasm of an arborization, there is an axial current flow that follows the spatiotemporal voltage gradients along the length of the neuronal arbors. The arborization is bounded by lipid bilayer membranes, and part of the axial current leaks out across the ion channels that are present in the plasma membrane. Thus, axial current flow decreases along the length of an arbor by the amount of current that leaks out. In addition, another part of the axial current is used to charge the local membrane capacitance. An electrical equivalent of any small length of this cable can be drawn taking these factors into account (Figure 2).
In general, cable equations can be written in order to describe this electrical configuration. The simplest one is the steady-state cable equation where time-dependent changes (e.g., capacitors) are neglected. Following Ohm’s law, the transmembrane current at any given point is found by dividing the membrane potential by the local transmembrane resistance (Im = Vm/Rm). The drop in potential between adjacent points along the cable depends upon the axial current and axial resistance per unit distance ( dVm
dx= –IAxial ⋅RAxial
dVm
dx= –IAxial ⋅RAxial ). Finally, the change
in axial current depends on how much of that current leaves across the plasma membrane, and so, the change in axial resistance is equal to minus the membrane current ( dIAxial
dx= −Im= –Im). After combining all these
equations, we can derive the following second order differential equation for the membrane potential:
4:03 19:15
Electrical equivalent of a leaky cable with resistance (neuronal arborization).
Cellular Mechanisms of Brain Function
Spatial distribution of Vm at steady state
d2V
dx2 = V RAxial Rm
V = V0 e -(x / λ)
λ = √ (Rm / RAxial) V
x
λ 63 %
0
7:32 19:15
Voltage drop as a function of the neuronal arborization length.
FIGURE 1
FIGURE 2
FIGURE 3
Cellular Mechanisms of Brain Function
Carl Petersen
1.5 Cable properties
Cellular Mechanisms of Brain Function Prof. Carl Petersen
LEARN
FASTER,
LEARN
BETTER!
BOOCs EPFL 15
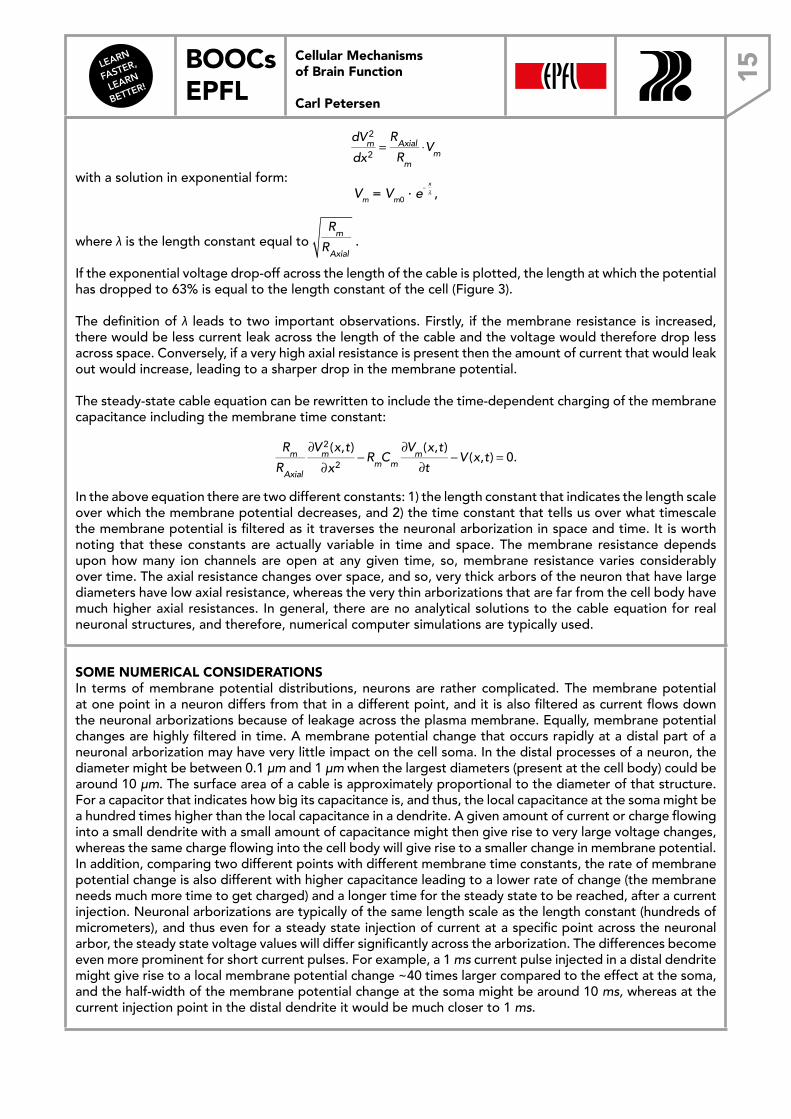
dVm2
dx2 =RAxial
Rm
⋅Vm
with a solution in exponential form: Vm = Vm0 · e
–xλ ,
where λ is the length constant equal to Rm
RAxial.
If the exponential voltage drop-off across the length of the cable is plotted, the length at which the potential has dropped to 63% is equal to the length constant of the cell (Figure 3).
The definition of λ leads to two important observations. Firstly, if the membrane resistance is increased, there would be less current leak across the length of the cable and the voltage would therefore drop less across space. Conversely, if a very high axial resistance is present then the amount of current that would leak out would increase, leading to a sharper drop in the membrane potential.
The steady-state cable equation can be rewritten to include the time-dependent charging of the membrane capacitance including the membrane time constant:
Rm
RAxial
∂Vm2 (x,t)∂x2 −RmCm
∂Vm (x,t)∂t
−V (x,t) = 0.
In the above equation there are two different constants: 1) the length constant that indicates the length scale over which the membrane potential decreases, and 2) the time constant that tells us over what timescale the membrane potential is filtered as it traverses the neuronal arborization in space and time. It is worth noting that these constants are actually variable in time and space. The membrane resistance depends upon how many ion channels are open at any given time, so, membrane resistance varies considerably over time. The axial resistance changes over space, and so, very thick arbors of the neuron that have large diameters have low axial resistance, whereas the very thin arborizations that are far from the cell body have much higher axial resistances. In general, there are no analytical solutions to the cable equation for real neuronal structures, and therefore, numerical computer simulations are typically used.
SOME NUMERICAL CONSIDERATIONS In terms of membrane potential distributions, neurons are rather complicated. The membrane potential at one point in a neuron differs from that in a different point, and it is also filtered as current flows down the neuronal arborizations because of leakage across the plasma membrane. Equally, membrane potential changes are highly filtered in time. A membrane potential change that occurs rapidly at a distal part of a neuronal arborization may have very little impact on the cell soma. In the distal processes of a neuron, the diameter might be between 0.1 μm and 1 μm when the largest diameters (present at the cell body) could be around 10 μm. The surface area of a cable is approximately proportional to the diameter of that structure. For a capacitor that indicates how big its capacitance is, and thus, the local capacitance at the soma might be a hundred times higher than the local capacitance in a dendrite. A given amount of current or charge flowing into a small dendrite with a small amount of capacitance might then give rise to very large voltage changes, whereas the same charge flowing into the cell body will give rise to a smaller change in membrane potential. In addition, comparing two different points with different membrane time constants, the rate of membrane potential change is also different with higher capacitance leading to a lower rate of change (the membrane needs much more time to get charged) and a longer time for the steady state to be reached, after a current injection. Neuronal arborizations are typically of the same length scale as the length constant (hundreds of micrometers), and thus even for a steady state injection of current at a specific point across the neuronal arbor, the steady state voltage values will differ significantly across the arborization. The differences become even more prominent for short current pulses. For example, a 1 ms current pulse injected in a distal dendrite might give rise to a local membrane potential change ~40 times larger compared to the effect at the soma, and the half-width of the membrane potential change at the soma might be around 10 ms, whereas at the current injection point in the distal dendrite it would be much closer to 1 ms.
Cellular Mechanisms of Brain Function
Carl Petersen
LEARN
FASTER,
LEARN
BETTER!
BOOCs EPFL16
Cellular Mechanisms of Brain Function
Carl Petersen
2.1 VOLTAGE-GATED CHANNELS
Cellular Mechanisms of Brain Function
Voltage-gated ion channels
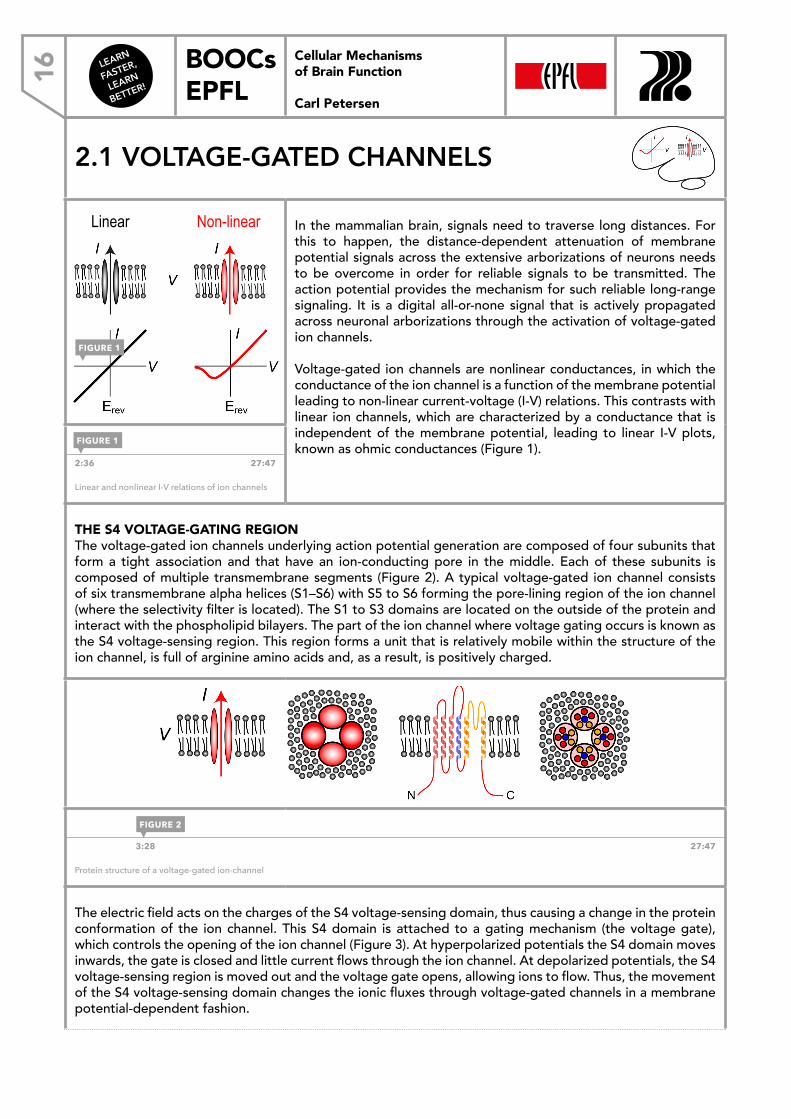
Linear Non-linear In the mammalian brain, signals need to traverse long distances. For this to happen, the distance-dependent attenuation of membrane potential signals across the extensive arborizations of neurons needs to be overcome in order for reliable signals to be transmitted. The action potential provides the mechanism for such reliable long-range signaling. It is a digital all-or-none signal that is actively propagated across neuronal arborizations through the activation of voltage-gated ion channels.
Voltage-gated ion channels are nonlinear conductances, in which the conductance of the ion channel is a function of the membrane potential leading to non-linear current-voltage (I-V) relations. This contrasts with linear ion channels, which are characterized by a conductance that is independent of the membrane potential, leading to linear I-V plots, known as ohmic conductances (Figure 1).
2:36 27:47
Linear and nonlinear I-V relations of ion channels
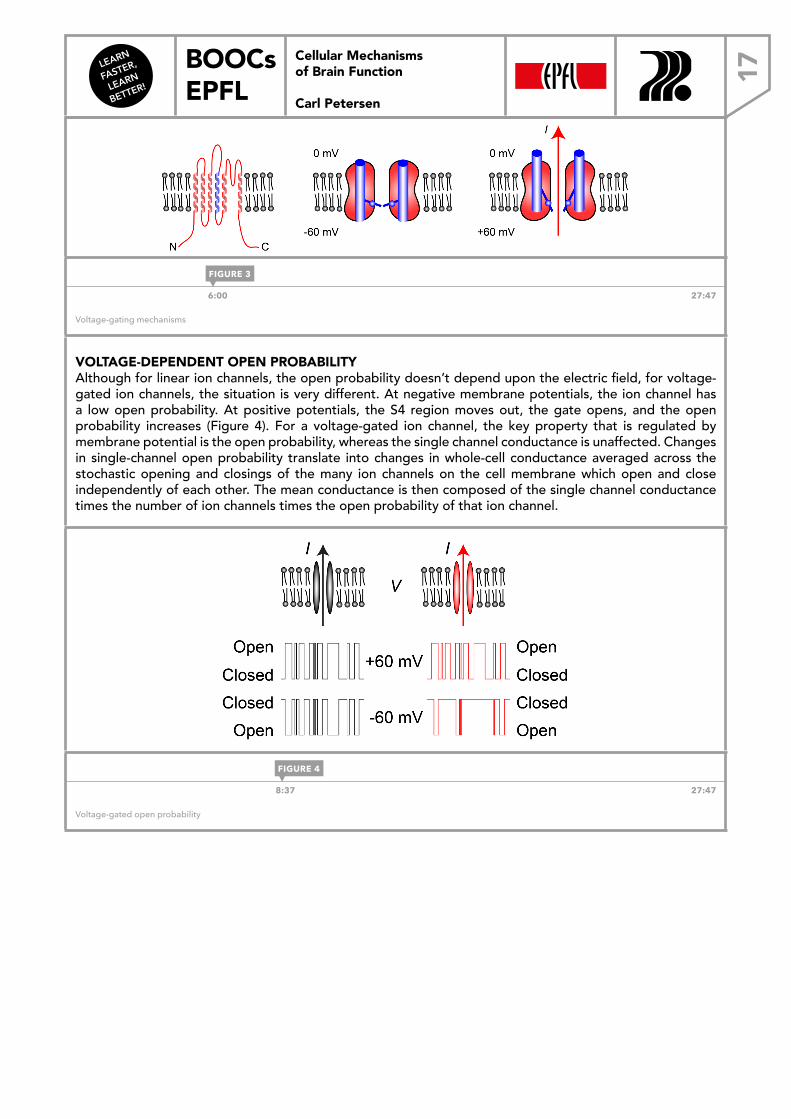
THE S4 VOLTAGE-GATING REGION The voltage-gated ion channels underlying action potential generation are composed of four subunits that form a tight association and that have an ion-conducting pore in the middle. Each of these subunits is composed of multiple transmembrane segments (Figure 2). A typical voltage-gated ion channel consists of six transmembrane alpha helices (S1–S6) with S5 to S6 forming the pore-lining region of the ion channel (where the selectivity filter is located). The S1 to S3 domains are located on the outside of the protein and interact with the phospholipid bilayers. The part of the ion channel where voltage gating occurs is known as the S4 voltage-sensing region. This region forms a unit that is relatively mobile within the structure of the ion channel, is full of arginine amino acids and, as a result, is positively charged.
Cellular Mechanisms of Brain Function
Protein structure of voltage-gated ion channels
3:28 27:47
Protein structure of a voltage-gated ion-channel
The electric field acts on the charges of the S4 voltage-sensing domain, thus causing a change in the protein conformation of the ion channel. This S4 domain is attached to a gating mechanism (the voltage gate), which controls the opening of the ion channel (Figure 3). At hyperpolarized potentials the S4 domain moves inwards, the gate is closed and little current flows through the ion channel. At depolarized potentials, the S4 voltage-sensing region is moved out and the voltage gate opens, allowing ions to flow. Thus, the movement of the S4 voltage-sensing domain changes the ionic fluxes through voltage-gated channels in a membrane potential-dependent fashion.
FIGURE 1
FIGURE 1
FIGURE 2
Cellular Mechanisms of Brain Function Prof. Carl Petersen
2.1 Voltage-gated cha
LEARN
FASTER,
LEARN
BETTER!
BOOCs EPFL 17
Cellular Mechanisms of Brain Function
Carl Petersen
Cellular Mechanisms of Brain Function
Voltage-gating mechanisms
6:00 27:47
Voltage-gating mechanisms
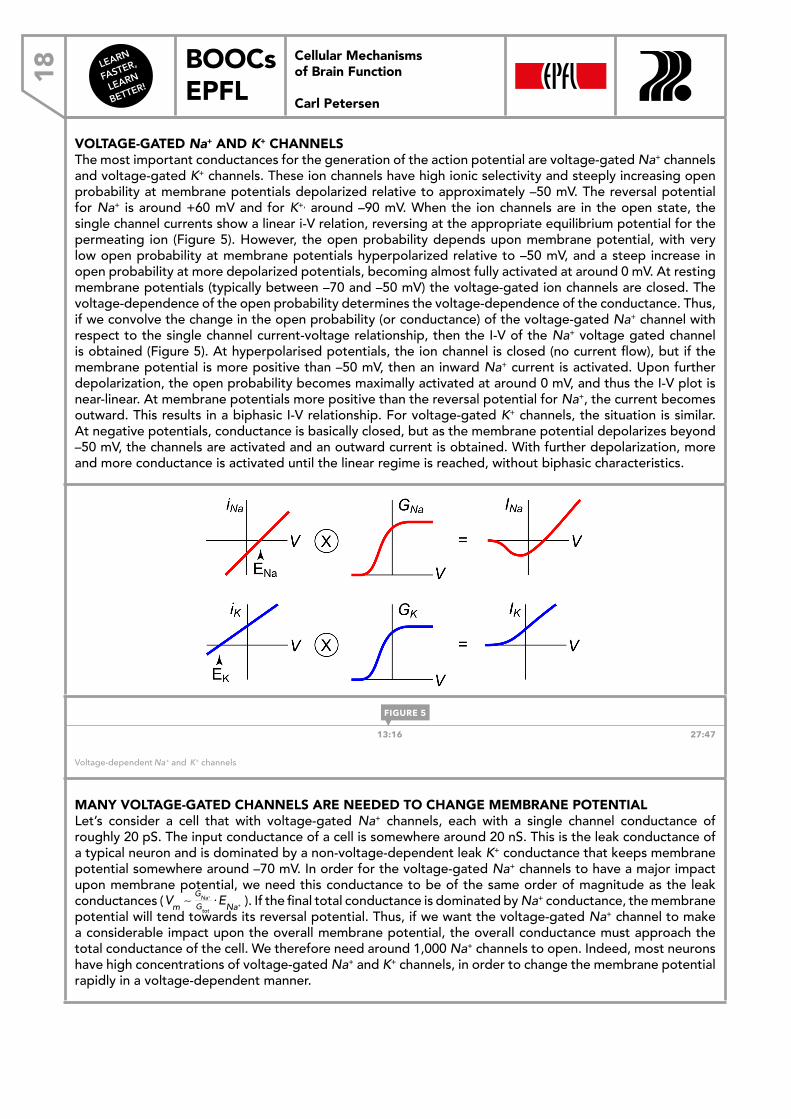
VOLTAGE-DEPENDENT OPEN PROBABILITYAlthough for linear ion channels, the open probability doesn’t depend upon the electric field, for voltage-gated ion channels, the situation is very different. At negative membrane potentials, the ion channel has a low open probability. At positive potentials, the S4 region moves out, the gate opens, and the open probability increases (Figure 4). For a voltage-gated ion channel, the key property that is regulated by membrane potential is the open probability, whereas the single channel conductance is unaffected. Changes in single-channel open probability translate into changes in whole-cell conductance averaged across the stochastic opening and closings of the many ion channels on the cell membrane which open and close independently of each other. The mean conductance is then composed of the single channel conductance times the number of ion channels times the open probability of that ion channel.
Cellular Mechanisms of Brain Function
Voltage-dependent open probability
8:37 27:47
Voltage-gated open probability
FIGURE 3
FIGURE 4
LEARN
FASTER,
LEARN
BETTER!
BOOCs EPFL18
Cellular Mechanisms of Brain Function
Carl Petersen
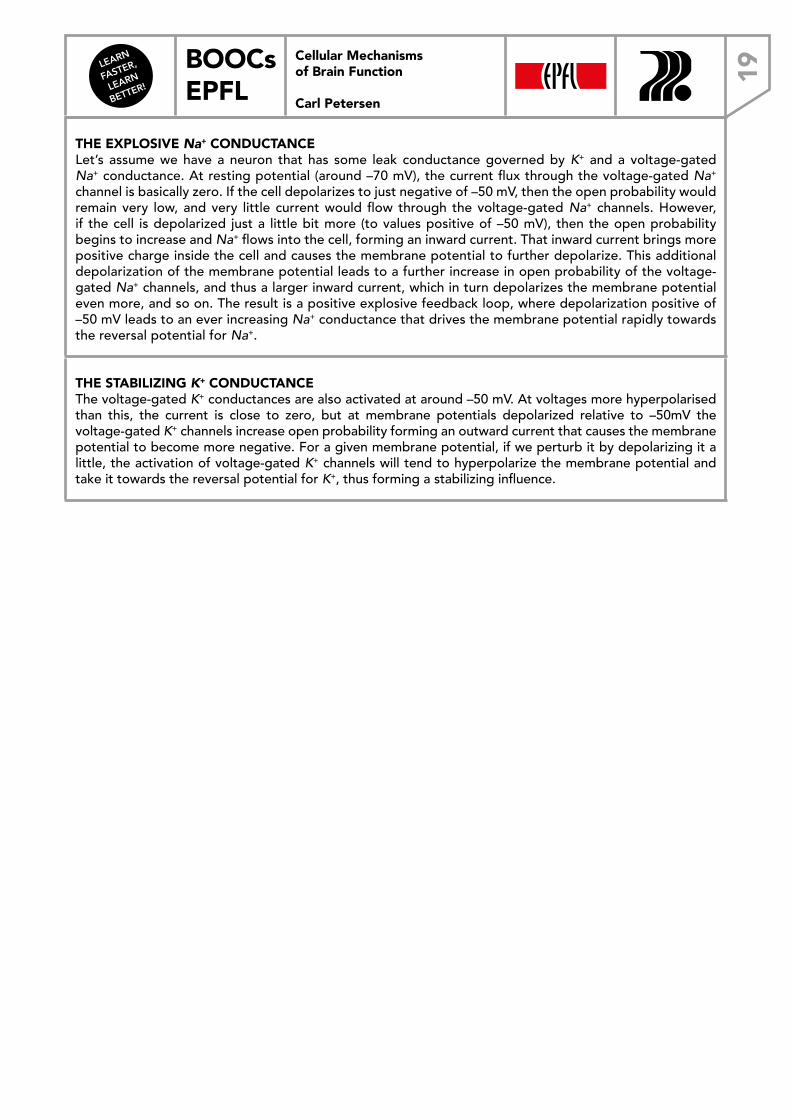
VOLTAGE-GATED Na+ AND K+ CHANNELSThe most important conductances for the generation of the action potential are voltage-gated Na+ channels and voltage-gated K+ channels. These ion channels have high ionic selectivity and steeply increasing open probability at membrane potentials depolarized relative to approximately –50 mV. The reversal potential for Na+ is around +60 mV and for K+, around –90 mV. When the ion channels are in the open state, the single channel currents show a linear i-V relation, reversing at the appropriate equilibrium potential for the permeating ion (Figure 5). However, the open probability depends upon membrane potential, with very low open probability at membrane potentials hyperpolarized relative to –50 mV, and a steep increase in open probability at more depolarized potentials, becoming almost fully activated at around 0 mV. At resting membrane potentials (typically between –70 and –50 mV) the voltage-gated ion channels are closed. The voltage-dependence of the open probability determines the voltage-dependence of the conductance. Thus, if we convolve the change in the open probability (or conductance) of the voltage-gated Na+ channel with respect to the single channel current-voltage relationship, then the I-V of the Na+ voltage gated channel is obtained (Figure 5). At hyperpolarised potentials, the ion channel is closed (no current flow), but if the membrane potential is more positive than –50 mV, then an inward Na+ current is activated. Upon further depolarization, the open probability becomes maximally activated at around 0 mV, and thus the I-V plot is near-linear. At membrane potentials more positive than the reversal potential for Na+, the current becomes outward. This results in a biphasic I-V relationship. For voltage-gated K+ channels, the situation is similar. At negative potentials, conductance is basically closed, but as the membrane potential depolarizes beyond –50 mV, the channels are activated and an outward current is obtained. With further depolarization, more and more conductance is activated until the linear regime is reached, without biphasic characteristics.
Cellular Mechanisms of Brain Function
Voltage-dependent Na+ and K+ channels
13:16 27:47
Voltage-dependent Na+ and K+ channels
MANY VOLTAGE-GATED CHANNELS ARE NEEDED TO CHANGE MEMBRANE POTENTIALLet’s consider a cell that with voltage-gated Na+ channels, each with a single channel conductance of roughly 20 pS. The input conductance of a cell is somewhere around 20 nS. This is the leak conductance of a typical neuron and is dominated by a non-voltage-dependent leak K+ conductance that keeps membrane potential somewhere around –70 mV. In order for the voltage-gated Na+ channels to have a major impact upon membrane potential, we need this conductance to be of the same order of magnitude as the leak conductances (Vm ∼
GNa+
Gtot
⋅ENa+Vm ∼
GNa+
Gtot
⋅ENa+Vm ∼GNa+
Gtot
⋅ENa+ ). If the final total conductance is dominated by Na+ conductance, the membrane potential will tend towards its reversal potential. Thus, if we want the voltage-gated Na+ channel to make a considerable impact upon the overall membrane potential, the overall conductance must approach the total conductance of the cell. We therefore need around 1,000 Na+ channels to open. Indeed, most neurons have high concentrations of voltage-gated Na+ and K+ channels, in order to change the membrane potential rapidly in a voltage-dependent manner.
FIGURE 5
LEARN
FASTER,
LEARN
BETTER!
BOOCs EPFL 19
Cellular Mechanisms of Brain Function
Carl Petersen
THE EXPLOSIVE Na+ CONDUCTANCE Let’s assume we have a neuron that has some leak conductance governed by K+ and a voltage-gated Na+ conductance. At resting potential (around –70 mV), the current flux through the voltage-gated Na+ channel is basically zero. If the cell depolarizes to just negative of –50 mV, then the open probability would remain very low, and very little current would flow through the voltage-gated Na+ channels. However, if the cell is depolarized just a little bit more (to values positive of –50 mV), then the open probability begins to increase and Na+ flows into the cell, forming an inward current. That inward current brings more positive charge inside the cell and causes the membrane potential to further depolarize. This additional depolarization of the membrane potential leads to a further increase in open probability of the voltage-gated Na+ channels, and thus a larger inward current, which in turn depolarizes the membrane potential even more, and so on. The result is a positive explosive feedback loop, where depolarization positive of –50 mV leads to an ever increasing Na+ conductance that drives the membrane potential rapidly towards the reversal potential for Na+.
THE STABILIZING K+ CONDUCTANCEThe voltage-gated K+ conductances are also activated at around –50 mV. At voltages more hyperpolarised than this, the current is close to zero, but at membrane potentials depolarized relative to –50mV the voltage-gated K+ channels increase open probability forming an outward current that causes the membrane potential to become more negative. For a given membrane potential, if we perturb it by depolarizing it a little, the activation of voltage-gated K+ channels will tend to hyperpolarize the membrane potential and take it towards the reversal potential for K+, thus forming a stabilizing influence.
LEARN
FASTER,
LEARN
BETTER!
BOOCs EPFL20
Cellular Mechanisms of Brain Function
Carl Petersen
2.2 VOLTAGE-GATING KINETICS
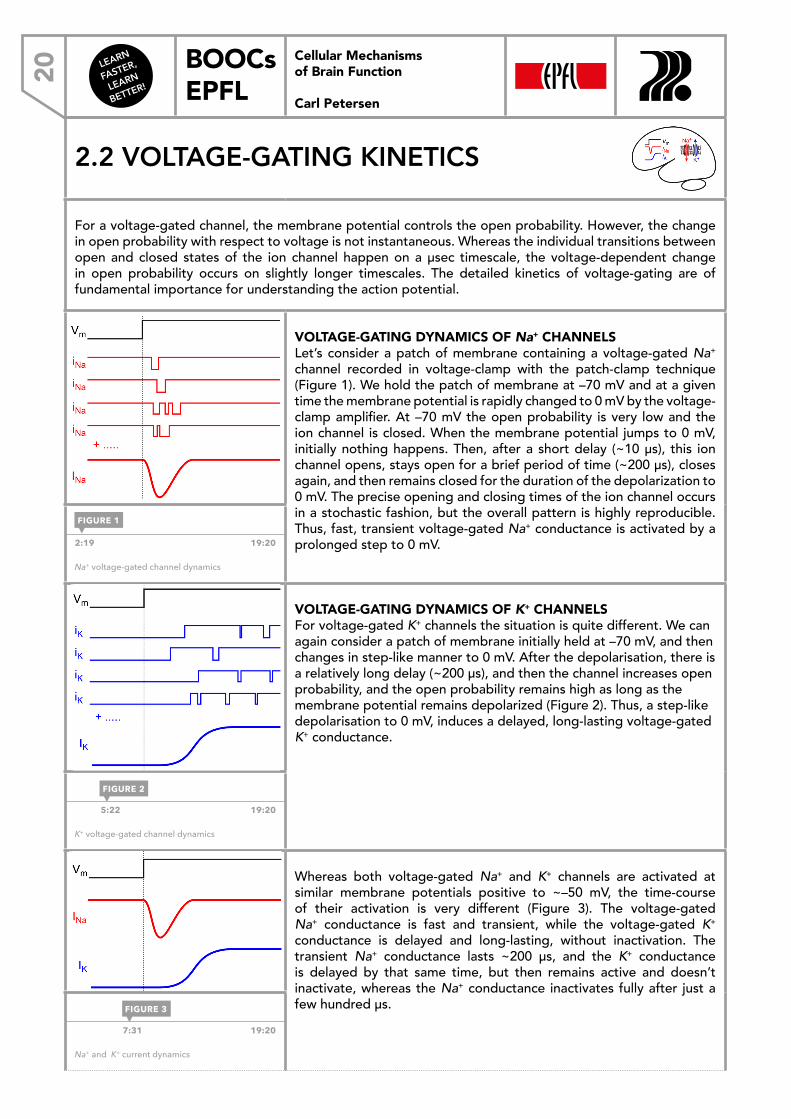
For a voltage-gated channel, the membrane potential controls the open probability. However, the change in open probability with respect to voltage is not instantaneous. Whereas the individual transitions between open and closed states of the ion channel happen on a μsec timescale, the voltage-dependent change in open probability occurs on slightly longer timescales. The detailed kinetics of voltage-gating are of fundamental importance for understanding the action potential.
Cellular Mechanisms of Brain Function
Voltage-gated Na+ channel kinetics
VOLTAGE-GATING DYNAMICS OF Na+ CHANNELSLet’s consider a patch of membrane containing a voltage-gated Na+ channel recorded in voltage-clamp with the patch-clamp technique (Figure 1). We hold the patch of membrane at –70 mV and at a given time the membrane potential is rapidly changed to 0 mV by the voltage-clamp amplifier. At –70 mV the open probability is very low and the ion channel is closed. When the membrane potential jumps to 0 mV, initially nothing happens. Then, after a short delay (~10 μs), this ion channel opens, stays open for a brief period of time (~200 μs), closes again, and then remains closed for the duration of the depolarization to 0 mV. The precise opening and closing times of the ion channel occurs in a stochastic fashion, but the overall pattern is highly reproducible. Thus, fast, transient voltage-gated Na+ conductance is activated by a prolonged step to 0 mV. 2:19 19:20
Na+ voltage-gated channel dynamics
Cellular Mechanisms of Brain Function
Voltage-gated K+ channel kinetics
VOLTAGE-GATING DYNAMICS OF K+ CHANNELSFor voltage-gated K+ channels the situation is quite different. We can again consider a patch of membrane initially held at –70 mV, and then changes in step-like manner to 0 mV. After the depolarisation, there is a relatively long delay (~200 μs), and then the channel increases open probability, and the open probability remains high as long as the membrane potential remains depolarized (Figure 2). Thus, a step-like depolarisation to 0 mV, induces a delayed, long-lasting voltage-gated K+ conductance.
5:22 19:20
K+ voltage-gated channel dynamics
Cellular Mechanisms of Brain Function
Kinetics of voltage-gated Na+ and K+ currents
Whereas both voltage-gated Na+ and K+ channels are activated at similar membrane potentials positive to ~–50 mV, the time-course of their activation is very different (Figure 3). The voltage-gated Na+ conductance is fast and transient, while the voltage-gated K+ conductance is delayed and long-lasting, without inactivation. The transient Na+ conductance lasts ~200 μs, and the K+ conductance is delayed by that same time, but then remains active and doesn’t inactivate, whereas the Na+ conductance inactivates fully after just a few hundred μs.
7:31 19:20
Na+ and K+ current dynamics
FIGURE 1
FIGURE 2
FIGURE 3
Cellular Mechanisms of Brain Function Prof. Carl Petersen
2.2 Voltage-gating kin
LEARN
FASTER,
LEARN
BETTER!
BOOCs EPFL 21
Cellular Mechanisms of Brain Function
Carl Petersen
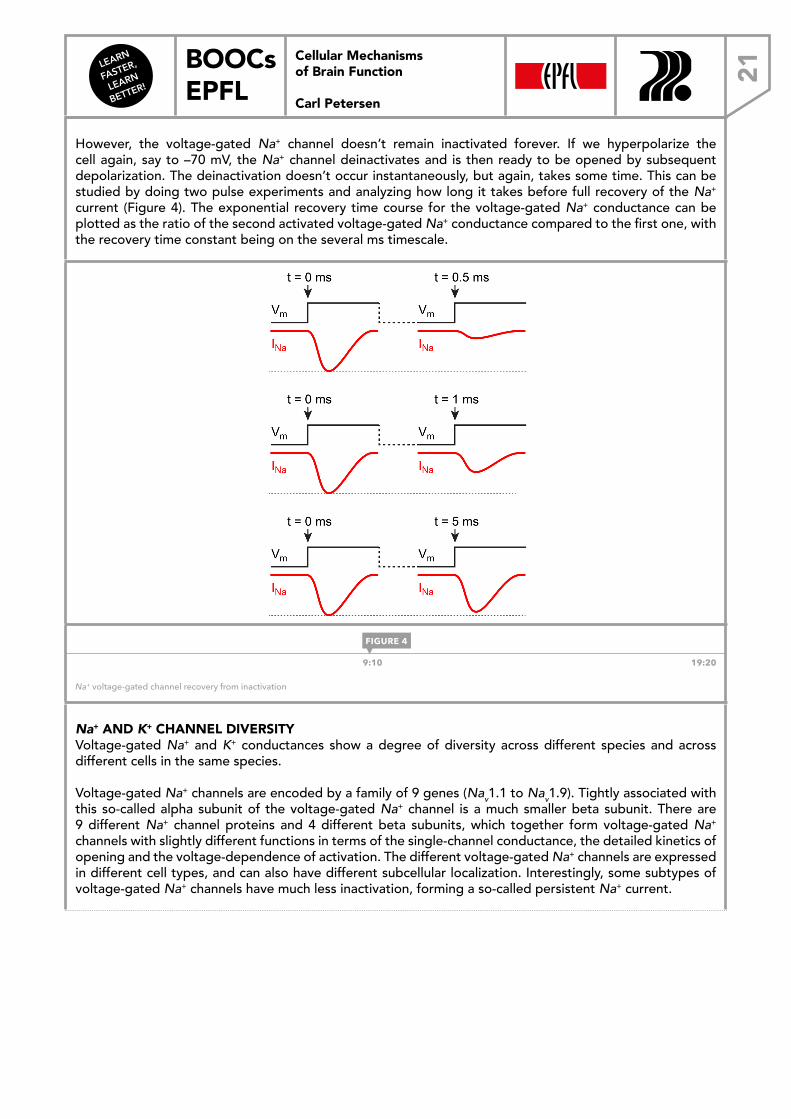
However, the voltage-gated Na+ channel doesn’t remain inactivated forever. If we hyperpolarize the cell again, say to –70 mV, the Na+ channel deinactivates and is then ready to be opened by subsequent depolarization. The deinactivation doesn’t occur instantaneously, but again, takes some time. This can be studied by doing two pulse experiments and analyzing how long it takes before full recovery of the Na+ current (Figure 4). The exponential recovery time course for the voltage-gated Na+ conductance can be plotted as the ratio of the second activated voltage-gated Na+ conductance compared to the first one, with the recovery time constant being on the several ms timescale.
Cellular Mechanisms of Brain Function
Recovery from inactivation
9:10 19:20
Na+ voltage-gated channel recovery from inactivation
Na+ AND K+ CHANNEL DIVERSITYVoltage-gated Na+ and K+ conductances show a degree of diversity across different species and across different cells in the same species.
Voltage-gated Na+ channels are encoded by a family of 9 genes (Nav1.1 to Nav1.9). Tightly associated with this so-called alpha subunit of the voltage-gated Na+ channel is a much smaller beta subunit. There are 9 different Na+ channel proteins and 4 different beta subunits, which together form voltage-gated Na+ channels with slightly different functions in terms of the single-channel conductance, the detailed kinetics of opening and the voltage-dependence of activation. The different voltage-gated Na+ channels are expressed in different cell types, and can also have different subcellular localization. Interestingly, some subtypes of voltage-gated Na+ channels have much less inactivation, forming a so-called persistent Na+ current.
FIGURE 4
LEARN
FASTER,
LEARN
BETTER!
BOOCs EPFL22
Cellular Mechanisms of Brain Function
Carl Petersen
K+ channels are even more diverse, with approximately 80 different genes in the mammalian genome that encode K+ channels. Not all of the K+ channels are voltage-gated, however, for example some K+ channels are primarily gated by intracellular Ca2+ concentration (BK and SK channels), and others are controlled by G-proteins (GIRK channels). Yet other K+ channels, tandem pore K+ channels, are involved in setting the resting membrane potential. Voltage-gated K+ channels themselves have extensive diversity in terms of the genes encoding the different subunits, their cellular and subcellular localisation, the voltage-dependence of activation, and the kinetics. Some voltage-gated K+ channels have a degree of inactivation, but typically on a much longer timescale than voltage-gated Na+ channels. The diversity in voltage-gated K+ channels causes a great deal of the diversity in terms of how neuronal membrane potential changes in different cell types and in different compartments of the same cell.
Na+ AND K+ CHANNELS DRIVING MEMBRANE POTENTIAL DYNAMICSLet’s consider a cell with both voltage-gated Na+ and K+ ion channels. Upon membrane potential depolarisation, we enter the regime where the Na+ channel begins to activate, causing further depolarisation with explosive positive feedback. After a few hundred µs the Na+ channels inactivate, and at the same time the K+ conductance is activated, driving hyperpolarization. It’s exactly this dynamic interaction between the voltage-gated Na+ and K+ conductances giving rise to brief transient excursions in the membrane potential that underlies the action potential.
LEARN
FASTER,
LEARN
BETTER!
BOOCs EPFL 23
Cellular Mechanisms of Brain Function
Carl Petersen
2.3 THE ACTION POTENTIAL
The action potential (AP) is a unitary, all-or-none event with a duration of about 1 ms. The action potential is the most important unit of information in the brain. The pattern of AP firing in different neurons encodes sensory input, motor output and every aspect underlying our thought processes.
Cellular Mechanisms of Brain Function
Hodgkin and Huxley
Alan Hodgkin Nobel Prize 1963
Andrew Huxley Nobel Prize 1963
Voltage-clamp experiments on the giant axon of the squid.
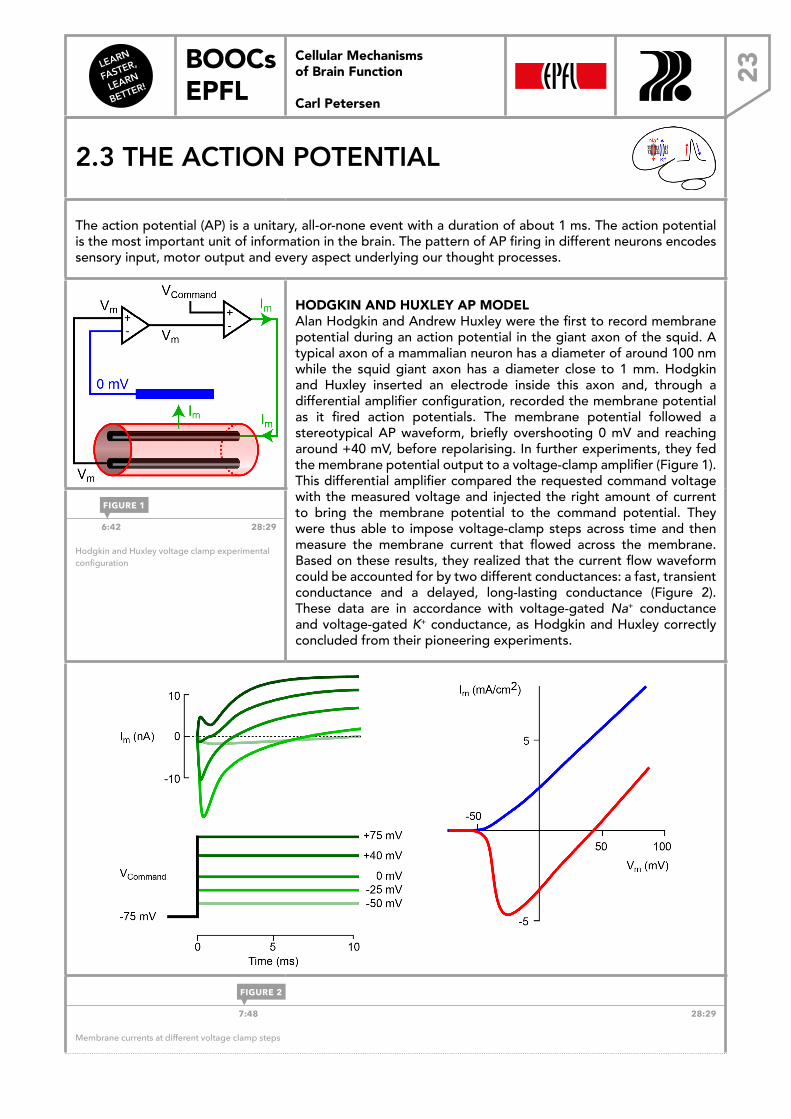
HODGKIN AND HUXLEY AP MODELAlan Hodgkin and Andrew Huxley were the first to record membrane potential during an action potential in the giant axon of the squid. A typical axon of a mammalian neuron has a diameter of around 100 nm while the squid giant axon has a diameter close to 1 mm. Hodgkin and Huxley inserted an electrode inside this axon and, through a differential amplifier configuration, recorded the membrane potential as it fired action potentials. The membrane potential followed a stereotypical AP waveform, briefly overshooting 0 mV and reaching around +40 mV, before repolarising. In further experiments, they fed the membrane potential output to a voltage-clamp amplifier (Figure 1). This differential amplifier compared the requested command voltage with the measured voltage and injected the right amount of current to bring the membrane potential to the command potential. They were thus able to impose voltage-clamp steps across time and then measure the membrane current that flowed across the membrane. Based on these results, they realized that the current flow waveform could be accounted for by two different conductances: a fast, transient conductance and a delayed, long-lasting conductance (Figure 2). These data are in accordance with voltage-gated Na+ conductance and voltage-gated K+ conductance, as Hodgkin and Huxley correctly concluded from their pioneering experiments.
6:42 28:29
Hodgkin and Huxley voltage clamp experimental configuration
Cellular Mechanisms of Brain Function
Ionic basis of the action potential
7:48 28:29
Membrane currents at different voltage clamp steps
FIGURE 1
FIGURE 2
Cellular Mechanisms of Brain Function Prof. Carl Petersen
2.3 The action potent
LEARN
FASTER,
LEARN
BETTER!
BOOCs EPFL24
Cellular Mechanisms of Brain Function
Carl Petersen
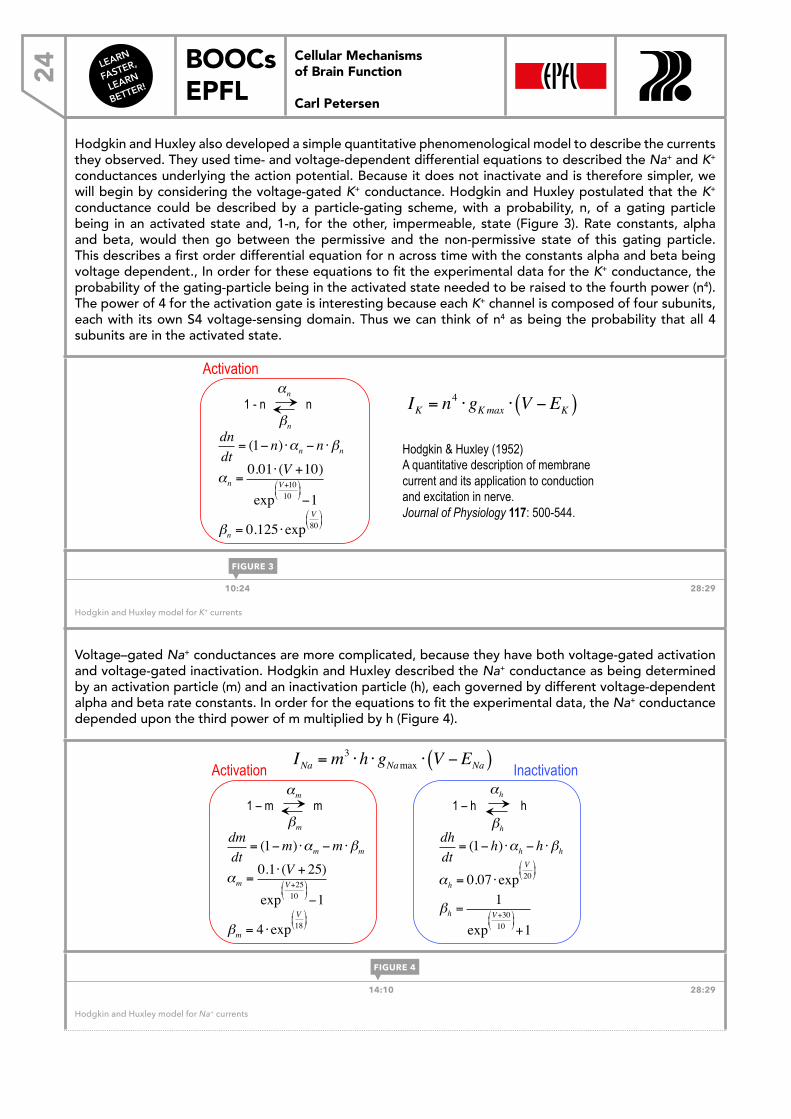
Hodgkin and Huxley also developed a simple quantitative phenomenological model to describe the currents they observed. They used time- and voltage-dependent differential equations to described the Na+ and K+ conductances underlying the action potential. Because it does not inactivate and is therefore simpler, we will begin by considering the voltage-gated K+ conductance. Hodgkin and Huxley postulated that the K+ conductance could be described by a particle-gating scheme, with a probability, n, of a gating particle being in an activated state and, 1-n, for the other, impermeable, state (Figure 3). Rate constants, alpha and beta, would then go between the permissive and the non-permissive state of this gating particle. This describes a first order differential equation for n across time with the constants alpha and beta being voltage dependent., In order for these equations to fit the experimental data for the K+ conductance, the probability of the gating-particle being in the activated state needed to be raised to the fourth power (n4). The power of 4 for the activation gate is interesting because each K+ channel is composed of four subunits, each with its own S4 voltage-sensing domain. Thus we can think of n4 as being the probability that all 4 subunits are in the activated state.
Cellular Mechanisms of Brain Function
Hodgkin and Huxley model for K+ conductance
IK = n4 ⋅ gKmax ⋅ V −EK( )
dndt= (1− n) ⋅αn − n ⋅βn
1 - n n αn
βn
αn =0.01⋅ (V +10)
expV+1010
"
#$
%
&'−1
βn = 0.125 ⋅expV80"
#$
%
&'
Activation
Hodgkin & Huxley (1952) A quantitative description of membrane current and its application to conduction and excitation in nerve. Journal of Physiology 117: 500-544.
10:24 28:29
Hodgkin and Huxley model for K+ currents
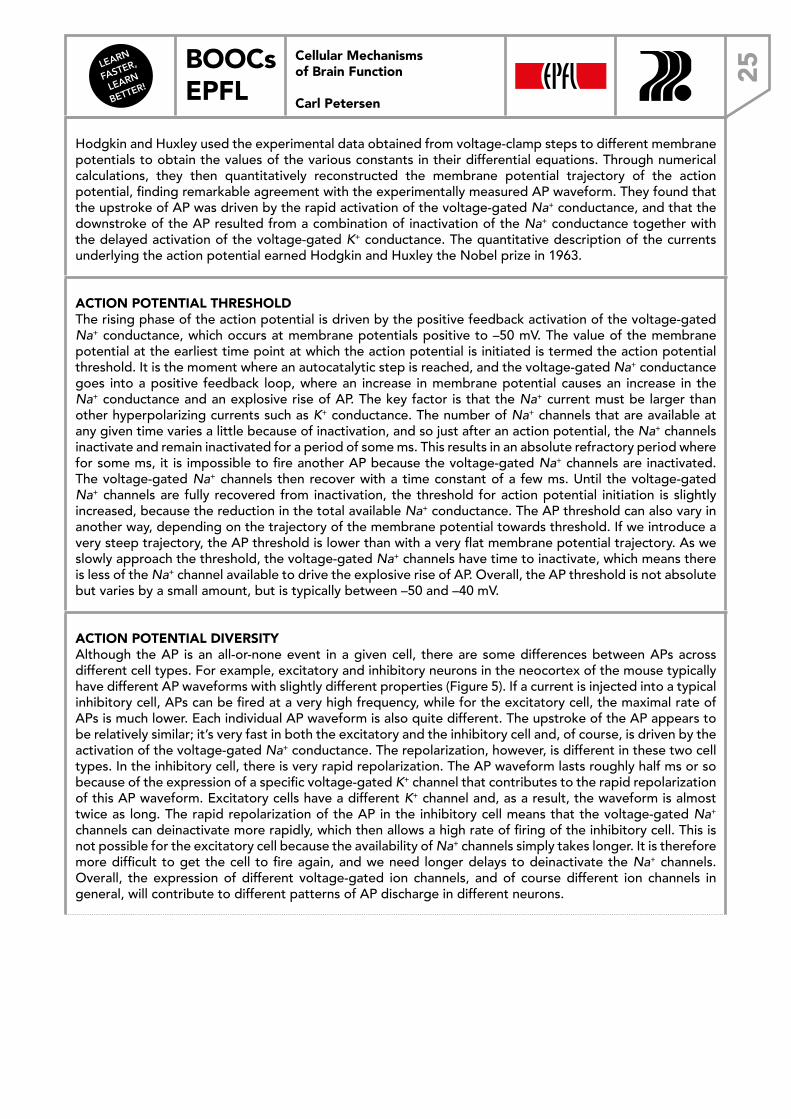
Voltage–gated Na+ conductances are more complicated, because they have both voltage-gated activation and voltage-gated inactivation. Hodgkin and Huxley described the Na+ conductance as being determined by an activation particle (m) and an inactivation particle (h), each governed by different voltage-dependent alpha and beta rate constants. In order for the equations to fit the experimental data, the Na+ conductance depended upon the third power of m multiplied by h (Figure 4).
Cellular Mechanisms of Brain Function
Hodgkin and Huxley model for Na+ conductance
INa =m3 ⋅h ⋅ gNamax ⋅ V −ENa( )
dmdt
= (1−m) ⋅αm −m ⋅βm
αm =0.1⋅ (V + 25)
expV+2510
"
#$
%
&'−1
βm = 4 ⋅expV18"
#$
%
&'
1 – m m αm
βmdhdt= (1− h) ⋅αh − h ⋅βh
αh = 0.07 ⋅expV20"
#$
%
&'
βh =1
expV+3010
!
"#
$
%&+1
1 – h h αh
βh
Activation Inactivation
14:10 28:29
Hodgkin and Huxley model for Na+ currents
FIGURE 3
FIGURE 4
LEARN
FASTER,
LEARN
BETTER!
BOOCs EPFL 25
Cellular Mechanisms of Brain Function
Carl Petersen
Hodgkin and Huxley used the experimental data obtained from voltage-clamp steps to different membrane potentials to obtain the values of the various constants in their differential equations. Through numerical calculations, they then quantitatively reconstructed the membrane potential trajectory of the action potential, finding remarkable agreement with the experimentally measured AP waveform. They found that the upstroke of AP was driven by the rapid activation of the voltage-gated Na+ conductance, and that the downstroke of the AP resulted from a combination of inactivation of the Na+ conductance together with the delayed activation of the voltage-gated K+ conductance. The quantitative description of the currents underlying the action potential earned Hodgkin and Huxley the Nobel prize in 1963.
ACTION POTENTIAL THRESHOLDThe rising phase of the action potential is driven by the positive feedback activation of the voltage-gated Na+ conductance, which occurs at membrane potentials positive to –50 mV. The value of the membrane potential at the earliest time point at which the action potential is initiated is termed the action potential threshold. It is the moment where an autocatalytic step is reached, and the voltage-gated Na+ conductance goes into a positive feedback loop, where an increase in membrane potential causes an increase in the Na+ conductance and an explosive rise of AP. The key factor is that the Na+ current must be larger than other hyperpolarizing currents such as K+ conductance. The number of Na+ channels that are available at any given time varies a little because of inactivation, and so just after an action potential, the Na+ channels inactivate and remain inactivated for a period of some ms. This results in an absolute refractory period where for some ms, it is impossible to fire another AP because the voltage-gated Na+ channels are inactivated. The voltage-gated Na+ channels then recover with a time constant of a few ms. Until the voltage-gated Na+ channels are fully recovered from inactivation, the threshold for action potential initiation is slightly increased, because the reduction in the total available Na+ conductance. The AP threshold can also vary in another way, depending on the trajectory of the membrane potential towards threshold. If we introduce a very steep trajectory, the AP threshold is lower than with a very flat membrane potential trajectory. As we slowly approach the threshold, the voltage-gated Na+ channels have time to inactivate, which means there is less of the Na+ channel available to drive the explosive rise of AP. Overall, the AP threshold is not absolute but varies by a small amount, but is typically between –50 and –40 mV.
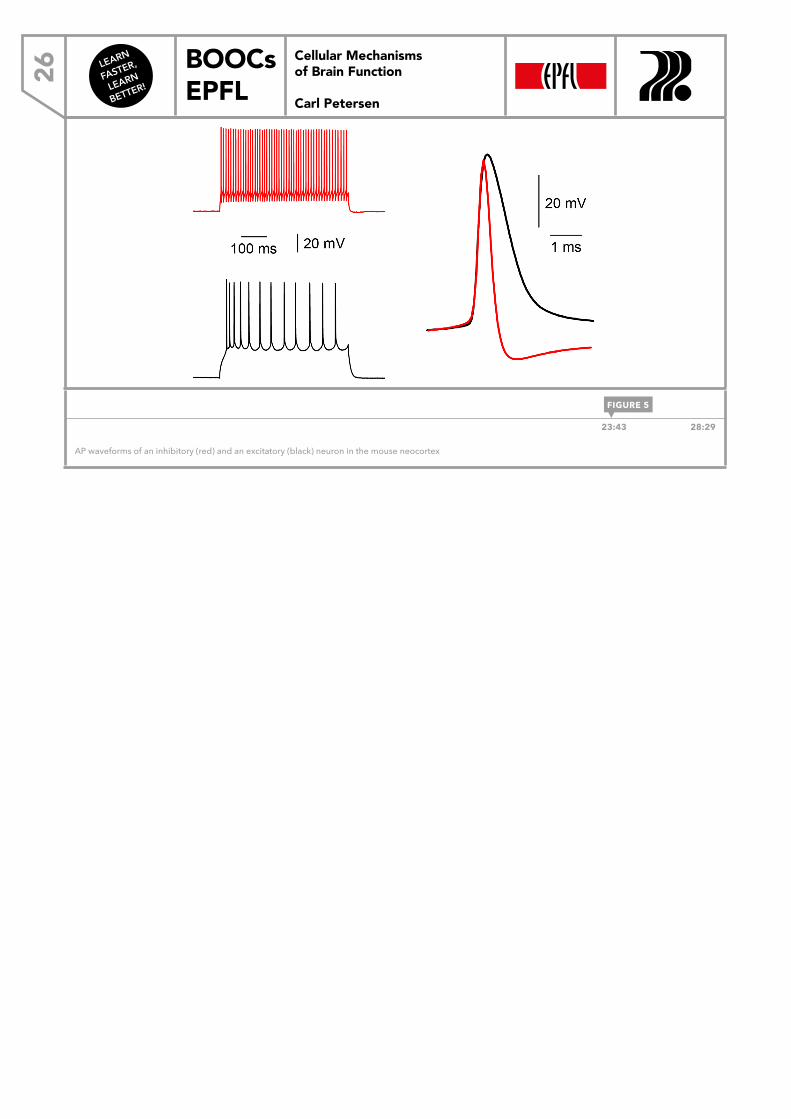
ACTION POTENTIAL DIVERSITY Although the AP is an all-or-none event in a given cell, there are some differences between APs across different cell types. For example, excitatory and inhibitory neurons in the neocortex of the mouse typically have different AP waveforms with slightly different properties (Figure 5). If a current is injected into a typical inhibitory cell, APs can be fired at a very high frequency, while for the excitatory cell, the maximal rate of APs is much lower. Each individual AP waveform is also quite different. The upstroke of the AP appears to be relatively similar; it’s very fast in both the excitatory and the inhibitory cell and, of course, is driven by the activation of the voltage-gated Na+ conductance. The repolarization, however, is different in these two cell types. In the inhibitory cell, there is very rapid repolarization. The AP waveform lasts roughly half ms or so because of the expression of a specific voltage-gated K+ channel that contributes to the rapid repolarization of this AP waveform. Excitatory cells have a different K+ channel and, as a result, the waveform is almost twice as long. The rapid repolarization of the AP in the inhibitory cell means that the voltage-gated Na+ channels can deinactivate more rapidly, which then allows a high rate of firing of the inhibitory cell. This is not possible for the excitatory cell because the availability of Na+ channels simply takes longer. It is therefore more difficult to get the cell to fire again, and we need longer delays to deinactivate the Na+ channels. Overall, the expression of different voltage-gated ion channels, and of course different ion channels in general, will contribute to different patterns of AP discharge in different neurons.
LEARN
FASTER,
LEARN
BETTER!
BOOCs EPFL26
Cellular Mechanisms of Brain Function
Carl Petersen
Cellular Mechanisms of Brain Function
Action potential diversity – cell-types
23:43 28:29
AP waveforms of an inhibitory (red) and an excitatory (black) neuron in the mouse neocortex
FIGURE 5
LEARN
FASTER,
LEARN
BETTER!
BOOCs EPFL 27
Cellular Mechanisms of Brain Function
Carl Petersen
2.4 ACTION POTENTIAL PROPAGATION
As we have already seen, the thin cables of neurons in the dendrites and axons are associated with a considerable amount of spatial and temporal filtering. The length scale of around 1 mm and membrane time constants in the order of several ms pose a considerable problem for information transfer. The axon of cells can travel for many cm, even meters, and under these circumstances, the length constants become so problematic that basically no signal would be transferred passively down an axon. The regenerative nature of AP allows it to propagate down axons faithfully.
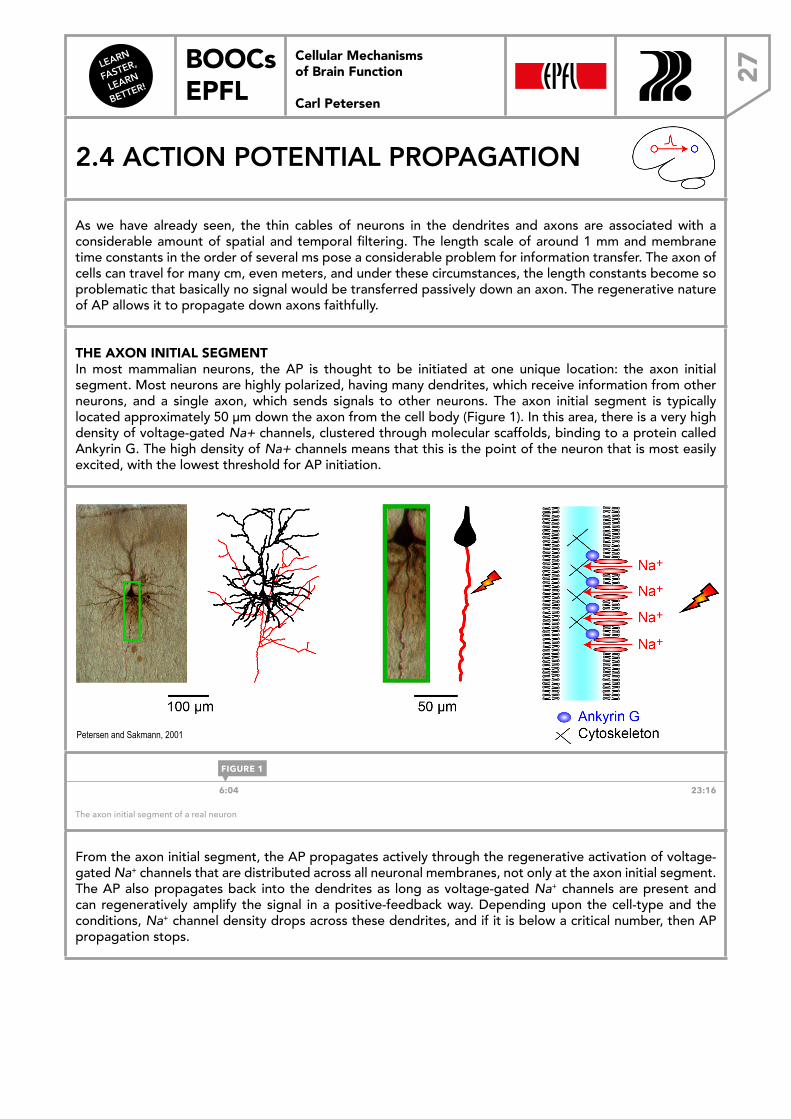
THE AXON INITIAL SEGMENTIn most mammalian neurons, the AP is thought to be initiated at one unique location: the axon initial segment. Most neurons are highly polarized, having many dendrites, which receive information from other neurons, and a single axon, which sends signals to other neurons. The axon initial segment is typically located approximately 50 µm down the axon from the cell body (Figure 1). In this area, there is a very high density of voltage-gated Na+ channels, clustered through molecular scaffolds, binding to a protein called Ankyrin G. The high density of Na+ channels means that this is the point of the neuron that is most easily excited, with the lowest threshold for AP initiation.
Cellular Mechanisms of Brain Function
The axon initial segment
Petersen and Sakmann, 2001
6:04 23:16
The axon initial segment of a real neuron
From the axon initial segment, the AP propagates actively through the regenerative activation of voltage-gated Na+ channels that are distributed across all neuronal membranes, not only at the axon initial segment. The AP also propagates back into the dendrites as long as voltage-gated Na+ channels are present and can regeneratively amplify the signal in a positive-feedback way. Depending upon the cell-type and the conditions, Na+ channel density drops across these dendrites, and if it is below a critical number, then AP propagation stops.
FIGURE 1
Cellular Mechanisms of Brain Function Prof. Carl Petersen
2.4 Action potential prop
LEARN
FASTER,
LEARN
BETTER!
BOOCs EPFL28
Cellular Mechanisms of Brain Function
Carl Petersen
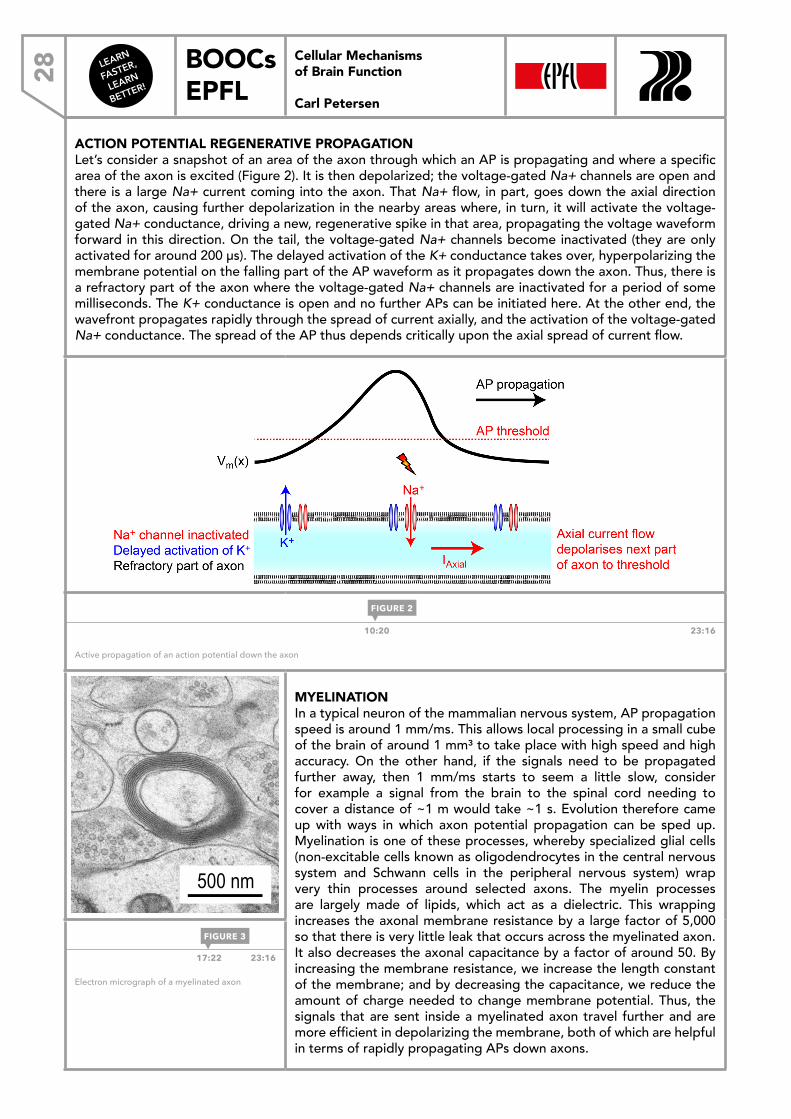
ACTION POTENTIAL REGENERATIVE PROPAGATIONLet’s consider a snapshot of an area of the axon through which an AP is propagating and where a specific area of the axon is excited (Figure 2). It is then depolarized; the voltage-gated Na+ channels are open and there is a large Na+ current coming into the axon. That Na+ flow, in part, goes down the axial direction of the axon, causing further depolarization in the nearby areas where, in turn, it will activate the voltage-gated Na+ conductance, driving a new, regenerative spike in that area, propagating the voltage waveform forward in this direction. On the tail, the voltage-gated Na+ channels become inactivated (they are only activated for around 200 µs). The delayed activation of the K+ conductance takes over, hyperpolarizing the membrane potential on the falling part of the AP waveform as it propagates down the axon. Thus, there is a refractory part of the axon where the voltage-gated Na+ channels are inactivated for a period of some milliseconds. The K+ conductance is open and no further APs can be initiated here. At the other end, the wavefront propagates rapidly through the spread of current axially, and the activation of the voltage-gated Na+ conductance. The spread of the AP thus depends critically upon the axial spread of current flow.
Cellular Mechanisms of Brain Function
Active amplification of action potentials
10:20 23:16
Active propagation of an action potential down the axon
Cellular Mechanisms of Brain Function
Myelination
Specialised glial cells (oligodendrocytes and Schwann cells) wrap very thin processes around selected axons. The myelin processes contain 80% lipid, which is a good electrical insulator.
Myelination increases axonal membrane resistance by a factor of ~5,000 and decreases axonal capacitance by ~50.
Korogod, Petersen and Knott
500 nm
λ = √ (Rm / RAxial)
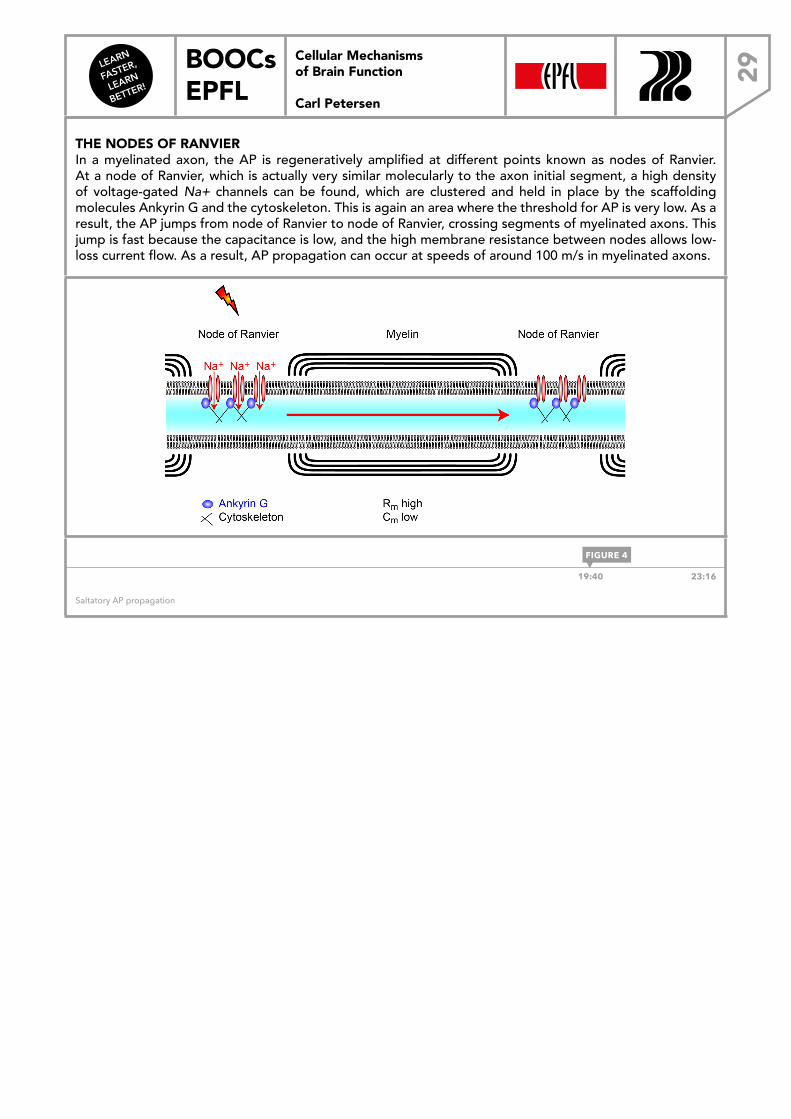
MYELINATION In a typical neuron of the mammalian nervous system, AP propagation speed is around 1 mm/ms. This allows local processing in a small cube of the brain of around 1 mm³ to take place with high speed and high accuracy. On the other hand, if the signals need to be propagated further away, then 1 mm/ms starts to seem a little slow, consider for example a signal from the brain to the spinal cord needing to cover a distance of ~1 m would take ~1 s. Evolution therefore came up with ways in which axon potential propagation can be sped up. Myelination is one of these processes, whereby specialized glial cells (non-excitable cells known as oligodendrocytes in the central nervous system and Schwann cells in the peripheral nervous system) wrap very thin processes around selected axons. The myelin processes are largely made of lipids, which act as a dielectric. This wrapping increases the axonal membrane resistance by a large factor of 5,000 so that there is very little leak that occurs across the myelinated axon. It also decreases the axonal capacitance by a factor of around 50. By increasing the membrane resistance, we increase the length constant of the membrane; and by decreasing the capacitance, we reduce the amount of charge needed to change membrane potential. Thus, the signals that are sent inside a myelinated axon travel further and are more efficient in depolarizing the membrane, both of which are helpful in terms of rapidly propagating APs down axons.
17:22 23:16
Electron micrograph of a myelinated axon
FIGURE 2
FIGURE 3
LEARN
FASTER,
LEARN
BETTER!
BOOCs EPFL 29
Cellular Mechanisms of Brain Function
Carl Petersen
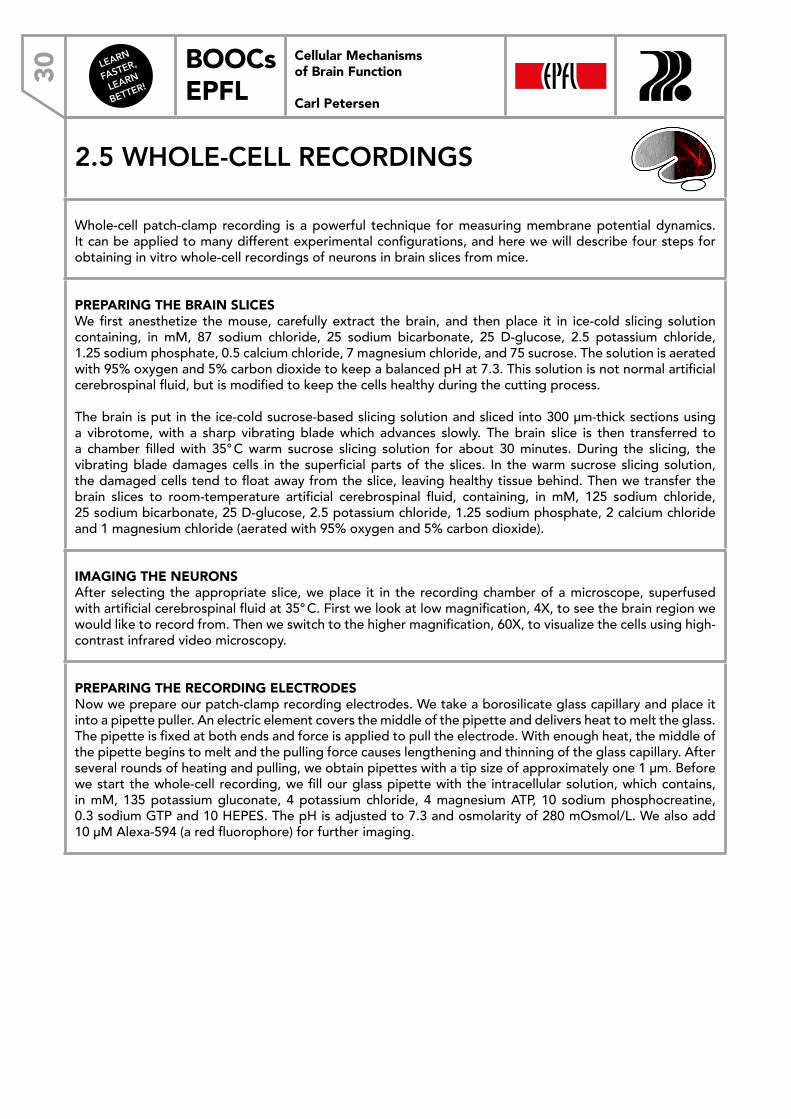
THE NODES OF RANVIER In a myelinated axon, the AP is regeneratively amplified at different points known as nodes of Ranvier. At a node of Ranvier, which is actually very similar molecularly to the axon initial segment, a high density of voltage-gated Na+ channels can be found, which are clustered and held in place by the scaffolding molecules Ankyrin G and the cytoskeleton. This is again an area where the threshold for AP is very low. As a result, the AP jumps from node of Ranvier to node of Ranvier, crossing segments of myelinated axons. This jump is fast because the capacitance is low, and the high membrane resistance between nodes allows low-loss current flow. As a result, AP propagation can occur at speeds of around 100 m/s in myelinated axons.
Cellular Mechanisms of Brain Function
Nodes of Ranvier – saltatory AP propagation
19:40 23:16
Saltatory AP propagation
FIGURE 4
LEARN
FASTER,
LEARN
BETTER!
BOOCs EPFL30
Cellular Mechanisms of Brain Function
Carl Petersen
2.5 WHOLE-CELL RECORDINGS
Whole-cell patch-clamp recording is a powerful technique for measuring membrane potential dynamics. It can be applied to many different experimental configurations, and here we will describe four steps for obtaining in vitro whole-cell recordings of neurons in brain slices from mice.
PREPARING THE BRAIN SLICESWe first anesthetize the mouse, carefully extract the brain, and then place it in ice-cold slicing solution containing, in mM, 87 sodium chloride, 25 sodium bicarbonate, 25 D-glucose, 2.5 potassium chloride, 1.25 sodium phosphate, 0.5 calcium chloride, 7 magnesium chloride, and 75 sucrose. The solution is aerated with 95% oxygen and 5% carbon dioxide to keep a balanced pH at 7.3. This solution is not normal artificial cerebrospinal fluid, but is modified to keep the cells healthy during the cutting process.
The brain is put in the ice-cold sucrose-based slicing solution and sliced into 300 µm-thick sections using a vibrotome, with a sharp vibrating blade which advances slowly. The brain slice is then transferred to a chamber filled with 35° C warm sucrose slicing solution for about 30 minutes. During the slicing, the vibrating blade damages cells in the superficial parts of the slices. In the warm sucrose slicing solution, the damaged cells tend to float away from the slice, leaving healthy tissue behind. Then we transfer the brain slices to room-temperature artificial cerebrospinal fluid, containing, in mM, 125 sodium chloride, 25 sodium bicarbonate, 25 D-glucose, 2.5 potassium chloride, 1.25 sodium phosphate, 2 calcium chloride and 1 magnesium chloride (aerated with 95% oxygen and 5% carbon dioxide).
IMAGING THE NEURONS After selecting the appropriate slice, we place it in the recording chamber of a microscope, superfused with artificial cerebrospinal fluid at 35° C. First we look at low magnification, 4X, to see the brain region we would like to record from. Then we switch to the higher magnification, 60X, to visualize the cells using high-contrast infrared video microscopy.
PREPARING THE RECORDING ELECTRODES Now we prepare our patch-clamp recording electrodes. We take a borosilicate glass capillary and place it into a pipette puller. An electric element covers the middle of the pipette and delivers heat to melt the glass. The pipette is fixed at both ends and force is applied to pull the electrode. With enough heat, the middle of the pipette begins to melt and the pulling force causes lengthening and thinning of the glass capillary. After several rounds of heating and pulling, we obtain pipettes with a tip size of approximately one 1 μm. Before we start the whole-cell recording, we fill our glass pipette with the intracellular solution, which contains, in mM, 135 potassium gluconate, 4 potassium chloride, 4 magnesium ATP, 10 sodium phosphocreatine, 0.3 sodium GTP and 10 HEPES. The pH is adjusted to 7.3 and osmolarity of 280 mOsmol/L. We also add 10 µM Alexa-594 (a red fluorophore) for further imaging.
Cellular Mechanisms of Brain Function Prof. Carl Petersen
2.5 Whole-cell recordin
LEARN
FASTER,
LEARN
BETTER!
BOOCs EPFL 31
Cellular Mechanisms of Brain Function
Carl Petersen
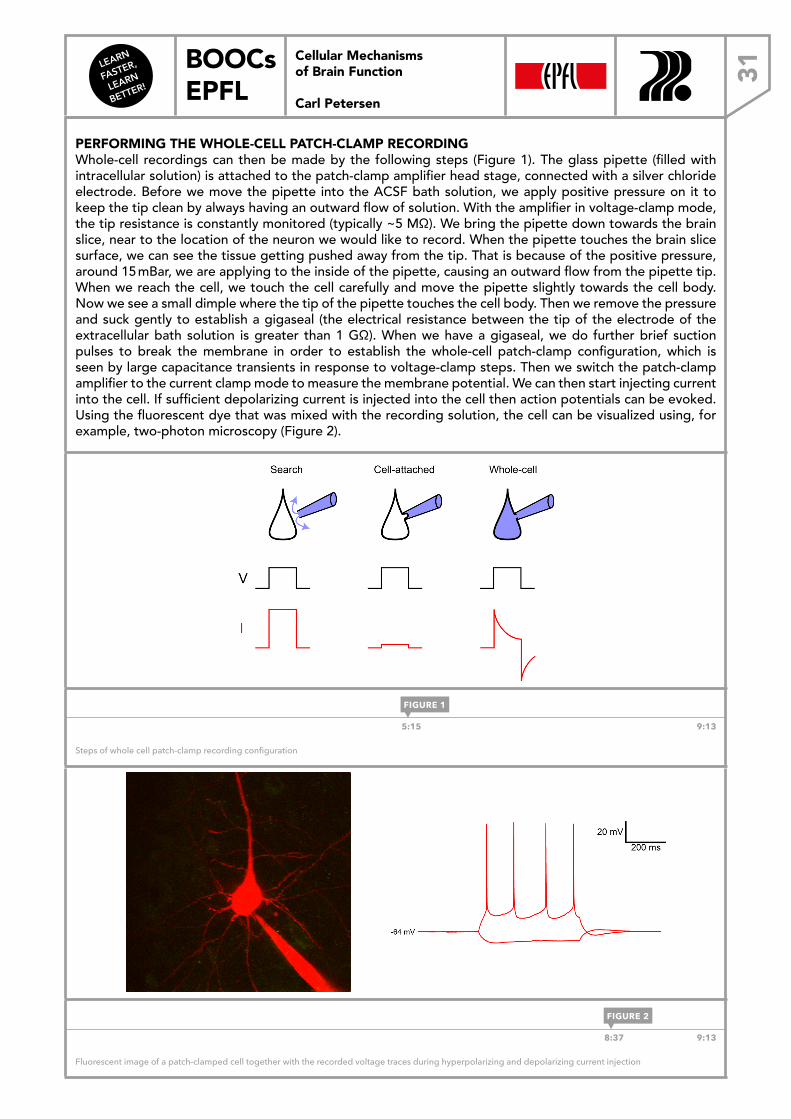
PERFORMING THE WHOLE-CELL PATCH-CLAMP RECORDINGWhole-cell recordings can then be made by the following steps (Figure 1). The glass pipette (filled with intracellular solution) is attached to the patch-clamp amplifier head stage, connected with a silver chloride electrode. Before we move the pipette into the ACSF bath solution, we apply positive pressure on it to keep the tip clean by always having an outward flow of solution. With the amplifier in voltage-clamp mode, the tip resistance is constantly monitored (typically ~5 MΩ). We bring the pipette down towards the brain slice, near to the location of the neuron we would like to record. When the pipette touches the brain slice surface, we can see the tissue getting pushed away from the tip. That is because of the positive pressure, around 15 mBar, we are applying to the inside of the pipette, causing an outward flow from the pipette tip. When we reach the cell, we touch the cell carefully and move the pipette slightly towards the cell body. Now we see a small dimple where the tip of the pipette touches the cell body. Then we remove the pressure and suck gently to establish a gigaseal (the electrical resistance between the tip of the electrode of the extracellular bath solution is greater than 1 GΩ). When we have a gigaseal, we do further brief suction pulses to break the membrane in order to establish the whole-cell patch-clamp configuration, which is seen by large capacitance transients in response to voltage-clamp steps. Then we switch the patch-clamp amplifier to the current clamp mode to measure the membrane potential. We can then start injecting current into the cell. If sufficient depolarizing current is injected into the cell then action potentials can be evoked. Using the fluorescent dye that was mixed with the recording solution, the cell can be visualized using, for example, two-photon microscopy (Figure 2).
Cellular Mechanisms of Brain Function
Whole-cell recording
5:15 9:13
Steps of whole cell patch-clamp recording configurationCellular Mechanisms of Brain Function
Structure and function
APs
Cellular Mechanisms of Brain Function
Structure and function
APs
8:37 9:13
Fluorescent image of a patch-clamped cell together with the recorded voltage traces during hyperpolarizing and depolarizing current injection
FIGURE 1
FIGURE 2
LEARN
FASTER,
LEARN
BETTER!
BOOCs EPFL32
Cellular Mechanisms of Brain Function
Carl Petersen
3.1 SYNAPTIC TRANSMISSION
Neurons communicate at specialized junctions called synapses, at which a neurotransmitter is released from the presynaptic cell sending a signal to the postsynaptic cell.
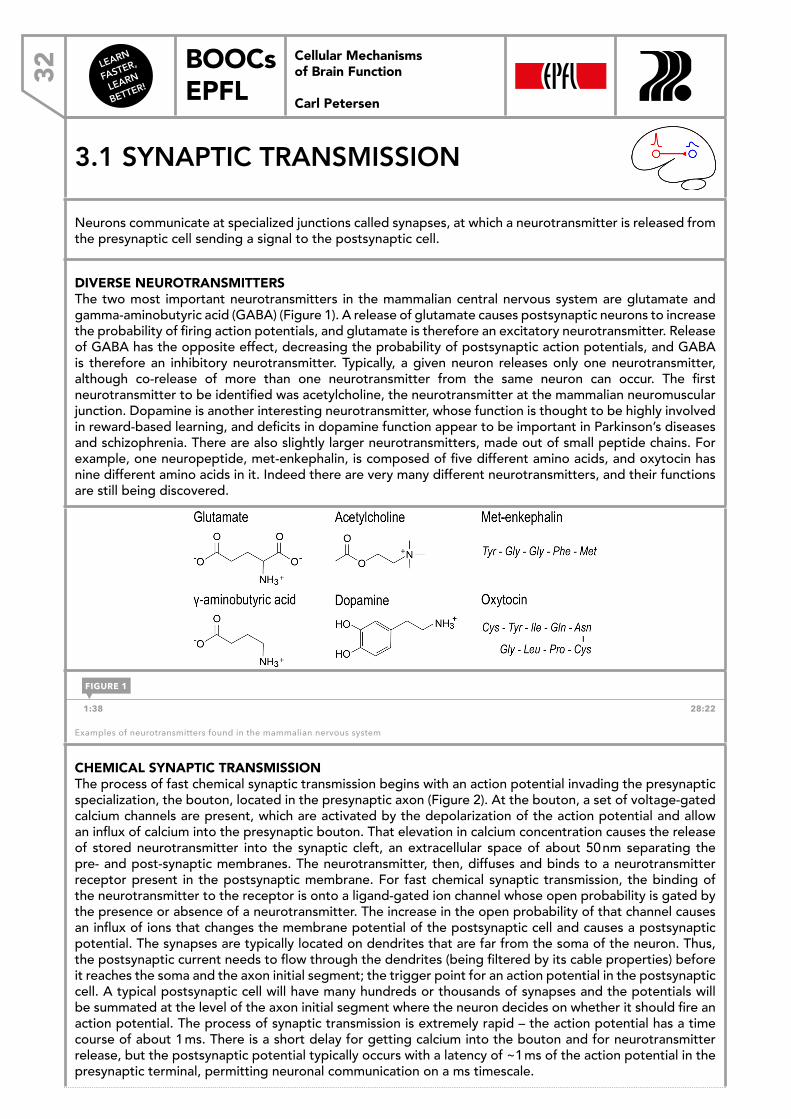
DIVERSE NEUROTRANSMITTERS The two most important neurotransmitters in the mammalian central nervous system are glutamate and gamma-aminobutyric acid (GABA) (Figure 1). A release of glutamate causes postsynaptic neurons to increase the probability of firing action potentials, and glutamate is therefore an excitatory neurotransmitter. Release of GABA has the opposite effect, decreasing the probability of postsynaptic action potentials, and GABA is therefore an inhibitory neurotransmitter. Typically, a given neuron releases only one neurotransmitter, although co-release of more than one neurotransmitter from the same neuron can occur. The first neurotransmitter to be identified was acetylcholine, the neurotransmitter at the mammalian neuromuscular junction. Dopamine is another interesting neurotransmitter, whose function is thought to be highly involved in reward-based learning, and deficits in dopamine function appear to be important in Parkinson’s diseases and schizophrenia. There are also slightly larger neurotransmitters, made out of small peptide chains. For example, one neuropeptide, met-enkephalin, is composed of five different amino acids, and oxytocin has nine different amino acids in it. Indeed there are very many different neurotransmitters, and their functions are still being discovered.
1:38 28:22
Examples of neurotransmitters found in the mammalian nervous system
CHEMICAL SYNAPTIC TRANSMISSION The process of fast chemical synaptic transmission begins with an action potential invading the presynaptic specialization, the bouton, located in the presynaptic axon (Figure 2). At the bouton, a set of voltage-gated calcium channels are present, which are activated by the depolarization of the action potential and allow an influx of calcium into the presynaptic bouton. That elevation in calcium concentration causes the release of stored neurotransmitter into the synaptic cleft, an extracellular space of about 50 nm separating the pre- and post-synaptic membranes. The neurotransmitter, then, diffuses and binds to a neurotransmitter receptor present in the postsynaptic membrane. For fast chemical synaptic transmission, the binding of the neurotransmitter to the receptor is onto a ligand-gated ion channel whose open probability is gated by the presence or absence of a neurotransmitter. The increase in the open probability of that channel causes an influx of ions that changes the membrane potential of the postsynaptic cell and causes a postsynaptic potential. The synapses are typically located on dendrites that are far from the soma of the neuron. Thus, the postsynaptic current needs to flow through the dendrites (being filtered by its cable properties) before it reaches the soma and the axon initial segment; the trigger point for an action potential in the postsynaptic cell. A typical postsynaptic cell will have many hundreds or thousands of synapses and the potentials will be summated at the level of the axon initial segment where the neuron decides on whether it should fire an action potential. The process of synaptic transmission is extremely rapid – the action potential has a time course of about 1 ms. There is a short delay for getting calcium into the bouton and for neurotransmitter release, but the postsynaptic potential typically occurs with a latency of ~1 ms of the action potential in the presynaptic terminal, permitting neuronal communication on a ms timescale.
FIGURE 1
Cellular Mechanisms of Brain Function Prof. Carl Petersen
3.1 Synaptic transmi
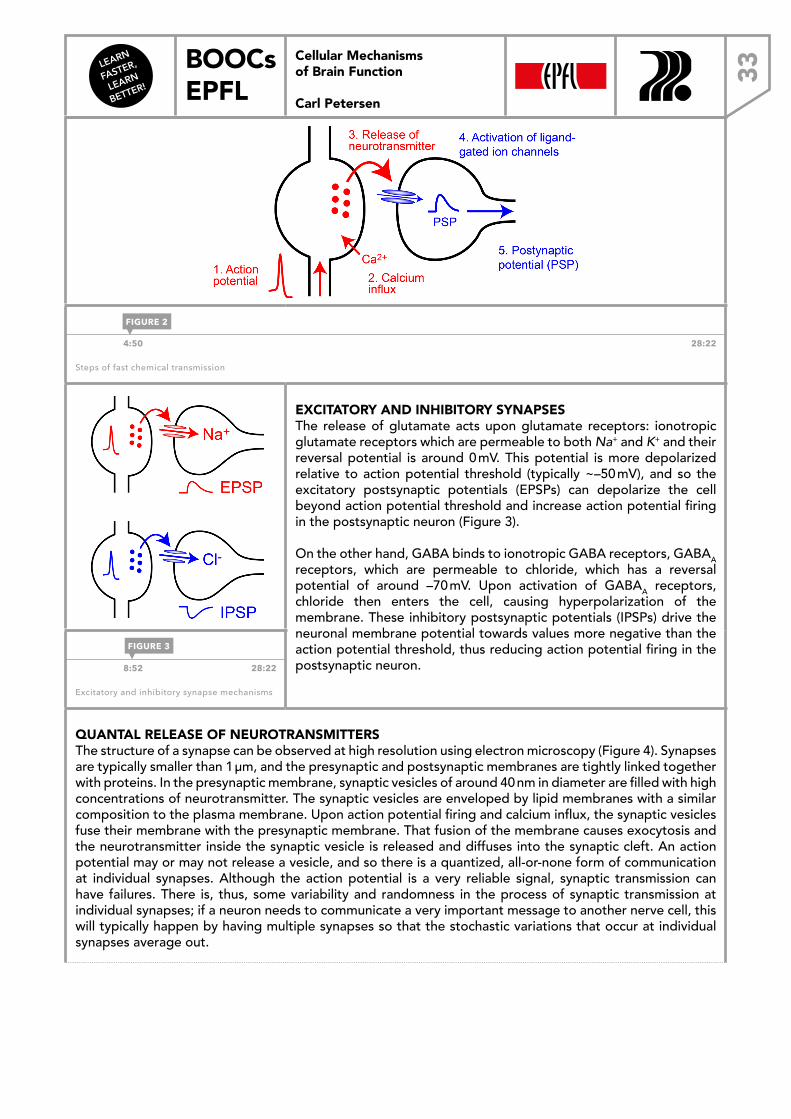
LEARN
FASTER,
LEARN
BETTER!
BOOCs EPFL 33
Cellular Mechanisms of Brain Function
Carl Petersen
Cellular Mechanisms of Brain Function
Fast chemical synaptic transmission
4:50 28:22
Steps of fast chemical transmission
Cellular Mechanisms of Brain Function
Excitatory and inhibitory synapses
Glutamate activates postsynaptic ionotropic glutamate receptors permeable to Na+ and K+ with reversal potential ~0 mV causing an excitatory postsynaptic potential (EPSP).
GABA activates postsynaptic ionotropic GABA receptors permeable to Cl- with reversal potential ~ -70 mV causing an inhibitory postsynaptic potential (IPSP).
EXCITATORY AND INHIBITORY SYNAPSESThe release of glutamate acts upon glutamate receptors: ionotropic glutamate receptors which are permeable to both Na+ and K+ and their reversal potential is around 0 mV. This potential is more depolarized relative to action potential threshold (typically ~–50 mV), and so the excitatory postsynaptic potentials (EPSPs) can depolarize the cell beyond action potential threshold and increase action potential firing in the postsynaptic neuron (Figure 3).
On the other hand, GABA binds to ionotropic GABA receptors, GABAA receptors, which are permeable to chloride, which has a reversal potential of around –70 mV. Upon activation of GABAA receptors, chloride then enters the cell, causing hyperpolarization of the membrane. These inhibitory postsynaptic potentials (IPSPs) drive the neuronal membrane potential towards values more negative than the action potential threshold, thus reducing action potential firing in the postsynaptic neuron. 8:52 28:22
Excitatory and inhibitory synapse mechanisms
QUANTAL RELEASE OF NEUROTRANSMITTERS The structure of a synapse can be observed at high resolution using electron microscopy (Figure 4). Synapses are typically smaller than 1 µm, and the presynaptic and postsynaptic membranes are tightly linked together with proteins. In the presynaptic membrane, synaptic vesicles of around 40 nm in diameter are filled with high concentrations of neurotransmitter. The synaptic vesicles are enveloped by lipid membranes with a similar composition to the plasma membrane. Upon action potential firing and calcium influx, the synaptic vesicles fuse their membrane with the presynaptic membrane. That fusion of the membrane causes exocytosis and the neurotransmitter inside the synaptic vesicle is released and diffuses into the synaptic cleft. An action potential may or may not release a vesicle, and so there is a quantized, all-or-none form of communication at individual synapses. Although the action potential is a very reliable signal, synaptic transmission can have failures. There is, thus, some variability and randomness in the process of synaptic transmission at individual synapses; if a neuron needs to communicate a very important message to another nerve cell, this will typically happen by having multiple synapses so that the stochastic variations that occur at individual synapses average out.
FIGURE 2
FIGURE 3
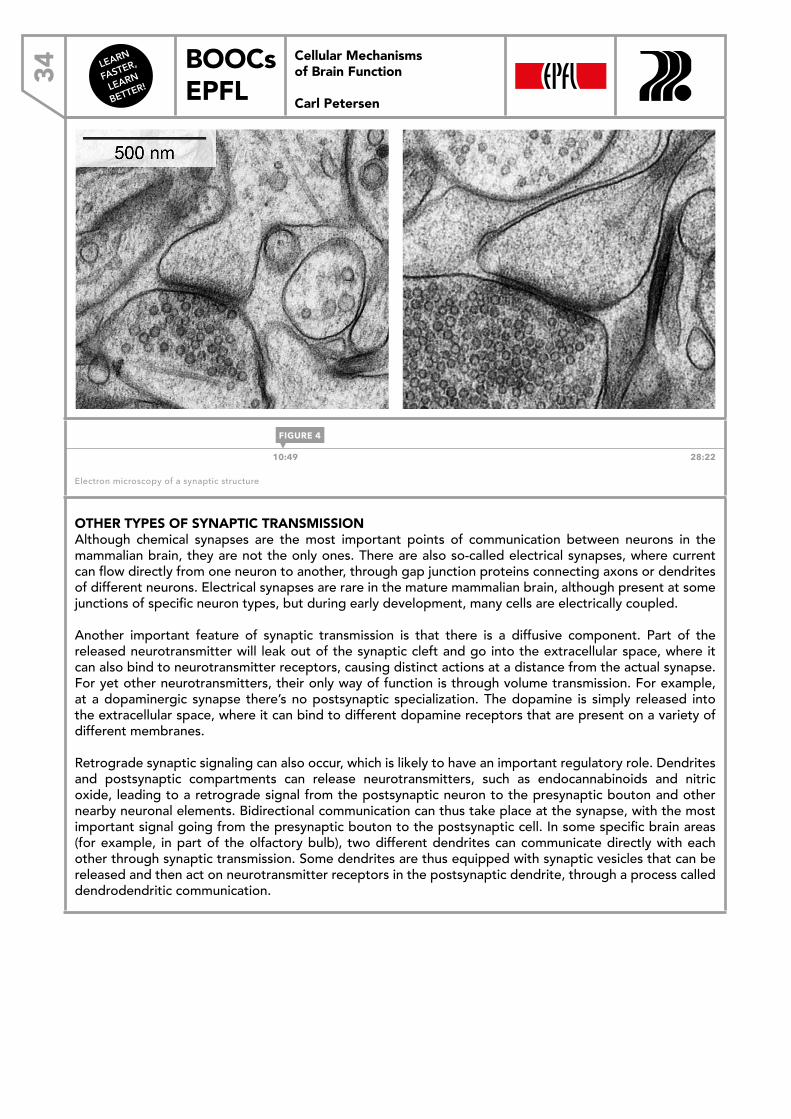
LEARN
FASTER,
LEARN
BETTER!
BOOCs EPFL34
Cellular Mechanisms of Brain Function
Carl Petersen
Cellular Mechanisms of Brain Function
Electron microscopy of synaptic structure
Korogod, Petersen and Knott
10:49 28:22
Electron microscopy of a synaptic structure
OTHER TYPES OF SYNAPTIC TRANSMISSIONAlthough chemical synapses are the most important points of communication between neurons in the mammalian brain, they are not the only ones. There are also so-called electrical synapses, where current can flow directly from one neuron to another, through gap junction proteins connecting axons or dendrites of different neurons. Electrical synapses are rare in the mature mammalian brain, although present at some junctions of specific neuron types, but during early development, many cells are electrically coupled.
Another important feature of synaptic transmission is that there is a diffusive component. Part of the released neurotransmitter will leak out of the synaptic cleft and go into the extracellular space, where it can also bind to neurotransmitter receptors, causing distinct actions at a distance from the actual synapse. For yet other neurotransmitters, their only way of function is through volume transmission. For example, at a dopaminergic synapse there’s no postsynaptic specialization. The dopamine is simply released into the extracellular space, where it can bind to different dopamine receptors that are present on a variety of different membranes.
Retrograde synaptic signaling can also occur, which is likely to have an important regulatory role. Dendrites and postsynaptic compartments can release neurotransmitters, such as endocannabinoids and nitric oxide, leading to a retrograde signal from the postsynaptic neuron to the presynaptic bouton and other nearby neuronal elements. Bidirectional communication can thus take place at the synapse, with the most important signal going from the presynaptic bouton to the postsynaptic cell. In some specific brain areas (for example, in part of the olfactory bulb), two different dendrites can communicate directly with each other through synaptic transmission. Some dendrites are thus equipped with synaptic vesicles that can be released and then act on neurotransmitter receptors in the postsynaptic dendrite, through a process called dendrodendritic communication.
FIGURE 4
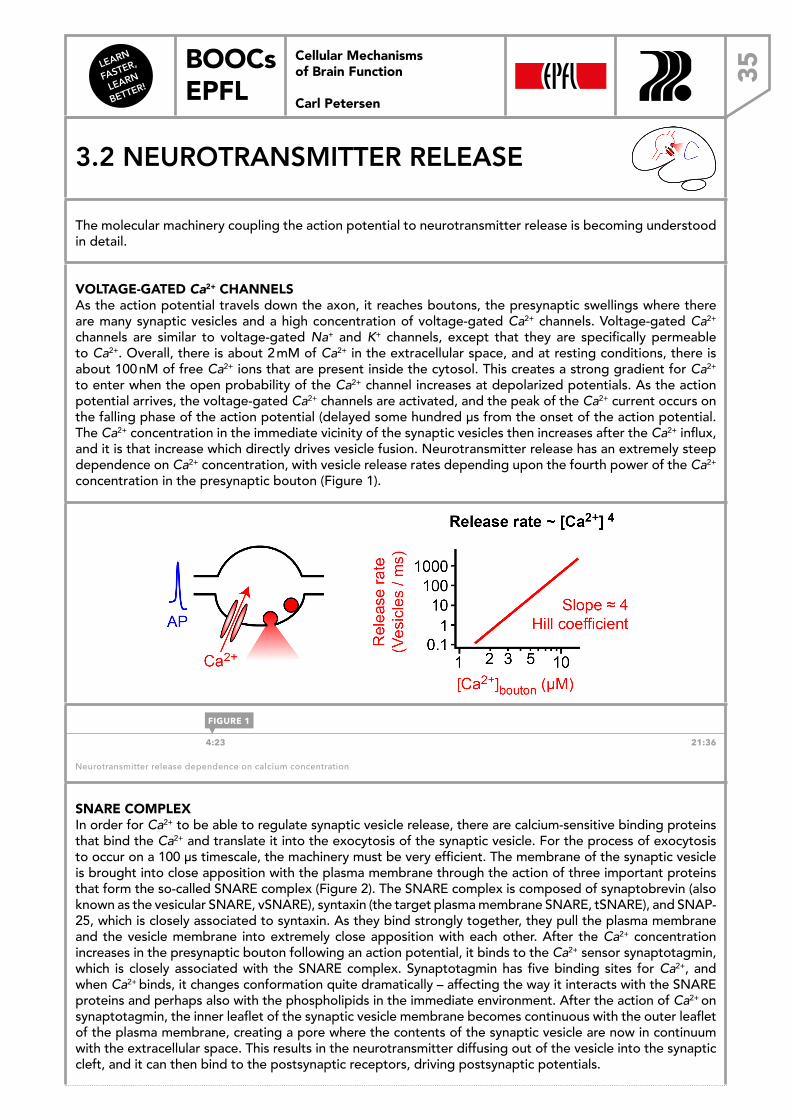
LEARN
FASTER,
LEARN
BETTER!
BOOCs EPFL 35
Cellular Mechanisms of Brain Function
Carl Petersen
3.2 NEUROTRANSMITTER RELEASE
The molecular machinery coupling the action potential to neurotransmitter release is becoming understood in detail.
VOLTAGE-GATED Ca2+ CHANNELSAs the action potential travels down the axon, it reaches boutons, the presynaptic swellings where there are many synaptic vesicles and a high concentration of voltage-gated Ca2+ channels. Voltage-gated Ca2+ channels are similar to voltage-gated Na+ and K+ channels, except that they are specifically permeable to Ca2+. Overall, there is about 2 mM of Ca2+ in the extracellular space, and at resting conditions, there is about 100 nM of free Ca2+ ions that are present inside the cytosol. This creates a strong gradient for Ca2+ to enter when the open probability of the Ca2+ channel increases at depolarized potentials. As the action potential arrives, the voltage-gated Ca2+ channels are activated, and the peak of the Ca2+ current occurs on the falling phase of the action potential (delayed some hundred µs from the onset of the action potential. The Ca2+ concentration in the immediate vicinity of the synaptic vesicles then increases after the Ca2+ influx, and it is that increase which directly drives vesicle fusion. Neurotransmitter release has an extremely steep dependence on Ca2+ concentration, with vesicle release rates depending upon the fourth power of the Ca2+ concentration in the presynaptic bouton (Figure 1).
Cellular Mechanisms of Brain Function
Calcium-evoked exocytosis of synaptic vesicles
Schneggenburger and Neher, 2000
4:23 21:36
Neurotransmitter release dependence on calcium concentration
SNARE COMPLEXIn order for Ca2+ to be able to regulate synaptic vesicle release, there are calcium-sensitive binding proteins that bind the Ca2+ and translate it into the exocytosis of the synaptic vesicle. For the process of exocytosis to occur on a 100 µs timescale, the machinery must be very efficient. The membrane of the synaptic vesicle is brought into close apposition with the plasma membrane through the action of three important proteins that form the so-called SNARE complex (Figure 2). The SNARE complex is composed of synaptobrevin (also known as the vesicular SNARE, vSNARE), syntaxin (the target plasma membrane SNARE, tSNARE), and SNAP-25, which is closely associated to syntaxin. As they bind strongly together, they pull the plasma membrane and the vesicle membrane into extremely close apposition with each other. After the Ca2+ concentration increases in the presynaptic bouton following an action potential, it binds to the Ca2+ sensor synaptotagmin, which is closely associated with the SNARE complex. Synaptotagmin has five binding sites for Ca2+, and when Ca2+ binds, it changes conformation quite dramatically – affecting the way it interacts with the SNARE proteins and perhaps also with the phospholipids in the immediate environment. After the action of Ca2+ on synaptotagmin, the inner leaflet of the synaptic vesicle membrane becomes continuous with the outer leaflet of the plasma membrane, creating a pore where the contents of the synaptic vesicle are now in continuum with the extracellular space. This results in the neurotransmitter diffusing out of the vesicle into the synaptic cleft, and it can then bind to the postsynaptic receptors, driving postsynaptic potentials.
FIGURE 1
Cellular Mechanisms of Brain Function Prof. Carl Petersen
3.2 Neurotransmitter r
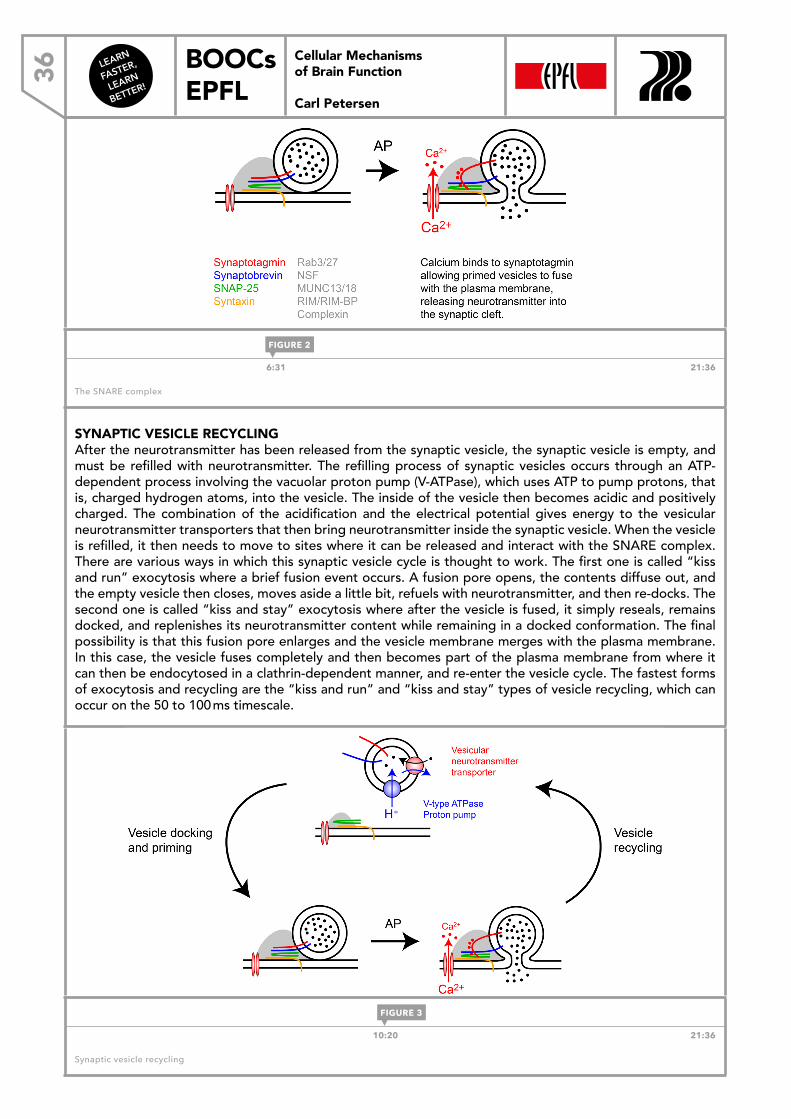
LEARN
FASTER,
LEARN
BETTER!
BOOCs EPFL36
Cellular Mechanisms of Brain Function
Carl Petersen
Cellular Mechanisms of Brain Function
Molecular mechanisms
6:31 21:36
The SNARE complex
SYNAPTIC VESICLE RECYCLING After the neurotransmitter has been released from the synaptic vesicle, the synaptic vesicle is empty, and must be refilled with neurotransmitter. The refilling process of synaptic vesicles occurs through an ATP-dependent process involving the vacuolar proton pump (V-ATPase), which uses ATP to pump protons, that is, charged hydrogen atoms, into the vesicle. The inside of the vesicle then becomes acidic and positively charged. The combination of the acidification and the electrical potential gives energy to the vesicular neurotransmitter transporters that then bring neurotransmitter inside the synaptic vesicle. When the vesicle is refilled, it then needs to move to sites where it can be released and interact with the SNARE complex. There are various ways in which this synaptic vesicle cycle is thought to work. The first one is called “kiss and run” exocytosis where a brief fusion event occurs. A fusion pore opens, the contents diffuse out, and the empty vesicle then closes, moves aside a little bit, refuels with neurotransmitter, and then re-docks. The second one is called “kiss and stay” exocytosis where after the vesicle is fused, it simply reseals, remains docked, and replenishes its neurotransmitter content while remaining in a docked conformation. The final possibility is that this fusion pore enlarges and the vesicle membrane merges with the plasma membrane. In this case, the vesicle fuses completely and then becomes part of the plasma membrane from where it can then be endocytosed in a clathrin-dependent manner, and re-enter the vesicle cycle. The fastest forms of exocytosis and recycling are the “kiss and run” and “kiss and stay” types of vesicle recycling, which can occur on the 50 to 100 ms timescale.
Cellular Mechanisms of Brain Function
Synaptic vesicle cycle
10:20 21:36
Synaptic vesicle recycling
FIGURE 2
FIGURE 3
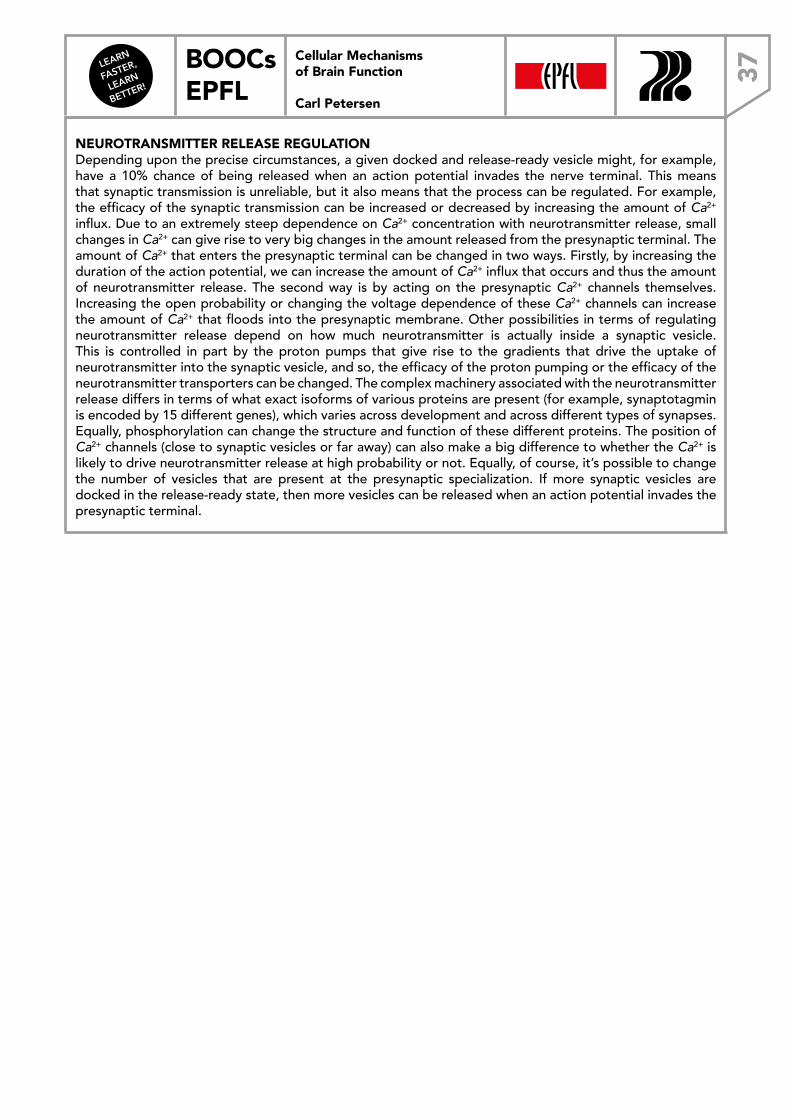
LEARN
FASTER,
LEARN
BETTER!
BOOCs EPFL 37
Cellular Mechanisms of Brain Function
Carl Petersen
NEUROTRANSMITTER RELEASE REGULATIONDepending upon the precise circumstances, a given docked and release-ready vesicle might, for example, have a 10% chance of being released when an action potential invades the nerve terminal. This means that synaptic transmission is unreliable, but it also means that the process can be regulated. For example, the efficacy of the synaptic transmission can be increased or decreased by increasing the amount of Ca2+ influx. Due to an extremely steep dependence on Ca2+ concentration with neurotransmitter release, small changes in Ca2+ can give rise to very big changes in the amount released from the presynaptic terminal. The amount of Ca2+ that enters the presynaptic terminal can be changed in two ways. Firstly, by increasing the duration of the action potential, we can increase the amount of Ca2+ influx that occurs and thus the amount of neurotransmitter release. The second way is by acting on the presynaptic Ca2+ channels themselves. Increasing the open probability or changing the voltage dependence of these Ca2+ channels can increase the amount of Ca2+ that floods into the presynaptic membrane. Other possibilities in terms of regulating neurotransmitter release depend on how much neurotransmitter is actually inside a synaptic vesicle. This is controlled in part by the proton pumps that give rise to the gradients that drive the uptake of neurotransmitter into the synaptic vesicle, and so, the efficacy of the proton pumping or the efficacy of the neurotransmitter transporters can be changed. The complex machinery associated with the neurotransmitter release differs in terms of what exact isoforms of various proteins are present (for example, synaptotagmin is encoded by 15 different genes), which varies across development and across different types of synapses. Equally, phosphorylation can change the structure and function of these different proteins. The position of Ca2+ channels (close to synaptic vesicles or far away) can also make a big difference to whether the Ca2+ is likely to drive neurotransmitter release at high probability or not. Equally, of course, it’s possible to change the number of vesicles that are present at the presynaptic specialization. If more synaptic vesicles are docked in the release-ready state, then more vesicles can be released when an action potential invades the presynaptic terminal.
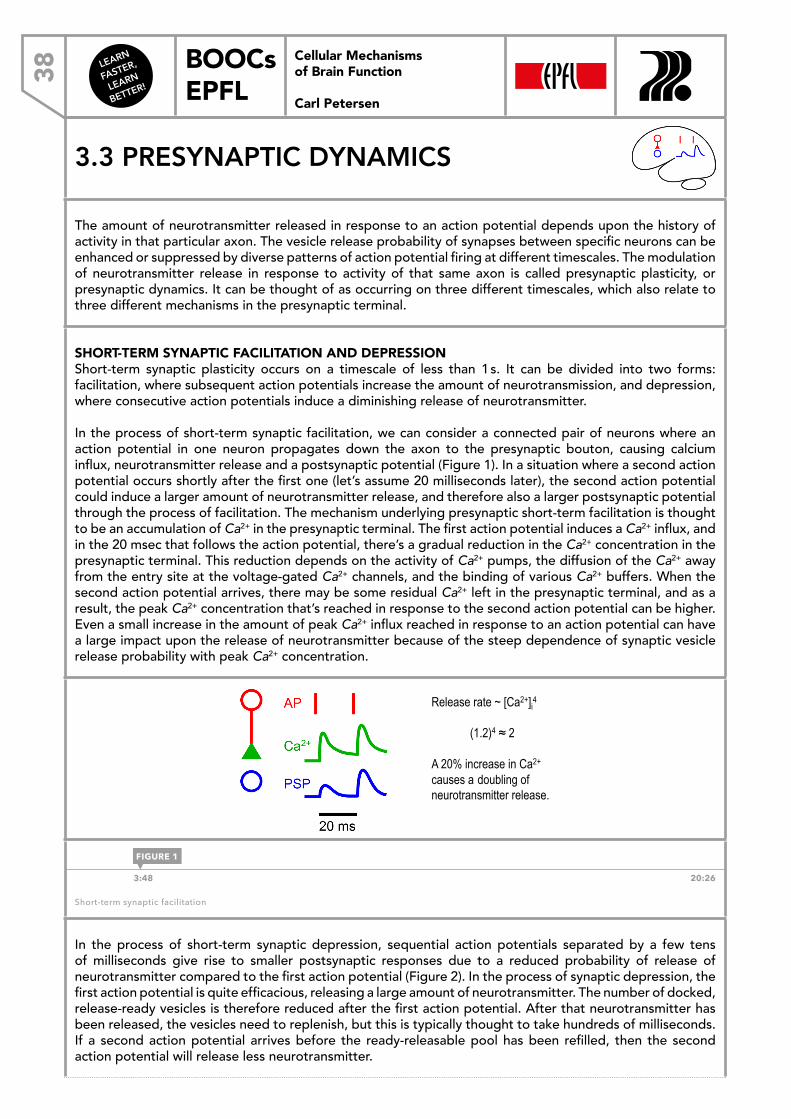
LEARN
FASTER,
LEARN
BETTER!
BOOCs EPFL38
Cellular Mechanisms of Brain Function
Carl Petersen
3.3 PRESYNAPTIC DYNAMICS
The amount of neurotransmitter released in response to an action potential depends upon the history of activity in that particular axon. The vesicle release probability of synapses between specific neurons can be enhanced or suppressed by diverse patterns of action potential firing at different timescales. The modulation of neurotransmitter release in response to activity of that same axon is called presynaptic plasticity, or presynaptic dynamics. It can be thought of as occurring on three different timescales, which also relate to three different mechanisms in the presynaptic terminal.
SHORT-TERM SYNAPTIC FACILITATION AND DEPRESSIONShort-term synaptic plasticity occurs on a timescale of less than 1 s. It can be divided into two forms: facilitation, where subsequent action potentials increase the amount of neurotransmission, and depression, where consecutive action potentials induce a diminishing release of neurotransmitter.
In the process of short-term synaptic facilitation, we can consider a connected pair of neurons where an action potential in one neuron propagates down the axon to the presynaptic bouton, causing calcium influx, neurotransmitter release and a postsynaptic potential (Figure 1). In a situation where a second action potential occurs shortly after the first one (let’s assume 20 milliseconds later), the second action potential could induce a larger amount of neurotransmitter release, and therefore also a larger postsynaptic potential through the process of facilitation. The mechanism underlying presynaptic short-term facilitation is thought to be an accumulation of Ca2+ in the presynaptic terminal. The first action potential induces a Ca2+ influx, and in the 20 msec that follows the action potential, there’s a gradual reduction in the Ca2+ concentration in the presynaptic terminal. This reduction depends on the activity of Ca2+ pumps, the diffusion of the Ca2+ away from the entry site at the voltage-gated Ca2+ channels, and the binding of various Ca2+ buffers. When the second action potential arrives, there may be some residual Ca2+ left in the presynaptic terminal, and as a result, the peak Ca2+ concentration that’s reached in response to the second action potential can be higher. Even a small increase in the amount of peak Ca2+ influx reached in response to an action potential can have a large impact upon the release of neurotransmitter because of the steep dependence of synaptic vesicle release probability with peak Ca2+ concentration.
Cellular Mechanisms of Brain Function
Short-term dynamics: Facilitation
Release rate ~ [Ca2+]i4
(1.2)4 ≈ 2
A 20% increase in Ca2+ causes a doubling of neurotransmitter release.
3:48 20:26
Short-term synaptic facilitation
In the process of short-term synaptic depression, sequential action potentials separated by a few tens of milliseconds give rise to smaller postsynaptic responses due to a reduced probability of release of neurotransmitter compared to the first action potential (Figure 2). In the process of synaptic depression, the first action potential is quite efficacious, releasing a large amount of neurotransmitter. The number of docked, release-ready vesicles is therefore reduced after the first action potential. After that neurotransmitter has been released, the vesicles need to replenish, but this is typically thought to take hundreds of milliseconds. If a second action potential arrives before the ready-releasable pool has been refilled, then the second action potential will release less neurotransmitter.
FIGURE 1
Cellular Mechanisms of Brain Function Prof. Carl Petersen
3.3 Presynaptic dynam
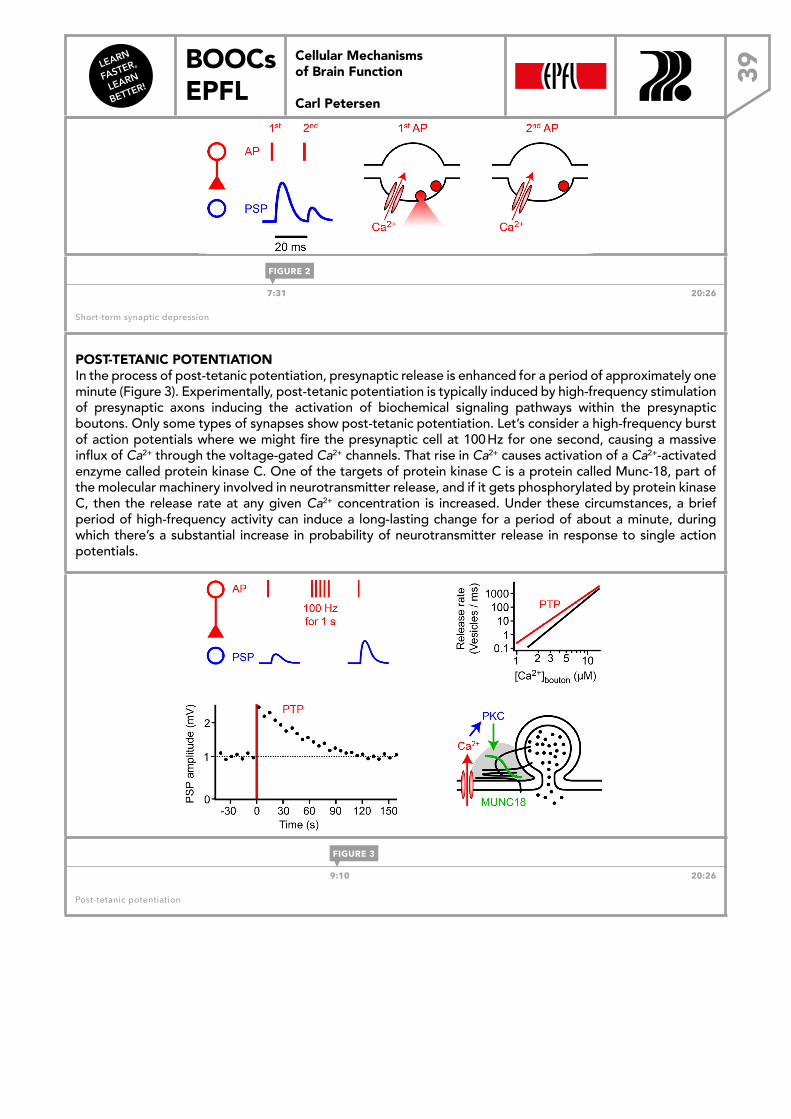
LEARN
FASTER,
LEARN
BETTER!
BOOCs EPFL 39
Cellular Mechanisms of Brain Function
Carl Petersen
Cellular Mechanisms of Brain Function
Short-term dynamics: Depression
7:31 20:26
Short-term synaptic depression
POST-TETANIC POTENTIATIONIn the process of post-tetanic potentiation, presynaptic release is enhanced for a period of approximately one minute (Figure 3). Experimentally, post-tetanic potentiation is typically induced by high-frequency stimulation of presynaptic axons inducing the activation of biochemical signaling pathways within the presynaptic boutons. Only some types of synapses show post-tetanic potentiation. Let’s consider a high-frequency burst of action potentials where we might fire the presynaptic cell at 100 Hz for one second, causing a massive influx of Ca2+ through the voltage-gated Ca2+ channels. That rise in Ca2+ causes activation of a Ca2+-activated enzyme called protein kinase C. One of the targets of protein kinase C is a protein called Munc-18, part of the molecular machinery involved in neurotransmitter release, and if it gets phosphorylated by protein kinase C, then the release rate at any given Ca2+ concentration is increased. Under these circumstances, a brief period of high-frequency activity can induce a long-lasting change for a period of about a minute, during which there’s a substantial increase in probability of neurotransmitter release in response to single action potentials.
Cellular Mechanisms of Brain Function
Post-tetanic potentiation
9:10 20:26
Post-tetanic potentiation
FIGURE 2
FIGURE 3
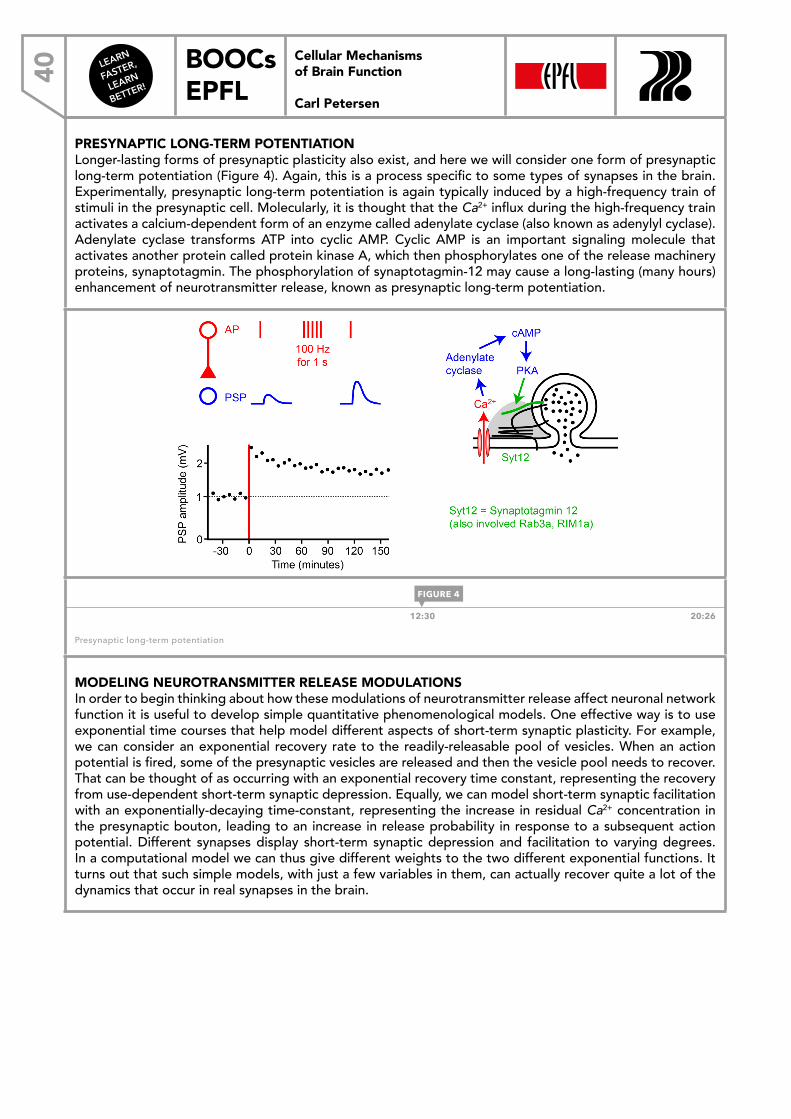
LEARN
FASTER,
LEARN
BETTER!
BOOCs EPFL40
Cellular Mechanisms of Brain Function
Carl Petersen
PRESYNAPTIC LONG-TERM POTENTIATIONLonger-lasting forms of presynaptic plasticity also exist, and here we will consider one form of presynaptic long-term potentiation (Figure 4). Again, this is a process specific to some types of synapses in the brain. Experimentally, presynaptic long-term potentiation is again typically induced by a high-frequency train of stimuli in the presynaptic cell. Molecularly, it is thought that the Ca2+ influx during the high-frequency train activates a calcium-dependent form of an enzyme called adenylate cyclase (also known as adenylyl cyclase). Adenylate cyclase transforms ATP into cyclic AMP. Cyclic AMP is an important signaling molecule that activates another protein called protein kinase A, which then phosphorylates one of the release machinery proteins, synaptotagmin. The phosphorylation of synaptotagmin-12 may cause a long-lasting (many hours) enhancement of neurotransmitter release, known as presynaptic long-term potentiation.
Cellular Mechanisms of Brain Function
Presynaptic long-term potentiation
12:30 20:26
Presynaptic long-term potentiation
MODELING NEUROTRANSMITTER RELEASE MODULATIONSIn order to begin thinking about how these modulations of neurotransmitter release affect neuronal network function it is useful to develop simple quantitative phenomenological models. One effective way is to use exponential time courses that help model different aspects of short-term synaptic plasticity. For example, we can consider an exponential recovery rate to the readily-releasable pool of vesicles. When an action potential is fired, some of the presynaptic vesicles are released and then the vesicle pool needs to recover. That can be thought of as occurring with an exponential recovery time constant, representing the recovery from use-dependent short-term synaptic depression. Equally, we can model short-term synaptic facilitation with an exponentially-decaying time-constant, representing the increase in residual Ca2+ concentration in the presynaptic bouton, leading to an increase in release probability in response to a subsequent action potential. Different synapses display short-term synaptic depression and facilitation to varying degrees. In a computational model we can thus give different weights to the two different exponential functions. It turns out that such simple models, with just a few variables in them, can actually recover quite a lot of the dynamics that occur in real synapses in the brain.
FIGURE 4
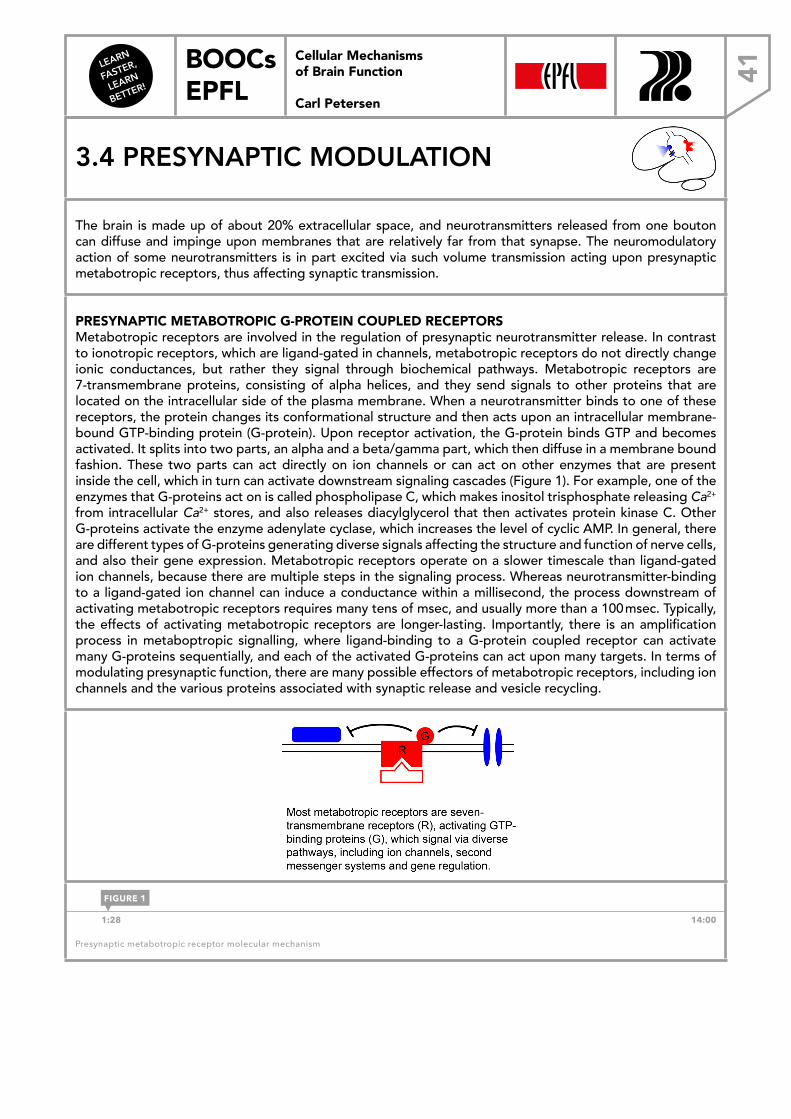
LEARN
FASTER,
LEARN
BETTER!
BOOCs EPFL 41
Cellular Mechanisms of Brain Function
Carl Petersen
3.4 PRESYNAPTIC MODULATION
The brain is made up of about 20% extracellular space, and neurotransmitters released from one bouton can diffuse and impinge upon membranes that are relatively far from that synapse. The neuromodulatory action of some neurotransmitters is in part excited via such volume transmission acting upon presynaptic metabotropic receptors, thus affecting synaptic transmission.
PRESYNAPTIC METABOTROPIC G-PROTEIN COUPLED RECEPTORSMetabotropic receptors are involved in the regulation of presynaptic neurotransmitter release. In contrast to ionotropic receptors, which are ligand-gated in channels, metabotropic receptors do not directly change ionic conductances, but rather they signal through biochemical pathways. Metabotropic receptors are 7-transmembrane proteins, consisting of alpha helices, and they send signals to other proteins that are located on the intracellular side of the plasma membrane. When a neurotransmitter binds to one of these receptors, the protein changes its conformational structure and then acts upon an intracellular membrane-bound GTP-binding protein (G-protein). Upon receptor activation, the G-protein binds GTP and becomes activated. It splits into two parts, an alpha and a beta/gamma part, which then diffuse in a membrane bound fashion. These two parts can act directly on ion channels or can act on other enzymes that are present inside the cell, which in turn can activate downstream signaling cascades (Figure 1). For example, one of the enzymes that G-proteins act on is called phospholipase C, which makes inositol trisphosphate releasing Ca2+ from intracellular Ca2+ stores, and also releases diacylglycerol that then activates protein kinase C. Other G-proteins activate the enzyme adenylate cyclase, which increases the level of cyclic AMP. In general, there are different types of G-proteins generating diverse signals affecting the structure and function of nerve cells, and also their gene expression. Metabotropic receptors operate on a slower timescale than ligand-gated ion channels, because there are multiple steps in the signaling process. Whereas neurotransmitter-binding to a ligand-gated ion channel can induce a conductance within a millisecond, the process downstream of activating metabotropic receptors requires many tens of msec, and usually more than a 100 msec. Typically, the effects of activating metabotropic receptors are longer-lasting. Importantly, there is an amplification process in metaboptropic signalling, where ligand-binding to a G-protein coupled receptor can activate many G-proteins sequentially, and each of the activated G-proteins can act upon many targets. In terms of modulating presynaptic function, there are many possible effectors of metabotropic receptors, including ion channels and the various proteins associated with synaptic release and vesicle recycling.
Cellular Mechanisms of Brain Function
Presynaptic metabotropic receptors
1:28 14:00
Presynaptic metabotropic receptor molecular mechanism
FIGURE 1
Cellular Mechanisms of Brain Function Prof. Carl Petersen
3.4 Presynaptic mod
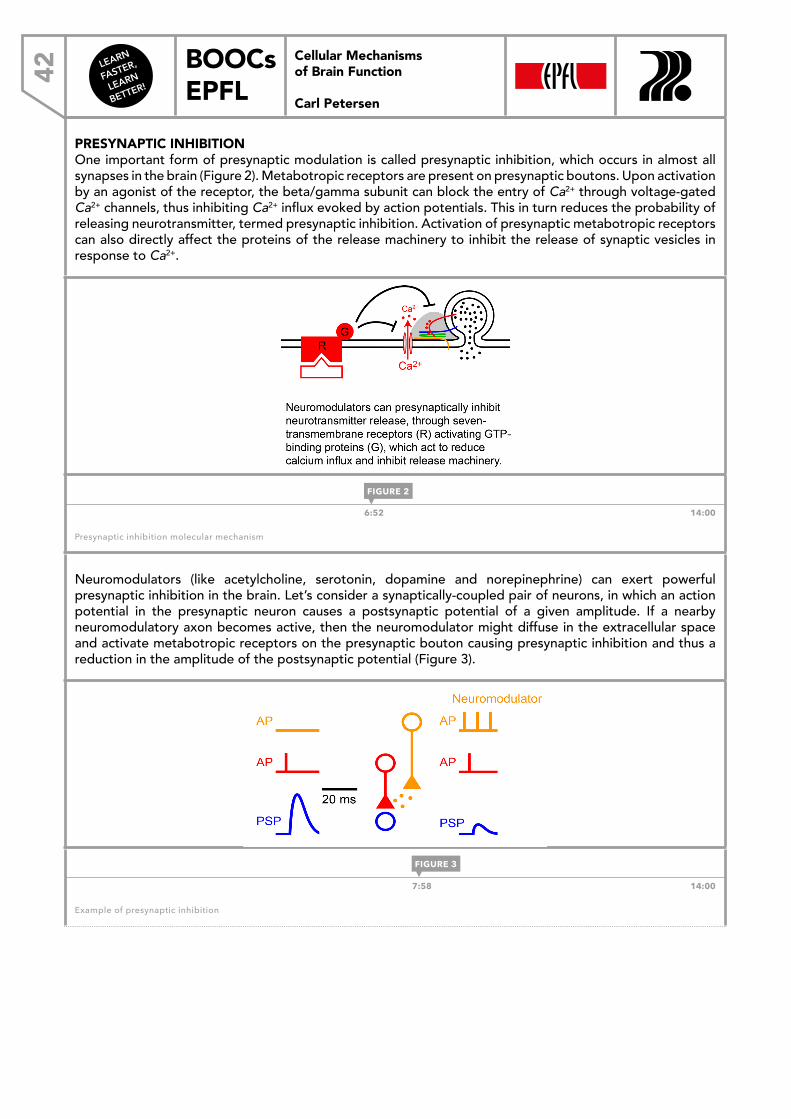
LEARN
FASTER,
LEARN
BETTER!
BOOCs EPFL42
Cellular Mechanisms of Brain Function
Carl Petersen
PRESYNAPTIC INHIBITIONOne important form of presynaptic modulation is called presynaptic inhibition, which occurs in almost all synapses in the brain (Figure 2). Metabotropic receptors are present on presynaptic boutons. Upon activation by an agonist of the receptor, the beta/gamma subunit can block the entry of Ca2+ through voltage-gated Ca2+ channels, thus inhibiting Ca2+ influx evoked by action potentials. This in turn reduces the probability of releasing neurotransmitter, termed presynaptic inhibition. Activation of presynaptic metabotropic receptors can also directly affect the proteins of the release machinery to inhibit the release of synaptic vesicles in response to Ca2+.
Cellular Mechanisms of Brain Function
Presynaptic inhibition
6:52 14:00
Presynaptic inhibition molecular mechanism
Neuromodulators (like acetylcholine, serotonin, dopamine and norepinephrine) can exert powerful presynaptic inhibition in the brain. Let’s consider a synaptically-coupled pair of neurons, in which an action potential in the presynaptic neuron causes a postsynaptic potential of a given amplitude. If a nearby neuromodulatory axon becomes active, then the neuromodulator might diffuse in the extracellular space and activate metabotropic receptors on the presynaptic bouton causing presynaptic inhibition and thus a reduction in the amplitude of the postsynaptic potential (Figure 3).
Cellular Mechanisms of Brain Function
Presynaptic inhibition
7:58 14:00
Example of presynaptic inhibition
FIGURE 2
FIGURE 3
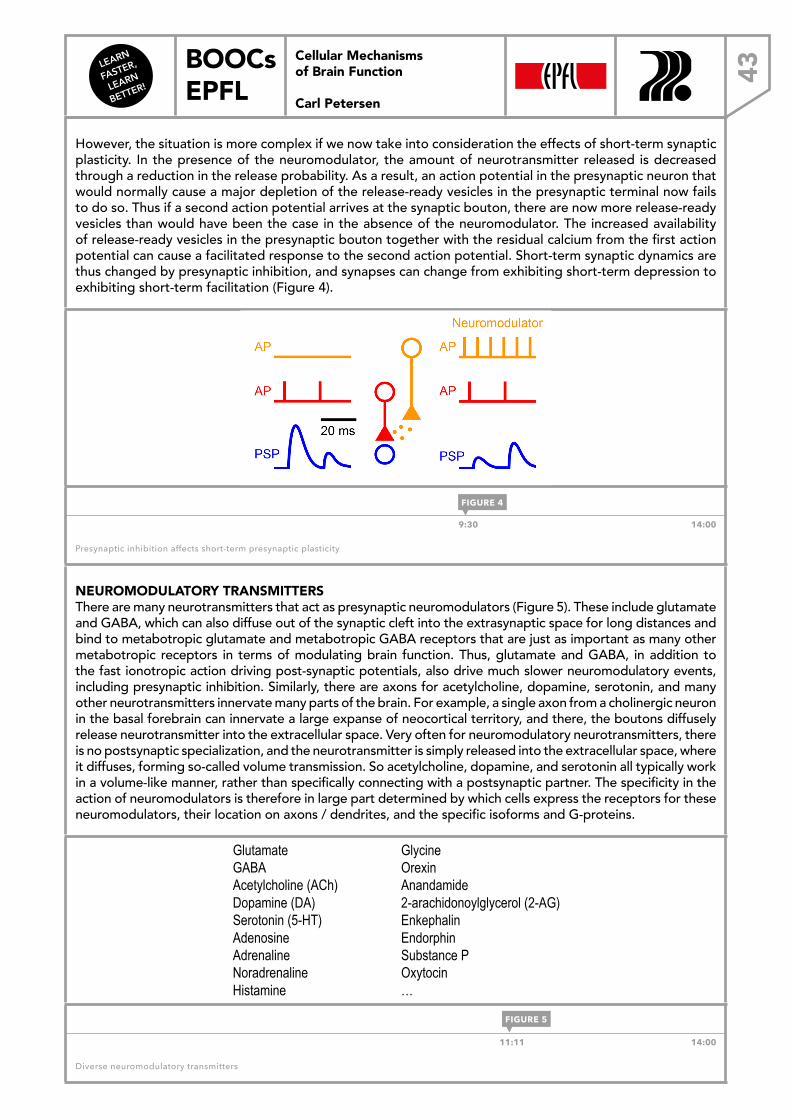
LEARN
FASTER,
LEARN
BETTER!
BOOCs EPFL 43
Cellular Mechanisms of Brain Function
Carl Petersen
However, the situation is more complex if we now take into consideration the effects of short-term synaptic plasticity. In the presence of the neuromodulator, the amount of neurotransmitter released is decreased through a reduction in the release probability. As a result, an action potential in the presynaptic neuron that would normally cause a major depletion of the release-ready vesicles in the presynaptic terminal now fails to do so. Thus if a second action potential arrives at the synaptic bouton, there are now more release-ready vesicles than would have been the case in the absence of the neuromodulator. The increased availability of release-ready vesicles in the presynaptic bouton together with the residual calcium from the first action potential can cause a facilitated response to the second action potential. Short-term synaptic dynamics are thus changed by presynaptic inhibition, and synapses can change from exhibiting short-term depression to exhibiting short-term facilitation (Figure 4).
Cellular Mechanisms of Brain Function
Presynaptic inhibition affects dynamics
9:30 14:00
Presynaptic inhibition affects short-term presynaptic plasticity
NEUROMODULATORY TRANSMITTERSThere are many neurotransmitters that act as presynaptic neuromodulators (Figure 5). These include glutamate and GABA, which can also diffuse out of the synaptic cleft into the extrasynaptic space for long distances and bind to metabotropic glutamate and metabotropic GABA receptors that are just as important as many other metabotropic receptors in terms of modulating brain function. Thus, glutamate and GABA, in addition to the fast ionotropic action driving post-synaptic potentials, also drive much slower neuromodulatory events, including presynaptic inhibition. Similarly, there are axons for acetylcholine, dopamine, serotonin, and many other neurotransmitters innervate many parts of the brain. For example, a single axon from a cholinergic neuron in the basal forebrain can innervate a large expanse of neocortical territory, and there, the boutons diffusely release neurotransmitter into the extracellular space. Very often for neuromodulatory neurotransmitters, there is no postsynaptic specialization, and the neurotransmitter is simply released into the extracellular space, where it diffuses, forming so-called volume transmission. So acetylcholine, dopamine, and serotonin all typically work in a volume-like manner, rather than specifically connecting with a postsynaptic partner. The specificity in the action of neuromodulators is therefore in large part determined by which cells express the receptors for these neuromodulators, their location on axons / dendrites, and the specific isoforms and G-proteins.
Cellular Mechanisms of Brain Function
Neuromodulatory transmitters
Glutamate GABA Acetylcholine (ACh) Dopamine (DA) Serotonin (5-HT) Adenosine Adrenaline Noradrenaline Histamine
Glycine Orexin Anandamide 2-arachidonoylglycerol (2-AG) Enkephalin Endorphin Substance P Oxytocin …
11:11 14:00
Diverse neuromodulatory transmitters
FIGURE 4
FIGURE 5
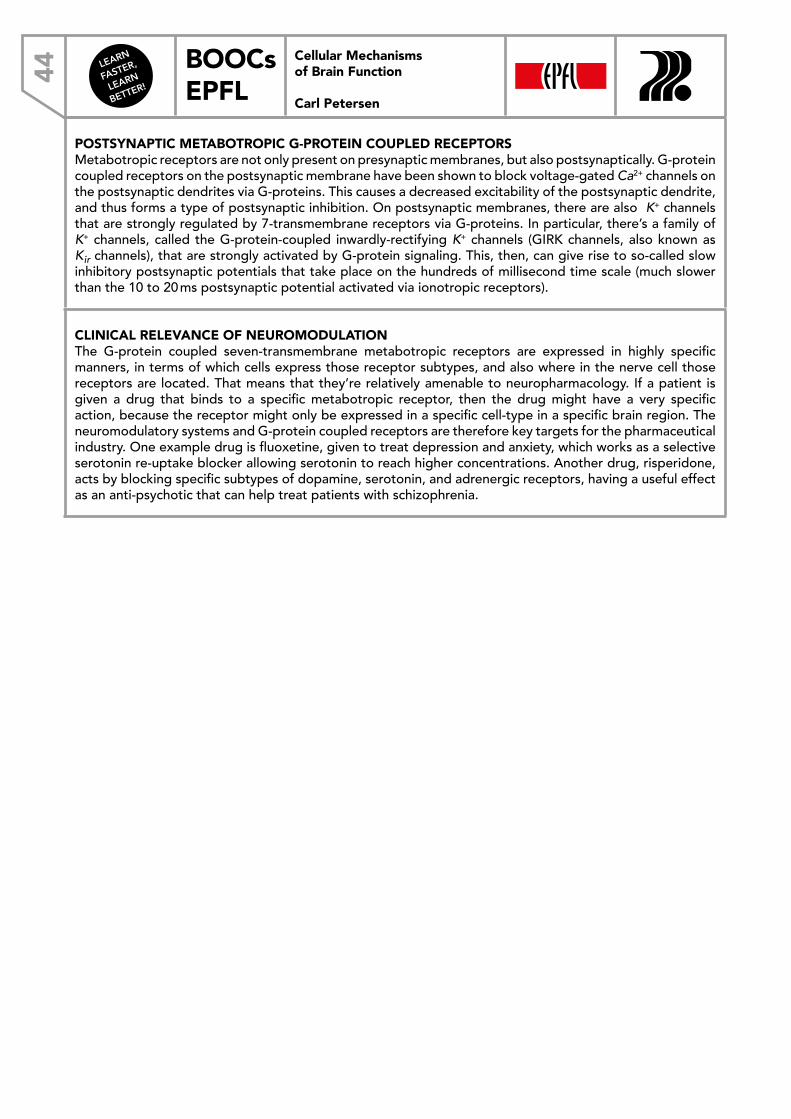
LEARN
FASTER,
LEARN
BETTER!
BOOCs EPFL44
Cellular Mechanisms of Brain Function
Carl Petersen
POSTSYNAPTIC METABOTROPIC G-PROTEIN COUPLED RECEPTORSMetabotropic receptors are not only present on presynaptic membranes, but also postsynaptically. G-protein coupled receptors on the postsynaptic membrane have been shown to block voltage-gated Ca2+ channels on the postsynaptic dendrites via G-proteins. This causes a decreased excitability of the postsynaptic dendrite, and thus forms a type of postsynaptic inhibition. On postsynaptic membranes, there are also K+ channels that are strongly regulated by 7-transmembrane receptors via G-proteins. In particular, there’s a family of K+ channels, called the G-protein-coupled inwardly-rectifying K+ channels (GIRK channels, also known as Kir channels), that are strongly activated by G-protein signaling. This, then, can give rise to so-called slow inhibitory postsynaptic potentials that take place on the hundreds of millisecond time scale (much slower than the 10 to 20 ms postsynaptic potential activated via ionotropic receptors).
CLINICAL RELEVANCE OF NEUROMODULATIONThe G-protein coupled seven-transmembrane metabotropic receptors are expressed in highly specific manners, in terms of which cells express those receptor subtypes, and also where in the nerve cell those receptors are located. That means that they’re relatively amenable to neuropharmacology. If a patient is given a drug that binds to a specific metabotropic receptor, then the drug might have a very specific action, because the receptor might only be expressed in a specific cell-type in a specific brain region. The neuromodulatory systems and G-protein coupled receptors are therefore key targets for the pharmaceutical industry. One example drug is fluoxetine, given to treat depression and anxiety, which works as a selective serotonin re-uptake blocker allowing serotonin to reach higher concentrations. Another drug, risperidone, acts by blocking specific subtypes of dopamine, serotonin, and adrenergic receptors, having a useful effect as an anti-psychotic that can help treat patients with schizophrenia.
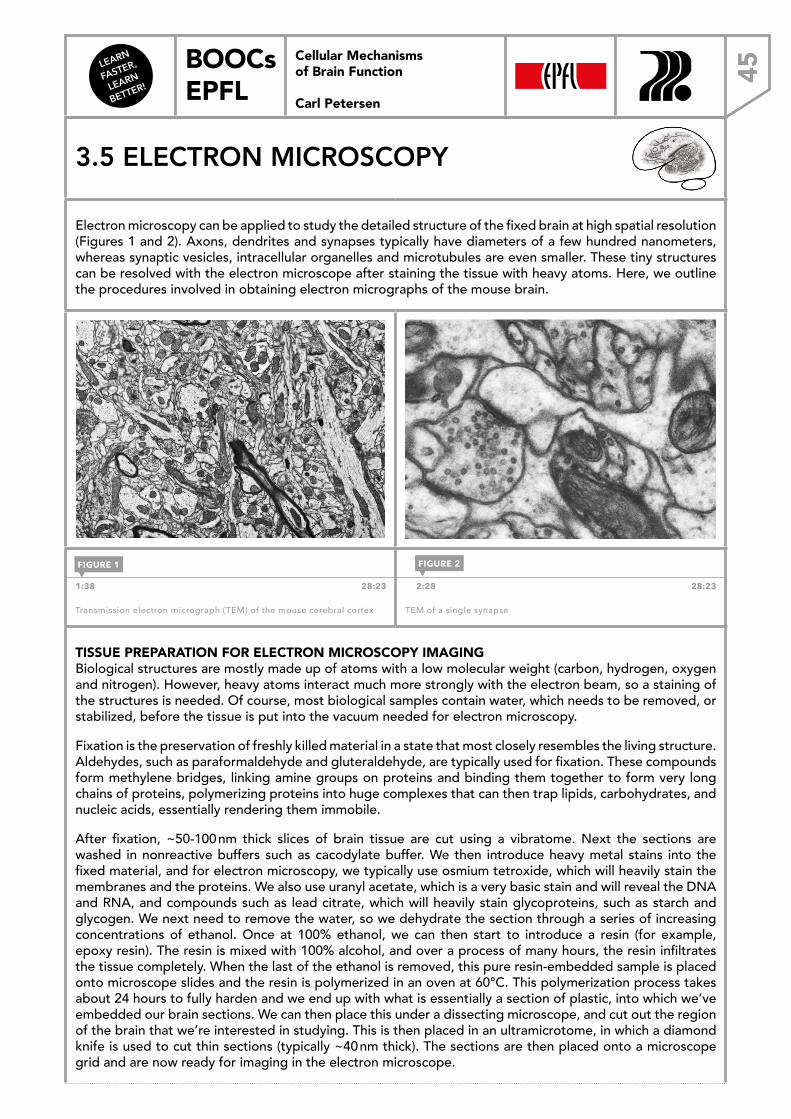
LEARN
FASTER,
LEARN
BETTER!
BOOCs EPFL 45
Cellular Mechanisms of Brain Function
Carl Petersen
3.5 ELECTRON MICROSCOPY
Electron microscopy can be applied to study the detailed structure of the fixed brain at high spatial resolution (Figures 1 and 2). Axons, dendrites and synapses typically have diameters of a few hundred nanometers, whereas synaptic vesicles, intracellular organelles and microtubules are even smaller. These tiny structures can be resolved with the electron microscope after staining the tissue with heavy atoms. Here, we outline the procedures involved in obtaining electron micrographs of the mouse brain.
Cellular Mechanisms of Brain Function
Transmission electron micrograph of mouse cerebral cortex
Imaging neuronal structure - electron microscopy
Cellular Mechanisms of Brain Function
TEM of a single synaptic connection
Imaging neuronal structure - electron microscopy
1:38 28:23
Transmission electron micrograph (TEM) of the mouse cerebral cortex
2:28 28:23
TEM of a single synapse
TISSUE PREPARATION FOR ELECTRON MICROSCOPY IMAGING Biological structures are mostly made up of atoms with a low molecular weight (carbon, hydrogen, oxygen and nitrogen). However, heavy atoms interact much more strongly with the electron beam, so a staining of the structures is needed. Of course, most biological samples contain water, which needs to be removed, or stabilized, before the tissue is put into the vacuum needed for electron microscopy.
Fixation is the preservation of freshly killed material in a state that most closely resembles the living structure. Aldehydes, such as paraformaldehyde and gluteraldehyde, are typically used for fixation. These compounds form methylene bridges, linking amine groups on proteins and binding them together to form very long chains of proteins, polymerizing proteins into huge complexes that can then trap lipids, carbohydrates, and nucleic acids, essentially rendering them immobile.
After fixation, ~50-100 nm thick slices of brain tissue are cut using a vibratome. Next the sections are washed in nonreactive buffers such as cacodylate buffer. We then introduce heavy metal stains into the fixed material, and for electron microscopy, we typically use osmium tetroxide, which will heavily stain the membranes and the proteins. We also use uranyl acetate, which is a very basic stain and will reveal the DNA and RNA, and compounds such as lead citrate, which will heavily stain glycoproteins, such as starch and glycogen. We next need to remove the water, so we dehydrate the section through a series of increasing concentrations of ethanol. Once at 100% ethanol, we can then start to introduce a resin (for example, epoxy resin). The resin is mixed with 100% alcohol, and over a process of many hours, the resin infiltrates the tissue completely. When the last of the ethanol is removed, this pure resin-embedded sample is placed onto microscope slides and the resin is polymerized in an oven at 60℃. This polymerization process takes about 24 hours to fully harden and we end up with what is essentially a section of plastic, into which we’ve embedded our brain sections. We can then place this under a dissecting microscope, and cut out the region of the brain that we’re interested in studying. This is then placed in an ultramicrotome, in which a diamond knife is used to cut thin sections (typically ~40 nm thick). The sections are then placed onto a microscope grid and are now ready for imaging in the electron microscope.
FIGURE 1 FIGURE 2
Cellular Mechanisms of Brain FuncGraham Knott
3.5 Electron microsc
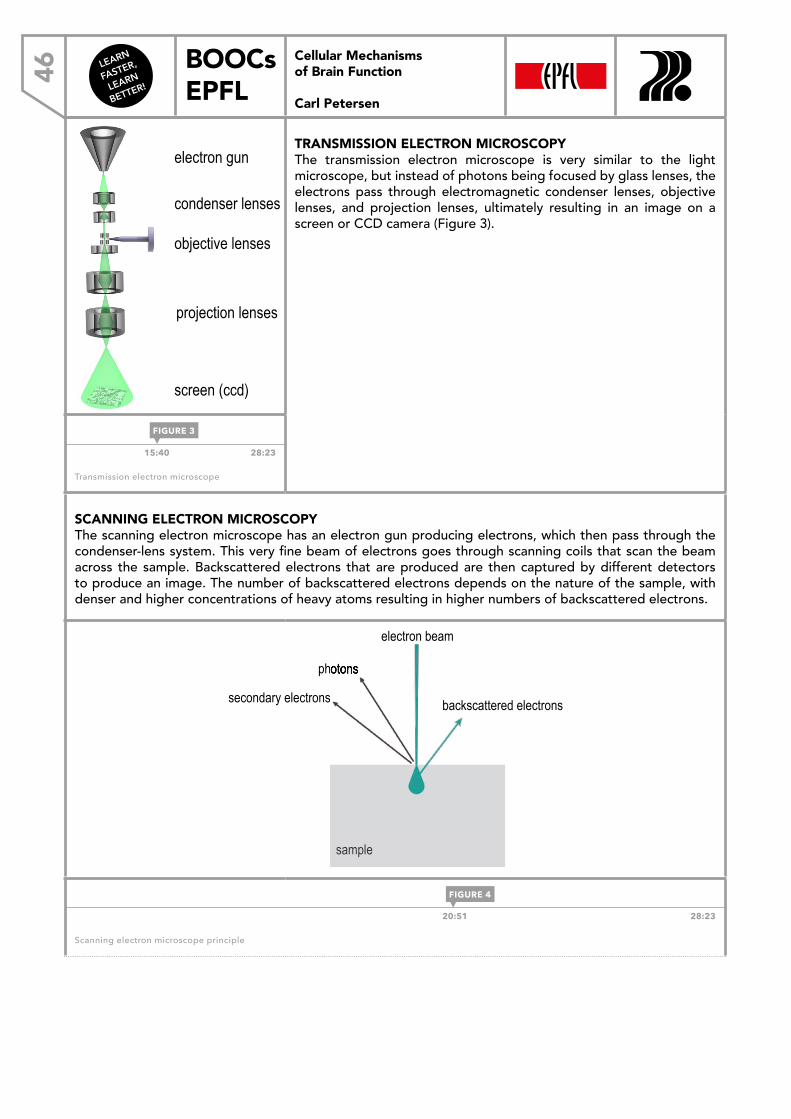
LEARN
FASTER,
LEARN
BETTER!
BOOCs EPFL46
Cellular Mechanisms of Brain Function
Carl Petersen
Cellular Mechanisms of Brain Function
electron gun
condenser lenses
objective lenses
projection lenses
screen (ccd)
Transmission electron microscope
TRANSMISSION ELECTRON MICROSCOPYThe transmission electron microscope is very similar to the light microscope, but instead of photons being focused by glass lenses, the electrons pass through electromagnetic condenser lenses, objective lenses, and projection lenses, ultimately resulting in an image on a screen or CCD camera (Figure 3).
15:40 28:23
Transmission electron microscope
SCANNING ELECTRON MICROSCOPYThe scanning electron microscope has an electron gun producing electrons, which then pass through the condenser-lens system. This very fine beam of electrons goes through scanning coils that scan the beam across the sample. Backscattered electrons that are produced are then captured by different detectors to produce an image. The number of backscattered electrons depends on the nature of the sample, with denser and higher concentrations of heavy atoms resulting in higher numbers of backscattered electrons.
Cellular Mechanisms of Brain Function
Scanning electron microscope
electron beam
secondary electrons
photons
sample
backscattered electrons
sample
20:51 28:23
Scanning electron microscope principle
FIGURE 3
FIGURE 4
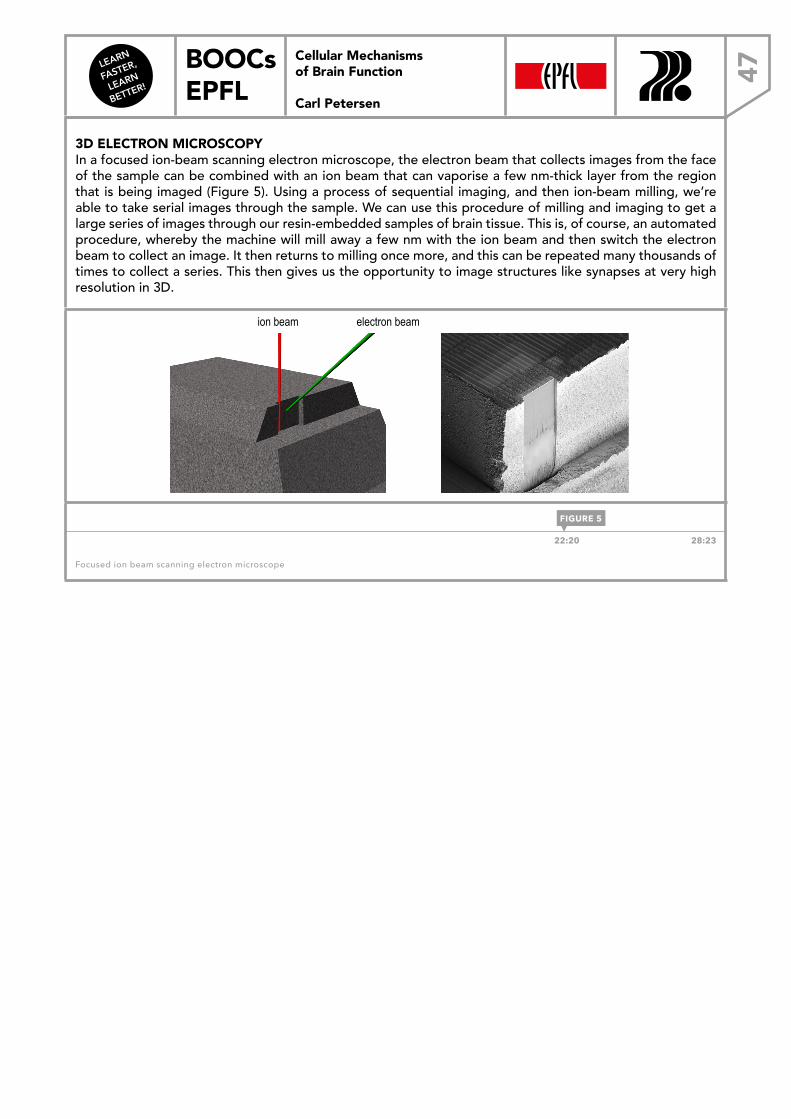
LEARN
FASTER,
LEARN
BETTER!
BOOCs EPFL 47
Cellular Mechanisms of Brain Function
Carl Petersen
3D ELECTRON MICROSCOPYIn a focused ion-beam scanning electron microscope, the electron beam that collects images from the face of the sample can be combined with an ion beam that can vaporise a few nm-thick layer from the region that is being imaged (Figure 5). Using a process of sequential imaging, and then ion-beam milling, we’re able to take serial images through the sample. We can use this procedure of milling and imaging to get a large series of images through our resin-embedded samples of brain tissue. This is, of course, an automated procedure, whereby the machine will mill away a few nm with the ion beam and then switch the electron beam to collect an image. It then returns to milling once more, and this can be repeated many thousands of times to collect a series. This then gives us the opportunity to image structures like synapses at very high resolution in 3D.
Cellular Mechanisms of Brain Function
electron beam ion beam
Block face scanning electron microscope
Focussed ion beam scanning electron microscope 22:20 28:23
Focused ion beam scanning electron microscope
FIGURE 5
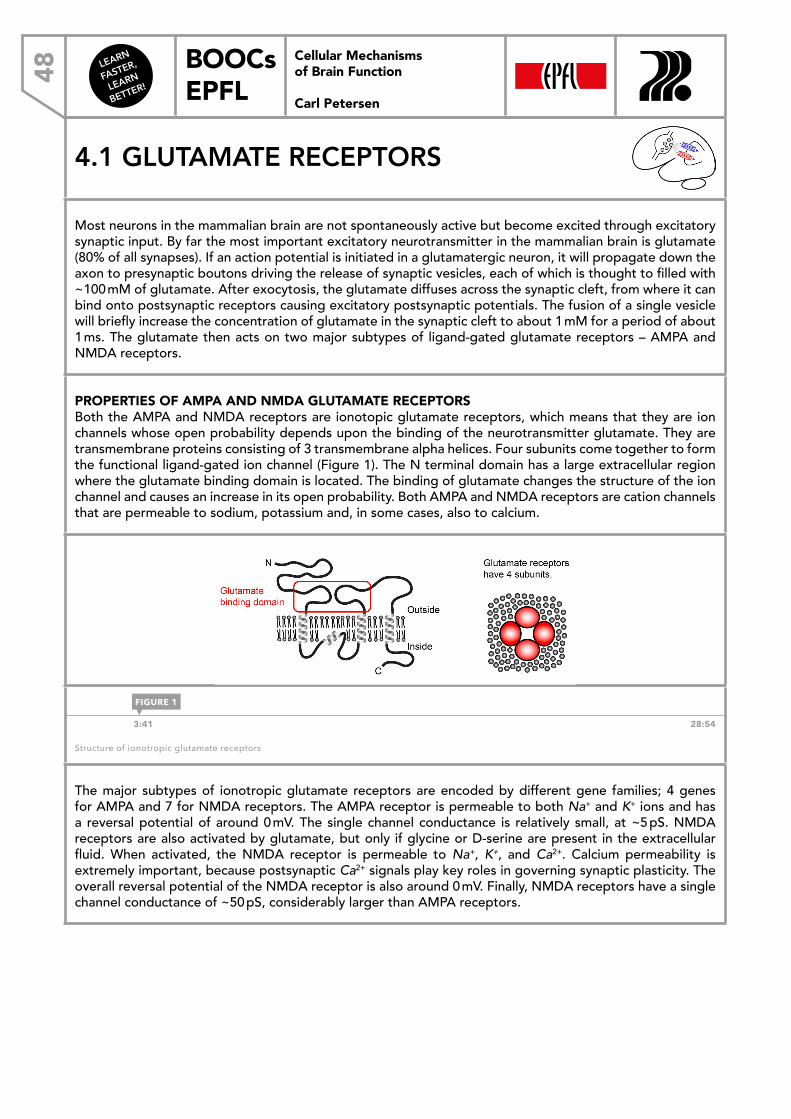
LEARN
FASTER,
LEARN
BETTER!
BOOCs EPFL48
Cellular Mechanisms of Brain Function
Carl Petersen
4.1 GLUTAMATE RECEPTORS
Most neurons in the mammalian brain are not spontaneously active but become excited through excitatory synaptic input. By far the most important excitatory neurotransmitter in the mammalian brain is glutamate (80% of all synapses). If an action potential is initiated in a glutamatergic neuron, it will propagate down the axon to presynaptic boutons driving the release of synaptic vesicles, each of which is thought to filled with ~100 mM of glutamate. After exocytosis, the glutamate diffuses across the synaptic cleft, from where it can bind onto postsynaptic receptors causing excitatory postsynaptic potentials. The fusion of a single vesicle will briefly increase the concentration of glutamate in the synaptic cleft to about 1 mM for a period of about 1 ms. The glutamate then acts on two major subtypes of ligand-gated glutamate receptors – AMPA and NMDA receptors.
PROPERTIES OF AMPA AND NMDA GLUTAMATE RECEPTORSBoth the AMPA and NMDA receptors are ionotopic glutamate receptors, which means that they are ion channels whose open probability depends upon the binding of the neurotransmitter glutamate. They are transmembrane proteins consisting of 3 transmembrane alpha helices. Four subunits come together to form the functional ligand-gated ion channel (Figure 1). The N terminal domain has a large extracellular region where the glutamate binding domain is located. The binding of glutamate changes the structure of the ion channel and causes an increase in its open probability. Both AMPA and NMDA receptors are cation channels that are permeable to sodium, potassium and, in some cases, also to calcium.
Cellular Mechanisms of Brain Function
Ionotropic glutamate receptors: structure
3:41 28:54
Structure of ionotropic glutamate receptors
The major subtypes of ionotropic glutamate receptors are encoded by different gene families; 4 genes for AMPA and 7 for NMDA receptors. The AMPA receptor is permeable to both Na+ and K+ ions and has a reversal potential of around 0 mV. The single channel conductance is relatively small, at ~5 pS. NMDA receptors are also activated by glutamate, but only if glycine or D-serine are present in the extracellular fluid. When activated, the NMDA receptor is permeable to Na+, K+, and Ca2+. Calcium permeability is extremely important, because postsynaptic Ca2+ signals play key roles in governing synaptic plasticity. The overall reversal potential of the NMDA receptor is also around 0 mV. Finally, NMDA receptors have a single channel conductance of ~50 pS, considerably larger than AMPA receptors.
FIGURE 1
Cellular Mechanisms of Brain Function Prof. Carl Petersen
4.1 Glutamate receptors
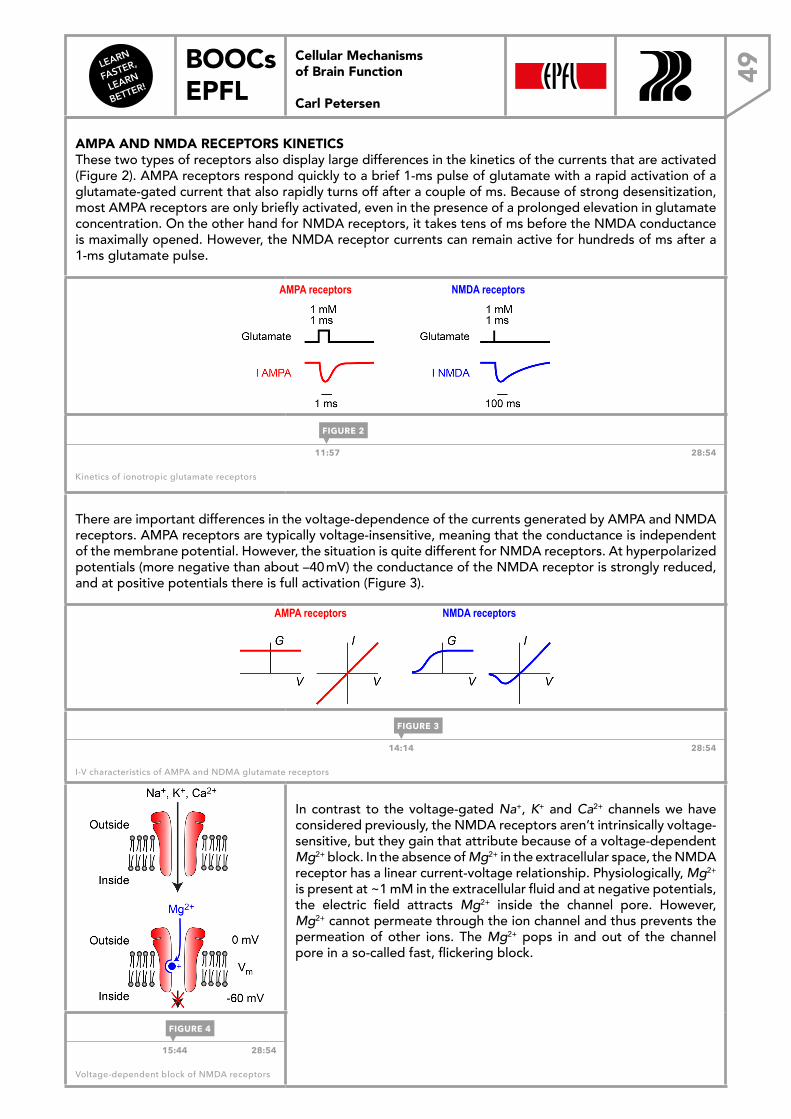
LEARN
FASTER,
LEARN
BETTER!
BOOCs EPFL 49
Cellular Mechanisms of Brain Function
Carl Petersen
AMPA AND NMDA RECEPTORS KINETICSThese two types of receptors also display large differences in the kinetics of the currents that are activated (Figure 2). AMPA receptors respond quickly to a brief 1-ms pulse of glutamate with a rapid activation of a glutamate-gated current that also rapidly turns off after a couple of ms. Because of strong desensitization, most AMPA receptors are only briefly activated, even in the presence of a prolonged elevation in glutamate concentration. On the other hand for NMDA receptors, it takes tens of ms before the NMDA conductance is maximally opened. However, the NMDA receptor currents can remain active for hundreds of ms after a 1-ms glutamate pulse.
Cellular Mechanisms of Brain Function
Ionotropic glutamate receptors: kinetics
AMPA receptors NMDA receptors
11:57 28:54
Kinetics of ionotropic glutamate receptors
There are important differences in the voltage-dependence of the currents generated by AMPA and NMDA receptors. AMPA receptors are typically voltage-insensitive, meaning that the conductance is independent of the membrane potential. However, the situation is quite different for NMDA receptors. At hyperpolarized potentials (more negative than about –40 mV) the conductance of the NMDA receptor is strongly reduced, and at positive potentials there is full activation (Figure 3).
Cellular Mechanisms of Brain Function
Ionotropic glutamate receptors: I–V relationship
AMPA receptors NMDA receptors
14:14 28:54
I-V characteristics of AMPA and NDMA glutamate receptors
In contrast to the voltage-gated Na+, K+ and Ca2+ channels we have considered previously, the NMDA receptors aren’t intrinsically voltage-sensitive, but they gain that attribute because of a voltage-dependent Mg2+ block. In the absence of Mg2+ in the extracellular space, the NMDA receptor has a linear current-voltage relationship. Physiologically, Mg2+ is present at ~1 mM in the extracellular fluid and at negative potentials, the electric field attracts Mg2+ inside the channel pore. However, Mg2+ cannot permeate through the ion channel and thus prevents the permeation of other ions. The Mg2+ pops in and out of the channel pore in a so-called fast, flickering block.
15:44 28:54
Voltage-dependent block of NMDA receptors
FIGURE 2
FIGURE 3
FIGURE 4
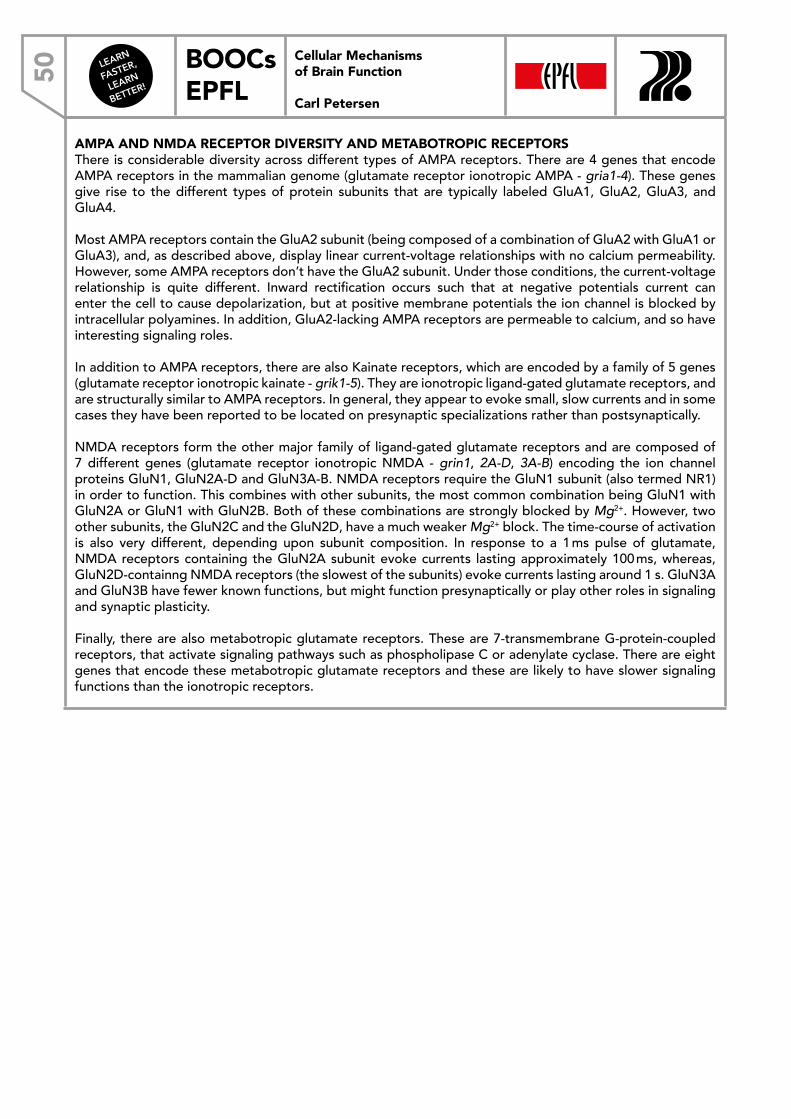
LEARN
FASTER,
LEARN
BETTER!
BOOCs EPFL50
Cellular Mechanisms of Brain Function
Carl Petersen
AMPA AND NMDA RECEPTOR DIVERSITY AND METABOTROPIC RECEPTORSThere is considerable diversity across different types of AMPA receptors. There are 4 genes that encode AMPA receptors in the mammalian genome (glutamate receptor ionotropic AMPA - gria1-4). These genes give rise to the different types of protein subunits that are typically labeled GluA1, GluA2, GluA3, and GluA4.
Most AMPA receptors contain the GluA2 subunit (being composed of a combination of GluA2 with GluA1 or GluA3), and, as described above, display linear current-voltage relationships with no calcium permeability. However, some AMPA receptors don’t have the GluA2 subunit. Under those conditions, the current-voltage relationship is quite different. Inward rectification occurs such that at negative potentials current can enter the cell to cause depolarization, but at positive membrane potentials the ion channel is blocked by intracellular polyamines. In addition, GluA2-lacking AMPA receptors are permeable to calcium, and so have interesting signaling roles.
In addition to AMPA receptors, there are also Kainate receptors, which are encoded by a family of 5 genes (glutamate receptor ionotropic kainate - grik1-5). They are ionotropic ligand-gated glutamate receptors, and are structurally similar to AMPA receptors. In general, they appear to evoke small, slow currents and in some cases they have been reported to be located on presynaptic specializations rather than postsynaptically.
NMDA receptors form the other major family of ligand-gated glutamate receptors and are composed of 7 different genes (glutamate receptor ionotropic NMDA - grin1, 2A-D, 3A-B) encoding the ion channel proteins GluN1, GluN2A-D and GluN3A-B. NMDA receptors require the GluN1 subunit (also termed NR1) in order to function. This combines with other subunits, the most common combination being GluN1 with GluN2A or GluN1 with GluN2B. Both of these combinations are strongly blocked by Mg2+. However, two other subunits, the GluN2C and the GluN2D, have a much weaker Mg2+ block. The time-course of activation is also very different, depending upon subunit composition. In response to a 1 ms pulse of glutamate, NMDA receptors containing the GluN2A subunit evoke currents lasting approximately 100 ms, whereas, GluN2D-containng NMDA receptors (the slowest of the subunits) evoke currents lasting around 1 s. GluN3A and GluN3B have fewer known functions, but might function presynaptically or play other roles in signaling and synaptic plasticity.
Finally, there are also metabotropic glutamate receptors. These are 7-transmembrane G-protein-coupled receptors, that activate signaling pathways such as phospholipase C or adenylate cyclase. There are eight genes that encode these metabotropic glutamate receptors and these are likely to have slower signaling functions than the ionotropic receptors.
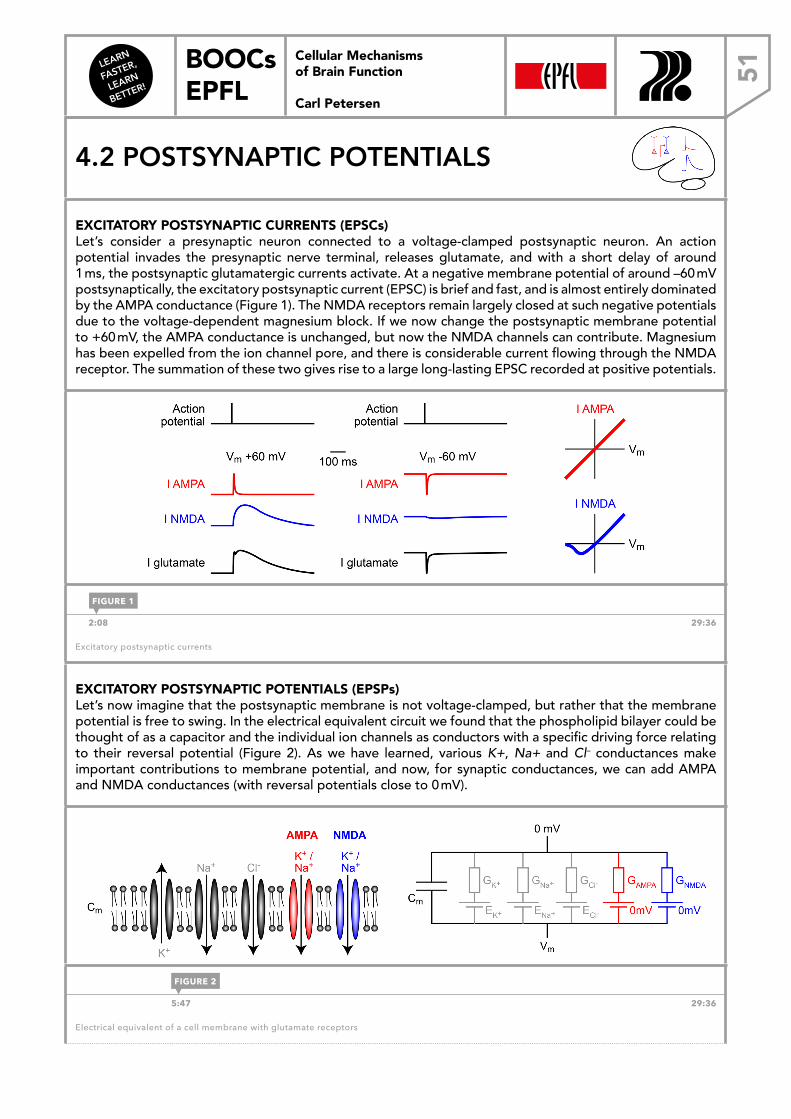
LEARN
FASTER,
LEARN
BETTER!
BOOCs EPFL 51
Cellular Mechanisms of Brain Function
Carl Petersen
4.2 POSTSYNAPTIC POTENTIALS
EXCITATORY POSTSYNAPTIC CURRENTS (EPSCs)Let’s consider a presynaptic neuron connected to a voltage-clamped postsynaptic neuron. An action potential invades the presynaptic nerve terminal, releases glutamate, and with a short delay of around 1 ms, the postsynaptic glutamatergic currents activate. At a negative membrane potential of around –60 mV postsynaptically, the excitatory postsynaptic current (EPSC) is brief and fast, and is almost entirely dominated by the AMPA conductance (Figure 1). The NMDA receptors remain largely closed at such negative potentials due to the voltage-dependent magnesium block. If we now change the postsynaptic membrane potential to +60 mV, the AMPA conductance is unchanged, but now the NMDA channels can contribute. Magnesium has been expelled from the ion channel pore, and there is considerable current flowing through the NMDA receptor. The summation of these two gives rise to a large long-lasting EPSC recorded at positive potentials.
Cellular Mechanisms of Brain Function
EPSCs - excitatory postsynaptic currents
2:08 29:36
Excitatory postsynaptic currents
EXCITATORY POSTSYNAPTIC POTENTIALS (EPSPs)Let’s now imagine that the postsynaptic membrane is not voltage-clamped, but rather that the membrane potential is free to swing. In the electrical equivalent circuit we found that the phospholipid bilayer could be thought of as a capacitor and the individual ion channels as conductors with a specific driving force relating to their reversal potential (Figure 2). As we have learned, various K+, Na+ and Cl– conductances make important contributions to membrane potential, and now, for synaptic conductances, we can add AMPA and NMDA conductances (with reversal potentials close to 0 mV).
Cellular Mechanisms of Brain Function
EPSPs - excitatory postsynaptic potentials
Cellular Mechanisms of Brain Function
EPSPs - excitatory postsynaptic potentials
5:47 29:36
Electrical equivalent of a cell membrane with glutamate receptors
FIGURE 1
FIGURE 2
Cellular Mechanisms of Brain Function Prof. Carl Petersen
4.2 Postsynaptic pote
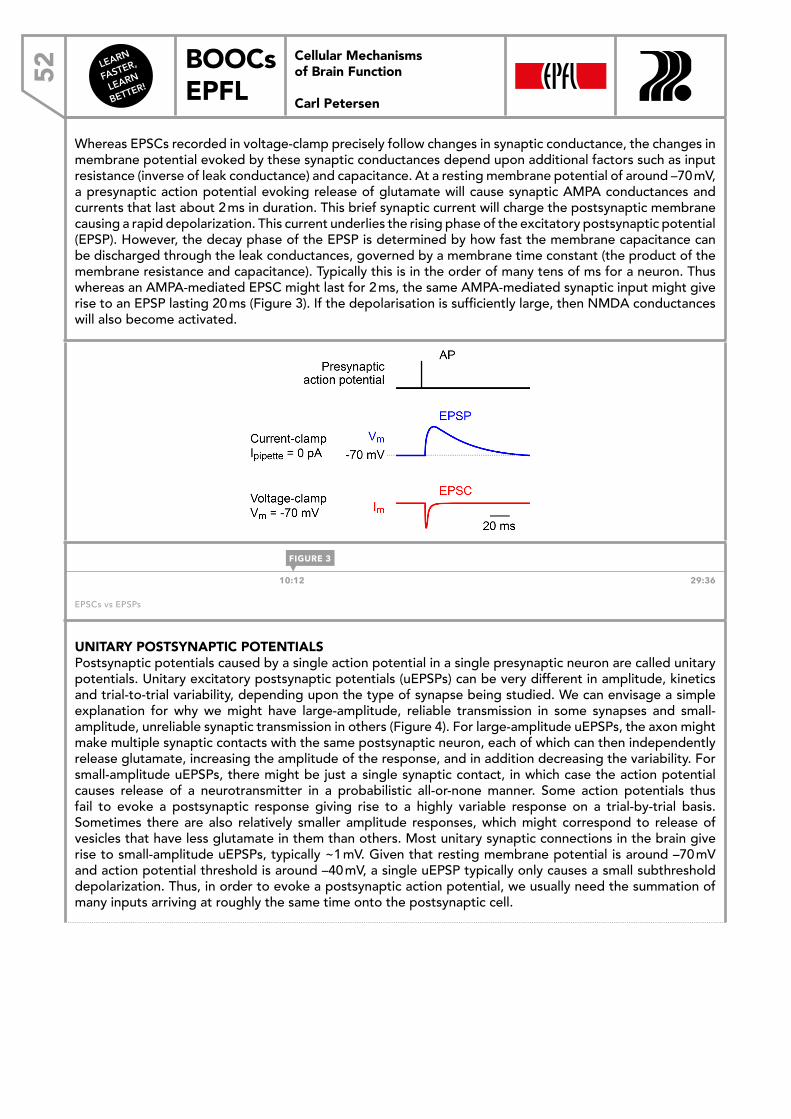
LEARN
FASTER,
LEARN
BETTER!
BOOCs EPFL52
Cellular Mechanisms of Brain Function
Carl Petersen
Whereas EPSCs recorded in voltage-clamp precisely follow changes in synaptic conductance, the changes in membrane potential evoked by these synaptic conductances depend upon additional factors such as input resistance (inverse of leak conductance) and capacitance. At a resting membrane potential of around –70 mV, a presynaptic action potential evoking release of glutamate will cause synaptic AMPA conductances and currents that last about 2 ms in duration. This brief synaptic current will charge the postsynaptic membrane causing a rapid depolarization. This current underlies the rising phase of the excitatory postsynaptic potential (EPSP). However, the decay phase of the EPSP is determined by how fast the membrane capacitance can be discharged through the leak conductances, governed by a membrane time constant (the product of the membrane resistance and capacitance). Typically this is in the order of many tens of ms for a neuron. Thus whereas an AMPA-mediated EPSC might last for 2 ms, the same AMPA-mediated synaptic input might give rise to an EPSP lasting 20 ms (Figure 3). If the depolarisation is sufficiently large, then NMDA conductances will also become activated.
Cellular Mechanisms of Brain Function
EPSPs vs EPSCs
10:12 29:36
EPSCs vs EPSPs
UNITARY POSTSYNAPTIC POTENTIALSPostsynaptic potentials caused by a single action potential in a single presynaptic neuron are called unitary potentials. Unitary excitatory postsynaptic potentials (uEPSPs) can be very different in amplitude, kinetics and trial-to-trial variability, depending upon the type of synapse being studied. We can envisage a simple explanation for why we might have large-amplitude, reliable transmission in some synapses and small-amplitude, unreliable synaptic transmission in others (Figure 4). For large-amplitude uEPSPs, the axon might make multiple synaptic contacts with the same postsynaptic neuron, each of which can then independently release glutamate, increasing the amplitude of the response, and in addition decreasing the variability. For small-amplitude uEPSPs, there might be just a single synaptic contact, in which case the action potential causes release of a neurotransmitter in a probabilistic all-or-none manner. Some action potentials thus fail to evoke a postsynaptic response giving rise to a highly variable response on a trial-by-trial basis. Sometimes there are also relatively smaller amplitude responses, which might correspond to release of vesicles that have less glutamate in them than others. Most unitary synaptic connections in the brain give rise to small-amplitude uEPSPs, typically ~1 mV. Given that resting membrane potential is around –70 mV and action potential threshold is around –40 mV, a single uEPSP typically only causes a small subthreshold depolarization. Thus, in order to evoke a postsynaptic action potential, we usually need the summation of many inputs arriving at roughly the same time onto the postsynaptic cell.
FIGURE 3
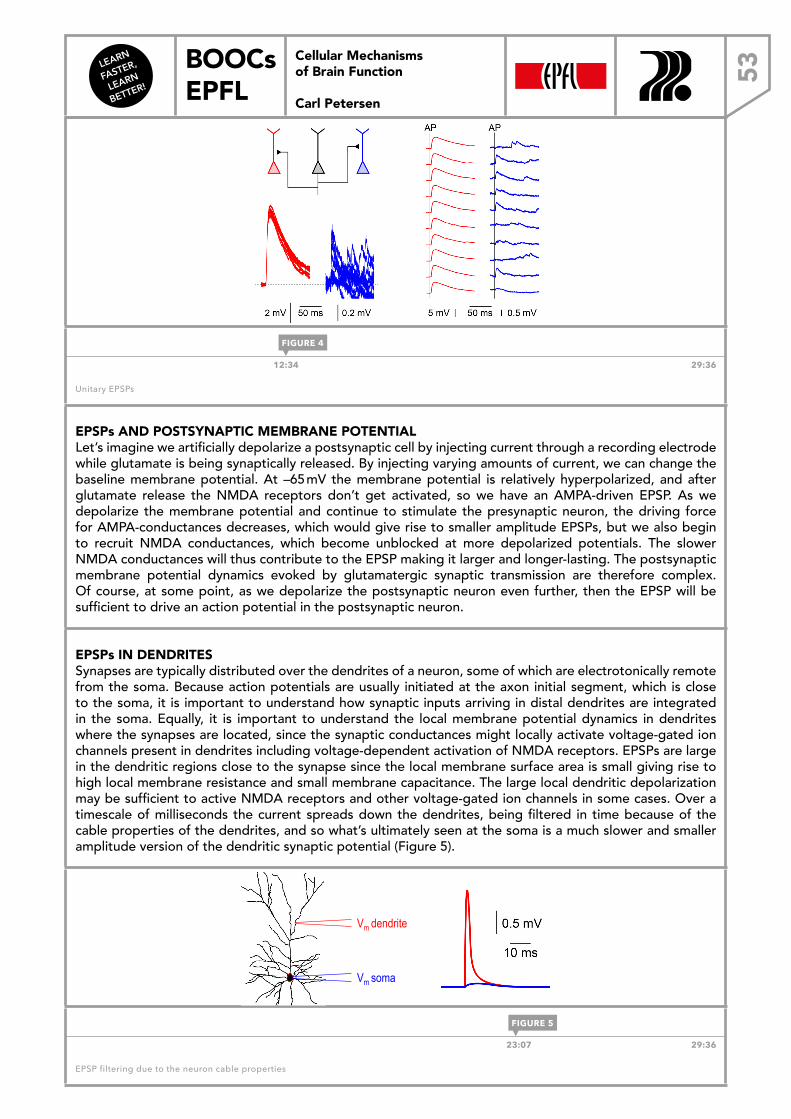
LEARN
FASTER,
LEARN
BETTER!
BOOCs EPFL 53
Cellular Mechanisms of Brain Function
Carl Petersen
Cellular Mechanisms of Brain Function
Unitary EPSPs
Lefort, Tomm, Sarria & Petersen, 2009
12:34 29:36
Unitary EPSPs
EPSPs AND POSTSYNAPTIC MEMBRANE POTENTIALLet’s imagine we artificially depolarize a postsynaptic cell by injecting current through a recording electrode while glutamate is being synaptically released. By injecting varying amounts of current, we can change the baseline membrane potential. At –65 mV the membrane potential is relatively hyperpolarized, and after glutamate release the NMDA receptors don’t get activated, so we have an AMPA-driven EPSP. As we depolarize the membrane potential and continue to stimulate the presynaptic neuron, the driving force for AMPA-conductances decreases, which would give rise to smaller amplitude EPSPs, but we also begin to recruit NMDA conductances, which become unblocked at more depolarized potentials. The slower NMDA conductances will thus contribute to the EPSP making it larger and longer-lasting. The postsynaptic membrane potential dynamics evoked by glutamatergic synaptic transmission are therefore complex. Of course, at some point, as we depolarize the postsynaptic neuron even further, then the EPSP will be sufficient to drive an action potential in the postsynaptic neuron.
EPSPs IN DENDRITESSynapses are typically distributed over the dendrites of a neuron, some of which are electrotonically remote from the soma. Because action potentials are usually initiated at the axon initial segment, which is close to the soma, it is important to understand how synaptic inputs arriving in distal dendrites are integrated in the soma. Equally, it is important to understand the local membrane potential dynamics in dendrites where the synapses are located, since the synaptic conductances might locally activate voltage-gated ion channels present in dendrites including voltage-dependent activation of NMDA receptors. EPSPs are large in the dendritic regions close to the synapse since the local membrane surface area is small giving rise to high local membrane resistance and small membrane capacitance. The large local dendritic depolarization may be sufficient to active NMDA receptors and other voltage-gated ion channels in some cases. Over a timescale of milliseconds the current spreads down the dendrites, being filtered in time because of the cable properties of the dendrites, and so what’s ultimately seen at the soma is a much slower and smaller amplitude version of the dendritic synaptic potential (Figure 5).
Cellular Mechanisms of Brain Function
Dendrites
Vm dendrite
Vm soma
23:07 29:36
EPSP filtering due to the neuron cable properties
FIGURE 4
FIGURE 5
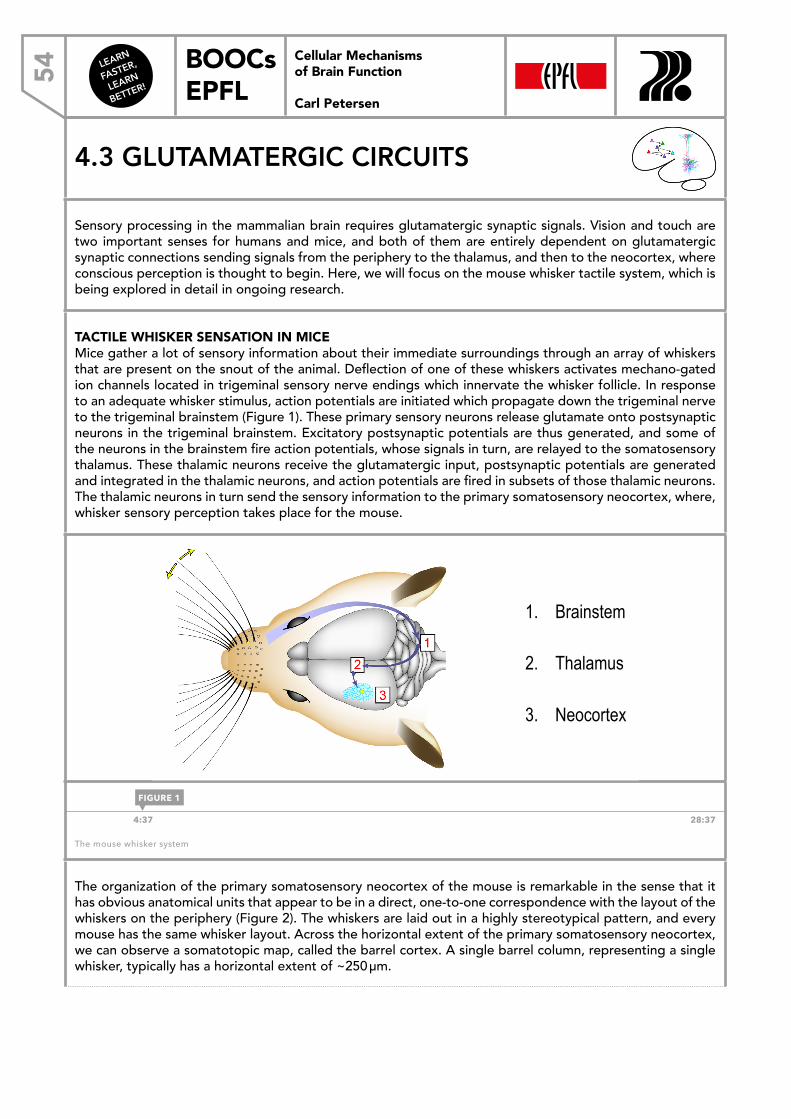
LEARN
FASTER,
LEARN
BETTER!
BOOCs EPFL54
Cellular Mechanisms of Brain Function
Carl Petersen
4.3 GLUTAMATERGIC CIRCUITS
Sensory processing in the mammalian brain requires glutamatergic synaptic signals. Vision and touch are two important senses for humans and mice, and both of them are entirely dependent on glutamatergic synaptic connections sending signals from the periphery to the thalamus, and then to the neocortex, where conscious perception is thought to begin. Here, we will focus on the mouse whisker tactile system, which is being explored in detail in ongoing research.
TACTILE WHISKER SENSATION IN MICEMice gather a lot of sensory information about their immediate surroundings through an array of whiskers that are present on the snout of the animal. Deflection of one of these whiskers activates mechano-gated ion channels located in trigeminal sensory nerve endings which innervate the whisker follicle. In response to an adequate whisker stimulus, action potentials are initiated which propagate down the trigeminal nerve to the trigeminal brainstem (Figure 1). These primary sensory neurons release glutamate onto postsynaptic neurons in the trigeminal brainstem. Excitatory postsynaptic potentials are thus generated, and some of the neurons in the brainstem fire action potentials, whose signals in turn, are relayed to the somatosensory thalamus. These thalamic neurons receive the glutamatergic input, postsynaptic potentials are generated and integrated in the thalamic neurons, and action potentials are fired in subsets of those thalamic neurons. The thalamic neurons in turn send the sensory information to the primary somatosensory neocortex, where, whisker sensory perception takes place for the mouse.
Cellular Mechanisms of Brain Function
Mouse whisker sensation
1. Brainstem 2. Thalamus 3. Neocortex
Petersen, 2007
4:37 28:37
The mouse whisker system
The organization of the primary somatosensory neocortex of the mouse is remarkable in the sense that it has obvious anatomical units that appear to be in a direct, one-to-one correspondence with the layout of the whiskers on the periphery (Figure 2). The whiskers are laid out in a highly stereotypical pattern, and every mouse has the same whisker layout. Across the horizontal extent of the primary somatosensory neocortex, we can observe a somatotopic map, called the barrel cortex. A single barrel column, representing a single whisker, typically has a horizontal extent of ~250 µm.
FIGURE 1
Cellular Mechanisms of Brain Function Prof. Carl Petersen
4.3 Glutamatergic cir
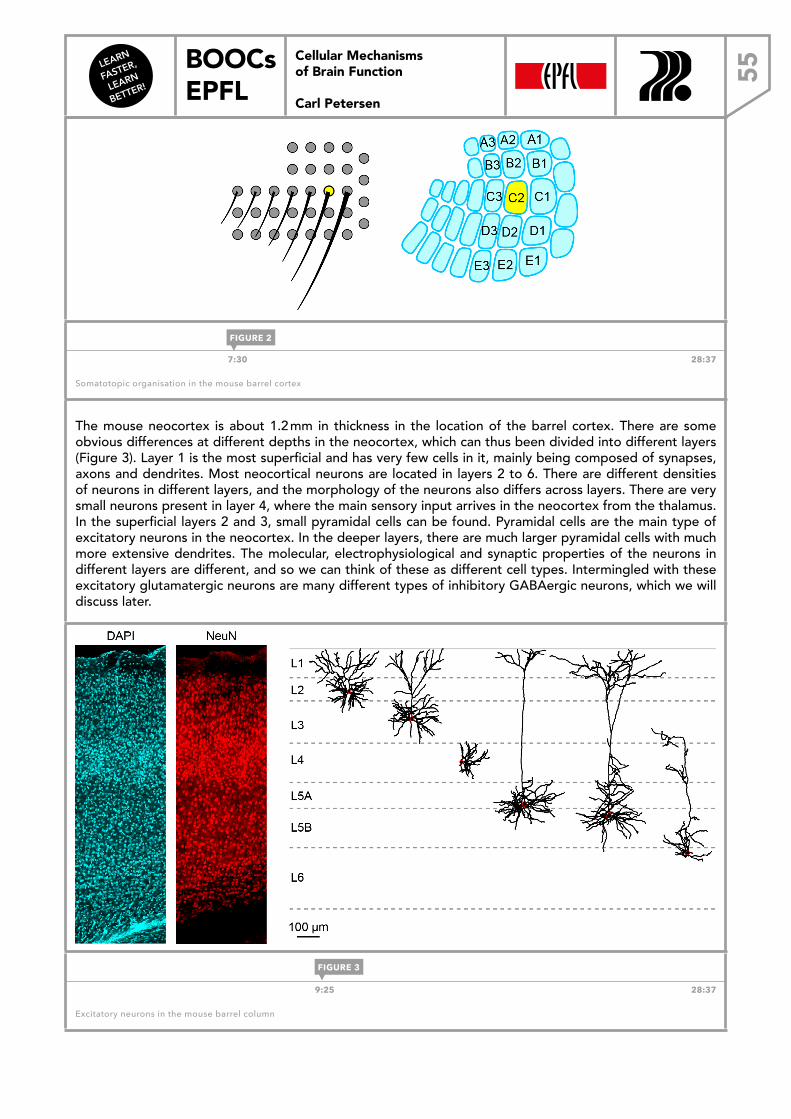
LEARN
FASTER,
LEARN
BETTER!
BOOCs EPFL 55
Cellular Mechanisms of Brain Function
Carl Petersen
Cellular Mechanisms of Brain Function
Whisker map in somatosensory neocortex
Petersen, 2007 7:30 28:37
Somatotopic organisation in the mouse barrel cortex
The mouse neocortex is about 1.2 mm in thickness in the location of the barrel cortex. There are some obvious differences at different depths in the neocortex, which can thus been divided into different layers (Figure 3). Layer 1 is the most superficial and has very few cells in it, mainly being composed of synapses, axons and dendrites. Most neocortical neurons are located in layers 2 to 6. There are different densities of neurons in different layers, and the morphology of the neurons also differs across layers. There are very small neurons present in layer 4, where the main sensory input arrives in the neocortex from the thalamus. In the superficial layers 2 and 3, small pyramidal cells can be found. Pyramidal cells are the main type of excitatory neurons in the neocortex. In the deeper layers, there are much larger pyramidal cells with much more extensive dendrites. The molecular, electrophysiological and synaptic properties of the neurons in different layers are different, and so we can think of these as different cell types. Intermingled with these excitatory glutamatergic neurons are many different types of inhibitory GABAergic neurons, which we will discuss later.
Cellular Mechanisms of Brain Function
Excitatory neurons of the C2 barrel column
Lefort, Tomm, Sarria & Petersen, 2009
9:25 28:37
Excitatory neurons in the mouse barrel column
FIGURE 2
FIGURE 3
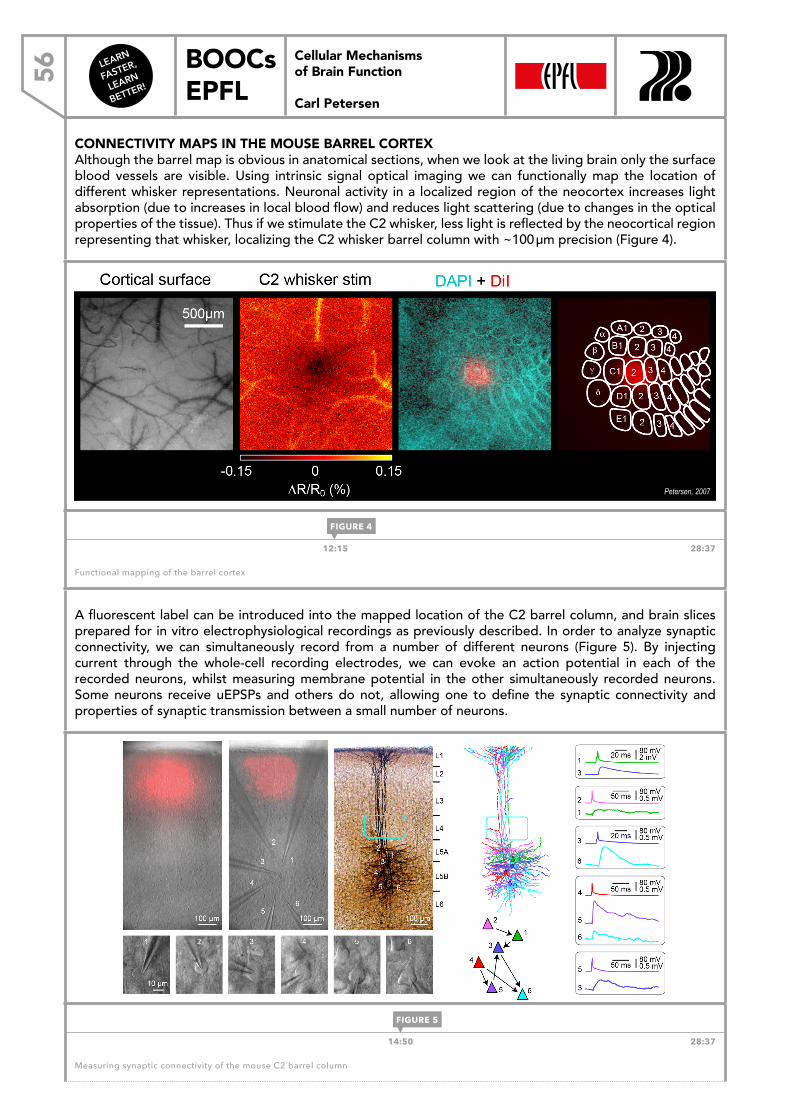
LEARN
FASTER,
LEARN
BETTER!
BOOCs EPFL56
Cellular Mechanisms of Brain Function
Carl Petersen
CONNECTIVITY MAPS IN THE MOUSE BARREL CORTEXAlthough the barrel map is obvious in anatomical sections, when we look at the living brain only the surface blood vessels are visible. Using intrinsic signal optical imaging we can functionally map the location of different whisker representations. Neuronal activity in a localized region of the neocortex increases light absorption (due to increases in local blood flow) and reduces light scattering (due to changes in the optical properties of the tissue). Thus if we stimulate the C2 whisker, less light is reflected by the neocortical region representing that whisker, localizing the C2 whisker barrel column with ~100 µm precision (Figure 4).
Cellular Mechanisms of Brain Function
Functional mapping of barrel cortex
Petersen, 2007
12:15 28:37
Functional mapping of the barrel cortex
A fluorescent label can be introduced into the mapped location of the C2 barrel column, and brain slices prepared for in vitro electrophysiological recordings as previously described. In order to analyze synaptic connectivity, we can simultaneously record from a number of different neurons (Figure 5). By injecting current through the whole-cell recording electrodes, we can evoke an action potential in each of the recorded neurons, whilst measuring membrane potential in the other simultaneously recorded neurons. Some neurons receive uEPSPs and others do not, allowing one to define the synaptic connectivity and properties of synaptic transmission between a small number of neurons.
Cellular Mechanisms of Brain Function
Synaptic microcircuits in the C2 barrel column
Lefort, Tomm, Sarria & Petersen, 2009
14:50 28:37
Measuring synaptic connectivity of the mouse C2 barrel column
FIGURE 4
FIGURE 5
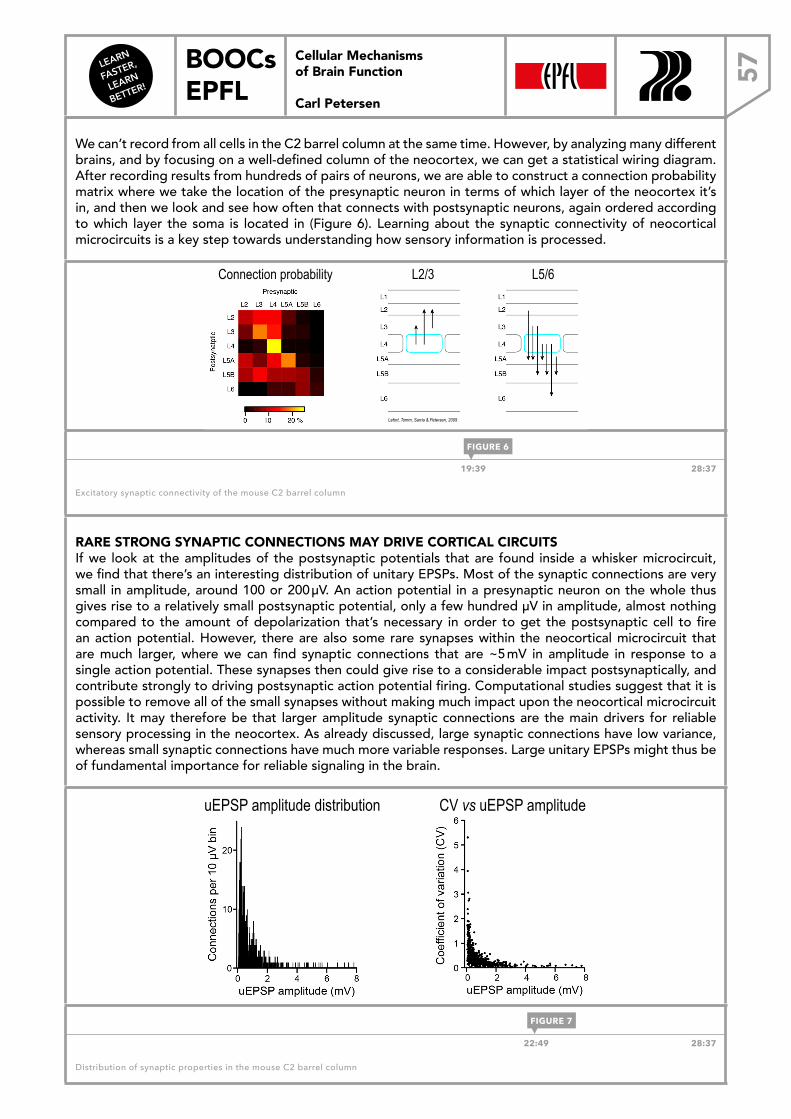
LEARN
FASTER,
LEARN
BETTER!
BOOCs EPFL 57
Cellular Mechanisms of Brain Function
Carl Petersen
We can’t record from all cells in the C2 barrel column at the same time. However, by analyzing many different brains, and by focusing on a well-defined column of the neocortex, we can get a statistical wiring diagram. After recording results from hundreds of pairs of neurons, we are able to construct a connection probability matrix where we take the location of the presynaptic neuron in terms of which layer of the neocortex it’s in, and then we look and see how often that connects with postsynaptic neurons, again ordered according to which layer the soma is located in (Figure 6). Learning about the synaptic connectivity of neocortical microcircuits is a key step towards understanding how sensory information is processed.
Cellular Mechanisms of Brain Function
Excitatory microcircuit of the C2 barrel column
Connection probability L2/3 L5/6
Lefort, Tomm, Sarria & Petersen, 2009
19:39 28:37
Excitatory synaptic connectivity of the mouse C2 barrel column
RARE STRONG SYNAPTIC CONNECTIONS MAY DRIVE CORTICAL CIRCUITSIf we look at the amplitudes of the postsynaptic potentials that are found inside a whisker microcircuit, we find that there’s an interesting distribution of unitary EPSPs. Most of the synaptic connections are very small in amplitude, around 100 or 200 μV. An action potential in a presynaptic neuron on the whole thus gives rise to a relatively small postsynaptic potential, only a few hundred μV in amplitude, almost nothing compared to the amount of depolarization that’s necessary in order to get the postsynaptic cell to fire an action potential. However, there are also some rare synapses within the neocortical microcircuit that are much larger, where we can find synaptic connections that are ~5 mV in amplitude in response to a single action potential. These synapses then could give rise to a considerable impact postsynaptically, and contribute strongly to driving postsynaptic action potential firing. Computational studies suggest that it is possible to remove all of the small synapses without making much impact upon the neocortical microcircuit activity. It may therefore be that larger amplitude synaptic connections are the main drivers for reliable sensory processing in the neocortex. As already discussed, large synaptic connections have low variance, whereas small synaptic connections have much more variable responses. Large unitary EPSPs might thus be of fundamental importance for reliable signaling in the brain.
Cellular Mechanisms of Brain Function
Synaptic properties
Lefort, Tomm, Sarria & Petersen, 2009
uEPSP amplitude distribution CV vs uEPSP amplitude
22:49 28:37
Distribution of synaptic properties in the mouse C2 barrel column
FIGURE 6
FIGURE 7
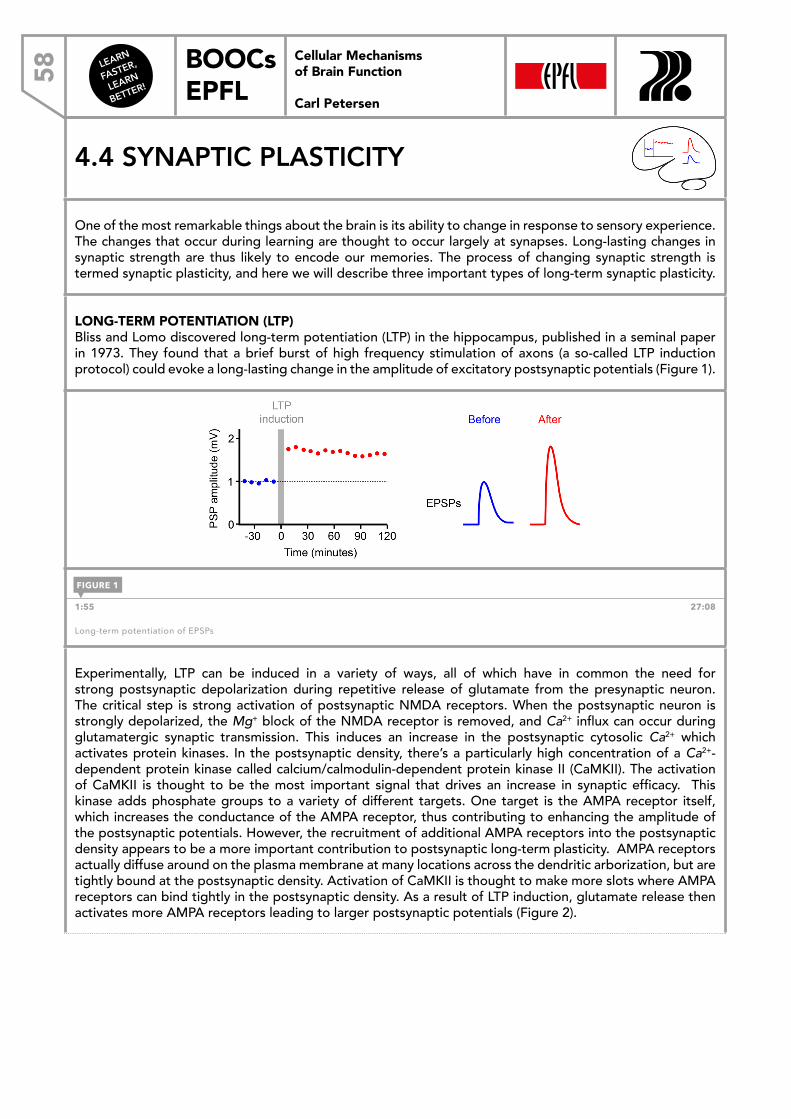
LEARN
FASTER,
LEARN
BETTER!
BOOCs EPFL58
Cellular Mechanisms of Brain Function
Carl Petersen
4.4 SYNAPTIC PLASTICITY
One of the most remarkable things about the brain is its ability to change in response to sensory experience. The changes that occur during learning are thought to occur largely at synapses. Long-lasting changes in synaptic strength are thus likely to encode our memories. The process of changing synaptic strength is termed synaptic plasticity, and here we will describe three important types of long-term synaptic plasticity.
LONG-TERM POTENTIATION (LTP)Bliss and Lomo discovered long-term potentiation (LTP) in the hippocampus, published in a seminal paper in 1973. They found that a brief burst of high frequency stimulation of axons (a so-called LTP induction protocol) could evoke a long-lasting change in the amplitude of excitatory postsynaptic potentials (Figure 1).
Cellular Mechanisms of Brain Function
Long-term potentiation (LTP)
1:55 27:08
Long-term potentiation of EPSPs
Experimentally, LTP can be induced in a variety of ways, all of which have in common the need for strong postsynaptic depolarization during repetitive release of glutamate from the presynaptic neuron. The critical step is strong activation of postsynaptic NMDA receptors. When the postsynaptic neuron is strongly depolarized, the Mg+ block of the NMDA receptor is removed, and Ca2+ influx can occur during glutamatergic synaptic transmission. This induces an increase in the postsynaptic cytosolic Ca2+ which activates protein kinases. In the postsynaptic density, there’s a particularly high concentration of a Ca2+-dependent protein kinase called calcium/calmodulin-dependent protein kinase II (CaMKII). The activation of CaMKII is thought to be the most important signal that drives an increase in synaptic efficacy. This kinase adds phosphate groups to a variety of different targets. One target is the AMPA receptor itself, which increases the conductance of the AMPA receptor, thus contributing to enhancing the amplitude of the postsynaptic potentials. However, the recruitment of additional AMPA receptors into the postsynaptic density appears to be a more important contribution to postsynaptic long-term plasticity. AMPA receptors actually diffuse around on the plasma membrane at many locations across the dendritic arborization, but are tightly bound at the postsynaptic density. Activation of CaMKII is thought to make more slots where AMPA receptors can bind tightly in the postsynaptic density. As a result of LTP induction, glutamate release then activates more AMPA receptors leading to larger postsynaptic potentials (Figure 2).
FIGURE 1
Cellular Mechanisms of Brain Function Prof. Carl Petersen
4.4 Synaptic plasticity
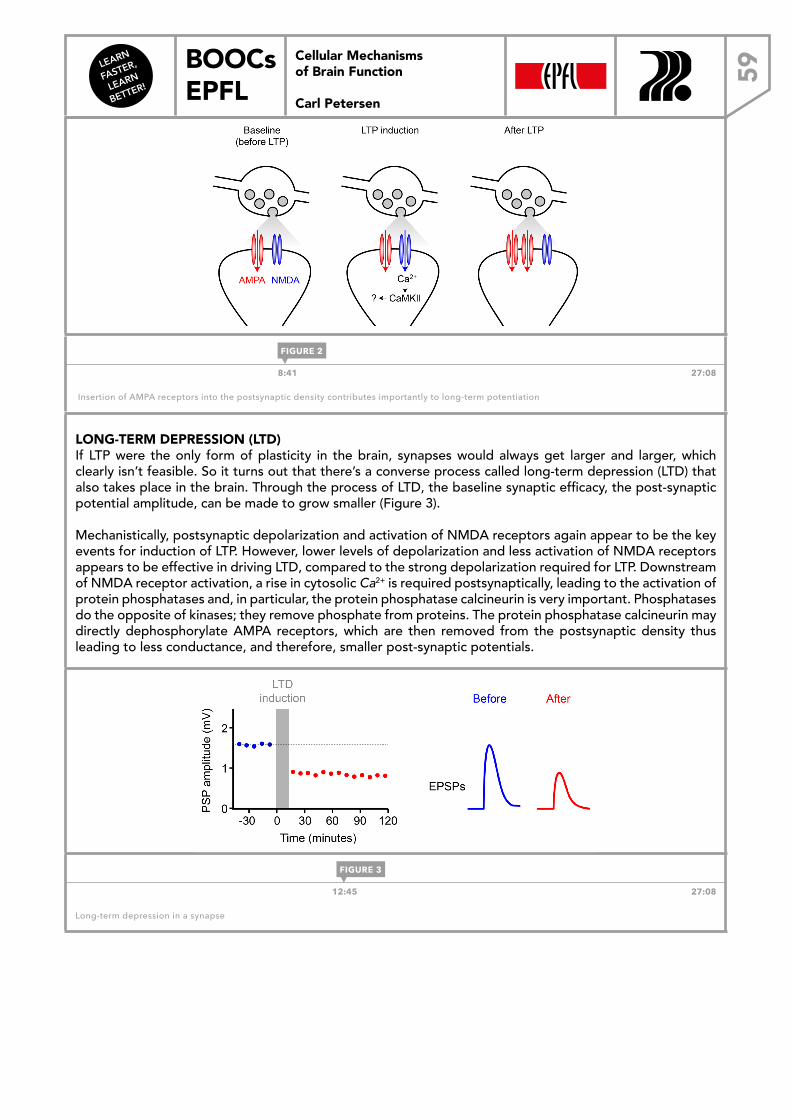
LEARN
FASTER,
LEARN
BETTER!
BOOCs EPFL 59
Cellular Mechanisms of Brain Function
Carl Petersen
Cellular Mechanisms of Brain Function
Postsynaptic mechanisms of LTP
8:41 27:08
Insertion of AMPA receptors into the postsynaptic density contributes importantly to long-term potentiation
LONG-TERM DEPRESSION (LTD)If LTP were the only form of plasticity in the brain, synapses would always get larger and larger, which clearly isn’t feasible. So it turns out that there’s a converse process called long-term depression (LTD) that also takes place in the brain. Through the process of LTD, the baseline synaptic efficacy, the post-synaptic potential amplitude, can be made to grow smaller (Figure 3).
Mechanistically, postsynaptic depolarization and activation of NMDA receptors again appear to be the key events for induction of LTP. However, lower levels of depolarization and less activation of NMDA receptors appears to be effective in driving LTD, compared to the strong depolarization required for LTP. Downstream of NMDA receptor activation, a rise in cytosolic Ca2+ is required postsynaptically, leading to the activation of protein phosphatases and, in particular, the protein phosphatase calcineurin is very important. Phosphatases do the opposite of kinases; they remove phosphate from proteins. The protein phosphatase calcineurin may directly dephosphorylate AMPA receptors, which are then removed from the postsynaptic density thus leading to less conductance, and therefore, smaller post-synaptic potentials.
Cellular Mechanisms of Brain Function
Long-term depression (LTD)
12:45 27:08
Long-term depression in a synapse
FIGURE 2
FIGURE 3
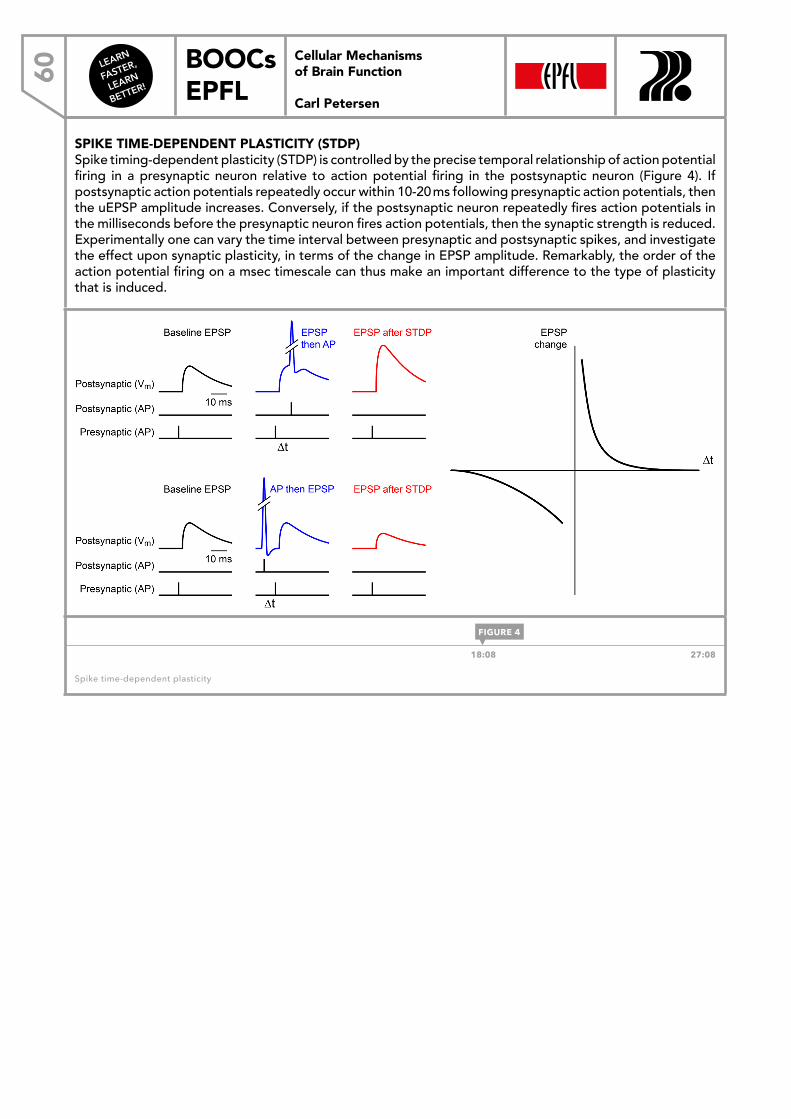
LEARN
FASTER,
LEARN
BETTER!
BOOCs EPFL60
Cellular Mechanisms of Brain Function
Carl Petersen
SPIKE TIME-DEPENDENT PLASTICITY (STDP)Spike timing-dependent plasticity (STDP) is controlled by the precise temporal relationship of action potential firing in a presynaptic neuron relative to action potential firing in the postsynaptic neuron (Figure 4). If postsynaptic action potentials repeatedly occur within 10-20 ms following presynaptic action potentials, then the uEPSP amplitude increases. Conversely, if the postsynaptic neuron repeatedly fires action potentials in the milliseconds before the presynaptic neuron fires action potentials, then the synaptic strength is reduced. Experimentally one can vary the time interval between presynaptic and postsynaptic spikes, and investigate the effect upon synaptic plasticity, in terms of the change in EPSP amplitude. Remarkably, the order of the action potential firing on a msec timescale can thus make an important difference to the type of plasticity that is induced.
Cellular Mechanisms of Brain Function
Spike timing-dependent plasticity (STDP)
18:08 27:08
Spike time-dependent plasticity
FIGURE 4
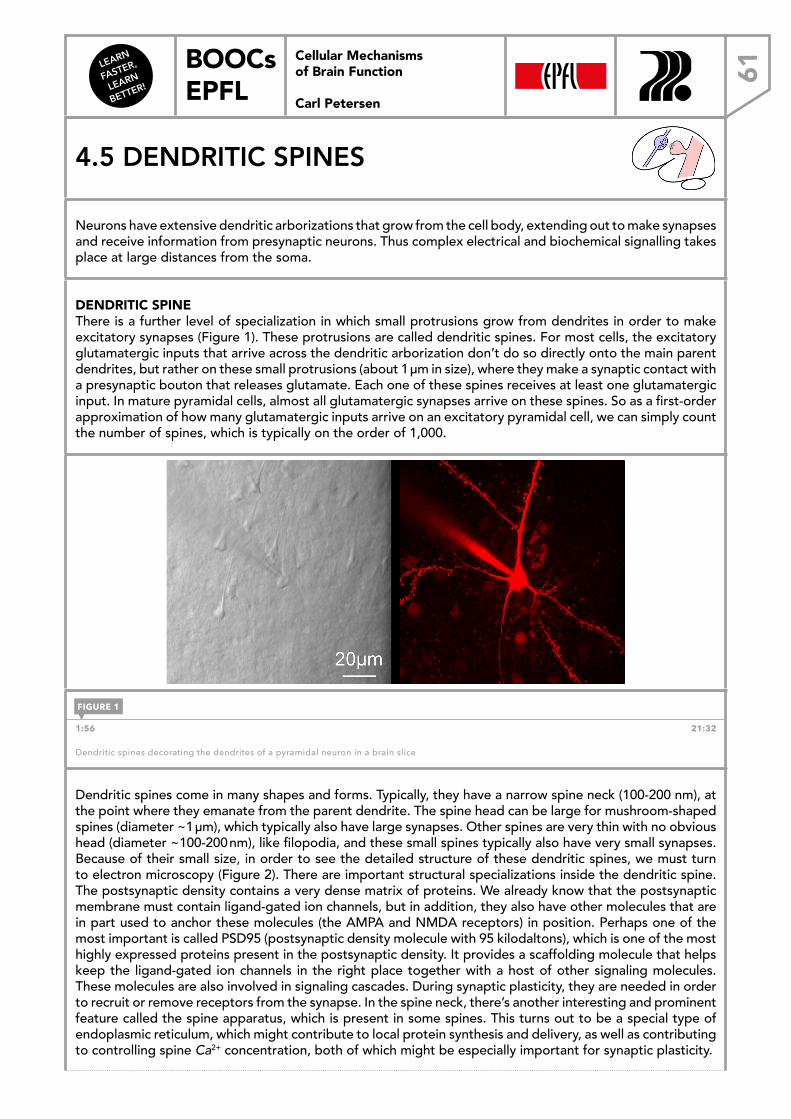
LEARN
FASTER,
LEARN
BETTER!
BOOCs EPFL 61
Cellular Mechanisms of Brain Function
Carl Petersen
4.5 DENDRITIC SPINES
Neurons have extensive dendritic arborizations that grow from the cell body, extending out to make synapses and receive information from presynaptic neurons. Thus complex electrical and biochemical signalling takes place at large distances from the soma.
DENDRITIC SPINEThere is a further level of specialization in which small protrusions grow from dendrites in order to make excitatory synapses (Figure 1). These protrusions are called dendritic spines. For most cells, the excitatory glutamatergic inputs that arrive across the dendritic arborization don’t do so directly onto the main parent dendrites, but rather on these small protrusions (about 1 µm in size), where they make a synaptic contact with a presynaptic bouton that releases glutamate. Each one of these spines receives at least one glutamatergic input. In mature pyramidal cells, almost all glutamatergic synapses arrive on these spines. So as a first-order approximation of how many glutamatergic inputs arrive on an excitatory pyramidal cell, we can simply count the number of spines, which is typically on the order of 1,000.
Cellular Mechanisms of Brain Function
Dendrites are often decorated with spines
Aronoff & Petersen, 2007
1:56 21:32
Dendritic spines decorating the dendrites of a pyramidal neuron in a brain slice
Dendritic spines come in many shapes and forms. Typically, they have a narrow spine neck (100-200 nm), at the point where they emanate from the parent dendrite. The spine head can be large for mushroom-shaped spines (diameter ~1 µm), which typically also have large synapses. Other spines are very thin with no obvious head (diameter ~100-200 nm), like filopodia, and these small spines typically also have very small synapses. Because of their small size, in order to see the detailed structure of these dendritic spines, we must turn to electron microscopy (Figure 2). There are important structural specializations inside the dendritic spine. The postsynaptic density contains a very dense matrix of proteins. We already know that the postsynaptic membrane must contain ligand-gated ion channels, but in addition, they also have other molecules that are in part used to anchor these molecules (the AMPA and NMDA receptors) in position. Perhaps one of the most important is called PSD95 (postsynaptic density molecule with 95 kilodaltons), which is one of the most highly expressed proteins present in the postsynaptic density. It provides a scaffolding molecule that helps keep the ligand-gated ion channels in the right place together with a host of other signaling molecules. These molecules are also involved in signaling cascades. During synaptic plasticity, they are needed in order to recruit or remove receptors from the synapse. In the spine neck, there’s another interesting and prominent feature called the spine apparatus, which is present in some spines. This turns out to be a special type of endoplasmic reticulum, which might contribute to local protein synthesis and delivery, as well as contributing to controlling spine Ca2+ concentration, both of which might be especially important for synaptic plasticity.
FIGURE 1
Cellular Mechanisms of Brain Function Prof. Carl Petersen
4.5 Dendritic spines
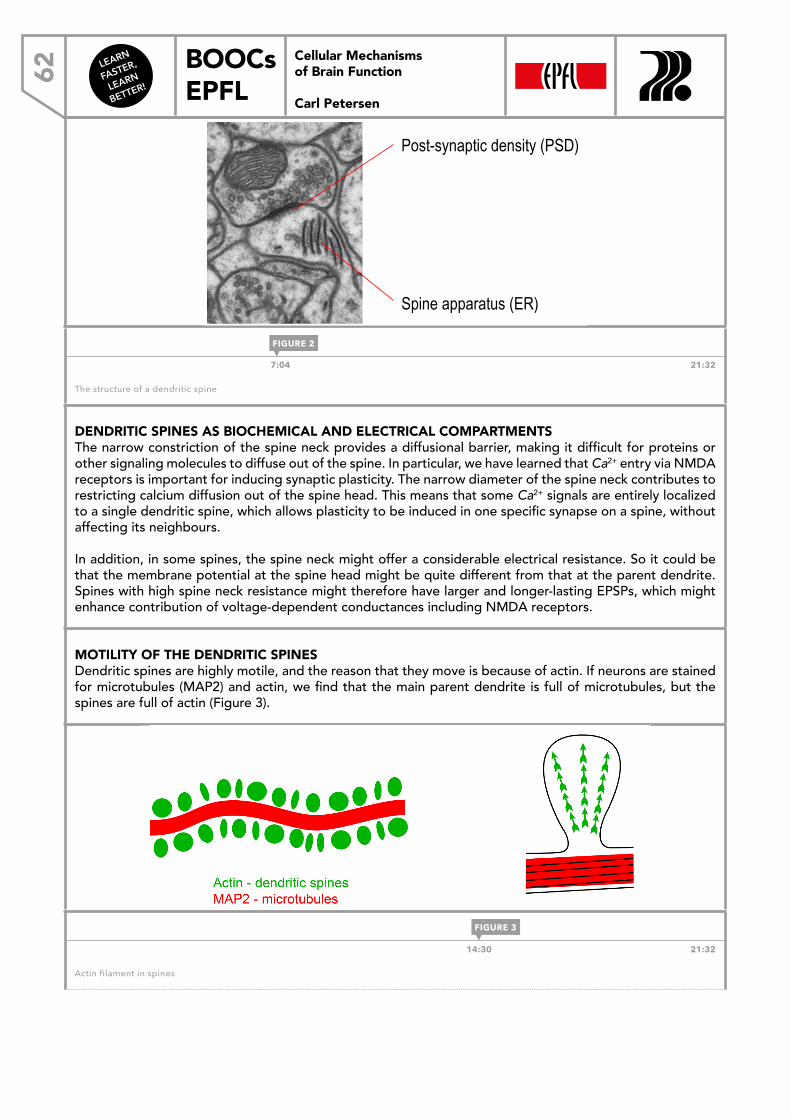
LEARN
FASTER,
LEARN
BETTER!
BOOCs EPFL62
Cellular Mechanisms of Brain Function
Carl Petersen
Cellular Mechanisms of Brain Function
Structure of dendritic spines
Graham Knott
Spine apparatus (ER)
Post-synaptic density (PSD)
7:04 21:32
The structure of a dendritic spine
DENDRITIC SPINES AS BIOCHEMICAL AND ELECTRICAL COMPARTMENTSThe narrow constriction of the spine neck provides a diffusional barrier, making it difficult for proteins or other signaling molecules to diffuse out of the spine. In particular, we have learned that Ca2+ entry via NMDA receptors is important for inducing synaptic plasticity. The narrow diameter of the spine neck contributes to restricting calcium diffusion out of the spine head. This means that some Ca2+ signals are entirely localized to a single dendritic spine, which allows plasticity to be induced in one specific synapse on a spine, without affecting its neighbours.
In addition, in some spines, the spine neck might offer a considerable electrical resistance. So it could be that the membrane potential at the spine head might be quite different from that at the parent dendrite. Spines with high spine neck resistance might therefore have larger and longer-lasting EPSPs, which might enhance contribution of voltage-dependent conductances including NMDA receptors.
MOTILITY OF THE DENDRITIC SPINESDendritic spines are highly motile, and the reason that they move is because of actin. If neurons are stained for microtubules (MAP2) and actin, we find that the main parent dendrite is full of microtubules, but the spines are full of actin (Figure 3).
Cellular Mechanisms of Brain Function
Actin filaments in spines
14:30 21:32
Actin filament in spines
FIGURE 2
FIGURE 3
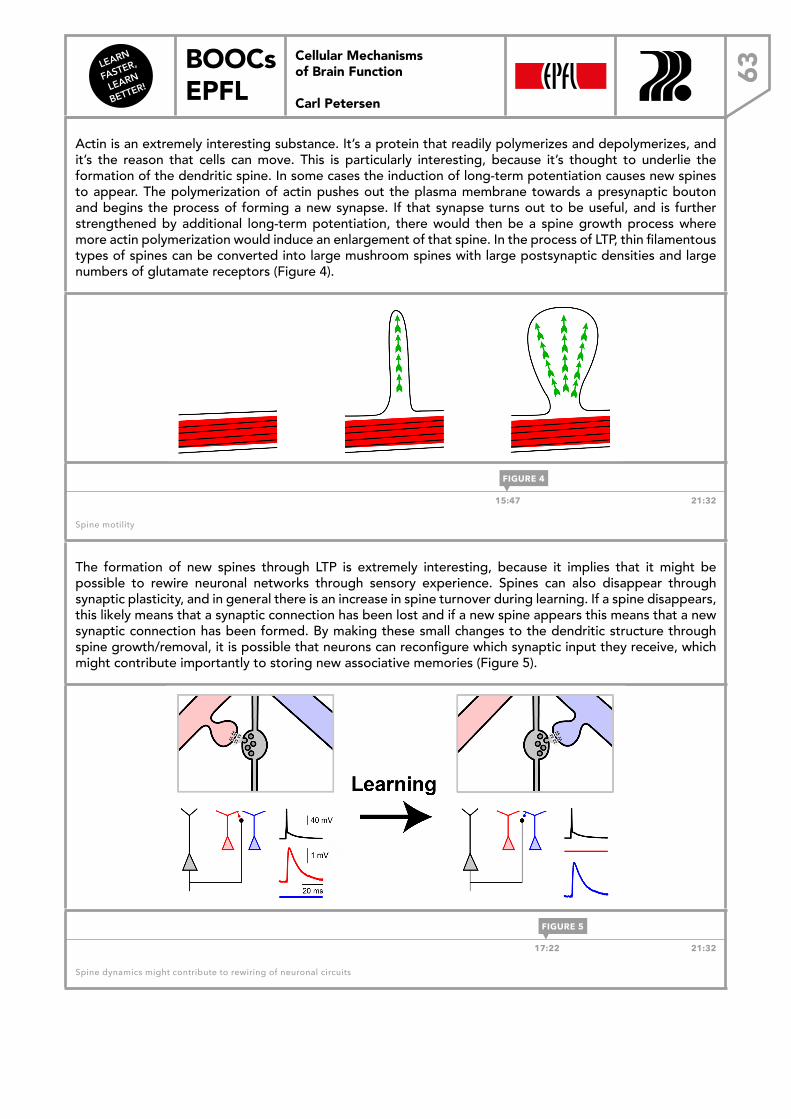
LEARN
FASTER,
LEARN
BETTER!
BOOCs EPFL 63
Cellular Mechanisms of Brain Function
Carl Petersen
Actin is an extremely interesting substance. It’s a protein that readily polymerizes and depolymerizes, and it’s the reason that cells can move. This is particularly interesting, because it’s thought to underlie the formation of the dendritic spine. In some cases the induction of long-term potentiation causes new spines to appear. The polymerization of actin pushes out the plasma membrane towards a presynaptic bouton and begins the process of forming a new synapse. If that synapse turns out to be useful, and is further strengthened by additional long-term potentiation, there would then be a spine growth process where more actin polymerization would induce an enlargement of that spine. In the process of LTP, thin filamentous types of spines can be converted into large mushroom spines with large postsynaptic densities and large numbers of glutamate receptors (Figure 4).
Cellular Mechanisms of Brain Function
Spine motility
15:47 21:32
Spine motility
The formation of new spines through LTP is extremely interesting, because it implies that it might be possible to rewire neuronal networks through sensory experience. Spines can also disappear through synaptic plasticity, and in general there is an increase in spine turnover during learning. If a spine disappears, this likely means that a synaptic connection has been lost and if a new spine appears this means that a new synaptic connection has been formed. By making these small changes to the dendritic structure through spine growth/removal, it is possible that neurons can reconfigure which synaptic input they receive, which might contribute importantly to storing new associative memories (Figure 5).
Cellular Mechanisms of Brain Function
Dendritic spines for rewiring neuronal networks
17:22 21:32
Spine dynamics might contribute to rewiring of neuronal circuits
FIGURE 4
FIGURE 5
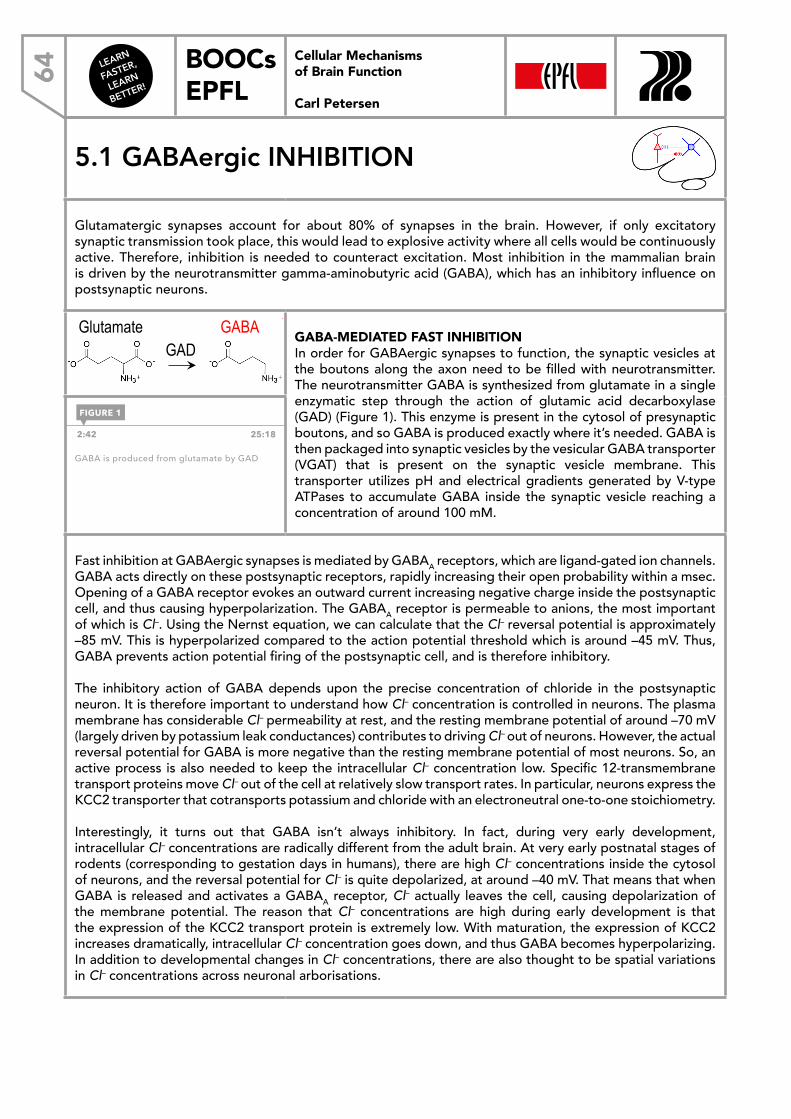
LEARN
FASTER,
LEARN
BETTER!
BOOCs EPFL64
Cellular Mechanisms of Brain Function
Carl Petersen
5.1 GABAergic INHIBITION
Glutamatergic synapses account for about 80% of synapses in the brain. However, if only excitatory synaptic transmission took place, this would lead to explosive activity where all cells would be continuously active. Therefore, inhibition is needed to counteract excitation. Most inhibition in the mammalian brain is driven by the neurotransmitter gamma-aminobutyric acid (GABA), which has an inhibitory influence on postsynaptic neurons.
Cellular Mechanisms of Brain Function
GABAergic synapses
Ionotropic GABA receptors Outward postsynaptic current
Glutamate GABA GAD
Vesicular GABA transporter VGAT
GABA-MEDIATED FAST INHIBITIONIn order for GABAergic synapses to function, the synaptic vesicles at the boutons along the axon need to be filled with neurotransmitter. The neurotransmitter GABA is synthesized from glutamate in a single enzymatic step through the action of glutamic acid decarboxylase (GAD) (Figure 1). This enzyme is present in the cytosol of presynaptic boutons, and so GABA is produced exactly where it’s needed. GABA is then packaged into synaptic vesicles by the vesicular GABA transporter (VGAT) that is present on the synaptic vesicle membrane. This transporter utilizes pH and electrical gradients generated by V-type ATPases to accumulate GABA inside the synaptic vesicle reaching a concentration of around 100 mM.
2:42 25:18
GABA is produced from glutamate by GAD
Fast inhibition at GABAergic synapses is mediated by GABAA receptors, which are ligand-gated ion channels. GABA acts directly on these postsynaptic receptors, rapidly increasing their open probability within a msec. Opening of a GABA receptor evokes an outward current increasing negative charge inside the postsynaptic cell, and thus causing hyperpolarization. The GABAA receptor is permeable to anions, the most important of which is Cl–. Using the Nernst equation, we can calculate that the Cl– reversal potential is approximately –85 mV. This is hyperpolarized compared to the action potential threshold which is around –45 mV. Thus, GABA prevents action potential firing of the postsynaptic cell, and is therefore inhibitory.
The inhibitory action of GABA depends upon the precise concentration of chloride in the postsynaptic neuron. It is therefore important to understand how Cl– concentration is controlled in neurons. The plasma membrane has considerable Cl– permeability at rest, and the resting membrane potential of around –70 mV (largely driven by potassium leak conductances) contributes to driving Cl– out of neurons. However, the actual reversal potential for GABA is more negative than the resting membrane potential of most neurons. So, an active process is also needed to keep the intracellular Cl– concentration low. Specific 12-transmembrane transport proteins move Cl– out of the cell at relatively slow transport rates. In particular, neurons express the KCC2 transporter that cotransports potassium and chloride with an electroneutral one-to-one stoichiometry.
Interestingly, it turns out that GABA isn’t always inhibitory. In fact, during very early development, intracellular Cl– concentrations are radically different from the adult brain. At very early postnatal stages of rodents (corresponding to gestation days in humans), there are high Cl– concentrations inside the cytosol of neurons, and the reversal potential for Cl– is quite depolarized, at around –40 mV. That means that when GABA is released and activates a GABAA receptor, Cl– actually leaves the cell, causing depolarization of the membrane potential. The reason that Cl– concentrations are high during early development is that the expression of the KCC2 transport protein is extremely low. With maturation, the expression of KCC2 increases dramatically, intracellular Cl– concentration goes down, and thus GABA becomes hyperpolarizing. In addition to developmental changes in Cl– concentrations, there are also thought to be spatial variations in Cl– concentrations across neuronal arborisations.
FIGURE 1
Cellular Mechanisms of Brain Function Prof. Carl Petersen
5.1 GABAergic inhibiti
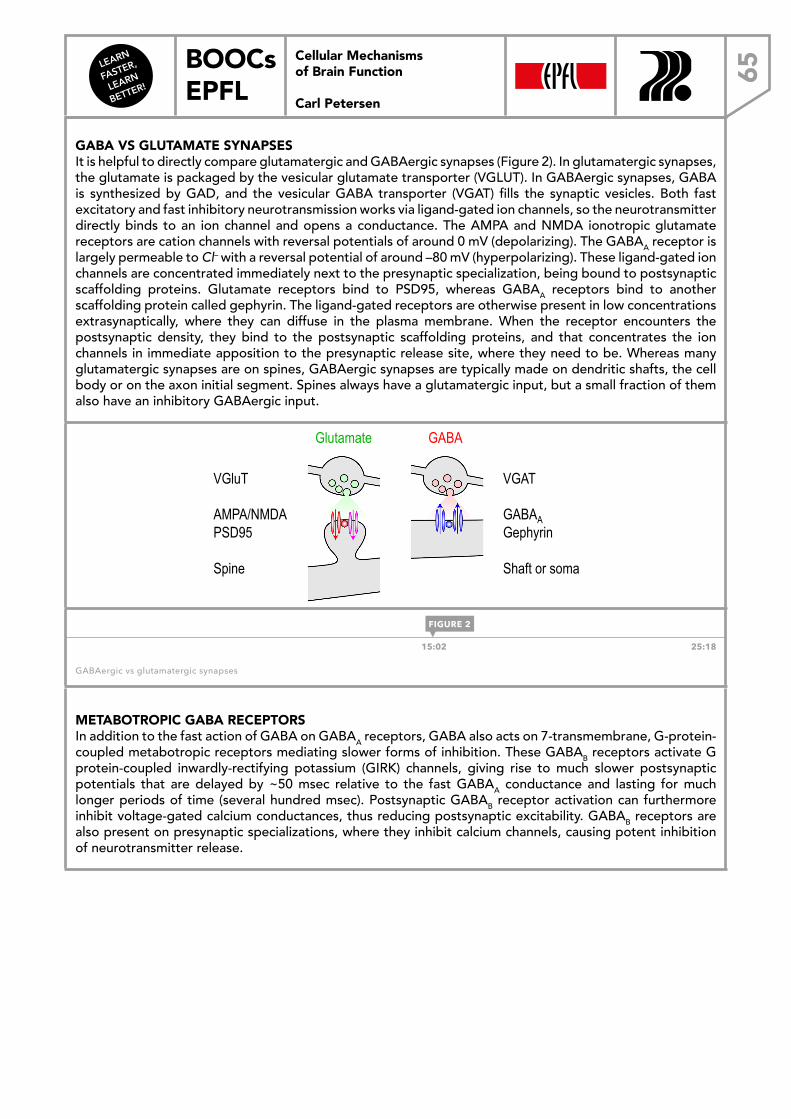
LEARN
FASTER,
LEARN
BETTER!
BOOCs EPFL 65
Cellular Mechanisms of Brain Function
Carl Petersen
GABA VS GLUTAMATE SYNAPSESIt is helpful to directly compare glutamatergic and GABAergic synapses (Figure 2). In glutamatergic synapses, the glutamate is packaged by the vesicular glutamate transporter (VGLUT). In GABAergic synapses, GABA is synthesized by GAD, and the vesicular GABA transporter (VGAT) fills the synaptic vesicles. Both fast excitatory and fast inhibitory neurotransmission works via ligand-gated ion channels, so the neurotransmitter directly binds to an ion channel and opens a conductance. The AMPA and NMDA ionotropic glutamate receptors are cation channels with reversal potentials of around 0 mV (depolarizing). The GABAA receptor is largely permeable to Cl– with a reversal potential of around –80 mV (hyperpolarizing). These ligand-gated ion channels are concentrated immediately next to the presynaptic specialization, being bound to postsynaptic scaffolding proteins. Glutamate receptors bind to PSD95, whereas GABAA receptors bind to another scaffolding protein called gephyrin. The ligand-gated receptors are otherwise present in low concentrations extrasynaptically, where they can diffuse in the plasma membrane. When the receptor encounters the postsynaptic density, they bind to the postsynaptic scaffolding proteins, and that concentrates the ion channels in immediate apposition to the presynaptic release site, where they need to be. Whereas many glutamatergic synapses are on spines, GABAergic synapses are typically made on dendritic shafts, the cell body or on the axon initial segment. Spines always have a glutamatergic input, but a small fraction of them also have an inhibitory GABAergic input.
Cellular Mechanisms of Brain Function
Glutamatergic vs GABAergic synapses
VGAT GABAA Gephyrin Shaft or soma
VGluT AMPA/NMDA PSD95 Spine
Glutamate GABA
15:02 25:18
GABAergic vs glutamatergic synapses
METABOTROPIC GABA RECEPTORSIn addition to the fast action of GABA on GABAA receptors, GABA also acts on 7-transmembrane, G-protein-coupled metabotropic receptors mediating slower forms of inhibition. These GABAB receptors activate G protein-coupled inwardly-rectifying potassium (GIRK) channels, giving rise to much slower postsynaptic potentials that are delayed by ~50 msec relative to the fast GABAA conductance and lasting for much longer periods of time (several hundred msec). Postsynaptic GABAB receptor activation can furthermore inhibit voltage-gated calcium conductances, thus reducing postsynaptic excitability. GABAB receptors are also present on presynaptic specializations, where they inhibit calcium channels, causing potent inhibition of neurotransmitter release.
FIGURE 2
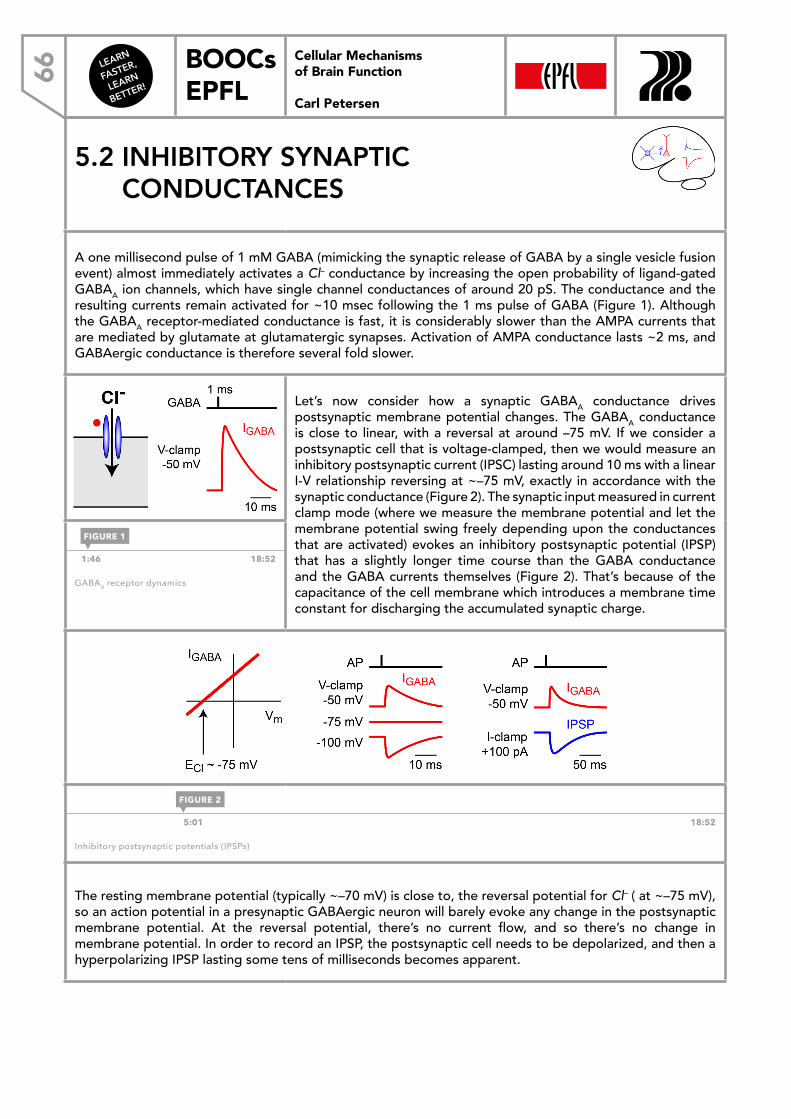
LEARN
FASTER,
LEARN
BETTER!
BOOCs EPFL66
Cellular Mechanisms of Brain Function
Carl Petersen
5.2 INHIBITORY SYNAPTIC CONDUCTANCES
A one millisecond pulse of 1 mM GABA (mimicking the synaptic release of GABA by a single vesicle fusion event) almost immediately activates a Cl– conductance by increasing the open probability of ligand-gated GABAA ion channels, which have single channel conductances of around 20 pS. The conductance and the resulting currents remain activated for ~10 msec following the 1 ms pulse of GABA (Figure 1). Although the GABAA receptor-mediated conductance is fast, it is considerably slower than the AMPA currents that are mediated by glutamate at glutamatergic synapses. Activation of AMPA conductance lasts ~2 ms, and GABAergic conductance is therefore several fold slower.
Let’s now consider how a synaptic GABAA conductance drives postsynaptic membrane potential changes. The GABAA conductance is close to linear, with a reversal at around –75 mV. If we consider a postsynaptic cell that is voltage-clamped, then we would measure an inhibitory postsynaptic current (IPSC) lasting around 10 ms with a linear I-V relationship reversing at ~–75 mV, exactly in accordance with the synaptic conductance (Figure 2). The synaptic input measured in current clamp mode (where we measure the membrane potential and let the membrane potential swing freely depending upon the conductances that are activated) evokes an inhibitory postsynaptic potential (IPSP) that has a slightly longer time course than the GABA conductance and the GABA currents themselves (Figure 2). That’s because of the capacitance of the cell membrane which introduces a membrane time constant for discharging the accumulated synaptic charge.
1:46 18:52
GABAA receptor dynamics
Cellular Mechanisms of Brain Function
Inhibitory postsynaptic potentials - IPSPs
5:01 18:52 Inhibitory postsynaptic potentials (IPSPs)
The resting membrane potential (typically ~–70 mV) is close to, the reversal potential for Cl– ( at ~–75 mV), so an action potential in a presynaptic GABAergic neuron will barely evoke any change in the postsynaptic membrane potential. At the reversal potential, there’s no current flow, and so there’s no change in membrane potential. In order to record an IPSP, the postsynaptic cell needs to be depolarized, and then a hyperpolarizing IPSP lasting some tens of milliseconds becomes apparent.
FIGURE 1
FIGURE 2
Cellular Mechanisms of Brain Function Prof. Carl Petersen
5.2 Inhibitory synaptic c
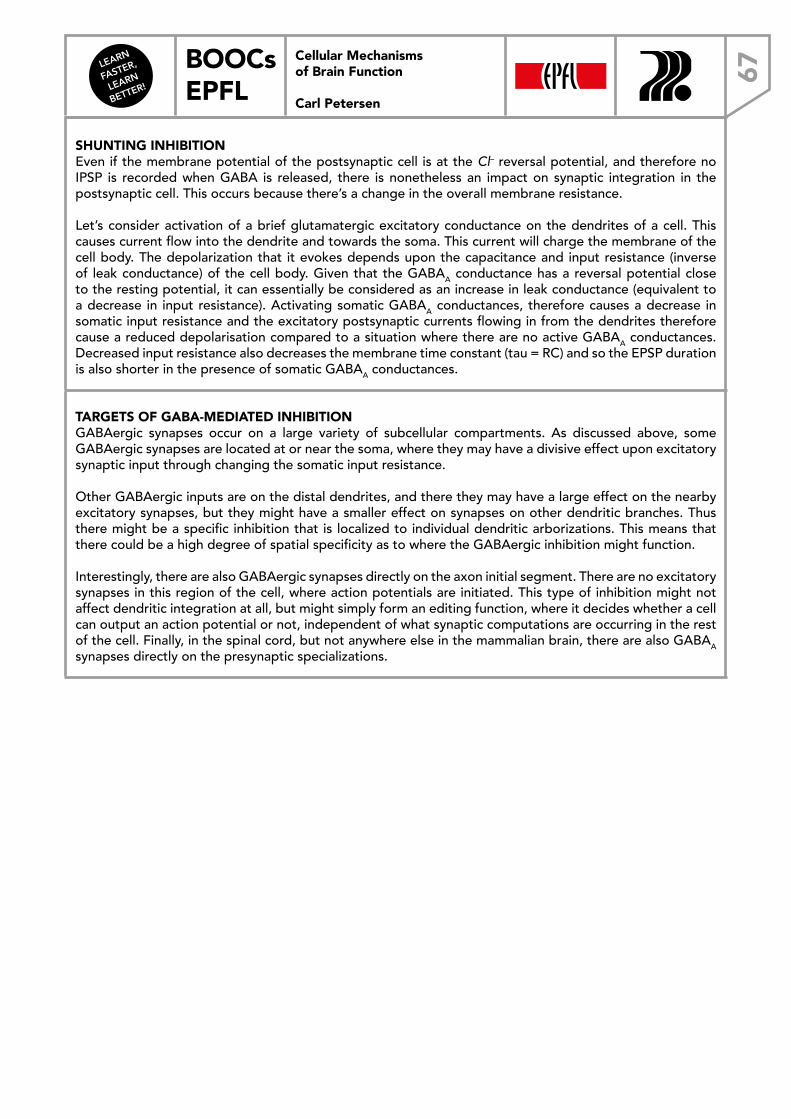
LEARN
FASTER,
LEARN
BETTER!
BOOCs EPFL 67
Cellular Mechanisms of Brain Function
Carl Petersen
SHUNTING INHIBITIONEven if the membrane potential of the postsynaptic cell is at the Cl– reversal potential, and therefore no IPSP is recorded when GABA is released, there is nonetheless an impact on synaptic integration in the postsynaptic cell. This occurs because there’s a change in the overall membrane resistance.
Let’s consider activation of a brief glutamatergic excitatory conductance on the dendrites of a cell. This causes current flow into the dendrite and towards the soma. This current will charge the membrane of the cell body. The depolarization that it evokes depends upon the capacitance and input resistance (inverse of leak conductance) of the cell body. Given that the GABAA conductance has a reversal potential close to the resting potential, it can essentially be considered as an increase in leak conductance (equivalent to a decrease in input resistance). Activating somatic GABAA conductances, therefore causes a decrease in somatic input resistance and the excitatory postsynaptic currents flowing in from the dendrites therefore cause a reduced depolarisation compared to a situation where there are no active GABAA conductances. Decreased input resistance also decreases the membrane time constant (tau = RC) and so the EPSP duration is also shorter in the presence of somatic GABAA conductances.
TARGETS OF GABA-MEDIATED INHIBITIONGABAergic synapses occur on a large variety of subcellular compartments. As discussed above, some GABAergic synapses are located at or near the soma, where they may have a divisive effect upon excitatory synaptic input through changing the somatic input resistance.
Other GABAergic inputs are on the distal dendrites, and there they may have a large effect on the nearby excitatory synapses, but they might have a smaller effect on synapses on other dendritic branches. Thus there might be a specific inhibition that is localized to individual dendritic arborizations. This means that there could be a high degree of spatial specificity as to where the GABAergic inhibition might function.
Interestingly, there are also GABAergic synapses directly on the axon initial segment. There are no excitatory synapses in this region of the cell, where action potentials are initiated. This type of inhibition might not affect dendritic integration at all, but might simply form an editing function, where it decides whether a cell can output an action potential or not, independent of what synaptic computations are occurring in the rest of the cell. Finally, in the spinal cord, but not anywhere else in the mammalian brain, there are also GABAA synapses directly on the presynaptic specializations.
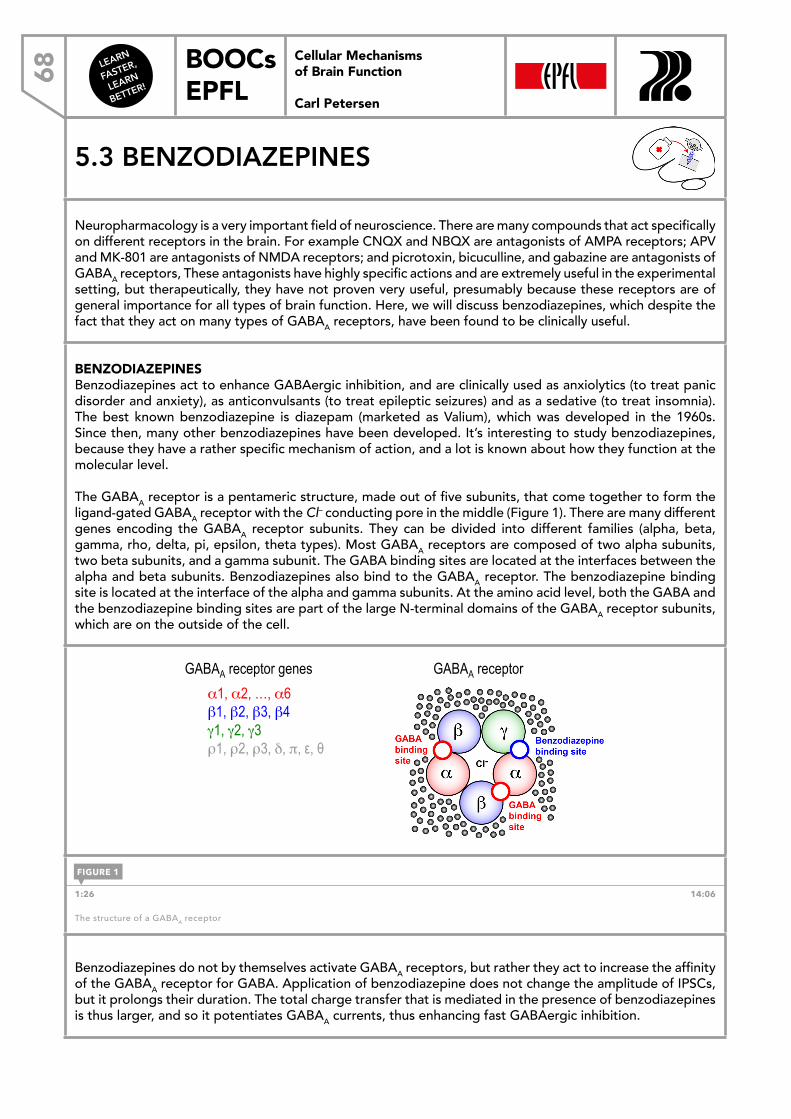
LEARN
FASTER,
LEARN
BETTER!
BOOCs EPFL68
Cellular Mechanisms of Brain Function
Carl Petersen
5.3 BENZODIAZEPINES
Neuropharmacology is a very important field of neuroscience. There are many compounds that act specifically on different receptors in the brain. For example CNQX and NBQX are antagonists of AMPA receptors; APV and MK-801 are antagonists of NMDA receptors; and picrotoxin, bicuculline, and gabazine are antagonists of GABAA receptors, These antagonists have highly specific actions and are extremely useful in the experimental setting, but therapeutically, they have not proven very useful, presumably because these receptors are of general importance for all types of brain function. Here, we will discuss benzodiazepines, which despite the fact that they act on many types of GABAA receptors, have been found to be clinically useful.
BENZODIAZEPINESBenzodiazepines act to enhance GABAergic inhibition, and are clinically used as anxiolytics (to treat panic disorder and anxiety), as anticonvulsants (to treat epileptic seizures) and as a sedative (to treat insomnia). The best known benzodiazepine is diazepam (marketed as Valium), which was developed in the 1960s. Since then, many other benzodiazepines have been developed. It’s interesting to study benzodiazepines, because they have a rather specific mechanism of action, and a lot is known about how they function at the molecular level.
The GABAA receptor is a pentameric structure, made out of five subunits, that come together to form the ligand-gated GABAA receptor with the Cl– conducting pore in the middle (Figure 1). There are many different genes encoding the GABAA receptor subunits. They can be divided into different families (alpha, beta, gamma, rho, delta, pi, epsilon, theta types). Most GABAA receptors are composed of two alpha subunits, two beta subunits, and a gamma subunit. The GABA binding sites are located at the interfaces between the alpha and beta subunits. Benzodiazepines also bind to the GABAA receptor. The benzodiazepine binding site is located at the interface of the alpha and gamma subunits. At the amino acid level, both the GABA and the benzodiazepine binding sites are part of the large N-terminal domains of the GABAA receptor subunits, which are on the outside of the cell.
Cellular Mechanisms of Brain Function
Structure of GABAA receptors
GABAA receptor genes
α1, α2, …, α6 β1, β2, β3, β4 γ1, γ2, γ3 ρ1, ρ2, ρ3, δ, π, ε, θ
GABAA receptor
1:26 14:06
The structure of a GABAA receptor
Benzodiazepines do not by themselves activate GABAA receptors, but rather they act to increase the affinity of the GABAA receptor for GABA. Application of benzodiazepine does not change the amplitude of IPSCs, but it prolongs their duration. The total charge transfer that is mediated in the presence of benzodiazepines is thus larger, and so it potentiates GABAA currents, thus enhancing fast GABAergic inhibition.
FIGURE 1
Cellular Mechanisms of Brain Function Prof. Carl Petersen
5.3 Benzodiazepines
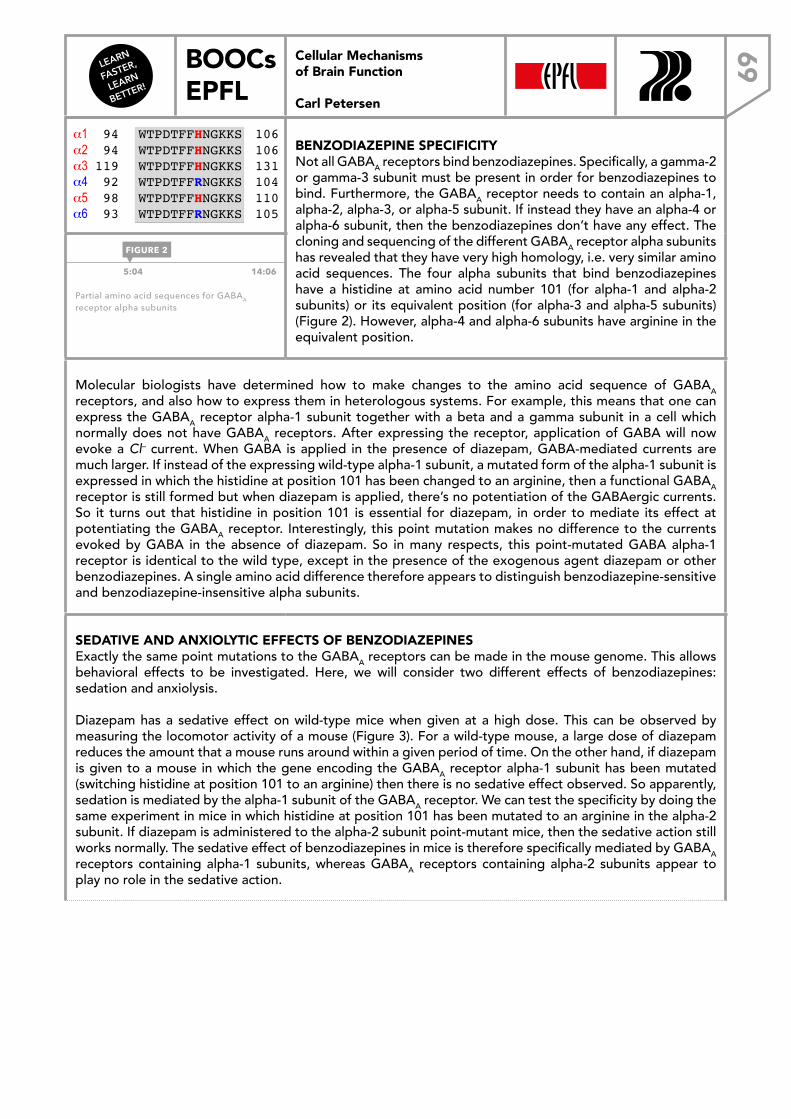
LEARN
FASTER,
LEARN
BETTER!
BOOCs EPFL 69
Cellular Mechanisms of Brain Function
Carl Petersen
Cellular Mechanisms of Brain Function
Amino acid sequences of GABAA receptors
Not all GABAA-α subunits are sensitive to benzodiazepines. Benzodiazepines potentiate GABAA receptors containing the α1, α2, α3 or α5 subunits, but it has no effect upon α4 /α6.
Amino acid sequences:
α1! 94 !WTPDTFFHNGKKS! 106! α2! 94 !WTPDTFFHNGKKS! 106! α3 !119 !WTPDTFFHNGKKS! 131! α4 ! 92 !WTPDTFFRNGKKS! 104! α5 ! 98 !WTPDTFFHNGKKS! 110! α6! 93 !WTPDTFFRNGKKS! 105!
BENZODIAZEPINE SPECIFICITYNot all GABAA receptors bind benzodiazepines. Specifically, a gamma-2 or gamma-3 subunit must be present in order for benzodiazepines to bind. Furthermore, the GABAA receptor needs to contain an alpha-1, alpha-2, alpha-3, or alpha-5 subunit. If instead they have an alpha-4 or alpha-6 subunit, then the benzodiazepines don’t have any effect. The cloning and sequencing of the different GABAA receptor alpha subunits has revealed that they have very high homology, i.e. very similar amino acid sequences. The four alpha subunits that bind benzodiazepines have a histidine at amino acid number 101 (for alpha-1 and alpha-2 subunits) or its equivalent position (for alpha-3 and alpha-5 subunits) (Figure 2). However, alpha-4 and alpha-6 subunits have arginine in the equivalent position.
5:04 14:06
Partial amino acid sequences for GABAA receptor alpha subunits
Molecular biologists have determined how to make changes to the amino acid sequence of GABAA receptors, and also how to express them in heterologous systems. For example, this means that one can express the GABAA receptor alpha-1 subunit together with a beta and a gamma subunit in a cell which normally does not have GABAA receptors. After expressing the receptor, application of GABA will now evoke a Cl– current. When GABA is applied in the presence of diazepam, GABA-mediated currents are much larger. If instead of the expressing wild-type alpha-1 subunit, a mutated form of the alpha-1 subunit is expressed in which the histidine at position 101 has been changed to an arginine, then a functional GABAA receptor is still formed but when diazepam is applied, there’s no potentiation of the GABAergic currents. So it turns out that histidine in position 101 is essential for diazepam, in order to mediate its effect at potentiating the GABAA receptor. Interestingly, this point mutation makes no difference to the currents evoked by GABA in the absence of diazepam. So in many respects, this point-mutated GABA alpha-1 receptor is identical to the wild type, except in the presence of the exogenous agent diazepam or other benzodiazepines. A single amino acid difference therefore appears to distinguish benzodiazepine-sensitive and benzodiazepine-insensitive alpha subunits.
SEDATIVE AND ANXIOLYTIC EFFECTS OF BENZODIAZEPINESExactly the same point mutations to the GABAA receptors can be made in the mouse genome. This allows behavioral effects to be investigated. Here, we will consider two different effects of benzodiazepines: sedation and anxiolysis.
Diazepam has a sedative effect on wild-type mice when given at a high dose. This can be observed by measuring the locomotor activity of a mouse (Figure 3). For a wild-type mouse, a large dose of diazepam reduces the amount that a mouse runs around within a given period of time. On the other hand, if diazepam is given to a mouse in which the gene encoding the GABAA receptor alpha-1 subunit has been mutated (switching histidine at position 101 to an arginine) then there is no sedative effect observed. So apparently, sedation is mediated by the alpha-1 subunit of the GABAA receptor. We can test the specificity by doing the same experiment in mice in which histidine at position 101 has been mutated to an arginine in the alpha-2 subunit. If diazepam is administered to the alpha-2 subunit point-mutant mice, then the sedative action still works normally. The sedative effect of benzodiazepines in mice is therefore specifically mediated by GABAA receptors containing alpha-1 subunits, whereas GABAA receptors containing alpha-2 subunits appear to play no role in the sedative action.
FIGURE 2
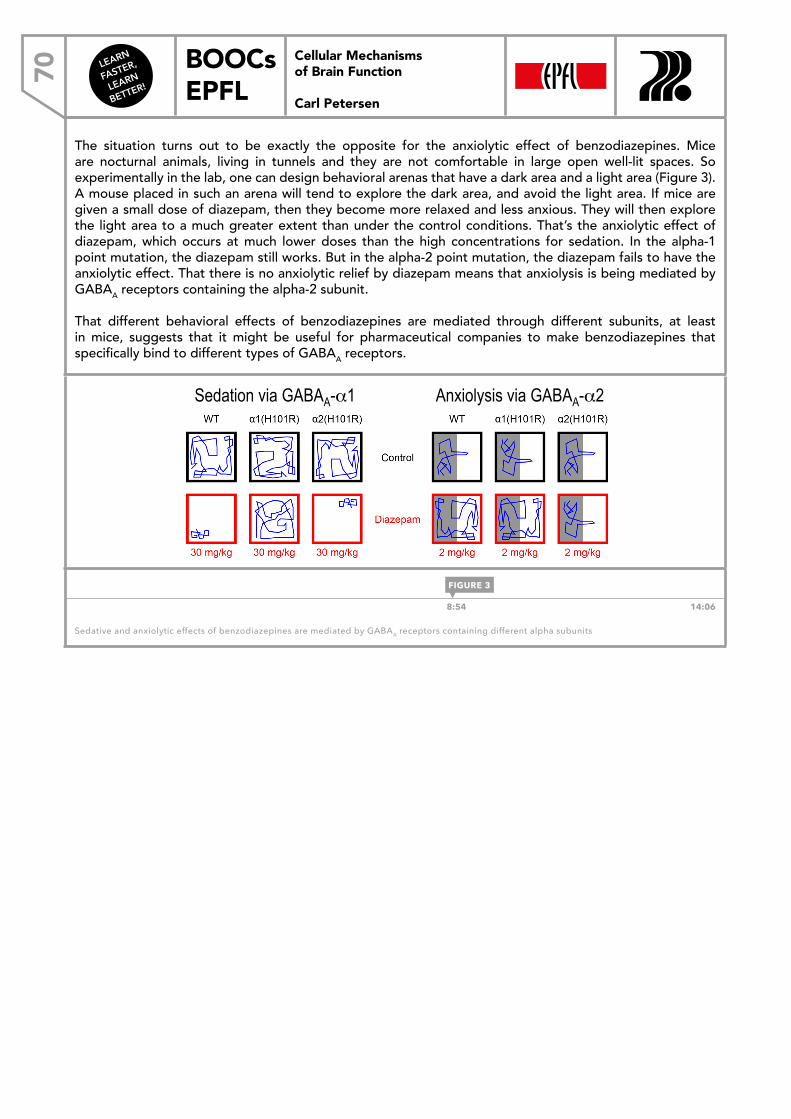
LEARN
FASTER,
LEARN
BETTER!
BOOCs EPFL70
Cellular Mechanisms of Brain Function
Carl Petersen
The situation turns out to be exactly the opposite for the anxiolytic effect of benzodiazepines. Mice are nocturnal animals, living in tunnels and they are not comfortable in large open well-lit spaces. So experimentally in the lab, one can design behavioral arenas that have a dark area and a light area (Figure 3). A mouse placed in such an arena will tend to explore the dark area, and avoid the light area. If mice are given a small dose of diazepam, then they become more relaxed and less anxious. They will then explore the light area to a much greater extent than under the control conditions. That’s the anxiolytic effect of diazepam, which occurs at much lower doses than the high concentrations for sedation. In the alpha-1 point mutation, the diazepam still works. But in the alpha-2 point mutation, the diazepam fails to have the anxiolytic effect. That there is no anxiolytic relief by diazepam means that anxiolysis is being mediated by GABAA receptors containing the alpha-2 subunit.
That different behavioral effects of benzodiazepines are mediated through different subunits, at least in mice, suggests that it might be useful for pharmaceutical companies to make benzodiazepines that specifically bind to different types of GABAA receptors.
Cellular Mechanisms of Brain Function
Mutating GABAA receptors in the mouse genome
Through genome editing, we can change H (histidine) to R (arginine) in specific subunits of GABAA receptors in living mice.
Sedation via GABAA-α1 Anxiolysis via GABAA-α2
8:54 14:06
Sedative and anxiolytic effects of benzodiazepines are mediated by GABAA receptors containing different alpha subunits
FIGURE 3
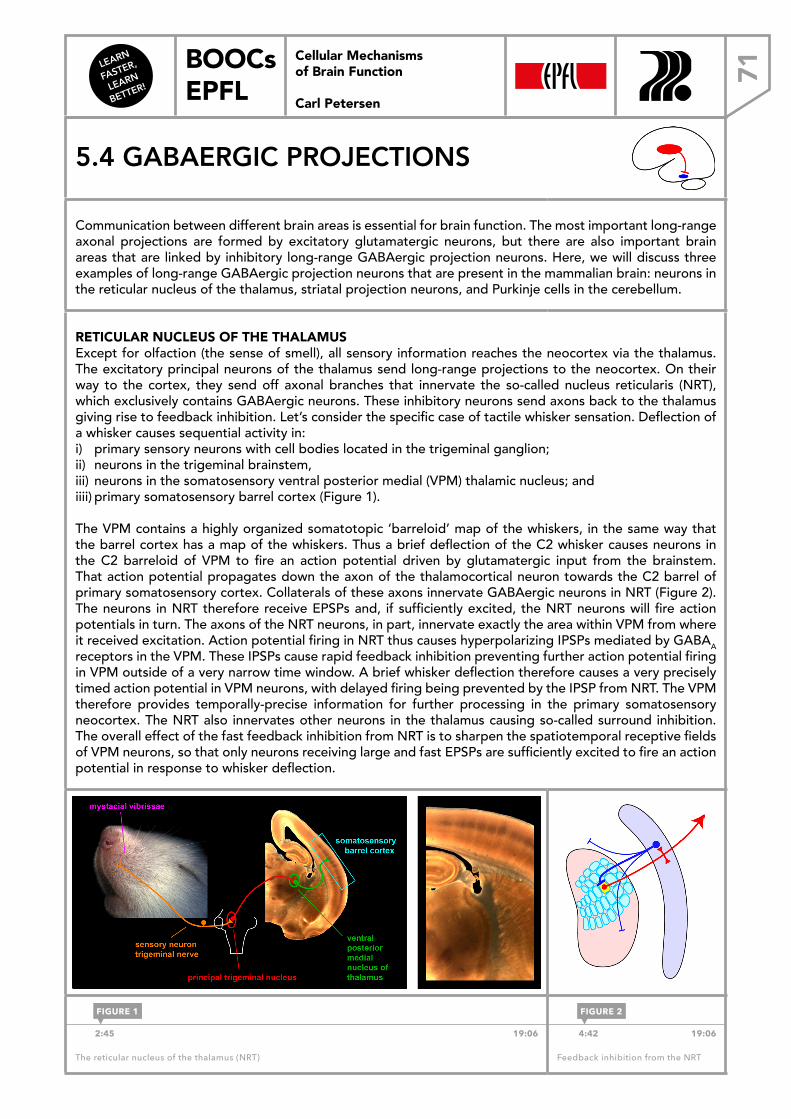
LEARN
FASTER,
LEARN
BETTER!
BOOCs EPFL 71
Cellular Mechanisms of Brain Function
Carl Petersen
5.4 GABAERGIC PROJECTIONS
Communication between different brain areas is essential for brain function. The most important long-range axonal projections are formed by excitatory glutamatergic neurons, but there are also important brain areas that are linked by inhibitory long-range GABAergic projection neurons. Here, we will discuss three examples of long-range GABAergic projection neurons that are present in the mammalian brain: neurons in the reticular nucleus of the thalamus, striatal projection neurons, and Purkinje cells in the cerebellum.
RETICULAR NUCLEUS OF THE THALAMUSExcept for olfaction (the sense of smell), all sensory information reaches the neocortex via the thalamus. The excitatory principal neurons of the thalamus send long-range projections to the neocortex. On their way to the cortex, they send off axonal branches that innervate the so-called nucleus reticularis (NRT), which exclusively contains GABAergic neurons. These inhibitory neurons send axons back to the thalamus giving rise to feedback inhibition. Let’s consider the specific case of tactile whisker sensation. Deflection of a whisker causes sequential activity in: i) primary sensory neurons with cell bodies located in the trigeminal ganglion; ii) neurons in the trigeminal brainstem, iii) neurons in the somatosensory ventral posterior medial (VPM) thalamic nucleus; and iiii) primary somatosensory barrel cortex (Figure 1).
The VPM contains a highly organized somatotopic ‘barreloid’ map of the whiskers, in the same way that the barrel cortex has a map of the whiskers. Thus a brief deflection of the C2 whisker causes neurons in the C2 barreloid of VPM to fire an action potential driven by glutamatergic input from the brainstem. That action potential propagates down the axon of the thalamocortical neuron towards the C2 barrel of primary somatosensory cortex. Collaterals of these axons innervate GABAergic neurons in NRT (Figure 2). The neurons in NRT therefore receive EPSPs and, if sufficiently excited, the NRT neurons will fire action potentials in turn. The axons of the NRT neurons, in part, innervate exactly the area within VPM from where it received excitation. Action potential firing in NRT thus causes hyperpolarizing IPSPs mediated by GABAA receptors in the VPM. These IPSPs cause rapid feedback inhibition preventing further action potential firing in VPM outside of a very narrow time window. A brief whisker deflection therefore causes a very precisely timed action potential in VPM neurons, with delayed firing being prevented by the IPSP from NRT. The VPM therefore provides temporally-precise information for further processing in the primary somatosensory neocortex. The NRT also innervates other neurons in the thalamus causing so-called surround inhibition. The overall effect of the fast feedback inhibition from NRT is to sharpen the spatiotemporal receptive fields of VPM neurons, so that only neurons receiving large and fast EPSPs are sufficiently excited to fire an action potential in response to whisker deflection.
Cellular Mechanisms of Brain Function
1. The reticular nucleus of the thalamus
Petersen, 2003 Cellular Mechanisms of Brain Function
Fast GABAergic feedback inhibition
2:45 19:06
The reticular nucleus of the thalamus (NRT)
4:42 19:06
Feedback inhibition from the NRT
FIGURE 1 FIGURE 2
Cellular Mechanisms of Brain Function Prof. Carl Petersen
5.4 GABAergic projecti
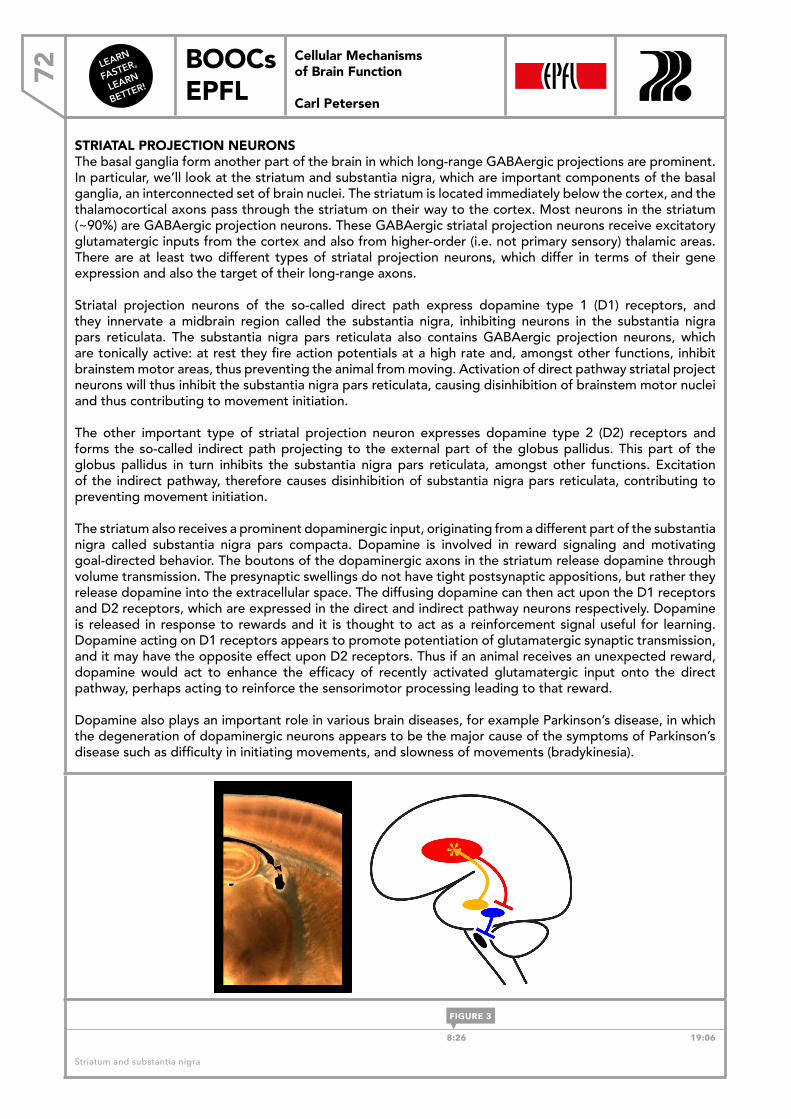
LEARN
FASTER,
LEARN
BETTER!
BOOCs EPFL72
Cellular Mechanisms of Brain Function
Carl Petersen
STRIATAL PROJECTION NEURONSThe basal ganglia form another part of the brain in which long-range GABAergic projections are prominent. In particular, we’ll look at the striatum and substantia nigra, which are important components of the basal ganglia, an interconnected set of brain nuclei. The striatum is located immediately below the cortex, and the thalamocortical axons pass through the striatum on their way to the cortex. Most neurons in the striatum (~90%) are GABAergic projection neurons. These GABAergic striatal projection neurons receive excitatory glutamatergic inputs from the cortex and also from higher-order (i.e. not primary sensory) thalamic areas. There are at least two different types of striatal projection neurons, which differ in terms of their gene expression and also the target of their long-range axons.
Striatal projection neurons of the so-called direct path express dopamine type 1 (D1) receptors, and they innervate a midbrain region called the substantia nigra, inhibiting neurons in the substantia nigra pars reticulata. The substantia nigra pars reticulata also contains GABAergic projection neurons, which are tonically active: at rest they fire action potentials at a high rate and, amongst other functions, inhibit brainstem motor areas, thus preventing the animal from moving. Activation of direct pathway striatal project neurons will thus inhibit the substantia nigra pars reticulata, causing disinhibition of brainstem motor nuclei and thus contributing to movement initiation.
The other important type of striatal projection neuron expresses dopamine type 2 (D2) receptors and forms the so-called indirect path projecting to the external part of the globus pallidus. This part of the globus pallidus in turn inhibits the substantia nigra pars reticulata, amongst other functions. Excitation of the indirect pathway, therefore causes disinhibition of substantia nigra pars reticulata, contributing to preventing movement initiation.
The striatum also receives a prominent dopaminergic input, originating from a different part of the substantia nigra called substantia nigra pars compacta. Dopamine is involved in reward signaling and motivating goal-directed behavior. The boutons of the dopaminergic axons in the striatum release dopamine through volume transmission. The presynaptic swellings do not have tight postsynaptic appositions, but rather they release dopamine into the extracellular space. The diffusing dopamine can then act upon the D1 receptors and D2 receptors, which are expressed in the direct and indirect pathway neurons respectively. Dopamine is released in response to rewards and it is thought to act as a reinforcement signal useful for learning. Dopamine acting on D1 receptors appears to promote potentiation of glutamatergic synaptic transmission, and it may have the opposite effect upon D2 receptors. Thus if an animal receives an unexpected reward, dopamine would act to enhance the efficacy of recently activated glutamatergic input onto the direct pathway, perhaps acting to reinforce the sensorimotor processing leading to that reward.
Dopamine also plays an important role in various brain diseases, for example Parkinson’s disease, in which the degeneration of dopaminergic neurons appears to be the major cause of the symptoms of Parkinson’s disease such as difficulty in initiating movements, and slowness of movements (bradykinesia).
Cellular Mechanisms of Brain Function
2. Striatum and substantia nigra
GABAergic striatal projection neurons inhibit tonically active GABAergic neurons in substantia nigra (SNr).
Dopaminergic neurons in a different part of the substantia nigra (SNc) project strongly to the striatum.
8:26 19:06
Striatum and substantia nigra
FIGURE 3

LEARN
FASTER,
LEARN
BETTER!
BOOCs EPFL 73
Cellular Mechanisms of Brain Function
Carl Petersen
PURKINJE CELLS OF THE CEREBELLUMThe output neurons of the cerebellum are also long-range GABAergic projection neurons. The cerebellum is thought to be involved in sensorimotor learning and also higher cognitive functions. It receives sensory information both from descending and ascending pathways, and it uses that sensory information to tune motor output. The GABAergic projection neurons of the cerebellum are called Purkinje cells. They have complex spiny dendrites which lie in a flat plane. The Purkinje cells inhibit the deep cerebellar nuclei and form the sole output of the cerebellum. It is interesting to note that the output of the neocortex is formed by glutamatergic excitatory pyramidal neurons, whereas the output of the cerebellum is formed by inhibitory GABAergic Purkinje cells.
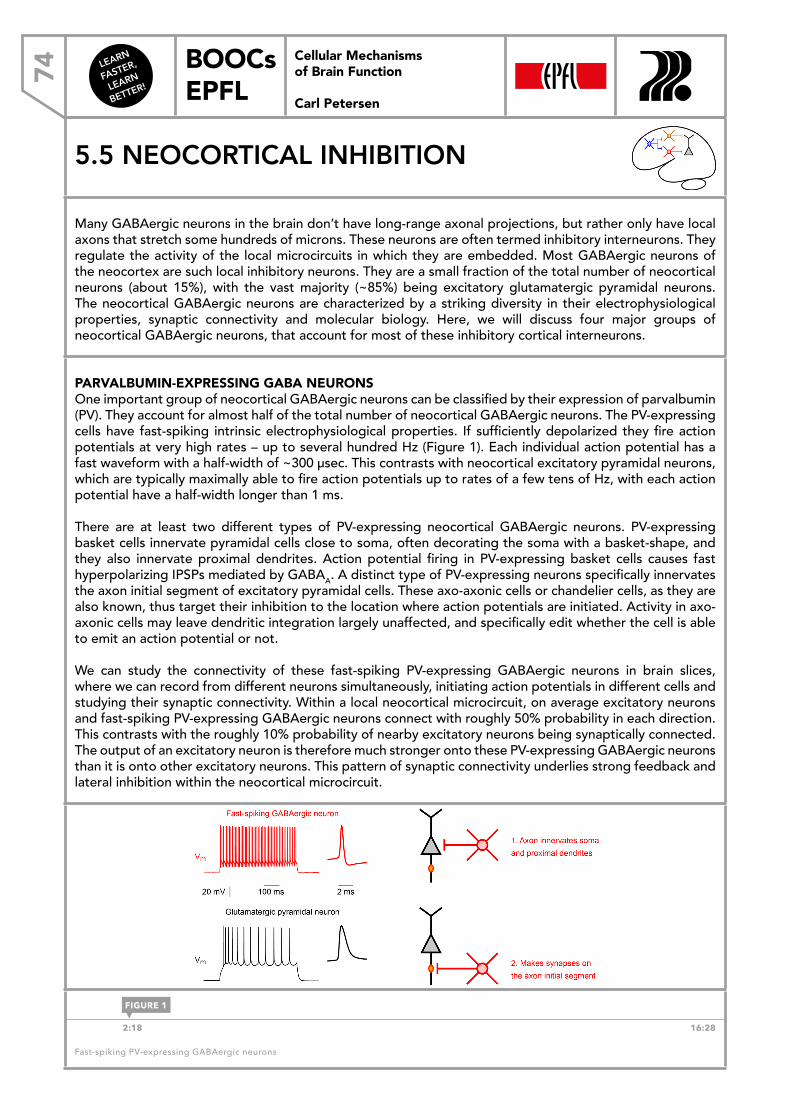
LEARN
FASTER,
LEARN
BETTER!
BOOCs EPFL74
Cellular Mechanisms of Brain Function
Carl Petersen
5.5 NEOCORTICAL INHIBITION
Many GABAergic neurons in the brain don’t have long-range axonal projections, but rather only have local axons that stretch some hundreds of microns. These neurons are often termed inhibitory interneurons. They regulate the activity of the local microcircuits in which they are embedded. Most GABAergic neurons of the neocortex are such local inhibitory neurons. They are a small fraction of the total number of neocortical neurons (about 15%), with the vast majority (~85%) being excitatory glutamatergic pyramidal neurons. The neocortical GABAergic neurons are characterized by a striking diversity in their electrophysiological properties, synaptic connectivity and molecular biology. Here, we will discuss four major groups of neocortical GABAergic neurons, that account for most of these inhibitory cortical interneurons.
PARVALBUMIN-EXPRESSING GABA NEURONSOne important group of neocortical GABAergic neurons can be classified by their expression of parvalbumin (PV). They account for almost half of the total number of neocortical GABAergic neurons. The PV-expressing cells have fast-spiking intrinsic electrophysiological properties. If sufficiently depolarized they fire action potentials at very high rates – up to several hundred Hz (Figure 1). Each individual action potential has a fast waveform with a half-width of ~300 µsec. This contrasts with neocortical excitatory pyramidal neurons, which are typically maximally able to fire action potentials up to rates of a few tens of Hz, with each action potential have a half-width longer than 1 ms.
There are at least two different types of PV-expressing neocortical GABAergic neurons. PV-expressing basket cells innervate pyramidal cells close to soma, often decorating the soma with a basket-shape, and they also innervate proximal dendrites. Action potential firing in PV-expressing basket cells causes fast hyperpolarizing IPSPs mediated by GABAA. A distinct type of PV-expressing neurons specifically innervates the axon initial segment of excitatory pyramidal cells. These axo-axonic cells or chandelier cells, as they are also known, thus target their inhibition to the location where action potentials are initiated. Activity in axo-axonic cells may leave dendritic integration largely unaffected, and specifically edit whether the cell is able to emit an action potential or not.
We can study the connectivity of these fast-spiking PV-expressing GABAergic neurons in brain slices, where we can record from different neurons simultaneously, initiating action potentials in different cells and studying their synaptic connectivity. Within a local neocortical microcircuit, on average excitatory neurons and fast-spiking PV-expressing GABAergic neurons connect with roughly 50% probability in each direction. This contrasts with the roughly 10% probability of nearby excitatory neurons being synaptically connected. The output of an excitatory neuron is therefore much stronger onto these PV-expressing GABAergic neurons than it is onto other excitatory neurons. This pattern of synaptic connectivity underlies strong feedback and lateral inhibition within the neocortical microcircuit.
Cellular Mechanisms of Brain Function
1. Fast-spiking, parvalbumin-expressing cells
2:18 16:28
Fast-spiking PV-expressing GABAergic neurons
FIGURE 1
Cellular Mechanisms of Brain Function Prof. Carl Petersen
5.5 Neocortical inhibit
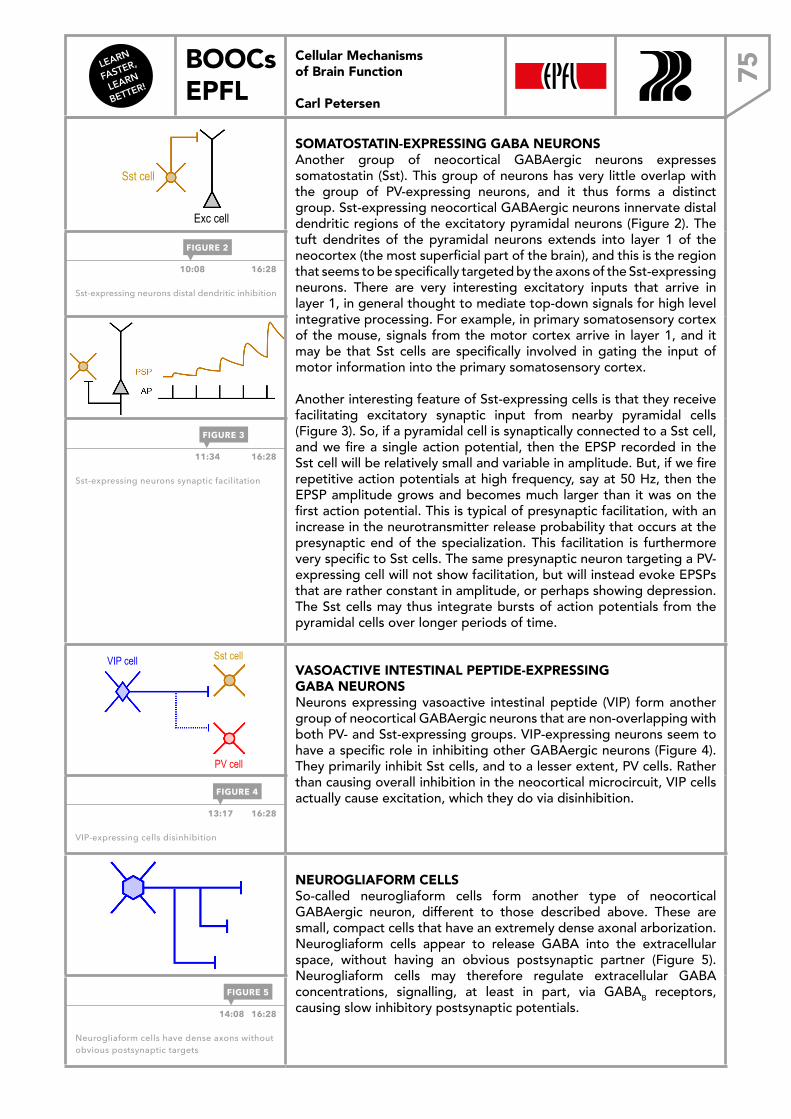
LEARN
FASTER,
LEARN
BETTER!
BOOCs EPFL 75
Cellular Mechanisms of Brain Function
Carl Petersen
Cellular Mechanisms of Brain Function
2. Somatostatin-expressing GABAergic neurons
Somatostatin-expressing (Sst) GABAergic neurons of the necortex strongly innervate distal dendrites of excitatory (Exc) pyramidal neurons. Sst cells - distal dendritic inhibition
Sst cell
Exc cell
SOMATOSTATIN-EXPRESSING GABA NEURONSAnother group of neocortical GABAergic neurons expresses somatostatin (Sst). This group of neurons has very little overlap with the group of PV-expressing neurons, and it thus forms a distinct group. Sst-expressing neocortical GABAergic neurons innervate distal dendritic regions of the excitatory pyramidal neurons (Figure 2). The tuft dendrites of the pyramidal neurons extends into layer 1 of the neocortex (the most superficial part of the brain), and this is the region that seems to be specifically targeted by the axons of the Sst-expressing neurons. There are very interesting excitatory inputs that arrive in layer 1, in general thought to mediate top-down signals for high level integrative processing. For example, in primary somatosensory cortex of the mouse, signals from the motor cortex arrive in layer 1, and it may be that Sst cells are specifically involved in gating the input of motor information into the primary somatosensory cortex.
Another interesting feature of Sst-expressing cells is that they receive facilitating excitatory synaptic input from nearby pyramidal cells (Figure 3). So, if a pyramidal cell is synaptically connected to a Sst cell, and we fire a single action potential, then the EPSP recorded in the Sst cell will be relatively small and variable in amplitude. But, if we fire repetitive action potentials at high frequency, say at 50 Hz, then the EPSP amplitude grows and becomes much larger than it was on the first action potential. This is typical of presynaptic facilitation, with an increase in the neurotransmitter release probability that occurs at the presynaptic end of the specialization. This facilitation is furthermore very specific to Sst cells. The same presynaptic neuron targeting a PV-expressing cell will not show facilitation, but will instead evoke EPSPs that are rather constant in amplitude, or perhaps showing depression. The Sst cells may thus integrate bursts of action potentials from the pyramidal cells over longer periods of time.
10:08 16:28
Sst-expressing neurons distal dendritic inhibition
11:34 16:28
Sst-expressing neurons synaptic facilitation
Cellular Mechanisms of Brain Function
3. VIP-expressing GABAergic neurons
Vasoactive intestinal peptide-expressing (VIP) GABAergic neurons inhibit other inhibitory neurons, especially Sst neurons. VIP cells – dis-inhibition
VIP cell Sst cell
PV cell
VASOACTIVE INTESTINAL PEPTIDE-EXPRESSING GABA NEURONSNeurons expressing vasoactive intestinal peptide (VIP) form another group of neocortical GABAergic neurons that are non-overlapping with both PV- and Sst-expressing groups. VIP-expressing neurons seem to have a specific role in inhibiting other GABAergic neurons (Figure 4). They primarily inhibit Sst cells, and to a lesser extent, PV cells. Rather than causing overall inhibition in the neocortical microcircuit, VIP cells actually cause excitation, which they do via disinhibition.
13:17 16:28
VIP-expressing cells disinhibition
Cellular Mechanisms of Brain Function
4. Neurogliaform GABAergic neurons
Neurogliaform cells release GABA into the extracellular space, thereby mediating volume transmission activating GABABRs to drive slow IPSPs.
NEUROGLIAFORM CELLSSo-called neurogliaform cells form another type of neocortical GABAergic neuron, different to those described above. These are small, compact cells that have an extremely dense axonal arborization. Neurogliaform cells appear to release GABA into the extracellular space, without having an obvious postsynaptic partner (Figure 5). Neurogliaform cells may therefore regulate extracellular GABA concentrations, signalling, at least in part, via GABAB receptors, causing slow inhibitory postsynaptic potentials. 14:08 16:28
Neurogliaform cells have dense axons without obvious postsynaptic targets
FIGURE 2
FIGURE 3
FIGURE 4
FIGURE 5
LEARN
FASTER,
LEARN
BETTER!
BOOCs EPFL76
Cellular Mechanisms of Brain Function
Carl Petersen
6.1 BRAIN FUNCTION AND BEHAVIOR
The purpose of the brain is to govern behavior. It is therefore essential to investigate brain function during behavior. In order to obtain a causal and mechanistic understanding, we need to investigate brain function at the level of individual neurons and their synaptic interactions in behaving animals. There are three essential aspects of neuroscience research that need to be integrated to gain a causal understanding of the mechanisms driving any given behavior: 1. Measurement of neuronal activity during the behavior; 2. Precise perturbation of neuronal activity during the behavior; and 3. Computational modeling of the neuronal network activity.
MEASUREMENT OF NEURONAL ACTIVITY DURING BEHAVIORThe first goal is to measure neuronal activity in the living brain and to correlate it directly with ongoing behaviors. If we do not find a correlation of neuronal activity and behavior, then the neuronal activity that is being measured cannot contribute to driving the behavior being studied. Measurement and correlation of neuronal activity with behavior is therefore a good starting point for research into the mechanisms underlying behavior. At the level of cells and synapses, there are two methods that so far have proved to be extremely useful: electrophysiology and optical imaging.
With the electrophysiological approach, we introduce recording electrodes into the brain. We have already considered whole-cell patch-clamp recordings of membrane potential applied to brain slices in vitro , and it turns out that, with small modifications, this method can also be applied to study the brain in action, in vivo, during behavior. It is also possible to make extracellular recordings of action potential firing. To date, we’ve treated the potential of the extracellular solution as being isopotential and fixed at 0 mV. In fact, this turns out not to be completely true, and there are in fact small changes in extracellular potentials, from which one can infer about the firing of neurons.
Electrophysiological measurements certainly prove useful in correlating neuronal activity with behavior, but they are invasive and have a number of important limitations. Optical imaging techniques, and in particular fluorescence microscopy, are developing into extremely effective methods for high-resolution structural and functional measurements of the brain. Furthermore, it is possible for these techniques to be carried out in the living brain and to correlate measurements with behavior.
PRECISE PERTURBATION OF NEURONAL ACTIVITY DURING BEHAVIORCorrelations do not necessarily imply causality, and so if we want to investigate the causal impact of a specific neuronal activity, we need to specifically perturb that activity. We need to be able to take control of the neurons and neuronal circuits and see what effect that has on behavior. In the past, researchers have relied on lesions, brain damage, disease, stimulation, or pharmacological manipulations, all of which lack specificity in space and time. It has therefore been difficult to get precise information about the causal impact of specific types of neuronal activity. Over the last few years, a revolution in neuroscience has taken place with the development of optogenetics, a method for controlling neuronal activity through light. This occurs by expressing specific light-sensitive proteins that then affect the activity of specific nerve cells. We use genetics to put these optogenetic actuators into specific cell types, and we can then shine light on specific neurons or parts of neurons gaining high spatiotemporal resolution.
Cellular Mechanisms of Brain Function Prof. Carl Petersen
6.1 Brain function and b

LEARN
FASTER,
LEARN
BETTER!
BOOCs EPFL 77
Cellular Mechanisms of Brain Function
Carl Petersen
COMPUTATIONAL MODELING OF NEURONAL NETWORKSThe next step is to investigate how those measurements and perturbations fit together. In order to do so, we need to quantitatively model the phenomena, which will give us causal mechanistic insight and allow us to test specific hypotheses. Unfortunately, we currently have a very incomplete understanding of neuronal circuits in the mammalian brain, and we’re far from having an understanding of even the simplest behaviors. The brain is highly interconnected, so it is an extremely complex question as to how we can quantitatively model its neuronal networks. But, we are able to make certain simplifications. Although many brain regions are highly interconnected, there is also a high degree of modularity, reminiscent of small world networks. Such subnetworks may be amenable to detailed cellular and synaptic modeling, which is now becoming feasible with increases in computing power.
HYPOTHESIS TESTING AND THE SCIENTIFIC METHODIn 1934 Karl Popper published his highly influential treatise “The logic of scientific discovery”. One important point he raised was that experimental science can only falsify hypotheses, but cannot prove them to be true. The nature of the scientific method is therefore to keep testing and updating our hypotheses, so that they are at least consistent with the facts, but we will not be able to prove them.
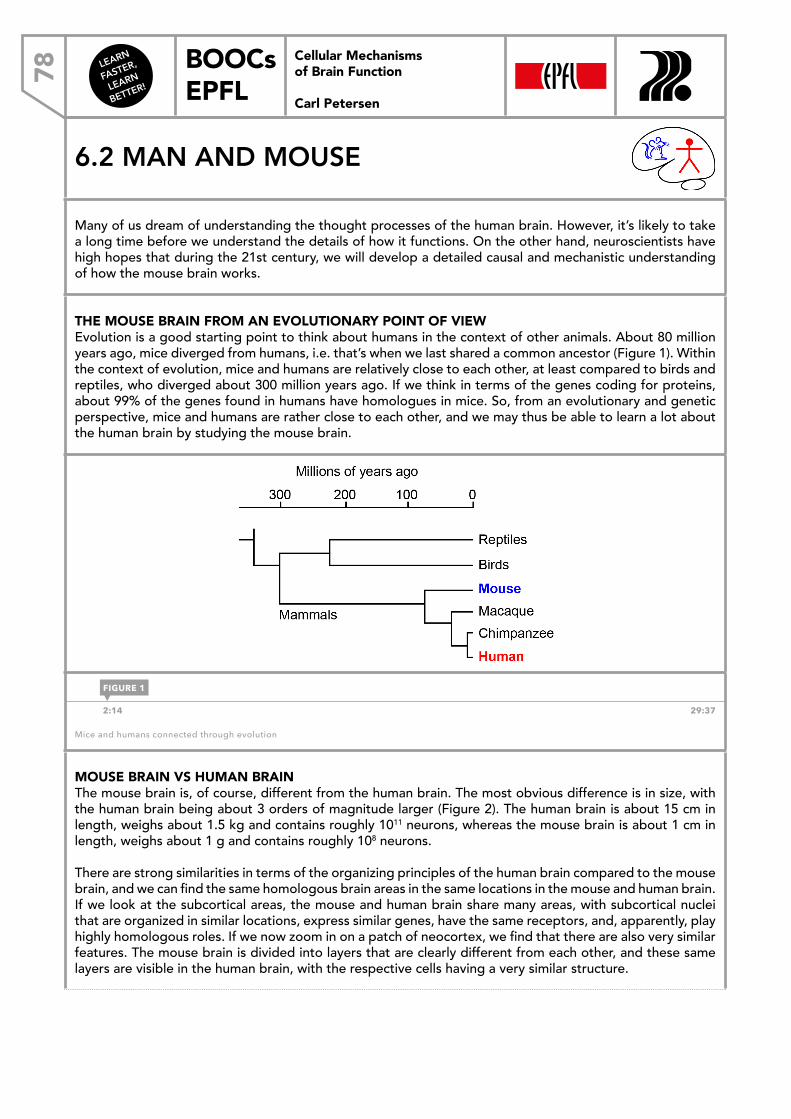
LEARN
FASTER,
LEARN
BETTER!
BOOCs EPFL78
Cellular Mechanisms of Brain Function
Carl Petersen
6.2 MAN AND MOUSE
Many of us dream of understanding the thought processes of the human brain. However, it’s likely to take a long time before we understand the details of how it functions. On the other hand, neuroscientists have high hopes that during the 21st century, we will develop a detailed causal and mechanistic understanding of how the mouse brain works.
THE MOUSE BRAIN FROM AN EVOLUTIONARY POINT OF VIEWEvolution is a good starting point to think about humans in the context of other animals. About 80 million years ago, mice diverged from humans, i.e. that’s when we last shared a common ancestor (Figure 1). Within the context of evolution, mice and humans are relatively close to each other, at least compared to birds and reptiles, who diverged about 300 million years ago. If we think in terms of the genes coding for proteins, about 99% of the genes found in humans have homologues in mice. So, from an evolutionary and genetic perspective, mice and humans are rather close to each other, and we may thus be able to learn a lot about the human brain by studying the mouse brain.
Cellular Mechanisms of Brain Function
Evolution
The closest common ancestor between man and mouse is thought to have lived ~80 million years ago.
~99 % of genes coding for proteins have homologs comparing man and mouse.
2:14 29:37
Mice and humans connected through evolution
MOUSE BRAIN VS HUMAN BRAINThe mouse brain is, of course, different from the human brain. The most obvious difference is in size, with the human brain being about 3 orders of magnitude larger (Figure 2). The human brain is about 15 cm in length, weighs about 1.5 kg and contains roughly 1011 neurons, whereas the mouse brain is about 1 cm in length, weighs about 1 g and contains roughly 108 neurons.
There are strong similarities in terms of the organizing principles of the human brain compared to the mouse brain, and we can find the same homologous brain areas in the same locations in the mouse and human brain. If we look at the subcortical areas, the mouse and human brain share many areas, with subcortical nuclei that are organized in similar locations, express similar genes, have the same receptors, and, apparently, play highly homologous roles. If we now zoom in on a patch of neocortex, we find that there are also very similar features. The mouse brain is divided into layers that are clearly different from each other, and these same layers are visible in the human brain, with the respective cells having a very similar structure.
FIGURE 1
Cellular Mechanisms of Brain Function Prof. Carl Petersen
6.2 Man and mouse
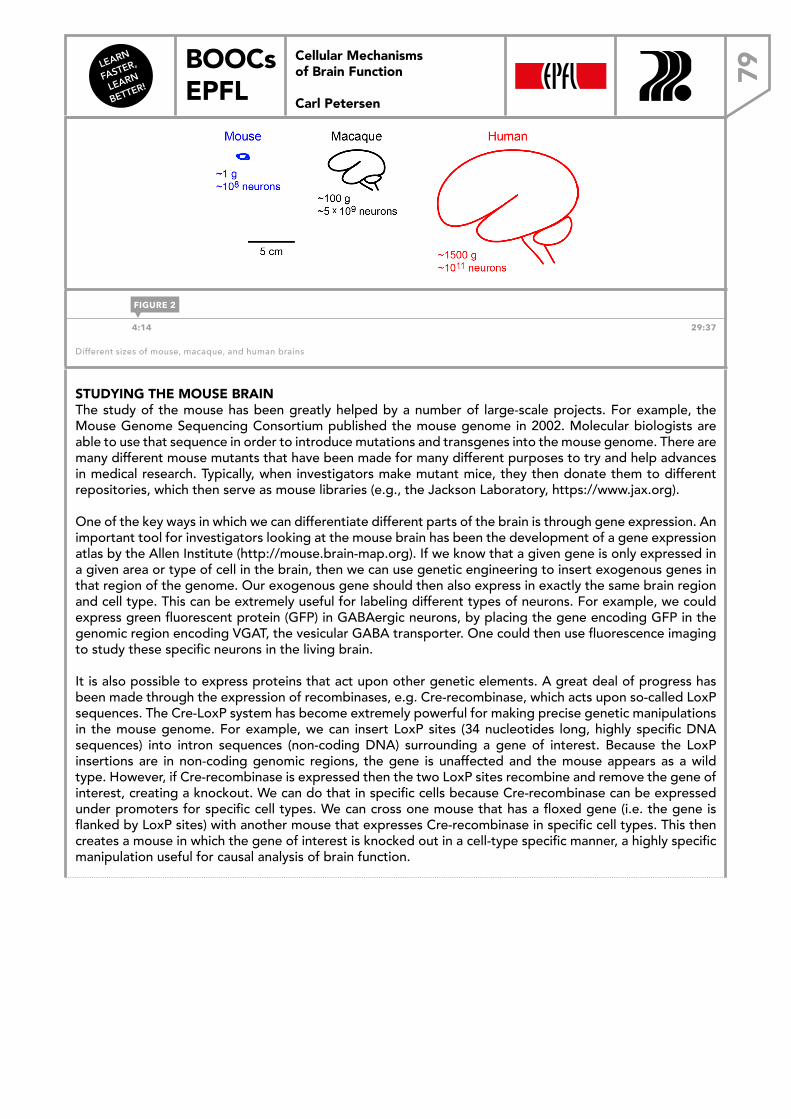
LEARN
FASTER,
LEARN
BETTER!
BOOCs EPFL 79
Cellular Mechanisms of Brain Function
Carl Petersen
Cellular Mechanisms of Brain Function
Mammalian brain size
There are big differences in brain size and neuron numbers.
However, many of the organising principles are very similar. 4:14 29:37
Different sizes of mouse, macaque, and human brains
STUDYING THE MOUSE BRAINThe study of the mouse has been greatly helped by a number of large-scale projects. For example, the Mouse Genome Sequencing Consortium published the mouse genome in 2002. Molecular biologists are able to use that sequence in order to introduce mutations and transgenes into the mouse genome. There are many different mouse mutants that have been made for many different purposes to try and help advances in medical research. Typically, when investigators make mutant mice, they then donate them to different repositories, which then serve as mouse libraries (e.g., the Jackson Laboratory, https://www.jax.org).
One of the key ways in which we can differentiate different parts of the brain is through gene expression. An important tool for investigators looking at the mouse brain has been the development of a gene expression atlas by the Allen Institute (http://mouse.brain-map.org). If we know that a given gene is only expressed in a given area or type of cell in the brain, then we can use genetic engineering to insert exogenous genes in that region of the genome. Our exogenous gene should then also express in exactly the same brain region and cell type. This can be extremely useful for labeling different types of neurons. For example, we could express green fluorescent protein (GFP) in GABAergic neurons, by placing the gene encoding GFP in the genomic region encoding VGAT, the vesicular GABA transporter. One could then use fluorescence imaging to study these specific neurons in the living brain.
It is also possible to express proteins that act upon other genetic elements. A great deal of progress has been made through the expression of recombinases, e.g. Cre-recombinase, which acts upon so-called LoxP sequences. The Cre-LoxP system has become extremely powerful for making precise genetic manipulations in the mouse genome. For example, we can insert LoxP sites (34 nucleotides long, highly specific DNA sequences) into intron sequences (non-coding DNA) surrounding a gene of interest. Because the LoxP insertions are in non-coding genomic regions, the gene is unaffected and the mouse appears as a wild type. However, if Cre-recombinase is expressed then the two LoxP sites recombine and remove the gene of interest, creating a knockout. We can do that in specific cells because Cre-recombinase can be expressed under promoters for specific cell types. We can cross one mouse that has a floxed gene (i.e. the gene is flanked by LoxP sites) with another mouse that expresses Cre-recombinase in specific cell types. This then creates a mouse in which the gene of interest is knocked out in a cell-type specific manner, a highly specific manipulation useful for causal analysis of brain function.
FIGURE 2
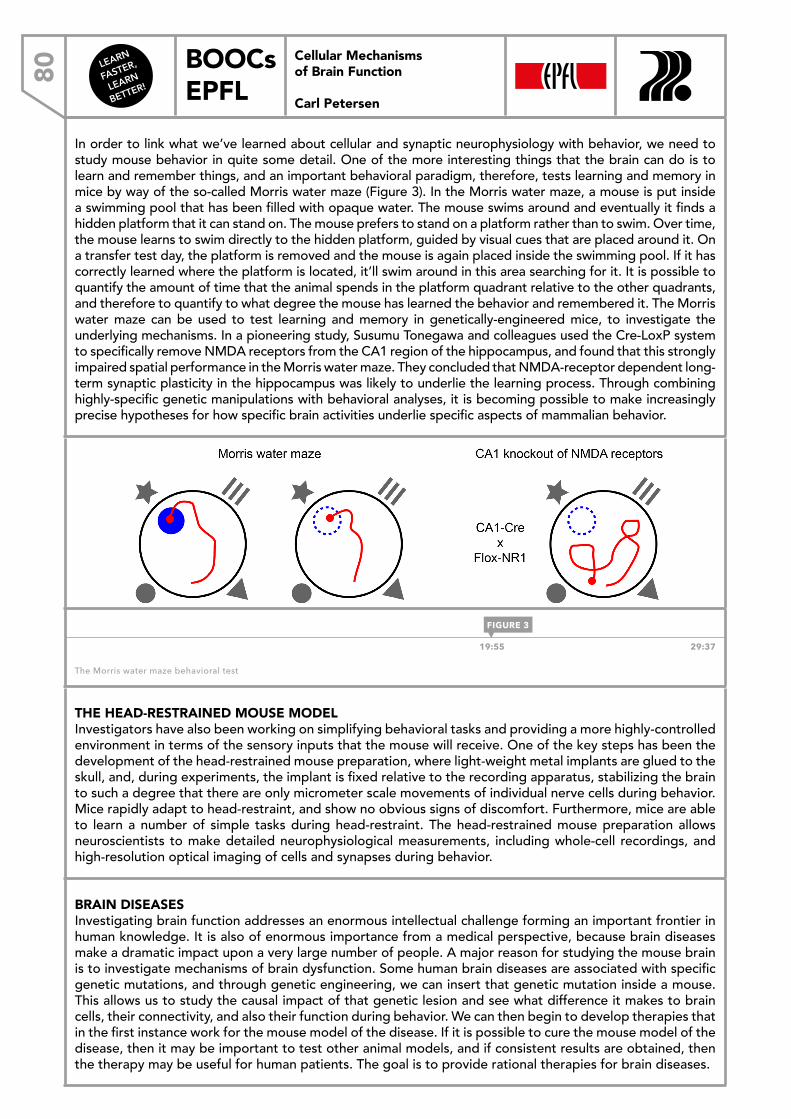
LEARN
FASTER,
LEARN
BETTER!
BOOCs EPFL80
Cellular Mechanisms of Brain Function
Carl Petersen
In order to link what we’ve learned about cellular and synaptic neurophysiology with behavior, we need to study mouse behavior in quite some detail. One of the more interesting things that the brain can do is to learn and remember things, and an important behavioral paradigm, therefore, tests learning and memory in mice by way of the so-called Morris water maze (Figure 3). In the Morris water maze, a mouse is put inside a swimming pool that has been filled with opaque water. The mouse swims around and eventually it finds a hidden platform that it can stand on. The mouse prefers to stand on a platform rather than to swim. Over time, the mouse learns to swim directly to the hidden platform, guided by visual cues that are placed around it. On a transfer test day, the platform is removed and the mouse is again placed inside the swimming pool. If it has correctly learned where the platform is located, it’ll swim around in this area searching for it. It is possible to quantify the amount of time that the animal spends in the platform quadrant relative to the other quadrants, and therefore to quantify to what degree the mouse has learned the behavior and remembered it. The Morris water maze can be used to test learning and memory in genetically-engineered mice, to investigate the underlying mechanisms. In a pioneering study, Susumu Tonegawa and colleagues used the Cre-LoxP system to specifically remove NMDA receptors from the CA1 region of the hippocampus, and found that this strongly impaired spatial performance in the Morris water maze. They concluded that NMDA-receptor dependent long-term synaptic plasticity in the hippocampus was likely to underlie the learning process. Through combining highly-specific genetic manipulations with behavioral analyses, it is becoming possible to make increasingly precise hypotheses for how specific brain activities underlie specific aspects of mammalian behavior.
Cellular Mechanisms of Brain Function
Mouse behavior
19:55 29:37
The Morris water maze behavioral test
THE HEAD-RESTRAINED MOUSE MODELInvestigators have also been working on simplifying behavioral tasks and providing a more highly-controlled environment in terms of the sensory inputs that the mouse will receive. One of the key steps has been the development of the head-restrained mouse preparation, where light-weight metal implants are glued to the skull, and, during experiments, the implant is fixed relative to the recording apparatus, stabilizing the brain to such a degree that there are only micrometer scale movements of individual nerve cells during behavior. Mice rapidly adapt to head-restraint, and show no obvious signs of discomfort. Furthermore, mice are able to learn a number of simple tasks during head-restraint. The head-restrained mouse preparation allows neuroscientists to make detailed neurophysiological measurements, including whole-cell recordings, and high-resolution optical imaging of cells and synapses during behavior.
BRAIN DISEASESInvestigating brain function addresses an enormous intellectual challenge forming an important frontier in human knowledge. It is also of enormous importance from a medical perspective, because brain diseases make a dramatic impact upon a very large number of people. A major reason for studying the mouse brain is to investigate mechanisms of brain dysfunction. Some human brain diseases are associated with specific genetic mutations, and through genetic engineering, we can insert that genetic mutation inside a mouse. This allows us to study the causal impact of that genetic lesion and see what difference it makes to brain cells, their connectivity, and also their function during behavior. We can then begin to develop therapies that in the first instance work for the mouse model of the disease. If it is possible to cure the mouse model of the disease, then it may be important to test other animal models, and if consistent results are obtained, then the therapy may be useful for human patients. The goal is to provide rational therapies for brain diseases.
FIGURE 3
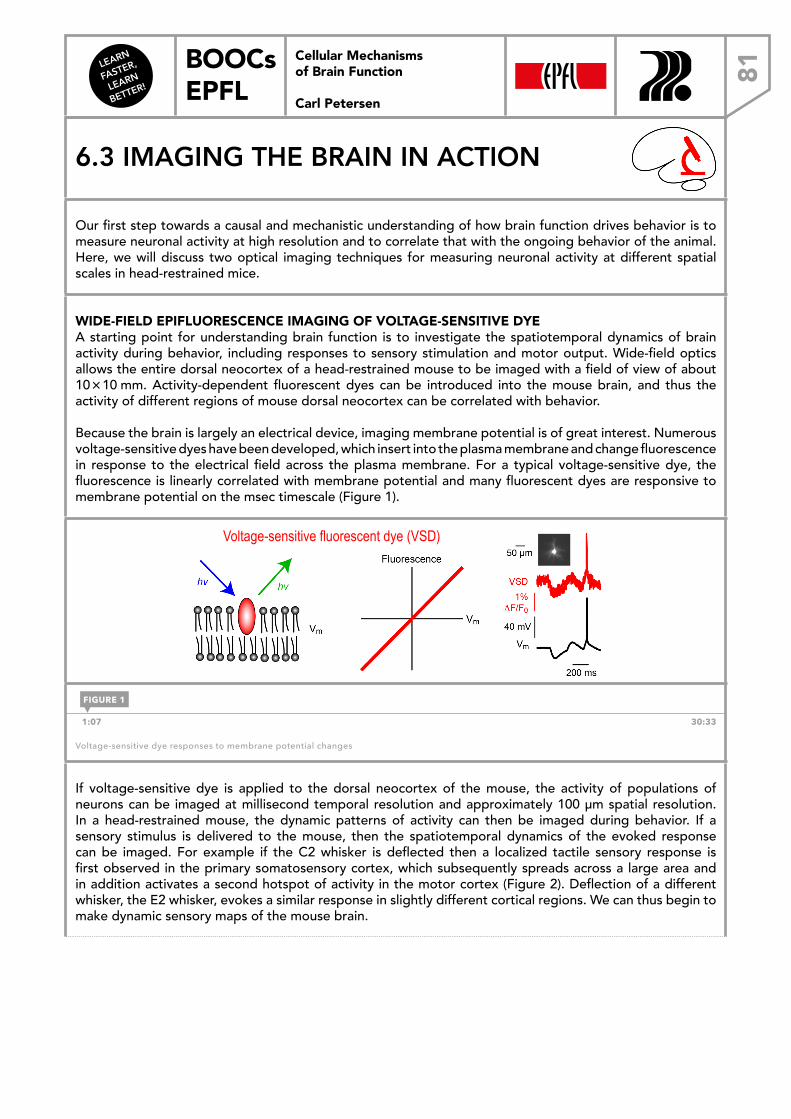
LEARN
FASTER,
LEARN
BETTER!
BOOCs EPFL 81
Cellular Mechanisms of Brain Function
Carl Petersen
6.3 IMAGING THE BRAIN IN ACTION
Our first step towards a causal and mechanistic understanding of how brain function drives behavior is to measure neuronal activity at high resolution and to correlate that with the ongoing behavior of the animal. Here, we will discuss two optical imaging techniques for measuring neuronal activity at different spatial scales in head-restrained mice.
WIDE-FIELD EPIFLUORESCENCE IMAGING OF VOLTAGE-SENSITIVE DYEA starting point for understanding brain function is to investigate the spatiotemporal dynamics of brain activity during behavior, including responses to sensory stimulation and motor output. Wide-field optics allows the entire dorsal neocortex of a head-restrained mouse to be imaged with a field of view of about 10 × 10 mm. Activity-dependent fluorescent dyes can be introduced into the mouse brain, and thus the activity of different regions of mouse dorsal neocortex can be correlated with behavior.
Because the brain is largely an electrical device, imaging membrane potential is of great interest. Numerous voltage-sensitive dyes have been developed, which insert into the plasma membrane and change fluorescence in response to the electrical field across the plasma membrane. For a typical voltage-sensitive dye, the fluorescence is linearly correlated with membrane potential and many fluorescent dyes are responsive to membrane potential on the msec timescale (Figure 1).
Cellular Mechanisms of Brain Function
Imaging membrane potential
Voltage-sensitive fluorescent dye (VSD)
Berger, Borgdorff, Crochet, Neubauer, Lefort, Fauvet, Ferezou, Carleton, Luscher & Petersen, 2007
1:07 30:33
Voltage-sensitive dye responses to membrane potential changes
If voltage-sensitive dye is applied to the dorsal neocortex of the mouse, the activity of populations of neurons can be imaged at millisecond temporal resolution and approximately 100 µm spatial resolution. In a head-restrained mouse, the dynamic patterns of activity can then be imaged during behavior. If a sensory stimulus is delivered to the mouse, then the spatiotemporal dynamics of the evoked response can be imaged. For example if the C2 whisker is deflected then a localized tactile sensory response is first observed in the primary somatosensory cortex, which subsequently spreads across a large area and in addition activates a second hotspot of activity in the motor cortex (Figure 2). Deflection of a different whisker, the E2 whisker, evokes a similar response in slightly different cortical regions. We can thus begin to make dynamic sensory maps of the mouse brain.
FIGURE 1
Cellular Mechanisms of Brain Function Prof. Carl Petersen
6.3 Imaging the brain in
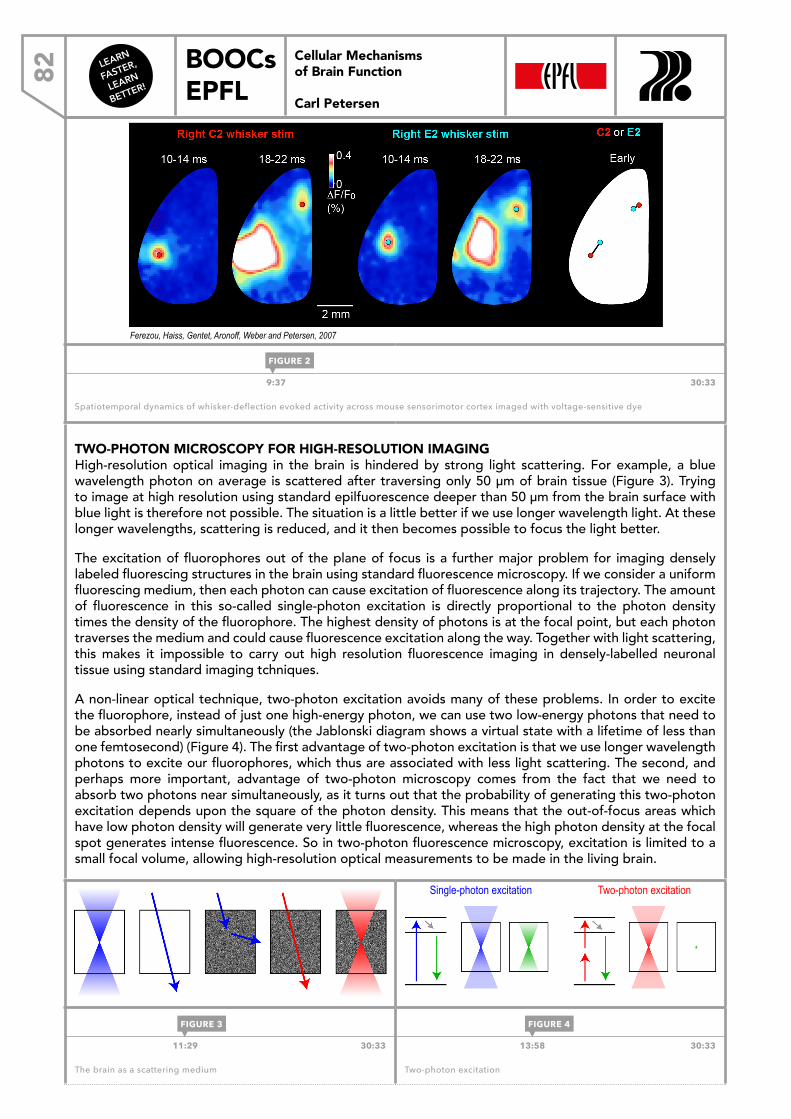
LEARN
FASTER,
LEARN
BETTER!
BOOCs EPFL82
Cellular Mechanisms of Brain Function
Carl Petersen
Cellular Mechanisms of Brain Function
Mapping mouse sensorimotor cortex
Ferezou, Haiss, Gentet, Aronoff, Weber and Petersen, 2007
9:37 30:33
Spatiotemporal dynamics of whisker-deflection evoked activity across mouse sensorimotor cortex imaged with voltage-sensitive dye
TWO-PHOTON MICROSCOPY FOR HIGH-RESOLUTION IMAGINGHigh-resolution optical imaging in the brain is hindered by strong light scattering. For example, a blue wavelength photon on average is scattered after traversing only 50 µm of brain tissue (Figure 3). Trying to image at high resolution using standard epilfuorescence deeper than 50 µm from the brain surface with blue light is therefore not possible. The situation is a little better if we use longer wavelength light. At these longer wavelengths, scattering is reduced, and it then becomes possible to focus the light better.
The excitation of fluorophores out of the plane of focus is a further major problem for imaging densely labeled fluorescing structures in the brain using standard fluorescence microscopy. If we consider a uniform fluorescing medium, then each photon can cause excitation of fluorescence along its trajectory. The amount of fluorescence in this so-called single-photon excitation is directly proportional to the photon density times the density of the fluorophore. The highest density of photons is at the focal point, but each photon traverses the medium and could cause fluorescence excitation along the way. Together with light scattering, this makes it impossible to carry out high resolution fluorescence imaging in densely-labelled neuronal tissue using standard imaging tchniques.
A non-linear optical technique, two-photon excitation avoids many of these problems. In order to excite the fluorophore, instead of just one high-energy photon, we can use two low-energy photons that need to be absorbed nearly simultaneously (the Jablonski diagram shows a virtual state with a lifetime of less than one femtosecond) (Figure 4). The first advantage of two-photon excitation is that we use longer wavelength photons to excite our fluorophores, which thus are associated with less light scattering. The second, and perhaps more important, advantage of two-photon microscopy comes from the fact that we need to absorb two photons near simultaneously, as it turns out that the probability of generating this two-photon excitation depends upon the square of the photon density. This means that the out-of-focus areas which have low photon density will generate very little fluorescence, whereas the high photon density at the focal spot generates intense fluorescence. So in two-photon fluorescence microscopy, excitation is limited to a small focal volume, allowing high-resolution optical measurements to be made in the living brain.
Cellular Mechanisms of Brain Function
High resolution optical imaging
The brain scatters light strongly, with less scattering at long wavelengths.
Cellular Mechanisms of Brain Function
Single-photon vs two-photon excitation
Single-photon excitation Two-photon excitation
11:29 30:33
The brain as a scattering medium
13:58 30:33
Two-photon excitation
FIGURE 2
FIGURE 3 FIGURE 4
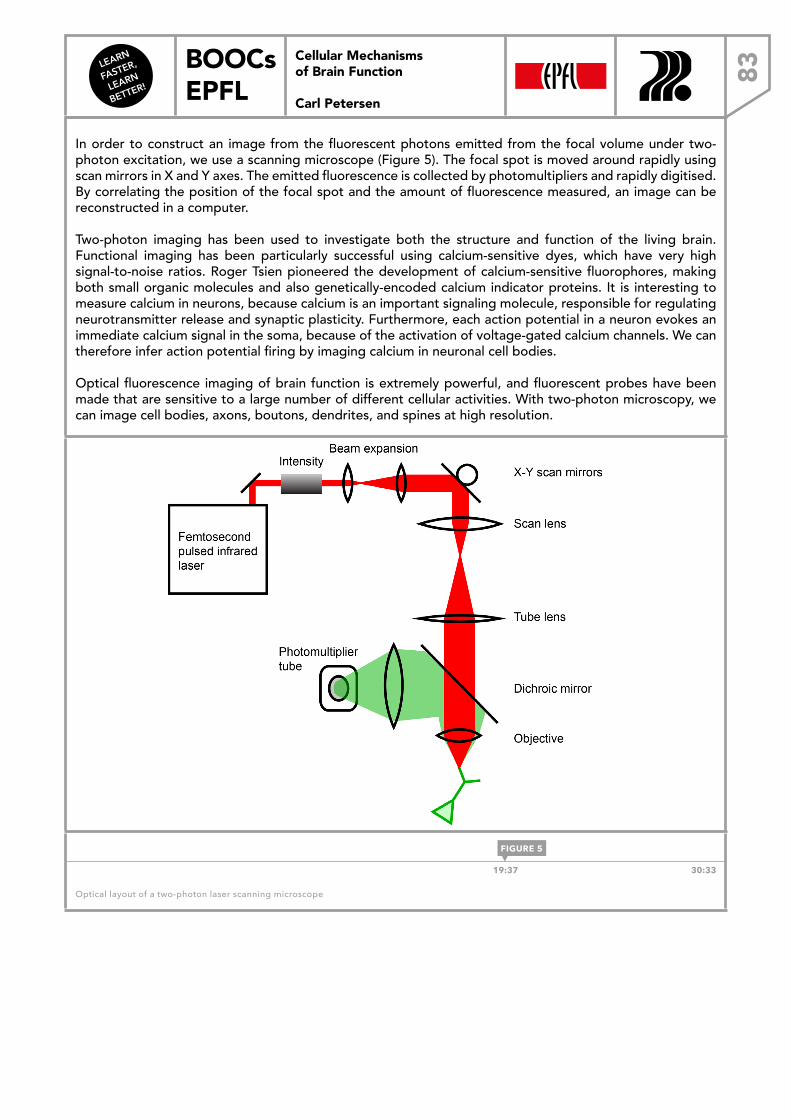
LEARN
FASTER,
LEARN
BETTER!
BOOCs EPFL 83
Cellular Mechanisms of Brain Function
Carl Petersen
In order to construct an image from the fluorescent photons emitted from the focal volume under two-photon excitation, we use a scanning microscope (Figure 5). The focal spot is moved around rapidly using scan mirrors in X and Y axes. The emitted fluorescence is collected by photomultipliers and rapidly digitised. By correlating the position of the focal spot and the amount of fluorescence measured, an image can be reconstructed in a computer.
Two-photon imaging has been used to investigate both the structure and function of the living brain. Functional imaging has been particularly successful using calcium-sensitive dyes, which have very high signal-to-noise ratios. Roger Tsien pioneered the development of calcium-sensitive fluorophores, making both small organic molecules and also genetically-encoded calcium indicator proteins. It is interesting to measure calcium in neurons, because calcium is an important signaling molecule, responsible for regulating neurotransmitter release and synaptic plasticity. Furthermore, each action potential in a neuron evokes an immediate calcium signal in the soma, because of the activation of voltage-gated calcium channels. We can therefore infer action potential firing by imaging calcium in neuronal cell bodies.
Optical fluorescence imaging of brain function is extremely powerful, and fluorescent probes have been made that are sensitive to a large number of different cellular activities. With two-photon microscopy, we can image cell bodies, axons, boutons, dendrites, and spines at high resolution.
Cellular Mechanisms of Brain Function
Two-photon imaging
19:37 30:33
Optical layout of a two-photon laser scanning microscope
FIGURE 5
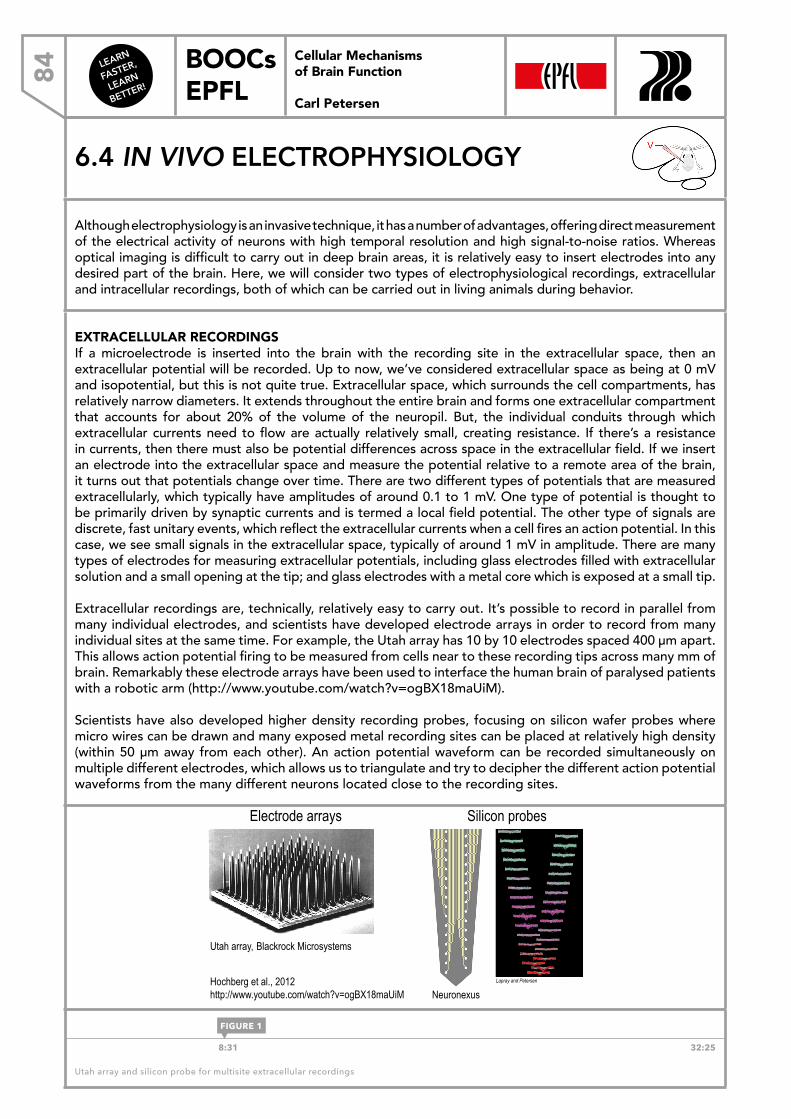
LEARN
FASTER,
LEARN
BETTER!
BOOCs EPFL84
Cellular Mechanisms of Brain Function
Carl Petersen
6.4 IN VIVO ELECTROPHYSIOLOGY
Although electrophysiology is an invasive technique, it has a number of advantages, offering direct measurement of the electrical activity of neurons with high temporal resolution and high signal-to-noise ratios. Whereas optical imaging is difficult to carry out in deep brain areas, it is relatively easy to insert electrodes into any desired part of the brain. Here, we will consider two types of electrophysiological recordings, extracellular and intracellular recordings, both of which can be carried out in living animals during behavior.
EXTRACELLULAR RECORDINGSIf a microelectrode is inserted into the brain with the recording site in the extracellular space, then an extracellular potential will be recorded. Up to now, we’ve considered extracellular space as being at 0 mV and isopotential, but this is not quite true. Extracellular space, which surrounds the cell compartments, has relatively narrow diameters. It extends throughout the entire brain and forms one extracellular compartment that accounts for about 20% of the volume of the neuropil. But, the individual conduits through which extracellular currents need to flow are actually relatively small, creating resistance. If there’s a resistance in currents, then there must also be potential differences across space in the extracellular field. If we insert an electrode into the extracellular space and measure the potential relative to a remote area of the brain, it turns out that potentials change over time. There are two different types of potentials that are measured extracellularly, which typically have amplitudes of around 0.1 to 1 mV. One type of potential is thought to be primarily driven by synaptic currents and is termed a local field potential. The other type of signals are discrete, fast unitary events, which reflect the extracellular currents when a cell fires an action potential. In this case, we see small signals in the extracellular space, typically of around 1 mV in amplitude. There are many types of electrodes for measuring extracellular potentials, including glass electrodes filled with extracellular solution and a small opening at the tip; and glass electrodes with a metal core which is exposed at a small tip.
Extracellular recordings are, technically, relatively easy to carry out. It’s possible to record in parallel from many individual electrodes, and scientists have developed electrode arrays in order to record from many individual sites at the same time. For example, the Utah array has 10 by 10 electrodes spaced 400 μm apart. This allows action potential firing to be measured from cells near to these recording tips across many mm of brain. Remarkably these electrode arrays have been used to interface the human brain of paralysed patients with a robotic arm (http://www.youtube.com/watch?v=ogBX18maUiM).
Scientists have also developed higher density recording probes, focusing on silicon wafer probes where micro wires can be drawn and many exposed metal recording sites can be placed at relatively high density (within 50 μm away from each other). An action potential waveform can be recorded simultaneously on multiple different electrodes, which allows us to triangulate and try to decipher the different action potential waveforms from the many different neurons located close to the recording sites.
Cellular Mechanisms of Brain Function
Multichannel extracellular recordings
Electrode arrays Silicon probes
Utah array, Blackrock Microsystems
Neuronexus Lapray and Petersen Hochberg et al., 2012
http://www.youtube.com/watch?v=ogBX18maUiM
8:31 32:25
Utah array and silicon probe for multisite extracellular recordings
FIGURE 1
Cellular Mechanisms of Brain Function Prof. Carl Petersen
6.4 In vivo electrophys
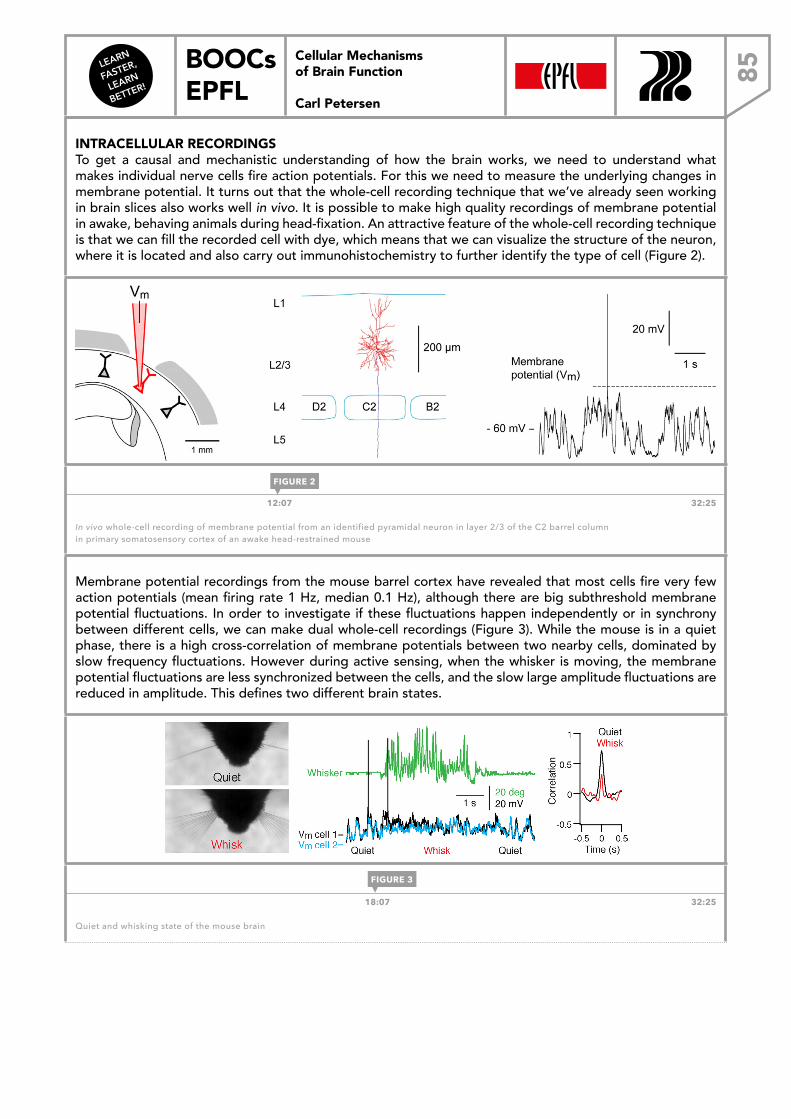
LEARN
FASTER,
LEARN
BETTER!
BOOCs EPFL 85
Cellular Mechanisms of Brain Function
Carl Petersen
INTRACELLULAR RECORDINGSTo get a causal and mechanistic understanding of how the brain works, we need to understand what makes individual nerve cells fire action potentials. For this we need to measure the underlying changes in membrane potential. It turns out that the whole-cell recording technique that we’ve already seen working in brain slices also works well in vivo. It is possible to make high quality recordings of membrane potential in awake, behaving animals during head-fixation. An attractive feature of the whole-cell recording technique is that we can fill the recorded cell with dye, which means that we can visualize the structure of the neuron, where it is located and also carry out immunohistochemistry to further identify the type of cell (Figure 2).
12:07 32:25
In vivo whole-cell recording of membrane potential from an identified pyramidal neuron in layer 2/3 of the C2 barrel column in primary somatosensory cortex of an awake head-restrained mouse
Membrane potential recordings from the mouse barrel cortex have revealed that most cells fire very few action potentials (mean firing rate 1 Hz, median 0.1 Hz), although there are big subthreshold membrane potential fluctuations. In order to investigate if these fluctuations happen independently or in synchrony between different cells, we can make dual whole-cell recordings (Figure 3). While the mouse is in a quiet phase, there is a high cross-correlation of membrane potentials between two nearby cells, dominated by slow frequency fluctuations. However during active sensing, when the whisker is moving, the membrane potential fluctuations are less synchronized between the cells, and the slow large amplitude fluctuations are reduced in amplitude. This defines two different brain states.
Cellular Mechanisms of Brain Function
Dual whole-cell recordings
Poulet and Petersen, 2008
18:07 32:25
Quiet and whisking state of the mouse brain
FIGURE 2
FIGURE 3
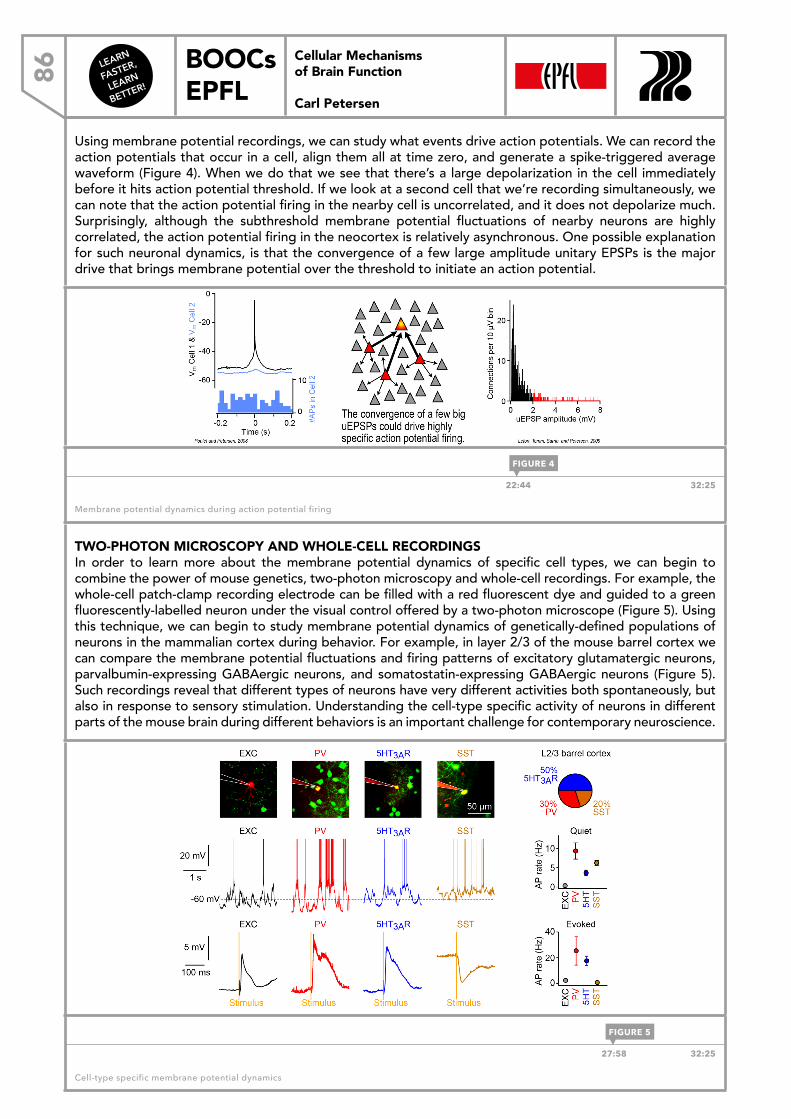
LEARN
FASTER,
LEARN
BETTER!
BOOCs EPFL86
Cellular Mechanisms of Brain Function
Carl Petersen
Using membrane potential recordings, we can study what events drive action potentials. We can record the action potentials that occur in a cell, align them all at time zero, and generate a spike-triggered average waveform (Figure 4). When we do that we see that there’s a large depolarization in the cell immediately before it hits action potential threshold. If we look at a second cell that we’re recording simultaneously, we can note that the action potential firing in the nearby cell is uncorrelated, and it does not depolarize much. Surprisingly, although the subthreshold membrane potential fluctuations of nearby neurons are highly correlated, the action potential firing in the neocortex is relatively asynchronous. One possible explanation for such neuronal dynamics, is that the convergence of a few large amplitude unitary EPSPs is the major drive that brings membrane potential over the threshold to initiate an action potential.
22:44 32:25
Membrane potential dynamics during action potential firing
TWO-PHOTON MICROSCOPY AND WHOLE-CELL RECORDINGSIn order to learn more about the membrane potential dynamics of specific cell types, we can begin to combine the power of mouse genetics, two-photon microscopy and whole-cell recordings. For example, the whole-cell patch-clamp recording electrode can be filled with a red fluorescent dye and guided to a green fluorescently-labelled neuron under the visual control offered by a two-photon microscope (Figure 5). Using this technique, we can begin to study membrane potential dynamics of genetically-defined populations of neurons in the mammalian cortex during behavior. For example, in layer 2/3 of the mouse barrel cortex we can compare the membrane potential fluctuations and firing patterns of excitatory glutamatergic neurons, parvalbumin-expressing GABAergic neurons, and somatostatin-expressing GABAergic neurons (Figure 5). Such recordings reveal that different types of neurons have very different activities both spontaneously, but also in response to sensory stimulation. Understanding the cell-type specific activity of neurons in different parts of the mouse brain during different behaviors is an important challenge for contemporary neuroscience.
27:58 32:25
Cell-type specific membrane potential dynamics
FIGURE 4
FIGURE 5
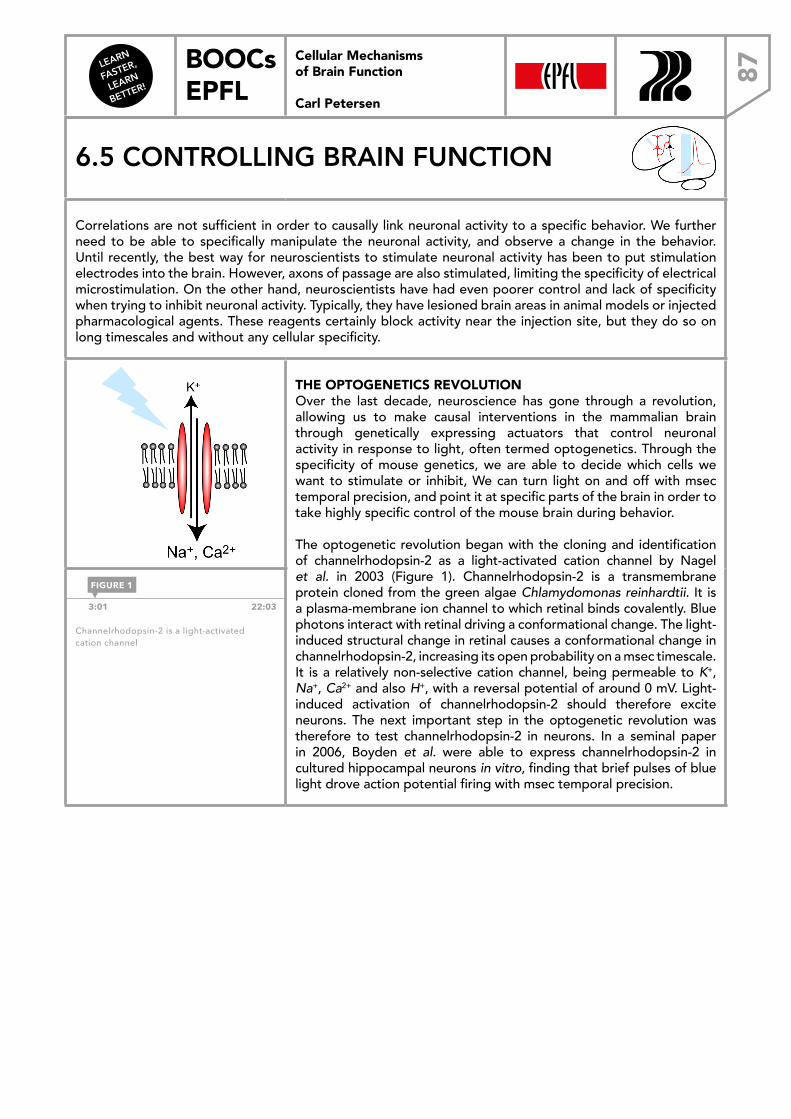
LEARN
FASTER,
LEARN
BETTER!
BOOCs EPFL 87
Cellular Mechanisms of Brain Function
Carl Petersen
6.5 CONTROLLING BRAIN FUNCTION
Correlations are not sufficient in order to causally link neuronal activity to a specific behavior. We further need to be able to specifically manipulate the neuronal activity, and observe a change in the behavior. Until recently, the best way for neuroscientists to stimulate neuronal activity has been to put stimulation electrodes into the brain. However, axons of passage are also stimulated, limiting the specificity of electrical microstimulation. On the other hand, neuroscientists have had even poorer control and lack of specificity when trying to inhibit neuronal activity. Typically, they have lesioned brain areas in animal models or injected pharmacological agents. These reagents certainly block activity near the injection site, but they do so on long timescales and without any cellular specificity.
Cellular Mechanisms of Brain Function
A light-activated cation channel
Retinal is bound to ChR2 and changes conformation from all-trans to 13-cis upon photon absorption.
Nagel, Szellas, Huhn, Kateriya, Adeishvili, Berthold, Ollig, Hegemann, Bamberg (2003) Channelrhodopsin-2, a directly light-gated cation-selective membrane channel. Proc Natl Acad Sci USA 100: 13940-13945.
Channelrhodopsin-2 (ChR2) is a light-activated cation channel, cloned from the green algae Chlamydomonas reinhardtii.
THE OPTOGENETICS REVOLUTIONOver the last decade, neuroscience has gone through a revolution, allowing us to make causal interventions in the mammalian brain through genetically expressing actuators that control neuronal activity in response to light, often termed optogenetics. Through the specificity of mouse genetics, we are able to decide which cells we want to stimulate or inhibit, We can turn light on and off with msec temporal precision, and point it at specific parts of the brain in order to take highly specific control of the mouse brain during behavior.
The optogenetic revolution began with the cloning and identification of channelrhodopsin-2 as a light-activated cation channel by Nagel et al. in 2003 (Figure 1). Channelrhodopsin-2 is a transmembrane protein cloned from the green algae Chlamydomonas reinhardtii. It is a plasma-membrane ion channel to which retinal binds covalently. Blue photons interact with retinal driving a conformational change. The light-induced structural change in retinal causes a conformational change in channelrhodopsin-2, increasing its open probability on a msec timescale. It is a relatively non-selective cation channel, being permeable to K+, Na+, Ca2+ and also H+, with a reversal potential of around 0 mV. Light-induced activation of channelrhodopsin-2 should therefore excite neurons. The next important step in the optogenetic revolution was therefore to test channelrhodopsin-2 in neurons. In a seminal paper in 2006, Boyden et al. were able to express channelrhodopsin-2 in cultured hippocampal neurons in vitro, finding that brief pulses of blue light drove action potential firing with msec temporal precision.
3:01 22:03
Channelrhodopsin-2 is a light-activated cation channel
FIGURE 1
Cellular Mechanisms of Brain Function Prof. Carl Petersen
6.5 Controlling brain fu
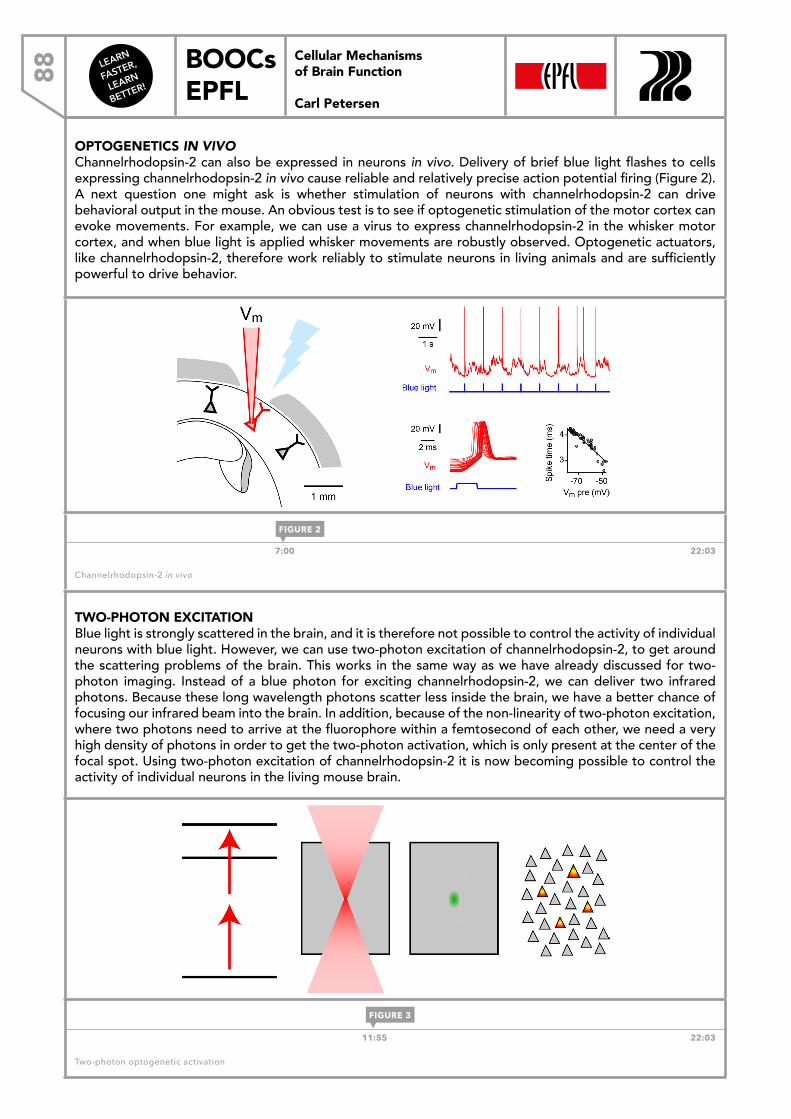
LEARN
FASTER,
LEARN
BETTER!
BOOCs EPFL88
Cellular Mechanisms of Brain Function
Carl Petersen
OPTOGENETICS IN VIVOChannelrhodopsin-2 can also be expressed in neurons in vivo. Delivery of brief blue light flashes to cells expressing channelrhodopsin-2 in vivo cause reliable and relatively precise action potential firing (Figure 2). A next question one might ask is whether stimulation of neurons with channelrhodopsin-2 can drive behavioral output in the mouse. An obvious test is to see if optogenetic stimulation of the motor cortex can evoke movements. For example, we can use a virus to express channelrhodopsin-2 in the whisker motor cortex, and when blue light is applied whisker movements are robustly observed. Optogenetic actuators, like channelrhodopsin-2, therefore work reliably to stimulate neurons in living animals and are sufficiently powerful to drive behavior.
Cellular Mechanisms of Brain Function
Channelrhodopsin-2 in vivo
Mateo, Avermann, Gentet, Zhang, Deisseroth and Petersen, 2011
7:00 22:03
Channelrhodopsin-2 in vivo
TWO-PHOTON EXCITATIONBlue light is strongly scattered in the brain, and it is therefore not possible to control the activity of individual neurons with blue light. However, we can use two-photon excitation of channelrhodopsin-2, to get around the scattering problems of the brain. This works in the same way as we have already discussed for two-photon imaging. Instead of a blue photon for exciting channelrhodopsin-2, we can deliver two infrared photons. Because these long wavelength photons scatter less inside the brain, we have a better chance of focusing our infrared beam into the brain. In addition, because of the non-linearity of two-photon excitation, where two photons need to arrive at the fluorophore within a femtosecond of each other, we need a very high density of photons in order to get the two-photon activation, which is only present at the center of the focal spot. Using two-photon excitation of channelrhodopsin-2 it is now becoming possible to control the activity of individual neurons in the living mouse brain.
Cellular Mechanisms of Brain Function
Single-cell stimulation
Two-photon excitation of ChR2 allows control at single-cell level.
11:55 22:03
Two-photon optogenetic activation
FIGURE 2
FIGURE 3
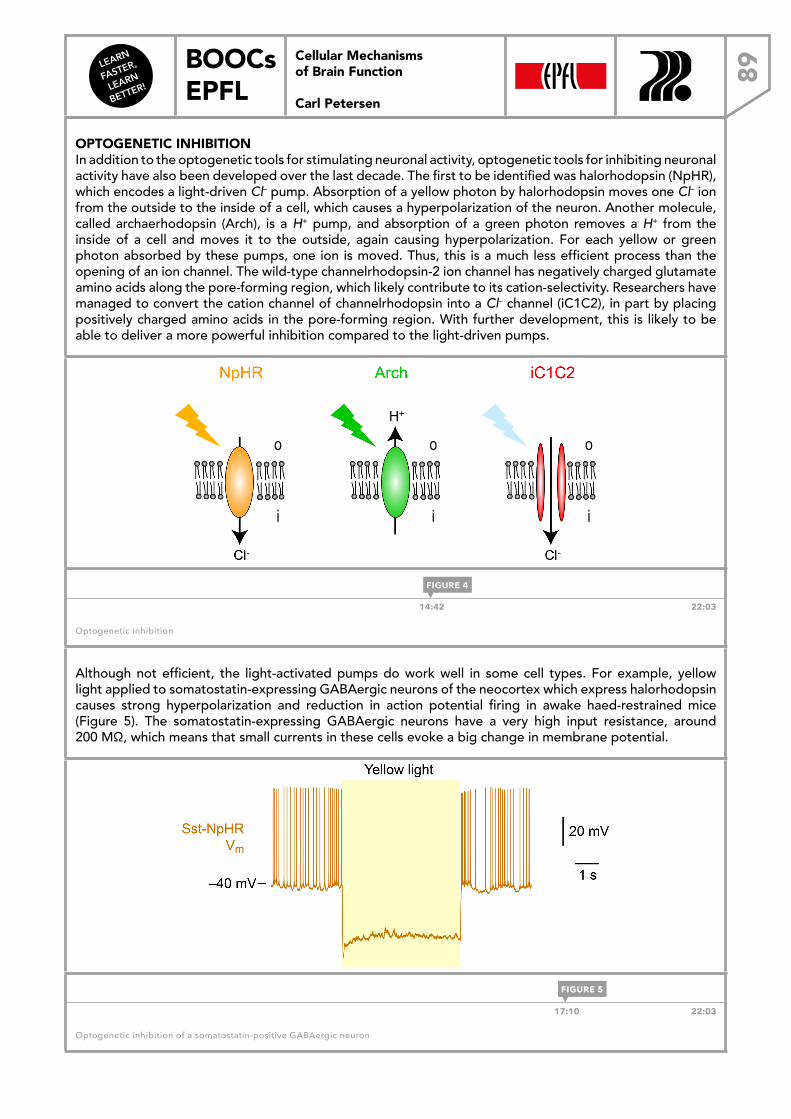
LEARN
FASTER,
LEARN
BETTER!
BOOCs EPFL 89
Cellular Mechanisms of Brain Function
Carl Petersen
OPTOGENETIC INHIBITION In addition to the optogenetic tools for stimulating neuronal activity, optogenetic tools for inhibiting neuronal activity have also been developed over the last decade. The first to be identified was halorhodopsin (NpHR), which encodes a light-driven Cl– pump. Absorption of a yellow photon by halorhodopsin moves one Cl– ion from the outside to the inside of a cell, which causes a hyperpolarization of the neuron. Another molecule, called archaerhodopsin (Arch), is a H+ pump, and absorption of a green photon removes a H+ from the inside of a cell and moves it to the outside, again causing hyperpolarization. For each yellow or green photon absorbed by these pumps, one ion is moved. Thus, this is a much less efficient process than the opening of an ion channel. The wild-type channelrhodopsin-2 ion channel has negatively charged glutamate amino acids along the pore-forming region, which likely contribute to its cation-selectivity. Researchers have managed to convert the cation channel of channelrhodopsin into a Cl– channel (iC1C2), in part by placing positively charged amino acids in the pore-forming region. With further development, this is likely to be able to deliver a more powerful inhibition compared to the light-driven pumps.
Cellular Mechanisms of Brain Function
Optogenetic inhibition
i
o
i
o
i
o
14:42 22:03
Optogenetic inhibition
Although not efficient, the light-activated pumps do work well in some cell types. For example, yellow light applied to somatostatin-expressing GABAergic neurons of the neocortex which express halorhodopsin causes strong hyperpolarization and reduction in action potential firing in awake haed-restrained mice (Figure 5). The somatostatin-expressing GABAergic neurons have a very high input resistance, around 200 MΩ, which means that small currents in these cells evoke a big change in membrane potential.
Cellular Mechanisms of Brain Function
Cell-type specific optogenetic inhibition
Gentet, Kremer, Taniguchi, Huang, Staiger and Petersen, 2012
17:10 22:03
Optogenetic inhibition of a somatostatin-positive GABAergic neuron
FIGURE 4
FIGURE 5
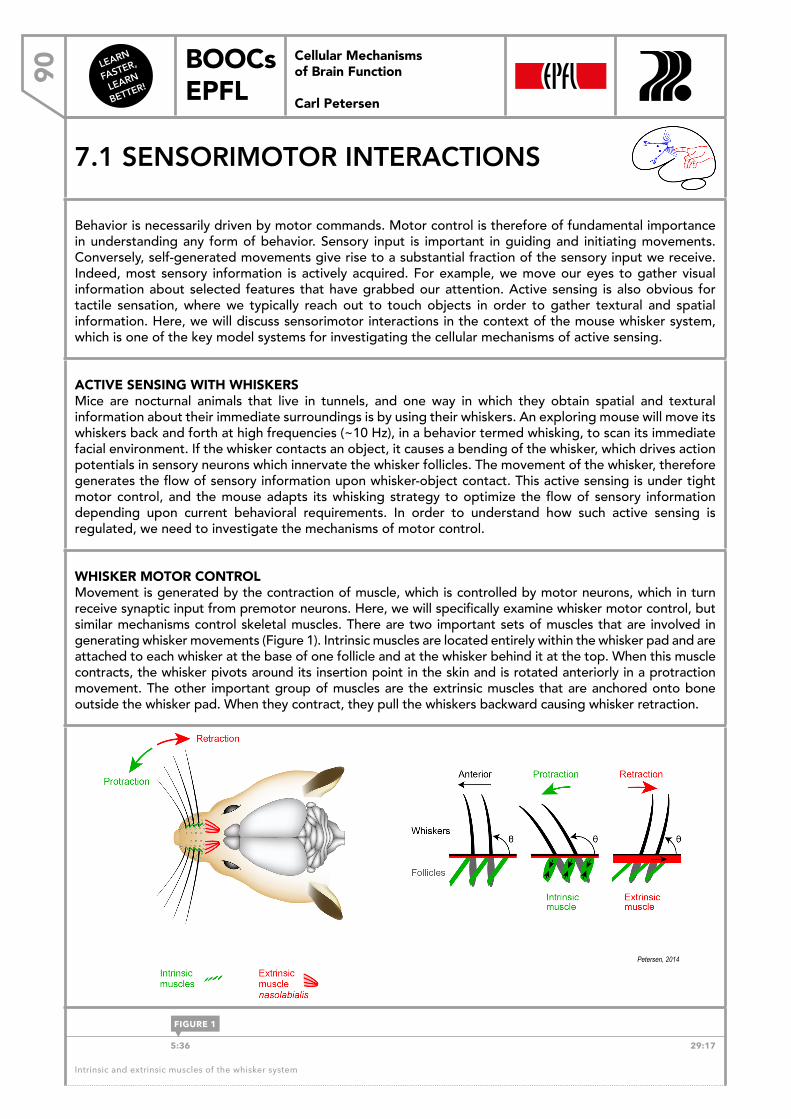
LEARN
FASTER,
LEARN
BETTER!
BOOCs EPFL90
Cellular Mechanisms of Brain Function
Carl Petersen
7.1 SENSORIMOTOR INTERACTIONS
Behavior is necessarily driven by motor commands. Motor control is therefore of fundamental importance in understanding any form of behavior. Sensory input is important in guiding and initiating movements. Conversely, self-generated movements give rise to a substantial fraction of the sensory input we receive. Indeed, most sensory information is actively acquired. For example, we move our eyes to gather visual information about selected features that have grabbed our attention. Active sensing is also obvious for tactile sensation, where we typically reach out to touch objects in order to gather textural and spatial information. Here, we will discuss sensorimotor interactions in the context of the mouse whisker system, which is one of the key model systems for investigating the cellular mechanisms of active sensing.
ACTIVE SENSING WITH WHISKERS Mice are nocturnal animals that live in tunnels, and one way in which they obtain spatial and textural information about their immediate surroundings is by using their whiskers. An exploring mouse will move its whiskers back and forth at high frequencies (~10 Hz), in a behavior termed whisking, to scan its immediate facial environment. If the whisker contacts an object, it causes a bending of the whisker, which drives action potentials in sensory neurons which innervate the whisker follicles. The movement of the whisker, therefore generates the flow of sensory information upon whisker-object contact. This active sensing is under tight motor control, and the mouse adapts its whisking strategy to optimize the flow of sensory information depending upon current behavioral requirements. In order to understand how such active sensing is regulated, we need to investigate the mechanisms of motor control.
WHISKER MOTOR CONTROL Movement is generated by the contraction of muscle, which is controlled by motor neurons, which in turn receive synaptic input from premotor neurons. Here, we will specifically examine whisker motor control, but similar mechanisms control skeletal muscles. There are two important sets of muscles that are involved in generating whisker movements (Figure 1). Intrinsic muscles are located entirely within the whisker pad and are attached to each whisker at the base of one follicle and at the whisker behind it at the top. When this muscle contracts, the whisker pivots around its insertion point in the skin and is rotated anteriorly in a protraction movement. The other important group of muscles are the extrinsic muscles that are anchored onto bone outside the whisker pad. When they contract, they pull the whiskers backward causing whisker retraction.
Cellular Mechanisms of Brain Function
Muscles driving whisker movements
Petersen, 2014
5:36 29:17
Intrinsic and extrinsic muscles of the whisker system
FIGURE 1
Cellular Mechanisms of Brain Function Prof. Carl Petersen
7.1 Sensorimotor interac
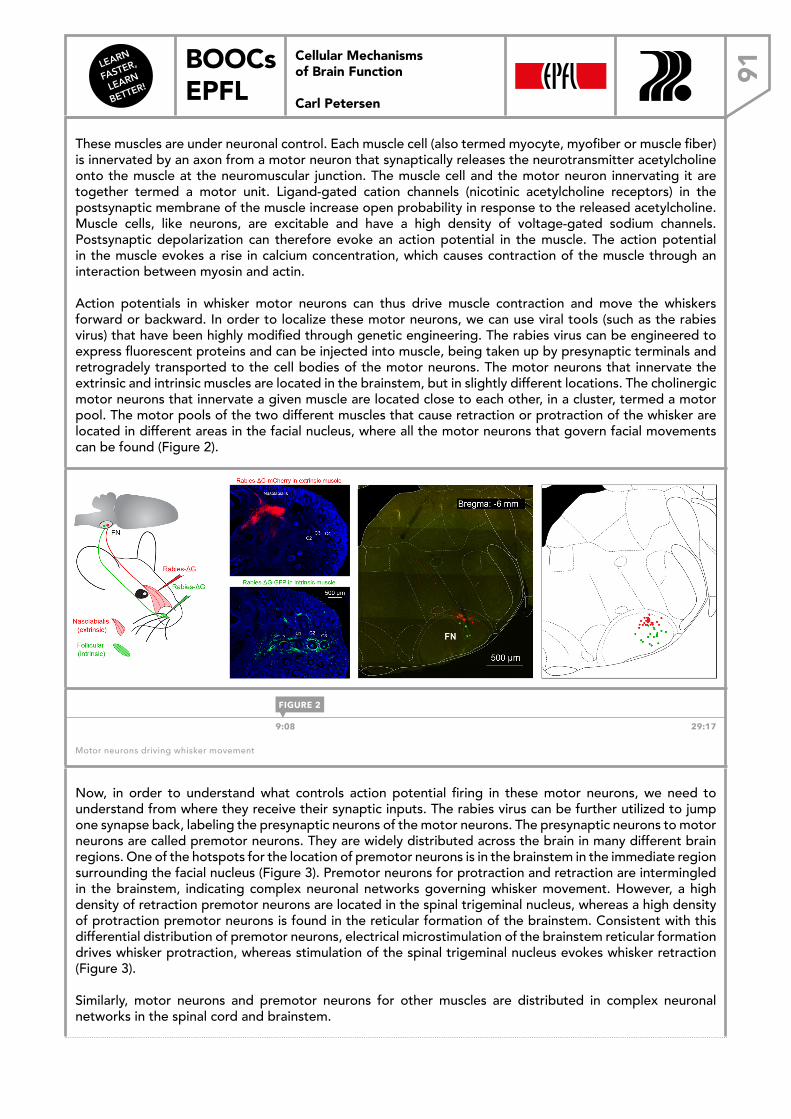
LEARN
FASTER,
LEARN
BETTER!
BOOCs EPFL 91
Cellular Mechanisms of Brain Function
Carl Petersen
These muscles are under neuronal control. Each muscle cell (also termed myocyte, myofiber or muscle fiber) is innervated by an axon from a motor neuron that synaptically releases the neurotransmitter acetylcholine onto the muscle at the neuromuscular junction. The muscle cell and the motor neuron innervating it are together termed a motor unit. Ligand-gated cation channels (nicotinic acetylcholine receptors) in the postsynaptic membrane of the muscle increase open probability in response to the released acetylcholine. Muscle cells, like neurons, are excitable and have a high density of voltage-gated sodium channels. Postsynaptic depolarization can therefore evoke an action potential in the muscle. The action potential in the muscle evokes a rise in calcium concentration, which causes contraction of the muscle through an interaction between myosin and actin.
Action potentials in whisker motor neurons can thus drive muscle contraction and move the whiskers forward or backward. In order to localize these motor neurons, we can use viral tools (such as the rabies virus) that have been highly modified through genetic engineering. The rabies virus can be engineered to express fluorescent proteins and can be injected into muscle, being taken up by presynaptic terminals and retrogradely transported to the cell bodies of the motor neurons. The motor neurons that innervate the extrinsic and intrinsic muscles are located in the brainstem, but in slightly different locations. The cholinergic motor neurons that innervate a given muscle are located close to each other, in a cluster, termed a motor pool. The motor pools of the two different muscles that cause retraction or protraction of the whisker are located in different areas in the facial nucleus, where all the motor neurons that govern facial movements can be found (Figure 2).
Cellular Mechanisms of Brain Function
Motor neurons driving whisker movements
Sreenivasan, Karmakar, Rijli and Petersen, 2015 9:08 29:17
Motor neurons driving whisker movement
Now, in order to understand what controls action potential firing in these motor neurons, we need to understand from where they receive their synaptic inputs. The rabies virus can be further utilized to jump one synapse back, labeling the presynaptic neurons of the motor neurons. The presynaptic neurons to motor neurons are called premotor neurons. They are widely distributed across the brain in many different brain regions. One of the hotspots for the location of premotor neurons is in the brainstem in the immediate region surrounding the facial nucleus (Figure 3). Premotor neurons for protraction and retraction are intermingled in the brainstem, indicating complex neuronal networks governing whisker movement. However, a high density of retraction premotor neurons are located in the spinal trigeminal nucleus, whereas a high density of protraction premotor neurons is found in the reticular formation of the brainstem. Consistent with this differential distribution of premotor neurons, electrical microstimulation of the brainstem reticular formation drives whisker protraction, whereas stimulation of the spinal trigeminal nucleus evokes whisker retraction (Figure 3).
Similarly, motor neurons and premotor neurons for other muscles are distributed in complex neuronal networks in the spinal cord and brainstem.
FIGURE 2
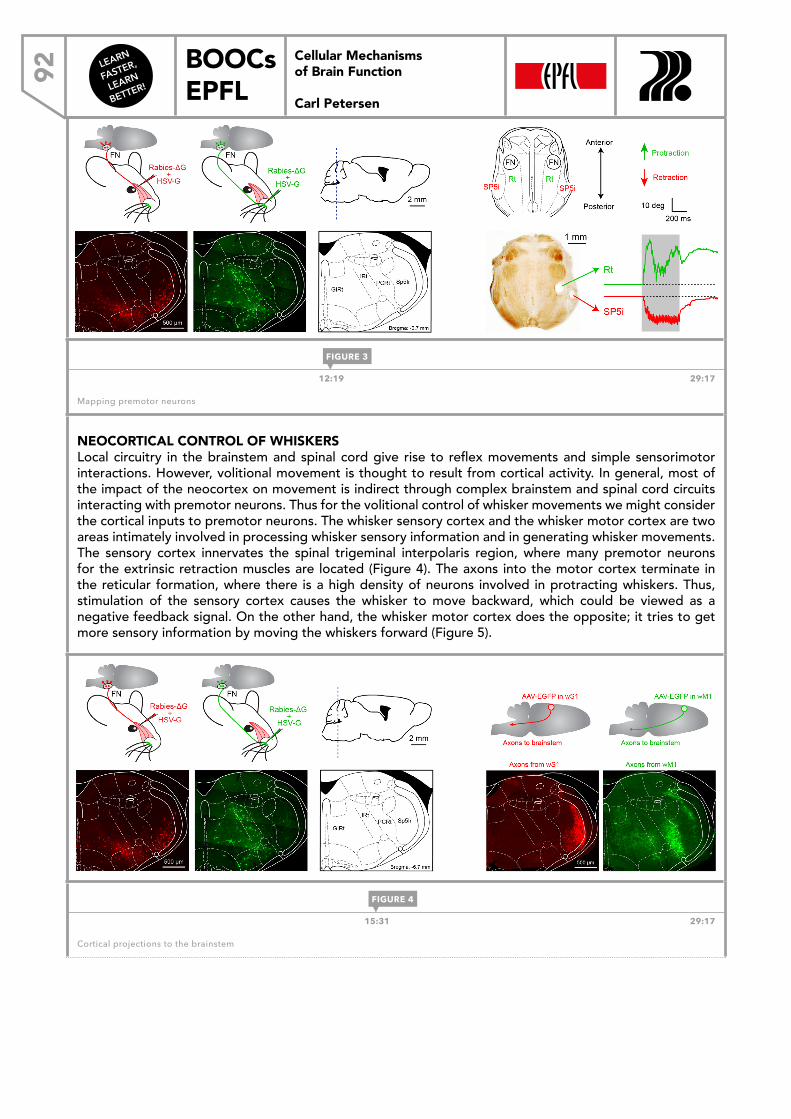
LEARN
FASTER,
LEARN
BETTER!
BOOCs EPFL92
Cellular Mechanisms of Brain Function
Carl Petersen
Cellular Mechanisms of Brain Function
Mapping premotor neurons
Sreenivasan, Karmakar, Rijli and Petersen, 2015 Matyas, Sreenivasan, Marbach, Wacongne, Barsy, Mateo, Aronoff and Petersen, 2010
12:19 29:17
Mapping premotor neurons
NEOCORTICAL CONTROL OF WHISKERSLocal circuitry in the brainstem and spinal cord give rise to reflex movements and simple sensorimotor interactions. However, volitional movement is thought to result from cortical activity. In general, most of the impact of the neocortex on movement is indirect through complex brainstem and spinal cord circuits interacting with premotor neurons. Thus for the volitional control of whisker movements we might consider the cortical inputs to premotor neurons. The whisker sensory cortex and the whisker motor cortex are two areas intimately involved in processing whisker sensory information and in generating whisker movements. The sensory cortex innervates the spinal trigeminal interpolaris region, where many premotor neurons for the extrinsic retraction muscles are located (Figure 4). The axons into the motor cortex terminate in the reticular formation, where there is a high density of neurons involved in protracting whiskers. Thus, stimulation of the sensory cortex causes the whisker to move backward, which could be viewed as a negative feedback signal. On the other hand, the whisker motor cortex does the opposite; it tries to get more sensory information by moving the whiskers forward (Figure 5).
Cellular Mechanisms of Brain Function
Cortical projections to brainstem
Sreenivasan, Karmakar, Rijli and Petersen, 2015 15:31 29:17
Cortical projections to the brainstem
FIGURE 3
FIGURE 4
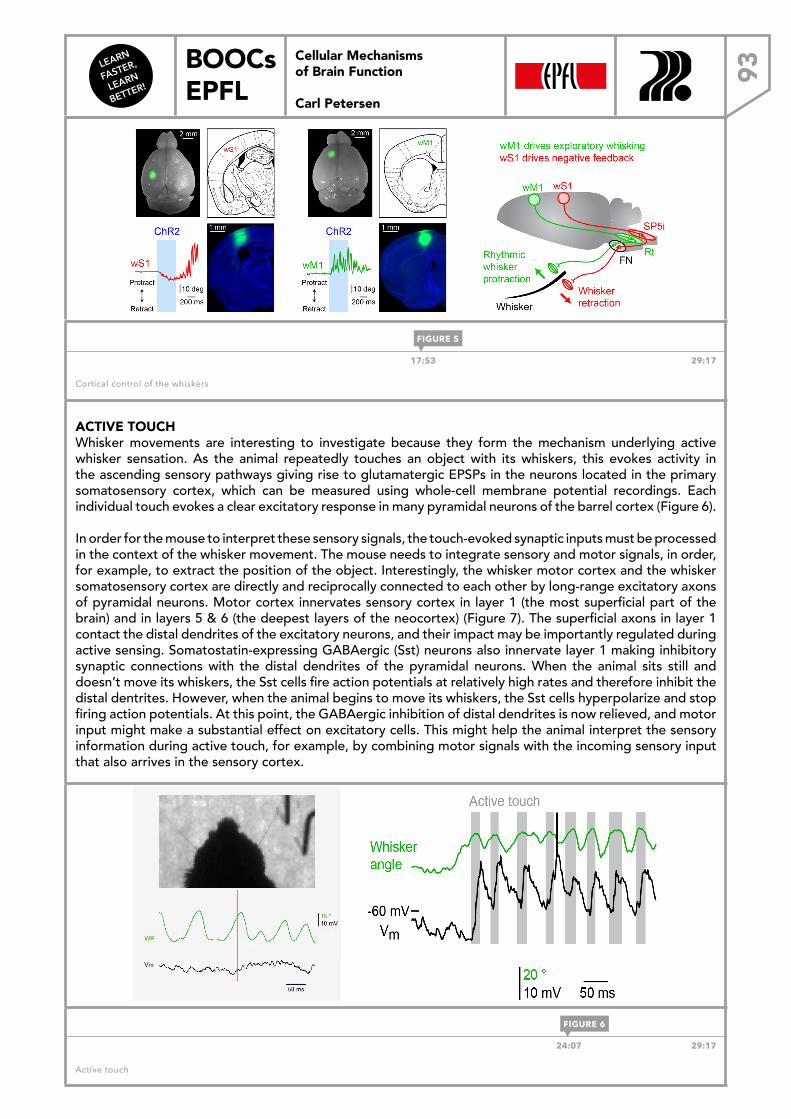
LEARN
FASTER,
LEARN
BETTER!
BOOCs EPFL 93
Cellular Mechanisms of Brain Function
Carl Petersen
Cellular Mechanisms of Brain Function
Cortical control of whisker movement
Sreenivasan, Karmakar, Rijli and Petersen, 2015 Matyas, Sreenivasan, Marbach, Wacongne, Barsy, Mateo, Aronoff and Petersen, 2010
17:53 29:17
Cortical control of the whiskers
ACTIVE TOUCHWhisker movements are interesting to investigate because they form the mechanism underlying active whisker sensation. As the animal repeatedly touches an object with its whiskers, this evokes activity in the ascending sensory pathways giving rise to glutamatergic EPSPs in the neurons located in the primary somatosensory cortex, which can be measured using whole-cell membrane potential recordings. Each individual touch evokes a clear excitatory response in many pyramidal neurons of the barrel cortex (Figure 6).
In order for the mouse to interpret these sensory signals, the touch-evoked synaptic inputs must be processed in the context of the whisker movement. The mouse needs to integrate sensory and motor signals, in order, for example, to extract the position of the object. Interestingly, the whisker motor cortex and the whisker somatosensory cortex are directly and reciprocally connected to each other by long-range excitatory axons of pyramidal neurons. Motor cortex innervates sensory cortex in layer 1 (the most superficial part of the brain) and in layers 5 & 6 (the deepest layers of the neocortex) (Figure 7). The superficial axons in layer 1 contact the distal dendrites of the excitatory neurons, and their impact may be importantly regulated during active sensing. Somatostatin-expressing GABAergic (Sst) neurons also innervate layer 1 making inhibitory synaptic connections with the distal dendrites of the pyramidal neurons. When the animal sits still and doesn’t move its whiskers, the Sst cells fire action potentials at relatively high rates and therefore inhibit the distal dentrites. However, when the animal begins to move its whiskers, the Sst cells hyperpolarize and stop firing action potentials. At this point, the GABAergic inhibition of distal dendrites is now relieved, and motor input might make a substantial effect on excitatory cells. This might help the animal interpret the sensory information during active touch, for example, by combining motor signals with the incoming sensory input that also arrives in the sensory cortex.
Cellular Mechanisms of Brain Function
Active touch
Crochet, Poulet, Kremer and Petersen, 2011
24:07 29:17
Active touch
FIGURE 5
FIGURE 6
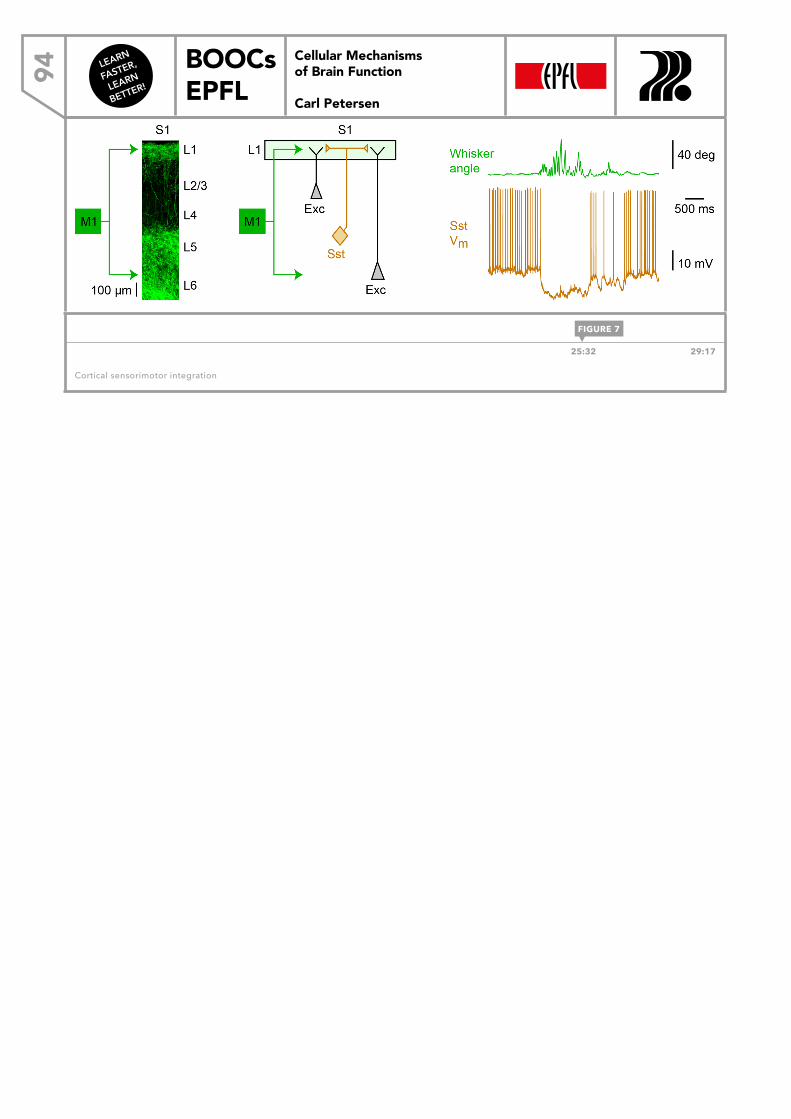
LEARN
FASTER,
LEARN
BETTER!
BOOCs EPFL94
Cellular Mechanisms of Brain Function
Carl Petersen
Cellular Mechanisms of Brain Function
Cortical sensorimotor integration
Gentet, Kremer, Taniguchi, Huang, Staiger and Petersen, 2012 25:32 29:17
Cortical sensorimotor integration
FIGURE 7
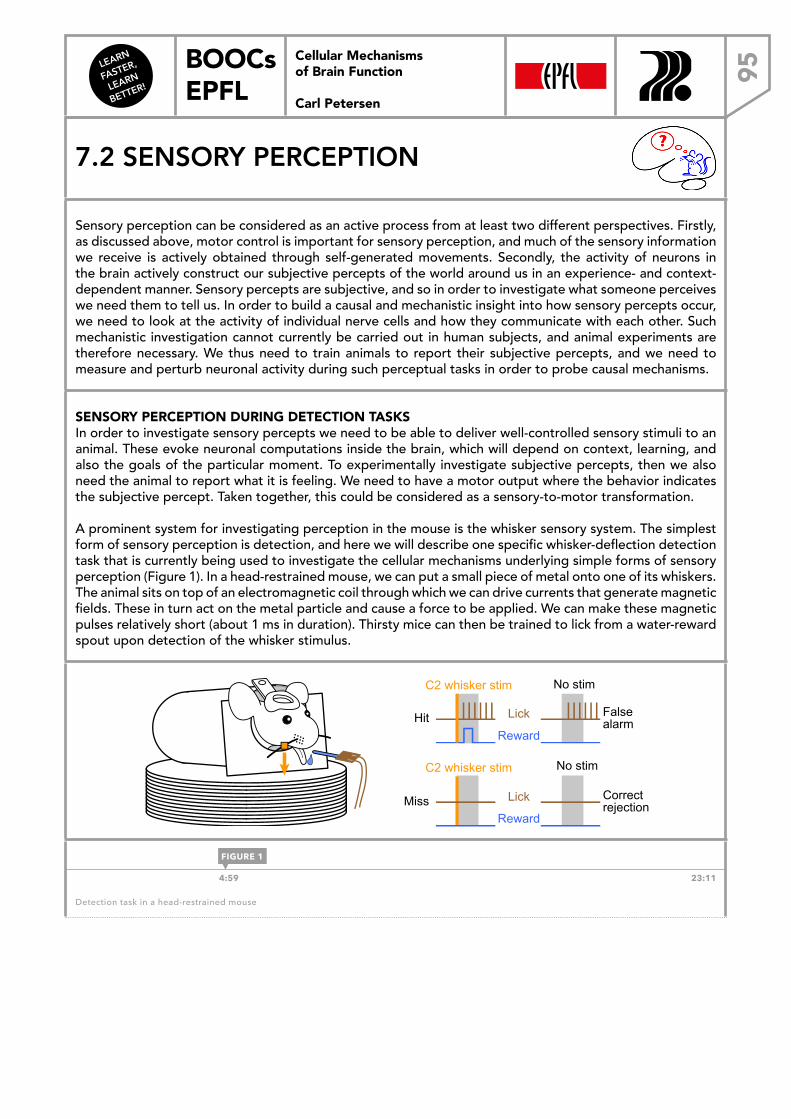
LEARN
FASTER,
LEARN
BETTER!
BOOCs EPFL 95
Cellular Mechanisms of Brain Function
Carl Petersen
7.2 SENSORY PERCEPTION
Sensory perception can be considered as an active process from at least two different perspectives. Firstly, as discussed above, motor control is important for sensory perception, and much of the sensory information we receive is actively obtained through self-generated movements. Secondly, the activity of neurons in the brain actively construct our subjective percepts of the world around us in an experience- and context-dependent manner. Sensory percepts are subjective, and so in order to investigate what someone perceives we need them to tell us. In order to build a causal and mechanistic insight into how sensory percepts occur, we need to look at the activity of individual nerve cells and how they communicate with each other. Such mechanistic investigation cannot currently be carried out in human subjects, and animal experiments are therefore necessary. We thus need to train animals to report their subjective percepts, and we need to measure and perturb neuronal activity during such perceptual tasks in order to probe causal mechanisms.
SENSORY PERCEPTION DURING DETECTION TASKSIn order to investigate sensory percepts we need to be able to deliver well-controlled sensory stimuli to an animal. These evoke neuronal computations inside the brain, which will depend on context, learning, and also the goals of the particular moment. To experimentally investigate subjective percepts, then we also need the animal to report what it is feeling. We need to have a motor output where the behavior indicates the subjective percept. Taken together, this could be considered as a sensory-to-motor transformation.
A prominent system for investigating perception in the mouse is the whisker sensory system. The simplest form of sensory perception is detection, and here we will describe one specific whisker-deflection detection task that is currently being used to investigate the cellular mechanisms underlying simple forms of sensory perception (Figure 1). In a head-restrained mouse, we can put a small piece of metal onto one of its whiskers. The animal sits on top of an electromagnetic coil through which we can drive currents that generate magnetic fields. These in turn act on the metal particle and cause a force to be applied. We can make these magnetic pulses relatively short (about 1 ms in duration). Thirsty mice can then be trained to lick from a water-reward spout upon detection of the whisker stimulus.
Cellular Mechanisms of Brain Function
Whisker detection task
!"#
$"%%
&"'(
)*+,-.
)*+,-.
/,0%*1,0,-2
34--*'#-*5*'#"46
&"'(
371+8"%(*-1%#"2 941%#"2
941%#"2371+8"%(*-1%#"2
Sachidhanandam, Sreenivasan, Kyriakatos, Kremer & Petersen, 2013
4:59 23:11
Detection task in a head-restrained mouse
FIGURE 1
Cellular Mechanisms of Brain Function Prof. Carl Petersen
7.2 Sensory perception
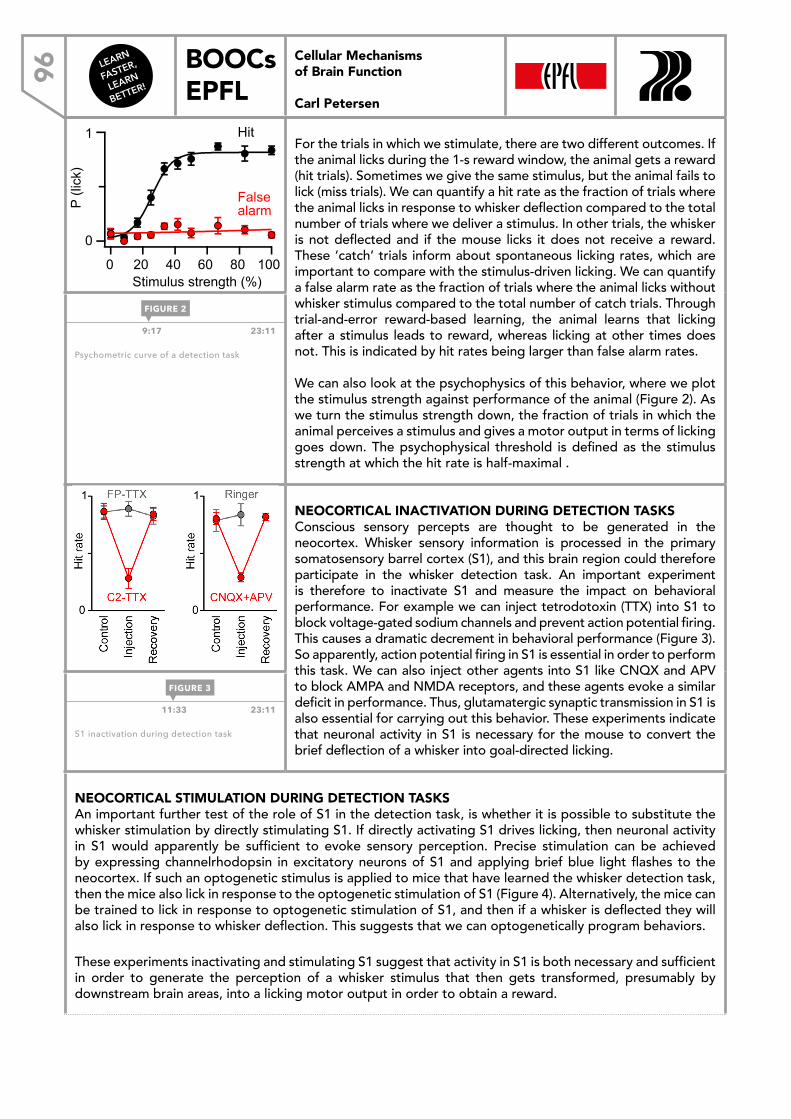
LEARN
FASTER,
LEARN
BETTER!
BOOCs EPFL96
Cellular Mechanisms of Brain Function
Carl Petersen
Cellular Mechanisms of Brain Function
Psychophysics
Sachidhanandam, Sreenivasan, Kyriakatos, Kremer & Petersen, 2013
!"#$
%
$%%&%'%(%)%%*#"+,-,./.#0123#4/567
89-.19-90+:/
5-";<7
For the trials in which we stimulate, there are two different outcomes. If the animal licks during the 1-s reward window, the animal gets a reward (hit trials). Sometimes we give the same stimulus, but the animal fails to lick (miss trials). We can quantify a hit rate as the fraction of trials where the animal licks in response to whisker deflection compared to the total number of trials where we deliver a stimulus. In other trials, the whisker is not deflected and if the mouse licks it does not receive a reward. These ‘catch’ trials inform about spontaneous licking rates, which are important to compare with the stimulus-driven licking. We can quantify a false alarm rate as the fraction of trials where the animal licks without whisker stimulus compared to the total number of catch trials. Through trial-and-error reward-based learning, the animal learns that licking after a stimulus leads to reward, whereas licking at other times does not. This is indicated by hit rates being larger than false alarm rates.
We can also look at the psychophysics of this behavior, where we plot the stimulus strength against performance of the animal (Figure 2). As we turn the stimulus strength down, the fraction of trials in which the animal perceives a stimulus and gives a motor output in terms of licking goes down. The psychophysical threshold is defined as the stimulus strength at which the hit rate is half-maximal .
9:17 23:11
Psychometric curve of a detection task
Cellular Mechanisms of Brain Function
S1 is necessary for detection task
Sachidhanandam, Sreenivasan, Kyriakatos, Kremer & Petersen, 2013
NEOCORTICAL INACTIVATION DURING DETECTION TASKSConscious sensory percepts are thought to be generated in the neocortex. Whisker sensory information is processed in the primary somatosensory barrel cortex (S1), and this brain region could therefore participate in the whisker detection task. An important experiment is therefore to inactivate S1 and measure the impact on behavioral performance. For example we can inject tetrodotoxin (TTX) into S1 to block voltage-gated sodium channels and prevent action potential firing. This causes a dramatic decrement in behavioral performance (Figure 3). So apparently, action potential firing in S1 is essential in order to perform this task. We can also inject other agents into S1 like CNQX and APV to block AMPA and NMDA receptors, and these agents evoke a similar deficit in performance. Thus, glutamatergic synaptic transmission in S1 is also essential for carrying out this behavior. These experiments indicate that neuronal activity in S1 is necessary for the mouse to convert the brief deflection of a whisker into goal-directed licking.
11:33 23:11
S1 inactivation during detection task
NEOCORTICAL STIMULATION DURING DETECTION TASKSAn important further test of the role of S1 in the detection task, is whether it is possible to substitute the whisker stimulation by directly stimulating S1. If directly activating S1 drives licking, then neuronal activity in S1 would apparently be sufficient to evoke sensory perception. Precise stimulation can be achieved by expressing channelrhodopsin in excitatory neurons of S1 and applying brief blue light flashes to the neocortex. If such an optogenetic stimulus is applied to mice that have learned the whisker detection task, then the mice also lick in response to the optogenetic stimulation of S1 (Figure 4). Alternatively, the mice can be trained to lick in response to optogenetic stimulation of S1, and then if a whisker is deflected they will also lick in response to whisker deflection. This suggests that we can optogenetically program behaviors.
These experiments inactivating and stimulating S1 suggest that activity in S1 is both necessary and sufficient in order to generate the perception of a whisker stimulus that then gets transformed, presumably by downstream brain areas, into a licking motor output in order to obtain a reward.
FIGURE 2
FIGURE 3
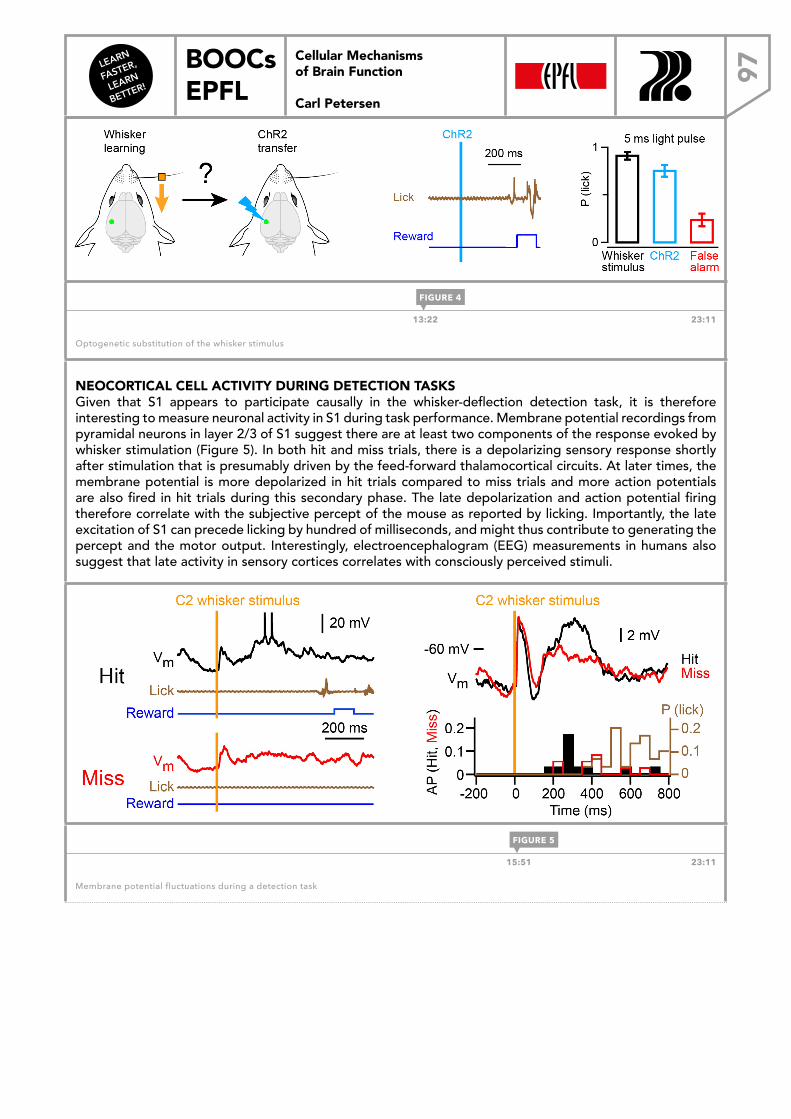
LEARN
FASTER,
LEARN
BETTER!
BOOCs EPFL 97
Cellular Mechanisms of Brain Function
Carl Petersen
Cellular Mechanisms of Brain Function
Optogenetic substitution for whisker stimulus
Sachidhanandam, Sreenivasan, Kyriakatos, Kremer & Petersen, 2013 13:22 23:11
Optogenetic substitution of the whisker stimulus
NEOCORTICAL CELL ACTIVITY DURING DETECTION TASKSGiven that S1 appears to participate causally in the whisker-deflection detection task, it is therefore interesting to measure neuronal activity in S1 during task performance. Membrane potential recordings from pyramidal neurons in layer 2/3 of S1 suggest there are at least two components of the response evoked by whisker stimulation (Figure 5). In both hit and miss trials, there is a depolarizing sensory response shortly after stimulation that is presumably driven by the feed-forward thalamocortical circuits. At later times, the membrane potential is more depolarized in hit trials compared to miss trials and more action potentials are also fired in hit trials during this secondary phase. The late depolarization and action potential firing therefore correlate with the subjective percept of the mouse as reported by licking. Importantly, the late excitation of S1 can precede licking by hundred of milliseconds, and might thus contribute to generating the percept and the motor output. Interestingly, electroencephalogram (EEG) measurements in humans also suggest that late activity in sensory cortices correlates with consciously perceived stimuli.
Cellular Mechanisms of Brain Function
Membrane potential correlates of perception
Sachidhanandam, Sreenivasan, Kyriakatos, Kremer & Petersen, 2013 15:51 23:11
Membrane potential fluctuations during a detection task
FIGURE 4
FIGURE 5
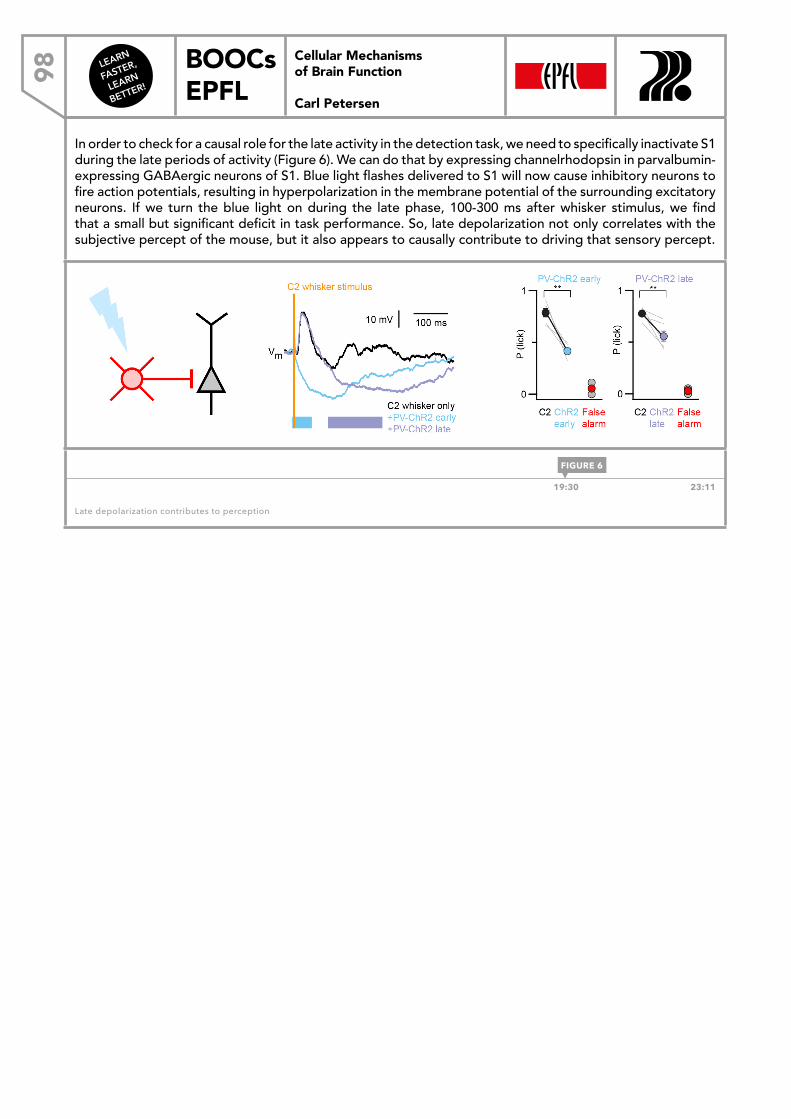
LEARN
FASTER,
LEARN
BETTER!
BOOCs EPFL98
Cellular Mechanisms of Brain Function
Carl Petersen
In order to check for a causal role for the late activity in the detection task, we need to specifically inactivate S1 during the late periods of activity (Figure 6). We can do that by expressing channelrhodopsin in parvalbumin-expressing GABAergic neurons of S1. Blue light flashes delivered to S1 will now cause inhibitory neurons to fire action potentials, resulting in hyperpolarization in the membrane potential of the surrounding excitatory neurons. If we turn the blue light on during the late phase, 100-300 ms after whisker stimulus, we find that a small but significant deficit in task performance. So, late depolarization not only correlates with the subjective percept of the mouse, but it also appears to causally contribute to driving that sensory percept.
Cellular Mechanisms of Brain Function
Late depolarisation contributes to perception
Sachidhanandam, Sreenivasan, Kyriakatos, Kremer & Petersen, 2013
19:30 23:11
Late depolarization contributes to perception
FIGURE 6
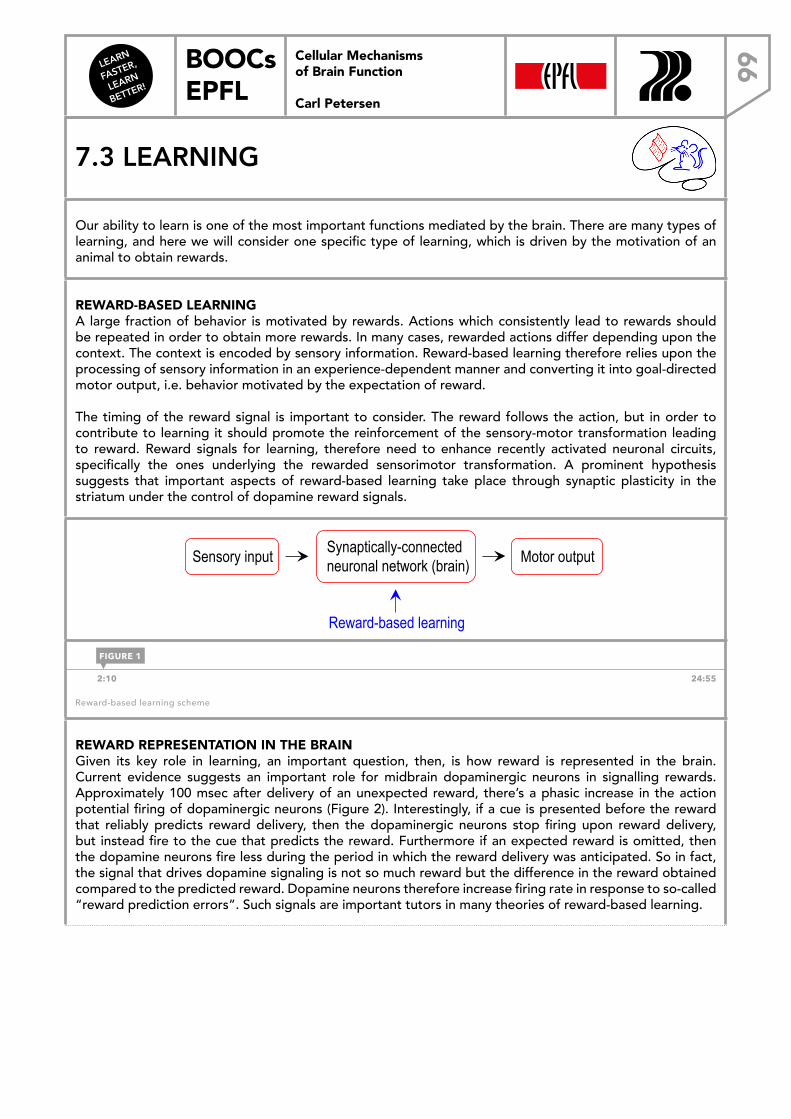
LEARN
FASTER,
LEARN
BETTER!
BOOCs EPFL 99
Cellular Mechanisms of Brain Function
Carl Petersen
7.3 LEARNING
Our ability to learn is one of the most important functions mediated by the brain. There are many types of learning, and here we will consider one specific type of learning, which is driven by the motivation of an animal to obtain rewards.
REWARD-BASED LEARNING A large fraction of behavior is motivated by rewards. Actions which consistently lead to rewards should be repeated in order to obtain more rewards. In many cases, rewarded actions differ depending upon the context. The context is encoded by sensory information. Reward-based learning therefore relies upon the processing of sensory information in an experience-dependent manner and converting it into goal-directed motor output, i.e. behavior motivated by the expectation of reward.
The timing of the reward signal is important to consider. The reward follows the action, but in order to contribute to learning it should promote the reinforcement of the sensory-motor transformation leading to reward. Reward signals for learning, therefore need to enhance recently activated neuronal circuits, specifically the ones underlying the rewarded sensorimotor transformation. A prominent hypothesis suggests that important aspects of reward-based learning take place through synaptic plasticity in the striatum under the control of dopamine reward signals.
Cellular Mechanisms of Brain Function
Reward-based learning
Synaptically-connected neuronal network (brain) Sensory input Motor output
Reward-based learning
2:10 24:55
Reward-based learning scheme
REWARD REPRESENTATION IN THE BRAINGiven its key role in learning, an important question, then, is how reward is represented in the brain. Current evidence suggests an important role for midbrain dopaminergic neurons in signalling rewards. Approximately 100 msec after delivery of an unexpected reward, there’s a phasic increase in the action potential firing of dopaminergic neurons (Figure 2). Interestingly, if a cue is presented before the reward that reliably predicts reward delivery, then the dopaminergic neurons stop firing upon reward delivery, but instead fire to the cue that predicts the reward. Furthermore if an expected reward is omitted, then the dopamine neurons fire less during the period in which the reward delivery was anticipated. So in fact, the signal that drives dopamine signaling is not so much reward but the difference in the reward obtained compared to the predicted reward. Dopamine neurons therefore increase firing rate in response to so-called “reward prediction errors”. Such signals are important tutors in many theories of reward-based learning.
FIGURE 1
Cellular Mechanisms of Brain Function Prof. Carl Petersen
7.3 Learning
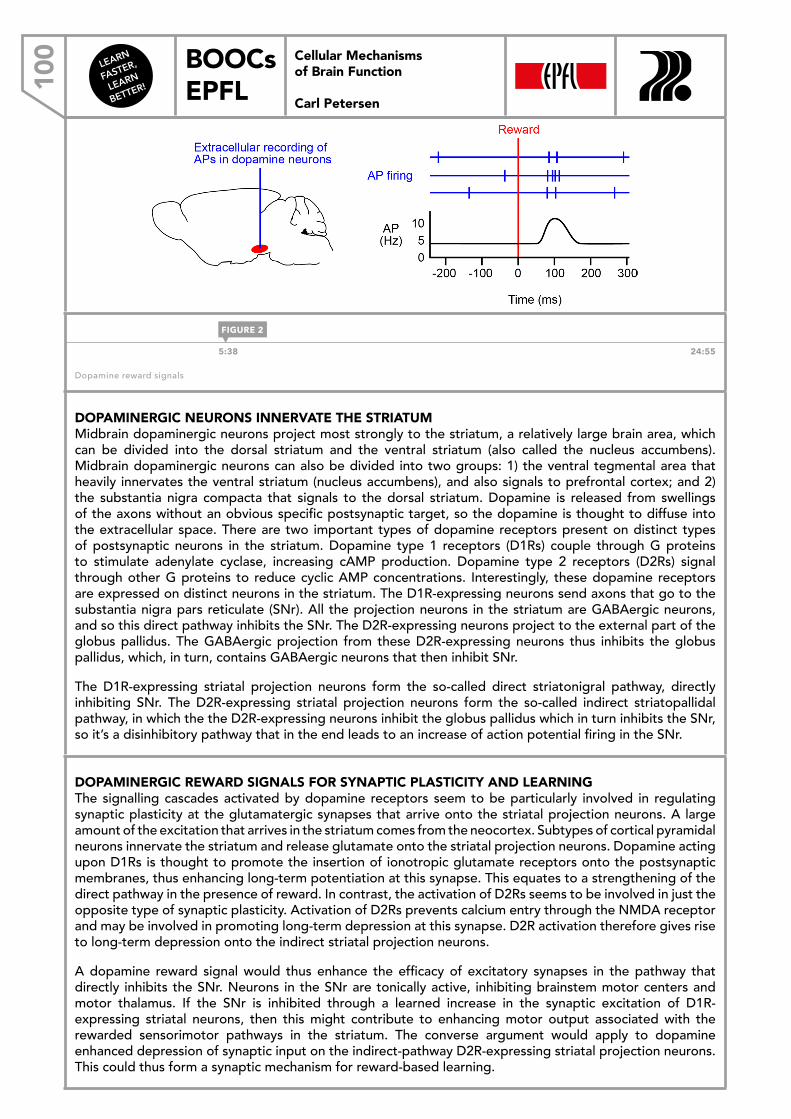
LEARN
FASTER,
LEARN
BETTER!
BOOCs EPFL10
0 Cellular Mechanisms of Brain Function
Carl Petersen
Cellular Mechanisms of Brain Function
Dopamine reward signal
5:38 24:55
Dopamine reward signals
DOPAMINERGIC NEURONS INNERVATE THE STRIATUMMidbrain dopaminergic neurons project most strongly to the striatum, a relatively large brain area, which can be divided into the dorsal striatum and the ventral striatum (also called the nucleus accumbens). Midbrain dopaminergic neurons can also be divided into two groups: 1) the ventral tegmental area that heavily innervates the ventral striatum (nucleus accumbens), and also signals to prefrontal cortex; and 2) the substantia nigra compacta that signals to the dorsal striatum. Dopamine is released from swellings of the axons without an obvious specific postsynaptic target, so the dopamine is thought to diffuse into the extracellular space. There are two important types of dopamine receptors present on distinct types of postsynaptic neurons in the striatum. Dopamine type 1 receptors (D1Rs) couple through G proteins to stimulate adenylate cyclase, increasing cAMP production. Dopamine type 2 receptors (D2Rs) signal through other G proteins to reduce cyclic AMP concentrations. Interestingly, these dopamine receptors are expressed on distinct neurons in the striatum. The D1R-expressing neurons send axons that go to the substantia nigra pars reticulate (SNr). All the projection neurons in the striatum are GABAergic neurons, and so this direct pathway inhibits the SNr. The D2R-expressing neurons project to the external part of the globus pallidus. The GABAergic projection from these D2R-expressing neurons thus inhibits the globus pallidus, which, in turn, contains GABAergic neurons that then inhibit SNr.
The D1R-expressing striatal projection neurons form the so-called direct striatonigral pathway, directly inhibiting SNr. The D2R-expressing striatal projection neurons form the so-called indirect striatopallidal pathway, in which the the D2R-expressing neurons inhibit the globus pallidus which in turn inhibits the SNr, so it’s a disinhibitory pathway that in the end leads to an increase of action potential firing in the SNr.
DOPAMINERGIC REWARD SIGNALS FOR SYNAPTIC PLASTICITY AND LEARNINGThe signalling cascades activated by dopamine receptors seem to be particularly involved in regulating synaptic plasticity at the glutamatergic synapses that arrive onto the striatal projection neurons. A large amount of the excitation that arrives in the striatum comes from the neocortex. Subtypes of cortical pyramidal neurons innervate the striatum and release glutamate onto the striatal projection neurons. Dopamine acting upon D1Rs is thought to promote the insertion of ionotropic glutamate receptors onto the postsynaptic membranes, thus enhancing long-term potentiation at this synapse. This equates to a strengthening of the direct pathway in the presence of reward. In contrast, the activation of D2Rs seems to be involved in just the opposite type of synaptic plasticity. Activation of D2Rs prevents calcium entry through the NMDA receptor and may be involved in promoting long-term depression at this synapse. D2R activation therefore gives rise to long-term depression onto the indirect striatal projection neurons.
A dopamine reward signal would thus enhance the efficacy of excitatory synapses in the pathway that directly inhibits the SNr. Neurons in the SNr are tonically active, inhibiting brainstem motor centers and motor thalamus. If the SNr is inhibited through a learned increase in the synaptic excitation of D1R-expressing striatal neurons, then this might contribute to enhancing motor output associated with the rewarded sensorimotor pathways in the striatum. The converse argument would apply to dopamine enhanced depression of synaptic input on the indirect-pathway D2R-expressing striatal projection neurons. This could thus form a synaptic mechanism for reward-based learning.
FIGURE 2
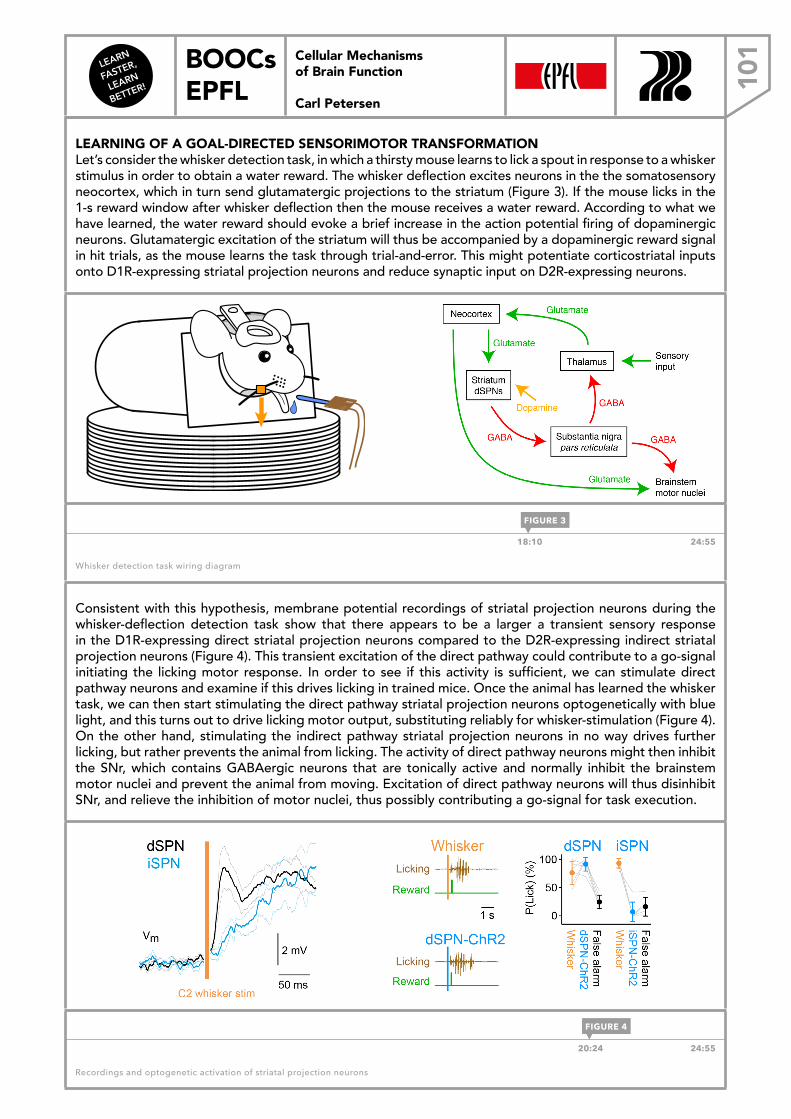
LEARN
FASTER,
LEARN
BETTER!
BOOCs EPFL 10
1Cellular Mechanisms of Brain Function
Carl Petersen
LEARNING OF A GOAL-DIRECTED SENSORIMOTOR TRANSFORMATION Let’s consider the whisker detection task, in which a thirsty mouse learns to lick a spout in response to a whisker stimulus in order to obtain a water reward. The whisker deflection excites neurons in the the somatosensory neocortex, which in turn send glutamatergic projections to the striatum (Figure 3). If the mouse licks in the 1-s reward window after whisker deflection then the mouse receives a water reward. According to what we have learned, the water reward should evoke a brief increase in the action potential firing of dopaminergic neurons. Glutamatergic excitation of the striatum will thus be accompanied by a dopaminergic reward signal in hit trials, as the mouse learns the task through trial-and-error. This might potentiate corticostriatal inputs onto D1R-expressing striatal projection neurons and reduce synaptic input on D2R-expressing neurons.
Cellular Mechanisms of Brain Function
Whisker detection task
Sachidhanandam, Sreenivasan, Kyriakatos, Kremer & Petersen, 2013
18:10 24:55
Whisker detection task wiring diagram
Consistent with this hypothesis, membrane potential recordings of striatal projection neurons during the whisker-deflection detection task show that there appears to be a larger a transient sensory response in the D1R-expressing direct striatal projection neurons compared to the D2R-expressing indirect striatal projection neurons (Figure 4). This transient excitation of the direct pathway could contribute to a go-signal initiating the licking motor response. In order to see if this activity is sufficient, we can stimulate direct pathway neurons and examine if this drives licking in trained mice. Once the animal has learned the whisker task, we can then start stimulating the direct pathway striatal projection neurons optogenetically with blue light, and this turns out to drive licking motor output, substituting reliably for whisker-stimulation (Figure 4). On the other hand, stimulating the indirect pathway striatal projection neurons in no way drives further licking, but rather prevents the animal from licking. The activity of direct pathway neurons might then inhibit the SNr, which contains GABAergic neurons that are tonically active and normally inhibit the brainstem motor nuclei and prevent the animal from moving. Excitation of direct pathway neurons will thus disinhibit SNr, and relieve the inhibition of motor nuclei, thus possibly contributing a go-signal for task execution.
Cellular Mechanisms of Brain Function
Cell-type-specific function of striatal neurons
Sippy, Lapray, Crochet & Petersen
20:24 24:55
Recordings and optogenetic activation of striatal projection neurons
FIGURE 3
FIGURE 4
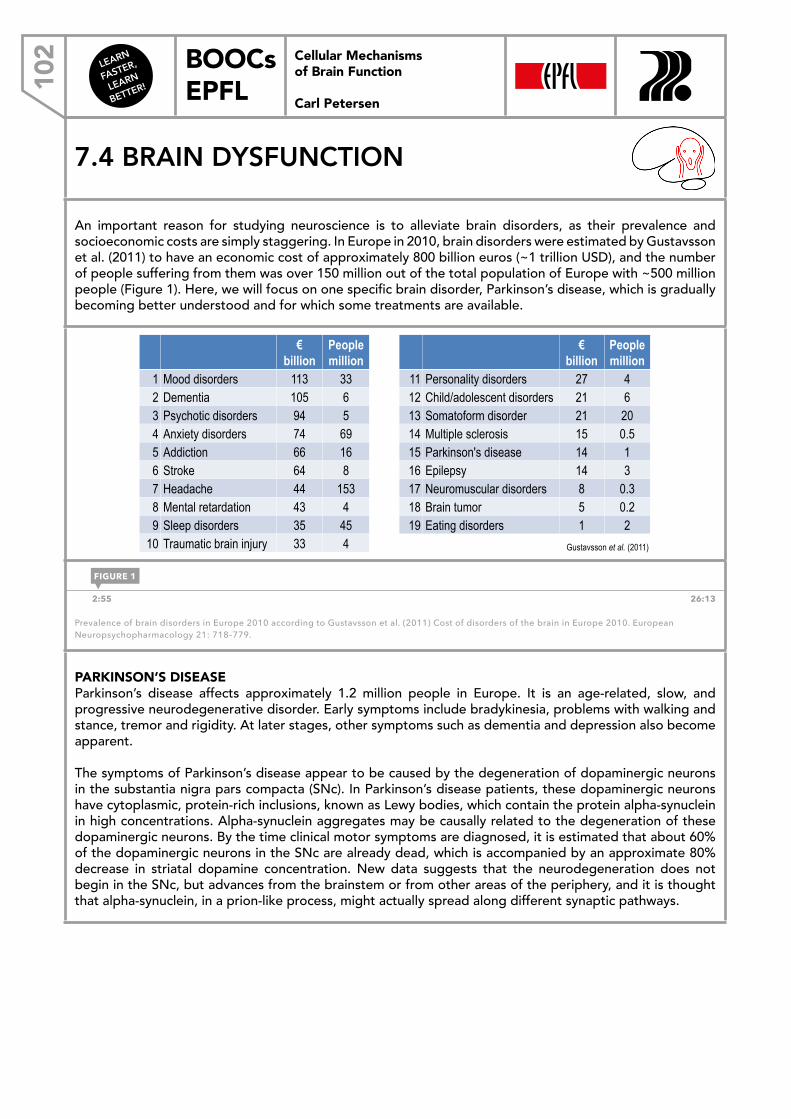
LEARN
FASTER,
LEARN
BETTER!
BOOCs EPFL10
2 Cellular Mechanisms of Brain Function
Carl Petersen
7.4 BRAIN DYSFUNCTION
An important reason for studying neuroscience is to alleviate brain disorders, as their prevalence and socioeconomic costs are simply staggering. In Europe in 2010, brain disorders were estimated by Gustavsson et al. (2011) to have an economic cost of approximately 800 billion euros (~1 trillion USD), and the number of people suffering from them was over 150 million out of the total population of Europe with ~500 million people (Figure 1). Here, we will focus on one specific brain disorder, Parkinson’s disease, which is gradually becoming better understood and for which some treatments are available.
Cellular Mechanisms of Brain Function
Prevalence of brain disorders in Europe 2010
€ billion!
People million!
1 Mood disorders 113 33 2 Dementia 105 6 3 Psychotic disorders 94 5 4 Anxiety disorders 74 69 5 Addiction 66 16 6 Stroke 64 8 7 Headache 44 153 8 Mental retardation 43 4 9 Sleep disorders 35 45
10 Traumatic brain injury 33 4
€ billion!
People million!
11 Personality disorders 27 4 12 Child/adolescent disorders 21 6 13 Somatoform disorder 21 20 14 Multiple sclerosis 15 0.5 15 Parkinson's disease 14 1 16 Epilepsy 14 3 17 Neuromuscular disorders 8 0.3 18 Brain tumor 5 0.2 19 Eating disorders 1 2
Gustavsson et al. (2011)
2:55 26:13
Prevalence of brain disorders in Europe 2010 according to Gustavsson et al. (2011) Cost of disorders of the brain in Europe 2010. European Neuropsychopharmacology 21: 718–779.
PARKINSON’S DISEASEParkinson’s disease affects approximately 1.2 million people in Europe. It is an age-related, slow, and progressive neurodegenerative disorder. Early symptoms include bradykinesia, problems with walking and stance, tremor and rigidity. At later stages, other symptoms such as dementia and depression also become apparent.
The symptoms of Parkinson’s disease appear to be caused by the degeneration of dopaminergic neurons in the substantia nigra pars compacta (SNc). In Parkinson’s disease patients, these dopaminergic neurons have cytoplasmic, protein-rich inclusions, known as Lewy bodies, which contain the protein alpha-synuclein in high concentrations. Alpha-synuclein aggregates may be causally related to the degeneration of these dopaminergic neurons. By the time clinical motor symptoms are diagnosed, it is estimated that about 60% of the dopaminergic neurons in the SNc are already dead, which is accompanied by an approximate 80% decrease in striatal dopamine concentration. New data suggests that the neurodegeneration does not begin in the SNc, but advances from the brainstem or from other areas of the periphery, and it is thought that alpha-synuclein, in a prion-like process, might actually spread along different synaptic pathways.
FIGURE 1
Cellular Mechanisms of Brain Function Prof. Carl Petersen
7.4 Brain dysfunction
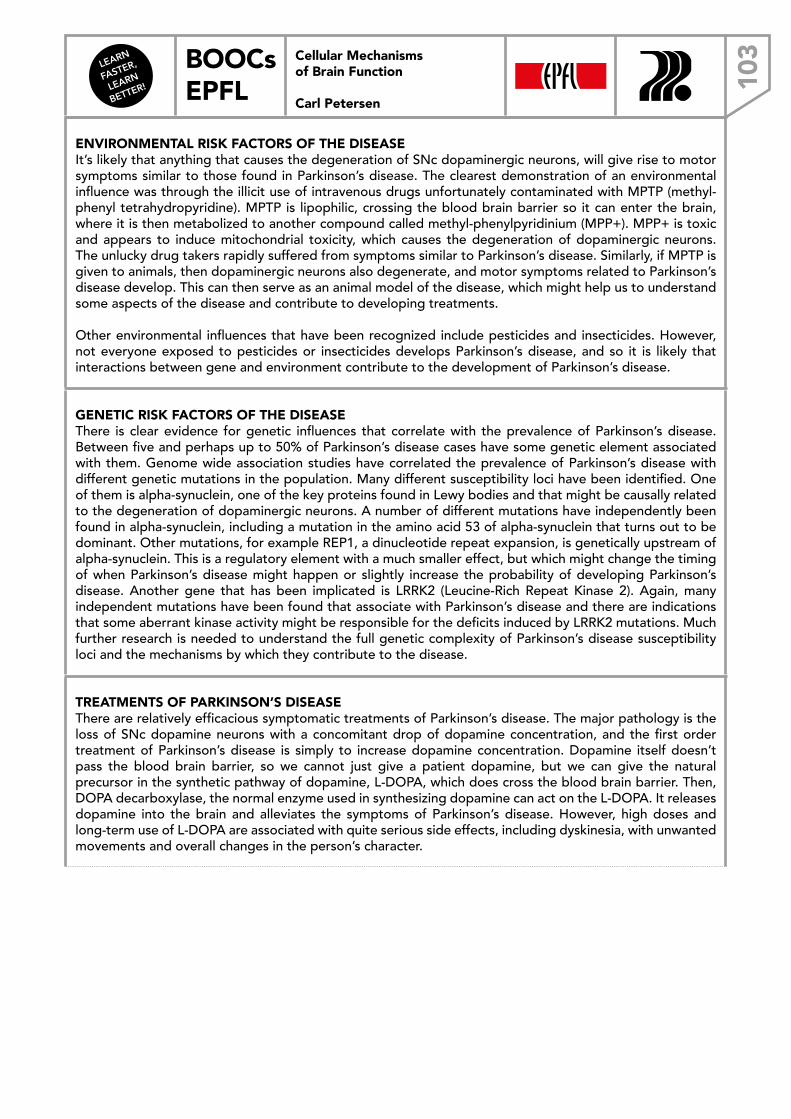
LEARN
FASTER,
LEARN
BETTER!
BOOCs EPFL 10
3Cellular Mechanisms of Brain Function
Carl Petersen
ENVIRONMENTAL RISK FACTORS OF THE DISEASEIt’s likely that anything that causes the degeneration of SNc dopaminergic neurons, will give rise to motor symptoms similar to those found in Parkinson’s disease. The clearest demonstration of an environmental influence was through the illicit use of intravenous drugs unfortunately contaminated with MPTP (methyl-phenyl tetrahydropyridine). MPTP is lipophilic, crossing the blood brain barrier so it can enter the brain, where it is then metabolized to another compound called methyl-phenylpyridinium (MPP+). MPP+ is toxic and appears to induce mitochondrial toxicity, which causes the degeneration of dopaminergic neurons. The unlucky drug takers rapidly suffered from symptoms similar to Parkinson’s disease. Similarly, if MPTP is given to animals, then dopaminergic neurons also degenerate, and motor symptoms related to Parkinson’s disease develop. This can then serve as an animal model of the disease, which might help us to understand some aspects of the disease and contribute to developing treatments.
Other environmental influences that have been recognized include pesticides and insecticides. However, not everyone exposed to pesticides or insecticides develops Parkinson’s disease, and so it is likely that interactions between gene and environment contribute to the development of Parkinson’s disease.
GENETIC RISK FACTORS OF THE DISEASEThere is clear evidence for genetic influences that correlate with the prevalence of Parkinson’s disease. Between five and perhaps up to 50% of Parkinson’s disease cases have some genetic element associated with them. Genome wide association studies have correlated the prevalence of Parkinson’s disease with different genetic mutations in the population. Many different susceptibility loci have been identified. One of them is alpha-synuclein, one of the key proteins found in Lewy bodies and that might be causally related to the degeneration of dopaminergic neurons. A number of different mutations have independently been found in alpha-synuclein, including a mutation in the amino acid 53 of alpha-synuclein that turns out to be dominant. Other mutations, for example REP1, a dinucleotide repeat expansion, is genetically upstream of alpha-synuclein. This is a regulatory element with a much smaller effect, but which might change the timing of when Parkinson’s disease might happen or slightly increase the probability of developing Parkinson’s disease. Another gene that has been implicated is LRRK2 (Leucine-Rich Repeat Kinase 2). Again, many independent mutations have been found that associate with Parkinson’s disease and there are indications that some aberrant kinase activity might be responsible for the deficits induced by LRRK2 mutations. Much further research is needed to understand the full genetic complexity of Parkinson’s disease susceptibility loci and the mechanisms by which they contribute to the disease.
TREATMENTS OF PARKINSON’S DISEASEThere are relatively efficacious symptomatic treatments of Parkinson’s disease. The major pathology is the loss of SNc dopamine neurons with a concomitant drop of dopamine concentration, and the first order treatment of Parkinson’s disease is simply to increase dopamine concentration. Dopamine itself doesn’t pass the blood brain barrier, so we cannot just give a patient dopamine, but we can give the natural precursor in the synthetic pathway of dopamine, L-DOPA, which does cross the blood brain barrier. Then, DOPA decarboxylase, the normal enzyme used in synthesizing dopamine can act on the L-DOPA. It releases dopamine into the brain and alleviates the symptoms of Parkinson’s disease. However, high doses and long-term use of L-DOPA are associated with quite serious side effects, including dyskinesia, with unwanted movements and overall changes in the person’s character.
LEARN
FASTER,
LEARN
BETTER!
BOOCs EPFL10
4 Cellular Mechanisms of Brain Function
Carl Petersen
When drug treatments fail, then some of the symptoms of Parkinson’s disease can be alleviated by deep brain stimulation (DBS), which consists of implanting electrodes into the brain. At the tip of these electrodes, it is possible to drive currents and stimulate the area of the brain that is targeted by the electrode. Successful treatment of Parkinson’s disease has used deep brain stimulation electrodes that target the subthalamic nucleus (STN) (Figure 2). The subthalamic nucleus contains glutamatergic excitatory neurons and is part of of the basal ganglia. The STN neurons provide an excitatory drive onto other parts of the basal ganglia. Electrodes are implanted bilaterally into the human brain and placed in the subthalamic nucleus. After implantation surgery and recovery, high frequency stimulation (100 Hz) is applied to the tips of these electrodes throughout the life of the Parkinson’s patient, providing almost immediate relief of symptoms. Remarkably, many thousands of patients have already been successfully implanted with DBS electrodes for the treatment of the symptoms of Parkinson’s disease. Unfortunately, the mechanisms by which DBS works are more or less mysterious. Much future research is therefore required, and this may lead to better and more specific treatments.
Cellular Mechanisms of Brain Function
Parkinson’s disease – Brain stimulation treatment
When drug treatments fail, then some symptoms of Parkinson’s disease can be alleviated by ‘Deep Brain Stimulation’ (DBS). DBS consists of bilateral implantation of electrical stimulation electrodes in the subthalamic nucleus (STN). High frequency electrical stimuli are then continuously applied to the STN, and provide immediate relief of symptoms.
16:17 26:13
Placement of DBS electrodes in the human STN
FIGURE 2
LEARN
FASTER,
LEARN
BETTER!
BOOCs EPFL 10
5Cellular Mechanisms of Brain Function
Carl Petersen
7.5 CONCLUDING REMARKS
In this course, we have focused on the biophysical mechanisms of brain function, leading us to explore the properties of membranes, ion channels, action potentials, synaptic transmission, dendritic integration, neuronal circuits and synaptic plasticity. We then used aspects of our knowledge to try to see how we might begin to investigate sensorimotor processing, sensory perception, learning and brain diseases. Neuroscience is a vast field, and this course only provides a glimpse of how the brain works from one particular perspective.
There is much more to learn, and I encourage you to study other aspects of neuroscience such as
i) developmental and comparative neuroscience; ii) molecular neurobiology and genetics; iii) drain dysfunction and therapy; iv) sensory and motor systems; and v) computational and theoretical neuroscience.
Cellular Mechanisms of Brain Function Prof. Carl Petersen
7.5 Concluding remarks

LEARN
FASTER,
LEARN
BETTER!
BOOCs EPFL10
6 Cellular Mechanisms of Brain Function
Carl Petersen
IMPRESSUM
EPFL Press, 2017.
Layout : Emphase Sàrl, Lausanne
BOOC text : Georgios Foustoukos and Carl Peterson
Version 1, December 2016
Developed by the EPFL Press, BOOCs (Books and Open Online Courses) provide the accompanying text for MOOCs at the Swiss Federal Institute of Technology in Lausanne (EPFL). They create a real learning advantage and bring added value to the MOOC, summarizing the main points to remember to help obtain the qualification.Learn faster, learn better. Happy studying!
ISBN 978-2-88914-400-6
for the content
Related Documents