Cell-, tissue-, sex- and developmental stage-specific expression of mouse flavin-containing monooxygenases (Fmos) Azara Janmohamed a , Diana Hernandez a , Ian R. Phillips b,1,2 , Elizabeth A. Shephard a,* a Department of Biochemistry and Molecular Biology, University College London, Gower Street, London WC1E 6BT, UK b School of Biological Sciences, Queen Mary, University of London, Mile End Road, London E1 4NS, UK Received 13 January 2004; accepted 19 February 2004 Abstract The cell-, tissue-, sex- and developmental stage-specific expression profiles of five members of the flavin-containing monooxygenase (FMO) family, FMO1, 2, 3, 4 and 5, were investigated in 129/SV mice, using isoform-specific antisense RNA probes. In situ hybridization localized FMO1 and 5 mRNAs to the perivenous, and FMO 2, 3 and 4 mRNAs to the periportal, regions of the liver. In kidney, each FMO mRNA is localized to the distal and proximal tubules and collecting ducts; FMO1 mRNA is present also in the glomerulus. In lung, FMO1 and 3 mRNAs are expressed in the terminal bronchiole, and FMO1 mRNA also in the alveoli. FMO1 mRNA is present in neurons of the cerebrum and in the choroid plexus. RNase protection assays showed that the most abundant isoform in newborn liver, lung, kidney and brain, and in adult lung and kidney is FMO1, but in adult liver FMO5 is present in greatest amounts. In liver, lung and kidney, expression of Fmo1, 3 and 5 peaks at 3 or 5 weeks of age, but in the brain, Fmo1 expression is greatest in newborns. In the kidney, FMO5 mRNA abundance is fourfold greater in males than in females, at all stages of development. Our results demonstrate that Fmo1, 2, 3, 4 and 5 exhibit distinct cell-, tissue-, sex- and developmental stage-specific patterns of expression. # 2004 Elsevier Inc. All rights reserved. Keywords: Flavin-containing monooxygenase; Mouse; Tissue; Development; Gene regulation; In situ hybridization 1. Introduction The flavin-containing monooxygenases (FMOs) [EC 1.14.13.8] constitute a family of proteins that play an important role in the detoxification of many foreign che- micals, including psychoactive drugs, pesticides and diet- ary-derived compounds [1]. Humans have five genes, named Fmo1–5 [2], and six pseudogenes, Fmo6P–11P [3]. In mice, there are nine Fmo genes, which are named Fmo1–6 and 9, 12 and 13 [3]. FMO1 and 3 are considered to be the most important members of the FMO family with respect to the metabolism of foreign chemicals [4]. In humans, FMO1 is expressed in fetal kidney and liver and in the adult kidney, but not in adult liver [5]. This is in contrast with other mammals, such as pig [6], rabbit [7], rat [8] and mouse [9], which do express FMO1 in adult liver. The expression of FMO3 is switched on in the liver after birth in humans [5,10] and in mice [9]. In most humans, functional FMO2 is not expressed because of nonsense and/or frameshift mutations in the FMO2 gene [11–13]. An allele encoding a full-length functional FMO2 is present at a frequency of 13% in individuals of African descent [14]. In rabbit [15], mouse [16] and guinea pig [17], a full-length functional FMO2 is expressed in the lung. But the FMO2 gene of Rattus norvegicus encodes a non-func- tional protein [18]. Current evidence indicates that FMO6, in humans, also does not code for a functional protein [13,19]. FMO5 is expressed in the liver of humans [20], rabbit [21], guinea pig [20] and mouse [22] and FMO4 mRNA has been detected in low amounts in several human tissues [23,24]. Analysis of mouse sequence databases revealed no cDNAs for FMO12 and 13 and just one, isolated from a 0-day neonate mouse head library, for FMO9 [3]. Thus, none of these three genes appears to be significantly expressed in the adult mouse. Biochemical Pharmacology 68 (2004) 73–83 0006-2952/$ – see front matter # 2004 Elsevier Inc. All rights reserved. doi:10.1016/j.bcp.2004.02.036 Abbreviations: CYP, cytochrome P450; FMOs, flavin-containing monooxygenases; RT-PCR, reverse transcription-PCR; DEPC-PBS, diethylpyrocarbonate-phosphate buffered saline * Corresponding author. Tel.: þ44-207-6792321; fax: þ44-20-76797193. E-mail addresses: [email protected] (I.R. Phillips), [email protected] (E.A. Shephard). 1 Co-corresponding author. 2 Tel.: þ44-207-8826338; fax: þ44-208-9830531.

Welcome message from author
This document is posted to help you gain knowledge. Please leave a comment to let me know what you think about it! Share it to your friends and learn new things together.
Transcript
Cell-, tissue-, sex- and developmental stage-specific expressionof mouse flavin-containing monooxygenases (Fmos)
Azara Janmohameda, Diana Hernandeza, Ian R. Phillipsb,1,2, Elizabeth A. Shepharda,*
aDepartment of Biochemistry and Molecular Biology, University College London, Gower Street, London WC1E 6BT, UKbSchool of Biological Sciences, Queen Mary, University of London, Mile End Road, London E1 4NS, UK
Received 13 January 2004; accepted 19 February 2004
Abstract
The cell-, tissue-, sex- and developmental stage-specific expression profiles of five members of the flavin-containing monooxygenase
(FMO) family, FMO1, 2, 3, 4 and 5, were investigated in 129/SV mice, using isoform-specific antisense RNA probes. In situ hybridization
localized FMO1 and 5 mRNAs to the perivenous, and FMO 2, 3 and 4 mRNAs to the periportal, regions of the liver. In kidney, each FMO
mRNA is localized to the distal and proximal tubules and collecting ducts; FMO1 mRNA is present also in the glomerulus. In lung, FMO1
and 3 mRNAs are expressed in the terminal bronchiole, and FMO1 mRNA also in the alveoli. FMO1 mRNA is present in neurons of the
cerebrum and in the choroid plexus. RNase protection assays showed that the most abundant isoform in newborn liver, lung, kidney and
brain, and in adult lung and kidney is FMO1, but in adult liver FMO5 is present in greatest amounts. In liver, lung and kidney, expression of
Fmo1, 3 and 5 peaks at 3 or 5 weeks of age, but in the brain, Fmo1 expression is greatest in newborns. In the kidney, FMO5 mRNA
abundance is fourfold greater in males than in females, at all stages of development. Our results demonstrate that Fmo1, 2, 3, 4 and 5
exhibit distinct cell-, tissue-, sex- and developmental stage-specific patterns of expression.
# 2004 Elsevier Inc. All rights reserved.
Keywords: Flavin-containing monooxygenase; Mouse; Tissue; Development; Gene regulation; In situ hybridization
1. Introduction
The flavin-containing monooxygenases (FMOs) [EC
1.14.13.8] constitute a family of proteins that play an
important role in the detoxification of many foreign che-
micals, including psychoactive drugs, pesticides and diet-
ary-derived compounds [1]. Humans have five genes,
named Fmo1–5 [2], and six pseudogenes, Fmo6P–11P
[3]. In mice, there are nine Fmo genes, which are named
Fmo1–6 and 9, 12 and 13 [3].
FMO1 and 3 are considered to be the most important
members of the FMO family with respect to the metabolism
of foreign chemicals [4]. In humans, FMO1 is expressed in
fetal kidney and liver and in the adult kidney, but not in
adult liver [5]. This is in contrast with other mammals, such
as pig [6], rabbit [7], rat [8] and mouse [9], which do express
FMO1 in adult liver. The expression of FMO3 is switched
on in the liver after birth in humans [5,10] and in mice [9].
In most humans, functional FMO2 is not expressed because
of nonsense and/or frameshift mutations in the FMO2 gene
[11–13]. An allele encoding a full-length functional FMO2
is present at a frequency of 13% in individuals of African
descent [14]. In rabbit [15], mouse [16] and guinea pig [17],
a full-length functional FMO2 is expressed in the lung. But
the FMO2 gene of Rattus norvegicus encodes a non-func-
tional protein [18]. Current evidence indicates that FMO6,
in humans, also does not code for a functional protein
[13,19]. FMO5 is expressed in the liver of humans [20],
rabbit [21], guinea pig [20] and mouse [22] and FMO4
mRNA has been detected in low amounts in several human
tissues [23,24]. Analysis of mouse sequence databases
revealed no cDNAs for FMO12 and 13 and just one,
isolated from a 0-day neonate mouse head library, for
FMO9 [3]. Thus, none of these three genes appears to be
significantly expressed in the adult mouse.
Biochemical Pharmacology 68 (2004) 73–83
0006-2952/$ – see front matter # 2004 Elsevier Inc. All rights reserved.
doi:10.1016/j.bcp.2004.02.036
Abbreviations: CYP, cytochrome P450; FMOs, flavin-containing
monooxygenases; RT-PCR, reverse transcription-PCR; DEPC-PBS,
diethylpyrocarbonate-phosphate buffered saline* Corresponding author. Tel.: þ44-207-6792321;
fax: þ44-20-76797193.
E-mail addresses: [email protected] (I.R. Phillips),
[email protected] (E.A. Shephard).1 Co-corresponding author.2 Tel.: þ44-207-8826338; fax: þ44-208-9830531.
Members of the family exhibit marked developmental
stage- and tissue-specific patterns of expression, which
differ among species [3,5]. Differences in the patterns of
expression of FMOs have implications for the ability of an
organism to respond to substrates of these enzymes that are
present in its environment and diet, or that are used as
therapeutic drugs in clinical or veterinary medicine.
Hormonal regulation appears to play a key role in some
of the species- and gender-specific differences observed in
FMO expression. For example, in mice Fmo3 is down-
regulated in adult male liver by testosterone [25], whereas
male rats have a higher hepatic FMO-related enzyme
activity than do females [26]. In vitro studies, using co-
cultures of male rat hepatocytes, showed that 17 beta-
estradiol [27] and thyroid hormones [28] down-regulate the
expression of FMO. In humans the symptoms of a fish-like
body odour, associated with the inherited disorder tri-
methylaminuria (fish-odour syndrome), are exacerbated
in some females during menstruation [29], indicating a
hormonally mediated decrease in the abundance of FMO3,
whose gene, when mutated, gives rise to the disorder [30].
The mouse is increasingly being used as a model
organism as researchers seek to understand the function
of mammalian genes and the role of specific proteins in
health and disease. We have investigated the expression
profiles, in the mouse, of five members of the mammalian
FMO family, FMO1, 2, 3, 4 and 5. To define these profiles
precisely, we have used both in situ hybridization analysis
and quantitative RNase protection assays with mouse FMO
isoform-specific antisense RNA probes. This allows a
comparison of the abundance and cellular location of each
isoform within a single tissue, among tissues, and at
different stages of development. The quantitative nature
of RNase protection assays means that direct comparisons
can be made between data derived from the mouse and
published data obtained from human tissues.
2. Materials and methods
2.1. Animals
Animals were purchased from Harlan and maintained on
the Harlan Teklad TRM Rat/Mouse diet. They had free
access to food and water and were sacrificed by cervical
dislocation.
2.2. Sexing of newborn
The sex of newborn 129/SV mice was determined by
PCR-amplification of a Y chromosome-specific sequence,
from tail DNA, using the primer pair: forward, YMTFP1,
50-ctggagctctacagtgatga-30; reverse, YMTRP1, 50-cagtta-
ccaatcaacacatcac-30 [31]. Tail DNA was isolated as
described [32]. As a positive control, a sequence of the
myogenin gene was amplified using the primer pair: for-
ward, Omla, 50-ttacgtccatcgtggacagcat-30, reverse, Omlb,
50-tgggctgggtgttagtcttat-30 [33]. Primers were synthesized
by Eurogentech.
2.3. RNA isolation
Total RNA was isolated from liver, lung, kidney and
brain of 129/SV female and male mice of various ages
(newborn, 3, 5 and 8 weeks (adult)), using the ULTRA-
SPEC RNA isolation system (Biotecx). For newborns,
samples were pooled and RNA isolated from a total of
eight males or four females.
2.4. cDNA cloning and synthesis of antisense
RNA probes
cDNA fragments encoding FMO1, 2, 3, 4 and 5 were
generated by reverse transcription-PCR (RT-PCR). Total
RNA (5 mg), isolated from adult female liver (FMO1, 3, 4
and 5) or lung (FMO2), was reverse transcribed using the
First Strand cDNA Synthesis kit for RT-PCR (AMV)
(Roche Molecular Biochemicals), according to the manu-
facturer’s recommendations. Double-stranded DNA mole-
cules were generated by PCR using Taq polymerase
(Qiagen Ltd.). Appropriate primer pairs for the amplifica-
tion of each FMO sequence were designed by reference to
DNA sequences stored under the accession numbers
MMU87456 (FMO1), AF184981 (FMO2), U87147
(FMO3), AI390626 (I.M.A.G.E. 692387) (FMO4) and
U90535 (FMO5). Oligonucleotides used were: FMO1,
forward 50-tgtctctggacagtgggaagt-30, reverse 50-cattcca-
actacaaggactcg-30 (amplifies nucleotides 661–877:
MMU87456); FMO2, forward 50-cgaagacgctattgattgcag-
30, reverse 50-ggcactatcagaggactgga-30 (amplifies nucleo-
tides 1314–1642: AF184981); FMO3, forward 50-caccact-
gaaaagcacggta-30, reverse 50-gtttaaaggcacccaaccatag-30
(amplifies nucleotides 418–862: U87147); FMO4, forward
50-cgtaagtggcctgtcctctat-30; reverse 50-ccactggccagtttcaga-
gaa-30 (amplifies nucleotides 62–404: AI390626); FMO5,
forward 50-atcacacggatgctcacctg-30, reverse 50-gcttgccta-
cacggttcaag-30 (amplifies nucleotides 1261–1494: U90535).
Amplification reactions were carried out using a Techne
PCR machine (SLS). DNA was denatured at 95 8C for
5 min, followed by 35 cycles of denaturation at 95 8C for
45 s, annealing for 30 s at 58 8C (FMO1 and 2), 57 8C(FMO3) or 62 8C (FMO4 and 5), and extension at 72 8C for
30 s, followed by a final extension step of 5 min at 72 8C.
PCR products were cloned into the TOPO TA vector
(Invitrogen). The inserts were then excised using EcoRI
and cloned into the EcoRI site of pBluescript (Stratagene
Europe) to produce the plasmids pBSmFMO1(217),
pBSmFMO2(328), pBSmFMO3(445), pBSmFMO4(343)
and pBSmFMO5(235). To generate antisense probes plas-
mids were first linearized with BamHI (pBSmFMO1(217)),
XbaI (pBSmFMO2(328)), HindIII (pBSmFMO3(445)
and pBSmFMO4(343)) or XhoI (pBSmFMO5(235)), then
74 A. Janmohamed et al. / Biochemical Pharmacology 68 (2004) 73–83
transcribed using the In Vitro Transcription kit (Stratagene
Europe), [a-32P]CTP (800 Ci/mmol; Amersham Pharmacia
Biotech, Little Chalfont, Bucks, UK) and T3 (FMO1
and 2) or T7 RNA polymerase (FMO3, 4 and 5). Sense
probes were generated in the same way except that
plasmids were linearized with HindIII (pBSmFMO1(217)
and pBSmFMO2(328)), or BamHI (pBSmFMO3(445),
pBSmFMO4(343) and pBSmFMO5(235)) and transcribed
using T7 (FMO1 and 2) or T3 (FMO3, 4 and 5) RNA
polymerase.
2.5. RNase protection assays
Synthesis in vitro of radiolabeled antisense and sense
RNAs and RNase protection assays were performed as
described previously [23,34,35]. Gels were exposed to a
phosphorimaging plate (BAS-MP2040, Fuji) and signals
quantified using Image Guage version 3.01 software (Fuji
Photo Film Co. Ltd.). RNA amounts, in terms of mole-
cules/mg of total RNA, were determined by reference to a
standard curve of undigested probe. Values were converted
to molecules/cell by using the average RNA content of a
mammalian cell (5 pg) [36]. Results from RNA samples for
different developmental stages are represented as spot
images, which indicate the level of expression of a parti-
cular FMO RNA. Spot intensities were set relative to
molecules of RNA/cell and are indicated in Fig. 5.
2.6. Tissue sections
Adult male and female mice were perfused with freshly
prepared 10% (v/v) formalin (Sigma-Aldrich) in diethyl-
pyrocarbonate-treated phosphate-buffered saline (DEPC-
PBS) (Sigma-Aldrich). Tissues to be sectioned (liver, lung,
kidney, brain) were excised and fixed overnight at 4 8C in
10% formalin. After two 20-min washes in DEPC-PBS,
tissues were dehydrated in graded ethanol, cleared in
Histoclear (National Diagnostics/Fisher Scientific), infil-
trated with wax and embedded. Sections, 10–15 mm thick,
were cut, using a Leica RM2155 microtome, fixed onto
Superfrost slides (BDH) and dried overnight at 37 8C.
2.7. In situ hybridization probes
Sense and antisense probes for in situ hybridization
were produced from the plasmids pBSmFMO2(328),
pBSmFMO3(445), pBSmFMO4(343) and pBSmFMO5-
(235). Probes derived from pBSmFMO1(217) proved
unsuitable for in situ hybridization. Probes for the ana-
lysis of FMO1 mRNA were instead produced from
pBSmFMO1(350). The insert of this plasmid was generated
using the primers forward, 50-agctgagagagcctgtgctaa-30,and reverse, 50-gggttgttcaggtcctaaaag-30, which prime the
amplification of nucleotides 1135–1484 of mouse FMO1
mRNA. PCR conditions were as above, with an annealing
temperature of 58 8C.
As a positive control for hepatic lobe regional expres-
sion, we constructed the plasmid pBSGS(313), which
encodes nucleotides 911–1222 of the mouse glutamine
synthetase mRNA [37]. Female liver RNA was reverse
transcribed, as above, and amplified using the primer pair
forward, 50-gcgggaggagaatggtctg-30, and reverse, 50-cctgtttcgttgaggagacacg-30, with an annealing temperature
of 60 8C. The PCR product was cloned into TOPO TA,
released by EcoRI digestion and sub-cloned into the EcoRI
site of pBluescript.
To produce antisense probes from pBSmFMO1(350)
and pBSGS(313), plasmids were linearized with BamHI
and transcribed from the T3 promoter. Sense probes
were transcribed from the T7 promoter, following linear-
ization with HindIII. Enzymes for the linearization and
transcription of pBSmFMO2(328), pBSmFMO3(445),
pBSmFMO4(343) and pBSmFMO5(235) were as des-
cribed above for the production of RNase protection
probes. Digoxigenin-labeled antisense and sense probes
were generated using the DIG RNA Labelling Kit (SP6/T7)
(Roche Molecular Biochemicals), according to the manu-
facturer’s recommendations. Probes were diluted 1:5 in
DEPC-treated water and stored at �70 8C.
2.8. In situ hybridization
Tissue sections were de-waxed in xylene (2�, 10 min)
and rehydrated in the following ethanol series (made up in
DEPC-PBS): 100% (2�), 75, 50, 25% (3 min each),
followed by two 5-min washes in DEPC-PBS. They were
then fixed in paraformaldehyde (Sigma-Aldrich), 4% (w/v)
in DEPC-PBS, for 20 min, and washed 3 � 5 min in PBS.
Sections were incubated at 37 8C for 30 min in Proteinase
K (Roche Molecular Biochemicals) (20 mg/ml in DEPC-
PBS), except for brain sections, which were incubated in
Proteinase K (10 mg/ml) for 15 min. Sections were placed
immediately in paraformaldehyde, 4% (w/v) in DEPC-
PBS, for 20 min, then washed in PBS for 3 � 5 min.
Dehydration was for 1 min in each of a series of ethanols
in PBS: 25, 50, 75 and 100% (2�). They were then air
dried, and hybridized at 55–60 8C overnight. Probes were
used at dilutions of 1:500 or 1:1000 in hybridization buffer
(0.2 M NaCl, 5 mM EDTA, 10 mM Tris–HCl, pH 7.5,
5 mM NaH2PO4, 5 mM Na2HPO4, 50% (v/v) deionized
formamide (Sigma-Aldrich), baker’s yeast tRNA (0.1 mg/
ml) (Roche Molecular Biochemicals), 10% (w/v) dextran
sulfate (Sigma-Aldrich), 1� Denhardt’s solution (50�stock, Sigma-Aldrich)).
After hybridization sections were washed at 65 8C, once
for 15 min and twice for 30 min each, in 1� SSC (0.15 M
NaCl, 0.01 M NaH2PO4, 1 mM EDTA), 50% (v/v) for-
mamide, 0.1% (v/v) Tween-20, then at room temperature,
twice for 30 min each in 100 mM maleic acid (Sigma-
Aldrich), pH 7.5, 150 mM NaCl, 0.1% (v/v) Tween-20
(MABT) and once for 1 h in blocking solution (MABT
containing 2% (w/v) blocking reagent (Roche Molecular
A. Janmohamed et al. / Biochemical Pharmacology 68 (2004) 73–83 75
Biochemicals) and 20% (v/v) heat-inactivated sheep serum
(Chemicon International)). Sections were then incubated
overnight at 4 8C with digoxigenin alkaline phosphatase-
conjugated antibody (Fab fragments, Roche Molecular
Biochemicals), diluted 1:1500 in blocking solution,
washed at room temperature, five times for 10 min each,
in MABT, and twice for 10 min each in prestaining buffer
(100 mM Tris–HCl, pH 9, 100 mM NaCl, 5 mM MgCl2).
For color development, sections were incubated at room
temperature for up to 24 h in 100 mM Tris–HCl, pH 9,
100 mM NaCl, 5 mM MgCl2, 0.2 mM 5-bromo-4-chloro-
3-indolyl-phosphate (BCIP; Roche Molecular Biochem-
icals), 0.2 mM nitroblue tetrazolium salt (NBT; Roche
Molecular Biochemicals) and 5% (w/v) polyvinyl alcohol
(average MW 70–100 kDa; Sigma-Aldrich). Color devel-
opment was stopped by rinsing the slides several times in
distilled water. Sections were then dehydrated in a graded
series of ethanols, as described above, and mounted in
XAM medium (BDH).
3. Results and discussion
We have used in situ hybridization to determine, and
compare, the cell type-specific expression of Fmo1, 2, 3, 4
and 5 in liver, lung, kidney and brain of the adult 129/SV
mouse. These experiments show that the regional localiza-
tion in the liver lobule of FMO1, 2, 3, 4 and 5 mRNAs is not
the same. FMO1 and 5 mRNAs are detected across the
acinus, with a concentration gradient decreasing from the
perivenous to periportal region (Fig. 1a and h). In contrast,
expression of FMO2 and 4 is restricted to the periportal
region (Fig. 1b and e). In female adult mice the mRNA
encoding FMO3 also localizes to a region of cells sur-
rounding the portal triad (Fig. 1c). No hybridization signal
was detected with the antisense probe for FMO3 mRNA in
sections of adult male liver (Fig. 1d). The periportal
localization of mRNAs encoding FMO2, 3 and 4 was
confirmed using, as a control, an antisense probe for
glutamine synthetase mRNA, whose expression, in mouse,
is confined to a 2- to 3-cell layer surrounding the central
vein [37]. Antisense probes for glutamine synthetase and
FMO3, used separately (Fig. 1f and c) or together (Fig. 1g),
show no overlap in their site of expression of the corre-
sponding mRNAs. No hybridization signal was observed in
sections hybridized with any of the corresponding five
FMO sense RNA probes (data not shown).
The hepatic distribution of mRNAs encoding FMO1 and
5 is similar to that of mRNAs for other phase I enzymes,
such as the cytochromes P450 (CYPs), most of which are
more highly expressed in hepatocytes of the perivenous
region [38]. The localization of expression of FMO3 to the
periportal region is unusual for a protein whose role is
considered to be predominantly one of xenobiotic meta-
bolism. The location of FMO3 may serve to protect the
liver acinus via a first-pass effect, but may also contribute
to increased toxicity and, possibly, carcinogenesis, if a
potentially harmful chemical is activated by FMO3. For
example, thiourea, phenylthiourea and a-naphthylthiourea
are toxic to mouse C3H/10T1/2 cells expressing human
FMO3, but not to those expressing human FMO1 [39].
Therefore, the differential pattern of FMO expression
within the liver lobule should be considered when carrying
out both in vivo and in vitro hepatic toxicological studies
on substances that are substrates for these enzymes.
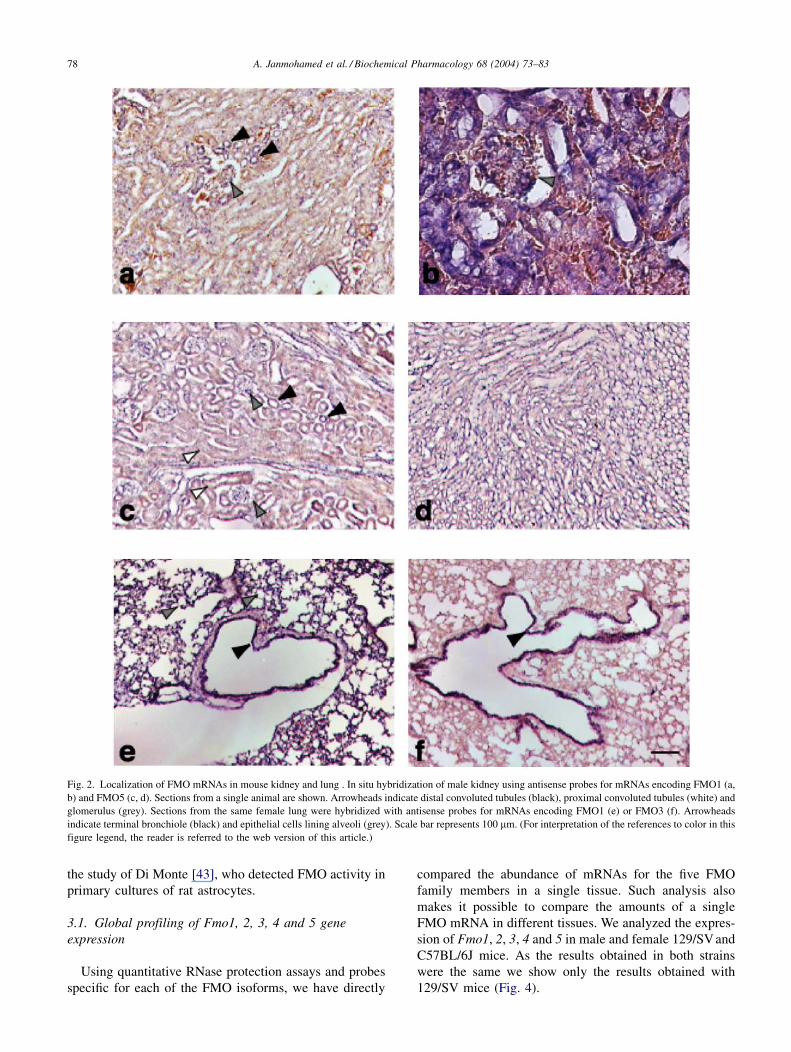
In the kidney, FMO1, 2, 3, 4 and 5 mRNAs are primarily
localized to the distal tubules of the cortex (Fig. 2, data not
shown). The five mRNAs were also detected in the prox-
imal tubules and the collecting ducts of the medulla (Fig. 2c
and d, data not shown). Xenobiotic-metabolizing enzymes,
such as CYPs and glutathione S-transferases, have been
localized to the cells of the proximal tubules, distal tubules
and the thick ascending limb, and in the medulla [40],
suggesting these as sites of renal detoxification. FMO1
mRNA was also detected in the glomerulus (Fig. 2a and b),
the site of initial filtration of blood arriving at the kidney
from the afferent arterioles.
FMO1 mRNA is localized to the endothelial lining of the
alveoli, which includes types I and II endothelial cells
(Fig. 2e), and the cells lining the terminal bronchiole, which
include the Clara cells. However, the particular cell type in
which FMO1 mRNA is present could not be identified
because of the thickness of the sections analyzed
(10–15 mm). The intensity of the hybridization signal in
the terminal bronchiole lining was greater than that in the
lining of the alveoli. FMO2 mRNA is localized to the lining
of the terminal bronchiole and the endothelial cells lining
the alveoli; however, the hybridization signals were weak
(data not shown). In contrast, in rabbits FMO2 has been
identified as the major lung isoform [15]. FMO3 mRNA is
specifically localized to the lining of the terminal bronch-
iole (Fig. 2f) and unlike the situation in liver, is present in
both male and female adult mice. No signal was observed in
the endothelial cells of the alveoli. No discernible signal
was observed by in situ hybridization for FMO4 mRNA
(data not shown). FMO5 mRNA was localized to the lining
of the alveoli and terminal bronchiole (data not shown).
The localization of FMO1 and FMO5 mRNAs in the
mouse lung corresponds to the regions in which FMO2
protein is found in rabbit lung [41]. The terminal bronch-
iole is the first part of the lung to be exposed to exogenous
substances, and the presence, in this region, of FMOs
provides a protective mechanism to the organism. How-
ever, the localization of expression of Fmo1 and 3 genes to
the terminal bronchiole may also predispose the lung to the
toxic effects of chemicals that are activated by FMOs [42].
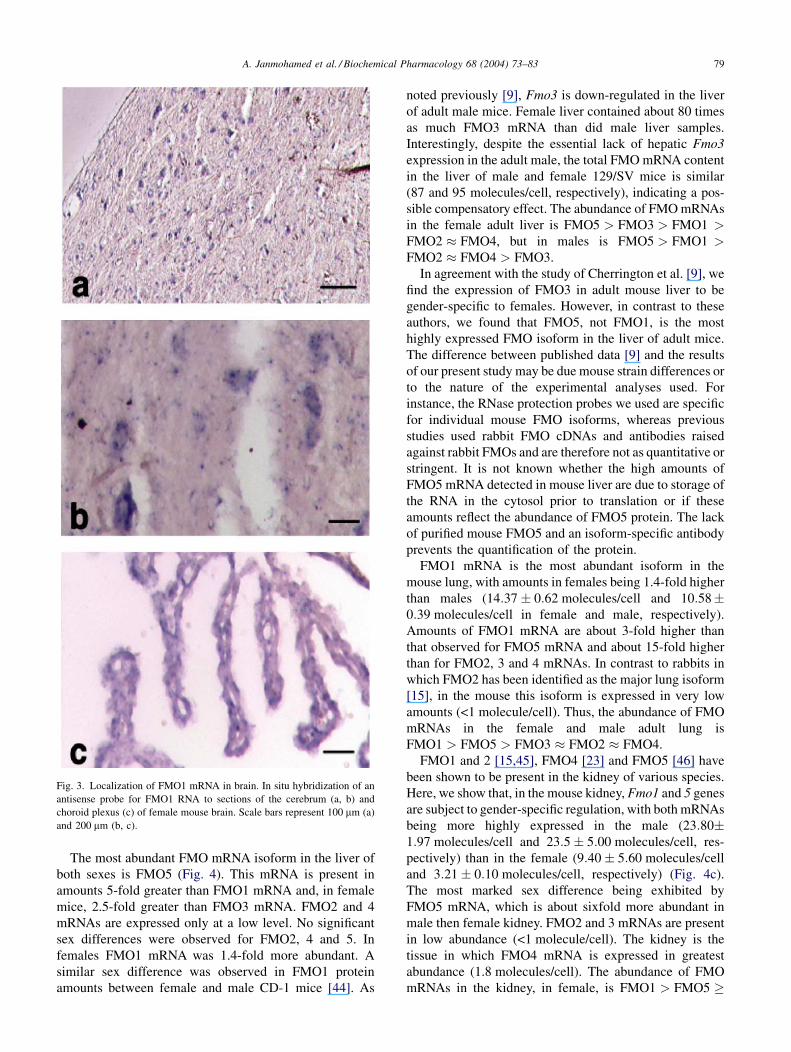
In situ hybridization of mouse brain sections localized
FMO1 mRNA to the neurons of the cerebrum (Fig. 3a
and b) and to the choroid plexus (Fig. 3c), a region rich in
blood vessels. FMO5 mRNA also was detected in the
neurons of the cerebrum (data not shown). No expression
of FMO mRNAs was detected in astrocytes, in contrast to
76 A. Janmohamed et al. / Biochemical Pharmacology 68 (2004) 73–83
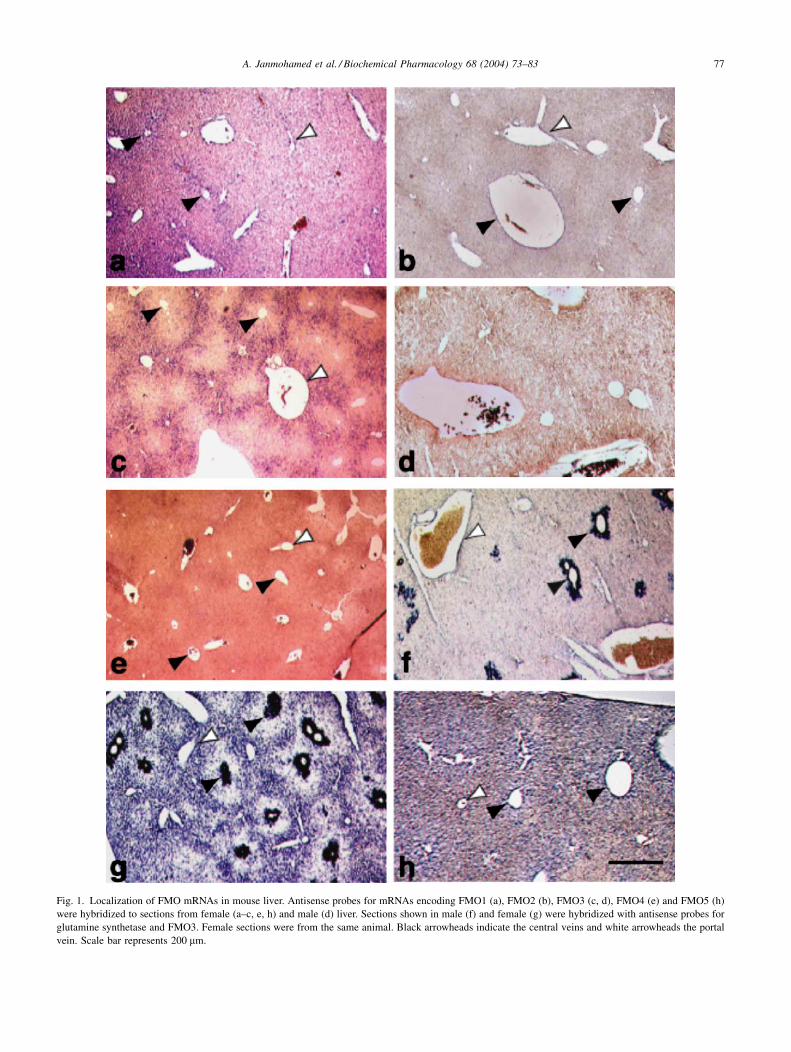
Fig. 1. Localization of FMO mRNAs in mouse liver. Antisense probes for mRNAs encoding FMO1 (a), FMO2 (b), FMO3 (c, d), FMO4 (e) and FMO5 (h)
were hybridized to sections from female (a–c, e, h) and male (d) liver. Sections shown in male (f) and female (g) were hybridized with antisense probes for
glutamine synthetase and FMO3. Female sections were from the same animal. Black arrowheads indicate the central veins and white arrowheads the portal
vein. Scale bar represents 200 mm.
A. Janmohamed et al. / Biochemical Pharmacology 68 (2004) 73–83 77
the study of Di Monte [43], who detected FMO activity in
primary cultures of rat astrocytes.
3.1. Global profiling of Fmo1, 2, 3, 4 and 5 gene
expression
Using quantitative RNase protection assays and probes
specific for each of the FMO isoforms, we have directly
compared the abundance of mRNAs for the five FMO
family members in a single tissue. Such analysis also
makes it possible to compare the amounts of a single
FMO mRNA in different tissues. We analyzed the expres-
sion of Fmo1, 2, 3, 4 and 5 in male and female 129/SV and
C57BL/6J mice. As the results obtained in both strains
were the same we show only the results obtained with
129/SV mice (Fig. 4).
Fig. 2. Localization of FMO mRNAs in mouse kidney and lung . In situ hybridization of male kidney using antisense probes for mRNAs encoding FMO1 (a,
b) and FMO5 (c, d). Sections from a single animal are shown. Arrowheads indicate distal convoluted tubules (black), proximal convoluted tubules (white) and
glomerulus (grey). Sections from the same female lung were hybridized with antisense probes for mRNAs encoding FMO1 (e) or FMO3 (f). Arrowheads
indicate terminal bronchiole (black) and epithelial cells lining alveoli (grey). Scale bar represents 100 mm. (For interpretation of the references to color in this
figure legend, the reader is referred to the web version of this article.)
78 A. Janmohamed et al. / Biochemical Pharmacology 68 (2004) 73–83
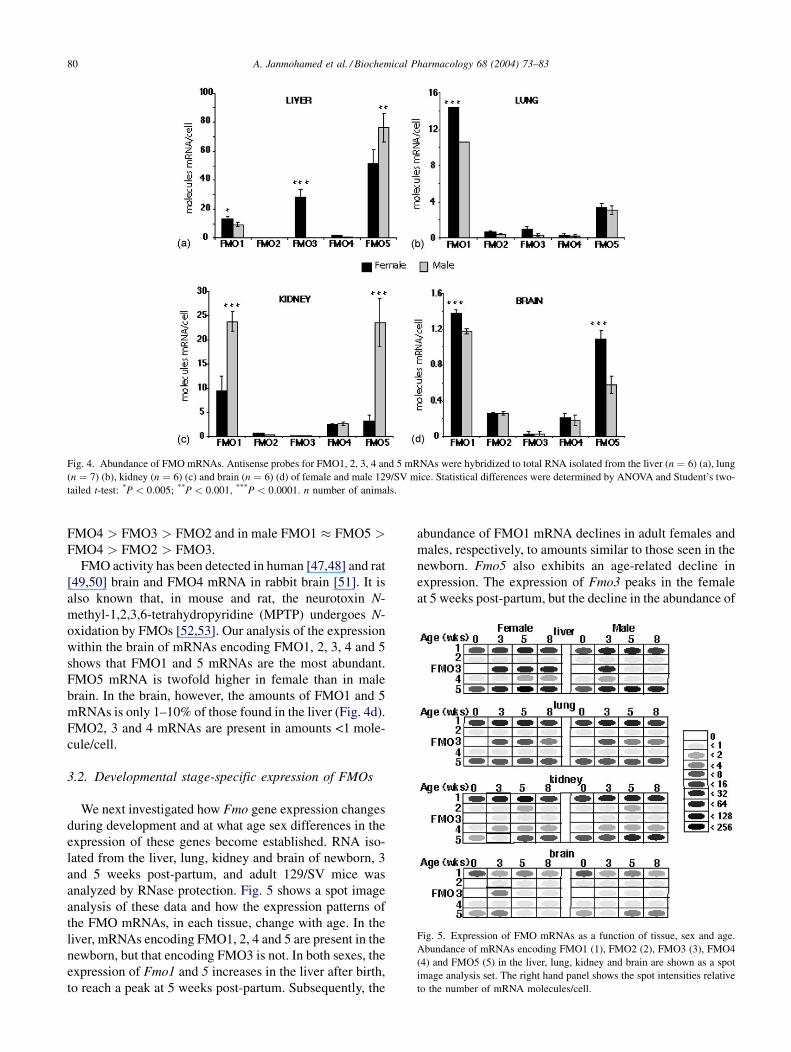
The most abundant FMO mRNA isoform in the liver of
both sexes is FMO5 (Fig. 4). This mRNA is present in
amounts 5-fold greater than FMO1 mRNA and, in female
mice, 2.5-fold greater than FMO3 mRNA. FMO2 and 4
mRNAs are expressed only at a low level. No significant
sex differences were observed for FMO2, 4 and 5. In
females FMO1 mRNA was 1.4-fold more abundant. A
similar sex difference was observed in FMO1 protein
amounts between female and male CD-1 mice [44]. As
noted previously [9], Fmo3 is down-regulated in the liver
of adult male mice. Female liver contained about 80 times
as much FMO3 mRNA than did male liver samples.
Interestingly, despite the essential lack of hepatic Fmo3
expression in the adult male, the total FMO mRNA content
in the liver of male and female 129/SV mice is similar
(87 and 95 molecules/cell, respectively), indicating a pos-
sible compensatory effect. The abundance of FMO mRNAs
in the female adult liver is FMO5 > FMO3 > FMO1 >FMO2 � FMO4, but in males is FMO5 > FMO1 >FMO2 � FMO4 > FMO3.
In agreement with the study of Cherrington et al. [9], we
find the expression of FMO3 in adult mouse liver to be
gender-specific to females. However, in contrast to these
authors, we found that FMO5, not FMO1, is the most
highly expressed FMO isoform in the liver of adult mice.
The difference between published data [9] and the results
of our present study may be due mouse strain differences or
to the nature of the experimental analyses used. For
instance, the RNase protection probes we used are specific
for individual mouse FMO isoforms, whereas previous
studies used rabbit FMO cDNAs and antibodies raised
against rabbit FMOs and are therefore not as quantitative or
stringent. It is not known whether the high amounts of
FMO5 mRNA detected in mouse liver are due to storage of
the RNA in the cytosol prior to translation or if these
amounts reflect the abundance of FMO5 protein. The lack
of purified mouse FMO5 and an isoform-specific antibody
prevents the quantification of the protein.
FMO1 mRNA is the most abundant isoform in the
mouse lung, with amounts in females being 1.4-fold higher
than males (14:37 � 0:62 molecules/cell and 10:58�0:39 molecules/cell in female and male, respectively).
Amounts of FMO1 mRNA are about 3-fold higher than
that observed for FMO5 mRNA and about 15-fold higher
than for FMO2, 3 and 4 mRNAs. In contrast to rabbits in
which FMO2 has been identified as the major lung isoform
[15], in the mouse this isoform is expressed in very low
amounts (<1 molecule/cell). Thus, the abundance of FMO
mRNAs in the female and male adult lung is
FMO1 > FMO5 > FMO3 � FMO2 � FMO4.
FMO1 and 2 [15,45], FMO4 [23] and FMO5 [46] have
been shown to be present in the kidney of various species.
Here, we show that, in the mouse kidney, Fmo1 and 5 genes
are subject to gender-specific regulation, with both mRNAs
being more highly expressed in the male (23:80�1:97 molecules/cell and 23:5 � 5:00 molecules/cell, res-
pectively) than in the female (9:40 � 5:60 molecules/cell
and 3:21 � 0:10 molecules/cell, respectively) (Fig. 4c).
The most marked sex difference being exhibited by
FMO5 mRNA, which is about sixfold more abundant in
male then female kidney. FMO2 and 3 mRNAs are present
in low abundance (<1 molecule/cell). The kidney is the
tissue in which FMO4 mRNA is expressed in greatest
abundance (1.8 molecules/cell). The abundance of FMO
mRNAs in the kidney, in female, is FMO1 > FMO5 �
Fig. 3. Localization of FMO1 mRNA in brain. In situ hybridization of an
antisense probe for FMO1 RNA to sections of the cerebrum (a, b) and
choroid plexus (c) of female mouse brain. Scale bars represent 100 mm (a)
and 200 mm (b, c).
A. Janmohamed et al. / Biochemical Pharmacology 68 (2004) 73–83 79
FMO4 > FMO3 > FMO2 and in male FMO1 � FMO5 >FMO4 > FMO2 > FMO3.
FMO activity has been detected in human [47,48] and rat
[49,50] brain and FMO4 mRNA in rabbit brain [51]. It is
also known that, in mouse and rat, the neurotoxin N-
methyl-1,2,3,6-tetrahydropyridine (MPTP) undergoes N-
oxidation by FMOs [52,53]. Our analysis of the expression
within the brain of mRNAs encoding FMO1, 2, 3, 4 and 5
shows that FMO1 and 5 mRNAs are the most abundant.
FMO5 mRNA is twofold higher in female than in male
brain. In the brain, however, the amounts of FMO1 and 5
mRNAs is only 1–10% of those found in the liver (Fig. 4d).
FMO2, 3 and 4 mRNAs are present in amounts <1 mole-
cule/cell.
3.2. Developmental stage-specific expression of FMOs
We next investigated how Fmo gene expression changes
during development and at what age sex differences in the
expression of these genes become established. RNA iso-
lated from the liver, lung, kidney and brain of newborn, 3
and 5 weeks post-partum, and adult 129/SV mice was
analyzed by RNase protection. Fig. 5 shows a spot image
analysis of these data and how the expression patterns of
the FMO mRNAs, in each tissue, change with age. In the
liver, mRNAs encoding FMO1, 2, 4 and 5 are present in the
newborn, but that encoding FMO3 is not. In both sexes, the
expression of Fmo1 and 5 increases in the liver after birth,
to reach a peak at 5 weeks post-partum. Subsequently, the
abundance of FMO1 mRNA declines in adult females and
males, respectively, to amounts similar to those seen in the
newborn. Fmo5 also exhibits an age-related decline in
expression. The expression of Fmo3 peaks in the female
at 5 weeks post-partum, but the decline in the abundance of
Fig. 4. Abundance of FMO mRNAs. Antisense probes for FMO1, 2, 3, 4 and 5 mRNAs were hybridized to total RNA isolated from the liver (n ¼ 6) (a), lung
(n ¼ 7) (b), kidney (n ¼ 6) (c) and brain (n ¼ 6) (d) of female and male 129/SV mice. Statistical differences were determined by ANOVA and Student’s two-
tailed t-test: *P < 0:005; **P < 0:001, ***P < 0:0001. n number of animals.
Fig. 5. Expression of FMO mRNAs as a function of tissue, sex and age.
Abundance of mRNAs encoding FMO1 (1), FMO2 (2), FMO3 (3), FMO4
(4) and FMO5 (5) in the liver, lung, kidney and brain are shown as a spot
image analysis set. The right hand panel shows the spot intensities relative
to the number of mRNA molecules/cell.
80 A. Janmohamed et al. / Biochemical Pharmacology 68 (2004) 73–83
FMO3 mRNA in the adult is only about 20%. In males,
however, the mRNA peaks earlier, at 3 weeks post-partum,
and is barely detectable by 5 weeks. FMO2 and 4 mRNAs
remain relatively constant at <1–2 molecules/cell and exhi-
bit no significant age-related changes in their expression.
In humans, FMO1 is the predominant fetal hepatic
isoform [5] and its expression is suppressed after birth
[5,10]. Mice [9], like other mammals [15], maintain hepa-
tic FMO1 expression in adulthood. However, in the 129/SV
and C57BL/6J mouse strains, as in man, Fmo5 is the most
highly expressed member of the family in liver [24].
The regulation of Fmo3 expression by sex steroids in
male mouse liver is documented [25]. Our studies show
that, in mouse liver, Fmo1, 3 and 5 are all up-regulated
during puberty, presumably due to hormonal influences,
and all are down-regulated in adulthood.
In the kidney, both FMO1 and 5 mRNAs are detectable
in the newborn and, as is the case in the liver, the expres-
sion of each of the corresponding genes peaks at 5 weeks of
age. Although the developmental pattern of expression of
Fmo5 is the same in male and female mice, there is a
striking gender difference in the abundance of the mRNA.
This is greater, at all stages of development, in the male and
the fold-difference between the two genders remains con-
stant throughout development suggesting that the gender
difference in Fmo5 expression is unlikely to be due to
hormonal factors.
FMO3 mRNA is undetectable in the kidney of new-
borns, but its expression increases by 3 weeks. Fmo4
expression in kidney, although low, was found to be greater
at all ages, than in other tissues investigated and the mRNA
increased from birth and then remained constant from 3
weeks of age through to adulthood.
In the lung, as is the case for liver and kidney, Fmo1, 2, 4
and 5 are expressed in the newborn and Fmo3 is not. The
abundance of FMO1 mRNA increases about fourfold from
birth to 3 and 5 weeks of age, but then declines in the adult
to a level that is similar to that in the newborn. In contrast,
the abundance of FMO5 mRNA remains relatively con-
stant in both sexes from birth to adulthood. FMO2 and 4
mRNAs are present in low amounts in lung at all devel-
opmental stages. From 3 weeks of age to adulthood the
amount of FMO3 mRNA remains constant.
In the brain FMO1 mRNA is most abundant in the
newborn and drops about 80% by 8 weeks of age.
FMO5 mRNA, is only 70% of that of FMO1 mRNA in
the newborns. However, FMO1 and 5 mRNAs are present
in similar amounts in the brains of 3-, 5- and 8-week-old
animals. As in all other tissues examined, FMO3 mRNA
was not detected in the brains of newborn mice. But the
mRNA was present, in low amounts (<1 molecule/cell), at
3, 5 and 8 weeks of age.
Our results show that FMO1 mRNA is the most abundant
FMO mRNA in the liver, lung, kidney and brain of newborn
mice. The reasons for the higher expression of Fmo1 in early
development are not yet understood. The predominance of
this mRNA does not change with age in the lung and kidney.
In the liver, however, FMO5 mRNA is the most highly
expressed FMO mRNA from age 3 weeks into adulthood.
These two mRNAs were found in all tissues analyzed and
showed a number of similarities in their tissue- and cell type-
specific expression profiles, suggesting that their genes share
common regulatory factors. Fmo3 is switched on only after
birth in liver, lung, kidney and brain. The decline in Fmo3
expression in the liver of adult male mouse is not observed in
the kidney and lung. Fmo3 is therefore subject to differ-
ential, tissue-specific hormonal control. In both sexes
mRNAs encoding FMO1, 3 and 5 increase during puberty
and decline with age, suggesting a physiological role, during
development, for the proteins they encode. Fmo1, 3 and 5 are
therefore all subject to age-related down-regulation.
A detailed functional analysis of the promoter elements
is necessary to define the DNA regulatory elements and
transcription factors that control the developmental-, tis-
sue-, cell type- and gender-specific expression of each of
the Fmo genes. The production of mice, deficient in various
FMO activities, will help to define the precise biological
roles of the Fmo gene family in the metabolism of endo-
genous and exogenous chemicals in specific cell types and
at various developmental stages.
The data presented in this paper and the quantitative
nature of the RNase protection assay make it possible to
compare directly the amounts of FMO mRNAs produced in
mouse and human. For example, in both human and mouse
FMO1 mRNA is the most abundant FMO mRNA in the
kidney [23]. In both species, the Fmo3 gene is switched on
only after birth, although the mouse, unlike human [5],
continues to express Fmo1 in adult liver. FMO5 mRNA is
the most highly expressed FMO mRNA in the liver of both
human (about 30 molecules/cell) [24], and in 129/SV mice
(51 � 10 molecules/cell and 76 � 10 molecules/cell in
females and males, respectively). FMO4 mRNA is
expressed in low amounts (1–2 molecules/cell) in liver,
lung and kidney of both human [23] and mouse.
Determination of the expression profiles of a particular
gene or family of genes is a logical next step as we enter the
post-genomic phase and decipher the patterns of expres-
sion of orthologous genes in different species.
Acknowledgments
We thank Dr. Anoop Kumar, Department of Biochemistry
and Molecular Biology, University College London, for help
with tissue preparation and photography. The work was
supported by a grant from the Wellcome Trust (No. 053590).
References
[1] Cashman JR. Human flavin-containing monooxygenase: substrate
specificity and role in drug metabolism. Curr Drug Metab 2000;1:
181–91.
A. Janmohamed et al. / Biochemical Pharmacology 68 (2004) 73–83 81
[2] Phillips IR, Dolphin CT, Clair P, Hadley MR, Hutt AJ, McCombie RR,
et al. The molecular biology of the flavin-containing monooxygenases
of man. Chem Biol Interact 1995;96:17–32.
[3] Hernandez D, Janmohamed A, Chandan P, Phillips IR, Shephard EA.
Organization and evolution of the flavin-containing monooxygenase
(FMO) genes of human and mouse: identification of novel gene and
pseudogene clusters. Pharmacogenetics 2004;14:117–30.
[4] Ziegler DM. Recent studies on the structure and function of multi-
substrate flavin-containing monooxygenases. Ann Rev Pharmacol
Toxicol 1993;33:179–99.
[5] Dolphin C, Shephard EA, Povey S, Palmer CN, Ziegler DM, Ayesh R,
et al. Cloning, primary sequence, and chromosomal mapping of a
human flavin-containing monooxygenase (FMO1). J Biol Chem
1991;266:12379–85.
[6] Gasser R, Tynes RE, Lawton MP, Korsmeyer KK, Ziegler DM, Philpot
RM. The flavin-containing monooxygenase expressed in pig liver:
primary sequence, distribution, and evidence for a single gene.
Biochemistry 1990;29:119–24.
[7] Lawton MP, Gasser R, Tynes RE, Hodgson E, Philpot RM. The flavin-
containing monooxygenase enzymes expressed in rabbit liver and lung
are products of related but distinctly different genes. J Biol Chem
1990;265:5855–61.
[8] Lattard V, Lachuer J, Buronfosse T, Garnier F, Benoit E. Physiological
factors affecting the expression of FMO1 and FMO3 in the rat liver
and kidney. Biochem Pharmacol 2002;63:1453–64.
[9] Cherrington NJ, Cao Y, Cherrington JW, Rose RL, Hodgson E.
Physiological factors affecting protein expression of flavin-containing
monooxygenases 1, 3 and 5. Xenobiotica 1998;28:673–82.
[10] Koukouritaki SB, Simpson P, Yeung CK, Rettie AE, Hines RN.
Human hepatic flavin-containing monooxygenases 1 (FMO1) and 3
(FMO3) developmental expression. Pediatr Res 2002;51:236–43.
[11] Dolphin CT, Beckett DJ, Janmohamed A, Cullingford TE, Smith RL,
Shephard EA, et al. The flavin-containing monooxygenase 2 gene
(FMO2) of humans, but not of other primates, encodes a truncated,
nonfunctional protein. J Biol Chem 1998;273:30599–607.
[12] Whetstine JR, Yueh M, McCarver DG, Williams DE, Park C, Kang JH,
et al. Ethnic differences in human flavin-containing monooxygenase 2
(FMO2) polymorphisms: detection of expressed protein in African-
Americans. Toxicol Appl Pharmacol 2000;168:216–24.
[13] Furnes B, Feng J, Sommer SS, Schlenk D. Identification of novel
variants of the flavin-containing monooxygenase gene family in
African Americans. Drug Metab Dispos 2003;31:187–93.
[14] Krueger SK, Martin SR, Yueh MF, Pereira CB, Williams DE. Identi-
fication of active flavin-containing monooxygenase isoform 2 in
human lung and characterization of expressed protein. Drug Metab
Dispos 2002;30:34–41.
[15] Shehin-Johnson SE, Williams DE, Larsen Su S, Stresser DM, Hines
RN. Tissue-specific expression of flavin-containing monooxygenase
(FMO) forms 1 and 2 in the rabbit. J Pharmacol Exp Ther 1995;272:
1293–9.
[16] Karoly ED, Rose RL. Sequencing, expression, and characterization of
cDNA expressed flavin-containing monooxygenase 2 from mouse. J
Biochem Mol Toxicol 2001;15:300–8.
[17] Nikbakht KN, Lawton MP, Philpot RM. Guinea pig or rabbit lung
flavin-containing monooxygenases with distinct mobilities in SDS–
PAGE are allelic variants that differ at only two positions. Pharma-
cogenetics 1992;2:207–16.
[18] Lattard V, Longin-Sauvageon C, Krueger SK, Williams DE, Benoit E.
The FMO2 gene of laboratory rats, as in most humans, encodes a
truncated protein. Biochem Biophys Res Commun 2002;292:558–63.
[19] Hines RN, Hopp KA, Franco J, Saeian K, Begun FP. Alternative
processing of the human FMO6 gene renders transcripts incapable of
encoding a functional flavin-containing monooxygenase. Mol Phar-
macol 2002;62:320–5.
[20] Overby LH, Buckpitt AR, Lawton MP, Atta AAE, Schulze J, Philpot
RM. Characterization of flavin-containing monooxygenase 5 (FMO5)
cloned from human and guinea pig: evidence that the unique catalytic
properties of FMO5 are not confined to the rabbit ortholog. Arch
Biochem Biophys 1995;317:275–84.
[21] Atta-Asafo-Adjei E, Lawton MP, Philpot RM. Cloning, sequencing,
distribution, and expression in Escherichia coli of flavin-containing
monooxygenase 1C1. Evidence for a third gene subfamily in rabbits. J
Biol Chem 1993;268:9681–9.
[22] Cherrington NJ, Falls JG, Rose RL, Clements KM, Philpot RM, Levi
PE, et al. Molecular cloning, sequence, and expression of mouse
flavin-containing monooxygenases 1 and 5 (FMO1 and FMO5). J
Biochem Mol Toxicol 1998;12:205–12.
[23] Dolphin CT, Cullingford TE, Shephard EA, Smith RL, Phillips IR.
Differential developmental and tissue-specific regulation of expres-
sion of the genes encoding three members of the flavin-containing
monooxygenase family of man, FMO1, FMO3 and FMO4. Eur J
Biochem 1996;235:683–9.
[24] Janmohamed A, Dolphin CT, Phillips IR, Shephard EA. Quantifica-
tion and cellular localization of expression in human skin of genes
encoding flavin-containing monooxygenases and cytochromes P450.
Biochem Pharmacol 2001;62:777–86.
[25] Falls JG, Ryu DY, Cao Y, Levi PE, Hodgson E. Regulation of mouse
liver flavin-containing monooxygenases 1 and 3 by sex steroids. Arch
Biochem Biophys 1997;342:212–23.
[26] Lemoine A, Williams DE, Cresteil T, Leroux JP. Hormonal regulation
of microsomal flavin-containing monooxygenase: tissue-dependent
expression and substrate specificity. Mol Pharmacol 1991;40:211–7.
[27] Coecke S, Debast G, Phillips IR, Vercruysse A, Shephard EA,
Rogiers V. Hormonal regulation of microsomal flavin-containing
monooxygenase activity by sex steroids and growth hormone in co-
cultured adult male rat hepatocytes. Biochem Pharmacol 1998;56:
1047–51.
[28] Coecke S, Callaerts A, Phillips IR, Vercruysse A, Shephard EA,
Rogiers V. Effect of thyroid hormones on flavin-containing mono-
oxygenase activity in co-cultured adult rat hepatocytes. Toxicol In
Vitro 1998;12:335–41.
[29] Zhang AQ, Mitchell SC, Smith RL. Exacerbation of symptoms of fish-
odour syndrome during menstruation. Lancet 1996;348:1740–1.
[30] Dolphin CT, Janmohamed A, Smith RL, Shephard EA, Phillips IR.
Missense mutation in flavin-containing mono-oxygenase 3 gene,
FMO3, underlies fish-odour syndrome. Nat Genet 1997;17:491–4.
[31] Bishop CE, Hatat D. Molecular cloning and sequence analysis of a
mouse Y chromosome RNA transcript expressed in the testis. Nucleic
Acids Res 1987;15:2959–69.
[32] Hammes A, Schedl A. Generation of transgenic mice from plasmids,
BACs and YACs. In: Abbot CM, editor. Mouse genetics and trans-
genics. Oxford: Oxford University Press; 2000. p. 217–45.
[33] Wright WE, Sassoon DA, Lin VK. Myogenin, a factor regulating
myogenesis, has a domain homologous to MyoD. Cell 1989;56:
607–17.
[34] Shephard EA, Palmer CN, Segall HJ, Phillips IR. Quantification of
cytochrome P450 reductase gene expression in human tissues. Arch
Biochem Biophys 1992;294:168–72.
[35] Akrawi M, Rogiers V, Vandenberghe Y, Palmer CN, Vercruysse A,
Shephard EA, et al. Maintenance and induction in co-cultured rat
hepatocytes of components of the cytochrome P450-mediated mono-
oxygenase. Biochem Pharmacol 1993;45:1583–91.
[36] Little PFR, Jackson IJ. In: Glover DM, editor. DNA cloning, vol. III.
Oxford: IRL Press; 1987. p. 1–18.
[37] Kuo CF, Paulson KE, Darnell Jr JE. Positional and developmental
regulation of glutamine synthetase expression in mouse liver. Mol Cell
Biol 1988;8:4966–71.
[38] Lindros KO. Zonation of cytochrome P450 expression, drug metabo-
lism and toxicity in liver. Gen Pharmacol 1997;28:191–6.
[39] Smith PB, Crespi C. Thiourea toxicity in mouse C3H/10T1/2 cells
expressing human flavin-dependent monooxygenase 3a. Biochem
Pharmacol 2002;63:1941–8.
82 A. Janmohamed et al. / Biochemical Pharmacology 68 (2004) 73–83
[40] Lock EA, Reed CJ. Xenobiotic metabolizing enzymes of the kidney.
Toxicol Pathol 1998;26:18–25.
[41] Overby L, Nishio SJ, Lawton MP, Plopper CG, Philpot RM. Cellular
localization of flavin-containing monooxygenase in rabbit lung. Exp
Lung Res 1992;18:131–44.
[42] Cashman JR, Traiger GJ, Hanzlik RP. Pneumotoxic effects of thio-
benzamide derivatives. Toxicology 1982;23:85–93.
[43] Di-Monte DA, Wu EY, Irwin I, Delanney LE, Langston JW. Bio-
transformation of 1-methyl-4-phenyl-1,2,3,6-tetrahydropyridine in
primary cultures of mouse astrocytes. J Pharmacol Exp Ther
1991;258:594–600.
[44] Falls JG, Blake BL, Cao Y, Levi PE, Hodgson E. Gender differences in
hepatic expression of flavin-containing monooxygenase isoforms
(FMO1, FMO3, and FMO5) in mice. J Biochem Toxicol 1995;10:
171–7.
[45] Tynes RE, Philpot RM. Tissue- and species-dependent expression of
multiple forms of mammalian microsomal flavin-containing mono-
oxygenase. Mol Pharmacol 1987;31:569–74.
[46] Chung WG, Park CS, Roh HK, Lee WK, Cha YN. Oxidation of
ranitidine by isozymes of flavin-containing monooxygenase and
cytochrome P450 [In Process Citation]. Jpn J Pharmacol 2000;84:
213–20.
[47] Bhagwat SV, Bhamre S, Boyd MR, Ravindranath V. Cerebral meta-
bolism of imipramine and a purified flavin-containing monooxygen-
ase from human brain. Neuropsychopharmacology 1996;15:133–42.
[48] Bhamre S, Bhagwat SV, Shankar SK, Boyd MR, Ravindranath V.
Flavin-containing monooxygenase mediated metabolism of psychoac-
tive drugs by human brain microsomes. Brain Res 1995;672:276–80.
[49] Bhamre S, Ravindranath V. Presence of flavin-containing monoox-
ygenase in rat brain. Biochem Pharmacol 1991;42:442–4.
[50] Kawaji A, Ohara K, Takabatake E. Determination of flavin-containing
monooxygenase activity in rat brain microsomes with benzydamine N-
oxidation. Biol Pharm Bull 1994;17:603–6.
[51] Blake BL, Philpot RM, Levi PE, Hodgson E. Xenobiotic biotrans-
forming enzymes in the central nervous system: an isoform of flavin-
containing monooxygenase (FMO4) is expressed in rabbit brain.
Chem Biol Interact 1996;99:253–61.
[52] Chiba K, Kubota E, Miyakawa T, Kato Y, Ishizaki T. Characterization
of hepatic microsomal metabolism as an in vivo detoxication pathway
of 1-methyl-4-phenyl-1,2,3,6-tetrahydropyridine in mice. J Pharmacol
Exp Ther 1988;246:1108–15.
[53] Cashman JR, Ziegler DM. Contribution of N-oxygenation to the
metabolism of MPTP (1-methyl-4-phenyl-1,2,3,6-tetrahydropyridine)
by various liver preparations. Mol Pharmacol 1986;29:163–7.
A. Janmohamed et al. / Biochemical Pharmacology 68 (2004) 73–83 83
Related Documents