DN98619493 © Nokia Networks Oy 1 (206) Issue 1-1 en Nokia Proprietary and Confidential BSS Network Doctor Formulas

Welcome message from author
This document is posted to help you gain knowledge. Please leave a comment to let me know what you think about it! Share it to your friends and learn new things together.
Transcript

BSS Network Doctor Formulas
DN98619493 © Nokia Networks Oy 1 (206)Issue 1-1 en Nokia Proprietary and Confidential

BSS Network Doctor Formulas
The information in this document is subject to change without notice and describes only theproduct defined in the introduction of this documentation. This document is intended for theuse of Nokia Networks' customers only for the purposes of the agreement under which thedocument is submitted, and no part of it may be reproduced or transmitted in any form ormeans without the prior written permission of Nokia Networks. The document has beenprepared to be used by professional and properly trained personnel, and the customerassumes full responsibility when using it. Nokia Networks welcomes customer comments aspart of the process of continuous development and improvement of the documentation.
The information or statements given in this document concerning the suitability, capacity, orperformance of the mentioned hardware or software products cannot be considered bindingbut shall be defined in the agreement made between Nokia Networks and the customer.However, Nokia Networks has made all reasonable efforts to ensure that the instructionscontained in the document are adequate and free of material errors and omissions. NokiaNetworks will, if necessary, explain issues which may not be covered by the document.
Nokia Networks' liability for any errors in the document is limited to the documentary correctionof errors. Nokia Networks WILL NOT BE RESPONSIBLE IN ANY EVENT FOR ERRORS INTHIS DOCUMENT OR FOR ANY DAMAGES, INCIDENTAL OR CONSEQUENTIAL(INCLUDING MONETARY LOSSES), that might arise from the use of this document or theinformation in it.
This document and the product it describes are considered protected by copyright according tothe applicable laws.
NOKIA logo is a registered trademark of Nokia Corporation.
Other product names mentioned in this document may be trademarks of their respectivecompanies, and they are mentioned for identification purposes only.
Copyright © Nokia Networks Oy 2001. All rights reserved.
2 (206) © Nokia Networks Oy DN98619493Nokia Proprietary and Confidential Issue 1-1en

Contents
Contents 3
List of tables 5
List of figures 6
1 About this manual 271.1 What you need to know first 271.2 Where to find more 281.3 Typographic conventions 281.3.1 Text styles 281.4 Terms and concepts 291.4.1 Abbreviations 291.4.2 Terms 31
2 BSS counter formulas 332.1 Additional GPRS channels (ach) 332.2 Multislot (msl) 352.3 TBF (tbf) 382.4 RLC (rlc) 422.5 Frame relay (frl) 462.6 Random access (rach) 472.7 SDCCH drop failures (sd) 492.7.1 SDCCH drop counters 502.7.2 Problems with the SDCCH drop counters 522.8 SDCCH drop ratio (sdr) 532.9 Setup success ratio (cssr) 542.10 TCH drop failures 552.10.1 TCH drop call counters 552.10.2 Drop call ratio 582.10.3 Drop-out ratio 582.10.4 Problems with the drop call counters 592.11 Drop call failures (dcf) 592.12 TCH drop call % (dcr) 602.13 Handover (ho) 712.14 Handover failure % (hfr) 832.15 Handover success % (hsr) 1082.16 Handover failures (hof) 1132.17 Interference (itf) 1172.18 Congestion (cngt) 1182.19 Queuing (que) 1202.20 Blocking (blck) 1232.21 Traffic (trf) 1332.22 Traffic directions 1602.22.1 Mobile originated calls (moc) 1602.22.2 Mobile terminated calls (mtc) 1622.23 Paging (pgn) 1642.24 Short message service (sms) 166
DN98619493 © Nokia Networks Oy 3 (206)Issue 1-1 en Nokia Proprietary and Confidential

BSS Network Doctor Formulas
2.25 Directed retry (dr) 1682.26 Availability (ava) 1702.27 Unavailability (uav) 1742.28 Location updates (lu) 1772.29 LU success % (lsr) 1772.30 Emergency call (ec) 1782.31 Emergency call success % (ecs) 1782.32 Call re-establishment (re) 1792.33 Call re-establishment success % (res) 1792.34 Quality 1792.34.1 Downlink quality (dlq) 1792.34.2 Uplink quality (ulq) 1802.35 Downlink and uplink level 1822.35.1 Downlink level (dll) 1822.35.2 Uplink level (ull) 1822.36 Power (pwr) 1822.37 Level (lev) 1832.38 Distance (dis) 1842.39 Link balance, power, level (lb) 1842.40 Call success (csf) 1872.41 Configuration (cnf) 202
3 Missing Counters 2033.1 XX1 2033.2 XX2 2033.3 XX3 2033.4 XX4 204
Index 205
4 (206) © Nokia Networks Oy DN98619493Nokia Proprietary and Confidential Issue 1-1en

List of tables
Table 1. Text styles in this document 29
Table 2. Abbreviations 29
Table 3. Terms used in this document 31
Table 4. SDCCH Drop Counters 51
Table 5. TCH drop call counters 56
DN98619493 © Nokia Networks Oy 5 (206)Issue 1-1 en Nokia Proprietary and Confidential

BSS Network Doctor Formulas
List of figures
Figure 1. Additional GPRS channel use, S9PS (ach_1) 34
Figure 2. Average additional GPRS channel hold time, S9PS (ach_2) 34
Figure 3. Additional GPRS channels seized, S9PS (ach_3) 34
Figure 4. Total additional GPRS channel hold time, S9PS (ach_4) 34
Figure 5. Distribution of UL multislot requests, S9PS (msl_1) 35
Figure 6. Distribution of DL multislot requests, S9PS (msl_2) 35
Figure 7. Distribution of UL multislot allocations, S9PS (msl_3) 35
Figure 8. Distribution of DL multislot allocations, S9PS (msl_4) 36
Figure 9. UL multislot allocations, S9PS (msl_9) 36
Figure 10. DL multislot allocations, S9PS (msl_10) 36
Figure 11. Average number of allocated timeslots, UL S9PS (msl_11) 36
Figure 12. Average number of allocated timeslots, DL S9PS (msl_13) 37
Figure 13. Average number of requested UL timeslots, S9PS (msl_13) 37
Figure 14. Average number of requested DL timeslots, S9PS (msl_14) 37
Figure 15. UL multislot allocation %, S9PS (msl_15) 37
Figure 16. DL multislot allocation %, S9PS (msl_16) 38
Figure 17. UL multislot requests, S9PS (msl_17) 38
Figure 18. DL multislot requests, S9PS (msl_18) 38
Figure 19. Average number of LLC blocks per UL TBF, S9PS (tbf_3) 39
Figure 20. Average number of LLC blocks per DL TBF, S9PS (tbf_4) 39
Figure 21. Average UL TBF duration, S9PS (tbf_5) 39
Figure 22. Average UL TBF duration, S9PS (tbf_5a) 39
Figure 23. Average DL TBF duration, S9PS (tbf_6a) 40
Figure 24. Average UL TBF duration, unack mode, S9PS (tbf_7) 40
Figure 25. Average DL TBF duration, unack mode, S9PS (tbf_8) 40
Figure 26. UL mlslot allocation blocking, S9PS (tbf_15) 40
Figure 27. DL mlslot allocation blocking, S9PS 41
Figure 28. Normally released UL TBF ratio, S9PS (tbf_25) 41
Figure 29. Normally released DL TBF ratio, S9PS (tbf_26) 41
6 (206) © Nokia Networks Oy DN98619493Nokia Proprietary and Confidential Issue 1-1en

Figure 30. UL TBF reallocation failure ratio, S9PS (tbf_29) 42
Figure 31. DL TBF reallocation failure ratio, S9PS (tbf_30) 42
Figure 32. UL TBF reallocation attempts, S9PS (tbf_31) 42
Figure 33. DL TBF reallocation attempts, S9PS (tbf_32) 42
Figure 34. Ack.CS1 RLC blocks UL, S9PS (rlc_1) 43
Figure 35. Ack.CS1 RLC blocks DL, S9PS (rlc_2) 43
Figure 36. Ack. CS1 RLC DL Block error rate, S9PS (rlc_3a) 43
Figure 37. Unack. CS1 RLC UL block error rate, S9PS (rlc_4a) 43
Figure 38. Ack. CS1 RLC UL block error rate, S9PS (rlc_5a) 43
Figure 39. UL CS1 RLC data share, S9PS (rlc_6) 44
Figure 40. UL CS2 RLC data share, S9PS 44
Figure 41. DL CS1 RLC data share, S9PS (rlc_8) 44
Figure 42. DL CS2 RLC data share, S9PS (rlc_9) 44
Figure 43. UL CS1 RLC block error rate, S9PS (rlc_10) 45
Figure 44. UL CS2 RLC block error rate, S9PS (rlc_11) 45
Figure 45. DL CS1 RLC block error rate, S9PS (rlc_12) 45
Figure 46. DL CS2 RLC block error rate, S9PS (rlc_13) 45
Figure 47. UL RLC blocks, S9PS (rlc_14) 46
Figure 48. DL RLC blocks, S9PS (rlc_15) 46
Figure 49. Bytes in discarded sent frames, S9PS (frl_5) 46
Figure 50. Bytes in discarded received frames, S9PS (frl_6) 46
Figure 51. Average RACH slot, S1 (rach_1) 47
Figure 52. Peak RACH load, average, S1 (rach_2) 47
Figure 53. Peak RACH load %, S1 (rach_3) 47
Figure 54. Average RACH load %, S1 (rach_4) 48
Figure 55. Average RACH busy, S1 (rach_5) 48
Figure 56. RACH rejected due to illegal establishment, S5 (rach_6) 48
Figure 57. Total RACH rejection ratio, S7 (rach_7) 49
Figure 58. Ghosts detected on SDCCH and other failures, S1 (sd_1) 49
Figure 59. Ghosts detected on SDCCH and other failures, S1 (sd_1a) 50
Figure 60. Ghosts detected on SDCCH and other failures, S1 (sd_1b) 50
DN98619493 © Nokia Networks Oy 7 (206)Issue 1-1 en Nokia Proprietary and Confidential

BSS Network Doctor Formulas
Figure 61. SDCCH Drop %, S3 (sdr_1a) 53
Figure 62. SDCCH Drop %, abis fail excluded, S3 (sdr_2) 54
Figure 63. Illegal establishment cause %, (sdr_3b) 54
Figure 64. SDCCH, TCH Setup Success %, S4 (cssr_2) 55
Figure 65. TCH drop calls in HO, S2 (dcf_2) 59
Figure 66. TCH drop calls in BSC outgoing HO, S3 (dcf_3) 59
Figure 67. TCH drop calls in intra-cell HO, S3 (dcf_4) 60
Figure 68. TCH drop calls in intra BSC HO, S3 (dcf_6) 60
Figure 69. Drop calls in BSC incoming HO, S3 (dcf_7) 60
Figure 70. TCH drop call %, area, real, after re-establishment S3 (dcr_3f) 61
Figure 71. TCH drop call %, area, real, before re-establishment, S3 (dcr_3g) 62
Figure 72. TCH drop call %, area, real, after re-establishment, S7 (dcr_3h) 62
Figure 73. TCH drop call %, area, real, before re-establishment, S3 (dcr_3i) 63
Figure 74. TCH drop call %, area, real, after re-establishment, S7 (dcr_3j) 65
Figure 75. TCH drop-out %, BTS level, before call re-establishment, S3 (dcr_4c) 65
Figure 76. TCH drop-out %, BTS level, before call re-establishment, S3 (dcr_4d) 66
Figure 77. TCH drop-out %, BTS level, before call re-establishment, S7 (dcr_4e) 66
Figure 78. TCH drop-out %, BTS level, before call re-establishment, S7 (dcr_4f) 67
Figure 79. TCH drop call (dropped conversation) %, BSC level, S4 (dcr_5) 68
Figure 80. TCH dropped conversation %, area, re-establishment considered, S7(dcr_5b) 69
Figure 81. TCH drop call %, after TCH assignment, without re-establishment, arealevel, S7 (dcr_8) 69
Figure 82. TCH drop call %, after TCH assignment, with re-establishment, area level,S7 (dcr_8b) 69
Figure 83. Drops per erlang , before re-establishment, S4 (dcr_10) 70
Figure 84. Drops per erlang , after re-establishment, S4 (dcr_10a) 70
Figure 85. Drops per erlang , after re-establishment, S7 (dcr_10b) 71
Figure 86. Return from super TRXs to regular TRX, S4 (ho_1) 71
Figure 87. HO attempts from regular TRXs to super, S4 (ho_2) 71
Figure 88. HO attempts from super to regular, S4 (ho_3) 71
Figure 89. Share of HO attempts from super to regular due to DL Qual, S4(ho_4) 72
8 (206) © Nokia Networks Oy DN98619493Nokia Proprietary and Confidential Issue 1-1en

Figure 90. Share of HO attempts from super to regular due to DL interference, S4(ho_5) 72
Figure 91. Share of HO attempts from super to regular due to UL interference, S4(ho_6) 72
Figure 92. Share of HO attempts from super to regular due to bad C/I, S4 (ho_7) 73
Figure 93. MSC incoming HO attempts, (ho_8) 73
Figure 94. MSC outgoing HO attempts, (ho_9) 73
Figure 95. BSC incoming HO attempts, (ho_10) 73
Figure 96. BSC outgoing HO attempts, (ho_11) 73
Figure 97. Intra-cell HO attempts, S2 (ho_12a) 74
Figure 98. HO attempts, , outgoing and intra-cell S4, (ho_13) 74
Figure 99. HO attempts S3, (ho_13a) 74
Figure 100. HO attempts, outgoing and intra-cell, S5, (ho_13c) 74
Figure 101. HO attempts, outgoing and intra-cell, S6, (ho_13d) 75
Figure 102. HO attempts , outgoing and intra-cell S3, (ho_13e) 75
Figure 103. HO attempts , outgoing and intra-cell S9, (ho_13f) 75
Figure 104. TCH requests for HO (ho_14a) 76
Figure 105. TCH requests for HO (ho_14b) 76
Figure 106. TCH seizures for HO (ho_15) 76
Figure 107. TCH-TCH HO attempts (ho_16) 76
Figure 108. SDCCH-TCH HO attempts (ho_17) 77
Figure 109. SDCCH-SDCCH HO attempts (ho_18) 77
Figure 110. TCH-TCH HO successes (ho_19) 77
Figure 111. SDCCH-TCH HO successes (ho_20) 77
Figure 112. SDCCH-SDCCH HO successes (ho_21) 78
Figure 113. MSC controlled HO attempts (ho_22) 78
Figure 114. BSC controlled HO attempts (ho_23) 78
Figure 115. Intra-cell HO attempts (ho_24) 78
Figure 116. MSC controlled HO successes (ho_25) 79
Figure 117. BSC controlled HO successes (ho_26) 79
Figure 118. Intra-cell HO successes (ho_27) 79
Figure 119. MSC incoming HO successes (ho_28) 79
DN98619493 © Nokia Networks Oy 9 (206)Issue 1-1 en Nokia Proprietary and Confidential

BSS Network Doctor Formulas
Figure 120. MSC outgoing HO successes (ho_29) 79
Figure 121. BSC incoming HO successes (ho_30) 80
Figure 122. BSC outgoing HO successes (ho_31) 80
Figure 123. Incoming HO success (ho_32) 80
Figure 124. Outgoing HO successes (ho_33) 80
Figure 125. Outgoing HO attempts (ho_34) 80
Figure 126. Incoming HO attempts (ho_35) 81
Figure 127. Outgoing SDCCH-SDCCH HO attempts (ho_36) 81
Figure 128. Incoming SDCCH-SDCCH HO attempts (ho_37) 81
Figure 129. Outgoing SDCCH-TCH HO attempts (ho_38) 81
Figure 130. Incoming SDCCH-TCH HO attempts (ho_39) 81
Figure 131. Outgoing TCH-TCH HO attempts (ho_40) 82
Figure 132. Incoming TCH-TCH HO attempts (ho_41) 82
Figure 133. Outgoing SDCCH-SDCCH HO success (ho_42) 82
Figure 134. Incoming SDCCH-SDCCH HO success (ho_43) 82
Figure 135. Outgoing SDCCH-TCH HO success (ho_44) 82
Figure 136. Incoming SDCCH-TCH HO success (ho_45) 83
Figure 137. Outgoing TCH-TCH HO success (ho_46) 83
Figure 138. Incoming TCH-TCH HO success (ho_47) 83
Figure 139. Total HO failure %, S1 (hfr_1) 84
Figure 140. Total HO failure %, S1 (hfr_2) 85
Figure 141. Intra-cell HO failure share, S1 (hfr_3a) 85
Figure 142. Intra-cell HO failure share, S1 (hfr_3b) 86
Figure 143. Intra-cell HO failure share, S1 (hfr_3c) 86
Figure 144. Intra-cell HO failure share, S1 (hfr_3d) 86
Figure 145. Incoming MSC ctrl HO failure %, S1 (hfr_4) 87
Figure 146. Incoming MSC ctrl HO failure share, S1 (hfr_4a) 87
Figure 147. Incoming MSC ctrl HO failure share, S1 (hfr_4b) 88
Figure 148. Incoming MSC ctrl HO failure share, S1 (hfr_4c) 88
Figure 149. Incoming MSC ctrl HO failure share, S1 (hfr_4d) 88
Figure 150. Outgoing MSC ctrl HO failure share %, S1 (hfr_5a) 89
10 (206) © Nokia Networks Oy DN98619493Nokia Proprietary and Confidential Issue 1-1en

Figure 151. Outgoing MSC ctrl HO failure share %, S1 (hfr_5b) 89
Figure 152. Outgoing MSC ctrl HO failure share %, S1 (hfr_5c) 90
Figure 153. Outgoing MSC ctrl HO failure share %, S1 (hfr_5d) 90
Figure 154. Incoming BSC ctrl HO failure %, S1 (hfr_6) 90
Figure 155. Incoming BSC ctrl HO failure share %, S1 (hfr_6a) 91
Figure 156. Incoming BSC ctrl HO failure %, S1 (hfr_6b 91
Figure 157. Incoming BSC ctrl HO failure share %, S1 (hfr_6c) 92
Figure 158. Incoming BSC ctrl HO failure %, S1 (hfr_6d) 92
Figure 159. Outgoing BSC ctrl HO failure share, S1 (hfr_7) 92
Figure 160. Outgoing BSC ctrl HO failure share, S1 (hfr_7a) 93
Figure 161. Outgoing BSC ctrl HO failure share, S1 (hfr_7b) 93
Figure 162. Outgoing BSC ctrl HO failure share, S1 (hfr_7c) 94
Figure 163. Outgoing BSC ctrl HO failure share, S1 (hfr_7d) 94
Figure 164. Internal inter HO failure %, S4 (hfr_8) 94
Figure 165. Internal intra HO failure %, S4 (hfr_9) 94
Figure 166. External source HO failure %, S4 (hfr_10) 95
Figure 167. HO failure % from super to regular, S4 (hfr_12) 95
Figure 168. HO failure % from regular to super, S4 (hfr_13) 95
Figure 169. Share of HO failures from regular to super due to return, S4 (hfr_14) 95
Figure 170. Share of HO failures from regular to super due to MS lost, S4 (hfr_15) 96
Figure 171. Share of HO failures from regular to super due to another cause, S4(hfr_16) 96
Figure 172. Share of HO failures from super to regular due to return, S4 (hfr_17) 96
Figure 173. Share of HO failures from super to regular due to MS lost, S4 (hfr_18) 97
Figure 174. Share of HO failures from super to regular due to another cause, S4(hfr_19) 97
Figure 175. SDCCH-SDCCH HO failure %, S2 (hfr_20) 97
Figure 176. SDCCH-TCH HO failure %, S2 (hfr_21) 98
Figure 177. TCH-TCH HO failure %, S2 (hfr_22) 98
Figure 178. SDCCH-SDCCH incoming HO failure %, S2 (hfr_23) 98
Figure 179. SDCCH-SDCCH outgoing HO failure ratio, S2 (hfr_24) 99
Figure 180. SDCCH-TCH incoming HO failure %, S2 (hfr_25) 99
DN98619493 © Nokia Networks Oy 11 (206)Issue 1-1 en Nokia Proprietary and Confidential

BSS Network Doctor Formulas
Figure 181. SDCCH-TCH outgoing HO failure %, S2 (hfr_26) 99
Figure 182. TCH-TCH incoming HO failure %, S2 (hfr_27) 99
Figure 183. TCH-TCH outgoing HO failure %, S2 (hfr_28) 100
Figure 184. MSC ctrl HO failure %, blocking (hfr_29) 100
Figure 185. MSC ctrl HO failure %, not allowed (hfr_30) 100
Figure 186. MSC ctrl HO failure %, return to old (hfr_31) 100
Figure 187. MSC ctrl HO failure %, call clear (hfr_32) 101
Figure 188. MSC ctrl HO failure %, end HO (hfr_33) 101
Figure 189. MSC ctrl HO failure %, end HO BSS (hfr_34) 101
Figure 190. MSC ctrl HO failure %, wrong A interface (hfr_35) 101
Figure 191. MSC ctrl HO failure %, adjacent cell error (hfr_36) 102
Figure 192. BSC ctrl HO failure %, blocking (hfr_37) 102
Figure 193. BSC ctrl HO failure %, not allowed (hfr_38) 102
Figure 194. BSC ctrl HO failure %, return to old (hfr_39) 102
Figure 195. BSC ctrl HO failure %, call clear (hfr_40) 103
Figure 196. BSC ctrl HO failure %, end HO (hfr_41) 103
Figure 197. BSC ctrl HO failure %, end HO BSS (hfr_42) 103
Figure 198. BSC ctrl HO failure %, wrong A interface (hfr_43) 103
Figure 199. BSC ctrl HO drop call %, (hfr_44) 104
Figure 200. Intra-cell HO failure %, cell_fail_lack (hfr_45) 104
Figure 201. Intra-cell HO failure %, not allowed (hfr_46) 104
Figure 202. Intra-cell HO failure %, return to old (hfr_47) 104
Figure 203. Intra-cell HO failure %, call clear (hfr_48) 105
Figure 204. Intra-cell HO failure %, MS lost (hfr_49) 105
Figure 205. Intra-cell HO failure %, BSS problem (hfr_50) 105
Figure 206. Intra-cell HO failure %, drop call (hfr_51) 105
Figure 207. HO failure % to adjacent cell (hfr_52) 106
Figure 208. HO failure % from adjacent cell (hfr_53) 106
Figure 209. HO failure %, blocking excluded (hfr_54a) 106
Figure 210. HO failure % due to radio interface blocking (hfr_55) 107
Figure 211. Intra-cell HO failure %, wrong A interface (hfr_56) 107
12 (206) © Nokia Networks Oy DN98619493Nokia Proprietary and Confidential Issue 1-1en

Figure 212. Intra-cell HO failure % (hfr_57) 107
Figure 213. HO failures to target cell, S6 (hfr_58) 108
Figure 214. HO failures from target cell, S6 (hfr_59) 108
Figure 215. MSC controlled outgoing SDCCH-SDCCH HO success %, S1(hsr_1) 108
Figure 216. MSC controlled outgoing SDCCH-TCH HO success %, S1 (hsr_2) 109
Figure 217. MSC controlled outgoing TCH-TCH HO success %, S1 (hsr_3) 109
Figure 218. BSC controlled outgoing SDCCH-SDCCH HO success %, S1(hsr_4) 109
Figure 219. BSC controlled outgoing SDCCH-TCH HO success %, S1 (hsr_5) 109
Figure 220. BSC controlled outgoing TCH-TCH HO success %, S1 (hsr_6) 109
Figure 221. Intra-cell SDCCH-SDCCH HO success %, S1 (hsr_7) 110
Figure 222. Intra-cell SDCCH-TCH HO success %, S1 (hsr_8) 110
Figure 223. Intra-cell TCH-TCH HO success %, S1 (hsr_9) 110
Figure 224. MSC controlled incoming SDCCH-SDCCH HO success %, S1(hsr_10) 110
Figure 225. MSC controlled incoming SDCCH-TCH HO success %, S1 (hsr_11) 110
Figure 226. MSC controlled incoming TCH-TCH HO success %, S1 (hsr_12) 111
Figure 227. BSC controlled incoming SDCCH-SDCCH HO success %, S1(hsr_13) 111
Figure 228. BSC controlled incoming SDCCH-TCH HO success %, S1 (hsr_14) 111
Figure 229. BSC controlled incoming TCH-TCH HO success %, S1 (hsr_15) 111
Figure 230. BSC controlled incoming HO success %, S1 (hsr_16) 111
Figure 231. MSC controlled incoming HO success %, S1 (hsr_17) 112
Figure 232. Incoming HO success %, S1 (hsr_18) 112
Figure 233. Outgoing HO success %, S1 (hsr_19) 112
Figure 234. Intra-cell SDCCH-SDCCH HO success %, S1 (hsr_20) 112
Figure 235. Intra-cell SDCCH-TCH HO success %, S1 (hsr_21) 113
Figure 236. Intra-cell TCH-TCH HO success %, S1 (hsr_22) 113
Figure 237. Outgoing HO failures due to lack of resources (hof_1) 113
Figure 238. Incoming HO failures due to lack of resources (hof_2) 113
Figure 239. TCH HO failures when return to old channel was successful (hof_3) 114
Figure 240. SDCCH HO failures when return to old channel was successful
DN98619493 © Nokia Networks Oy 13 (206)Issue 1-1 en Nokia Proprietary and Confidential

BSS Network Doctor Formulas
(hof_4) 114
Figure 241. MSC incoming HO failures (hof_5) 114
Figure 242. MSC outgoing HO failures (hof_6) 114
Figure 243. MSC outgoing HO failures (hof_6a) 115
Figure 244. BSC incoming HO failures (hof_7) 115
Figure 245. BSC incoming HO failures (hof_7a) 115
Figure 246. BSC outgoing HO failures (hof_8) 115
Figure 247. BSC outgoing HO failures (hof_8a) 115
Figure 248. Intra-cell HO failures (hof_9a) 116
Figure 249. Failed outgoing HO, return to old (hof_10) 116
Figure 250. Outgoing HO failures (hof_12) 116
Figure 251. Intra-cell HO failure, return to old channel (hof_13) 116
Figure 252. Intra-cell HO failure, drop call (hof_14) 116
Figure 253. Incoming HO failures (hof_15) 117
Figure 254. UL interference, BTS level, S1 (itf_1) 117
Figure 255. Idle TSL percentage of time in band X, TRX level, IUO, S4 (itf_2) 118
Figure 256. UL interference from IUO, TRX level, S4 (itf_3) 118
Figure 257. UL interference from Power Control, TRX level, S6 (itf_4) 118
Figure 258. TCH congestion time, S1 (cngt_1) 119
Figure 259. SDCCH congestion time, S1 (cngt_2) 119
Figure 260. FTCH time congestion % (cngt_3a) 119
Figure 261. FTCH time congestion % (cngt_3a) 119
Figure 262. HTCH time congestion % (cngt_4a) 120
Figure 263. HTCH time congestion % (cngt_4a) 120
Figure 264. Queued, served TCH call requests % (que_1) 120
Figure 265. Queued, served TCH HO requests % (que_2) 121
Figure 266. Queued, served TCH HO requests %, (que_2a) 121
Figure 267. Successful queued TCH requests (que_3) 121
Figure 268. Successful non-queued TCH requests (que_4) 121
Figure 269. Successful queued TCH HO requests (que_5) 122
Figure 270. Successful non-queued TCH HO requests (que_6) 122
14 (206) © Nokia Networks Oy DN98619493Nokia Proprietary and Confidential Issue 1-1en

Figure 271. Non-queued, served TCH call requests % (que_7) 122
Figure 272. Non-queued, served TCH HO requests % (que_8) 122
Figure 273. Non-queued, served TCH HO requests %, (que_8a) 123
Figure 274. TCH raw blocking, S1 (blck_1) 123
Figure 275. SDCCH blocking %, S1 (blck_5) 123
Figure 276. SDCCH real blocking %, S1 (blck_5a) 124
Figure 277. TCH raw blocking % on super TRXs, S4 (blck_6) 124
Figure 278. TCH raw blocking % on regular TRXs, S4 (blck_7) 124
Figure 279. TCH call blocking, before DR, S2 (blck_8) 125
Figure 280. TCH call blocking %, DR compensated, S2 (blck_8b) 126
Figure 281. TCH call blocking %, DR and DAC compensated, EFR excluded, S5(blck_8d) 127
Figure 282. Blocked calls, S5 (blck_9b) 127
Figure 283. Blocked calls , S5 (blck_9c) 128
Figure 284. Blocked TCH HOs, S2 (blck_10a) 128
Figure 285. Blocked TCH HOs, S5 (blck_10b) 128
Figure 286. TCH HO blocking, S2 (blck_11a) 129
Figure 287. TCH HO blocking without Q, S2 (blck_11b) 129
Figure 288. TCH HO blocking, S5 (blck_11c) 129
Figure 289. Blocked incoming and internal HO, S2 (blck_12) 130
Figure 290. Blocked incoming and internal HO, S2 (blck_12a) 130
Figure 291. AG blocking, S1 (blck_13) 130
Figure 292. FCS blocking, S5 (blck_14) 130
Figure 293. Blocked SDCCH seizure attempts, S5 (blck_15) 131
Figure 294. HO blocking % (blck_16a) 131
Figure 295. Handover blocking %, (blck_16b) 131
Figure 296. Blocked FACCH call setup TCH requests, (blck_18) 132
Figure 297. Handover blocking to target cell, (blck_19) 132
Figure 298. Handover blocking from target cell, (blck_20) 132
Figure 299. NACK ratio of p-immediate assignment, S9PS (blck_21) 132
Figure 300. Territory upgrade rejection %, S9PS (blck_22) 133
DN98619493 © Nokia Networks Oy 15 (206)Issue 1-1 en Nokia Proprietary and Confidential
BSS Network Doctor Formulas
Figure 301. TCH traffic sum, S1 (trf_1) 133
Figure 302. TCH traffic sum, S1 (trf_1a) 134
Figure 303. Average call length, S1 (trf_2d) 134
Figure 304. TCH usage, S1 (trf_3) 135
Figure 305. FTCH usage, S5 (trf_3b) 135
Figure 306. Average SDCCH holding time, S1 (trf_4) 135
Figure 307. Average FTCH holding time, S1 (trf_5) 136
Figure 308. TCH seizures for new call (call bids), S1 (trf_6) 136
Figure 309. SDCCH usage %, S1 (trf_7b) 136
Figure 310. TCH traffic absorption on super, S4 (trf_8) 137
Figure 311. TCH traffic absorption on super, S4 (trf_8a) 137
Figure 312. Average cell TCH traffic from IUO, S4 (trf_9) 137
Figure 313. Cell TCH traffic from IUO, S4 (trf_9a) 138
Figure 314. Super TRX TCH traffic, S4 (trf_10) 138
Figure 315. Sum of super TRX TCH traffic, S4 (trf_10a) 138
Figure 316. Average SDCCH traffic, erlang, S2 (trf_11) 138
Figure 317. Average SDCCH traffic, erlang, S2 (trf_11a) 139
Figure 318. Average TCH traffic, erlang, S2 (trf_12) 139
Figure 319. Average TCH traffic, erlang, S2 (trf_12a) 139
Figure 320. Average TCH traffic, erlang, S2 (trf_12b) 139
Figure 321. Handover/call %, (trf_13b) 140
Figure 322. Intra-cell handover/call %, (trf_13c) 140
Figure 323. Handover/call %, (trf_13d) 141
Figure 324. IUO, average TCH seizure length on super TRXs, S4 (trf_14b) 141
Figure 325. IUO, average TCH seizure length on regular TRXs, S4 (trf_15b) 141
Figure 326. Average TRX traffic, IUO, S4 (trf_16) 142
Figure 327. Average TRX TCH seizure length, IUO, S4 (trf_17a) 142
Figure 328. Average TRX TCH seizure length, IUO, S4 (trf_17b) 142
Figure 329. TCH requests for a new call, S3 (trf_18) 142
Figure 330. TCH requests for a new call, S3 (trf_18a) 143
Figure 331. Peak busy TCH (trf_19) 143
16 (206) © Nokia Networks Oy DN98619493Nokia Proprietary and Confidential Issue 1-1en

Figure 332. Average unit load (trf_20) 143
Figure 333. Call time difference between TRXs, S4 (trf_21) 144
Figure 334. Call time difference between TRXs, S4 (trf_21a) 144
Figure 335. Number of mobiles located in a cell, BSC, (trf_23a) 145
Figure 336. Total TCH seizure time (call time in seconds) (trf_24b) 145
Figure 337. Total TCH seizure time (call time in hours), (trf_24c) 145
Figure 338. SDCCH true seizures (trf_25) 146
Figure 339. SDCCH true seizures, S7 (trf_25a) 146
Figure 340. SDCCH true seizures for call and SS (trf_26) 146
Figure 341. SDCCH true seizures for call, SMS, SS (trf_27) 146
Figure 342. Peak busy SDCCH seizures (trf_28) 147
Figure 343. IUO layer usage % (trf_29) 147
Figure 344. SDCCH seizures (trf_30) 147
Figure 345. Call time (minutes) from p_nbsc_res_avail (trf_32) 147
Figure 346. Call time from p_nbsc_rx_qual (trf_32a) 148
Figure 347. Call time from p_nbsc_rx_statistics (trf_32b) 148
Figure 348. SDCCH HO seizure % out of HO seizure attempts (trf_33) 148
Figure 349. SDCCH assignment % out of HO seizure attempts (trf_34) 148
Figure 350. TCH HO seizure % out of TCH HO seizure request (trf_35) 149
Figure 351. TCH norm seizure % out of TCH call request (trf_36) 149
Figure 352. TCH normal seizure % out of TCH call requests, (trf_36a) 149
Figure 353. TCH FCS seizure % out of TCH FCS attempts (trf_37) 149
Figure 354. TCH FCS seizure % out of congested SDCCH seizure attempts(trf_38) 150
Figure 355. TCH seizures for new calls (trf_39) 150
Figure 356. TCH seizures for new calls (trf_39a) 150
Figure 357. HTCH usage, S5 (trf_40) 151
Figure 358. MOC rate, S6 (trf_41) 151
Figure 359. MTC rate, S6 (trf_42) 151
Figure 360. TCH single band subscriber holding time, S6 (trf_43) 151
Figure 361. TCH dual band subscriber holding time, S6 (trf_44) 152
DN98619493 © Nokia Networks Oy 17 (206)Issue 1-1 en Nokia Proprietary and Confidential

BSS Network Doctor Formulas
Figure 362. TCH data call seizures (trf_46) 152
Figure 363. Share of single band traffic (trf_47) 152
Figure 364. Share of dual band traffic (trf_48) 152
Figure 365. Call retries due to A interface pool mismatch (trf_49) 153
Figure 366. HO retries due to A interface pool mismatch (trf_50) 153
Figure 367. TCH single band subscribers’ share of holding time, S6 (trf_51) 153
Figure 368. TCH dual band subscribers’ share of holding time, S6 (trf_52) 154
Figure 369. Calls started as FACCH call setup (trf_53) 154
Figure 370. SDCCH seizures (trf_54) 154
Figure 371. TCH normal seizures (trf_55) 154
Figure 372. Total FTCH seizure time (trf_56) 154
Figure 373. Total HTCH seizure time (trf_57) 155
Figure 374. Average TCH hold time for HSCSD, S7 (trf_58) 155
Figure 375. Total HSCSD TCH seizure time (call time, hours),(trf_61) 155
Figure 376. Average upgrade pending time for HSCSD, (trf_62) 155
Figure 377. Average upgrade pending time due to congestion, (trf_63) 156
Figure 378. Total reporting time of ph1 and ph2 mobiles, (trf_64) 156
Figure 379. Total TCH seizures, (trf_65) 156
Figure 380. Net UL data traffic per timeslot, S9PS (trf_69a) 156
Figure 381. Net DL data traffic per timeslot, S9PS (trf_70a) 157
Figure 382. Average UL throughput per allocated timeslot, S9PS (trf_72b) 157
Figure 383. Average DL throughput per allocated timeslot, S9PS (trf_73b) 158
Figure 384. Total RLC data, S9PS (trf_74a) 158
Figure 385. GPRS territory UL utilisation, S9PS (trf_76b) 158
Figure 386. GPRS territory DL utilisation, S9PS (trf_77a) 159
Figure 387. UL GPRS timeslot usage, S9PS (trf_78a) 159
Figure 388. DL GPRS timeslot usage, S9PS (trf_79a) 160
Figure 389. SDCCH seizures for MO calls, S2 (moc_1) 160
Figure 390. Successful MO speech calls, S3 (moc_2) 161
Figure 391. Successful MO data calls, S3 (moc_3) 161
Figure 392. MO call success ratio, S6 (moc_4) 161
18 (206) © Nokia Networks Oy DN98619493Nokia Proprietary and Confidential Issue 1-1en

Figure 393. MO speech call attempts, S3 (moc_5) 162
Figure 394. MO call bids, S2 (moc_6) 162
Figure 395. SDCCH seizures for MT calls, S2 (mtc_1) 162
Figure 396. Successful MT speech calls (mtc_2) 162
Figure 397. Successful MT data calls, S3 (mtc_3) 163
Figure 398. MT call success ratio, S6 (mtc_4) 163
Figure 399. MT speech call attempts (mtc_5) 163
Figure 400. MT call attempts, S2 (mtc_6) 163
Figure 401. Number of paging messages sent, S2 (pgn_1) 164
Figure 402. Paging buffer size average, S1 (pgn_2) 164
Figure 403. Average paging buffer space, S1 (pgn_3) 165
Figure 404. Paging success ratio, S1 (pgn_4) 165
Figure 405. Average paging buffer Aif occpancy, S7 (pgn_5) 165
Figure 406. Average paging buffer Gb occpancy, S7PS (pgn_6) 165
Figure 407. Average DRX buffer occpancy due to paging, S7 (pgn_7) 166
Figure 408. Average DRX buffer occpancy due to DRX AG, S7 (pgn_8) 166
Figure 409. Average DRX buffer occpancy due to nonDRX AG, S7 (pgn_9) 166
Figure 410. SMS establishment failure % (sms_1) 166
Figure 411. SMS TCH establishment failure % (sms_2) 167
Figure 412. SMS SDCCH establishment failure % (sms_3) 167
Figure 413. SMS establishment attempts (sms_4) 167
Figure 414. SMS SDCCH establishment attempts (sms_5) 167
Figure 415. SMS TCH establishment attempts (sms_6) 168
Figure 416. DR, outgoing attempts, S3 (dr_1) 168
Figure 417. DR attempts, S3 (dr_1a) 168
Figure 418. DR, incoming attempts, S3 (dr_2) 168
Figure 419. DR, outgoing success to another cell, S3 (dr_3) 168
Figure 420. DR, incoming success from another cell, S3 (dr_4) 169
Figure 421. DR, intra-cell success, S3 (dr_5) 169
Figure 422. % of new calls successfully handed over to another cell by DR, S3(dr_6) 169
DN98619493 © Nokia Networks Oy 19 (206)Issue 1-1 en Nokia Proprietary and Confidential

BSS Network Doctor Formulas
Figure 423. DR, outgoing to another cell, failed, S3 (dr_7) 169
Figure 424. DR, intra-cell failed, S3 (dr_8) 170
Figure 425. TCH availability %, S4 (ava_1a) 170
Figure 426. TCH availability %, S9 (ava_1c) 170
Figure 427. TCH availability %, S9 (ava_1d) 171
Figure 428. Average available TCH, S1 (ava_2) 171
Figure 429. Average available SDCCH, S1 (ava_3) 171
Figure 430. SDCCH availability %, S4 (ava_4) 172
Figure 431. Average available FTCH in area, S1 (ava_5) 172
Figure 432. DMR availability %, S6 (ava_6) 172
Figure 433. DN2 availability %, S6 (ava_7) 172
Figure 434. TRU availability %, S6 (ava_8) 173
Figure 435. Average available TCH in BTS, S9 (ava_15) 173
Figure 436. Average available PDTCH in BTS, S9PS (ava_16) 173
Figure 437. Average available dedicated GPRS channels, S9PS (ava_17) 173
Figure 438. Average defined TCH, S1 (ava_18) 174
Figure 439. Average unavailable TSL per BTS, S1 (uav_1) 174
Figure 440. Average unavailable TSL per BTS, S1 (uav_1a) 174
Figure 441. Average unavailable TSL per BTS, S1 (uav_1b) 174
Figure 442. Total outage time, (uav_2) 175
Figure 443. Number of outages, (uav_3) 175
Figure 444. Share of unavailability due to user (uav_4) 175
Figure 445. Share of unavailability due to internal reasons (uav_5) 176
Figure 446. Share of unavailability due to external reasons (uav_6) 176
Figure 447. TRX unavailability time due to user (uav_7) 176
Figure 448. TRX unavailability time due to internal reasons (uav_8) 176
Figure 449. TRX unavailability time due to external reasons (uav_9) 177
Figure 450. Number of LU attempts, S1 (lu_1) 177
Figure 451. Average of LU attempts per hour, S1 (lu_2) 177
Figure 452. Number of LU attempts, S1 (lu_3) 177
Figure 453. LU success %, S6 (lsr_2) 178
20 (206) © Nokia Networks Oy DN98619493Nokia Proprietary and Confidential Issue 1-1en

Figure 454. Emergency calls, S6 (ec_1) 178
Figure 455. Emergency call success %, S6 (ecs_1) 178
Figure 456. Call re-establishment attempts, S6 (re_1) 179
Figure 457. Call re-establishments, S6 (re_2) 179
Figure 458. Call re-establishment success %, S6 (res_1) 179
Figure 459. DL BER, S1 (dlq_1) 180
Figure 460. DL cumulative quality % in class X, S1 (dlq_2) 180
Figure 461. DL cumulative quality % in class X, S1 (dlq_2a) 180
Figure 462. UL BER, S1 (ulq_1) 181
Figure 463. UL cumulative quality % in class X, S1 (ulq_2) 181
Figure 464. UL cumulative quality % in class X, S1 (ulq_2a) 181
Figure 465. Share % per range, S4 (dll_1) 182
Figure 466. Share % per range, S4 (ull_1) 182
Figure 467. Average MS power, S2 (pwr_1) 182
Figure 468. Average MS power, S2 (pwr_1b) 183
Figure 469. Average BS power, S2 (pwr_2) 183
Figure 470. Average DL signal strength, S2 (lev_1) 183
Figure 471. Average DL signal strength, S2 (lev_1a) 183
Figure 472. Average UL signal strength, S2 (lev_2) 184
Figure 473. Average UL signal strength, S2 (lev_2a) 184
Figure 474. Average MS-BS distance (dis_1) 184
Figure 475. Link balance, S1 (lb_1) 185
Figure 476. Share in acceptance range, S4 (lb_2) 185
Figure 477. Share in normal, S4 (lb_3) 185
Figure 478. Share in MS limited, S4 (lb_4) 185
Figure 479. Share in BS limited, S4 (lb_5) 186
Figure 480. Share in maximum power, S4 (lb_6) 186
Figure 481. Average MS power attenuation, S2 (lb_7) 186
Figure 482. Average MS power, S2 (lb_7b) 186
Figure 483. Average UL signal strength, S2 (lb_9) 187
Figure 484. Average DL signal strength, S2 (lb_10) 187
DN98619493 © Nokia Networks Oy 21 (206)Issue 1-1 en Nokia Proprietary and Confidential

BSS Network Doctor Formulas
Figure 485. Average MS power attenuation, S2 (lb_11) 187
Figure 486. Average BS power attenuation, S2 (lb_12) 187
Figure 487. SDCCH access probability, before FCS (csf_1) 188
Figure 488. SDCCH access probability (csf_1a) 188
Figure 489. SDCCH success ratio (csf_2a) 189
Figure 490. SDCCH success ratio, (csf_2c) 189
Figure 491. SDCCH success ratio, BTS, S6 (csf_2g) 190
Figure 492. SDCCH success ratio, BTS, (csf_2i) 191
Figure 493. SDCCH success ratio, area, (csf_2j) 192
Figure 494. SDCCH success ratio, BTS, (csf_2k) 193
Figure 495. TCH access probability without DR (csf_3a) 193
Figure 496. TCH access probability without DR and Q (csf_3b) 194
Figure 497. TCH access probability without Q (csf_3c) 194
Figure 498. TCH access probability, real (csf_3d) 194
Figure 499. TCH access probability without DR, (csf_3i) 195
Figure 500. TCH access probability without DR and Q, (csf_3j) 195
Figure 501. TCH access probability, real, (csf_3k) 196
Figure 502. TCH access probability, real (csf_3l) 196
Figure 503. TCH access probability without DR and Q, (csf_3m) 197
Figure 504. TCH success ratio, area, before call re-establisment (csf_4o) 197
Figure 505. TCH success ratio, area, after call re-establishment, S6 (csf_4p) 198
Figure 506. TCH success ratio, BTS, before call re-establisment (csf_4q) 199
Figure 507. TCH success ratio, BTS, after call re-establishment (csf_4r) 199
Figure 508. TCH success ratio, BTS, after call re-establishment, (csf_4t) 200
Figure 509. TCH success ratio, area, before call re-establishment, S7(csf_4u) 200
Figure 510. TCH success ratio, area, after call re-establishment, S7 (csf_4v) 201
Figure 511. TCH success ratio, BTS, after call re-establishment, (csf_4x) 201
Figure 512. TCH success ratio, BTS, before call re-establishment, (csf_4y) 202
Figure 513. Reuse pattern (cnf_1) 202
22 (206) © Nokia Networks Oy DN98619493Nokia Proprietary and Confidential Issue 1-1en

Summary of changes
In this Functionality Note (FN T1712)
As a result of the changes made between BSS Network Doctor software versions12.0 and 12.1 the following changes have been made into this document:
New formulas
• TBF (tbf)
- UL TBF reallocation failure ratio, S9PS (tbf_29)- DL TBF reallocation failure ratio, S9PS (tbf_30)- UL TBF reallocation attempts, S9PS (tbf_31)- DL TBF reallocation attempts, S9PS (tbf_32)
• RLC (rlc)
- UL RLC blocks, S9PS (rlc_14)- DL RLC blocks, S9PS (rlc_15)
• Frame Relay (frl), all formulas new
- Bytes in discarded sent frames, S9PS (frl_5)- Bytes in discarded received frames, S9PS (frl_6)
• Random access (rach)
- Total RACH rejection ratio, S7 (rach_7)
• SDCCH drop ratio (sdr)
- SDCCH drop %, S3 (sdr_1a)- Illegal establishment cause %, (sdr_3b)
• TCH drop call (dcr)
- TCH drop call %, after TCH assignment, w RE, area level, S7(dcr_8b)
• Blocking (blck)
- NACK ratio of p-immediate assignment, S9PS (blck_21)- Territory upgrade rejection %, S9PS (blck_22)
• Traffic (trf)
- GPRS territory UL utilisation, S9PS (trf_76b)- UL GPRS timeslot usage, S9PS (trf_78a)- DL GPRS timeslot usage, S9PS (trf_79a)
• Call success (csf)
DN98619493 © Nokia Networks Oy 23 (206)Issue 1-1 en Nokia Proprietary and Confidential

BSS Network Doctor Formulas
- SDCCH success ratio, (csf_2c)
Removed formulas
• sdr_1 replaced with sdr_1a
• sdr_3 replaced with sdr_3b
• dcr_8a replaced with sdr_8b
• trf_76a replaced with trf_76b
• csf_2b replaced with csf_2c
In the previous Functionality Note (FN T1538)
As a result of the changes made between BSS Network Doctor software versions11.2 and 12.0 the following changes have been made into this document:
New formulas
• Additional GPRS channels (ach), all formulas new
• Multislot (msl), all formulas new
• TBF (tbf), all formulas new
• RLC (rlc), all formulas new
• Availability (ava)
- ava_1c, TCH availability %, S9- ava_1d, TCH availability %, S9- ava_15, Average available TCH in BTS, S9- ava_16, Average available PDTCH in BTS, S9PS- ava_17, Average available dedicated GPRS channels, S9PS- ava_18, Average defined TCH, S1
• Call success (csf)
- csf_2j, SDCCH success ratio, area, S9- csf_2k, SDCCH success ratio, BTS, S9
• Congestion (cngt)
- cngt_3a, FTCH time congestion %- cngt_4a, HTCH time congestion %
• Handover (ho)
- ho_13f, HO attempts, outgoing and intra-cell, S9
24 (206) © Nokia Networks Oy DN98619493Nokia Proprietary and Confidential Issue 1-1en

• Paging (pgn)
- pgn_5, Average paging buffer Aif occupancy, S7- pgn_6, Average paging buffer Gb occupancy, S7PS- pgn_7, Average DRX buffer occupancy due to paging, S7- pgn_8, Average DRX buffer occupancy due to DRX AG, S7- pgn_9, Average DRX buffer occupancy due to nonDRX AG, S7
• Traffic (trf)
- trf_61, Total HSCSD TCH seizure time (call time, hours)- trf_62, Average upgrade pending time for HSCSD- trf_63, Average upgrade pending time due to congestion- trf_64, Total reporting time of ph1 and ph2 mobile- trf_65, Total TCH seizures- trf_69a, Net UL data traffic per timeslot, S9PS- trf_70a, Net DL data traffic per timeslot, S9PS- trf_72b, Average UL throughput per allocated timeslot, S9PS- trf_73b, Average DL throughput per allocated timeslot, S9PS- trf_74a, Total RLC data, S9PS- trf_76a, GPRS territory UL utilisation, S9PS- trf_77a, GPRS territory DL utilisation, S9PS
Removed formulas
• blck_8c replaced with blck_8d
• csf_2a replaced with csf_2b
• csf_2h replaced with csf_2j
• csf_4s replaced with csf_4v
• dcr_5a
DN98619493 © Nokia Networks Oy 25 (206)Issue 1-1 en Nokia Proprietary and Confidential

BSS Network Doctor Formulas
26 (206) © Nokia Networks Oy DN98619493Nokia Proprietary and Confidential Issue 1-1en

About this manual
Note
1 About this manualThis document defines the formulas used to calculating the Key PerformanceIndicators based on the Nokia NMS/2000 database.
This document contains also formulas which are not used in any actual reports ofthe NMS/2000 post-processing tools. You can see the formulas used in post-processing from the actual reports of the tools.
This document serves as a reference to the available formulas and does notinclude information on whether the formula is in use or not.
The information contained in this document relates to BSS Network Doctorsoftware version 12.x, Nokia NMS release T12 and to release S9 of the NokiaBSC software. This document should not be used with any other versions of theNokia NMS/2000 or Nokia BSC software.
This document is intended for the network operators of the Nokia NMS/2000.
This chapter covers the following topics:
• What you need to know first
• Where to find more
• Typographic conventions
• Concepts and terminology
1.1 What you need to know first
This document assumes that you are familiar with the following areas:
DN98619493 © Nokia Networks Oy 27 (206)Issue 1-1 en Nokia Proprietary and Confidential

BSS Network Doctor Formulas
• The concepts of the Nokia NMS and GSM networks in general
• A text processing utility, such as vi or dtpad. These text processors areused for editing certain configuration files.
1.2 Where to find more
When you perform the user’s tasks described in this document, you may need torefer to other documentation for further information. Below is a list of manualsthat you will find useful, as well as a brief description of the manual’s contents.
BSS Network Doctor documentation
• BSS Network Doctor, Feature Overview, DN00308743, for a briefoverview on the application
• BSS Network Doctor, System Administrator’s Guide, DN98619369, forsystem administrator’s tasks related to running Network Doctor
• BSS Network Doctor, User’s Guide, DN98614186, for a detaileddescription on utilising the Network Doctor reports
Other Nokia documents
• Database Description for BSC Measurements, DN98619454, for adescription of the structure of performance management (PM) tables in theNMS/2000 database and the records, including counters, in each table.
• Call Related DX Causes in BSC, Functional Description, DN9814277, foran explanation of phases and for a list of causes in TCH and SDCCHobservations to find details for dropping calls.#1
• DX Cause Coding Mapping, DN9813878, for an explanation to therelationship between DX cause codes and PM counters and for the analysisof TCH and SDCCH observations.#2
1.3 Typographic conventions
The following tables present the typographic conventions which have been usedin this manual to describe different actions and restrictions.
1.3.1 Text styles
The following table presents the typefaces and fonts and their indications.
28 (206) © Nokia Networks Oy DN98619493Nokia Proprietary and Confidential Issue 1-1en

About this manual
1.4 Terms and concepts
The lists below presents the terms and abbreviations used in this document.
1.4.1 Abbreviations
Table 1. Text styles in this document
Style Explanation
Initial Upper-caseLettering
Application names
Italiced text Emphasis
State, status or mode
Courier File and directory names
Names of database tables
Parameters
User names
System output
User input
UPPER-CASELETTERING
Keys on the keyboard (ALT, TAB, CTRL etc.)
Bold text User interface components
Initial Upper-caseLettering in Italics
Referenced documents
Referenced sections and chapters within a document
<bracketed text> Variable user input
Table 2. Abbreviations
Abbreviation Explanation
AG Access Grant
BCCH Broadcast Control Channel
BCF Base Control Function
BER Bit Error Ratio
BSC Base Station Controller
DN98619493 © Nokia Networks Oy 29 (206)Issue 1-1 en Nokia Proprietary and Confidential

BSS Network Doctor Formulas
BSS Base Station Subsystem
BTS Base Transceiver Station
CI Cell Identity
DL Downlink
DR Directed Retry
FCS Frame Check Sequence
HO Handover
IUO Intelligent Underlay Overlay
KPI Key Performance Indicator
LU Location Update
MML Man-machine Language
MOC Mobile Originated Call
MR Maintenance Region
MS Mobile Station
MSC Mobile Services Switching Centre
OMC Operation and Maintenance Centre
PI Performance Indicator
PLMN Public Land Mobile Network
PM Performance Management
RACH Random Access Control Channel
SDCCH Stand Alone Dedicated Control Channel
SMS Short Message Service
SQL Standard Query Language
SS Supplementary Service
TCH Traffic Channel
TR Trunk Reservation
TRX Transceiver
TSL Timeslot
UL Uplink
Table 2. Abbreviations (Continued)
Abbreviation Explanation
30 (206) © Nokia Networks Oy DN98619493Nokia Proprietary and Confidential Issue 1-1en

About this manual
1.4.2 Terms
The lists below presents the abbreviations and terms used in this document.
Table 3. Terms used in this document
Term Explanation
AGCH A downlink control channel that is used to carry aresponse to a mobile channel allocation request.The AGCH assigns the mobile to operate on aspecific TDMA timeslot.
Bit Error Ratio The ratio of the number of the bit errors to the totalnumber of bits transmitted within a given time period.
Broadcast Control Channel (BCCH) A channel from a base station to a mobile station(MS) used for transmission of messages to allmobile stations located in the cell coverage area.
BTS group A predefined set of BTSs which can be created andhandled for definition by Network Doctor.
Cell Identity (CI) A number which identifies a cell to the networkswithin a location area (LA).
Clear Code Code that describes why the call set-up or the callitself has been disconnected.
Day The counting of data per day is based on theperiod_start_time field in the measurementtables. This field always tells the starting hour of themeasurement period. Under one day there are hoursfrom 00 to 23.
Directed Retry A procedure used in a call set-up phase forassigning a mobile station to a traffic channel of acell other than the serving cell when the traffic iscongested.
Frame Check Sequence Extra characters added to a frame for the purposesof error control. The FCS is used in HDCL, FrameRelay, and other data link layer protocols.
Key Performance Indicator The performance of the network is calculated fromthe NMS/2000 based on the Network Elementcounter information. Sometimes the plain counter assuch describes an important performance aspect(number of calls, for example) of the network butsometimes a formula of counters is needed (e.g.drop call ratio).
DN98619493 © Nokia Networks Oy 31 (206)Issue 1-1 en Nokia Proprietary and Confidential

BSS Network Doctor Formulas
For any other terms, refer to Glossary, DN9763965.
Maintenance Region Each object in the NMS/2000 database belongs toone and only one Maintenance Region (MR).
Mobile Terminated Call A call in which the called subscriber used a mobiletelephone.
NMS/2000 A product of Nokia Telecommunications for theoperation and maintenance of cellular networks.
SQL*Plus An interactive program for accessing the database.
Stand-alone Dedicated ControlChannel (SDCCH)
A control channel (CCH) used for roaming,authentication, encryption activation and call control.
Timeslot (TSL) A timeslot in the time division multiple access(TDMA) frame in the GSM radio interface.
Traffic Channel A logical radio channel assigned to a base stationand primarily intended for conversation.
Trunk Reservation A stochastic algorithm employed in a channelallocation from a cell.
Table 3. Terms used in this document (Continued)
Term Explanation
32 (206) © Nokia Networks Oy DN98619493Nokia Proprietary and Confidential Issue 1-1en

BSS counter formulas
Note
2 BSS counter formulasThis chapter lists all BSS Network Doctor formulas. The more commonly usedones are described in further detail concerning their use or known problems withthem, for example. In connection with the name of a formula there is also areference to the BSC release (S1 to S6) since when the counters of the formulahave been available.
The use of formulas backwards, S4 formulas with S3 for example, gives either noresults because the measurement is not available, or false results because somecounters, which are new in S4, will be filled with value -1 by the OMC for S3BSCs.
When running the reports with newer counters, be careful especially when youhave two BSC software releases running in the network simultaneously. Thesimplest way to avoid problems is to start to use new counters of a new BSCrelease only when the new software release is used in the entire network under theNMS/2000.
2.1 Additional GPRS channels (ach)
Additional GPRS channel use, S9PS (ach_1)
Use: Example: if value equals to 1 then in average 1 additionaltimeslot has been used for GPRS. If the situation continues itindicates need for extending the default or dedicated territory.
total hold time of all additional GPRS ch. seizures (sec)----------------------------------------------------------- =period duration
sum(AVE_ADD_GPRS_CH_HOLD_TIME_SUM)/100---------------------------------------sum(period_duration*60)
Counters from table(s):p_nbsc_res_avail
DN98619493 © Nokia Networks Oy 33 (206)Issue 1-1 en Nokia Proprietary and Confidential
BSS Network Doctor Formulas
Unit: timeslot
Figure 1. Additional GPRS channel use, S9PS (ach_1)
Average additional GPRS channel hold time, S9PS (ach_2)
Use: If the value is high, more default area is needed.total hold time of all additional GPRS ch. seizures (sec)--------------------------------------------------------------- =total nbr of all additional GPRS channel seizures
sum(AVE_ADD_GPRS_CH_HOLD_TIME_SUM)/100--------------------------------------------------------------------------sum(decode(AVE_ADD_GPRS_CH_HOLD_TIME_SUM ,0,0,AVE_ADD_GPRS_CH_HOLD_TIME_DEN)
Counters from table(s):p_nbsc_res_availUnit: sec
Figure 2. Average additional GPRS channel hold time, S9PS (ach_2)
Additional GPRS channels seized, S9PS (ach_3)
Use: How many times an additional channel has been released(territory downgrade).
sum(decode(AVE_ADD_GPRS_CH_HOLD_TIME_SUM,0,0,AVE_ADD_GPRS_CH_HOLD_TIME_DEN)
Counters from table(s):p_nbsc_res_avail
Figure 3. Additional GPRS channels seized, S9PS (ach_3)
Total additional GPRS channel hold time, S9PS (ach_4)
Use: If the value is high, more default area is needed.sum(AVE_ADD_GPRS_CH_HOLD_TIME_SUM)/100
Counters from table(s):p_nbsc_res_availUnit: sec
Figure 4. Total additional GPRS channel hold time, S9PS (ach_4)
34 (206) © Nokia Networks Oy DN98619493Nokia Proprietary and Confidential Issue 1-1en
BSS counter formulas
2.2 Multislot (msl)
Distribution of UL multislot requests, S9PS (msl_1)
Use: Indicates the share of a multislot request type to all multislotrequests.
req_X_TSL_UL100 * -------------------------------------------------------------------------- % sum(req_1_TSL_UL+req_2_TSL_UL+req_1_TSL_UL +req_4_TSL_UL+ req_5_8_TSL_UL)
req_X_TSL_UL = one of the components of the denominator.
Counters from table(s):p_nbsc_packet_control_unit
Figure 5. Distribution of UL multislot requests, S9PS (msl_1)
Distribution of DL multislot requests, S9PS (msl_2)
Use: Indicates the share of a multislot request type to all multislotrequests.
req_X_TSL_DL100 * -------------------------------------------------------------------------- % sum(req_1_TSL_DL+req_2_TSL_DL+req_1_TSL_DL +req_4_TSL_DL+ req_5_8_TSL_DL)
req_X_TSL_UL = one of the components of the denominator.
Counters from table(s):p_nbsc_packet_control_unit
Figure 6. Distribution of DL multislot requests, S9PS (msl_2)
Distribution of UL multislot allocations, S9PS (msl_3)
Use: Indicates the share of a multislot request type to all multislotrequests.
alloc_X_TSL_UL100 * -------------------------------------------------------- % sum(alloc_1_TSL_UL+alloc_2_TSL_UL+alloc_1_TSL_UL +alloc_4_TSL_UL+ alloc_5_8_TSL_UL)
req_X_TSL_UL = one of the components of the denominator.
Counters from table(s):p_nbsc_packet_control_unit
Figure 7. Distribution of UL multislot allocations, S9PS (msl_3)
DN98619493 © Nokia Networks Oy 35 (206)Issue 1-1 en Nokia Proprietary and Confidential
BSS Network Doctor Formulas
Distribution of DL multislot allocations, S9PS (msl_4)
Use: Indicates the share of a multislot request type to all multislotrequests.
alloc_X_TSL_DL100 * ------------------------------------------------------ % sum(alloc_1_TSL_DL+alloc_2_TSL_DL+alloc_1_TSL_DL +alloc_4_TSL_DL+ alloc_5_8_TSL_DL)
req_X_TSL_DL = one of the components of the denominator.
Counters from table(s):p_nbsc_packet_control_unit
Figure 8. Distribution of DL multislot allocations, S9PS (msl_4)
UL multislot allocations, S9PS (msl_9)
Use: Total number of multislot allocations in UL.sum(alloc_1_TSL_UL+alloc_2_TSL_UL+alloc_3_TSL_UL +alloc_4_TSL_UL+ alloc_5_8_TSL_UL)
Counters from table(s):p_nbsc_packet_control_unit
Figure 9. UL multislot allocations, S9PS (msl_9)
DL multislot allocations, S9PS (msl_10)
Use: Total number of multislot allocations in DL.sum(alloc_1_TSL_DL+alloc_2_TSL_DL+alloc_3_TSL_DL +alloc_4_TSL_DL+ alloc_5_8_TSL_DL)
Counters from table(s):p_nbsc_packet_control_unit
Figure 10. DL multislot allocations, S9PS (msl_10)
Average number of allocated timeslots, UL S9PS (msl_11)
sum(alloc_1_TSL_UL+2*alloc_2_TSL_UL+3*alloc_3_TSL_UL +4*alloc_4_TSL_UL)------------------------------------------------------------------------ sum(alloc_1_TSL_UL+alloc_2_TSL_UL+alloc_3_TSL_UL+alloc_4_TSL_UL)
Counters from table(s):p_nbsc_packet_control_unit
Figure 11. Average number of allocated timeslots, UL S9PS (msl_11)
36 (206) © Nokia Networks Oy DN98619493Nokia Proprietary and Confidential Issue 1-1en

BSS counter formulas
Average number of allocated timeslots, DL S9PS (msl_12)
sum(alloc_1_TSL_DL+2*alloc_2_TSL_DL+3*alloc_3_TSL_DL +4*alloc_4_TSL_DL)------------------------------------------------------------------------ sum(alloc_1_TSL_DL+alloc_2_TSL_DL+alloc_3_TSL_DL+alloc_4_TSL_DL)
Counters from table(s):p_nbsc_packet_control_unit
Figure 12. Average number of allocated timeslots, DL S9PS (msl_13)
Average number of requested UL timeslots, S9PS (msl_13)
sum(req_1_TSL_UL+2*req_2_TSL_UL+3*req_3_TSL_UL +4*req_4_TSL_UL)------------------------------------------------------------------------ sum(req_1_TSL_UL+req_2_TSL_UL+req_3_TSL_UL+req_4_TSL_UL)
Counters from table(s):p_nbsc_packet_control_unit
Figure 13. Average number of requested UL timeslots, S9PS (msl_13)
Average number of requested DL timeslots, S9PS (msl_14)
sum(req_1_TSL_DL+2*req_2_TSL_DL+3*req_3_TSL_DL +4*req_4_TSL_DL)------------------------------------------------------------------------ sum(req_1_TSL_DL+req_2_TSL_DL+req_3_TSL_DL+req_4_TSL_DL)
Counters from table(s):p_nbsc_packet_control_unit
Figure 14. Average number of requested DL timeslots, S9PS (msl_14)
UL multislot allocation %, S9PS (msl_15)
100* average allocated tsl / average requested tsl % =
sum(alloc_1_TSL_UL+2*alloc_2_TSL_UL+3*alloc_3_TSL_UL +4*alloc_4_TSL_UL) ------------------------------------------------------------------ sum(alloc_1_TSL_UL+alloc_2_TSL_UL+alloc_3_TSL_UL+alloc_4_TSL_UL)100* ------------------------------------------------------------------------- % sum(req_1_TSL_UL+2*req_2_TSL_UL+3*req_3_TSL_UL +4*req_4_TSL_UL) ---------------------------------------------------------------- sum(req_1_TSL_UL+req_2_TSL_UL+req_3_TSL_UL+req_4_TSL_UL)
Counters from table(s):p_nbsc_packet_control_unit
Figure 15. UL multislot allocation %, S9PS (msl_15)
DN98619493 © Nokia Networks Oy 37 (206)Issue 1-1 en Nokia Proprietary and Confidential

BSS Network Doctor Formulas
DL multislot allocation %, S9PS (msl_16)
100* average allocated tsl / average requested tsl % =
sum(alloc_1_TSL_DL+2*alloc_2_TSL_DL+3*alloc_3_TSL_DL +4*alloc_4_TSL_DL) ------------------------------------------------------------------ sum(alloc_1_TSL_DL+alloc_2_TSL_DL+alloc_3_TSL_DL+alloc_4_TSL_DL)100* ------------------------------------------------------------------------- % sum(req_1_TSL_DL+2*req_2_TSL_DL+3*req_3_TSL_DL +4*req_4_TSL_DL) ---------------------------------------------------------------- sum(req_1_TSL_DL+req_2_TSL_DL+req_3_TSL_DL+req_4_TSL_DL)
Counters from table(s):p_nbsc_packet_control_unit
Figure 16. DL multislot allocation %, S9PS (msl_16)
UL multislot requests, S9PS (msl_17)
Use: Total number of multislot requests in UL.sum(req_1_TSL_UL+req_2_TSL_UL+req_3_TSL_UL +req_4_TSL_UL+ req_5_8_TSL_UL)
Counters from table(s):p_nbsc_packet_control_unit
Figure 17. UL multislot requests, S9PS (msl_17)
DL multislot requests, S9PS (msl_18)
Use: Total number of multislot requests in DL.sum(req_1_TSL_DL+req_2_TSL_DL+req_3_TSL_DL +req_4_TSL_DL+ req_5_8_TSL_DL)
Counters from table(s):p_nbsc_packet_control_unit
Figure 18. DL multislot requests, S9PS (msl_18)
2.3 TBF (tbf)
Average number of LLC blocks per UL TBF, S9PS (tbf_3)
Use: Indicates the average number of LLC data blocks pernormally released TBF.
sum(Ave_UL_LLC_per_TBF_sum)----------------------------sum(Ave_UL_LLC_per_TBF_den)
38 (206) © Nokia Networks Oy DN98619493Nokia Proprietary and Confidential Issue 1-1en

BSS counter formulas
Counters from table(s):p_nbsc_packet_control_unit
Figure 19. Average number of LLC blocks per UL TBF, S9PS (tbf_3)
Average number of LLC blocks per DL TBF, S9PS (tbf_4)
Use: Indicates the average number of LLC data blocks pernormally released TBF.
sum(Ave_DL_LLC_per_TBF_sum)----------------------------sum(Ave_DL_LLC_per_TBF_den)
Counters from table(s):p_nbsc_packet_control_unit
Unit: seconds
Figure 20. Average number of LLC blocks per DL TBF, S9PS (tbf_4)
Average UL TBF duration, S9PS (tbf_5)
sum(ave_dur_ul_tbf_sum)------------------------sum(ave_dur_ul_tbf_den)
Counters from table(s):p_nbsc_packet_control_unit
Unit: seconds
Figure 21. Average UL TBF duration, S9PS (tbf_5)
Average UL TBF duration, S9PS (tbf_5a)
Use: Counted from the normally released TBFs.Known problems: Contains part of TBF establishment delays.
sum(ave_dur_ul_tbf_sum)/100----------------------------sum(ave_dur_ul_tbf_den)
Counters from table(s):p_nbsc_packet_control_unit
Unit: seconds
Figure 22. Average UL TBF duration, S9PS (tbf_5a)
Average DL TBF duration, S9PS (tbf_6a)
Use: Counted from the normally released TBFs.
DN98619493 © Nokia Networks Oy 39 (206)Issue 1-1 en Nokia Proprietary and Confidential

BSS Network Doctor Formulas
Known problems: Contains part of TBF establishment delays.sum(ave_dur_dl_tbf_sum)/100---------------------------sum(ave_dur_dl_tbf_den)
Counters from table(s):p_nbsc_packet_control_unit
Unit: seconds
Figure 23. Average DL TBF duration, S9PS (tbf_6a)
Average UL TBF duration, unack mode, S9PS (tbf_7)
um(ave_dur_ul_tbf_unack_mode_sum/100)-------------------------------------sum(ave_dur_ul_tbf_unack_mode_den)
Counters from table(s):p_nbsc_packet_control_unit
Unit: seconds
Figure 24. Average UL TBF duration, unack mode, S9PS (tbf_7)
Average DL TBF duration, unack mode, S9PS (tbf_8)
sum(ave_dur_dl_tbf_unack_mode_sum/100)--------------------------------------sum(ave_dur_dl_tbf_unack_mode_den)
Counters from table(s):p_nbsc_packet_control_unit
Unit: seconds
Figure 25. Average DL TBF duration, unack mode, S9PS (tbf_8)
UL mlslot allocation blocking, S9PS (tbf_15)
Known problems: Over 100 % values are met.
sum(NO_RADIO_RES_AVA_UL_TBF)100 * ------------------------------------------------------------------------- % sum(req_1_TSL_UL+req_2_TSL_UL+req_3_TSL_UL +req_4_TSL_UL+ req_5_8_TSL_UL)
Counters from table(s):p_nbsc_packet_control_unit
Figure 26. UL mlslot allocation blocking, S9PS (tbf_15)
40 (206) © Nokia Networks Oy DN98619493Nokia Proprietary and Confidential Issue 1-1en

BSS counter formulas
DL mlslot allocation blocking, S9PS (tbf_16)
Known problems: Values of over 100% are met.
sum(NO_RADIO_RES_AVA_DL_TBF)100 * ------------------------------------------------------------------------- % sum(req_1_TSL_DL+req_2_TSL_DL+req_3_TSL_DL +req_4_TSL_DL+ req_5_8_TSL_DL)
Counters from table(s):p_nbsc_packet_control_unit
Figure 27. DL mlslot allocation blocking, S9PS
Normally released UL TBF ratio, S9PS (tbf_25)
Experiences on use: Cases when TBF is not released normally:1) PCU receives a Channel Request, allocates resources andsends assignment but receives no blocks. These cases canoccur if MS sends more than one Channel Request before itreceives an Immediate Assignment.2) Ghost Accesses.
normally released UL TBFs100*---------------------------- % = established UL TBFs
sum(AVE_DUR_UL_TBF_DEN)100*--------------------------- % sum(NBR_OF_UL_TBF)
Counters from table(s):p_nbsc_packet_control_unit
Figure 28. Normally released UL TBF ratio, S9PS (tbf_25)
Normally released DL TBF ratio, S9PS (tbf_26)
Use: DL TBF establishment is not completed normally, forexample, if a response from a MS is not received. If the TBFis already running and the MS is not heard from, the counterDL_TBF_REL_DUE_NO_RESP_MS is triggered.
normally released DL TBFs100*---------------------------- % = established DL TBFs
sum(AVE_DUR_DL_TBF_DEN)100*--------------------------- sum(NBR_OF_DL_TBF)
Counters from table(s):p_nbsc_packet_control_unit
Figure 29. Normally released DL TBF ratio, S9PS (tbf_26)
DN98619493 © Nokia Networks Oy 41 (206)Issue 1-1 en Nokia Proprietary and Confidential

BSS Network Doctor Formulas
UL TBF reallocation failure ratio, S9PS (tbf_29)
sum(UL_TBF_REALLOC_FAILS)100 * ----------------------------------------------- % sum(UL_TBF_RE_ALLOCATIONS+ UL_TBF_REALLOC_FAILS)
Counters from table(s):p_nbsc_packet_control_unit
Figure 30. UL TBF reallocation failure ratio, S9PS (tbf_29)
DL TBF reallocation failure ratio, S9PS (tbf_30)
sum(DL_TBF_REALLOC_FAILS)100 * ----------------------------------------------- % sum(DL_TBF_RE_ALLOCATIONS+ DL_TBF_REALLOC_FAILS)
Counters from table(s):p_nbsc_packet_control_unit
Figure 31. DL TBF reallocation failure ratio, S9PS (tbf_30)
UL TBF reallocation attempts, S9PS (tbf_31)
sum(UL_TBF_RE_ALLOCATIONS+ UL_TBF_REALLOC_FAILS)
Counters from table(s):p_nbsc_packet_control_unit
Figure 32. UL TBF reallocation attempts, S9PS (tbf_31)
DL TBF reallocation attempts, S9PS (tbf_32)
sum(DL_TBF_RE_ALLOCATIONS+ DL_TBF_REALLOC_FAILS)
Counters from table(s):p_nbsc_packet_control_unit
Figure 33. DL TBF reallocation attempts, S9PS (tbf_32)
2.4 RLC (rlc)
Ack.CS1 RLC blocks UL, S9PS (rlc_1)
Use: Number of UL blocks in RLC ack mode using CS1.Retransmission is not included.
42 (206) © Nokia Networks Oy DN98619493Nokia Proprietary and Confidential Issue 1-1en

BSS counter formulas
sum(RLC_DATA_BLOCKS_UL_CS1 - RLC_DATA_BLOCKS_UL_UNACK)
Figure 34. Ack.CS1 RLC blocks UL, S9PS (rlc_1)
Ack.CS1 RLC blocks DL, S9PS (rlc_2)
Use: Number of DL blocks in RLC ack mode using CS1.Retransmission is not included.
sum(RLC_DATA_BLOCKS_DL_CS1 - RLC_DATA_BLOCKS_DL_UNACK)
Figure 35. Ack.CS1 RLC blocks DL, S9PS (rlc_2)
Ack. CS1 RLC DL block error rate, S9PS (rlc_3a)
Use: Number of DL blocks in RLC ack mode using CS1.
sum(BAD_FRAME_IND_UL_CS1 - BAD_FRAME_IND_UL_UNACK )100 * ------------------------------------------------ % sum(RLC_DATA_BLOCKS_DL_CS1 - RLC_DATA_BLOCKS_DL_UNACK + BAD_FRAME_IND_UL_CS1 - BAD_FRAME_IND_UL_UNACK )
Figure 36. Ack. CS1 RLC DL Block error rate, S9PS (rlc_3a)
Unack. CS1 RLC UL block error rate, S9PS (rlc_4a)
sum(BAD_FRAME_IND_UL_UNACK)100 * ---------------------------------------------------- % sum(RLC_DATA_BLOCKS_UL_UNACK+ BAD_FRAME_IND_UL_UNACK)
Figure 37. Unack. CS1 RLC UL block error rate, S9PS (rlc_4a)
Ack. CS1 RLC UL block error rate, S9PS (rlc_5a)
sum(BAD_FRAME_IND_UL_CS2)100 * ------------------------------------------------- % sum(RLC_DATA_BLOCKS_UL_CS2+ BAD_FRAME_IND_UL_CS2)
Figure 38. Ack. CS1 RLC UL block error rate, S9PS (rlc_5a)
UL CS1 RLC data share, S9PS (rlc_6)
sum(RLC_data_blocks_UL_CS1*22100 * ---------------------------------------------------------- % (sum(RLC_data_blocks_UL_CS1*22+RLC_data_blocks_UL_CS2*32
DN98619493 © Nokia Networks Oy 43 (206)Issue 1-1 en Nokia Proprietary and Confidential

BSS Network Doctor Formulas
+ RLC_data_blocks_DL_CS1*22+RLC_data_blocks_DL_CS2*32)
Counters from table(s):p_nbsc_packet_control_unit
Unit: %
Figure 39. UL CS1 RLC data share, S9PS (rlc_6)
UL CS2 RLC data share, S9PS (rlc_7)
sum(RLC_data_blocks_UL_CS2*22100 * ---------------------------------------------------------- % (sum(RLC_data_blocks_UL_CS1*22+RLC_data_blocks_UL_CS2*32 + RLC_data_blocks_DL_CS1*22+RLC_data_blocks_DL_CS2*32)
Counters from table(s):p_nbsc_packet_control_unit
Unit: %
Figure 40. UL CS2 RLC data share, S9PS
DL CS1 RLC data share, S9PS (rlc_8)
sum(RLC_data_blocks_DL_CS1*22100 * ---------------------------------------------------------- % (sum(RLC_data_blocks_UL_CS1*22+RLC_data_blocks_UL_CS2*32 + RLC_data_blocks_DL_CS1*22+RLC_data_blocks_DL_CS2*32)
Counters from table(s):p_nbsc_packet_control_unit
Unit: %
Figure 41. DL CS1 RLC data share, S9PS (rlc_8)
DL CS2 RLC data share, S9PS (rlc_9)
sum(RLC_data_blocks_DL_CS2*22100 * ---------------------------------------------------------- % (sum(RLC_data_blocks_UL_CS1*22+RLC_data_blocks_UL_CS2*32 + RLC_data_blocks_DL_CS1*22+RLC_data_blocks_DL_CS2*32)
Counters from table(s):p_nbsc_packet_control_unit
Unit: %
Figure 42. DL CS2 RLC data share, S9PS (rlc_9)
44 (206) © Nokia Networks Oy DN98619493Nokia Proprietary and Confidential Issue 1-1en
BSS counter formulas
UL CS1 RLC block error rate, S9PS (rlc_10)
Known problems: 100% values met. 100% means that the MS has not respondedto USF. The number of ignored RLC data blocks in uplink dueto BSN in acknowledged mode should be subtracted, but thereis no counter specifically for CS1.
sum(BAD_FRAME_IND_UL_CS1)100 * ------------------------------------------------- % sum(RLC_DATA_BLOCKS_UL_CS1+ BAD_FRAME_IND_UL_CS1)
Figure 43. UL CS1 RLC block error rate, S9PS (rlc_10)
UL CS2 RLC block error rate, S9PS (rlc_11)
Known problems: 100% means that there can be only failing accesses. Thenumber of ignored RLC data blocks in downlink due to BSNin acknowledged mode should be subtracted, but there is nocounter specifically for CS1.
sum(BAD_FRAME_IND_UL_CS2)100 * ------------------------------------------------- % sum(RLC_DATA_BLOCKS_UL_CS2+ BAD_FRAME_IND_UL_CS2)
Figure 44. UL CS2 RLC block error rate, S9PS (rlc_11)
DL CS1 RLC block error rate, S9PS (rlc_12)
sum(RETRA_RLC_DATA_BLOCKS_DL_CS1)100 * ------------------------------------------------- % sum(RLC_DATA_BLOCKS_DL_CS1+ RETRA_RLC_DATA_BLOCKS_DL_CS1)
Figure 45. DL CS1 RLC block error rate, S9PS (rlc_12)
DL CS2 RLC block error rate, S9PS (rlc_13)
sum(RETRA_RLC_DATA_BLOCKS_DL_CS2)100 * -------------------------------------------------------- % sum(RLC_DATA_BLOCKS_DL_CS2+ RETRA_RLC_DATA_BLOCKS_DL_CS2)
Figure 46. DL CS2 RLC block error rate, S9PS (rlc_13)
UL RLC blocks, S9PS (rlc_14)
Use: Total UL data volume as the number of RLC blocks.sum(rlc_data_blocks_ul_cs1 + rlc_data_blocks_ul_cs2 + rlc_mac_cntrl_blocks_ul + bad_frame_ind_ul_cs1
DN98619493 © Nokia Networks Oy 45 (206)Issue 1-1 en Nokia Proprietary and Confidential

BSS Network Doctor Formulas
+ bad_frame_ind_ul_cs2 + bad_frame_ind_ul_unack + ignor_rlc_data_bl_ul_due_bsn)
Counters from table(s):p_nbsc_packet_control_unit
Figure 47. UL RLC blocks, S9PS (rlc_14)
DL RLC blocks, S9PS (rlc_15)
Use: Total DL data volume as the number of RLC blocks.sum(rlc_data_blocks_dl_cs1 + rlc_data_blocks_dl_cs2 + rlc_mac_cntrl_blocks_dl + retra_rlc_data_blocks_dl_cs1 + retra_rlc_data_blocks_dl_cs2)
Counters from table(s):p_nbsc_packet_control_unit
Figure 48. DL RLC blocks, S9PS (rlc_15)
2.5 Frame relay (frl)
Bytes in discarded sent frames, S9PS (frl_5)
sum(dlci_1_bytes_sent+dlci_2_bytes_sent+dlci_3_bytes_sent+dlci_4_bytes_sent+dlci_5_bytes_sent)
Counters from table(s):p_nbsc_frame_relay
Figure 49. Bytes in discarded sent frames, S9PS (frl_5)
Bytes in discarded received frames, S9PS (frl_6)
sum(DLCI_1_BYTES_REC+DLCI_2_BYTES_REC+DLCI_3_BYTES_REC+DLCI_4_BYTES_REC +DLCI_5_BYTES_REC)
Counters from table(s):p_nbsc_frame_relay
Figure 50. Bytes in discarded received frames, S9PS (frl_6)
46 (206) © Nokia Networks Oy DN98619493Nokia Proprietary and Confidential Issue 1-1en
BSS counter formulas
2.6 Random access (rach)
Average RACH slot, S1 (rach_1)
Use: Indicates the capacity of BTS for RACH burst handling.Normally shows a constant value because it is dependent onthe BTS configuration which does not often change.
avg(ave_rach_slot/res_acc_denom1)
Counters from table(s):p_nbsc_res_access
Figure 51. Average RACH slot, S1 (rach_1)
Peak RACH load, average, S1 (rach_2)
Use: Indicates the absolute peak value during a measurementperiod. Correlates strongly with UL interference.
Experiences on use: High values may suggest that MSs have problems inaccessing the BTS. High values do not mean high load onSDCCH because SDCCH is needed only if the RACH passesthe detection in BTS.
Known problems: The peak value does not indicate yet how many times therehave been other peaks during the measurement period.
Open questions: How serious the high values really are from the MS point ofview?
avg(peak_rach_load)
Counters from table(s):p_nbsc_res_access
Figure 52. Peak RACH load, average, S1 (rach_2)
Peak RACH load %, S1 (rach_3)
Use: This PI indicates how near to full capacity the peak use ofRACH has been during the measurement period.
max(peak_rach_load)100 * ------------------------------------- % max(ave_rach_busy/res_acc_denom1)
Counters from table(s):p_nbsc_res_access
Figure 53. Peak RACH load %, S1 (rach_3)
DN98619493 © Nokia Networks Oy 47 (206)Issue 1-1 en Nokia Proprietary and Confidential

BSS Network Doctor Formulas
Average RACH load % , S1 (rach_4)
Use: This PI indicates how high the RACH load is on average.Experiences on use: If the value is to the order of tens of per cent, there probably
are access problems and MS users get, more often than usual,3 beeps when trying to start calls. The probable reason is ULinterference.
avg(ave_rach_busy/res_acc_denom3)100 * -------------------------------------- % avg(ave_rach_slot/res_acc_denom1)
Counters from table(s):p_nbsc_res_access
Figure 54. Average RACH load %, S1 (rach_4)
Average RACH busy, S1 (rach_5)
Use: This PI indicates roughly the average of the used RACH slots.If the average approaches the \xb2 average RACH slot\xb2(rach_1) there probably are access problems and MS usersget, more often than usual, 3 beeps when trying to start calls.
avg(ave_rach_busy/res_acc_denom3)
Counters from table(s):p_nbsc_res_access
Figure 55. Average RACH busy, S1 (rach_5)
RACH rejected due to illegal establishment, S5 (rach_6)
Use: Most of the rejections are ghost accesses. Note that part of theghosts have legal establishment cause and get further toSDCCH.
sum(ghost_ccch_res- rej_seiz_att_due_dist)
Counters from table(s):p_nbsc_res_access
Figure 56. RACH rejected due to illegal establishment, S5 (rach_6)
Total RACH rejection ratio, S7 (rach_7)
Use: Ratio of all RACH rejections to total nbr of channel requiredmessages received.Note that the counter ghost_ccch_res contains both ghosts andrejections due to distance checking. The latter one is anoptional feature of BSC.
48 (206) © Nokia Networks Oy DN98619493Nokia Proprietary and Confidential Issue 1-1en

BSS counter formulas
sum(ghost_ccch_res + bcsu_overload_lower_limit + bcsu_overload_upper_limit + bcsu_overload_deleted_rach)100 * ------------------------------------------------------------------------- % sum(ch_req_msg_rec)
Counters from table(s):p_nbsc_res_access
Figure 57. Total RACH rejection ratio, S7 (rach_7)
2.7 SDCCH drop failures (sd)
Ghosts detected on SDCCH and other failures, S1 (sd_1)
Use: This part of ghost RACH accesses comprises:- Ghosts which have an occasionally valid establishmentcause. These should comprise statistically 5/8 of all ghosts.Another 3/8 of ghosts are detected already before SDCCHbased on some invalid establishment cause. In GSM2 the ratio5/8 and 3/8 is not valid any more.- Multiple seizures of SDCCH.
Known problems: This counter includes also IMSI detaches which do not havea counter of their own.
sum(a.sdcch_assign)- sum(b.succ_seiz_term + b.succ_seiz_orig + b.sdcch_loc_upd+ b.succ_emerg_call + b.sdcch_call_re_est)
Counters from table(s):a = p_nbsc_trafficb = p_nbsc_res_access
Figure 58. Ghosts detected on SDCCH and other failures, S1 (sd_1)
Ghosts detected on SDCCH and other failures, S1 (sd_1a)
Use: - Ghosts which have an occasionally valid establishmentcause. These should comprise statistically 5/8 of all ghosts.Another 3/8 of ghosts are detected already before SDCCHbased on some invalid establishment cause. In GSM2 the ratio5/8 and 3/8 is no longer valid.- Multiple seizures of SDCCH.
Known problems: This counter includes also supplementary service requestwhich do not have a counter of their own.
sum(a.sdcch_assign)- sum(b.succ_seiz_term + b.succ_seiz_orig
+ b.sdcch_loc_upd + b.succ_emerg_call + b.sdcch_call_re_est + imsi_detach_sdcch)
Counters from table(s):
DN98619493 © Nokia Networks Oy 49 (206)Issue 1-1 en Nokia Proprietary and Confidential

BSS Network Doctor Formulas
a = p_nbsc_trafficb = p_nbsc_res_access
Figure 59. Ghosts detected on SDCCH and other failures, S1 (sd_1a)
Ghosts detected on SDCCH and other failures, S1 (sd_1b)
Use: This part of ghost RACH accesses comprises:- Ghosts which have an occasionally valid establishmentcause. These should comprise statistically 5/8 of all ghosts.Another 3/8 of ghosts are detected already before SDCCHbased on some invalid establishment cause. In GSM2 the ratio5/8 and 3/8 is not valid any more.- Multiple seizures of SDCCH.
sum(a.sdcch_assign)- sum(b.succ_seiz_term + b.succ_seiz_orig
+ b.sdcch_loc_upd + b.succ_emerg_call + b.sdcch_call_re_est + imsi_detach_sdcch +b.succ_seiz_supplem_serv)
Counters from table(s):a = p_nbsc_trafficb = p_nbsc_res_access
Figure 60. Ghosts detected on SDCCH and other failures, S1 (sd_1b)
2.7.1 SDCCH drop counters
SDCCH drop calls are counted as the sum of the following counters:
50 (206) © Nokia Networks Oy DN98619493Nokia Proprietary and Confidential Issue 1-1en
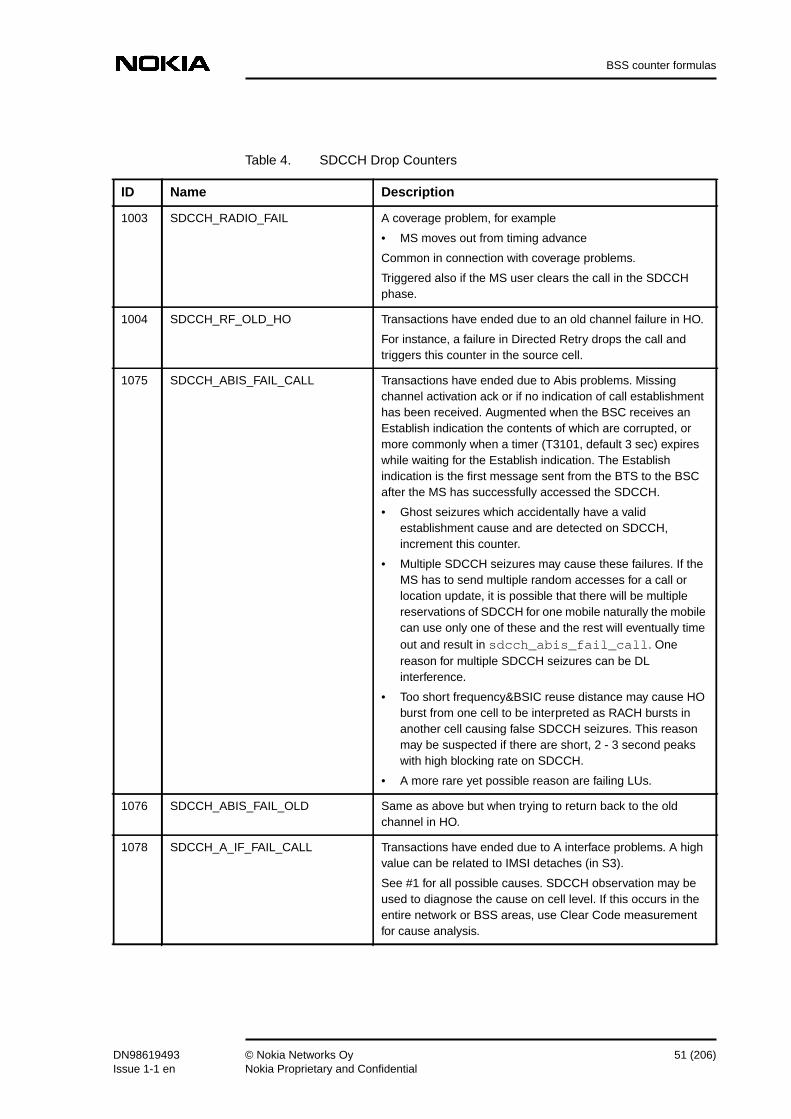
BSS counter formulas
Table 4. SDCCH Drop Counters
ID Name Description
1003 SDCCH_RADIO_FAIL A coverage problem, for example
• MS moves out from timing advance
Common in connection with coverage problems.
Triggered also if the MS user clears the call in the SDCCHphase.
1004 SDCCH_RF_OLD_HO Transactions have ended due to an old channel failure in HO.
For instance, a failure in Directed Retry drops the call andtriggers this counter in the source cell.
1075 SDCCH_ABIS_FAIL_CALL Transactions have ended due to Abis problems. Missingchannel activation ack or if no indication of call establishmenthas been received. Augmented when the BSC receives anEstablish indication the contents of which are corrupted, ormore commonly when a timer (T3101, default 3 sec) expireswhile waiting for the Establish indication. The Establishindication is the first message sent from the BTS to the BSCafter the MS has successfully accessed the SDCCH.
• Ghost seizures which accidentally have a validestablishment cause and are detected on SDCCH,increment this counter.
• Multiple SDCCH seizures may cause these failures. If theMS has to send multiple random accesses for a call orlocation update, it is possible that there will be multiplereservations of SDCCH for one mobile naturally the mobilecan use only one of these and the rest will eventually timeout and result in sdcch_abis_fail_call. Onereason for multiple SDCCH seizures can be DLinterference.
• Too short frequency&BSIC reuse distance may cause HOburst from one cell to be interpreted as RACH bursts inanother cell causing false SDCCH seizures. This reasonmay be suspected if there are short, 2 - 3 second peakswith high blocking rate on SDCCH.
• A more rare yet possible reason are failing LUs.
1076 SDCCH_ABIS_FAIL_OLD Same as above but when trying to return back to the oldchannel in HO.
1078 SDCCH_A_IF_FAIL_CALL Transactions have ended due to A interface problems. A highvalue can be related to IMSI detaches (in S3).
See #1 for all possible causes. SDCCH observation may beused to diagnose the cause on cell level. If this occurs in theentire network or BSS areas, use Clear Code measurementfor cause analysis.
DN98619493 © Nokia Networks Oy 51 (206)Issue 1-1 en Nokia Proprietary and Confidential

BSS Network Doctor Formulas
To see what DX causes can trigger the counters above, see #2.
2.7.2 Problems with the SDCCH drop counters
Phantoms affect SDCCH_abis_fail_*
SDCCH drop ratio counts the ratio of all SDCCH failures to SDCCH seizures.Normally most of the seizures are caused because of phantoms which are countedas SDCCH_abis_fail_call and SDCCH_abis_fail_old. In practice, thelatter case does not practically occur because SDCCH handovers are usually notused and particularly because phantoms do not perform handover.
The percentage of SDCCH_abis_fail_call used to be very high in a low trafficnetwork (even tens of per cent) whereas in a high traffic network the percentagesettled down to around 18-20 per cent. In BTS B9, BTS RACH detection wasimproved, and figures well under 10 per cent are now typical.
1079 SDCCH_A_IF_FAIL_OLD Same as above but when trying to return back to the oldchannel in HO.
1035 SDCCH_LAPD_FAIL Transactions have ended due to Lapd problems (a call is lostwhen Lapd goes down).
1036 SDCCH_BTS_FAIL Transactions have ended due to BTS problems. A call is lostwhen TRX/TSL is blocked with cause bts_fail due to FUor CU or BCF fault or BTS or BCF reset.
Even if occurs, the share is normally very low because thesituation is transient.
1038 SDCCH_BCSU_RESET Transactions have ended due to BSCU reset (calls are lostwhen BSCU is reset).
Even if occurs, the share is normally very low because thesituation is transient.
1037 SDCCH_USER_ACT Transactions have ended due to user actions. Timeslot or TRXis locked by the user via the Top-level User Interface or BSCMML.
Even if occurs, the share is normally very low because thesituation is transient.
1039 SDCCH_NETW_ACT Transactions have ended due to a change in the radio networkconfiguration (BCCH swap to another TRX) initiated by theBSC. The cause for the configuration change fails or locallyblocked BCCH TRX.
Even if occurs, the share is normally very low because thesituation is transient.
Table 4. SDCCH Drop Counters (Continued)
ID Name Description
52 (206) © Nokia Networks Oy DN98619493Nokia Proprietary and Confidential Issue 1-1en

BSS counter formulas
A interface blocking not shown
SDCCH failures do not include A interface blocking. In A interface blocking, anMSC clears the call without a request from a BSC. The failure is not in the BSCwhere the principle has been that MSC failures are not counted. Yet from an MSuser’s point of view, A interface blocking ends up to a failed call attempt. Youcan detect A interface blocking from the NSS statistics for circuit groups.
2.8 SDCCH drop ratio (sdr)
SDCCH drop %, S3 (sdr_1a)
Use: To follow up the performance of SDCCH from a technicalpoint of view.
Experiences on use: 1) High SDCCH drop rates usually result from ghostaccesses. A BTS decodes them from environmental orbackground noise and filters out most of them. However, allof them cannot be filtered out and the RACH request is passedon to the BSC for processing and for the allocation of aSDCCH channel.The counter ghost_ccch_res (3030) is updated each time achannel required is rejected because of an invalidestablishment cause. In GSM ph.1 there exist altogether eightestablishment causes, three of which are undefined as invalid,for example,resulting in that this counter shows only 3/8 of allthe ghost accesses the BTS has decoded. For the rest, aSDCCH is allocated and this will result insdcch_abis_fail_call failure. Because of ghost attemptsthe SDCCH drop ratio is high with low traffic. As the amountof call attempts increases, the influence of ghosts becomessmaller and the drop ratio approaches its real value.2) The rate of ghosts coming to SDCCH dropped when BTSB9 with improved ghost filtering was taken into use.
Known problems: In SDCCH failure counters it is not possible to separate LUand call seizures.
sum(sdcch_radio_fail+sdcch_rf_old_ho+sdcch_user_act+sdcch_bcsu_reset+ sdcch_netw_act+sdcch_abis_fail_call+sdcch_abis_fail_old+sdcch_bts_fail+ sdcch_lapd_fail+sdcch_a_if_fail_call+sdcch_a_if_fail_old)100 * ------------------------------------------------------------------------ % sum(sdcch_assign+sdcch_ho_seiz)
Counters from table(s):p_nbsc_traffic
Figure 61. SDCCH Drop %, S3 (sdr_1a)
DN98619493 © Nokia Networks Oy 53 (206)Issue 1-1 en Nokia Proprietary and Confidential
BSS Network Doctor Formulas
SDCCH drop %, abis fail excluded, S3 (sdr_2)
Known problems: SDCCH_ABIS_CALL does not necessarily refer to ghosts butalso, for example, to failing location updates.
sum(sdcch_radio_fail+sdcch_rf_old_ho+sdcch_user_act+sdcch_bcsu_reset+ sdcch_netw_act +sdcch_bts_fail+ sdcch_lapd_fail+sdcch_a_if_fail_call+sdcch_a_if_fail_old)100 * ------------------------------------------------------------------------ % sum(sdcch_assign+sdcch_ho_seiz) - sum(sdcch_abis_call+sdcch_fail_old)
Counters from table(s):p_nbsc_traffic
Figure 62. SDCCH Drop %, abis fail excluded, S3 (sdr_2)
Illegal establishment cause %, (sdr_3b)
Use: This PI gives you the number of ghost accesses which try toseize SDCCH but are rejected before seizing SDCCH due toan illegal establishment cause.
sum(a.ghost_CCCH_res-a.rej_seiz_att_due_dist)100 * ------------------------------------------------- % sum(b.sdcch_assign+b.sdcch_ho_seiz)%
Counters from table(s):a = p_nbsc_res_accessb = p_nbsc_traffic
Figure 63. Illegal establishment cause %, (sdr_3b)
2.9 Setup success ratio (cssr)
SDCCH, TCH setup success %, S4 (cssr_2)
Use: This PI shows the setup success ratio, including SDCCH andTCH. It works also in the case of DR.Possible fault cases:- faulty DSP in BTS TRX
Experiences on use: Fits for general quality monitoring. Values between 2.5 and4%, for example.
54 (206) © Nokia Networks Oy DN98619493Nokia Proprietary and Confidential Issue 1-1en

BSS counter formulas
Known problems: ’B no answer’ is also counted as a successful call.Includes also SMSs and LUs which do not use TCH at all.This causes problems in special cases when there are manyLUs but few calls. The problems in calls are hidden by a greatnumber of LUs which receive SDCCH successfully.There is a known case in which cssr_1 went down by 6 percent down due to a MSC problem while cssr_2 did not showany change. This could be due to the location updates whichincreased by 10 per cent in MSC restart and thus compensatedthe bad TCH setup.
Troubleshooting: You can use SDCCH and TCH observations to see which oneis failing. However, note that this is a time-consuming task.
sum(call_setup_failure)100* ( 1 - ----------------------------------------) % sum(setup_succ+call_setup_failure)
Counters from table(s):p_nbsc_service
Figure 64. SDCCH, TCH Setup Success %, S4 (cssr_2)
2.10 TCH drop failures
2.10.1 TCH drop call counters
TCH drop calls are counted as the sum of the following counters:
DN98619493 © Nokia Networks Oy 55 (206)Issue 1-1 en Nokia Proprietary and Confidential

BSS Network Doctor Formulas
Table 5. TCH drop call counters
ID Name Description
1011 TCH_RADIO_FAIL • Radio link timeout
• Release indication from MS
• MS moves out from timing advance
• TCH assignment failure where an Establish Indication hasbeen received but Assignment Complete has not beenreceived
This counter is typical in connection with coverage problems. Thisfailure type is usually the dominating one.
1014 TCH_RF_OLD_HO Same as above but when trying to return to the old channel in HO.
1084 TCH_ABIS_FAIL_CALL • missing ack of channel activation
• missing establishment indication
• reception of error indication
• corruption of messages
• measurement results no longer received from BTS
• excessive timing advance
• missing HO detection
• T3107 (assignment completely missing) expiry
• T3109 expiry. As in this case the drop happens in the releasephase, the MS user cannot see the situation as a drop call.
The BTS suffering from this failure can be faulty or their TCH TRXsuffers from bad interference (TCH assignment fails).
See #1 for all possible causes that trigger this counter.
If FACCH call setup is used, we may expect that we start to seeghost seizures incrementing this counter because the signallingtries to use SDCCH instead of TCH.
The portion of this failure decreased from S4 to S5. Doublecounting of a coprocess failure was causing higher values in S4.
1085 TCH_ABIS_FAIL_OLD Same as above but when trying to return to the old channel in HO.
56 (206) © Nokia Networks Oy DN98619493Nokia Proprietary and Confidential Issue 1-1en

BSS counter formulas
1087 TCH_A_IF_FAIL_CALL • A clear command from the MSC during the call setup phasebefore the assignment from MS is complete
• Abnormal clear received due to A-interface (reset circuit,SCCP clear). For example, a BSU reset in MSC makes MSCsend a "reset circuit" message.
There have been cases where the MSC of another vendor in inter-MSC handovers has caused high values even though thehandovers have been successful.
See #1 for all possible causes that trigger this counter.
1088 TCH_A_IF_FAIL_OLD Same as above but when trying to return to the old channel in HO.
Can be updated when GSM timer T8 expires in the source BSCduring an external handover.
1029 TCH_TR_FAIL • Transcoder failure during a call attempt
This counter is updated only when BTS sends a "connectionfailure" with cause "remote trascoder failure" and the call isreleased due to this.
If this failure is related to a transcoder, you can see its share to behigh for one BSC. Another possibility is that the problem lies in aBTS. Also interruptions of the transmission may cause this failure(alarms may be filtered out in a BSC or OMC to reduce thenumber of alarms due to disturbance).
In analysing the problem, you may find it helpful to check thepattern over a longer period of time.
In S6 the portion of this failure has decreased due toimprovements in transcoders.
1030 TCH_TR_FAIL_OLD Same as above but when trying to return to the old channel in HO.
1046 TCH_LAPD_FAIL TRX is blocked due to a LAPD failure (signalling link failure orPCM failure).
Even if occurs, the share is very small because only ongoing callsare dropped when the LAPD fails.
1047 TCH_BTS_FAIL TRX is blocked by a BTS failure.
(FU fault, CU fault, BTS reset, BCF reset, CU and FU fault, BCFfault).
Even if occurs, the share is very small because only ongoing callsare dropped when a BTS fails.
Table 5. TCH drop call counters (Continued)
ID Name Description
DN98619493 © Nokia Networks Oy 57 (206)Issue 1-1 en Nokia Proprietary and Confidential

BSS Network Doctor Formulas
To see what DX causes can trigger the counters above, see #2.
The problem especially with failure classes Abis and Aif is that they are triggeredby many different causes. To analyse the case in question, TCH observations maybe used. As there are limitations on how to set the observations, the analysis ismore time-consuming.
If the problem is not cell specific but related to the entire network or BSS areas,you can also use the Clear Code measurement.
*_OLD counters are related to the handover situation when returning to the oldchannel fails causing a call to drop. Thus, these counters reflect the amount of calldrops in handovers.
2.10.2 Drop call ratio
Drop call ratio is counted as the ratio of the sum of the above named counters toall TCH seizures for a new call. This ratio is used in reports for network ormaintenance region level. See dcr_3*.
2.10.3 Drop-out ratio
Drop-out ratio is counted as the ratio of the sum of the above named counters toall TCH seizures. This ratio is used on cell level reports where the concept of callis not applicable.
1049 TCH_BCSU_RESET TRX is blocked by BCSU reset.
Even if occurs, the share is very small because only ongoing callsare dropped when BCSU resets.
1048 TCH_USER_ACT Busy TSL or TRX blocked by MML command (blocked by user).
Even if occurs, the share is very small because only ongoing callsare dropped when the blocking command is given.
1050 TCH_NETW_ACT TRX is blocked by a fault leading to reconfiguration (blocked by thesystem).
Even if occurs, the share is very small because only ongoing callsare dropped when reconfiguration is executed.
1081 TCH_ACT_FAIL_CALL Channel activation nack received.
Table 5. TCH drop call counters (Continued)
ID Name Description
58 (206) © Nokia Networks Oy DN98619493Nokia Proprietary and Confidential Issue 1-1en

BSS counter formulas
2.10.4 Problems with the drop call counters
TCH Tr, Abis failures
These failures can contain also situations when timer T3109 (8 to 15 s, default 12s) expires in a BSC in the call release phase while waiting for the Releaseindication. With BTS software 6.0 these were seen as TC failures, whereas sinceBTS software 6.1 they have been Abis failures. The MS user does not see thesefailures as real drop calls.
If you detect a high ratio of TC or Abis failures, check the BTS release and thetimer.
TCH_A_IF_OLD high
There have been cases when this counter has been showing high values whileanother vendor’s MSC has cleared the call with the cause CLR_CMD in the case ofa successful inter-MSC HO.
2.11 Drop call failures (dcf)
TCH drop calls in HO, S2 (dcf_2)
Open questions: Claims of cases when the TCH_A_IF_OLD has not been a dropcall have been made.
sum(tch_rf_old_ho+ tch_abis_fail_old+tch_a_if_fail_old+tch_tr_fail_old)
Counters from table(s):p_nbsc_traffic
Figure 65. TCH drop calls in HO, S2 (dcf_2)
TCH drop calls in BSC outgoing HO, S3 (dcf_3)
Known problems: Accuracy is not good.sum(bsc_o_drop_calls)
Counters from table(s):p_nbsc_ho
Figure 66. TCH drop calls in BSC outgoing HO, S3 (dcf_3)
TCH drop calls in intra-cell HO, S3 (dcf_4)
Known problems: Accuracy is not good.sum(cell_drop_calls)
DN98619493 © Nokia Networks Oy 59 (206)Issue 1-1 en Nokia Proprietary and Confidential

BSS Network Doctor Formulas
Counters from table(s):p_nbsc_ho
Figure 67. TCH drop calls in intra-cell HO, S3 (dcf_4)
TCH drop calls in intra-BSC HO, S3 (dcf_6)
Known problems: Use on the BTS level. On the area level causes doublecounting. Accuracy is not good.
sum(bsc_i_drop_calls+bsc_o_drop_calls+cell_drop_calls)
Counters from table(s):p_nbsc_ho
Figure 68. TCH drop calls in intra BSC HO, S3 (dcf_6)
Drop calls in BSC incoming HO, S3 (dcf_7)
Known problems: Accuracy is not good.sum(bsc_i_drop_calls)
Counters from table(s):p_nbsc_ho
Figure 69. Drop calls in BSC incoming HO, S3 (dcf_7)
2.12 TCH drop call % (dcr)
TCH drop call %, area, real, after re-establishment, S3 (dcr_3f)
Use: On the area level.Experiences on use: See dcr_3g. Call re-establishments can markedly improve
the drop call ratio (for example, from 2.5 to 2.0%). Since thisis an improvement from the MS user’s point of view, thisfigure suits better to management reports.
Known problems: 1) See dcr_3g.2) It is assumed that call re-establishments happen on TCH. Infact they may happen also on SDCCH.3) The counters used to compensate re-establishments are theones that indicate re-establishment attempts, not thesuccessful re-establishments. In S7/T11 re-establishments canbe considered accurately (see dcr_3j).4) On cell level it can happen that the call is re-established ina different cell than where it was dropped, resulting ininaccuracy.
60 (206) © Nokia Networks Oy DN98619493Nokia Proprietary and Confidential Issue 1-1en

BSS counter formulas
100-csf_4p =
. sum(tch_radio_fail+tch_rf_old_ho+tch_abis_fail_call+tch_abis_fail_old+
. tch_a_if_fail_call+tch_a_if_fail_old+tch_tr_fail+tch_tr_fail_old+
. tch_lapd_fail+tch_bts_fail+tch_user_act+tch_bcsu_reset+tch_netw_act+
. tch_act_fail_call - sum(b.sdcch_call_re_est+b.tch_call_re_est);(call re-establishments)100* ---------------------------------------------------------------------------- % sum(a.tch_norm_seiz) ;(normal calls) + sum(c.msc_i_sdcch_tch+c.bsc_i_sdcch_tch+c.cell_sdcch_tch) ;(DR calls) + sum(a.tch_seiz_due_sdcch_con) ; calls started as FACCH call setup - sum(b.sdcch_call_re_est+b.tch_call_re_est) ;(call re-establishments)
Counters from table(s):a = p_nbsc_trafficb = p_nbsc_res_accessc = p_nbsc_ho
Figure 70. TCH drop call %, area, real, after re-establishment S3 (dcr_3f)
TCH drop call %, area, real, before re-establishment, S3 (dcr_3g)
Use: On the area level.Experiences on use: In good networks where optimisation has been done already
for two to three years, values have been around 2 to 3 per cent(and in networks in which no optimisation has been done yet,the values remain even above 10 per cent). A value of 5 percent is achievable in many networks despite their bad initialcoverage planning.Interference also raises the figure. Be careful when setting thetarget values since the factors (whether caused by thecustomer or Nokia) can be time-consuming and expensive toprove. If used on cell level, the values can be even over 100per cent if a cell takes HOs in but then drops them.
Known problems: Some failures in the release phase are included in this formula(tch_abis_fail_call) but are, in fact, not perceived asdrop calls by the MS user.tch_norm_seiz does not mean that the MS is on TCH. Itmeans that TCH has been successfully seized. Some mobilesnever appear to the TCH because:• the call is cleared by the user (probability is higher if
call setup takes a long time, and thus DR and queuingcan increase this share) or
• the mobile fails or• something else goes wrong.TCH failure counters are not triggered if a call is cleared bypre-emption (1st priority call requested to be established, allTCH seized, lower priority calls on) whereas p_nbsc-service_dropped_call is triggered.
DN98619493 © Nokia Networks Oy 61 (206)Issue 1-1 en Nokia Proprietary and Confidential

BSS Network Doctor Formulas
sum(a.tch_radio_fail+a.tch_rf_old_ho+a.tch_abis_fail_call+ a.tch_abis_fail_old+a.tch_a_if_fail_call+ a.tch_a_if_fail_old+ a.tch_tr_fail+ a.tch_tr_fail_old+a.tch_lapd_fail+ a.tch_bts_fail+ a.tch_user_act+ a.tch_bcsu_reset+a.tch_netw_act+a.tch_act_fail_call)100 -100* ---------------------------------------------------------------------- % sum(a.tch_norm_seiz) ;(normal calls) + sum(c.msc_i_sdcch_tch+c.bsc_i_sdcch_tch+c.cell_sdcch_tch) ;(DR calls) + sum(a.tch_seiz_due_sdcch_con) ; FACCH call setup calls
Counters from table(s):a = p_nbsc_trafficc = p_nbsc_ho
Figure 71. TCH drop call %, area, real, before re-establishment, S3(dcr_3g)
TCH drop call %, area, real, after re-establishment, S7 (dcr_3h)
Use: On the area level.Experiences on use: See dcr_3. Call re-establishments can markedly improve
the drop call ratio (for example, from 2.5 to 2.0%). Since thisis an improvement from the MS user’s point of view, thisfigure suits better to management reports.
Known problems: See dcr_3g. It is assumed that call re-establishments occuron TCH. In fact they may occur also on SDCCH.
sum(tch_radio_fail+tch_rf_old_ho+tch_abis_fail_call+tch_abis_fail_old+. tch_a_if_fail_call+tch_a_if_fail_old+tch_tr_fail+tch_tr_fail_old+. tch_lapd_fail+tch_bts_fail+tch_user_act+tch_bcsu_reset+tch_netw_act+. tch_act_fail_call - sum(b.tch_re_est_assign) ;(call re-establishments)100* ---------------------------------------------------------------------------- % sum(a.tch_norm_seiz) ;(normal calls) + sum(c.msc_i_sdcch_tch+c.bsc_i_sdcch_tch+c.cell_sdcch_tch) ;(DR calls) + sum(a.tch_seiz_due_sdcch_con) ; calls started as FACCH call setup - sum(b.tch_re_est_assign) ;(call re-establishments)
Counters from table(s):a = p_nbsc_trafficb = p_nbsc_servicec = p_nbsc_ho
Figure 72. TCH drop call %, area, real, after re-establishment, S7(dcr_3h)
TCH drop call %, area, real, before re-establishment S3 (dcr_3i)
Use: On the area level.This KPI indicates how much calls are dropped after TCHseizure.
62 (206) © Nokia Networks Oy DN98619493Nokia Proprietary and Confidential Issue 1-1en

BSS counter formulas
Experiences on use: In good networks where optimisation has been done alreadyfor two to three years, values have been around 2 to 3 per cent(and in networks in which no optimisation has been done yetthe values remain even above 10 per cent. A value of 5 percent is achievable in many networks despite their bad initialcoverage planning. Interference also raises the figure. Becareful when setting the target values since the factors(whether caused by the customer or Nokia) can be time-consuming and expensive to prove.If used on cell level, the values can be even over 100 per centif a cell takes HOs in but then drops them.
Known problems: 1) Some failures in release phase are included in this formula(tch_abis_fail_call) but are, in fact, not perceived asdrop calls by the MS user.2) tch_norm_seiz does not mean that the MS is on TCH. Itmeans that TCH has been successfully seized. Some mobilesnever appear to the TCH because2a) the call is cleared by the user (probability is higher if callsetup takes a long time, and thus DR and queuing canincrease this share) or2b) the mobile fails or2c) something else goes wrong.3) TCH failure counters are not triggered if a call is cleared bypre-emption (1st priority call requested to be established, allTCH seized, lower priority calls on), whereas p_nbsc-service.dropped_call is triggered.
100-csf_4u =
. sum(tch_radio_fail+tch_rf_old_ho+tch_abis_fail_call+tch_abis_fail_old+
. tch_a_if_fail_call+tch_a_if_fail_old+tch_tr_fail+tch_tr_fail_old+
. tch_lapd_fail+tch_bts_fail+tch_user_act+tch_bcsu_reset+tch_netw_act+
. tch_act_fail_call)100* ---------------------------------------------------------------------------- % sum(a.tch_norm_seiz) ;(normal calls) + sum(c.msc_i_sdcch_tch+c.bsc_i_sdcch_tch+c.cell_sdcch_tch) ;(DR calls) -sum(a.tch_succ_seiz_for_dir_acc);ref.1 + sum(a.tch_seiz_due_sdcch_con) ; calls started as FACCH call setup
Counters from table(s):a = p_nbsc_trafficc = p_nbsc_ho
Figure 73. TCH drop call %, area, real, before re-establishment, S3(dcr_3i)
Ref.2. Compensation is needed, since in case of Direct Access to super reuse TRXthe tch_norm_seiz is triggered in parallel with cell_sdcch_tch.
DN98619493 © Nokia Networks Oy 63 (206)Issue 1-1 en Nokia Proprietary and Confidential
BSS Network Doctor Formulas
TCH drop call %, area, real, after re-establishment, S7 (dcr_3j)
Use: On the area level.Experiences on use: In good networks where optimisation has been done already
for two to three years, values are around 2 to 3 per cent. Innetworks in which no optimisation has been done yet thevalues are as much as 10 per cent. A value of 5 per cent isachievable in many networks despite their bad initialcoverage planning.The values in the best networks are below 2%.Interference also raises the figure.Be careful when you give promises concerning quality sincethe factors (whether caused by the customer or Nokia) can betime-consuming and expensive to prove.If used on cell level, the values can be even over 100 per centif a cell takes HOs in but then drops them.Call re-establishments can markedly improve the drop callratio (for example, from 2.3 to 2.0 %). Since this is animprovement from the MS user’s point of view, this figuresuits better to management reports.The biggest reason to have low figures usually is in basicnetwork planning. If coverage is not adequate, this KPI cannotshow good values.
Known problems: 1) Some failures in release phase are included in this formula(tch_abis_fail_call) but are, in fact, not perceived as drop callsby the MS user.2) tch_norm_seiz does not mean that the MS is on TCH. Itmeans that TCH has been successfully seized. Some mobilesnever appear to the TCH because2a) the call is cleared by user (probability is higher if callsetup takes a long time, and thus DR and queuing canincrease this share) or2b) the mobile fails or2c) something else goes wrong3) TCH failure counters are not triggered if call is cleared bypre-emption (1st priority call requested to be established, allTCH seized, lower priority calls on) where as p_nbsc-service.dropped_call is triggered.4) It is assumed that call re-establishments happen on TCH. Infact they may happen also on SDCCH.5) On cell level it can happen that the call is re-established ina different cell than it was dropped and this causes inaccuracy.
100-csf_4v =
. sum(tch_radio_fail+tch_rf_old_ho+tch_abis_fail_call+tch_abis_fail_old+
. tch_a_if_fail_call+tch_a_if_fail_old+tch_tr_fail+tch_tr_fail_old+
. tch_lapd_fail+tch_bts_fail+tch_user_act+tch_bcsu_reset+tch_netw_act+
. tch_act_fail_call - sum(b.tch_re_est_assign) ;(call re-establishments)100* ---------------------------------------------------------------------------- % sum(a.tch_norm_seiz) ;(normal calls)
+ sum(c.msc_i_sdcch_tch+c.bsc_i_sdcch_tch+c.cell_sdcch_tch) ;(DR calls)
64 (206) © Nokia Networks Oy DN98619493Nokia Proprietary and Confidential Issue 1-1en

BSS counter formulas
-sum(a.succ_tch_seiz_for_dir_acc) ;ref.2 + sum(a.tch_seiz_due_sdcch_con) ; calls started as FACCH call setup - sum(b.tch_re_est_assign) ;(call re-establishments)
Counters from table(s):a = p_nbsc_trafficb = p_nbsc_servicec = p_nbsc_ho
Figure 74. TCH drop call %, area, real, after re-establishment, S7 (dcr_3j)
Ref.2. Compensation is needed, since in case of Direct Access to super reuse TRXthe tch_norm_seiz is triggered in parallel with cell_sdcch_tch.
TCH drop-out %, BTS level, before call re-establishment, S3 (dcr_4c)
Use: On the BTS level. To rank cells by the share of TCH drop callfailures per TCH seizure (normal or HO). Intra-cell HOexcluded which is meaningful in the case of IUO, forexample.
Known problems: See dcr_3g.
sum(a.tch_radio_fail+a.tch_rf_old_ho+a.tch_abis_fail_call+ a.tch_abis_fail_old+a.tch_a_if_fail_call+ a.tch_a_if_fail_old+ a.tch_tr_fail+ a.tch_tr_fail_old+a.tch_lapd_fail+ a.tch_bts_fail+ a.tch_user_act+ a.tch_bcsu_reset+a.tch_netw_act+a.tch_act_fail_call)100* --------------------------------------------------------------------------- % sum(a.tch_norm_seiz) ;(normal calls) + sum(c.msc_i_sdcch_tch+c.bsc_i_sdcch_tch+c.cell_sdcch_tch) ;(DR calls) + sum(a.tch_seiz_due_sdcch_con) ; (FACCH call setup calls) + sum(c.msc_i_tch_tch+c.bsc.bsc_i_tch_tch) ;(TCH-TCH Ho from other cells)
Counters from table(s):a = p_nbsc_trafficc = p_nbsc_ho
Figure 75. TCH drop-out %, BTS level, before call re-establishment, S3(dcr_4c)
TCH drop-out %, BTS level, before call re-establishment, S3 (dcr_4d)
Use: On the BTS level. To rank cells by the share of TCH drop callfailures per TCH seizure (normal or HO). Intra-cell HO isexcluded, which is meaningful in the case of IUO. Inter-cellHOs are counted only as a net value.
Known problems: See dcr_3g.
sum(a.tch_radio_fail+a.tch_rf_old_ho+a.tch_abis_fail_call+ a.tch_abis_fail_old+a.tch_a_if_fail_call+ a.tch_a_if_fail_old+ a.tch_tr_fail+ a.tch_tr_fail_old+a.tch_lapd_fail+ a.tch_bts_fail+ a.tch_user_act+ a.tch_bcsu_reset+a.tch_netw_act+a.tch_act_fail_call)
DN98619493 © Nokia Networks Oy 65 (206)Issue 1-1 en Nokia Proprietary and Confidential

BSS Network Doctor Formulas
100* ---------------------------------------------------------------------------- % sum(a.tch_norm_seiz) ;(normal calls) + sum(c.msc_i_sdcch_tch+c.bsc_i_sdcch_tch+c.cell_sdcch_tch) ;(DR calls) + sum(a.tch_seiz_due_sdcch_con) ; (FACCH call setup calls) + sum(c.msc_i_tch_tch+c.bsc.bsc_i_tch_tch) - sum(c.msc_o_tch_tch +c.bsc.bsc_o_tch_tch) ;(TCH-TCH Ho net in from other cells)
Counters from table(s):a = p_nbsc_trafficc = p_nbsc_ho
Figure 76. TCH drop-out %, BTS level, before call re-establishment, S3(dcr_4d)
TCH drop-out %, BTS level, before call re-establishment, S7 (dcr_4e)
Use: On the BTS level. To rank cells by the share of TCH drop callfailures per TCH seizure (normal or HO). Intra-cell HO isexcluded, which is meaningful in the case of IUO, forexample.
Known problems: See dcr_3g.
100-csf_4y= sum(a.tch_radio_fail+a.tch_rf_old_ho+a.tch_abis_fail_call+ a.tch_abis_fail_old+a.tch_a_if_fail_call+ a.tch_a_if_fail_old+ a.tch_tr_fail+ a.tch_tr_fail_old+a.tch_lapd_fail+ a.tch_bts_fail+ a.tch_user_act+ a.tch_bcsu_reset+a.tch_netw_act+a.tch_act_fail_call)100* --------------------------------------------------------------------------- % sum(a.tch_norm_seiz) ;(normal calls) + sum(c.msc_i_sdcch_tch+c.bsc_i_sdcch_tch+c.cell_sdcch_tch) ;(DR calls) - sum(a.tch_succ_seiz_for_dir_acc);ref.2 + sum(a.tch_seiz_due_sdcch_con) ; (FACCH call setup calls) + sum(c.msc_i_tch_tch+c.bsc.bsc_i_tch_tch) ;(TCH-TCH Ho from other cells)
Counters from table(s):a = p_nbsc_trafficc = p_nbsc_ho
Figure 77. TCH drop-out %, BTS level, before call re-establishment, S7(dcr_4e)
Ref.2. Compensation is needed, since in case of Direct Access to super reuse TRXthe tch_norm_seiz is triggered in parallel with cell_sdcch_tch.
66 (206) © Nokia Networks Oy DN98619493Nokia Proprietary and Confidential Issue 1-1en

BSS counter formulas
TCH drop-out %, BTS level, before call re-establishment, S7 (dcr_4f)
Use: On the BTS level. To rank cells by the share of TCH drop callfailures per TCH seizure (normal or HO). Intra-cell HO isexcluded, which is meaningful in the case of IUO. Inter-cellHOs are counted only as a net value.
Known problems: See dcr_3g.
sum(a.tch_radio_fail+a.tch_rf_old_ho+a.tch_abis_fail_call+ a.tch_abis_fail_old+a.tch_a_if_fail_call+ a.tch_a_if_fail_old+ a.tch_tr_fail+ a.tch_tr_fail_old+a.tch_lapd_fail+ a.tch_bts_fail+ a.tch_user_act+ a.tch_bcsu_reset+a.tch_netw_act+a.tch_act_fail_call)100* --------------------------------------------------------------------------- % sum(a.tch_norm_seiz) ;(normal calls) + sum(c.msc_i_sdcch_tch+c.bsc_i_sdcch_tch+c.cell_sdcch_tch) ;(DR calls) - sum(a.succ_tch_seiz_for_dir_acc);ref.2 + sum(a.tch_seiz_due_sdcch_con) ; (FACCH call setup calls) + sum(c.msc_i_tch_tch+c.bsc.bsc_i_tch_tch) - sum(c.msc_o_tch_tch +c.bsc.bsc_o_tch_tch) ;(TCH-TCH Ho net in from other cells)
Counters from table(s):a = p_nbsc_trafficc = p_nbsc_ho
Figure 78. TCH drop-out %, BTS level, before call re-establishment, S7(dcr_4f)
Ref.2. Compensation is needed, since in case of Direct Access to super reuse TRXthe tch_norm_seiz is triggered in parallel with cell_sdcch_tch.
TCH drop call (dropped conversation) %, BSC level, S4 (dcr_5)
Use: On the area level. Tells the ratio of calls dropped while A andB are talking, that is after conn_ack.Theoretically should always be less than dcr_3f or dcr_3g.Results from networks 2 to 6 %.
Known problems: Does not work on the BTS level (handovers). Accurate on theBSC and PLMN levels after a bug was corrected.If call re-establishment is active and occurs, theconver_started is triggered once and dropped_callsonly once. After the first call re-establishment thedropped_calls counter is no longer incremented in this callno matter if the call stays or drops. This means that in this caseseen from counters, the call looks like a dropped call. In fact,from the MS user’s point of view it is impossible to knowwhether it was dropped or not (does callre_establishment save the call or not).Subscriber clear during HO is counted as a dropped call.
DN98619493 © Nokia Networks Oy 67 (206)Issue 1-1 en Nokia Proprietary and Confidential

BSS Network Doctor Formulas
Due to an error in the mapping table also blocking in the caseof an external HO has been counted as a dropped call.In the NMS/2000 T8 the p_nbsc_service table did havewrong index settings (a bug in the upgrade script) andtherefore the use of the table was very slow.External HOs (inter BSC handovers) triggerconver_started counter in target cell. Therefore onnetwork level the ratio does not illustrate correctly thedropped conversation ratio from the MS’s point of view.
sum(dropped_calls)100* -------------------- % sum(conver_started)
Counters from table(s):p_nbsc_service
Figure 79. TCH drop call (dropped conversation) %, BSC level, S4(dcr_5)
TCH dropped conversation %, area, re-establishment considered, S7(dcr_5b)
Use: On the area level. Tells the ratio of calls dropped while A andB are talking, that is after conn_ack. Inter BSC handoversare subtracted in the denominator because they triggerconver_started. Compensation is 100% true only if thearea has no inter-BSC handovers from outside the area.Theoretically should always be less than dcr_3f or dcr_3g.
Known problems: See dcr_5.1) conver_started is not triggered for call re-establishments.dropped_calls is triggered once for the first re-establishment. After that setup_failure is triggered if thecall is a dropped call.If the call is ’saved’ by re-establishment multiple times,setup_failure will be triggered several times accordingly.2) Drop call by pre-emption (1st priority call request to beestablished, all TCHs seized, lower priority calls on) triggersdropped_calls. Therefore this counter does not indicateonly technical drops.
sum(b.dropped_calls) - sum(tch_re_est_release)100* -------------------------------------------------- % sum(b.conver_started) - sum(a.msc_i_tch_tch)
Counters from table(s):
68 (206) © Nokia Networks Oy DN98619493Nokia Proprietary and Confidential Issue 1-1en

BSS counter formulas
a = p_nbsc_hob = p_nbsc_service
Figure 80. TCH dropped conversation %, area, re-establishmentconsidered, S7 (dcr_5b)
TCH drop call %, after TCH assignment, without re-establishment, arealevel, S7 (dcr_8)
Use: This formula is developed to better match with the othervendors’ formulas.
Drops after TCH assignment100* ------------------------------ % = TCH assignments for new calls
sum(tch_new_call_assign +tch_ho_assign -tch_norm_release-tch_ho_release)100* -------------------------------------------------------- % sum(tch_new_call_assign)
Counters from table(s):p_nbsc_service
Figure 81. TCH drop call %, after TCH assignment, without re-establishment, area level, S7 (dcr_8)
TCH drop call %, after TCH assignment, with re-establishment, area level,S7 (dcr_8b)
Use: This formula is developed to better match with the othervendors’ formulas.
Known problems: Negative values seen in the field.
Drops after TCH assignment100* ------------------------------ % = TCH assignments for new calls
sum(tch_new_call_assign +tch_ho_assign -tch_norm_release-tch_ho_release-tch_re_est_release)100* -------------------------------------------------------- % sum(tch_new_call_assign)
Counters from table(s):p_nbsc_service
Figure 82. TCH drop call %, after TCH assignment, with re-establishment, area level, S7 (dcr_8b)
Drops per erlang, before re-establishment, S4 (dcr_10)
Use: On the area and BTS level.
DN98619493 © Nokia Networks Oy 69 (206)Issue 1-1 en Nokia Proprietary and Confidential

BSS Network Doctor Formulas
Known problems: Works for 60 min period.
Drops-------------------------- =Traffic (Erlang hours sum)
sum(a.tch_radio_fail+a.tch_rf_old_ho+a.tch_abis_fail_call+ a.tch_abis_fail_old+a.tch_a_if_fail_call+ a.tch_a_if_fail_old+ a.tch_tr_fail+ a.tch_tr_fail_old+a.tch_lapd_fail+ a.tch_bts_fail+ a.tch_user_act+ a.tch_bcsu_reset+a.tch_netw_act+a.tch_act_fail_call)------------------------------------------------------------------------------- sum(b.ave_busy_tch/b.res_av_denom14) / (60/avg(period_duration))
Counters from table(s):a = p_nbsc_trafficb = p_nbsc_res_avail
Figure 83. Drops per erlang , before re-establishment, S4 (dcr_10)
Drops per erlang, after re-establishment, S4 (dcr_10a)
Use: On the area and BTS level.Known problems: Works for 60 min period.
The counters used to compensate re-establishments are theones that indicate re-establishment attempts, not thesuccessful re-establishments.
Drops- re-establishments-------------------------- =Traffic (Erlang hours sum)
sum(a.tch_radio_fail+a.tch_rf_old_ho+a.tch_abis_fail_call+ a.tch_abis_fail_old+a.tch_a_if_fail_call+ a.tch_a_if_fail_old+ a.tch_tr_fail+ a.tch_tr_fail_old+a.tch_lapd_fail+ a.tch_bts_fail+ a.tch_user_act+ a.tch_bcsu_reset+a.tch_netw_act+a.tch_act_fail_call) - sum(c.sdcch_call_re_est+c.tch_call_re_est);call re-establishments------------------------------------------------------------------------------- sum(b.ave_busy_tch/b.res_av_denom14) / (60/avg(period_duration))
Counters from table(s):a = p_nbsc_trafficb = p_nbsc_res_availc = p_nbsc_res_access
Figure 84. Drops per erlang , after re-establishment, S4 (dcr_10a)
Drops per erlang, after re-establishment, S7 (dcr_10b)
Use: On the area and BTS level.Known problems: Works for the 60 min period.
Drops- re-establishments-------------------------- =Traffic (Erlang hours sum)
sum(a.tch_radio_fail+a.tch_rf_old_ho+a.tch_abis_fail_call+
70 (206) © Nokia Networks Oy DN98619493Nokia Proprietary and Confidential Issue 1-1en

BSS counter formulas
a.tch_abis_fail_old+a.tch_a_if_fail_call+ a.tch_a_if_fail_old+ a.tch_tr_fail+ a.tch_tr_fail_old+a.tch_lapd_fail+ a.tch_bts_fail+ a.tch_user_act+ a.tch_bcsu_reset+a.tch_netw_act+a.tch_act_fail_call) - sum(c.tch_re_est_assign) ;call re-establishments------------------------------------------------------------------------------- sum(b.ave_busy_tch/b.res_av_denom14) / (60/avg(period_duration))
Counters from table(s):a = p_nbsc_trafficb = p_nbsc_res_availc = p_nbsc_service
Figure 85. Drops per erlang , after re-establishment, S7 (dcr_10b)
2.13 Handover (ho)
Return from super TRXs to regular TRX, S4 (ho_1)
sum(ho_succ_to_reg_freq)100* ------------------------------ % sum(ho_succ_from_reg_freq)
Counters from table(s):p_nbsc_underlay
Figure 86. Return from super TRXs to regular TRX, S4 (ho_1)
HO attempts from regular TRXs to super, S4 (ho_2)
sum(ho_att_from_reg_freq)
Counters from table(s):p_nbsc_underlay
Figure 87. HO attempts from regular TRXs to super, S4 (ho_2)
HO attempts from super to regular, S4 (ho_3)
sum(ho_att_to_reg_freq)
Counters from table(s):p_nbsc_underlay
Figure 88. HO attempts from super to regular, S4 (ho_3)
DN98619493 © Nokia Networks Oy 71 (206)Issue 1-1 en Nokia Proprietary and Confidential

BSS Network Doctor Formulas
Share of HO attempts from super to regular due to DL quality, S4 (ho_4)
sum(att_from_super_dl_qual)100 * ------------------------------------------------------ % sum(att_from_super_dl_qual + att_from_super_dl_if +att_from_super_ul_if + att_from_super_bad_ci)
Counters from table(s):p_nbsc_underlay
Figure 89. Share of HO attempts from super to regular due to DL Qual,S4 (ho_4)
Share of HO attempts from super to regular due to DL interference, S4(ho_5)
sum(att_from_super_dl_if)100 * ------------------------------------------------------ % sum(att_from_super_dl_qual + att_from_super_dl_if +att_from_super_ul_if + att_from_super_bad_ci)
Counters from table(s):p_nbsc_underlay
Figure 90. Share of HO attempts from super to regular due to DLinterference, S4 (ho_5)
Share of HO attempts from super to regular due to UL interference, S4(ho_6)
sum(att_from_super_ul_itf)100 * ------------------------------------------------------ % sum(att_from_super_dl_qual + att_from_super_dl_itf +att_from_super_ul_itf + att_from_super_bad_ci)
Counters from table(s):p_nbsc_underlay
Figure 91. Share of HO attempts from super to regular due to ULinterference, S4 (ho_6)
Share of HO attempts from super to regular due to bad C/I, S4 (ho_7)
sum(att_from_super_bad_ci)100 * ------------------------------------------------------ % sum(att_from_super_dl_qual + att_from_super_dl_itf +att_from_super_ul_itf + att_from_super_bad_ci)
72 (206) © Nokia Networks Oy DN98619493Nokia Proprietary and Confidential Issue 1-1en

BSS counter formulas
Counters from table(s):p_nbsc_underlay
Figure 92. Share of HO attempts from super to regular due to bad C/I, S4(ho_7)
MSC incoming HO attempts (ho_8)
sum(msc_i_tch_tch_at+msc_i_sdcch_tch_at+msc_i_sdcch_at)
Counters from table(s):p_nbsc_ho
Figure 93. MSC incoming HO attempts, (ho_8)
MSC outgoing HO attempts (ho_9)
sum(msc_o_tch_tch_at+msc_o_sdcch_tch_at+msc_o_sdcch_at)
Counters from table(s):p_nbsc_ho
Figure 94. MSC outgoing HO attempts, (ho_9)
BSC incoming HO attempts (ho_10)
sum(bsc_i_tch_tch_at+bsc_i_sdcch_tch_at+bsc_i_sdcch_at)
Counters from table(s):p_nbsc_ho
Figure 95. BSC incoming HO attempts, (ho_10)
BSC outgoing HO attempts (ho_11)
sum(bsc_o_tch_tch_at+bsc_o_sdcch_tch_at+bsc_o_sdcch_at)
Counters from table(s):p_nbsc_ho
Figure 96. BSC outgoing HO attempts, (ho_11)
Intra-cell HO attempts, S6 (ho_12a)
sum(cell_tch_tch_at+cell_sdcch_at+cell_sdcch_tch_at)
DN98619493 © Nokia Networks Oy 73 (206)Issue 1-1 en Nokia Proprietary and Confidential

BSS Network Doctor Formulas
Counters from table(s):p_nbsc_ho
Figure 97. Intra-cell HO attempts, S2 (ho_12a)
HO attempts, S4 (ho_13)
sum(cause_up_qual+cause_up_level+cause_down_qual+cause_down_lev+cause_distance+cause_msc_invoc+cause_intfer_up+cause_intfer_dwn+cause_umbr+cause_pbdgt+cause_omc+cause_ch_adm+cause_traffic+cause_dir_retry+cause_pre_emption+cause_field_drop+cause_low_distance+cause_bad_CI+cause_good_CI)
Counters from table(s):p_nbsc_ho
Figure 98. HO attempts, , outgoing and intra-cell S4, (ho_13)
HO attempts, S3 (ho_13a)
sum(msc_i_tch_tch_at + msc_i_sdcch_tch_at+ msc_i_sdcch_at)
+ sum(msc_o_tch_tch_at + msc_o_sdcch_tch_at+ msc_o_sdcch_at)+ sum(bsc_i_tch_tch_at + bsc_i_sdcch_tch_at+ bsc_i_sdcch_at)
+ sum(bsc_o_tch_tch_at + bsc_o_sdcch_tch_at+ bsc_o_sdcch_at)+ sum(cell_tch_tch_at + cell_sdcch_tch_at+ cell_sdcch_at)
Counters from table(s):p_nbsc_ho
Figure 99. HO attempts S3, (ho_13a)
HO attempts, outgoing and intra-cell, S5 (ho_13c)
sum(cause_up_qual+cause_up_level+cause_down_qual+cause_down_lev+cause_distance+cause_msc_invoc+cause_intfer_up+cause_intfer_dwn+cause_umbr+cause_pbdgt+cause_omc+cause_dir_retry+cause_pre_emption+cause_field_drop+cause_low_distance+cause_bad_CI+cause_good_CI+ cause_ho_due_slow_mov_ms+ switch_crcr_pool;S5)
Counters from table(s):p_nbsc_ho
Figure 100. HO attempts, outgoing and intra-cell, S5, (ho_13c)
HO attempts, outgoing and intra-cell, S6 (ho_13d)
sum(cause_up_qual+cause_up_level+cause_down_qual+cause_down_lev+cause_distance+cause_msc_invoc+cause_intfer_up+cause_intfer_dwn+cause_umbr+cause_pbdgt+cause_omc+cause_dir_retry+cause_pre_emption+cause_field_drop
74 (206) © Nokia Networks Oy DN98619493Nokia Proprietary and Confidential Issue 1-1en

BSS counter formulas
+cause_low_distance+cause_bad_CI+cause_good_CI+ cause_ho_due_slow_mov_ms+ho_att_due_switch_circ_pool;S5+ ms_slow_speed + ms_high_speed; S6)
Counters from table(s):p_nbsc_ho
Figure 101. HO attempts, outgoing and intra-cell, S6, (ho_13d)
HO attempts, outgoing and intra-cell, S3, (ho_13e)
sum(msc_o_tch_tch_at + msc_o_sdcch_tch_at+ msc_o_sdcch_at)+ sum(bsc_o_tch_tch_at + bsc_o_sdcch_tch_at+ bsc_o_sdcch_at)+ sum(cell_tch_tch_at + cell_sdcch_tch_at+ cell_sdcch_at)
Counters from table(s):p_nbsc_ho
Figure 102. HO attempts , outgoing and intra-cell S3, (ho_13e)
HO attempts, outgoing and intra-cell, S9, (ho_13f)
sum(cause_up_qual+cause_up_level+cause_down_qual+cause_down_lev+cause_distance+cause_msc_invoc+cause_intfer_up+cause_intfer_dwn+cause_umbr+cause_pbdgt+cause_omc+cause_dir_retry+cause_pre_emption+cause_field_drop+cause_low_distance+cause_bad_CI+cause_good_CI+ cause_ho_due_slow_mov_ms+ho_att_due_switch_circ_pool;S5+ ms_slow_speed + ms_high_speed; S6+cause_dir_retry+ho_due_ms_high_speed+ ho_due_ms_low_speed+ho_att_due_bad_super_rx_lev+ho_att_due_good_regular_rx_lev+ho_att_due_direct_access+ho_att_due_erfd;S7+ ho_att_due_dadlb+ ho_att_due_to_bsc_contr_trho; S8+ ho_att_due_to_gprs;S9)
Counters from table(s):p_nbsc_ho
Figure 103. HO attempts , outgoing and intra-cell S9, (ho_13f)
TCH requests for HO (ho_14a)
um(tch_req-tch_call_req-tch_fast_req)
DN98619493 © Nokia Networks Oy 75 (206)Issue 1-1 en Nokia Proprietary and Confidential

BSS Network Doctor Formulas
Counters from table(s):p_nbsc_traffic
Figure 104. TCH requests for HO (ho_14a)
TCH requests for HO, (ho_14b)
Note: When you are using IUO, you can see that numbers of TCHrequests due to HO attempts increases (even tenfold).
sum(a.tch_req-a.tch_call_req-tch_fast_req)-sum(b.bsc_i_unsucc_a_int_circ_type+b.msc_controlled_in_ho +b.ho_unsucc_a_int_circ_type)
Counters from table(s):a = p_nbsc_trafficb = p_nbsc_ho
Figure 105. TCH requests for HO (ho_14b)
TCH seizures for HO (ho_15)
sum(tch_ho_seiz)
Counters from table(s):p_nbsc_traffic
Figure 106. TCH seizures for HO (ho_15)
TCH-TCH HO attempts (ho_16)
Use: On the BTS level. If used on the area level, it will result indouble counting of inter-cell HOs.
sum( msc_o_tch_tch_at + msc_i_tch_tch_at + bsc_o_tch_tch_at + bsc_i_tch_tch_at + cell_tch_tch_at)
Counters from table(s):p_nbsc_ho
Figure 107. TCH-TCH HO attempts (ho_16)
SDCCH-TCH HO attempts (ho_17)
Use: On the BTS level. If used on the area level, it will result indouble counting of inter-cell HOs.
sum( msc_o_sdcch_tch_at + msc_i_sdcch_tch_at + bsc_o_sdcch_tch_at + bsc_i_sdcch_tch_at + cell_sdcch_tch_at)
76 (206) © Nokia Networks Oy DN98619493Nokia Proprietary and Confidential Issue 1-1en
BSS counter formulas
Counters from table(s):p_nbsc_ho
Figure 108. SDCCH-TCH HO attempts (ho_17)
SDCCH-SDCCH HO attempts (ho_18)
Use: On the BTS level. If used on the area level, it will result indouble counting of inter-cell HOs.
sum( msc_o_sdcch_at + msc_i_sdcch_at + bsc_o_sdcch_at + bsc_i_sdcch_at + cell_sdcch_at)
Counters from table(s):p_nbsc_ho
Figure 109. SDCCH-SDCCH HO attempts (ho_18)
TCH-TCH HO success (ho_19)
Use: On the BTS level. If used on the area level, it will result indouble counting of inter-cell HOs.
sum( msc_o_tch_tch + msc_i_tch_tch + bsc_o_tch_tch + bsc_i_tch_tch + cell_tch_tch)
Counters from table(s):p_nbsc_ho
Figure 110. TCH-TCH HO successes (ho_19)
SDCCH-TCH HO success (ho_20)
Use: On the BTS level. If used on the area level, it will result indouble counting of inter-cell HOs.
sum( msc_o_sdcch_tch + msc_i_sdcch_tch + bsc_o_sdcch_tch + bsc_i_sdcch_tch + cell_sdcch_tch)
Counters from table(s):p_nbsc_ho
Figure 111. SDCCH-TCH HO successes (ho_20)
SDCCH-SDCCH HO success (ho_21)
Use: On the BTS level. If used on the area level, it will result indouble counting of inter-cell HOs.
sum( msc_o_sdcch + msc_i_sdcch + bsc_o_sdcch + bsc_i_sdcch + cell_sdcch)
DN98619493 © Nokia Networks Oy 77 (206)Issue 1-1 en Nokia Proprietary and Confidential

BSS Network Doctor Formulas
Counters from table(s):p_nbsc_ho
Figure 112. SDCCH-SDCCH HO successes (ho_21)
MSC controlled HO attempts (ho_22)
Use: On the BTS level. If used on the area level, it will result indouble counting of inter-cell HOs.
sum( msc_o_tch_tch_at + msc_i_tch_tch_at + msc_o_sdcch_tch_at + msc_i_sdcch_tch_at + msc_o_sdcch_sdcch_at + msc_i_sdcch_sdcch_at)
Counters from table(s):p_nbsc_ho
Figure 113. MSC controlled HO attempts (ho_22)
BSC controlled HO attempts (ho_23)
Use: On the BTS level. If used on the area level, it will result indouble counting of inter-cell HOs.
sum( bsc_o_tch_tch_at + bsc_i_tch_tch_at + bsc_o_sdcch_tch_at + bsc_i_sdcch_tch_at + bsc_o_sdcch_sdcch_at + bsc_i_sdcch_sdcch_at)
Counters from table(s):p_nbsc_ho
Figure 114. BSC controlled HO attempts (ho_23)
Intra-cell HO attempts (ho_24)
sum(cell_tch_tch_at+ cell_sdcch_tch_at+ cell_sdcch_at)
Counters from table(s):p_nbsc_ho
Figure 115. Intra-cell HO attempts (ho_24)
MSC controlled HO success (ho_25)
Use: On the BTS level. If used on the area level, it will result indouble counting of inter-cell HOs.
sum( msc_o_tch_tch + msc_i_tch_tch
78 (206) © Nokia Networks Oy DN98619493Nokia Proprietary and Confidential Issue 1-1en

BSS counter formulas
+ msc_o_sdcch_tch + msc_i_sdcch_tch + msc_o_sdcch_ + msc_i_sdcch)
Counters from table(s):p_nbsc_ho
Figure 116. MSC controlled HO successes (ho_25)
BSC controlled HO success (ho_26)
Use: On the BTS level. If used on the area level, it will result indouble counting of inter-cell HOs.
sum( bsc_o_tch_tch + bsc_i_tch_tch + bsc_o_sdcch_tch + bsc_i_sdcch_tch + bsc_o_sdcch + bsc_i_sdcch)
Counters from table(s):p_nbsc_ho
Figure 117. BSC controlled HO successes (ho_26)
Intra-cell HO success (ho_27)
sum(cell_tch_tch + cell_sdcch_tch + cell_sdcch)
Counters from table(s):p_nbsc_ho
Figure 118. Intra-cell HO successes (ho_27)
MSC incoming HO success (ho_28)
sum(msc_i_tch_tch+msc_i_sdcch_tch+msc_i_sdcch)
Counters from table(s):p_nbsc_ho
Figure 119. MSC incoming HO successes (ho_28)
MSC outgoing HO success (ho_29)
sum(msc_o_tch_tch+msc_o_sdcch_tch+msc_o_sdcch)
Counters from table(s):p_nbsc_ho
Figure 120. MSC outgoing HO successes (ho_29)
DN98619493 © Nokia Networks Oy 79 (206)Issue 1-1 en Nokia Proprietary and Confidential
BSS Network Doctor Formulas
BSC incoming HO success (ho_30)
sum(bsc_i_tch_tch+bsc_i_sdcch_tch+bsc_i_sdcch)
Counters from table(s):p_nbsc_ho
Figure 121. BSC incoming HO successes (ho_30)
BSC outgoing HO success (ho_31)
sum(bsc_o_tch_tch+bsc_o_sdcch_tch+bsc_o_sdcch)
Counters from table(s):p_nbsc_ho
Figure 122. BSC outgoing HO successes (ho_31)
Incoming HO success (ho_32)
sum(msc_i_succ_ho+bsc_i_succ_ho)
Counters from table(s):p_nbsc_ho
Figure 123. Incoming HO success (ho_32)
Outgoing HO success (ho_33)
sum(msc_o_succ_ho+ bsc_o_succ_ho)
Counters from table(s):p_nbsc_ho
Figure 124. Outgoing HO successes (ho_33)
Outgoing HO attempts (ho_34)
um(msc_o_tch_tch_at+msc_o_sdcch_tch_at+msc_o_sdcch_at +bsc_o_tch_tch_at+bsc_o_sdcch_tch_at+bsc_o_sdcch_at)
Counters from table(s):p_nbsc_ho
Figure 125. Outgoing HO attempts (ho_34)
80 (206) © Nokia Networks Oy DN98619493Nokia Proprietary and Confidential Issue 1-1en

BSS counter formulas
Incoming HO attempts (ho_35)
sum(msc_i_tch_tch_at+msc_i_sdcch_tch_at+msc_i_sdcch_at +bsc_i_tch_tch_at+bsc_i_sdcch_tch_at+bsc_i_sdcch_at)
Counters from table(s):p_nbsc_ho
Figure 126. Incoming HO attempts (ho_35)
Outgoing SDCCH-SDCCH HO attempts (ho_36)
sum(msc_o_sdcch_at+bsc_o_sdcch_at)
Counters from table(s):p_nbsc_ho
Figure 127. Outgoing SDCCH-SDCCH HO attempts (ho_36)
Incoming SDCCH-SDCCH HO attempts (ho_37)
sum(msc_i_sdcch_at+bsc_i_sdcch_at)
Counters from table(s):p_nbsc_ho
Figure 128. Incoming SDCCH-SDCCH HO attempts (ho_37)
Outgoing SDCCH-TCH HO attempts (ho_38)
sum(msc_o_sdcch_tch_at+bsc_o_sdcch_tch_at)
Counters from table(s):p_nbsc_ho
Figure 129. Outgoing SDCCH-TCH HO attempts (ho_38)
Incoming SDCCH-TCH HO attempts (ho_39)
sum(msc_i_sdcch_tch_at+bsc_i_sdcch_tch_at)
Counters from table(s):p_nbsc_ho
Figure 130. Incoming SDCCH-TCH HO attempts (ho_39)
DN98619493 © Nokia Networks Oy 81 (206)Issue 1-1 en Nokia Proprietary and Confidential

BSS Network Doctor Formulas
Outgoing TCH-TCH HO attempts (ho_40)
sum(msc_o_tch_tch_at+bsc_o_tch_tch_at)
Counters from table(s):p_nbsc_ho
Figure 131. Outgoing TCH-TCH HO attempts (ho_40)
Incoming TCH-TCH HO attempts (ho_41)
sum(msc_i_tch_tch_at+bsc_i_tch_tch_at)
Counters from table(s):p_nbsc_ho
Figure 132. Incoming TCH-TCH HO attempts (ho_41)
Outgoing SDCCH-SDCCH HO success (ho_42)
sum(msc_o_sdcch+bsc_o_sdcch)
Counters from table(s):p_nbsc_ho
Figure 133. Outgoing SDCCH-SDCCH HO success (ho_42)
Incoming SDCCH-SDCCH HO success (ho_43)
sum(msc_i_sdcch+bsc_i_sdcch)
Counters from table(s):p_nbsc_ho
Figure 134. Incoming SDCCH-SDCCH HO success (ho_43)
Outgoing SDCCH-TCH HO success (ho_44)
sum(msc_o_sdcch_tch+bsc_o_sdcch_tch)
Counters from table(s):p_nbsc_ho
Figure 135. Outgoing SDCCH-TCH HO success (ho_44)
Incoming SDCCH-TCH HO success (ho_45)
sum(msc_i_sdcchtch+bsc_i_sdcch_tch)
82 (206) © Nokia Networks Oy DN98619493Nokia Proprietary and Confidential Issue 1-1en

BSS counter formulas
Counters from table(s):p_nbsc_ho
Figure 136. Incoming SDCCH-TCH HO success (ho_45)
Outgoing TCH-TCH HO success (ho_46)
sum(msc_o_tch_tch+bsc_o_tch_tch)
Counters from table(s):p_nbsc_ho
Figure 137. Outgoing TCH-TCH HO success (ho_46)
Incoming TCH-TCH HO success (ho_47)
sum(msc_i_tch_tch+bsc_i_tch_tch)
Counters from table(s):p_nbsc_ho
Figure 138. Incoming TCH-TCH HO success (ho_47)
2.14 Handover failure % (hfr)
Total HO failure %, S1 (hfr_1)
Use: Works best on the BTS level, but is usable on both the areaand cell level.
Experiences on use: In a good network the value can be less than 3 per cent,whereas in a very bad network values higher than 15 per centmay occur. When IUO is used, this formula shows high valuesdue to highly failing intra-cell handovers between layers incongested cells.
Known problems: This formula emphasises the non-intra-cell handovers sincethey are counted twice. This causes no problem on the celllevel, whereas on the area level problems may occur.Blocking is included. Blocking makes this indicator showhigh values especially in the case of IUO, but it does notnecessarily mean that there are some problems.
HO failures100* --------------- % HO attempts
HO attempts - successful HOs= 100 * --------------------------------- % HO attempts
DN98619493 © Nokia Networks Oy 83 (206)Issue 1-1 en Nokia Proprietary and Confidential
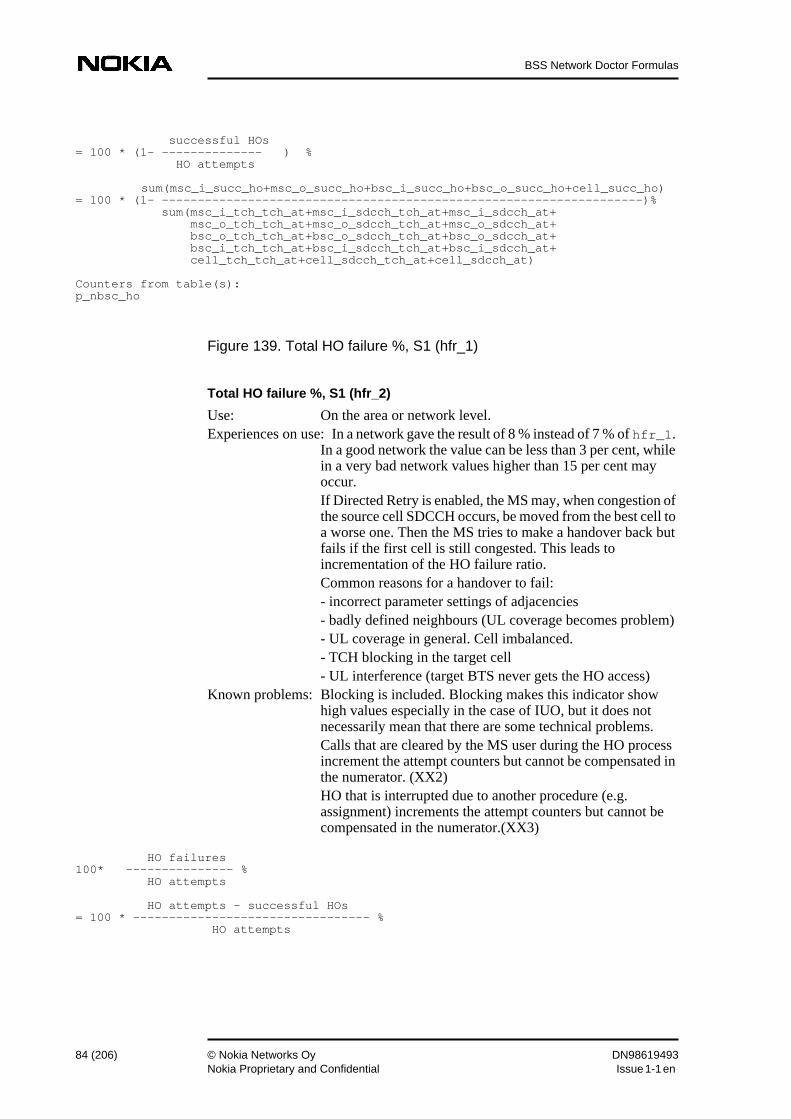
BSS Network Doctor Formulas
successful HOs= 100 * (1- -------------- ) % HO attempts
sum(msc_i_succ_ho+msc_o_succ_ho+bsc_i_succ_ho+bsc_o_succ_ho+cell_succ_ho)= 100 * (1- -------------------------------------------------------------------)% sum(msc_i_tch_tch_at+msc_i_sdcch_tch_at+msc_i_sdcch_at+ msc_o_tch_tch_at+msc_o_sdcch_tch_at+msc_o_sdcch_at+ bsc_o_tch_tch_at+bsc_o_sdcch_tch_at+bsc_o_sdcch_at+ bsc_i_tch_tch_at+bsc_i_sdcch_tch_at+bsc_i_sdcch_at+ cell_tch_tch_at+cell_sdcch_tch_at+cell_sdcch_at)
Counters from table(s):p_nbsc_ho
Figure 139. Total HO failure %, S1 (hfr_1)
Total HO failure %, S1 (hfr_2)
Use: On the area or network level.Experiences on use: In a network gave the result of 8 % instead of 7 % of hfr_1.
In a good network the value can be less than 3 per cent, whilein a very bad network values higher than 15 per cent mayoccur.If Directed Retry is enabled, the MS may, when congestion ofthe source cell SDCCH occurs, be moved from the best cell toa worse one. Then the MS tries to make a handover back butfails if the first cell is still congested. This leads toincrementation of the HO failure ratio.Common reasons for a handover to fail:- incorrect parameter settings of adjacencies- badly defined neighbours (UL coverage becomes problem)- UL coverage in general. Cell imbalanced.- TCH blocking in the target cell- UL interference (target BTS never gets the HO access)
Known problems: Blocking is included. Blocking makes this indicator showhigh values especially in the case of IUO, but it does notnecessarily mean that there are some technical problems.Calls that are cleared by the MS user during the HO processincrement the attempt counters but cannot be compensated inthe numerator. (XX2)HO that is interrupted due to another procedure (e.g.assignment) increments the attempt counters but cannot becompensated in the numerator.(XX3)
HO failures100* --------------- % HO attempts
HO attempts - successful HOs= 100 * --------------------------------- % HO attempts
84 (206) © Nokia Networks Oy DN98619493Nokia Proprietary and Confidential Issue 1-1en

BSS counter formulas
successful HOs= 100 * (1- -------------- ) % HO attempts
sum(msc_o_succ_ho + bsc_o_succ_ho + cell_succ_ho) + XX2+ XX3= 100 * (1- -------------------------------------------------------------------)% sum(msc_o_tch_tch_at+msc_o_sdcch_tch_at+msc_o_sdcch_at+ bsc_o_tch_tch_at+bsc_o_sdcch_tch_at+bsc_o_sdcch_at+ cell_tch_tch_at+cell_sdcch_tch_at+cell_sdcch_at)
Counters from table(s):p_nbsc_ho
Figure 140. Total HO failure %, S1 (hfr_2)
Intra-cell HO failure share, S1 (hfr_3a)
Use: On the BTS level. The results are equal to hfr_3c.
Intra-cell HO failures100* (--------------------------------------) % All HO attempts
sum(cell_tch_tch_at+cell_sdcch_tch_at+cell_sdcch-at) -sum(cell_succ_ho)= 100* (--------------------------------------------------------------) % sum(msc_i_tch_tch_at + msc_i_sdcch_tch_at+ msc_i_sdcch_at)
+ sum(msc_o_tch_tch_at + msc_o_sdcch_tch_at+ msc_o_sdcch_at) + sum(bsc_i_tch_tch_at + bsc_i_sdcch_tch_at+ bsc_i_sdcch_at)
+ sum(bsc_o_tch_tch_at + bsc_o_sdcch_tch_at+ bsc_o_sdcch_at) + sum(cell_tch_tch_at + cell_sdcch_tch_at + cell_sdcch_at)
Counters from table(s):p_nbsc_ho
Figure 141. Intra-cell HO failure share, S1 (hfr_3a)
Intra-cell HO failure share, S1 (hfr_3b)
Use: On the area or network level. The results are equal to hfr_3d.
Intra-cell HO failures100* (--------------------------------------) % All HO attempts
sum(cell_tch_tch_at+cell_sdcch_tch_at+cell_sdcch-at) -sum(cell_succ_ho)= 100* (--------------------------------------------------------------) % sum(msc_i_tch_tch_at + msc_i_sdcch_tch_at+ msc_i_sdcch_at)
+ sum(msc_o_tch_tch_at + msc_o_sdcch_tch_at+ msc_o_sdcch_at) + sum(bsc_i_tch_tch_at + bsc_i_sdcch_tch_at+ bsc_i_sdcch_at)
+ sum(bsc_o_tch_tch_at + bsc_o_sdcch_tch_at+ bsc_o_sdcch_at) + sum(cell_tch_tch_at + cell_sdcch_tch_at + cell_sdcch_at)
DN98619493 © Nokia Networks Oy 85 (206)Issue 1-1 en Nokia Proprietary and Confidential
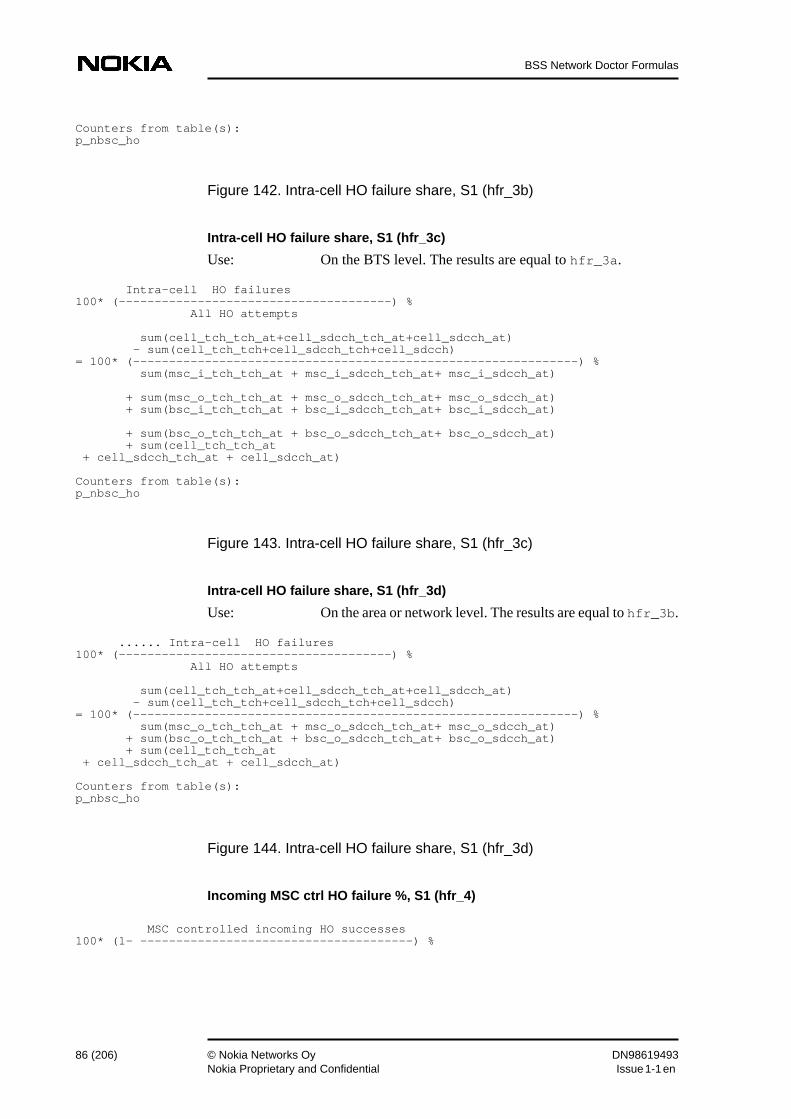
BSS Network Doctor Formulas
Counters from table(s):p_nbsc_ho
Figure 142. Intra-cell HO failure share, S1 (hfr_3b)
Intra-cell HO failure share, S1 (hfr_3c)
Use: On the BTS level. The results are equal to hfr_3a.
Intra-cell HO failures100* (--------------------------------------) % All HO attempts
sum(cell_tch_tch_at+cell_sdcch_tch_at+cell_sdcch_at) - sum(cell_tch_tch+cell_sdcch_tch+cell_sdcch)= 100* (--------------------------------------------------------------) % sum(msc_i_tch_tch_at + msc_i_sdcch_tch_at+ msc_i_sdcch_at)
+ sum(msc_o_tch_tch_at + msc_o_sdcch_tch_at+ msc_o_sdcch_at) + sum(bsc_i_tch_tch_at + bsc_i_sdcch_tch_at+ bsc_i_sdcch_at)
+ sum(bsc_o_tch_tch_at + bsc_o_sdcch_tch_at+ bsc_o_sdcch_at) + sum(cell_tch_tch_at + cell_sdcch_tch_at + cell_sdcch_at)
Counters from table(s):p_nbsc_ho
Figure 143. Intra-cell HO failure share, S1 (hfr_3c)
Intra-cell HO failure share, S1 (hfr_3d)
Use: On the area or network level. The results are equal to hfr_3b.
...... Intra-cell HO failures100* (--------------------------------------) % All HO attempts
sum(cell_tch_tch_at+cell_sdcch_tch_at+cell_sdcch_at) - sum(cell_tch_tch+cell_sdcch_tch+cell_sdcch)= 100* (--------------------------------------------------------------) % sum(msc_o_tch_tch_at + msc_o_sdcch_tch_at+ msc_o_sdcch_at) + sum(bsc_o_tch_tch_at + bsc_o_sdcch_tch_at+ bsc_o_sdcch_at) + sum(cell_tch_tch_at + cell_sdcch_tch_at + cell_sdcch_at)
Counters from table(s):p_nbsc_ho
Figure 144. Intra-cell HO failure share, S1 (hfr_3d)
Incoming MSC ctrl HO failure %, S1 (hfr_4)
MSC controlled incoming HO successes100* (1- --------------------------------------) %
86 (206) © Nokia Networks Oy DN98619493Nokia Proprietary and Confidential Issue 1-1en

BSS counter formulas
MSC controlled incoming HO attempts
sum(msc_i_tch_tch+msc_i_sdcch_tch+msc_i_sdcch)= 100* (1- --------------------------------------------------------------) % sum(msc_i_tch_tch_at+msc_i_sdcch_tch_at+msc_i_sdcch_at)
Counters from table(s):p_nbsc_ho
Figure 145. Incoming MSC ctrl HO failure %, S1 (hfr_4)
Incoming MSC ctrl HO failure share, S1 (hfr_4a)
Use: On the BTS level.
MSC controlled incoming HO failures100* (--------------------------------------) % All HO attempts
sum(msc_i_tch_tch_at+msc_i_sdcch_tch_at+msc_i_sdcch-at) -sum(msc_i_succ_ho)= 100* (--------------------------------------------------------------) % sum(msc_i_tch_tch_at + msc_i_sdcch_tch_at+ msc_i_sdcch_at)
+ sum(msc_o_tch_tch_at + msc_o_sdcch_tch_at+ msc_o_sdcch_at) + sum(bsc_i_tch_tch_at + bsc_i_sdcch_tch_at+ bsc_i_sdcch_at)
+ sum(bsc_o_tch_tch_at + bsc_o_sdcch_tch_at+ bsc_o_sdcch_at) + sum(cell_tch_tch_at + cell_sdcch_tch_at + cell_sdcch_at)
Counters from table(s):p_nbsc_ho
Figure 146. Incoming MSC ctrl HO failure share, S1 (hfr_4a)
Incoming MSC ctrl HO failure share, S1 (hfr_4b)
Use: On the area or network level. The results are equal to hfr_4d.
MSC controlled incoming HO failures100* (--------------------------------------) % All HO incoming attempts
sum(msc_i_tch_tch_at+msc_i_sdcch_tch_at+msc_i_sdcch-at) -sum(msc_i_succ_ho)= 100* (--------------------------------------------------------------) % sum(msc_i_tch_tch_at + msc_i_sdcch_tch_at+ msc_i_sdcch_at)
+ sum(bsc_i_tch_tch_at + bsc_i_sdcch_tch_at+ bsc_i_sdcch_at)
+ sum(cell_tch_tch_at + cell_sdcch_tch_at + cell_sdcch_at)
DN98619493 © Nokia Networks Oy 87 (206)Issue 1-1 en Nokia Proprietary and Confidential

BSS Network Doctor Formulas
Counters from table(s):p_nbsc_ho
Figure 147. Incoming MSC ctrl HO failure share, S1 (hfr_4b)
Incoming MSC ctrl HO failure share, S1 (hfr_4c)
Use: On the BTS level. The results are equal to hfr_4a.
MSC controlled incoming HO failures100* (--------------------------------------) % All HO attempts
sum(msc_i_tch_tch_at+msc_i_sdcch_tch_at+msc_i_sdcch_at) - sum(msc_i_tch_tch+msc_i_sdcch_tch+msc_i_sdcch)= 100* (--------------------------------------------------------------) % sum(msc_i_tch_tch_at + msc_i_sdcch_tch_at+ msc_i_sdcch_at)
+ sum(msc_o_tch_tch_at + msc_o_sdcch_tch_at+ msc_o_sdcch_at) + sum(bsc_i_tch_tch_at + bsc_i_sdcch_tch_at+ bsc_i_sdcch_at)
+ sum(bsc_o_tch_tch_at + bsc_o_sdcch_tch_at+ bsc_o_sdcch_at) + sum(cell_tch_tch_at + cell_sdcch_tch_at + cell_sdcch_at)
Counters from table(s):p_nbsc_ho
Figure 148. Incoming MSC ctrl HO failure share, S1 (hfr_4c)
Incoming MSC ctrl HO failure share, S1 (hfr_4d)
Use: On the area or network level. The results are equal to hfr_4b.
MSC controlled incoming HO failures100* (--------------------------------------) % All HO incoming attempts
sum(msc_i_tch_tch_at+msc_i_sdcch_tch_at+msc_i_sdcch_at) - sum(msc_i_tch_tch+msc_i_sdcch_tch+msc_i_sdcch)= 100* (--------------------------------------------------------------) % sum(msc_i_tch_tch_at + msc_i_sdcch_tch_at+ msc_i_sdcch_at)
+ sum(bsc_i_tch_tch_at + bsc_i_sdcch_tch_at+ bsc_i_sdcch_at)
+ sum(cell_tch_tch_at + cell_sdcch_tch_at + cell_sdcch_at)
Counters from table(s):p_nbsc_ho
Figure 149. Incoming MSC ctrl HO failure share, S1 (hfr_4d)
88 (206) © Nokia Networks Oy DN98619493Nokia Proprietary and Confidential Issue 1-1en

BSS counter formulas
Outgoing MSC ctrl HO failure share %, S1 (hfr_5a)
Use: On the BTS level. The results are equal to hfr_5c.
MSC controlled outgoing HO failures100* (--------------------------------------) % All HO attempts
sum(msc_o_tch_tch_at+msc_o_sdcch_tch_at+msc_o_sdcch-at) -sum(msc_o_succ_ho)= 100* (--------------------------------------------------------------) % sum(msc_i_tch_tch_at + msc_i_sdcch_tch_at+ msc_i_sdcch_at)
+ sum(msc_o_tch_tch_at + msc_o_sdcch_tch_at+ msc_o_sdcch_at) + sum(bsc_i_tch_tch_at + bsc_i_sdcch_tch_at+ bsc_i_sdcch_at)
+ sum(bsc_o_tch_tch_at + bsc_o_sdcch_tch_at+ bsc_o_sdcch_at) + sum(cell_tch_tch_at + cell_sdcch_tch_at + cell_sdcch_at)
Counters from table(s):p_nbsc_ho
Figure 150. Outgoing MSC ctrl HO failure share %, S1 (hfr_5a)
Outgoing MSC ctrl HO failure share %, S1 (hfr_5b)
Use: On the area or network level. The results are equal to hfr_5d.
MSC controlled outgoing HO failures100* (--------------------------------------) % All HO outgoing attempts
sum(msc_o_tch_tch_at+msc_o_sdcch_tch_at+msc_o_sdcch-at) -sum(msc_o_succ_ho)= 100* (--------------------------------------------------------------) % sum(msc_o_tch_tch_at + msc_o_sdcch_tch_at+ msc_o_sdcch_at) + sum(bsc_o_tch_tch_at + bsc_o_sdcch_tch_at+ bsc_o_sdcch_at) + sum(cell_tch_tch_at + cell_sdcch_tch_at + cell_sdcch_at)
Counters from table(s):p_nbsc_ho
Figure 151. Outgoing MSC ctrl HO failure share %, S1 (hfr_5b)
Outgoing MSC ctrl HO failure share %, S1 (hfr_5c)
Use: On the BTS level. The results are equal to hfr_5a.
MSC controlled outgoing HO failures100* (--------------------------------------) % All HO attempts
sum(msc_o_tch_tch_at+msc_o_sdcch_tch_at+msc_o_sdcch_at) - sum(msc_o_tch_tch+msc_o_sdcch_tch+msc_o_sdcch)= 100* (--------------------------------------------------------------) % sum(msc_i_tch_tch_at + msc_i_sdcch_tch_at+ msc_i_sdcch_at)
DN98619493 © Nokia Networks Oy 89 (206)Issue 1-1 en Nokia Proprietary and Confidential
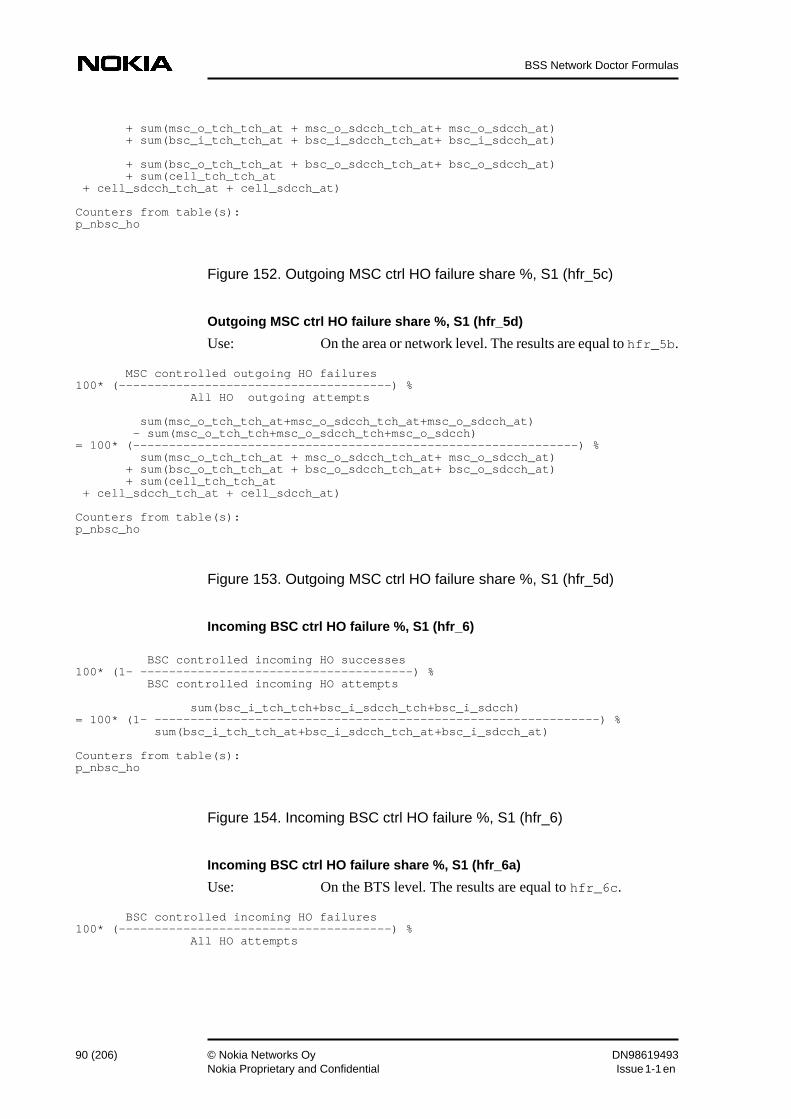
BSS Network Doctor Formulas
+ sum(msc_o_tch_tch_at + msc_o_sdcch_tch_at+ msc_o_sdcch_at) + sum(bsc_i_tch_tch_at + bsc_i_sdcch_tch_at+ bsc_i_sdcch_at)
+ sum(bsc_o_tch_tch_at + bsc_o_sdcch_tch_at+ bsc_o_sdcch_at) + sum(cell_tch_tch_at + cell_sdcch_tch_at + cell_sdcch_at)
Counters from table(s):p_nbsc_ho
Figure 152. Outgoing MSC ctrl HO failure share %, S1 (hfr_5c)
Outgoing MSC ctrl HO failure share %, S1 (hfr_5d)
Use: On the area or network level. The results are equal to hfr_5b.
MSC controlled outgoing HO failures100* (--------------------------------------) % All HO outgoing attempts
sum(msc_o_tch_tch_at+msc_o_sdcch_tch_at+msc_o_sdcch_at) - sum(msc_o_tch_tch+msc_o_sdcch_tch+msc_o_sdcch)= 100* (--------------------------------------------------------------) % sum(msc_o_tch_tch_at + msc_o_sdcch_tch_at+ msc_o_sdcch_at) + sum(bsc_o_tch_tch_at + bsc_o_sdcch_tch_at+ bsc_o_sdcch_at) + sum(cell_tch_tch_at + cell_sdcch_tch_at + cell_sdcch_at)
Counters from table(s):p_nbsc_ho
Figure 153. Outgoing MSC ctrl HO failure share %, S1 (hfr_5d)
Incoming BSC ctrl HO failure %, S1 (hfr_6)
BSC controlled incoming HO successes100* (1- --------------------------------------) % BSC controlled incoming HO attempts
sum(bsc_i_tch_tch+bsc_i_sdcch_tch+bsc_i_sdcch)= 100* (1- --------------------------------------------------------------) % sum(bsc_i_tch_tch_at+bsc_i_sdcch_tch_at+bsc_i_sdcch_at)
Counters from table(s):p_nbsc_ho
Figure 154. Incoming BSC ctrl HO failure %, S1 (hfr_6)
Incoming BSC ctrl HO failure share %, S1 (hfr_6a)
Use: On the BTS level. The results are equal to hfr_6c.
BSC controlled incoming HO failures100* (--------------------------------------) % All HO attempts
90 (206) © Nokia Networks Oy DN98619493Nokia Proprietary and Confidential Issue 1-1en

BSS counter formulas
sum(bsc_i_tch_tch_at+bsc_i_sdcch_tch_at+bsc_i_sdcch-at) -sum(bsc_i_succ_ho)= 100* (--------------------------------------------------------------) % sum(msc_i_tch_tch_at + msc_i_sdcch_tch_at+ msc_i_sdcch_at)
+ sum(msc_o_tch_tch_at + msc_o_sdcch_tch_at+ msc_o_sdcch_at) + sum(bsc_i_tch_tch_at + bsc_i_sdcch_tch_at+ bsc_i_sdcch_at)
+ sum(bsc_o_tch_tch_at + bsc_o_sdcch_tch_at+ bsc_o_sdcch_at) + sum(cell_tch_tch_at + cell_sdcch_tch_at + cell_sdcch_at)
Counters from table(s):p_nbsc_ho
Figure 155. Incoming BSC ctrl HO failure share %, S1 (hfr_6a)
Incoming BSC ctrl HO failure %, S1 (hfr_6b)
Use: On the area or network level. The results are equal to hfr_6d.
BSC controlled incoming HO failures100* (--------------------------------------) % All incoming HO attempts
sum(bsc_i_tch_tch_at+bsc_i_sdcch_tch_at+bsc_i_sdcch-at) -sum(bsc_i_succ_ho)= 100* (--------------------------------------------------------------) % sum(msc_i_tch_tch_at + msc_i_sdcch_tch_at+ msc_i_sdcch_at)
+ sum(bsc_i_tch_tch_at + bsc_i_sdcch_tch_at+ bsc_i_sdcch_at)
+ sum(cell_tch_tch_at + cell_sdcch_tch_at + cell_sdcch_at)
Counters from table(s):p_nbsc_ho
Figure 156. Incoming BSC ctrl HO failure %, S1 (hfr_6b
Incoming BSC ctrl HO failure share %, S1 (hfr_6c)
Use: On the BTS level. The results are equal to hfr_6a.
BSC controlled incoming HO failures100* (--------------------------------------) % All HO attempts
sum(bsc_i_tch_tch_at+bsc_i_sdcch_tch_at+bsc_i_sdcch_at) - sum(bsc_i_tch_tch+bsc_i_sdcch_tch+bsc_i_sdcch)= 100* (--------------------------------------------------------------) % sum(msc_i_tch_tch_at + msc_i_sdcch_tch_at+ msc_i_sdcch_at)
+ sum(msc_o_tch_tch_at + msc_o_sdcch_tch_at+ msc_o_sdcch_at) + sum(bsc_i_tch_tch_at + bsc_i_sdcch_tch_at+ bsc_i_sdcch_at)
+ sum(bsc_o_tch_tch_at + bsc_o_sdcch_tch_at+ bsc_o_sdcch_at) + sum(cell_tch_tch_at + cell_sdcch_tch_at + cell_sdcch_at)
DN98619493 © Nokia Networks Oy 91 (206)Issue 1-1 en Nokia Proprietary and Confidential
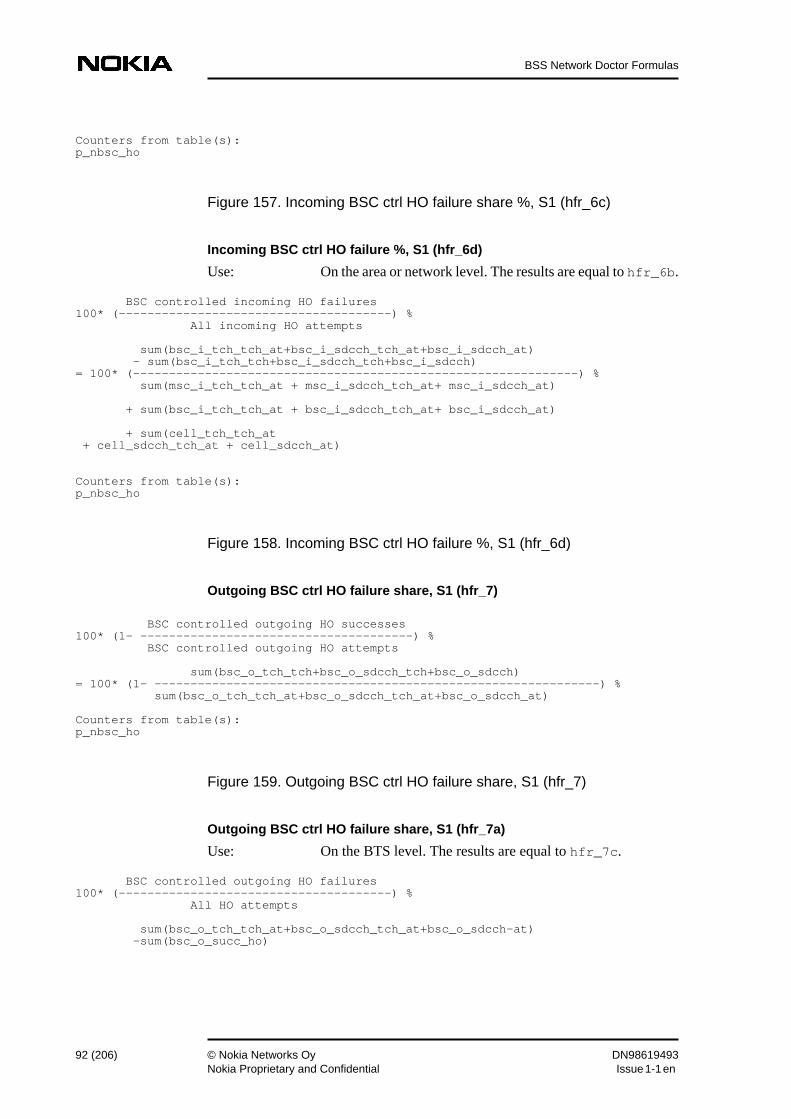
BSS Network Doctor Formulas
Counters from table(s):p_nbsc_ho
Figure 157. Incoming BSC ctrl HO failure share %, S1 (hfr_6c)
Incoming BSC ctrl HO failure %, S1 (hfr_6d)
Use: On the area or network level. The results are equal to hfr_6b.
BSC controlled incoming HO failures100* (--------------------------------------) % All incoming HO attempts
sum(bsc_i_tch_tch_at+bsc_i_sdcch_tch_at+bsc_i_sdcch_at) - sum(bsc_i_tch_tch+bsc_i_sdcch_tch+bsc_i_sdcch)= 100* (--------------------------------------------------------------) % sum(msc_i_tch_tch_at + msc_i_sdcch_tch_at+ msc_i_sdcch_at)
+ sum(bsc_i_tch_tch_at + bsc_i_sdcch_tch_at+ bsc_i_sdcch_at)
+ sum(cell_tch_tch_at + cell_sdcch_tch_at + cell_sdcch_at)
Counters from table(s):p_nbsc_ho
Figure 158. Incoming BSC ctrl HO failure %, S1 (hfr_6d)
Outgoing BSC ctrl HO failure share, S1 (hfr_7)
BSC controlled outgoing HO successes100* (1- --------------------------------------) % BSC controlled outgoing HO attempts
sum(bsc_o_tch_tch+bsc_o_sdcch_tch+bsc_o_sdcch)= 100* (1- --------------------------------------------------------------) % sum(bsc_o_tch_tch_at+bsc_o_sdcch_tch_at+bsc_o_sdcch_at)
Counters from table(s):p_nbsc_ho
Figure 159. Outgoing BSC ctrl HO failure share, S1 (hfr_7)
Outgoing BSC ctrl HO failure share, S1 (hfr_7a)
Use: On the BTS level. The results are equal to hfr_7c.
BSC controlled outgoing HO failures100* (--------------------------------------) % All HO attempts
sum(bsc_o_tch_tch_at+bsc_o_sdcch_tch_at+bsc_o_sdcch-at) -sum(bsc_o_succ_ho)
92 (206) © Nokia Networks Oy DN98619493Nokia Proprietary and Confidential Issue 1-1en

BSS counter formulas
= 100* (--------------------------------------------------------------) % sum(msc_i_tch_tch_at + msc_i_sdcch_tch_at+ msc_i_sdcch_at)
+ sum(msc_o_tch_tch_at + msc_o_sdcch_tch_at+ msc_o_sdcch_at) + sum(bsc_i_tch_tch_at + bsc_i_sdcch_tch_at+ bsc_i_sdcch_at)
+ sum(bsc_o_tch_tch_at + bsc_o_sdcch_tch_at+ bsc_o_sdcch_at) + sum(cell_tch_tch_at + cell_sdcch_tch_at + cell_sdcch_at)
Counters from table(s):p_nbsc_ho
Figure 160. Outgoing BSC ctrl HO failure share, S1 (hfr_7a)
Outgoing BSC ctrl HO failure share, S1 (hfr_7b)
Use: On the area or network level. The results are equal to hfr_7d.
BSC controlled outgoing HO failures100* (--------------------------------------) % All HO attempts
sum(bsc_o_tch_tch_at+bsc_o_sdcch_tch_at+bsc_o_sdcch-at) -sum(bsc_o_succ_ho)= 100* (--------------------------------------------------------------) %........ sum(msc_o_tch_tch_at + msc_o_sdcch_tch_at+ msc_o_sdcch_at).......+ sum(bsc_o_tch_tch_at + bsc_o_sdcch_tch_at+ bsc_o_sdcch_at) + sum(cell_tch_tch_at + cell_sdcch_tch_at + cell_sdcch_at)
Counters from table(s):p_nbsc_ho
Figure 161. Outgoing BSC ctrl HO failure share, S1 (hfr_7b)
Outgoing BSC ctrl HO failure share, S1 (hfr_7c)
Use: On the BTS level. The results are equal to hfr_7c.
BSC controlled outgoing HO failures100* (--------------------------------------) % All HO attempts
sum(bsc_o_tch_tch_at+bsc_o_sdcch_tch_at+bsc_o_sdcch_at) - sum(bsc_o_tch_tch+bsc_o_sdcch_tch+bsc_o_sdcch)= 100* (--------------------------------------------------------------) % sum(msc_i_tch_tch_at + msc_i_sdcch_tch_at+ msc_i_sdcch_at)
+ sum(msc_o_tch_tch_at + msc_o_sdcch_tch_at+ msc_o_sdcch_at) + sum(bsc_i_tch_tch_at + bsc_i_sdcch_tch_at+ bsc_i_sdcch_at)
+ sum(bsc_o_tch_tch_at + bsc_o_sdcch_tch_at+ bsc_o_sdcch_at) + sum(cell_tch_tch_at + cell_sdcch_tch_at + cell_sdcch_at)
DN98619493 © Nokia Networks Oy 93 (206)Issue 1-1 en Nokia Proprietary and Confidential

BSS Network Doctor Formulas
Counters from table(s):p_nbsc_ho
Figure 162. Outgoing BSC ctrl HO failure share, S1 (hfr_7c)
Outgoing BSC ctrl HO failure share, S1 (hfr_7d)
Use: On the area or network level. The results are equal to hfr_7d.
BSC controlled outgoing HO failures100* (--------------------------------------) % All HO attempts
sum(bsc_o_tch_tch_at+bsc_o_sdcch_tch_at+bsc_o_sdcch_at) - sum(bsc_o_tch_tch+bsc_o_sdcch_tch+bsc_o_sdcch)= 100* (--------------------------------------------------------------) %........ sum(msc_o_tch_tch_at + msc_o_sdcch_tch_at+ msc_o_sdcch_at).......+ sum(bsc_o_tch_tch_at + bsc_o_sdcch_tch_at+ bsc_o_sdcch_at) + sum(cell_tch_tch_at + cell_sdcch_tch_at + cell_sdcch_at)
Counters from table(s):p_nbsc_ho
Figure 163. Outgoing BSC ctrl HO failure share, S1 (hfr_7d)
Internal inter HO failure %, S4 (hfr_8)
sum(int_inter_ho_source_fail)100* (-----------------------------------------------) % sum(int_inter_ho_source_fail+int_inter_ho_succ)
Counters from table(s):p_nbsc_service
Figure 164. Internal inter HO failure %, S4 (hfr_8)
Internal intra HO failure %, S4 (hfr_9)
sum(int_intra_ho_source_fail)100* (-----------------------------------------------) % sum(int_intra_ho_source_fail+int_intra_ho_succ)
Counters from table(s):p_nbsc_service
Figure 165. Internal intra HO failure %, S4 (hfr_9)
94 (206) © Nokia Networks Oy DN98619493Nokia Proprietary and Confidential Issue 1-1en

BSS counter formulas
External source HO failure %, S4 (hfr_10)
sum(ext_ho_source_fail)100* (-----------------------------------------------) % sum(ext_ho_source_fail+ ext_ho_source_succ)
Counters from table(s):p_nbsc_service
Figure 166. External source HO failure %, S4 (hfr_10)
HO failure % from super to regular, S4 (hfr_12)
Use: Ratio of all other failures than ’blocked’ to all HO attemptsfrom super to regular TRX.
sum(ho_fail_to_reg_due_ret+ ho_fail_to_reg_ms_lost+ ho_fail_to_reg_freq)100* (--------------------------------------------------------------------------) % sum(ho_att_to_reg_freq)
Counters from table(s):p_nbsc_underlay
Figure 167. HO failure % from super to regular, S4 (hfr_12)
HO failure % from regular to super, S4 (hfr_13)
sum(ho_fail_from_reg_due_ret+ ho_fail_from_reg_ms_lost+ ho_fail_from_reg_freq)100* (--------------------------------------------------------------------------) % sum(ho_att_from_reg_freq)
Counters from table(s):p_nbsc_underlay
Figure 168. HO failure % from regular to super, S4 (hfr_13)
Share of HO failures from regular to super due to return, S4 (hfr_14)
sum(ho_fail_from_reg_due_ret)100* (--------------------------------------------------------------------------) %
sum(ho_fail_from_reg_due_ret+ ho_fail_from_reg_ms_lost+ ho_fail_from_reg_freq)
Counters from table(s):p_nbsc_underlay
Figure 169. Share of HO failures from regular to super due to return, S4(hfr_14)
DN98619493 © Nokia Networks Oy 95 (206)Issue 1-1 en Nokia Proprietary and Confidential

BSS Network Doctor Formulas
Share of HO failures from regular to super due to MS lost, S4 (hfr_15)
Use: Ratio of ’MS Lost’ failures to all HO attempts (blocked HOsexcluded) in HOs from regular to super TRX.
sum(ho_fail_from_reg_ms_lost)100* (--------------------------------------------------------------------------) %
sum(ho_fail_from_reg_due_ret+ ho_fail_from_reg_ms_lost+ ho_fail_from_reg_freq)
Counters from table(s):p_nbsc_underlay
Figure 170. Share of HO failures from regular to super due to MS lost, S4(hfr_15)
Share of HO failures from regular to super due to another cause, S4 (hfr_16)
Use: Ratio of any other HO failures than ’return’ and ’MS lost’ toall HO attempts (blocked HOs excluded) in HOs from regularto super TRX.
sum(ho_fail_from_reg_freq)100* (--------------------------------------------------------------------------) %
sum(ho_fail_from_reg_due_ret+ ho_fail_from_reg_ms_lost+ ho_fail_from_reg_freq)
Counters from table(s):p_nbsc_underlay
Figure 171. Share of HO failures from regular to super due to anothercause, S4 (hfr_16)
Share of HO failures from super to regular due to return, S4 (hfr_17)
Use: Ratio of ’return’ HO failures to all HO attempts (blocked HOsexcluded) in HOs from super to regular TRX.
sum(ho_fail_to_reg_due_ret)100* (--------------------------------------------------------------------------) % sum(ho_fail_to_reg_due_ret+ ho_fail_to_reg_ms_lost+ ho_fail_to_reg_freq)
Counters from table(s):p_nbsc_underlay
Figure 172. Share of HO failures from super to regular due to return, S4(hfr_17)
Share of HO failures from super to regular due to MS lost, S4 (hfr_18)
Use: Ratio of ’MS lost’ HO failures to all HO attempts (blockedHOs excluded) in HOs from super to regular TRX.
sum(ho_fail_to_reg_ms_lost)
96 (206) © Nokia Networks Oy DN98619493Nokia Proprietary and Confidential Issue 1-1en

BSS counter formulas
100* (--------------------------------------------------------------------------) % sum(ho_fail_to_reg_due_ret+ ho_fail_to_reg_ms_lost+ ho_fail_to_reg_freq)
Counters from table(s):p_nbsc_underlay
Figure 173. Share of HO failures from super to regular due to MS lost, S4(hfr_18)
Share of HO failures from super to regular due to another cause, S4 (hfr_19)
Experiences on use: Includes HO failures due to any other reason than ’return’and ’MS lost’.
Use: Ratio of ’Other cause’ HO failures to all HO attempts(blocked HOs excluded) in HOs from super to regular TRX.
sum(ho_fail_to_reg_freq)100* (--------------------------------------------------------------------------) % sum(ho_fail_to_reg_due_ret+ ho_fail_to_reg_ms_lost+ ho_fail_to_reg_freq)
Counters from table(s):p_nbsc_underlay
Figure 174. Share of HO failures from super to regular due to anothercause, S4 (hfr_19)
SDCCH-SDCCH HO failure %, S2 (hfr_20)
Experiences on use: It is better to look at MSC and BSC controlled handoverseparately.
sum(msc_i_sdcch+ msc_o_sdcch + bsc_i_sdcch+ bsc_o_sdcch + cell_sdcch) - sum(msc_i_sdcch_at + msc_o_sdcch_at + bsc_i_sdcch_at + bsc_o_sdcch_at
+ cell_sdcch_at)100* (----------------------------------------------) % sum(msc_i_sdcch_at + msc_o_sdcch_at + bsc_i_sdcch_at + bsc_o_sdcch_at
+ cell_sdcch_at)
Counters from table(s):p_nbsc_ho
Figure 175. SDCCH-SDCCH HO failure %, S2 (hfr_20)
SDCCH-TCH HO failure %, S2 (hfr_21)
Use: These are Directed Retry.
DN98619493 © Nokia Networks Oy 97 (206)Issue 1-1 en Nokia Proprietary and Confidential
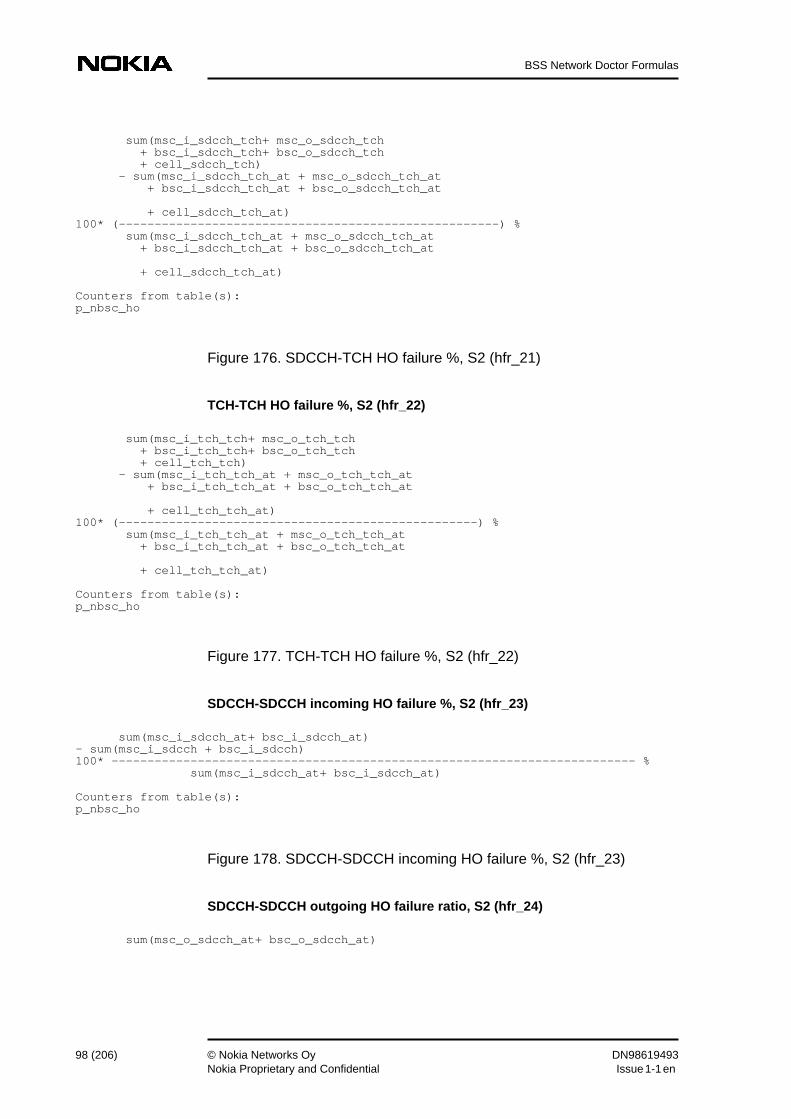
BSS Network Doctor Formulas
sum(msc_i_sdcch_tch+ msc_o_sdcch_tch + bsc_i_sdcch_tch+ bsc_o_sdcch_tch + cell_sdcch_tch) - sum(msc_i_sdcch_tch_at + msc_o_sdcch_tch_at + bsc_i_sdcch_tch_at + bsc_o_sdcch_tch_at
+ cell_sdcch_tch_at)100* (-----------------------------------------------------) % sum(msc_i_sdcch_tch_at + msc_o_sdcch_tch_at + bsc_i_sdcch_tch_at + bsc_o_sdcch_tch_at
+ cell_sdcch_tch_at)
Counters from table(s):p_nbsc_ho
Figure 176. SDCCH-TCH HO failure %, S2 (hfr_21)
TCH-TCH HO failure %, S2 (hfr_22)
sum(msc_i_tch_tch+ msc_o_tch_tch + bsc_i_tch_tch+ bsc_o_tch_tch + cell_tch_tch) - sum(msc_i_tch_tch_at + msc_o_tch_tch_at + bsc_i_tch_tch_at + bsc_o_tch_tch_at
+ cell_tch_tch_at)100* (--------------------------------------------------) % sum(msc_i_tch_tch_at + msc_o_tch_tch_at + bsc_i_tch_tch_at + bsc_o_tch_tch_at
+ cell_tch_tch_at)
Counters from table(s):p_nbsc_ho
Figure 177. TCH-TCH HO failure %, S2 (hfr_22)
SDCCH-SDCCH incoming HO failure %, S2 (hfr_23)
sum(msc_i_sdcch_at+ bsc_i_sdcch_at)- sum(msc_i_sdcch + bsc_i_sdcch)100* ------------------------------------------------------------------------- % sum(msc_i_sdcch_at+ bsc_i_sdcch_at)
Counters from table(s):p_nbsc_ho
Figure 178. SDCCH-SDCCH incoming HO failure %, S2 (hfr_23)
SDCCH-SDCCH outgoing HO failure ratio, S2 (hfr_24)
sum(msc_o_sdcch_at+ bsc_o_sdcch_at)
98 (206) © Nokia Networks Oy DN98619493Nokia Proprietary and Confidential Issue 1-1en
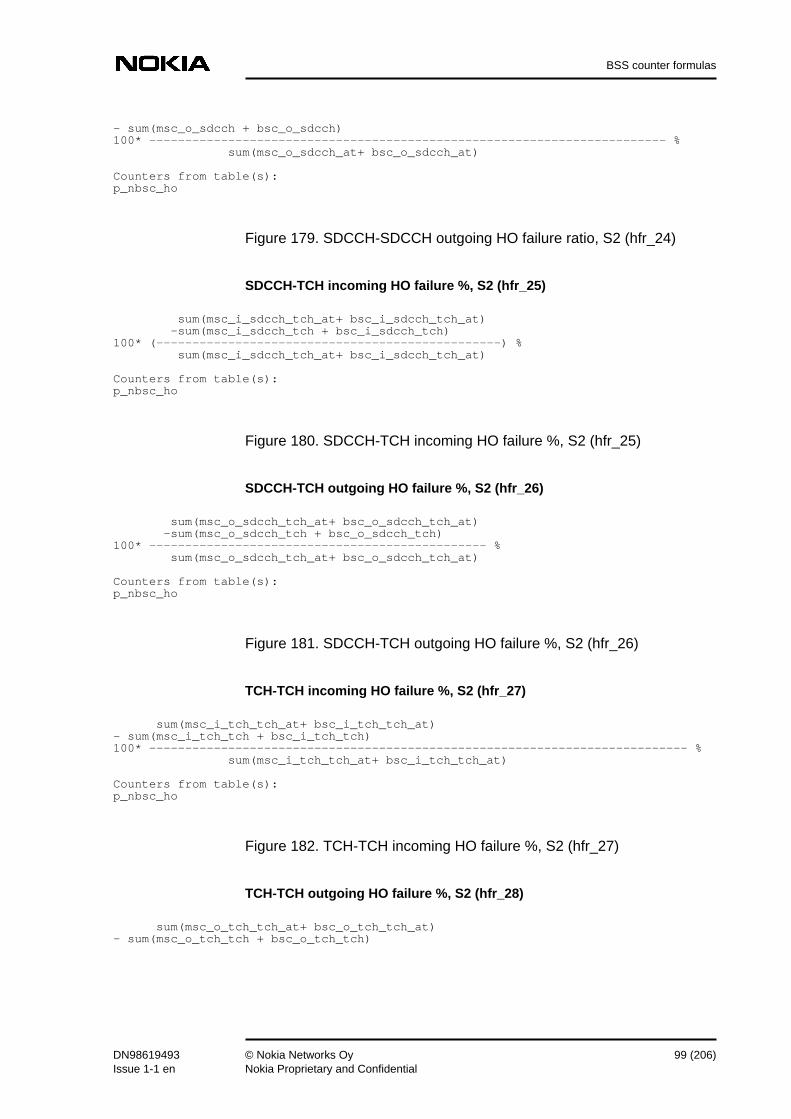
BSS counter formulas
- sum(msc_o_sdcch + bsc_o_sdcch)100* ------------------------------------------------------------------------ % sum(msc_o_sdcch_at+ bsc_o_sdcch_at)
Counters from table(s):p_nbsc_ho
Figure 179. SDCCH-SDCCH outgoing HO failure ratio, S2 (hfr_24)
SDCCH-TCH incoming HO failure %, S2 (hfr_25)
sum(msc_i_sdcch_tch_at+ bsc_i_sdcch_tch_at) -sum(msc_i_sdcch_tch + bsc_i_sdcch_tch)100* (------------------------------------------------) % sum(msc_i_sdcch_tch_at+ bsc_i_sdcch_tch_at)
Counters from table(s):p_nbsc_ho
Figure 180. SDCCH-TCH incoming HO failure %, S2 (hfr_25)
SDCCH-TCH outgoing HO failure %, S2 (hfr_26)
sum(msc_o_sdcch_tch_at+ bsc_o_sdcch_tch_at) -sum(msc_o_sdcch_tch + bsc_o_sdcch_tch)100* ----------------------------------------------- % sum(msc_o_sdcch_tch_at+ bsc_o_sdcch_tch_at)
Counters from table(s):p_nbsc_ho
Figure 181. SDCCH-TCH outgoing HO failure %, S2 (hfr_26)
TCH-TCH incoming HO failure %, S2 (hfr_27)
sum(msc_i_tch_tch_at+ bsc_i_tch_tch_at)- sum(msc_i_tch_tch + bsc_i_tch_tch)100* --------------------------------------------------------------------------- % sum(msc_i_tch_tch_at+ bsc_i_tch_tch_at)
Counters from table(s):p_nbsc_ho
Figure 182. TCH-TCH incoming HO failure %, S2 (hfr_27)
TCH-TCH outgoing HO failure %, S2 (hfr_28)
sum(msc_o_tch_tch_at+ bsc_o_tch_tch_at)- sum(msc_o_tch_tch + bsc_o_tch_tch)
DN98619493 © Nokia Networks Oy 99 (206)Issue 1-1 en Nokia Proprietary and Confidential

BSS Network Doctor Formulas
100* ---------------------------------------------------------------------------- % sum(msc_o_tch_tch_at+ bsc_o_tch_tch_at)
Counters from table(s):p_nbsc_ho
Figure 183. TCH-TCH outgoing HO failure %, S2 (hfr_28)
MSC ctrl HO failure %, blocking (hfr_29)
msc_o_fail_lack100* ------------------------------------------------------ % msc_o_sdcch_at + msc_o_sdcch_tch_at + msc_o_tch_tch_at
Counters from table(s):p_nbsc_ho
Figure 184. MSC ctrl HO failure %, blocking (hfr_29)
MSC ctrl HO failure %, not allowed (hfr_30)
msc_o_not_allwd100* ------------------------------------------------------ % msc_o_sdcch_at + msc_o_sdcch_tch_at + msc_o_tch_tch_at
Counters from table(s):p_nbsc_ho
Figure 185. MSC ctrl HO failure %, not allowed (hfr_30)
MSC ctrl HO failure %, return to old (hfr_31)
msc_o_fail_ret100* ------------------------------------------------------ % msc_o_sdcch_at + msc_o_sdcch_tch_at + msc_o_tch_tch_at
Counters from table(s):p_nbsc_ho
Figure 186. MSC ctrl HO failure %, return to old (hfr_31)
MSC ctrl HO failure %, call clear (hfr_32)
msc_o_call_clr100* ------------------------------------------------------ % msc_o_sdcch_at + msc_o_sdcch_tch_at + msc_o_tch_tch_at
100 (206) © Nokia Networks Oy DN98619493Nokia Proprietary and Confidential Issue 1-1en

BSS counter formulas
Counters from table(s):p_nbsc_ho
Figure 187. MSC ctrl HO failure %, call clear (hfr_32)
MSC ctrl HO failure %, end HO (hfr_33)
msc_o_end_of_ho100* ------------------------------------------------------ % msc_o_sdcch_at + msc_o_sdcch_tch_at + msc_o_tch_tch_at
Counters from table(s):p_nbsc_ho
Figure 188. MSC ctrl HO failure %, end HO (hfr_33)
MSC ctrl HO failure %, end HO BSS (hfr_34)
msc_o_end_ho_bss100* ------------------------------------------------------ % msc_o_sdcch_at + msc_o_sdcch_tch_at + msc_o_tch_tch_at
Counters from table(s):p_nbsc_ho
Figure 189. MSC ctrl HO failure %, end HO BSS (hfr_34)
MSC ctrl HO failure %, wrong A interface (hfr_35)
Use: Relates to congestion of A interface pool resources detectedby BSC.
msc_controlled_out_ho100* ------------------------------------------------------ % msc_o_sdcch_at + msc_o_sdcch_tch_at + msc_o_tch_tch_at
Counters from table(s):p_nbsc_ho
Figure 190. MSC ctrl HO failure %, wrong A interface (hfr_35)
MSC ctrl HO failure %, adjacent cell error (hfr_36)
msc_o_adj_cell_id_err_c100* ------------------------------------------------------ % msc_o_sdcch_at + msc_o_sdcch_tch_at + msc_o_tch_tch_at
DN98619493 © Nokia Networks Oy 101 (206)Issue 1-1 en Nokia Proprietary and Confidential

BSS Network Doctor Formulas
Counters from table(s):p_nbsc_ho
Figure 191. MSC ctrl HO failure %, adjacent cell error (hfr_36)
BSC ctrl HO failure %, blocking (hfr_37)
bsc_o_fail_lack100* ------------------------------------------------------ % bsc_o_sdcch_at + bsc_o_sdcch_tch_at + bsc_o_tch_tch_at
Counters from table(s):p_nbsc_ho
Figure 192. BSC ctrl HO failure %, blocking (hfr_37)
BSC ctrl HO failure %, not allowed (hfr_38)
bsc_o_not_allwd100* ------------------------------------------------------ % bsc_o_sdcch_at + bsc_o_sdcch_tch_at + bsc_o_tch_tch_at
Counters from table(s):p_nbsc_ho
Figure 193. BSC ctrl HO failure %, not allowed (hfr_38)
BSC ctrl HO failure %, return to old (hfr_39)
bsc_o_fail_ret100* ------------------------------------------------------ % bsc_o_sdcch_at + bsc_o_sdcch_tch_at + bsc_o_tch_tch_at
Counters from table(s):p_nbsc_ho
Figure 194. BSC ctrl HO failure %, return to old (hfr_39)
BSC ctrl HO failure %, call clear (hfr_40)
bsc_o_call_clr100* ------------------------------------------------------ % bsc_o_sdcch_at + bsc_o_sdcch_tch_at + bsc_o_tch_tch_at
102 (206) © Nokia Networks Oy DN98619493Nokia Proprietary and Confidential Issue 1-1en

BSS counter formulas
Counters from table(s):p_nbsc_ho
Figure 195. BSC ctrl HO failure %, call clear (hfr_40)
BSC ctrl HO failure %, end HO (hfr_41)
bsc_o_end_of_ho100* ------------------------------------------------------ % bsc_o_sdcch_at + bsc_o_sdcch_tch_at + bsc_o_tch_tch_at
Counters from table(s):p_nbsc_ho
Figure 196. BSC ctrl HO failure %, end HO (hfr_41)
BSC ctrl HO failure %, end HO BSS (hfr_42)
bsc_o_end_ho_bss100* ------------------------------------------------------ % bsc_o_sdcch_at + bsc_o_sdcch_tch_at + bsc_o_tch_tch_at
Counters from table(s):p_nbsc_ho
Figure 197. BSC ctrl HO failure %, end HO BSS (hfr_42)
BSC ctrl HO failure %, wrong A interface (hfr_43)
Use: Relates to congestion of A interface pool resources detectedby BSC.
bsc_o_unsucc_a_int_circ_type100* ------------------------------------------------------ % bsc_o_sdcch_at + bsc_o_sdcch_tch_at + bsc_o_tch_tch_at
Counters from table(s):p_nbsc_ho
Figure 198. BSC ctrl HO failure %, wrong A interface (hfr_43)
BSC ctrl HO drop call %, (hfr_44)
bsc_o_drop_calls100* ------------------------------------------------------ % bsc_o_sdcch_at + bsc_o_sdcch_tch_at + bsc_o_tch_tch_at
DN98619493 © Nokia Networks Oy 103 (206)Issue 1-1 en Nokia Proprietary and Confidential

BSS Network Doctor Formulas
Counters from table(s):p_nbsc_ho
Figure 199. BSC ctrl HO drop call %, (hfr_44)
Intra-cell HO failure %, cell_fail_lack (hfr_45)
cell_fail_lack100* --------------------------------------------------- % cell_sdcch_at + cell_sdcch_tch_at + cell_tch_tch_at
Counters from table(s):p_nbsc_ho
Figure 200. Intra-cell HO failure %, cell_fail_lack (hfr_45)
Intra-cell HO failure %, not allowed (hfr_46)
cell_not_allwd100* --------------------------------------------------- % cell_sdcch_at + cell_sdcch_tch_at + cell_tch_tch_at
Counters from table(s):p_nbsc_ho
Figure 201. Intra-cell HO failure %, not allowed (hfr_46)
Intra-cell HO failure %, return to old (hfr_47)
cell_fail_ret100* --------------------------------------------------- % cell_sdcch_at + cell_sdcch_tch_at + cell_tch_tch_at
Counters from table(s):p_nbsc_ho
Figure 202. Intra-cell HO failure %, return to old (hfr_47)
Intra-cell HO failure %, call clear (hfr_48)
cell_call_clr100* --------------------------------------------------- % cell_sdcch_at + cell_sdcch_tch_at + cell_tch_tch_at
104 (206) © Nokia Networks Oy DN98619493Nokia Proprietary and Confidential Issue 1-1en

BSS counter formulas
Counters from table(s):p_nbsc_ho
Figure 203. Intra-cell HO failure %, call clear (hfr_48)
Intra-cell HO failure %, MS lost (hfr_49)
cell_fail_move100* --------------------------------------------------- % cell_sdcch_at + cell_sdcch_tch_at + cell_tch_tch_at
Counters from table(s):p_nbsc_ho
Figure 204. Intra-cell HO failure %, MS lost (hfr_49)
Intra-cell HO failure %, BSS problem (hfr_50)
cell_fail_bss100* --------------------------------------------------- % cell_sdcch_at + cell_sdcch_tch_at + cell_tch_tch_at
Counters from table(s):p_nbsc_ho
Figure 205. Intra-cell HO failure %, BSS problem (hfr_50)
Intra-cell HO failure %, drop call (hfr_51)
cell_drop_calls100* --------------------------------------------------- % cell_sdcch_at + cell_sdcch_tch_at + cell_tch_tch_at
Counters from table(s):p_nbsc_ho
Figure 206. Intra-cell HO failure %, drop call (hfr_51)
HO failure % to adjacent cell (hfr_52)
sum(ho_att_to_adj - ho_succ_to_adj)100* ----------------------------------- % sum(ho_att_to_adj)
DN98619493 © Nokia Networks Oy 105 (206)Issue 1-1 en Nokia Proprietary and Confidential

BSS Network Doctor Formulas
Counters from table(s):p _nbsc_ho_adj
Figure 207. HO failure % to adjacent cell (hfr_52)
HO failure % from adjacent cell (hfr_53)
sum(ho_att_from_adj - ho_succ_from_adj)100* --------------------------------------- % sum(ho_att_from_adj)
Counters from table(s):p _nbsc_ho_adj
Figure 208. HO failure % from adjacent cell (hfr_53)
HO failure %, blocking excluded (hfr_54a)
Use: On the area level.
/* all HO attempts */ sum(msc_o_tch_tch_at+msc_o_sdcch_tch_at+msc_o_sdcch_at +bsc_o_tch_tch_at+bsc_o_sdcch_tch_at+bsc_o_sdcch_at +cell_tch_tch_at+cell_sdcch_tch_at+cell_sdcch_at)
/*successful handovers */ -sum(msc_o_succ_ho +bsc_o_succ_ho+cell_succ_ho)
/* handovers failing due to blocking */ -sum(msc_o_fail_lack+bsc_o_fail_lack+cell_fail_lack)
100 * ------------------------------------------------------ % /* all HO attempts */ sum(msc_o_tch_tch_at+msc_o_sdcch_tch_at+msc_o_sdcch_at +bsc_o_tch_tch_at+bsc_o_sdcch_tch_at+bsc_o_sdcch_at +cell_tch_tch_at+cell_sdcch_tch_at+cell_sdcch_at)
Counters from table(s):p_nbsc_ho
Figure 209. HO failure %, blocking excluded (hfr_54a)
HO failure % due to radio interface blocking (hfr_55)
Use: On the area level.
/* handovers failing due to blocking */ sum(msc_o_fail_lack+bsc_o_fail_lack+cell_fail_lack)
100 * ------------------------------------------------------ % /* all HO attempts */ sum(msc_o_tch_tch_at+msc_o_sdcch_tch_at+msc_o_sdcch_at +bsc_o_tch_tch_at+bsc_o_sdcch_tch_at+bsc_o_sdcch_at +cell_tch_tch_at+cell_sdcch_tch_at+cell_sdcch_at)
106 (206) © Nokia Networks Oy DN98619493Nokia Proprietary and Confidential Issue 1-1en

BSS counter formulas
Counters from table(s):p_nbsc_ho
Figure 210. HO failure % due to radio interface blocking (hfr_55)
Intra-cell HO failure %, wrong A interface (hfr_56)
Use: Relates to congestion of A interface pool resources detectedby BSC.
100* sum(ho_unsucc_a_int_circ_type)/(cell_sdcch_at+cell_sdcch_tch_at+cell_tch_tch_at)
Counters from table(s):p_nbsc_ho
Figure 211. Intra-cell HO failure %, wrong A interface (hfr_56)
Intra-cell HO failure % (hfr_57)
Intra-cell HO successes100* (1- -------------------------) % Intra-cell HO attempts
sum(cell_tch_tch + cell_sdcch_tch+ cell_sdcch)= 100* (1- ---------------------------------------------------------------) % sum(cell_tch_tch_at + cell_sdcch_tch_at + cell_sdcch_at)
Counters from table(s):p_nbsc_ho
Figure 212. Intra-cell HO failure % (hfr_57)
HO failures to target cell, S6 (hfr_58)
Use: On the adjacency level. Gives failure % of the real(unblocked) HO attempts.
Known problems: Not accurate because of:1. Calls that are cleared by MS user during the HO
process. The ho_att_to_adj counter is incrementedand cannot be compensated in the numerator.
2. HO that is interrupted due to other procedure (e.g.assignment) increments attempt counters but cannot becompensated in the numerator.
sum(ho_att_to_adj-ho_succ_to_adj-ho_fail_res_to_adj)100* -------------------------------------------------------- % sum(ho_att_to_adj- ho_fail_res_to_adj)
DN98619493 © Nokia Networks Oy 107 (206)Issue 1-1 en Nokia Proprietary and Confidential
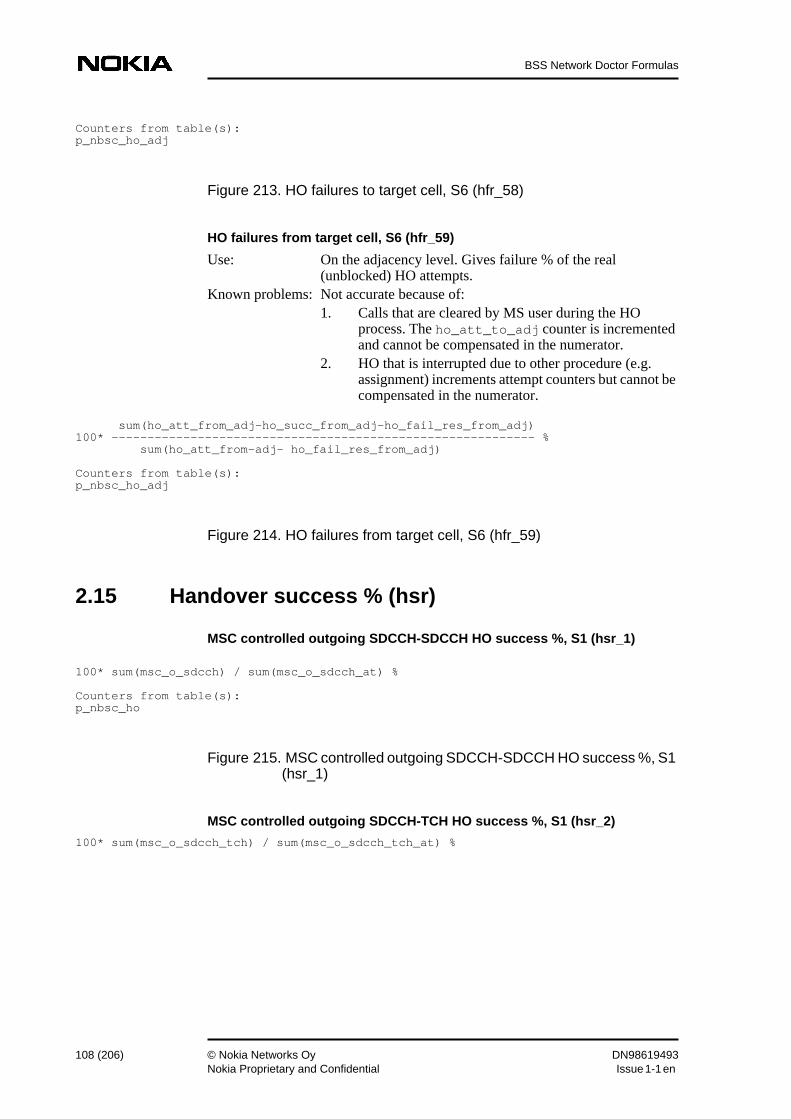
BSS Network Doctor Formulas
Counters from table(s):p_nbsc_ho_adj
Figure 213. HO failures to target cell, S6 (hfr_58)
HO failures from target cell, S6 (hfr_59)
Use: On the adjacency level. Gives failure % of the real(unblocked) HO attempts.
Known problems: Not accurate because of:1. Calls that are cleared by MS user during the HO
process. The ho_att_to_adj counter is incrementedand cannot be compensated in the numerator.
2. HO that is interrupted due to other procedure (e.g.assignment) increments attempt counters but cannot becompensated in the numerator.
sum(ho_att_from_adj-ho_succ_from_adj-ho_fail_res_from_adj)100* ----------------------------------------------------------- % sum(ho_att_from-adj- ho_fail_res_from_adj)
Counters from table(s):p_nbsc_ho_adj
Figure 214. HO failures from target cell, S6 (hfr_59)
2.15 Handover success % (hsr)
MSC controlled outgoing SDCCH-SDCCH HO success %, S1 (hsr_1)
100* sum(msc_o_sdcch) / sum(msc_o_sdcch_at) %
Counters from table(s):p_nbsc_ho
Figure 215. MSC controlled outgoing SDCCH-SDCCH HO success %, S1(hsr_1)
MSC controlled outgoing SDCCH-TCH HO success %, S1 (hsr_2)
100* sum(msc_o_sdcch_tch) / sum(msc_o_sdcch_tch_at) %
108 (206) © Nokia Networks Oy DN98619493Nokia Proprietary and Confidential Issue 1-1en

BSS counter formulas
Counters from table(s):p_nbsc_ho
Figure 216. MSC controlled outgoing SDCCH-TCH HO success %, S1(hsr_2)
MSC controlled outgoing TCH-TCH HO success %, S1 (hsr_3)
100* sum(msc_o_tch_tch) / sum(msc_o_tch_tch_at) %
Counters from table(s):p_nbsc_ho
Figure 217. MSC controlled outgoing TCH-TCH HO success %, S1(hsr_3)
BSC controlled outgoing SDCCH-SDCCH HO success %, S1 (hsr_4)
100* sum(bsc_o_sdcch) / sum(bsc_o_sdcch_at) %
Counters from table(s):p_nbsc_ho
Figure 218. BSC controlled outgoing SDCCH-SDCCH HO success %, S1(hsr_4)
BSC controlled outgoing SDCCH-TCH HO success %, S1 (hsr_5)
100* sum(bsc_o_sdcch_tch) / sum(bsc_o_sdcch_tch_at) %
Counters from table(s):p_nbsc_ho
Figure 219. BSC controlled outgoing SDCCH-TCH HO success %, S1(hsr_5)
BSC controlled outgoing TCH-TCH HO success %, S1 (hsr_6)
100* sum(bsc_o_tch_tch) / sum(bsc_o_tch_tch_at) %
Counters from table(s):p_nbsc_ho
Figure 220. BSC controlled outgoing TCH-TCH HO success %, S1(hsr_6)
DN98619493 © Nokia Networks Oy 109 (206)Issue 1-1 en Nokia Proprietary and Confidential

BSS Network Doctor Formulas
Intra-cell SDCCH-SDCCH HO success %, S1 (hsr_7)
100* sum(cell_o_sdcch) / sum(cell_o_sdcch_at) %
Counters from table(s):p_nbsc_ho
Figure 221. Intra-cell SDCCH-SDCCH HO success %, S1 (hsr_7)
Intra-cell SDCCH-TCH HO success %, S1 (hsr_8)
100* sum(cell_o_sdcch_tch) / sum(cell_o_sdcch_tch_at) %
Counters from table(s):p_nbsc_ho
Figure 222. Intra-cell SDCCH-TCH HO success %, S1 (hsr_8)
Intra-cell TCH-TCH HO success %, S1 (hsr_9)
100* sum(cell_o_tch_tch) / sum(cell_o_tch_tch_at) %
Counters from table(s):p_nbsc_ho
Figure 223. Intra-cell TCH-TCH HO success %, S1 (hsr_9)
MSC controlled incoming SDCCH-SDCCH HO success %, S1 (hsr_10)
100* sum(msc_i_sdcch) / sum(msc_i_sdcch_at) %
Counters from table(s):p_nbsc_ho
Figure 224. MSC controlled incoming SDCCH-SDCCH HO success %,S1 (hsr_10)
MSC controlled incoming SDCCH-TCH HO success %, S1 (hsr_11)
100* sum(msc_i_sdcch_tch) / sum(msc_i_sdcch_tch_at) %
Counters from table(s):p_nbsc_ho
Figure 225. MSC controlled incoming SDCCH-TCH HO success %, S1(hsr_11)
110 (206) © Nokia Networks Oy DN98619493Nokia Proprietary and Confidential Issue 1-1en

BSS counter formulas
MSC controlled incoming TCH-TCH HO success %, S1 (hsr_12)
100* sum(msc_i_tch_tch) / sum(msc_i_tch_tch_at) %
Counters from table(s):p_nbsc_ho
Figure 226. MSC controlled incoming TCH-TCH HO success %, S1(hsr_12)
BSC controlled incoming SDCCH-SDCCH HO success %, S1 (hsr_13)
100* sum(bsc_i_sdcch) / sum(bsc_i_sdcch_at) %
Counters from table(s):p_nbsc_ho
Figure 227. BSC controlled incoming SDCCH-SDCCH HO success %, S1(hsr_13)
BSC controlled incoming SDCCH-TCH HO success %, S1 (hsr_14)
100* sum(bsc_i_sdcch_tch) / sum(bsc_i_sdcch_tch_at) %
Counters from table(s):p_nbsc_ho
Figure 228. BSC controlled incoming SDCCH-TCH HO success %, S1(hsr_14)
BSC controlled incoming TCH-TCH HO success %, S1 (hsr_15)
100* sum(bsc_i_tch_tch) / sum(bsc_i_tch_tch_at) %
Counters from table(s):p_nbsc_ho
Figure 229. BSC controlled incoming TCH-TCH HO success %, S1(hsr_15)
BSC controlled incoming HO success %, S1 (hsr_16)
100* sum(bsc_i_succ_ho) /sum(bsc_i_sdcch_at + bsc_i_sdcch_tch_at + bsc_i_tch_tch_at) %
Counters from table(s):p_nbsc_ho
Figure 230. BSC controlled incoming HO success %, S1 (hsr_16)
DN98619493 © Nokia Networks Oy 111 (206)Issue 1-1 en Nokia Proprietary and Confidential

BSS Network Doctor Formulas
MSC controlled incoming HO success %, S1 (hsr_17)
100* sum(bsc_i_succ_ho) /sum(bsc_i_sdcch_at + bsc_i_sdcch_tch_at + bsc_i_tch_tch_at) %
Counters from table(s):p_nbsc_ho
Figure 231. MSC controlled incoming HO success %, S1 (hsr_17)
Incoming HO success %, S1 (hsr_18)
100* sum(msc_i_tch_tch+bsc_i_tch_tch) /sum(msc_i_tch_tch_at +bsc_i_tch_tch_at) %
Counters from table(s):p_nbsc_ho
Figure 232. Incoming HO success %, S1 (hsr_18)
Outgoing HO success %, S1 (hsr_19)
100* sum(msc_o_tch_tch+bsc_o_tch_tch) /sum(msc_o_tch_tch_at +bsc_o_tch_tch_at) %
Counters from table(s):p_nbsc_ho
Figure 233. Outgoing HO success %, S1 (hsr_19)
Intra-cell SDCCH-SDCCH HO success %, S1 (hsr_20)
sum(cell_sdcch)100* ------------------ % sum(cell_sdcch_at)
Counters from table(s):p_nbsc_ho
Figure 234. Intra-cell SDCCH-SDCCH HO success %, S1 (hsr_20)
Intra-cell SDCCH-TCH HO success %, S1 (hsr_21)
sum(cell_sdcch_tch)100* --------------------- % sum(cell_sdcch_tch_at)
112 (206) © Nokia Networks Oy DN98619493Nokia Proprietary and Confidential Issue 1-1en

BSS counter formulas
Counters from table(s):p_nbsc_ho
Figure 235. Intra-cell SDCCH-TCH HO success %, S1 (hsr_21)
Intra-cell TCH-TCH HO success %, S1 (hsr_22)
sum(cell_tch_tch)100* --------------------- % sum(cell_tch_tch_at)
Counters from table(s):p_nbsc_ho
Figure 236. Intra-cell TCH-TCH HO success %, S1 (hsr_22)
2.16 Handover failures (hof)
Outgoing HO failures due to lack of resources (hof_1)
sum(BSC_o_fail_lack+MSC_o_fail_lack)
Counters from table(s):p_nbsc_ho
Figure 237. Outgoing HO failures due to lack of resources (hof_1)
Incoming HO failures due to lack of resources (hof_2)
sum(BSC_i_fail_lack+MSC_i_fail_lack)
Counters from table(s):p_nbsc_ho
Figure 238. Incoming HO failures due to lack of resources (hof_2)
TCH HO failures when return to old channel was successful (hof_3)
Known problems: Due to the mapping of different causes the accuracy may below.
HOs failed in going to newchannel - HOs failed to return to old channel
= sum(tch_rf_new_ho + tch_abis_fail_new + tch_a_if_fail_new + tch_tr_fail_new)- sum(tch_rf_old_ho + tch_abis_fail_old + tch_a_if_fail_old + tch_tr_fail_old)
DN98619493 © Nokia Networks Oy 113 (206)Issue 1-1 en Nokia Proprietary and Confidential

BSS Network Doctor Formulas
Counters from table(s):p_nbsc_traffic
Figure 239. TCH HO failures when return to old channel was successful(hof_3)
SDCCH HO failures when return to old channel was successful (hof_4)
Known problems: Due to the mapping of different causes the accuracy may below.
HOs failed in going to new channel - HOs failed to return to old channel
= sum(sdcch_rf_new_ho+sdcch_abis_fail_new+sdccha_if_fail_new+sdcch_tr_fail_new) -sum(sdcch_rf_old_ho+sdcch_abis_fail_old+sdccha_if_fail_old+sdcch_tr_fail_old)
Counters from table(s):p_nbsc_traffic
Figure 240. SDCCH HO failures when return to old channel wassuccessful (hof_4)
MSC incoming HO failures (hof_5)
HO attempts - successful HO
= sum(msc_i_tch_tch_at+msc_i_tch_tch_at+msc_i_sdcch_at - msc_i_tch_tch+msc_i_sdcch_tch+msc_i_sdcch)
Counters from table(s):p_nbsc_ho
Figure 241. MSC incoming HO failures (hof_5)
MSC outgoing HO failures (hof_6)
sum(msc_o_tch_tch_at+msc_o_sdcch_tch_at+msc_o_sdcch_at) - sum(msc_o_tch_tch+msc_o_sdcch_tch+msc_o_sdcch)
Counters from table(s):p_nbsc_ho
Figure 242. MSC outgoing HO failures (hof_6)
MSC outgoing HO failures (hof_6a)
sum(msc_o_tch_tch_at+msc_o_sdcch_tch_at+msc_o_sdcch_at) - sum(msc_o_succ_ho)
114 (206) © Nokia Networks Oy DN98619493Nokia Proprietary and Confidential Issue 1-1en
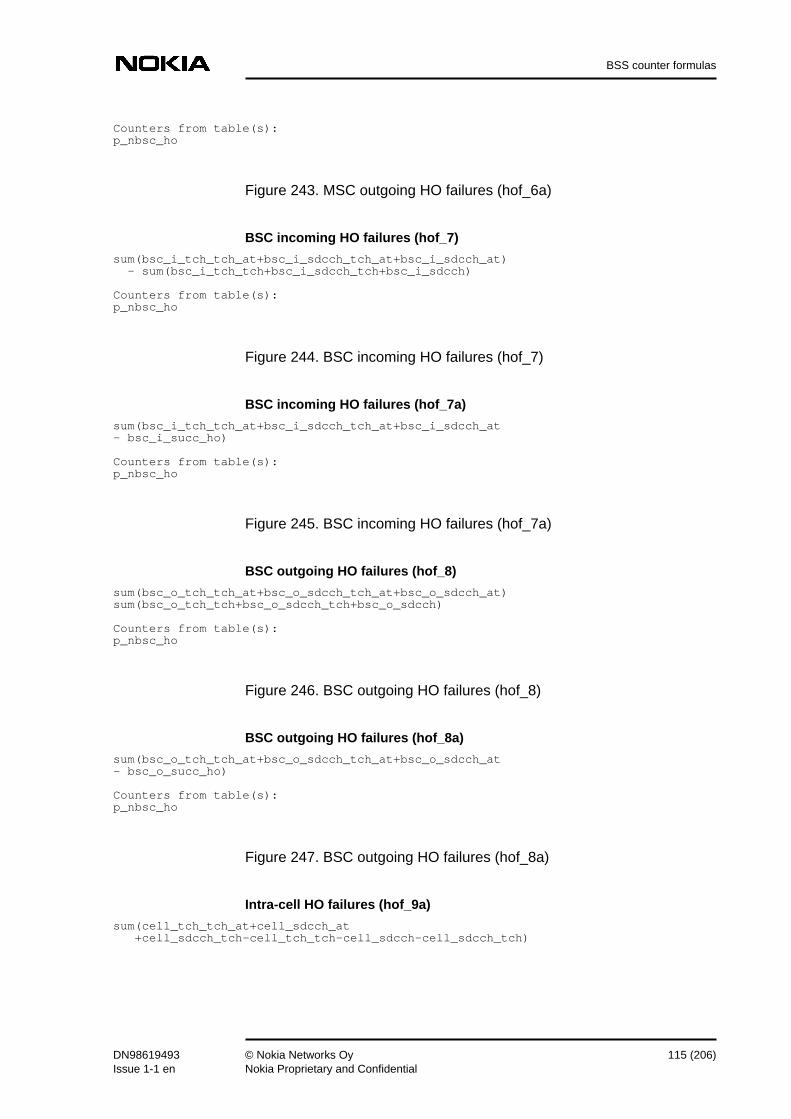
BSS counter formulas
Counters from table(s):p_nbsc_ho
Figure 243. MSC outgoing HO failures (hof_6a)
BSC incoming HO failures (hof_7)
sum(bsc_i_tch_tch_at+bsc_i_sdcch_tch_at+bsc_i_sdcch_at) - sum(bsc_i_tch_tch+bsc_i_sdcch_tch+bsc_i_sdcch)
Counters from table(s):p_nbsc_ho
Figure 244. BSC incoming HO failures (hof_7)
BSC incoming HO failures (hof_7a)
sum(bsc_i_tch_tch_at+bsc_i_sdcch_tch_at+bsc_i_sdcch_at- bsc_i_succ_ho)
Counters from table(s):p_nbsc_ho
Figure 245. BSC incoming HO failures (hof_7a)
BSC outgoing HO failures (hof_8)
sum(bsc_o_tch_tch_at+bsc_o_sdcch_tch_at+bsc_o_sdcch_at)sum(bsc_o_tch_tch+bsc_o_sdcch_tch+bsc_o_sdcch)
Counters from table(s):p_nbsc_ho
Figure 246. BSC outgoing HO failures (hof_8)
BSC outgoing HO failures (hof_8a)
sum(bsc_o_tch_tch_at+bsc_o_sdcch_tch_at+bsc_o_sdcch_at- bsc_o_succ_ho)
Counters from table(s):p_nbsc_ho
Figure 247. BSC outgoing HO failures (hof_8a)
Intra-cell HO failures (hof_9a)
sum(cell_tch_tch_at+cell_sdcch_at +cell_sdcch_tch-cell_tch_tch-cell_sdcch-cell_sdcch_tch)
DN98619493 © Nokia Networks Oy 115 (206)Issue 1-1 en Nokia Proprietary and Confidential

BSS Network Doctor Formulas
Counters from table(s):p_nbsc_ho
Figure 248. Intra-cell HO failures (hof_9a)
Failed outgoing HO, return to old (hof_10)
sum(msc_o_fail_ret + bsc_o_fail_ret)
Counters from table(s):p_nbsc_ho
Figure 249. Failed outgoing HO, return to old (hof_10)
Outgoing HO failures (hof_12)
Outgoing HO attempts - Outgoing HO successes
= sum(msc_o_tch_tch_at+msc_o_sdcch_tch_at+msc_o_sdcch_at + bsc_o_tch_tch_at+bsc_o_sdcch_tch_at+bsc_o_sdcch_at) - sum(msc_o_succ_ho+ bsc_o_succ_ho)
Counters from table(s):p_nbsc_ho
Figure 250. Outgoing HO failures (hof_12)
Intra-cell HO failure, return to old channel (hof_13)
sum(cell_fail_ret)
Counters from table(s):p_nbsc_ho
Figure 251. Intra-cell HO failure, return to old channel (hof_13)
Intra-cell HO failure, drop call (hof_14)
sum(cell_drop_calls)
Counters from table(s):p_nbsc_ho
Figure 252. Intra-cell HO failure, drop call (hof_14)
116 (206) © Nokia Networks Oy DN98619493Nokia Proprietary and Confidential Issue 1-1en

BSS counter formulas
Incoming HO failures (hof_15)
Incoming HO attempts - Incoming HO successes
= sum(msc_i_tch_tch_at+msc_i_sdcch_tch_at+msc_i_sdcch_at + bsc_i_tch_tch_at+bsc_i_sdcch_tch_at+bsc_i_sdcch_at) - sum(msc_i_succ_ho+ bsc_i_succ_ho)
Counters from table(s):p_nbsc_ho
Figure 253. Incoming HO failures (hof_15)
2.17 Interference (itf)
UL interference, BTS level, S1 (itf_1)
Use: UL interference is measured as the time-out of lowest band 1(band 0 in BSC terminology). Band 10 is defined byboundaries 0 and 1 which are BTS parameters. Boundary 0 isfixed, whereas boundary 1 can be set.
Experiences on use: UL interference alone is not a reliable quality factor if IUOis used. In IUO cells the UL interference can be high but thequality is still good.
Known problems: This formula is on the BTS level, whereas the interferenceproblems are met on the frequency (TRX) level. This meansthat the accuracy is not good if there is more than one TRX ina cell.If band 1 is defined as exceptionally wide, it becomes difficultto see the interference.
sum(ave_idle_f_TCH_1/res_av_denom4)100 x (1- --------------------------------------------------------------------) % sum(ave_idle_f_TCH_1/res_av_denom4+ ave_idle_f_TCH_2/res_av_denom5 + ave_idle_f_TCH_3/res_av_denom6+ ave_idle_f_TCH_4/res_av_denom7 + ave_idle_f_TCH_5/res_av_denom8)
Counters from table(s):p_nbsc_res_avail
Figure 254. UL interference, BTS level, S1 (itf_1)
Idle TSL percentage of time in band X, TRX level, IUO, S4 (itf_2)
Experiences on use: In IUO cells the UL interference can show high values butthe UL quality is still excellent. The bigger the values are inbands towards band 5, the worse the interference.
sum(ave_full_tch_ifX)100 x (------------------------------------------------------------) % sum(ave_full_tch_if1 + ave_full_tch_if2 + ave_full_tch_if3 + ave_full_tch_if4 + ave_full_tch_if5)
DN98619493 © Nokia Networks Oy 117 (206)Issue 1-1 en Nokia Proprietary and Confidential

BSS Network Doctor Formulas
Counters from table(s):p_nbsc_underlay
Figure 255. Idle TSL percentage of time in band X, TRX level, IUO, S4(itf_2)
UL interference from IUO, TRX level, S4 (itf_3)
Experiences on use: UL interference alone is not a reliable quality factor if IUOis used. In IUO cells the UL interference can be high but thequality is still good.
Known problems: There are more than one TRX in a cell.
sum(ave_full_tch_if1)100x (1 - ------------------------------------------------------------) % sum(ave_full_tch_if1 + ave_full_tch_if2 + ave_full_tch_if3 + ave_full_tch_if4 + ave_full_tch_if5)
Counters from table(s):p_nbsc_underlay
Figure 256. UL interference from IUO, TRX level, S4 (itf_3)
UL interference from Power Control, TRX level, S6 (itf_4)
Use: BTS reports interference of each TCH as band number (0-4,where 0 is the lowest and band boundaries are defined as cellparameters). BSC sums up the band numbers (ave_sum_idle_ch_interf) as well as the number ofTCHs reported ( ave_sum_idle_tch_per_trx), and fromthese figures an average interference band (0-4) can becalculated. Average interference is shifted by 1 (+1) tocomply with band numbers 1-5.
sum(ave_sum_idle_ch_interf)/sum(ave_sum_idle_tch_per_trx)+1
Counters from table(s):p_nbsc_power
Figure 257. UL interference from Power Control, TRX level, S6 (itf_4)
2.18 Congestion (cngt)
TCH congestion time, S1 (cngt_1)
Experiences on use: Useful to follow on the area level. Should give higher valuesthan SDCCH congestion.
118 (206) © Nokia Networks Oy DN98619493Nokia Proprietary and Confidential Issue 1-1en
BSS counter formulas
sum(tch_cong_time/100)
Counters from table(s):p_nbsc_res_availunit: seconds
Figure 258. TCH congestion time, S1 (cngt_1)
SDCCH congestion time, S1 (cngt_2)
Experiences on use: Useful to follow on the area level. Should give smallervalues than TCH congestion.
sum(sdcch_cong_time/100)
Counters from table(s):p_nbsc_res_availunit: seconds
Figure 259. SDCCH congestion time, S1 (cngt_2)
FTCH time congestion % (cngt_3)
sum(tch_fr_radio_congestion_time)100 * ----------------------------------------- % sum(period_duration*ave_tch_busy_full/60)
Counters from table(s):p_nbsc_res_avail
Figure 260. FTCH time congestion % (cngt_3a)
FTCH time congestion % (cngt_3a)
sum(tch_fr_radio_congestion_time/100)100 * ----------------------------------------- % sum(period_duration*ave_tch_busy_full*60)
Counters from table(s):p_nbsc_res_avail
Figure 261. FTCH time congestion % (cngt_3a)
HTCH time congestion % (cngt_4)
sum(tch_hr_radio_congestion_time)100 * ----------------------------------------- % sum(period_duration*ave_tch_busy_half/60)
DN98619493 © Nokia Networks Oy 119 (206)Issue 1-1 en Nokia Proprietary and Confidential

BSS Network Doctor Formulas
Counters from table(s):p_nbsc_res_avail
Figure 262. HTCH time congestion % (cngt_4a)
HTCH time congestion % (cngt_4a)
sum(tch_hr_radio_congestion_time/100)100 * ----------------------------------------- % sum(period_duration*ave_tch_busy_half*60)
Counters from table(s):p_nbsc_res_avail
Figure 263. HTCH time congestion % (cngt_4a)
2.19 Queuing (que)
Queued, served TCH call requests % (que_1)
Use: Indicates the quota of TCH call requests seizing the TCHsuccessfully after queuing.
Known problems: tch_qd_call_att is triggered but unsrv_qd_call_attis not if:1. Call attempt is in the queue and while waiting is taken
by DR to another cell. The formula shows as if thequeuing took place.
2. If the call is lost for some other reason (e.g. MS userhangs) before the queuing timer expires.
The impact of this depends on queuing time and cellparameter Directed Retry Time Limit Min.A call is taken from the queue to DR as soon as the DR targetcell list is ready. To get an accurate ratio, an additionalcounter XX1 would be needed (queued attempts taken to DR).
sum( tch_qd_call_att-XX1-unsrv_qd_call_att)100* -------------------------------------------- % sum(tch_call_req)
Counters from table(s):p_nbsc_trafficXX1 is the number of calls taken from queue to DR.
Figure 264. Queued, served TCH call requests % (que_1)
120 (206) © Nokia Networks Oy DN98619493Nokia Proprietary and Confidential Issue 1-1en

BSS counter formulas
Queued, served TCH HO requests % (que_2)
Known problems: tch_qd_ho_att is triggered but unsrv_qd_ho_att is notif a call for some reason is lost (the MS user is hanging, forexample) before the queuing timer expires.
sum(tch_qd_ho_att-unsrv_qd_ho_att)100* ------------------------------------------------- % sum(tch_request-tch_call_req-tch_fast_req)
Counters from table(s):p_nbsc_traffic
Figure 265. Queued, served TCH HO requests % (que_2)
Queued, served TCH HO requests %, (que_2a)
Known problems: tch_qd_ho_att is triggered but unsrv_qd_ho_att is notif a call for some reason is lost (the MS user is hanging, forexample) before the queuing timer expires.
sum(a. tch_qd_ho_att-a.unsrv_qd_ho_att)100* ------------------------------------------------- % sum(a.tch_request-a.tch_call_req-a.tch_fast_req) - Sum(b.bsc_i_unsucc_a_int_circ_type+b.msc_controlled_in_ho +b.ho_unsucc_a_int_circ_type)
Counters from table(s):a = p_nbsc_trafficb = p_nbsc_handover
Figure 266. Queued, served TCH HO requests %, (que_2a)
Successful queued TCH requests (que_3)
sum(tch_qd_call_att-unsrv_qd_call_att)
Counters from table(s):p_nbsc_traffic
Figure 267. Successful queued TCH requests (que_3)
Successful non-queued TCH requests (que_4)
sum(tch_norm_seiz)-sum(tch_qd_call_att-unsrv_qd_call_att)
Counters from table(s):p_nbsc_traffic
Figure 268. Successful non-queued TCH requests (que_4)
DN98619493 © Nokia Networks Oy 121 (206)Issue 1-1 en Nokia Proprietary and Confidential

BSS Network Doctor Formulas
Successful queued TCH HO requests (que_5)
sum(tch_qd_ho_att-unsrv_qd_ho_att)
Counters from table(s):p_nbsc_traffic
Figure 269. Successful queued TCH HO requests (que_5)
Successful non-queued TCH HO requests (que_6)
sum(tch_ho_seiz)-sum(tch_qd_ho_att-unsrv_qd_ho_att)
Counters from table(s):p_nbsc_traffic
Figure 270. Successful non-queued TCH HO requests (que_6)
Non-queued, served TCH call requests % (que_7)
Use: Indicates the quota of TCH call requests seizing the TCHsuccessfully straight without queuing. DR is excluded (itsimpact is seen in dr_3).
sum(tch_norm_seiz-(tch_qd_call_att-unsrv_qd_call_att))100* --------------------------------------------------------- % sum(tch_call_req)
Counters from table(s):p_nbsc_traffic
Figure 271. Non-queued, served TCH call requests % (que_7)
Non-queued, served TCH HO requests % (que_8)
sum(tch_ho_seiz-(tch_qd_ho_att-unsrv_qd_ho_att))100* ------------------------------------------------- % sum(tch_request-tch_call_req-tch_fast_req)
Counters from table(s):p_nbsc_traffic
Figure 272. Non-queued, served TCH HO requests % (que_8)
Non-queued, served TCH HO requests %, (que_8a)
Known problems: See que_2.
sum(a.tch_ho_seiz-(a.tch_qd_ho_att-a.unsrv_qd_ho_att))100* ------------------------------------------------- %
122 (206) © Nokia Networks Oy DN98619493Nokia Proprietary and Confidential Issue 1-1en

BSS counter formulas
sum(a.tch_request-a.tch_call_req-a.tch_fast_req)- Sum(b.bsc_i_unsucc_a_int_circ_type+b.msc_controlled_in_ho +b.ho_unsucc_a_int_circ_type)
Counters from table(s):a = p_nbsc_trafficb = p_nbsc_handover
Figure 273. Non-queued, served TCH HO requests %, (que_8a)
2.20 Blocking (blck)
TCH raw blocking, S1 (blck_1)
Experiences on use: Was earlier (before blck_8a) widely used on the cell andthe area level.
Known problems: This PI does not take Directed Retry into consideration.Rather, it shows only raw blocking including also HOs.Blocked HOs are normally not so serious because there arealternatives to go to. Blocked new calls can be lost calls ifDirected Retry is not in use.
sum(tch_req_rej_lack)100* --------------------- % sum(tch_request)
Counters from table(s):p_nbsc_traffic
Figure 274. TCH raw blocking, S1 (blck_1)
SDCCH blocking %, S1 (blck_5)
Known problems: sdcch_busy_att is triggered also in the case of HO attemptif there are no free SDCCHs.
100-csf_1 =
sum(SDCCH_busy_att)100* -------------------- % sum(SDCCH_seiz_att)
Counters from table(s):p_nbsc_traffic
Figure 275. SDCCH blocking %, S1 (blck_5)
DN98619493 © Nokia Networks Oy 123 (206)Issue 1-1 en Nokia Proprietary and Confidential

BSS Network Doctor Formulas
SDCCH real blocking %, S1 (blck_5a)
Known problems: sdcch_busy_att is triggered also in the case of HO attemptif there are no free SDCCHs.
100_csf_1a =
sum(SDCCH_busy_att-tch_seiz_due_sdcch_con)100* ----------------------------------------- % sum(SDCCH_seiz_att)
Counters from table(s):p_nbsc_traffic
Figure 276. SDCCH real blocking %, S1 (blck_5a)
TCH raw blocking % on super TRXs, S4 (blck_6)
Note: Cannot be calculated by a simple SQL*Plus statement.
sum over super TRXs (tch_req_rej_lack)100* ----------------------------------------- % sum over super TRXs (tch_request)
Counters from table(s):p_nbsc_underlay
Figure 277. TCH raw blocking % on super TRXs, S4 (blck_6)
TCH raw blocking % on regular TRXs, S4 (blck_7)
Note: Cannot be calculated by a simple SQL*Plus statement.
sum over regular TRX (tch_req_rej_lack)100* ----------------------------------------- % sum over regular TRX (tch_request)
Counters from table(s):p_nbsc_underlay
Figure 278. TCH raw blocking % on regular TRXs, S4 (blck_7)
TCH call blocking, before DR, S2 (blck_8)
Experiences on use: Shows the blocking if DR is not used.
TCH call req. rejected due to lack of res. or routed by DR to another cell100* ------------------------------------------------------------------------- % = all TCH call requests
sum(tch_call_req-tch_norm_seiz)100* -------------------------------- % sum(tch_call_req)
124 (206) © Nokia Networks Oy DN98619493Nokia Proprietary and Confidential Issue 1-1en

BSS counter formulas
Counters from table(s):p_nbsc_traffic
Figure 279. TCH call blocking, before DR, S2 (blck_8)
TCH call blocking %, DR compensated, S2 (blck_8b)
Use: On the cell level should appear in the busiest cells. The cellneeds an urgent capacity extension or has lost part of itscapacity due to a fault.It is the blocking rate that the customers will notice when theyare driving in the mobile environment caused by the lack ofradio resources. It is therefore one of the most critical KPIs.
Experiences on use: On the area level there is not yet a target value to give(except that 0 % is the best). On the cell level, for example, 2% blocking on busy hour has been used as a criterion fordesign.
Known problems: 1) This blocking shows also situations when blocking iscaused by a fault in the BTS - not only pure blocking causedby high traffic.2) Note that if Trunk Reservation is used, HO and Callblocking cannot be counted precisely (there is only onecounter for the case of Trunk Reservation InvocationRefused).3) The ratio can show too high values in the following case:TCH assignment fails if the requested channel type is notfound in the A-interface circuit pool. In this casetch_norm_seiz is not triggered but tch_call_req is, i.e.this attempt in blck_8b is considered a blocked call.Anyhow, BSC requests the MSC to change the A-interfacecircuit pool. MSC can then decide if there is anotherassignment request or call clear ( clear_command).The second request may again fail or succeed. In BSC theTCH_REJ_DUE_REQ_CH_A_IF_CRC counter is triggeredevery time the channel request fails due to the above-mentioned reason.If Nokia MSC is used, there can be only one retry. Withanother vendor’s MSC there can be multiple retrys.The actual situation when this can be met is if EFR (enhancedfull rate) codec is the primary choice but - the selected A-interface circuit supports only Full Rate- there are free circuitssupporting EFR in the A-interface
TCH call requests rejected due to lack of res. or saved by DR - successful DR100* ------------------------------------------------------------------------- % = all TCH call requests
sum(a.tch_call_req-a.tch_norm_seiz) - sum(b.msc_o_sdcch_tch+ b.bsc_o_sdcch_tch+b.cell_sdcch_tch)100* ---------------------------------------------------------- %
DN98619493 © Nokia Networks Oy 125 (206)Issue 1-1 en Nokia Proprietary and Confidential

BSS Network Doctor Formulas
sum(a.tch_call_req)
Counters from table(s):a = p_nbsc_trafficb = p_nbsc_handover
Figure 280. TCH call blocking %, DR compensated, S2 (blck_8b)
TCH call blocking %, DR and DAC compensated, EFR excluded, S5(blck_8d)
Use: Applicable on area or BTS level.Queuing and Directed Retry are the BSS features that canreduce blocking.It is the failed call attempts that the MS user will notice,caused by the lack of radio resources. It is therefore one of themost critical KPIs.On the cell level may appear in the busiest cells. The cellneeds an urgent capacity extension or has lost part of capacitydue to a fault. An MS user will usually hear three beep toneswhen the call is rejected due to blocking.
Experiences on use: On the area level there is not yet a target value to give(except that the trend should be towards a smaller value, 0%being the best). On the cell level, for example, 2% blockingon Busy Hour has been used as a criterion for design. ThisKPI can be followed statistically, for example, as the numberof cells in which the value exceeds the given threshold.
Known problems: 1) This blocking shows also situations when blocking iscaused by a fault in the BTS - not only pure blocking causedby high traffic.2) Note that if Trunk Reservation is used, HO and Callblocking cannot be counted precisely (there is only onecounter for the case of Trunk Reservation InvocationRefused).
100-csf_3l =
sum(a.tch_call_req-a.tch_norm_seiz) - sum(b.msc_o_sdcch_tch+ b.bsc_o_sdcch_tch+b.cell_sdcch_tch); DR calls + sum(a.tch_succ_seiz_for_dir_acc) ;ref.2 - sum(a.tch_rej_due_req_ch_a_if_crc ; Aif type mismatch or congestion -(b.bsc_i_unsucc_a_int_circ_type ; Aif circuit pool handover failures +b.msc_controlled_in_ho +b.ho_unsucc_a_int_circ_type))100-100* ----------------------------------------------------------- % sum(a.tch_call_req) - sum(a.tch_rej_due_req_ch_a_if_crc ; Aif type mismatch or congestion -(b.bsc_i_unsucc_a_int_circ_type ; Aif circuit pool handover failures +b.msc_controlled_in_ho +b.ho_unsucc_a_int_circ_type))
Counters from table(s):
126 (206) © Nokia Networks Oy DN98619493Nokia Proprietary and Confidential Issue 1-1en

BSS counter formulas
a = p_nbsc_trafficb = p_nbsc_handover
Figure 281. TCH call blocking %, DR and DAC compensated, EFRexcluded, S5 (blck_8d)
Ref.2. Compensation needed since in case of Direct Access to super reuse TRXthe tch_norm_seiz is triggered in parallel with cell_sdcch_tch.
Blocked calls, S5 (blck_9b)
Use: Shows also situations when blocking is caused by a fault inthe BTS - not only blocking caused purely by high traffic.
TCH call req. rejected due to lack of res. or routed by DR to another cell - successful DR - Rejections due to Aif circuit mismatch
sum(a.tch_call_req-a.tch_norm_seiz)- sum(b.msc_o_sdcch_tch+ b.bsc_o_sdcch_tch);inter-cell DR- sum(b.cell_sdcch_tch); intra-cell DR in IUO- sum(a.tch_rej_due_req_ch_a_if_crc ; Aif type mismatch or congestion -(b.bsc_i_unsucc_a_int_circ_type ; Aif circuit pool handover failures +b.msc_controlled_in_ho +b.ho_unsucc_a_int_circ_type))
Counters from table(s):a = p_nbsc_trafficb = p_nbsc_handover
Figure 282. Blocked calls, S5 (blck_9b)
Blocked calls , S5 (blck_9c)
Use: Shows also situations when blocking is caused by a fault inthe BTS - not only blocking caused purely by high traffic.
TCH call req. rejected due to lack of res. or routed by DR to another cell - successful DR - Rejections due to Aif circuit mismatch
sum(a.tch_call_req-a.tch_norm_seiz)- sum(b.msc_o_sdcch_tch+ b.bsc_o_sdcch_tch);inter-cell DR- sum(b.cell_sdcch_tch); intra-cell DR in IUO+ sum(a.succ_tch_seiz_for_dir_acc) ;ref.2- sum(a.tch_rej_due_req_ch_a_if_crc ; Aif type mismatch or congestion -(b.bsc_i_unsucc_a_int_circ_type ; Aif circuit pool handover failures +b.msc_controlled_in_ho +b.ho_unsucc_a_int_circ_type))
Counters from table(s):
DN98619493 © Nokia Networks Oy 127 (206)Issue 1-1 en Nokia Proprietary and Confidential

BSS Network Doctor Formulas
a = p_nbsc_trafficb = p_nbsc_handover
Figure 283. Blocked calls , S5 (blck_9c)
Ref.2. Compensation needed since in case of Direct Access to super reuse TRXthe tch_norm_seiz is triggered in parallel with cell_sdcch_tch.
Blocked TCH HOs, S2 (blck_10a)
Use: Replaces blck_10.sum(tch_request-tch_call_req-tch_fast_req-tch_ho_seiz)
Counters from table(s):p_nbsc_traffic
Figure 284. Blocked TCH HOs, S2 (blck_10a)
Blocked TCH HOs, S5 (blck_10b)
Use: Replaces blck_10a.sum(a.tch_request-a.tch_call_req-a.tch_fast_req-a.tch_ho_seiz)-sum(b.bsc_i_unsucc_a_int_circ_type+b.msc_controlled_in_ho +b.ho_unsucc_a_int_circ_type)
Counters from table(s):a = p_nbsc_trafficb = p_nbsc_ho
Figure 285. Blocked TCH HOs, S5 (blck_10b)
TCH HO blocking, S2 (blck_11a)
Known problems: 1) Shows also the situations when blocking is caused by afault in the BTS - not only blocking caused purely by hightraffic.2) Note that if Trunk Reservation is used, HO and Callblocking cannot be counted precisely (there is only onecounter for the case of Trunk Reservation InvocationRefused).
sum(tch_request-tch_call_req-tch_fast_req-tch_ho_seiz)100 * ------------------------------------------------------------- % sum(tch_request-tch_call_req-tch_fast_req)
128 (206) © Nokia Networks Oy DN98619493Nokia Proprietary and Confidential Issue 1-1en

BSS counter formulas
Counters from table(s):p_nbsc_traffic
Figure 286. TCH HO blocking, S2 (blck_11a)
TCH HO blocking without Q, S2 (blck_11b)
Use: Shows TCH HO blocking if queuing was not in use.Known problems: See que_2 (factor XX1).
sum(tch_request-tch_call_req-tch_fast_req-tch_ho_seiz) + sum(tch_qd_ho_att-XX1- unserv_qd_ho_att)100 * ------------------------------------------------------------- % sum(tch_request-tch_call_req-tch_fast_req)
Counters from table(s):p_nbsc_traffic
Figure 287. TCH HO blocking without Q, S2 (blck_11b)
TCH HO blocking, S5 (blck_11c)
Known problems: 1) Shows also the situations when blocking is caused by afault in the BTS - not only blocking caused purely by hightraffic.2) Note that if Trunk Reservation is used, HO and Callblocking cannot be counted precisely (there is only onecounter for the case of Trunk Reservation InvocationRefused).
sum(a.tch_request-a.tch_call_req-a.tch_fast_req-a.tch_ho_seiz)-sum(b.bsc_i_unsucc_a_int_circ_type+b.msc_controlled_in_ho +b.ho_unsucc_a_int_circ_type)100 * ------------------------------------------------------------- % sum(a.tch_request-a.tch_call_req-a.tch_fast_req)-sum(b.bsc_i_unsucc_a_int_circ_type+b.msc_controlled_in_ho +b.ho_unsucc_a_int_circ_type)
Counters from table(s):a = p_nbsc_trafficb = p_nbsc_ho
Figure 288. TCH HO blocking, S5 (blck_11c)
Blocked incoming and internal HO, S2 (blck_12)
Use: Usable with S4 and earlier.sum(msc_i_fail_lack+ bsc_i_fail_lack + cell_fail_lack)
DN98619493 © Nokia Networks Oy 129 (206)Issue 1-1 en Nokia Proprietary and Confidential

BSS Network Doctor Formulas
Counters from table(s):p_nbsc_ho
Figure 289. Blocked incoming and internal HO, S2 (blck_12)
Blocked incoming and internal HO, S2 (blck_12a)
Use: On the area level with S5 and S6.sum(msc_i_fail_lack+ bsc_i_fail_lack + cell_fail_lack
+ bsc_i_unsucc_a_int_circ_type+msc_controlled_in_ho+ho_unsucc_a_int_circ_type)
Counters from table(s):p_nbsc_ho
Figure 290. Blocked incoming and internal HO, S2 (blck_12a)
AG blocking, S1 (blck_13)
Use: A BSC sends to a BTS an immediate assignment orimmediate assignment rejected commands. If the AccessGrant (AG) buffer in the BTS is full, it will respond with adelete indication. Thus the ratio of delete indications to thesum of immediate assignment and immediate assignmentrejected describes the AG blocking.
100 * sum(del_ind_msg_rec)/ sum(imm_assgn_rej+imm_assgn_sent)
Counters from table(s):p_nbsc_res_access
Figure 291. AG blocking, S1 (blck_13)
FCS blocking, S5 (blck_14)
100 * sum(tch_seiz_att_due_sdcch_con-tch_seiz_due_sdcch_con)/sum(tch_seiz_att_due_sdcch_con %)
Counters from table(s):p_nbsc_traffic
Figure 292. FCS blocking, S5 (blck_14)
Blocked SDCCH seizure attempts, S5 (blck_15)
All blocked - seizures toFACCH setup sum(sdcch_busy_att- tch_seiz_due_sdcch_con)
130 (206) © Nokia Networks Oy DN98619493Nokia Proprietary and Confidential Issue 1-1en

BSS counter formulas
Counters from table(s):p_nbsc_traffic
Figure 293. Blocked SDCCH seizure attempts, S5 (blck_15)
HO blocking % (blck_16a)
Use: On the area level with S4 or earlier.
/* handovers failing due to blocking */ -sum(msc_o_fail_lack+bsc_o_fail_lack+cell_fail_lack)
100 * ------------------------------------------------ /* all HO attempts */ sum(msc_o_tch_tch_at+msc_o_sdcch_tch_at+msc_o_sdcch_at +bsc_o_tch_tch_at+bsc_o_sdcch_tch_at+bsc_o_sdcch_at +cell_tch_tch_at+cell_sdcch_tch_at+cell_sdcch_at)
Counters from table(s):p_nbsc_ho
Figure 294. HO blocking % (blck_16a)
Handover blocking %, (blck_16b)
Use: On the area level with S5 and S6.Known problems: If the required channel type (e.g. Full Rate) is not available in
intra-cell handover, then ho_unsucc_a_int_circ_type istriggered, but the same channel may be seized successfullyafter changing the handover for external (A interface circuitchanges).
/* handovers failing due to blocking */ sum(msc_i_fail_lack+bsc_i_fail_lack + cell_fail_lack+ +bsc_i_unsucc_a_int_circ_type+msc_i_unsucc_a_int_circ_type +ho_unsucc_a_int_circ_type)100 * ------------------------------------------------ /* all HO attempts */ sum(msc_o_tch_tch_at+msc_o_sdcch_tch_at+msc_o_sdcch_at +bsc_o_tch_tch_at+bsc_o_sdcch_tch_at+bsc_o_sdcch_at +cell_tch_tch_at+cell_sdcch_tch_at+cell_sdcch_at)
Counters from table(s):p_nbsc_ho
Figure 295. Handover blocking %, (blck_16b)
Abis link blocking (blck_17)
There is no counter but an alarm: 2720 ’Telecom Link Overload’.
DN98619493 © Nokia Networks Oy 131 (206)Issue 1-1 en Nokia Proprietary and Confidential

BSS Network Doctor Formulas
Blocked FACCH call setup TCH requests, (blck_18)
sum(tch_seiz_att_due_sdcch_con- tch_seiz_due_sdcch_con)
Counters from table(s):p_nbsc_traffic
Figure 296. Blocked FACCH call setup TCH requests, (blck_18)
Handover blocking to target cell, (blck_19)
100* sum(ho_fail_res_to_adj)/sum(ho_att_to_adj)
Counters from table(s):p_nbsc_ho_adj
Figure 297. Handover blocking to target cell, (blck_19)
Handover blocking from target cell, (blck_20)
100* sum(ho_fail_res_from_adj)/sum(ho_att_from_adj)
Counters from table(s):p_nbsc_ho_adj
Figure 298. Handover blocking from target cell, (blck_20)
NACK ratio of p-immediate assignment, S9PS (blck_21)
Use: A negative acknowledgement (NACK) is sent from BTS toBSC after all AGCH messages that are deleted from TRXbuffers due to:- buffer overflow- maximum lead-time expiry- expired starting timeThe AGCH messages are ordered by BSC to beacknowledged. The negative acknowledgement is sentimmediately after the message has been deleted.
sum(packet_immed_ass_nack_msg)100 * -----------------------------------------------------% sum(packet_immed_ass_msg+ packet_immed_ass_rej_msg)
Counters in table(s):p_nbsc_packet_control_unit
Figure 299. NACK ratio of p-immediate assignment, S9PS (blck_21)
132 (206) © Nokia Networks Oy DN98619493Nokia Proprietary and Confidential Issue 1-1en

BSS counter formulas
Note
Territory upgrade rejection %, S9PS (blck_22)
Use: Indicates the lack of resources to upgrade the GPRS territory.
sum(gprs_ter_ug_rej_due_csw_tr+gprs_ter_ug_rej_due_lack_psw +gprs_ter_ug_rej_due_lack_pcu)100 * -----------------------------------------------------------% sum(gprs_ter_upgrd_req)
Counters in table(s):p_nbsc_packet_control_unit
Figure 300. Territory upgrade rejection %, S9PS (blck_22)
2.21 Traffic (trf)
TCH traffic sum, S1 (trf_1)
Experiences on use: If counted over one hour, erlang is shown. Counting erlangsover a longer period requires that the erlang values per hourare first counted and then averaged.
Known problems: Shows slightly different values (around 3 % higher accordingto one study) than if counted from an MSC. The reason forthis is that in a BSC one call holds two TCHs for a short periodin HOs.The sampling period is 20 s which means that during theperiod of one hour the number of used TCHs checked 180times. This method is not accurate if we think about shortseizures and low traffic, but statistically the results have beensatisfactory.Does not show calls going to voice mail.
The result represents technical traffic, not charged traffic because counting isstarted when BSC seizes TCH. Includes some of signalling, ringing and speech.
sum(ave_busy_tch / res_av_denom14)
Counters from table(s):p_nbsc_res_availUnit: Erlang hours if the measurement period is 1 hour.
Figure 301. TCH traffic sum, S1 (trf_1)
TCH traffic sum, S1 (trf_1a)
Note: See trf_1.
DN98619493 © Nokia Networks Oy 133 (206)Issue 1-1 en Nokia Proprietary and Confidential

BSS Network Doctor Formulas
Note
sum_over_area( sum_over_BTS(ave_busy_tch)/ sum_over_BTS(res_av_denom14)
)
Counters from table(s):p_nbsc_res_avail
Figure 302. TCH traffic sum, S1 (trf_1a)
Average call length, S1 (trf_2d)
Use: On the area level gives you an idea about the behaviour of theMS users.
In the numerator ( a.ave_busy_tch / a.res_av_denom14) representstechnical traffic, not charged traffic, because counting is started when BSC seizesTCH. Includes some of signalling, ringing and speech.
In the denominator there are also calls that are not answered. The numeratorcounts both the A and B side in MS-MS calls, thus duplicating call time.
total TCH use time nbr of seconds in meas.period * average busy TCH------------------- = ------------------------------------------------- number of calls number of calls
sum(period_duration*60* a.ave_busy_tch / a.res_av_denom14)= ---------------------------------------------------------- sum(b.tch_norm_seiz) ;normal calls + sum(msc_i_sdcch_tch+ bsc_i_sdcch_tch + cell_sdcch_tch) ;DR calls + sum(a.tch_seiz_due_sdcch_con) ; FACCH call setup calls
Counters from table(s):a = p_nbsc_res_availb = p_bsc_trafficc = p_nbsc_ho
Figure 303. Average call length, S1 (trf_2d)
TCH usage, S1 (trf_3)
Use: On the area level gives you an idea of how well the capacityis used. Usable after S4 if half rate not used.The formula does not comprise the GPRS timeslots(PDTCH).
used TCH100 * ----------------------- %
134 (206) © Nokia Networks Oy DN98619493Nokia Proprietary and Confidential Issue 1-1en

BSS counter formulas
available TCH
sum(ave_busy_tch/res_av_denom14)= 100 * -------------------------------------------- % sum(ave_avail_full_TCH/res_av_denom2)
Counters from table(s):p_nbsc_res_avail
Figure 304. TCH usage, S1 (trf_3)
FTCH usage, S5 (trf_3b)
Use: On the area level gives you an idea of how well the capacityis used. Use with S5 or later.The denominator does not consider the GPRS timeslots.
sum(ave_tch_busy_full)= 100 * -------------------------------------------- % sum(ave_avail_full_TCH/res_av_denom2)
Counters from table(s):p_nbsc_res_avail
Figure 305. FTCH usage, S5 (trf_3b)
Average SDCCH holding time, S1 (trf_4)
Use: The holding time may change due to modification of thetimers or perhaps software.
Experiences on use: The counters get 0 values if the BTS is locked.sum(ave_sdcch_hold_tim)------------------------ secsum(res_av_denom16)*100
Counters from table(s):p_nbsc_res_avail
Figure 306. Average SDCCH holding time, S1 (trf_4)
Average FTCH holding time, S1 (trf_5)
Use: The holding time may change due to modification of thetimers or perhaps software. You can use this PI to follow theimpact of the modifications.
Experiences on use: The counters get 0 values if the BTS is locked.sum(ave_ftch_hold_tim)------------------------ secsum(res_av_denom17)*100
DN98619493 © Nokia Networks Oy 135 (206)Issue 1-1 en Nokia Proprietary and Confidential

BSS Network Doctor Formulas
Counters from table(s):p_nbsc_res_avail
Figure 307. Average FTCH holding time, S1 (trf_5)
TCH seizures for new call (call bids), S1 (trf_6)
Use: The seizures of TCH for a new call (i.e. not HO, not DR, notFCS).
sum(p_nbsc_traffic.tch_norm_seiz)
Counters from table(s):p_nbsc_traffic
Figure 308. TCH seizures for new call (call bids), S1 (trf_6)
SDCCH usage %, S1 (trf_7b)
total SDCCH hold time in seconds100 * --------------------------------------------------- % average total nbr of SDCCH * period duration in seconds
sum(SDCCH_SEIZURES)*avg(a.ave_sdcch_hold_tim/a.res_av_denom16/100)= 100 * ----------------------------------------------------- % sum((a.ave_sdcch_sub/a.res_av_denom3 + a.ave_non_avail_sdcch) * a.period duration*60)
where SDCCH_SEIZURES = (b.sdcch_assign+b.sdcch_ho_seiz+b.tch_seiz_due_sdcch_con)
Counters from table(s):a = p_nbsc_res_availb = p_nbsc_traffic
Figure 309. SDCCH usage %, S1 (trf_7b)
TCH traffic absorption on super, S4 (trf_8)
Note: Cannot be calculated by a simple SQL*Plus statement.
1. First, count the traffic per a TRX.
avg(ave_busy_tch)
2. Then, lable the TRXs to super or regular (TRX is a super if HO relatedcounters for this TRX show zero values). Sum up the traffic for super TRXsand for all TRXs and calculate their ratio.
traffic (super)100 x --------------- % traffic (all)
136 (206) © Nokia Networks Oy DN98619493Nokia Proprietary and Confidential Issue 1-1en

BSS counter formulas
Counters from table(s):p_nbsc_underlay
Figure 310. TCH traffic absorption on super, S4 (trf_8)
TCH traffic absorption on super, S4 (trf_8a)
Use: IUONote: Cannot be calculated by a simple SQL*Plus statement.
First, count the traffic per TRX and per hour:
sum over BTS (avg per each super TRX (ave_busy_tch))100 x ---------------------------------------------------- % sum over BTS (avg per each TRX (ave_busy_tch))
Counters from table(s):p_nbsc_underlay
Figure 311. TCH traffic absorption on super, S4 (trf_8a)
Average cell TCH traffic from IUO, S4 (trf_9)
Note: Cannot be calculated by a simple SQL*Plus statement.
1. First, count the traffic per a TRX and per hour:
avg(ave_busy_tch)
2. Then, sum up the traffic over the period and divide it by the number ofhours in the period:
sum traffic of all TRXs100 x ------------------------ % hours
Counters from table(s):p_nbsc_underlay
Figure 312. Average cell TCH traffic from IUO, S4 (trf_9)
Cell TCH traffic from IUO, S4 (trf_9a)
Note: Cannot be calculated by a simple SQL*Plus statement.sum over BTS (avg per eachTRX (ave_busy_tch))
DN98619493 © Nokia Networks Oy 137 (206)Issue 1-1 en Nokia Proprietary and Confidential

BSS Network Doctor Formulas
Counters from table(s):p_nbsc_underlay
Figure 313. Cell TCH traffic from IUO, S4 (trf_9a)
Super TRX TCH traffic, S4 (trf_10)
Note: Cannot be calculated by a simple SQL*Plus statement.
1. First, count the traffic per a TRX and per hour:
avg(ave_busy_tch)
2. Then, sum it up over the period for super TRXs and divide it by the numberof hours in the period:
traffic (super)100 x --------------- 100% hours
Counters from table(s):p_nbsc_underlay
Figure 314. Super TRX TCH traffic, S4 (trf_10)
Sum of super TRX TCH traffic, S4 (trf_10a)
Note: Cannot be calculated by a simple SQL*Plus statement.sum over BTS (avg per eachsuper TRX (ave_busy_tch))
Counters from table(s):p_nbsc_underlay
Figure 315. Sum of super TRX TCH traffic, S4 (trf_10a)
Average SDCCH traffic, erlang, S2 (trf_11)
Known problems: SDCCH seizures are too short to be counted by using 20 ssampling time. if traffic is low (less than 0.5 Erl).
sum of traffic sum(ave_busy_sdcch / res_av_denom15)--------------- = -------------------------------------- nbr of records count(*)
Counters from table(s):p_nbsc_res_avail
Figure 316. Average SDCCH traffic, erlang, S2 (trf_11)
138 (206) © Nokia Networks Oy DN98619493Nokia Proprietary and Confidential Issue 1-1en

BSS counter formulas
Average SDCCH traffic, erlang, S2 (trf_11a)
Known problems: SDCCH seizures are too short to be counted by using 20 ssampling if traffic is low (less than 0.5 Erl).
Note: Gives the same results as trf_11. Experiments showed thatresults match well with trf_45.
avg(ave_busy_sdcch / res_av_denom15)
Counters from table(s):p_nbsc_res_avail
Figure 317. Average SDCCH traffic, erlang, S2 (trf_11a)
Average TCH traffic, erlang, S2 (trf_12)
avg(ave_busy_tch / res_av_denom14)Countersfrom table(s):p_nbsc_res_avail
Figure 318. Average TCH traffic, erlang, S2 (trf_12)
Average TCH traffic, erlang, S2 (trf_12a)
Note: Gives the same results as trf_12.avg(ave_busy_tch / res_av_denom14)
Counters from table(s):p_nbsc_res_avail
Figure 319. Average TCH traffic, erlang, S2 (trf_12a)
Average TCH traffic, erlang, S2 (trf_12b)
Use: This formula gives the same result as trf_12a ifres_av_denom14 is the same (in practice varies slightly).
sum(ave_busy_tch) / sum(res_av_denom14)
Counters from table(s):p_nbsc_res_avail
Figure 320. Average TCH traffic, erlang, S2 (trf_12b)
Handover/call %, (trf_13b)
Use: Indicates how stationary or mobile the traffic is. The biggerthe number, the more mobile the traffic. Using this KPI, cellswith stationary traffic can be found.
DN98619493 © Nokia Networks Oy 139 (206)Issue 1-1 en Nokia Proprietary and Confidential

BSS Network Doctor Formulas
Known problems: Includes also intra-cell handovers that are not so directlyrelated to mobility. This is largely dependent on how muchoverlapping there is in the coverages.
sum(a.tch_ho_seiz)100 * ----------------------------------------------------------------------- % sum(a.tch_norm_seiz) ;(normal calls) + sum(c.msc_i_sdcch_tch+c.bsc_i_sdcch_tch) ;(DR inter-cell calls) + sum(c.cell_sdcch_tch) ;(DR intra-cellcalls in IOU, optional feature for S6) + sum(a.tch_seiz_due_sdcch_con) ; calls started as FACCH call setup
Counters from table(s):a = p_nbsc_trafficc = p_nbsc_ho
Figure 321. Handover/call %, (trf_13b)
Intra-cell handover/call %, (trf_13c)
Use: Illustrates usually the impact of interference in a non-IUOnetwork.
Known problems: See trf_13b.
sum(c.cell_tch_tch)100 * ------------------------------------------------------------------------- % sum(a.tch_norm_seiz) ;(normal calls) + sum(c.msc_i_sdcch_tch+c.bsc_i_sdcch_tch) ;(DR inter-cell calls) + sum(c.cell_sdcch_tch) ;(DR intra-cellcalls in IOU, optional feature for S6) + sum(a.tch_seiz_due_sdcch_con) ; calls started as FACCH call setup
Counters from table(s):a = p_nbsc_trafficc = p_nbsc_ho
Figure 322. Intra-cell handover/call %, (trf_13c)
Handover/call %, (trf_13d)
Use: Indicates how stationary or mobile the traffic is: the bigger thevalue, the more mobile the traffic. Using this KPI cells withstationary traffic can be found.Depends much on how much overlapping there is in thecoverage areas.Usable for a non-IUO network.
Known problems: Includes also intra-cell handovers that are not so directlyrelated to mobility.
140 (206) © Nokia Networks Oy DN98619493Nokia Proprietary and Confidential Issue 1-1en

BSS counter formulas
sum(a.tch_ho_seiz) - sum(c.msc_i_sdcch_tch+c.bsc_i_sdcch_tch) ;(DR inter-cell calls) - sum(c.cell_sdcch_tch) ;(DR intra-cell callsin IOU, optional feature for S6)100 * ------------------------------------------------------------------------- % sum(a.tch_norm_seiz) ;(normal calls) + sum(c.msc_i_sdcch_tch+c.bsc_i_sdcch_tch) ;(DR inter-cell calls) + sum(c.cell_sdcch_tch) ;(DR intra-cellcalls in IOU, optional feature for S6) + sum(a.tch_seiz_due_sdcch_con) ; calls started as FACCH call setup
Counters from table(s):a = p_nbsc_trafficc = p_nbsc_ho
Figure 323. Handover/call %, (trf_13d)
IUO, average TCH seizure length on super TRXs, S4 (trf_14b)
call time/tch seizures = averageperiod duration * average traffic / tch seizures.
avg of BTS (avg of TRX (period_duration))*60 ! Avg.call time in seconds *sum of BTS (sum of super TRX(ave_busy_tch)) = ------------------------------------------------------------- sec sum of BTS( sum of super TRX(tch_succ_seiz))
Counters from table(s):p_nbsc_underlay
Figure 324. IUO, average TCH seizure length on super TRXs, S4(trf_14b)
IUO, average TCH seizure length on regular TRXs, S4 (trf_15b)
call time/tch seizures = averageperiod duration * average traffic / tch seizures.
avg of BTS (avg of TRX (period_duration))*60 *sum of BTS (sum of regular TRX(avg_trx_traf)) = ------------------------------------------------------------- sec sum of BTS( sum of regular TRX(tch_succ_seiz))
Counters from table(s):p_nbsc_underlay
Figure 325. IUO, average TCH seizure length on regular TRXs, S4(trf_15b)
DN98619493 © Nokia Networks Oy 141 (206)Issue 1-1 en Nokia Proprietary and Confidential
BSS Network Doctor Formulas
Average TRX traffic, IUO, S4 (trf_16)
avg(ave_busy_tch)
Counters from table(s):p_nbsc_underlay
Figure 326. Average TRX traffic, IUO, S4 (trf_16)
Average TRX TCH seizure length, IUO, S4 (trf_17a)
count(*) avg(ave_busy_tch)* period_duration*60----------------------------------------------- sum(tch_succ_seiz)
Counters from table(s):p_nbsc_underlay
Figure 327. Average TRX TCH seizure length, IUO, S4 (trf_17a)
Average TRX TCH seizure length, IUO, S4 (trf_17b)
sum(ave_busy_tch* period_duration*60)----------------------------------------------- sum(tch_succ_seiz)
Counters from table(s):p_nbsc_underlayUnit: second
Figure 328. Average TRX TCH seizure length, IUO, S4 (trf_17b)
TCH requests for a new call, S3 (trf_18)
Known problems: A interface pool circuit type mismatch related retries areincluded.
sum(tch_call_req)
Counters from table(s):p_nbsc_traffic
Figure 329. TCH requests for a new call, S3 (trf_18)
TCH requests for a new call, S3 (trf_18a)
sum(a.tch_call_req)- sum(a.tch_rej_due_req_ch_a_if_crc)- (b.bsc_i_unsucc_a_int_circ_type+b.msc_controlled_in_ho +b.ho_unsucc_a_int_circ_type)
Counters from table(s):
142 (206) © Nokia Networks Oy DN98619493Nokia Proprietary and Confidential Issue 1-1en

BSS counter formulas
a = p_nbsc_trafficb = p_nbsc_ho
Figure 330. TCH requests for a new call, S3 (trf_18a)
Peak busy TCH (trf_19)
Use: This PI is an important traffic load indicator on the cell level.By following the development of this indicator and reactingproactively, blocking can be avoided in cells where the trafficgrowth is smooth.
max(peak_busy_tch)
Counters from table(s):p_nbsc_res_avail
Figure 331. Peak busy TCH (trf_19)
Average unit load (trf_20)
sum(load_rate)/sum(load_denom1)
Counters from table(s):p_nbsc_load
Figure 332. Average unit load (trf_20)
Call time difference between TRXs, S4 (trf_21)
Use: This PI shows as a percentage how much bigger the traffic ofthe busiest TRX of a BTS is compared to the least busy TRXof the same BTS.
100*(max_call_samples-min_call_samples)/min_call_samples
wheremax_call_samples is call samples of busiest TRXof BTS:max((ul_calls+dl_calls)/2)andmin_call_samples is call samples of least busyTRX of BTS:min((ul_calls+dl_calls)/2)
ul_calls=sum(freq_ul_qual0+freq_ul_qual1+freq_ul_qual2+freq_ul_qual3+freq_ul_qual4 +freq_ul_qual5+freq_ul_qual6+freq_ul_qual7)dl_calls=sum(freq_dl_qual0+freq_dl_qual1+freq_dl_qual2+freq_dl_qual3+freq_dl_qual4 +freq_dl_qual5+freq_dl_qual6+freq_dl_qual7)
DN98619493 © Nokia Networks Oy 143 (206)Issue 1-1 en Nokia Proprietary and Confidential

BSS Network Doctor Formulas
Counters from table(s):p_nbsc_rx_qual
Figure 333. Call time difference between TRXs, S4 (trf_21)
Call time difference between TRXs, S4 (trf_21a)
Use: Shows how many times bigger the traffic of the busiest TRXof a BTS is compared to the least busy TRX of the same BTS.
max_call_samples/min_call_samples
wheremax_call_samples is call samples of busiest TRXof BTS:max((ul_calls+dl_calls)/2)andmin_call_samples is call samples of least busyTRX of BTS:min((ul_calls+dl_calls)/2)
ul_calls=sum(freq_ul_qual0+freq_ul_qual1+freq_ul_qual2+freq_ul_qual3+freq_ul_qual4 +freq_ul_qual5+freq_ul_qual6+freq_ul_qual7)dl_calls=sum(freq_dl_qual0+freq_dl_qual1+freq_dl_qual2+freq_dl_qual3+freq_dl_qual4 +freq_dl_qual5+freq_dl_qual6+freq_dl_qual7)
Counters from table(s):p_nbsc_rx_qual
Figure 334. Call time difference between TRXs, S4 (trf_21a)
Number of mobiles located in a cell, BSC, (trf_23a)
Use: If counted over an area, it could be possible to derive a KPIcalled ’Call minutes per MS’ from this formula.If used over a cell, it can give you an idea about how potentialthe cell is, for example.
How many times periodic LU has been sent = PLUS
How many times one MS sends a periodic LU in a time period =count_of_periods * period_duration/LU_period
X = nbr of MS
==>
X* count_of_periods * period_duration/LU_period = number ofperiodic updates (PLUS)
==> X = PLUS * LU_period/ (count_of_periods *period_duration)
144 (206) © Nokia Networks Oy DN98619493Nokia Proprietary and Confidential Issue 1-1en

BSS counter formulas
Note
sum(a.sdcch_loc_upd-nbrof incom.HO from other LA) * 0.1*b.timer_periodic_update_ms------------------------------------------------------------------------------- count(*).a.period_duration/60
Counters from table(s):a = p_nbsc_res_accessb = c_bts
Figure 335. Number of mobiles located in a cell, BSC, (trf_23a)
The sum of incoming handovers from other location areas has to be counted fromp_nbsc_ho_adj using the LA info from the c_bts table.
* b.timer_periodic_update_ms and a.period_duration should be ofthe same unit, minutes for example.
Total TCH seizure time (call time in seconds) (trf_24b)
Note: The sampling takes place every 20 seconds. ave_busy_tchcounts cumulatively the number of busy TCHs.res_av_denom14 counts the number of samples taken.This is not pure conversation time but TCH seizure time. InHO there are two TCHs seized for a short time simultaneouslyand both may be counted if both seizures take place at thesampling moment.
sum(period_duration*60*ave_busy_tch/res_av_denom14)
Counters from table(s):p_nbsc_res_availunit = seconds
Figure 336. Total TCH seizure time (call time in seconds) (trf_24b)
Total TCH seizure time (call time in hours), (trf_24c)
Note: See trf_24b.sum(period_duration*ave_busy_tch/res_av_denom14/60)
Counters from table(s):p_nbsc_res_avail |unit = hours
Figure 337. Total TCH seizure time (call time in hours), (trf_24c)
DN98619493 © Nokia Networks Oy 145 (206)Issue 1-1 en Nokia Proprietary and Confidential
BSS Network Doctor Formulas
SDCCH true seizures (trf_25)
Known problems: There is no counter for IMSI detaches until in release S7.sum(succ_seiz_term+succ_seiz_orig+sdcch_call_re_est +sdcch_emerg_call+sdcch_loc_upd)
Counters from table(s):p_nbsc_res_access
Figure 338. SDCCH true seizures (trf_25)
SDCCH true seizures, S7 (trf_25a)
Known problems: There is no counter for supplemetary service requests until inrelease S9.
sum(succ_seiz_term+succ_seiz_orig+sdcch_call_re_est +sdcch_emerg_call+sdcch_loc_upd+imsi_detach_sdcch)
Counters from table(s):p_nbsc_res_access
Figure 339. SDCCH true seizures, S7 (trf_25a)
SDCCH true seizures for call and SS (trf_26)
Known problems: Supplementary services cannot be separated currently on thecell level.
sum(succ_seiz_term+succ_seiz_orig+sdcch_call_re_est+sdcch_emerg_call- succ_sdcch_sms_est- unsucc_sdcch_sms_est)
Counters from table(s):p_nbsc_res_access
Figure 340. SDCCH true seizures for call and SS (trf_26)
SDCCH true seizures for call, SMS, SS (trf_27)
Known problems: Supplementary services cannot be separated.sum(succ_seiz_term+succ_seiz_orig+sdcch_call_re_est+sdcch_emerg_call)
Counters from table(s):p_nbsc_res_access
Figure 341. SDCCH true seizures for call, SMS, SS (trf_27)
Peak busy SDCCH seizures (trf_28)
Use: The peak value of SDCCH usage is needed for preventivecapacity monitoring on the cell level.
146 (206) © Nokia Networks Oy DN98619493Nokia Proprietary and Confidential Issue 1-1en

BSS counter formulas
max(peak_busy_sdcch)
Counters from table(s):p_nbsc_res_avail
Figure 342. Peak busy SDCCH seizures (trf_28)
IUO layer usage % (trf_29)
Use: Counted for overlay TRXs or underlay TRXs.Counted for overlay TRXsor underlay TRXs. sum(ave_busy_tch)100 * ----------------------------------------------------------- % sum(ave_full_tch_if1+ ave_full_tch_if2+ ave_full_tch_if3+ ave_full_tch_if4+ ave_full_tch_if5) + sum(ave_busy_tch)
Counters from table(s):p_nbsc_underlay
Figure 343. IUO layer usage % (trf_29)
SDCCH seizures (trf_30)
Use: This figure tells the number of all events that have seizedSDCCH.
sum(sdcch_assign+sdcch_ho_seiz)
Counters from table(s):p_nbsc_traffic
Figure 344. SDCCH seizures (trf_30)
Call time (minutes) from p_nbsc_res_avail (trf_32)
sum(period_duration * ave_busy_tch/res_av_denom14)
Counters from table(s):p_nbsc_res_availunit = minutes
Figure 345. Call time (minutes) from p_nbsc_res_avail (trf_32)
DN98619493 © Nokia Networks Oy 147 (206)Issue 1-1 en Nokia Proprietary and Confidential

BSS Network Doctor Formulas
Call time from p_nbsc_rx_qual (trf_32a)
Known problems: In a high load situation (OMU link) it is possible that all calltime is not measured. In other words, call time can show alower value than it has in reality.Also in the beginning of the call and in handover two samplesare lost, showing a shorter time than in reality.
0.48*sum(freq_ul_qual0+freq_ul_qual1+freq_ul_qual2+freq_ul_qual3+freq_ul_qual4 +freq_ul_qual5+freq_ul_qual6+freq_ul_qual7)/60
Counters from table(s):p_nbsc_rx_qualunit = minutes
Figure 346. Call time from p_nbsc_rx_qual (trf_32a)
Call time from p_nbsc_rx_statistics (trf_32b)
Known problems: In a high load situation it is possible that all call time is notmeasured. In other words, call time can show a lower valuethan it has in reality.
0.48*sum(freq_ul_qual0+freq_ul_qual1+freq_ul_qual2+freq_ul_qual3+freq_ul_qual4 +freq_ul_qual5+freq_ul_qual6+freq_ul_qual7)/60
Counters from table(s):p_nbsc_rx_statisticsunit = minutes
Figure 347. Call time from p_nbsc_rx_statistics (trf_32b)
SDCCH HO seizure % out of HO seizure attempts (trf_33)
100*sum(sdcch_ho_seiz)/sum(sdcch_seiz_att)
Counters from table(s):p_nbsc_traffic
Figure 348. SDCCH HO seizure % out of HO seizure attempts (trf_33)
SDCCH assignment % out of HO seizure attempts (trf_34)
100*sum(sdcch_assign)/sum(sdcch_seiz_att) %
Counters from table(s):p_nbsc_traffic
Figure 349. SDCCH assignment % out of HO seizure attempts (trf_34)
148 (206) © Nokia Networks Oy DN98619493Nokia Proprietary and Confidential Issue 1-1en

BSS counter formulas
TCH HO seizure % out of TCH HO seizure request (trf_35)
100*sum(tch_ho_seiz)/sum(tch_request-tch_call_req-tch_fast_req) %
Counters from table(s):p_nbsc_traffic
Figure 350. TCH HO seizure % out of TCH HO seizure request (trf_35)
TCH norm seizure % out of TCH call request (trf_36)
sum(tch_norm_seiz)100 * --------------------------- % sum(tch_call_req)
Counters from table(s):p_nbsc_traffic
Figure 351. TCH norm seizure % out of TCH call request (trf_36)
TCH normal seizure % out of TCH call requests, (trf_36a)
sum(tch_norm_seiz) -sum(tch_succ_seiz_for_dir_acc); ref.1100 * --------------------------------------- % sum(tch_call_req)
Counters from table(s):p_nbsc_traffic
Figure 352. TCH normal seizure % out of TCH call requests, (trf_36a)
Ref.1 tch_norm_seiz is triggered also in case of DAC.
TCH FCS seizure % out of TCH FCS attempts (trf_37)
sum(tch_seiz_due_sdcch_con)100 * ----------------------------------- % sum(tch_seiz_att_due_sdcch_con)
Counters from table(s):p_nbsc_traffic
Figure 353. TCH FCS seizure % out of TCH FCS attempts (trf_37)
TCH FCS seizure % out of congested SDCCH seizure attempts (trf_38)
Use: Indicates the percentage how many SDCCH seizures aresaved by FACCH call setup.
DN98619493 © Nokia Networks Oy 149 (206)Issue 1-1 en Nokia Proprietary and Confidential

BSS Network Doctor Formulas
sum(tch_seiz_due_sdcch_con)100 * ----------------------------------- % sum(sdcch_seiz_att)
Counters from table(s):p_nbsc_traffic
Figure 354. TCH FCS seizure % out of congested SDCCH seizureattempts (trf_38)
TCH seizures for new calls (trf_39)
sum(a.tch_norm_seiz) ;(normal calls)+ sum(c.msc_i_sdcch_tch+c.bsc_i_sdcch_tch) ;(DR inter-cell calls)+ sum(c.cell_sdcch_tch) ;(DR intra-cellcalls in IOU, optional feature for S6)+ sum(a.tch_seiz_due_sdcch_con) ; calls started as FACCH call setup
Counters from table(s):a = p_nbsc_trafficc = p_nbsc_ho
Figure 355. TCH seizures for new calls (trf_39)
TCH seizures for new calls (trf_39a)
sum(a.tch_norm_seiz) ;(normal calls)- sum(a.succ_tch_seiz_for_dir_acc) ;ref.2+ sum(c.msc_i_sdcch_tch+c.bsc_i_sdcch_tch) ;(DR inter-cell calls)+ sum(c.cell_sdcch_tch) ;(DR intra-cellcalls in IOU)+ sum(a.tch_seiz_due_sdcch_con) ; calls started as FACCH call setup
Counters from table(s):a = p_nbsc_trafficc = p_nbsc_ho
Figure 356. TCH seizures for new calls (trf_39a)
Ref.2. Compensation needed since in case of Direct Access to super reuse TRXthe tch_norm_seiz is triggered in parallel with cell_sdcch_tch.
HTCH usage, S5 (trf_40)
Use: On the area level gives you an idea of how well the capacityis used. Use with S5 or later.
150 (206) © Nokia Networks Oy DN98619493Nokia Proprietary and Confidential Issue 1-1en

BSS counter formulas
sum(ave_tch_busy_halfl)= 100 * -------------------------------------------- % sum(ave_tch_avail_half)
Counters from table(s):p_nbsc_res_avail
Figure 357. HTCH usage, S5 (trf_40)
MOC rate, S6 (trf_41)
Known problems: Do not include SMS, SS ==> Better accuracy for speech callsthan if 3012 and 3013 were used.If SDCCH congested and FACCH used for SMS (SS?) thenalso SMS and SS get included.
tch_moc_seiz_att100 * ------------------------------------ % tch_moc_seiz_att + tch_mtc_seiz_att
Counters from table(s):p_nbsc_traffic
Figure 358. MOC rate, S6 (trf_41)
MTC rate, S6 (trf_42)
Known problems: Do not include SMS, SS ==> Better accuracy for speech callsthan if 3012 and 3013 were used.If SDCCH congested and FACCH used for SMS (SS?) thenalso SMS and SS get included.
tch_moc_seiz_att100 * ------------------------------------ % tch_moc_seiz_att + tch_mtc_seiz_att
Counters from table(s):p_nbsc_traffic
Figure 359. MTC rate, S6 (trf_42)
TCH single band subscriber holding time, S6 (trf_43)
0.48* sum(tch_single_band_hold_time)
Counters from table(s):p_nbsc_dual_bandUnit: seconds
Figure 360. TCH single band subscriber holding time, S6 (trf_43)
DN98619493 © Nokia Networks Oy 151 (206)Issue 1-1 en Nokia Proprietary and Confidential

BSS Network Doctor Formulas
TCH dual band subscriber holding time, S6 (trf_44)
0.48* sum(tch_dual_band_hold_time)
Unit: secondCounters from table(s):p_nbsc_dual_band
Figure 361. TCH dual band subscriber holding time, S6 (trf_44)
TCH data call seizures (trf_46)
sum(tch_norm_seiz+tch_ho_seiz+tch_seiz_due_sdcch_con) !! All TCH seizures ( -sum(tch_full_seiz_speech_ver1+tch_full_seiz_speech_ver2 +tch_full_seiz_speech_ver3+tch_half_seiz_speech_ver1 +tch_half_seiz_speech_ver2+tch_half_seiz_speech_ver3) !! Speech seizurescsf_2c
Counters from table(s):p_nbsc_traffic
Figure 362. TCH data call seizures (trf_46)
Share of single band traffic (trf_47)
sum(tch_single_band_hold_time)100* -------------------------------------------------------- % sum(tch_single_band_hold_time + tch_dual_band_hold_time)
Counters from table(s):p_nbsc_dual_band.
Figure 363. Share of single band traffic (trf_47)
Share of dual band traffic (trf_48)
sum(tch_dual_band_hold_time)100* -------------------------------------------------------- % sum(tch_single_band_hold_time + tch_dual_band_hold_time)
Counters from table(s):p_nbsc_dual_band.
Figure 364. Share of dual band traffic (trf_48)
152 (206) © Nokia Networks Oy DN98619493Nokia Proprietary and Confidential Issue 1-1en

BSS counter formulas
Call retries due to A interface pool mismatch (trf_49)
Use: Compensation of the blocking caused by the A interfacecircuit pool mismatch.
Aif type mismatch or congestion- Aif circuit pool handover failure= a.tch_rej_due_req_ch_a_if_crc
- (b.bsc_i_unsucc_a_int_circ_type+b.msc_controlled_in_ho +b.ho_unsucc_a_int_circ_type)
Counters from table(s):a = p_nbsc_trafficb = p_nbsc_ho
Figure 365. Call retries due to A interface pool mismatch (trf_49)
HO retries due to A interface pool mismatch (trf_50)
Use: Compensation of the blocking caused by the A interfacecircuit pool mismatch.
Sum(bsc_i_unsucc_a_int_circ_type+msc_controlled_in_ho+ho_unsucc_a_int_circ_type)
Counters from table(s):p_nbsc_ho
Figure 366. HO retries due to A interface pool mismatch (trf_50)
TCH single band subscribers’ share of holding time, S6 (trf_51)
sum(tch_single_band_hold_time)100 * ------------------------------------------------------ % sum(tch_single_band_hold_time+tch_dual_band_hold_time)
Counters from table(s):p_nbsc_dual_band.
Figure 367. TCH single band subscribers’ share of holding time, S6(trf_51)
TCH dual band subscribers’ share of holding time, S6 (trf_52)
sum(tch_dual_band_hold_time)100 * ------------------------------------------------------ % sum(tch_single_band_hold_time+tch_dual_band_hold_time)
Unit: second.
DN98619493 © Nokia Networks Oy 153 (206)Issue 1-1 en Nokia Proprietary and Confidential
BSS Network Doctor Formulas
Counters from table(s):p_nbsc_dual_band.
Figure 368. TCH dual band subscribers’ share of holding time, S6 (trf_52)
Calls started as FACCH call setup (trf_53)
sum(tch_seiz_att_due_sdcch_con)
Counters from table(s):p_nbsc_trafficUnit: seconds
Figure 369. Calls started as FACCH call setup (trf_53)
SDCCH seizures (trf_54)
sum(sdcch_assign+sdcch_ho_seiz)
Counters from table(s):p_nbsc_traffic
Figure 370. SDCCH seizures (trf_54)
TCH normal seizures (trf_55)
sum(tch_norm_seiz) -sum(tch_succ_seiz_for_dir_acc); ref.1
Counters from table(s):p_nbsc_traffic
Figure 371. TCH normal seizures (trf_55)
Ref.1 tch_norm_seiz is triggered also in case of DAC.
Total FTCH seizure time (trf_56)
sum(period_duration*ave_tch_busy_full/60)
Counters from table(s):p_nbsc_res_availunit = hour
Figure 372. Total FTCH seizure time (trf_56)
154 (206) © Nokia Networks Oy DN98619493Nokia Proprietary and Confidential Issue 1-1en

BSS counter formulas
Total HTCH seizure time (trf_57)
sum(period_duration*ave_tch_busy_half/60)
Counters from table(s):p_nbsc_res_availunit = hour
Figure 373. Total HTCH seizure time (trf_57)
Average TCH hold time for HSCSD, S7 (trf_58)
sum(ave_tch_hold_time_hscsd_numer)----------------------------------- secsum(ave_tch_hold_time_hscsd_denom)*100
Counters from table(s):p_nbsc_res_avail
Figure 374. Average TCH hold time for HSCSD, S7 (trf_58)
Total HSCSD TCH seizure time (call time, hours),(trf_61)
sum(period_duration*ave_busy_tch_hscsd_numer/ave_busy_tch_hscsd_denom/60)
Counters from table(s):p_nbsc_res_availunit = hour
Figure 375. Total HSCSD TCH seizure time (call time, hours),(trf_61)
Average upgrade pending time for HSCSD, (trf_62)
sum(ave_pend_time_numer)----------------------------sum(ave_pend_time_denom)*100
Counters from table(s):p_nbsc_high_speed_dataUnit: sec
Figure 376. Average upgrade pending time for HSCSD, (trf_62)
Average upgrade pending time due to congestion, (trf_63)
sum(ave_pend_time_due_cong_numer)---------------------------------------sum(ave_pend_time_due_cong_denom)*100
Counters from table(s):
DN98619493 © Nokia Networks Oy 155 (206)Issue 1-1 en Nokia Proprietary and Confidential

BSS Network Doctor Formulas
p_nbsc_high_speed_dataUnit: sec
Figure 377. Average upgrade pending time due to congestion, (trf_63)
Total reporting time of ph1 and ph2 mobiles, (trf_64)
sum(rep_time_by_ph_1_ms + rep_time_by_ph_2_ms)*0,46/60
Counters from table(s):p_nbsc_ms_capabilityUnit: min
Figure 378. Total reporting time of ph1 and ph2 mobiles, (trf_64)
Total TCH seizures, (trf_65)
sum(tch_reserv_by_mslot_cl_1_ms + ... + tch_reserv_by_mslot_cl_18_ms+tch_reserv_by_mslot_incap_ms)
Counters from table(s):p_nbsc_ms_capability
Figure 379. Total TCH seizures, (trf_65)
Net UL data traffic per timeslot, S9PS (trf_69a)
Use: Gives a feeling how effectively the GPRS timeslots are used.data in kilobits------------------------------------------------------- =total time * average number of GPRS timeslots
sum(a.RLC_data_blocks_UL_CS1*20+a.RLC_data_blocks_UL_CS2*30)* 8/1000-------------------------------------------------------------------------------sum(b.period_duration*60)*sum(b.ave_GPRS_channels_sum)/sum(b.ave_GPRS_channels_den)
Counters from table(s):a = p_nbsc_packet_control_unitb = p_nbsc_res_availUnit: kbit/sec/tsl
Figure 380. Net UL data traffic per timeslot, S9PS (trf_69a)
Net DL data traffic per timeslot, S9PS (trf_70a)
Use: Gives a feeling how effectively the GPRS timeslots are used.data in kilobits------------------------------------------------------- =total time * average number of GPRS timeslots
sum(a.RLC_data_blocks_DL_CS1*20+a.RLC_data_blocks_DL_CS2*30)* 8/1000-------------------------------------------------------------------------------
156 (206) © Nokia Networks Oy DN98619493Nokia Proprietary and Confidential Issue 1-1en
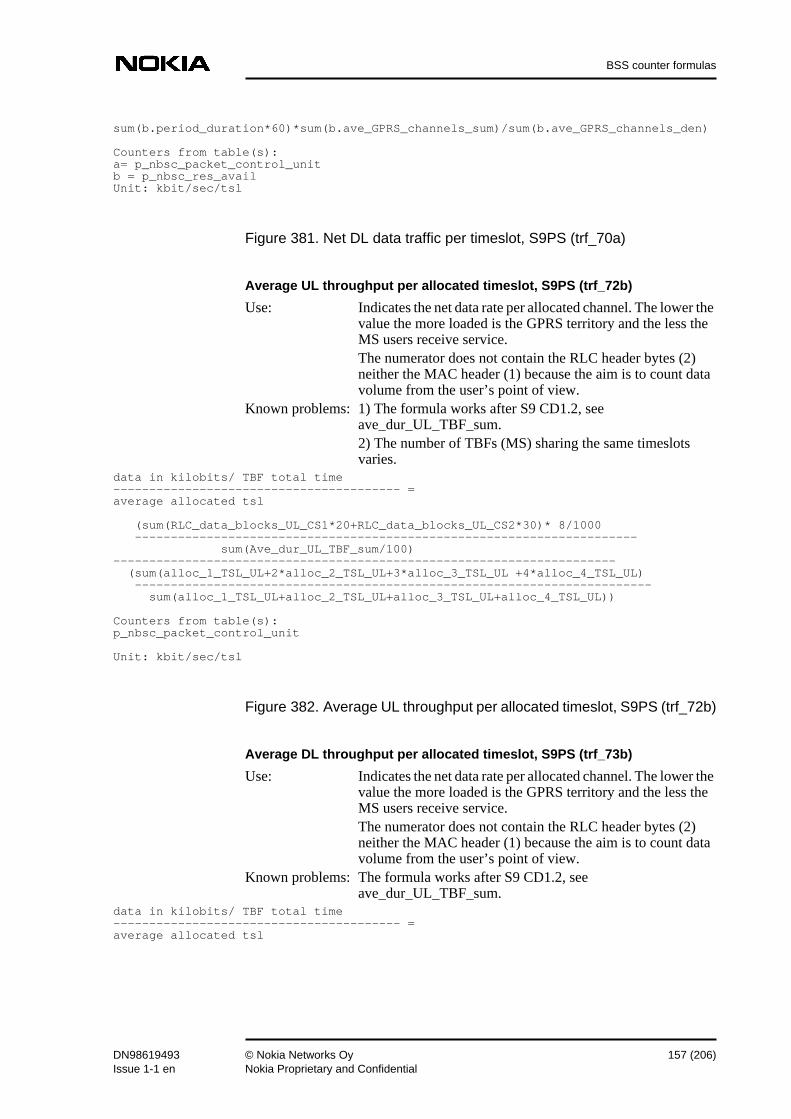
BSS counter formulas
sum(b.period_duration*60)*sum(b.ave_GPRS_channels_sum)/sum(b.ave_GPRS_channels_den)
Counters from table(s):a= p_nbsc_packet_control_unitb = p_nbsc_res_availUnit: kbit/sec/tsl
Figure 381. Net DL data traffic per timeslot, S9PS (trf_70a)
Average UL throughput per allocated timeslot, S9PS (trf_72b)
Use: Indicates the net data rate per allocated channel. The lower thevalue the more loaded is the GPRS territory and the less theMS users receive service.The numerator does not contain the RLC header bytes (2)neither the MAC header (1) because the aim is to count datavolume from the user’s point of view.
Known problems: 1) The formula works after S9 CD1.2, seeave_dur_UL_TBF_sum.2) The number of TBFs (MS) sharing the same timeslotsvaries.
data in kilobits/ TBF total time---------------------------------------- =average allocated tsl
(sum(RLC_data_blocks_UL_CS1*20+RLC_data_blocks_UL_CS2*30)* 8/1000 ---------------------------------------------------------------------- sum(Ave_dur_UL_TBF_sum/100)---------------------------------------------------------------------- (sum(alloc_1_TSL_UL+2*alloc_2_TSL_UL+3*alloc_3_TSL_UL +4*alloc_4_TSL_UL) ------------------------------------------------------------------------ sum(alloc_1_TSL_UL+alloc_2_TSL_UL+alloc_3_TSL_UL+alloc_4_TSL_UL))
Counters from table(s):p_nbsc_packet_control_unit
Unit: kbit/sec/tsl
Figure 382. Average UL throughput per allocated timeslot, S9PS (trf_72b)
Average DL throughput per allocated timeslot, S9PS (trf_73b)
Use: Indicates the net data rate per allocated channel. The lower thevalue the more loaded is the GPRS territory and the less theMS users receive service.The numerator does not contain the RLC header bytes (2)neither the MAC header (1) because the aim is to count datavolume from the user’s point of view.
Known problems: The formula works after S9 CD1.2, seeave_dur_UL_TBF_sum.
data in kilobits/ TBF total time---------------------------------------- =average allocated tsl
DN98619493 © Nokia Networks Oy 157 (206)Issue 1-1 en Nokia Proprietary and Confidential

BSS Network Doctor Formulas
(sum(RLC_data_blocks_DL_CS1*20+RLC_data_blocks_DL_CS2*30)* 8/1000 ---------------------------------------------------------------------- sum(Ave_dur_DL_TBF_sum/100 )---------------------------------------------------------------------- (sum(alloc_1_TSL_DL+2*alloc_2_TSL_DL+3*alloc_3_TSL_DL +4*alloc_4_TSL_DL) ------------------------------------------------------------------------ sum(alloc_1_TSL_DL+alloc_2_TSL_DL+alloc_3_TSL_DL+alloc_4_TSL_DL))
Counters from table(s):p_nbsc_packet_control_unit
Unit: kbit/sec/tsl
Figure 383. Average DL throughput per allocated timeslot, S9PS (trf_73b)
Total RLC data, S9PS (trf_74a)
Use: Indicates the total amount of data transmitted as CS1 or CS2blocks, UL or DL. MAC and RLC header bytes not included.
(sum(RLC_data_blocks_UL_CS1*20+RLC_data_blocks_UL_CS2*30+ RLC_data_blocks_DL_CS1*20+RLC_data_blocks_DL_CS2*30) /1000
Counters from table(s):p_nbsc_packet_control_unit
Unit: kbyte
Figure 384. Total RLC data, S9PS (trf_74a)
GPRS territory UL utilisation, S9PS (trf_76b)
Data blocks transmitted in UL100* --------------------------------------------------- % = (available GPRS channel time in sec)* (nbr of blocks per sec)
100*(DL blocks transmitted / DL block transmission capacity) % =
sum(rlc_data_blocks_ul_cs1 + rlc_data_blocks_ul_cs2 + rlc_mac_cntrl_blocks_ul + BAD_FRAME_IND_UL_CS1 + BAD_FRAME_IND_UL_CS2 + BAD_FRAME_IND_UL_UNACK + IGNOR_RLC_DATA_BL_UL_DUE_BSN)100* -------------------------------------------------------------- % sum(a.ave_gprs_channels_sum/sum(a.ave_gprs_channels_den) *sum(a.period_duration*60)*50
Counters from table(s):a = p_nbsc_res_availb = p_nbsc_packet_control_unit
Figure 385. GPRS territory UL utilisation, S9PS (trf_76b)
158 (206) © Nokia Networks Oy DN98619493Nokia Proprietary and Confidential Issue 1-1en

BSS counter formulas
GPRS territory DL utilisation, S9PS (trf_77a)
Known problems: Dummy blocks on DL make this PI to show a too high value.
Data blocks transmitted in DL and UL100* --------------------------------------------------- % = (available GPRS channel time in sec)* (nbr of blocks per sec)
100*(DL blocks transmitted / DL block transmission capacity) % =
sum( + b.RLC_data_blocks_DL_CS1 + b.RLC_data_blocks_DL_CS2 + b.RLC_MAC_cntrl_blocks_DL + b.retra_RLC_data_blocks_DL_CS1 + b.retra_RLC_data_blocks_DL_CS2 )100* --------------------------------------------------------------- % sum(a.ave_gprs_channels_sum/sum(a.ave_gprs_channels_den) *sum(a.period_duration*60)*50
Counters from table(s):a = p_nbsc_res_availb = p_nbsc_packet_control_unit
Figure 386. GPRS territory DL utilisation, S9PS (trf_77a)
UL GPRS timeslot usage, S9PS (trf_78a)
Use: Indicates how much resources (timeslots) the GPRS traffic(data) consumes on average during the period. Thisinformation is useful, for example, in forecasting the need forcapacity extension. This value represents erlangs on PTCH.
Actual UL data troughput (blocks)---------------------------------------------- =max. nbr of blocks during measurement period
sum(rlc_data_blocks_ul_cs1 + rlc_data_blocks_ul_cs2 + rlc_mac_cntrl_blocks_ul + BAD_FRAME_IND_UL_CS1 + BAD_FRAME_IND_UL_CS2 + BAD_FRAME_IND_UL_UNACK + IGNOR_RLC_DATA_BL_UL_DUE_BSN)-----------------------------------sum(period_duration*60)*50
Counters from table(s):p_nbsc_packet_control_unit
Unit: tsl (or erlang)
Figure 387. UL GPRS timeslot usage, S9PS (trf_78a)
DN98619493 © Nokia Networks Oy 159 (206)Issue 1-1 en Nokia Proprietary and Confidential

BSS Network Doctor Formulas
DL GPRS timeslot usage, S9PS (trf_79a)
Use: Indicates how much resources (timeslots) the GPRS traffic(data) consumes on average during the period. Thisinformation is useful, for example, in forecasting the need forcapacity extension. This value represents erlangs on PTCH.
Known problems: 1) MAC blocks contain dummy blocks.2) Transferred DL blocks, whose corresponding element inthe transmit window V(B) has the value PENDING ACK, arenot counted to any of the counters.
Actual DLdata troughput (blocks)---------------------------------------------- =max. nbr of blocks during measurement period
sum(rlc_data_blocks_dl_cs1 + rlc_data_blocks_dl_cs2 + rlc_mac_cntrl_blocks_dl + RETRA_RLC_DATA_BLOCKS_DL_CS1 + RETRA_RLC_DATA_BLOCKS_DL_CS2)----------------------------------sum(period_duration*60)*50
Counters from table(s):p_nbsc_packet_control_unitUnit: time slot or erlang
Figure 388. DL GPRS timeslot usage, S9PS (trf_79a)
2.22 Traffic directions
2.22.1 Mobile originated calls (moc)
SDCCH seizures for MO calls, S2 (moc_1)
Known problems: Includes supplementary services such as call divert.Includes SMS.
sum(succ_seiz_orig)
Counters from table(s):p_nbsc_res_access
Figure 389. SDCCH seizures for MO calls, S2 (moc_1)
Successful MO speech calls, S3 (moc_2)
Note: Triggered when a call is cleared. Excludes setup failures,TCH drops and TCH busy (congestion) cases.
Known problems: The measurement is on the BSC level.sum(nbr_of_calls)where counter_id = 44
160 (206) © Nokia Networks Oy DN98619493Nokia Proprietary and Confidential Issue 1-1en

BSS counter formulas
Note
Counters from table(s):p_nbsc_cc_pm
Figure 390. Successful MO speech calls, S3 (moc_2)
Successful MO data calls, S3 (moc_3)
Note: See moc_2.Known problems: The measurement is on the BSC level.
sum(nbr_of_calls)where counter_id = 45
Counters from table(s):p_nbsc_cc_pm
Figure 391. Successful MO data calls, S3 (moc_3)
MO call success ratio, S6 (moc_4)
Note: See moc_2.Known problems: The measurement is on the BSC level.
MO call attempts are counted when MOCs are found on SDCCH. The numeratorexcludes setup failures, TCH drops and TCH busy (congestion) cases.
sum(nbr_of_calls) where counter_id = 44 /* MO call completed */100 * ----------------------------------------------------------------------- sum(nbr_of_calls) where counter_id = 38 /* MO call attempt */
Counters from table(s):p_nbsc_cc_pm
Figure 392. MO call success ratio, S6 (moc_4)
MO speech call attempts, S3 (moc_5)
Note: Triggered when a call is cleared. Excludes setup failures,TCH drops and TCH busy (congestion) cases.
Known problems: The measurement is on the BSC level.sum(nbr_of_calls)where counter_id = 38
DN98619493 © Nokia Networks Oy 161 (206)Issue 1-1 en Nokia Proprietary and Confidential

BSS Network Doctor Formulas
Counters from table(s):p_nbsc_cc_pm
Figure 393. MO speech call attempts, S3 (moc_5)
MO call bids, S2 (moc_6)
Known problems: Includes supplementary services such as call divert.Includes SMS.
sum(succ_seiz_orig+tch_moc)
Counters from table(s):p_nbsc_res_access
Figure 394. MO call bids, S2 (moc_6)
2.22.2 Mobile terminated calls (mtc)
SDCCH seizures for MT calls, S2 (mtc_1)
Known problems: Includes SMS. See also moc_2.sum(succ_seiz_term)
Counters from table(s):p_nbsc_res_access
Figure 395. SDCCH seizures for MT calls, S2 (mtc_1)
Successful MT speech calls (mtc_2)
Note: See moc_2.Known problems: See moc_2.
sum(nbr_of_calls)where counter_id = 43
Counters from table(s):p_nbsc_cc_pm
Figure 396. Successful MT speech calls (mtc_2)
Successful MT data calls, S3 (mtc_3)
Note: See moc_2.Known problems: See moc_2.
sum(nbr_of_calls)where counter_id = 47
162 (206) © Nokia Networks Oy DN98619493Nokia Proprietary and Confidential Issue 1-1en
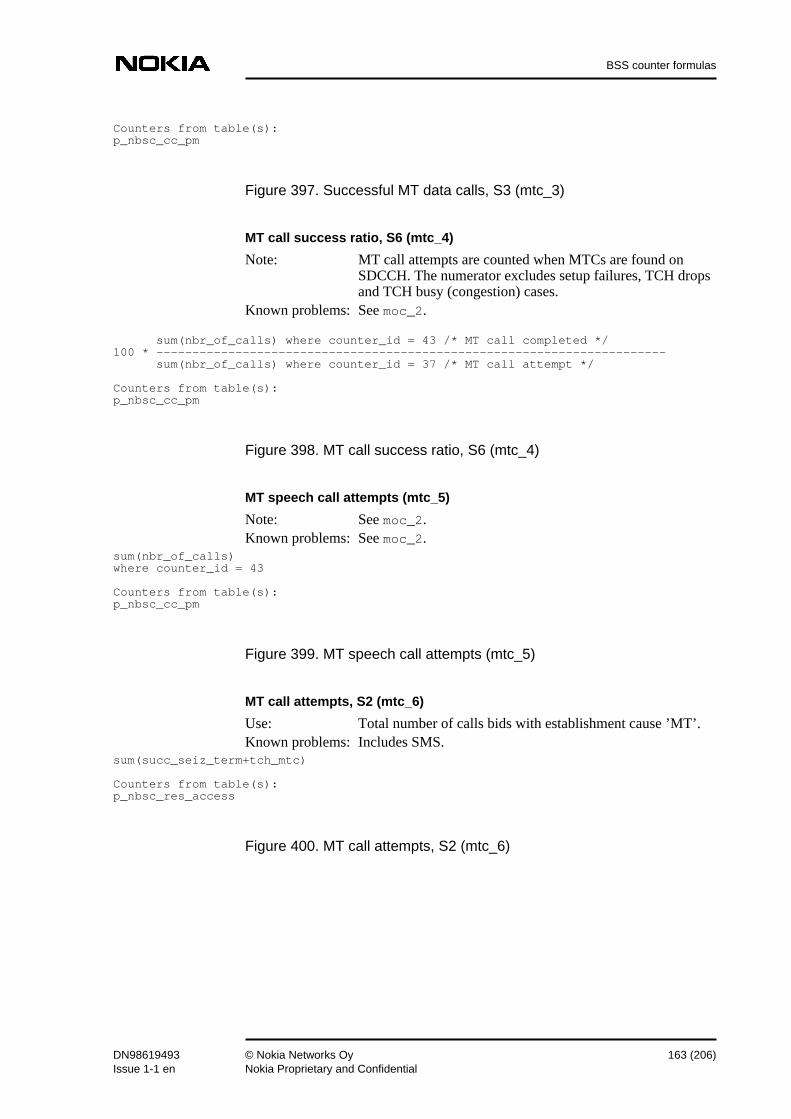
BSS counter formulas
Counters from table(s):p_nbsc_cc_pm
Figure 397. Successful MT data calls, S3 (mtc_3)
MT call success ratio, S6 (mtc_4)
Note: MT call attempts are counted when MTCs are found onSDCCH. The numerator excludes setup failures, TCH dropsand TCH busy (congestion) cases.
Known problems: See moc_2.
sum(nbr_of_calls) where counter_id = 43 /* MT call completed */100 * ----------------------------------------------------------------------- sum(nbr_of_calls) where counter_id = 37 /* MT call attempt */
Counters from table(s):p_nbsc_cc_pm
Figure 398. MT call success ratio, S6 (mtc_4)
MT speech call attempts (mtc_5)
Note: See moc_2.Known problems: See moc_2.
sum(nbr_of_calls)where counter_id = 43
Counters from table(s):p_nbsc_cc_pm
Figure 399. MT speech call attempts (mtc_5)
MT call attempts, S2 (mtc_6)
Use: Total number of calls bids with establishment cause ’MT’.Known problems: Includes SMS.
sum(succ_seiz_term+tch_mtc)
Counters from table(s):p_nbsc_res_access
Figure 400. MT call attempts, S2 (mtc_6)
DN98619493 © Nokia Networks Oy 163 (206)Issue 1-1 en Nokia Proprietary and Confidential

BSS Network Doctor Formulas
2.23 Paging (pgn)
Number of paging messages sent, S2 (pgn_1)
Known problems: The number of repagings cannot be separated.sum(paging_msg_sent)
Counters from table(s):p_nbsc_res_access
Figure 401. Number of paging messages sent, S2 (pgn_1)
Paging buffer size average, S1 (pgn_2)
Use: To have an idea of how close to problems the BTS has been.Known problems: It is difficult to say when the problems start. Even if the
counter 3018 does not yet show the 0 value, there may havebeen the situation in one or some of the buffers that thecapacity has run out.
avg(min_paging_buf)
Counters from table(s):p_nbsc_res_access
Parameters related:Number of Blocks for AGCH (AG): e.g. = 2Number of MultiFrames (MFR): e.g. = 6
Formulas related:Nbr of paging groups = (3-AG)*MFR ;if combinedcontrol channelNbr of paging groups = (9-AG)*MFR ;if non-combinedcontrol channel
Paging_Buffer_Size = free buffers (max8) * Nbr of paging groups
Min Paging Buffer (counter 3018) = min(Paging_Buffer_Space). = min(Paging_Buffer_Size/2)
Figure 402. Paging buffer size average, S1 (pgn_2)
Paging Buffer Space is sent by BTS in the CCH_Load_Ind message to a BSCevery 30 s. A BSC sends current paging load as Paging_Buffer_Size to astatistical unit. The minimum value of this is recorded as counter 3018. If MinPaging Buffer (counter 3018) equals to zero, paging blocking has occurred.
Average paging buffer space, S1 (pgn_3)
Use: Average remaining space for paging commands.avg(ave_pch_load/res_acc_denom2)
164 (206) © Nokia Networks Oy DN98619493Nokia Proprietary and Confidential Issue 1-1en

BSS counter formulas
Counters from table(s):p_nbsc_res_access
Figure 403. Average paging buffer space, S1 (pgn_3)
Paging success ratio, S1 (pgn_4)
Known problems: Ghosts can increment the denominator. Due to the verydynamic behaviour it seems that this formula is not useful.
sum over all BTS in LA (succ_seiz_term + tch_mtc)100* ------------------------------------------------------- % sum over LA(paging_msg_sent) / sum over LA (count of BTS)
Counters from table(s):p_nbsc_res_access
Figure 404. Paging success ratio, S1 (pgn_4)
Average paging buffer Aif occupancy, S7 (pgn_5)
sum (ave_paging_buffer_capa_numer)----------------------------------sum(ave_paging_buffer_capa_denom)
Counters from table(s):p_nbsc_res_access
Figure 405. Average paging buffer Aif occpancy, S7 (pgn_5)
Average paging buffer Gb occpancy, S7PS (pgn_6)u
sum (ave_paging_gb_buf_sum)---------------------------sum(ave_paging_gb_buf_den)
Counters from table(s):p_nbsc_res_access
Figure 406. Average paging buffer Gb occpancy, S7PS (pgn_6)
Average DRX buffer occupancy due to paging, S7 (pgn_7)
sum (ave_paging_load_air_sum)---------------------------sum(ave_paging_load_air_den)
DN98619493 © Nokia Networks Oy 165 (206)Issue 1-1 en Nokia Proprietary and Confidential

BSS Network Doctor Formulas
Counters from table(s):p_nbsc_res_access
Figure 407. Average DRX buffer occpancy due to paging, S7 (pgn_7)
Average DRX buffer occupancy due to DRX AG, S7 (pgn_8)
sum (ave_drx_agch_load_air_sum)-------------------------------sum(ave_drx_agch_load_air_den)
Counters from table(s):p_nbsc_res_access
Figure 408. Average DRX buffer occpancy due to DRX AG, S7 (pgn_8)
Average DRX buffer occupancy due to nonDRX AG, S7 (pgn_9)
sum (ave_non_drx_agch_load_air_sum)-----------------------------------sum(ave_non_drx_agch_load_air_den)
Counters from table(s):p_nbsc_res_access
Figure 409. Average DRX buffer occpancy due to nonDRX AG, S7(pgn_9)
2.24 Short message service (sms)
SMS establishment failure % (sms_1)
100* unsuccessful SMS establishments / all SMS establishments =
sum(unsucc_TCH_sms_est+unsucc_SDCCH_sms_est)100* ------------------------------------------------------------------ % sum(succ_TCH_sms_est+unsucc_TCH_sms_est+succ_SDCCH_sms_est +unsucc_SDCCH_sms_est)
Counters from table(s):p_nbsc_res_access
Figure 410. SMS establishment failure % (sms_1)
SMS TCH establishment failure % (sms_2)
sum(unsucc_TCH_sms_est)100 * ------------------------------------------- % sum(succ_TCH_sms_est+unsucc_TCH_sms_est)
166 (206) © Nokia Networks Oy DN98619493Nokia Proprietary and Confidential Issue 1-1en

BSS counter formulas
Counters from table(s):p_nbsc_res_access
Figure 411. SMS TCH establishment failure % (sms_2)
SMS SDCCH establishment failure % (sms_3)
Use: MOC: Instead of the sending SETUP message, the MS startsSMS by sending SABM with SAPI 3 to BTS, and a newestablishment indication is generated.MTC : Instead of the sending SETUP message, the MSCstarts SMS by sending the CP DATA message to BSC andBSC sends an ESTABLISH REQUEST to BTS, then MSanswers by UA message, and an ESTABLISH CONFIRMmessage is generated.SMS fails if the message data is corrupted, timer expires inwaiting for an establishment confirmation, or if an errorindication or release indication is received.
sum(unsucc_sdcch_sms_est)100 * -------------------------------------------- % sum(succ_sdcch_sms_est+unsucc_sdcch_sms_est)
Counters from table(s):p_nbsc_res_access
Figure 412. SMS SDCCH establishment failure % (sms_3)
SMS establishment attempts (sms_4)
sum(succ_tch_sms_est+unsucc_tch_sms_est+succ_sdcch_sms_est+unsucc_sdcch_sms_est)
Counters from table(s):p_nbsc_res_access
Figure 413. SMS establishment attempts (sms_4)
SMS SDCCH establishment attempts (sms_5)
sum(succ_sdcch_sms_est+unsucc_sdcch_sms_est)
Counters from table(s):p_nbsc_res_access
Figure 414. SMS SDCCH establishment attempts (sms_5)
DN98619493 © Nokia Networks Oy 167 (206)Issue 1-1 en Nokia Proprietary and Confidential

BSS Network Doctor Formulas
SMS TCH establishment attempts (sms_6)
sum(succ_TCH_sms_est+unsucc_TCH_sms_est)
Counters from table(s):p_nbsc_res_access
Figure 415. SMS TCH establishment attempts (sms_6)
2.25 Directed retry (dr)
DR, outgoing attempts, S3 (dr_1)
sum(msc_o_sdcch_tch_at+ bsc_o_sdcch_tch_at)
Counters from table(s):p_nbsc_ho
Figure 416. DR, outgoing attempts, S3 (dr_1)
DR attempts, S3 (dr_1a)
Use: Includes all DR cases (to another cell and intra-cell).sum(p_nbsc_ho.cause_dir_retry)
Counters from table(s):p_nbsc_ho
Figure 417. DR attempts, S3 (dr_1a)
DR, incoming attempts, S3 (dr_2)
sum(msc_i_sdcch_tch_at+ bsc_i_sdcch_tch_at)
Counters from table(s):p_nbsc_ho
Figure 418. DR, incoming attempts, S3 (dr_2)
DR, outgoing success to another cell, S3 (dr_3)
sum(msc_o_sdcch_tch+ bsc_o_sdcch_tch)
Counters from table(s):p_nbsc_ho
Figure 419. DR, outgoing success to another cell, S3 (dr_3)
168 (206) © Nokia Networks Oy DN98619493Nokia Proprietary and Confidential Issue 1-1en

BSS counter formulas
DR, incoming success from another cell, S3 (dr_4)
sum(msc_i_sdcch_tch+ bsc_i_sdcch_tch)
Counters from table(s):p_nbsc_ho
Figure 420. DR, incoming success from another cell, S3 (dr_4)
DR, intra-cell success, S3 (dr_5)
Use: Triggered by• S6 feature ’TCH assignment to super-reuse in IUO’• S7 feature ’Direct access to super-reuse TRX’
sum(cell_sdcch_tch)
Counters from table(s):p_nbsc_ho
Figure 421. DR, intra-cell success, S3 (dr_5)
% of new calls successfully handed over to another cell by DR, S3 (dr_6)
100*sum(msc_o_sdcch_tch+ bsc_o_sdcch_tch)/sum(tch_call_req)
Counters from table(s):p_nbsc_ho
Figure 422. % of new calls successfully handed over to another cell byDR, S3 (dr_6)
DR, outgoing to another cell, failed, S3 (dr_7)
sum(msc_o_sdcch_tch_at + bsc_o_sdcch_tch_at - msc_o_sdcch_tch + bsc_o_sdcch_tch)
Counters from table(s):p_nbsc_ho
Figure 423. DR, outgoing to another cell, failed, S3 (dr_7)
DR, intra-cell failed, S3 (dr_8)
Use: Triggered by• S6 feature ’TCH assignment to super-reuse in IUO’• S7 feature ’Direct access to super-reuse TRX’
sum(cell_sdcch_tch_at- cell_sdcch_tch)
DN98619493 © Nokia Networks Oy 169 (206)Issue 1-1 en Nokia Proprietary and Confidential

BSS Network Doctor Formulas
Counters from table(s):p_nbsc_ho
Figure 424. DR, intra-cell failed, S3 (dr_8)
2.26 Availability (ava)
TCH availability %, S4 (ava_1a)
Known problems: If TRXs are locked and BTSs and BCFs are unlocked, theTCHs appear as unavailable.This PI does not take HTCH into consideration.
available TCH100 * ------------------ % all TCH sum(ave_avail_full_TCH/res_av_denom2)=100 * ------------------------------------------------------------------------ % sum(ave_avail_full_TCH/res_av_denom2)+sum(ave_non_avail_TCH)
Counters from table(s):p_nbsc_res_avail
Figure 425. TCH availability %, S4 (ava_1a)
TCH availability %, S9 (ava_1c)
Use: Failures (downtime) of TRXs cause loss of TCH and affectthis KPI.
Known problems: 1) If TRXs are locked and BTSs and BCFs are unlocked, theTCHs appear as unavailable. This means that both the systemand the user can affect this KPI and make it less useful.2) The formula leaves out the timeslots reserved for GPRS.
available TCH100 * ------------------ % all TCH sum(ave_avail_TCH_sum/ave_avail_TCH_den)=100 * ------------------------------------------------------------------------ % sum(ave_avail_TCH_sum/ave_avail_TCH_den)+sum(ave_non_avail_TCH)
Counters from table(s):p_nbsc_res_avail
Figure 426. TCH availability %, S9 (ava_1c)
170 (206) © Nokia Networks Oy DN98619493Nokia Proprietary and Confidential Issue 1-1en
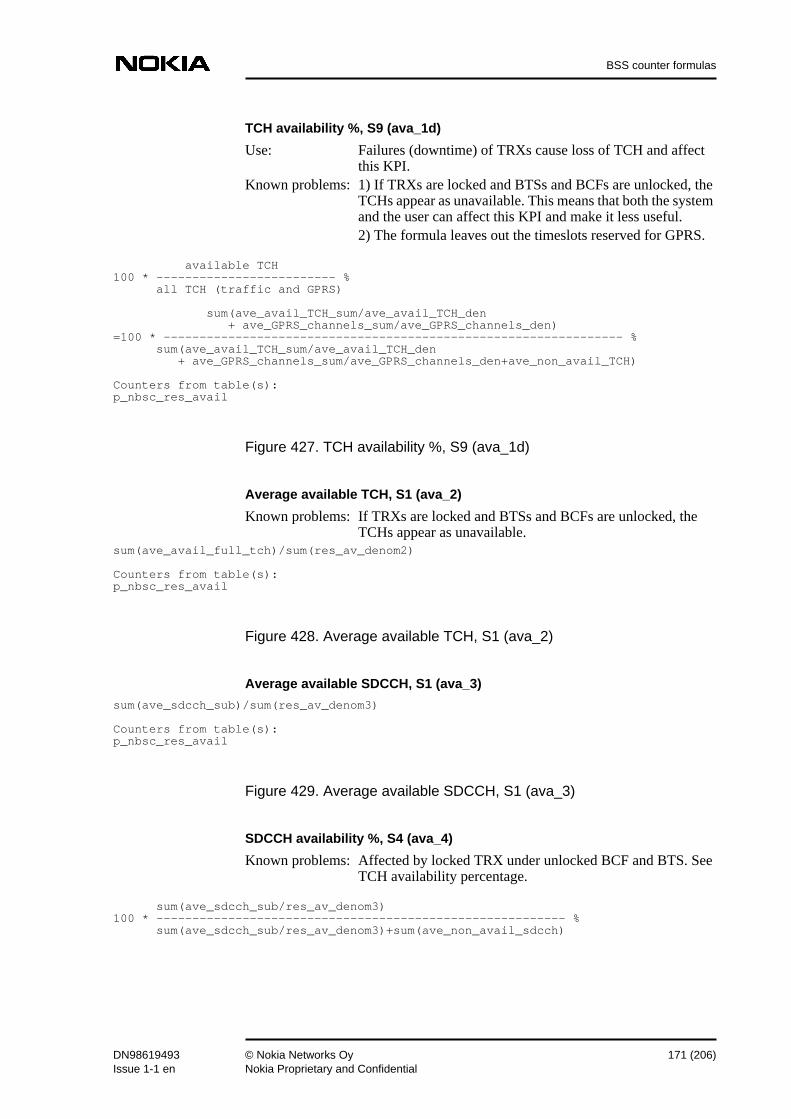
BSS counter formulas
TCH availability %, S9 (ava_1d)
Use: Failures (downtime) of TRXs cause loss of TCH and affectthis KPI.
Known problems: 1) If TRXs are locked and BTSs and BCFs are unlocked, theTCHs appear as unavailable. This means that both the systemand the user can affect this KPI and make it less useful.2) The formula leaves out the timeslots reserved for GPRS.
available TCH100 * ------------------------- % all TCH (traffic and GPRS)
sum(ave_avail_TCH_sum/ave_avail_TCH_den + ave_GPRS_channels_sum/ave_GPRS_channels_den)=100 * ---------------------------------------------------------------- % sum(ave_avail_TCH_sum/ave_avail_TCH_den + ave_GPRS_channels_sum/ave_GPRS_channels_den+ave_non_avail_TCH)
Counters from table(s):p_nbsc_res_avail
Figure 427. TCH availability %, S9 (ava_1d)
Average available TCH, S1 (ava_2)
Known problems: If TRXs are locked and BTSs and BCFs are unlocked, theTCHs appear as unavailable.
sum(ave_avail_full_tch)/sum(res_av_denom2)
Counters from table(s):p_nbsc_res_avail
Figure 428. Average available TCH, S1 (ava_2)
Average available SDCCH, S1 (ava_3)
sum(ave_sdcch_sub)/sum(res_av_denom3)
Counters from table(s):p_nbsc_res_avail
Figure 429. Average available SDCCH, S1 (ava_3)
SDCCH availability %, S4 (ava_4)
Known problems: Affected by locked TRX under unlocked BCF and BTS. SeeTCH availability percentage.
sum(ave_sdcch_sub/res_av_denom3)100 * --------------------------------------------------------- % sum(ave_sdcch_sub/res_av_denom3)+sum(ave_non_avail_sdcch)
DN98619493 © Nokia Networks Oy 171 (206)Issue 1-1 en Nokia Proprietary and Confidential

BSS Network Doctor Formulas
Counters from table(s):p_nbsc_res_avail
Figure 430. SDCCH availability %, S4 (ava_4)
Average available FTCH in area, S1 (ava_5)
sum_over_area (sum_over_BTS(ave_avail_full_TCH)/sum_over_BTS(res_av_denom2) )
Counters from table(s):p_nbsc_res_avail
Figure 431. Average available FTCH in area, S1 (ava_5)
DMR availability %, S6 (ava_6)
sum(avail_time)100 * ---------------- % sum(total_time)
Counters from table(s):p_nbsc_dmr
Figure 432. DMR availability %, S6 (ava_6)
DN2 availability %, S6 (ava_7)
sum(avail_time)100 * --------------- % sum(total_time)
Counters from table(s):p_nbsc_dn2
Figure 433. DN2 availability %, S6 (ava_7)
TRU availability %, S6 (ava_8)
sum(avail_time)100 * --------------- % sum(total_time)
172 (206) © Nokia Networks Oy DN98619493Nokia Proprietary and Confidential Issue 1-1en
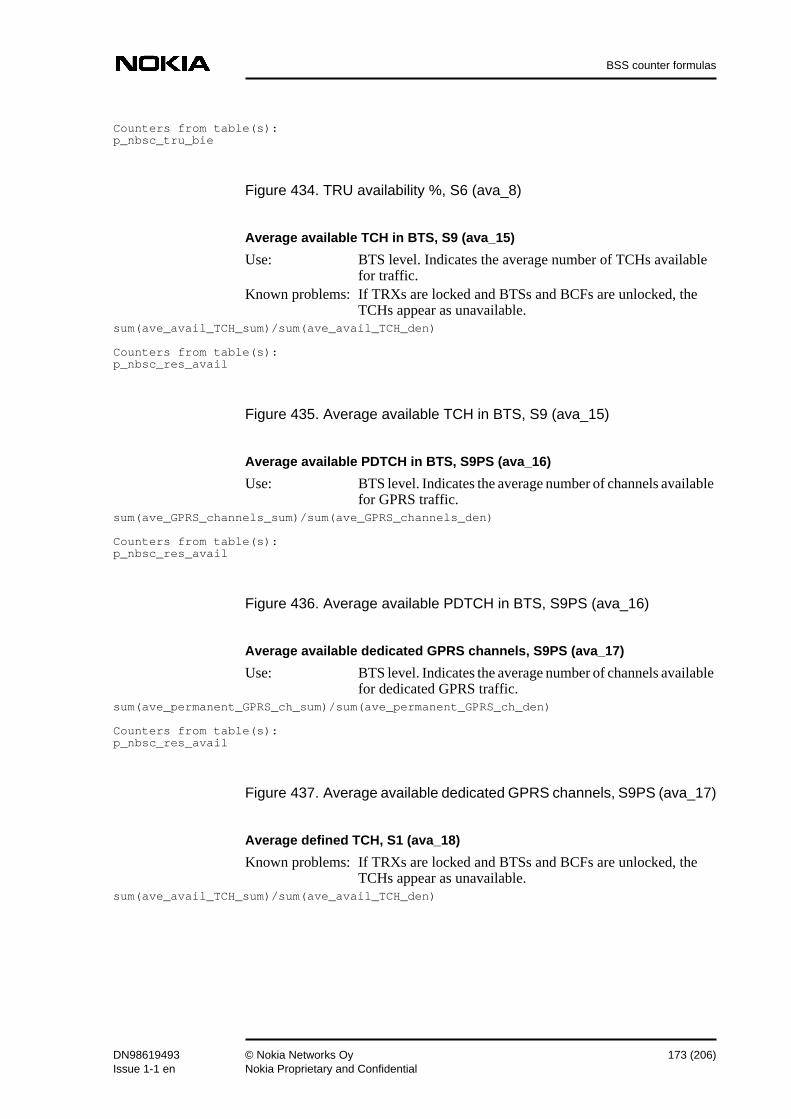
BSS counter formulas
Counters from table(s):p_nbsc_tru_bie
Figure 434. TRU availability %, S6 (ava_8)
Average available TCH in BTS, S9 (ava_15)
Use: BTS level. Indicates the average number of TCHs availablefor traffic.
Known problems: If TRXs are locked and BTSs and BCFs are unlocked, theTCHs appear as unavailable.
sum(ave_avail_TCH_sum)/sum(ave_avail_TCH_den)
Counters from table(s):p_nbsc_res_avail
Figure 435. Average available TCH in BTS, S9 (ava_15)
Average available PDTCH in BTS, S9PS (ava_16)
Use: BTS level. Indicates the average number of channels availablefor GPRS traffic.
sum(ave_GPRS_channels_sum)/sum(ave_GPRS_channels_den)
Counters from table(s):p_nbsc_res_avail
Figure 436. Average available PDTCH in BTS, S9PS (ava_16)
Average available dedicated GPRS channels, S9PS (ava_17)
Use: BTS level. Indicates the average number of channels availablefor dedicated GPRS traffic.
sum(ave_permanent_GPRS_ch_sum)/sum(ave_permanent_GPRS_ch_den)
Counters from table(s):p_nbsc_res_avail
Figure 437. Average available dedicated GPRS channels, S9PS (ava_17)
Average defined TCH, S1 (ava_18)
Known problems: If TRXs are locked and BTSs and BCFs are unlocked, theTCHs appear as unavailable.
sum(ave_avail_TCH_sum)/sum(ave_avail_TCH_den)
DN98619493 © Nokia Networks Oy 173 (206)Issue 1-1 en Nokia Proprietary and Confidential

BSS Network Doctor Formulas
Counters from table(s):p_nbsc_res_avail
Figure 438. Average defined TCH, S1 (ava_18)
2.27 Unavailability (uav)
Average unavailable TSL per BTS, S1 (uav_1)
Known problems: If TRXs are locked and BTSs and BCFs are unlocked, theTCHs appear as unavailable.
sum(ave_non_avail_tsl)/sum(res_av_denom1)
Counters from table(s):p_nbsc_res_avail
Figure 439. Average unavailable TSL per BTS, S1 (uav_1)
Average unavailable TSL per BTS, S1 (uav_1a)
Known problems: If TRXs are locked and BTSs and BCFs are unlocked, theTCHs appear as unavailable.
avg(ave_non_avail_tsl/res_av_denom1)
Counters from table(s):p_nbsc_res_avail
Figure 440. Average unavailable TSL per BTS, S1 (uav_1a)
Average unavailable TSL per BTS, S1 (uav_1b)
Known problems: If TRXs are locked and BTSs and BCFs are unlocked, theTCHs appear as unavailable.
sum(ave_non_avail_tsl/res_av_denom1) ------------------------------------ count(*)
Counters from table(s):p_nbsc_res_avail
Figure 441. Average unavailable TSL per BTS, S1 (uav_1b)
Total outage time, (uav_2)
Known problems: It should be made possible to differentiate the reasons foroutage.
174 (206) © Nokia Networks Oy DN98619493Nokia Proprietary and Confidential Issue 1-1en

BSS counter formulas
Note: Alarm number changed in S7.sum of BCCH missing alarmdurations =
sum(cancel_time-alarm_time)*24*60
where probable_cause = 2567 /* BCCHmissing alarm */
Counters from table(s):fx_alarmunit = minutes
Figure 442. Total outage time, (uav_2)
Number of outages, (uav_3)
Note: Alarm number changed in S7.number of BCCH missing alarmstarts =
count(alarm_start_time)
where probable_cause = 2567 /* BCCHmissing alarm */
Counters from table(s):fx_alarm
Figure 443. Number of outages, (uav_3)
Share of unavailability due to user (uav_4)
Experiences on use: Locked TRXs can make this PI show high values.Known problems: The measurement is made on the BSC level. The BTS level
cannot be seen.
sum(ave_non_avail_user)100 * -------------------------------------------------------------- % sum(ave_non_avail_user + ave_non_avail_int + ave_non_avail_ext)
Counters from table(s):p_nbsc_trx_avail
Figure 444. Share of unavailability due to user (uav_4)
Share of unavailability due to internal reasons (uav_5)
Known problems: The measurement is made on the BSC level. The BTS levelcannot be seen. This includes, for example, also an electricitybreak which, in fact, is not a BTS fault.
sum(ave_non_avail_int)
DN98619493 © Nokia Networks Oy 175 (206)Issue 1-1 en Nokia Proprietary and Confidential

BSS Network Doctor Formulas
100 * -------------------------------------------------------------- % sum(ave_non_avail_user + ave_non_avail_int + ave_non_avail_ext)
Counters from table(s):p_nbsc_trx_avail
Figure 445. Share of unavailability due to internal reasons (uav_5)
Share of unavailability due to external reasons (uav_6)
Known problems: The measurement is made on the BSC level. The BTS levelcannot be seen.
sum(ave_non_avail_ext)100 * -------------------------------------------------------------- % sum(ave_non_avail_user + ave_non_avail_int + ave_non_avail_ext)
Counters from table(s):p_nbsc_trx_avail
Figure 446. Share of unavailability due to external reasons (uav_6)
TRX unavailability time due to user (uav_7)
Experiences on use: Locked TRXs can make this PI show high values.sum(period_duration * ave_non_avail_user)
Counters from table(s):p_nbsc_trx_avail
Figure 447. TRX unavailability time due to user (uav_7)
TRX unavailability time due to internal reasons (uav_8)
Known problems: This includes, for example, also an electricity break which, infact, is not a BTS fault.
sum(period_duration * ave_non_avail_int)
Counters from table(s):p_nbsc_trx_avail
Figure 448. TRX unavailability time due to internal reasons (uav_8)
TRX unavailability time due to external reasons (uav_9)
sum(period_duration * ave_non_avail_ext)
176 (206) © Nokia Networks Oy DN98619493Nokia Proprietary and Confidential Issue 1-1en

BSS counter formulas
Counters from table(s):p_nbsc_trx_avail
Figure 449. TRX unavailability time due to external reasons (uav_9)
2.28 Location updates (lu)
Number of LU attempts, S1 (lu_1)
sum(sdcch_loc_upd)
Counters from table(s):p_nbsc_res_access
Figure 450. Number of LU attempts, S1 (lu_1)
Average of LU attempts per hour, S1 (lu_2)
sum(sdcch_loc_upd)--------------------------------avg(period_duration)*count(*)/60
Counters from table(s):p_nbsc_res_access
Figure 451. Average of LU attempts per hour, S1 (lu_2)
Number of LU attempts, S1 (lu_3)
sum(nbr_of_calls)where counter_id = 25 /* LUstarted */
Counters from table(s):p_nbsc_res_access
Figure 452. Number of LU attempts, S1 (lu_3)
2.29 LU success % (lsr)
LU success %, S6 (lsr_2)
Use: Probable causes to make this KPI show bad values:interference, coverage, possibly MSC side problems.
DN98619493 © Nokia Networks Oy 177 (206)Issue 1-1 en Nokia Proprietary and Confidential

BSS Network Doctor Formulas
Known problems: The measurement is made on the BSC level.The LU started (51025) is triggered from establish indication.Any problems prior to that cannot be seen. For example,interference prevents a mobile station from making a locationupdate.
Values: Good: >99% .
sum(nbr_of_calls) where counter_id = 26 /* LU completed */100 * -------------------------------------------------------------- % sum(nbr_of_calls) where counter_id = 25 /* LU started */
Counters from table(s):p_nbsc_cc_pm
Figure 453. LU success %, S6 (lsr_2)
2.30 Emergency call (ec)
Emergency calls, S6 (ec_1)
sum(nbr_of_calls)where counter_id = 35 /* Em.callstarted */
Counters from table(s):p_nbsc_cc_pm
Figure 454. Emergency calls, S6 (ec_1)
2.31 Emergency call success % (ecs)
Emergency call success %, S6 (ecs_1)
sum(nbr_of_calls) where counter_id = 41 /* Em.call completed */100 * ----------------------------------------------------------------------- sum(nbr_of_calls) where counter_id = 35 /* Em.call started */
Counters from table(s):p_nbsc_cc_pm
Figure 455. Emergency call success %, S6 (ecs_1)
178 (206) © Nokia Networks Oy DN98619493Nokia Proprietary and Confidential Issue 1-1en

BSS counter formulas
2.32 Call re-establishment (re)
Call re-establishment attempts, S6 (re_1)
sum(nbr_of_calls)where counter_id = 36 /* Callreest. started */
Counters from table(s):p_nbsc_cc_pm
Figure 456. Call re-establishment attempts, S6 (re_1)
Call re-establishments, S6 (re_2)
sum(sdcch_call_re_est+tch_call_re_est)
Counters from table(s):p_nbsc_res_access
Figure 457. Call re-establishments, S6 (re_2)
2.33 Call re-establishment success % (res)
Call re-establishment success %, S6 (res_1)
sum(nbr_of_calls) where counter_id = 42 /* Call re-est. completed */100 * ----------------------------------------------------------------------- sum(nbr_of_calls) where counter_id = 36 /* Call re-est. started */
Counters from table(s):p_nbsc_cc_pm
Figure 458. Call re-establishment success %, S6 (res_1)
2.34 Quality
2.34.1 Downlink quality (dlq)
DL BER, S1 (dlq_1)
Known problems: BER % is not a very easy entity for network planners.sum(ave_dl_sig_qual)------------------------ %sum(power_denom5)*100
DN98619493 © Nokia Networks Oy 179 (206)Issue 1-1 en Nokia Proprietary and Confidential

BSS Network Doctor Formulas
Counters from table(s):p_nbsc_powerUnit = BER %
Figure 459. DL BER, S1 (dlq_1)
DL cumulative quality % in class X, S1 (dlq_2)
Use: This PI gives a cumulative percentage of call samples inclasses 0 to X. X=5 is normally used as quality indicator. IfX=5 and this figure is 100 %, then the MS users obviouslyhave not perceived any quality problems.
sum(freq_dl_qual0 + ... + freq_dl_qualX)100 * --------------------------------------------- % sum( freq_dl_qual0 + ... + freq_dl_qual7)
Counters from table(s):p_nbsc_rx_qual
Figure 460. DL cumulative quality % in class X, S1 (dlq_2)
DL cumulative quality % in class X, S1 (dlq_2a)
Use: This PI gives a cumulative percentage of call samples inclasses 0 to X. X=5 is normally used as quality indicator. IfX=5 and this figure is 100 %, then the MS users obviouslyhave not perceived any quality problems.
sum(freq_dl_qual0 + ... + freq_dl_qualX)100 * --------------------------------------------- % sum(freq_dl_qual0 + ... + freq_dl_qual7)
Counters from table(s):p_nbsc_rx_statistics
Figure 461. DL cumulative quality % in class X, S1 (dlq_2a)
2.34.2 Uplink quality (ulq)
UL BER, S1 (ulq_1)
Known problems: BER % is not a very easy entity for network planners.sum(ave_ul_sig_qual)------------------------ %sum(power_denom6)*100
180 (206) © Nokia Networks Oy DN98619493Nokia Proprietary and Confidential Issue 1-1en

BSS counter formulas
Counters from table(s):p_nbsc_power
Figure 462. UL BER, S1 (ulq_1)
UL cumulative quality % in class X, S1 (ulq_2)
Use: This PI gives a cumulative percentage of call samples inclasses 0 to X. X=5 is normally used as quality indicator. IfX=5 and this figure is 100 %, then the MS users obviouslyhave not perceived any quality problems.
Known problems: Investigations in late 1997 showed that UL DTX makes ULquality seem worse than it actually is. The impact was aboutone 1% unit (1% of samples more in classes 6 and 7). Wheninvestigated with field tests, no real degradation of qualitycould be found.
sum(freq_ul_qual0 + ... + freq_ul_qualX)100 * --------------------------------------------- % sum(freq_ul_qual0 + ... + freq_ul_qual7)
Counters from table(s):p_nbsc_rx_qual
Figure 463. UL cumulative quality % in class X, S1 (ulq_2)
UL cumulative quality % in class X, S1 (ulq_2a)
Use: This PI gives a cumulative percentage of call samples inclasses 0 to X. X=5 is normally used as quality indicator. IfX=5 and this figure is 100 %, then the MS users obviouslyhave not perceived any quality problems.
sum(freq_ul_qual0 + ... + freq_ul_qualX)100 * --------------------------------------------- % sum(freq_ul_qual0 + ... + freq_ul_qual7)
Counters from table(s):p_nbsc_rx_qual
Figure 464. UL cumulative quality % in class X, S1 (ulq_2a)
DN98619493 © Nokia Networks Oy 181 (206)Issue 1-1 en Nokia Proprietary and Confidential

BSS Network Doctor Formulas
2.35 Downlink and uplink level
2.35.1 Downlink level (dll)
Share % per range, S4 (dll_1)
sum over a range (class_upper_range) (freq_dl_qual0+freq_dl_qual1+freq_dl_qual2+freq_dl_qual3+freq_dl_qual4 +freq_dl_qual5+freq_dl_qual6+freq_dl_qual7)100 * ----------------------------------------------------------- % sum over all ranges (freq_dl_qual0+freq_dl_qual1+freq_dl_qual2+freq_dl_qual3+freq_dl_qual4 +freq_dl_qual5+freq_dl_qual6+freq_dl_qual7)
Counters from table(s):p_nbsc_rx_statistics
Figure 465. Share % per range, S4 (dll_1)
2.35.2 Uplink level (ull)
Share % per range, S4 (ull_1)
sum over a range (class_upper_range) (freq_ul_qual0+freq_ul_qual1+freq_ul_qual2+freq_ul_qual3+freq_ul_qual4 +freq_ul_qual5+freq_ul_qual6+freq_ul_qual7)100 * ----------------------------------------------------------- % sum over all ranges (freq_ul_qual0+freq_ul_qual1+freq_ul_qual2+freq_ul_qual3+freq_ul_qual4 +freq_ul_qual5+freq_ul_qual6+freq_ul_qual7)
Counters from table(s):p_nbsc_rx_statistics
Figure 466. Share % per range, S4 (ull_1)
2.36 Power (pwr)
Average MS power, S2 (pwr_1)
max_power-2*sum(ave_ms_power)/sum(power_denom1)
max_power = 43 (GSM900) or max_power = 30(GSM1800, GSM1900)
Counters from table(s):p_nbsc_power
Figure 467. Average MS power, S2 (pwr_1)
182 (206) © Nokia Networks Oy DN98619493Nokia Proprietary and Confidential Issue 1-1en

BSS counter formulas
Average MS power, S2 (pwr_1b)
Note: max_power = 43 (GSM900) or 30 (GSM1800, GSM1900)decode(objects.frequency_band_in_use,0,43,30)-2*sum(ave_ms_power)/sum(power_denom1)
Counters from table(s):p_nbsc_power
Figure 468. Average MS power, S2 (pwr_1b)
Average BS power, S2 (pwr_2)
max_power - 2*sum(ave_BS_power)/sum(power_denom2)
max_power depends on the TRX used.
Counters from table(s):p_nbsc_power
Figure 469. Average BS power, S2 (pwr_2)
2.37 Level (lev)
Average DL signal strength, S2 (lev_1)
-110+sum(ave_dl_sig_str)/sum(power_denom3)
Counters from table(s):p_nbsc_power
Figure 470. Average DL signal strength, S2 (lev_1)
Average DL signal strength, S2 (lev_1a)
decode(ave_dl_sig_str/power_denom3,0,’< -110’,63,’> -48’,(-110+(round(ave_dl_sig_str/power_denom3)-1))||’..’||(-110+round(ave_dl_sig_str/power_denom3)))
Counters from table(s):p_nbsc_power
Figure 471. Average DL signal strength, S2 (lev_1a)
DN98619493 © Nokia Networks Oy 183 (206)Issue 1-1 en Nokia Proprietary and Confidential

BSS Network Doctor Formulas
Average UL signal strength, S2 (lev_2)
-110+sum(ave_ul_sig_str)/sum(power_denom4)
Counters from table(s):p_nbsc_power
Figure 472. Average UL signal strength, S2 (lev_2)
Average UL signal strength, S2 (lev_2a)
decode(ave_ul_sig_str/power_denom4,0,’< -110’,63,’> -48’,(-110+(round(ave_ul_sig_str/power_denom4)-1))||’..’||(-110+round(ave_ul_sig_str/power_denom4)))
Counters from table(s):p_nbsc_power
Figure 473. Average UL signal strength, S2 (lev_2a)
2.38 Distance (dis)
Average MS-BS distance (dis_1)
avg(ave_ms_bs_dist)*550 meter
Counters from table(s):p_nbsc_power
Figure 474. Average MS-BS distance (dis_1)
The condition below should be applied in order to filter out the hours that do nothave traffic and for that reason show 0:
peak_ms_bs_dist+ave_dl_sig_str/power_denom3+ave_ul_sig_str/power_denom4 > 0
2.39 Link balance, power, level (lb)
Link balance, S1 (lb_1)
Known problems: Inaccurate.
184 (206) © Nokia Networks Oy DN98619493Nokia Proprietary and Confidential Issue 1-1en

BSS counter formulas
avg(ave_dl_sig_str/power_denom3)- avg(ave_ul_sig_str/power_denom4)
Counters from table(s):p_nbsc_power
Figure 475. Link balance, S1 (lb_1)
Share in acceptance range, S4 (lb_2)
Known problems: The usefulness of link balance measurement is questionable.
sum(normal+ms_limited+bs_limited+max_power)
{where class_sig_level <= upper thresholdand class_sig_level >= lower threshold }100 * ------------------------------------------------- % sum(normal+ms_limited+bs_limited+max_power)
Counters from table(s):p_nbsc_link_balance
Figure 476. Share in acceptance range, S4 (lb_2)
Share in normal, S4 (lb_3)
Known problems: The usefulness of link balance measurement is questionable.
sum(normal)100 * ------------------------------------------------- % sum(normal+ms_limited+bs_limited+max_power)
Counters from table(s):p_nbsc_link_balance
Figure 477. Share in normal, S4 (lb_3)
Share in MS limited, S4 (lb_4)
Known problems: The usefulness of link balance measurement is questionable.
sum(ms_limited)100 * ------------------------------------------------- % sum(normal+ms_limited+bs_limited+max_power)
Counters from table(s):p_nbsc_link_balance
Figure 478. Share in MS limited, S4 (lb_4)
DN98619493 © Nokia Networks Oy 185 (206)Issue 1-1 en Nokia Proprietary and Confidential

BSS Network Doctor Formulas
Share in BS limited, S4 (lb_5)
Known problems: The usefulness of link balance measurement is questionable.
sum(bs_limited)100 * ------------------------------------------------- % sum(normal+ms_limited+bs_limited+max_power)
Counters from table(s):p_nbsc_link_balance
Figure 479. Share in BS limited, S4 (lb_5)
Share in maximum power, S4 (lb_6)
Known problems: The usefulness of link balance measurement is questionable.
sum(max_power)100 * ------------------------------------------------- % sum(normal+ms_limited+bs_limited+max_power)
Counters from table(s):p_nbsc_link_balance
Figure 480. Share in maximum power, S4 (lb_6)
Average MS power attenuation, S2 (lb_7)
2*sum(ave_MS_power)/sum(power_denom1)
Counters from table(s):p_nbsc_powerUnit = dB
Figure 481. Average MS power attenuation, S2 (lb_7)
Average MS power, S2 (lb_7b)
avg(decode(o_bts.freq_band_in_use,0,43,1,30)-2*ave_MS_power/power_denom1
Counters from table(s):p_nbsc_powerUnit= dBm
Figure 482. Average MS power, S2 (lb_7b)
Average UL signal strength, S2 (lb_9)
Use: Values as defined by GSM 5.08 (0..63: 0 = less than -110dBm, 1 = -110 to -109 dBm, 3 = -109 to -108 dBm ... 62 = -49 to -48, 63 =greater than -48)
186 (206) © Nokia Networks Oy DN98619493Nokia Proprietary and Confidential Issue 1-1en
BSS counter formulas
sum(ave_ul_sig_str)/sum(power_denom4)
Counters from table(s):p_nbsc_power
Figure 483. Average UL signal strength, S2 (lb_9)
Average DL signal strength, S2 (lb_10)
Use: Values as defined by GSM 5.08 (0..63: 0 = less than -110dBm, 1 = -110 to -109 dBm, 3 = -109 to -108 dBm ... 62 = -49 to -48, 63 =greater than -48)
sum(ave_dl_sig_str)/sum(power_denom3)
Counters from table(s):p_nbsc_power
Figure 484. Average DL signal strength, S2 (lb_10)
Average MS power attenuation, S2 (lb_11)
2*sum(ave_MS_power)/sum(power_denom1)
Counters from table(s):p_nbsc_powerUnit = dB
Figure 485. Average MS power attenuation, S2 (lb_11)
Average BS power attenuation, S2 (lb_12)
2*sum(ave_BS_power)/sum(power_denom2)
Counters from table(s): p_nbsc_powerUnit = dB
Figure 486. Average BS power attenuation, S2 (lb_12)
2.40 Call success (csf)
SDCCH access probability, before FCS (csf_1)
Use: Gives the probability to access SDCCH without the effect ofFCS. Applicable for area and BTS level.
DN98619493 © Nokia Networks Oy 187 (206)Issue 1-1 en Nokia Proprietary and Confidential

BSS Network Doctor Formulas
Known problems: 1) The momentary SDCCH blocking phenomenon is met insome networks.2) sdcch_busy_att triggered also in the case of HO attemptif there are no free SDCCH.
sdcch_busy_att100*(1- --------------) % sdcch_seiz_att
Counters from table(s):p_nbsc_traffic
Figure 487. SDCCH access probability, before FCS (csf_1)
SDCCH access probability (csf_1a)
Use: Gives the probability to access SDCCH. Applicable for areaand BTS level. A low value means high traffic on SDCCH andlack of SDCCH resources, that is SDCCH blocking.
Known problems: 1) The momentary SDCCH blocking phenomenon is met insome networks.2) sdcch_busy_att triggers also in the case of HO attemptif there are no free SDCCH.
100-blck_5a =
sdcch_busy_att- tch_seiz_due_sdcch_con100-(100* ----------------------------------------) % sdcch_seiz_att
Counters from table(s):p_nbsc_traffic
Figure 488. SDCCH access probability (csf_1a)
SDCCH success ratio (csf_2a)
Experiences on use: The best values seen are around 98%.Known problems: The formula does not separate the SDCCH call seizures from
other seizures (such as LU). The failure rate in the case of acall or LU can greatly differ from one another, wherefore youcannot use this formula for SDCCH call success ratiocalculation.It is not exactly known how large a share ofsum(sdcch_abis_fail_call +sdcch_abis_fail_old) really are setup failures.
100 - non abis SDCCH dropratio =
sum(sdcch_radio_fail+sdcch_rf_old_ho+sdcch_user_act+sdcch_bcsu_reset+ sdcch_netw_act +sdcch_bts_fail+ sdcch_lapd_fail+sdcch_a_if_fail_call+sdcch_a_if_fail_old)100- 100*----------------------------------------------------------------------- %
188 (206) © Nokia Networks Oy DN98619493Nokia Proprietary and Confidential Issue 1-1en
BSS counter formulas
sum(sdcch_assign+sdcch_ho_seiz) - sum(sdcch_abis_fail_call+sdcch_abis_fail_old); phantoms
Counters from table(s):p_nbsc_traffic
Figure 489. SDCCH success ratio (csf_2a)
SDCCH success ratio, (csf_2c)
Use: Indicates how well the SDCCH phase is completed.Experiences on use: The best values seen are around 98%.Known problems: 1) The formula does not separate the SDCCH call seizures
from other seizures (such as LU and SS). The failure rate inthe case of a call or, for example, LU can greatly differ fromone another, wherefore you cannot use this formula forSDCCH call success ratio calculation.
100 - SDCCH drop ratio =
sum(a.sdcch_radio_fail+a.sdcch_rf_old_ho+ a.sdcch_user_act +a.sdcch_bcsu_reset + sdcch_netw_act + a.sdcch_bts_fail+ a.sdcch_lapd_fail + a.sdcch_a_if_fail_call + a.sdcch_a_if_fail_old+a.sdcch_abis_fail_old + (a.sdcch_abis_fail_call- C))100- 100*---------------------------------------------------------------------- % sum(b.succ_seiz_term+b.succ_seiz_orig+b.sdcch_call_re_est +b.sdcch_loc_upd+b.imsi_detach_sdcch+b.sdcch_emerg_call) ;(calls, SS,SMS,emerg. calls,LUs,IMSI detach, succ. estab.) +sum(c.msc_i_sdcch + c.bsc_i_sdcch); ;(successful incoming SDCCH-SDCCH HOs,intracell excl.)
C= part of sdcch_abis_fail_call that happens before establishment indication =a.sdcch_assign- (b.succ_seiz_term+b.succ_seiz_orig+b.sdcch_call_re_est +b.sdcch_loc_upd+b.imsi_detach_sdcch+b.sdcch_emerg_call)
Counters from table(s):a = p_nbsc_trafficb = p_nbsc_res_accessc = p_nbsc_ho
Figure 490. SDCCH success ratio, (csf_2c)
SDCCH success ratio, BTS, S6 (csf_2g)
Use: BTS level.Experiences on use: Includes A interface blocking!Known problems: As consistency is a critical property in measurements, the
combining of three tables can lead into problems. Seeproblems 1-3 from csf_2d. Unknown factors in thedenominator make the values seem pessimistic (See problems1-3 from csf_2d.).
sum(a.tch_norm_seiz)
DN98619493 © Nokia Networks Oy 189 (206)Issue 1-1 en Nokia Proprietary and Confidential

BSS Network Doctor Formulas
Note
;(all TCH seiz.for new call)=100* -------------------------------------------------------------------- % sum(b.succ_seiz_term+b.succ_seiz_orig +b.sdcch_call_re_est+b.sdcch_emerg_call);(calls,sms, ss reqs) - sum(b.succ_sdcch_sms_est + b.unsucc_sdcch_sms_est) ;(sms attempts) + sum(c.msc_i_sdcch + c.bsc_i_sdcch ;(net SDCCH HO in) -c.msc_o_sdcch - c.bsc_o_sdcch) ;(unknown how big part calls - sum(a.tch_call_req-a.tch_norm_seiz) ;(DR and air itf blocking)
- supplem.serv. requests ;(unknown factor) - call clears before TCH ;(unknown factor) - supplem.serv. requests ;(unknown factor)
Counters from table(s):a = p_nbsc_trafficb = p_nbsc_res_accessc = p_nbsc_ho
Figure 491. SDCCH success ratio, BTS, S6 (csf_2g)
This formula includes also A interface blocking. If call re-establishment occursalready on SDCCH, the formula is not correct, but if it occurs on TCH, it iscorrect.
SDCCH success ratio, BTS, (csf_2i)
Use: BTS level.Experiences on use: Includes A interface blocking!Known problems: As consistency is a critical property in measurements, the
combining of three tables can lead into problems. Seeproblems 1-3 from csf_2d. Unknown factors in thedenominator make the values seem pessimistic (See problems1-3 from csf_2d.).
sum(a.tch_norm_seiz) ;(all TCH seiz.for new call)=100* -------------------------------------------------------------------- % sum(b.succ_seiz_term+b.succ_seiz_orig +b.sdcch_call_re_est+b.sdcch_emerg_call);(calls,sms, ss reqs) - sum(b.succ_sdcch_sms_est + b.unsucc_sdcch_sms_est) ;(sms attempts) + sum(c.msc_i_sdcch + c.bsc_i_sdcch ;(net SDCCH HO in) -c.msc_o_sdcch - c.bsc_o_sdcch) ;(unknown how big part calls - sum(c.cell_sdcch_tch) + sum(a.tch_succ_seiz_for_dir_acc);
190 (206) © Nokia Networks Oy DN98619493Nokia Proprietary and Confidential Issue 1-1en

BSS counter formulas
Note
direct access related correction - sum(a.tch_call_req-a.tch_norm_seiz) ;(DR and air itf blocking) - supplem.serv. requests ;(unknown factor) - call clears before TCH ;(unknown factor) - supplem.serv. requests ;(unknown factor)
Counters from table(s):a = p_nbsc_trafficb = p_nbsc_res_accessc = p_nbsc_ho
Figure 492. SDCCH success ratio, BTS, (csf_2i)
This formula includes also A interface blocking. If call re-establishment occursalready on SDCCH, the formula is not correct, but if it occurs on TCH, it iscorrect.
SDCCH success ratio, area, S9 (csf_2j)
Use: On the area level.Experiences on use: The best values seen are around 95 %. Includes A interface
blocking!Known problems: As consistency is a critical property in measurements, the
combining of three tables can lead into problems. Unknownfactors in the dividor make the values seem pessimistic.• The calls are cleared before TCH can vary between
networks depending on the call setup time which,again, may depend on the use of DR or queuingfeatures. Other reasons can be authentication fails,identity check fails and MOC calls having wrongdialling, for example.
• This formula does not count correctly the situationwhen the first call or call re-establishment fails onSDCCH (MS never comes to TCH).
• For the BTS area there is no way knowing how muchSDCCH-SDCCH handovers take place across the areaborder. The net incoming amount of SDCCHhandovers ends up in a successful case to TCH seizuresbut they are not seen in the nominator.
• For the BTS area there is no way knowing how muchSDCCH-TCH (DR) handovers take place across thearea border. The net incoming amount of SDCCH-TCH(DR) handovers ends up in a successful case with TCHseizures but they are not seen in the nominator.
DN98619493 © Nokia Networks Oy 191 (206)Issue 1-1 en Nokia Proprietary and Confidential
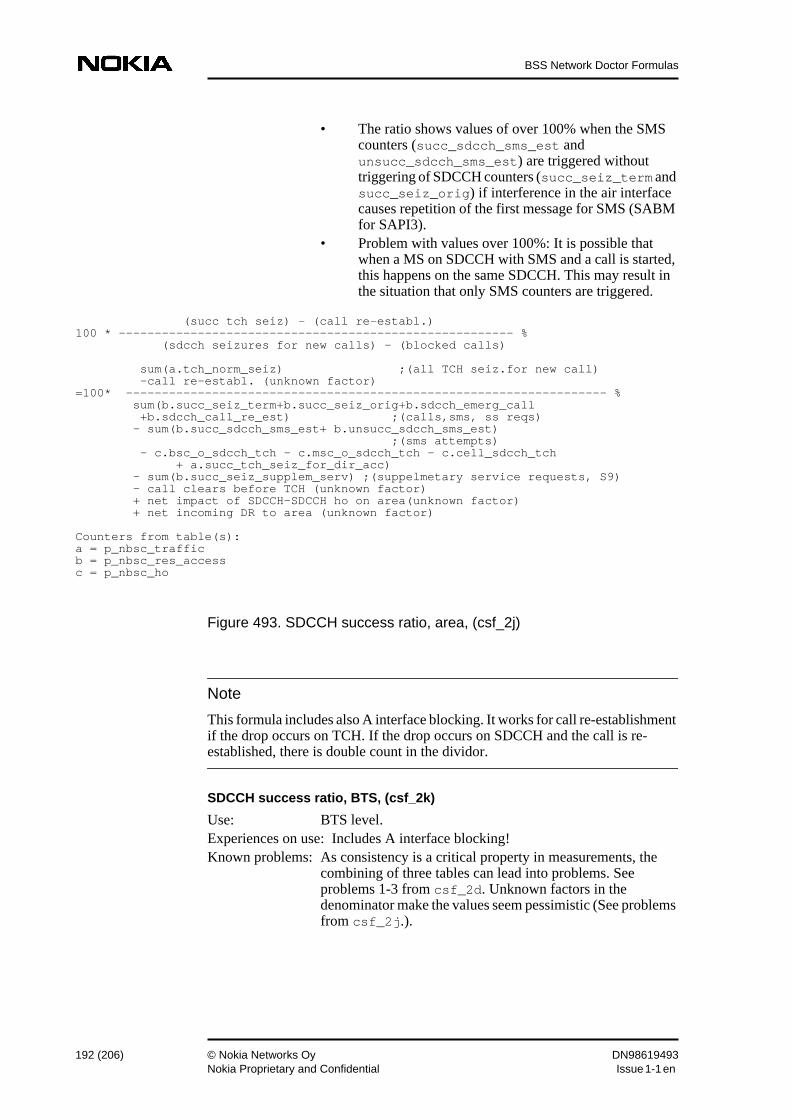
BSS Network Doctor Formulas
Note
• The ratio shows values of over 100% when the SMScounters (succ_sdcch_sms_est andunsucc_sdcch_sms_est) are triggered withouttriggering of SDCCH counters (succ_seiz_term andsucc_seiz_orig) if interference in the air interfacecauses repetition of the first message for SMS (SABMfor SAPI3).
• Problem with values over 100%: It is possible thatwhen a MS on SDCCH with SMS and a call is started,this happens on the same SDCCH. This may result inthe situation that only SMS counters are triggered.
(succ tch seiz) - (call re-establ.)100 * ------------------------------------------------------- % (sdcch seizures for new calls) - (blocked calls)
sum(a.tch_norm_seiz) ;(all TCH seiz.for new call) -call re-establ. (unknown factor)=100* ------------------------------------------------------------------- % sum(b.succ_seiz_term+b.succ_seiz_orig+b.sdcch_emerg_call +b.sdcch_call_re_est) ;(calls,sms, ss reqs) - sum(b.succ_sdcch_sms_est+ b.unsucc_sdcch_sms_est) ;(sms attempts) - c.bsc_o_sdcch_tch - c.msc_o_sdcch_tch - c.cell_sdcch_tch + a.succ_tch_seiz_for_dir_acc) - sum(b.succ_seiz_supplem_serv) ;(suppelmetary service requests, S9) - call clears before TCH (unknown factor) + net impact of SDCCH-SDCCH ho on area(unknown factor) + net incoming DR to area (unknown factor)
Counters from table(s):a = p_nbsc_trafficb = p_nbsc_res_accessc = p_nbsc_ho
Figure 493. SDCCH success ratio, area, (csf_2j)
This formula includes also A interface blocking. It works for call re-establishmentif the drop occurs on TCH. If the drop occurs on SDCCH and the call is re-established, there is double count in the dividor.
SDCCH success ratio, BTS, (csf_2k)
Use: BTS level.Experiences on use: Includes A interface blocking!Known problems: As consistency is a critical property in measurements, the
combining of three tables can lead into problems. Seeproblems 1-3 from csf_2d. Unknown factors in thedenominator make the values seem pessimistic (See problemsfrom csf_2j.).
192 (206) © Nokia Networks Oy DN98619493Nokia Proprietary and Confidential Issue 1-1en
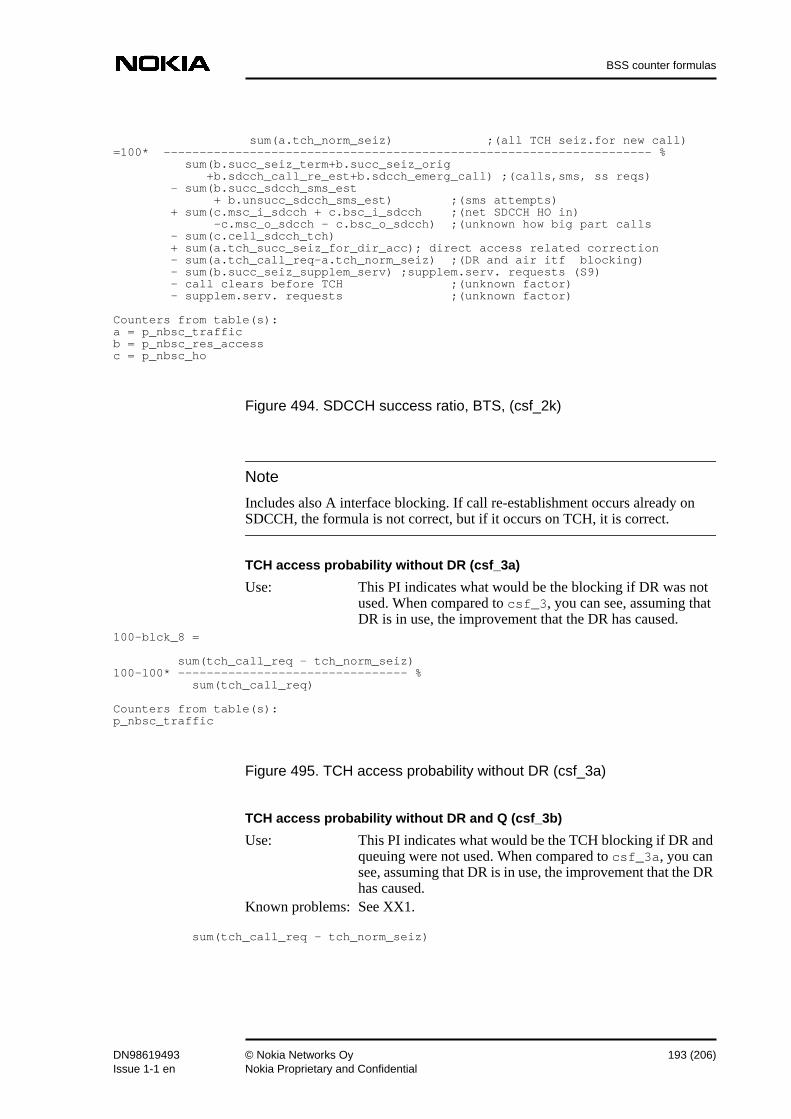
BSS counter formulas
Note
sum(a.tch_norm_seiz) ;(all TCH seiz.for new call)=100* -------------------------------------------------------------------- % sum(b.succ_seiz_term+b.succ_seiz_orig +b.sdcch_call_re_est+b.sdcch_emerg_call) ;(calls,sms, ss reqs) - sum(b.succ_sdcch_sms_est + b.unsucc_sdcch_sms_est) ;(sms attempts) + sum(c.msc_i_sdcch + c.bsc_i_sdcch ;(net SDCCH HO in) -c.msc_o_sdcch - c.bsc_o_sdcch) ;(unknown how big part calls - sum(c.cell_sdcch_tch) + sum(a.tch_succ_seiz_for_dir_acc); direct access related correction - sum(a.tch_call_req-a.tch_norm_seiz) ;(DR and air itf blocking) - sum(b.succ_seiz_supplem_serv) ;supplem.serv. requests (S9) - call clears before TCH ;(unknown factor) - supplem.serv. requests ;(unknown factor)
Counters from table(s):a = p_nbsc_trafficb = p_nbsc_res_accessc = p_nbsc_ho
Figure 494. SDCCH success ratio, BTS, (csf_2k)
Includes also A interface blocking. If call re-establishment occurs already onSDCCH, the formula is not correct, but if it occurs on TCH, it is correct.
TCH access probability without DR (csf_3a)
Use: This PI indicates what would be the blocking if DR was notused. When compared to csf_3, you can see, assuming thatDR is in use, the improvement that the DR has caused.
100-blck_8 =
sum(tch_call_req - tch_norm_seiz)100-100* -------------------------------- % sum(tch_call_req)
Counters from table(s):p_nbsc_traffic
Figure 495. TCH access probability without DR (csf_3a)
TCH access probability without DR and Q (csf_3b)
Use: This PI indicates what would be the TCH blocking if DR andqueuing were not used. When compared to csf_3a, you cansee, assuming that DR is in use, the improvement that the DRhas caused.
Known problems: See XX1.
sum(tch_call_req - tch_norm_seiz)
DN98619493 © Nokia Networks Oy 193 (206)Issue 1-1 en Nokia Proprietary and Confidential

BSS Network Doctor Formulas
+ sum(tch_qd_call_att-XX1-unsrv_qd_call_att); calls succ. via queuing100-100*----------------------------------------------------------------------- % sum(tch_call_req)
Counters from table(s):p_nbsc_traffic
Figure 496. TCH access probability without DR and Q (csf_3b)
TCH access probability without Q (csf_3c)
Use: This PI indicates what would be the blocking if queuing wasnot used (but DR is used).
sum(a.tch_call_req - a.tch_norm_seiz - b.msc_o_sdcch_tch -b.bsc_o_sdcch_tch) + sum(a.tch_qd_call_att -a.unsrv_qd_call_att) ;calls that succeeded via queuing100-100* ------------------------------------------------------------- % sum(a.tch_call_req)
Counters from table(s):a = p_nbsc_trafficb = p_nbsc_ho
Figure 497. TCH access probability without Q (csf_3c)
TCH access probability, real (csf_3d)
Use: This KPI is affected by the congestion on TCH.100-blck_8b =
sum(a.tch_call_req-a.tch_norm_seiz) - sum(b.msc_o_sdcch_tch+ b.bsc_o_sdcch_tch+b.cell_sdcch_tch); DR calls100-100* ----------------------------------------------------------- % sum(a.tch_call_req)
Counters from table(s):a = p_nbsc_trafficb = p_nbsc_handover
Figure 498. TCH access probability, real (csf_3d)
TCH access probability without DR, (csf_3i)
Use: This PI indicates what would be the TCH blocking if DR wasnot used. When compared to csf_3a, you can see, assumingthat DR is in use, the improvement that the DR has caused.Does not contain the congestion of the A interface circuitpool.
sum(a.tch_call_req - a.tch_norm_seiz)
194 (206) © Nokia Networks Oy DN98619493Nokia Proprietary and Confidential Issue 1-1en

BSS counter formulas
- sum(a.tch_rej_due_req_ch_a_if_crc ; Aif type mismatch or congestion -(b.bsc_i_unsucc_a_int_circ_type ; Aif circuit pool handover failures +b.msc_controlled_in_ho +b.ho_unsucc_a_int_circ_type))100-100* ------------------------------------- % sum(a.tch_call_req) - sum(a.tch_rej_due_req_ch_a_if_crc ; Aif type mismatch or congestion -(b.bsc_i_unsucc_a_int_circ_type ; Aif circuit pool handover failures +b.msc_controlled_in_ho +b.ho_unsucc_a_int_circ_type))
Counters from table(s):a = p_nbsc_trafficb = p_nbsc_handover
Figure 499. TCH access probability without DR, (csf_3i)
TCH access probability without DR and Q, (csf_3j)
Use: This PI indicates what would be the TCH blocking if DR andqueuing were not used. When compared to csf_3a, you cansee, assuming that queuing is in use, the improvement that thequeuing has caused. Does not contain the congestion of the Ainterface circuit pool.
Known problems: See XX1.
sum(tch_call_req - tch_norm_seiz) + sum(tch_qd_call_att-XX1-unsrv_qd_call_att);succ. calls via queuing - sum(tch_rej_due_req_ch_a_if_crc); Aif pool rejections100-100*------------------------------------------- % sum(tch_call_req) - sum(tch_rej_due_req_ch_a_if_crc); Aif pool rejections
Counters from table(s):p_nbsc_trafficXX1 = attempts taken from queue to DR (unknown)
Figure 500. TCH access probability without DR and Q, (csf_3j)
TCH access probability, real, (csf_3k)
Use: This KPI is affected by the blocking on TCH.100-blck_8c =
sum(a.tch_call_req-a.tch_norm_seiz) - sum(b.msc_o_sdcch_tch+ b.bsc_o_sdcch_tch+b.cell_sdcch_tch); DR calls - sum(a.tch_rej_due_req_ch_a_if_crc ; Aif type mismatch or congestion -(b.bsc_i_unsucc_a_int_circ_type ; Aif circuit pool handover failures +b.msc_controlled_in_ho
DN98619493 © Nokia Networks Oy 195 (206)Issue 1-1 en Nokia Proprietary and Confidential

BSS Network Doctor Formulas
+b.ho_unsucc_a_int_circ_type))100-100* ----------------------------------------------------------- % sum(a.tch_call_req) - sum(a.tch_rej_due_req_ch_a_if_crc ; Aif type mismatch or congestion -(b.bsc_i_unsucc_a_int_circ_type ; Aif circuit pool handover failures +b.msc_controlled_in_ho +b.ho_unsucc_a_int_circ_type))
Counters from table(s):a = p_nbsc_trafficb = p_nbsc_handover
Figure 501. TCH access probability, real, (csf_3k)
TCH access probability, real (csf_3l)
Use: This KPI is affected by the blocking on TCH.Known problems: On cell level the formula is inaccurate in case of inter cell
direct access (BSS7057).100-blck_8d =
sum(a.tch_call_req-a.tch_norm_seiz) - sum(b.msc_o_sdcch_tch+ b.bsc_o_sdcch_tch+b.cell_sdcch_tch); DR calls + sum(a.tch_succ_seiz_for_dir_acc);ref.2 - sum(a.tch_rej_due_req_ch_a_if_crc ; Aif type mismatch or congestion -(b.bsc_i_unsucc_a_int_circ_type ; Aif circuit pool handover failures +b.msc_controlled_in_ho +b.ho_unsucc_a_int_circ_type))100-100* ----------------------------------------------------------- % sum(a.tch_call_req) - sum(a.tch_rej_due_req_ch_a_if_crc ; Aif type mismatch or congestion -(b.bsc_i_unsucc_a_int_circ_type ; Aif circuit pool handover failures +b.msc_controlled_in_ho +b.ho_unsucc_a_int_circ_type))
Counters from table(s):a = p_nbsc_trafficb = p_nbsc_handover
Figure 502. TCH access probability, real (csf_3l)
Ref.2. Compensation needed since in case of Direct Access to super reuse TRXthe tch_norm_seiz is triggered in parallel with the cell_sdcch_tch.
196 (206) © Nokia Networks Oy DN98619493Nokia Proprietary and Confidential Issue 1-1en

BSS counter formulas
TCH access probability without DR and Q, (csf_3m)
Use: This PI indicates what would be the TCH blocking if DR andqueuing were not used. When compared to csf_3a, you cansee, assuming that queuing is in use, the improvement that thequeuing has caused. Does not contain the congestion of the Ainterface circuit pool.
Known problems: Inaccurate when the feature ’TCH assignment to super-reuseTRX in IUO’ is applied. In this case tch_call_req andremoval_from_que_due_to_dr are triggered multipletimes if the target cell is congested and queuing is started butthe call is removed to normal DR.
sum(tch_call_req - tch_norm_seiz) + sum(tch_qd_call_att-removal_from_que_due_to_dr-unsrv_qd_call_att)
;succ. calls via queuing - sum(tch_rej_due_req_ch_a_if_crc); Aif pool rejections100-100*------------------------------------------- % sum(tch_call_req) - sum(tch_rej_due_req_ch_a_if_crc); Aif pool rejections
Counters from table(s):p_nbsc_traffic
Figure 503. TCH access probability without DR and Q, (csf_3m)
TCH success ratio, area, before call re-establisment (csf_4o)
Use: On the area level. The impact of call re-establishment is notyet taken into account.
Known problems: See dcr_3g.
sum(a.tch_radio_fail+a.tch_rf_old_ho+a.tch_abis_fail_call+ a.tch_abis_fail_old+a.tch_a_if_fail_call+ a.tch_a_if_fail_old+ a.tch_tr_fail+ a.tch_tr_fail_old+a.tch_lapd_fail+ a.tch_bts_fail+ a.tch_user_act+ a.tch_bcsu_reset+a.tch_netw_act+a.tch_act_fail_call)100 -100* ---------------------------------------------------------------------- % sum(a.tch_norm_seiz) ;(normal calls) + sum(c.msc_i_sdcch_tch+c.bsc_i_sdcch_tch+c.cell_sdcch_tch);(DR calls) + sum(a.tch_seiz_due_sdcch_con) ; FACCH call setup calls
Counters from table(s):a = p_nbsc_trafficc = p_nbsc_ho
Figure 504. TCH success ratio, area, before call re-establisment (csf_4o)
DN98619493 © Nokia Networks Oy 197 (206)Issue 1-1 en Nokia Proprietary and Confidential

BSS Network Doctor Formulas
TCH success ratio, area, after call re-establishment, S6 (csf_4p)
Use: On the area level.Known problems: 1) See dcr_3g.
2) It is assumed that call re-establishments happen on TCH. Infact they may happen also on SDCCH.3) The counters used to compensate re-establishments are theones that indicate re-establishment attempts, not the succesfulre-establishments. In S7/T11 re-establishments can beconsidered accurately (see csf_4v).4) On cell level it can happen that the call is re-established ina different cell than where it was dropped, which results ininaccuracy.
100-dcr_3f =
sum(a.tch_radio_fail+a.tch_rf_old_ho+a.tch_abis_fail_call+ a.tch_abis_fail_old+a.tch_a_if_fail_call+ a.tch_a_if_fail_old+ a.tch_tr_fail+a.tch_tr_fail_old+a.tch_lapd_fail+a.tch_bts_fail+ a.tch_user_act+a.tch_bcsu_reset+a.tch_netw_act+a.tch_act_fail_call) - sum(b.sdcch_call_re_est+b.tch_call_re_est);call re-establishments100 -100* ----------------------------------------------------------------------- % sum(a.tch_norm_seiz) ;calls started directly in the cell + sum(c.msc_i_sdcch_tch+c.bsc_i_sdcch_tch+c.cell_sdcch_tch);DR calls + sum(a.tch_seiz_due_sdcch_con) ; FACCH call setup calls - sum(b.sdcch_call_re_est+b.tch_call_re_est);call re-establishments
Counters from table(s):a = p_nbsc_trafficb = p_nbsc_res_accessc = p_nbsc_ho
Figure 505. TCH success ratio, area, after call re-establishment, S6(csf_4p)
TCH success ratio, BTS, before call re-establisment (csf_4q)
Use: On the BTS level.Known problems: See dcr_4c.
100-dcr_4b =
sum(a.tch_radio_fail+a.tch_rf_old_ho+a.tch_abis_fail_call+ a.tch_abis_fail_old+a.tch_a_if_fail_call+a.tch_a_if_fail_old+ a.tch_tr_fail+a.tch_tr_fail_old+a.tch_lapd_fail+a.tch_bts_fail+ a.tch_user_act+ a.tch_bcsu_reset+a.tch_netw_act+a.tch_act_fail_call)100 -100* ----------------------------------------------------------------------- % sum(a.tch_norm_seiz) ;(normal calls) + sum(c.msc_i_sdcch_tch+c.bsc_i_sdcch_tch+c.cell_sdcch_tch) ;(DR calls) + sum(a.tch_seiz_due_sdcch_con) ; FACCH call setup calls + sum(c.msc_i_tch_tch+c.bsc_i_tch_tch) ;(TCH-TCH Ho in)
198 (206) © Nokia Networks Oy DN98619493Nokia Proprietary and Confidential Issue 1-1en

BSS counter formulas
Counters from table(s):a = p_nbsc_trafficc = p_nbsc_ho
Figure 506. TCH success ratio, BTS, before call re-establisment (csf_4q)
TCH success ratio, BTS, after call re-establishment (csf_4r)
Use: On the BTS level.Known problems: See dcr_3g.
sum(a.tch_radio_fail+a.tch_rf_old_ho+a.tch_abis_fail_call+ a.tch_abis_fail_old+a.tch_a_if_fail_call+a.tch_a_if_fail_old+ a.tch_tr_fail+a.tch_tr_fail_old+a.tch_lapd_fail+a.tch_bts_fail+ a.tch_user_act+a.tch_bcsu_reset+a.tch_netw_act+a.tch_act_fail_call) - sum(b.sdcch_call_re_est+b.tch_call_re_est);call re-establishments100 -100* ----------------------------------------------------------------------- % sum(a.tch_norm_seiz) ;(normal calls) + sum(c.msc_i_sdcch_tch+c.bsc_i_sdcch_tch+c.cellsdcch_tch) ;(DR calls) + sum(a.tch_seiz_due_sdcch_con) ; FACCH call setup calls + sum(c.msc_i_tch_tch+c.bsc_i_tch_tch) ;(TCH-TCH Ho in) - sum(b.sdcch_call_re_est+b.tch_call_re_est);call re-establishments
Counters from table(s):a = p_nbsc_trafficb = p_nbsc_res_accessc = p_nbsc_ho
Figure 507. TCH success ratio, BTS, after call re-establishment (csf_4r)
TCH success ratio, BTS, after call re-establishment, (csf_4t)
Use: On the BTS level.Known problems: See dcr_3d.
sum(a.tch_radio_fail+a.tch_rf_old_ho+a.tch_abis_fail_call+ a.tch_abis_fail_old+a.tch_a_if_fail_call+a.tch_a_if_fail_old+ a.tch_tr_fail+a.tch_tr_fail_old+a.tch_lapd_fail+a.tch_bts_fail+ a.tch_user_act+a.tch_bcsu_reset+a.tch_netw_act+a.tch_act_fail_call) -sum(b.tch_re_est_assign) ;call re-establishments100 -100* ----------------------------------------------------------------------- % sum(a.tch_norm_seiz) ;(normal calls) + sum(c.msc_i_sdcch_tch+c.bsc_i_sdcch_tch+c.cellsdcch_tch) ;(DR calls) + sum(a.tch_seiz_due_sdcch_con) ; FACCH call setup calls + sum(c.msc_i_tch_tch+c.bsc_i_tch_tch) ;(TCH-TCH Ho in) - sum(b.tch_re_est_assign);call re-establishments
DN98619493 © Nokia Networks Oy 199 (206)Issue 1-1 en Nokia Proprietary and Confidential
BSS Network Doctor Formulas
Counters from table(s):a = p_nbsc_trafficb = p_nbsc_servicec = p_nbsc_ho
Figure 508. TCH success ratio, BTS, after call re-establishment, (csf_4t)
TCH success ratio, area, before call re-establishment, S7(csf_4u)
Use: On the BTS level.Known problems: See dcr_3g. The impact of call re-establishment is not yet
taken into account.100-dcr_3i =
sum(a.tch_radio_fail+a.tch_rf_old_ho+a.tch_abis_fail_call+ a.tch_abis_fail_old+a.tch_a_if_fail_call+a.tch_a_if_fail_old+ a.tch_tr_fail+ a.tch_tr_fail_old+a.tch_lapd_fail+ a.tch_bts_fail+ a.tch_user_act+ a.tch_bcsu_reset+ a.tch_netw_act+a.tch_act_fail_call)100 -100* ----------------------------------------------------------------------- % sum(a.tch_norm_seiz) ;(normal calls) + sum(c.msc_i_sdcch_tch+c.bsc_i_sdcch_tch+c.cell_sdcch_tch);(DR calls) - sum(a.succ_tch_seiz_for_dir_acc);ref.2 + sum(a.tch_seiz_due_sdcch_con) ; FACCH call setup calls
Counters from table(s):a = p_nbsc_trafficc = p_nbsc_ho
Figure 509. TCH success ratio, area, before call re-establishment,S7(csf_4u)
Ref.2. Compensation needed since in case of Direct Access to super reuse TRXthe tch_norm_seiz is triggered in parallel with the cell_sdcch_tch.
TCH success ratio, area, after call re-establishment, S7 (csf_4v)
Use: On the BTS level.Known problems: 1) It is assumed that call re-establishments happen on TCH. In
fact they may happen also on SDCCH.2) On cell level it can happen that the call is re-established ina different cell than it was dropped and this causes inaccuracy.
100-dcr_3j= sum(a.tch_radio_fail+a.tch_rf_old_ho+a.tch_abis_fail_call+ a.tch_abis_fail_old+a.tch_a_if_fail_call+a.tch_a_if_fail_old+ a.tch_tr_fail+ a.tch_tr_fail_old+a.tch_lapd_fail+ a.tch_bts_fail+ a.tch_user_act+ a.tch_bcsu_reset+
a.tch_netw_act+a.tch_act_fail_call) - sum(b.tch_re_est_assign) ;call re-establishments100 -100* ----------------------------------------------------------------------- %
200 (206) © Nokia Networks Oy DN98619493Nokia Proprietary and Confidential Issue 1-1en

BSS counter formulas
sum(a.tch_norm_seiz);calls started directly in the cell + sum(c.msc_i_sdcch_tch+c.bsc_i_sdcch_tch+c.cell_sdcch_tch);DR calls - sum(a.tch_succ_seiz_for_dir_acc);ref.1 + sum(a.tch_seiz_due_sdcch_con) ; FACCH call setup calls - sum(b.tch_re_est_assign);call re-establishments
Counters from table(s):a = p_nbsc_trafficb = p_nbsc_servicec = p_nbsc_ho
Figure 510. TCH success ratio, area, after call re-establishment, S7(csf_4v)
Ref.2. Compensation needed since in case of Direct Access to super reuse TRXthe tch_norm_seiz is triggered in parallel with the cell_sdcch_tch.
TCH success ratio, BTS, after call re-establishment, (csf_4x)
Use: On the BTS level.Known problems: See dcr_3d.
sum(a.tch_radio_fail+a.tch_rf_old_ho+a.tch_abis_fail_call+ a.tch_abis_fail_old+a.tch_a_if_fail_call+.tch_a_if_fail_old+ a.tch_tr_fail+ a.tch_tr_fail_old+a.tch_lapd_fail+ a.tch_bts_fail+ a.tch_user_act+ a.tch_bcsu_reset+ a.tch_netw_act+a.tch_act_fail_call) -sum(b.tch_re_est_assign) ;callre-establishments100 -100* ----------------------------------------------------------------------- % sum(a.tch_norm_seiz) ;(normal calls) + sum(c.msc_i_sdcch_tch+c.bsc_i_sdcch_tch+c.cellsdcch_tch) ;(DR calls) - sum(a.succ_tch_seiz_for_dir_acc);ref.2 + sum(a.tch_seiz_due_sdcch_con) ; FACCH call setup calls + sum(c.msc_i_tch_tch+c.bsc_i_tch_tch) ;(TCH-TCH Ho in) - sum(b.tch_re_est_assign);call re-establishments
Counters from table(s):a = p_nbsc_trafficb = p_nbsc_servicec = p_nbsc_ho
Figure 511. TCH success ratio, BTS, after call re-establishment, (csf_4x)
Ref.2. Compensation needed since in case of Direct Access to super reuse TRXthe tch_norm_seiz is triggered in parallel with the cell_sdcch_tch.
DN98619493 © Nokia Networks Oy 201 (206)Issue 1-1 en Nokia Proprietary and Confidential
BSS Network Doctor Formulas
TCH success ratio, BTS, before call re-establishment, (csf_4y)
Use: On the BTS level.Known problems: See dcr_3d.
100-dcr_4e=
sum(a.tch_radio_fail+a.tch_rf_old_ho+a.tch_abis_fail_call+ a.tch_abis_fail_old+a.tch_a_if_fail_call+a.tch_a_if_fail_old+ a.tch_tr_fail+ a.tch_tr_fail_old+a.tch_lapd_fail+ a.tch_bts_fail+ a.tch_user_act+ a.tch_bcsu_reset+
a.tch_netw_act+a.tch_act_fail_call)100 -100* -------------------------------------------------------------------- % sum(a.tch_norm_seiz) ;(normal calls) + sum(c.msc_i_sdcch_tch+c.bsc_i_sdcch_tch+c.cellsdcch_tch) ;(DR calls) - sum(a.succ_tch_seiz_for_dir_acc);ref.2 + sum(a.tch_seiz_due_sdcch_con) ; FACCH call setup calls + sum(c.msc_i_tch_tch+c.bsc_i_tch_tch) ;(TCH-TCH Ho in)
Counters from table(s):a = p_nbsc_trafficc = p_nbsc_ho
Figure 512. TCH success ratio, BTS, before call re-establishment,(csf_4y)
Ref.2. Compensation needed since in case of Direct Access to super reuse TRXthe tch_norm_seiz is triggered in parallel with the cell_sdcch_tch.
2.41 Configuration (cnf)
Reuse pattern (cnf_1)
Experiences on use: For example, 30/3 = 10 means that the frequency can berepeated with 10 cells!The smaller the figure, the better the planning.
Known problems: This indicator can be counted from the NMS/2000 only forthe latest moment (no history).
nbr of used frequencies------------------------average TRXs per cell
Figure 513. Reuse pattern (cnf_1)
The used frequency means that the TRX and its parents (BTS and BCF) areunlocked.
202 (206) © Nokia Networks Oy DN98619493Nokia Proprietary and Confidential Issue 1-1en

Missing Counters
3 Missing CountersThis chapter handles counters that are found to be needed in the formulas but aremissing or scheduled for later BSC software releases.
3.1 XX1
Meaning: How many calls were taken from the queue to DR.Related problem: If a call attempt is in queue, it is taken to DR as soon as the
DR target list is ready. In this case counters show as if thequeuing took place: tch_qd_call_att is triggered butunsrv_qd_call_att is not.
Planned schedule: S8 (BSC name: REM_FROM_QUEUE_DUE_DR, counter ID1173)
3.2 XX2
Meaning: Clear by MS user during HO procedure.Related problem: Affects the counting of HO failure ratios. The ratio cannot be
counted accurately (see hfr_2).Planned schedule: Open.
3.3 XX3
Meaning: Clear by another procedure during the HO procedure, forexample assignment.
Related problem: Affects the counting of HO failure ratios. The ratio cannot becounted accurately (see hfr_2).
Planned schedule: Open.
DN98619493 © Nokia Networks Oy 203 (206)Issue 1-1 en Nokia Proprietary and Confidential

BSS Network Doctor Formulas
3.4 XX4
Meaning: The number of available timeslots for TCH (half or full rate).Related problem: Without this counter it is not possible to count the TCH
availability in case HTCH is used.Planned schedule: S9.
204 (206) © Nokia Networks Oy DN98619493Nokia Proprietary and Confidential Issue 1-1en

Index
DN98619493 © Nokia Networks Oy 205 (206)Issue 1-1 en Nokia Proprietary and Confidential

BSS Network Doctor Formulas
206 (206) © Nokia Networks Oy DN98619493Nokia Proprietary and Confidential Issue 1-1en
Related Documents