WS/FCS PRE-K ENDURING IMPACT Cecilia Sisk [email protected] Winston-Salem/Forsyth County Schools Fall 2012

Cecilia Sisk [email protected] Winston-Salem/Forsyth County Schools Fall 2012.
Jan 02, 2016
Welcome message from author
This document is posted to help you gain knowledge. Please leave a comment to let me know what you think about it! Share it to your friends and learn new things together.
Transcript
WS/FCS PRE-K ENDURING IMPACT
Cecilia [email protected]
Winston-Salem/Forsyth County SchoolsFall 2012

LAP-D General Description
LAP-D assesses children from 30-72 months old
Four domains and 8 subscales :Cognitive LanguageFine Motor Gross Motor
Only use two domains and 4 subscales
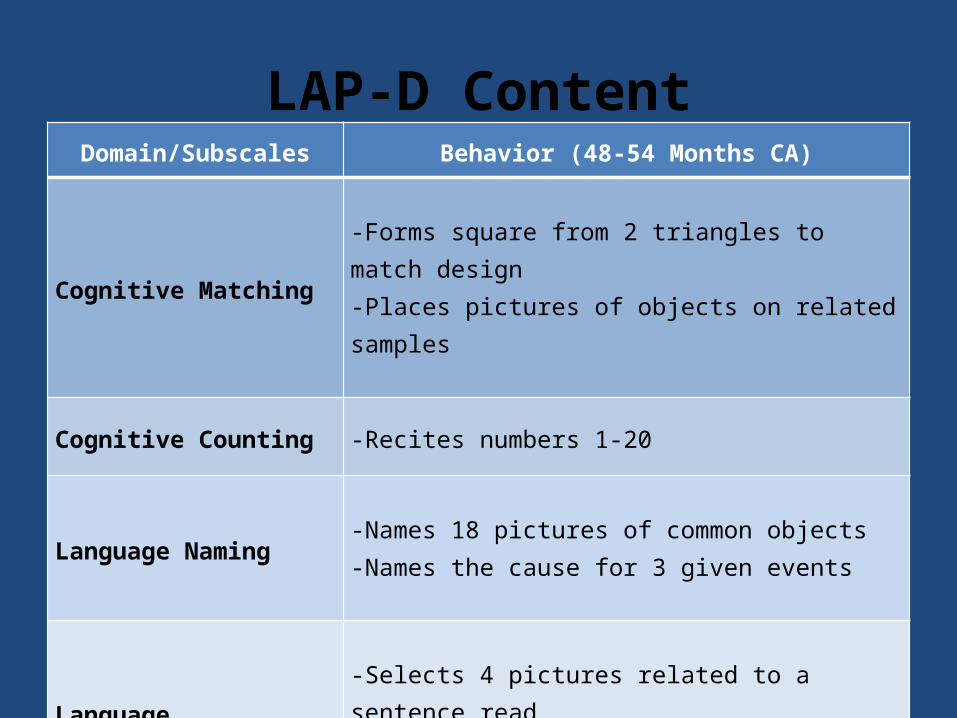
LAP-D ContentDomain/Subscales Behavior (48-54 Months CA)
Cognitive Matching-Forms square from 2 triangles to match design-Places pictures of objects on related samples
Cognitive Counting -Recites numbers 1-20
Language Naming-Names 18 pictures of common objects-Names the cause for 3 given events
Language Comprehension -Selects 4 pictures related to a sentence read-Points to 5 printed numerals between 1 and 10
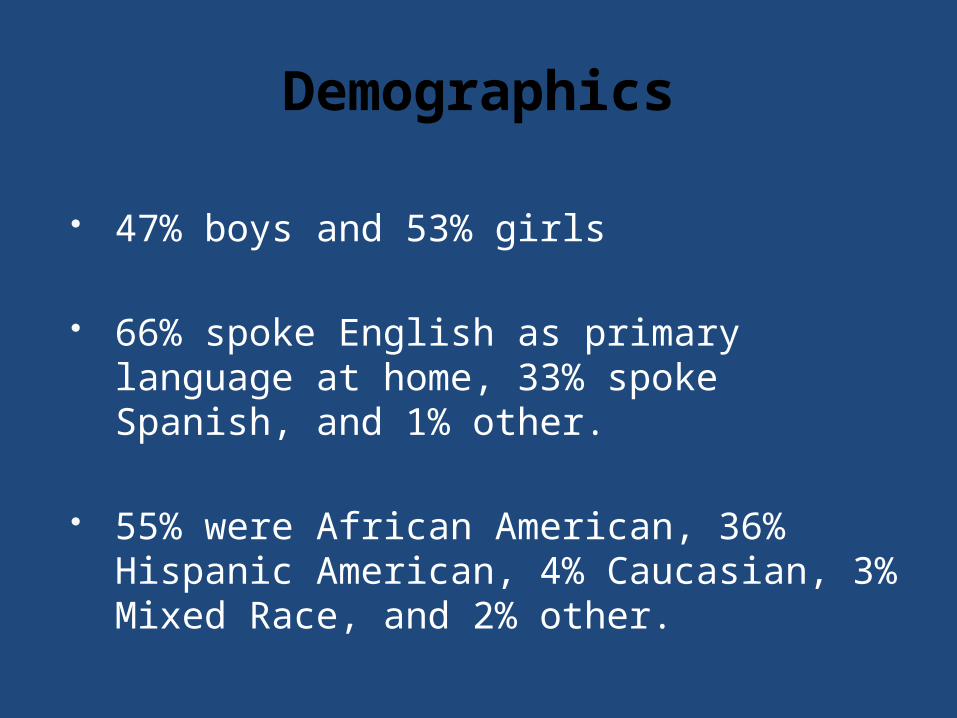
Demographics
47% boys and 53% girls
66% spoke English as primary language at home, 33% spoke Spanish, and 1% other.
55% were African American, 36% Hispanic American, 4% Caucasian, 3% Mixed Race, and 2% other.
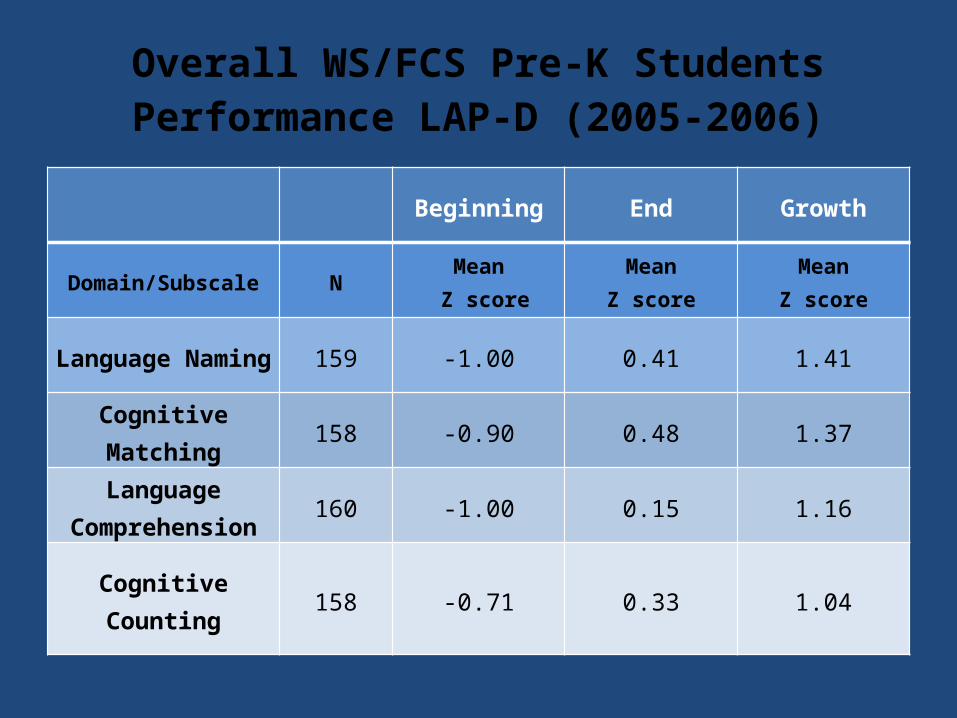
Beginning End Growth
Domain/Subscale N Mean Z score
MeanZ score
MeanZ score
Language Naming 159 -1.00 0.41 1.41
Cognitive Matching 158 -0.90 0.48 1.37
Language Comprehension 160 -1.00 0.15 1.16
Cognitive Counting 158 -0.71 0.33 1.04
Overall WS/FCS Pre-K StudentsPerformance LAP-D (2005-2006)
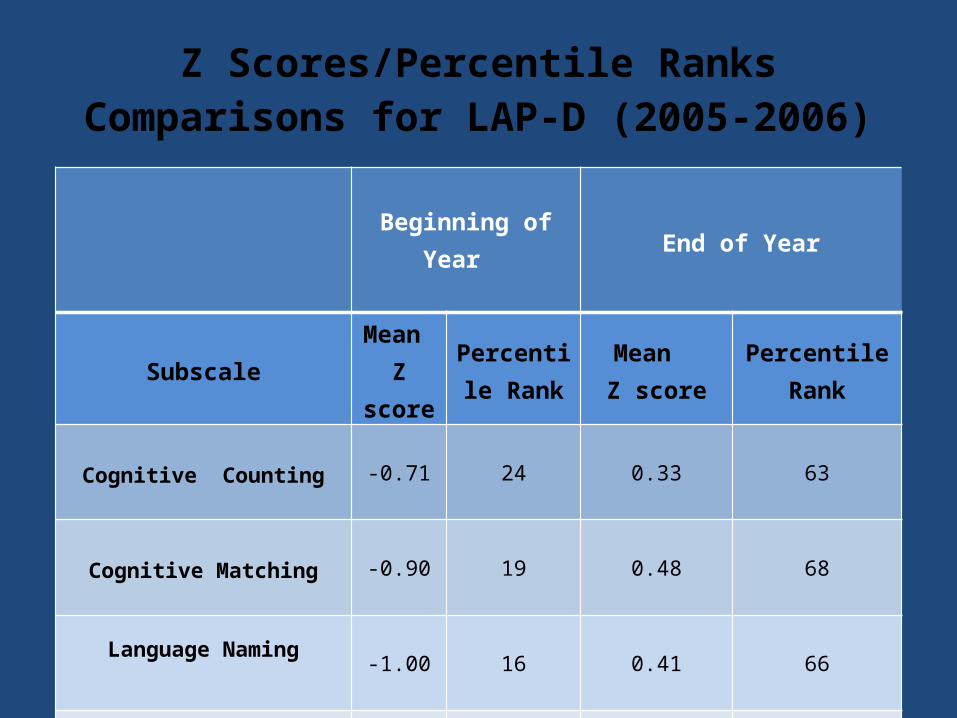
Z Scores/Percentile Ranks Comparisons for LAP-D (2005-2006)
Beginning of Year
End of Year
Subscale Mean Z score
Percentile Rank
Mean Z score Percentile Rank
Cognitive Counting -0.71 24 0.33 63
Cognitive Matching -0.90 19 0.48 68
Language Naming
-1.00 16 0.41 66
Language Comprehension -1.00 16 0.15 56

Cognitive Matching Subscale by Gender
Beginning of Year End of Year-1.2
-1
-0.8
-0.6
-0.4
-0.2
2.22044604925031E-16
0.2
0.4
0.6
0.8
1
1.2
-0.97000000000
0001
0.56
-0.83000000000
0001
0.41
Male Female
Subsca
le Z
S
core
s
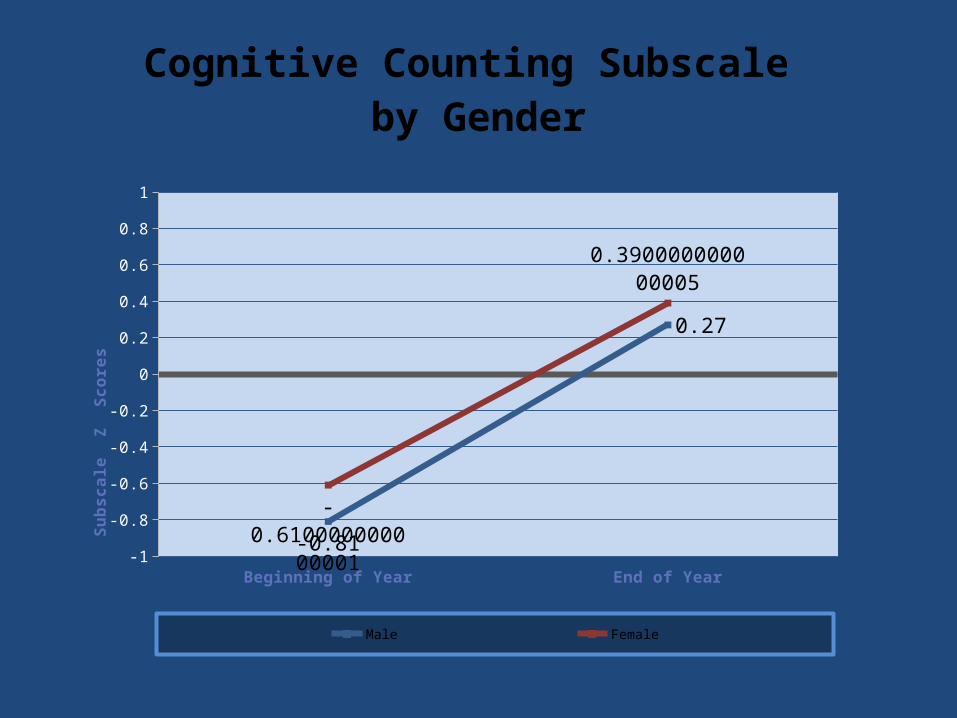
Cognitive Counting Subscale by Gender
Beginning of Year End of Year-1
-0.8
-0.6
-0.4
-0.2
0
0.2
0.4
0.6
0.8
1
-0.81
0.27
-0.61000000000
0001
0.390000000000005
Male Female
Subsca
le
Z
Sco
res
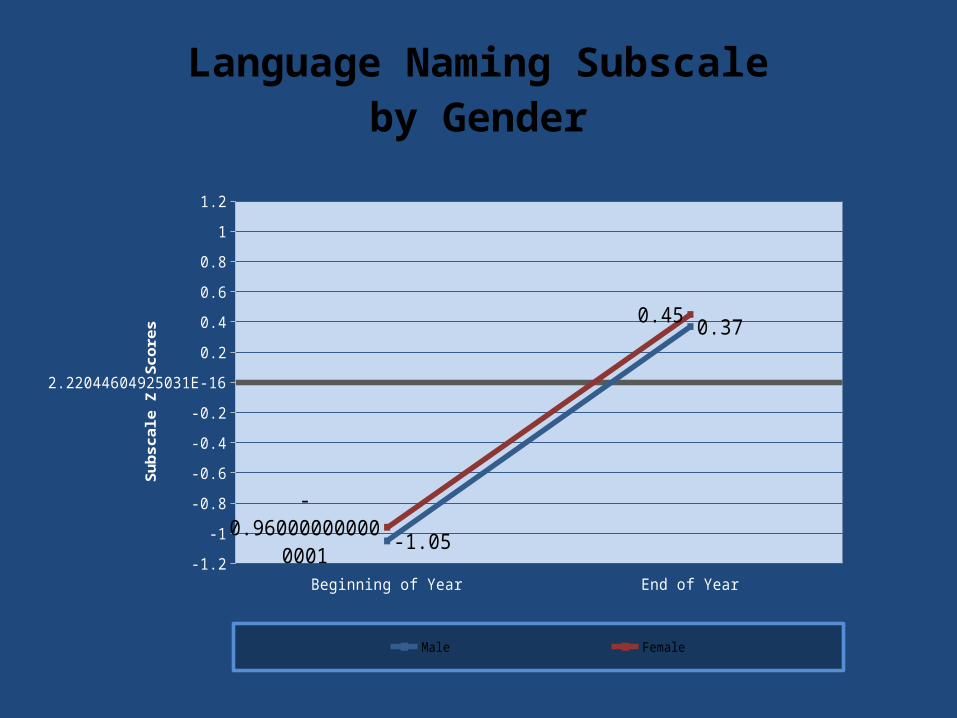
Language Naming Subscaleby Gender
Beginning of Year End of Year-1.2
-1
-0.8
-0.6
-0.4
-0.2
2.22044604925031E-16
0.2
0.4
0.6
0.8
1
1.2
-1.05
0.37
-0.96000000000
0001
0.45
Male Female
Subsc
ale
Z
Sco
res

Language Comprehension Subscaleby Gender
Beginning of Year End of Year-1.2
-1
-0.8
-0.6
-0.4
-0.2
2.22044604925031E-16
0.2
0.4
0.6
0.8
1
1.2
-1.12
0.01
-0.92
0.27
Male Female
Subsc
ale
Z
Sco
res

Cognitive Matching Subscaleby Ethnicity
Beginning of Year End of Year-1
-0.8
-0.6
-0.4
-0.2
0
0.2
0.4
0.6
0.8
1
-0.91
0.46
-0.91
0.42
African American Hispanic American
Subsca
le Z
S
core
s
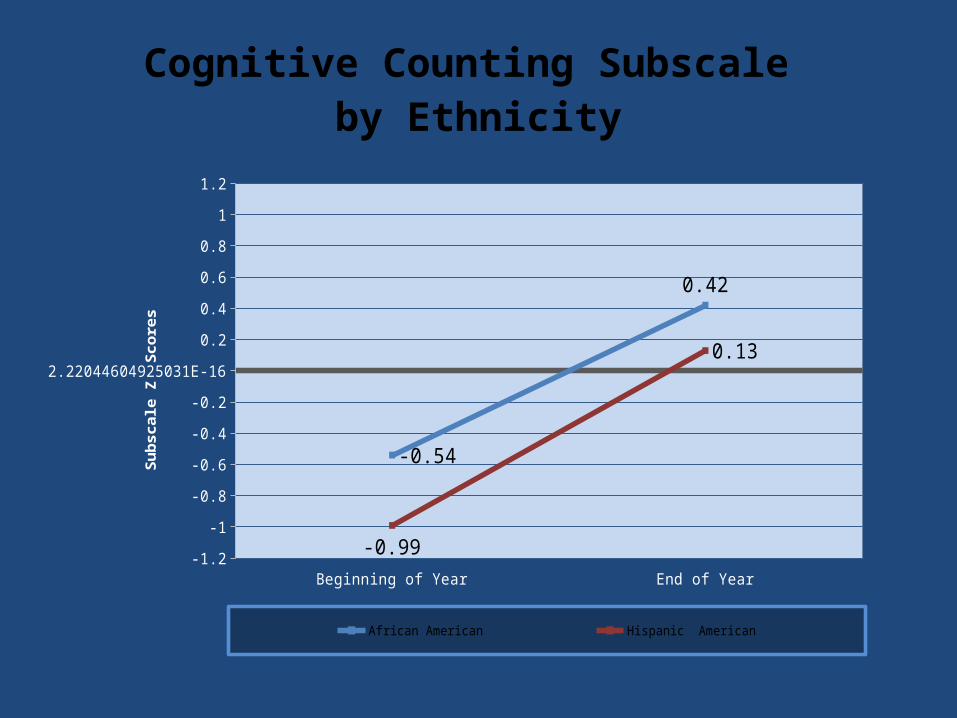
Cognitive Counting Subscale by Ethnicity
Beginning of Year End of Year-1.2
-1
-0.8
-0.6
-0.4
-0.2
2.22044604925031E-16
0.2
0.4
0.6
0.8
1
1.2
-0.54
0.42
-0.99
0.13
African American Hispanic American
Subsc
ale
Z
Sco
res
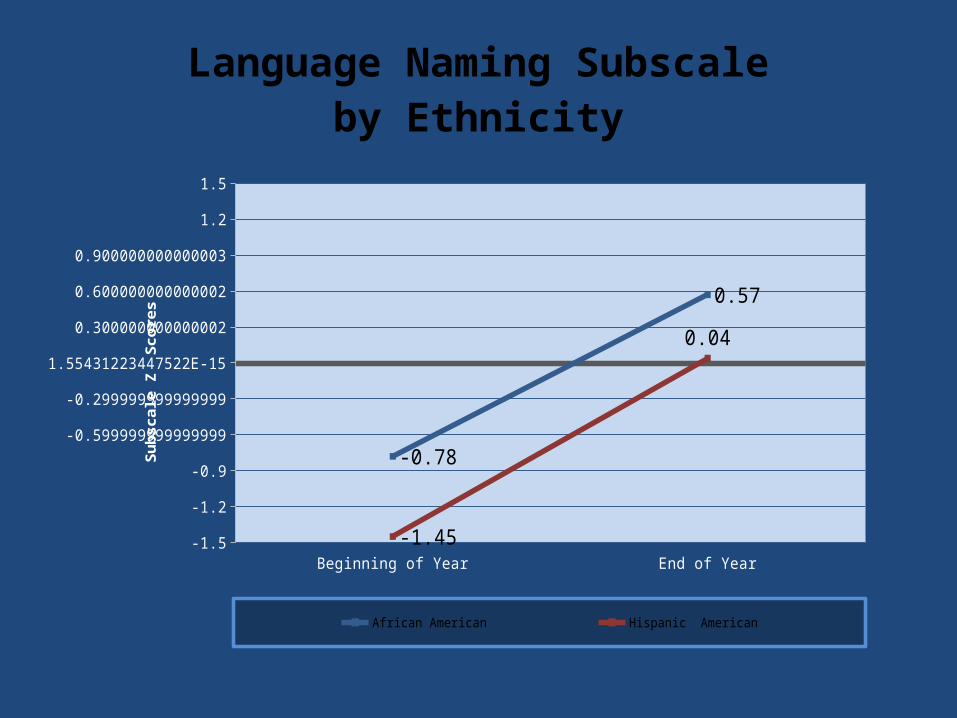
Language Naming Subscaleby Ethnicity
Beginning of Year End of Year-1.5
-1.2
-0.899999999999999
-0.599999999999999
-0.299999999999999
1.55431223447522E-15
0.300000000000002
0.600000000000002
0.900000000000003
1.2
1.5
-0.78
0.57
-1.45
0.04
African American Hispanic American
Subsc
ale
Z
Sco
res
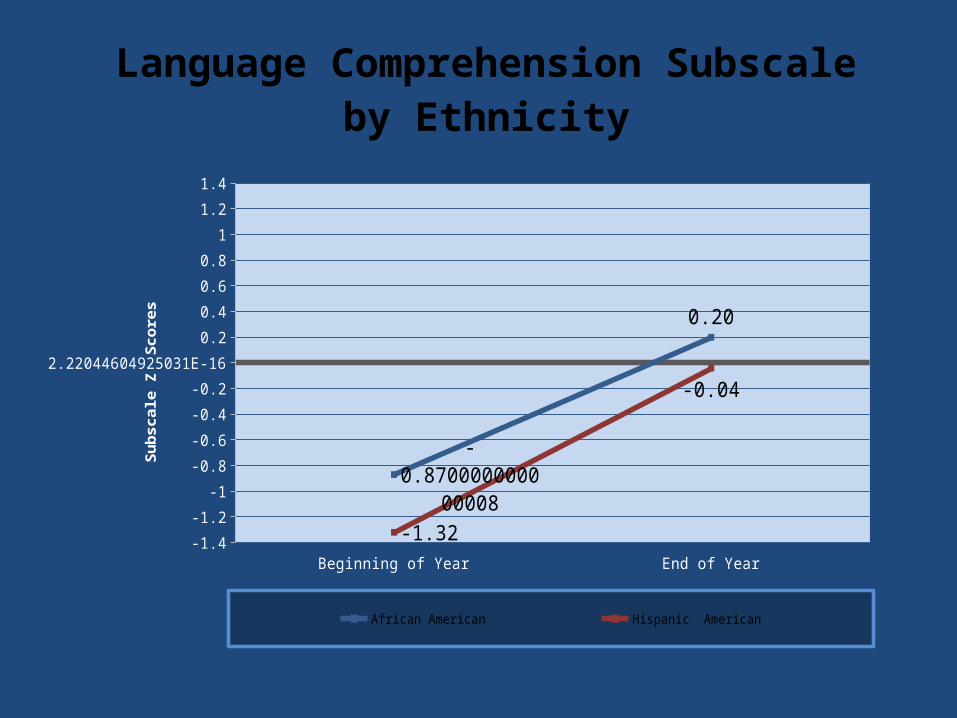
Language Comprehension Subscaleby Ethnicity
Beginning of Year End of Year-1.4
-1.2
-1
-0.8
-0.6
-0.4
-0.2
2.22044604925031E-16
0.2
0.4
0.6
0.8
1
1.2
1.4
-0.8700000000
00008
0.20
-1.32
-0.04
African American Hispanic American
Subsc
ale
Z
Sco
res
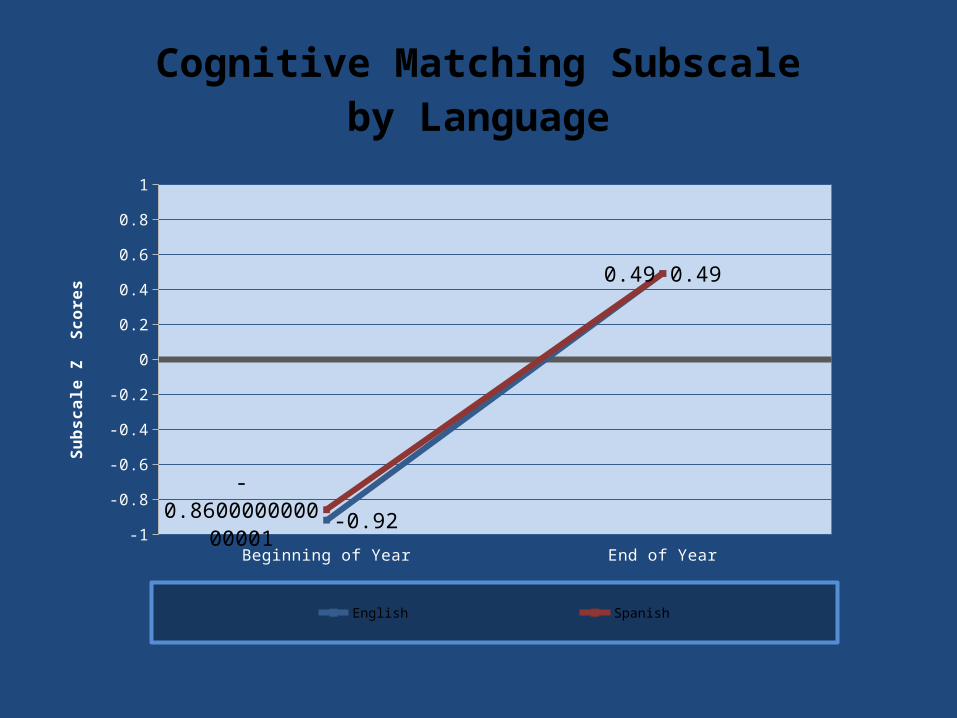
Cognitive Matching Subscaleby Language
Beginning of Year End of Year-1
-0.8
-0.6
-0.4
-0.2
0
0.2
0.4
0.6
0.8
1
-0.92
0.49
-0.8600000000
00001
0.49
English Spanish
Subsca
le Z
S
core
s
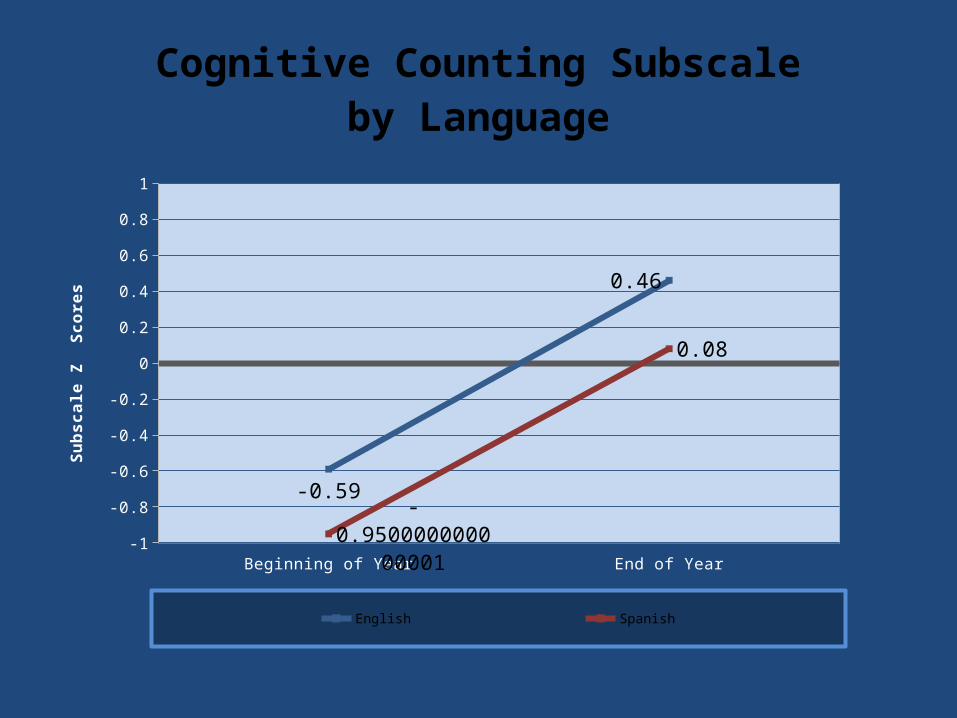
Cognitive Counting Subscaleby Language
Beginning of Year End of Year-1
-0.8
-0.6
-0.4
-0.2
0
0.2
0.4
0.6
0.8
1
-0.59
0.46
-0.9500000000
00001
0.08
English Spanish
Subsca
le Z
S
core
s

Language Naming Subscaleby Language
Beginning of Year End of Year-1.5
-1.2
-0.899999999999999
-0.599999999999999
-0.299999999999999
1.55431223447522E-15
0.300000000000002
0.600000000000002
0.900000000000003
1.2
1.5
-0.83000000000
0001
0.59
-1.35
0.09
English Spanish
Subsc
ale
Z
Sco
res
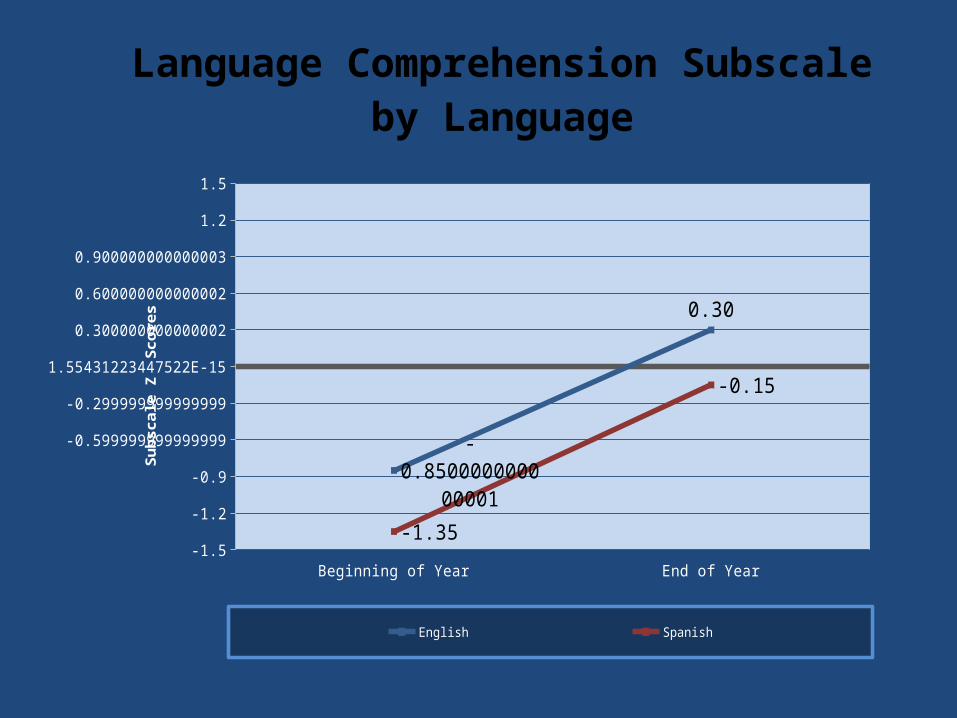
Language Comprehension Subscaleby Language
Beginning of Year End of Year-1.5
-1.2
-0.899999999999999
-0.599999999999999
-0.299999999999999
1.55431223447522E-15
0.300000000000002
0.600000000000002
0.900000000000003
1.2
1.5
-0.85000000000
0001
0.30
-1.35
-0.15
English Spanish
Subsc
ale
Z
Sco
res
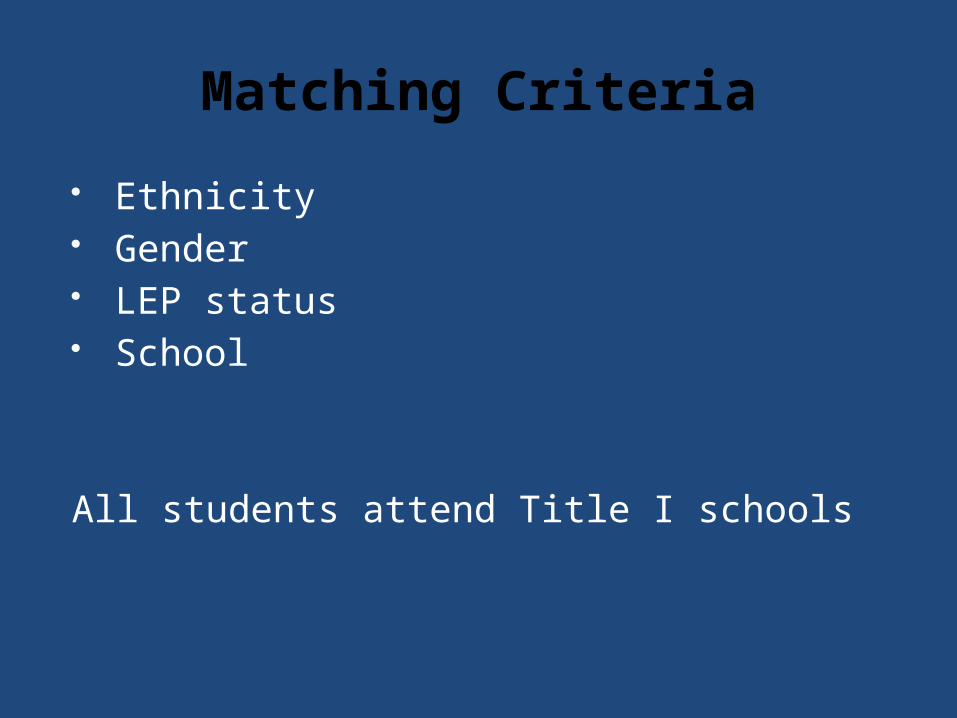
Matching Criteria
Ethnicity Gender LEP status School
All students attend Title I schools
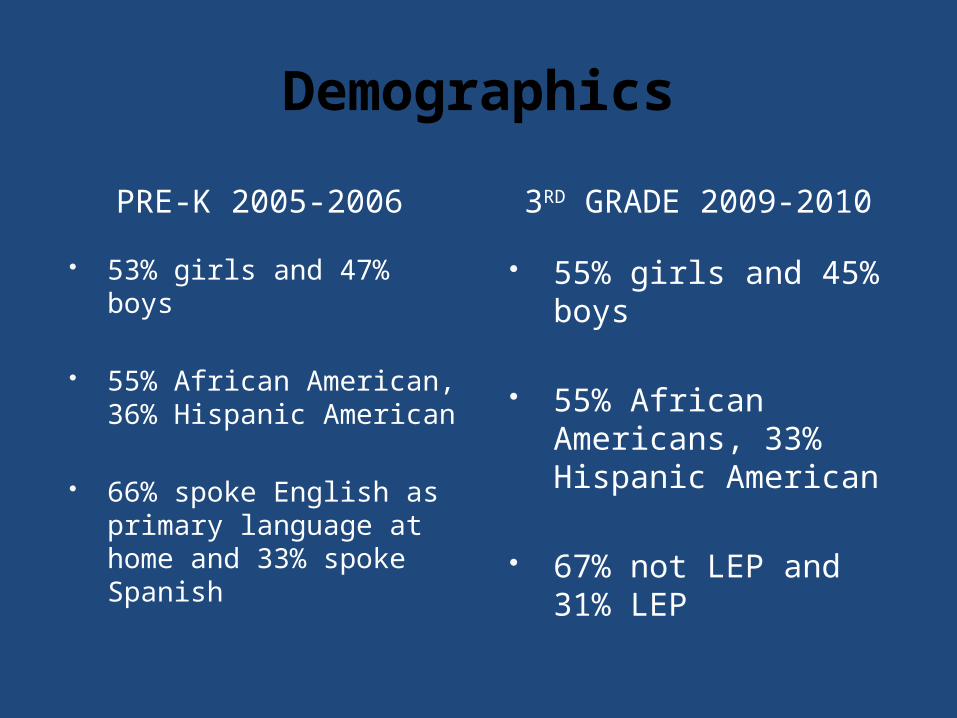
Demographics
PRE-K 2005-2006 3RD GRADE 2009-2010
53% girls and 47% boys
55% African American, 36% Hispanic American
66% spoke English as primary language at home and 33% spoke Spanish
55% girls and 45% boys
55% African Americans, 33% Hispanic American
67% not LEP and 31% LEP

2010 3rd Grade EOG Scores based on WS/FCS Pre-K Attendance
Pre-K Group N Mean Std. Deviation
EOG READING
WS/FCS Pre-K 99 336.07 10.33
Not WS/FCS Pre-K 98 330.07 11.95
EOG MATH
WS/FCS Pre-K 99 344.17 8.70
Not WS/FCSPre-K 98 339.30 9.08

2010 3rd Grade EOG Reading
NC WS/FCS Pre-K Not WS/FCS Pre-K0%
10%
20%
30%
40%
50%
60%
70%
80%
90%
100%
22%29%
50%19%
25%
20%38%
36%
25%22%
10% 5%
Level 1 Level 2 Level 3 Level 4
Perc
en
tag
e P
er
Level
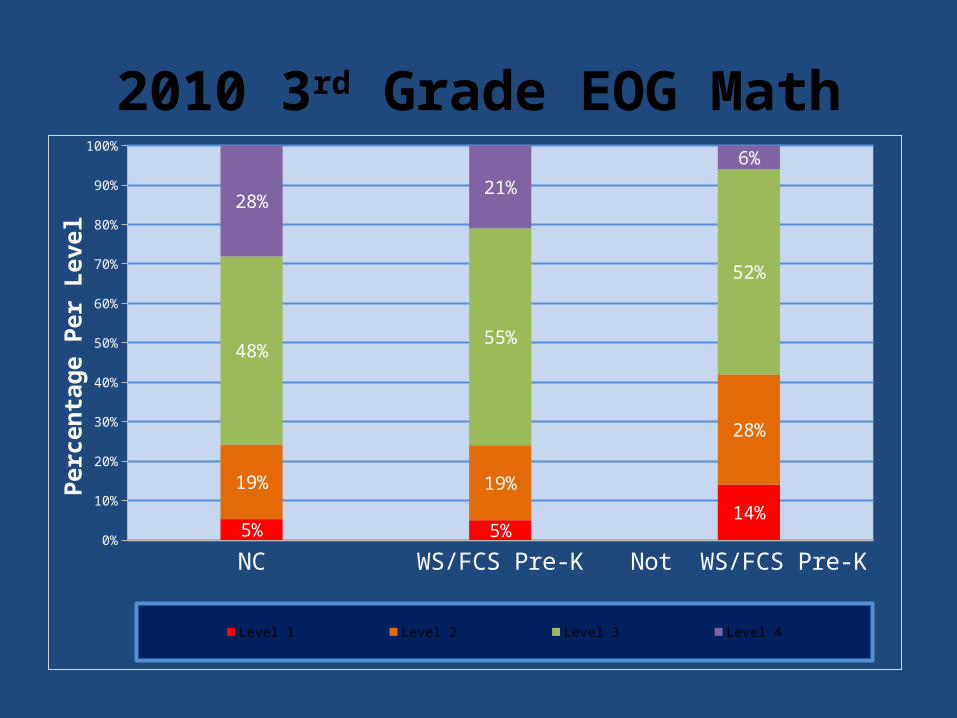
2010 3rd Grade EOG Math
NC WS/FCS Pre-K Not WS/FCS Pre-K0%
10%
20%
30%
40%
50%
60%
70%
80%
90%
100%
5% 5%14%
19% 19%
28%
48%55%
52%
28%21%
6%
Level 1 Level 2 Level 3 Level 4
Perc
en
tag
e P
er
Level
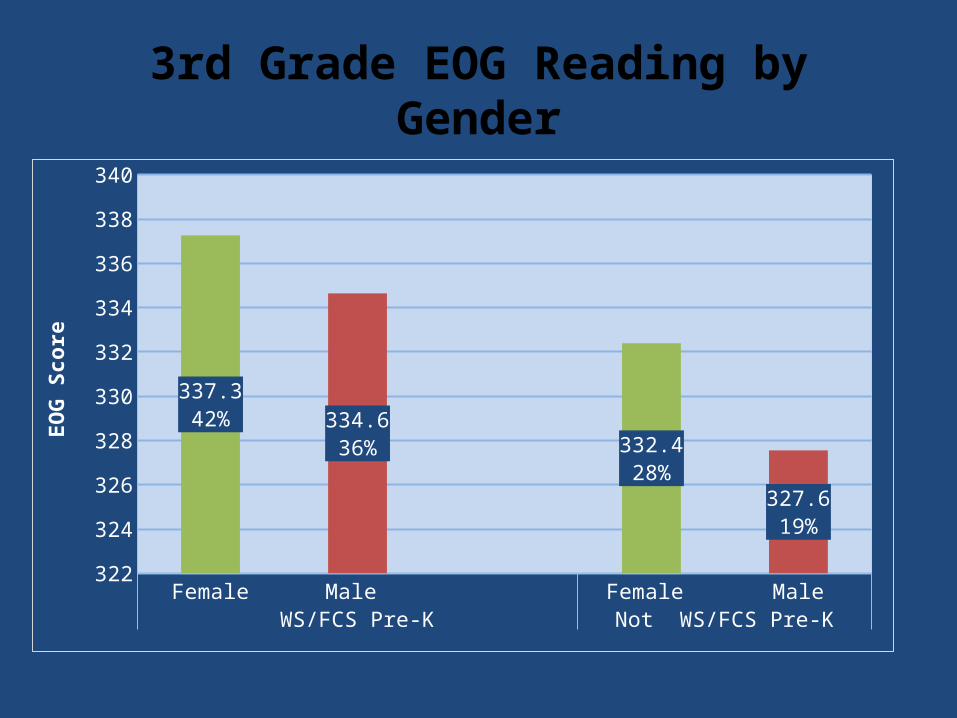
3rd Grade EOG Reading by Gender
Female Male Female MaleWS/FCS Pre-K Not WS/FCS Pre-K
322
324
326
328
330
332
334
336
338
340
337.342% 334.6
36% 332.428%
327.619%
EO
G S
core

3rd Grade EOG Reading by Gender
Female Male Female MaleWS/FCS Pre-K Not WS/FCS Pre-K
322
324
326
328
330
332
334
336
338
340
337.342% 334.6
36% 332.428%
327.619%
EO
G S
core
Stat. Sig. Diff.
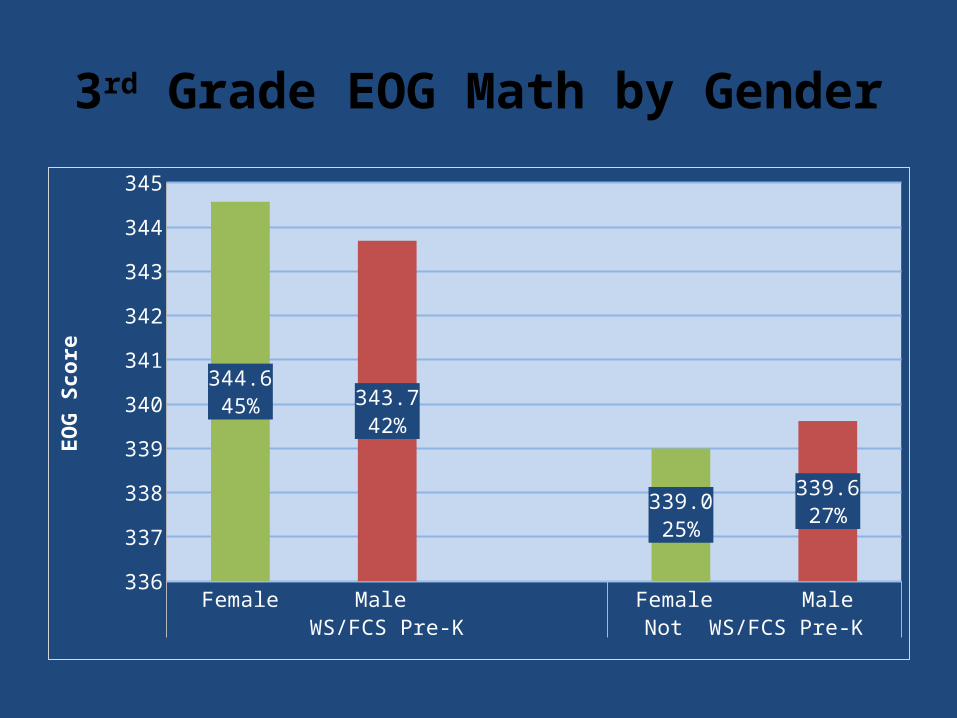
3rd Grade EOG Math by Gender
Female Male Female MaleWS/FCS Pre-K Not WS/FCS Pre-K
336
337
338
339
340
341
342
343
344
345
344.645% 343.7
42%
339.025%
339.627%
EO
G S
core
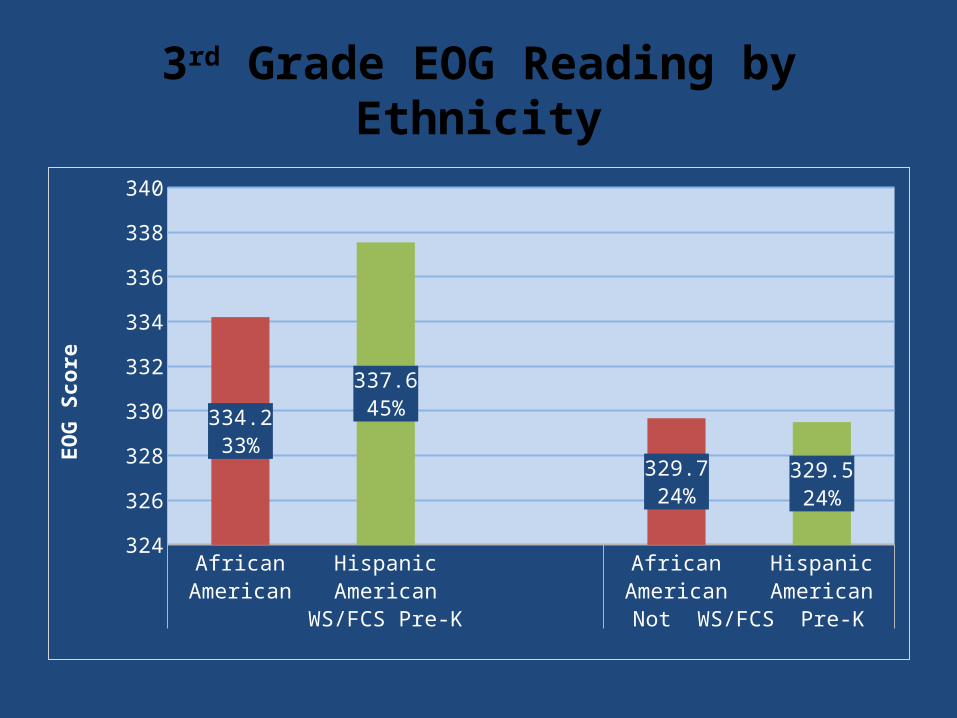
3rd Grade EOG Reading by Ethnicity
African American
Hispanic American
African American
Hispanic American
WS/FCS Pre-K Not WS/FCS Pre-K
324
326
328
330
332
334
336
338
340
334.233%
337.645%
329.724%
329.524%
EO
G S
core

3rd Grade EOG Math by Ethnicity
African American
Hispanic American
African American
Hispanic American
WS/FCS Pre-K Not WS/FCS Pre-K
332
334
336
338
340
342
344
346
348
350
341.633%
348.157%
338.725%
339.727%
EO
G S
core

3rd Grade EOG Math by Ethnicity
African American
Hispanic American
African American
Hispanic American
WS/FCS Pre-K Not WS/FCS Pre-K
332
334
336
338
340
342
344
346
348
350
341.633%
348.157%
338.725%
339.727%
EO
G S
core
Stat. Sig. Diff.
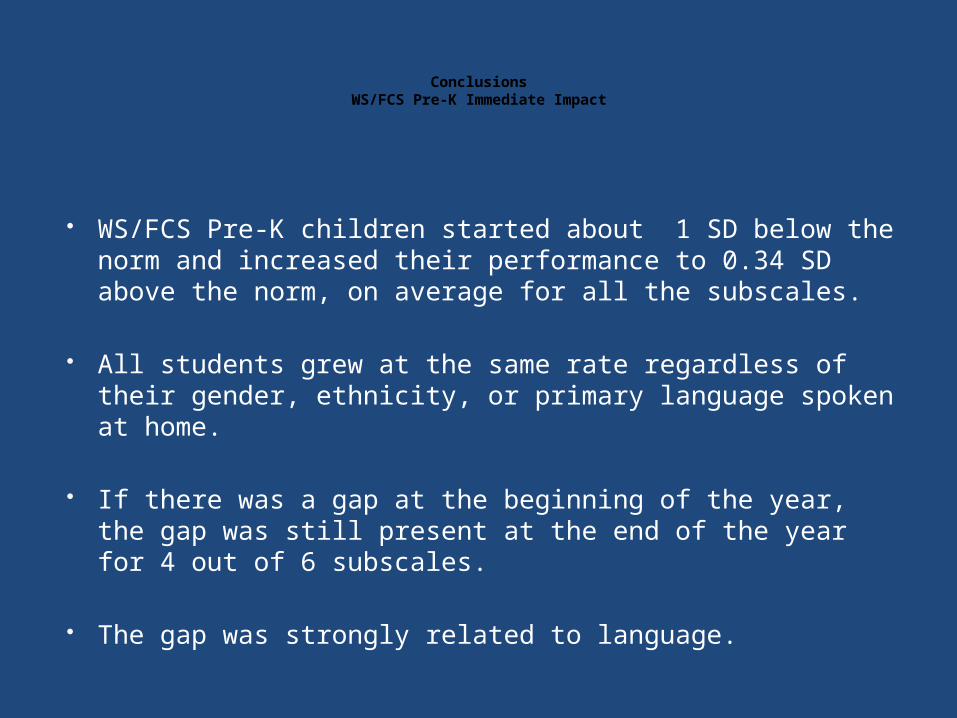
ConclusionsWS/FCS Pre-K Immediate Impact
WS/FCS Pre-K children started about 1 SD below the norm and increased their performance to 0.34 SD above the norm, on average for all the subscales.
All students grew at the same rate regardless of their gender, ethnicity, or primary language spoken at home.
If there was a gap at the beginning of the year, the gap was still present at the end of the year for 4 out of 6 subscales.
The gap was strongly related to language.
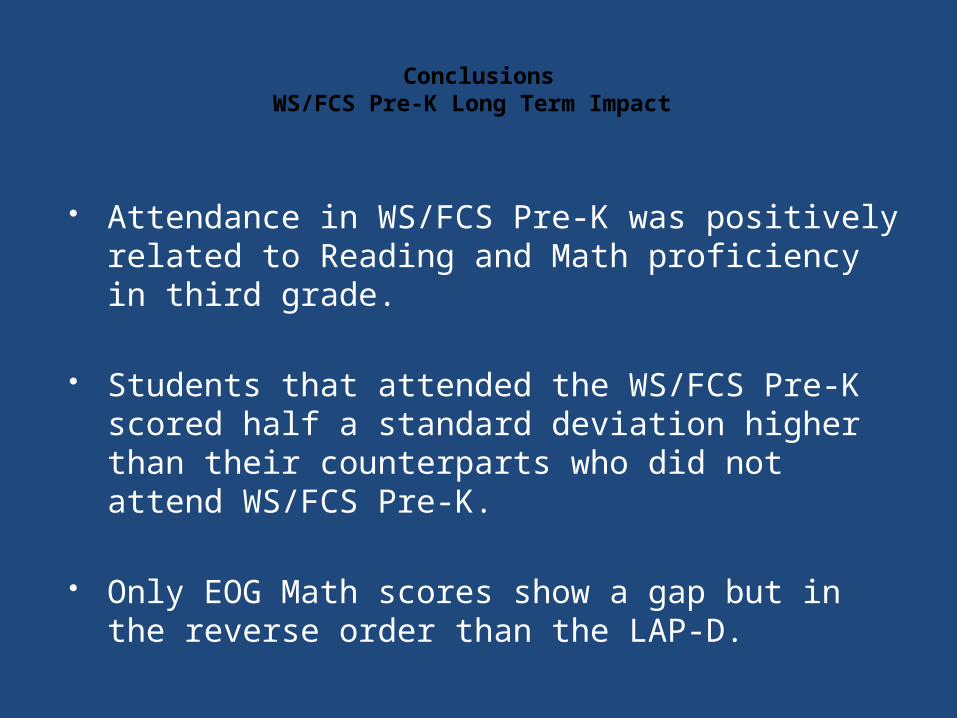
ConclusionsWS/FCS Pre-K Long Term Impact
Attendance in WS/FCS Pre-K was positively related to Reading and Math proficiency in third grade.
Students that attended the WS/FCS Pre-K scored half a standard deviation higher than their counterparts who did not attend WS/FCS Pre-K.
Only EOG Math scores show a gap but in the reverse order than the LAP-D.

Questions?
Related Documents