BioMed Central Page 1 of 13 (page number not for citation purposes) BMC Genomics Open Access Research article cDNA array-CGH profiling identifies genomic alterations specific to stage and MYCN-amplification in neuroblastoma Qing-Rong Chen †1 , Sven Bilke †1 , Jun S Wei 1 , Craig C Whiteford 1 , Nicola Cenacchi 1 , Alexei L Krasnoselsky 1 , Braden T Greer 1 , Chang- Gue Son 1,2 , Frank Westermann 3 , Frank Berthold 4 , Manfred Schwab 3 , Daniel Catchpoole 5 and Javed Khan* 1 Address: 1 Oncogenomics Section, Pediatric Oncology Branch, Advanced Technology Center, National Cancer Institute, 8717 Grovemont Circle, Gaithersburg, MD 20877, USA, 2 Department of Internal Medicine, College of Oriental Medicine, Daejeon University, Daejeon 301-724, Korea, 3 Department of Cytogenetics, German Cancer Research Center, Im Neuenheimer Feld 280, D-69120 Heidelberg, Germany, 4 Department of Pediatrics, Klinik für Kinderheilkunde der Universität zu Köln, Joseph Stelzmann Straße 9, D-50924 Köln, Germany and 5 Tumour Bank, The Children's Hospital at Westmead, Locked Bag 4001, Westmead, NSW, 2145, Australia Email: Qing-Rong Chen - [email protected]; Sven Bilke - [email protected]; Jun S Wei - [email protected]; Craig C Whiteford - [email protected]; Nicola Cenacchi - [email protected]; Alexei L Krasnoselsky - [email protected]; Braden T Greer - [email protected]; Chang-Gue Son - [email protected]; Frank Westermann - [email protected]; Frank Berthold - [email protected]; Manfred Schwab - [email protected]; Daniel Catchpoole - [email protected]; Javed Khan* - [email protected] * Corresponding author †Equal contributors Abstract Background: Recurrent non-random genomic alterations are the hallmarks of cancer and the characterization of these imbalances is critical to our understanding of tumorigenesis and cancer progression. Results: We performed array-comparative genomic hybridization (A-CGH) on cDNA microarrays containing 42,000 elements in neuroblastoma (NB). We found that only two chromosomes (2p and 12q) had gene amplifications and all were in the MYCN amplified samples. There were 6 independent non-contiguous amplicons (10.4–69.4 Mb) on chromosome 2, and the largest contiguous region was 1.7 Mb bounded by NAG and an EST (clone: 757451); the smallest region was 27 Kb including an EST (clone: 241343), NCYM, and MYCN. Using a probabilistic approach to identify single copy number changes, we systemically investigated the genomic alterations occurring in Stage 1 and Stage 4 NBs with and without MYCN amplification (stage 1-, 4-, and 4+). We have not found genomic alterations universally present in all (100%) three subgroups of NBs. However we identified both common and unique patterns of genomic imbalance in NB including gain of 7q32, 17q21, 17q23- 24 and loss of 3p21 were common to all three categories. Finally we confirm that the most frequent specific changes in Stage 4+ tumors were the loss of 1p36 with gain of 2p24-25 and they had fewer genomic alterations compared to either stage 1 or 4-, indicating that for this subgroup of poor risk NB requires a smaller number of genomic changes are required to develop the malignant phenotype. Conclusions: cDNA A-CGH analysis is an efficient method for the detection and characterization of amplicons. Furthermore we were able to detect single copy number changes using our probabilistic approach and identified genomic alterations specific to stage and MYCN amplification. Published: 20 September 2004 BMC Genomics 2004, 5:70 doi:10.1186/1471-2164-5-70 Received: 19 May 2004 Accepted: 20 September 2004 This article is available from: http://www.biomedcentral.com/1471-2164/5/70 © 2004 Chen et al; licensee BioMed Central Ltd. This is an open-access article distributed under the terms of the Creative Commons Attribution License (http://creativecommons.org/licenses/by/2.0 ), which permits unrestricted use, distribution, and reproduction in any medium, provided the original work is properly cited.

Welcome message from author
This document is posted to help you gain knowledge. Please leave a comment to let me know what you think about it! Share it to your friends and learn new things together.
Transcript
BioMed CentralBMC Genomics
ss
Open AcceResearch articlecDNA array-CGH profiling identifies genomic alterations specific to stage and MYCN-amplification in neuroblastomaQing-Rong Chen†1, Sven Bilke†1, Jun S Wei1, Craig C Whiteford1, Nicola Cenacchi1, Alexei L Krasnoselsky1, Braden T Greer1, Chang-Gue Son1,2, Frank Westermann3, Frank Berthold4, Manfred Schwab3, Daniel Catchpoole5 and Javed Khan*1Address: 1Oncogenomics Section, Pediatric Oncology Branch, Advanced Technology Center, National Cancer Institute, 8717 Grovemont Circle, Gaithersburg, MD 20877, USA, 2Department of Internal Medicine, College of Oriental Medicine, Daejeon University, Daejeon 301-724, Korea, 3Department of Cytogenetics, German Cancer Research Center, Im Neuenheimer Feld 280, D-69120 Heidelberg, Germany, 4Department of Pediatrics, Klinik für Kinderheilkunde der Universität zu Köln, Joseph Stelzmann Straße 9, D-50924 Köln, Germany and 5Tumour Bank, The Children's Hospital at Westmead, Locked Bag 4001, Westmead, NSW, 2145, Australia
Email: Qing-Rong Chen - [email protected]; Sven Bilke - [email protected]; Jun S Wei - [email protected]; Craig C Whiteford - [email protected]; Nicola Cenacchi - [email protected]; Alexei L Krasnoselsky - [email protected]; Braden T Greer - [email protected]; Chang-Gue Son - [email protected]; Frank Westermann - [email protected]; Frank Berthold - [email protected]; Manfred Schwab - [email protected]; Daniel Catchpoole - [email protected]; Javed Khan* - [email protected]
* Corresponding author †Equal contributors
AbstractBackground: Recurrent non-random genomic alterations are the hallmarks of cancer and the characterizationof these imbalances is critical to our understanding of tumorigenesis and cancer progression.
Results: We performed array-comparative genomic hybridization (A-CGH) on cDNA microarrays containing42,000 elements in neuroblastoma (NB). We found that only two chromosomes (2p and 12q) had geneamplifications and all were in the MYCN amplified samples. There were 6 independent non-contiguous amplicons(10.4–69.4 Mb) on chromosome 2, and the largest contiguous region was 1.7 Mb bounded by NAG and an EST(clone: 757451); the smallest region was 27 Kb including an EST (clone: 241343), NCYM, and MYCN. Using aprobabilistic approach to identify single copy number changes, we systemically investigated the genomicalterations occurring in Stage 1 and Stage 4 NBs with and without MYCN amplification (stage 1-, 4-, and 4+). Wehave not found genomic alterations universally present in all (100%) three subgroups of NBs. However weidentified both common and unique patterns of genomic imbalance in NB including gain of 7q32, 17q21, 17q23-24 and loss of 3p21 were common to all three categories. Finally we confirm that the most frequent specificchanges in Stage 4+ tumors were the loss of 1p36 with gain of 2p24-25 and they had fewer genomic alterationscompared to either stage 1 or 4-, indicating that for this subgroup of poor risk NB requires a smaller number ofgenomic changes are required to develop the malignant phenotype.
Conclusions: cDNA A-CGH analysis is an efficient method for the detection and characterization of amplicons.Furthermore we were able to detect single copy number changes using our probabilistic approach and identifiedgenomic alterations specific to stage and MYCN amplification.
Published: 20 September 2004
BMC Genomics 2004, 5:70 doi:10.1186/1471-2164-5-70
Received: 19 May 2004Accepted: 20 September 2004
This article is available from: http://www.biomedcentral.com/1471-2164/5/70
© 2004 Chen et al; licensee BioMed Central Ltd. This is an open-access article distributed under the terms of the Creative Commons Attribution License (http://creativecommons.org/licenses/by/2.0), which permits unrestricted use, distribution, and reproduction in any medium, provided the original work is properly cited.
Page 1 of 13(page number not for citation purposes)
BMC Genomics 2004, 5:70 http://www.biomedcentral.com/1471-2164/5/70
BackgroundNeuroblastoma (NB) is one of the most common pediat-ric solid tumors, and accounts for 7–10% of all childhoodcancers. The prognosis of patients with NB varies accord-ing to the stage, age and MYCN amplification status. Stage1 disease is essentially curable, whereas patients with stage4 disease, in particular those with MYCN amplification,remain largely incurable despite advances in cancer thera-peutics [1]. Genomic alterations in NB have been investi-gated by cytogenetic, and molecular methods includingspectral karyotyping and metaphase comparativegenomic hybridization (M-CGH) [2-6]. Based on thesestudies several genomic alterations have been reported tocorrelate with prognosis including amplification of theMYCN oncogene (found in 30% of NB) [1,7], gains of17q (>50%) and loss of 1p36 (30–35%) [1,8,9]. Otherrecurrent changes including losses of 3p, 4p, 9p, 11q, and14q, as well as frequent gain of chromosome 7 have alsobeen suggested to have relevance to the development andprogression of these tumors [9].
Recently array-based CGH (A-CGH) on BAC and cDNAmicroarrays has been used to investigate the genomicalterations with high resolution [10-14]. cDNA A-CGHhas been successfully utilized to detect amplification andto investigate the direct effects of genomic changes overgene expression level by using the same microarray forboth A-CGH and gene expression analysis [14-16]. In thisstudy, we applied A-CGH, on cDNA microarrays contain-ing 42,000 elements, to systematically identify commonaberrant genomic alterations in NB of various stages. Wehave applied a probabilistic approach to detect single-copy losses and gains of chromosomal regions. Our studyhas three principal aims: 1) Detection and high resolutionmapping of amplicons in NB. 2) Detection of low copynumber genomic alterations using a probabilisticapproach. 3) Establishing a map of genomic imbalancesin NB profiling samples with good (stage 1) and poor(stage 4 with or without MYCN amplification) prognosis.
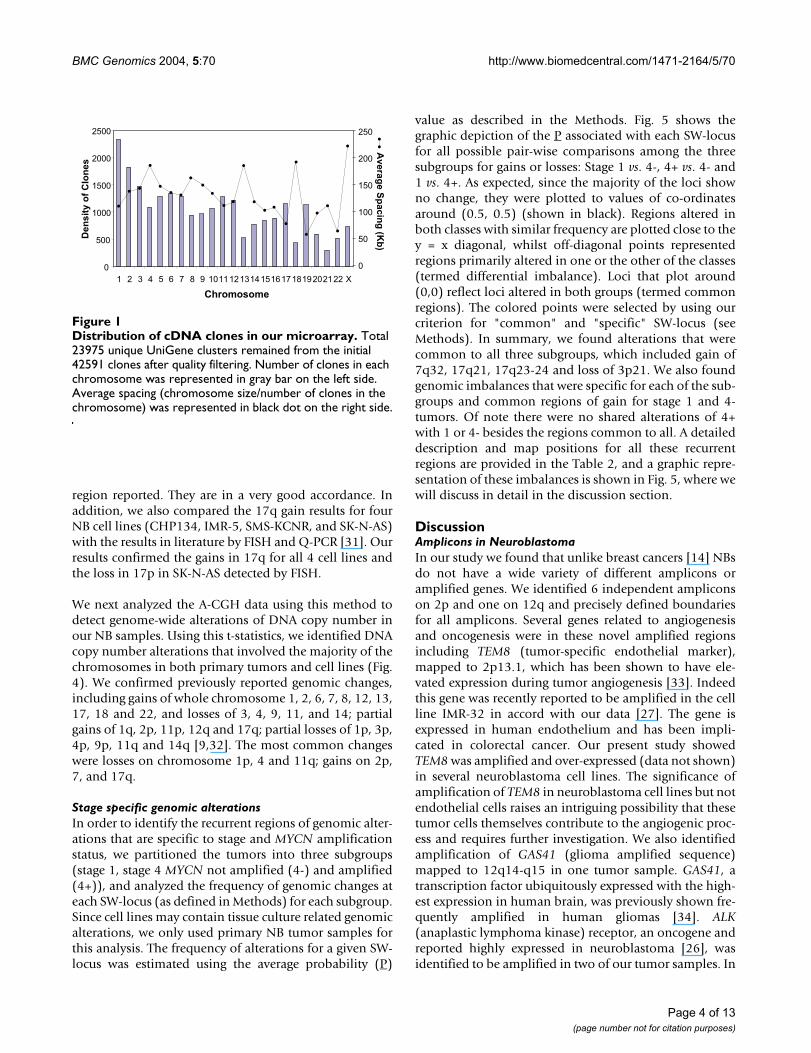
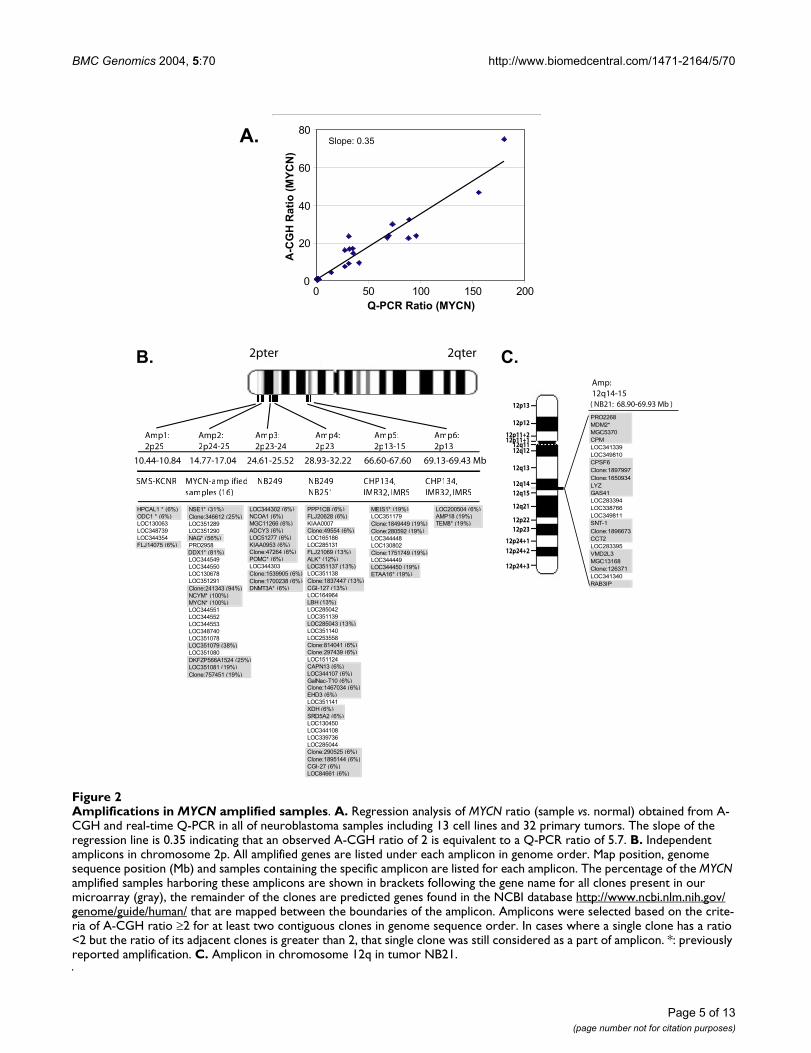
ResultsAmplicon Mapping by A-CGHTotally around 24,000 qualified array cDNA clones wereapplied for data analysis in 12 NB cell lines and 32 NB pri-mary tumor samples (see Table 1 for sample informa-tion). Fig. 1 shows the number of clones as well as theaverage spacing for each chromosome. We first deter-mined the sensitivity of A-CGH to detect the copy numberof highly amplified genes. We here chose MYCN since it isthe most commonly amplified gene in NB and correlateswith the biological behavior of these tumors. Fig. 2Ashows the linear regression plot of the MYCN amplifica-tion results from A-CGH and Quantitative-PCR (Q-PCR).We found that the slope of the fitting line was 0.35, andtherefore an observed ratio of 2 by A-CGH corresponds to
Q-PCR ratio of ~6. In order to identify the amplifiedregions, we initially selected genes with A-CGH ratio ≥2for at least two contiguous clones in genome sequenceorder. Only two chromosomes (2p and 12q) showedamplifications by this criterion exclusively in the MYCNamplified samples. Focusing on 2p (Fig. 2B), we found 6independent non-contiguous amplicons (10.4–69.4 Mb).For the MYCN amplicon, the largest contiguous regionwas 1.7 Mb and bounded by NAG and an EST (clone:757451) in three tumor samples, whilst the smallestregion was 27 Kb including an EST (clone: 241343),NCYM, and MYCN. We identified 9 previously reportedco-amplified genes (HPCAL1, ODC1, NSE1, NAG, DDX1,NCYM, POMC, DNMT3A, ALK, MEIS1, TEM8) [16,20-27], and detected the novel amplification of severalknown genes (NCOA1, ADCY3, PPP1CB, CGI-127, LBH,CAPN13, GalNac-T10, EHD3, XDH, SRD5A2, CGI-27,AMP18) and ESTs. Three of the cell lines (CHP134, IMR-5 and IMR-32) contained two amplicons in 2p13-15. Thefirst (66.6–67.6 Mb) included previously reported ampli-fied gene MEIS1, and the size of the second amplicon was0.3 Mb (69.1–69.4 Mb), which was bounded byLOC200504 and TEM8. In addition to chromosome 2p,we identified another amplicon on 12q14-q15 in a singletumor (NB21); bounded by PRO2268 (68.9 Mb) andRAB3IP (69.9 Mb) containing one previously reportedamplified gene (MDM2) [28] as well as several novelamplifications (CPM, CPSF6, LYZ, GAS41, SNT-1, CCT2,VMD2L3, and RAB3IP) (Fig. 2C). We verified the amplifi-cation of NSE1, NAG, DDX1, MYCN and TEM8 by Q-PCR(data not shown). Simultaneous gene expression profilingby using the same cDNA arrays for all samples showedthat 47% of the amplified genes correlate with geneexpression (using a correlation coefficient cutoff 0.5; datanot shown).
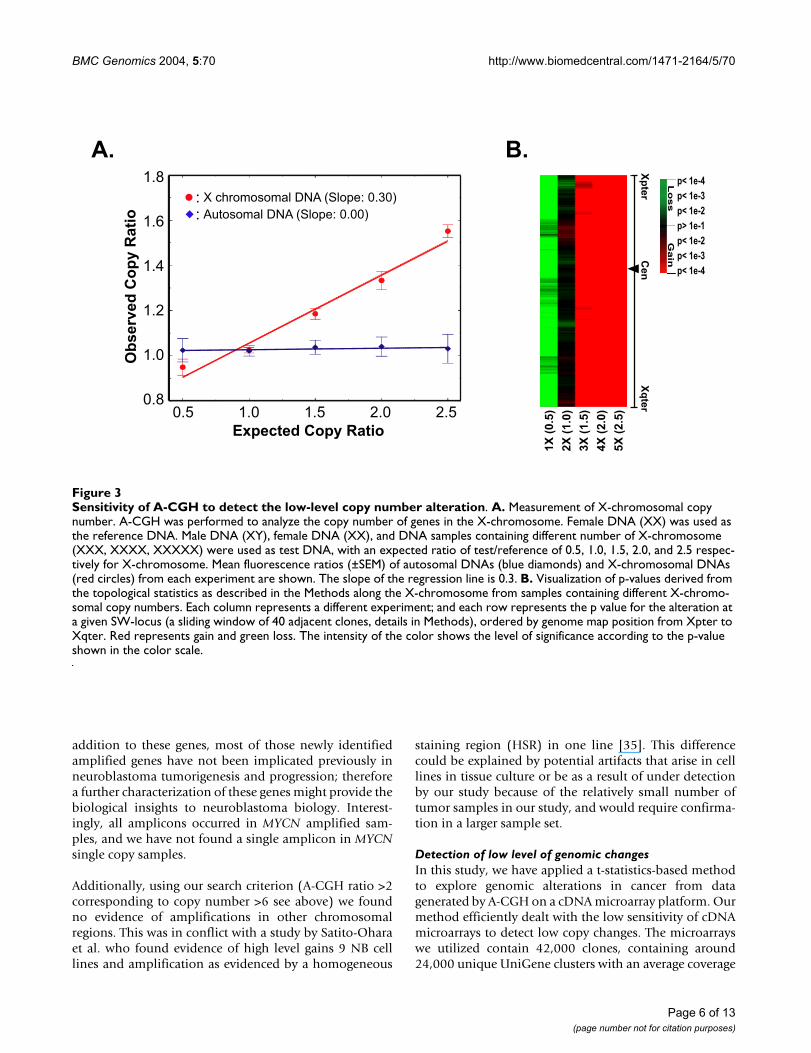
Detection of low-level DNA copy number alterationsTo test the sensitivity of A-CGH to detect single copynumber changes, we performed A-CGH with DNA fromcell lines containing different numbers of X chromosomes(1–5 copies) [12] and compared them to a sample with 2copies of X chromosomes. The observed mean fluores-cence ratio of all clones across X chromosome was calcu-lated (Fig. 3A). For single copy deletions we observed anA-CGH ratio 0.9 (expected 0.5). The regression slope was0.3, similar to that for the MYCN above (Fig 2A). Theunderestimation of the expected ratio by A-CGH demon-strated that it is difficult to detect single-copy changesusing pre-set threshold-based approaches.
In order to increase the sensitivity for detecting low copynumber changes, we applied a probabilistic approach uti-lizing t-statistics and the local genomic sequence mappinginformation of each of the cDNA clones on our arrays. Tovalidate our method, we re-analyzed the A-CGH data
Page 2 of 13(page number not for citation purposes)
BMC Genomics 2004, 5:70 http://www.biomedcentral.com/1471-2164/5/70
generated from the cell lines containing 1–5 copies of theX chromosome as described above, and we were able todetect a single copy loss and gain of X chromosome wherethe expected ratio was 0.5 and 1.5 respectively (Fig. 3B).In addition, we used the reported results from the litera-ture as an independent validation. The cell line SK-N-AS is
deleted within 1p36.2-p36.3, which has been investigatedby FISH and southern blot analysis [29,30]. The proximalSK-N-AS deletion breakpoint was mapped to betweenNPPA and PLOD, while the distal breakpoint is proximalof CDC2L1. The deletion detected by our method is bor-dered by KIAA0495 and CTNNBIP1, which is within the
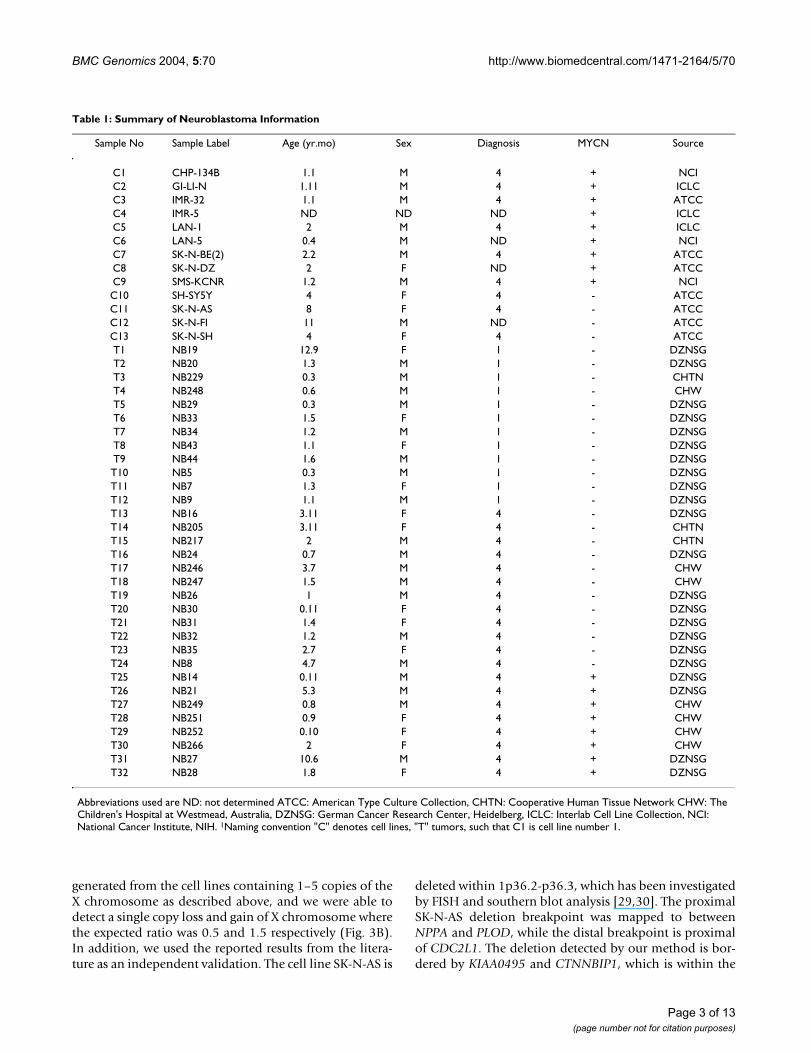
Table 1: Summary of Neuroblastoma Information
Sample No Sample Label Age (yr.mo) Sex Diagnosis MYCN Source
C1 CHP-134B 1.1 M 4 + NCIC2 GI-LI-N 1.11 M 4 + ICLCC3 IMR-32 1.1 M 4 + ATCCC4 IMR-5 ND ND ND + ICLCC5 LAN-1 2 M 4 + ICLCC6 LAN-5 0.4 M ND + NCIC7 SK-N-BE(2) 2.2 M 4 + ATCCC8 SK-N-DZ 2 F ND + ATCCC9 SMS-KCNR 1.2 M 4 + NCIC10 SH-SY5Y 4 F 4 - ATCCC11 SK-N-AS 8 F 4 - ATCCC12 SK-N-FI 11 M ND - ATCCC13 SK-N-SH 4 F 4 - ATCCT1 NB19 12.9 F 1 - DZNSGT2 NB20 1.3 M 1 - DZNSGT3 NB229 0.3 M 1 - CHTNT4 NB248 0.6 M 1 - CHWT5 NB29 0.3 M 1 - DZNSGT6 NB33 1.5 F 1 - DZNSGT7 NB34 1.2 M 1 - DZNSGT8 NB43 1.1 F 1 - DZNSGT9 NB44 1.6 M 1 - DZNSGT10 NB5 0.3 M 1 - DZNSGT11 NB7 1.3 F 1 - DZNSGT12 NB9 1.1 M 1 - DZNSGT13 NB16 3.11 F 4 - DZNSGT14 NB205 3.11 F 4 - CHTNT15 NB217 2 M 4 - CHTNT16 NB24 0.7 M 4 - DZNSGT17 NB246 3.7 M 4 - CHWT18 NB247 1.5 M 4 - CHWT19 NB26 1 M 4 - DZNSGT20 NB30 0.11 F 4 - DZNSGT21 NB31 1.4 F 4 - DZNSGT22 NB32 1.2 M 4 - DZNSGT23 NB35 2.7 F 4 - DZNSGT24 NB8 4.7 M 4 - DZNSGT25 NB14 0.11 M 4 + DZNSGT26 NB21 5.3 M 4 + DZNSGT27 NB249 0.8 M 4 + CHWT28 NB251 0.9 F 4 + CHWT29 NB252 0.10 F 4 + CHWT30 NB266 2 F 4 + CHWT31 NB27 10.6 M 4 + DZNSGT32 NB28 1.8 F 4 + DZNSG
Abbreviations used are ND: not determined ATCC: American Type Culture Collection, CHTN: Cooperative Human Tissue Network CHW: The Children's Hospital at Westmead, Australia, DZNSG: German Cancer Research Center, Heidelberg, ICLC: Interlab Cell Line Collection, NCI: National Cancer Institute, NIH. 1Naming convention "C" denotes cell lines, "T" tumors, such that C1 is cell line number 1.
Page 3 of 13(page number not for citation purposes)
BMC Genomics 2004, 5:70 http://www.biomedcentral.com/1471-2164/5/70
region reported. They are in a very good accordance. Inaddition, we also compared the 17q gain results for fourNB cell lines (CHP134, IMR-5, SMS-KCNR, and SK-N-AS)with the results in literature by FISH and Q-PCR [31]. Ourresults confirmed the gains in 17q for all 4 cell lines andthe loss in 17p in SK-N-AS detected by FISH.
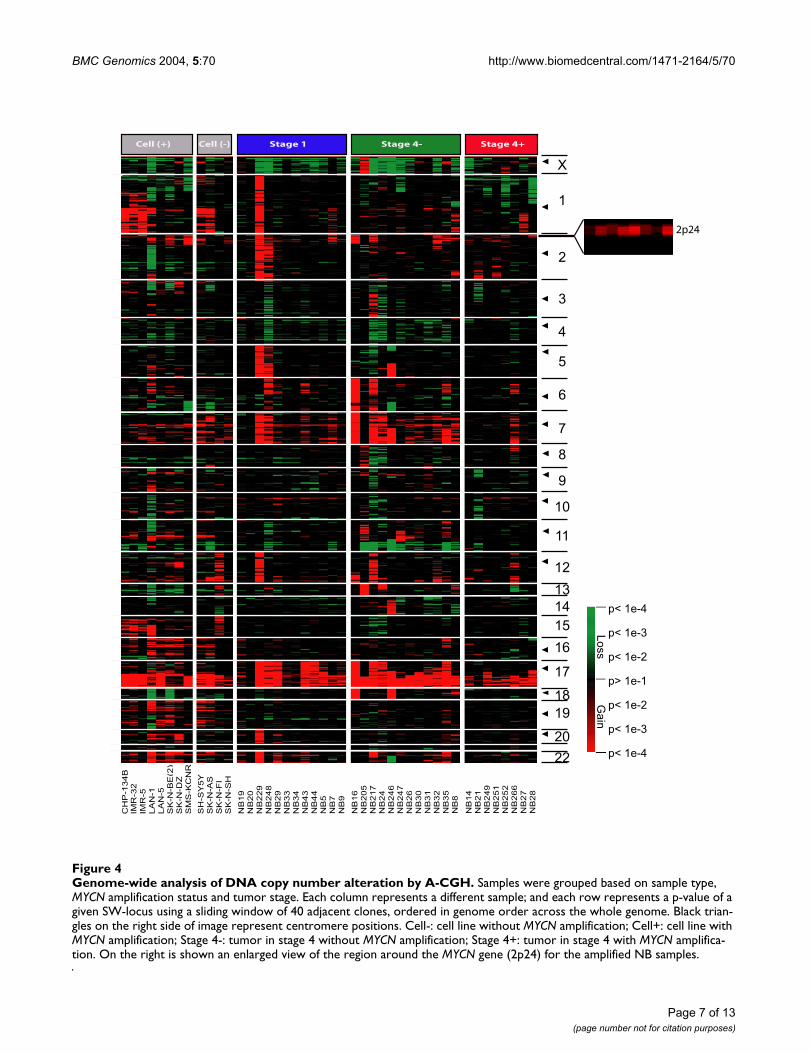
We next analyzed the A-CGH data using this method todetect genome-wide alterations of DNA copy number inour NB samples. Using this t-statistics, we identified DNAcopy number alterations that involved the majority of thechromosomes in both primary tumors and cell lines (Fig.4). We confirmed previously reported genomic changes,including gains of whole chromosome 1, 2, 6, 7, 8, 12, 13,17, 18 and 22, and losses of 3, 4, 9, 11, and 14; partialgains of 1q, 2p, 11p, 12q and 17q; partial losses of 1p, 3p,4p, 9p, 11q and 14q [9,32]. The most common changeswere losses on chromosome 1p, 4 and 11q; gains on 2p,7, and 17q.
Stage specific genomic alterationsIn order to identify the recurrent regions of genomic alter-ations that are specific to stage and MYCN amplificationstatus, we partitioned the tumors into three subgroups(stage 1, stage 4 MYCN not amplified (4-) and amplified(4+)), and analyzed the frequency of genomic changes ateach SW-locus (as defined in Methods) for each subgroup.Since cell lines may contain tissue culture related genomicalterations, we only used primary NB tumor samples forthis analysis. The frequency of alterations for a given SW-locus was estimated using the average probability (P)
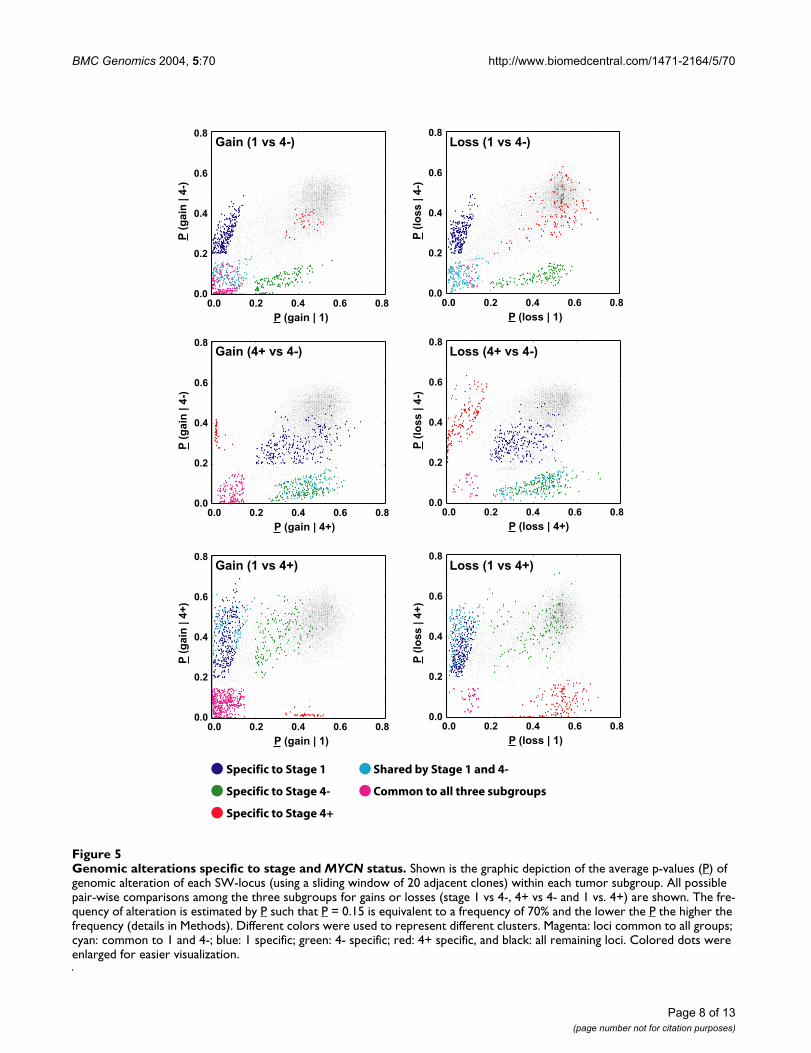
value as described in the Methods. Fig. 5 shows thegraphic depiction of the P associated with each SW-locusfor all possible pair-wise comparisons among the threesubgroups for gains or losses: Stage 1 vs. 4-, 4+ vs. 4- and1 vs. 4+. As expected, since the majority of the loci showno change, they were plotted to values of co-ordinatesaround (0.5, 0.5) (shown in black). Regions altered inboth classes with similar frequency are plotted close to they = x diagonal, whilst off-diagonal points representedregions primarily altered in one or the other of the classes(termed differential imbalance). Loci that plot around(0,0) reflect loci altered in both groups (termed commonregions). The colored points were selected by using ourcriterion for "common" and "specific" SW-locus (seeMethods). In summary, we found alterations that werecommon to all three subgroups, which included gain of7q32, 17q21, 17q23-24 and loss of 3p21. We also foundgenomic imbalances that were specific for each of the sub-groups and common regions of gain for stage 1 and 4-tumors. Of note there were no shared alterations of 4+with 1 or 4- besides the regions common to all. A detaileddescription and map positions for all these recurrentregions are provided in the Table 2, and a graphic repre-sentation of these imbalances is shown in Fig. 5, where wewill discuss in detail in the discussion section.
DiscussionAmplicons in NeuroblastomaIn our study we found that unlike breast cancers [14] NBsdo not have a wide variety of different amplicons oramplified genes. We identified 6 independent ampliconson 2p and one on 12q and precisely defined boundariesfor all amplicons. Several genes related to angiogenesisand oncogenesis were in these novel amplified regionsincluding TEM8 (tumor-specific endothelial marker),mapped to 2p13.1, which has been shown to have ele-vated expression during tumor angiogenesis [33]. Indeedthis gene was recently reported to be amplified in the cellline IMR-32 in accord with our data [27]. The gene isexpressed in human endothelium and has been impli-cated in colorectal cancer. Our present study showedTEM8 was amplified and over-expressed (data not shown)in several neuroblastoma cell lines. The significance ofamplification of TEM8 in neuroblastoma cell lines but notendothelial cells raises an intriguing possibility that thesetumor cells themselves contribute to the angiogenic proc-ess and requires further investigation. We also identifiedamplification of GAS41 (glioma amplified sequence)mapped to 12q14-q15 in one tumor sample. GAS41, atranscription factor ubiquitously expressed with the high-est expression in human brain, was previously shown fre-quently amplified in human gliomas [34]. ALK(anaplastic lymphoma kinase) receptor, an oncogene andreported highly expressed in neuroblastoma [26], wasidentified to be amplified in two of our tumor samples. In
Distribution of cDNA clones in our microarrayFigure 1Distribution of cDNA clones in our microarray. Total 23975 unique UniGene clusters remained from the initial 42591 clones after quality filtering. Number of clones in each chromosome was represented in gray bar on the left side. Average spacing (chromosome size/number of clones in the chromosome) was represented in black dot on the right side.
Chromosome
DensityofClones
0
500
1000
1500
2000
2500
1 2 3 4 5 6 7 8 9 10111213141516171819202122 X
250
200
0
50
100
150
AverageSpacing(Kb)
Page 4 of 13(page number not for citation purposes)
BMC Genomics 2004, 5:70 http://www.biomedcentral.com/1471-2164/5/70
Amplifications in MYCN amplified samplesFigure 2Amplifications in MYCN amplified samples. A. Regression analysis of MYCN ratio (sample vs. normal) obtained from A-CGH and real-time Q-PCR in all of neuroblastoma samples including 13 cell lines and 32 primary tumors. The slope of the regression line is 0.35 indicating that an observed A-CGH ratio of 2 is equivalent to a Q-PCR ratio of 5.7. B. Independent amplicons in chromosome 2p. All amplified genes are listed under each amplicon in genome order. Map position, genome sequence position (Mb) and samples containing the specific amplicon are listed for each amplicon. The percentage of the MYCN amplified samples harboring these amplicons are shown in brackets following the gene name for all clones present in our microarray (gray), the remainder of the clones are predicted genes found in the NCBI database http://www.ncbi.nlm.nih.gov/genome/guide/human/ that are mapped between the boundaries of the amplicon. Amplicons were selected based on the crite-ria of A-CGH ratio ≥2 for at least two contiguous clones in genome sequence order. In cases where a single clone has a ratio <2 but the ratio of its adjacent clones is greater than 2, that single clone was still considered as a part of amplicon. *: previously reported amplification. C. Amplicon in chromosome 12q in tumor NB21.
Slope: 0.35
0
20
40
60
80
0 50 100 150 200
Q-PCR Ratio (MYCN)
A-CGHRatio(MYCN)
2pter 2qter
Amp1:2p25
Amp6:2p13
Amp5:2p13-15
Amp2:2p24-25
Amp4:2p23
Amp3:2p23-24
SMS-KCNR MYCN-amplifiedsamples (16)
NB249 NB249NB251
CHP134,IMR32, IMR5
CHP134,IMR32, IMR5
10.44-10.84 69.13-69.43 Mb66.60-67.6028.93-32.2224.61-25.5214.77-17.04
LOC200504 (6%)
AMP18 (19%)
TEM8* (19%)
MEIS1* (19%)
LOC351179
Clone:1849449 (19%)
Clone:280592 (19%)
LOC344448
LOC130802
Clone:1751749 (19%)
LOC344449
LOC344450 (19%)
ETAA16* (19%)
LOC285044
Clone:290525 (6%)
Clone:1895144 (6%)
CGI-27 (6%)
LOC84661 (6%)
PPP1CB (6%)
FLJ20628 (6%)
KIAA0007
Clone:49554 (6%)
LOC165186
LOC285131
FLJ21069 (13%)
ALK* (12%)
LOC351137 (13%)
LOC351138
Clone:1837447 (13%)
CGI-127 (13%)
LOC164964
LBH (13%)
LOC285042
LOC351139
LOC285043 (13%)
LOC351140
LOC253558
Clone:814041 (6%)
Clone:297439 (6%)
LOC151124
CAPN13 (6%)
LOC344107 (6%)
GalNac-T10 (6%)Clone:1467034 (6%)
EHD3 (6%)
LOC351141
XDH (6%)
SRD5A2 (6%)
LOC130450
LOC344108
LOC339736
LOC344302 (6%)
NCOA1 (6%)
MGC11266 (6%)
ADCY3 (6%)
LOC51277 (6%)
KIAA0953 (6%)
Clone:47264 (6%)
POMC* (6%)
LOC344303
Clone:1539905 (6%)
Clone:1700238 (6%)
DNMT3A* (6%)
NSE1* (31%)
Clone:346612 (25%)
LOC351289
LOC351290
NAG* (56%)
PRO2958
DDX1* (81%)
LOC344549
LOC344550
LOC130678
LOC351291
Clone:241343 (94%)
NCYM* (100%)
MYCN* (100%)
LOC344551
LOC344552
LOC344553
LOC348740
LOC351078
LOC351079 (38%)
LOC351080
DKFZP566A1524 (25%)
LOC351081 (19%)
Clone:757451 (19%)
HPCAL1 * (6%)
ODC1 * (6%)
LOC130063
LOC348739
LOC344354
FLJ14075 (6%)
A.
B. C.
Amp:12q14-15( NB21: 68.90-69.93 Mb )
PRO2268
MDM2*
MGC5370
CPM
LOC341339
LOC349810
CPSF6
Clone:1897997
Clone:1650934
LYZ
GAS41
LOC283394
LOC338766
LOC349811
SNT-1
Clone:1896673
CCT2
LOC283395
VMD2L3
MGC13168
Clone:126371
LOC341340
RAB3IP
12p13
12p24+1
12p12
12p22
12q14
12q11
12q15
12p11+2
12q13
12q12
12p24+3
12p24+2
12p23
12q21
12p11+1
Page 5 of 13(page number not for citation purposes)
BMC Genomics 2004, 5:70 http://www.biomedcentral.com/1471-2164/5/70
addition to these genes, most of those newly identifiedamplified genes have not been implicated previously inneuroblastoma tumorigenesis and progression; thereforea further characterization of these genes might provide thebiological insights to neuroblastoma biology. Interest-ingly, all amplicons occurred in MYCN amplified sam-ples, and we have not found a single amplicon in MYCNsingle copy samples.
Additionally, using our search criterion (A-CGH ratio >2corresponding to copy number >6 see above) we foundno evidence of amplifications in other chromosomalregions. This was in conflict with a study by Satito-Oharaet al. who found evidence of high level gains 9 NB celllines and amplification as evidenced by a homogeneous
staining region (HSR) in one line [35]. This differencecould be explained by potential artifacts that arise in celllines in tissue culture or be as a result of under detectionby our study because of the relatively small number oftumor samples in our study, and would require confirma-tion in a larger sample set.
Detection of low level of genomic changesIn this study, we have applied a t-statistics-based methodto explore genomic alterations in cancer from datagenerated by A-CGH on a cDNA microarray platform. Ourmethod efficiently dealt with the low sensitivity of cDNAmicroarrays to detect low copy changes. The microarrayswe utilized contain 42,000 clones, containing around24,000 unique UniGene clusters with an average coverage
Sensitivity of A-CGH to detect the low-level copy number alterationFigure 3Sensitivity of A-CGH to detect the low-level copy number alteration. A. Measurement of X-chromosomal copy number. A-CGH was performed to analyze the copy number of genes in the X-chromosome. Female DNA (XX) was used as the reference DNA. Male DNA (XY), female DNA (XX), and DNA samples containing different number of X-chromosome (XXX, XXXX, XXXXX) were used as test DNA, with an expected ratio of test/reference of 0.5, 1.0, 1.5, 2.0, and 2.5 respec-tively for X-chromosome. Mean fluorescence ratios (±SEM) of autosomal DNAs (blue diamonds) and X-chromosomal DNAs (red circles) from each experiment are shown. The slope of the regression line is 0.3. B. Visualization of p-values derived from the topological statistics as described in the Methods along the X-chromosome from samples containing different X-chromo-somal copy numbers. Each column represents a different experiment; and each row represents the p value for the alteration at a given SW-locus (a sliding window of 40 adjacent clones, details in Methods), ordered by genome map position from Xpter to Xqter. Red represents gain and green loss. The intensity of the color shows the level of significance according to the p-value shown in the color scale.
X chromosomal DNA (Slope: 0.30)
Autosomal DNA (Slope: 0.00)
0.5 2.52.01.51.0
Expected Copy Ratio
1.8
1.6
1.4
1.2
1.0
0.8
ObservedCopyRatio
::
A. B.Xpter
Cen
Xqter
Loss
Gain
p< 1e-4
p> 1e-1
p< 1e-2
p< 1e-3
p< 1e-2
p< 1e-3
p< 1e-4
1X(0.5)
2X(1.0)
5X(2.5)
4X(2.0)
3X(1.5)
Page 6 of 13(page number not for citation purposes)
BMC Genomics 2004, 5:70 http://www.biomedcentral.com/1471-2164/5/70
Genome-wide analysis of DNA copy number alteration by A-CGHFigure 4Genome-wide analysis of DNA copy number alteration by A-CGH. Samples were grouped based on sample type, MYCN amplification status and tumor stage. Each column represents a different sample; and each row represents a p-value of a given SW-locus using a sliding window of 40 adjacent clones, ordered in genome order across the whole genome. Black trian-gles on the right side of image represent centromere positions. Cell-: cell line without MYCN amplification; Cell+: cell line with MYCN amplification; Stage 4-: tumor in stage 4 without MYCN amplification; Stage 4+: tumor in stage 4 with MYCN amplifica-tion. On the right is shown an enlarged view of the region around the MYCN gene (2p24) for the amplified NB samples.
Cell (+) Cell (-) Stage 4+Stage 4-Stage 1
CHP-134B
IMR-32
IMR-5
LAN-1
LAN-5
SK-N-BE(2)
SK-N-DZ
SMS-KCNR
SH-SY5Y
SK-N-AS
SK-N-FI
SK-N-SH
NB19
NB20
NB229
NB248
NB29
NB33
NB34
NB43
NB44
NB5
NB7
NB9
NB16
NB205
NB217
NB24
NB246
NB247
NB26
NB30
NB31
NB32
NB35
NB8
NB14
NB21
NB249
NB251
NB252
NB266
NB27
NB28
1
2
3
4
5
6
7
8
9
10
11
12
13
14
15
16
17
18
19
20
22
X
Loss
Gain
p< 1e-4
p> 1e-1
p< 1e-2
p< 1e-3
p< 1e-2
p< 1e-3
p< 1e-4
2p24
Page 7 of 13(page number not for citation purposes)
BMC Genomics 2004, 5:70 http://www.biomedcentral.com/1471-2164/5/70
Genomic alterations specific to stage and MYCN statusFigure 5Genomic alterations specific to stage and MYCN status. Shown is the graphic depiction of the average p-values (P) of genomic alteration of each SW-locus (using a sliding window of 20 adjacent clones) within each tumor subgroup. All possible pair-wise comparisons among the three subgroups for gains or losses (stage 1 vs 4-, 4+ vs 4- and 1 vs. 4+) are shown. The fre-quency of alteration is estimated by P such that P = 0.15 is equivalent to a frequency of 70% and the lower the P the higher the frequency (details in Methods). Different colors were used to represent different clusters. Magenta: loci common to all groups; cyan: common to 1 and 4-; blue: 1 specific; green: 4- specific; red: 4+ specific, and black: all remaining loci. Colored dots were enlarged for easier visualization.
Gain (1 vs 4-)
Gain (4+ vs 4-)
Gain (1 vs 4+)
Loss (1 vs 4-)
Loss (4+ vs 4-)
Loss (1 vs 4+)
0.2
0.8
0.6
0.4
0.00.0 0.2 0.4 0.6 0.8
P (gain | 1)
P(gain|4-)
0.2
0.8
0.6
0.4
0.00.0 0.2 0.4 0.6 0.8
P (gain | 4+)
P(gain|4-)
0.2
0.8
0.6
0.4
0.00.0 0.2 0.4 0.6 0.8
P (gain | 1)
P(gain|4+)
0.2
0.8
0.6
0.4
0.00.0 0.2 0.4 0.6 0.8
P (loss | 1)
P(loss|4-)
0.2
0.8
0.6
0.4
0.00.0 0.2 0.4 0.6 0.8
P (loss | 4+)
P(loss|4-)
0.2
0.8
0.6
0.4
0.00.0 0.2 0.4 0.6 0.8
P (loss | 1)
P(loss|4+)
Specific to Stage 4+
Specific to Stage 1 Shared by Stage 1 and 4-
Common to all three subgroupsSpecific to Stage 4-
Page 8 of 13(page number not for citation purposes)
BMC Genomics 2004, 5:70 http://www.biomedcentral.com/1471-2164/5/70
of one cluster every 125 Kb. Underestimation of DNAcopy number ratios by cDNA A-CGH data made it diffi-cult to detect low level of gains and losses using ratiothreshold based approaches, which was addressed in ourstudy and previous reports [14-16]. The algorithm wehave implemented included an efficient noise reductionstrategy by combining ratios within a sliding window ofclones as has been previously described [13,14]. Howeverthe incorporation of t-statistics demonstrated severaladvantages over the sole reliance of moving average fordetecting genomic changes. It provides confidence levelsfor detecting genomic changes at each DNA location (SW-locus) in terms of p-values. This has theoretical advan-tages over the original raw ratio, because it incorporatesan estimate of possible statistical errors in the analysis bygiving a p-value attached to each genomic change withina SW-locus. By this method we were able to detect 1.5 foldchanges of gene copy number as shown in our X-chromo-some validation experiment.
However, all these advantages are traded for a loss of res-olution: genomic imbalances much smaller than the win-dow-size cannot be detected and the boundaries ofinstable regions are blurred. Therefore we should choosethe smallest window that has the desired level of statisticalsignificance. The effective resolution can be obtained byanalyzing the correlation of overlapping sliding windows.The integrated autocorrelation time is an estimator of theminimal distance for windows to be effectively uncorre-lated [36] even when they overlap. For the sliding windowt-test in our algorithm this distance can be calculated to behalf the window size w, thus the number (N) of totalunique Unigene clusters is reduced to 2N/w for the effec-tively independent measurements of the DNA copynumber. Our results indicate that a window size 20 isneeded in order to detect the lowest possible DNA change(one copy change) with reasonable statistical significance.According to the discussion above, this window sizereduces the approximately 24,000 quality filtered uniqueUnigene clusters to 2 * 24,000/20 = 2400 independentestimates. This resolution is comparable to typical BAC
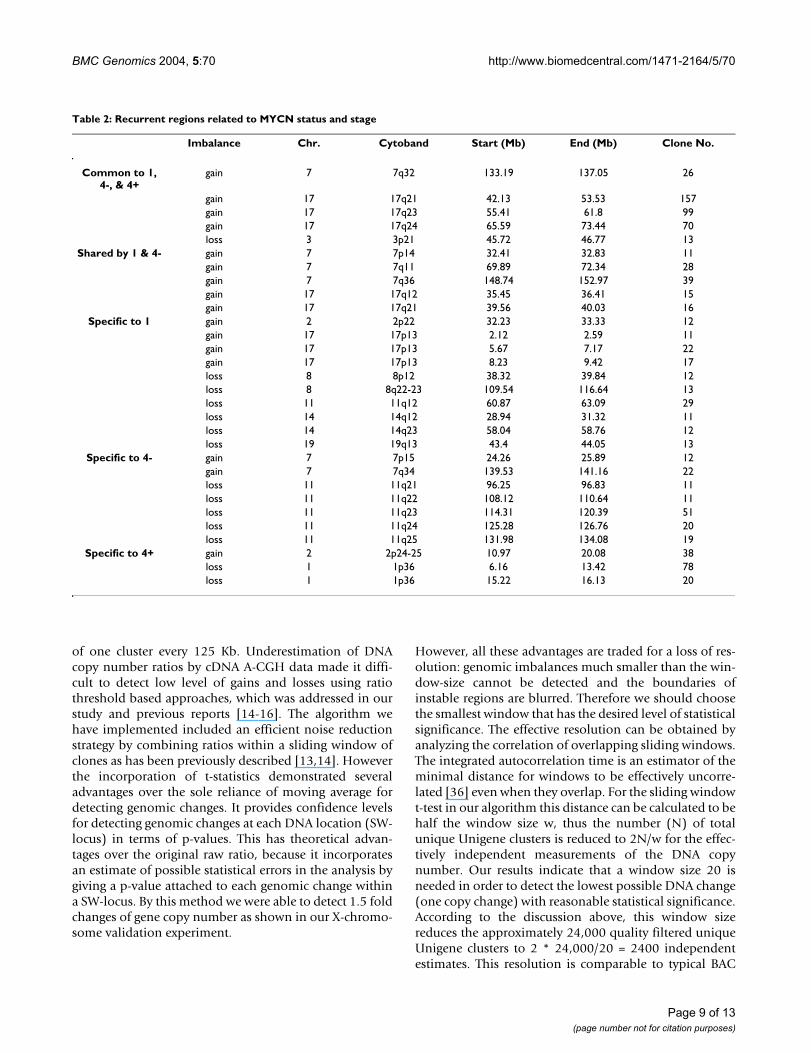
Table 2: Recurrent regions related to MYCN status and stage
Imbalance Chr. Cytoband Start (Mb) End (Mb) Clone No.
Common to 1, 4-, & 4+
gain 7 7q32 133.19 137.05 26
gain 17 17q21 42.13 53.53 157gain 17 17q23 55.41 61.8 99gain 17 17q24 65.59 73.44 70loss 3 3p21 45.72 46.77 13
Shared by 1 & 4- gain 7 7p14 32.41 32.83 11gain 7 7q11 69.89 72.34 28gain 7 7q36 148.74 152.97 39gain 17 17q12 35.45 36.41 15gain 17 17q21 39.56 40.03 16
Specific to 1 gain 2 2p22 32.23 33.33 12gain 17 17p13 2.12 2.59 11gain 17 17p13 5.67 7.17 22gain 17 17p13 8.23 9.42 17loss 8 8p12 38.32 39.84 12loss 8 8q22-23 109.54 116.64 13loss 11 11q12 60.87 63.09 29loss 14 14q12 28.94 31.32 11loss 14 14q23 58.04 58.76 12loss 19 19q13 43.4 44.05 13
Specific to 4- gain 7 7p15 24.26 25.89 12gain 7 7q34 139.53 141.16 22loss 11 11q21 96.25 96.83 11loss 11 11q22 108.12 110.64 11loss 11 11q23 114.31 120.39 51loss 11 11q24 125.28 126.76 20loss 11 11q25 131.98 134.08 19
Specific to 4+ gain 2 2p24-25 10.97 20.08 38loss 1 1p36 6.16 13.42 78loss 1 1p36 15.22 16.13 20
Page 9 of 13(page number not for citation purposes)
BMC Genomics 2004, 5:70 http://www.biomedcentral.com/1471-2164/5/70
arrays. For the stronger signals, less noise reduction isrequired. To detect 2-copy number DNA changes, only asmall window size 5 is needed, therefore the resolutionwill be 4 fold higher. Although cDNA A-CGH is knownnot as sensitive as BAC A-CGH for the detection of lowlevel of DNA copy number changes, currently we are ableto obtain the comparable detection by using the probabi-listic approach. In addition, with cDNA array it is possibleto identify genomic amplification at the gene level andinvestigate the direct effect of gene copy number changeover gene expression level in parallel, which will beaddressed in future studies.
ConclusionsIn this study we explored the genomic alterations in NBfrom the data generated by A-CGH on a cDNA microarrayplatform. We have not found genomic alterationsuniversally present in all (100%) three subgroups of NBs,although such a region would be interesting since it mayharbor specific genes that are uniquely responsible for NBtumorigenesis. We therefore focused on commonlyaltered regions where >70% of tumors showed changes ina given region, for our three different subgroups (Fig. 5and Table 2). We found only a few of imbalances occur-ring in all three subgroups, of which gain of 17q21-24 andloss of 3p21 have been previously described in NB biol-ogy [8,37]. Apart from these regions stage 4+ tumors didnot have any other regions that commonly change withthe other two stages, whereas stages 1 and 4- had severalcommon alterations. Stage 4- tumors demonstrated sev-eral unique changes of which losses in 11q has been pre-viously described in MYCN single copy NB [38] and actsas a possible marker of unfavorable phenotype independ-ent of MYCN amplification [39]. Remarkably stage 4+disease appears to have very few genomic alterationswhen compared with Stage 1 and 4- implying that MYCNamplification is sufficient to drive these tumors to anaggressive phenotype, and although other genomicchanges occur, including loss of 1p36 as shown by us andothers [40], it does not require extensive changes. This isin agreement with the murine MYCN transgenic model ofNB where the MYCN transgene itself is enough for tumordevelopment, but these tumors develop additionalgenomic changes characteristic of NB [41].
Based on these results we found that cDNA A-CGH analy-sis is an efficient method for the detection andcharacterization of amplicons. We confirmed the previ-ously reported amplified genes and also identified novelamplifications in neuroblastoma. Furthermore our prob-abilistic approach allows the detection of single copynumber changes from cDNA A-CGH and can be appliedto other CGH platforms including BAC or oligonucle-otides based arrays.
MethodsTumors, cell lines, and genomic DNAThirty-two snap frozen neuroblastoma specimens wereobtained from 12 patients with stage 1, and 20 patientswith stage 4 of which 12 were MYCN-amplified and 8were MYCN single-copy tumors. The original histologicaldiagnoses were made at tertiary hospitals with extensiveexperience in diagnosis and management of neuroblast-oma. Additionally, 12 neuroblastoma cell lines including8 MYCN-amplified and 4 MYCN single copy samples wereused in the study. Details of individual sample are sum-marized in Table 1. The conditions for cell cultures weredone as described previously [17]. High molecular weightgenomic DNA was extracted from interphase of a Trizolpreparation for RNA extraction according to the manufac-turer's instructions (Invitrogen, Gaithersburg, MD).Genomic DNA was treated with RNase A and protease(Qiagen, Valencia, CA), and purified by phenol/chloro-form extraction followed by ethanol precipitation. Weobtained normal genomic DNA samples (male, female or1:1 mixture of male and female) from Promega, andgenomic DNA samples containing the different numbersof X chromosomes (XXX, XXXX, and XXXXX) from theNIGMS http://locus.umdnj.edu/nigms/.
Microarray experimentsPreparation of glass cDNA microarrays was performedaccording to a previously published protocol [18]. Imageanalysis was performed using DeArray software [19]. ThecDNA library containing 42,000 clones was obtainedfrom Research Genetics (Huntsville, AL) and clones wereprinted on two microscope glass slides as a set. Approxi-mately 50% of the cDNAs on the microarrays were eitherknown genes or similar to known genes in other organ-isms, whereas the remainders were anonymous ESTs. ForA-CGH experiments on cDNA microarrays, 20 µg ofgenomic DNA from neuroblastoma tumor or cell linesamples were sonicated and purified with QIAquick PCRpurification column (Qiagen, Valencia, CA). Three micro-grams of sonicated DNA were labeled with aminoallyl-dUTP (Sigma) in a 25-µl reaction, including random hex-amer (0.24 µg/µl, Roche), dATP, dCTP and dGTP (125 µMeach), dTTP (25 µM), aminoallyl-dUTP (100 µM) andhigh concentration of Klenow fragment (2.5 U/µl, NEB).The labeling reaction was purified with QIAquick PCRpurification column. Cy3 and Cy5 dyes were coupled tothe reference DNA (1:1 mixture of normal male andfemale DNA) and sample DNA respectively. Cy3- andCy5-labeled probes were then combined along withhuman Cot-1 DNA (50 µg, Invitrogen) and yeast tRNA(100 µg, Invitrogen). The mixture was concentrated andre-suspended in 32 µl of hybridization buffer (50% for-mamide, 10% dextran sulfate, 4 × SSC, and 2% SDS). Thehybridization mix was first heated at 75°C for 10 min,then at 37°C for an hour, and finally loaded to the pre-
Page 10 of 13(page number not for citation purposes)
BMC Genomics 2004, 5:70 http://www.biomedcentral.com/1471-2164/5/70
hybridized array. The hybridization was performed at37°C overnight. The washing procedure was performed asdescribed previously [17].
Real time quantitative PCRReal time PCR was carried out using SYBR Green PCR corereagents according to the manufacturer's instructions(Applied Biosystems, Foster City, CA). Each DNA samplewas analyzed in triplicate using the ABI PRISM 7000Sequence Detector. For quantitative PCR, 10 ng ofgenomic DNA was used for SYBR green PCR assay. Serialdilutions of neuroblastoma cell line CHP134 DNA wereused as templates for a standard curve, and the normalgenomic DNA was used as a calibrator. The normalizationwas performed as described using BCMA and SDC4 as ref-erence genes [20].
Data analysisFluorescence ratios were normalized for each microarrayby setting the average log ratio for each subarray elementsequal to zero (commonly referred to as "pin-normaliza-tion"). The data was quality-filtered by removing thoseclones with quality lower than 0.5 in more than 20% ofall the samples [19]. For the clones that passed this filter,if the quality for a specific sample is lower than 0.5, thenits fluorescence ratio is replaced by the average ratio valueof all other samples with the good quality. The cloneswere finally assigned to UniGene Cluster (Build 154 Sep-tember 2002). For the UniGene clusters represented bymultiple clones, mean fluorescence ratios of those clonesare used. After these processes we had 23975 unique Uni-Gene clusters remaining from the initial 42591 clones.Map positions for the cluster were assigned by Blatsearches against the "Golden Path" genome assembly(http://genome.ucsc.edu/; June, 2002 Freeze). Through-out this publication, all genomic coordinates are givenwith the respect to this assembly. Finally the clusters weresorted according to their starting position of sequence oneach individual chromosome.
Detection of single copy changesTo identify the alterations of copy number along thegenome, we compared the distribution of the ratios in asliding window of 20 clones in genomic order with a "nulldistribution" using a t-test. The p-value for genomicchange (Pgc) obtained in this way is assigned to the centerof the sliding window (referred to as the "SW-locus"throughout this manuscript). The t-test is valid in thisinstance because the observed distribution of Pgc for theloci in random order matches the expected theoretical dis-tribution. The null-distribution used in t-test representsthe unaltered part of genome. To identify the cDNA clonesfor the null-distribution, we start with the whole genome.The SW-loci corresponding to portions of the DNA thatare amplified or deleted with a p-value smaller than 0.05
are removed recursively from the null dataset, until thenull dataset is stable and there is no more amplified ordeleted SW-locus in the null data set. Finally, the confi-dence of identified genomic alterations is visualized in apseudo-color map in which color intensity represents thelog of p-values (red for gain and green for loss).
Estimation of frequency of genomic changes among the samplesThe probabilistic approach above provides P-values forthe presence of genomic alteration in a given sample. Inorder to estimate the frequency of a genomic alteration wecan set a threshold ratio and identify how many sampleshave a ratio value outside this threshold in the samegenomic region. The disadvantage of this method is thatdifferent ratio thresholds will give different frequencies.We therefore applied another approach to avoid the use ofratio thresholds. To determine the frequency of loss orgain that correlate with the stage or MYCN amplificationstatus, we first calculated the mean of the Pgc or P, for eachgroup. This value is proportional to the frequency fwith
change = Nwith change/Ntotal of their occurrence, where Nwith
change is the number of samples in a subgroup with a givengenomic imbalance and Ntotal is the overall number ofsamples in that subgroup. This is valid as follows. For allloci in which there are no genomic imbalances theobserved Pgc will follow the flat theoretical distributionwith a mean (expectation value) <P> = 0.5. Therefore, forthose cases where we are sure of a genomic imbalance Pgcis close to 0 (for example p < 0.01), whereas for the sam-ples in which there are no changes Pgc = 0.5. According tothe formula: P = ((Nno change × 0.5) + (Nwith change × 0))/Nto-
tal = (1 - fwith change) × 0.5, the lower the P the higher the fre-quency of a genomic change in that SW-locus. Thus the Pcan be used to determine the frequency of a given changee.g. P = 0.15 corresponds to a frequency of ~70% of thesamples with that given change.
Determination of recurrent regionsWe first define a SW-locus with P < 0.15 in a specific sub-group as altered. This threshold corresponds to roughly afraction of >70% of all tumor samples harboring thatalteration in each subgroup. We define an altered SW-locus as common in all tumors, if the SW-locus passes thethreshold for each of the three subgroups. A SW-locus iscalled differential in one subgroup with respect to anothersubgroup, if the frequency of genomic change is at least 3times higher in one subgroup as compared to another. ASW-locus is defined as specific if the locus in one sub-group is differential with respect to each of the other sub-groups; a SW-locus is defined as shared in two groups, ifin both groups it is differential with respect to the thirdsubgroup.
Page 11 of 13(page number not for citation purposes)
BMC Genomics 2004, 5:70 http://www.biomedcentral.com/1471-2164/5/70
AbbreviationsNB: neuroblastoma
A-CGH: array-comparative genomic hybridization
M-CGH: metaphase-comparative genomic hybridization
Stage 1-: stage 1 without MYCN amplification
Stage 4-: stage 4 without MYCN amplification
Stage 4+: stage 4 with MYCN amplification
BAC: Bacterial artificial chromosome
Author's contributionsQC carried out all experiments and participated in dataanalysis. SB performed array CGH data analysis and statis-tical analysis. QC and SB drafted the manuscript. JSW,CCW, NC and CS were involved in the microarray produc-tion and the manuscript edition. ALK and BG wereinvolved in the data analysis and the manuscript edition.FW, FB, MS and DC provided the tumor samples andpatient information and were also involved in the manu-script edition. JK principal investigator of the project, par-ticipated in its design and is the final editor of themanuscript. All authors read and approved the finalmanuscript.
AcknowledgementsWe thank Dr John Maris, Children's Hospital of Philadelphia and Dr Steven Qualman at the Cooperative Human Tissue Network (CHTN) for several of the tumors.
References1. Brodeur GM: Neuroblastoma: biological insights into a clinical
enigma. Nat Rev Cancer 2003, 3:203-16.2. Brodeur GM, Azar C, Brother M, Hiemstra J, Kaufman B, Marshall H,
Moley J, Nakagawara A, Saylors R, Scavarda N, et al.: Neuroblast-oma. Effect of genetic factors on prognosis and treatment.Cancer 1992, 70:1685-94.
3. Brinkschmidt C, Christiansen H, Terpe HJ, Simon R, Boecker W,Lampert F, Stoerkel S: Comparative genomic hybridization(CGH) analysis of neuroblastomas--an important methodo-logical approach in paediatric tumour pathology. J Pathol 1997,181:394-400.
4. Plantaz D, Vandesompele J, Van Roy N, Lastowska M, Bown N, Com-baret V, Favrot MC, Delattre O, Michon J, Benard J, et al.: Compar-ative genomichybridization (CGH) analysis of stage 4neuroblastoma reveals high frequency of 11q deletion intumors lacking MYCN amplification. Int J Cancer 2001, 91:680-6.
5. Cohen N, Betts DR, Trakhtenbrot L, Niggli FK, Amariglio N, Brok-Simoni F, Rechavi G, Meitar D: Detection of unidentified chro-mosome abnormalities in human neuroblastoma by spectralkaryotyping (SKY). Genes Chromosomes Cancer 2001, 31:201-8.
6. Schleiermacher G, Janoueix-Lerosey I, Combaret V, Derre J, Coutu-rier J, Aurias A, Delattre O: Combined 24-color karyotyping andcomparative genomic hybridization analysis indicates pre-dominant rearrangements of early replicating chromosomeregions in neuroblastoma. Cancer Genet Cytogenet 2003,141:32-42.
7. Schwab M, Varmus HE, Bishop JM: Human N-myc gene contrib-utes to neoplastic transformation of mammalian cells inculture. Nature 1985, 316:160-2.
8. Maris JM, Matthay KK: Molecular biology of neuroblastoma. JClin Oncol 1999, 17:2264-79.
9. Vandesompele J, Speleman F, Van Roy N, Laureys G, Brinskchmidt C,Christiansen H, Lampert F, Lastowska M, Bown N, Pearson A, et al.:Multicentre analysis of patterns of DNA gains and losses in204 neuroblastoma tumors: how many genetic subgroupsare there? Med Pediatr Oncol 2001, 36:5-10.
10. Pinkel D, Segraves R, Sudar D, Clark S, Poole I, Kowbel D, Collins C,Kuo WL, Chen C, Zhai Y, et al.: High resolution analysis of DNAcopy number variation using comparative genomic hybridi-zation to microarrays. Nat Genet 1998, 20:207-11.
11. Snijders AM, Nowak N, Segraves R, Blackwood S, Brown N, ConroyJ, Hamilton G, Hindle AK, Huey B, Kimura K, et al.: Assembly ofmicroarrays for genome-wide measurement of DNA copynumber. Nat Genet 2001, 29:263-4.
12. Pollack JR, Perou CM, Alizadeh AA, Eisen MB, Pergamenschikov A,Williams CF, Jeffrey SS, Botstein D, Brown PO: Genome-wideanalysis of DNA copy-number changes using cDNAmicroarrays. Nat Genet 1999, 23:41-6.
13. Pollack JR, Sorlie T, Perou CM, Rees CA, Jeffrey SS, Lonning PE, Tib-shirani R, Botstein D, Borresen-Dale AL, Brown PO: Microarrayanalysis reveals a major direct role of DNA copy numberalteration in the transcriptional program of human breasttumors. Proc Natl Acad Sci U S A 2002, 99:12963-8.
14. Hyman E, Kauraniemi P, Hautaniemi S, Wolf M, Mousses S, Rozen-blum E, Ringner M, Sauter G, Monni O, Elkahloun A, et al.: Impact ofDNA amplification on gene expression patterns in breastcancer. Cancer Res 2002, 62:6240-5.
15. Heiskanen MA, Bittner ML, Chen Y, Khan J, Adler KE, Trent JM, Melt-zer PS: Detection of gene amplification by genomic hybridiza-tion to cDNA microarrays. Cancer Res 2000, 60:799-802.
16. Beheshti B, Braude I, Marrano P, Thorner P, Zielenska M, Squire JA:Chromosomal localization of DNA amplifications in neurob-lastoma tumors using cDNA microarray comparativegenomic hybridization. Neoplasia 2003, 5:53-62.
17. Khan J, Wei JS, Ringner M, Saal LH, Ladanyi M, Westermann F,Berthold F, Schwab M, Antonescu CR, Peterson C, et al.: Classifica-tion and diagnostic prediction of cancers using gene expres-sion profiling and artificial neural networks. Nat Med 2001,7:673-9.
18. Khan J, Saal LH, Bittner ML, Jiang Y, Gooden GC, Glatfelter AA, Melt-zer PS: Gene expression profiling in cancer using cDNAmicroarrays. Methods Mol Med 2002, 68:205-22.
19. Chen Y, Dougherty ER, Bittner ML: Ratio-based decisions and thequantitative analysis of cDNA microarray images. BiomedicalOptics 1997, 2:364-374.
20. De Preter K, Speleman F, Combaret V, Lunec J, Laureys G, EussenBH, Francotte N, Board J, Pearson AD, De Paepe A, et al.: Quantifi-cation of MYCN, DDX1, and NAG gene copy number in neu-roblastoma using a real-time quantitative PCR assay. ModPathol 2002, 15:159-66.
21. Tonin PN, Yeger H, Stallings RL, Srinivasan PR, Lewis WH: Amplifi-cation of N-myc and ornithine decarboxylase genes inhuman neuroblastoma and hydroxyurea-resistant hamstercell lines. Oncogene 1989, 4:1117-21.
22. Kuroda H, White PS, Sulman EP, Manohar CF, Reiter JL, Cohn SL,Brodeur GM: Physical mapping of the DDX1 gene to 340 kb 5'of MYCN. Oncogene 1996, 13:1561-5.
23. Jones TA, Flomen RH, Senger G, Nizetic D, Sheer D: The home-obox gene MEIS1 is amplified in IMR-32 and highly expressedin other neuroblastoma cell lines. Eur J Cancer 2000, 36:2368-74.
24. Armstrong BC, Krystal GW: Isolation and characterization ofcomplementary DNA for N-cym, a gene encoded by theDNA strand opposite to N-myc. Cell Growth Differ 1992,3:385-90.
25. Wimmer K, Zhu XX, Lamb BJ, Kuick R, Ambros PF, Kovar H, Tho-raval D, Motyka S, Alberts JR, Hanash SM: Co-amplification of anovel gene, NAG, with the N-myc gene in neuroblastoma.Oncogene 1999, 18:233-8.
26. Miyake I, Hakomori Y, Shinohara A, Gamou T, Saito M, Iwamatsu A,Sakai R: Activation of anaplastic lymphoma kinase is respon-sible for hyperphosphorylation of ShcC in neuroblastomacell lines. Oncogene 2002, 21:5823-34.
27. De Preter K, Pattyn F, Berx G, Strumane K, Menten B, Van Roy F, DePaepe A, Speleman F, Vandesompele J: Combined subtractivecDNA cloning and array CGH: an efficient approach for iden-
Page 12 of 13(page number not for citation purposes)
http://www.ncbi.nlm.nih.gov/entrez/query.fcgi?cmd=Retrieve&db=PubMed&dopt=Abstract&list_uids=1325279
http://www.ncbi.nlm.nih.gov/entrez/query.fcgi?cmd=Retrieve&db=PubMed&dopt=Abstract&list_uids=1325279
http://www.ncbi.nlm.nih.gov/entrez/query.fcgi?cmd=Retrieve&db=PubMed&dopt=Abstract&list_uids=9196436
http://www.ncbi.nlm.nih.gov/entrez/query.fcgi?cmd=Retrieve&db=PubMed&dopt=Abstract&list_uids=4040214
http://www.ncbi.nlm.nih.gov/entrez/query.fcgi?cmd=Retrieve&db=PubMed&dopt=Abstract&list_uids=4040214
http://www.ncbi.nlm.nih.gov/entrez/query.fcgi?cmd=Retrieve&db=PubMed&dopt=Abstract&list_uids=4040214
http://www.ncbi.nlm.nih.gov/entrez/query.fcgi?cmd=Retrieve&db=PubMed&dopt=Abstract&list_uids=9771718
http://www.ncbi.nlm.nih.gov/entrez/query.fcgi?cmd=Retrieve&db=PubMed&dopt=Abstract&list_uids=2780050
http://www.ncbi.nlm.nih.gov/entrez/query.fcgi?cmd=Retrieve&db=PubMed&dopt=Abstract&list_uids=2780050
http://www.ncbi.nlm.nih.gov/entrez/query.fcgi?cmd=Retrieve&db=PubMed&dopt=Abstract&list_uids=2780050
http://www.ncbi.nlm.nih.gov/entrez/query.fcgi?cmd=Retrieve&db=PubMed&dopt=Abstract&list_uids=8875996
http://www.ncbi.nlm.nih.gov/entrez/query.fcgi?cmd=Retrieve&db=PubMed&dopt=Abstract&list_uids=8875996
http://www.ncbi.nlm.nih.gov/entrez/query.fcgi?cmd=Retrieve&db=PubMed&dopt=Abstract&list_uids=1419902
http://www.ncbi.nlm.nih.gov/entrez/query.fcgi?cmd=Retrieve&db=PubMed&dopt=Abstract&list_uids=1419902
http://www.ncbi.nlm.nih.gov/entrez/query.fcgi?cmd=Retrieve&db=PubMed&dopt=Abstract&list_uids=1419902
BMC Genomics 2004, 5:70 http://www.biomedcentral.com/1471-2164/5/70
Publish with BioMed Central and every scientist can read your work free of charge
"BioMed Central will be the most significant development for disseminating the results of biomedical research in our lifetime."
Sir Paul Nurse, Cancer Research UK
Your research papers will be:
available free of charge to the entire biomedical community
peer reviewed and published immediately upon acceptance
cited in PubMed and archived on PubMed Central
yours — you keep the copyright
Submit your manuscript here:http://www.biomedcentral.com/info/publishing_adv.asp
BioMedcentral
tification of overexpressed genes in DNA amplicons. BMCGenomics 2004, 5:11.
28. Corvi R, Savelyeva L, Breit S, Wenzel A, Handgretinger R, Barak J,Oren M, Amler L, Schwab M: Non-syntenic amplification ofMDM2 and MYCN in human neuroblastoma. Oncogene 1995,10:1081-6.
29. Cheng NC, Van Roy N, Chan A, Beitsma M, Westerveld A, SpelemanF, Versteeg R: Deletion mapping in neuroblastoma cell linessuggests two distinct tumor suppressor genes in the 1p35-36region, only one of which is associated with N-mycamplification. Oncogene 1995, 10:291-7.
30. White PS, Maris JM, Beltinger C, Sulman E, Marshall HN, Fujimori M,Kaufman BA, Biegel JA, Allen C, Hilliard C, et al.: A region of con-sistent deletion in neuroblastoma maps within human chro-mosome 1p36.2-36.3. Proc Natl Acad Sci U S A 1995, 92:5520-4.
31. Morowitz M, Shusterman S, Mosse Y, Hii G, Winter CL, Khazi D,Wang Q, King R, Maris JM: Detection of single-copy chromo-some 17q gain in human neuroblastomas using real-timequantitative polymerase chain reaction. Mod Pathol 2003,16:1248-56.
32. Tonini GP, Romani M: Genetic and epigenetic alterations inneuroblastoma. Cancer Lett 2003, 197:69-73.
33. Carson-Walter EB, Watkins DN, Nanda A, Vogelstein B, Kinzler KW,St Croix B: Cell surface tumor endothelial markers are con-served in mice and humans. Cancer Res 2001, 61:6649-55.
34. Munnia A, Schutz N, Romeike BF, Maldener E, Glass B, Maas R, Nas-tainczyk W, Feiden W, Fischer U, Meese E: Expression, cellulardistribution and protein binding of the glioma amplifiedsequence (GAS41), a highly conserved putative transcriptionfactor. Oncogene 2001, 20:4853-63.
35. Saito-Ohara F, Imoto I, Inoue J, Hosoi H, Nakagawara A, Sugimoto T,Inazawa J: PPM1D is a potential target for 17q gain inneuroblastoma. Cancer Res 2003, 63:1876-83.
36. Sokal A: Monte Carlo methods in statistical mechanics: foun-dations and new algorithms. In: Funtial Integration: Basics andApplicaitons Edited by: CP DeWitt-Morette C, Folacci A Cargese.France: Proceedings of the NATO ASI B-361; 1996.
37. Ejeskar K, Aburatani H, Abrahamsson J, Kogner P, Martinsson T: Lossof heterozygosity of 3p markers in neuroblastoma tumoursimplicate a tumour-suppressor locus distal to the FHITgene. Br J Cancer 1998, 77:1787-91.
38. Guo C, White PS, Weiss MJ, Hogarty MD, Thompson PM, Stram DO,Gerbing R, Matthay KK, Seeger RC, Brodeur GM, et al.: Allelic dele-tion at 11q23 is common in MYCN single copyneuroblastomas. Oncogene 1999, 18:4948-57.
39. Luttikhuis ME, Powell JE, Rees SA, Genus T, Chughtai S, Ramani P,Mann JR, McConville CM: Neuroblastomas with chromosome11q loss and single copy MYCN comprise a biologically dis-tinct group of tumours with adverse prognosis. Br J Cancer2001, 85:531-7.
40. Fong CT, Dracopoli NC, White PS, Merrill PT, Griffith RC, HousmanDE, Brodeur GM: Loss of heterozygosity for the short arm ofchromosome 1 in human neuroblastomas: correlation withN-myc amplification. Proc Natl Acad Sci U S A 1989, 86:3753-7.
41. Hackett CS, Hodgson JG, Law ME, Fridlyand J, Osoegawa K, De JongPJ, Nowak NJ, Pinkel D, Albertson DG, Jain A, et al.: Genome-widearray CGH analysis of murine neuroblastoma reveals dis-tinct genomic aberrations which parallel those in humantumors. Cancer Res 2003, 63:5266-5273.
Page 13 of 13(page number not for citation purposes)
http://www.ncbi.nlm.nih.gov/entrez/query.fcgi?cmd=Retrieve&db=PubMed&dopt=Abstract&list_uids=7700632
http://www.ncbi.nlm.nih.gov/entrez/query.fcgi?cmd=Retrieve&db=PubMed&dopt=Abstract&list_uids=7700632
http://www.ncbi.nlm.nih.gov/entrez/query.fcgi?cmd=Retrieve&db=PubMed&dopt=Abstract&list_uids=7838528
http://www.ncbi.nlm.nih.gov/entrez/query.fcgi?cmd=Retrieve&db=PubMed&dopt=Abstract&list_uids=7838528
http://www.ncbi.nlm.nih.gov/entrez/query.fcgi?cmd=Retrieve&db=PubMed&dopt=Abstract&list_uids=7838528
http://www.ncbi.nlm.nih.gov/entrez/query.fcgi?cmd=Retrieve&db=PubMed&dopt=Abstract&list_uids=7777541
http://www.ncbi.nlm.nih.gov/entrez/query.fcgi?cmd=Retrieve&db=PubMed&dopt=Abstract&list_uids=9667647
http://www.ncbi.nlm.nih.gov/entrez/query.fcgi?cmd=Retrieve&db=PubMed&dopt=Abstract&list_uids=9667647
http://www.ncbi.nlm.nih.gov/entrez/query.fcgi?cmd=Retrieve&db=PubMed&dopt=Abstract&list_uids=9667647
Related Documents

![Targeting the Difficult-to-Drug CD71 and MYCN with ... · tumor models [13–17]. With respect to the MAPK/ERK pathway and CD71, iron levels indeed influence the activity of neuroblastoma,](https://static.cupdf.com/doc/110x72/6066cb26220882738c0ea7ac/targeting-the-difficult-to-drug-cd71-and-mycn-with-tumor-models-13a17-with.jpg)


