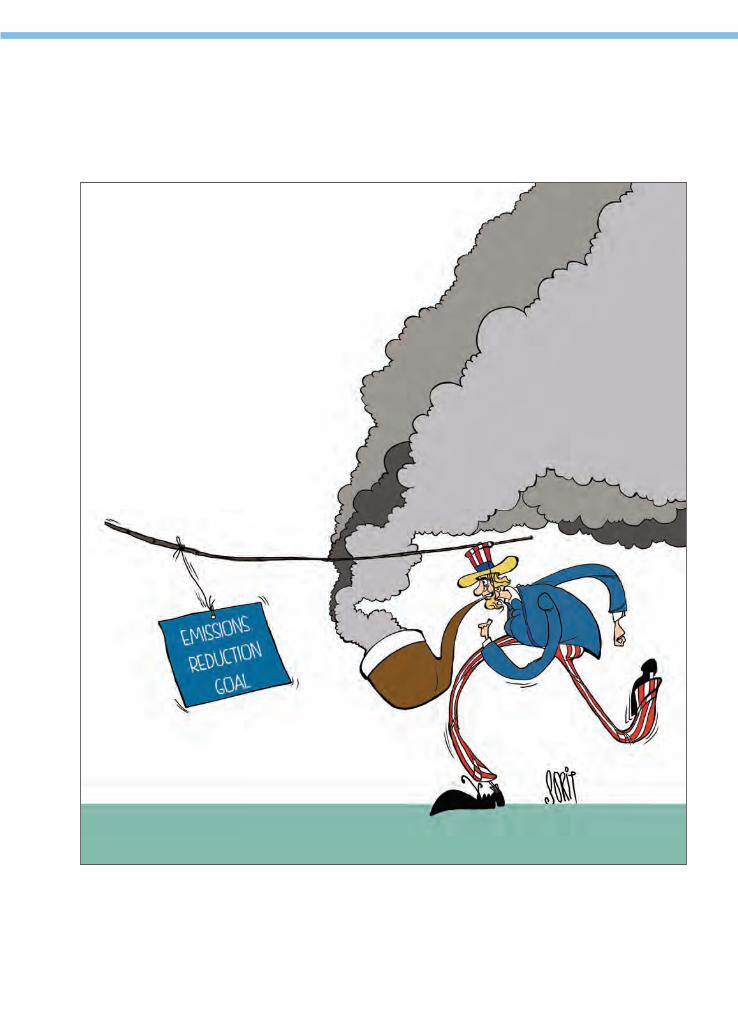
CAPITAN AMERICA US climate goals: a reckoning CAPITAN AMERICA US climate goals: a reckoning

Welcome message from author
This document is posted to help you gain knowledge. Please leave a comment to let me know what you think about it! Share it to your friends and learn new things together.
Transcript

CAPITANAMERICA US climate goals: a reckoning
CENTRE FOR SCIENCE AND ENVIRONMENT41, Tughlakabad Institutional Area, New Delhi 110 062Phone: 91-11- 40616000 Fax: 91-11-29955879E-mail: [email protected] Website: www.cseindia.org
CA
PITAN
AM
ER
ICA
US
climate goals: a reckoning
Back Cover Front cover
ISBN: 978-81-86906-87-3

i
CAPITANAMERICA US climate goals: a reckoning

ii
Authors: Sunita Narain and Chandra Bhushan
Research assistance: Vijeta Rattani
Editors: Pratap Pandey and Souparno Banerjee
Design and cover: Ajit Bajaj
Cartoons: Sorit Gupto
Layouts: Kirpal Singh
Infographics: Rajkumar Singh
Production: Rakesh Shrivastava, Gundhar Das
© 2015 Centre for Science and Environment
ISBN: 978-81-86906-87-3
Material from this publication can be used, but with acknowledgement.
Citation: Narain, Sunita and Bhushan, Chandra 2015, Capitan America–USclimate goals: a reckoning, Centre for Science and Environment, New Delhi
Published byCentre for Science and Environment41, Tughlakabad Institutional AreaNew Delhi 110 062Phone: 91-11- 40616000Fax: 91-11-29955879E-mail: [email protected] Website: www.cseindia.org
Printed at Multi Colour Services

Foreword v
1. Misprison? 1US climate-action stance seems proactive. Seems. For starters,
its INDC is neither fair nor ambitious
2. The Guzzle Puzzle 13Seems an entrenched fossil fuel user is changing tack. Seems.
3. Light Years Away 23US electricity sector alone can short-circuit climate action
4. Loco Motion 51US transport sector cannot remain as car-friendly as it is now
5. Buildings 69Building sizes are growing, and so therefore, is the energy consumption
6. Industry 85Industrial emissions have not gone down; they have merely been outsourced
7. Agriculture & Waste 97Will the US change its preference for processed foods and stop wasting food?
8. The Mall-thusians 107A species bred on conspicuous consumption. Borne by the USA
9. The Star-Spangled Spanner 115What this book is about. A reiteration
References 127
iii
Contents
iv
v
After nearly three decades of climate change denial, the US hasdecided enough is enough. Climate change is real, and the US mustact. It has submitted its Intended Nationally DeterminedContribution — its emissions reduction framework — to the climate
treaty secretariat. It has set out its climate change action plan. Dramatic. TheParis climate conference is the stage for an operatic unfolding. The world isalready celebrating — the prodigal has returned.
We present a few inconvenient truths — one per chapter — that might throwcold water on the celebration. The US climate action plan is dramatic. But it isneither ambitious nor equitable. Worse, it is but business-as-usual. Ifimplemented, we have analysed, emissions reduction will be marginal.Whatever reduction is achieved, whether due to increased efficiency or a shiftin fossil fuel use, will be run over by runaway gluttonous consumption. Weconclude, for the sake of the world’s future: American lifestyle can no longerremain not-negotiable.
Will our stance lead to huge disquiet? Our friends in US civil society are sure toaccuse us of playing into the hands of the Republican Party — that fearsomefree-market gang of raucous climate sceptics. Here is a president, they will say,who has finally come out of the closet. It has taken President Barack Obamacourage to act on what he declaimed in the first year of his eight-yearpresidency, when he spoke loudly and with passion about the coming climatecatastrophe. We, they will rue, are discounting this effort. Discrediting US
policy drift. We are providing serious grist, they will scold, to the anti-climatechange mill in the country. Our position on the need to discuss consumption inclimate change will fuel their worst fears: the world wants to close their free-market frontier.
We would have agreed with them, except for the following issues.
One: the US really believes, its action plan is perhaps the beginning of realchange; even if the plan isn’t ambitious, once accepted the momentum mightallow it to pick up speed and scale. Unfortunately, our analysis shows that is
Foreword

not the case. So, the world cannot keep deluding itself that the climate actioneagle has landed.
Two: more seriously, the dangers of climate change are real and the need forreal action urgent. We in India are beginning to see how devastating extremeweather events can be — they are death-dealers; in India, they are taking lives.The world’s poorest, who have not contributed to the emissions already in theatmosphere, are becoming the most affected. This is not acceptable. Climatejustice requires effective and ambitious action to cut greenhouse gases.Nothing else is acceptable.
Three: for many years now, we have been told, by our same friends in the US
civil society, that we must always fear the return of the Republicans, for theywill destroy even the vestige of US climate change policy. And when aDemocrat president is elected, the advice is we need to ‘tone down’, bepragmatic and allow that ‘liberal’ person to steer the climate course. Actually,for many years, their Game of Thrones has held us to ransom. Decades havegone, and deadly greenhouse gas emissions still continue to rise.
We have nothing against such advice. All would have been all right if theDemocrat government in the US had, for the first time, taken hard and decisivesteps to reduce emissions, starting today and more tomorrow. But, as ourassessment shows, this is not the case.
So, it is time we stopped tiptoeing around the US. It is time to call a spade aspade: US obduracy on climate change has ensured the world today is in thedanger zone and will go critical soon. Since 1992, when the frameworkconvention on climate change was signed, the US has played offense — finger-pointing at others and justifying its own lack of action. It is time the rest of usstopped playing defense. For the Planet’s sake.
We do take heart from the words of President Obama, who said as plainly aspossible, in Alaska in August, that the threat of climate change is real, and hefears not enough is being done to combat it. “We are not acting fast enough,”he repeated over and over again. This is true. This is what the Americanpeople need to be told.
They cannot be fed the story, repeated by their leaders and the powerful mediaof the free world, that it is the emissions of China and India that are frying the
vi

world. The American people cannot be told that they needn’t act, becauseother countries — opting for the right to development — refuse to make amove. The ‘right to development’ of the poor, who need carbon space andecological space for their growth, cannot be equated with the ‘right to pollute’of the rich. The burden of transition cannot be shifted because the rich of theworld are rich and so powerful.
At this juncture, we cannot afford to be inconsiderate. Raising the issue ofAmerica’s lack of action, we really fear, might justify similar renegade stepsfrom countries like India. Everbody will use the US as a cloak. Argue: first theUS, then us. This is not our intention. As environmentalists, we are pushing ourgovernment to take aggressive steps to reduce emissions, not only because it isin the interest of the world, but also because it is in our interest to do what wecan to re-invent growth without pollution.
In this case, our conviction also comes from the fact that in India the tide ofclimate-denial has turned. We are enjoined in the pain of our farmers, who, forthe last three years, have lost everything because of freak hail and weirdly-timed rain. A single event cannot be attributed to climate change, but thefrequency of these weather anomalies is making us think deep. And weep.
Our concern is different. US lifestyle and consumption patterns are aspirationaland addictive. Quite simply, everybody wants to be an American. Every citizenof the developing world wants to either live in America or live like anAmerican. If it were possible to attain such a lifestyle and yet combat climatechange, our concern would be unfounded. But we all know that is not possible.We also know that if Americans continue their guzzle, it is not possible toexpect the rest will not follow in their footsteps. The world — the US and us —cannot combat climate change without changing the way we drive, buildhomes or consume goods. The C-word is the C-word.
Climate change demands we collaborate and act collectively. The US is theworld’s most powerful economy, a world-leader. This leader has to take thelead, point to the direction of change that must be credible and meaningful.Otherwise, the deal will not fructify. We all lose.
The US is also a leader because of the strength of its institutions, such as the Environmental Protection Agency or the Energy InformationAdministration. Remarkable data. Remarkable analysis. We wish we had the
vii
CAPITAN AMERICA

same resources. But, amazingly, nobody seems interested in putting this dataout, or using it.
Here is cause for a niggling worry. We have found an enormous restraint —even a tendency towards self-censorship — in big and powerful US civil societygroups. These largely Washington-based organisations do not want to push theenvelope very much. They are satisfied — perhaps due to the nature of thepower equations in their country — to be meek in their critique or in thesolutions they advocate. For instance, these groups are asking — rightly — forcar restraints in many parts of the developing world. But in the US, they stillpush fuel economy standards and, at most, hybrid cars as the panacea toclimate ills. There is no bus rapid transit being built in the US, where over 70-80 per cent people commute to work in cars. This is where practice mustalso happen, so that the world can follow and emissions reduce. Change has tobe real. Change has to be measurable and meaningful.
What a win-win opportunity. If the US can change its ways — harness itsenormous ingenuity and innovation to re-invent the lifestyles of the rich andfamous so that they can be emulated by all, without blowing up the Planet —we are home and dry. We hope the US will.
Sunita NarainChandra Bhushan
viii

CAPITAN AMERICA
1

● The perception is that after peaking in 2005, US total greenhouse gas emissions have beenreducing. Not true.
● Compared to 1990 levels, greenhouse gasemissions are up 6 per cent.
● 1990-2013, carbon dioxide emissions are up 7.4 per cent. Carbon-dioxide emissions comprise82 per cent of all US greenhouse gas emissions.
● In the INDC the US has submitted to the climatesecretariat, it will reduce greenhouse gasemissions 26-28 per cent below 2005 levels by2025. Just by using 2005 as its baseline year, theUS has avoided cutting 500 million metric tonnesof greenhouse gas emissions.
● On a 1990 baseline the US will reduce emissionsby a mere 13-15 per cent by 2025. This is evenlower than what it had pledged in 2010 in theCancun climate meet.
● In percentage as well as absolute terms, the INDC of the US is far less ambitious than that of the EU-28.
● In its INDC, the US has said it will depend on landuse, land use changes and forestry (LULUCF) toreduce emissions. By so doing, it has avoidedcutting 250 million metric tonnes of greenhousegas emissions by 2025.
2

3
CAPITAN AMERICA
Till 2006, there was only one narrative in town: the United States, withfive per cent of the world’s population, was the world’s biggest emitter ofgreenhouse gases (GHGs), and whereas the world agreed action wasurgently needed to drastically reduce GHG emissions, especially CO2emssions, the US differed. It was like a climate-action caterpillar,doggedly munching away a leaf on its own, postponing its transformationto the chrysalis stage.
In 2006, China overtook the US as the single largest GHG emitter.Now the narrative changed. Suddenly all attention turned to China, itsspewing chimneys and growing middle-class. The shift literally occurredovernight. In Western media reportage, the matter of US emissionsbecame a there’s-no-breaking-news-in-this-one story. In Western,especially US, thinktank deliberation, the matter became a now-see-who’s-painting-the-town-red? plot. Since China was now the largestcontributor, went the new plot, the onus of mitigating climate changewas no longer with the US. It primarily lay with China. India’s growingemissions, too, became a watch-this-strand sub-plot — perhaps the newplot needed spicing up.
Of course China’s annual emissions today are higher than that of the US. But such a bald assertion glosses over irrefutable, indeedinconvenient truths. One, the US remains the no 1 historical GHG emitter,especially CO2 (see Section: What of the Stock?). Two, its per capita CO2
1. Misprison?US climate-action stance seems proactive. Seems
4.8
17.6
6.8 7.2
1.7
10
12.2
4.7
1.4
12
8.7
16.5
5.3
0 2 4 6 8
10 12 14 16 18 20
Bra
zil
Can
ada
Ch
ina
EU 2
8
Ind
ia
Jap
an
Ko
rea,
Rep
ub
lic
In p
er c
ent
Mex
ico
Nig
eria
Ru
ssia
Sou
th A
fric
a
USA
Wo
rld
Graph 1.1: Per capita emissions, 2012The US per capita emissions are flagrantly high
Source: Anon 2014, Global Carbon Budget Factsheet, Centre for Science and Environment
6%Increase in US emissions,1990-2013
8.8%Growth in emissions fromfossil fuel combustion,responsible for most of thehike in national emissions

4
US INDC: a glanceA ‘promises to keep’ kind of poetic procedural submission
In May 2015, the US submitted its Intended Nationally Determined Contribution, or INDC, to the secretariatof the UN climate convention. The INDC states that the US intends to achieve an economy-wide GHGreduction target of 26-28 per cent below what it emitted in 2005 by 2025. It will make best efforts toreduce emissions by 28 per cent.
The INDC goes on to say that “the target is fair and ambitious”. It justifies: “The United States has already undertaken substantial policy action to reduce its
emissions, taking the necessary steps to place us on a path to achieve the 2020 target of reducingemissions in the range of 17 per cent below the 2005 level in 2020. Additional action to achieve the2025 target represents a substantial acceleration of the current pace of greenhouse gas emissionreductions. Achieving the 2025 target will require a further emission reduction of 9-11 per centbeyond our 2020 target compared to the 2005 baseline and a substantial acceleration of the 2005-2020 annual pace of reduction, to 2.3-2.8 per cent per year, or an approximate doubling”.1 Let’s lookat the target itself.
Under the 2010 Cancun agreement, the US had put on the table the following roadmap for emissionsreduction: 17 per cent below 2005 level, by 2020; 30 per cent by 2025 and 42 per cent by 2030. Now, itsINDC only talks about reducing by 26-28 per cent by 2025, which is even lower than the weak Cancunpledge.2
Moreover, a simple comparison with the INDC of other developed countries, such as the EU-28, showshow weak the 2015 roadmap is. The Centre for Science and Environment has linearly extrapolated the USintended effort and found the following:3
● The US will reduce its total greenhouse gas (GHG) emissions by 34-37 per cent below 2005 levels by2030. But on a 1990 baseline, the US will cut emissions by a mere 13-15 per cent by 2025 and 23-27 percent by 2030. Compare with EU-28, which has committed to reduce 40 per cent below its 1990emissions levels by 2030.
● Vis-a-vis 1990, the US will cut annual emissions by 1,400-1,650 million metric tonnes CO2 equivalent(MMTCO2e) by 2030. In comparison, the EU-28 will reduce their annual emissions by 2,250 MMTCO2eby 2030 from its 1990 levels. So, both in percentage and absolute emissions reduction terms, the EU-28’s ambitions are far higher than the US.
● In 2030, total GHG emissions in the US will be 4,500-4,700 MTCO2e. Per capita emissions will be 12.5-13 tonnes. By contrast, in 2030, EU-28 total emissions will be 3,365 MTCO2e. Per capita emissions?6.5 tonnes. Crucially, the INDC uses a baseline convenient only to the US. Now, it can conveniently reduce against
this single year. Whatever happened to the fact that, 1990-2005, the US actually increased its share ofglobal emissions, and at a time it was expected to reduce? Absolute camouflage. It is an erasure thatweakens another important plank of the US’s future intentions: its statement in the cover note that theINDC is ‘fair’.
To move on. The INDC specifically mentions that it will include sinks — reductions from forestry andthe land use sectors — to achieve its already unambitious target. This is problematic, given theweaknesses in methodology in accounting for sinks and the fact that such a reliance on sinks providescover to the growth of emissions.

5
CAPITAN AMERICA
emissions (the most important GHG) are among the highest in the world(see Graph 1.1: Per Capita GHG Emissions, 2011). Three, its dogged lackof ambition in contributing to climate change mitigation has always beena puzzle and a persistent migraine, for the US has always been the RichieRich of nations, always had all the capacity needed to reduce its GHG
emissions. It is still rich and eminently capable (see Infographic: A GodlyCapacity). Is it still as unambitious?
No, ostensibly. The US claims it has put in place robust climate-actionpolicies that are already showing results. The Western media andthinktanks, especially US thinktanks, largely support the claim. It seemsthe reluctant caterpillar has turned chrysalis. Not only that: the newesttwist in the new plot is that the US has actually emerged from thechrysalis of self-conscious climate inaction. This butterfly is all a-flutterand is an unbesmirched specimen.
All a-flutterUS climate-action claims today wing on a twister of nationally-relevantplans as well as procedurally-relevant international submission.
On June 25, 2013 US President Barack Obama announced his CleanAction Plan. The plan outlined 75 goals in three areas: cutting CO2pollution in the US, preparing it for climate change impacts, and leadinginternational efforts to address climate change.1
The US has also published ‘2014 CAR: United States Climate ActionReport 2014’. Two documents comprise this US Department of Statepublication: the ‘First Biennial Report of the United States of America’and the ‘Sixth National Communication Under the United Nationsframework Convention on Climate Change’. In his ‘message’ in ‘2014CAR’, US Secretary of State John F Kerry summarised what the US, underPresident Obama’s leadership, had done to reduce emissions:● Doubled wind and solar electricity generation;● Adopted the toughest fuel economy standards in US history for
passenger vehicles;● Advanced environmental standards to expedite the transition to
cleaner and more efficient fuels in power plants; and● Increased the energy efficiency of homes, industries and businesses.
This, Kerry said, was showing results, “as since 2005 our emissionshave fallen by 6.5 per cent, even as our economy continues to grow.” He added: “This is an important signal to the world that America is ready to act.”2
On August 3, 2015 President Obama launched the Clean Power Plan,to reduce emissions from power plants (see Chapter 4: Light Years Away).In the same month, the US Environmental Protection Agency (EPA)issued rules to substantially cut methane emissions from the oil and gasindustry (see Chapter 7: Industry).
Internationally, the US submitted to the global climate treatysecretariat — as per procedure — its Intended Nationally Determined
6.5In tonnes, EU-28 per capitaemissions in 2030, as perextrapolation of its INDC
12.5-13 In tonnes, US per capitaemissions in 2030, as perextrapolation of its INDC
Percentage change in emissions: 1990-2013
↑ 11.4% Electricity ↑ 16.4% Transportation ↓ 12.3% Industries
↑ 19.1% Agriculture ↓ 5.6% Commercial ↑ 8.3% Residential
↑ 5.9% Total Emissions ↑ 13.7% Sinks ↑ 4.8% Net Emissions (subtracting sinks)
6
Emis
sio
ns
(mill
ion
met
ric
ton
nes
of
carb
on
dio
xid
e eq
uiv
alen
ts)
2000
0
4000
6000
8000
1990 1992 1994 1996 1998 2000 2002 2004 2006 2008 2010 2012
Electricity generation Transportation Industry Agriculture Commercial Residential
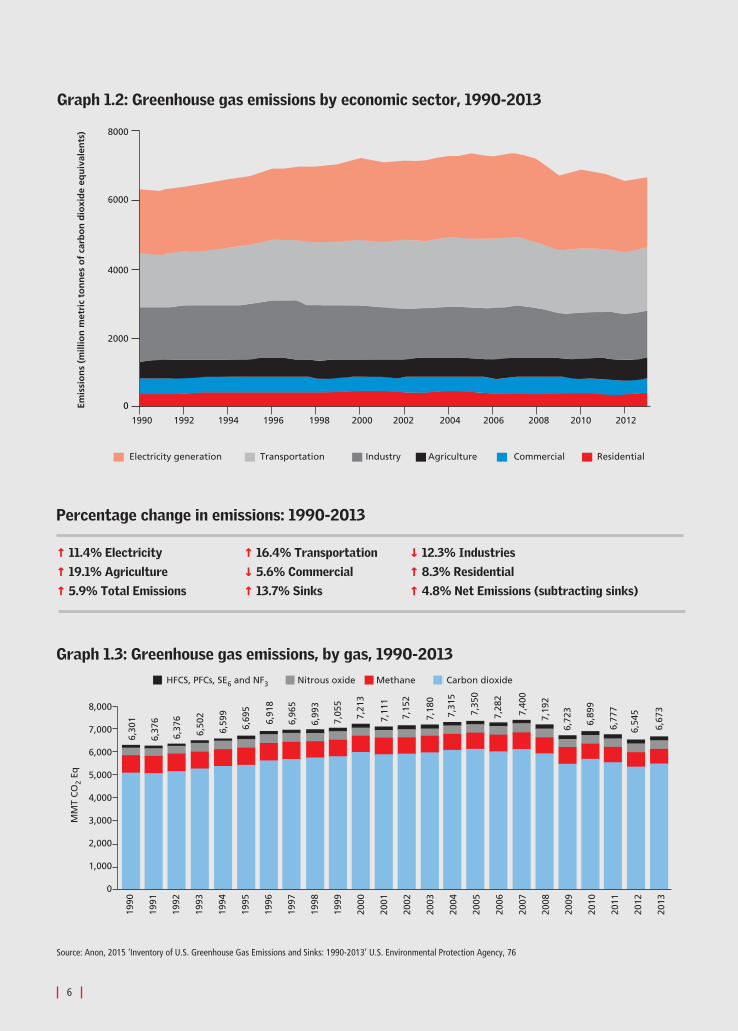
Graph 1.2: Greenhouse gas emissions by economic sector, 1990-2013
Graph 1.3: Greenhouse gas emissions, by gas, 1990-2013
Source: Anon, 2015 ‘Inventory of U.S. Greenhouse Gas Emissions and Sinks: 1990-2013’ U.S. Environmental Protection Agency, 76
6,67
3
6,54
5
6,77
7
6,89
9
6,72
3
7,19
2
7,40
0
7,28
2
7,35
0
7,31
5
7,18
0
7,15
2
7,11
1
7,21
3
7,05
5
6,99
3
6,96
5
6,91
8
6,69
5
6,59
9
6,50
2
6,37
6
6,37
6
6,30
1
MM
T C
O2
Eq
HFCS, PFCs, SE6 and NF3
8,000
7,000
6,000
5,000
4,000
3,000
2,000
1,000
0
Nitrous oxide Methane Carbon dioxide
1990
1991
1992
1993
1994
1995
1996
1997
1998
1999
2000
2001
2002
2003
2004
2005
2006
2007
2008
2009
2010
2011
2012
2013
7
-0.5
1.7 2
1.5 1.4
3.3
0.7 0.4
0.9
2.2
-1.4
0.6 0.4
1.9
0.5
-0.9
1.6
-2.8
-6.5
2.6
-1.8
-3.4
2
-8
-6
-4
-2
Per
cen
t
0
2
4 19
91
1992
1993
1994
1995
1996
1997
1998
1999
2000
2001
2002
2003
2004
2005
2006
2007
5008
2009
2010
2011
2012
2013
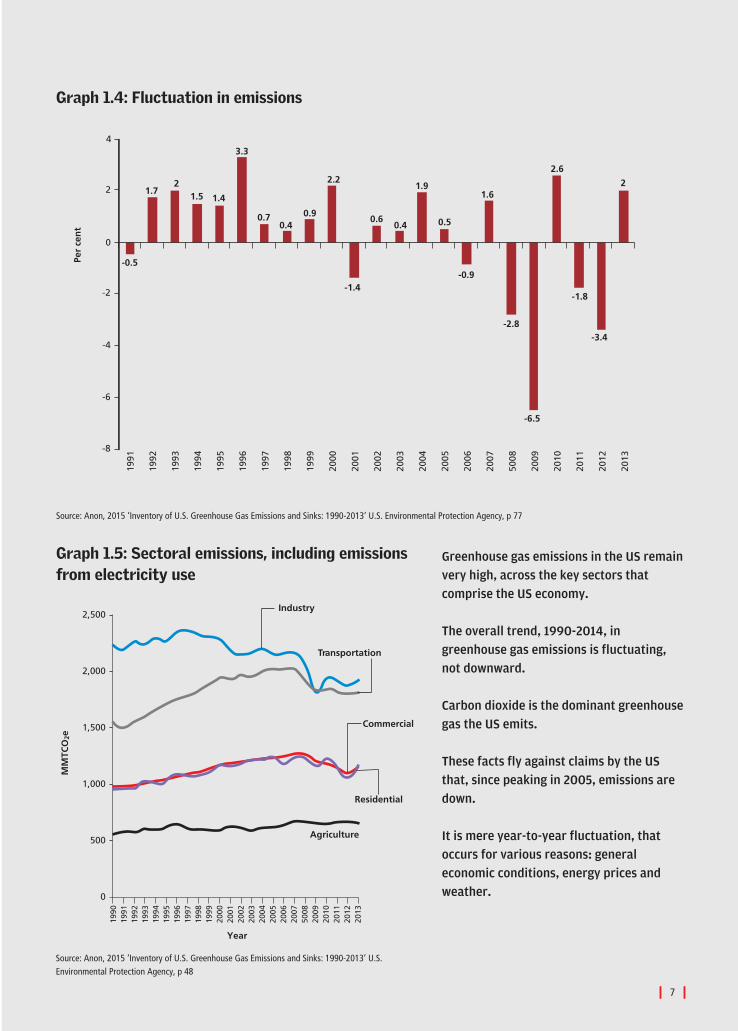
Graph 1.4: Fluctuation in emissions
Source: Anon, 2015 ‘Inventory of U.S. Greenhouse Gas Emissions and Sinks: 1990-2013’ U.S. Environmental Protection Agency, p 77
Industry
Transportation
Residential
Commercial
Agriculture
Year
2,500
2,000
1,500
1,000
500
0
MM
TCO
2e
1990
1991
1992
1993
1994
1995
1996
1997
1998
1999
2000
2001
2002
2003
2004
2005
2006
2007
5008
2009
2010
2011
2012
2013
Graph 1.5: Sectoral emissions, including emissionsfrom electricity use
Source: Anon, 2015 ‘Inventory of U.S. Greenhouse Gas Emissions and Sinks: 1990-2013’ U.S.Environmental Protection Agency, p 48
Greenhouse gas emissions in the US remainvery high, across the key sectors thatcomprise the US economy.
The overall trend, 1990-2014, ingreenhouse gas emissions is fluctuating,not downward.
Carbon dioxide is the dominant greenhousegas the US emits.
These facts fly against claims by the USthat, since peaking in 2005, emissions aredown.
It is mere year-to-year fluctuation, thatoccurs for various reasons: generaleconomic conditions, energy prices andweather.

Contribution, further proof it was in ready-to-act mode (see Box: US INDC:a glance).
In short, the butterfly — climate-action Psyche embodied byPresident Obama — has fully taken wing.
The US is using existing regulatory instruments to do all it can tobend its emissions curve. It is not business-as-usual anymore in the US.Its butterfly-as-usual. Is this really so, we ask. Is the butterfly amasquerade? An utterly non-butterfly effect?
We ask : what do you mask? What are the GHG emissions of the US, especially CO2? What is thecontribution of this country, with 5 per cent of the world’s population, tothe gases already in the global atmosphere? Has this contribution beenreducing since 2005, when its emissions peaked (a fact the US has madethe most of, using 2005 as its baseline year for emissions reduction, asagainst 1990, the globally preferred emissions reduction baseline theclimate convention has stamped its approval on)?
2009-2011, points out 2014 CAR, average US GHG emissions fell to thelowest level for any three-year period since 1994-19963, fuelling theimpression the US does have policies that will lead to long-term changesand result in emissions reduction each year.
Wrong.
Emissions flow Total GHG emissions in the US did peak in 2005, to over 7,350 millionmetric tonnes of CO2 equivalent (MMT CO2e). Subsequently, emissionsreduced 2009-2012. But 2012-2013, emissions increased by 2 per cent, orabout 128 MMT CO2e, according to data the US Environmental ProtectionAgency (EPA) has published.4 In the same period, CO2 emissions — by farthe predominant global-warming gas emitted — saw a spike: up by closeto 3 per cent.5
But it is still not clear the US has actually begun reducing itsemissions. Only consider the emissions inventory the US EPA haspublished.
What is the overall trend? In 2013, total US GHG emissions were 6,673MMT of CO2e6, including 5,502 MMT of CO2 emissions.7 Overall, comparedto 1990 levels, total GHG emissions are actually up, by 6 per cent.8 And1990-2013, CO2 emissions increased by 381.5 MMT CO2, up 7.4 per cent.9
In other words, the overall trend is that US GHG emissions, especially CO2,are higher than in 1990 (see Graph 1.2 and 1.3: Greenhouse gas emissions,1990-2013). Up and up.
What about the 2009-2012 dip, then? The 2012-2013 spike?These are mini-trends, that mask the overall trend. Although the EPA
calls these ‘trends’, its explanation gives the game away. These trends,the EPA explains, “can be attributed to multiple factors includingincreased emissions from electricity generation, an increase in miles
8
6,673In million metric tonnes ofcarbon dioxide equivalent,
US greenhouse gasemissions, 2013

9
CAPITAN AMERICA
travelled by on-road vehicles, an increase in industrial production andemissions in multiple sectors, and year-to-year changes in the prevailingweather.”10
In fact, the mini-trends are a mere time-to-time fluctuation. No waycan they be mistaken for a general propensity, downwards, in GHG
emissions, especially CO2 (see Graph 1.4: Fluctuation in emissions). TheEPA points out that annual variation is a response to changes in generaleconomic conditions, energy prices, weather and to what extent non-fossil alternatives exist. For instance, “a year with increasedconsumption of goods and services, low fuel prices, severe summer andwinter weather conditions, nuclear plant closures and lower precipitationfeeding hydroelectric dams would increase fossil fuel consumption thana year with poor economic performance, high fuel prices, mildtemperatures and increased output from nuclear and hydroelectricplants”.11
Overall, EPA’s analysis provides a picture athwart US climate-actionclaims. Historically, the dominant factor in US emissions trends has beenemissions from combusting fossil fuels. Between 1990 and 2013, CO2emissions from fossil fuel combustion increased from 4,740.7 MMT CO2eto 5,157.7 MMT CO2e, an 8.8 per cent increase, affecting most of theincrease in national emissions.12 There’s another concern. CO2 emissionscomprise 82 per cent of all US emissions.13 And GHG emissions from thekey sectors—electricity, transport, the residential and commercial sector—show no decrease at all. Industrial sector apart (see Chapter 6), just a year-to-year variation (see Graphic: Percentage change in emission, 1990-2013 and Graph 1.5: Sectoral emissions, by electricity end user).
Mask 1: the 2005 ‘peak’ It is pertinent to go to the snub of all climate-action things: the 2005‘peak’ in US emissions.
Well, the ‘peak’ has attained mythological status in the globalperceptual understanding of US climate-tackling commitment. The US
has picked, pickled and endlessly packaged it. Here is a roadshow the US
has taken round the world. It is a smash hit. So far. Whereas 1990 is the baseline fixed in the global climate convention
for nations to reduce GHG emissions, the US’ choice is 2005. It is the firstmask the US wears to veil its climate-inaction. The US has cleverly used2005 as its base year because, 1990-2005, the US allowed its emissions togrow, whereas it should have actually been reducing its emissions.
The masking effect of 2005 as a base to reduce emissions translatesto millions of tonnes of CO2 emissions the US has cloaked — that, forsome reason, the world has failed to notice.
In its INDC submitted in May 2015, the US has agreed to reduce GHG
emissions 26-28 per cent below 2005 levels by 2025. This means the US
has agreed to cut GHG emissions to 4,700-4,800 MMTCO2e by 2025,compared to 6,438 MMTCO2e in 2005. If the US had used 1990 as base year
5,502In million metric tonnes, UScarbon dioxide emissions,2013

and gone for the same degree of emissions reduction as it has in the INDC,in 2025 its total emissions would have been 4,200-4100 MMTCO2e. Just bychanging the base year, the US has avoided cutting 500 MMTCO2e of GHG
emissions by 2025.14
Mask 2: Sinks Countries often create their emissions profile by using a metric called‘net emissions’; they assume some of the pollution they create getsabsorbed, or cleaned up, by terrestrial sinks, mainly forests andgrasslands.
In 2013, the US’ net emissions were 5.8 billion tonnes CO2e. In itscase, the scale and size of removal by sinks is not small. For, says the EPA,terrestrial sinks sequester some 0.88 billion tonnes CO2e of GHGs —roughly, 14 per cent of what the US emits in toto (see Graph 1.6: 14 percent of what the US emits is sequestered).15
(To get an idea of the scale, compare it to India’s annual GHG
emissions, which in 2013 were roughly 2.5 billion tonnes CO2e.16 In otherwords, US sinks remove roughly one-third of what India, with its hugepopulation, emits today).
How accurate are these measurements? Who has audited or verifiedthese numbers? The EPA has done a formidable job in putting togetherthese estimates using a method the climate convention has established.At the same time, it is well known that calculation of sinks — whatforests of different ages and types, in different regions, actually sequester— is still a nascent science.
The question of real-time calculation is important. Because the US
has not only increased its emissions between 1990 and 2013, its net flux
10
0
1000
2000
3000
4000
5000
6000
7000
8000
1995 2005 2009 2010 2011 2012 2013
Without LULUCF
In M
MTC
O2e
With LULUCF
Graph 1.6: 14 per cent of what the US emits is sequesteredBut sinks often hide the true extent of emissons
Source: Graph generated by the Centre for Science and Envieonment using the greenhouse gas inventory datasetprovided by the US Environmental Protection Agency
250In million metric tonnes
carbon dioxide equivalent,emissions the US will avoid
cutting, by 2025, by relying on sinks

— GHG emissions US sinks have removed — is also up. In 1990, all sinksaccounted for 0.762 billion tonnes CO2e of GHG removal. By 2013, sinksbecame more efficient or proactive, removing 0.858 billion tonnes CO2eof GHGs17. In the US sinks inventory the EPA has published, the primaryreason given is improved forest carbon stock.18
The fact is that land use, land use change and forestry (LULUCF) isanother mask that allows the US to conceal more emissions.
In 2005, US GHG emissions with LULUCF were 6,438 MMTCO2e.Excluding LULUCF, total GHG emissions were 7,350 MMTCO2e. So, the US
actually emitted 7,350 MMTCO2e of GHGs from various sources, but byincluding carbon sinks of about 900 MMTCO2e in forests and on land in itsledger, it has reduced its GHG emissions to 6,438 MMTCO2e.
Further, in its INDC the US has said that LULUCF is a certain plank inits GHG emissions reduction plans. If US had agreed to reduce itsemissions by excluding LULUCF, it would have had to cut 250 MMTCO2emore GHGs in 2025. By including LULUCF, it has avoided cutting a hugeamount of emissions.
What of the Stock?So far, we have looked at the ‘flow’ of US emissions. But what of thestock: 411 billion tonnes CO2, emitted 1850-2011?19 The US has borrowedfrom the global commons a share of other countries’ carbon space tobecome the economic powerhouse it is today. This is its natural debt.And, as with a financial debt, the natural debt needs to be paid. Try as itmight, the US cannot erase its historical emissions from its climate actionrecord. CO2 is a gas with a past, present and future. Once emitted, it staysin the atmosphere. So, the US’s past emissions are a legacy that must beaccounted for in any future emissions reduction plan or move.
1850-2011, the US was responsible for 21 per cent of CO2 emissions inthe atmosphere.20 These emissions have caused the warming we see today,whose impacts are now devastating the lives of the poorest. It has the capacity. But it also has the responsibility to reduce emissions(see Infographic: A Godly Capacity). Not by tinkering year-to-year, orcreating a perceptual veneer of reduction, but rather through drasticreductions that make space for the rest of the world to grow.
Its historical contribution is huge. Its current emissions are high.Moreover, by a) choosing 2005 as base year and b) including LULUCF inits future GHG emissions reduction plans, the US has masked 750MMTCO2e of excess GHG emissions in 2025.21The US really needs to walkthe talk. Can it? Read on.
11
CAPITAN AMERICA
411In billion tonnes, theamount of carbon dioxidethe US has emitted, 1850-2011

12
USA EU-28 India China
Sources: World Bank, IEA, HDI report
16.5
7.2
1.7
6.8
Per capita CO2 emissions (metric tonne, 2012)
3,61,299.98
3,25,545.08
35,581.29
1,40,860.33
Total historical emissions (1850-2011) in million tonne CO2
1,55,33,800
1,68,11,791
59,62,978
1,34,95,910
GDP (PPP, 000’ US $, 2011)
49,854
33,414
4,883
10,041
GDP per capita (US $, 2011)
97.46
72.67
23.47
103.72
Total primary energy consumption (Quadrillion BTU, 2011)
Total renewable electricity net consumption (billion KWh, 2011)
Per capita electricity consumption (KWh)
Motor vehicles per thousand (in 2011)
Air travel (million passenger trips in 2013)
Human Development Index (2013)
527.5
684.8
160.4
801
13,246
5,738
684
3,298
786
473
18
69
743
NA
75
352
0.914
0.735
0.586
0.719
Historically, the US has been the biggest emitter of greenhouse gases. Its responsibility in forcing climate change has been the most
Currently, the US is the 2nd largest emitter of greenhouse gases
It is important for the US to overcome its state of climate perdition
The good news is that the US can. It has such immense capacity
Every parameter of well-being points to the fact that the US can take on a very ambitious target to reduce emissions of greenhouse gases, especially carbon dioxide
21.2USA
28.7Rest of World
18.4EU-28
10.7China
7.4Russia
4.4Brazil
3.3Japan
2.8India
2.2Canada
0.9South Africa
A Godly CapacityThe US is prosperous enough to take on ambitious climate targets
Percentage of global CO2 emissions: Past and present (1850-2011)

13
CAPITAN AMERICA
14
● The US energy system is too fossil-fuel reliant.Today, coal, natural gas and oil motor 80 per centof all US energy needs.
● The US is the world’s top producer of petroleumand natural gas. 1990-2014, fossil fuel production in the US is up 18.3 per cent.
● US per capita coal consumption is marginallyhigher than China’s and 5 times higher thanIndia’s.
● Natural gas consumption is at a historic high. 1990-2014, up 40 per cent.
● 1990-2014, US consumption of oil rose 8 per cent.
● An American consumes twice as much energy as aEuropean, 4 times more than a Chinese and 16 times more than an Indian.
● 1990-2014, US per capita energy consumptionhas annually reduced by an insignificant 0.4 per cent.

In his introduction to the First Biennial Report of the United States ofAmerica, Secretary of State John Kerry claimed the US was taking strongaction on climate change: “...we are closer than we’ve ever been to abreakthrough”.1
Let’s take him for his word. Perhaps the US is changing its ways.The US has always been a fossil fuel-dominant economy
(see Graph 2.1: Share of energy consumption in the US: 1776-2014). Threefossil fuels — petroleum, natural gas, and coal — have always ruledthe source-of-energy roost (see Graph 2.2: Energy consumption in the US,1776-2014). Even now, they constitute the absolute basis for energyproduction: at least 80 per cent of all the energy the US needs is fromthese fossil fuels.
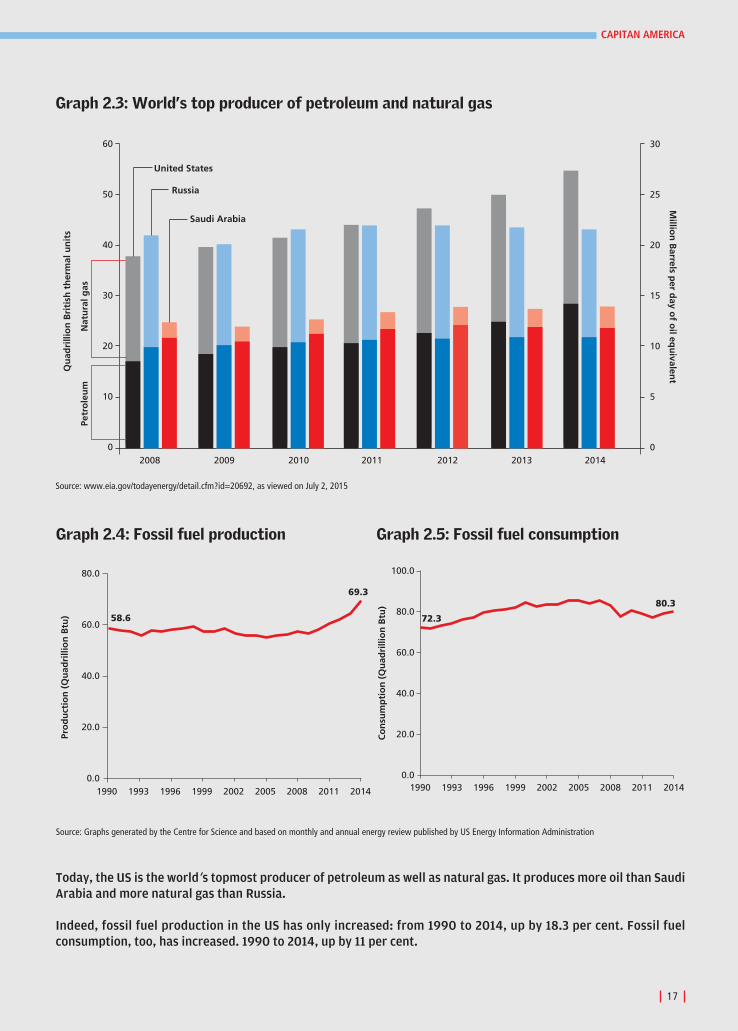
Overall, the scenario isn’t changing. Guzzle-wise, the US is today theworld’s top producer of petroleum and natural gas. It now producesmore crude oil than Saudi Arabia and more natural gas than Russia (see Graph 2.3: World’s top producer of petroleum and natural gas). Since1990, even as the world began taking climate change seriously, fossilfuel production in the US has only increased: 1990-2014, up 18.3 per cent(see Graph 2.4: Fossil fuel production). Fossil fuel consumption in the US,too, has risen: 1990-2014, by 11 per cent (see Graph 2.5: Fossil fuelconsumption). Kerry’s claim is becoming a bit of a puzzle. Let’s furtherunpack the scenario.
Coal: is the King dead?The urgency to move away from coal has taken on an evangelistdimension, with President Barack Obama urging the world to “keep theking of fuel in the ground”.2 Recently, he described a US EnvironmentProtection Agency (EPA) step to control coal-burning as “the biggest,most important step we’ve ever taken to combat climate change”.3 Headded, “Power plants are the single biggest source of the harmful carbonpollution that contributes to climate change. Think about that”.4
But is his country thinking about that?In terms of producing and consuming coal, not much has changed in
the US. In 2014, coal consumption in the US was about 1 per cent higherthan in 1990. However, coal consumption peaked in 2005, at about 1.02billion metric tonnes (billion MT), and since then has reduced 19 per cent(see Graph 2.6: Energy mix: coal use lesser). Nevertheless, globally the US
remains the second largest consumer of coal after China. Its per capitaconsumption is marginally higher than China and five times higher thanIndia (see Table 2.1: Coal countries consume).
15
CAPITAN AMERICA
2. The Guzzle PuzzleSeems an entrenched fossil fuel user is changing tack. Seems.
11%Increase in fossil fuelconsumption in the US,1990-2014

16
Other renewables
Petroleum
Natural gas
Coal
Nuclear
Hydroelectric
Wood
1776 1850 1900 1950 2014
45
40
35
30
25
20
15
10
5
0
Qu
adri
llio
n B
tu
Graph 2.2: Energy consumption in the US (1776-2014)
Source: www.eia.gov/todayenergy/detail.cfm?id=21912, as viewed on July 2, 2015
100%
80%
60%
40%
20%
0%
Other renewablesHydroelectric
Nuclear
Wood
Coal
Petroleum
Natural gas
1776 1850 1900 1950 2014
Graph 2.1: Share of energy consumption in the US (1776-2014)
Source: www.eia.gov/todayenergy/detail.cfm?id=21912, as viewed on July 2, 2015
The United States has always been a fossil-fuel dominant economy. Three fossil fuels — petroleum, natural gasand coal — have always been favoured to produce energy.
The scenario today remains the same. Today, these three fossil fuels form the absolute basis for energyproduction, accounting for 80 per cent of all the energy the US needs.
17
CAPITAN AMERICA
Pro
du
ctio
n (
Qu
adri
llio
n B
tu)
1990 1993 1999 2002 2008 20111996 2005 2014
80.0
60.0
40.0
20.0
0.0
58.6
69.3
Graph 2.4: Fossil fuel production
Source: Graphs generated by the Centre for Science and based on monthly and annual energy review published by US Energy Information Administration
1990 1993 1999 2002 2008 20111996 2005 2014
100.0
80.0
60.0
40.0
20.0
0.0
Co
nsu
mp
tio
n (
Qu
adri
llio
n B
tu)
72.3
80.3
Graph 2.5: Fossil fuel consumption
30
25
20
15
10
5
0
United States
Saudi Arabia
Nat
ura
l gas
Petr
ole
um
Russia
Qu
adri
llio
n B
riti
sh t
her
mal
un
its
Millio
n B
arrels per d
ay of o
il equ
ivalent
2008 2009 2010 2011 2012 2013 2014
60
50
40
30
20
10
0
Graph 2.3: World’s top producer of petroleum and natural gas
Source: www.eia.gov/todayenergy/detail.cfm?id=20692, as viewed on July 2, 2015
Today, the US is the world’s topmost producer of petroleum as well as natural gas. It produces more oil than SaudiArabia and more natural gas than Russia.
Indeed, fossil fuel production in the US has only increased: from 1990 to 2014, up by 18.3 per cent. Fossil fuelconsumption, too, has increased. 1990 to 2014, up by 11 per cent.

Natural gas: a new king is bornNatural gas consumption in the US today is at a historical high. Comparedto 1990, consumption has risen 40 per cent (see Graph 2.7: Energy mix: gasuse is up). Today, the US is by far the largest consumer of natural gas in theworld. In 2014, it consumed natural gas to the tune of 695.3 milliontonnes oil equivalent (mtoe), 22.7 per cent of what the world did.
Oil and cars go well togetherUS consumption of oil in 2014 was about 8 per cent higher than in 1990(see Graph 2.8: Energy mix: oil use also up). However, like coal,consumption peaked in 2005 and is today about 11 per cent lower than2005 levels. Even so, as with natural gas, the US remains the world’slargest oil consumer. In 2014, it accounted for about 20 per cent of all theoil the world used.
Shift to renewables is minor The critical climate change choice is whether a country has finally begunmoving away from fossil fuels to cleaner non-fossil fuel alternatives. Inthe US’ case, the answer is a resounding no. US leaders love to talk bigabout their breakthrough on climate change. To make us believe they arefinally ‘decarbonising’ growth. Reality shows otherwise.
The contribution of fossil fuels to primary energy consumption in theUS has reduced from 85.6 per cent in 1990 to 81.6 per cent in 2014, by 4 per cent. Put another way, the contribution of renewable energy(including hydropower and biomass) has increased from 7.1 per cent to9.8 per cent in this period. Yet, the hard fact is that the contribution ofrenewable energy — and this includes all hydropower and biomasspower generation — has increased by just 3 per cent in the last 24 years(see Graph 2.9: Energy mix: minor shift to cleaner alternatives).
And still its allies argue the US is on track to tackle climate change.They point out that whereas the contribution of fossil fuels to primaryenergy produced is reducing, at 0.3 per cent per year, that of renewablesis increasing 2.3 per cent per year. Isn’t that fast-paced?
No. It’s snail-paced. If this trend continues, in 2050 not more than 25 per cent of the primary energy consumed in the US will be fromrenewables. Definitely not what the world expects from the largesthistorical contributor to climate change.
Breakthrough?‘Decarbonisation’ has at least two aspects. One, whether a country hasmoved to non-fossil fuels, made the transition. Two, whether it hasreduced energy usage, i.e., de-linked growth from energy consumptionand thus emissions. For the US, neither aspect holds good. First, fossilfuel use is gargantuan and out of sync with what the Planet can sustain.Second, even the little decrease visible in terms of per capita energyconsumption can, in fact, be camouflage.
18
22%Natural gas the US
consumed in 2014, as apercentage of what theentire world consumed

19
CAPITAN AMERICA
Table 2.1: Coal countries consumePer capita coal use highest in the US
Country Coal Per capita consumption: coal
2014 consumption(million toe) (toe) in 2014
US 453.4 1.47
Japan 126.5 1.0
Germany 77.4 1
China 1962.4 1.45
India 360.2 0.3
Source: BP Statistics, 20151
800 759
543600
400
200
0
Co
nsu
mp
tio
n (
Bill
ion
cu
bic
met
ers)
1990
1996
1999
2005
2008
2011
1993
2002
2014
Graph 2.7: Energy mix: gas useRapid growth in gas use
Source for 2.6-2.8: generated by the Centre for Science and Environment based on monthly and annual energy review published by US Energy Information Administration
0
200
400
600
800
1000
1200
Pro
du
ctio
n/
Co
nsu
mp
tio
n (
mill
ion
MT)
Coal production
Coal consumption
907934
821 832
1990
1996
1999
2005
2008
2011
1993
2002
2014
1990
1996
1999
2005
2008
2011
1993
2002
2014
1000
800
600
400
200
0
Co
nsu
mp
tio
n (
Mill
ion
to
nn
es) 836
772.5
Graph 2.8: Energy mix: oil usePeaked in 2005, then down
Total fossil fuels (72.3)
Nuclear electric power (6.1)
Total renewable energy (6.0)
Total fossil fuels (80.3)
Nuclear electric power (8.3)
Total renewable energy (9.6)
Source: Graphs generated by the Centre for Science and Environment based on monthly and annual energy review published by US Energy Information Administration
Graph 2.9: Energy mix: renewablesMinor shift to cleaner alternatives
1990 2014
Quadrillion British thermal unit
Graph 2.6: Energy mix: coal use1990-2014, coal use stagnated

Primary energy consumption has grown from 84.5 Quadrillion Britishthermal unit (Quad) in 1990 to 98.5 Quad in 2014, up 16.5 per cent. It isimportant to understand this increase.
US per capita energy consumption is shockingly high, compared tocountries with a similar economy and population. An American citizenconsumes twice as much energy as a European, four times more energythan a Chinese and 16 times that of an Indian (see Graph 2.10: Per capitaprimary energy consumption, 2011). Moreover, such consumption is notreducing at a pace required to address climate change. While per capitaconsumption has reduced from 0.34 billion Btu in 1990 to 0.31 billionBtu in 2014, the annual rate of reduction is insignificant: 0.4 per cent(see Graph 2.11: Trend in per capita energy consumption). But this figuredoes not portray what’s really happening.
Total energy consumption in the domestic, commercial and transportsectors — three big sectors — has increased since 1990 by 28 per cent,
20
313
166 150
78
20 5
283
0
50
100
150
200
250
300
350
United States
Japan European Union-28
China India Nigeria Australia
Mill
ion
Btu
per
per
son
Graph 2.10: Per capita primary energy consumption, 2011US has the highest in the world and the trend is hardly changing
Source: Graph generated by CSE based on International Energy Statistics, US Energy Information Administration
0.34
0.31
1990
1992
1994
1996
1998
2000
2002
2004
2006
2008
2010
2012
2014
0.40
0.35
0.30
0.25
0.20
0.15
0.10
Bill
ion
Btu
/ y
ear
/ p
erso
n
Graph 2.11: Trend in per capita energy consumptionMarginal drop in per capita energy
Source: Graphs generated by the Centre for Science and Environment based on monthly and annual energy reviewpublished by US Energy Information Administration
16%Increase in primary energy
consumption in the US,1990-2014

21
CAPITAN AMERICA
38 per cent and 21 per cent respectively (see Graph 2.12: Sector-wise energy consumption). Co-evally, per capita energy consumption in these sectors has hardly reduced (see Graph 2.13: Sector-wise per capitaenergy consumption).
The industrial sector is the only one down. 1990-2014, its totalenergy consumption has gone down two per cent; per capita energyconsumption is down 23 per cent. But, curiously enough, US Departmentof Commerce data shows that consumption of all goods, including
0
20
40
60
80
100
120
140
2014
1990
1992
1994
1996
1998
2000
2002
2004
2006
2008
2010
2012
Ener
gy
con
sum
pti
on
(m
illio
n B
tu)
68 68
53 58
128
98 90
85 Residential
Commercial
Industrial
Transporttion
Graph 2.13: Sector-wise per capita energy consumptionIn most sectors, there has been no change
Source: Graphs generated by the Centre for Science and Environment based on monthly and annual energy reviewpublished by US Energy Information Administration
16945
21618
13320
18394
31810 31308
22420
27142
0
5000
10000
15000
20000
25000
30000
35000
40000
1990
1992
1994
1996
1998
2000
2002
2004
2006
2008
2010
2012
2014
Tota
l en
erg
y co
nsu
med
(Tr
illio
n B
tu)
Residential
Commercial
Industrial
Transportation
Graph 2.12: Sector-wise energy consumptionPost-slump US economy is picking up, sectoral energy use is also up
Source: Graphs generated by the Centre for Science and Environment based on monthly and annual energy reviewpublished by US Energy Information Administration
28%Increase in total energyconsumed by the USresidential sector, 1990-2014

industrial goods, has increased since 1990. What has ‘changed’ is that theUS now imports more of the energy-intensive goods it so likes to consume(see: Chapter 7: Industry). The industrial sector’s energy use has reducedonly because manufacture has been outsourced. There is, therefore, noprima facie evidence to suggest the US has made a deliberate, plannedeffort to reduce energy consumption. Indeed, its energy pricing policymay be propelling more fossil fuel use (see Box: No Incentive to Reduce).
To understand the scenario better, let us go sector by sector. Read on.
22
No Incentive to ReduceReal energy prices in the US are falling
An average individual in the US today spends less on energy than what s/he spent in 1990. The per capita realconsumption expenditure — a measure of price changes in consumer goods — on energy has reduced fromUS $1,701 in 1990 to US $1,556 in 2014, down 8.5 per cent. In terms of its share in a person’s spending basket,expenditure on energy is significantly down. In 1990, an average US citizen used to spend 7.2 per cent ofher/his total annual expenditure on energy; in 2014, 4.7 per cent. An average US person therefore spendsless than 5 per cent of her/his income on energy, one of the lowest in the World.
A key reason is reduced natural gas and electricity prices. 1990-2014, though the Urban consumer price index (Index 1982-1984 = 100) increased by 81 per cent,
the per unit cost of residential electricity, in terms of Real (1982-1984) Dollars per million Btu, actuallyreduced 12 per cent. The unit cost of residential natural gas has remained more or less at 1990 levels. Thecost of motor gasoline has increased 61 per cent. Therefore, in comparison to the increase in prices of othergoods and services (as measured by the consumer price index), the price of electricity has reduced, that ofnatural gas stagnated and gasoline price has risen at a relatively lower rate. These reductions in prices areactually counterproductive to all efforts made to improve energy efficiency.
1990
1992
1994
1996
1998
2000
2002
2004
2006
2008
2010
2012
2014
1800
1700
16001555.6
1701
1500
1400
Exp
end
itu
re [
Ch
ain
ed (
2009
) d
olla
rs]
Graph 1: Per capita real consumptionexpenditure on energy
Source: Graph generated by Centre for Science and Environment based on datafrom Personal consumption expenditure by function, 1969-2014, Bureau ofEconomic Analysis
Source: Graphs generated by the Centre for Science and Environment based onmonthly and annual energy review published by US Energy InformationAdministration
0
2
4
6
8
10
12
14
16
18
20
1990
1992
1994
1996
1998
2000
2002
2004
2006
2008
2010
2012
2014
In R
eal (
1982
-198
4) d
olla
rs p
er m
illio
n B
tu
Motor gasoline
15.5
12
4.5
17.6
7
4.3
Residential natural gas
Residential electricity
Graph 2: Cost of electricity and fuels toend users

23
CAPITAN AMERICA

24
● Complete reliance on fossil fuels: In 1990, 69 percent of all electricity the US produced was fossil-fuel based. In 2014, 67 per cent.
● Meagre shift to renewable sources of electricitygeneration: 1n 1990, 11.3 per cent electricitygenerated using renewables, including hydropower.In 2014, 12.7 per cent.
● US per capita elecricity consumption is double thatof the European Union, four times that of Chinaand 17 times higher than India.
● In 2013, US electricity sector accounted for awhopping 31 per cent of US total emissions. Since1990, the sector’s emissions are up 11 per cent.
● Coal-based power plants contribute less to thesector’s emissions today, but the amount of coalused has increased. In 1990, the sector consumed710 million metric tonnes (MMT) coal. In 2014,772 MMT.
● In the US, natural gas is substituting coal. But CO2emissions from gas-based plants have increased,1990-2014, by 150 per cent.
● Even if three per cent of methane is ‘leaked’ in theshale gas cycle, natural gas will lose its climate‘advantage’ over coal.
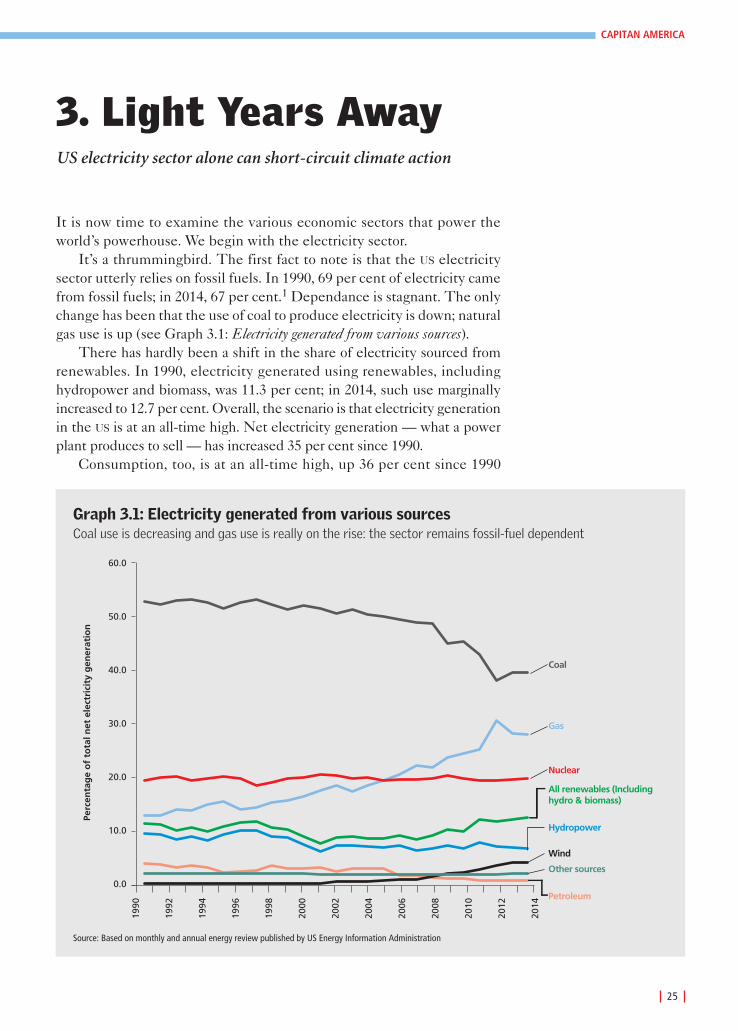
It is now time to examine the various economic sectors that power theworld’s powerhouse. We begin with the electricity sector.
It’s a thrummingbird. The first fact to note is that the US electricitysector utterly relies on fossil fuels. In 1990, 69 per cent of electricity camefrom fossil fuels; in 2014, 67 per cent.1 Dependance is stagnant. The onlychange has been that the use of coal to produce electricity is down; naturalgas use is up (see Graph 3.1: Electricity generated from various sources).
There has hardly been a shift in the share of electricity sourced fromrenewables. In 1990, electricity generated using renewables, includinghydropower and biomass, was 11.3 per cent; in 2014, such use marginallyincreased to 12.7 per cent. Overall, the scenario is that electricity generationin the US is at an all-time high. Net electricity generation — what a powerplant produces to sell — has increased 35 per cent since 1990.
Consumption, too, is at an all-time high, up 36 per cent since 1990
25
CAPITAN AMERICA
3. Light Years AwayUS electricity sector alone can short-circuit climate action
1990
1992
1994
1996
1998
2000
2002
2004
2006
2008
2010
2012
2014
60.0
50.0
40.0
30.0
20.0
10.0
0.0
Perc
enta
ge
of
tota
l net
ele
ctri
city
gen
erat
ion
Coal
Gas
Nuclear
All renewables (Including hydro & biomass)
Hydropower
Wind
Other sources
Petroleum
Graph 3.1: Electricity generated from various sourcesCoal use is decreasing and gas use is really on the rise: the sector remains fossil-fuel dependent
Source: Based on monthly and annual energy review published by US Energy Information Administration

(see Graph 3.2: Electricity generation and consumption in the US). Anindividual in the US today consumes more electricity than s/he did in1990. Up from 11,373 kiloWatt hour (kWh)/annum in 1990 to 12,113kWh/annum in 2014, a seven per cent increase. Indeed, per capitaconsumption reached an electrifying 12,900 kWh/annum in 2007 itself.Since then it reduced for various reasons, including economic freefall in2009 (see Graph 3.3: Per capita electricity consumption).
In addition, US per capita electricity consumption is more thandouble that of the European Union (EU-28), forcing the question: whydoes the US need so much electricity, when its human developmentindex and that of other rich nations such as in the EU-28 are comparable?Its electricity consumption is almost four times of China and 17 timeshigher than India (see Table 3.1: Why so much?). Why?
Cheap electricity is the prime driver for gluttonous consumption.Sans commas, forget full stops. As electricity prices fall, consumptiongoes up. This tango is unstoppable (see Graph 3.4: Cheaper electricity
26
1990
1996
1999
2005
2008
2011
1993
2002
2014
4500
4000
3500
3000
2500
2000
1500
1000
500
0
Co
nsu
mp
tio
n (
Bill
ion
KW
h)
3862
4093
2837
3038
Electricity consumption
Electricity net generation
Graph 3.2: Electricity generation andconsumption in the US
Source: Based on monthly and annual energy review published by US Energy Information Administration
Graph 3.3: Per capita electricityconsumption
Table 3.1: Why so much?An American consumes on an average four times more electricity than a Chinese
Metrics US EU-28 India China
Per capita electricity 12200 5738 684 3298consumption (KWh)
Source: Enerdata, 2013
14000
12000
10000
8000
6000
4000
2000
0
12113
Per
cap
ita
elec
tric
ity
con
sum
pti
on
(K
Wh
/ a
nn
um
)
11373
1990
1992
1994
1996
1998
2000
2002
2004
2006
2008
2010
2012
2014

driving consumption). The net effect of growing electricity consumption isthat greenhouse gas (GHG) emissions from the US electric power sectorare up by about 11 per cent since 1990. In 2013 the electricity sector,spewing 2,100 million metric tonnes of carbon dioxide equivalent (MMT
CO2e), was the single largest source of GHG emissions (see Graph 3.5:Electricity sector emissions trends). The sector accounted for a whopping 31per cent of the country’s total emissions (excluding LULUCF).
CO2 emissions comprise the vast majority of GHG emissions from thissector: 97.6 per cent. Methane (CH4) and nitrous oxide (N2O) emissionsmake up the rest.
Coal: No 1 go-to fossil fuelIn 2014, 93 per cent of all coal used in the US was in the electricity sector(the rest was largely used in the industrial sector; see Chapter 6). In 2014,coal-based power plants accounted for 38.7 per cent of all electricitygenerated; in 1990, its contribution was 52.5 per cent. This statistic istrue, but misleading. 1990-2014, the amount of coal used has increasedover these 24 years.
In 2014, the electricity sector consumed 772 MMT coal; in 1990, 710MMT. In all the electricity generated in the US, the proportion of coal-based generation may have reduced. But generation itself has increased,and so coal use — climate change’s problem parent (see Graph 3.6: CoalConsumed by the Electric Power Sector).
27
CAPITAN AMERICA
0
2000
4000
6000
8000
10000
12000
14000
16000
18000
20000
1990
1992
1994
1996
1998
2000
2002
2004
2006
2008
2010
2012
2014
Per capita electricity consumption (kWh/annum)
17558
11373
15475
12113
Cost of residential electricity (Real (1982-1984) Dollars per billion Btu)
Graph 3.4: Cheaper electricity driving consumptionThe price-consumption correlation is a strong 0.9
Source: Based on monthly and annual energy review published by US Energy Information Administration
772In million metric tonnes,amount of coal used in theUS electricity sector, 2014

Spew Quotient The contribution of coal-based power plants to all the CO2 the US
emits from electricity generation has reduced, from 85 per cent in 1990to 77 per cent in 2014.
Again, here is a statistic that is true but does not provide the realpicture. For, in terms of total emissions, coal-based plants continue toemit as much CO2 as they did in 1990 — about 1.5 billion tonnes (see Graph 3.7: CO2 emissions from differently fuelled power plants). In
28
1990 19961994 1998 2000 2004 2006 20102008 20121992 2002 2014
Co
nsu
mp
tio
n (
mill
ion
met
ric
ton
nes
)
710 721 761814
850 894 887 922 931 944885
747772
1000
800
600
400
200
900
700
500
300
100
0
Graph 3.6: Coal Consumed by the Electric Power Sector Coal use may have reduced, but the amount of coal used remains staggeringly high
Source: Based on monthly and annual energy review published by US Energy Information Administration
Graph 3.5: Electricity sector emissions trends11 per cent more then 1990
Source: Based on US Greenhouse Gas Inventory of the Environmental protectionAgency.
1990
1992
1994
1996
1998
2000
2002
2004
2006
2008
2010
2012
2014
140
120
100
80
60
40
20
0
Mill
ion
met
ric
ton
nes
CO
2
Coal electric power
Natural gas electric power
Other fuel electric power
CO2 emissions
Graph 3.7: CO2 emissions from differentlyfuelled power plantsCoal emission down, gas emission up
Source: Based on monthly and annual energy review published by US EnergyInformation Administration
2500
2000
1500
1000
GH
G e
mis
sio
ns
(Mill
ion
met
ric
ton
nes
CO
2eq
uiv
alen
t)
1990
1992
1994
1996
1998
2000
2002
2004
2006
2008
2010
2012
18652077

absolute terms, since the use of coal simply hasn’t reduced, neither havethe sector’s CO2 emissions.
Efficiency QuotientIf the spew quotient of coal-based power plants in the US is high, theirefficiency quotient is the exact opposite. The US has the world’s secondlargest coal-based power plant installed capacity (after China); in 2013, alittle more than 329 giga-watts. And most of these plants are old andinefficient.
According to the US Energy Information Administration (EIA), by2010-end, approximately 73 per cent of US coal-fired power plants were30 years old, or older. Centre for Science and Environment analysis,based on 2014 data EIA has published, found the average weighted-age ofall coal-based power plants in the US to be 39 years.
Old means inefficient (see Infographic: The Big Belch). Indeed, US
power plants are less efficient than power plants in the Nordic group ofnations, Germany, Japan, Australia and even South Korea. Japan and theNordic group of countries top the list, at 42 per cent and 40 per centefficiency respectively. (The ‘efficiency’ of a power plant is thepercentage of the total energy content of a power plant’s fuel that isconverted into electricity.) Average efficiency of US coal-based powerplants, by contrast, was 35.8 per cent. Indeed, in the US at present, plantscan’t go beyond 40 per cent efficiency. In comparison, China’s best plantshave achieved efficiency as high as 44 per cent.
There are nearly 6,000 electricity-generating facilities in the US, but most of the sector’s global-warming pollution comes from a handfulof exceptionally dirty power plants. In 2011, the 50 dirtiest US
power plants belched 30 per cent of all US electricity sector CO2 emissions, 12 per cent of total US energy-related emissions, and 2 percent of worldwide energy-related emissions. If these 50 were an independent nation, they would be the seventh-largest emitter of CO2in the world, behind Germany and ahead of South Korea. And if all power plants comprised a separate country, that ‘nation’ would be the third most polluting country after China and the US (see Infographic:The Big Belch).
De-commissioning these 50 power plants should have been thebiggest historical polluter’s first task. That hasn’t happened. And giventhe present policy trajectory, that seems impossible.
Natural gas: the new-pretender fossil fuel?In all the energy the US electric power sector used up, 1990-2014,natural gas contribution has doubled: 11 per cent to 22 per cent.Electricity generated using natural gas has increased from 12.3 per centof all the electricity the sector generated, in 1990, to 27.4 per cent in2014. In tandem, coal’s contribution to all electricity generated hascome down, from 52.5 per cent to 38.7 per cent. It is evident that in the
29
CAPITAN AMERICA
44%Efficiency the best coal-based power plants achievein China
40%Maximum efficiency of acoal-based power plant inthe US

30
WHAT ALL POLLUTE: MILLION TONNES OF EMISSIONS IN 2013
If all US power plants were a country, it would be the third highest polluter in the world. If the 50 dirtiest power plants were a nation, that country would be the 8th largest emitter of CO2 in the world. Just behind Germany, and just ahead of South Korea.
The Big BelchThe US’s war against coal is NOT at home
The US has the world’s second-
largest coal-based power plant
capacity, after China.
Per capita coal consumption in the US is 5 times more
than India.
Most power plants are more than
30 years old. The average weighted age of all US coal-
based power plants is 39
years.
CO
2 em
issi
on
s (m
illio
n t
on
nes
)
11000
10000
9000
8000
7000
6000
5000
4000
3000
2000
1000
0China United All US
power plants
India Russia Japan Germany 50 dirtiest US power
plants
South Korea
Canada
Sources: Environment America Centre, 2013
Sources: Heat on Power, CSE, 2015
OLD MEANS INEFFICIENT:
US coal-fired power plants are less efficient than those in the Nordic group of nations, Japan, Germany, Australia, even UK-Ireland.
Effi
cien
cy (
in p
erce
nta
ge)
45.0
40.0
35.0
30.0
25.0
20.0
15.0
10.0
5.0
0.0India China US UK-Ireland Germany Nordic
CountriesJapan

US, natural gas is substituting coal (see Graph 3.8: Contribution ofelectricity from coal and natural gas).
But what kind of a substitute is it? CO2 emissions from gas-basedplants have further upped the sector’s spew quotient. In 2014, 22 percent of all CO2 the sector emitted was from gas-based plants; in 1990, itwas just 10 per cent. This sub-sector, then, has seen a CO2 emissionsincrease of 150 per cent in the last 24 years. If current US policy andregulation are to be believed, it will keep occurring. Hence, it isimportant to understand the nature of the substitution.
Gas-based power plants are cheaper to operate than coal-based ones.In 2012, a gas-based plant spent, on average, US $35.67 to produce onemegawatt-hour of electricity. A coal-based plant spent more: US $ 37.20.Thus, gas has a competitive advantage over coal (see Graph 3.9: Averagepower plant operating expenses: 2012).
This edge is likely to continue. In 2020, the levelized cost ofelectricity (the per kilowatt-hour cost of building operating a power plantover an assumed financial life and performance cycle) from a new gas-based power plant is estimated to be significantly lower than a coal-based power plant. In fact, in 2020, the cheapest way to produceelectricity in the US will be to build an Advanced Combined Cycle Gas-based power plant. A coal-based power plant in 2020 will produceelectricity at a cost 30 per cent higher than gas (see Graph 3.10: Estimatedlevelized cost of electricity from new power plants in 2020).
31
CAPITAN AMERICA
52.5
38.7
12.3
27.4
0.0
10.0
20.0
30.0
40.0
50.0
60.0
1990
1992
1994
1996
1998
2000
2002
2004
2006
2008
2010
2012
2014
Electricity net generation from coal
Electricity net generation from natural gas
Perc
enta
ge
of
tota
l ele
ctri
city
gen
erat
ed
Graph 3.8: Contribution of electricityfrom coal and natural gasA matter of time before gas use overtakes coal use
Source: Based on monthly and annual energy review published by US EnergyInformation Administration
Graph 3.9: Average power plantoperating expenses: 2012Gas-based ones win hands down
Source: http://www.eia.gov/electricity/annual/html/epa_08_04.html, as viewed inAugust 2015
40
35
30
25
20
15
10
5
0
$US/
MW
h
Coal-based utilities
Fuel Maintenance Operation
Gas-based utilities

32
Policy direction: more gasUS policy direction for the future does not in any way discourage settingup new power plants, coal- or gas-based. In August 2015 the US
Environment Protection Agency (EPA) released emissions standards fornew, modified and reconstructed power plants. Under these standards,new gas plants are required to meet 453 kg CO2/megawatt-hour (MWh),while coal plants will need to meet 635 kg CO2/MWh. So what kind ofstandards are these? As per EPA itself, a Combined Cycle gas plant — thetechnology that is widely used and is the cheapest to build and operate— will meet this new standard.
Another way to look at these standards is to compare it with anothercountry. The standard the EPA has set in 2015, for the future, isequivalent to the standard gas-based power plants in India were alreadymeeting in 2009. As Challenge of the New Balance — a 2010 report of theCentre for Science and Environment — clearly shows, average emissionsof gas-based plants in India were 470 kg CO2/MWh, with many plants aslow as 410 kg CO2/MWh. In other words, the emissions standards for gas-based power plants (new, modified, or reconstructed) EPA has set is evenpoorer than what old gas-based power plants meet in India.
New coal plants, on the other hand, are going to have a tough time inthe US. A new coal plant, to meet these standards, must be highlyefficient. It must be of the ‘supercritical’ category of power plants, the
Graph 3.10: Estimated levilized cost of electricity from new power plants in 2020In 2020, a coal-based power plant will produce electricity at a cost 30 per cent higher than a gas-based one
Source: Annual Energy Outlook 2015, US Energy Information Administration
Solar Thermal
Wind – Offshore
Advanced Coal with CCS
Gas – Conventional Combustion Turbine
Solar PV
Advanced Coal
Gas – Advanced Combustion Turbine
Biomass
Gas – Advanced CC with CCS
Advanced Nuclear
Conventional Coal
Hydroelectric
Gas – Conventional Combined Cycle
Wind
Gas – Advanced Combined Cycle
Levelized capital cost
Fixed O&M
Variable O&M (including fuel)
Transmission investment
U.S. average levelized costs (2013 $/MWh) for plants entering service in 2020
0 50 100 150 200 250 300

kind that uses pulverised coal with partial carbon capture. Such plantsare expensive, for their operational costs are higher.
What are we to make of the EPA’s — and so, the US’s — stanceregarding natural gas? Why is the US allowing so much natural gas in itsenergy mix for the future? One reason is the shale gas boom is on andthere is no indication it will flag (see Box: Why the US is so happy about gas).The other is that cost rules, not climate change. The use of natural gasenables utilities to produce more electricity more cheaply. Whatever the scenario — business-as-usual or those the Energy InformationAdministration (EIA) has modelled in its analysis of the Clean Power Plan(see Section: Obama on Overdrive) — the US electric power sector isprojected to depend more and more on natural gas power plants.
The EIA has modelled four scenarios, on what could happen in thesector under the Clean Power Plant (CPP). Natural gas production isprojected to increase by 75-100 per cent by 2030 from 2005 levels. By2030, it is projected, natural gas will be the single largest energy source toproduce electricity — about 30 per cent of all electricity generated.
A 2012 study by the Union of Concerned Scientists (UCS) — anindependent institution — projects even higher natural gas use (seeGraph 3.11: Projections of natural gas consumption). According to this study,if current trends persist, natural gas will account for nearly two-thirds ofUS electricity by 2050.2 Since demand is going to rise and fossil fuels willcontinue to dominate the electricity sector in the years to come, says the
33
CAPITAN AMERICA
Why the US is so happy about gasSupply is abundant and prices are low. The US will soon become net exporter of natural gas
2013 was a record year for natural gas production in the US. For the first time in its history, gross naturalgas production crossed 30 trillion cubic feet (Tcf). The US, traditionally, relied on imports to meet itsnatural gas needs. Now, it was on the verge of becoming self-sufficient. Not only that. It was touted tobecome an exporter — no less — of natural gas by 2020. Gas prices in the US are at a record low, reflectingrobust growth in production and record high gas inventories.
About 40 per cent of the gas the US is now gregariously producing comes from a source barely thoughtto be a commercially viable just a decade back: shales, a rock formation. The gas is called shale gas.
The Energy Department estimates the US has 880 Tcf of technically recoverable shale gas. Such a stock,combined with other oil-and-gas resources, could last two centuries. Truly turning an energy-gobblingcountry energy-sufficient. US shale gas production has increased 12-fold over the last decade. This trend isexpected to continue through at least 2035, rising from 5 Tcf in 2010 (23 per cent of total US dry gasproduction) to 13.6 Tcf per year in 2035 (49 per cent of total US dry gas production).
The upsurge of cheap shale gas in the US has even made the IEA nervous. Fatih Birol, chief economist ofthe IEA has gone on record and said: “If gas prices come down, that would put a lot of pressure ongovernments to review their existing renewable energy support policies... We may see many renewableenergy projects put on the shelf.” Birol said the world must continue to invest in renewables, energyefficiency and carbon capture and storage, in order to stave off climate change. If the world fails to investin renewables, a new generation of gas-fired power stations would have a lifetime of at least 25 years,effectively “locking in” billion of tonnes of carbon emissions a year.1

UCS report, CO2 emissions in 2050 are going to be 5-25 per cent higherthan 2013. UCS cites a study by EIA where, similarly, it is said that in thisnatural gas use scenario, CO2 emissions are going to increase by 12 percent over 2012 levels by 2045. In sum, the switch from dirty coal tocleaner gas will not make a significant difference in the electricitysector’s GHG emissions.
Will gas be good for climate?Is gas better or coal, so far as climate change action is concerned? In mostmodelling studies, large-scale use of natural gas is not associated with anysignificant reduction in GHG emissions by 2050. Nature, for instance,published a major study in 2014.3 The study simulates five state-of-the-art integrated assessment models of energy-economy-climate systems. It found that an abundant gas scenario — additional natural gasconsumption of up to +170 per cent by 2050 — actually led to a muchsmaller impact on CO2 emissions, from −2 per cent to +11 per cent. Amajority of the models, Nature’s study shows, reported a small increase inclimate forcing, from −0.3 per cent to +7 per cent, associated withincreased use of abundantly available gas.
A major study published by the Stanford’s Energy Modeling Forum,which convened 50 experts and 14 different modelling teams fromindustry, academia, and government to look at how the surge in naturalgas production could transform the US economy, found that a boom inshale gas would not lead to any significant reduction in GHG emissionsfrom the US. Most experts in the Stanford study expect natural gas todisplace not only coal, but also nuclear and renewable energy betweennow and 2035.4 A low natural gas price in the US is also likely to reduceinvestments in energy efficiency.5
34
6,000
5,000
4,000
3,000
2,000
1,000
0
Gen
erat
ion
TW
h
2010 2025 2050
Non-hydro renewables Nuclear
Hydro CoalNatural gas
Graph 3.11: Projections of natural gas consumptionIn the future, natural gas will be the go-to source to produce electricity
Source: Report by ‘Union of Concerned Scientists’, 2012
11%The tiny impact gas use hason carbon dioxide emissions

According to the International Energy Agency (IEA), a highunconventional gas scenario (called the Golden Rule scenario), in whichnatural gas constitutes 25 per cent of the global energy supply andunconventional gas production (gas produced from unconventionalsources; shale gas is a good example) triples by 2035, does not lead to anysignificant reduction in energy-related CO2 emissions.6 IEA also concludes“greater reliance on natural gas alone cannot realise the internationalgoal of limiting the long-term increase in the global mean temperature totwo degrees Celsius above pre-industrial levels. Achieving this climatetarget will require a much more substantial shift in global energy use”.7
IEA’s caution is warranted, and timely. Natural gas, particularly whensourced from shale rock formations (and so, called shale gas), has farworse climate impacts than what was once assumed. For instance, muchhigher methane is emitted during the life cycle of shale gas, fromproduction to use. Methane is more potent, but has a lower half-life: itdoes not stay as long as CO2 does in the atmosphere. Averaged over 100years — the number of years a molecule of CO2 persists in theatmosphere — the GWP of methane is 25. But averaged over 20 yearsonly, methane’s ability to provoke global warming could be as high as72.8 Some studies have pegged it at 105, making it a really potent gas inthe short term.9
According to IEA, if the GWP of methane is estimated to be 105, evenif three per cent of shale gas is ‘leaked’ from the point it is produced in
35
CAPITAN AMERICA
Graph 3.12: Climate impacts of shale over coal The ‘leakage’ of methane in the shale gas produce-to-use cycle could stymie US climate action plans
Source: Golden Rules for a Golden Age of Gas, World Energy Outlook Special Report on Unconventional Gas, International Energy Agency, 2012
2.0
1.5
1.0
0.5
0
Rat
io o
f G
HG
em
issi
on
s o
f g
as o
ver
coal
Assumed methane global warming potential
Typical value
Methane emissionsas share of totalproduction
0 25 50 75 105
8%
6%
5%
3%
2%
1%

wells through when it is piped to when it is used in power plants orhomes, shale gas will lose all its advantage over coal. So minute a leakageis enough to make shale gas as potent a climate villain as coal (see Graph3.12: Climate impacts of shale over coal).
Indeed, studies in the US are already highlighting the problem. Asmuch as 3.6 to 7.9 per cent of the total gas output from a shale gas well islost through fugitive methane emissions. Compared to coal, then, thefootprint of shale gas could be at least 20 per cent greater. Perhaps morethan 200 per cent greater on a 20-year time scale.10
The US government now — belatedly — wants to control methaneemissions. On January 14, 2015, EPA announced a goal to cut methaneemissions from the oil and gas sectors by 40-45 per cent below 2012levels by 2025. EPA is planning to use existing laws like the New SourcePerformance Standards to set norms for methane and volatile organiccompound emissions from the gas sector. The draft standards EPA
announced will be finalised in 2016. But such standards will not add up. Even in CPP, it is expected there will be a 22 per cent increase in
primary energy production from 2013 to 2030. And so, even as coal isreplaced by natural gas, usage of the latter will increase and negate anygains made because of the low carbon intensity of this ‘bridge-fuel’ — asits votaries, including President Obama,11 call natural gas, meaning thefuel that will act as a bridge in the energy-transition from coal torenewable, to a ‘cleaner’ future.12 In fact, if the scenarios such as Natureor the EIA have modelled hold, then in 2050, emissions from the US
electric power sector will be equivalent to its current emissions.What’s more of a worry is that experts believe shale gas will stymie
the growth of the renewable energy sector for decades to come.13
It is clear as crystal. The US policy direction is all wrong. Without asubstantial, and meaningful, switch to renewables combined with steepcuts in energy consumption, the US will not make the gains the world sodesperately needs, or what the US itself — increasingly desperately —insists it is on the verge of achieving.
Renewable energyBy 2014, electricity produced from renewable sources in the US
increased by about 50 per cent since 1990 (see Graph 3.13: Growth inrenewable electricity generation). The annual growth rate of renewableelectricity production has been about 1.7 per cent since 1990.
But, the annual growth in total net electricity generation in the US
during 1990-2014 was 1.25 per cent. So, renewable electricity production isgrowing at a marginally higher rate than total electricity production. Theresult: the share of renewable sources used in generating electricity hasnot changed much since 1990. Renewable energy sources provided 12.7per cent of total electricity in 2014, barely up from 11.3 per cent in 1990.
The conclusion is simple: electricity from renewables is growing, butnot rapidly enough. This sub-sector remains a small part of overall
36
22%Projected increase in
primary energy production,2013 to 3030, negatinggains of the US flagship
plan to improve emissionsfrom the electricity sector

electricity production and consumption in the US. Moreover, if hydropower — a ‘traditional’ source
of electricity in the US — is taken out of therenewables equation, the contribution of renewableslike solar, wind and biomass is even smaller (about6.5 per cent of the total electricity generation). Sofar, non-hydro renewables remain a small part of theUS energy-mix story.
Changing source of renewable electricityThere has been a change in the sources of renewableelectricity in the US. In 1990, about 85 per cent ofrenewable electricity was generated fromhydropower. This has reduced to 50 per cent in 2014(see Graph 3.14: Share of different renewables, 2014). In2014, wind produced about 35 per cent of totalrenewable electricity, up from 1.0 per cent in 1990.So, wind power has grown at a tremendous pace,especially after 2005. The contribution of anotherimportant renewable source, solar power, hasremained miniscule.
The change in the mix of renewables in the US
37
CAPITAN AMERICA
Hydropower (50)
Biomass (8)
Geothermal (3)
Solar (4)
Wind (35)
Graph 3.14: Share of differentrenewables, 2014Wind is popular today in the US
Source: Based on monthly and annual energy review published by USEnergy Information Administration
1990
1992
1994
1996
1998
2000
2002
2004
2006
2008
2010
2012
2014
600000
500000
400000
300000
200000
100000
0
Gen
erat
ion
( M
illio
n K
Wh
)
Total
Hydropower
Wind
Biomass
Geothermal
Solar
Graph 3.13: Growth in renewable electricity generationThe US focus is to rely only on market-decided cheaper renewables. Solar remains a strict no-no
Source: Based on monthly and annual energy review published by US Energy Information Administration

reflects a price factor. United States has moved to wind in the last 10years because wind has become cheaper. It is not moving to solar,because it is expensive. In fact, the cheapest way to produce electricityin the US is through Onshore wind power and natural gas CombinedCycle power plants. Both of them are growing at the fastest pace. Pureeconomics; no altruism (see Graph 3.15: Levelized cost of electricity fromvarious energy sources: 2009-2014).
But even favourable economics has not propelled the US to climb therenewable ladder.
The pecking orderThe US is lagging far behind other major economies. In EU the share ofrenewable energy in power generation was 23 per cent in 2013. WhileSweden uses 53 per cent of renewables in total electricity generation,Germany and France use 26 and 18 per cent renewables, respectively. InChina and India, renewables share in electricity generation is 21 and 17per cent respectively — significantly higher than the US (see Graph 3.16:Percentage of renewable electricity in different countries).
38
Leve
lized
co
st o
f en
erg
y ($
/ k
Wh
)
Technology (number of volume)
Win
d, O
nsh
ore
(50
)
Win
d, O
ffsh
ore
(69
)
Sola
r, Ph
oto
volt
aic
(114
)
Co
nce
ntr
atin
g
Sola
r Po
wer
(49
)
Geo
ther
mal
, H
ydro
ther
mal
(24
)
Blin
d G
eoth
erm
al
Syst
em (
2)
Enh
ance
d G
eoth
erm
al
Syst
em (
EGS)
(13
)
Smal
l Hyd
rop
ow
er (
1)
Hyd
rop
ow
er (
17)
Oce
an (
3)
Bio
po
wer
(52
)
DIs
trib
ute
d
gen
erat
ion
(15
)
Fuel
Cel
l (12
)
Nat
ura
l Gas
C
om
bin
ed C
ycle
(33
)
Nat
ura
l Gas
C
om
bu
stio
n T
urb
ine
(19)
Co
al, P
ulv
eriz
ed C
oal
, Sc
rub
bed
(18
)
Co
al, P
ulv
eriz
ed C
oal
, U
nsc
rub
bed
(4)
Co
al, I
nte
gra
ted
Gas
ific
atio
n
Co
mb
ined
Cyc
le (
38)
Nu
clea
r (2
1)
$0.70
$0.60
$0.50
$0.40
$0.30
$0.20
$0.10
$0.00
Box & whisker Scatter DOE Program Estimate Other Estimate (insuffient data to show box & whisker)
Graph 3.15: Levelized cost of electricity from various energy sources: 2009-2014Wind costs less then US $0.5
Note: The levelized cost data is for data points generated from 2009 to 2014 and reflects the costs for the year 2009 to 2014.Source: Transparent cost database, Open Energy Information, http://en.openei.org/apps/TCDB/ as viewed on September 22, 2015

Not enough capacityIn 2014, the country with the highest wind power installation was China.Germany had the highest solar photovoltaic (PV) installations in 2014.The US ranked 2nd in wind power installation and 5th in solar PV
installations. The US renewable power installed capacity is less than halfof EU-28 and 50 per cent lower than China’s total renewable powercapacity (see Graphs 3.17: Total solar PV installed capacity: 2014; see Graph3.18: Total wind power installed capacity: 2014; and see Graph 3.19: Totalrenewable power installed capacities, excluding hydropower).
The US is simply not leading the transition towards renewableenergy. Its investments in renewable energy has peaked and thenplummeted. In 2014, the US invested US $38.3 billion in renewable powerand fuels. This was equivalent to 0.2 per cent of its GDP. In comparison,China invested US $83.3 billion, or about 0.75 per cent of its 2014 GDP, onputting up renewable power and fuel installations.13 India invested US $7.4 billion on renewables in 2014 or about 0.3 per cent of its GDP
(see Graph 3.20: Investments in renewable power and fuels).In the last 3 years (2012-2014), the share of the US in total global
investments in renewable energy has averaged 15 per cent. China, on theother hand, has accounted for 27.5 per cent of total global investments inrenewable energy, 2012-2014. In 2014, while the US accounted for 14 percent of the global investments in renewable energy, China’s contributionwas 31 per cent. China, therefore, is bearing the burden of transition torenewable energy. Large-scale investments in China means that theglobal prices of renewable technologies is coming down allowing other
39
CAPITAN AMERICA
0.0
10.0
20.0
30.0
40.0
50.0
60.0
Sweden
53.2
25.327.3
17.516.1 16.8
20.7
13.7
Germany EU France UK India China US
Perc
enta
ge
of
ren
ewab
le in
to
tal e
lect
rici
ty
Graph 3.16: Percentage of renewable electricity in different countriesThe US is a real laggard in using renewable sources to produce electricity
Source: Enerdata 2013
40
Graph 3.17: Total solar PV installedcapacity: 2014 US disinterest in solar is absolute
Graph 3.18: Total wind power installedcapacity: 2014China is far ahead of the US
177
In g
igaw
atts
200
150
100
50
0
38.228.2 23.3 18.5 18.3
3.2
Wo
rld
Ger
man
y
Ch
ina
Jap
an
Ital
y
USA
Ind
ia
Total solar PV installed capacity: 2014370
In g
igaw
atts
400
300
200
100
0
114.6
65.9
39.223 22.5
Wo
rld
Ch
ina
USA
Ger
man
y
Spai
n
Ind
ia
Total wind power installed capacity: 2014
Source: Renewables 2015 Global Status Report Source: Renewables 2015 Global Status Report
Graph 3.19: Total renewable power installed capacities, excluding hydropowerWind is popular in the US just because it is cheaper
150
125
75
50
25
0
100
ChinaBRICSeu-28Worldtotal
United States
Germany Italy Spain Japan India
31313232
153Gigawatts
Gigawatts
657
255
700
600
500
400
300
200
100
0
206
105
86
CSP and Ocean power
Geothermal power
Bio-power
Solar PV
Wind power
Source: Renewables 2015 Global Status Report

countries, including the US, to benefit from cheap renewables.The biggest problem is that US is not committing to take up more
burden in the future as well.
No commitmentsUS has plans to install 100 GW of renewable capacity across federallysubsidised housing by 2020, permitting 10 GW of renewable projects onpublic lands by 2020, deploying 3 GW of renewable energy on militaryinstallations by 2025, and doubling wind and solar electricity generationin the United States by 2025.15
If we assume the US will double its wind and solar electricitygeneration by 2025 with respect to 2014 (we are over-projecting, as theUS has not specified the baseline years), then in 2025 the solar powercapacity in the US will be 36.6 GW and wind power capacity will be about132 GW. For the record, in 2014 the total solar power capacity in Germanywas 38.2 GW and total wind power capacity in China was 115 GW. So, evenin 2025, US will have lower or similar solar and wind capacity thanGermany and China, respectively. This is truly unambitious.
In fact, India and China have more ambitious goals on renewableenergy than the US. As part of its Intended Nationally DeterminedContribution submitted to the secretariat of the United NationsFramework Convention on Climate Change, China has pledged toinstall 200 GW of wind power and 100 GW of solar power by 2020.16
Similarly, India has set itself a goal to install 100 GW solar power and 60GW wind power capacity by 2022. In 2022, India will have 170 GW of
41
CAPITAN AMERICA
Global
US
China
300
250
200
150
100
50
0
455.
43
7311
.68.
3
112
In U
S $
bill
ion
29.1
11.1
154
3316
.6
182
35.1
25.7
178
24.3 39
.5
237
35.1
38.7
279
50 49.1
256
38.2
62.8
232
3662
.6
270
38.3
83.3
2004 2005 2006 2007 2008 2009 2010 2011 2012 2013 2014
Graph 3.20: Investments in renewable power and fuelsThe US has shifted the burden of transition to renewables to other countries
Source: Renewables 2015 Global Status Report
115In gigawatts, installed windenergy capacity in China,2014. Similar to what theUS plans to install by 2020

renewable power capacity; the US will reach this level in 2025.16
From all angles, we find that the US is doing far less than others inrenewables energy. We cannot find any other reason other than price ofrenewables that can explain the reluctance of the US to deploy morerenewable energy. While countries like China and India are putting upexpensive renewable energy, the US is refusing to do so because it wantsits consumers to have cheap electricity.
Obama on OverdriveThe Clean Power Plan (CPP), a regulation that aims to reduce carbondioxide emissions from US power plants 32 per cent below their 2005-emissions level by 2030, was formally unveiled on August 3, 2015. Theplan exists under the umbrella Clean Air Act; its implementation will beoverseen by the Environmental Protection Agency (EPA). Speaking tojournalists the day before, White House advisor Brian Deese said thenew EPA rules were nothing less than the “biggest step that any singlepresident has made to curb the carbon pollution that is fuelling climatechange”.
CPP was first announced on June 2, 2014. It faced a lot of heat and,over a year,was revised. EPA released final rules in June 2015. Thatgenerated positive buzz. As The Guardian reported, Al Gore said the newrules were “the most important step taken to combat the climate crisis inour country’s history”. At the formal ceremony, President Obama spokeat length. The White House also released a statement in which CPP islinked to the global climate treaty: “Taken together, these measures putthe United States on track to achieve the president’s near-term target toreduce emissions in the range of 17% below 2005 levels by 2020, and laya strong foundation to deliver against our long-term target to reduceemissions 26 to 28% below 2005 levels by 2025”.
After the august unveiling, the world took up the refrain. “ThePlan,” said Stéphane Dujarric, spokesperson for UN Secretary-GeneralBan Ki Moon, “is an example of the visionary leadership necessary toreduce emissions and to tackle climate change”. Speaking to reporters inNew York on Monday itself, he also said: “We believe that this planshows the United States’ determination to address global warming whilealso saving money and growing economy”. CPP received wide mediacoverage, and a lot of attention in the social media. Some, such asGreenpeace and 350.org, were skeptical. But, largely, the world acceptedCPP was the best the US could come up with and do.
Is that so?If it is the stated goal of CPP to reduce coal consumption, immediatecomparison places a question mark on that ambition: ● The European Commission projects that, in 2030, only about 12 per
cent of EU-28 electricity will come from coal. Under CPP, in 2030 coalwill be the basis for at least 25 per cent of all electricity the US will
42

generate. Thus, compared to the EU-28, the US’ dependence on coalwill remain very high, even in 2030;
● 12 of China’s 34 provinces, that account for 44 per cent of China’s coalconsumption, have pledged to implement coal control measures.The province of Beijing alone plans to cut coal emissions by 50 percent compared to 2012 levels by 2017. Collectively, China’s coalcontrol measures imply lesser coal consumption to the tune of about350 million MT by 2017 and 655 MT by 2020, compared to business-as-usual growth. In CPP, US coal consumption will reduce by a muchlesser amount. If it is the stated goal of CPP to reduce emissions, then it is worth
noting, to begin with, that the so-called reduction of power sectoremissions by 32 per cent below 2005 emissions levels is NOT a target. It is a projection. Of what would happen to total emissions from the US’electricity sector if CPP were implemented in an assumed growth, energyprice and energy mix scenario. What CPP has done is just lay out a way (or four; see below) for power plants and different states to comply with its projection. If the scenario changes — say, the US’ growth ratedoubles than the assumed scenario, or oil and gas prices reducesignificantly than assumed — the outcome will be different. Thus, thismetric — much bandied about in reportage on CPP as a tough ‘target’ —is misleading.
CPP is misleading for another reason. CPP takes 2005 as the baselineyear for emissions reduction (see: Chapter 1, ‘Mask 1: the 2005 ‘peak’’).2005 was a year in which US emissions peaked. Whereas US emissionshave fallen but also risen, year-on-year, since then the US has picked andpickled, then promoted and packaged 2005 as its baseline year foremissions reduction, first in the global climate treaty arena, and now inCPP. If 1990 is taken as the baseline year, actual emissions reduction by2030, a la CPP, are going to be be a paltry 15 per cent. In this respect, CPP
is as misleading as all US commitments on tackling climate change are.
CPP: the devil in the detailsCPP comprises two key elements:1. Setting specific CO2 emission standards — a limit, if you like — for
existing coal- and gas-based power plants; and2. Converting the above standards into state-specific CO2 goals for the
entire electricity sector.Element 1 is detailed elsewhere (see Box: Limits or Limitless?). So
let’s look at element 2. CPP defines state-specific goals in terms of carbonintensity goals (specific CO2 emissons per unit of electricity generated ina state). This goal a state must reach by 2030. For each state, EPA hascalculated a goal by taking into consideration the CO2 emissionsperformance of existing plants in each state and each state’s mix ofenergy sources to produce electricity.
States can also opt for mass-based standards (tonnes of CO2 a state can
43
CAPITAN AMERICA

emit from its electricity sector by 2030). Here, EPA has used a method tofirst estimate how much emissions are allowed in 2012 and then add to itthe emissions growth allowable till 2030 due to increase in electricitygeneration. But, when all emissions are added up and divided by theamount of electricity generated in 2030, the figure must be such that itconforms to a state’s carbon intensity goals.
Every state can meet its target how it prefers. Closing old coal plants,increasing natural gas use, adding renewables — or increasingrenewables use — in the energy mix, increasing energy efficiency inhomes, shops and offices, putting a carbon tax on electricity consumptionor emissions from power plants,even working with other states to set-upmarket-based systems such as cap-and-trade.
In CPP as it now stands, states have to submit plans, latest by 2018, onhow they’ll comply. EPA will vet and clear their plans. The states mustimplement approved plans 2022 onwards. Here is a compromise: in thedraft CPP, the start-reducing-emissions schedule was tougher.
The draft CPP and the final August 2015 version differ in at least twoimportant ways. Specific CO2 emission standards for existing plants wereabsent in the draft rules.Also, implementation dates have been extendedby 2 years: in the draft rule, cuts had to begin from 2020, instead of 2022.These changes have been made to facilitate emission trading betweenstates. The net result of these changes, as EPA projects, is a shift from 30per cent CO2 reductions in the electricity sector by 2030, over 2005 levels,to 32 per cent.There will also be some increase in renewable energy use.
After the draft CPP was released in June 2014, the IndependentStatistics and Analysis wing of the Energy Information Administration —EIA, a body that looks into the implications of legislations on the US
energy sector — went through it with a fine toothcomb. We, with a finertoothcomb, go through EIA’s analysis of the draft rule. We wish to reallyunderstand how exactly will CPP decarbonise the US’ electricity sector.
Analysing EIA’s analysisEIA created multiple scenarios to project what CPP could achieve: ● AEO: EIA’s reference case scenario for 2015. It is founded on annual
projections of energy supply, demand and prices, based on existingregulations and market conditions,up to 2040.
● CPP: It is the base policy case that models CPP’s ambitions usingenergy supply, demand, and prices assumed in the AEO 2015 scenarioas the underlying baseline.
● CPPEXT: A Policy Extension case, a hypothetical scenario. Ithypothetically extends CO2 reduction targets beyond 2030, in order toreduce CO2 emissions from the power sector by 45 per cent below2005 levels in 2040, using the AEO 2015 reference case as the baseline.
● CPPHEG: Models CPP using the AEO 2015 High Economic Growthtrajectory as the baseline. In this scenario, electricity and natural gasdemand are higher, as are fuel prices, than the reference case.
44

● CPPHOGR: The CPPHOGR case models CPP using the AEO 2015 HighOil and Gas Resource trajectory as the baseline. This scenario haslower fossil fuel prices than the reference case.CPP does not mandate particular energy mix. It projects emissions
reductions if all states implement their carbon intensity goals or mass-based targets. Because states have huge flexibility to meet their targets,it is very difficult to predict the mix of energy and the final emissionsreduction in 2030 and beyond. Therefore, the need for multiplescenarios.
45
CAPITAN AMERICA
Limits or Limitless?A look at what the US has in store for its power plants
In the Clean Power Plan (CPP), the Environmental Protection Agency (EPA) has fixed emissions standards forexisting coal-based power plants at 1,305 lb carbon dioxide per megawatt-hour (CO2/MWh), or 592 kgCO2/MWh. Gas-based plants can only emit 771 lb CO2/MWh, or 350 kg CO2/MWh. EPA arrived at thesenumbers after taking into consideration actions a power plant could take to reduce emissions. These actions,called ‘building blocks’ in CPP, include making fossil fuel power plants more efficient, switching to naturalgas and scaling up a plant’s share of renewable energy in its electricity production profile. A power plant canemploy all these ‘bulding blocks’ to achieve the emissions standards.
EPA has also notified, separately on August 3, 2015, CO2 emissions standards for new, modified andreconstructed power plants. For base load gas-based new and reconstructed plants (base load plants arethose that run for 24-hrs, on a certain capacity), the standard is 1,000 lb CO2/ MWh-gross or 454 kg CO2/MWh-gross (megawatt hour-gross denotes all the power a plant produces, including what it itself uses).According to the EPA, a natural gas combined cycle (NGCC) technology can meet this norm. For a new coal-based power plant, the emission standard has been fixed at 1400 lb CO2/ MWh-gross (635 kg CO2/ MWh-gross). As per EPA’s analysis, a new highly efficient supercritical pulverized coal unit with partial carboncapture and storage (about 20 per cent of carbon capture) can meet this standard.
The CO2 emissions standards for new, modified and reconstructed power plants are shocking. to say theleast.
The standards the US has set for new gas-based power plants is hardly better than what the new gas-based power plants are already meeting in the US. In fact, the standards are so poor that all the existing gas-fleet will meet these stanadrds without even changing a screw.The current fleet-wide emission rates of thegas-based plants are 894 lb/MWh, 899 lb/MWh and 951 lb/MWh in the East, West, and Texas (the three mainelectricity grids), respectively.
The standards for new coal-based based plants are tougher but can be met with emerging technologies. Ahighly efficient ultra supercritical coal plant using washed high calorific value coal can meet these standards. The implication is frightening: the US is open — amenable, willing, as interested as ever — to setting upmore fossil fuel-based power plants within its national boundaries. It is, in fact, encouraging industry tosetup inefficient gas-based power plants.
These standards show how hypocritical the US is on the issue of climate change. The US, of late, has putpressure on multilateral banks and financial institutions not to fund coal-based power plant projects indeveloping countries — Pakistan, Turkey, even Bangladesh, immediately come to mind. But it has kept theoption open for itself to set up new coal-based power plants.

How much CO2 emissions will CPP reduce?EIA analysis shows electricity sector CO2 emissions in the base policy casewill be 25 per cent below 2005 levels by 2020 and 34 per cent below 2005levels by 2030. In all the modelled scenarios, US power plants will emit atleast 22 per cent below 2005 levels by 2020 and 29 per cent below 2005levels by 2030. The maximum reduction is in the CPPEXT scenario: 26 percent by 2020 and 36 per cent by 2030, compared to 2005 levels (seeGraph 3.21: Projected CO2 emissions reduction under scenarios).
But these numbers hide a lot more than they reveal.The electricity sector in the US is already emitting 15 per cent less
than what it was in 2005. From 2005 to 2014, this sector’s emissionsreduced 1.8 per cent annually, largely due to a switch from coal use tonatural gas use. The switch has not happened because of any altruistic, orclimate-caring, reason. It is cold economics: it is cheaper to produceelectricity using natural gas than coal.
The cold-economics switch has enabled the US to reduce electricitysector emissions 1.8 per cent annually, in the last 15 years. Now, even ifthis sector emits, by 2030, 34 per cent less than what it did in 2005, theannual rate of reduction from now till 2030 will only be about 1.6 percent. In other words, the annual rate of reduction in the future, asimagined in CPP, is going to be less than what has already happened, thattoo in a business-as-usual scenario. How, therefore, is CPP ambitious?How is it “historical”, as President Obama has claimed?
CPP also does not enable a significant reduction in total emissionsfrom the electricity sector. By choosing 2005 as its baseline to cutemissions, the US has concealed the huge emissions increase thathappened from 1990 to 2005. If, instead of 2005, 1990 is used as abaseline, the true picture of what CPP enables — actually, glosses over,suppresses — becomes clear.
Compared to 1990 levels, there will hardly be any reductions till 2020in the US electricity sector, under all projected scenarios. In 1990,thissector emitted 1,865 million MT. What will it emit in 2020? In CPPEXT,the most climate-ambitious scenario EIA has modelled, the least thissector will emit is 1,800 million MT. That’s just 4 per cent below what thesector emitted in1990.
Next question: what happens by 2030? By 2030, this sector will emitat least 1,550 million MT. That is just 17 per cent below 1990 levels! Also,1,550 million MT is a hell of a lot of CO2 emissions. It is equivalent to 75per cent of the total CO2 emissions from India from all sectors in 2012.Fathom: just one sector of the US will emit, by 2030, 75 per cent of what1.2 billion-strong India emitted in toto in 2012. Wow. That’s the plan?
How important will renewables be in the energy mix? A good way to tackle perplexity — or attain clarity — regarding CPP is tolook at the projected energy mix in 2030: which energy sources are goingto be used, or not. EIA modelling shows that if oil and gas prices will be
46

low, the US will meet its CPP targets by using large quantities of naturalgas. If expensive, renewables will play a more significant role. But whatis clear is that till 2030, most of the emissions reduction will happen dueto greater use of natural gas and lesser use of coal. So, the past willcontinue in the future, too.
Let’s look at the issue of energy mix a little more closely. Fuel byfuel.
King CoalIn the CPP (base policy) scenario, coal production is projected to go down20 per cent by 2020 and 32 per cent by 2030. This matches projected
47
CAPITAN AMERICA
MM
T C
O2
MM
T C
O2
3000
2500
2000
1500
1000
500
02005 20052010 20102015 20152020
2020
Cases using AEO reference case baseline
AEO CPP CPPEXT CPPNUC
2030
20202025 20252030 20302035 20352040 2040
3000
2500
2000
1500
1000
500
0
Cases using alternative baseline
2020 2030
AEOHEG AEOHOGR CPPHEG CPPHOGR
Graph 3.21: Projected CO2 emissions reduction under scenariosThe Clean Power Plan doesn’t do much to reduce emissions
1,400
1,200
1,000
800
600
400
200
0
Mill
ion
sh
ort
to
nn
es
2005 2010 2015 2020 2025
AEO CPP
CPPEXT CPPNUC
2030 2035 2040
1,400
1,200
1,000
800
600
400
200
0
Mill
ion
sh
ort
to
nn
es
2005 2010 2015 2020 2025 2030 2035 2040
AEOHOGRAEOHEG
CPPHOGRCPPHEG
Graph 3.22: Production of fossil fuels in different scenariosThe US energy system is projected to remain heavily dependent on fossil fuels
Note: 1 short ton = 0.907 metric tonneSource: Analysis of the Impacts of the Clean Power Plan, Independent statistics and analysis, U.S. Energy Information Administration, May 2015

reductions in CO2 emissions. Coal production reduces further in theCPPHOGR scenario: here, gas is highly available and prices are low. In theCPPHOGR scenario, coal production can reduce by 40 per cent by 2030.However, in all scenarios — and this is the point to consider — the leastamount of coal the US will produce in 2030 is still going to be around 600million MT. That’s really high: equivalent to what India consumes today.In fact, in the CPP scenario, coal production in 2030 will be about 725million MT (see Graph 3.22: Production of fossil fuels in different scenarios).Where’s the backing-off?
48
60
50
40
30
20
10
0
Mill
ion
cu
bic
fee
t
2005 2010 2015 2020 2025 2030 2035 2040
60
50
40
30
20
10
0M
illio
n c
ub
ic f
eet
2005 2010 2015 2020 2025 2030 2035 2040
AEO CPP
CPPEXT CPPNUC
AEOHOGRAEOHEG
CPPHOGRCPPHEG
Graph 3.23: Projected natural gas production in different scenariosIt is quite clear that future cleaner climate plans are founded on gas use
0
500
1000
1500
2000
2500
3000
3500
4000
4500
5000
Co
al
Nat
ura
l Gas
Nu
clea
r
Hyd
ro
Win
d
Sola
r
Oth
er
ren
ewab
les
Oil/
Oth
er
Tota
l
Elec
tric
ity
gen
erat
ion
(m
illio
n K
Wh
)
1990
1594 20
13
1153
382 76
114
29
577 78
2
808
293
270
299
2.8
18
562
0.4
1 148
48 69 146
141
142
40
3038
4055 45
84
2005 2030: CPP
Graph 3.24: The future US energy mixThere is no change, from now till then
Source: Analysis of the Impacts of the Clean Power Plan, Independent statistics and analysis, U.S. Energy Information Administration, May 2015

Prince GasIn all scenarios, natural gas production continues to increase till 2030 andbeyond. In fact, in all scenarios, natural gas production exceeds 32 trillioncubic feet — about 75 per cent higher than 2005 levels. Indeed, in theCPPHOGR scenario, production could more than double, compared to2005 levels (see Graph 3.23: Projected natural gas production in differentscenarios). Is this a mitigation option, nationally and internationally (anygas emitted has an ‘international/ global-atmospheric dimension’)? No,for such levels of accepted production, policy-driven, means the US is justnot going to interfere in the way people consume electricity. The switchto gas is really a bogey. Cost rules, not climate change action.
The OrphanEven in 2030, all the electricity produced from all renewables (excludinghydropower) in the US will still be 25 per cent less than that producedfrom coal. If hydropower is included, total electricity produced from allrenewables is going to be the same as that produced using coal. In 2030,electricity produced from all renewables and coal will be about 25 percent, each. Gas and nuclear will account for the remaining 50 per cent(see Graph 3.24: The future US energy mix).
Essentially, even by 2030 under President Obama’s CPP, fossil fuelswill be used to produce — will continue to produce — 57-60 per cent ofall electricity. In 2014, fossil fuels accounted for 67 per cent of allelectricity produced. In 2030, solar power will contribute just 3 per centto total electricity produced. Wind? 12 per cent, only. So, popularrenewables such as wind and solar will remain marginal, in the US, in2030.
Brute FactBrute fact is that, even in 2030, the energy system in the US is hardlygoing to change, under CPP. The system remains fossil-fuel heavy (seeTable 3.2: How decarbonised is the US energy system in 2030):● Energy production and consumption continues unabated. In 2030,
the US will produce 22 per cent more primary energy than 2013levels.
● The energy system in the US remains fossil-fuel dependent. In 2013,78 per cent of total primary energy the US produced came from fossilfuels. In 2030? 76 per cent will come from fossil fuels. Indeed, in2030, total fossil fuel production in the US will be 20 per cent higherthan in 2013.
● Renewables will remain marginal. In 2013, renewables contributed11 per cent to total primary energy produced in the US. In 2030, thisalternative will increase, marginally, to 15 per cent.
What’s really going to happen? Let’s read it from pp 16-17 of the 1,560-page CPP final rule document itself: “Coal and gas will remain the twoleading sources of electricity generation in the US, with coal providing
49
CAPITAN AMERICA

about 27 percent of the projected generation, and gas providing about 33percent of the projected generation”.
All in all, CPP hardly transforms the energy system. How is this plan— the first-ever climate action step the US has taken — the mostambitious the US has ever imagined? Has the US run out of imagination?For a country that has been most unimagimative, or utterly practical,about climate change — despite its high level of development, itsHuman Development Index of 0.94; by almost any index of humanprosperity or well-being, it is right up there at the top — is CPP anotherproof it has run away from ambition? Again?
Most sadly, has the world lost its capacity to critique and challengethe US?
50
Table 3.2: How decarbonised the US energy system is in 2030Not much at all
Primary energy Clean power plan scenario: 2030
production in 2013 Primary energy Percentage Percentage of the (in quadrillion Btu) production (in increase over total (%)
quadrillion Btu) 2013 (%)
Natural Gas 25.1 33.6 34 33
Coal 20 16.6 -17 16
Oil 19.2 26.8 40 26
Nuclear 8.3 8.5 2 8
Renewable 9 14.8 64 15
Other 1.3 0.9 -31 1
Total 82.7 101.2 22 100
Source: Analysis by CSE using data from: Analysis of the Impacts of the Clean Power Plan, Independent statistics and analysis, U.S. Energy Information Administration,May 2015

51
CAPITAN AMERICA

52
● Transport sector in 2013 was responsible for 28per cent of all US emissions; within this passengercars contributed some 42 per cent; light dutytrucks, which includes SUVs, 18 per cent and thentrucks another 23 per cent. Private vehiclesresulted in 60 per cent of the country’s emissions.
● Buses, railways — most efficient transport —contributed less than 5 per cent; air travelemissions were more than railways.
● After 2005, emissions have reduced annually by1.4 per cent — a marginal decline at best. Buteven here emissions from passenger cars aregrowing by 1 per cent each year.
● Some 86 per cent Americans commute using thecar, as compared to 10-15 per cent in India. Thisis not changing.
● The rest of the world is realising that reining intransport related emissions requires reinventingmobility so that people move, not cars. US, itseems, is in reverse gear.
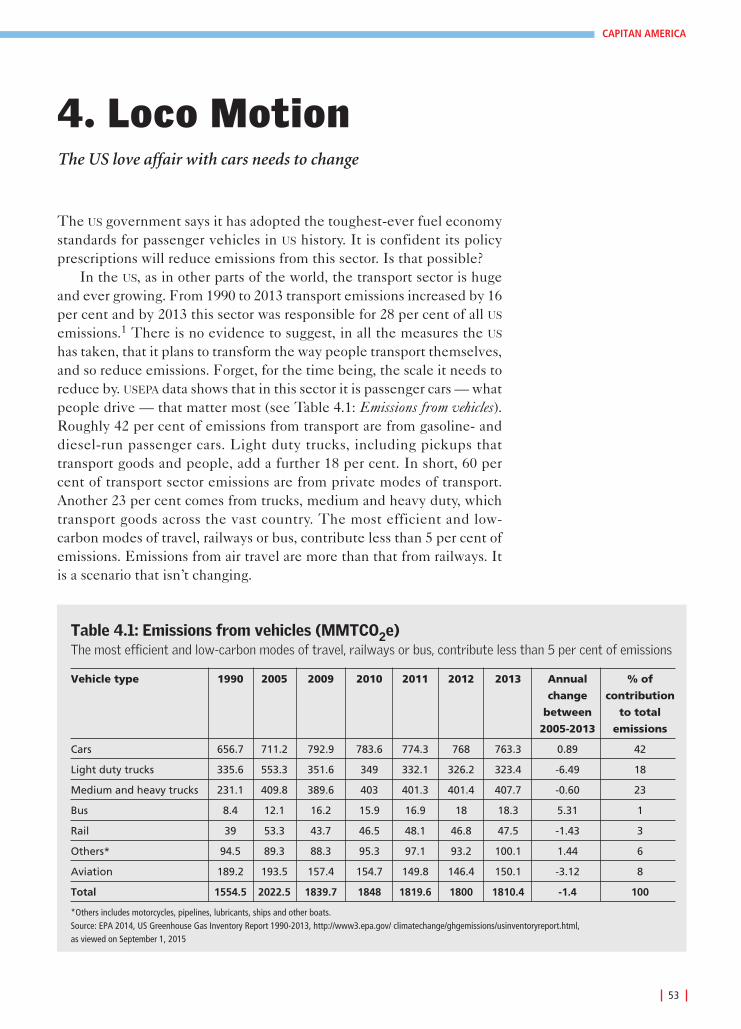
The US government says it has adopted the toughest-ever fuel economystandards for passenger vehicles in US history. It is confident its policyprescriptions will reduce emissions from this sector. Is that possible?
In the US, as in other parts of the world, the transport sector is hugeand ever growing. From 1990 to 2013 transport emissions increased by 16per cent and by 2013 this sector was responsible for 28 per cent of all US
emissions.1 There is no evidence to suggest, in all the measures the US
has taken, that it plans to transform the way people transport themselves,and so reduce emissions. Forget, for the time being, the scale it needs toreduce by. USEPA data shows that in this sector it is passenger cars — whatpeople drive — that matter most (see Table 4.1: Emissions from vehicles).Roughly 42 per cent of emissions from transport are from gasoline- anddiesel-run passenger cars. Light duty trucks, including pickups thattransport goods and people, add a further 18 per cent. In short, 60 percent of transport sector emissions are from private modes of transport.Another 23 per cent comes from trucks, medium and heavy duty, whichtransport goods across the vast country. The most efficient and low-carbon modes of travel, railways or bus, contribute less than 5 per cent ofemissions. Emissions from air travel are more than that from railways. Itis a scenario that isn’t changing.
53
CAPITAN AMERICA
4. Loco MotionThe US love affair with cars needs to change
Vehicle type 1990 2005 2009 2010 2011 2012 2013 Annual % of
change contribution
between to total
2005-2013 emissions
Cars 656.7 711.2 792.9 783.6 774.3 768 763.3 0.89 42
Light duty trucks 335.6 553.3 351.6 349 332.1 326.2 323.4 -6.49 18
Medium and heavy trucks 231.1 409.8 389.6 403 401.3 401.4 407.7 -0.60 23
Bus 8.4 12.1 16.2 15.9 16.9 18 18.3 5.31 1
Rail 39 53.3 43.7 46.5 48.1 46.8 47.5 -1.43 3
Others* 94.5 89.3 88.3 95.3 97.1 93.2 100.1 1.44 6
Aviation 189.2 193.5 157.4 154.7 149.8 146.4 150.1 -3.12 8
Total 1554.5 2022.5 1839.7 1848 1819.6 1800 1810.4 -1.4 100
Table 4.1: Emissions from vehicles (MMTCO2e) The most efficient and low-carbon modes of travel, railways or bus, contribute less than 5 per cent of emissions
*Others includes motorcycles, pipelines, lubricants, ships and other boats.Source: EPA 2014, US Greenhouse Gas Inventory Report 1990-2013, http://www3.epa.gov/ climatechange/ghgemissions/usinventoryreport.html, as viewed on September 1, 2015
First, cars are not reducingCompared to 1990 levels, emissions from the transport sector are up 25.5per cent. Emissions declined after 2005, the year US emissions peaked,but marginally, at best. It cannot be said that the US, till date, has bent itsemission curve on transport. Emissions from transport reduced by 1.4 percent per year between 2005-2013.
But emissions from passenger cars are not reducing. This segmentcontinues to grow at 1 per cent each year in this period. It is alsoprojected that car sales are on the upswing and will break new records inthe coming years.
The bus segment, growth in which signals the country is beginningto leap forward on mobility transition (if not transformation), hasincreased its emissions. But the segment itself has a low base,constituting just 1 per cent of all US transportation emissions.
Emissions from the railways segment — the big opportunity to movepassengers and goods with low emissions — has declined, reducing 1.4per cent each year between 2005-2013. This segment has either becomemuch less polluting in terms of kilometres travelled or its use in theeconomy is down, not up.
US plans on fuel efficiency standardsThe silver bullet for the US in this sector is the improvement notified infuel-economy standards of passenger (light duty) vehicles. Thegovernment expects these standards — applicable in two phases, first tovehicles manufactured between 2012 and 2016 and then to thosemanufactured between 2017 and 2025 — would substantially tighten theamount of fuel a vehicle can use for each kilometer travelled, and soreduce emissions. The EPA has calculated that light duty vehiclestandards are projected to result in an average industry fleet-wide levelof 163 grams CO2/mile (gCO2/mile) travelled in model year 2025.2 TheCorporate Average Fuel Economy (or CAFÉ) standards, as these areknown, are in terms of grams of CO2, which will be emitted per mile thevehicle travels and are set for a given fleet of vehicles in a given modelyear. According to International Council for Clean Transportation (ICCT),this would mean that the average light duty vehicle CO2 emissions wouldbe reduced from the 2016 level of 250 gCO2/mile to 163 gCO2/mile formodel year 2025. If this standard is converted to km to compare withEuropean standards, then it would mean that US would reduce from 172gCO2/km in 2016 to 107 gCO2/km in 2021. And if only passenger cars areconsidered then these would come down to 91 gCO2/km in 2025. Againaccording to ICCT, with the US light duty standards in place, fueleconomy will increase from 34.1 miles per gallon in 2016 to 49.6 milesper gallon in 2025 — a hike of 45 per cent.3
In addition to light duty vehicle standards, on June 19, 2015 EPA hasissued a draft standard for heavy-duty vehicles — trailers and trucks —which once notified would be implemented over model years 2018 to
54
42%Contribution of gasoline-and diesel-driven cars to
transport sector emissions

2027. These are important as trucks continue to transport bulk of freightin the country and contribute some 23 per cent of the sector’s carbonemissions. It is also a fact that the world is only just beginning to move toset fuel economy norms. Only Canada, China and Japan have standardsfor heavy-duty vehicles. The US standards, says ICCT, establish relativelymodest efficiency improvement of 11-14 per cent.4 Japan and China willimplement their standards by 2015 and US and Canada by 2018.
Will fuel efficiency be a game changer?The question is: will fuel-efficiency standards result in the gains the US
government expects?First, it is well known fuel efficiency standards are difficult to
implement on the road. A 2011 report by the Boston-based Union ofConcerned Scientists (UCS)5 found that the mileage standard of 54.5 mpgin the showroom could mean as little as 35 mpg on the road, largelybecause of the test cycle used to certify compliance with standards. ICCT
found similar results in Europe. A 2012 ICCT study found that the gapbetween type-approval and ‘real-world’ fuel consumption CO2 valuesincreased from 8 per cent in 2001 models to 21 per cent in 2011, moreefficient, models.6 A later study by ICCT found that, in 2013, the gapbetween vehicle emissions testing in laboratory conditions and the realworld was as high as 38 per cent. “This gap represents the lower real CO2emission benefits with the regulation and higher fuel costs for buyer”writes Drew Kodjak of ICCT.7
Second, the US is neither the first to announce fuel efficiencystandards nor is it the leader in this field. An analysis by the ICCT
compares targets of various countries, their historical performance andproposed targets. Japan and Europe, the analysis finds, continue to leadthe world with the most stringent passenger vehicle greenhouse gas andfuel economy standards (see Graph 4.1: Comparison of light-duty vehicleefficiency standards).8 Such findings provoke a question: when Europe andJapan, with their stringent fuel-economy standards, have not been ableto rein-in transport sector emissions, will the US be able to do so?
In this context, it is worth looking at a fact the 2011 UCS report comesup with: some five years before the CAFÉ standards kicked in,manufacturers already had cars on the road that could meet them.
Further, critics suggest CAFÉ is limited. The standards have no effecton the current fleet, and so will have no impact on vehicle fuel use for atleast another decade. CAFÉ does not reduce levels of driving; indeed, itactually encourages driving. As people get more efficient cars, they drivemore. This is called the rebound effect, the absolute bull in an efficiencystandard’s china shop. CAFE is sure to get gored.
The Centre for Science and Environment’s analysis shows that, inthe US, increased driving negates about 50 per cent of the fuel savingsbenefits of fuel efficiency improvements (see Box: Fuel efficiency is notsufficient). Even as fuel efficiency in the US increased by 16 per cent
55
CAPITAN AMERICA
16.9Cars sold in the US in 2015,in million

between 1990 and 2013, miles travelled by vehicles increased 7 per cent.Efficiency gains vapourised.
There is no reason to believe this trend will not continue in the yearsto come. After a recession-caused increase led to a dip in vehicle milestravelled in 2007, there is an upward swing again. IHS Automotive, amarket consultancy, in its annual global survey has projected that in2015, 16.9 million cars will be sold in the US and this will increase to 17.2million in 2016 and 17.5 million cars in 2017. If this happens, it wouldherald a new car-sale peak for the US — the last car-peak was in 2000when 17.4 million cars were sold.9 If this happens then it is clear thatbulk of the gains made by increasing fuel efficiency and so, reducedemissions of each vehicle, would be lost.
This is also when, according to US Energy InformationAdministration, motor gasoline use has been rising after the recession-caused dip in 2012.10 So, car sales are increasing, fuel use is increasing,vehicle-miles are increasing. Bad news for climate mitigation plans.
In this way, it is clear that EPA has over-estimated the CO2 emissionsreduction benefit from its silver-bullet measure. Something may happen,but it is likely CAFE will not enable the huge benefits anticipated.
It is just not enough to depend on improved efficiency as a way toreduce emissions, without addressing two key issues: vehicle numbers(private cars as well as goods trucks) and an attempt to change drivingmodes (consumption patterns).
56
Graph 4.1: Comparison of light-duty vehicle efficiency standardsJapan and EU lead the world with the most stringent standards
Source: Drew Kodjak 2015, Policies to reduce fuel consumption, air pollution and carbon emissions from vehicles in G20 nations, ICCT briefing paper, May
Canada 2025: 97
Historical performance
Enacted targets
Proposed targetsor targets under study
2000 2005 2010 2015 2020 2025
US 2025: 97EU 2021: 95
South Korea 2020: 97India 2021: 113
China 2020: 117
Japan 2020: 122
Mexico 2016: 145Brazil 2017: 138
KSA 2020:142
220
200
180
160
140
120
100
80
60
40
20
0
9
8
7
6
5
4
3
2
1
0
Gra
ms
CO
2p
er k
ilom
eter
, no
rmal
ised
to
NED
CLiters p
er 100 kilom
eters (gaso
line eq
uivalen
t)
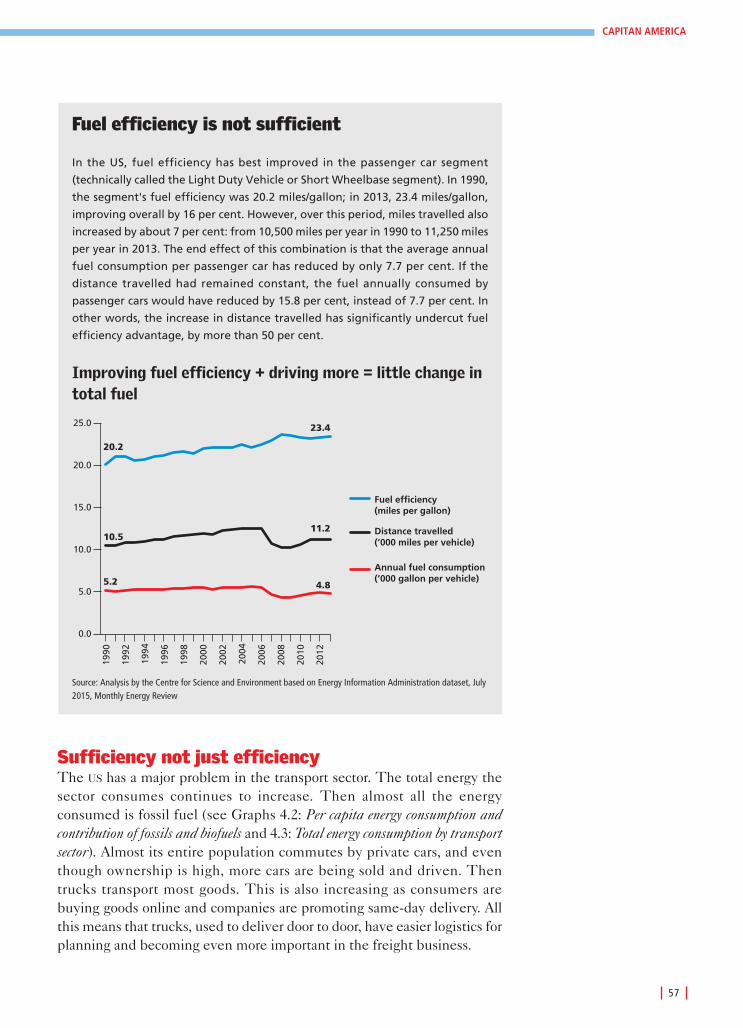
Sufficiency not just efficiencyThe US has a major problem in the transport sector. The total energy thesector consumes continues to increase. Then almost all the energyconsumed is fossil fuel (see Graphs 4.2: Per capita energy consumption andcontribution of fossils and biofuels and 4.3: Total energy consumption by transportsector). Almost its entire population commutes by private cars, and eventhough ownership is high, more cars are being sold and driven. Thentrucks transport most goods. This is also increasing as consumers arebuying goods online and companies are promoting same-day delivery. Allthis means that trucks, used to deliver door to door, have easier logistics forplanning and becoming even more important in the freight business.
57
CAPITAN AMERICA
Fuel efficiency is not sufficient
In the US, fuel efficiency has best improved in the passenger car segment
(technically called the Light Duty Vehicle or Short Wheelbase segment). In 1990,
the segment's fuel efficiency was 20.2 miles/gallon; in 2013, 23.4 miles/gallon,
improving overall by 16 per cent. However, over this period, miles travelled also
increased by about 7 per cent: from 10,500 miles per year in 1990 to 11,250 miles
per year in 2013. The end effect of this combination is that the average annual
fuel consumption per passenger car has reduced by only 7.7 per cent. If the
distance travelled had remained constant, the fuel annually consumed by
passenger cars would have reduced by 15.8 per cent, instead of 7.7 per cent. In
other words, the increase in distance travelled has significantly undercut fuel
efficiency advantage, by more than 50 per cent.
0.0
5.0
10.0
15.0
20.0
25.0
20.2
23.4
10.511.2
5.2 4.8
1990
1992
1994
1996
1998
2000
2002
2004
2006
2008
2010
2012
Fuel efficiency (miles per gallon)
Distance travelled (’000 miles per vehicle)
Annual fuel consumption (’000 gallon per vehicle)
Improving fuel efficiency + driving more = little change intotal fuel
Source: Analysis by the Centre for Science and Environment based on Energy Information Administration dataset, July2015, Monthly Energy Review
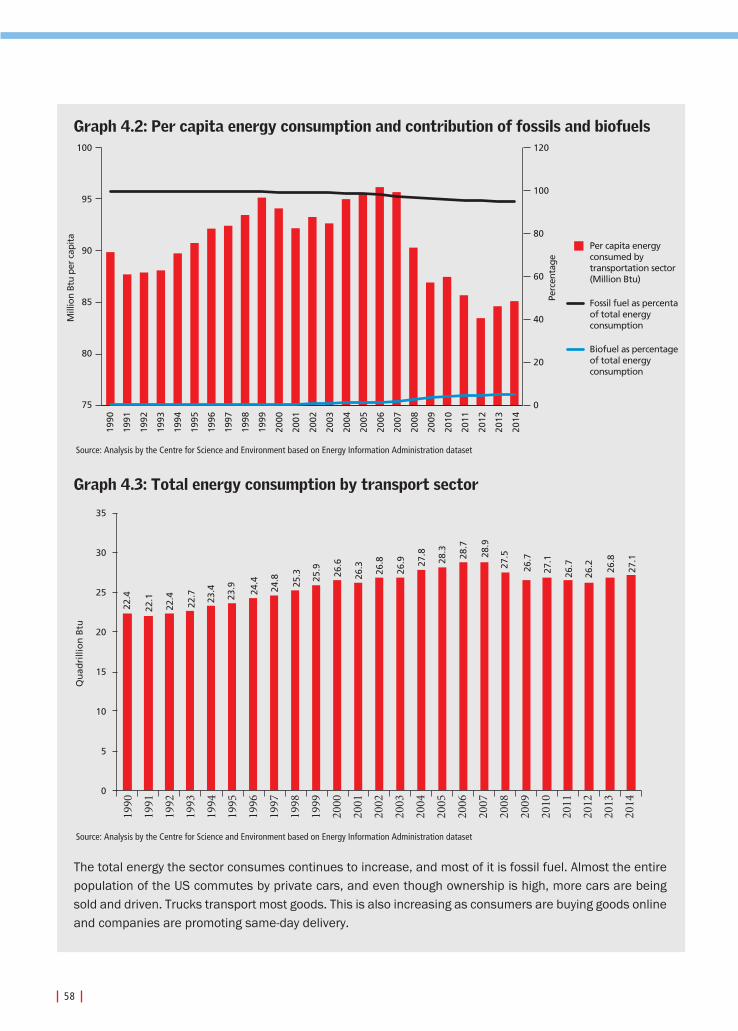
58
1990
1992
1994
1996
1998
2000
2002
2004
2006
2008
2010
2012
2014
1991
1993
1995
1997
1999
2001
2003
2005
2007
2009
2011
2013
120
100
80
60
40
20
0
100
95
90
85
80
75
Mill
ion
Btu
per
capi
ta
Perc
enta
ge
Per capita energyconsumed bytransportation sector(Million Btu)
Fossil fuel as percentagof total energyconsumption
Biofuel as percentageof total energyconsumption
Graph 4.2: Per capita energy consumption and contribution of fossils and biofuels
Source: Analysis by the Centre for Science and Environment based on Energy Information Administration dataset
Graph 4.3: Total energy consumption by transport sector
Source: Analysis by the Centre for Science and Environment based on Energy Information Administration dataset
The total energy the sector consumes continues to increase, and most of it is fossil fuel. Almost the entirepopulation of the US commutes by private cars, and even though ownership is high, more cars are beingsold and driven. Trucks transport most goods. This is also increasing as consumers are buying goods onlineand companies are promoting same-day delivery.
1990
1991
1992
1993
1994
1995
1996
1997
1998
1999
2000
2001
2002
2003
2004
2005
2006
2007
2008
2009
2010
2011
2012
2013
2014
35
30
25
20
15
10
5
0
22.4
22.1
22.4
22.7
23.4
23.9
24.4
24.8
25.3
25.9
26.6
26.3
26.8
26.9
27.8
28.3
28.7
28.9
27.5
26.7
27.1
26.7
26.2
26.8
27.1
Qu
adri
llio
n B
tu

59
CAPITAN AMERICA
There is also the matter of how many cars peopleown — where the divide is, really, between thedeveloped and not-developed world. By 2011, 78 percent Americans owned a vehicle, as compared to 1.8per cent in India (see Table 4.2: Car ownership). Thisis not going down, despite recession or concerns forclimate change. In 2014, nearly one million morevehicles were sold, as compared to 2013. These 16.5million vehicle sale of 2014 is expected to break newrecords in the coming years. Automobile analysts saythat there are a host of reasons for this growth: arebounding economy, increasing consumerconfidence, falling gas prices and easier finance.11
Public transport in cities: neglected in the USIn countries like India, large numbers of people use public transport —over 50 per cent on an average. They use this mode of transport becausethey are poor. The challenge here is to ensure that this often dilapidated,inconvenient and unsafe mode of transport is refurbished and mademodern so that even as people get richer, they continue to use it. InIndia’s case, public transport is marginalised, but not replaced.
In rich countries the car replaced public transport as the mode oftravel. But now, increasingly and largely driven by local air pollution,climate change and health concerns, there is a shift back towards publictransport. This has been done by deliberate policy measures and action.In countries, which compete with the US in terms of vehicle ownership,the track record of using public transport is better. This does mean thatrich countries can buy cars (indeed love their cars) and still take a bus, asubway or a bicycle to work.
For instance, in Germany, a country also fascinated by automobilesand autobahns, government policies to simultaneously promote publictransport and restrain cars through parking price and other measureshave led to a change in the way people drive. A 2012 paper by US
academics Ralph Buehler and John Pucher makes a fascinatingassessment of differences between Germany and US riding styles andhow these have changed, or not, through the years.12
The paper finds Germans are five times more likely than Americansto make a trip using public transport. Importantly, this trend is growing.Between 1945 and 2010, millions of trips per year by public transport andin terms of per capita are on the increase. But in the US, it is the reverse.While public transport trips per year are increasing very slowly, per capitatrips are declining. This is clearly worrying (see Graph 4.4: Publictransport trips — Germany and USA).
Indeed, Germany is not the best among European nations in terms ofpublic transport. Switzerland is. Comparison makes the US a complete
Country Motor vehicles per 1000people, (year 2011)
United States 786
Japan 588
Germany 588
China 69
Nigeria 31
India 18
Congo (Dem Rep) 5
Bangladesh 3
Table 4.2: Car ownership78 per cent Americans own a vehicle
Source: World Bank, data.worldbank.org/indicators, as viewed onSeptember 1, 2015
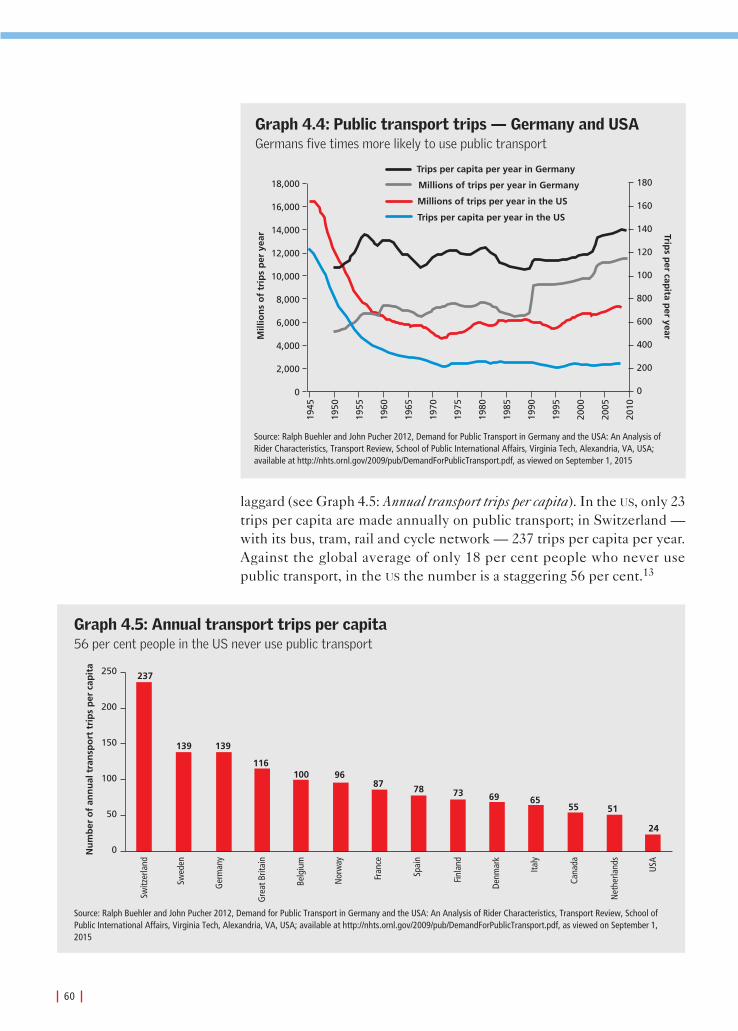
laggard (see Graph 4.5: Annual transport trips per capita). In the US, only 23trips per capita are made annually on public transport; in Switzerland —with its bus, tram, rail and cycle network — 237 trips per capita per year.Against the global average of only 18 per cent people who never usepublic transport, in the US the number is a staggering 56 per cent.13
60
250
200
150
100
50
0
24
516569
100116
139139
237
9687 78 73
55
Nu
mb
er o
f an
nu
al t
ran
spo
rt t
rip
s p
er c
apit
a
Switz
erla
nd
Swed
en
Ger
man
y
Gre
at B
ritai
n
Belg
ium
Nor
way
Fran
ce
Spai
n
Finl
and
Denm
ark
Italy
Cana
da
Net
herla
nds
USA
Graph 4.5: Annual transport trips per capita56 per cent people in the US never use public transport
Source: Ralph Buehler and John Pucher 2012, Demand for Public Transport in Germany and the USA: An Analysis of Rider Characteristics, Transport Review, School ofPublic International Affairs, Virginia Tech, Alexandria, VA, USA; available at http://nhts.ornl.gov/2009/pub/DemandForPublicTransport.pdf, as viewed on September 1,2015
18,000
16,000
14,000
12,000
10,000
8,000
6,000
4,000
2,000
0
180
160
140
120
100
800
600
400
200
0
Mill
ion
s o
f tr
ips
per
yea
r
1945
1950
1955
1960
1965
1970
1975
1980
1985
1990
1995
2000
2005
2010
Trips p
er capita p
er year
Trips per capita per year in Germany
Millions of trips per year in Germany
Millions of trips per year in the US
Trips per capita per year in the US
Graph 4.4: Public transport trips — Germany and USAGermans five times more likely to use public transport
Source: Ralph Buehler and John Pucher 2012, Demand for Public Transport in Germany and the USA: An Analysis ofRider Characteristics, Transport Review, School of Public International Affairs, Virginia Tech, Alexandria, VA, USA;available at http://nhts.ornl.gov/2009/pub/DemandForPublicTransport.pdf, as viewed on September 1, 2015
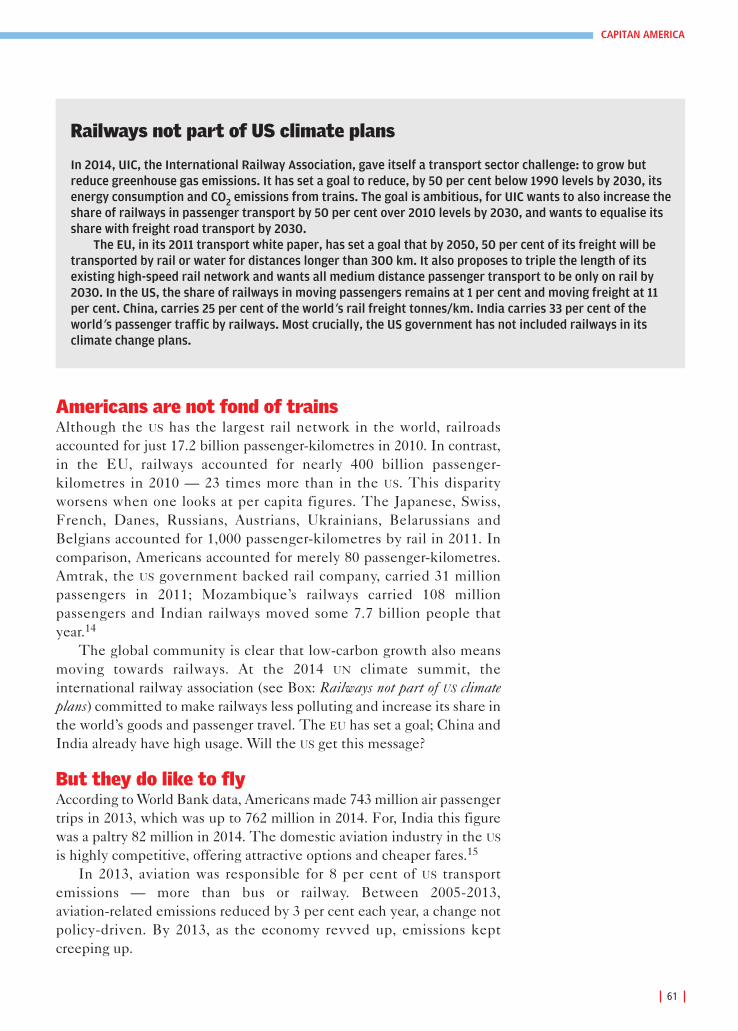
Americans are not fond of trains Although the US has the largest rail network in the world, railroadsaccounted for just 17.2 billion passenger-kilometres in 2010. In contrast,in the EU, railways accounted for nearly 400 billion passenger-kilometres in 2010 — 23 times more than in the US. This disparityworsens when one looks at per capita figures. The Japanese, Swiss,French, Danes, Russians, Austrians, Ukrainians, Belarussians andBelgians accounted for 1,000 passenger-kilometres by rail in 2011. Incomparison, Americans accounted for merely 80 passenger-kilometres.Amtrak, the US government backed rail company, carried 31 millionpassengers in 2011; Mozambique’s railways carried 108 millionpassengers and Indian railways moved some 7.7 billion people thatyear.14
The global community is clear that low-carbon growth also meansmoving towards railways. At the 2014 UN climate summit, theinternational railway association (see Box: Railways not part of US climateplans) committed to make railways less polluting and increase its share inthe world’s goods and passenger travel. The EU has set a goal; China andIndia already have high usage. Will the US get this message?
But they do like to fly According to World Bank data, Americans made 743 million air passengertrips in 2013, which was up to 762 million in 2014. For, India this figurewas a paltry 82 million in 2014. The domestic aviation industry in the US
is highly competitive, offering attractive options and cheaper fares.15
In 2013, aviation was responsible for 8 per cent of US transportemissions — more than bus or railway. Between 2005-2013, aviation-related emissions reduced by 3 per cent each year, a change notpolicy-driven. By 2013, as the economy revved up, emissions keptcreeping up.
61
CAPITAN AMERICA
Railways not part of US climate plans
In 2014, UIC, the International Railway Association, gave itself a transport sector challenge: to grow butreduce greenhouse gas emissions. It has set a goal to reduce, by 50 per cent below 1990 levels by 2030, itsenergy consumption and CO2 emissions from trains. The goal is ambitious, for UIC wants to also increase theshare of railways in passenger transport by 50 per cent over 2010 levels by 2030, and wants to equalise itsshare with freight road transport by 2030.
The EU, in its 2011 transport white paper, has set a goal that by 2050, 50 per cent of its freight will betransported by rail or water for distances longer than 300 km. It also proposes to triple the length of itsexisting high-speed rail network and wants all medium distance passenger transport to be only on rail by2030. In the US, the share of railways in moving passengers remains at 1 per cent and moving freight at 11per cent. China, carries 25 per cent of the world’s rail freight tonnes/km. India carries 33 per cent of theworld’s passenger traffic by railways. Most crucially, the US government has not included railways in itsclimate change plans.

Transporting goodsIn 2013, goods transport by road contributed 23 per cent of the sector’semissions, railways contributed only 3 per cent (including passengertravel) of the sector’s GHG emissions. The goods transport scenario isboth ridiculous and positive. A needless reliance on road (and, byextension, heavy vehicles) points to complete inefficiency in the waygoods transport is managed; at the same time, the amazing emissionsprofile of the railways shows an opportunity crying to be availed of. Therailway, however, is not part of the US plans for climate action.
Road vs railWhat are the options of moving 18.5 billion tonnes of freight, moved inthe US in 2007? So asks a 2013 study of the US department of energy(DOE), in its Transportation Energy Futures Series.17 The freightbusiness is measured in terms of the total tonnes of goods carried, howmany miles these tonnes are carried and what is the value of the goodstransported. In the US, 18.5 billion tonnes were generated, requiring 5.4 trillion tonne miles. The value of these goods was US $16.7 trillion.Trucks transported 72 per cent of all this freight, accounting for 42 per cent of tonne miles and 70 per cent of freight value. Railaccounted for only 11 per cent of tonnage moved, but 28 per cent of alltonne miles and 3.5 per cent of total value. The rest was made up by airand waterways.
In other words, railway was used to transport heavier, low-valuecommodities such as coal and grain over long distances. Trucks dominatethe market for shipments under 550 miles, which account for almost 80per cent of all domestic freight tonnage.
Energy used in these modes makes a crucial difference in climatechange. Energy used per tonne-mile of freight measured in BritishThermal Unit (Btu) is 30 for air, 4 for road trucking, 0.5 for water and 0.4for railways. Moving from truck to rail would bring down energy usedand reduce emissions — this is a no-brainer. The question is: how canthis be done? The DOE report recommends the following policies:
One, increase fuel tax. A diesel fuel tax will increase the cost oftrucking relative to rail. But given the huge advantage of cheap fuel, theauthors of this report conclude that even a doubling of diesel priceswould only increase rail tonnage by a few percentage points. Much morewould be needed.
Two, increase the cost of trucking via tolls and other user fees, andimpose a greenhouse gas pricing regulation to increase the cost oftrucking and so encourage a move to rail. But even this is not enough tochallenge the cost-effectiveness and consumer interest in trucks. DOE,therefore, also recommends other actions such as decreasing the driver’sservice hours and putting limits on the truck size and the weightage ofgoods that can be transported by road. It also stresses railways in the US
will only recover if there is substantial investment in freight rail corridors
62
23%Contribution to sectoral
emissions from goodstransport by road in 2013

63
CAPITAN AMERICA
Source: National Geographic Greendex Report 2014, http://environment.nationalgeographic.com/environment/greendex/, as viewed on September 1, 2015

and better services. Such measures, the report says, require a radicalincrease in public investment in rail.
This is the problem. Railways in US have always been greatlyneglected. By the early 20th century, trucking had already become thedominant mode of hauling freight and much of the railway industry wentbankrupt. In 1980, Congress deregulated the private-sector freighttransportation industry, which led to massive restructuring — firms were consolidated, routes and services redesigned and pricesslashed. Railways lost out.
The DOE says that the freight industry in the US is now “in the midst of another technological revolution”. Driven by computers andsatellite communication — now, companies can co-ordinate logistics,making the business more effective and further reduce the cost of freighttransport.
In this freight technological revolution, railway is losing out.Although the fuel efficiency of railways has increased by 20 per centsince 1980, yet the number of miles travelled by trucks has increasedeight-fold. This is when it has the advantage of lower operational costs.A look at the marginal cost per mile of operating a truck in early 2010reveals fuel cost was 31 per cent and driver labour was 36 per cent.Railways spend less on fuel — 18 per cent of its operational cost and so,it should be able to compete with trucks.
But railways require public investment in infrastructure. Trucks rideon roads the tax-payer pays for. There is no equivalent investment inrailway tracks. According to Association of American Railroads in 2013alone, states disbursed more than US $96 billion on capital outlays andhighway maintenance. Other expenses such as administration andplanning, law enforcement, interest, and grants to local governmentsbrings the total disbursement for highways, in 2013, to a staggering US
$152 billion. Even this is inadequate and given the growth of freight,highway investments will need to be increased.18
Ironically, even then the US is not moving rapidly to rail freight. Itincentivizes road travel. The federal diesel fuel tax, at US $0.244, hasremained unchanged for 20 years — drivers pay a fixed amountregardless of the cost of fuel. This is the fossil fuel subsidy the US
government wants developing countries to be weaned off. But the added problem is the changing nature of consumption in the
US. With the rapid growth of e-commerce, goods have to be transportedquickly and over shorter distances. The single driving day to meet on-time deliveries means that trucks are favoured over railways. In the shortdistance transport of good — up to 1,000 miles or 1,600 km trucks arewinning. In this situation, railways cannot grow or compete, argue US
analysts. The trucking business will grow. But this assertion isquestionable, given countries have built dense railway networks totransport goods, even over what could be considered a short distance. So,railways could be in. But it stays out.
64
20%Increase in fuel efficiency
of railways since 1980;the number of miles
travelled by trucks hasincreased eight-fold
in this period

No number control is the plan There is nothing to suggest — including the government’s climatechange plan — that the US takes the idea of public transport seriously.The entire policy focus is to improve air quality by making cars moreefficient. Nothing in its approach signifies that the US has recognised theneed for drastic emissions reduction, and so will design policies torestrain car and truck numbers and promote mass transit systems.
It is not that money is not available. It is just not the preferred plan ofaction of state governments across the country. NRDC researcher RobPerk, NDRC’s transportation advocacy director, writes in his blog that outof the US $53 billion in “flexible” transportation funding available from2007 to 2011, only about US $5 billion was used for urban public transit.19
With regard to rail transport, too, government policies have not beenso friendly. Most American passenger trains travel on tracks owned byfreight companies. That means most trains have to defer to freightservices, leading to lengthy delays and inconvenience for passengers.But road travel is heavily subsidised. And gasoline is cheaper in Americathan in Europe. And most major highways are toll free. And domestic airtravel, too, is cheap and popular.20
Such an imbalance in approach begins to look positively lopsidedconsidering the current US strategy of depending on fuel efficiencystandards to kick in 2025 is not just risky but also, by all evidence, highlyunlikely to bring gains at the scale EPA has projected. The country has todo much more to reduce its total emissions, and in this, the transportsector is already a major contributor and set to rise.
A 2011 report by the Pew Centre (now renamed Centre for Climateand Energy Solutions) finds that it is possible for US transport emissionsto be reduced by up to 65 per cent below 2010 levels by 2050, but only ifthe country adopts policies that include a shift to less carbon-intensivefuels, changing travel behaviour and moving to more efficient modes oftransport, like buses or rail.21 Interestingly, even this analysis underplaysthe advantage a shift in transport patterns could bring to the US. Instead,in the report’s high mitigation scenario, the emphasis is on fuel-shift —moving from gasoline to hydrogen, battery electric or advanced biofuels.
In terms of shifting to more energy efficient modes — rail or publictransport — the report is less sanguine. It simply says “moving passengerand freight movement to more efficient modes is well worth pursuingbut can be expected to yield only moderate reductions in GHG emissionsand fuel use”. The reason stated is that public transport supplies only 1 per cent total passenger miles in the US, and that it would be difficult toshift modes in goods transport because of the growing demand for just-in-time delivery and need for flexibility in trucking schedules to meetconsumer needs.
More interestingly, the same institute’s report on transportationstrategies for Shanghai says that car restraint and augmentation of publictransport are the only way to reduce carbon emissions.22 This sauce for
65
CAPITAN AMERICA
86%People travelling to workusing a car or a van in theUS — there has been nochange in this scenario overtwo decades
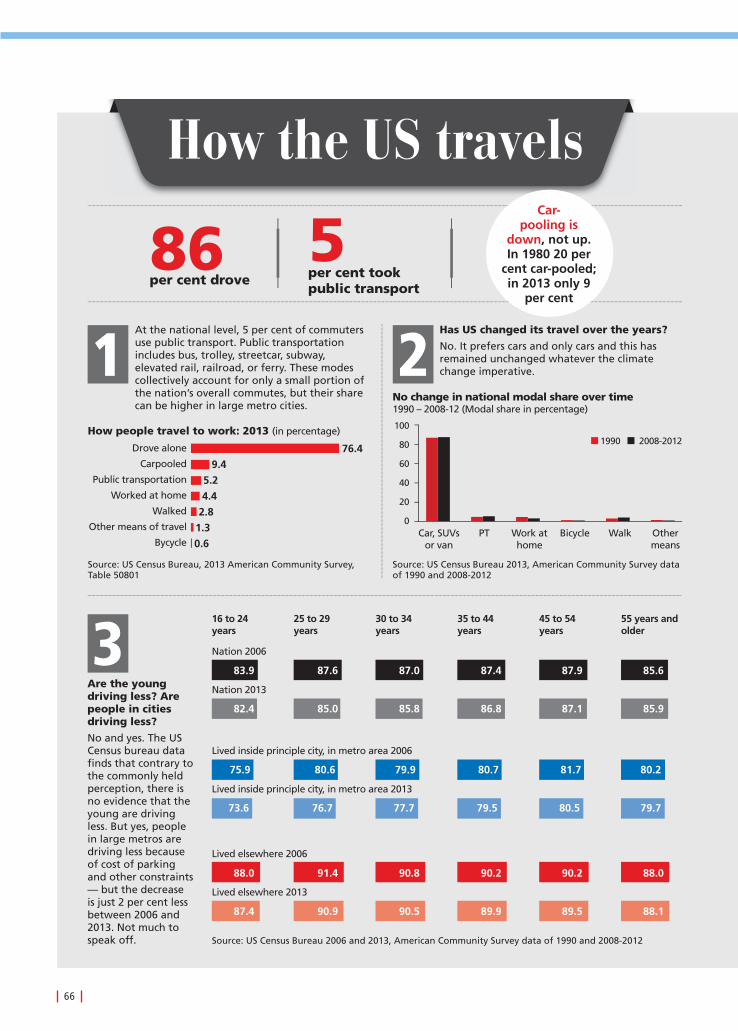
66
At the national level, 5 per cent of commuters use public transport. Public transportation includes bus, trolley, streetcar, subway, elevated rail, railroad, or ferry. These modes collectively account for only a small portion of the nation’s overall commutes, but their share can be higher in large metro cities.
Are the young driving less? Are people in cities driving less?
No and yes. The US Census bureau data finds that contrary to the commonly held perception, there is no evidence that the young are driving less. But yes, people in large metros are driving less because of cost of parking and other constraints — but the decrease is just 2 per cent less between 2006 and 2013. Not much to speak off.
Has US changed its travel over the years?
No. It prefers cars and only cars and this has remained unchanged whatever the climate change imperative.
How the US travels
Source: US Census Bureau, 2013 American Community Survey, Table 50801
Source: US Census Bureau 2013, American Community Survey data of 1990 and 2008-2012
Source: US Census Bureau 2006 and 2013, American Community Survey data of 1990 and 2008-2012
86 per cent drove
5 per cent took public transport
1
3
2
Car-pooling is
down, not up. In 1980 20 per
cent car-pooled; in 2013 only 9
per cent
How people travel to work: 2013 (in percentage)
No change in national modal share over time 1990 – 2008-12 (Modal share in percentage)
76.4
9.4
5.2
4.4
2.8
1.3
0.6
Drove alone
Carpooled
Public transportation
Worked at home
Walked
Other means of travel
elcycyB
16 to 24 years
25 to 29 years
30 to 34 years
35 to 44 years
45 to 54 years
55 years and older
Car, SUVs or van
PT Work at home
Bicycle Walk Other means
100
80
60
40
20
0
1990 2102-8002
Nation 2006
Nation 2013
Lived inside principle city, in metro area 2006
Lived inside principle city, in metro area 2013
Lived elsewhere 2006
Lived elsewhere 2013
83.9
88.0
75.9
82.4
87.4
73.6
87.6
91.4
80.6
85.0
90.9
76.7
87.0
90.8
79.9
85.8
90.5
77.7
87.4
90.2
80.7
86.8
89.9
79.5
87.9
90.2
81.7
87.1
89.5
80.5
85.6
88.0
80.2
85.9
88.1
79.7

67
CAPITAN AMERICA
Note: Numbers are rounded. See Appendix table 4 for estimates and margins of error.
Source: US Census Bureau 2006 and 2013, American Community Survey data of 1990 and 2008-2012
Who is car-pooling? Who prefers to drive alone
It is the Hispanic, Asian and Black populations who car-pool — a fact clearly related to income. White population drives alone.
Is public transport growing in cities?
Greater San Francisco registered the largest decline in automobile commuting of any metro between 2006 and 2013 — but only by 4 per cent. Greater Boston saw car-commuting decline by 3.3 per cent. New York reduced by 2 per cent; However, New York, with its density, high levels of congestion, and extensive transit and rail system remains the metro where the smallest share of workers get to work by car (57 per cent). In other cities, the percentage of car-commute is higher — over 75 per cent in cities like Washington DC to San Francisco and up to 80 per cent in Chicago.
4
5
Rates of driving alone and car-pooling by race and ethnicity: 2006 and 2013 (in percentage)
Metro areas among those with the lowest rates of automobile commuting and their second most common commute mode: 2013
Driving alone Carpooling65 13
67 9
71 11
80 14
71 19
69 11
67 8
72 9
80 13
71 15
Hispanic
Asian
Black
White
rehtO
Hispanic
Asian
Black
White
rehtO
Source: US Census Bureau 2006 and 2013, American Community Survey data of 1990 and 2008-2012
2006 2013

the goose is certainly not meant for the gander. What is clear is that the issue of restraining the growth of vehicle
miles travelled needs to be built into policy. Over 86 per cent peopletravel to work using a car or a van; there has been no change in thisscenario over two decades. Even in metros, people are driving lessbecause of congestion and parking costs, but only marginally less. Thedecrease is just 2 per cent between 2006 and 2013. Most cities depend oncars to commute — in Washington DC over 75 per cent use a car to go towork. New York is the country’s outlier, but here, too, 57 per cent are by-car commuters. This is not surprising given that the cost of fuel remainslow and there is no driver for change.
What is needed is deliberate policy intervention to move people, notcars. But for now, US love affair with only cars is not over. Not at all.
68
More cars in a household means more emissions
The US Energy Information Administration points out the obvious, but with a twist — households withmore vehicles not only travel more, but often put more miles on their most-used vehicle compared tohouseholds with fewer vehicles. In the US, 58 per cent households have more than one car — and 22 percent have three cars and more. But what is not so obvious is that households with more than one car alsouse their most-used vehicle more. And they just drive more. Much more.1
Miles per year Percent of households
10,600 32%
23,700 36%
33,900 14%
43,600 5%
49,300 2%
57,700 1%
9% without a vehicle0 20,000 40,000 60,000
Average annual vehicle miles of travel per household
One
Two
Three
Four
Five
Six
Nu
mb
er o
f ve
hic
les
per
ho
use
ho
ld
Most-used vehicle 2nd vehicle 3rd
Source: EIA 2015, Households with more vehicles travel more, April http://www.eia.gov/todayinenergy/detail.cfm?id=20832, as viewed on September 1, 2015
69
CAPITAN AMERICA

70
● Residential and commercial sector accounts for 12per cent of US greenhouse gas emissions. Between1990 and 2013, CO2 emissions have increased by28 per cent.
● This sector also accounts for 41 per cent of allenergy consumed in the US. It is not expected toreduce.
● The size of the building determines energy consumption. And each generation of Americans isbuilding bigger. In commercial buildings, averagesize in the 1960s was 12,000 sq feet, which grewto 19,000 sq ft in 2000-2012.
● While in the 1970s-1980s, people built 1,800 sq fthomes, in the year 2000 the size has increased towell over 2,400 sq ft. In comparison, an averagesize house in Japan measures 1,420 sq ft, 818 sq ft in UK and 645 sq ft in China.
● Energy consumption in homes has gone up, butthe proportion used for space heating or cooling is down. The use of electricity for appliances, electronics and lighting has gone up significantly.
● US strategy to reduce energy in this sector hasbeen to make improvements via building codesand appliance standards.

In 2013, the residential and commercial sector accounted for roughly 12per cent of US greenhouse gas emissions.1 The Environment ProtectionAgency (EPA) calculates emissions from this sector as those that comefrom heating, cooking needs, management of waste and wastewater andleaks of refrigerants from homes and businesses. The emissions inve n -tory does not include emissions from generation of power that is used inhomes or businesses, only what is consumed. For our analysis we haveconsidered the building sector only. According to the US EnergyInformation Administration (EIA) in 2014, buildings — homes, offices,malls and factories — accounted for about 41 per cent of all energy consumed in the US.2
The EPA reports that emissions from the building sector are up, notdown. Between 1990 and 2013, carbon dioxide (CO2) emissions fromhomes and businesses have increased by 28 per cent (see Graph 5.1:Emissions from homes and businesses).3 The growth is led by indirect emis-sions from the lighting, heating, air conditioning and appliances homesand businesses use. Direct emissions — from fireplaces and burning offuel in homes — have increased by 1 per cent in the same period. And ifat all there is a fluctuation in emissions quantum, it is because of short-term changes caused by weather conditions: colder or hotter seasonsrequire more heating or cooling (see Box: A degree above or below).
71
CAPITAN AMERICA
5. Buildings Building sizes are growing, and so therefore, is the energy consumption
3,000
2,500
2,000
1,500
1,000
500
0
Direct emissions
Indirect emissions from electricity
Total emissions
GH
G e
mis
sio
ns
(mill
ion
met
ric
ton
nes
CO
2 eq
)
1990
1991
1992
1993
1994
1995
1996
1997
1998
1999
2000
2001
2002
2003
2004
2005
2006
2007
2008
2009
2010
2011
2012
2013
Graph 5.1: Emissions from homes and businessesCO2 emissions have increased by 28 per cent between 1990 and 2013
Source: EPA Commercial and Residential Sector Emissions available athttp://epa.gov/climatechange/ghgemissions/sources/commercialresidential.html, as viewed on August 31, 2015

Commercial sector: growing in sizeThe EIA defines a commercial building as one bigger than 1,000 squarefeet (sq ft) and devoting more than 50 per cent of its floor area to activi-ties that are not residential, agricultural or industrial. Its 2015Commercial Building Energy Consumption Survey says there were 5.6million commercial buildings in the US in 2012, comprising 87.4 billion sqft of floor space, an increase of 14 per cent in building numbers and 21 per cent in floor area as compared to 2003.4
The size of a building is key to how much energy it will consume. EIA
finds that between 1979 and 2012, the size of buildings outpaced theincrease in ‘building stock’ — the number of buildings constructed (seeGraph 5.4: Average commercial building sizes). While the number of com-mercial buildings increased from 3.8 million to 5.6 million, commercialfloor space increased from 51 billion sq ft to 87 billion sq ft. “A growing
72
A degree above or belowColder and hotter seasons increase electricity use, and this is in turn leads to fluctuations in emissions fromresidential and commercial buildings as people crank up the heating or air-conditioning. The EPA defines heating degree days as those below or above 65°F (18°C).
Source: EPA Commercial and Residential Sector Emissions available at http://epa.gov/climatechange/ghgemissions/sources/commercialresidential.html, as viewed onAugust 31, 2015
1950
1950
1954
1956
1958
1960
1962
1964
1966
1968
1970
1972
1973
1975
1977
1979
1981
1983
1985
1987
1989
1991
1993
1995
1997
1999
2001
2003
2005
2007
2009
2011
2013
Normal (4,524 heatingdegree days)
99% confidence
Ind
ex n
orm
al =
100
(Dev
iati
on
fro
m n
orm
al
Graph 5.2: Annual deviations from normal heating degree days (1950-2013)
Graph 5.3: Annual deviations from normal cooling degree days (1950-2013)
20
10
0
–10
–20
1950
1950
1954
1956
1958
1960
1962
1964
1966
1968
1970
1972
1973
1975
1977
1979
1981
1983
1985
1987
1989
1991
1993
1995
1997
1999
2001
2003
2005
2007
2009
2011
2013
99% confidence
Ind
ex n
orm
al =
100
(Dev
iati
on
fro
m n
orm
al 30
20
10
0
–10
–20
Normal (1,242 coolingdegree days)
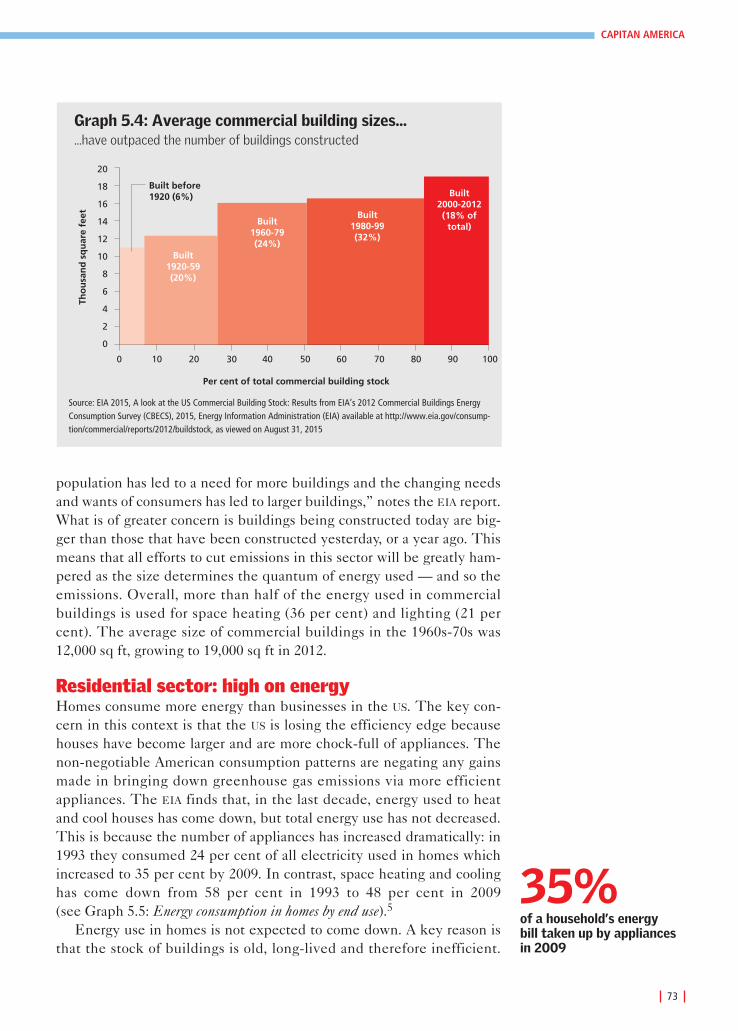
population has led to a need for more buildings and the changing needsand wants of consumers has led to larger buildings,” notes the EIA report.What is of greater concern is buildings being constructed today are big-ger than those that have been constructed yesterday, or a year ago. Thismeans that all efforts to cut emissions in this sector will be greatly ham-pered as the size determines the quantum of energy used — and so theemissions. Overall, more than half of the energy used in commercialbuildings is used for space heating (36 per cent) and lighting (21 percent). The average size of commercial buildings in the 1960s-70s was12,000 sq ft, growing to 19,000 sq ft in 2012.
Residential sector: high on energyHomes consume more energy than businesses in the US. The key con-cern in this context is that the US is losing the efficiency edge becausehouses have become larger and are more chock-full of appliances. Thenon-negotiable American consumption patterns are negating any gainsmade in bringing down greenhouse gas emissions via more efficientappliances. The EIA finds that, in the last decade, energy used to heatand cool houses has come down, but total energy use has not decreased.This is because the number of appliances has increased dramatically: in1993 they consumed 24 per cent of all electricity used in homes whichincreased to 35 per cent by 2009. In contrast, space heating and coolinghas come down from 58 per cent in 1993 to 48 per cent in 2009 (see Graph 5.5: Energy consumption in homes by end use).5
Energy use in homes is not expected to come down. A key reason isthat the stock of buildings is old, long-lived and therefore inefficient.
73
CAPITAN AMERICA
Graph 5.4: Average commercial building sizes......have outpaced the number of buildings constructed
Source: EIA 2015, A look at the US Commercial Building Stock: Results from EIA’s 2012 Commercial Buildings EnergyConsumption Survey (CBECS), 2015, Energy Information Administration (EIA) available at http://www.eia.gov/consump-tion/commercial/reports/2012/buildstock, as viewed on August 31, 2015
20
18
16
14
12
10
8
6
4
2
0
Built before1920 (6%)
Built1920-59(20%)
Built1960-79(24%)
Built1980-99(32%)
Built 2000-2012(18% of
total)
Per cent of total commercial building stock
0 10 20 30 40 50 60 70 80 90 100
Tho
usa
nd
sq
uar
e fe
et
35%of a household’s energy bill taken up by appliancesin 2009
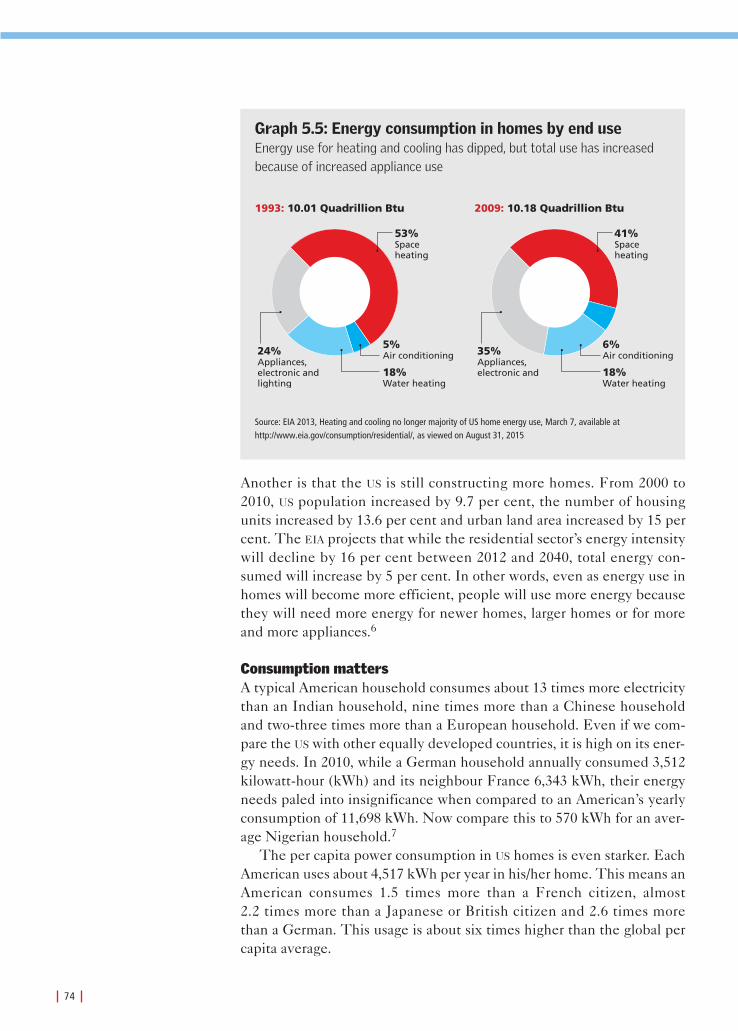
74
53%Space heating
41%Space heating
5%Air conditioning
6%Air conditioning
18%Water heating
18%Water heating
24%Appliances, electronic and lighting
1993: 10.01 Quadrillion Btu 2009: 10.18 Quadrillion Btu
35%Appliances, electronic and
Another is that the US is still constructing more homes. From 2000 to2010, US population increased by 9.7 per cent, the number of housingunits increased by 13.6 per cent and urban land area increased by 15 percent. The EIA projects that while the residential sector’s energy intensitywill decline by 16 per cent between 2012 and 2040, total energy con-sumed will increase by 5 per cent. In other words, even as energy use inhomes will become more efficient, people will use more energy becausethey will need more energy for newer homes, larger homes or for moreand more appliances.6
Consumption matters A typical American household consumes about 13 times more electricitythan an Indian household, nine times more than a Chinese householdand two-three times more than a European household. Even if we com-pare the US with other equally developed countries, it is high on its ener-gy needs. In 2010, while a German household annually consumed 3,512kilowatt-hour (kWh) and its neighbour France 6,343 kWh, their energyneeds paled into insignificance when compared to an American’s yearlyconsumption of 11,698 kWh. Now compare this to 570 kWh for an aver-age Nigerian household.7
The per capita power consumption in US homes is even starker. EachAmerican uses about 4,517 kWh per year in his/her home. This means anAmerican consumes 1.5 times more than a French citizen, almost 2.2 times more than a Japanese or British citizen and 2.6 times more than a German. This usage is about six times higher than the global percapita average.
Graph 5.5: Energy consumption in homes by end useEnergy use for heating and cooling has dipped, but total use has increasedbecause of increased appliance use
Source: EIA 2013, Heating and cooling no longer majority of US home energy use, March 7, available athttp://www.eia.gov/consumption/residential/, as viewed on August 31, 2015
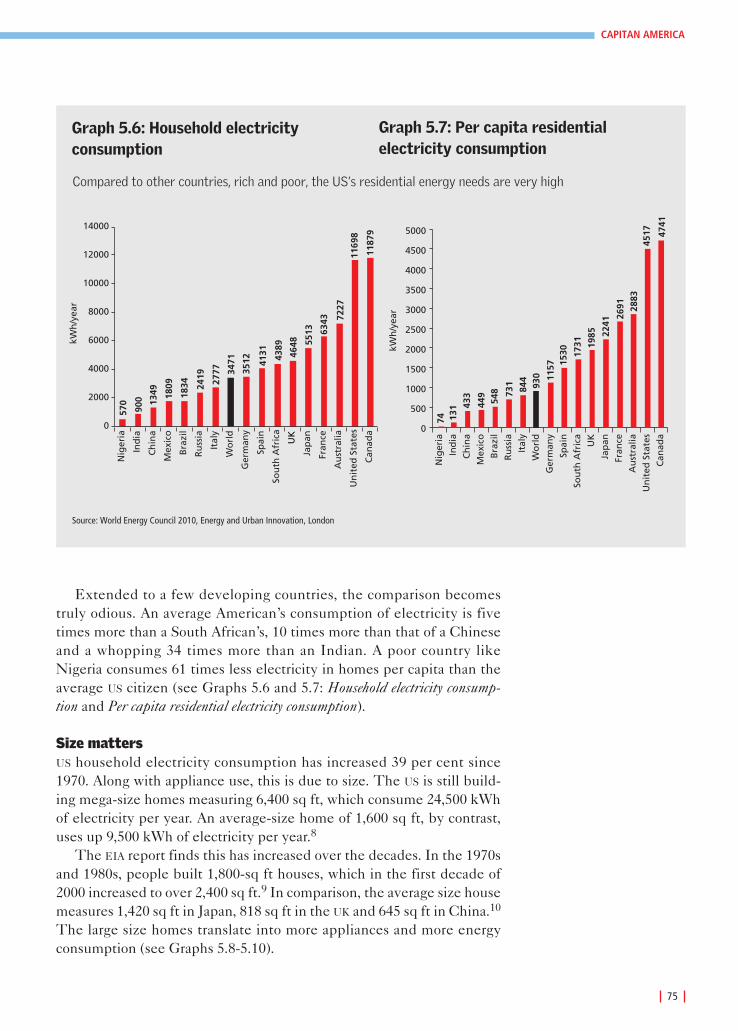
75
CAPITAN AMERICA
570
900 13
49
1809
1834
2419
2777
3471
3512
4131
4389
4648
5513
6343
7227
1169
8
1187
9
0
2000
4000
6000
8000
10000
12000
14000
Nig
eria
Ind
ia
kWh
/yea
r
Ch
ina
Mex
ico
Bra
zil
Ru
ssia
Ital
y
Wo
rld
Ger
man
y
Spai
n
Sou
th A
fric
a
UK
Jap
an
Fran
ce
Au
stra
lia
Un
ited
Sta
tes
Can
ada
Graph 5.6: Household electricity consumption
74
131 43
3
449
548 73
1
844
930 11
57
1530
1731
1985
2241
2691
28
83
4517
4741
0
500
1000
1500
2000
2500
3000
3500
4000
4500
5000
Nig
eria
Ind
ia
Ch
ina
Mex
ico
Bra
zil
Ru
ssia
Ital
y
Wo
rld
Ger
man
y
Spai
n
Sou
th A
fric
a
UK
Jap
an
Fran
ce
Au
stra
lia
Un
ited
Sta
tes
Can
ada
kWh
/yea
r
Graph 5.7: Per capita residential electricity consumption
Source: World Energy Council 2010, Energy and Urban Innovation, London
Compared to other countries, rich and poor, the US’s residential energy needs are very high
Extended to a few developing countries, the comparison becomestruly odious. An average American’s consumption of electricity is fivetimes more than a South African’s, 10 times more than that of a Chineseand a whopping 34 times more than an Indian. A poor country likeNigeria consumes 61 times less electricity in homes per capita than theaverage US citizen (see Graphs 5.6 and 5.7: Household electricity consump-tion and Per capita residential electricity consumption).
Size matters US household electricity consumption has increased 39 per cent since1970. Along with appliance use, this is due to size. The US is still build-ing mega-size homes measuring 6,400 sq ft, which consume 24,500 kWhof electricity per year. An average-size home of 1,600 sq ft, by contrast,uses up 9,500 kWh of electricity per year.8
The EIA report finds this has increased over the decades. In the 1970sand 1980s, people built 1,800-sq ft houses, which in the first decade of2000 increased to over 2,400 sq ft.9 In comparison, the average size housemeasures 1,420 sq ft in Japan, 818 sq ft in the UK and 645 sq ft in China.10
The large size homes translate into more appliances and more energyconsumption (see Graphs 5.8-5.10).

76
Electricity consumed at home by 1 American =
1.5 x citizen of France
2.2 x citizen of Japan
2.2 x citizen of the UK
2.6 x citizen of Germany
5 x citizen of South Africa
10 x citizen of China
34 x citizen of India
61 x citizen of Nigeria
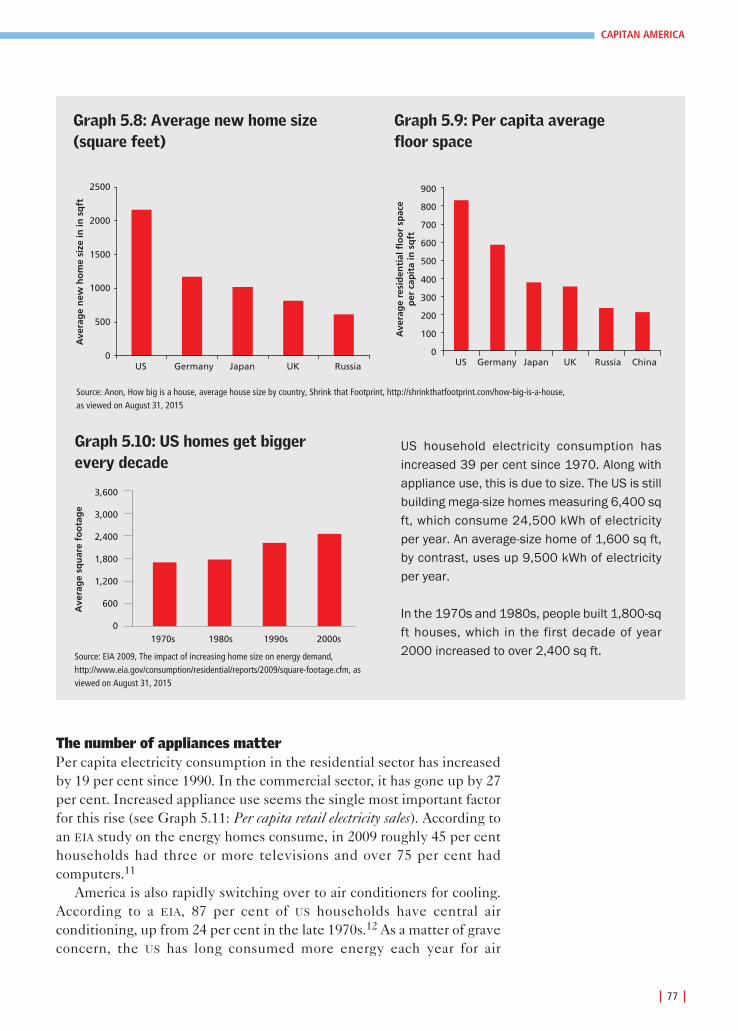
77
CAPITAN AMERICA
Ave
rag
e re
sid
enti
al f
loo
r sp
ace
per
cap
ita
in s
qft
0
100
200
300
400
500
600
700
800
900
US Germany Japan UK Russia China
Graph 5.9: Per capita average floor space
Ave
rag
e n
ew h
om
e si
ze in
in s
qft
0
500
1000
1500
2000
2500
US Germany Japan UK Russia
Graph 5.8: Average new home size(square feet)
Source: Anon, How big is a house, average house size by country, Shrink that Footprint, http://shrinkthatfootprint.com/how-big-is-a-house, as viewed on August 31, 2015
The number of appliances matterPer capita electricity consumption in the residential sector has increasedby 19 per cent since 1990. In the commercial sector, it has gone up by 27per cent. Increased appliance use seems the single most important factorfor this rise (see Graph 5.11: Per capita retail electricity sales). According toan EIA study on the energy homes consume, in 2009 roughly 45 per centhouseholds had three or more televisions and over 75 per cent had computers.11
America is also rapidly switching over to air conditioners for cooling.According to a EIA, 87 per cent of US households have central air conditioning, up from 24 per cent in the late 1970s.12 As a matter of graveconcern, the US has long consumed more energy each year for air
Source: EIA 2009, The impact of increasing home size on energy demand,http://www.eia.gov/consumption/residential/reports/2009/square-footage.cfm, asviewed on August 31, 2015
3,600
3,000
2,400
1,800
1,200
600
01970s 1980s 1990s 2000s
Ave
rag
e sq
uar
e fo
ota
ge
Graph 5.10: US homes get bigger every decade
US household electricity consumption hasincreased 39 per cent since 1970. Along withappliance use, this is due to size. The US is stillbuilding mega-size homes measuring 6,400 sqft, which consume 24,500 kWh of electricityper year. An average-size home of 1,600 sq ft,by contrast, uses up 9,500 kWh of electricityper year.
In the 1970s and 1980s, people built 1,800-sqft houses, which in the first decade of year2000 increased to over 2,400 sq ft.
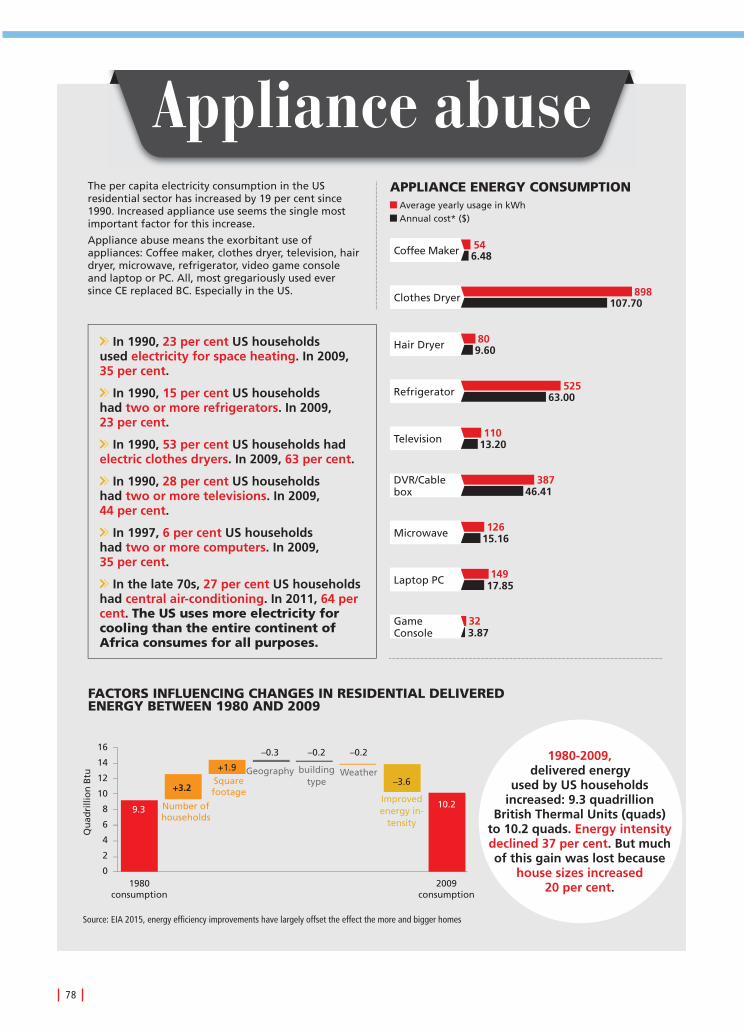
78
Appliance abuse
FACTORS INFLUENCING CHANGES IN RESIDENTIAL DELIVERED ENERGY BETWEEN 1980 AND 2009
APPLIANCE ENERGY CONSUMPTIONThe per capita electricity consumption in the US residential sector has increased by 19 per cent since 1990. Increased appliance use seems the single most important factor for this increase.
Appliance abuse means the exorbitant use of appliances: Coffee maker, clothes dryer, television, hair dryer, microwave, refrigerator, video game console and laptop or PC. All, most gregariously used ever since CE replaced BC. Especially in the US.
In 1990, 23 per cent US households used electricity for space heating. In 2009, 35 per cent.
In 1990, 15 per cent US households had two or more refrigerators. In 2009, 23 per cent.
In 1990, 53 per cent US households had electric clothes dryers. In 2009, 63 per cent.
In 1990, 28 per cent US households had two or more televisions. In 2009, 44 per cent.
In 1997, 6 per cent US households had two or more computers. In 2009, 35 per cent.
In the late 70s, 27 per cent US households had central air-conditioning. In 2011, 64 per cent. The US uses more electricity for cooling than the entire continent of Africa consumes for all purposes.
1980-2009, delivered energy
used by US households increased: 9.3 quadrillion
British Thermal Units (quads) to 10.2 quads. Energy intensity declined 37 per cent. But much of this gain was lost because
house sizes increased 20 per cent.
Average yearly usage in kWh Annual cost* ($)
Coffee Maker 546.48
Clothes Dryer 898107.70
Hair Dryer 809.60
Refrigerator 52563.00
Television 11013.20
DVR/Cable box
38746.41
Microwave 12615.16
Laptop PC 14917.85
Game Console
323.87
Source: EIA 2015, energy efficiency improvements have largely offset the effect the more and bigger homes
Number ofhouseholds
Squarefootage+3.2

conditioning than the rest of the world combined.In fact, the US uses more electricity for coolingthan the entire continent of Africa, home to a bil-lion people, consumes for all purposes. In sharpcontrast, a 2008 Mintel report found that just 0.5per cent of houses and flats in the UK had anykind of air conditioning.13
The ‘peak’ energy consumption on hotterdays — a typical home consumes 20-30 per centmore electricity overall on the hottest days, rela-tive to an average summer day — comes at anoth-er cost. During this time when ACs are eating upenergy, the extra energy is provided by powerplants called ‘peaker plants’ which are otherwiseidle and shudder to life only when demandpeaks. These plants are old and inefficient, and consume high energy and generate high emissions.14
Since electricity rates have remained stable,the spike in energy use is obviously due to appli-ances. For instance, among other utility items,clothes dryers use maximum energy. In the US, 85 per cent householdsown tumble dryers, as compared to 57 per cent in the UK. In many coun-tries people hang-dry clothes, a practice not popular in US. In fact, in theUS, many states have banned the use of outdoor drying. An energy-fool-ish decision, for according to Opower, a blog on innovative energy solu-tions, drying of clothes accounts for 6 per cent of the country’s energybills and costs roughly US $9 billion annually.15
Policies for buildings: enough to bend the curve? What is the US government doing to reduce emissions from the residen-tial and commercial building sector?
US policy has been to nudge improvements via building codes andappliance standards. While building codes are enacted at the state level,the Federal government sets efficiency standards and mandatorylabelling for appliances. This is complemented with rating schemes(which certify buildings) and incentives from the Federal government,states and even utilities for improved efficiencies.16
In his first term, President Obama introduced appliance efficiencystandards for nearly 40 products, announced a scheme for ‘weatherising’more than one million homes, and recognised superior energy savingsacross more than 65 product categories. In 2011, the Obama administra-tion prioritised commercial buildings and pledged to make them 20 percent more efficient by 2020. An executive order states a goal to design allnew federal buildings to achieve net zero emissions, but 2020 onwards.Other goals are to reduce energy use in residential homes by 30-50 per cent
79
CAPITAN AMERICA
1990
1992
1994
1996
1998
2000
2002
2004
2006
2008
2010
2012
2014
5000
4000
3000
2000
1000
0
Elec
tric
ity
sale
s (k
Wh
)
Residential sectorCommercial sector
Graph 5.11: Per capita retail electricity salesConsumption has increased in both sectors, mainlydue to appliance use
Source: Graph generated by the Centre for Science and Environment, based onEnergy Information Administration dataset.

relative to 2009 for new buildings and relative to current energy use forexisting buildings. But no dates are specified for these goals.
In President Obama’s Climate Action Plan announced in June 2013,the Department of Energy set a goal to reduce carbon emissions by 3 bil-lion metric tonnes cumulatively by 2030, combining standards for appli-ances and federal buildings (set in the President’s first and second terms)with energy conservation standards.
Are the measures, taken through local enforcement of building codesand stricter appliance standards, enough to reduce emissions in thisgrowth area? The past decade’s experience shows clearly that all the sub-stantial gains made in reducing the energy intensity of appliances orimproving building insulation and design have been lost because ofincreased consumption. The EIA report for the past decade shows clearlyhow the gains in energy efficiency are being squandered away because ofnewer and bigger houses and growing number of appliances. Between1980 and 2009, delivered energy used by US households increased from9.3 quadrillion British Thermal Units (quads) to 10.2 quads — anincrease of 9 per cent. Although, in the same period, energy intensitydeclined by as much as 37 per cent, all the gain was lost because morehouses were built and house sizes increased by 20 per cent; at the sametime, people bought many more and larger appliances.17 So, why wouldanything change now?
How change is made: China and Germany vs USA 2013 report by Climate Policy Initiative compares building energy effi-ciency in China, Germany and the US. It finds that total energy con-sumption in German residential and commercial buildings fell between1996 and 2008.18 Most dramatically, the use of energy for space heatingdecreased significantly. This occurred because of government policiestargeted at retrofitting thermal envelopes and replacing heating systemsalong with drastic improvement in appliance standards. Also, unlike inthe US, in Germany electricity price has increased, and has become amajor driver in improving efficiency and demand.
The reduction in Germany’s emissions is not accidental. It is drivenby clear policy. Its 2010 German Energy Concept policy has specifiednational efficiency goals, including an ambitious target of 80 per cent pri-mary energy demand reduction, by 2050, for the buildings sector. Mid-term goals include reducing heating demand by 20 per cent by 2020;ensuring all new buildings are climate neutral by 2020; and increasingthe thermal retrofit rate to 2 per cent. Japan has specified an energy effi-ciency target of 30 per cent by 2030 for this sector.19
Moreover, German policy is not voluntary — like the rating of thebuilding sector in the US. The Energy Saving Ordinance includes an ener-gy efficiency building code which mandates a standard for primary ener-gy use in each building. It allows building owners to use a combination ofinsulation, heating and ventilation systems to achieve this standard. The
80
1980: 9.3 2009: 10.2
Energy used by US households (in quads)

code also sets a requirement for maximum heat loss. This is incentivisedby preferential loans to buildings that surpass the standard.
Germany has also introduced policies to promote integrated renew-able energy in space heating — its renewable energy act sets a minimumstandard for renewable heat production in new buildings.
In the case of the US, in contrast, energy consumption in residentialbuildings has gone up between 1998 and 2008. Unlike Germany, wherespace heating is dramatically down, in the US it has remained constant.This shows efficiency gains in the US have been lost because larger floorareas were built. Or, gains were not substantial in the first place becausebuilding codes remain voluntary and weak. What is worrying is that allother energy use has gone up — from air conditioning to electronics.This means gains from improvement in appliance standards have, again,been negated by increasing use.
The US building energy efficiency codes and enforcement still lagsbehind other countries. A report by the American Council for EnergyEfficient Economy compares the building efficiency standards of differ-ent countries and finds that the US is below most countries when it comesto setting building codes and enforcement of standards20 (see Table 5.1:Building efficiency standards of different countries).
The 2013 CPI paper that compares China, Germany and the US
clearly establishes that the US is both massive in its energy consumptionin this sector, but also that its policy to reduce emissions is weak and inadequate. There are also ‘behaviour’ issues — driven by price and
81
CAPITAN AMERICA
Table 5.1: Building efficiency standards of different countriesThe US building energy efficiency codes and enforcement still lags behind other countries
Source: American Council for Energy Efficient Economy, 2014.
Building enrgy Technical Technical Enforcement Enforcement Totalcodes requirement in requirement mechanisms mechanisms points
residential in commercial for residential for commercial
China 3.5 1.5 1.25 3 3 12.25
Australia 4 1.75 1.5 2 2 11.25
South Korea 4 1.75 1.5 2 2 11.25
United Kingdom 4 1.75 1.5 2 2 11.25
France 4 1.5 1.25 2 2 10.75
Canada 3 1.5 1.25 2 2 9.75
Spain 4 1.75 1.5 1 1 9.25
United States 3 1.25 1 2 2 9.25
Germany 3.5 1.75 1.5 0 1 7.75
Russia 3 1 0.75 2 1 7.75
India 2 0 1.5 2 2 7.5
Brazil 0 0 0 3 3 6
Japan 3.5 1.25 1.25 0 0 6

82
Germany has worked to bring its home and office energy use down — unlike the US
Germany 1–US 0 (own goal)
Germany
2500
2000
1500
1000
500
0
Bu
ildin
g e
ner
gy
con
sum
pti
on
by
end
use
(Ex
ajo
ule
s)
Residential building (1996-2008)
1996 2008
Space heating Lighting
Total energy consumption (Exajoules)
1996
3,913
2008
3,486
Germany
1000
500
0
Cooking Water heatin g
Commercial building (1996-2008)
1996 2008
Total energy consumption (Exajoules)
1996
2,534
2008
2,428
Space cooling Refrigeration
7000
6000
5000
4000
3000
2000
1000
0
US
Residential building (1998-2008)
1998 2008
Total energy consumption (Exajoules)
1998
19,811
2008
22,722
MechanicalElectronic s Other
US
7000
6000
5000
4000
3000
2000
1000
0
Total energy consumption (Exajoules)
1998
16,249
2008
18,064
Commercial building (1998-2008)
1998 2008

affordability triggers in many cases — that make each country’s story different and better.
The paper finds, for instance, that Chinese residential buildings arekept colder in winter and warmer in summer as compared to those in theUS (see Graph 5.12: Comparing temperatures at which the US and China switchon heating and cooling). This behaviour is related to price — US electricityprices relative to income are very low and have remained so. In China,the ratio of price to income was high in the past, but is now steadilyfalling as people get richer. In Germany, where space heating is reducing— the price of energy to per capita income is relatively constant, but ismore than twice that of the US. This acts as a deterrent along with poli-cies that drive the change. So, in these trends, Chinese householdswould be expected to consume more energy as incomes rise, unless, likein Germany, deliberate efforts are made to curtail that use.
The CPI paper also finds that China’s energy consumption in residen-tial buildings increased, between 1996 and 2008, from 2,158 exajoules to6,562 exajoules — but its base is low. In comparison, energy consump-tion in residential buildings in the US in 2008 is 22,722 exajoules — overthree times more than China’s.21
83
CAPITAN AMERICA
HugeEnergy consumption of theUS in this sector
WeakPolicies to reduce emissions
Graph 5.12: Comparing temperatures at which the US and China switch on heating and coolingChinese residential buildings are kept colder in winter and warmer in summer as compared to those in the US
Source: Hermann Amecke, Jeff Deason, Andrew Hobbs et al 2013, Building energy efficiency in China, Germany and the United States, Climate Policy Initiative assessedat http://climatepolicyinitiative.org/wp-content/uploads/2013/04/Buildings-Energy-Efficiency-in-China-Germany-and-the-United-States.pdf
Summer set temperature
Shar
e o
f su
rvey
ed b
uild
ing
s
US
China
75%
50%
25%
0%
China
US
Winter set temperature
<20°C 22°C 24°C 26°C 28°C >29°C <16°C 18°C 20°C 22°C >22°C

Clearly, the US strategy of relying entirely on energy efficiency is notadding up. It needs to set ambitious national goals for this sector — tar-gets for energy use, emissions and floor space control. And goals that areenforceable and can be strictly monitored. But all this will not be enoughif it does not look at how it can change consumer behaviour so that whatthe consumer does reflects the cost to the Planet. Currently, all behav-iour in the US is driven by the fact that the price of energy is kept con-stant and low — it leads to change that is meaningless.
84

CAPITAN AMERICA
85

86
● In 2013, the US industrial sector accounted for 20per cent of total US greenhouse gas emissions.
● Emissions and energy consumption has declined inthis sector — the reason could be the shift in USeconomy from manufacturing to services.
● Consumption of goods has increased, but the US isnot making these goods. Instead, it hasoutsourced their manufacture to other countries.This means industrial emissions have not gonedown, but merely been outsourced.
● In terms of value, more than half of the goodsconsumed in the US is imported. In the last 15years, imports of energy-intensive industrialsupplies and materials (cement, steel, chemicalsetc) have more than tripled.
● Cement is the most intensive energy consumingsector in the US, and contributes significantly toemissions. The industry continues to grow, and hasset a very unambitious target.
● The oil and gas industry is a major contributor tomethane emissions: 29 per cent of US's total. Thesector is responsible for considerably more GHGpollution than was previously believed.
● The US iron and steel industry has managed toreduce its emissions, but it can do much more.

The US industrial sector was responsible for 20per cent of total US greenhouse gas (GHG)emissions in 2013. It is the only sector whereenergy consumption as well as carbon dioxide(CO2) emissions have declined. Between 1990 and2013, the sector’s emissions declined 12.3 percent.1 However, the reduction may well berelated to structural changes in the US economy,which has shifted from manufacturing to services.
Does this reduction in emissions show the US
has reduced its consumption of industrial goods?No. In fact, the consumption of goods hasskyrocketed. Instead of producing these goodsdomestically, manufacturing has largely been‘exported’ — emissions are now added to thebalance sheet of those countries which makethings for the US to consume. Between 1990-2014,the index of real personal consumption expenditure on goods doubled.And more and more of this consumption is met by imports. Over the past24 years, import of goods into the US has gone through the sky: almost afive-fold increase. Most of these goods were energy-intensive industrialsupplies and materials. Therefore, industrial emissions have not gonedown, but have merely been outsourced (see Box: Importing goods,exporting pollution2).
What about industries operating within the country? According to theEPA’s 2014 emissions inventory, the switchover of ozone-depletingsubstances such as CFC to HFC, iron and steel, cement and petrochemicalproduction are the key contributors (see Graph 6.1: Sources of emissions).The EPA accounts for fossil energy used in industry for manufacture andalso emissions from the industrial process itself.
CementCement is the country’s most intensive energy-consuming sector. The US
cement industry consists of 107 cement plants across 36 states.3 After abrief slump in cement consumption in 2009, the US cement industry hasrecovered and continues to grow (see Graph 6.7: Cement consumption).
The US remains the world’s third largest consumer of cement afterChina and India, both emergent economies.4 The US consumed 79million tonnes of cement in 2012, the combined consumption of Japanand Mexico in that year. Therefore, despite its high development status,
87
CAPITAN AMERICA
6. IndustryIndustrial emissions have not gone down; they have merely been outsourced
Other direct sources 9%
Petroleum 3% Cement production 3%
Iron and steel production 4%
Coal mining 4%
Non-energy use of fuels 7%
Natural gas systems 13%
On-site fossil fuel combustion 57%
Graph 6.1: Sources of emissionsThe sector accounted for 20 per cent of totalUS GHG emissions in 2013
Source: EPA 2014

Importing goods, exporting pollution
In 2014, the industrial sector in the US consumed2 per cent less energy than what it had in 1990.In fact, post-2000 the trend in total energyconsumption has been a decreasing one. Thereduction in per capita energy consumption iseven greater — down by 23 per cent (1990-2014).
Data indicates that over the past 25 years, thecontribution of the US manufacturing sub-sector(the largest and most energy-intensive sub-sector of the industrial sector) to the grossdomestic product (GDP) has significantlyreduced. In 1990, this sub-sector contributed16.7 per cent to the GDP; in 2014, 12 per cent.Clear evidence the sub-sector is shrinking vis-a-vis other sectors.
But has the consumption of industrial goodsand services also gone down?
Ample data exists to show the consumption ofall goods, including industrial goods, hasincreased. In terms of nominal dollars, thepersonal consumption expenditure on goods(including durables such as vehicles orelectronics and non-durable goods such as food and beverages, clothing and footwear) has increased from US $1,500 billion in 1990 to $3,950 billion in 2014 — a rise of 165 per cent.
From 1990 to 2014, the index of real personalconsumption expenditure (Index number, 2009 =100) on goods has more than doubled. So, both innominal and real dollar terms, consumption ofgoods has at least doubled. From this data, it isdifficult to quantify the increase in the amount ofgoods consumed in the US. But it is quite clearthe US consumes significantly more goods todaythan what it did in 1990.
And more and more of the demand for goodsis being met by imports. In 1990, only US $500billion worth of goods were imported to the US;in 2014 it was US $2,374 billion — an almost five-fold increase.
In 1990, the value of imported goodsaccounted for about 33 per cent of the totalpersonal consumption expenditure on goods; in2014, 60 per cent. In terms of value, therefore,more than half of goods consumed in the US isimported.
1990 1996 1999 2005 2008 20111993 2002 2014
40000
35000
30000
25000
20000
15000
10000
38,810 31,308
Co
nsu
mp
tio
n (
Trill
ion
Btu
)
Graph 6.2: Total energy consumption
140
120
100
80
60
40
20
0
128
Co
nsu
mp
tio
n (
Mill
ion
Btu
)
98
1990 1996 1999 2005 2008 20111993 2002 2014
Graph 6.3: Per capita energy consumption
4500
4000
3500
3000
2500
2000
1500
1000
No
min
al d
olla
rs (
In b
illio
ns)
1990 1996 1999 2005 2008 20111993 2002 2014
Graph 6.4: Total personal consumptionexpenditure on all goods
88

So, what kinds of goods is the US importing? In 2014, the main goods imported to the US in terms of value were industrial supplies and materials (28 percent of all imported goods), capital goods except automotive (25 per cent), consumer goods except food andautomotive (24 per cent), automotive vehicles, parts and engines (14 per cent) and foods, feeds and beverages(5 per cent).
Thus in the last 15 years, the imports of energy-intensive industrial supplies and materials (which includescement, steel, chemicals, other metals and non-metals) have more than tripled. The imports of capital andconsumer goods have also doubled during this period. The US, therefore, has outsourced a significantproportion of its energy-intensive industrial production.
0.0
500.0
1,000.0
1,500.0
2,000.0
2,500.0
3,000.0
3,500.0
4,000.0
4,500.0
1990
1991
1992
1993
1994
1995
1996
1997
1998
1999
2000
2001
2002
2003
2004
2005
2006
2007
2008
2009
2010
2011
2012
2013
2014
In b
illio
ns
of
no
min
al d
olla
rs
Total personal consumption expenditures on all goods
Total imports of all goods
Graph 6.5: Consumption of goods vs import of goods
CAPITAN AMERICA
89
1999
2000
2001
2002
2003
2004
2005
2006
2007
2008
2009
2010
2011
2012
2013
2014
2500
2000
1500
1000
500
0
Do
llars
(In
bill
ion
s)
All goods
Industrial supplies and materials Capital goods
except automotive Consumer goods
except food andautomotive
Automotivevehicles & engines
Food, feeds & beverages
Other general merchandise
Graph 6.6: What kinds of goods does the US import
Sources: For Graphs 6.2 and 6.3 — USEIA; for Graph 6.4 — data on personal consumption expenditure released by Bureau of Economic Analysis, 2014; forGraphs 6.5 and 6.6 — data on US international transactions released by Bureau of Economic Analysis, 2015
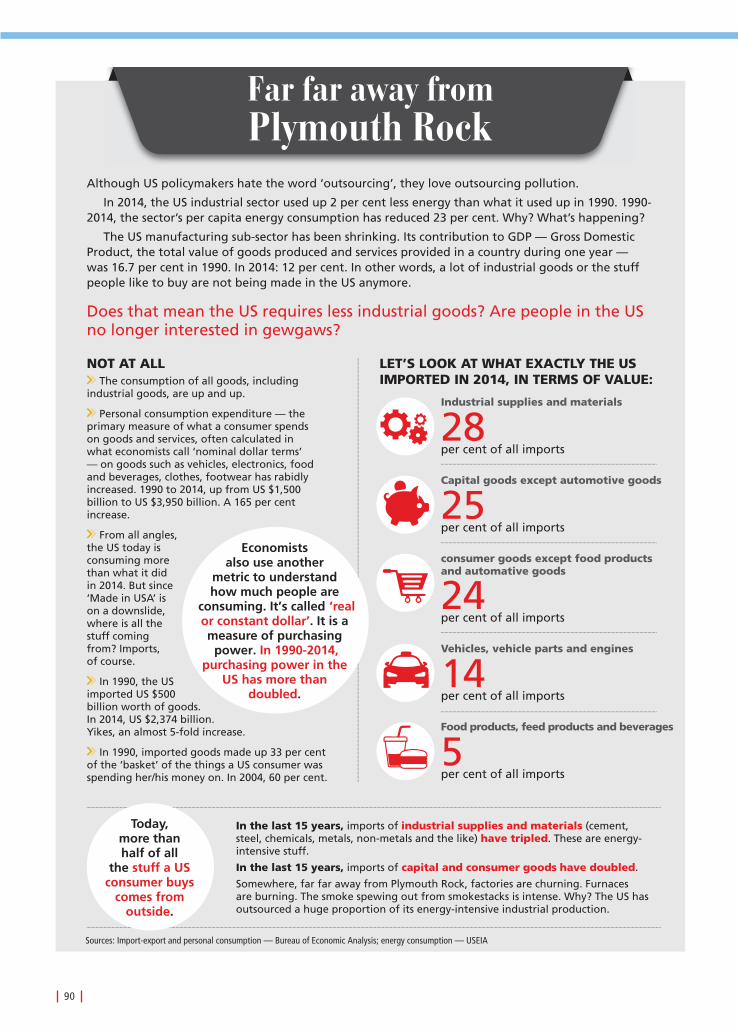
Although US policymakers hate the word ‘outsourcing’, they love outsourcing pollution.
In 2014, the US industrial sector used up 2 per cent less energy than what it used up in 1990. 1990-2014, the sector’s per capita energy consumption has reduced 23 per cent. Why? What’s happening?
The US manufacturing sub-sector has been shrinking. Its contribution to GDP — Gross Domestic Product, the total value of goods produced and services provided in a country during one year —was 16.7 per cent in 1990. In 2014: 12 per cent. In other words, a lot of industrial goods or the stuff people like to buy are not being made in the US anymore.
Does that mean the US requires less industrial goods? Are people in the US no longer interested in gewgaws?
NOT AT ALL The consumption of all goods, including
industrial goods, are up and up.
Personal consumption expenditure — the primary measure of what a consumer spends on goods and services, often calculated in what economists call ‘nominal dollar terms’ — on goods such as vehicles, electronics, food and beverages, clothes, footwear has rabidly increased. 1990 to 2014, up from US $1,500 billion to US $3,950 billion. A 165 per cent increase.
From all angles, the US today is consuming more than what it did in 2014. But since ‘Made in USA’ is on a downslide, where is all the stuff coming from? Imports, of course.
In 1990, the US imported US $500 billion worth of goods. In 2014, US $2,374 billion. Yikes, an almost 5-fold increase.
In 1990, imported goods made up 33 per cent of the ‘basket’ of the things a US consumer was spending her/his money on. In 2004, 60 per cent.
In the last 15 years, imports of industrial supplies and materials (cement, steel, chemicals, metals, non-metals and the like) have tripled. These are energy-intensive stuff.
In the last 15 years, imports of capital and consumer goods have doubled.
Somewhere, far far away from Plymouth Rock, factories are churning. Furnaces are burning. The smoke spewing out from smokestacks is intense. Why? The US has outsourced a huge proportion of its energy-intensive industrial production.
LET’S LOOK AT WHAT EXACTLY THE US IMPORTED IN 2014, IN TERMS OF VALUE:
Far far away from Plymouth Rock
Economists also use another
metric to understand how much people are
consuming. It’s called ‘real or constant dollar’. It is a measure of purchasing
power. In 1990-2014, purchasing power in the
US has more than doubled.
Food products, feed products and beverages
5 per cent of all imports
Industrial supplies and materials
28 per cent of all imports
Capital goods except automotive goods
25 per cent of all imports
consumer goods except food products and automative goods
24 per cent of all imports
Vehicles, vehicle parts and engines
14 per cent of all imports
Today, more than half of all
the stuff a US consumer buys
comes from outside.
90
Sources: Import-export and personal consumption — Bureau of Economic Analysis; energy consumption — USEIA

CAPITAN AMERICA
91
Co
nsu
mp
tio
n in
th
ou
san
d t
on
nes
0
20000
40000
60000
80000
100000
120000
2008 2009 2010 2011 2012 2013 2014
Graph 6.7: Cement consumptionThe US is the world’s third largest consumer
Source: Statistics Portal http://www.statista.com/statistics/273367/consumption-of-cement-in-the-us/, as viewed on September 10, 2015.
Time 2009 2010 2011 2012 2013Emissions (MMTCO2)* 29.4 31.3 32.0 35.1 36.1
Source: EPA 2014, US Greenhouse gas inventory report, 1990-2013, http://www3.epa.gov/climatechange/ghgemissions/usinventoryreport.html, as viewed on September 10, 2015.* The inventory estimates US process-related emissions from cement production. Due to thenature of the IPCC guidelines, as well as the way industrial sector emissions are estimated in theUnited States, combustion-related emissions resulting from the cement industry are not as wellcharacterised. One report states that the total combustion and process-related emissions from thecement industry in the US in 2001 itself were 71 MMTCO2e.
Table 6.1: Process-related emissions fromcement productionCement manufacturing is very energy-intensive and results insignificant energy-related as well as process emissions
Wei
gh
ted
ave
rag
e g
ross
C
O2
emis
sio
ns
kg C
O2/
ton
ne
cem
ent
0100200300400500600700800900
US India China Germany
Graph 6.8: Gross CO2 emissionsThe US cement industry is far moreemissions-inefficient than its counterparts
Source: World Business Council For Sustainable Development,Cement Sustainability Initiative, GNR Project Reporting CO2,available at http://wbcsdcement.org/GNR-2012/index.html, asviewed on September 10, 2015.
it is still building more and growing more. The rise in cement production is directly proportional to emissions
increase. Post-slump, CO2 emissions have also risen, from 29.4 milliontonnes in 2009 to 36.1 million tonnes in 2013.
Cement manufacturing results in significant energy-related as well asprocess emissions of GHGs, mainly CO2 (see Table 6.1 and Graph 6.8).There are various ways in which GHG intensity of cement production canreduce. Lowering energy intensity reduces emissions. In addition,process CO2 emissions can be significantly reduced per tonne of cementproduced by mixing clinker — limestone — with an increased proportionof other products in cement. The GHG reductions from cement blendingcan outstrip the returns from energy-efficiency initiatives by a significantmargin.5 But the US cement industry does not seem to have taken to theseways. It is, therefore, far more emissions-inefficient than its counterparts
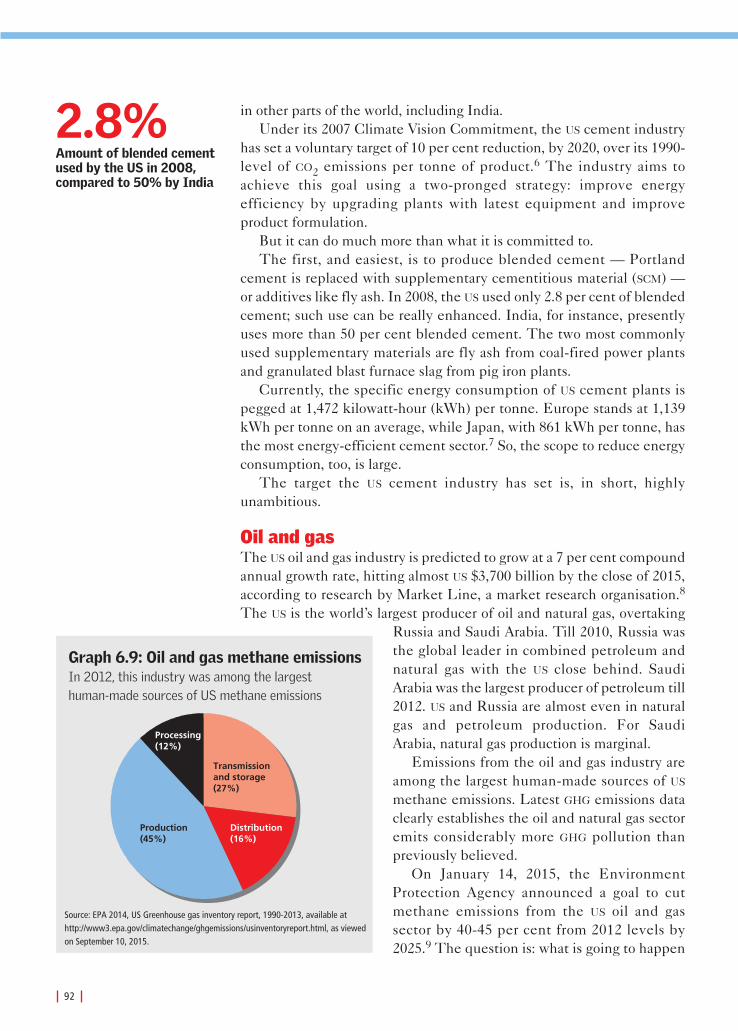
in other parts of the world, including India.Under its 2007 Climate Vision Commitment, the US cement industry
has set a voluntary target of 10 per cent reduction, by 2020, over its 1990-level of CO2 emissions per tonne of product.6 The industry aims toachieve this goal using a two-pronged strategy: improve energyefficiency by upgrading plants with latest equipment and improveproduct formulation.
But it can do much more than what it is committed to. The first, and easiest, is to produce blended cement — Portland
cement is replaced with supplementary cementitious material (SCM) —or additives like fly ash. In 2008, the US used only 2.8 per cent of blendedcement; such use can be really enhanced. India, for instance, presentlyuses more than 50 per cent blended cement. The two most commonlyused supplementary materials are fly ash from coal-fired power plantsand granulated blast furnace slag from pig iron plants.
Currently, the specific energy consumption of US cement plants ispegged at 1,472 kilowatt-hour (kWh) per tonne. Europe stands at 1,139kWh per tonne on an average, while Japan, with 861 kWh per tonne, hasthe most energy-efficient cement sector.7 So, the scope to reduce energyconsumption, too, is large.
The target the US cement industry has set is, in short, highlyunambitious.
Oil and gasThe US oil and gas industry is predicted to grow at a 7 per cent compoundannual growth rate, hitting almost US $3,700 billion by the close of 2015,according to research by Market Line, a market research organisation.8
The US is the world’s largest producer of oil and natural gas, overtakingRussia and Saudi Arabia. Till 2010, Russia wasthe global leader in combined petroleum andnatural gas with the US close behind. SaudiArabia was the largest producer of petroleum till2012. US and Russia are almost even in naturalgas and petroleum production. For SaudiArabia, natural gas production is marginal.
Emissions from the oil and gas industry areamong the largest human-made sources of US
methane emissions. Latest GHG emissions dataclearly establishes the oil and natural gas sectoremits considerably more GHG pollution thanpreviously believed.
On January 14, 2015, the EnvironmentProtection Agency announced a goal to cutmethane emissions from the US oil and gassector by 40-45 per cent from 2012 levels by2025.9 The question is: what is going to happen
92
Transmissionand storage (27%)
Distribution (16%)
Production (45%)
Processing (12%)
Graph 6.9: Oil and gas methane emissions In 2012, this industry was among the largest human-made sources of US methane emissions
Source: EPA 2014, US Greenhouse gas inventory report, 1990-2013, available athttp://www3.epa.gov/climatechange/ghgemissions/usinventoryreport.html, as viewedon September 10, 2015.
2.8%Amount of blended cementused by the US in 2008,compared to 50% by India

93
CAPITAN AMERICA
US estimates of methane emissions up in flamesLike all other greenhouse gases (GHGs), methane emissions from the oil and gas sector have increased. TheEnvironment Protection Agency’s GHG inventory states that the natural gas systems (which includethousands of wells, transmission lines and distribution lines, and processing facilities) contributed to 157.4million metric tonnes CO2e of methane. The petroleum system pitched in with about 25 million tonnes ofCO2e. Together, the oil and gas sector contributed to 29 per cent of the US’s overall methane emissions.1
EPA’s numbers for natural gas industry are, by the agency’s own admission, outdated, based on limiteddata and likely to be an under-estimation. Actual emissions would be higher.2
The devil is in the detailThe US emits methane from natural gas combusted for energy. But when methane leaks out of oil andgas wells, or pipelines, into the atmosphere, it acts as a potent greenhouse gas. The Global WarmingPotential (GWP), an index of how potent a gas is in influencing global warming, is conventionally takenas 25 times that of CO2, but this is an under-estimation.
The time for which a GHG persists in the atmosphere is also a way to estimate its potency. It is knownthat CO2 stays a long time in the atmosphere; methane has a relatively small stay. When averaged over100 years (to compare with CO2) its potency is 25, but when averaged over 20 years, its potency could beas much as 105. The jury is still out on this issue and a lot more work needs to be done to estimate itspotency and create a methodology to calculate its emissions. This is particularly important in the case ofshale gas where gas fields are scattered over long distances. In the case of all natural gas, it is not justabout production from a gas field, but also leakage during transportation and during household andindustrial use.3
First, what is needed is a rigorously established baseline to determine the extent of emissions andthe reduction potential. A leading expert on fracture mechanics,Tony Ingraffea of Cornell University,says that the smaller the starting number from which they begin reductions, the smaller the amount onehas to reduce in coming years by regulation. A 45 per cent reduction on a rate that is extremely low, forinstance, will be a very small reduction. From a scientific perspective, this does not amount to a hill ofbeans.4
Second, how reliable are the EPA figures? To come up with its annual estimate, the EPA does notmake direct measurements of methane emissions each year. Rather it multiplies emissions factors, thevolume of gas thought to be emitted by a particular source such as a mile of pipeline or a belching cow,by the number of such sources in a given area. For the natural gas sector, emissions factors are based ona limited number of measurements conducted in the early 1990s in industry-funded studies.
In 2010, the EPA increased its emissions factors for methane from the oil and natural gas sector,citing outdated and potentially understated emissions. The end result was a more than doubling of itsannual emissions estimate from the year before. In 2013, however, the EPA reversed course, loweringestimates for key emissions factors for methane at wells and processing facilities by 25-30 per cent.Even this is said to be not enough and may still not be the full picture.5
Third, the US has consistently downplayed its fugitive methane emissions leakages or gas ventedduring oil and gas production. A study published in the Proceedings of the National Academy of Sciences(PNAS) shows that the US methane emissions may well be a whopping 50 per cent higher than the EPAestimates. Most strikingly, the study reveals that fugitive methane may be five times greater than thecurrent estimates.6
Fourth, there have been emissions from abandoned wells. To estimate methane emissions from theoil and gas sector, activities such as production from oil and gas sites, including well completion, routinemaintenance and equipment leaks are used to compose a bottom-up estimate. But a comparison ofbottom-up and top-down estimates shows that some sources are unaccounted for in the estimates, suchas abandoned wells. Currently in the US, there is no regulatory requirement to monitor or account formethane emissions from abandoned wells.7
Continued.....
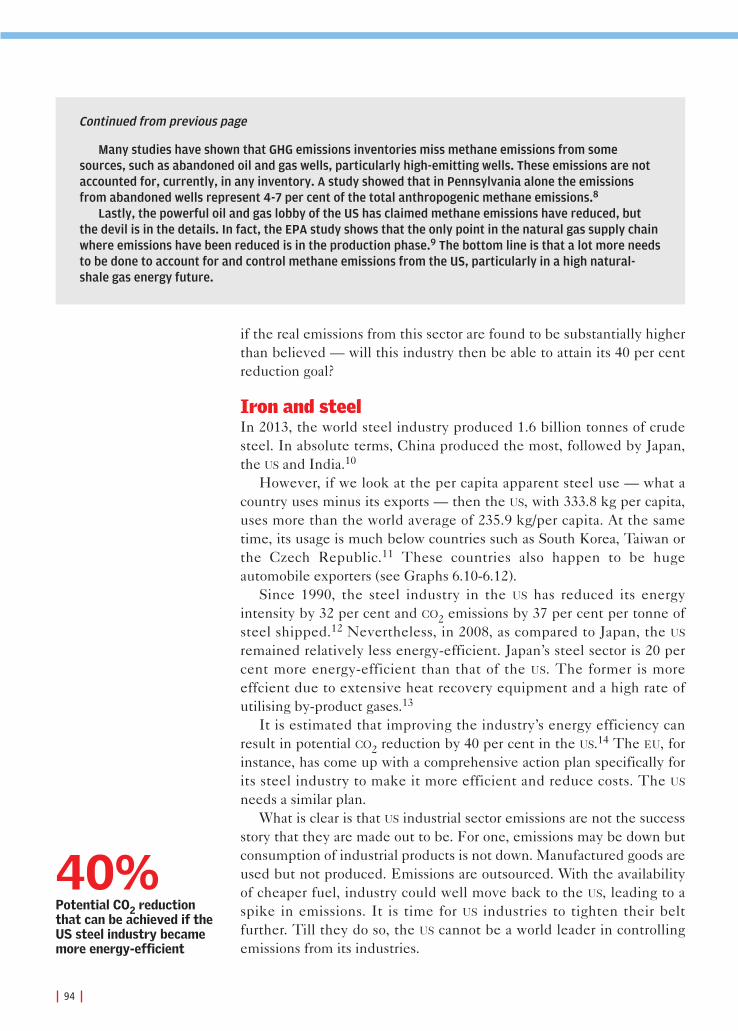
94
if the real emissions from this sector are found to be substantially higherthan believed — will this industry then be able to attain its 40 per centreduction goal?
Iron and steelIn 2013, the world steel industry produced 1.6 billion tonnes of crudesteel. In absolute terms, China produced the most, followed by Japan,the US and India.10
However, if we look at the per capita apparent steel use — what acountry uses minus its exports — then the US, with 333.8 kg per capita,uses more than the world average of 235.9 kg/per capita. At the sametime, its usage is much below countries such as South Korea, Taiwan orthe Czech Republic.11 These countries also happen to be hugeautomobile exporters (see Graphs 6.10-6.12).
Since 1990, the steel industry in the US has reduced its energyintensity by 32 per cent and CO2 emissions by 37 per cent per tonne ofsteel shipped.12 Nevertheless, in 2008, as compared to Japan, the US
remained relatively less energy-efficient. Japan’s steel sector is 20 percent more energy-efficient than that of the US. The former is moreeffcient due to extensive heat recovery equipment and a high rate ofutilising by-product gases.13
It is estimated that improving the industry’s energy efficiency canresult in potential CO2 reduction by 40 per cent in the US.14 The EU, forinstance, has come up with a comprehensive action plan specifically forits steel industry to make it more efficient and reduce costs. The US
needs a similar plan. What is clear is that US industrial sector emissions are not the success
story that they are made out to be. For one, emissions may be down butconsumption of industrial products is not down. Manufactured goods areused but not produced. Emissions are outsourced. With the availabilityof cheaper fuel, industry could well move back to the US, leading to aspike in emissions. It is time for US industries to tighten their beltfurther. Till they do so, the US cannot be a world leader in controllingemissions from its industries.
Many studies have shown that GHG emissions inventories miss methane emissions from somesources, such as abandoned oil and gas wells, particularly high-emitting wells. These emissions are notaccounted for, currently, in any inventory. A study showed that in Pennsylvania alone the emissionsfrom abandoned wells represent 4-7 per cent of the total anthropogenic methane emissions.8
Lastly, the powerful oil and gas lobby of the US has claimed methane emissions have reduced, butthe devil is in the details. In fact, the EPA study shows that the only point in the natural gas supply chainwhere emissions have been reduced is in the production phase.9 The bottom line is that a lot more needsto be done to account for and control methane emissions from the US, particularly in a high natural-shale gas energy future.
Continued from previous page
40%Potential CO2 reductionthat can be achieved if theUS steel industry becamemore energy-efficient

CAPITAN AMERICA
95
In m
illio
n t
on
nes
0
100
200
300
400
500
600
700
800
900
Chin
a
Japa
n US
Indi
a
Russ
ia
Sout
h Ko
rea
Ger
man
y
Graph 6.10: Steel production
Source: World Steel Association available at https://www.worldsteel.org,as viewed on September 10, 2015.
Ave
rag
e st
eel u
se p
er c
apit
a (k
g-c
rud
e st
eel)
0
200
400
600
800
1000
1200
Fran
ce EU
Ru
ssia US
Wo
rld
Ind
ia
Ger
man
y
Ch
ina
Jap
an
Cze
ch R
epu
blic
Sou
th K
ore
a
Taiw
an
Graph 6.11: Per capita steel use
South Korea
Taiwan
Czech Republic
Japan
China
Germany
US
Steel consumed (kg per capita) Car export ($ billion)
1,057.4
793.4
546.8
516.4
515.1
460.2
300.2
9.8
44.3
15.3
92
4.6
148.7
57.1
Graph 6.12: Steel consumption versus vehicle exports
Source: Gwynn Guilford 2014, South Korea consumes more steel per capita than China and Japan combined available at Anon http://qz.com/214223/south-korea-consumes-more-steel-per-capita-than-china-and-japan-combined/, as viewed on September 10, 2015.
Tonnes of oil equivalent per tonne of crude steel
Japan 0.59
South Korea 0.63
Germany 0.69
France 0.71
United Kingdom 0.72
United States 0.74
Canada 0.75
China 0.76
India 0.78
Australia 0.79
Russia 0.80
Source: RITE 2008, International comparisons of energy efficiency, sectors of electricity generation,iron and steel and cement, Research Institute of Innovative Technologies for the Earth.
Table 6.2: Energy consumption — a comparison Though China and Japan producedmore steel than the US in 2013, theUS's per capita apparent steel use wasmore than the world average. However,its usage remained below the bigautomobile-exporting nations.
The industry has managed to reduce itsemissions, but could become moreenergy-efficient. In 2008, as comparedto Japan, the US remained relativelyless energy-efficient. Japan’s steelsector is 20 per cent more energy-efficient than that of the US.
Source: World Steel Association available at https://www.worldsteel.org, asviewed on September 10, 2015.

96

CAPITAN AMERICA
97

● Emissions from agriculture were 7.7 per cent oftotal US greenhouse gas emissions. Since 1990,they have seen a 14 per cent hike.
● Methane and nitrous oxide are the primary GHGsthis sector emits. The key sources are irrigation,chemical fertiliser use, methane from rice fields,burning crop residues and enteric fermentation.
● The US plans to reduce net emissions from thissector and enhance carbon sequestration by 2025;but even after doing all that, its per capitaemissions will remain more than that of India.
● One important aspect that the US misses out on isthe linkage between its agricultural emissions andits consumption of food that is processed and highin empty calories. The way such foods areprepared, and their consumption, adds to the US'sclimate change burden.
● US — and other rich nations — waste a lot offood. In 2010, 60 million tonnes of food was lostto wastage in the US.
● Reducing food losses by just 15 per cent wouldhelp feed over 25 million people every year,thereby reducing agriculture-related emissions.
98

7. Agriculture & WasteWill the US change its preference for processed foods and stop wasting food?
Agriculture as a portion of all emissions (7.7%)
Agricultural soil management
Enteric fermentation
Manure management
Rice cultivation
Field burning of agricultural residues
0 25 50 75 100 125 150 175 200 225 250 275 300
Million metric tonnes CO2 equivalent
<0.5
Graph 7.1: US agriculture emissionskey drivers for emissions growth are livestock manure management and agricultural soil management
Note: Emission values are presented in CO2 equivalent mass units using IPCC AR4 GWP values.Totals may not sum up due to independent rounding.Source: EPA 2014, US greenhouse gas inventory report, 1990-2013, available at http://www3.epa.gov/climatechange/ghgemissions/usinventoryreport.html, as viewed onSeptember 25, 2015.
CAPITAN AMERICA
99
In 2013, US agricultural emissions were 515 million metric tonnes,accounting for roughly 7.7 per cent of total US greenhouse gas (GHG)emissions (see Graph and Table 7.1). According to the EnvironmrntalProtection Agency (EPA), emissions from agriculture have increased byroughly 14 per cent since 1990.1 Methane and nitrous oxide are theprimary GHGs this sector emits. The key drivers for emissions growth arelivestock manure management and agricultural soil management, andare largely due to irrigation and chemical fertiliser use. Other agriculturalsources — methane from rice and burning crop residue — have shown arelatively small increase since 1990. But at 32 per cent, entericfermentation — gas from the stomach of cattle — remains a highcontributor.
Trends in agriculture source emissionsMethane and nitrous oxide emissions increased by 54.4 per cent from1990 to 2013, largely from swine and dairy cow manure.2
Enteric fermentation is the country’s largest anthropogenic source of

Table 7.1: Emissions from agriculture (MMTCO2e) Emissions from agriculture have increased by roughly 14 per cent since 1990
Gas/source 1990 2005 2009 2010 2011 2012 2013CH4 210.8 234.4 242.1 243.4 238.9 239.6 234.5 Enteric fermentation 164.2 168.9 172.7 171.1 168.7 166.3 164.5 Manure management 37.2 56.3 59.7 60.9 61.4 63.7 61.4 Rice cultivation 9.2 8.9 9.4 11.1 8.5 9.3 8.3Field burning of agricultural residues 0.3 0.2 0.3 0.3 0.3 0.3 0.3N2O2 237.9 260.1 281.2 281.4 283.2 283.4 281.1Agricultural soil management 224.0 243.6 264.1 264.3 265.8 266.0 263.7Manure management 13.8 16.4 17.0 17.1 17.3 17.3 17.3Field burning of agricultural residues 0.1 0.1 0.1 0.1 0.1 0.1 0.1Total 448.7 494.5 523.3 524.8 522.1 523.0 515.7
100
methane emissions. On a year-to-year basis, emissions increase ordecrease depending on the cattle population and what they eat, butoverall, between 1990 and 2013 there has been no significant increase. Ingeneral, the quantity of gas livestock generate depends on the type —ruminants such as cattle have greater outputs — and quality of feed.Lower quality of feed but also higher feed intake lead to higheremissions. EPA has done extensive work on the methodology tounderstand feed characteristics and digestibility in livestock. But itaccepts that much more is needed to understand methane productionfrom this sector.
Agricultural soils produced 74 per cent of the nitrous oxide emissionsin 2013, mainly because of the application of chemical and organicfertilisers and weather and water conditions.
US plans on agricultureIn April 2015, the US agriculture secretary announced the country’s planto reduce GHG emissions from this sector. The plan is to reduce netemissions and enhance carbon sequestration by over 120 million metrictonnes of CO2 equivalent (MMTCO2e) per year — about 2 per cent ofeconomy-wide net GHG emissions — by 2025.3 Even then, its per capitaemissions will remain more than that of India’s (see Box: Agriculture: percapita emissions).
The US’s broad suite of policies includes targeting livestock-relatedemissions, by making sure there are roofs to contain some methaneemissions, and planting more trees.
A significant point to note is that this proposed reduction is not solelyfrom reducing agricultural emissions. It also includes new carbon storagein forests and lands, and changes in energy use.4 Therefore, thispercentage would in reality be much lower (see Box: Forestry and sinks).There is no target set for each sector, only a list of proposed actionsintended to reduce emissions. It is, therefore, difficult to say whether
Source: EPA 2014, US greenhouse gas inventory report, 1990-2013, available at http://www3.epa.gov/climatechange/ghgemissions/usinventoryreport.html, as viewed onSeptember 25, 2015.
Entericfermentation is the
country’s largestanthropogenic source of
methane emissions
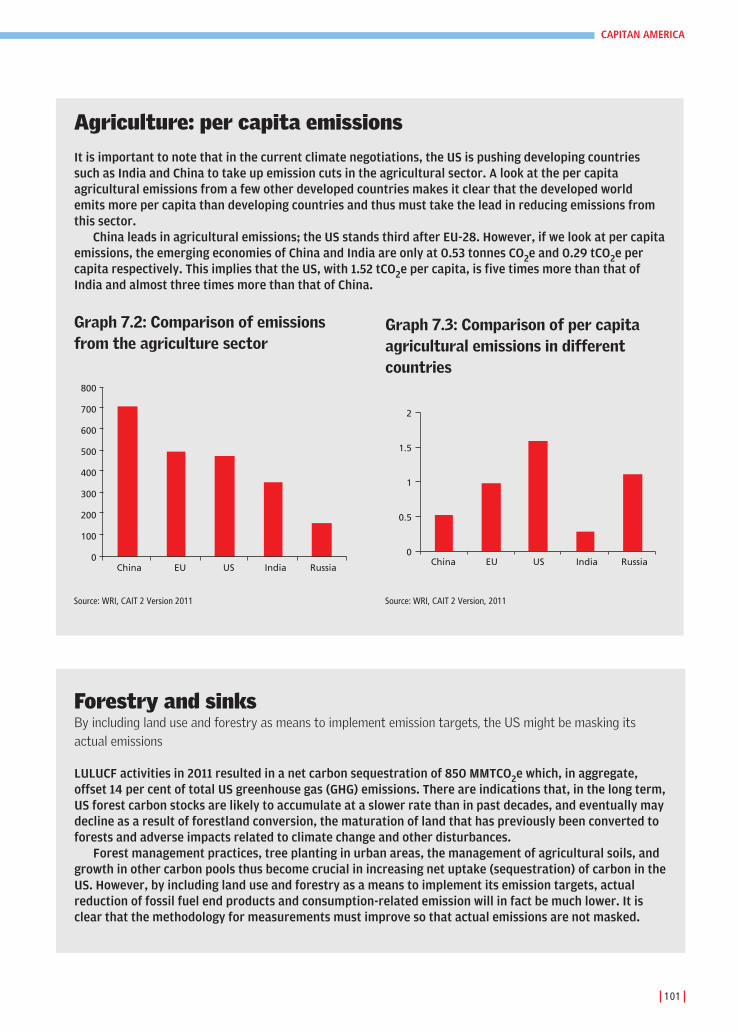
Agriculture: per capita emissions
It is important to note that in the current climate negotiations, the US is pushing developing countriessuch as India and China to take up emission cuts in the agricultural sector. A look at the per capitaagricultural emissions from a few other developed countries makes it clear that the developed world emits more per capita than developing countries and thus must take the lead in reducing emissions fromthis sector.
China leads in agricultural emissions; the US stands third after EU-28. However, if we look at per capitaemissions, the emerging economies of China and India are only at 0.53 tonnes CO2e and 0.29 tCO2e percapita respectively. This implies that the US, with 1.52 tCO2e per capita, is five times more than that ofIndia and almost three times more than that of China.
0
100
200
300
400
500
600
700
800
China EU US India Russia
Graph 7.2: Comparison of emissionsfrom the agriculture sector
Source: WRI, CAIT 2 Version 2011
0
0.5
1
1.5
2
China EU US India Russia
Graph 7.3: Comparison of per capitaagricultural emissions in differentcountries
Source: WRI, CAIT 2 Version, 2011
CAPITAN AMERICA
101
Forestry and sinksBy including land use and forestry as means to implement emission targets, the US might be masking itsactual emissions
LULUCF activities in 2011 resulted in a net carbon sequestration of 850 MMTCO2e which, in aggregate,offset 14 per cent of total US greenhouse gas (GHG) emissions. There are indications that, in the long term,US forest carbon stocks are likely to accumulate at a slower rate than in past decades, and eventually maydecline as a result of forestland conversion, the maturation of land that has previously been converted toforests and adverse impacts related to climate change and other disturbances.
Forest management practices, tree planting in urban areas, the management of agricultural soils, andgrowth in other carbon pools thus become crucial in increasing net uptake (sequestration) of carbon in theUS. However, by including land use and forestry as a means to implement its emission targets, actualreduction of fossil fuel end products and consumption-related emission will in fact be much lower. It isclear that the methodology for measurements must improve so that actual emissions are not masked.

US intended action for agriculture emissionsThe US government has announced 10 building blocks that span a range of technologies and practicesthat will reduce greenhouse gas emissions, increase carbon storage and generate clean renewable energy.
Soil health: Improve soil resilience and increase productivity by promoting conservation tillage andno-till systems, planting cover crops, planting perennial forages, managing organic inputs andcompost application, and alleviating compaction. For example, the effort aims to increase the use ofno-till systems to cover more than 100 million acres by 2025.
Nitrogen stewardship: Focus on the right timing, type, placement and quantity of nutrients to reducenitrous oxide emissions and provide cost savings through efficient application.
Livestock partnerships: Encourage broader deployment of anaerobic digesters, lagoon covers,composting, and solids separators to reduce methane emissions from cattle, dairy, and swineoperations, including the installation of 500 new digesters over the next 10 years.
Conservation of sensitive lands: Use the Conservation Reserve Program (CRP) and the AgriculturalConservation Easement Program (ACEP) to reduce GHG emissions through riparian buffers, treeplanting, and the conservation of wetlands and organic soils. For example, the effort aims to enroll400,000 acres of lands with high greenhouse gas benefits into the Conservation Reserve Program.
Grazing and pasture lands: Support rotational grazing management on an additional 4 million acres,avoiding soil carbon loss through improved management of forage, soils and grazing livestock.
Private forest growth and retention: Through the Forest Legacy Program and the Community Forestand Open Space Conservation Program, protect almost 1 million additional acres of workinglandscapes.
Stewardship of federal forests: Employ the Forest Stewardship Program to cover an average of 2.1million acres annually (new or revised plans), in addition to the 26 million acres covered by activeplans. Reforest areas damaged by wildfire, insects, or disease, and restore forests to increase theirresilience to those disturbances. This includes plans to reforest an additional 5,000 acres each year.
Promotion of wood products: Increase the use of wood as a building material, to store additionalcarbon in buildings while offsetting the use of energy from fossil fuel.
Urban forests: Encourage tree planting in urban areas to reduce energy costs, storm water runoff,and urban heat island effects while increasing carbon sequestration, curb appeal, and propertyvalues. The effort aims to plant an additional 9,000 trees in urban areas on average each yearthrough 2025.
Energy generation and efficiency: Promote renewable energy technologies and improve energyefficiency. Through the Energy Efficiency and Conservation Loan Program, work with utilities toimprove the efficiency of equipment and appliances. Using the Rural Energy for America Program,develop additional renewable energy opportunities. Support the National On-Farm Energy Initiative to improve farm energy efficiency through cost-sharing and energy audits.
Source: USDA 2015, Secretary Vilsack announces partnership with farmers and ranchers to address climate change, US Department of Agriculture available athttp://blogs.usda.gov/2015/04/23/secretary-vilsack-announces-partnerships-with-farmers-and-ranchers-to-address-climate-change/, as viewed on September 25, 2015.
102

these actions, on their own or together, will bring change or whetheragriculture emissions will be masked by an increase in sequestration —land use and forestry changes that absorb the pollution.
What is interesting is that the US does not, in any way, link itsagricultural emissions to its consumption of ‘intensively’ grown food; itssheer wastage of Planet-costing food and its poor health status, with theresult that it is eating food that is processed and high in empty calories.This is its agenda — link food with nutrition and nature.
Livestock emission-consumption linkThe bulk of US agricultural emissions is related to its livestock industry.What is the US doing to reduce these emissions? Currently, the 10 aspectsof its domestic action plan are aimed, at best, to mitigate emissionsthrough after-treatment devices, like anaerobic digesters (biogas plants).
But it says nothing about how it must change the way it produces foodand even change what it eats. Meat consumption in the US has nearlydoubled in the last century. According to the Food and AgricultureOrganization, an American eats more than three times the globalaverage.5
This consumption has health impacts — eating meat that is high insaturated fat means even the ‘goodness’ of protein is negated. Americanseat more than 1.5 times the average human protein requirement.6 It isnow well documented that excess meat consumption is linked to theburden of diseases of the heart, type 2 diabetes, obesity and certaincancers.
Then there is the added problem of the way meat is ‘produced’,which uses intensive methods and feeds animals additives andantibiotics. All this adds to pollution in the country’s waterways and hasled to serious problems of antibiotic resistance. In the 2015 nationaldietary guidelines, for the first time, concern regarding environmentaland health impacts have led to a proposal to restrict meat consumption.But the country’s powerful meat industry opposes any such move.7
Reduction in meat-eating and changes in the way it is produced must bea central part of the country’s climate change mitigation plan. As yet,these solutions are being ignored.
Food waste: not counted yetAgriculture emissions are not just about what is produced or how it isproduced. It is also about how what is produced is wasted. Wastage offood is about inefficiency. Every year, according to United NationsEnvironment Programme (UNEP), consumers in rich countries wastealmost as much food (222 million tonnes) as the entire net foodproduction of sub-Saharan Africa (230 million tonnes).8 In the US, 60million tonnes of food was lost in 2010. This amounts to 31 per cent ofthe total food supply, worth about US $161.6 billion.9 The wastagetranslates to 141 trillion calories down the drain, literally, or 1,249 calories
CAPITAN AMERICA
103
31%of the US’s total foodsupply was wasted in 2010— amounting to a loss ofover US $161 million
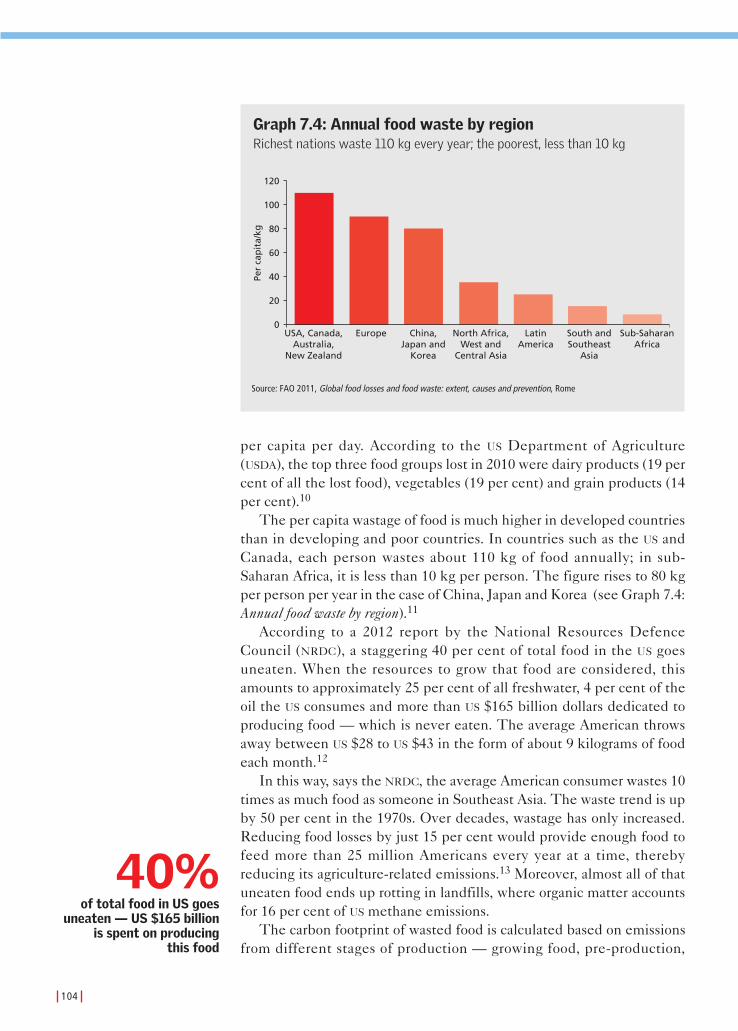
per capita per day. According to the US Department of Agriculture(USDA), the top three food groups lost in 2010 were dairy products (19 percent of all the lost food), vegetables (19 per cent) and grain products (14per cent).10
The per capita wastage of food is much higher in developed countriesthan in developing and poor countries. In countries such as the US andCanada, each person wastes about 110 kg of food annually; in sub-Saharan Africa, it is less than 10 kg per person. The figure rises to 80 kgper person per year in the case of China, Japan and Korea (see Graph 7.4:Annual food waste by region).11
According to a 2012 report by the National Resources DefenceCouncil (NRDC), a staggering 40 per cent of total food in the US goesuneaten. When the resources to grow that food are considered, thisamounts to approximately 25 per cent of all freshwater, 4 per cent of theoil the US consumes and more than US $165 billion dollars dedicated toproducing food — which is never eaten. The average American throwsaway between US $28 to US $43 in the form of about 9 kilograms of foodeach month.12
In this way, says the NRDC, the average American consumer wastes 10times as much food as someone in Southeast Asia. The waste trend is upby 50 per cent in the 1970s. Over decades, wastage has only increased.Reducing food losses by just 15 per cent would provide enough food tofeed more than 25 million Americans every year at a time, therebyreducing its agriculture-related emissions.13 Moreover, almost all of thatuneaten food ends up rotting in landfills, where organic matter accountsfor 16 per cent of US methane emissions.
The carbon footprint of wasted food is calculated based on emissionsfrom different stages of production — growing food, pre-production,
104
120
100
80
60
40
20
0USA, Canada,
Australia,New Zealand
Europe China,Japan and
Korea
North Africa,West and
Central Asia
LatinAmerica
South andSoutheast
Asia
Sub-SaharanAfrica
Graph 7.4: Annual food waste by regionRichest nations waste 110 kg every year; the poorest, less than 10 kg
Source: FAO 2011, Global food losses and food waste: extent, causes and prevention, Rome
40%of total food in US goes
uneaten — US $165 billionis spent on producing
this food
Per
cap
ita/
kg

105
CAPITAN AMERICA
post-production and deforestation. It then turns out that the consumerwaste footprint is more than 350 kgCO2e in North America, while it is 25kgCO2e in sub-Saharan Africa.14
There is also a difference in where this waste occurs. In poorcountries, food wastage happens not out of choice but because of lack ofinfrastructure and facilities to store food. In many cases farmers have nooption but to allow the waste to happen, but even there all efforts aremade to save and re-use wasted food. In rich countries, however, wastehappens after food is produced and because consumers throw food away.
Globally, cutting food waste levels by half would save the world up toUS $300 billion by 2030. At the same time, emissions would fall by up to1 billion metric tonnes of CO2 emissions per year, equal to roughly one-seventh of all US GHG emissions. In the US alone, an average family couldsave around US $1,600 a year by eating leftovers and by smart shopping.15
What is being done to control food wastage? In January 2012, theEuropean Parliament adopted a resolution to reduce food waste by 50per cent by 2020 and designated 2014 as the ‘European year against foodwaste’. In the UK, through a massive public campaign called ‘Love Food,Hate Waste’, in just five years, avoidable household food waste has beenreduced 18 per cent. Likewise, in Japan, targets were put in place in 2012to curb wastage. As a result, food waste there has reduced by around 14per cent over a 3-year period. In Denmark, 50 per cent of the populationreduced food waste within a year in 2012.16
But in the US, there is no drive to push for changes in consumerbehaviour so that food wastage is reduced:● The US, like the UK, needs a massive public campaign to educate
people about food wastage and to instil food conservation habits.● Across supply chains, the US needs tight regulations to ensure food
wastage is minimal.

106

107
CAPITAN AMERICA

108
● The US's consumption levels are mind-boggling. In2013, a US household purchased items which weredouble that of the EU, 24 times that of China, and44 times that of India.
● On an average, an individual in the US todayconsumes 50 per cent more goods and servicesthan in 1990.
● US citizens are spending less than half theirconsumption expenditure on basic things like food, energy and transport, and much more onnon-essential services and goods related to areaslike communication, recreation, clothes andpersonal care etc.
● In market exchange rate terms, average per capitaconsumption in the US is 36 times higher thanIndia's. An average American spends 15 timesmore on food, 50 times more on housing, and over6,000 times more on recreation.
● The US does not have a deliberate policy to reduceits consumption of primary energy or goods andservices.

‘Consumption’ is a conspicuously ‘bad’ word in climate changediscussions. It is accepted consumption of goods and services requireenergy, which leads to emissions. Further, it is accepted consumptionpatterns must change, so that there is human well-being, though not atthe cost of the Earth. This line of argument presumes a silence that hasachieved axiomatic status: don’t mention ‘consumption’. The silence isfounded on a great faith that consumption is nothing less that the NewGlobal Sermon on the Mount (NGSM), to be endlessly recited, word forword. Critiquing NGSM is taboo, for then we delve into the realm of howthe market needs to be reined in; that’s socialism: unacceptable. In thisway, global negotiations on climate change dish out mouthfuls of properplatitudes about consumption patterns and all that goods and servicesjazz, but have no real take on what is the lifestyle the Planet can sustain.
In the US, where there are enough critics of the very idea of climatechange, NGSM rules absolute. The US government does not ever broachit. Even the big US groups, powerful in Washington and global circles, donot want to discuss it at all. Whereas ‘consumption’ is on, really on, it isnever on the table. Any table.
But we need to break the silence. It may be inconvenient, but thisbad word is far too important to ignore.
Absurd levelsThe way the US gobbles up goods and services is unparalleled in theworld. It has the highest per capita household final consumptionexpenditure (a measure of consumption, calculated as the market valueof all goods and services a household purchases in a year). In 2013, all thestuff a US household purchased was almost double that a EuropeanUnion household did, 24 times a Chinese household, 44 times an Indian,64 times a Bangladeshi household and 173 times a household in Malawi.That year, per capita household final consumption expenditure (constant2005 US $) was 6.7 times the world average (see Graph 8.1: Household finalconsumption expenditure per capita: 2013). Even in 1990, household spendin the US was US $21,000 (constant 2005 US $) — it took the Germans 20more years to match that level.
There really isn’t no mountain high enough. Since 1990, the index oftotal real personal consumption expenditure — a measure of goods andservices targeted towards individuals and consumed by them — in the US
has almost doubled. The index has increased by about 120 per cent forgoods and 80 per cent for services. In terms of value, therefore, the US hasalmost doubled its total consumption of goods and services since 1990
109
CAPITAN AMERICA
8. The Mall-thusiansA species bred on conspicuous consumption. Borne by the USA

110
21784
488
3985 1307
16889
25214
706
22408
5894
180 699
6627 4530
679
31190
4658
Au
stra
lia
Ban
gla
des
h
Bra
zil
Ch
ina
Euro
pea
n U
nio
n
Un
ited
Kin
gd
om
Ind
ia
Jap
an
Mex
ico
Mal
awi
Nig
eria
Pola
nd
Ru
ssia
n F
eder
atio
n
Sub
-Sah
aran
Afr
ica
Un
ited
Sta
tes
Wo
rld
0
5000
10000
15000
20000
25000
30000
35000
In c
on
stan
t 20
05 U
S $
Graph 8.1: Household final consumption expenditure per capita: 2013The US has the highest — 44 times that of India’s
Source: Household final consumption expenditure per capita (constant 2005 US $), World Development Indicators, World Bank
1990
1992
1994
1996
1998
2000
2002
2004
2006
2008
2010
2012
2014
140
120
100
80
60
40
20
0
Ind
ex 2
009
= 1
00
Total personal consumption expenditure
Personal consumption expenditure on goods
Personal consumption expenditure on services
Graph 8.2: Index of real personal consumption expenditureThe index has doubled since 1990
Source: Graph generated by Centre for Science and Environment based on data from personal consumption expenditure, 1969-2014, Bureau of Economic Analysis
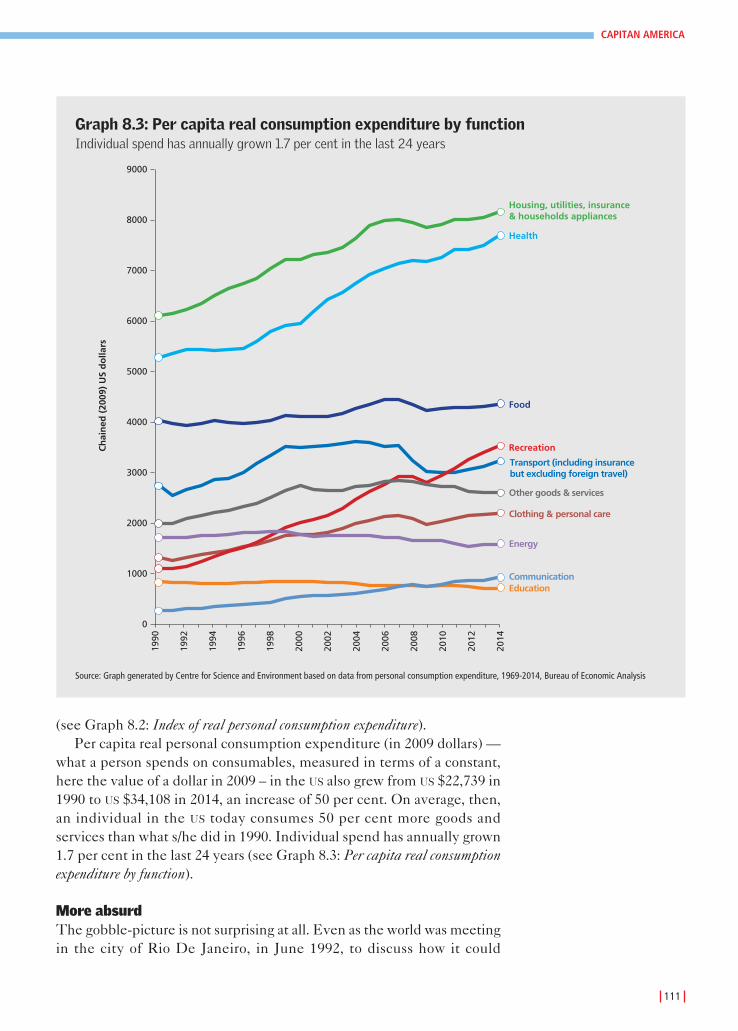
111
CAPITAN AMERICA
(see Graph 8.2: Index of real personal consumption expenditure).Per capita real personal consumption expenditure (in 2009 dollars) —
what a person spends on consumables, measured in terms of a constant,here the value of a dollar in 2009 – in the US also grew from US $22,739 in1990 to US $34,108 in 2014, an increase of 50 per cent. On average, then,an individual in the US today consumes 50 per cent more goods andservices than what s/he did in 1990. Individual spend has annually grown1.7 per cent in the last 24 years (see Graph 8.3: Per capita real consumptionexpenditure by function).
More absurd The gobble-picture is not surprising at all. Even as the world was meetingin the city of Rio De Janeiro, in June 1992, to discuss how it could
1990
1992
1994
1996
1998
2000
2002
2004
2006
2008
2010
2012
2014
9000
8000
7000
6000
5000
4000
3000
2000
1000
0
Ch
ain
ed (
2009
) U
S d
olla
rs
Housing, utilities, insurance & households appliances
Transport (including insurance but excluding foreign travel)
Other goods & services
Clothing & personal care
Energy
CommunicationEducation
Recreation
Food
Health
Source: Graph generated by Centre for Science and Environment based on data from personal consumption expenditure, 1969-2014, Bureau of Economic Analysis
Graph 8.3: Per capita real consumption expenditure by functionIndividual spend has annually grown 1.7 per cent in the last 24 years

mitigate greenhouse gas emissions, the then US president George Bush Srwas strolling in malls in his country, extolling his people to consume moreto save the failing economy. Americans have taken his message to heart.And keep it there, whether the economy’s failing or not.
What is an average American today spending more on? Americans arechanging the way they consume different products and services. First ofall, even at such a high level of consumption, consumption expenditureis increasing for all goods and services other than two areas.
There has been but a modest increase, 1990-2014, in what Americansspend on food and beverages: about 8 per cent. Over this period,expenditure on housing and transport has increased, respectively 30 percent and 17 per cent. Americans continue to buy more cars and biggerhouses.
The only two areas in which individual spend has actually fallen areeducation and energy, by 15 per cent and 8.5 per cent respectively. Theformer is a surprise. The fall in energy spend is perfectly explainable. AnAmerican’s spend on energy has fallen, but the energy s/he consumes hasincreased: that’s only possible when real energy prices dip.
In this way, an average American is spending less on the basket ofwhat may be called ‘basic necessities’ or ‘essential items’, as compared tonon-essential luxury items.
The maximum growth in an American’s consumption expenditurehas occurred in goods and services related to communication (+250 percent) and recreation (+220 per cent). Spending has also spiked onhousehold furnishing and equipment (+90 per cent), clothes andpersonal care (+70 per cent) and heath care (+46 per cent).
Thus, an ‘individual’ in the US today spends less than half his/herannual consumption expenditure on basics such as food, energy, housingand transport. Consumption growth in the US is, therefore, propelled byservices and non-essential luxury consumption.
Totally absurdThe real absurdity of US consumption levels becomes apparent as soon aswhat Americans consume is compared to what citizens of some othercountries do. In this context, the Centre for Science and Environment(CSE) has compared average American consumption with averageconsumption by a citizen of India. The years for which CSE has completedata to enable such a comparison is for 2011-2012 (see Table 8.1: Averageper capita consumption expenditure in the US and India).
There is absolutely no comparison between the consumptionexpenditure of an average American and an average citizen of India. Inmarket exchange rate (MER) terms, the average per capita consumptionexpenditure in the US is 36 times higher than India’s (US $33,469 vs US
$900). Even in terms of purchasing power parity (PPP), the average percapita consumption expenditure in the US is 10 times higher than India’s(US $33,469 vs US $3,001).
112
+220%the growth in anAmerican’s consumptionexpenditure in goods andservices related torecreation

113
CAPITAN AMERICA
Source: Inforraphics by Centre for Science and Environment based on data from Personal consumption expenditure, 1969-2014, Bureau of Economic Analysis.

114
In MER terms, an average American spends 15 times more on food andbeverages, 24 times more on transportation, 50 times more on housingand household goods & services, more than 200 times on health, andmore than 6,000 times on recreation as compared to an average Indian.
Even in terms of PPP, the consumption in the US is extremely highcompared to India.
The situation begs some very important questions: Is there a limit toconsumption? How much consumption is enough? Can the US continueto increase its consumption and still continue to reduce greenhouse gasemissions?
There is no visible trend to indicate the US has in place a deliberatepolicy to reduce primary energy consumption and reduce consumptionof goods and services. There is no sign of the breakthrough the world islooking for from the ‘indispensible nation’. The Mall-thusian is in theUS’ climate-action vanguard, possibly leading it. He is invisible,omnipotent and chilling-out. In the final analysis, that’s what is reallychilling about this country’s climate-action claims.
Table 8.1: Average per capita consumption expenditure in the US and IndiaIn market exchange rate terms, the US’s is 36 times higher than India’s
Average per capita consumption expenditure India vs. USA
United States: India: 2011-12 US consumption as number of Average times India's consumption2011 & 2012
($US) ($US-MER) ($US-PPP) ($US-MER) ($US-PPP)
Food, beverages & tobacco 5160 324 1079 15.9 4.8
Clothing, footwear, and related services 1158 67 223 17.3 5.2
Housing & household goods & services 7827 154 512 51.0 15.3
Health 7099 33 109 216.8 65.0
Transportation 3447 142 474 24.2 7.3
Communication 828 12 39 70.2 21.1
Recreation 3021 0.5 2 6173.4 1852.0
Education 829 24 79 35.0 10.5
Other goods and services 4099 145 484 28.3 8.5
Total per capita household 33469 900 3001 37.2 11.2consumption expenditures
Notes:
1. CSE has harmonized data of both the countries, for classification of goods and services are not identical. We also had to average consumption data for two yearsfor the US (2011 and 2012) because India’s consumption data is for the period April 2011 to March 2012.
2. Indian rupee has been converted to US dollar using the annual average market exchange rate (MER) published by the Reserve Bank of India. For the year 2011-12,the average exchange rate of a US dollar to an Indian Rupee was 47.9229. The US $ (MER) was converted to US $(PPP or purchase power parity) using the datapublished by the World Bank on Price level ratio of PPP conversion factor (GDP) to MER. For 2011-2012, the conversion factor for India was 0.3.
3. Data on household consumption expenditure is published as part of National Accounts each year. This data gives the total private consumption in a country underdifferent categories of goods and services. Bureau of Economic Analysis (BEA) in the US and the Ministry of Statistics and Programme Implementation (MOSPI) inIndia publish annual data on total household consumption expenditure. CSE has taken this data and converted them in per capita terms using estimated totalpopulation of both countries.

115
CAPITAN AMERICA

116

The minimal context for this book is the Intended NationallyDetermined Contribution (INDC) the US has submitted to the secretariatof the United Nations Framework Convention on Climate Change. Weseek clarity. We need adequacy. So we ask: is the US submissionambitious and equitable, as the INDC claims? Does the INDC reflect thecountry’s intention to reduce emissions over time, really reduce in realtime? Is this the beginning of the change the world so desperately seeksfrom the US?
There is a larger context. The Planet has run out of time and carbonspace. Climate change impacts are already devastating large parts of theglobe — the poorest, the most vulnerable, are worst-hit. In large parts ofthe Indian subcontinent and in Africa, farmers face increasing insecurityas weather patterns change and rainfall anomalies become the newnormal. Increasingly, we are witness to season after season of despair.Sowing time or harvesting time or anytime in the middle, the weatherturns ‘weird’, destroying crops. Taking life. Now the weather deals outdeath, impacting everybodu, not just the poor. Today, the signs of whatthe future holds are clear.
President Barack Obama was right when he said, in August 2015 inAlaska, that “Climate change is no longer some far-off problem; it ishappening here, it is happening now.” The world, therefore, has to get itsact together, to cut emissions at a pace and a scale needed to keep Earthsafe. The US, the largest historical contributor of greenhouse gases andthe second largest polluter to date, is a big piece of the global climatechange challenge.
Ambition and equity?
We conclude: the INDC of the US is neither ambitious nor equitable. Mostimportantly, in the existing as well as the expected global climate changeregime, the US will not compromise on the way it eats into the globalcarbon budget. It will continue to appropriate, as disproportionately asbefore, the global carbon space.
In its Fifth Assessment Report, the Intergovernmental Panel onClimate Change published a carbon dioxide (CO2) emissions budget —how much CO2 the world could emit to stay below 2°C warming. Itestimated the world could emit about 2,900 billion tonnes (giga-tonne orGt) of CO2 from all sources, from the dawn of the Industrial Revolutiontill 2100, to avoid catastrophic change.
117
CAPITAN AMERICA
9. The Star-SpangledSpannerWhat this book is about. A reiteration

But by 2011, the world had emitted 1,900 Gt of CO2. Over 65 per centof the global atmospheric commons has already been used up. All thatremains, 2012 to 2100, is 1,000 Gt. This is the shrunken carbon space thatmust be divided between nations in the future. In a context where nocountry, as yet, has been able to delink growth from CO2 emissions, aquestion emerges: who has already emitted in the past — appropriatedthe carbon space — and who now has the right to use that little space inorder to develop?
The US, 1850-2011, emitted 411 Gt CO2 (after accounting foremissions removed by its terrestrial sinks). With roughly 5 per cent of theworld’s population, it has emitted 21 per cent of the world’s total CO2 till2011. What is it now doing to vacate that space, reduce its emissions sothat other countries can grow?
Quite frankly, nothing.The INDC of the US, which promises to reduce emissions by 26-28 per
cent below 2005 levels by 2025, shows the US is planning to appropriateanother 80 Gt CO2. By 2025, then, the US will use roughly 500 Gt of thetotal 2,900 Gt carbon budget available to all countries till 2100. 1850-2100, therefore, it will eat into 17.25 per cent of the global budget. That’snot fair. Not by a long shot.
Also, the US will not stop its emissions in 2025. In fact, in 2025 its totalGHG emissions will be 4,765 Gt CO2e. Its per capita emissions are going tobe 13.5 tonnes. In comparison, the EU has committed to reduce 40 percent below 1990 levels by 2030. This means in 2025 the per capitaemissions of the EU will be 6.5 tonnes — less than half of the US. So, theUS INDC is also not ambitious. Not by a longer shot.
Beginning to change?The US is not ambitious. Its INDC is not equitable. Still, we ask: does thesubmission herald the beginning of the change the world is sodesperately seeking from the US?
The US civil society argues that even if the INDC is not ambitious, itdoes signify the country has taken the first step to reduce its gargantuanemissions. More importantly, regulatory measures it is now taking willensure its emissions continue on a downward spiral. The message is: theUS is on track. Climate action has gathered momentum and the futurewill be different. This is why the US wants, at the forthcoming climateconference in Paris, CoP-21, to sign off on a post-2020 emissions
118
Table 1: Misappropriating Carbon Budget
Total carbon US emitted US will emit Total % of world’s dioxide up to 2011 by 2025 between total carbon budget (Gt) (Gt) (Gt) 1850-2025 (Gt) budget by 2025
2900 411 80 491 17.25
Source: Centre for Science and Environment
119
CAPITAN AMERICA
reduction agreement. Such an agreement, the US insists, will create astable regime, in which all countries will have a pledge to keep, a pledgethat can be reviewed periodically and ratcheted up slowly.
The question here is: has the US indeed put into place measures thatwill increase its ambitions in the future?
We conclude: There is no evidence of a policy-driven downwardtrend in US GHG emissions post-2005 (2005 is the year US emissionspeaked). In fact, as the economy is picking up, so is consumption andconsequently emissions.
It is true that US GHG emissions are lower in 2013 than 2005, but wesee no relation between such reduction and regulatory actions that willenable long-term change. In 2013, as the economy picked up, emissionsincreased by 2 per cent over the previous year. The US EnvironmentalProtection Agency (EPA) itself accepts that this upward trend is becauseof “increased emissions from electricity generation, an increase in milestravelled by on-road vehicles, an increase in industrial production andemissions in multiple sectors and year-to-year changes in the prevailingweather” (see Box: What the watchdog found).● Emissions from all sectors, barring the industrial sector, are higher in
2013 compared to 1990 levels. There was a recession-led dip inemissions 2007 on, but emissions are climbing up again as theeconomy continues to recover;
● Industrial sector emissions, 1990-2013, are lesser largely because theUS has outsourced manufacturing and production of goods. In thisperiod, consumption of goods has skyrocketed; imports of goods,particularly energy-intensive industrial supplies, have surged.Therefore, this cannot be counted as a ‘reduction’.
● Emissions from cars, which contribute 42 per cent to the US transportsector’s emissions, are increasing. 2005-2013, emissions from thesector as a whole have annually reduced, by 1.4 per cent. Butemissions from passenger cars have increased 1 per cent. 2014 on, carsales are up and are expected to break new records. With the price ofmotor gasoline (petrol and diesel) remaining low, there is no reason tobelieve this trend will be reversed.
We conclude: All US climate change action plans, domestic as well as theINDC, are business-as-usual. They are not turning the economy low-carbon.
The Clean Power Plan (CPP) finalised in August 2015, the country’ssingle biggest measure to reduce emissions from power plants, is neitherambitious nor historical. At best, it can be called ‘business-as-usual’. ● Under this plan, the objective is to reduce CO2 emissions from the
power utility sector — 32 per cent, by 2030, below 2005 levels. But thisplan only reflects what is already happening in the US energy sector.Market economics, not climate change considerations or policy, rule.
Natural gas, particularly shale, has made huge strides in the past fewyears. It is cost-effective to use to generate and the US has alreadyovertaken Russia in gas production. As a result of this switch, thecontribution of coal-based power plants to electricity sector emissionshas come down, from 85 per cent in 2005 to 77 per cent in 2014.Emissions from the electricity sector have reduced 1.8 per centannually. At this ‘business-as-usual’ rate, by 2030, emissions from theelectricity sector will be down by more than 35 per cent. But CPP’s
120
What the watchdog foundThe truth about US emissions, year-on-year
The Environmental Protection Agency (EPA) of the US has published an inventory of US greenhousegas emissions. A remarkable piece of documentation, the inventory provides a candid picture ofexactly what has been going on in the US. Among other revelations, the inventory nails the lieabout US emissions reduction since the 2005 ‘peak’.
EPA explains the year-to-year changes in emissions in the US in recent years1:
● 2009-2010: Emissions from fossil fuels increased by 3.3 per cent, the largest annual increasein CO2 emissions for the 24-year period from 1990 to 2013. It was due to increase in economicoutput, higher coal consumption and the hot summer of 2009.
● 2010-2011: Fossil fuel emissions decreased by 2.5 per cent. A rise in natural gas use and highercar fuel costs, which led to lesser miles travelled, were the reasons. A significant increase ingasoline price led to 1.2 per cent lesser energy consumed. In addition, the price of coal was upwhile gas prices went down; that led to a 5.7 per cent decrease in coal used to generateelectricity and a concomitant 2.5 per cent increase in natural gas use. Though a fossil fuel, gashas lower carbon intensity. Its use produces lesser emissions. Hence the dip.
● 2011-12: Emissions from fossil fuels decreased 3.9 per cent, primarily because of a switch frommore expensive coal to cheaper natural gas. Coal consumed to generate electricity reduced12.3 per cent; gas use increased 20.4 per cent. Weather conditions, in addition, were good. Soheating-degree days — days below or above 65° F (18°C) — decreased by up to 12.6 per cent.People used less energy to heat or cool their homes, and so natural gas consumed in theresidential and commercial sectors was down roughly 20 per cent. Thus, it was a shift torelatively cleaner gas and its lesser use that gave the US the opportunity to boast aboutcleaning up.
● 2012 to 2013: Once again, CO2 emissions from fossil fuel combustion increased 2.6 per cent. Theprime culprits were the residential and commercial sectors, homes and offices. The weatherwasn’t favourable. Heating-degree days increased 18.5 per cent. Cooler weather led to a 30 percent rise in direct use of fuels (wood, coal or gas) in homes. Electricity use in heating rose 2 percent. At the same time, the price of natural gas went up; its use in the electricity sector fell 10per cent. Power plants shifted back to coal. In 2013, industrial production went up 2.9 per cent;the sector’s emissions rose 4.2 per cent. This is a trend that needs watching. For, this used tobe the only sector showing a fall in greenhouse gas emissions.

intended target is 32 per cent: so CPP reflects, at best, what will happenin any case, because of falling prices of gas and the cost-effectivenessof generating power from this relatively cleaner fossil fuel source.
● Under the best and most-climate-progressive scenario CPP hasprojected, the US will still produce 22 per cent more primary energyin 2030, over 2013 levels. And this energy system will remain firmlylocked into fossil fuels. In 2013, 78 per cent of the country’s totalprimary energy came from fossil fuels. In 2030, 76 per cent will comefrom fossil fuels.
● In the current as well as all future scenarios, the US shift torenewables remains marginal. The contribution of renewables in thecountry’s primary energy consumption has increased just 3 per centbetween 1990 and 2014. Under CPP, renewables in 2030 willcontribute 15 per cent of the country’s primary energy production.But once we realise that, in 2013, renewables contributed 9 per cent,it becomes evident this shift is illusionary. It is not happening.
● The shift to natural gas to generate electricity will not reduceemissions in an energy growth scenario. This is because the US isunder-estimating the future role of methane — the GHG emitted allthrough the natural gas production-to-use cycle — in its emissionsreduction plans. The US is underestimating this GHG’s globalwarming potential. Emissions due to leakage during production andtransport are also underestimated. According to the InternationalEnergy Agency, even if three per cent of methane leaks from naturalgas extracted from shale rock formations — called shale gas, thepredominant source of US natural gas production today and in thefuture — or during production or transport or consumption, naturalgas loses its advantage over coal. There is, therefore, enormousuncertainty about emissions related to the natural gas cycle.Combined with the fact that total energy consumption will increasesubstantially, US plans for clean power is not merely business-as-usual. It could, in reality, be regressive.
● In all, the US plan for clean power does not make the transition torenewables. Instead, it remains firmly locked-in into a fossil fuelenergy future. The US is neither bold nor transformational, butbusiness-as-usual, because the switch to natural gas, which is leadingto lower emissions from coal-based power plants, is ocurring becauseit is cheaper for the US to do so. In fact, the future could be grimmer:CPP is based on the assumption that shifting to relatively cleanernatural gas will obviate the need for emissions reduction in energyproduction and consumption. The country can produce more and consume more, because this electricity will not be based on‘dirty coal’. But given the uncertainty about deadlier methaneemissions from natural gas, this unrestrained growth in energyproduction could be disastrous for a cleaner future, for the US as wellas for the world.
121
CAPITAN AMERICA
122
We conclude: the use of efficiency standards in the transport andbuilding sectors to curtail emissions is not working and will not work infuture, unless there is a brake on consumption.
The US government’s climate action plans are based on one principle:efficiency. It will reduce emissions by taking aggressive measures toimprove energy efficiency. It has mandated greater energy efficiency forvehicles, appliances and buildings. But our analysis clearly shows thispresumption, this policy path, is deeply flawed. US consumption patternsare not changing. In fact, all trends show that as the economy is pickingup people are buying more cars, more appliances and building biggerhomes and offices. All efficiency gains are being squandered away.● Take the transport sector. 1990-2013, the fuel economy of US vehicles
improved by 16 per cent, but miles travelled by vehicles increased 7per cent. This means real-time fuel consumption reduced only 7.7per cent. The gain of emissions reduction because of fuel economystandards has vapourised because people are driving more. The US government has notified further fuel economy standards,
expected to reduce CO2 emissions by 35 per cent by 2025. But, firstly, itis well known that fuel economy in showrooms is drastically differentand lower than when vehicles ply on the road. Also, car sales are up and,by 2017, are expected to break the previous high record of 2000. Theprice of gasoline remains constant and there is nothing in US policy thatrestrains vehicle-driving — passenger cars or goods vehicles. Therefore,there is no reason to believe the future will not be more of the present.The 35 per cent emissions reduction that underpins the US climate actionplan for vehicles could well turn out to be a dud, or close to it.
Indeed, there is no real change in the way the US travels. Over 86 percent people travel to working using a car or a van; only 9.4 per centcarpool. The use of public transport to commute remains at a mere, andinconsequential, 5 per cent. This has also not changed in the last decade.As many people drove in the 1990s as they did in the first decade of the21st century. Even in congested cities, public transport has not pickedup: the highest decline in automobile commuting was in Greater SanFrancisco and that was only 4 per cent between 2006 and 2013. In othercities, 75-80 per cent people commute using a car. In this situation,however efficient a car becomes in terms of fuel usage, it will not reduceemissions. Young or old, people will just buy more and drive more.
In the US, over 70 per cent of the goods moved from one destinationto another are done so on trucks. Trucks contribute 23 per cent of US
transport sector emissions. Though it is well-known the railways aremuch more fuel- and emissions-efficient, its share is not growing. This ispartly because of changed consumer behaviour: online-shopping andjust-in-time delivery. This, combined with the lack of investment in therailways, as well as lower costs of fuel that makes the trucking businesscompetitive and profitable, will make sure these emissions continue toincrease.

● Take the residential and commercial sector. 1980-2009, energyintensity in the household sector of the US declined a whopping 37per cent. Home insulation improved; space heating and cooling, andappliances used in homes and offices, became more energy-efficient.But in the same period, more houses were built and the size ofhouses increased 20 per cent. The enormous gains that could havebeen made were lost. 1980-2009, delivered energy to US householdsincreased from 9.3 quadrillion British Thermal Units (quads) to 10.2quads, an increase of 9 per cent. This trend continues. Each subsequent decade, the size of buildings
has increased. The average size of commercial buildings in the 1960s was12,000 square feet (sq ft); in 2012, it increased to 19,000 sq ft. Averagesize of homes was 1,800 sq ft, which has now grown to 2,400 sq ft. As aresult, electricity sales to the commercial and residential sector areincreasing year on year, irrespective of increased efficiency.
It is the same with appliances. The US Energy InformationAdministration (EIA) notes that in the last decade, even as energy neededto heat or cool houses has come down, total energy used in the residentialsector has not decreased. This is because the use of ‘efficient’ appliancesincreased dramatically, constituting 35 per cent of household energyconsumption in 2009. This trend is expected to continue. In this way,too, the US government’s plans to cut emissions will be decimated.
Why is change not happening?The US is doing things in a business-as-usual manner, it does not wantchange. Certainly not change we can believe in. So, the fact that the US
is not putting its economy on a low-carbon path is clear. The question is:why? It has the technological and economic prowess to be the climatechange leader. So why is it not leading?
We conclude: economic growth and consumption is non-negotiablefor the US. It wants to ‘solve’ the climate puzzle, without doing anythingthat will change the status quo. It wants the ultimate win-win —consume but not pollute. But as our analysis shows, till the time the US
stays away from Consumption — the other C-word — the world will notbe able to tackle climate change.
Consumption is the marauding elephant in the US emissionsreduction room. It figures nowhere in US action plans on climate change.If this elephant is not reined in, there can be no emissions reduction —serious or non-serious.
Consumption is directly related to the price of energy. In the case ofthe US, energy prices have remained low and getting lower. An averageAmerican spends less on energy than what s/he did in 1990. In 1990, anaverage American spent 7.2 per cent of her/his annual personalexpenditure on energy. In 2014, s/he spent 4.7 per cent. Such spending isone of the lowest in the world. 1990-2014, the urban consumer priceindex increased 81 per cent, but per unit cost of residential electricity
123
CAPITAN AMERICA

reduced 12 per cent. The result: per capita electricity consumption wentup from 11,373 kilo-watt hour/annum (kWh/annum) in 1990 to 12,113kWh/annum in 2014. All policy prescriptions to reduce emissions havebeen thrown out of the window.
Such numbers make more sense when we realise the US has thehighest per capita household consumption expenditure in the world —in 2013 (at constant 2005 US $), double that of an EU-28 household, 24times a Chinese one, 44 times an Indian’s, 64 times a household inBangladesh and 173 times a Malawi household.
Consumption expenditure in the US has also increased dramaticallysince 1990. The index of total personal expenditure on goods — ameasure of a person’s yearly spend — is up by 120 per cent; services 80per cent. In terms of value, the US has doubled its total consumption ofgoods and services. An average American consumes 50 per cent moregoods and services in 2014 than what s/he did in 1990. The real annualgrowth in personal expenditure has been 1.7 per cent since 1990.
Expenditure has gone up for most goods and services. But spendinghas skyrocketed — as in any rich society — on what can only beconsidered luxury consumption: recreation, furnishing, cars, houses,clothes and personal care. Can a 220 per cent more expenditure onrecreation, 1990-2014, be considered essential?
This out-of-whack consumption is also the world’s opportunity toreduce emissions. First, there is huge inefficiency in the US. Housesthere are bigger than what Germans, the Japanese or the British build. Atypical American household consumes 2-3 times more electricity thantheir rich counterparts in Europe. They own more cars than other richpeople of rich countries. They do not use public transport. They do notuse the railways to transport their goods. They waste so much food thatit is shameful. All-round flab, that provides an easy opportunity to reduceemissions. It is not as if Europeans live in poverty. It is not as if thischanged lifestyle will mean lack of wealth or well-being. The Planetcannot sustain the lifestyle of one America, let alone two or many.
In sum: if there is a limit to emissions in the world, then there also hasto be a limit to consumption — unless the world learns to grow withoutcarbon. Should there, then, be a limit on non-essential or luxuryconsumption, so that survival-related emissions and consumption-related spew can be shared across the world? Changing consumptionpatterns has to be on the high table of climate change negotiations.Otherwise, we are signing our common death warrant. Nothing less.
Why then is the US so bullish on climate change? President Obama and his Secretary of State John Kerry are going aroundthe world exhorting their counterparts to act on climate change. There isthe Obama-Xi ‘deal’, the Obama-Rousseff ‘deal’ and so on and on.President Obama now mentions climate change in practically all hisspeeches. What is happening?
124
We conclude (sadly): the apparent change of stance is not a changeafter all. The US is doing everything so that it can to continue withbusiness-as-usual and this will then shift the burden of transition toothers.
The US has adopted an aggressive strategy to convince the world it istaking a leadership role on climate change. So, at every opportunity, amassive PR exercise unfolds, to show the world that what the US is doingis ambitious and historic. It doesn’t want anyone to question its claims.Its claims are false. So the noise.
The problem is this BAU approach of the US directly translates toshifting the burden of transition to others.
Take the case of renewable energy. The US should have been leadingthe world in renewable energy investments. But it is not. In the last threeyears (2012-2014), the share of the US in total global investment inrenewable energy has averaged 15 per cent. China, on the other hand,has accounted for 27.5 per cent of the total global investment inrenewable energy in this period. In 2014, the US accounted for 14 percent of global investment in renewable energy; China’s contribution was31 per cent and Europe another 21 per cent. China and Europe,therefore, are bearing the burden of transition to renewable energy.Large-scale investments in China mean that the global prices ofrenewable technologies are coming down, allowing other countries,including the US, to benefit from cheaper renewables. It should havebeen other way round, considering the responsibility and capability ofthe US.
Even India is sharing more of this burden than the US. In 2014, the US
invested US $38.3 billion in renewable power and fuels. This wasequivalent to 0.2 per cent of its GDP. In comparison, in 2014 Indiainvested US $7.4 billion on renewables, or about 0.3 per cent of its GDP.In fact, India has set itself a goal to install 100 gigawatts (GW) solar powerand 60 GW wind power capacity by 2022. In 2022, India will have at least170 GW of solar and wind power capacity. The US will reach this level onlyin 2025.
In this way, the US has passed on the burden of shifting to renewablesto other countries. Countries like India are installing renewables whenthey are expensive; the US turns to renewables only when they comecheaper.
The US doesn’t want even a perception to go around that climatechange will cost its economy. In its preamble to the Clean Power Plan,the US EPA has communicated to the American citizen that when CPP isfully implemented, “electricity bills would be expected to be roughly 8percent lower than they would been without the actions in state plans”.1
The US only wants win-win for itself, even if it is loss-loss for other.Loss-loss it will be for most developing countries, for not only will theyhave to reduce emissions, but also spend hugely on adaptation.
The win-win approach of the US has transformed the UN Climate
125
CAPITAN AMERICA

Change Convention from a forum where every nation was supposed totake action based on “common but differentiated responsibilities andrespective capabilities” to a forum where now nations are competing in arace to the bottom. Today’s climate action vocabulary accepts ‘bottom-up’, ‘nationally determined action’ and ‘voluntary’. These are US
inventions. To suit only the US.It is pertinent at this juncture to remember what happened on July
25, 1997. On that day, the US Senate passed a resolution — the Byrd-Hagel resolution, passed 95-0 — that it made no sense for the US to be asignatory to any global action on reducing GHG emissions. At that time,global climate change negotiations had swiftly concluded GHG emissionshad to be reduced, and reduction had to begin in the developed world. Aprotocol was in the offing. Global climate change action was on anupsurge.
States the resolution: “the proposals under negotiation, because ofthe disparity of treatment between Annex I Parties [developedcountries] and Developing Countries and the level of required emissionreductions, could result in serious harm to the United States economy...”[emphasis added]. The resolution resolves: “the United States shouldnot be a signatory to any protocol to, or other agreement regarding, theUnited Nations Framework Convention on Climate Change of 1992, atnegotiations in Kyoto in December 1997, or thereafter...” [emphasisadded].
The resolution is still in force.So, the big question confronting the world is: should the climate
convention again be tailored — as was done in Cancun in 2010 andDurban in 2011 — to suit the convenience of the US? Or, should theworld come together to fashion a global deal, which will suit theconvenience of the poor and the most affected?
This is the issue in Paris. Nothing more. All else is optics androadshow.
126

References1. Misprison?
1. Tubman, Michael 2015, ‘President Obama’s Climate Action Plan: Two Years Later’, Centrefor Climate and Energy Solutions.
2. Anon 2014, ‘Message by the Secretary of State, Washington’ in ‘2014 CAR: United StatesClimate Action Report 2014’, US Department of State, p 2.
3. Anon 2014 ‘First Biennial Report of the United States of America’ in ‘2014 CAR: UnitedStates Climate Action Report 2014’, US Department of State, p 7.
4. Anon, 2015 ‘Inventory of U.S. Greenhouse Gas Emissions and Sinks: 1990-2013’ U.S.Environmental Protection Agency, p 28.
5. ibid., p 766. ibid.7. ibid., p 298. ibid., p 76.9. ibid., p 7710 ibid., p 33.11. ibid., pp 77-7812 ibid., p 33.13 ibid., p 31.14. A calculation by the Centre for Science and Environment based on the US INDC projection
and the US EPA’s emissions inventory dataset.15. Anon, 2015 ‘Inventory of U.S. Greenhouse Gas Emissions and Sinks: 1990-2013’ U.S.
Environmental Protection Agency, p 44. 16. CAIT, World Resource Institute17. Anon, 2015 ‘Inventory of U.S. Greenhouse Gas Emissions and Sinks: 1990-2013’ U.S.
Environmental Protection Agency, p 45.18. ibid., p 44.19. Anon 2014, Global Carbon Budget Factsheet, Centre for Science and Environment.20. ibid. 21. A calculation by the Centre for Science and Environment based on the US INDC projection
and the US EPA’s emissions inventory dataset.
Box: US INDC: a glance1. Anon 2015, ‘US Cover Note INDC and Accompanying Text’, as accessed at:
http://www4.unfccc.int/submissions/indc/Submission%20Pages/submissions.aspx, p 1.2. Anon 2014, Global Carbon Budget Factsheet, Centre for Science and Environment, p 4.3. Analysis based on INDC comparison.
2. The Guzzle Puzzle
Note: Unless mentioned otherwise, all graphs as well as figures (percentages, numbers) mentionedin this chapter have been generated by the Centre for Science and Environment using two datasets:US Energy Information Administration statistics and BP’s statistical database for 2015. 1. Anon 2014, ‘Message by the Secretary of State, Washington’ in ‘2014 CAR: United States
Climate Action Report 2014’, US Department of State, p 2.2. Friedman, Thomas L., 2014, ‘Obama on Climate Change’, in ‘Sunday Review’, The New York
Times, June 7.3. Warrick, Soby, 2015, ‘White House Set to Adopt Sweeping Curbs on Carbon Pollution’, in The
Washington Post, August 1.4. ibid.
3. Light Years Away
1. Unless otherwise mentioned, all graphs and all calculations within chapter text are based ontwo datasets a) Annual Electricity generator Data, 2013 (Form EIA – 860 Data – Scedule 3 – USEIA) and b) US Greenhouse Gas Inventory of the Environmental protection Agency.
127
CAPITAN AMERICA
2. Haewon McJeon et.al., 2014, ‘Limited impact on decadal-scale climate change from increaseduse of natural gas, Nature Vol 514, No 482–485, 23 October.
3. http://www.washingtonpost.com/blogs/wonkblog/wp/2013/10/21/the-shale-gas-boom-wont-do-much-for-climate-change-but-it-will-make-us-a-bit-richer/
4. http://www.bloomberg.com/news/articles/2013-10-16/low-natural-gas-price-to-hamper-u-s-energy-efficiency-iea-says, as seen
5. Anon 2012, ‘Golden Rules for a Golden Age of Gas’, in World Energy Outlook Special Report onUnconventional Gas, International Energy Agency.
6. Ibid.7. S. Solomon et al. (eds.), ‘Climate Change 2007: The Physical Science Basis’, Contribution of
Working Group I to the Fourth Assessment Report of the IPCC, Cambridge University Press,Cambridge and New York.
8. Shindell, D. et al., 2009, “Improved Attribution of Climate Forcing to Emissions”, Science Vol.326, No. 5953, Washington, DC, pp. 716-718.
9. Howarth, Robert W, ‘A bridge to nowhere: methane emissions and the greenhouse gasfootprint of natural gas’, Department of Ecology & Evolutionary Biology, Cornell University,Ithaca, New York.
10. http://www.washingtonpost.com/blogs/wonkblog/wp/2014/01/29/obama-says-fracking-offers-a-bridge-to-a-clean-energy-future-its-not-that-simple/, as seen
11. http://www.theguardian.com/environment/2011/apr/13/shale-gas-green-message, as seen12. Stevens, P., 2012, “The ‘Shale Gas Revolution’: Developments and Changes”, Chatham
House13. GDP is in terms of current prices. GDP Data sourced from IMF World Economic Outlook,
2015.14. Advancing American Energy, The White House, available at https://www.whitehouse.
gov/energy/securing-american-energy, as seen.15. Enhanced actions on climate change: China’s intended nationally determined contributions,
http://www4.unfccc.int/submissions/INDC/Published%20Documents/China/1/China’s%20INDC%20-%20on%2030%20June%202015.pdf, viewed on September 22, 2015.
16. Renewables 2015 Global Status Report
Box: Why the US is so happy about gas1. http://www.theguardian.com/environment/2011/jun/06/natural-gas-climate-change-no-
panacea?intcmp=122
4. Loco Motion
1. EPA 2014, US Greenhouse Gas Inventory Report 1990-2013, http://www3.epa.gov/climatechange/ghgemissions/usinventoryreport.html
2. EPA, Regulations and Standards, http://www3.epa.gov/otaq/climate/regs-light-duty.htm3. John German 2011, US EPA/DOT supplemental Notice of Intent Regarding Light-Duty
Vehicle Standards for 2017-2025, ICCT http://www.theicct.org/us-snoi-ldv-standards-2017-2025
4. Drew Kodjak 2015 Policies to reduce fuel consumption, air pollution and carbon emissionsfrom vehicles in G20 nations, ICCT briefing paper, May http://www.theicct.org/sites/default/files/publications/ICCT_G20-briefing-paper_Jun2015_updated.pdf
5. Union of Concerned Scientists 2011, Translating New Auto Standards into on-road fuel-efficiency, http://www.ucsusa.org/sites/default/files/legacy/assets/documents/clean_vehicles/Translating-Standards-into-On-Road.pdf
6. Peter Mock, John German, Anup Bandivadekar, Iddo Riemersma 2012, Discrepanciesbetween type-approval and real-world fuel consumption and CO2 values in 2001-2011European passenger cars, ICCT
7. Drew Kodjak, 2015, Policies to reduce fuel consumption, air pollution and carbon emissions from vehiclesin G20 nations, ICCT
8. Drew Kodjak, 2015, Policies to reduce fuel consumption, air pollution and carbon emissions from vehiclesin G20 nations, ICCT
9. Brad Turtle 2015, Car ownership has peaked – or maybe it hasn’t, February 3, in Time.Comhttp://time.com/money/3693978/car-ownership-peak-auto-sales/
10. EIA 2015, US job market and automobile sale trends support growth in gasoline use,September 15, http://www.eia.gov/todayinenergy/
128
11. Aaron M Kessler 2015, 2014 Auto sales jump in US, even with recalls, in The New York Times,January 5 http://www.nytimes.com/2015/01/06/business/us-auto-sales-jump-for-2014.html?
12. Ralph Buehler and John Pucher 2012, Demand for Public Transport in Germany and the USA:An Analysis of Rider Characteristics, Transport Review, School of Public International Affairs,Virginia Tech, Alexandria, VA, USA; available at http://nhts.ornl.gov/2009/pub/Demand -ForPublicTransport.pdf
13. National Geographic Greendex Report 2014, http://environment.nationalgeographic.com/environment/greendex/
14. The Economist Explains 2013, Why don’t Americans ride trains, August 29, http://www.economist.com/blogs/economist-explains/2013/08/economist-explains-18
15. World Bank, Air transport, passengers carried, http://data.worldbank.org/indicator/IS.AIR.PSGR
16. Anon 2014, Transport: Low carbon rail transport challenge: action plan, Climate Summit 2014http:/ /www.un.org/climatechange/summit/wp-content/uploads/sites/2/2014/07/TRANSPORT-Action-Plan-UIC.pdf
17. DOE 2013, freight transportation modal shares: scenarios for a low-carbon future,http://www.nrel.gov/docs/fy13osti/55636.pdf
18. Association of American Railroads 2015, Rail Intermodal Keeps America Moving, Mayhttps://www.aar.org/BackgroundPapers/Rail%20Intermodal.pdf
19. Rob Perk 2012, Now is the time for more transit, not less, blog http://switchboard.nrdc.org/blogs/rperks/america_needs_more_transit_not.html
20. The Economist Explains 2013, Why don’t Americans ride trains, August 29, http://www.economist.com/blogs/economist-explains/2013/08/economist-explains-18
21. David L Green and Steven E Plotkin 2011, Reducing Greenhouse Gas Emissions from USTransportation for Pew Centre, available at www.c2es.org/docUploads/reducing-transportation-ghg.pdf
22. Hongchang Zhou, Daniel Sperling, Mark Delucchi, and Deborah Salon, 2001, transportation inDeveloping Countries: Greenhouse Gas Scenarios for Shanghai, China, for Pew Centreavailable at http://www.c2es.org/publications/transportation-developing-countries-greenhouse-gas-scenarios-shanghai-china
Box: More cars in a household means more emissions1. EIA 2015, Households with more vehicles travel more, April
http://www.eia.gov/todayinenergy/detail.cfm?id=20832
5. Buildings
1. EPA Commercial and Residential Sector Emissions available at http://epa.gov/climatechange/ghgemissions/sources/commercialresidential.html
2. EIA 2015, A look at the US Commercial Building Stock: Results from EIA’s 2012 CommercialBuildings Energy Consumption Survey (CBECS), 2015, Energy Information Administration(EIA) available at http://www.eia.gov/consumption/commercial/reports/2012/buildstock
3. EPA Commercial and Residential Sector Emissions available at http://epa.gov/climatechange/ghgemissions/sources/commercialresidential.html
4. EIA 2015, A look at the US Commercial Building Stock: Results from EIA’s 2012 CommercialBuildings Energy Consumption Survey (CBECS), 2015, Energy Information Administration(EIA) available at http://www.eia.gov/consumption/commercial/reports/2012/buildstock
5. EIA 2013, Heating and cooling no longer majority of US home energy use, March 7, availableat http://www.eia.gov/consumption/residential/
6. Ibid7. World Energy Council 2010, Energy and Urban Innovation, London8. Barry Fischer, 2013, America’s energy distribution: the top 1 per cent homes consume 4 times
more electricity than average and why it matters- Opower, available at http://blog.opower.com/2013/03/americas-energy-distribution-the-top-1-of-homes-consume-4-times-more-electricity-than-average-and-why-it-matters/
9. EIA 2009, Residential Energy Consumption Survey assessed at http://www.eia.gov/consumption/residential/data/2009/index.cfm?view=consumption
10. Anon, How big is a house, average house size by country, Shrink that Footprint assessed athttp://shrinkthatfootprint.com/how-big-is-a-house
11. EIA 2011, US households increase use of consumer electronics, May, assessed at http://www.
129
CAPITAN AMERICA

eia.gov/todayinenergy/detail.cfm?id=127012. EIA 2011 Air conditioning in nearly 100 million US homes, http://www.eia.gov/consumption/
residential/reports/2009/air-conditioning.cfm13. Vanessa Barford 2013, 10 ways the UK is ill prepared for a heat wave in BBC news magazine
accessed at http://www.bbc.com/news/magazine-2334169814. Barry Fischer 2012 Hot and Heavy Energy Usage: How the Demand and price for electricity
skyrocketed on a 100°day assessed at http://blog.opower.com/2012/09/hot-and-heavy-energy-usage-how-the-demand-and-price-for-electricity-skyrocketed-on-a-100-day/
15. Barry Fischer and Nate Kaufman 2013, America’s most unpopular way of saving energy is oneof Europe’s favorites accessed at http://blog.opower.com/2013/07/americas-most-unpopular-way-of-saving-energy-is-one-of-europes-favorites/
16. Hermann Amecke, Jeff Deason, Andrew Hobbs et al 2013, Building energy efficiency inChina, Germany and the United States, Climate Policy Initiative assessed athttp://climatepolicyinitiative.org/wp-content/uploads/2013/04/Buildings-Energy-Efficiency-in-China-Germany-and-the-United-States.pdf
17. EIA 2015, Energy efficiency improvements have largely offset effect of more, larger homes,accessed at http://www.eia.gov/todayinenergy/detail.cfm?id=20031
18. Hermann Amecke, Jeff Deason, Andrew Hobbs et al 2013, Building energy efficiency inChina, Germany and the United States, Climate Policy Initiative assessed athttp://climatepolicyinitiative.org/wp-content/uploads/2013/04/Buildings-Energy-Efficiency-in-China-Germany-and-the-United-States.pdf
19. Ibid20. Rachel Young 2014, Global Approaches: a Comparison of Building Energy Codes in 15
Countries, American Council for an Energy Efficient Economy available at aceee.org/files/proceedings/2014/data/papers/3-606.pdf
21. Hermann Amecke, Jeff Deason, Andrew Hobbs et al 2013, Building energy efficiency inChina, Germany and the United States, Climate Policy Initiative assessed athttp://climatepolicyinitiative.org/wp-content/uploads/2013/04/Buildings-Energy-Efficiency-in-China-Germany-and-the-United-States.pdf
6. Industry
1. EPA 2014, US Greenhouse gas inventory report, 1990-2013, available at http://www3.epa.gov/climatechange/ghgemissions/usinventoryreport.html
2. Analysis by the Centre for Science and Environment based on Energy InformationAdministration dataset
3. Anon Targeting the cement industry for energy and carbon reduction, article written forDepartment of Energy Industrial Technologies Program available at http://www.reliableplant.com/Read/23445/cement-industry-energy-carbon-reductions
4. http://www.statista.com/statistics/273367/consumption-of-cement-in-the-us/5. OECD An Initial View on Methodologies for Emission Baseline: Cement Case Study,
available at http://www.oecd.org/env/cc/2390789.pdf6. Portland Cement Association, Concrete thinking for a sustainable world, Factsheet available at
http://cement.org/Briefingkit/pdf_files/PCAFactSheet.pdf7. ClimateTechWiki, Energy efficiency and savings in the cement industry available at
http://www.climatetechwiki.org/technology/energy-saving-cement8. http://www.marketlineinfo.com9. Ben Wolfgang 2015 Obama Targets oil and gas industry, demands massive reduction in
methane emissions in Washington Times, available at http://www.washingtontimes.com/news/2015/jan/14/obama-hits-oil-and-gas-industry-demands-massive-re/?page=all
10. World Steel Association available at https://www.worldsteel.org11. Gwynn Guilford 2014, South Korea consumes more steel per capita than China and Japan
combined available at Anon http://qz.com/214223/south-korea-consumes-more-steel-per-capita-than-china-and-japan-combined/
12. Chandra Bhushan 2010, Challenge of the New Balance, Centre for Science and Environment,New Delhi
13. RITE 2008, International comparisons of energy efficiency, sectors of electricity generation,iron and steel and cement, Research Institute of Innovative Technologies for the Earthavailable at http://www.rite.or.jp/English/lab/syslab/about-global-warming/download-data/E-InternationalComparison_Eeff(ElecIronCement).pdf
130
14. IEA 2008, Energy Technology Perspectives, scenarios and technologies till 2050, Paris
Box: US estimates of methane emissions up in flames1. EPA 2014, US Greenhouse gas inventory report, 1990-2013, available at http://www3.epa.gov/
climatechange/ghgemissions/usinventoryreport.html2. Mark Brownstein 2015 Methane Emissions from Oil & Gas are on the Rise, Confirm Latest
EPA Data, Environmental Defense Fund available at http://blogs.edf.org/energyexchange/2015/04/15/methane-emissions-from-oil-gas-are-on-the-rise-confirm-latest-epa-data/
3. Gayathri Vaidyanathan and Climate Wire, 2015 Methane Leaks from Oil and Gas Wells NowTop Polluters, in Scientific American available at http://www.scientificamerican.com/article/methane-leaks-from-oil-and-gas-wells-now-top-polluters/
4. Chandra Bhushan 2015, Shale Trail, in Down To Earth July 16-31, Society for EnvironmentalCommunications, Delhi
5. David Lyon 2014, Latest EPA greenhouse gas inventory may not reflect full scope of oil andgas emissions, Environment Defence Fund available at http://blogs.edf.org/energyexchange/2014/03/13/latest-epa-greenhouse-gas-inventory-may-not-reflect-full-scope-of-oil-and-gas-emissions/
6. Scott M Miller et al 2013, Anthropogenic emissions of methane in the United States,Proceedings of the National Academy of Sciences (PNAS), available at http://www.pnas.org/content/110/50/20018.full
7. John Sullivan 2014, Abandoned wells can be ‘super-emitters’ of greenhouse gas, PrincetonUniversity available at http://www.princeton.edu/main/news/archive/S41/80/71G06/index.xml?section=topstories
8. Mary Kang et al 2014, direct measurements of methane emissions from abandoned oil and gaswells in Pennsylvania, Proceedings of the National Academy of Sciences (PNAS) available athttp://www.pnas.org/content/111/51/18173.full
9. Mark Brownstein 2015, Oil and gas lobby says up, means down, Environmental Defense Fund,available at http://blogs.edf.org/energyexchange/2015/02/27/oil-and-gas-lobby-says-up-means-down/
7. Agriculture & Waste
1. EPA 2014, US Greenhouse gas inventory report, 1990-2013, available at http://www3.epa.gov/climatechange/ghgemissions/usinventoryreport.html
2. Ibid3. Cris Mooney 2015, The Obama Administration is taking on agriculture’s role in climate change.
Here’s why that’s a big deal in The Washington Post, Mooney, available at http://www.washing -ton post.com/news/energy-environment/wp/2015/04/23/the-obama-administration-wants-to-slash-emissions-from-agriculture-heres-why-thats-a-big-deal/
4. USDA 2015, Secretary Vilsack announces partnership with farmers and ranchers to addressclimate change, US Department of Agriculture available at http://blogs.usda.gov/2015/04/23/secretary-vilsack-announces-partnerships-with-farmers-and-ranchers-to-address-climate-change/
5. FAO 2011, World Livestock Report – livestock in food security, Rome6. John Hopkins, Bloomberg School of Public Health, Health and environmental implications of
US meat Consumption, available at http://www.jhsph.edu/research/centers-and-institutes/johns-hopkins-center-for-a-livable-future/projects/meatless_monday/resources/meat_consumption.html
7. Chinmaya Shalya 2015, Fuming over Food in Down To Earth, available at http://www.downtoearth.org.in/news/fuming-over-food-50806
8. UNEP 2013, Food Waste Facts available at http://www.unep.org/wed/2013/quickfacts/9. USDA The estimated amount, value, and calories of Past harvest Food Losses at the Retail and
Consumer Levels in The United States, US Department of agriculture Economic ResearchService- available at http://www.ers.usda.gov/publications/eib-economic-information-bulletin/eib121.aspx
10. NPR 2014, US Lets 141 trillion calories of food go waste each year: available athttp://www.npr.org/blogs/thesalt/2014/02/27/283071610/u-s-lets-141-trillion-calories-of-food-go-to-waste-each-year
11. NRDC Smarter Living: Eating Well: Saving Leftovers Saves Money and Resources, availableat http://www.nrdc.org/living/eatingwell/saving-leftovers-saves-money-resources.asp
131
CAPITAN AMERICA
12. NRDC 2012, Wasted: How America is Losing Up to 40 percent of Its Food from farm to Forkto Landfill Issue Paper, August, available at http://www.nrdc.org/food/files/wasted-food-ip.pdf
13. Ibid14. Shrink that Footprint, The Food wastage footprint is big, available at http://shrink -
thatfootprint.com/the-big-footprint-of-food-waste15. Andrew Parry, Keith James, Stephen LeRoux, 2015, Strategies to achieve economic and
environmental gains by reducing food waste, The New Climate Economy available athttp://static.newclimateeconomy.report/wp-content/uploads/2015/02/WRAP-NCE_Economic-environmental-gains-food-waste.pdf
16. Ibid
8. The Mall-thusians
Note: Unless mentioned otherwise, all graphs as well as figures (percentages, numbers) mentionedin this chapter have been generated by the Centre for Science and Environment using the dataseton US consumption expenditure provided by the US Bureau of Economic Analysis.
9. The Star-Spangled Spanner
1. http://www2.epa.gov/cleanpowerplan/fact-sheet-clean-power-plan-benefits, as viewed onSeptember 5, 2015.
Box: What the watchdog found1. Anon, 2015 ‘Inventory of U.S. Greenhouse Gas Emissions and Sinks: 1990-2013’ U.S.
Environmental Protection Agency, p 77-8
132

CAPITANAMERICA US climate goals: a reckoning
CENTRE FOR SCIENCE AND ENVIRONMENT41, Tughlakabad Institutional Area, New Delhi 110 062Phone: 91-11- 40616000 Fax: 91-11-29955879E-mail: [email protected] Website: www.cseindia.org
CA
PITAN
AM
ER
ICA
US
climate goals: a reckoning
Back Cover Front cover
ISBN: 978-81-86906-87-3
Related Documents


