6/18/2014 1 Holly Billie, MPH Injury Prevention Specialist CDC National Center for Injury Prevention and Control Leanna Fox, MPH Public Health Advisor CDC National Center for Injury Prevention and Control CDC Tribal Motor Vehicle Injury Prevention Program Webinar Division of Unintentional Injury Prevention National Center for Injury Prevention and Control Webinar Schedule Program overview – Holly Billie, CDC Presenters: Hannah Harper – CO River Indian Tribes Gregory Sehongva – Hopi Tribe Danielle Lippert – CA Rural Indian Health Board Lesa Way – SE Alaska Regional Health Consortium Toni Short – Caddo Nation Richard Bracha – Rosebud Sioux Connie Johnson – Oglala Tribe Shannon White – Sisseton Wahpeton-Oyate Questions and answers Overview American Indians/Alaska Natives (AI/AN) 5.2 million AI/AN CA and OK have largest AI/AN population 566 federally recognized tribes • 230 in AK, 102 in CA, 38 in OK, 29 in WA • Sovereign governments • Some state laws are not applicable on tribal lands AI/AN Injuries Unintentional injuries - leading cause of death for ages 1 – 44 and 3 rd overall Leading injury type – motor vehicle crashes The American Indian and Alaska Native Population; 2010 Census Brief http://www.ihs.gov/aboutihs/ CDC WISQARS 05/14 2006–2010, US, Unintentional Injury Deaths Crude rates per 100,000, Ages 1–44, Both Sexes 26.56 28.65 22.28 35.22 8.02 0 10 20 30 40 50 60 All Races White Black AIAN Asian/PI CDC WISQARS 10/13 2006–2010 Unintentional Injury Deaths, US, AIAN ages 1–44, both Sexes 1.8% 1.9% 2% 2% 2% 3% 4% 26.7% 50.6% Suffocation Fire/burn Other land transport Pedestrian Fall Natural Env. Drowning Poisoning MV Traffic N=5028 CDC WISQARS 10/13

Welcome message from author
This document is posted to help you gain knowledge. Please leave a comment to let me know what you think about it! Share it to your friends and learn new things together.
Transcript

6/18/2014
1
Holly Billie, MPH
Injury Prevention Specialist
CDC National Center for Injury Prevention and Control
Leanna Fox, MPH
Public Health Advisor
CDC National Center for Injury Prevention and Control
CDC Tribal Motor Vehicle Injury
Prevention Program Webinar
Division of Unintentional Injury Prevention
National Center for Injury Prevention and Control
Webinar Schedule
Program overview – Holly Billie, CDC
Presenters:
Hannah Harper – CO River Indian Tribes
Gregory Sehongva – Hopi Tribe
Danielle Lippert – CA Rural Indian Health Board
Lesa Way – SE Alaska Regional Health Consortium
Toni Short – Caddo Nation
Richard Bracha – Rosebud Sioux
Connie Johnson – Oglala Tribe
Shannon White – Sisseton Wahpeton-Oyate
Questions and answers
Overview
American Indians/Alaska Natives (AI/AN)
5.2 million AI/AN
CA and OK have largest AI/AN population
566 federally recognized tribes
• 230 in AK, 102 in CA, 38 in OK, 29 in WA
• Sovereign governments
• Some state laws are not applicable on tribal lands
AI/AN Injuries
Unintentional injuries - leading cause of death for ages 1 – 44 and
3rd overall
Leading injury type – motor vehicle crashes
The American Indian and Alaska Native Population; 2010 Census Brief
http://www.ihs.gov/aboutihs/
CDC WISQARS 05/14
2006–2010, US, Unintentional Injury Deaths Crude rates per 100,000, Ages 1–44, Both Sexes
26.56 28.65
22.28
35.22
8.02
0
10
20
30
40
50
60
All Races White Black AIAN Asian/PI
CDC WISQARS 10/13
2006–2010 Unintentional Injury Deaths, US, AIAN ages 1–44, both Sexes
1.8%
1.9%
2%
2%
2%
3%
4%
26.7%
50.6%
Suffocation
Fire/burn
Other land transport
Pedestrian
Fall
Natural Env.
Drowning
Poisoning
MV Traffic
N=5028
CDC WISQARS 10/13

6/18/2014
2
CDC Tribal Motor Vehicle Injury Prevention Program
Purpose: Implement tailored effective strategies
Reduce alcohol impaired driving, increase child safety seat use, and
increase safety belt use
Pilot 2004–2009, four tribes funded at $70K
Results – increased restraint use and decreased injuries and
fatalities through evidence based interventions
CDC Native American Road Safety webpage
CDC Tribal Motor Vehicle Injury Prevention Program
2010–2014
16 applications for $3.92M
8 tribes funded at $2.24M
2011 – supplemental funding for teens
Implement 2 or more effective strategies
Interventions
• Child safety seat distribution
• Improved law enforcement
• Educate about evidence of traffic safety laws
• Education and media campaigns
Activities
Coalition and partnership building, data collection, data analysis,
restraint use observations, presentations, administration.
Effective Strategies
Tribe Seat belt Use Child Safety Seat
Use
Impaired Driving
Prevention
Caddo Nation
CA Rural Indian
Health Board
CO River Indian
Tribes
Hopi Tribe
Oglala Sioux
Rosebud Sioux
Sisseton
Wahpeton Oyate
SE AK Regional Health Consortium
Technical Assistance
University of North Carolina
Robert Letourneau, MPH
Carolyn Crump, PhD
Program planning & implementation
• Conference calls
• Annual site visits
• Annual meetings
• Conference posters & presentations
• Reports to CDC
Indian Health Service
Local support – data collection, site visits
Challenges and Rewards
Challenges
Injury data – tribal or other source
Public Health experience
Long list of requirements, small budget
Relied heavily on partnerships
Tribal circumstances
Rewards
Professional growth
Data collection
Tribes poised for other funding
Sustainability
Best Practice Manual
Future Direction
Partnership with Federal Highway Administration
(FHWA)
Tribal Technical Assistance Program (TTAP) IP Pilot Project
Objectives: Provide injury prevention technical assistance to tribes
in 3 of 7 TTAP centers
Partners: Western, Southern Plains, and Northern Plains TTAP
Regions

6/18/2014
3
For more information please contact Centers for Disease Control and Prevention
1600 Clifton Road NE, Atlanta, GA 30333
Telephone, 1-800-CDC-INFO (232-4636)/TTY: 1-888-232-6348
E-mail: [email protected] Web: www.cdc.gov
Holly Billie
770-488-4712
National Center for Injury Prevention and Control
Division of Unintentional Injury Prevention
The findings and conclusions in this report are those of the authors and do not necessarily represent the official
position of the Centers for Disease Control and Prevention.
The Colorado River Indian Tribes Tribal Motor Vehicle Injury Prevention Program
Hannah Harper, Coordinator 26600 Mohave Road | Parker, AZ 85344 928.669.1253 | [email protected]
Located along the Colorado River in AZ and CA (~300,000 acres)
Parker, AZ is primary community
Four distinct Tribes - Mohave, Chemehuevi, Hopi and Navajo
~4,070 active Tribal members
CRIT’s land base lies in 2 states, 3 counties
CRIT TMVIPP: Effective Strategies
• Reduce alcohol-impaired driving Selected because the police department felt that it was a major concern due to high incidences of DUIs
• Increase safety belt use
Selected because there was no program promoting seatbelt use and CRIT was already receiving carseat program funding
CRIT: Unique Aspects
• Multi-jurisdictional
• First time an “injury prevention” program was administered by the CRIT Police Department
• CRIT received funding from multiple highway safety
programs Tribal Motor Vehicle Injury Prevention Program, CDC Tribal Injury Prevention Cooperative Agreement Program, IHS Indian Highway Safety Program, BIA
• Primary Child Car Seat Law/ Secondary Seatbelt Law • BAC Level of 0.10 for DUI arrest

6/18/2014
4
GOAL:
Reduce motor vehicle crash related injuries and deaths due to lack of seatbelt use and alcohol impaired driving.
TEEN Supplemental Goal:
Reduce alcohol-impaired driving among teens.
OBJECTIVE:
Reduce alcohol-related motor vehicle crash injuries and deaths by 15% by 2014
OBJECTIVE:
Increase adult seatbelt use rates by 20% by 2014
Activities:
• Enhanced Enforcement Events • Outreach events • DUI VIP Panels • Media • Officer Training • Developed Checkpoint Procedures • Community Safety Advisory Board Task Force for Code Revision
Enhanced Enforcement Activities Occupant Protection / DUI Prevention 7 Checkpoints 4 Saturation Patrols Media Activities
• Billboards, Theater Ads
• Radio Ads, Tribal Newspaper
• The Live Campaign
https://vimeo.com/778088811
Outreach Activities
School Events, Recreational Events,
Traditional/ Community Gatherings
KEY PARTNERS
• Law Enforcement
• CRIT Tribal Court
• CRIT Deterrence
• CRIT Attorney General
• Community Coalitions
• CRIT Tribal Injury Prevention Cooperative Agreement Program / Indian Health Service IP
Data Collection Methods & Results
◦ Seatbelt Observations using IHS/UNC protocol
35 locations
2011 – 1,265 obs.
2012 – 1,427 obs.
2013 – 1,138 obs.
◦ Written DUI & Seatbelt Surveys
Conducted in 2011 & 2013, total of 431 survey respondents
Seatbelt Survey Areas: A) Survey Respondent Information; B) Seat Belt Knowledge/Outlook; C) Seat Belt Enforcement Knowledge/Outlook; and D) Seat Belt Use Outreach
DUI Survey Areas: A) Survey Respondent Information; B) DUI Knowledge/Outlook; C) DUI Enforcement Knowledge/Outlook; D) DUI Prevention Outreach/Media; and E) DUI and Injury Prevention
◦ Police Crash Reports
Pre-project data baseline through current 2009-2014.
Seatbelt Warnings/Citations, CSS Warnings/Citations, DUI Arrests, MVCs, MVCs with either injuries or fatalities, Alcohol-involved MVCs.
• Annual Observational Restraint Use Surveys o 35 locations o Every year in June
• Community Awareness Surveys
o Seatbelt Use o DUI o Conducted in 2011 & 2013
• Police Department Records
o Seatbelt/Carseat Warnings and Citations o DUI Arrests o Crash Reports

6/18/2014
5
Year I-2011 (n=1454) Year II-2012 (n=1766) Year III 2013 (n=1172)
Driver 59.6% 66.3% 63.9%
Passenger 53.2% 63.2% 60.5%
Overall 58.2% 65.5% 63.1%
59.6%
66.3%63.9%
53.2%
63.2%60.5%
58.2%
65.5%63.1%
0%
10%
20%
30%
40%
50%
60%
70%
80%
90%
100%
CRIT TMVIPP Seatbelt Use Summary, 2011-2013
Major Changes:
While there was a slight decrease in overall seatbelt use from 2012 to 2013, the percent change (increase) from 2011 to 2013 was 8.4%
Major Changes:
28.9% change (decrease) in total crashes from 2011-2013
46.6% change (decrease) in MVCs with injuries from 2011-2013
Major Changes:
44.8% change (decrease) in MVCs that were alcohol involved (AI) from 2011-2013
56.25% change (decrease) in AI-MVCs with injury or fatality from 2011-2013
29.8% change (decrease) in DUI arrests from 2011-2013
27 29 28
16
0
11
16 17
7
84 87
94
61
0
10
20
30
40
50
60
70
80
90
100
Pre-Project (2009-2010) Year I (2010-2011) Year II (2011-2012) Year III (2012-2013) Year IV (2013-2014)
Nu
mb
er
Years
CRIT TMVIPP Alcohol-Impaired (AI) MVCs Total, AI-MVCs with either Injuries or Fatalities, and DUI Arrests 2010-2014
AI-MVCs Total AI-MVCs With either Injury or Fatality DUI Arrests (#)
Project Start
• Staff turnovers / shortages
• Limited administrative support (i.e. working on policy changes)
• Keeping key partners involved • Collecting certain data (i.e. written warnings that are not regularly tracked)
CHALLENGES
Project Sustainability
• Code Amendment Proposals:
‐ Create primary seat belt law and update child car seat law
‐ Adjust B.A.C. level to .08; Incorporate DUI graduated sentencing
• CRIT TIPCAP will include seat belt use
Lessons Learned
The most effective results in traffic safety
are obtained by incorporating all of the following:
Enforcement Education/outreach Media Policy change
Hannah Harper, Coordinator 26600 Mohave Road Parker, AZ 85344
928.669.1253 | [email protected]

6/18/2014
6
Gregory Sehongva
Hopi TMVIPP Coordinator
Phone: (928) 737-6089
Email: [email protected]
The Hopi Tribe
•
• 2,532 sq miles
• 200 miles NE of Phoenix, AZ
Hopi Health Care Center
Law Enforcement
BIA Hopi Agency Hopi Police Department
Hopi Police/Rangers Tribal Law Enforcement
The Hopi Tribe
Department of Health and Human Services CHR Program
TMVIPP (Hopi Health Care Center)
Law Enforcement (cont.)/Traffic Safety
• Both agencies enforce Hopi Laws
• Historically, BIA enforced traffic & Rangers oversaw range management
• Work independently and cooperatively
Hopi Vs.
Arizona
Safety Belt Requirement Infant/Child Passenger Restraints
Unsecured Passengers in
Trucks
• Hopi • Primary or Secondary? TMVIPP advocating for primary law
• (12) years of age or younger and less than 4’9”
• Applies to passengers under the age of 13
• Arizona
• Secondary • Child restraint under 5 yrs. • Booster 5-7 yrs.
• No restrictions
Effective Strategies
•Increase seat belt use by 25% • Observational Surveys • Provide support for primary seat belt law • Law enforcement checkpoints
•Increase child safety seat use by 25%
• Observational Surveys • Obtain CPS certification • Child Safety Seat Clinics • Recertified expired technicians
By September 2014
Tailored Effective Strategies
Bi-weekly car seat clinics • Available on a regular basis for public • Opportunities for technicians participate • Not all technicians need to be on site
• Open to all community members • Child safety seats are provided free of charge • Expecting mothers encouraged to attend

6/18/2014
7
Partnerships
Hopi CHR Program
IHS Public Health Nursing
IHS Office of Environmental Health
Hopi Injury Prevention Coalition
Hopi Rangers
BIA Law Enforcement
IHS Outpatient Nursing
Short Stay Nursing
Use of Local Media
KUYI Hopi Radio ◦ House Calls
◦ PSA for Booster seats
◦ Community Calendar to announce events
Hopi Tutuveni (Hopi
newspaper)
◦ Announcements
◦ Event posters
Results 4 Law enforcement checkpoints w/ TMVIPP
◦ 2 checkpoints in conjunction with a car seat check event
◦ BIA & Rangers also conducted enforcement checkpoints
◦ Plans for Click it or Ticket events in May 2014
34 Child safety seat events/clinics
579 Child safety seats installed
0 0
63 29
92
0 49
17 26
92
23
156 122
94
395
23
205 202 149
579
Year I (2010-2011) Year II (2011-2012) Year III (2012-2013) Year IV (2013-2014) TOTAL
On-on-One Appts Group Classes Check/Instal Events Total
Occupant Restraint Use (before and after)
Percentage increase of 32.3%
Percentage increase of 36.9% overall
21.7% 31.3% 28.7%
0%
20%
40%
60%
80%
100%
Year II-2012
(n=120)
Year III 2013
(n=64)
Year IV (2014)
(n=101)
Percen
t U
se
Program Years
Hopi Tribe Child Safety Seat Use, 2012-2014
42.0%
53.4% 54.7% 56.0%
30.4% 39.0%
43.4% 45.0% 38.8%
49.6% 51.5% 53.1%
0%
25%
50%
75%
100%
Year I-2011(n=1,378)
Year II-2012(n=1,529)
Year III 2013(n=1,442)
Year IV (2014)(n=1,506)
Perc
ent
Program Year
The Hopi Tribe Seatbelt Use Summary, 2011-2014
Driver Passenger Overall
Changes in leadership while providing support for primary seat belt law
Lack of stakeholder participation (YR I-III)
Required paperwork not completed for CSS distribution
Differing interpretations of seat belt law by local law enforcement agencies
Enforcement and crash data
Lessons Learned/Next Steps
• Pursue opportunities to enhance data collection from law enforcement and other resources
• Continue to build relationships
•Highway Safety Plan
•Injury Prevention Coalition
• What will continue?
• IP Coordinator?
• IHS Program Development Fellowship
• Lasting effects
• passenger restraint laws

6/18/2014
8
Kwakw'ai (Thank You)
Gregory Sehongva
Hopi TMVIPP Coordinator
Phone: (928) 737-6089
Email: [email protected]
Questions?
Buckle up Yurok Danielle Lippert
(916) 929-9761
The Yurok Tribe
• Largest tribe in California
▫ > 5,000 enrolled members
▫ 700 reside on reservation
• Land-based/Reservation
▫ Del Norte and Humboldt counties in
northern California,
▫ 44-mile stretch of the Klamath River, one
mile around the river
TMVIPP Program Administration
• California Rural Indian Health Board (CRIHB) ▫ State-wide agency that serves member tribes ▫ Applies for and helps implement grants ▫ Located in Sacramento, CA ▫ 359 miles from the Yurok Reservation ▫ Plans activities and manages funding program
• Yurok Police Department ▫ Located on the Yurok Reservation in Klamath, CA ▫ Implements program activities/assist with data
collection locally
359 miles/6.5 hours driving Varied communication channels:
Phone Calls (regular) Emails (frequent) Site Visits (average 5/year)
Traffic Safety for the Yurok Tribe
• Yurok PD ▫ Cross-deputized ▫ Road/River Patrol, criminal investigation, disaster
services
• Enforcement of Traffic Safety Laws
▫ No Tribal restraint use laws at program start ▫ Progress made to draft a new traffic code Follow CA’s restraint use primary law
▫ CA is PL-280 state = jurisdictional issues
6/18/2014
9
Additional Key Program Partners
• Yurok Tribal Court
• Crescent City California Highway Patrol (CHP)
• United Indian Health Services (UIHS) Clinic Staff
• Local Youth Leaders a Klamath River Early College of the Redwoods (KRECR)
Program Objectives/Selected Strategies
• Increase child safety seat use (5%/year)
▫ Enhance/enforce existing child occupant restraint laws
▫ Enhanced enforcement campaigns
▫ Distribution and education programs
• Increase seat belt use (5%/year) ▫ Enhance and enforce existing safety belt restraint laws
▫ Enhanced enforcement events
Child Safety Seats (CSS)
• CSS Installation Events (n=16)
• CSS distributed (to date) (>260) • Safe Native American Passengers
(SNAP) Courses (n=3) ▫People Trained (n=36)
• NHTSA courses (n=3)
▫ Yurok Tribe Employee CPS Certified Technicians (n=24)
Enforcement Events and Media
• Enhanced Enforcement Events
▫ 1 checkpoint, 4 roving patrols
• Yurok today, The Triplicate, and CRIHB Tribal Advisor
▫ *6 Articles published
• Bicoastal Radio
▫ 4 PSAs broadcasted
▫ 180 likes
Policy Change – Yurok Traffic Code
• Research and education about primary laws ▫ Fall 2010-2012
• Introduced to Tribal Council ▫ Fall 2011
• Considered/debated by Council ▫ January-October 2012
• Passed by Tribal Council ▫ October 12, 2012
• ‘Grace-Period’ ▫ November 2012 -- present
• PD Chief/Staff turnover ▫ August 2013
• Implementation ▫ On-going at discretion of officers ▫ Used often for probable cause
BUY Teen Coalition
• 9 Youth Leaders
• 10 Conference Calls
• 3 Coalition Meetings
• 2 Booths Hosted by Youth Leaders
• 3 CSS Events
6/18/2014
10
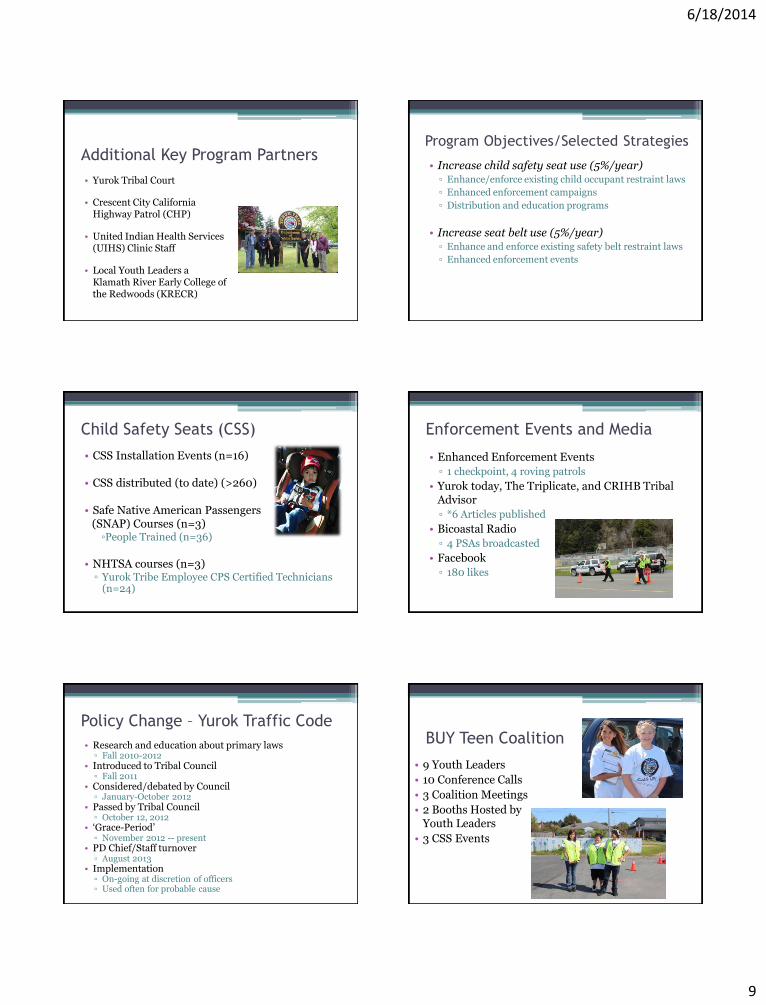
Seatbelt Use Child Safety Seat Use
53.0%
60.4%
64.3%
0.0%
10.0%
20.0%
30.0%
40.0%
50.0%
60.0%
70.0%
Year I-2011 (n=45) Year II-2012 (n=49) Year III 2013 (n=70)
Yurok CSS Use Rate, 2011-2013
Program Sustainability
• Child Safety Seat Violation Fee Diversion Program
▫ April 2014
• CPS Certified Technicians
• Ride Safe Curriculum at Head Start Sites
▫ Students (n=~125)
• The Yurok Tribal Safety Plan
Challenges
• Staff Turnover
▫ Yurok PD, UIHS, TMVIPP
Coordinator
• Lack of Yurok-specific Data
▫ Difficulty in obtaining data
• BUY Teen Coalition Participation
▫ School Closure
Lessons Learned
• Establish more than 1 point of contact
▫ Turnover
• One Community Champion=
▫ Huge Impact
Questions?
Danielle Lippert [email protected]
(916) 929-9761
Thank you for your time.

6/18/2014
11
SouthEast Alaska
Regional Health Consortium
Tribal Motor Vehicle Injury
Prevention Program
Lesa Way
Injury Prevention
Specialist
Southeast Alaska
Juneau Traffic Safety
Law Enforcement
• Juneau Police
Department
• Alaska State Troopers
Laws
• Primary seat belt law
• Primary child restraint
law includes use of
booster seat
Unique to Juneau Alaska
• Geography
• Not a land based tribe
• Hub community
• Weather
• Daylight hours
Project Objectives
Increase restraint use
Community wide by 8%
High school age drivers by 10%
Increase car seat use Community wide by 8%
Head Start Program of Central Council Tlingit
Haida Indian Tribes of Alaska (Tlingit Haida)
Seat Belt Use Activities
Community Media
High School (n=2) Peer to Peer education
Pledge drives
Promote seat belt use
Seat belt use observations

6/18/2014
12
Car Seat Use Activities
Community Media
Presentations
1-on-1 carseat installation & education
Car seat check events
Central Council (CCTHITA) Safe Native American Passenger (SNAP)
Training:
11 Head Start teachers
9 Village Public Safety Officers
75.1%
85.4%
75.1% 76.1%
84.40%
80.20% 81.60%
89.3% 88.1% 86.1%
90.0%
84.0% 84.0%
0%
10%
20%
30%
40%
50%
60%
70%
80%
90%
100%
Year I-2011 (n=788) Year II-2012 (n=604) Year III-2013 (n=688) Year IV-2014 (n=854)
SEARHC, Alaska, and National Seatbelt Use, 2011-2014
SEARHC Juneau Alaska National
Child Safety Seat Installation
a Through April 2014 b August of year three Head Start became a partner
At Check events During one-on-one
Education and Installation Totals b
Year I (2010-2011) 14 106 120
Year II (2011-2012) 2 75 77
Year III (2012-2013) 8 8 16
Year IV (2013-2014) a 9 9
Totals 24 198 222
Challenges
• Weather and day light hours
• Seat belt surveys and students
• Staff turn over
• Geography
• TMVPP funding amount not adequate
Leveraged Support
• Alaska Native Tribal Health
Consortium
• SouthEast Alaska Regional
Health Consortium
• Alaska Highway Safety Office
• Department of Public Safety
• Juneau Empire
Sustainability
• Invited back to Head Start for yearly training
• High Schools continue yearly peer to peer
• Connect schools to funding sources
• Seeking ways to continue car seat program
• Seeking grant funding to continue program

6/18/2014
13
Questions
Lesa Way
907-966-8804
Caddo Nation
Tribal Motor Vehicle
Injury Prevention
Program
Antoinette Short,
Program Director
Caddo Nation Background
• Caddo Indians lived in the areas of southwest Arkansas,
northwest Louisiana, southeast Oklahoma and Northeast Texas
• Ceded their land in Louisiana to the United States government in
1835
• 5,111 enrolled members
• No reservation (Tribal Jurisdictional Areas/ Tribal Allotted Land)
18 Miles North of Anadarko
TMVIPP Effective Strategies
• Implemented three interventions in Caddo County, OK
Increase child safety seat use
Increase seat belt use
Reduce alcohol-impaired drivers
• Multiple sources of evaluation data:
Restraint use data collected across Caddo County
Enforcement data collected from multiple jurisdictions
MVC and MVC Injury/Fatality data collected through
Oklahoma Highway Safety Office
TMVIPP/Law Enforcement Collaboration
• No tribal police or tribal court system
Tribe uses BIA Law Enforcement Agency and Court of
Federal Regulations (CFR) court system of Anadarko, OK
BIA Law Enforcement follows the Oklahoma State Traffic
Laws
• Collaborated with multiple law enforcement agencies in Caddo
County
Oklahoma Highway Patrol
Anadarko Police Department
Binger Police Department
Bureau of Indian Affairs
Program Implementation Activities
Obj 1: Increase child safety seat use by 5% by 2014
• One-on-one education on child safety seat
• Child safety seat checks & events
• Media Campaigns
• National CPS Certification
• Child safety seat observational surveys
• Advised groups about Tribal efforts
• State and Federal organizations
• Key focus: Enhanced installation, use, and enforcement of
child safety seats

6/18/2014
14
Program Implementation Activities
Obj 2: Increase seat belt usage by 5% by 2014
• High school presentations
Alive at 25
Victim Impact Panels
• Media Campaigns
• Enhanced enforcement collaboration (e.g., click it or ticket)
Checkpoints/Saturation patrols
• Seat belt observational surveys
• Collect and summarize Caddo County/State MVC data
• Advised groups about Tribal efforts
• Key focus: improve tracking and sustainability of restraint
use enforcement activities
Program Implementation Activities
Obj 3: Reduce alcohol-related MVC injuries/fatalities by 5% by
2014
• High school presentations
• Media Campaigns
• Enhanced enforcement collaboration (e.g., Drive Sober)
DUI Checkpoints/Saturation Patrols
Collect and summarize data
Alcohol-related MVCs
Alcohol-related MVC injury and fatality
• Advised groups about Tribal efforts
Key focus: led to expansion of enforcement efforts in
surrounding counties
Collaboration Focus
Enforcement
• Highway Patrol
• Highway Safety Office
• BIA Law Enforcement
• Anadarko Law Enforcement & Fire Department
Strengthening Laws/Traffic Safety
• Oklahoma Injury Prevention Advisory Committee
• Oklahoma Safe Kid Coalition & Executive Board
• Metro Area Traffic Safety Committee
• Drive Aware Oklahoma Committee
• Southern Plains TTAP
Media
• Anadarko Daily News
• Settles Studio
Media Examples
Results Related to Child Safety Seat Use
CPS Certification
58 CPS Techs Trained
17 Law Enforcement CPS
Techs
2 Native American CPS
Instructors 26 students attended
SNAP Course
Education and Installation
432 seats installed
120 seats checked
Child Safety Seat Citations
Pre TMVIPP 34
Year I 47
Year II 31
Year III 60
Year IV TBD
Results Related to Seat Belt Use
Seatbelt Use Citations
Pre TMVIPP 359
Year I 510
Year II 383
Year III 782
Year IV TBD
Media
Billboards (n=3)
Radio PSAs (n=3)
News Releases (n=8)
Posters (n=575 total, 3 of each)
Window Clings (n=250)
High School Education
Alive at 25
• Courses (4-hour) (n=13)
• Officers trained (n=7)
Victim Impact Panels (n=6)

6/18/2014
15
391
368 369
351
178
163 164
148
77% 74% 77%
56% 74%
0
50
100
150
200
250
300
350
400
450
Pre-Project (2009-2010) Year I (2010-2011) Year II (2011-2012) Year III (2012-2013)
Num
ber
Program Years
Caddo Nation TMVIPP MVCs Total, MVCs with either Injuries or Fatalities and Observed Restraint Use, 2009-2013
MVCs Total MVCs w/either Inj or Fatl Seatbelt Use (%) CSS Use (%)
Project Start
Results Related to Alcohol-Related
Motor Vehicle Crash Injuries/Fatalities
Enhanced DUI Events (n=8) Alcohol-Related MVC Injuries
Pre TMVIPP 31
Year I 30
Year II 23
Year III 34
Year IV TBD
Alcohol-Related MVC Fatalities
Pre TMVIPP 5
Year I 9
Year II 2
Year III TBD
Year IV TBD
61
56
43
52
37 38
25
48
110
94
140
79
0
20
40
60
80
100
120
140
160
Pre-Project (2009-2010) Year I (2010-2011) Year II (2011-2012) Year III (2012-2013)
Num
ber
Years
Caddo Nation TMVIPP Alcohol-Related (AR) MVCs Total, AR-MVCs with either Injuries or Fatalities, and DUI Arrests 2009-2013
AR-MVCs Total AR-MVCs With either Injury or Fatality DUI Arrests (#)
Project Start
Lessons Learned What I learned from being involved with TMVIPP?
o Education: Request for Alive at 25
o Child Safety Seat: improved knowledge /hands-on steps
o Training: seek training for partners
o Media: Use local citizens for messaging
o Enforcement: Saturation Patrols v. checkpoints
o Data Collection: Need more years of data to see trends
o Partnerships: Improved relationships with BIA Law
Enforcement, City Police, and OHP-LEL’s.
Thank You!
Questions?
Antoinette Short,
Program Director
PO Box 487
Binger, Oklahoma 73005
405.638.0456

6/18/2014
16
Rosebud Sioux Tribe
Tribal Motor Vehicle Injury Prevention Program
Richard Bracha
RST TMVIPP Coordinator
POB 808
Rosebud, SD 57570
PH: 605-747-2467 CELL 605-828-3500
Background • Located in South Central South Dakota
• Land based Tribe about 1,970 square miles
• Population of about 13,000 people live on the reservation
• TMVIPP program is organizationally located under the Community Health Representative (CHR) Program
Traffic Safety at Rosebud • Tribal Police Dept. is governed by the Rosebud Sioux Tribe
• Tribal primary seat belt and child safety seat laws (since 2009) – Seatbelt: primary law; fine 1st offense $20, 2nd offense $20
– Child Safety Seat: primary law; fine $20
• Project Challenges: – Distance between communities and public schools
– Large size of the Rosebud Sioux Reservation / Weather
– Turnover in Tribal program staff /RST Police Dept. Social Stigma
• Unique Elements:
- Rosebud Sioux Tribe Television Station
Program Objectives/Strategies
• Increase child safety seat use among 3-5 year old children attending RST Head Start Centers and WIC by 20% by 2014
• Increase seatbelt use by 24% among Rosebud Sioux Tribal Members by September 2014
• Reduce alcohol-related Motor Vehicle Crash Injuries by 20% and Fatalities by 30% by the end of Year IV
Child Safety Seat Use Strategies • Radio / TV CSS PSA’S/Billboard / Poster awareness
• CSS distribution to head start & WIC
– One on one parent education and installation (90 seats to head start parents and 121 to community parents )
– CSS check station (3 check stations )
• Staff Certified CPS Technician Training
• Program Partners – RST PD – WIC – Head Start – CHR – Indian Health Service (OEH) – Rosebud Injury Prevention coalition
Seat Belt Use Strategies • Radio/TV PSA’s (n=17 TV / 24 radio)
• Retail store advertisement (n=12)
• Awareness crash events at yearly fair, school events
and parades (n=7 events )
• Teen / athletic league events (n=4 lock-ins/5 leagues)
• Commercial billboard signs
• Data Collection

6/18/2014
17
DUI Prevention Strategies
• Radio / TV PSA’s
• Awareness Booths
• Educational Displays
• Teen Activities (9)
• Newspaper Articles
(8 articles)
Rosebud Occupant Restraint Use by Year
9% 10%
21%
34%
n/a
9% 10% 11%
0
10
20
30
40
50
60
70
80
90
100
Pre-Proj. - 2009-2010
YR I - 2010-2011 YR II - 2011-2012 YR III - 2012-2013
Program Years
Seatbelt Use (%) CSS Use (%)
Perc
ent
Increased Enforcement Summary
541
458
166
359
308
59
3
53
327
0 5 17
604
536
451
0
100
200
300
400
500
600
700
Year I (2010-2011) Year II (2011-2012) Year III (2012-2013)
Nu
mb
er
Program Years
Rosebud Sioux TMVIPP MVCs Total, MVCs with Either Injuries or Fatalities, and Traffic Safety Enforcement Summary, 2010-2011
MVCs Total MVCs w/either Inj or Fatl Seatbelt Citations CSS Citations DUI Arrests
Project Start
MVC’s, MVC Injury & Fatality
Project Sustainability
• FHWA implementation application
• Completion of RST safety management plan
• TIPCAP funding
• Education/awareness publicity PSA’s
• Child safety Seat distribution
• TMVIPP activities in RST PD regular routine
Lessons Learned/Challenges • Limited cooperation/collaboration with Law enforcement
– Several police chiefs – Loss and gain of BIA Indian Highway Safety Program – Lack of support/communication with highway safety
officer – Competing priorities with law enforcement
• Staff turnover – Current TMVIPP coordinator began at the end of YR II
• Seatbelt & Child Safety Seat Laws passed prior to TMVIPP • IHS. Partnership
– Familiar with data collection – Primary role to collect CSS and seat belt use data

6/18/2014
18
Questions
Richard Bracha RST TMVIPP Coordinator
POB 808 Rosebud, SD 57570
PH: 605-747-2467 CELL 605-828-3500
Land-based Tribe
South Central South Dakota (near NE border)
4,844 square miles/3.1 million acres
3 counties/9 districts (multiple communities)
44,824 enrolled Oglala Sioux Tribal members
Department of Public Safety Law Enforcement Services PL 638 Charter Shared Office Space o Highway Safety Troopers
o TIPCAP Specialist
o Development & Compliance Manager
o TMVIPP Coordinator are in 1 office
Oglala Sioux Tribe Court System 1 Traffic Court 2 Civil Courts
2 Criminal Courts 1 Juvenile Court
1. Increase Seat Belt use by 5% per year for 4 years (20% from baseline)
2.Reduce Motor Vehicle Crash (MVC) severe injuries and fatalities resulting from alcohol/drug impaired by 2.5% per year for 4 years
3.Strengthen existing Tribal seat belt use law
4.Strengthen existing Tribal DUI/DWI laws
Partnership Indian Highway Safety,
TIPCAP, OSTDPS, TMVIPP
TMVIPP Coordinator
IHS TIPCAP Coordinator
BIA Indian Highway Safety Officer(s)
IHS Office of Environmental Health & Engineering (OEH)

6/18/2014
19
Events/Activities Year I Year II Year III Year IV Total
Enhanced Occupant Restraint Use Enforcement
15 14 10 0 44
Enhanced DUI Enforcement 8 8 7 4 27
DUI Checkpoints 20 32 17 2 71
Presentations 10 11 8 8 37
Educational Booths 7 2 2 3 14
Posters Contests 1 1 1 1 4
Proposed DUI Code Proposed DWI Code
.079 BAC or higher and/or drugs (prescription or illegal)
Offenses range: ◦ $200 fine and 90 days in jail, to ◦ $3000 fine and 1 year in jail
1st time offenders offered
chance to participate in a diversion program
.08 BAC or higher Offense range:
◦ $500 & 3 months in jail to
◦ $5000 fine & 1 years in jail
Diversion program, DWI classes; 6 months probation
No Plea out of a DWI Charge
One hour weekly radio talk show on KILI Radio.
Indian Highway Safety, Dept. of Public Safety, TIPCAP, TMVIPP, & invited guests discuss upcoming campaigns, seat belt use, distracted/impaired driving, and child safety seats
10.0% 12.0%
32.0%
45.0%
73.0% 72.1% 73.4%
83.0% 82.0% 84.0% 84.0%
87.0%
0.0%
10.0%
20.0%
30.0%
40.0%
50.0%
60.0%
70.0%
80.0%
90.0%
100.0%
2007 2009 2011 2013
Oglala Sioux Tribe Occupant Seat Belt Use, 2007-2013
Oglala Sioux South Dakota National
5 20 32 17 2
514
648 617
523
368
0
100
200
300
400
500
600
700
Pre-Project (2009-2010) Year I (2010-2011) Year II (2011-2012) Year III (2012-2013) Year IV (2013-2014)
Nu
mb
er
Program Years
Oglala Sioux Tribe Driving Under the Influence (DUI) Enforcement Activity Summary, 2010-2014
DUI Checkpoints DUI Arrests
Project Start
Partial Year
318 312 248
209
62 106 76 70 44 17
1039
1430
864 905
143
218
391
250
147
16
514
648 617
523
204
0
200
400
600
800
1000
1200
1400
1600
Pre-Project (2009-2010) Year I (2010-2011) Year II (2011-2012) Year III (2012-2013) Year IV (2013-2014)
Nu
mb
er
Program Years
MVCs Total, MVCs with Either Injuries or Fatalities, and Traffic Safety Enforcement Summary, 2010-2014
MVCs Total MVCs w/either Inj or Fatl Seatbelt Citations CSS Citations DUI Arrests
Project Start
Partial Year

6/18/2014
20
Staff turnover
Tribal Motor Vehicle Injury Prevention Program Coordinator (n=5 in four years)
Chief of Police
Managers
Financial Officer
Tribal Court Staff
Tribal Politics (proposed laws pending with committee)
Transportation
Documentation
Dedicated participants
Maintaining a strong coalition
Education to our tribe on “Issues of Importance”
Communication is our most valuable tool
Seat Belt & Child Safety Seat Traffic Codes ◦ Proposed, passed, and included raised fines
DWI/DUI: ◦ Proposing higher fines and penalties
Ongoing-Education, Outreach ◦ Billboards at all entrances onto the Pine Ridge reservation
◦ Will change every two years
MVC Fatality Banners ◦ Small signs displaying photos of lost crash victims
Connie Johnson Oglala Sioux Tribe
Department of Public Safety
Tribal Motor Vehicle Injury Prevention Program
Coordinator
(605) 867-8170
Sisseton-Wahpeton Oyate Injury Prevention Program
Presented by Shannon White, SWO Injury Prevention Program Manager
SWO Injury Prevention
» SWO is located in
Northeastern SD
» Population: 5k on Rez
» Checkerboard jurisdiction
» Tribal Police main
partners
» Primary laws

6/18/2014
21
SWO IP Strategies
» Sobriety Checkpoints
» Law changes
» Restraint Checkpoints
» Participation in enforcement campaigns
SWO IP Goals and Objectives
» Goal 1:To reduce severe injuries due to motor
vehicle crashes as reported in Severe Injury Surveillance System (SISS) by 20% (from 15 per
year to 13 per year) and fatalities due to motor
vehicle crashes by 30% (from 6 per year to 4.2)
» Goal 2: Reduce the number of alcohol related severe injuries by 18% in 2015 (from 38% in the
2005-2007 Severe Injury Surveillance System
(SISS) to 20% in 2015.
» Goal 3: To build capacity in the tribe by maintaining and strengthening the Community
Injury Prevention Team (CIPT)
Key Partners Key Partners
» Law Enforcement
» Tribal Courts
» Roberts County Aliive
» Media
» CIPT
Results
» 90 enforcement events (beginning of project
year through May 2014)
» 49 Sobriety Checkpoints
» 41 Seatbelt Checkpoints
» 72 citations
» 24 arrests
» 3435 contacts made
Year I-2005(n=520)
Year II-2006(n=2440)
Year III-2007(n=2841)
Year IV-2008(n=2924)
Year V-2009(n=2110)
Year VI-2010(n=2386)
Year VII-2011(n=2899)
Year VIII-2012(n=1010)
Driver 25.0% 45.0% 50.0% 56.0% 58.0% 58.0% 58.0% 56.3%
Passenger 9.0% 34.0% 42.0% 46.0% 52.0% 49.0% 49.0% 48.5%
Overall 20.0% 42.2% 47.9% 53.4% 56.6% 55.0% 55.3% 54.2%
25.0%
45.0%
50.0%
56.0%58.0% 58.0% 58.0%
56.3%
9.0%
34.0%
42.0%
46.0%
52.0%49.0% 49.0% 48.5%
20.0%
42.2%
47.9%
53.4%56.6% 55.0% 55.3% 54.2%
0%
10%
20%
30%
40%
50%
60%
70%
80%
90%
100%
Figure 1. SWO Seatbelt Use Summary, 2005-2012
Driver Passenger Overall
TMVIPP Project Start

6/18/2014
22
85
40
75
83
18
7
23
6
152
180
138
90
121 124
127
144
55% 55% 52% 48%
0
20
40
60
80
100
120
140
160
180
200
Pre-Project (2009-2010) Year I (2010-2011) Year II (2011-2012) Year III (2012-2013)
Num
ber
Program Years
Sisseton Wahpeton Oyate Tribe TMVIPP MVCs Total, MVCs with Either Injuries or Fatalities, and Traffic Safety Enforcement Summary, 2010-2014
MVCs Total MVCs w/either Inj or Fatl Seatbelt Citations
CSS Citations DUI Arrests Seatbelt Use (%)
Project Start Challenges
» Indian Highway Safety Officers
» Tribal Politics
» Tribal Boards/Committees
» Youth Council
» Staff absence
Interesting outcomes
» Police and youth
» Teen Court
» Outside funding had an impact
The future of SWO IP
» SWO Health Plan 638 funds
» Policy changes
» Law changes
» Indian Highway Safety funding
» Federal Highways funding
Questions?
» Shannon White
» SWO IP Program Manager
» 605-742-3647
» shannondeliawhite@
hotmail.com
Thank you!
Related Documents