CD8 + T Cells in Facioscapulohumeral Muscular Dystrophy Patients with Inflammatory Features at Muscle MRI Giovanni Frisullo & Roberto Frusciante & Viviana Nociti & Giorgio Tasca & Rosaria Renna & Raffaele Iorio & Agata Katia Patanella & Elisabetta Iannaccone & Alessandro Marti & Monica Rossi & Assunta Bianco & Mauro Monforte & Pietro Attilio Tonali & Massimiliano Mirabella & Anna Paola Batocchi & Enzo Ricci Received: 29 August 2010 / Accepted: 28 September 2010 / Published online: 10 November 2010 # Springer Science+Business Media, LLC 2010 Abstract Facioscapulohumeral muscular dystrophy (FSHD) is an inherited disease, and although strongly suggested, a contribution of inflammation to its pathogenesis has never been demonstrated. In FSHD patients, we found by immunohistochemistry inflammatory infiltrates mainly composed by CD8 + T cells in muscles showing hyper- intensity features on T2-weighted short tau inversion recovery magnetic resonance imaging (T2-STIR-MRI) sequences. Therefore, we evaluated the presence of circulating activated immune cells and the production of cytokines in patients with or without muscles showing hyperintensity features on T2-STIR-MRI sequences and from controls. FSHD patients displaying hyperintensity features in one or more muscles showed higher CD8 + pSTAT1 + , CD8 + T-bet + T cells and CD14 + pSTAT1 + , CD14 + T-bet + cells percentages and IL12p40, IFNγ and TNFα levels than patients without muscles displaying hyperintense features and controls. Moreover, the percen- tages of CD8 + pSTAT1 + , CD8 + T-bet + and CD14 + pSTAT1 + cells correlated with the proportion of muscles displaying hyperintensity features at T2-STIR sequences. These data indicate that circulating activated immune cells, mainly CD8 + T cells, may favour FSHD progression by promoting active phases of muscle inflammation. Keywords T-bet . pSTAT1 . cytokines . FSHD . muscle MRI . CD8 T cells . inflammation Introduction Tissue damage in genetic disorders leads to the release of intracellular proteins and possibly the breakdown of tolerance, which can result in autoimmunity. The subse- quent chronic autoimmune damage results in increased tissue degeneration [1] as observed in Duchenne muscular dystrophy, X-linked adrenoleukodystrophy and alpha 1- antitrypsin deficiency, in which a contribute of autoimmu- nity to the tissue damage has been demonstrated [2–5]. Moreover, in limb girdle muscular dystrophy (LGMD) type 2B and Miyoshi myopathy, dysferlin deficiency besides inducing muscle fibre degeneration can “per se” directly activate monocytes leading to an enhanced phagocytosis of damaged myofibres [6]. Facioscapulohumeral muscular dystrophy (FSHD) is an autosomal dominant inherited myopathy that is not due to mutation within a protein- coding gene but, in more than 95% of cases, is associated with a low number of 3.3-kb tandem repeat units, termed D4Z4, located on chromosome 4q35 [7]. To date, no causal gene has been identified, and epigenetic mechanisms that determine the loss of appropriate gene expression control seem to be involved in the pathogenesis of disease [8, 9]. Although a reliable genetic test is available for diagnostic purposes, very little is still known about the molecular mechanisms that induce muscle degeneration. Early studies focused on the presence of inflammatory features at G. Frisullo : R. Frusciante : V. Nociti : G. Tasca : R. Renna : R. Iorio : A. K. Patanella : E. Iannaccone : A. Marti : M. Rossi : A. Bianco : M. Monforte : P. A. Tonali : M. Mirabella : A. P. Batocchi (*) : E. Ricci Institute of Neurology, Department of Neurosciences, Catholic University of Rome, largo Gemelli 8, 00168 Rome, Italy e-mail: [email protected] V. Nociti : A. K. Patanella : M. Rossi : P. A. Tonali : M. Mirabella : E. Ricci Fondazione Don Carlo Gnocchi, Via Capecelatro 66, 20148 Milan, Italy J Clin Immunol (2011) 31:155–166 DOI 10.1007/s10875-010-9474-6

Welcome message from author
This document is posted to help you gain knowledge. Please leave a comment to let me know what you think about it! Share it to your friends and learn new things together.
Transcript

CD8+ T Cells in Facioscapulohumeral Muscular DystrophyPatients with Inflammatory Features at Muscle MRI
Giovanni Frisullo & Roberto Frusciante & Viviana Nociti & Giorgio Tasca &
Rosaria Renna & Raffaele Iorio & Agata Katia Patanella & Elisabetta Iannaccone &
Alessandro Marti & Monica Rossi & Assunta Bianco & Mauro Monforte &
Pietro Attilio Tonali & Massimiliano Mirabella & Anna Paola Batocchi & Enzo Ricci
Received: 29 August 2010 /Accepted: 28 September 2010 /Published online: 10 November 2010# Springer Science+Business Media, LLC 2010
Abstract Facioscapulohumeral muscular dystrophy(FSHD) is an inherited disease, and although stronglysuggested, a contribution of inflammation to its pathogenesishas never been demonstrated. In FSHD patients, we found byimmunohistochemistry inflammatory infiltrates mainlycomposed by CD8+ T cells in muscles showing hyper-intensity features on T2-weighted short tau inversionrecovery magnetic resonance imaging (T2-STIR-MRI)sequences. Therefore, we evaluated the presence ofcirculating activated immune cells and the production ofcytokines in patients with or without muscles showinghyperintensity features on T2-STIR-MRI sequences andfrom controls. FSHD patients displaying hyperintensityfeatures in one or more muscles showed higherCD8+pSTAT1+, CD8+T-bet+ T cells and CD14+pSTAT1+,CD14+T-bet+ cells percentages and IL12p40, IFNγ andTNFα levels than patients without muscles displayinghyperintense features and controls. Moreover, the percen-tages of CD8+pSTAT1+, CD8+T-bet+ and CD14+pSTAT1+
cells correlated with the proportion of muscles displayinghyperintensity features at T2-STIR sequences. These data
indicate that circulating activated immune cells, mainlyCD8+ T cells, may favour FSHD progression by promotingactive phases of muscle inflammation.
Keywords T-bet . pSTAT1 . cytokines . FSHD .muscleMRI . CD8 T cells . inflammation
Introduction
Tissue damage in genetic disorders leads to the release ofintracellular proteins and possibly the breakdown oftolerance, which can result in autoimmunity. The subse-quent chronic autoimmune damage results in increasedtissue degeneration [1] as observed in Duchenne musculardystrophy, X-linked adrenoleukodystrophy and alpha 1-antitrypsin deficiency, in which a contribute of autoimmu-nity to the tissue damage has been demonstrated [2–5].Moreover, in limb girdle muscular dystrophy (LGMD) type2B and Miyoshi myopathy, dysferlin deficiency besidesinducing muscle fibre degeneration can “per se” directlyactivate monocytes leading to an enhanced phagocytosis ofdamaged myofibres [6]. Facioscapulohumeral musculardystrophy (FSHD) is an autosomal dominant inheritedmyopathy that is not due to mutation within a protein-coding gene but, in more than 95% of cases, is associatedwith a low number of 3.3-kb tandem repeat units, termedD4Z4, located on chromosome 4q35 [7]. To date, no causalgene has been identified, and epigenetic mechanisms thatdetermine the loss of appropriate gene expression controlseem to be involved in the pathogenesis of disease [8, 9].Although a reliable genetic test is available for diagnosticpurposes, very little is still known about the molecularmechanisms that induce muscle degeneration. Early studiesfocused on the presence of inflammatory features at
G. Frisullo : R. Frusciante :V. Nociti :G. Tasca :R. Renna :R. Iorio :A. K. Patanella : E. Iannaccone :A. Marti :M. Rossi :A. Bianco :M. Monforte : P. A. Tonali :M. Mirabella :A. P. Batocchi (*) : E. RicciInstitute of Neurology, Department of Neurosciences,Catholic University of Rome,largo Gemelli 8,00168 Rome, Italye-mail: [email protected]
V. Nociti :A. K. Patanella :M. Rossi : P. A. Tonali :M. Mirabella : E. RicciFondazione Don Carlo Gnocchi,Via Capecelatro 66,20148 Milan, Italy
J Clin Immunol (2011) 31:155–166DOI 10.1007/s10875-010-9474-6
histochemical muscle biopsy examination in many FSHDpatients [10–12]. However, a 3-month prednisone pilot trialfailed to show improvement in strength or muscle mass[13], and a pathogenic role for immunity has never beendemonstrated. Magnetic resonance imaging (MRI) isemerging as a powerful tool in clinical practice to assessseverity, distribution and characteristics of muscle involve-ment in muscular disorders, including FSHD [14–17].Indeed, T1-weighted (T1-W) sequences are able to detectfeatures of replacement of muscle with fibrosis or adiposetissue, while hyperintensity features at muscle MRI T2-weighted short tau inversion recovery (T2-STIR) sequencesreflect changes in tissue water distribution and have beendescribed in disorders characterized by oedema andinflammation or by denervation atrophy [18, 19]. Recently,we studied pelvic and lower limb muscles in FSHD patientsby means of muscle MRI and observed, besides features ofmuscle tissue replacement on T1-W sequences, single ormultiple focal areas of signal hyperintensity on T2-STIRsequences in 121 out of 202 patients (60%; unpublisheddata). As we hypothesized that these areas may representfeatures of muscle inflammation, in this study we per-formed immunohistochemistry on biopsies from FSHDpatients obtained from muscles either or not showinghyperintensity features on T2-STIR sequences at MRI.Moreover, since the analysis of cytokines and cytokineinduced transcription factors expressed in peripheral bloodmononuclear cells (PBMC) may contribute to a betterunderstanding of the pathophysiological mechanisms under-lying inflammatory/autoimmune processes, we evaluated thepresence of activated immune cells in the peripheral blood ofFSHD patients and controls assessing the percentages ofcirculating CD4+, CD8+ and CD14+ cells positive for thetranscription factors T-bet and pSTAT1, master regulators ofTh 1 cells and pSTAT3, involved in the differentiation ofTh17 cells. Finally, we measured the spontaneous productionof several pro-inflammatory (IL12/IL23p40, IL6, IFNγ,IL17, TNFα) and anti-inflammatory cytokines (IL10 andTGFβ) by cultured PBMC from FSHD patients and healthysubjects.
Materials and Methods
Patients and Controls
Patients with a genetically confirmed diagnosis of FSHD(pathogenic EcoRI/BlnI-resistant fragment ranging between10 and 40 kb) and sex- and age-matched healthy subjectswere screened for infectious conditions or other inflamma-tory diseases and then included in our study. Clinicalexamination and muscle MRI were performed in allpatients before the inclusion in the study. Clinical severity
was assessed by a 10-grade Clinical Severity Scale (CSS)[20] assigning a score to the overall level of mobilitylimitations (from 0.5=facial weakness to 5=wheelchairbounded); according to this scale, higher scores (3 to 5) areassigned to patients with pelvic and proximal lower limbmuscle involvement. None of the patients was underpharmacological treatments at the time of the study. Thisstudy was approved by the local ethics committee, and allthe participants gave written informed consent beforeenrolment according to the Declaration of Helsinki [21].
MRI Protocol
Muscle imaging was performed on a 1.5-T MR scanner.Participants were examined by T1-W spin echo (TR/TE=500/35 ms) and T2-STIR (T1=150 ms) sequences. Ten-millimetre contiguous axial slices were obtained from theproximal lumbar spine to the ankles according to a protocolcommonly used in the assessment of muscle disorders[16]. A total of 37 muscles on each body side wereindependently and blindly evaluated by two investigators(ER and RF) who had been extensively trained in muscleMRI evaluation.
According to T1-W sequences, each muscle was scored0 (normal) to 4 (end-stage appearance, whole musclereplacement by connective tissue and fat) as reported [14].As an index of disease severity, a T1 MRI score wasobtained for each patient by summing all the single musclescores.
Each muscle showing hyperintensity features on T2-STIR sequences was rated 1. A T2-STIR-MRI scorecorresponded to the number of such muscles observed ineach patient.
On the basis of T2-STIR sequences, we split the patientsinto two groups: Group 1 included all individuals whoshowed no hyperintensity features (T2-STIR-MRI score=0);group 2 included all individuals displaying hyperintensityfeatures (T2-STIR-MRI score >0). It is worth noting that theT1MRI score, indicating the overall severity and extension ofirreversible muscle fatty-fibrous replacement, did not haveany influence on patient group assignment. Interobserverreliability was tested on all muscle MRI examinations.To test intraobserver reliability, muscle MRI of all FSHDpatients were evaluated twice by each investigator with a30-day period interval. A good sampled data reproduc-ibility (<3% changes for the 1,850 evaluated muscles inboth T1- and T2-STIR-W sequences) was obtained inboth cases.
Immunohistochemistry
Biopsy was performed on five muscles showing hyper-intensity features on T2-STIR sequences at MRI and on
156 J Clin Immunol (2011) 31:155–166

five muscles with no hyperintensity features on T2-STIRsequences. All biopsies were obtained after writteninformed consent.
Immunohistochemistry was performed on 6-μm cryostatsections using the following primary antibodies from Dako(Carpinteria, CA, USA): monoclonal mouse anti-humanCD8, CD4, HLA ABC, HLA DP, DQ, DR, CD68, C5bC9(MAC) and CD20; monoclonal mouse anti-human CD138was purchased from Serotec (Raleigh, NC, USA) andmonoclonal mouse anti-human perforin 1 (1.VB.3) fromSanta Cruz Biotechnology (Santa Cruz, CA, USA). Musclefibres were counterstained with FITC-conjugated phalloidin,and nuclei were visualized with Hoechst 33258 (MolecularProbes Inc.) staining. Sections were analysed using TCS SP5laser scanning confocal microscope (Leica Microsystems,Wetzlar, Germany).
Isolation of Peripheral Blood Mononuclear Cells
PBMC were isolated from venous blood by densitygradient centrifugation (2,500 rpm, 30 min) over a Ficoll-Hypaque density gradient (Pharmacia, Uppsala, Sweden).PBMC were then harvested by pipetting cells from theFicoll/serum interface and washed twice.
Culture of PBMC
PBMC (3×10⁶ cells/mL) were transferred into 24-wellplates in RPMI 1640 (EuroClone, West York, UK)containing 2 n-glutamine and 5% foetal calf serum(Hyclone Laboratories Inc, Logan, UT, USA). After 24 hincubation, the supernatants were collected, centrifuged at400×g for 10 min at 15°C and stored at −80°C untilcytokine determination.
Cytokine Measurement
The cytokines spontaneous production (IL12/IL23p40, IL6,IFNγ, IL17, TNFα, IL10 and TGFβ) was measured byenzyme-linked immunosorbent assay (ELISA) using com-mercial kits (R&D Systems, Minneapolis, MN, USA),following manufacturer’s instructions. The spontaneousproduction of cytokines (IL12/IL23p40, IL6, IFNγ, IL17,TNFα, IL10 and TGFβ) was measured by ELISA usingcommercial kits (R&D Systems, Minneapolis, MN, USA),following manufacturer’s instructions. The intra- and inter-assay coefficients of variation were 4% and 7% for IL-12/IL23p40, 5% and 5% for IL6, 6% and 5% for IFNγ, 7%and 7% for IL17, 4% and 6% for TNFα, 6% and 5% forIL10 and 5% and 7% for TGFβ, respectively. Cytokineconcentrations were determined from the regression line fora standard curve generated by using highly purifiedrecombinant cytokines at different concentrations per-
formed contemporaneously with each assay. The standardcurve also served as an internal control over the sensitivityand range of each assay. Data were expressed in picogramsper millilitre. All samples were assayed in duplicate.
Flow Cytometry
For the detection of pSTAT1, pSTAT3 and T-bet expres-sion, isolated PBMC were washed once in culture medium(Dulbecco) containing FCS and once in phosphate-bufferedsaline (PBS) and incubated with specific PE-Cy5-conjugated antibody (CD4, CD8, CD14). CD4− PE-Cy5,CD8− PE-Cy5, CD14− PE-Cy5 and isotype controls werepurchased from Beckman Coulter (Miami, FL, USA). Inaddition, anti-pSTAT1(A-2)-PE antibody, anti-pSTAT3(B-7)-PE antibody and anti-T-bet (4B10)-PE antibodywere purchased from Santa Cruz Biotechnology, SantaCruz, CA, USA.
The PBMC were then fixed with 2% paraformaldehydefor 10 min. Detection of pSTAT-1, pSTAT-3 and T-bet wasperformed by intracellular flow cytometry. Cells werepermeabilized using a commercially available perm/washkit (BD Biosciences/Pharmingen) and then washed once inculture medium (Dulbecco) containing FCS and once inPBS. Upon permeabilization, 3×10⁵ cells were resuspendedin 100 μL of PBS and incubated for 30 min with thespecific PE-conjugated antibody. Cells were washed againwith PBS and resuspended in PBS for flow cytometry(Beckman Coulter, EPICS XL™). Each analysis wasperformed using at least 50,000 cells that were gated inthe lymphocyte–monocyte population region, as deter-mined by light scatter properties (forward scatter versusside scatter). To analyse pSTAT1, pSTAT3 and T-betexpression in monocytes, cells were gated in both themonocyte (morphological gate) and CD14+ (immunologicalgate) regions. To analyse the transcription factor expression inlymphocytes (CD4+/CD8+ T cells), cells were gated inboth the lymphocyte and CD4+/CD8+ regions. Appropri-ate fluorochrome-conjugated isotype-matched mAbs wereused as control for background staining in each flowacquisition.
Statistical Analysis
Differences in variables between groups were tested byanalysis of variance. Post hoc tests were done by usingFisher’s protected least significant difference. Results areexpressed as mean ± SD. A p level<0.05 was considered tobe statistically significant. Correlation was estimated bySpearman rank correlation. Correlation was considered at ap value<0.05. Group comparisons (in Table I) wereperformed by the Student’s t test, and p<0.05 was takenas significant.
J Clin Immunol (2011) 31:155–166 157
Results
Patients
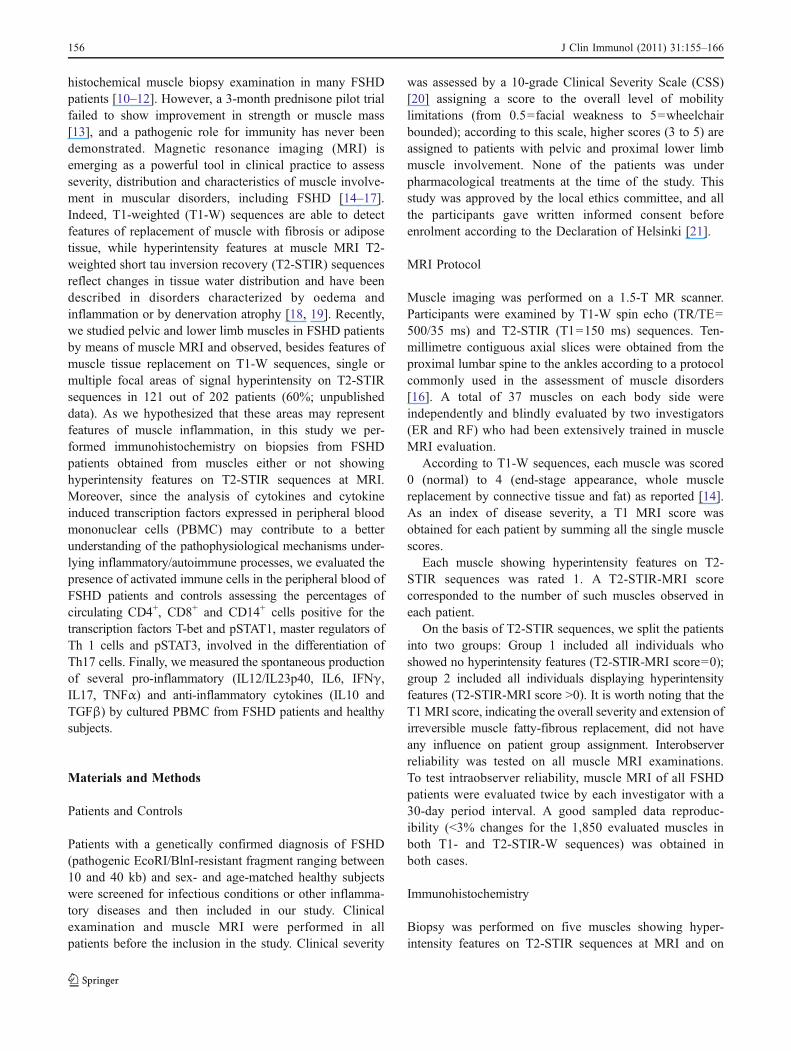
Twenty-five consecutive FSHD patients and 15 healthysubjects were included in the immunological study. InFSHD patients, as expected, T1 MRI score highly correlatedwith CSS (r=0.83; p<0.0001; Fig. 1). On the basis of theT2-STIR-MRI score, 11 patients were assigned to group 1and 14 patients to group 2 since they showed hyperintensityfeatures in one or more muscles. Muscles that showed acomplete fatty-fibrous substitution on T1-W sequences(score 4) did not show hyperintensity features on T2-STIRsequences. Conversely, muscles showing hyperintensityfeatures on T2-STIR sequences turned out to be, on T1-Wsequences, either normal (score 0) or partially replaced byfatty-fibrous tissue (scores 1 to 3). Group 1 patients wereolder (p=0.0121) and showed CSS scores significantlyhigher than group 2 patients (p=0.0116). No differencewas observed in the pathogenic 4q35 EcoRI allele fragmentsize between the two groups. All these data are summarisedin Table I.
Inflammatory Infiltrates on Muscle Biopsies
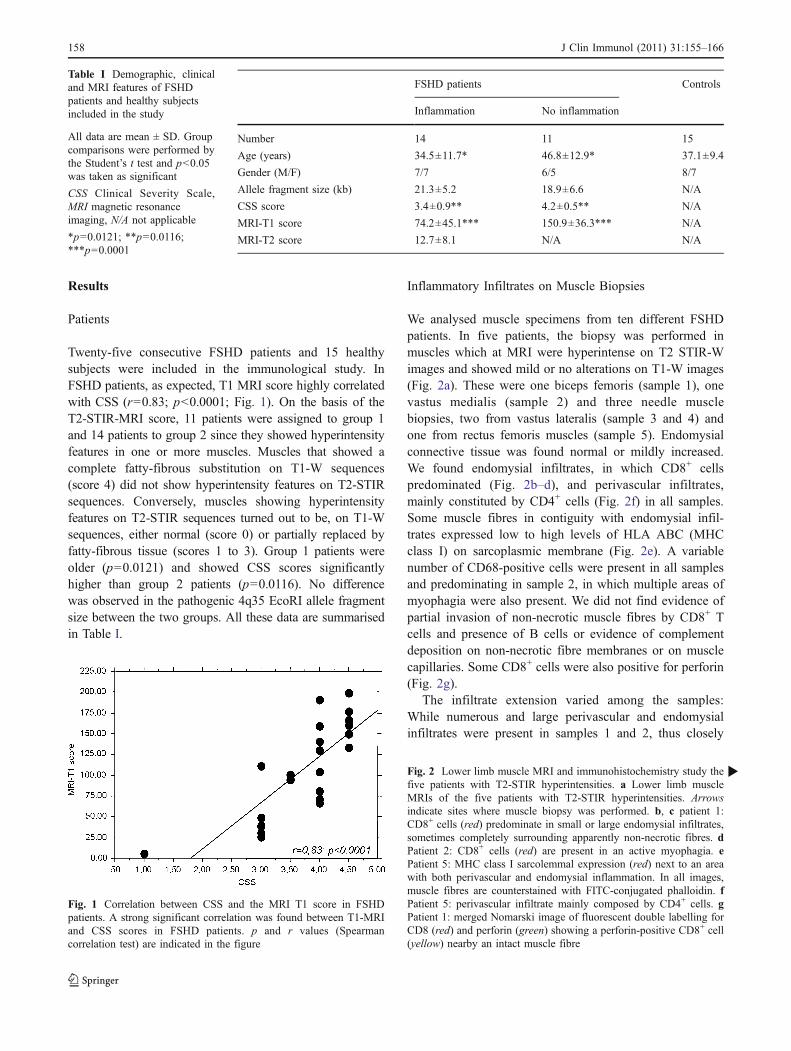
We analysed muscle specimens from ten different FSHDpatients. In five patients, the biopsy was performed inmuscles which at MRI were hyperintense on T2 STIR-Wimages and showed mild or no alterations on T1-W images(Fig. 2a). These were one biceps femoris (sample 1), onevastus medialis (sample 2) and three needle musclebiopsies, two from vastus lateralis (sample 3 and 4) andone from rectus femoris muscles (sample 5). Endomysialconnective tissue was found normal or mildly increased.We found endomysial infiltrates, in which CD8+ cellspredominated (Fig. 2b–d), and perivascular infiltrates,mainly constituted by CD4+ cells (Fig. 2f) in all samples.Some muscle fibres in contiguity with endomysial infil-trates expressed low to high levels of HLA ABC (MHCclass I) on sarcoplasmic membrane (Fig. 2e). A variablenumber of CD68-positive cells were present in all samplesand predominating in sample 2, in which multiple areas ofmyophagia were also present. We did not find evidence ofpartial invasion of non-necrotic muscle fibres by CD8+ Tcells and presence of B cells or evidence of complementdeposition on non-necrotic fibre membranes or on musclecapillaries. Some CD8+ cells were also positive for perforin(Fig. 2g).
The infiltrate extension varied among the samples:While numerous and large perivascular and endomysialinfiltrates were present in samples 1 and 2, thus closely
Fig. 1 Correlation between CSS and the MRI T1 score in FSHDpatients. A strong significant correlation was found between T1-MRIand CSS scores in FSHD patients. p and r values (Spearmancorrelation test) are indicated in the figure
FSHD patients Controls
Inflammation No inflammation
Number 14 11 15
Age (years) 34.5±11.7* 46.8±12.9* 37.1±9.4
Gender (M/F) 7/7 6/5 8/7
Allele fragment size (kb) 21.3±5.2 18.9±6.6 N/A
CSS score 3.4±0.9** 4.2±0.5** N/A
MRI-T1 score 74.2±45.1*** 150.9±36.3*** N/A
MRI-T2 score 12.7±8.1 N/A N/A
Table I Demographic, clinicaland MRI features of FSHDpatients and healthy subjectsincluded in the study
All data are mean ± SD. Groupcomparisons were performed bythe Student’s t test and p<0.05was taken as significant
CSS Clinical Severity Scale,MRI magnetic resonanceimaging, N/A not applicable
*p=0.0121; **p=0.0116;***p=0.0001
Fig. 2 Lower limb muscle MRI and immunohistochemistry study thefive patients with T2-STIR hyperintensities. a Lower limb muscleMRIs of the five patients with T2-STIR hyperintensities. Arrowsindicate sites where muscle biopsy was performed. b, c patient 1:CD8+ cells (red) predominate in small or large endomysial infiltrates,sometimes completely surrounding apparently non-necrotic fibres. dPatient 2: CD8+ cells (red) are present in an active myophagia. ePatient 5: MHC class I sarcolemmal expression (red) next to an areawith both perivascular and endomysial inflammation. In all images,muscle fibres are counterstained with FITC-conjugated phalloidin. fPatient 5: perivascular infiltrate mainly composed by CD4+ cells. gPatient 1: merged Nomarski image of fluorescent double labelling forCD8 (red) and perforin (green) showing a perforin-positive CD8+ cell(yellow) nearby an intact muscle fibre
b
158 J Clin Immunol (2011) 31:155–166

J Clin Immunol (2011) 31:155–166 159
resembling the histopathological features of an inflamma-tory myopathy, samples 3–5 showed predominantly small-or medium-sized endomysial infiltrates. Sample 5 alsoshowed interstitial oedema and slightly enlarged vessels.FSHD needle muscle biopsies obtained from five normalappearing muscles (on both T1 and T2-STIR sequences)were normal or displayed only mild myopathic changeswith routine histological and histochemical stainings, andno inflammatory features were evident on them.
pSTAT1, pSTAT3 and T-bet in Circulating CD4+, CD8+ TCells and Monocytes from FSHD Patients and Controls
A higher percentage of CD14+T-bet+ cells was observed inpatients than in healthy subjects; otherwise, no differenceswere found in the percentages of CD4+T-bet+, CD8+T-bet+ Tcells between patients and controls (Fig. 3a). The percen-tages of circulating CD4+pSTAT1+, CD8+pSTAT1+ andCD14+pSTAT1+ cells were higher in FSHD patients than incontrols, however without reaching statistical significantvalues (Fig. 3b). No difference was found in the percentagesof CD4+pSTAT3+, CD8+pSTAT3+ and CD14+pSTAT3+ cellsbetween FSHD patients and controls (Fig. 3c). When weseparately analysed the two groups of FSHD patients, wefound higher percentages of CD8+pSTAT1+, CD8+T-bet+,CD14+pSTAT1+ and CD14+T-bet+ cells in peripheral bloodof group 2 than both group 1 and healthy subjects (Fig. 3d, e).The percentage of CD14+pSTAT3+ cells was significantlyhigher in group 2 than in controls and in group 1 than incontrols without reaching significant values, while there wasno difference in the percentage of CD14+pSTAT3+ cellsbetween group 1 and group 2 (Fig. 3f). On the contrary, nodifference was found in the percentages of CD4+pSTAT1+,CD4+pSTAT3+, CD4+T-bet+ and CD8+pSTAT3+ cellsamong the different study groups (Fig. 3d–f). Representativetwo-parameter plots of T-bet, pSTAT1 and pSTAT3 in CD4+,CD8+ T cells and monocytes are described in Fig. 4.
When we compared the immunological findings withmuscle MRI features, we found that the percentages ofCD8+pSTAT1+ (Fig. 5b), CD14+pSTAT1+ (Fig. 5b) andCD8+T-bet+ cells (Fig. 5a) significantly correlated with thenumber of T2-STIR hyperintense muscles. Otherwise, wedid not find any correlation between pSTAT1+, pSTAT3+
and T-bet+ cells and the degree of muscle fatty-fibrousreplacement as defined by the T1 MRI score. Accordingly,we did not find any correlation between pSTAT1+,pSTAT3+ and T-bet+ cells and CSS score (data not shown).
Cytokine Production by PBMC from FSHD Patientsand Controls
We found higher IFNγ, TNFα, IL12/IL23p40, IL6 andIL10 levels in FSHD patients than in controls (Fig. 6a–c, e, f),
while no differences were observed in IL17 and TGFβ levels(Fig. 6d, g). When we divided FSHD patients into twogroups according to different MRI features (T2-STIR-MRIscore), we observed that FSHD patients with MRI featuresof inflammation (group 2) showed significant higher IFNγ,TNFα and IL12/IL23p40 levels than both FSHD patientswithout MRI features of inflammation (group 1) and healthysubjects (Fig. 6a–c). IL6 and IL10 production by PBMC washigher in group 2 than in group 1 while both groups ofFSHD patients showed higher IL6 and IL10 levels thanhealthy subjects (Fig. 6e, f). Otherwise, no significantdifference was observed in IL17 and TGFβ levels betweenthe two groups of FSHD patients as well as between eachFSHD group and the control group (Fig. 6d, g). Nocorrelations were found between cytokine production byPBMC from FSHD patients and muscle MRI features orCSS score (data not shown).
Discussion
In this study, we performed ten muscle biopsies driven byMRI study in FSHD patients and found that inflammatorychanges appear to be a constant finding when samples areobtained from muscles showing hyperintensity features onT2-STIR sequences but not from normal appearing ones.These data indicate that T2-STIR abnormalities in musclesfrom FSHD patients are correlated with inflammation, andtherefore, in the following part of this discussion, we willindifferently use the terms inflammation and hyperintensityfeatures for these findings.
Our pathological results, in particular the composition ofboth perivascular and endomysial infiltrates, are similar tothose previously reported by others [10–12] and consistentwith a significant presence of CD8+ T cells in theendomysium close to non-necrotic fibres. CD8+ T cellsalso invade rare degenerating fibres, together with macro-phages. No histopathological data support a complement-mediated damage against muscle vessels or fibres, differentlyfrom dermatomyositis or dysferlinopathies [22]. As describedby Arahata and colleagues, neither did we discover evidenceof partial invasion of non-necrotic muscle fibres by CD8+ Tcells, but a cytotoxic action of these cells cannot be excludedonly on the basis of this finding. To this regard, we mustunderline the presence of focal (limited to single fibres orportions of the sarcolemma) expression of MHC class Iin our samples and the expression of perforin in scatteredCD8+ T cells that we report for the first time in FSHDmuscle biopsies.
To better define the contribution of inflammation tothe pathophysiology of FSHD, we evaluated in theperipheral blood of FSHD patients and controls thepercentages of T-bet-, pSTAT1- and pSTAT3-positive
160 J Clin Immunol (2011) 31:155–166
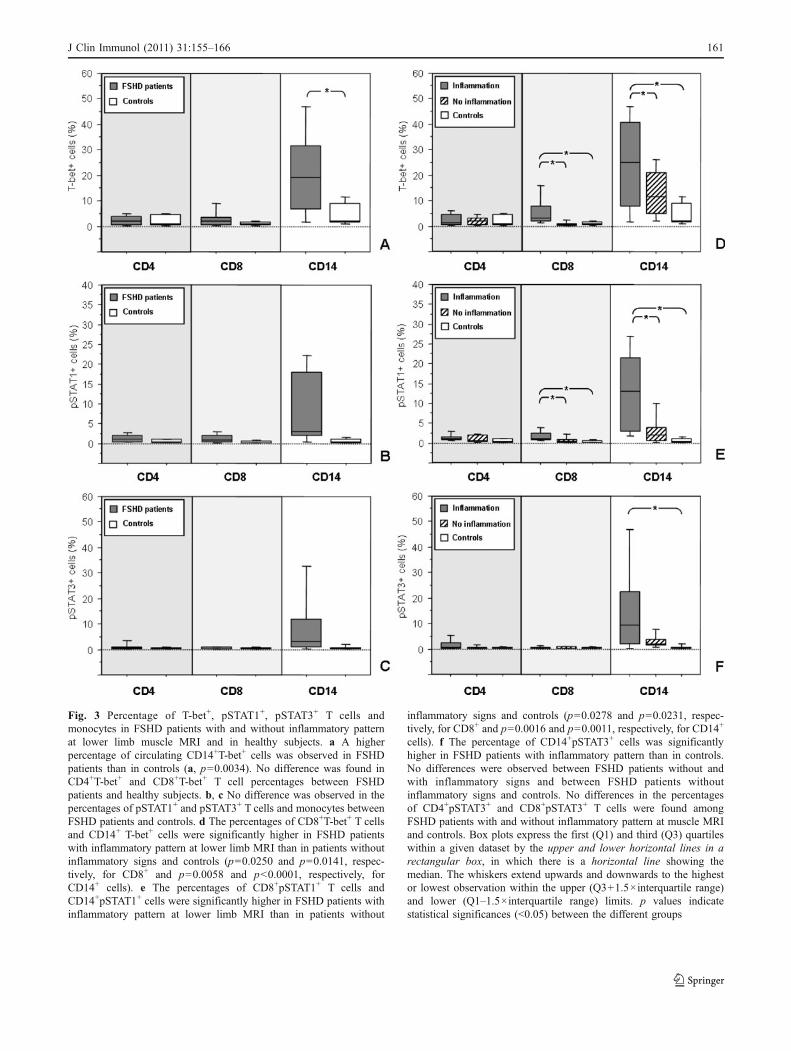
Fig. 3 Percentage of T-bet+, pSTAT1+, pSTAT3+ T cells andmonocytes in FSHD patients with and without inflammatory patternat lower limb muscle MRI and in healthy subjects. a A higherpercentage of circulating CD14+T-bet+ cells was observed in FSHDpatients than in controls (a, p=0.0034). No difference was found inCD4+T-bet+ and CD8+T-bet+ T cell percentages between FSHDpatients and healthy subjects. b, c No difference was observed in thepercentages of pSTAT1+ and pSTAT3+ T cells and monocytes betweenFSHD patients and controls. d The percentages of CD8+T-bet+ T cellsand CD14+ T-bet+ cells were significantly higher in FSHD patientswith inflammatory pattern at lower limb MRI than in patients withoutinflammatory signs and controls (p=0.0250 and p=0.0141, respec-tively, for CD8+ and p=0.0058 and p<0.0001, respectively, forCD14+ cells). e The percentages of CD8+pSTAT1+ T cells andCD14+pSTAT1+ cells were significantly higher in FSHD patients withinflammatory pattern at lower limb MRI than in patients without
inflammatory signs and controls (p=0.0278 and p=0.0231, respec-tively, for CD8+ and p=0.0016 and p=0.0011, respectively, for CD14+
cells). f The percentage of CD14+pSTAT3+ cells was significantlyhigher in FSHD patients with inflammatory pattern than in controls.No differences were observed between FSHD patients without andwith inflammatory signs and between FSHD patients withoutinflammatory signs and controls. No differences in the percentagesof CD4+pSTAT3+ and CD8+pSTAT3+ T cells were found amongFSHD patients with and without inflammatory pattern at muscle MRIand controls. Box plots express the first (Q1) and third (Q3) quartileswithin a given dataset by the upper and lower horizontal lines in arectangular box, in which there is a horizontal line showing themedian. The whiskers extend upwards and downwards to the highestor lowest observation within the upper (Q3+1.5×interquartile range)and lower (Q1–1.5×interquartile range) limits. p values indicatestatistical significances (<0.05) between the different groups
J Clin Immunol (2011) 31:155–166 161
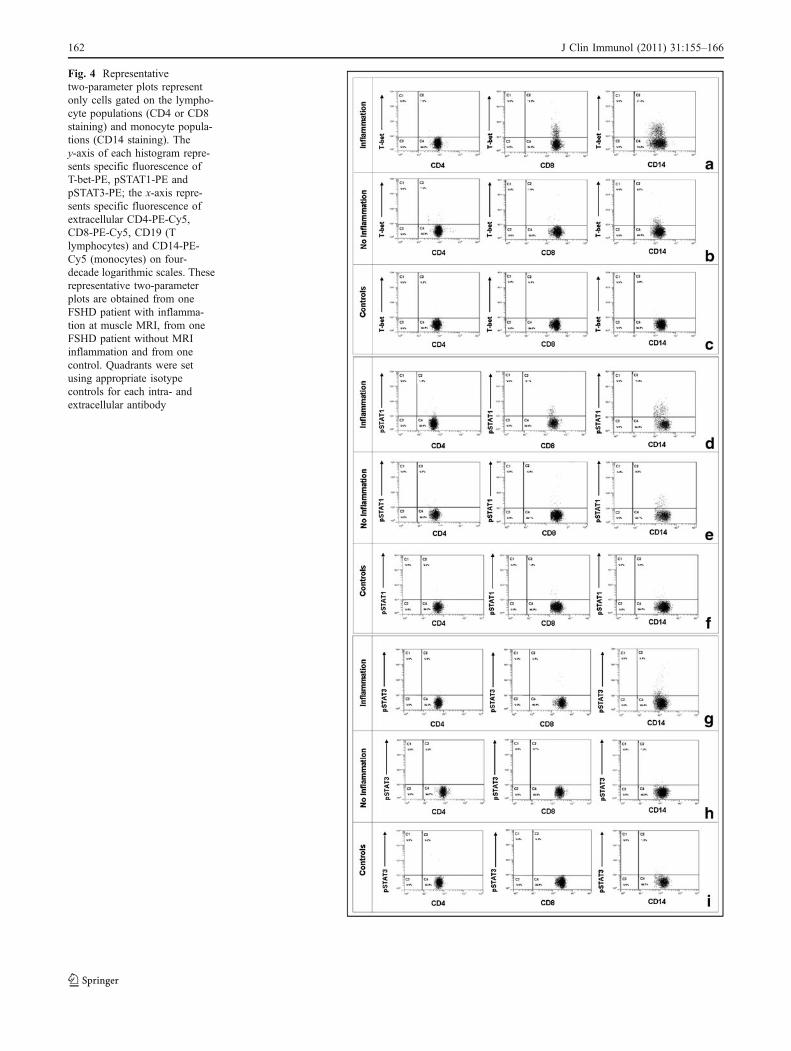
Fig. 4 Representativetwo-parameter plots representonly cells gated on the lympho-cyte populations (CD4 or CD8staining) and monocyte popula-tions (CD14 staining). They-axis of each histogram repre-sents specific fluorescence ofT-bet-PE, pSTAT1-PE andpSTAT3-PE; the x-axis repre-sents specific fluorescence ofextracellular CD4-PE-Cy5,CD8-PE-Cy5, CD19 (Tlymphocytes) and CD14-PE-Cy5 (monocytes) on four-decade logarithmic scales. Theserepresentative two-parameterplots are obtained from oneFSHD patient with inflamma-tion at muscle MRI, from oneFSHD patient without MRIinflammation and from onecontrol. Quadrants were setusing appropriate isotypecontrols for each intra- andextracellular antibody
162 J Clin Immunol (2011) 31:155–166

cells and the production of several pro-inflammatory andanti-inflammatory cytokines by mononuclear cells. T-betis a specific transcription factor that seems to play acentral role in type 1 immunity by influencing geneticprogramme in both innate and adaptive immunity [23]. T-betis mainly induced by IFNγ, through STAT1 activation [24,25], and, once expressed, amplifies IFN-γ production by Tcells, NK cells, monocytes and dendritic cells [26]. AlsoIL12, by STAT4 activation, can induce T-bet expression andincrease IFNγ production by T cells [27]. Activated CD8+ Tcells produce TNFα and IFNγ, and T-bet is critical for IFNγin vivo production by CD8+ T cells [28]. T-bet is alsorequired for CD8+ T cell full effector function [29] andperforin and granzyme B expression [30].
FSHD patients showed an increased percentage ofcirculating CD14+T-bet+ cells and an increased spontaneousproduction of IL12/IL23p40, IFNγ, TNFα, IL6 and IL10by PBMC in comparison to controls, while no difference
was observed in TGFβ and IL17 levels. When we dividedFSHD patients in two groups on the basis of MRI features,we found an increased production of IL12/IL23p40, IFNγand TNFα by PBMC and higher percentages ofCD8+pSTAT1+, CD8+T-bet+, CD14+pSTAT1+ andCD14+T-bet+ cells in the peripheral blood from group 2patients, displaying inflammatory features on MRI exami-nation than both group 1 patients, not displaying MRIevidence of inflammation, and healthy subjects. Thepercentages of CD8+pSTAT1+, CD8+T-bet+ andCD14+pSTAT1+ cells positively correlated with the numberof muscles showing hyperintensity features at MRI T2-STIR sequences but not with T1 MRI and CSS scores,indicating that only the active phase of inflammation isassociated with peripheral blood immune cell activation,which is conversely absent when MRI examination displaysmerely irreversible fatty-fibrous replacement of muscletissue. On the contrary, CSS, as an index of disease
Fig. 5 Correlation between the percentages of T-bet, pSTAT1 andpSTAT3 positive CD4+, CD8+ T cells and CD14+ cells and thenumber of T2-STIR-positive muscles at MRI in FSHD patients. Asignificant correlation was found between the value of MRI T2 score
and the percentages of T-bet+ and pSTAT1+ CD8+ T cells. Asignificant correlation was also observed between the value of MRIT2 score and the percentage of pSTAT1+ monocytes. p and R2 value(Spearman correlation test) are indicated in the figure
J Clin Immunol (2011) 31:155–166 163

severity, is related to irreversible lesions due to fatty-fibrousreplacement of muscle tissue, which are detected by T1-Wsequences and are not hyperintense on T2-STIR sequences.All these data, in addition with the presence of perforinexpressing CD8+ T cells in muscle infiltrates, indicate anactivation of immune cells, mainly CD8+ T cells, producingpro-inflammatory cytokines such as IFNγ, TNFα and IL12/IL23p40 in FSHD patients showing inflammatory featuresat muscle MRI but not in FSHD patients showing onlyT1-W abnormalities and controls. The younger age ofpatients with inflammatory features at muscle MRIsuggests that the immune process is mainly present inthe early phase of disease. Hyperintensity features atMRI T2-STIR sequences may be observed in musclespartially replaced by fat but also in muscles normallyappearing on T1-W sequences. The last condition is thecase of five muscles we chose to perform muscle biopsy. The
absence of important fatty-fibrous replacement on both MRIand pathological examinations suggests that in single muscles,inflammation may be an early event in the pathophysiologicalcascade underlying the dystrophic process.
Both groups of FSHD patients showed higher sponta-neous PBMC production of IL6 and IL10 than controls,group 2 showing a higher production than group 1. BothIL6 and IL10 act through pSTAT3 activation. IL6-mediated STAT3 activation favours monocytic differenti-ation [31], augments T cell proliferation through thesuppression of apoptosis [32] and, in presence of TGFβand IL23, favours the differentiation of Th17 cells [33,34]. IL10 is a cytokine with broad anti-inflammatoryproperties and has a key effect on the suppression of Th1cell responses [35]. IL10-mediated-STAT3 signalling caninhibit dendritic cell maturation from monocytes [36],inflammatory cytokine secretion such that of IL12 [37],
Fig. 6 Cytokine spontaneous production by PBMC from FSHDpatients with inflammation at muscle MRI, FSHD patients withoutinflammation at muscle MRI and healthy subjects. Higher IFNγ (a),TNFα (b), IL12/IL23p40 (c), IL6 (e) and IL10 (f) levels wereobserved in FSHD patients than in controls (p=0.0402, p=0.0011, p=0.0010, p=0.0005 and p=0.0001, respectively). Significant higherIFNγ (a), TNFα (b), IL12/IL23p40 (c), IL6 (e) and IL10 (f) levelswere observed in FSHD patients with MRI features of inflammation
than both FSHD patients without MRI features of inflammation (p=0.0181, p=0.0049, p=0.0415, p=0.0032 and p=0.0003, respectively)and healthy subjects (p=0.0041, p<0.0001, p=0.0020, p<0.0001 andp=0.0020, respectively). Moreover, IL6 (e) and IL10 (f) production byPBMC was higher in FSHD patients without MRI inflammation thanhealthy subjects (p=0.0422 and p=0.0405, respectively). P valueindicates statistical differences (<0.05) between the different groups
164 J Clin Immunol (2011) 31:155–166

MHC class II and costimulatory molecule expression byboth macrophages and dendritic cells [38, 39]. Addition-ally, IL6-mediated STAT3 activation can induce IL10production in Th1, Th2 and Th17 T cells to temperinflammatory response [40]. We found similar percentagesof CD14+pSTAT3+ cells in the two groups of patients andan increased percentage of these cells in group 2 than incontrol group whereas there was no difference in thepercentage of CD4+pSTAT3+ and CD8+pSTAT3+ T cellsamong the three groups.
These data suggest that in FSHD patients, IL6 and IL10are produced mainly by monocytes. The production of IL6by monocytes may favour CD8+ T cell activation andincrease their proliferation and effector functions. Conversely,IL10 may be produced by monocytes as a way of preventingexcessive inflammation and immunity.
However, it is worth noting that an augmented produc-tion of IL6 and IL10 by PBMC as compared to controlswas present in both groups of FSHD patients. IL6 causesskeletal muscle atrophy in rats [41, 42] and correlates withmuscle mass and strength loss in humans [43, 44] whereasendogenous IL10 attenuates IL6 expression by skeletalmuscles following an inflammatory insult [45]. In thiscontext, we can hypothesize that in all FSHD patients, IL6produced by monocytes and muscles is only partiallyinhibited by IL10 produced by monocytes favouring, evenwhen episodes of acute/subacute inflammation are overcome,diffuse muscle atrophy.
Conclusions
In conclusion, our data demonstrate that the areas ofhyperintensity on T2-STIR images at muscle MRI in FSHDpatients are characterized by the presence of inflammatoryinfiltrates mainly composed by CD8+ in the endomysium.Moreover, we showed, in peripheral blood of FSHDpatients with hyperintensity features at MRI T2-STIRsequences, the presence of activated immune cells, mainlyCD8+ T cells. Therefore, inflammation, as an early event insingle muscle involvement, may play a role in FSHDpathophysiology by promoting muscle pathology andfavouring disease progression and might constitute apotential target for the treatment of the disease.
Further studies are necessary to demonstrate whetherCD8+ T cell activation observed in muscles and peripheralblood from FSHD patients is generated by muscledegeneration as a bystander phenomenon or may be causedby transcriptional dysregulation of multiple genes involvedin the autoimmune response.
Acknowledgements We thank Manuela Papacci and Teresa Marescafor technical assistance.
References
1. Steinman L. Four easy pieces: interconnections between tissueinjury, intermediary metabolism, autoimmunity, and chronicdegeneration. Proc Am Thorac Soc. 2006;3:484–6.
2. Spencer MJ, Tidball JG. Do immune cells promote the pathologyof dystrophin-deficient myopathies. Neuromuscul Disord.2001;11:556–64.
3. Moser H, Dubye P, Fatemi A. Progress in X-linked adrenoleuko-dystrophy. Curr Opin Neurol. 2004;17:263–9.
4. Ranes J, Stoller K. Review of alpha 1-antitrypsin deficiency.Semin Respir Crit Care Med. 2005;26:154–66.
5. Pescatori M, Broccolini A, Minetti C, Bertini E, Bruno C,D’amico A, et al. Gene expression profiling in the early phasesof DMD: a constant molecular signature characterizes DMDmuscle from early postnatal life throughout disease progression.FASEB J. 2007;21:1210–26.
6. Nagaraju K, Rawat R, Veszelovszky E, Thapliyal R, Kesari A,Sparks S, et al. Dysferlin deficiency enhances monocyte phago-cytosis: a model for the inflammatory onset of limb-girdlemuscular dystrophy 2B. Am J Pathol. 2008;172:774–85.
7. van Deutekom JC, Wijmenga C, van Tienhoven EA, Gruter AM,Hewitt JE, Padberg GW, et al. FSHD associated DNA rearrange-ments are due to deletions of integral copies of a 3.2 kb tandemlyrepeated unit. Hum Mol Genet. 1993;2:2037–42.
8. Tawil R, Van Der Maarel SM. Facioscapulohumeral musculardystrophy. Muscle Nerve. 2006;34:1–15.
9. Tupler R, Perini G, Pellegrino MA, Green MR. Profoundmisregulation of muscle-specific gene expression in facioscapu-lohumeral muscular dystrophy. Proc Natl Acad Sci USA.1999;96:12650–4.
10. Munsat TL, Piper D, Cancilla P, Mednick J. Inflammatorymyopathy with facioscapulohumeral distribution. Neurology.1972;22:335–47.
11. Figarella-Branger D, Pellissier JF, Serratrice G, Pouget J, BiancoN. Immunocytochemical study of the inflammatory forms offacioscapulohumeral myopathies and correlation with other typesof myositis. Ann Pathol. 1989;9:100–8.
12. Arahata K, Ishihara T, Fukunaga H, Orimo S, Lee JH, Goto K, etal. Inflammatory response in facioscapulohumeral musculardystrophy (FSHD): immunocytochemical and genetic analyses.Muscle Nerve. 1995;2:S56–66.
13. Tawil R, McDermott MP, Pandya S, King W, Kissel J, MendellJR, et al. A pilot trial of prednisone in facioscapulohumeralmuscular dystrophy FSH-DY group. Neurology. 1997;48:46–9.
14. Mercuri E, Talim B, Moghadaszadeh B, Petit N, Brockington M,Counsell S, et al. Clinical and imaging findings in six cases ofcongenital muscular dystrophy with rigid spine syndrome linked tochromosome 1p (RSMD1). Neuromuscul Disord. 2002;12:631–8.
15. Sookhoo S, Mackinnon I, Bushby K, Chinnery PF, Birchall D.MRI for the demonstration of subclinical muscle involvement inmuscular dystrophy. Clin Radiol. 2007;62:160–5.
16. Olsen DB, Gideon P, Jeppesen TD, Vissing J. Leg muscleinvolvement in facioscapulohumeral muscular dystrophy assessedby MRI. J Neurol. 2006;253:1437–41.
17. Kan HE, Scheenen TW, Wohlgemuth M, Klomp DW, vanLoosbroek-Wagenmans I, Padberg GW, et al. Quantitative MRimaging of individual muscle involvement in facioscapulohumeralmuscular dystrophy. Neuromuscul Disord. 2009;19:357–62.
18. May DA, Disler DG, Jones EA, Balkissoon AA, Manaster BJ.Abnormal signal intensity in skeletal muscle at MR imaging:patterns, pearls, and pitfalls. Radiographics. 2000;20:S295–315.
19. Kamath S, Venkatanarasimha N, Walsh MA, Hughes PM. MRIappearance of muscle denervation. Skeletal Radiol. 2008;37:397–404.
J Clin Immunol (2011) 31:155–166 165

20. Ricci E, Galluzzi G, Deidda G, Cacurri S, Colantoni L, Merico B,et al. Progress in the molecular diagnosis of facioscapulohumeralmuscular dystrophy and correlation between the number of KpnIrepeats at the 4q35 locus and clinical phenotype. Ann Neurol.1999;45:751–7.
21. Lynöe N, Sandlund M, Dahlqvist G, Jacobsson L. Informedconsent: study of quality of information given to participants in aclinical trial. BMJ. 1991;303:610–3.
22. Brunn A, Schroder R, Deckert M. The inflammatory reactionpattern distinguishes primary dysferlinopathies from idiopathicinflammatory myopathies: an important role for the membraneattack complex. Acta Neuropathol. 2006;112:325–32.
23. Wang J, Fathman JW, Lugo-Villarino G, Scimone L, von AndrianU, Dorfman DM, et al. Transcription factor T-bet regulatesinflammatory arthritis through its function in dendritic cells. JClin Invest. 2006;116:414–21.
24. Lighvani AA, Frucht DM, Jankovic D, Yamane H, Aliberti J,Hissong BD, et al. T-bet is rapidly induced by interferon-gammain lymphoid and myeloid cells. Proc Natl Acad Sci USA.2001;98:15137–42.
25. Afkarian M, Sedy JR, Yang J, Jacobson NG, Cereb N, Yang SY, etal. T-bet is a STAT1-induced regulator of IL-12R receptor in naïveCD4+ cells. Nat Immunol. 2002;3:549–57.
26. Mullen AC, High FA, Hutchins AS, Lee HW, Villarino AV,Livingston DM, et al. Role of T-bet in commitment of TH1 cellsbefore IL-12-dependent selection. Science. 2001;292:1907–10.
27. Yang Y, Ochando JC, Bromberg JS, Ding Y. Identification of adistant T-bet enhancer responsive to IL-12/Stat4 and IFNgamma/Stat1 signals. Blood. 2007;110:2494–500.
28. Mayer KD, Mohrs K, Reiley W, Wittmer S, Kohlmeier JE, PearlJE, et al. Cutting edge: T-bet and IL-27R are critical for in vivoIFN-gamma production by CD8 T cells during infection. JImmunol. 2008;180:693–7.
29. Sullivan BM, Juedes A, Szabo SJ, von Herrath M, Glimcher LH.Antigen-driven effector CD8 T cell function regulated by T-bet.Proc Natl Acad Sci USA. 2003;100:15818–23.
30. Cruz-Guilloty F, Pipkin ME, Djuretic IM, Levanon D, Lotem J,Lichtenheld MG, et al. Runx3 and T-box proteins cooperate toestablish the transcriptional program of effector CTLs. J Exp Med.2009;206:51–9.
31. Manel N, Unutmaz D, Littman DR. The differentiation of humanT(H)-17 cells requires transforming growth factor-beta andinduction of the nuclear receptor RORgammat. Nat Immunol.2008;9:641–9.
32. Takeda K, Kaisho T, Yoshida N, Takeda J, Kishimoto T, Akira S.Stat3 activation is responsible for IL-6-dependent T cell proliferation
through preventing apoptosis: generation and characterizationof T cell-specific Stat3-deficient mice. J Immunol. 1998;161(9):4652–60.
33. Mangan JK, Rane SG, Kang AD, Amanullah A, Wong BC, ReddyEP. Mechanisms associated with IL-6-induced up-regulation ofJak3 and its role in monocytic differentiation. Blood.2004;103:4093–101.
34. Volpe E, Servant N, Zollinger R, Bogiatzi SI, Hupé P, Barillot E,et al. A critical function for transforming growth factor-beta,interleukin 23 and proinflammatory cytokines in driving andmodulating human T(H)-17 responses. Nat Immunol.2008;9:650–7.
35. O’Garra A, Vieira P. T(H)1 cells control themselves by producinginterleukin-10. Nat Rev Immunol. 2007;7:425–8.
36. Corinti S, Albanesi C, la Sala A, Pastore S, Girolomoni G.Regulatory activity of autocrine IL-10 on dendritic cell functions.J Immunol. 2001;166:4312–8.
37. Hoentjen F, Sartor RB, Ozaki M, Jobin C. STAT3 regulates NF-kappaB recruitment to the IL-12p40 promoter in dendritic cells.Blood. 2005;105:689–96.
38. Williams L, Bradley L, Smith A, Foxwell B. Signal transducerand activator of transcription 3 is the dominant mediator of theanti-inflammatory effects of IL-10 in human macrophages. JImmunol. 2004;172:567–76.
39. Murray PJ. Understanding and exploiting the endogenousinterleukin-10/STAT3-mediated anti-inflammatory response. CurrOpin Pharmacol. 2006;6:379–86.
40. Stumhofer JS, Silver JS, Laurence A, Porrett PM, Harris TH,Turka LA, et al. Interleukins 27 and 6 induce STAT3-mediated Tcell production of interleukin 10. Nat Immunol. 2007;8:1363–71.
41. Janssen SP, Gayan-Ramirez G, Van den Bergh A, Herijgers P,Maes K, Verbeken E, et al. Interleukin-6 causes myocardial failureand skeletal muscle atrophy in rats. Circulation. 2005;111:996–1005.
42. Haddad F, Zaldivar F, Cooper DM, Adams GR. IL-6-inducedskeletal muscle atrophy. J Appl Physiol. 2005;98:911–7.
43. Schaap LA, Pluijm SM, Deeg DJ, Visser M. Inflammatorymarkers and loss of muscle mass (sarcopenia) and strength. AmJ Med. 2006;119:9–17.
44. Toth MJ, Ades PA, Tischler MD, Tracy RP, LeWinter MM.Immune activation is associated with reduced skeletal musclemass and physical function in chronic heart failure. Int J Cardiol.2006;109:179–87.
45. Huey KA, McCusker RH, Kelley KW. Exaggerated expression ofskeletal muscle-derived interleukin-6, but not TNFalpha, in micelacking interleukin-10. J Neuroimmunol. 2008;199:56–62.
166 J Clin Immunol (2011) 31:155–166
Related Documents


![FSH Society Facioscapulohumeral Muscular Dystrophy [FSHD] … · 2019-08-27 · This workshop brings together clinicians, scientists, industry, patient representatives and policy](https://static.cupdf.com/doc/110x72/5e7be9793efeae1aea4c8301/fsh-society-facioscapulohumeral-muscular-dystrophy-fshd-2019-08-27-this-workshop.jpg)