© 2020 International Medical Press ISSN 1359-6535 CD4 + :CD8 + T-cell ratio changes in people with HIV receiving antiretroviral treatment Maria J Vivancos-Gallego, Hajra Okhai, Maria J Perez-Elías, Cristina Gomez-Ayerbe, Ana Moreno-Zamora, Jose L Casado, Carmen Quereda, Javier Martinez Sanz, Matilde Sanchez-Conde, Sergio Serrano-Villar, Santos Del Campo, Fernando Dronda, Juan Carlos Galan, Caroline A Sabin, Santiago Moreno Antiviral Therapy 2020; 10.3851/IMP3354 Submission date 9th January 2020 Acceptance date 12th April 2020 Publication date 27th April 2020 For information about publishing your article in Antiviral Therapy go to http://www.intmedpress.com/index.cfm?pid=12 This provisional PDF matches the article and figures as they appeared upon acceptance. Copyedited and fully formatted PDF and full text (HTML) versions will be made available soon.

Welcome message from author
This document is posted to help you gain knowledge. Please leave a comment to let me know what you think about it! Share it to your friends and learn new things together.
Transcript
©2020 International Medical Press ISSN 1359-6535
CD4+:CD8+ T-cell ratio changes in people with HIV receiving antiretroviral treatment
Maria J Vivancos-Gallego, Hajra Okhai, Maria J Perez-Elías, Cristina Gomez-Ayerbe, Ana Moreno-Zamora, Jose L Casado, Carmen Quereda, Javier Martinez Sanz, Matilde Sanchez-Conde, Sergio Serrano-Villar, Santos Del Campo, Fernando Dronda, Juan Carlos Galan, Caroline A Sabin, Santiago Moreno Antiviral Therapy 2020; 10.3851/IMP3354 Submission date 9th January 2020 Acceptance date 12th April 2020 Publication date 27th April 2020 For information about publishing your article in Antiviral Therapy go to http://www.intmedpress.com/index.cfm?pid=12
This provisional PDF matches the article and figures as they appeared upon acceptance. Copyedited and fully formatted PDF and full text (HTML) versions will be made available soon.
Publication: Antiviral Therapy; Type: Original article
DOI: 10.3851/IMP3354
Original article
CD4+:CD8+ T-cell ratio changes in people with HIV receiving antiretroviral treatment Maria J Vivancos-Gallego1*, Hajra Okhai2, Maria J Perez-Elías1, Cristina Gomez-Ayerbe1, Ana Moreno-Zamora1, Jose L Casado1, Carmen Quereda1, Javier Martinez Sanz1, Matilde Sanchez-Conde1, Sergio Serrano-Villar1, Santos Del Campo1, Fernando Dronda1, Juan Carlos Galan3, Caroline A Sabin2, Santiago Moreno1,4
1Department of Infectious Diseases, University Hospital Ramon y Cajal and Ramón y Cajal Health Research Institute (IRYCIS), Madrid, Spain
2Institute for Global Health, UCL, Royal Free Campus, London, United Kingdom
3Microbiology Department, IRYCIS, University Hospital Ramón y Cajal, Madrid, Spain
4Department of Medicine and Medical Specialties, Alcala University, Madrid, Spain
*Corresponding author e-mail: [email protected]
Abstract
Background: Cofactors associated with persistently abnormal CD4+:CD8+ T-cell ratio in people with HIV (PWH) on antiretroviral treatment (ART) might change over time as the population of people with HIV ages or as new ART drugs become available. The main objective of our study was to determine the long-term associations of baseline factors, including the CD4+ count and ratio,
with ratio normalization (1). In addition to this, we explored whether the ratio remained associated with the risk of both AIDS and non-AIDS events among individuals on suppressive ART.
Methods: Clinic-based study in a tertiary, University Hospital in Madrid. People with HIV starting a first-line ART regimen (Jan 2006-June 2017) were included in a prospective national multi-centre cohort (CoRIS). People with controlled HIV-infection within the first year of ART initiation and complete CD4+ and CD8+ T-cell records were selected. Cox proportional hazard (PH) regression models were used to estimate the cumulative incidence of ratio normalization and to examine associations with socio-demographic and clinical variables. To investigate factors independently associated with the development of AIDS and non-AIDS events we used a time updated Poisson regression model.
Results: The study included 557 subjects. During follow up (median 5.24 years), 44% participants achieved a ratio of 1 within a median of 1.49 years. In a multivariate PH model, pre-ART factors negatively associated with ratio normalization were the pre-ART CD4+:CD8+ T-cell ratio and mode of HIV acquisition. For the secondary analysis, 1.3 events/100 person years of follow up were observed. After adjustment, older age, HIV RNA >200 copies/mL and CD4+:CD8+ T-cell ratios over follow-up, remained significantly associated with the development of AIDS and non-AIDS events. In contrast, pre-ART ratio was not associated with the risk of AIDS and non-AIDS events.
Conclusions: In summary, our study showed that higher pre-ART CD4+:CD8+
T-cell ratio is associated with rates of ratio normalization 1. In addition, the
Publication: Antiviral Therapy; Type: Original article
DOI: 10.3851/IMP3354
risk of AIDS and non-AIDS events seems to be predicted by the time updated CD4+:CD8+ T-cell ratio not by the pre-ART CD4+:CD8+ T-cell ratio. Therefore, CD4+:CD8+ T-cell ratio should be considered as a dynamic marker for translation into clinical practice.
Accepted 12 April 2020, published online 27 April 2020.
Introduction
The CD4+:CD8+ T-cell ratio is considered to be a useful surrogate marker of immune activation and
inflammation. In addition, CD4+:CD8+ T-cell ratio is an important time-dependent prognostic factor,
for treatment naïve and cART-treated patient [1]. Persistence of a low CD4+:CD8+ T-cell ratio has
been reported to be associated with an increased risk of morbidity and mortality [2]. Indeed, it has
been reported that the benefits of earlier antiretroviral treatment (ART) initiation and modern regimens
are partly due to a shorter time to CD4+:CD8+ T-cell ratio normalization [3].
It is not clear if ART is able to fully restore the immune system even when it is started soon
after infection. Important cofactors associated with persistently abnormal CD4+:CD8+ T-cell ratio
changes in treated patients might change over time as patients age or as the timing of ART is
modified. Methods used in studies that have evaluated the CD4+:CD8+ T-cell ratio were mostly based
on cross-sectional designs and only a few longitudinal studies have included virological failure.
Additionally, few studies have assessed factors associated with CD4+:CD8+ T-cell ratio restoration or
the relationship between baseline CD4+:CD8+ T-cell ratio and the risk of both AIDS and non-AIDS
events. Hence, more data about the factors associated with CD4+:CD8+ T-cell ratio changes after
initiation of ART, and the association with events in ART-treated people with HIV (PWH) is required.
With this information we can help to define a role for the CD4+:CD8+ T-cell ratio in routine clinical
care.
The primary objective of our study was to determine the long-term associations of baseline
factors, including CD4+ T-cell count and CD4+:CD8+ T-cell ratio before ART initiation, with
CD4+:CD8+ T-cell ratio recovery in patients with controlled HIV-infection within 12 months of
treatment initiation. Our secondary objective was to determine if the CD4+: CD8+ T-cell ratio remains
associated with the risk of AIDS and non-AIDS events among individuals on suppressive ART after
adjusting for baseline factors.
Methods
Study design, setting and participants
We conducted a clinic-based study among PWH who were ART-naïve at the University Hospital
Ramón y Cajal, Madrid. We selected those starting a first-line ART regimen from January 2006 to
June 2017 who were included in a prospective national multi-centre cohort of HIV-positive subjects
(CoRIS). Ethic committee approval was obtained from the institutional review board at the Ramón y
Cajal Hospital, and all participants provided written informed consent at enrolment to CoRIS.

Publication: Antiviral Therapy; Type: Original article
DOI: 10.3851/IMP3354
We included people with controlled HIV-infection defined as at least one viral load (VL) <200
copies/mL (2006-2010) or <50 copies/mL (2011 onwards) within 12 months of treatment initiation.
Inclusion criteria included: 6 months of follow up after initial plasma HIV RNA suppression and at least
one CD4+:CD8+ T-cell ratio assessment 6 months after ART initiation.
Variables
The following data were collected: age at ART initiation, sex (male, female), geographical origin,
education level (high school or lower, secondary, university, unknown), mode of HIV acquisition (sex
between men, injection drug use [IDU], sex between men and women, unknown), ART regimens and
dates of ART initiation, CD4+ and CD8+ T-cell counts (from immunology records) and HIV VL from
ART initiation onwards, diagnosis of AIDS (defined according to the Centers for Disease Control and
Prevention) and the following non-AIDS events [4]: non-AIDS defining malignancies, cardiovascular
disease/stroke, decompensated liver disease (variceal bleeding, encephalopathy, ascites,
hepatocarcinoma), end-stage renal disease and diabetes mellitus.
Baseline assessments were determined during the six-month period prior to ART initiation.
Follow-up continued until the occurrence of death from any AIDS or non-AIDS cause (as listed above)
or from any other cause of death not listed above or the last date of CD4+ and CD8+ T-cell count
measurement.
Statistical analysis
For the primary analysis, participant follow-up started on the date of ART initiation and ended on the
date of normalisation of the ratio, defined as a CD4+:CD8+ T-cell ratio 1. This cut off was selected
based on previous literature [5]. Follow-up on subjects was right-censored on the earliest of the date
of development of a new AIDS-defining event, a non-AIDS defining event, or on dis-enrolment from
the hospital (loss to follow up). Cox proportional hazard (PH) regression models were used to
estimate the cumulative incidence of CD4+:CD8+ T-cell ratio recovery and to examine associations of
this with socio-demographic and clinical variables. Based on published findings [2,6–8], we examined
associations with mode of HIV acquisition, gender, age at treatment initiation, baseline CD4+:CD8+ T-
cell ratio, antiretroviral treatment and calendar period of treatment initiation. Calendar time was split
into three periods: 2006-2008 (reflecting the approval of tenofovir disoproxil fumarate
(TDF)/emtricitabine (FTC)/efavirenz (EFV)); 2009-2014 (reflecting the introduction and use of
integrase strand transfer inhibitors (INSTIs)); and 2015-2017 (reflecting the extended use of INSTI-
based single-tablet regimens). To avoid the potential collinearity between hepatitis C virus (HCV),
hepatitis B virus (HBV) and IDU, hepatitis were excluded from the analysis and IDU was included
because it was the variable with the strongest association.
To investigate factors independently associated with the development of AIDS and non-AIDS
events, we used Poisson regression models. For these analyses, follow-up started 6 months after
ART initiation and ended at the earliest of date of a clinical event (date of AIDS event, date of non-
AIDS event or date of death), date of last clinical visit or date of loss to follow up before June 2017.
We examined associations with mode of HIV acquisition, baseline T-cell CD4:CD8 ratio, time-updated
Publication: Antiviral Therapy; Type: Original article
DOI: 10.3851/IMP3354
age, time-updated HCV status and time-updated T-cell CD4:CD8 ratio. Selection of variables for the
multivariable model were based on factors significantly associated with the risk of events in our
population.
Results
Characteristics of the Patients
From January 2006 to June 2017, 617 ART-naïve individuals initiated ART and had at least one
undetectable plasma HIV RNA within the first year after ART initiation. Of these, 557 had sufficient
CD4+ and CD8+ T-cell counts for inclusion. In total, these individuals contributed 7,560 CD4+ and
CD8+ T-cell measurements over follow-up. Median total follow-up time from ART initiation was 5.24
(IQR: 2.50-7.91) years.
The study population comprised 467 men (83.8%), 338 men having reported sex with men
(MSM, 60.7%) with 380 individuals from Spain (68.2%). Pre-ART initiation, the median (IQR) age was
37 (29-44) years, the CD4+ T-cell count was 342 (232-468) cells/ml, and the CD8+ T-cell count was
960 (720–1302) cells/ml. (See Supplementary Table 1). Compared to the excluded sample (n=60),
participants included in the study (n=557) had been less frequently diagnosed with CDC classification
C (14% vs 25%), were more likely to have started ART in the period between 2009 and 2014 (55% vs
23%), were more commonly treated with an INSTI-based regimen (28% vs 22%) and were less
frequently HBsAg positive (3% vs 8%).
CD4+:CD8+ T-cell ratio changes
As mentioned, only patients with all CD4% and CD8% or absolute values for each period were
included. The median CD4+:CD8+ T-cell ratio at baseline was 0.32 (IQR 0.19-0.50) and mínimum-
maximum values were 0.01 and 1.45. Twenty-eight percent exhibited a baseline ratio of less than 0.2.
Two hundred and forty-five (44%) attained a CD4:CD8 ratio of >1 within a median time of 1.49 (0.83-
3.22) years of initiating ART.
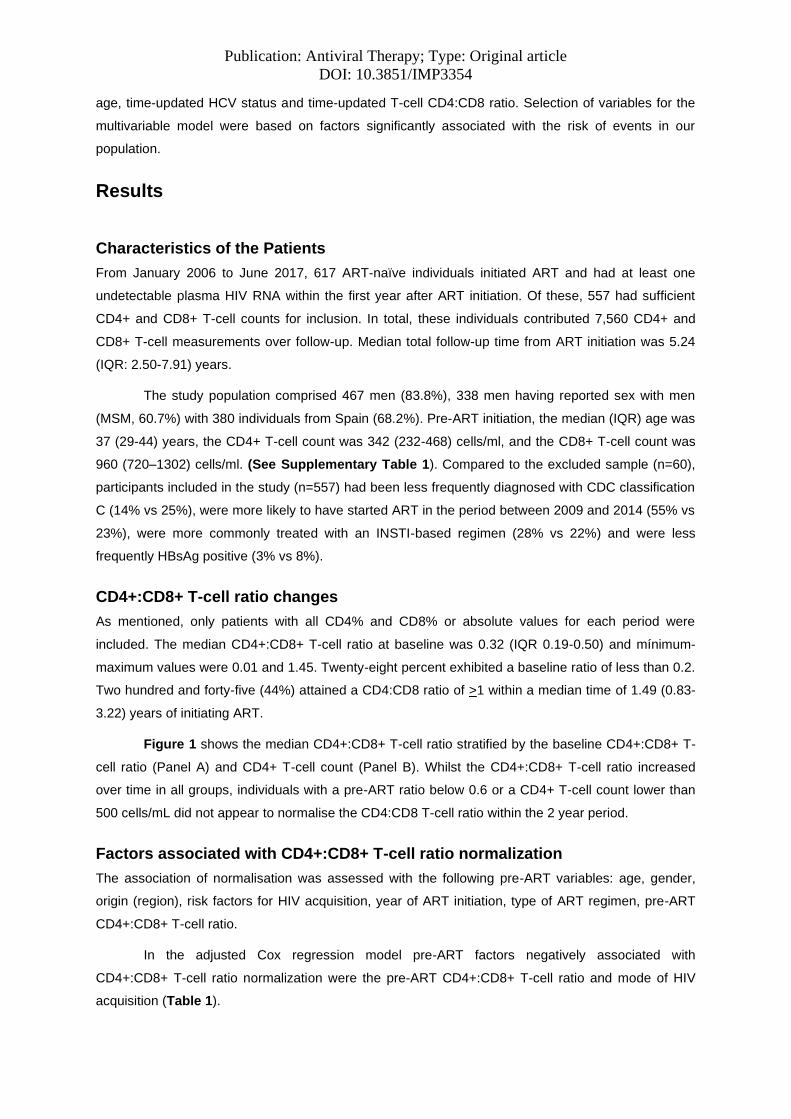
Figure 1 shows the median CD4+:CD8+ T-cell ratio stratified by the baseline CD4+:CD8+ T-
cell ratio (Panel A) and CD4+ T-cell count (Panel B). Whilst the CD4+:CD8+ T-cell ratio increased
over time in all groups, individuals with a pre-ART ratio below 0.6 or a CD4+ T-cell count lower than
500 cells/mL did not appear to normalise the CD4:CD8 T-cell ratio within the 2 year period.
Factors associated with CD4+:CD8+ T-cell ratio normalization
The association of normalisation was assessed with the following pre-ART variables: age, gender,
origin (region), risk factors for HIV acquisition, year of ART initiation, type of ART regimen, pre-ART
CD4+:CD8+ T-cell ratio.
In the adjusted Cox regression model pre-ART factors negatively associated with
CD4+:CD8+ T-cell ratio normalization were the pre-ART CD4+:CD8+ T-cell ratio and mode of HIV
acquisition (Table 1).

Publication: Antiviral Therapy; Type: Original article
DOI: 10.3851/IMP3354
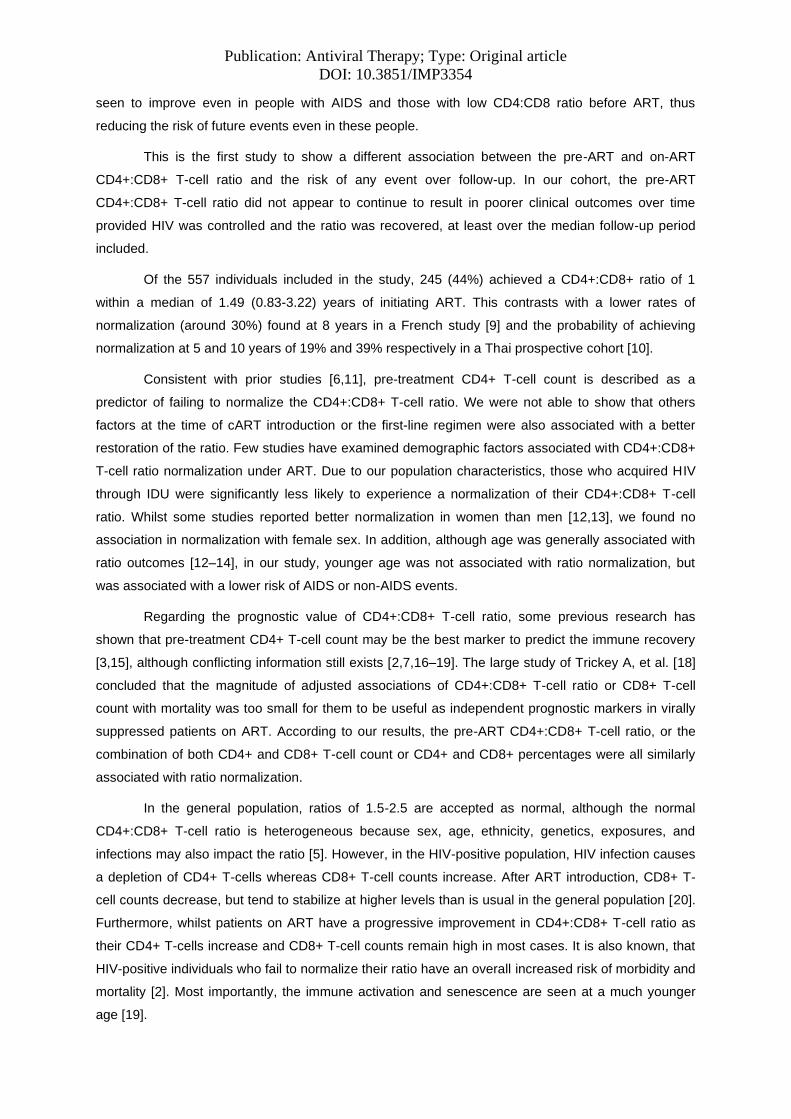
We also explored various models to determine associations of the various immunological
markers (pre-ART CD4+:CD8+ T-cell ratio, pre-ART CD4+ and CD8+ T-cell count, or pre-ART CD4+
and CD8+ percentage) with normalisation of the ratio (Figure 2). Although similar conclusions were
reached with each combination of parameters, the CD4+:CD8+ T-cell ratio has been included in
subsequent analyses as we had complete data for CD4+:CD8+ T-cell ratio for each period.
Risk of AIDS and non-AIDS defining conditions
Of the 557 included people, 548 were eligible for this analysis (Table 2). Nine individuals were
excluded due to insufficient follow-up after ART initiation (6 MSM, 2 with AIDS at baseline, 8 starting
ART during the period 2012-2014, and 8 who were receiving an INSTI). After initial suppression post
cART initiation, individuals had undetectable viral load for 91% of their total follow-up time (based on
monthly intervals).
There were a total of 41 recorded events in 35 eligible participants: 13 AIDS events, nine non-
AIDS-defining malignancies, six cardiovascular events, one stroke, seven diabetes and five hepatic
events. Nine subjects died of causes related to AIDS and non-AIDS-defining conditions, four from
other causes, and in one person the cause of the death was unknown. Three people had two or more
AIDS events and three had two or more non-AIDS events; the median time to the first event was 1.9
(CI: 0.49-4.02) years. The 41 events were observed over a total time of 2726 person-years [1.38 (CI
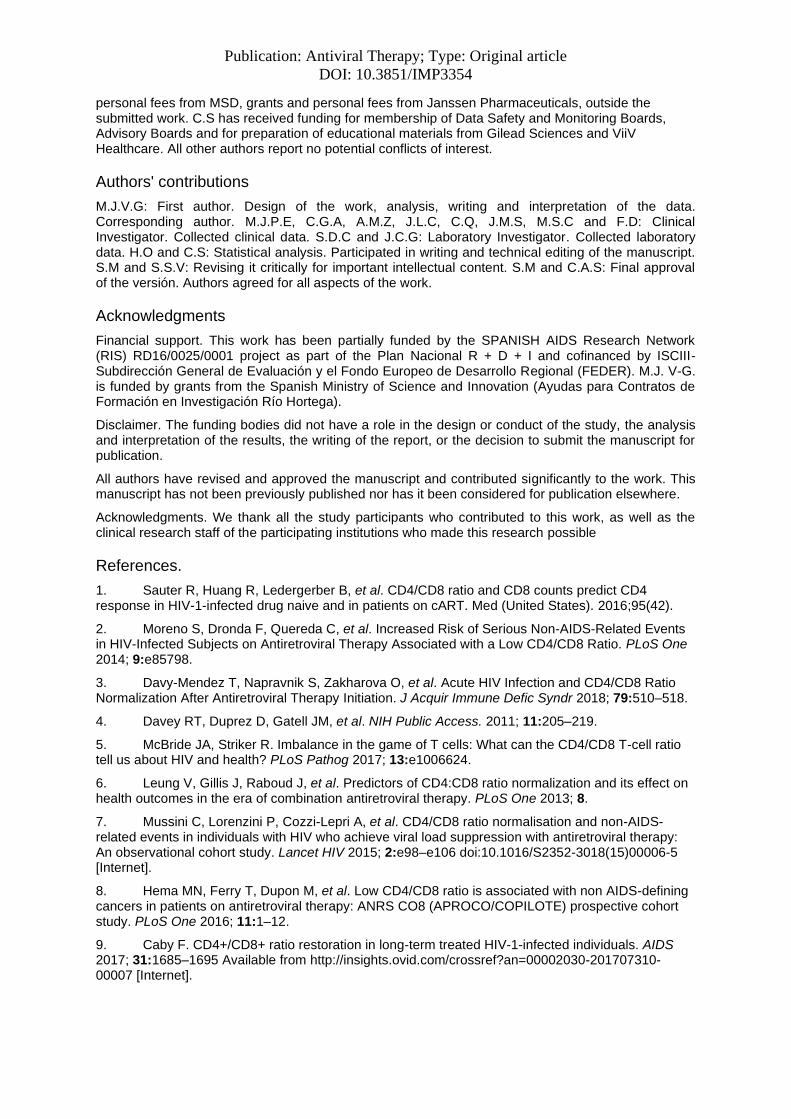
0.99-1.93) events per 100 person years of follow-up]. Event rates varied by CD4+:CD8+ T-cell ratio
category, ranging from 6.56 (CI 3.13-13.77) events per 100 person-years in those with a ratio <0.2 to
0.29 (CI 0.72-1.15) events per 100 person-years in those with a ratio >1 (Figure 3).
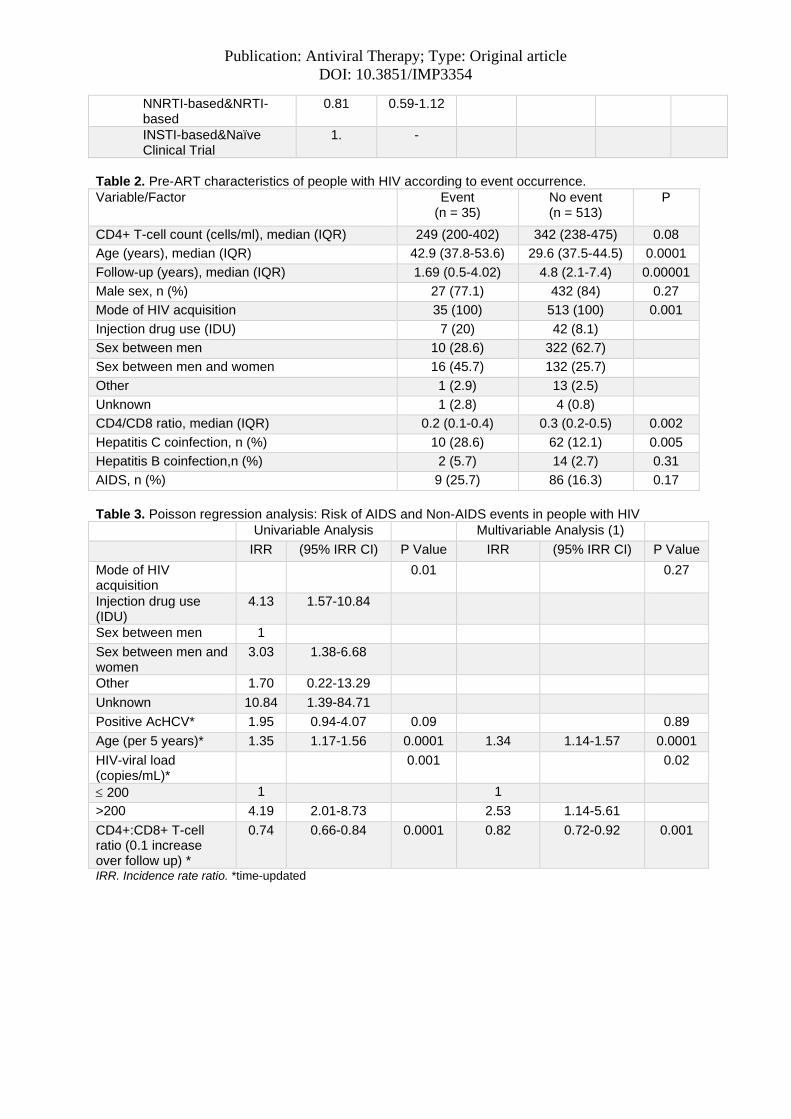
Using Poisson regression analysis, we calculated univariable and multivariable incidence rate
ratios (IRR) adjusting for mode of HIV acquisition, HCV serology, age (per 5 years), HIV RNA
copies/mL (200, >200) and CD4+:CD8+ T-cell ratios over follow-up all as time-updated covariates.
An unadjusted time-dependent model did not show a higher risk of events with higher pre-
ART CD4+:CD8+ T-cell ratio (0.1 increase) [IRR 0.89 (CI 0.75-1.05)]. After including significant
factors into a multivariable model (Table 3), only older age, HIV RNA >200 copies/mL and
CD4+:CD8+ T-cell ratios over follow-up remained significantly associated with the outcome, although
the effects of other factors (e.g. mode of HIV acquisition) generally remained similar although were
attenuated (and failed to reach statistical significance, likely due to lack of power).
Discussion
In this cohort study, we show that pre-ART CD4+:CD8+ T-cell ratio levels are associated with
CD4+:CD8+ T-cell ratio normalization during therapy. However, the development of AIDS and non
AIDS events appear to be better related to the changing CD4+:CD8+ T-cell measurement after
starting ART compared to the pre-ART CD4+:CD8+ T-cell ratio, as additional factors could influence
the ratio evolution during the time. The finding is supported by the fact that the ratio generally
increases under ART but can also drop in some individuals. Of note, CD4+:CD8+ T-cell ratios were
Publication: Antiviral Therapy; Type: Original article
DOI: 10.3851/IMP3354
seen to improve even in people with AIDS and those with low CD4:CD8 ratio before ART, thus
reducing the risk of future events even in these people.
This is the first study to show a different association between the pre-ART and on-ART
CD4+:CD8+ T-cell ratio and the risk of any event over follow-up. In our cohort, the pre-ART
CD4+:CD8+ T-cell ratio did not appear to continue to result in poorer clinical outcomes over time
provided HIV was controlled and the ratio was recovered, at least over the median follow-up period
included.
Of the 557 individuals included in the study, 245 (44%) achieved a CD4+:CD8+ ratio of 1
within a median of 1.49 (0.83-3.22) years of initiating ART. This contrasts with a lower rates of
normalization (around 30%) found at 8 years in a French study [9] and the probability of achieving
normalization at 5 and 10 years of 19% and 39% respectively in a Thai prospective cohort [10].
Consistent with prior studies [6,11], pre-treatment CD4+ T-cell count is described as a
predictor of failing to normalize the CD4+:CD8+ T-cell ratio. We were not able to show that others
factors at the time of cART introduction or the first-line regimen were also associated with a better
restoration of the ratio. Few studies have examined demographic factors associated with CD4+:CD8+
T-cell ratio normalization under ART. Due to our population characteristics, those who acquired HIV
through IDU were significantly less likely to experience a normalization of their CD4+:CD8+ T-cell
ratio. Whilst some studies reported better normalization in women than men [12,13], we found no
association in normalization with female sex. In addition, although age was generally associated with
ratio outcomes [12–14], in our study, younger age was not associated with ratio normalization, but
was associated with a lower risk of AIDS or non-AIDS events.
Regarding the prognostic value of CD4+:CD8+ T-cell ratio, some previous research has
shown that pre-treatment CD4+ T-cell count may be the best marker to predict the immune recovery
[3,15], although conflicting information still exists [2,7,16–19]. The large study of Trickey A, et al. [18]
concluded that the magnitude of adjusted associations of CD4+:CD8+ T-cell ratio or CD8+ T-cell
count with mortality was too small for them to be useful as independent prognostic markers in virally
suppressed patients on ART. According to our results, the pre-ART CD4+:CD8+ T-cell ratio, or the
combination of both CD4+ and CD8+ T-cell count or CD4+ and CD8+ percentages were all similarly
associated with ratio normalization.
In the general population, ratios of 1.5-2.5 are accepted as normal, although the normal
CD4+:CD8+ T-cell ratio is heterogeneous because sex, age, ethnicity, genetics, exposures, and
infections may also impact the ratio [5]. However, in the HIV-positive population, HIV infection causes
a depletion of CD4+ T-cells whereas CD8+ T-cell counts increase. After ART introduction, CD8+ T-
cell counts decrease, but tend to stabilize at higher levels than is usual in the general population [20].
Furthermore, whilst patients on ART have a progressive improvement in CD4+:CD8+ T-cell ratio as
their CD4+ T-cells increase and CD8+ T-cell counts remain high in most cases. It is also known, that
HIV-positive individuals who fail to normalize their ratio have an overall increased risk of morbidity and
mortality [2]. Most importantly, the immune activation and senescence are seen at a much younger
age [19].

Publication: Antiviral Therapy; Type: Original article
DOI: 10.3851/IMP3354
Therefore, some studies have suggested that there may be immunological benefits to the
initiation of ART prior to an increase in CD8+ T-cell count [21]. According to the START study, the risk
of AIDS and non-AIDS events was reduced by 57% in those patients who initiated ART immediately
after diagnosis, whilst the CD4+ T-cell count remained >500 cells/mL, compared to those who
deferred treatment until their CD4+ T-cell count had fallen below 350 cells/mL [22].
The reason for the discrepancy with pre-ART CD4+:CD8+ T-cell ratio and the risk of AIDS
and non-AIDS events remains unclear. Both early initiation, mainly during primary HIV-infection
[23,24] and continuous adherence to treatment are important to achieve normalization of CD4+:CD8+
T-cell ratio. For this reason, we adjusted for time-updated viral load in our regression models, as we
were not able to include adherence in our analysis.
Some limitations of our study should be considered. We have no information on other factors
that can influence the ratio, including smoking, alcohol, cytomegalovirus (CMV) infection, and other
comorbidities (e.g. obesity, hypertension). It is well known that CMV infection has a significant impact
on the CD4+:CD8+ T-cell ratio through the expansion of CD8+ T-cells [25]. One of the limitations of
this study had to do with the small number of AIDS and non AIDS events. Of note, events occurred in
different times but more frequently in recent time periods, specifically, from 2011. There are also
implications regarding immune recovery depending on the timing of ART initiation from the real date
of HIV infection that we were unable to address in our study [3]. On the other hand, the impact of
different ART regimens during follow up has not been analysed. A study from a French cohort
reported that initiation of cART with an INSTI regimen was strongly associated with a faster rate of
ratio normalisation when compared to initiation with non-INSTI containing regimens [26]. INSTIs
became available more recently than PIs and NNRTIs, and this coincides with changing views on the
timing of initiation of ART, with a consensus toward universal treatment emerging just as INSTIs
became more widely used and NNRTIs and PIs became less favored options.
Unfortunatetly, after viral suppression, treatment failure, resistance tests and switching
regimens could not be addressed clearly in our database. Major strengths of this study are the time
update HIV viral load after viral suppression in the analysis, and the prospective study follow-up
design.
In conclusion, our study showed that higher pre-ART CD4+:CD8+ T-cell ratios are associated
with rates of ratio normalization. In addition, the risk of AIDS and non-AIDS events are more strongly
associated with the CD4+:CD8+ T-cell ratio over follow-up than with the pre-ART CD4+:CD8+ T-cell
ratio at baseline. Therefore, the CD4+:CD8+ T-cell ratio should be considered as a dynamic marker
for translation into clinical practice.
Disclosure statement
M.J.V.G reports grants and personal fees from Gilead and ViiV outside the submitted work. M.J.P.E reports grants and personal fees from Abbvie, ViiV Healthcare, Gilead Sciences, Janssen Cilag.M.S.C reports personal fees from MSD, personal fees from ViiV Healthcare, personal fees from GILEAD, outside the submitted work. S.S.V reports grants and personal fees from Gilead, grants and personal fees from MSD, personal fees from ViiV, outside the submitted work. S.M reports grants and personal fees from ViiV Healthcare, grants and personal fees from Gilead Sciences, grants and
Publication: Antiviral Therapy; Type: Original article
DOI: 10.3851/IMP3354
personal fees from MSD, grants and personal fees from Janssen Pharmaceuticals, outside the submitted work. C.S has received funding for membership of Data Safety and Monitoring Boards, Advisory Boards and for preparation of educational materials from Gilead Sciences and ViiV Healthcare. All other authors report no potential conflicts of interest.
Authors' contributions
M.J.V.G: First author. Design of the work, analysis, writing and interpretation of the data. Corresponding author. M.J.P.E, C.G.A, A.M.Z, J.L.C, C.Q, J.M.S, M.S.C and F.D: Clinical Investigator. Collected clinical data. S.D.C and J.C.G: Laboratory Investigator. Collected laboratory data. H.O and C.S: Statistical analysis. Participated in writing and technical editing of the manuscript. S.M and S.S.V: Revising it critically for important intellectual content. S.M and C.A.S: Final approval of the versión. Authors agreed for all aspects of the work.
Acknowledgments
Financial support. This work has been partially funded by the SPANISH AIDS Research Network (RIS) RD16/0025/0001 project as part of the Plan Nacional R + D + I and cofinanced by ISCIII- Subdirección General de Evaluación y el Fondo Europeo de Desarrollo Regional (FEDER). M.J. V-G. is funded by grants from the Spanish Ministry of Science and Innovation (Ayudas para Contratos de Formación en Investigación Río Hortega).
Disclaimer. The funding bodies did not have a role in the design or conduct of the study, the analysis and interpretation of the results, the writing of the report, or the decision to submit the manuscript for publication.
All authors have revised and approved the manuscript and contributed significantly to the work. This manuscript has not been previously published nor has it been considered for publication elsewhere.
Acknowledgments. We thank all the study participants who contributed to this work, as well as the clinical research staff of the participating institutions who made this research possible
References.
1. Sauter R, Huang R, Ledergerber B, et al. CD4/CD8 ratio and CD8 counts predict CD4 response in HIV-1-infected drug naive and in patients on cART. Med (United States). 2016;95(42).
2. Moreno S, Dronda F, Quereda C, et al. Increased Risk of Serious Non-AIDS-Related Events in HIV-Infected Subjects on Antiretroviral Therapy Associated with a Low CD4/CD8 Ratio. PLoS One 2014; 9:e85798.
3. Davy-Mendez T, Napravnik S, Zakharova O, et al. Acute HIV Infection and CD4/CD8 Ratio Normalization After Antiretroviral Therapy Initiation. J Acquir Immune Defic Syndr 2018; 79:510–518.
4. Davey RT, Duprez D, Gatell JM, et al. NIH Public Access. 2011; 11:205–219.
5. McBride JA, Striker R. Imbalance in the game of T cells: What can the CD4/CD8 T-cell ratio tell us about HIV and health? PLoS Pathog 2017; 13:e1006624.
6. Leung V, Gillis J, Raboud J, et al. Predictors of CD4:CD8 ratio normalization and its effect on health outcomes in the era of combination antiretroviral therapy. PLoS One 2013; 8.
7. Mussini C, Lorenzini P, Cozzi-Lepri A, et al. CD4/CD8 ratio normalisation and non-AIDS-related events in individuals with HIV who achieve viral load suppression with antiretroviral therapy: An observational cohort study. Lancet HIV 2015; 2:e98–e106 doi:10.1016/S2352-3018(15)00006-5 [Internet].
8. Hema MN, Ferry T, Dupon M, et al. Low CD4/CD8 ratio is associated with non AIDS-defining cancers in patients on antiretroviral therapy: ANRS CO8 (APROCO/COPILOTE) prospective cohort study. PLoS One 2016; 11:1–12.
9. Caby F. CD4+/CD8+ ratio restoration in long-term treated HIV-1-infected individuals. AIDS 2017; 31:1685–1695 Available from http://insights.ovid.com/crossref?an=00002030-201707310-00007 [Internet].
Publication: Antiviral Therapy; Type: Original article
DOI: 10.3851/IMP3354
10. Ruxrungtham K, Avihingsanon A, Do T, et al. CD4/CD8 ratio normalization rates and low ratio as prognostic marker for non-AIDS defining events among long-term virologically suppressed people living with HIV. AIDS Res Ther 2018; 15:1–9 10.1186/s12981-018-0200-4 [Internet].
11. M HIVFCO. CD4 R / CD8 R ratio restoration in long-term treated HIV-1-infected individuals Ratio Working Group of the French Hospital Database. 2017;(February):1685–95.
12. Fisher M, Jose S, Winston A, et al. Host, disease, and antiretroviral factors are associated with normalization of the CD4:CD8 ratio after initiating antiretroviral therapy. J Allergy Clin Immunol 2015; 136:1682–1685.e1.
13. Torti C, Prosperi M, Motta D, et al. Factors influencing the normalization of CD4+ T-cell count, percentage and CD4+/CD8+ T-cell ratio in HIV-infected patients on long-term suppressive antiretroviral therapy. Clin Microbiol Infect 2012; 18:449–458 doi:10.1111/j.1469-0691.2011.03650.x [Internet].
14. Raffi F, Le Moing V, Assuied A, et al. Failure to achieve immunological recovery in HIV-infected patients with clinical and virological success after 10 years of combined ART: Role of treatment course. J Antimicrob Chemother 2017; 72:240–245.
15. Lee SS, Wong NS, Wong BCK, Wong KH, Chan KCW. Combining CD4 recovery and CD4: CD8 ratio restoration as an indicator for evaluating the outcome of continued antiretroviral therapy: An observational cohort study. BMJ Open 2017; 7.
16. Serrano-Villar S, Sainz T, Lee SA, et al. HIV-Infected Individuals with Low CD4/CD8 Ratio despite Effective Antiretroviral Therapy Exhibit Altered T Cell Subsets, Heightened CD8+ T Cell Activation, and Increased Risk of Non-AIDS Morbidity and Mortality. PLoS Pathog 2014; 10.
17. Leung V, Gillis J, Raboud J, Cooper C, Hogg RS, Loutfy MR. Predictors of CD4 : CD8 Ratio Normalization and Its Effect on Health Outcomes in the Era of Combination Antiretroviral Therapy. 2013;8 [10].
18. Trickey A, May MT, Schommers P, Tate J, Ingle SM, Guest JL, et al. CD4 : CD8 Ratio and CD8 Count as Prognostic Markers for Mortality in Human Immunodeficiency Virus – Infected Patients on Antiretroviral Therapy : The Antiretroviral Therapy Cohort Collaboration (ART-CC). 2017;65:959–66.
19. Serrano-Villar S, Moreno S, Fuentes-Ferrer M, et al. The CD4: CD8 ratio is associated with markers of age-associated disease in virally suppressed HIV-infected patients with immunological recovery. HIV Med 2014; 15:40–49.
20. Helleberg M, Kronborg G, Ullum H, Ryder LP, Obel N, Gerstoft J. Course and clinical significance of CD8+ T-cell counts in a large cohort of HIV-infected individuals. J Infect Dis 2015; 211:1726–1734.
21. Williams M, Haerry DH-U, Sterling TR, et al. CD4:CD8 Ratio and CD8 Count as Prognostic Markers for Mortality in Human Immunodeficiency Virus–Infected Patients on Antiretroviral Therapy: The Antiretroviral Therapy Cohort Collaboration (ART-CC). Clin Infect Dis 2017; 65:959–966.
22. Diseases I. Initiation of Antiretroviral Therapy in Early Asymptomatic HIV Infection. N Engl J Med 2015; 373:795–807.
23. Laanani M, Ghosn J, Essat A, et al. Impact of the timing of initiation of antiretroviral therapy during primary HIV-1 infection on the decay of cell-associated HIV-DNA. Clin Infect Dis 2015; 60:1715–1721.
24. Hocqueloux L, Avettand-fènoël V, Jacquot S, et al. Long-term antiretroviral therapy initiated during primary HIV-1 infection is key to achieving both low HIV reservoirs and normal T cell counts. J Antimicrob Chemother 2013; 68:1169–1178.
25. Hadrup SR, Strindhall J, Kollgaard T, et al. Longitudinal Studies of Clonally Expanded CD8 T Cells Reveal a Repertoire Shrinkage Predicting Mortality and an Increased Number of Dysfunctional Cytomegalovirus-Specific T Cells in the Very Elderly. J Immunol 2014; 176:2645–2653.
26. De Salvador-Guillouët F, Sakarovitch C, Durant J, et al. Antiretroviral regimens and CD4/CD8 ratio normalization in HIV-infected patients during the initial year of treatment: A cohort study. PLoS One 2015; 10:1–12.

Publication: Antiviral Therapy; Type: Original article
DOI: 10.3851/IMP3354
Table 1. Pre-ART associations with CD4+:CD8+ T-cell ratio normalization in 557 individuals with complete data. Cox regression model after backward selection.
Univariable Analysis
Multivariable Analysis
Hazard Ratio
(95% CI) P Value
Hazard Ratio
(95% CI) P Value
Age at ART initiation (per 5 years)
0.89 0.84 -0.96 0.001
Gender (male/transgender vs. female)
0.79 0.58-1.09 0.17
Region
0.83
Spain 1. -
Latin America 0.96 0.69-1.31
Sub-Saharan Africa 1.02 0.54-1.94
Others 1.26 0.76-2.11
Mode of HIV acquisition
0.02
0.01
Injection drug use (IDU) 0.41 0.23-0.73
0.49 0.27-0.89
Sex between men 1. -
1.
Sex between men and women
0.84 0.63-1.13
1.26 0.93-1.71
Other 0.97 0.48-1.98
2.19 1-05-4.56
Unknown 0.93 0.23-3.77
1.00 0.24-4.12
Education level
0.08
None 0.51 0.19-1.39
Primary School 0.92 0.54-1.58
Secondary School 1.11 0.79-1.56
High secondary/college 1.11 0.79-1.55
University/postgrad 1. -
Unknown 1.86 1.17-2.94
Pre-ART CD4+:CD8+T-cell ratio
0.0000
1
0.0001
<0.2 0.15 0.10-0.22
0.14 0.09-0.21
0.2-0.4 0.36 0.26-0.50
0.33 0.24-0.46
0.4-0.6 1. -
1 -
0.6-0.8 2.02 1.38-2.94 2.05 1.40-3.00
>0.8 3.49 2.05-5.94
3.55 2.08-6.08
CDC classification at diagnosis, n (%)
0.00001
Collinear.
A 1 - -
B 0,.9 0.30-0.78 0.001
C 0.41 0.31-0.78 0.003
Acute Infection 1.47 0.85-2.52 0.17
Positive HCV Ab 0.56 0.36-0.88 0.006 Collinear.
Positive HBsAg 0.65 0.27-1.57 0.30
Period of cART introduction
0.02
2006-2008 0.54 0.35-0.82
2009-2014 0.60 0.41-0.87
2015-2017 1. -
Baseline cART
0.03
Boosted PI-based 0.59 0.39-0.87
Publication: Antiviral Therapy; Type: Original article
DOI: 10.3851/IMP3354
NNRTI-based&NRTI-based
0.81 0.59-1.12
INSTI-based&Naïve Clinical Trial
1. -
Table 2. Pre-ART characteristics of people with HIV according to event occurrence.
Variable/Factor Event (n = 35)
No event (n = 513)
P
CD4+ T-cell count (cells/ml), median (IQR) 249 (200-402) 342 (238-475) 0.08
Age (years), median (IQR) 42.9 (37.8-53.6) 29.6 (37.5-44.5) 0.0001
Follow-up (years), median (IQR) 1.69 (0.5-4.02) 4.8 (2.1-7.4) 0.00001
Male sex, n (%) 27 (77.1) 432 (84) 0.27
Mode of HIV acquisition 35 (100) 513 (100) 0.001
Injection drug use (IDU) 7 (20) 42 (8.1)
Sex between men 10 (28.6) 322 (62.7)
Sex between men and women 16 (45.7) 132 (25.7)
Other 1 (2.9) 13 (2.5)
Unknown 1 (2.8) 4 (0.8)
CD4/CD8 ratio, median (IQR) 0.2 (0.1-0.4) 0.3 (0.2-0.5) 0.002
Hepatitis C coinfection, n (%) 10 (28.6) 62 (12.1) 0.005
Hepatitis B coinfection,n (%) 2 (5.7) 14 (2.7) 0.31
AIDS, n (%) 9 (25.7) 86 (16.3) 0.17
Table 3. Poisson regression analysis: Risk of AIDS and Non-AIDS events in people with HIV
Univariable Analysis
Multivariable Analysis (1)
IRR (95% IRR CI) P Value IRR (95% IRR CI) P Value
Mode of HIV acquisition
0.01
0.27
Injection drug use (IDU)
4.13 1.57-10.84
Sex between men 1
Sex between men and women
3.03 1.38-6.68
Other 1.70 0.22-13.29
Unknown 10.84 1.39-84.71
Positive AcHCV* 1.95 0.94-4.07 0.09 0.89
Age (per 5 years)* 1.35 1.17-1.56 0.0001 1.34 1.14-1.57 0.0001
HIV-viral load (copies/mL)*
0.001 0.02
200 1 1
>200 4.19 2.01-8.73 2.53 1.14-5.61
CD4+:CD8+ T-cell ratio (0.1 increase over follow up) *
0.74 0.66-0.84 0.0001 0.82 0.72-0.92 0.001
IRR. Incidence rate ratio. *time-updated

Fig1.Ratio dynamics in the first two years after ART initiation by pre-ART CD4+:CD8+ T-cell ratio (Panel A) and pre-ART CD4+ T-cell count (Panel B).
Panel A

Panel B
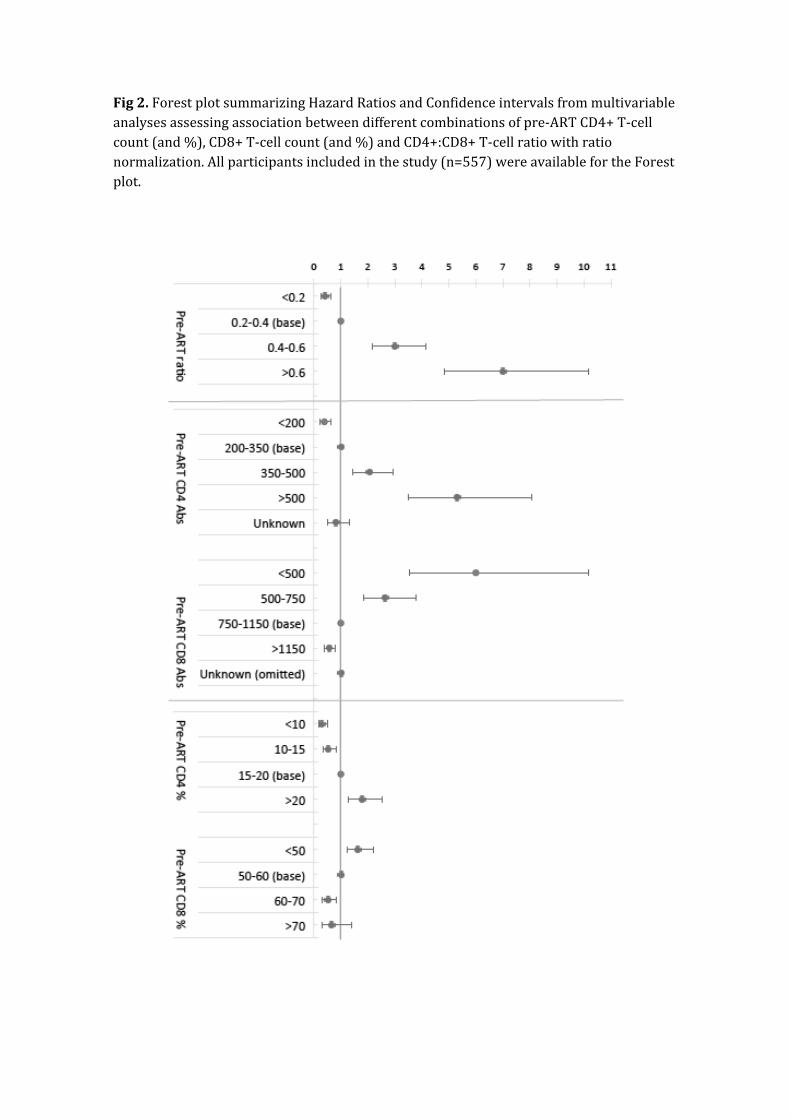
Fig2. Forest plot summarizing Hazard Ratios and Confidence intervals from multivariable analyses assessing association between different combinations of pre-ART CD4+ T-cell count (and %), CD8+ T-cell count (and %) and CD4+:CD8+ T-cell ratio with ratio normalization. All participants included in the study (n=557) were available for the Forest plot.
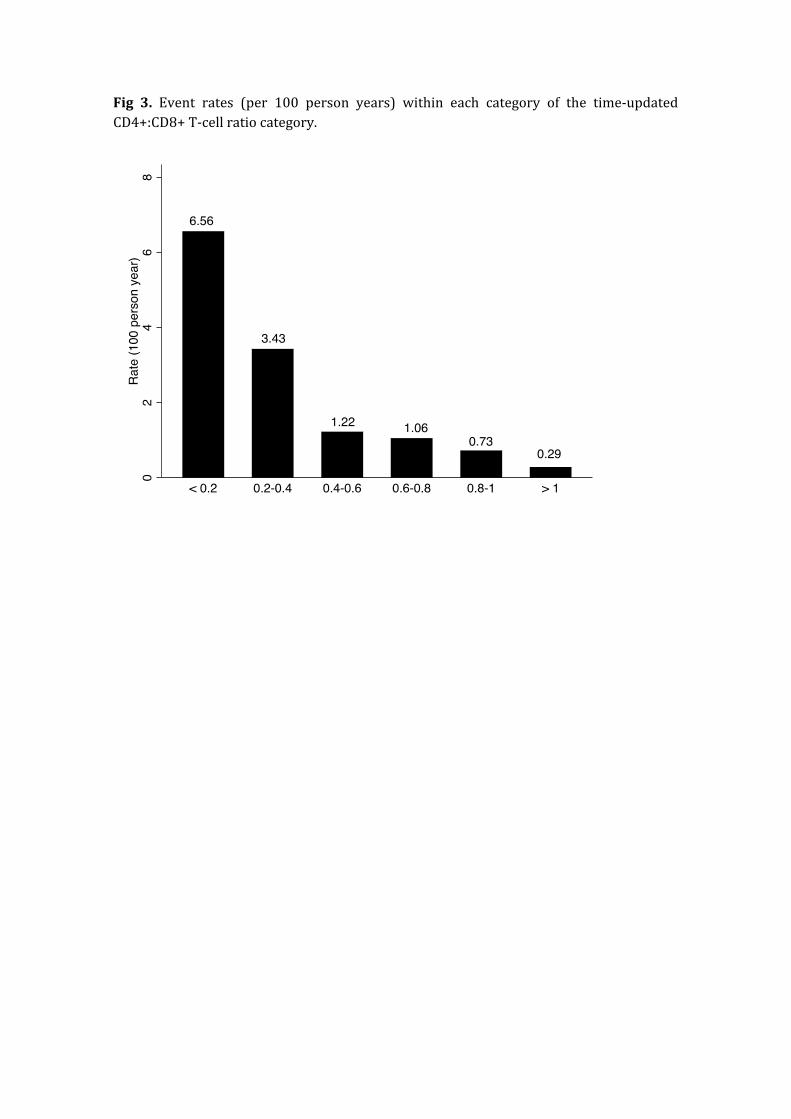
Fig 3. Event rates (per 100 person years) within each category of the time-updated CD4+:CD8+ T-cell ratio category.

Supplementary_Table 1. Characteristics of the study population sample and sample selection (CD4 and CD8 not complete data compared to the sample).
All =617 Individuals With
CD4 CD8 (n = 557) Individuals With No complete
CD4 CD8 (n =60) P Value
Age at ART initiation, median (IQR) 37 (29-44) 37 (29-44) 35.5 (28-40.5) 0.13
Male sex, n (%) 517 (83.79) 467 (83.84) 50 (83.33) 0.92
Origin
0.07
Spain n (%) 413 (66.94) 380 (68.22) 33 (55)
Latin America n (%) 141 (22.85) 124 (22.26) 17 (28.33)
Sub-Saharan Africa n (%) 27 (4.38) 21 (3.77) 6 (10)
Others n (%) 36 (5.83) 32 (5.75) 4 (6.67)
Mode of HIV acquisition
0.32
Injection drug use (IDU) 53 (8.59) 50 (8.98) 3 (5.00)
Sex between men 369 (59.81) 338 (60.68) 31 (51.67)
Sex between men and women
173 (28.04) 150 (26.93) 23 (38.33)
Other 16 (2.59) 14 (2.51) 2 (3.33)
Unknown 6 (0.97) 5 (0.90) 1 (1.67)
Education level
0.84
None 19 (3.08) 17 (3.06) 2 (3.33)
Primary School 48 (7.79) 44 (7.91) 4 (6.67)
Secondary School 134 (21.75) 121 (21.76) 13 (21.67)
High secondary/colleg 153 (24.84) 136 (24.46) 17 (28.33)
University/postgrad 211 (34.25) 194 (34.89) 17 (28.33)
Unknown 51 (8.28) 44 (7.91) 7 (11.67)
CDC classification at diagnosis, n (%)
0.03
A 427 (72.37) 394 (73.92) 33 (57.89)
B 75 (12.71) 65 (12.20) 10 (16.67)
C 88 (14.92) 74 (13.88) 14 (24.56)
Acute Infection 23 (3.72) 22 (3.9) 1 (1.6) 0.38
AIDS (at diagnosis) 115 (18.63) 97 (17.41) 18 (30) 0.17
Pre-ART CD4+ T-cell count, n (%)
-
Median (IQR) - 342 (232-468) -
>500 cells/mm3 - 86 (15.44) -
350-500 cells/mm3 - 127 (22.80) -
200–350 cells/mm3 - 148 (26.57) -
<200 cells/mm - 81 (14.54) -
Unknown - 115 (20.65) -
Pre-ART CD8+ T-cell count - -
Median (IQR) - 960 (720-1302) -
<500 - 30 (5.39) -
500-750 - 93 (16.70) -
750-1150 - 167 (29.98) -
>1150 - 152 (27.29) -
Unknown - 115 (20.65) -
Number of baseline measurements - -
CD4 % T-cell - 557 (100) -
CD8 % T-cell - 557 (100) -
CD4+:CD8+ T-cell ratio - 0.3 (0.19-0.50) -
Date of ART initiation
0.003
2006-2008 149 (24.15) 126 (22.62) 23 (38.33)
2009-2014 328 (53.16) 308 (55.30) 20 (33.33)

2015-2017 140 (22.69) 123 (22.08) 17 (28.33)
Baseline cART
0.001
Boosted PI-based 127 (20.58) 113 (20.29) 14 (23.33)
NNRTI-based 309 (50.08) 282 (50.63) 27 (45.00)
INSTI-based 168 (27.23) 155 (27.83) 13 (21.67)
NRTI-based 3 (0.49) 2 (0.36) 1 (1.67)
Naïve Clinical Trial 10 (1.62) 5 (0.90) 5 (8.33)
Positive AcHCV, n (%) 78 (12.64) 74 (13.29) 4 (6.67) 0.14
Positive HBsAg, n (%) 21 (3.40) 16 (2.87) 5 (8.33) 0.03
Related Documents