CD Equisearch Pvt Ltd June 21, 2016 Equities Derivatives Commodities Distribution of Mutual Funds Distribution of Life Insurance . * nine months ended Mar 31, 2016 due to change in accounting year The Supreme Industries Ltd No. of shares (m) 127.0 Mkt cap (Rs crs/$m) 11109/1648.0 Current price (Rs/$) 875/13.0 Price target (Rs/$) 971/14.4 52 W H/L (Rs.) 1000/540 Book Value (Rs/$) 103/1.5 Beta 0.5 Daily volume (avg. monthly) 155450 P/BV (FY17e/18e) 7.2/6.1 EV/EBITDA (FY17e/18e) 16.7/14.7 P/E (FY17e/18e) 31.8/27.0 EPS growth (F17e/18e) 16.6/17.6 OPM (FY16/17e/18e) 15.5/14.7/14.9 ROE (FY16/17e/18e) 23.7/24.5/24.5 ROCE(FY16e/17e/18e) 18.2/20.0/21.6 D/E ratio (FY16e/17e/18e) 0.3/0.2/0.1 BSE Code 509930 NSE Code SUPREMEIND Bloomberg SI IN Reuters SUPI.BO Shareholding pattern % Promoters 49.7 MFs / Banks / FIs 8.3 FIIs 20.6 Govt. Holding 0.0 Public & Others 21.4 Total 100.0 As on Mar 31, 2016 Recommendation ACCUMULATE Analyst KISHAN GUPTA, CFA, FRM Phone: + 91 (33) 4488 0043 E- mail: [email protected] (Figures in Rs crs) FY14 FY15 FY16* FY17e FY18e Income from operations 3962.22 4255.18 2974.85 4672.70 5223.89 Other Income 5.94 4.66 3.64 2.83 2.97 EBITDA (other income included) 594.74 670.89 457.09 689.48 779.66 Profit after EO 281.30 320.75 225.52 349.68 411.15 EPS 22.14 25.25 17.75 27.53 32.37 EPS growth (%) -3.1 14.0 -6.5 16.6 17.6 Quarterly Highlights Trampled by incessant fall in global crude oil prices, polymer manufacturers faced a nasty shock. Most reported sharp fall in prices of their finished products, resulting in near brutal moderation in sales. SIL was no exception for its plastic business sales grew by just 4%. Its plastic piping system picked up the slack for it reported 13.7% growth in sales (18.6% in volumes) in FY16 (nine months). But its industrial products and packaging products businesses showed lousy growth in dispatches last fiscal: volumes of the former slid by 7.6% and that of the latter grew by a tiddly 6.6%. Surprisingly, SIL’s consumer products business proved most resilient for it has now posted double digit revenue growth for six quarters in a row; volumes too have complied - 19.8% median growth in last five quarters. Strong uptick in demand from agriculture and infrastructure sector - drinking water pipes; sewage etc explains the buoyancy in plastic piping system business. Resultantly, its CPVC business outgrew the industry by posting 24% growth in dispatches last fiscal. But this peppiness in overall demand barely reflects effects of seasonality. Piping volumes for instance grew by a measly 4.3% in Q2FY16. Third quarter of last fiscal alone contributed 46% to annual tally. Cumulative sales in two quarters (Q3&Q4) accounted for nearly 62% of total annual volumes in FY15. Notwithstanding growing value addition in packaging products business (read: cross laminated films and protective packaging), its revenues last fiscal grew at the slowest pace (6.6%) in seven years. Despite expansion in operating margins by some 120 bps, volumes of its most profitable cross laminated films advanced by just 5.8%. SIL reckons that capacity constraints would plague its protective packaging business for some more time. Build up in material margins of plastic business last fiscal largely explains the large increase (150 bps) in OPMs (including construction business). Ebullience in margins was pervasive too: packaging products reported a stunning 664 bps rise in OPMs last fiscal; consumer products business was not too far at 491 bps. That's not all. OPMs of all but plastic piping system business reached either multi-year or record highs last fiscal. The stock currently trades at 31.8x FY17e EPS of Rs 27.53 and 27x FY18e EPS of Rs 32.37. Uptick in volumes of India’s plastic industry prompts reduction in equity risk premiums. Yet SIL’s projected revenue growth of 15% (average) over the next two years partially reflects the unpredictibility of global crude oil markets. SIL’s high past average earnings and top decile return on capital would preclude sharp decline in earnings. On balance we retain our accumulate rating on the stock with revised target of Rs 971 (previous target: Rs 821 based on 30x FY18e earnings.

Welcome message from author
This document is posted to help you gain knowledge. Please leave a comment to let me know what you think about it! Share it to your friends and learn new things together.
Transcript
CD Equisearch Pvt Ltd June 21, 2016
Equities Derivatives Commodities Distribution of Mutual Funds Distribution of Life Insurance
.
* nine months ended Mar 31, 2016 due to change in accounting year
The Supreme Industries Ltd
No. of shares (m) 127.0
Mkt cap (Rs crs/$m) 11109/1648.0
Current price (Rs/$) 875/13.0
Price target (Rs/$)
971/14.4
52 W H/L (Rs.) 1000/540
Book Value (Rs/$) 103/1.5
Beta 0.5
Daily volume (avg. monthly) 155450
P/BV (FY17e/18e) 7.2/6.1
EV/EBITDA (FY17e/18e) 16.7/14.7
P/E (FY17e/18e) 31.8/27.0
EPS growth (F17e/18e) 16.6/17.6
OPM (FY16/17e/18e) 15.5/14.7/14.9
ROE (FY16/17e/18e) 23.7/24.5/24.5
ROCE(FY16e/17e/18e) 18.2/20.0/21.6
D/E ratio (FY16e/17e/18e) 0.3/0.2/0.1
BSE Code 509930
NSE Code SUPREMEIND
Bloomberg SI IN
Reuters SUPI.BO
Shareholding pattern %
Promoters 49.7
MFs / Banks / FIs 8.3
FIIs 20.6
Govt. Holding 0.0
Public & Others 21.4
Total 100.0
As on Mar 31, 2016
Recommendation
ACCUMULATE
Analyst
KISHAN GUPTA, CFA, FRM
Phone: + 91 (33) 4488 0043
E- mail: [email protected]
(Figures in Rs crs)
FY14
FY15
FY16*
FY17e
FY18e
Income from operations 3962.22 4255.18 2974.85 4672.70 5223.89
Other Income 5.94 4.66 3.64 2.83 2.97
EBITDA (other income included) 594.74 670.89 457.09 689.48 779.66
Profit after EO 281.30 320.75 225.52 349.68 411.15
EPS (Rs) 22.14 25.25 17.75 27.53 32.37
EPS growth (%) -3.1 14.0 -6.5 16.6 17.6
Quarterly Highlights � Trampled by incessant fall in global crude oil prices, polymer manufacturers
faced a nasty shock. Most reported sharp fall in prices of their finished
products, resulting in near brutal moderation in sales. SIL was no exception
for its plastic business sales grew by just 4%. Its plastic piping system picked
up the slack for it reported 13.7% growth in sales (18.6% in volumes) in FY16
(nine months). But its industrial products and packaging products businesses
showed lousy growth in dispatches last fiscal: volumes of the former slid by
7.6% and that of the latter grew by a tiddly 6.6%. Surprisingly, SIL’s consumer
products business proved most resilient for it has now posted double digit
revenue growth for six quarters in a row; volumes too have complied - 19.8%
median growth in last five quarters.
� Strong uptick in demand from agriculture and infrastructure sector - drinking
water pipes; sewage etc explains the buoyancy in plastic piping system
business. Resultantly, its CPVC business outgrew the industry by posting 24%
growth in dispatches last fiscal. But this peppiness in overall demand barely
reflects effects of seasonality. Piping volumes for instance grew by a measly
4.3% in Q2FY16. Third quarter of last fiscal alone contributed 46% to annual
tally. Cumulative sales in two quarters (Q3&Q4) accounted for nearly 62% of
total annual volumes in FY15.
� Notwithstanding growing value addition in packaging products business
(read: cross laminated films and protective packaging), its revenues last fiscal
grew at the slowest pace (6.6%) in seven years. Despite expansion in operating
margins by some 120 bps, volumes of its most profitable cross laminated films
advanced by just 5.8%. SIL reckons that capacity constraints would plague its
protective packaging business for some more time.
� Build up in material margins of plastic business last fiscal largely explains the
large increase (150 bps) in OPMs (including construction business). Ebullience
in margins was pervasive too: packaging products reported a stunning 664
bps rise in OPMs last fiscal; consumer products business was not too far at 491
bps. That's not all. OPMs of all but plastic piping system business reached
either multi-year or record highs last fiscal.
� The stock currently trades at 31.8x FY17e EPS of Rs 27.53 and 27x FY18e EPS
of Rs 32.37. Uptick in volumes of India’s plastic industry prompts reduction in
equity risk premiums. Yet SIL’s projected revenue growth of 15% (average)
over the next two years partially reflects the unpredictibility of global crude
oil markets. SIL’s high past average earnings and top decile return on capital
would preclude sharp decline in earnings. On balance we retain our
accumulate rating on the stock with revised target of Rs 971 (previous target:
Rs 821 based on 30x FY18e earnings.
2
2
CD Equisearch Pvt Ltd
Equities Derivatives Commodities Distribution of Mutual Funds Distribution of Life Insurance
[
Outlook & Recommendation
Indian plastic industry – outlook
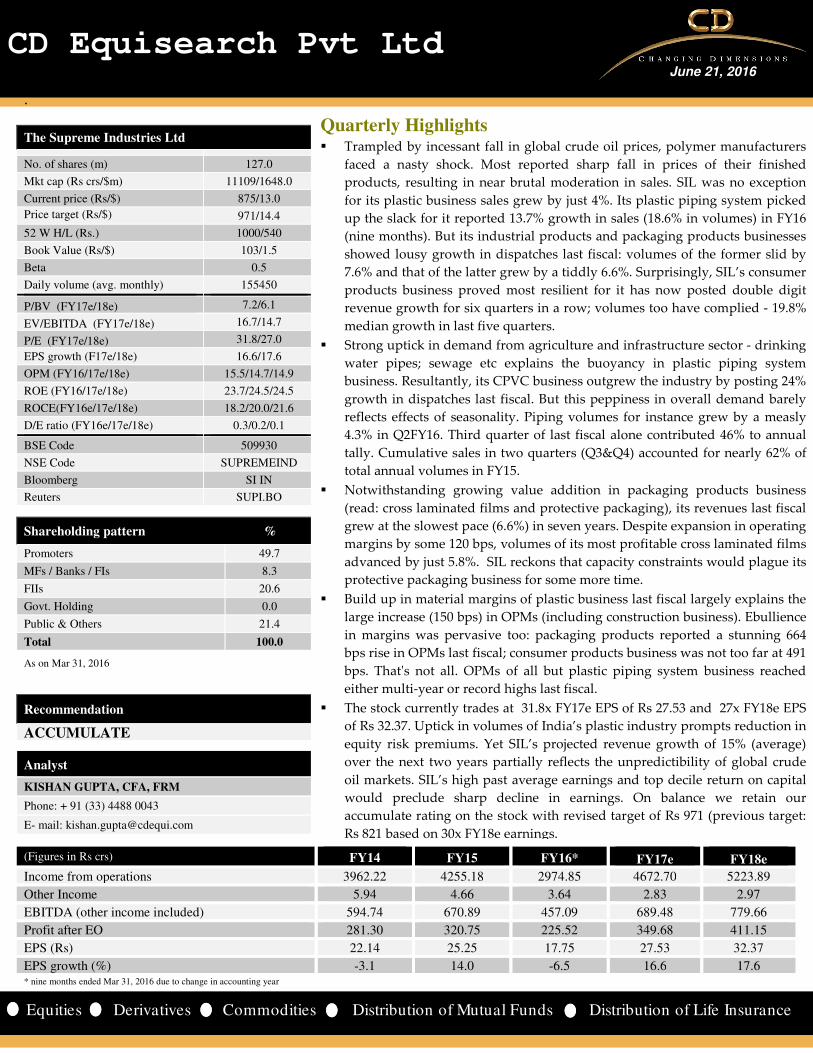
Despite growing consumption of plastics (~10% annually), India still consumes under 5% of total global consumption of some
285m tons. India's per capita polymer consumption at 10.5kg (2014-15 data) trails global counterparts - USA 109kg; China 45kg;
Brazil 32kg, indicating huge growth potential of India's plastic industry. Industry reports suggest that India's per capital plastic
consumption would double in next five years driven by growing consumerism. Plastics are being increasingly used in
automobiles and other consumer products. Capacity building has also kept pace with growing consumption as the country added
capacities at 13% CAGR in last five years.
Dutch Polymer Institute (DPI), a Europe based international platform for industry
driven collaborative research in polymer science and technology, reckons that
plastics market in India would expand not least because of increasing use of plastics
in infrastructure, healthcare and agriculture; needless to mention the consumer
market for automobiles and electronics. It opines that in the past plastics use in
India was limited to consumer durables and packaging which capped growth. It
also posits that India should work towards integrating polymers in various sectors
in a green manner. Innovation remains paramount for India to introduce new or
improved polymer materials and plastic products that meet industry and consumer
needs while at the same time overcome environmental challenges.
Industry reports suggest that India would gain from GOI's 'Make in India' campaign for it ushers tax reforms to boost local
manufacturing of plastics. Attracting foreign investments and levying higher import duties on plastic goods would give much
needed impetus to local manufacturers.
Capex
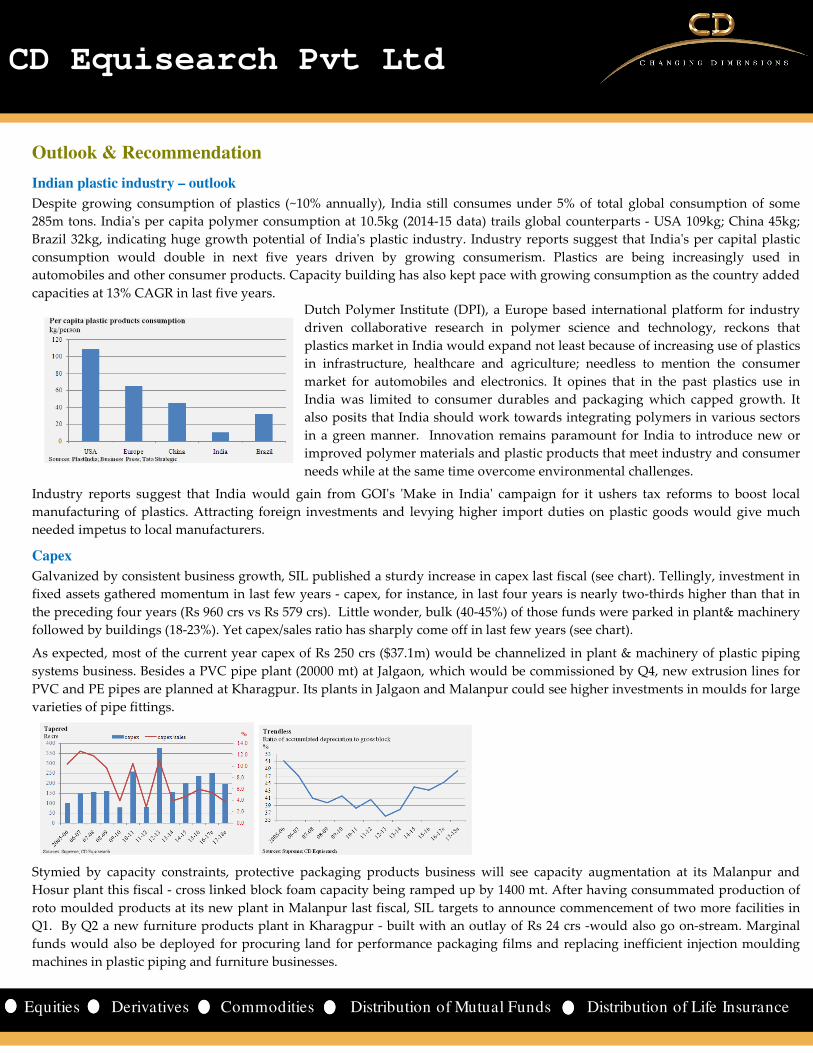
Galvanized by consistent business growth, SIL published a sturdy increase in capex last fiscal (see chart). Tellingly, investment in
fixed assets gathered momentum in last few years - capex, for instance, in last four years is nearly two-thirds higher than that in
the preceding four years (Rs 960 crs vs Rs 579 crs). Little wonder, bulk (40-45%) of those funds were parked in plant& machinery
followed by buildings (18-23%). Yet capex/sales ratio has sharply come off in last few years (see chart).
As expected, most of the current year capex of Rs 250 crs ($37.1m) would be channelized in plant & machinery of plastic piping
systems business. Besides a PVC pipe plant (20000 mt) at Jalgaon, which would be commissioned by Q4, new extrusion lines for
PVC and PE pipes are planned at Kharagpur. Its plants in Jalgaon and Malanpur could see higher investments in moulds for large
varieties of pipe fittings.
Stymied by capacity constraints, protective packaging products business will see capacity augmentation at its Malanpur and
Hosur plant this fiscal - cross linked block foam capacity being ramped up by 1400 mt. After having consummated production of
roto moulded products at its new plant in Malanpur last fiscal, SIL targets to announce commencement of two more facilities in
Q1. By Q2 a new furniture products plant in Kharagpur - built with an outlay of Rs 24 crs -would also go on-stream. Marginal
funds would also be deployed for procuring land for performance packaging films and replacing inefficient injection moulding
machines in plastic piping and furniture businesses.
3
3
CD Equisearch Pvt Ltd
Equities Derivatives Commodities Distribution of Mutual Funds Distribution of Life Insurance
Financials & Valuation
Thanks to ceaseless fall in crude oil prices, India's polymer consumption got a boost last year for its volumes grew by an
appealing 14% during Apr-Dec 15 periods. Supreme too manifested record dispatches: growth in volumes touched a five
year high at 13.2%. Growing use of plastics in consumer goods and automobiles would doubtless boost domestic demand,
propelling India's per capita consumption. India's export potential cannot be gainsaid either. It shipped $4.5bn worth of
plastics in 2015, a puny fraction of China's $104bn.
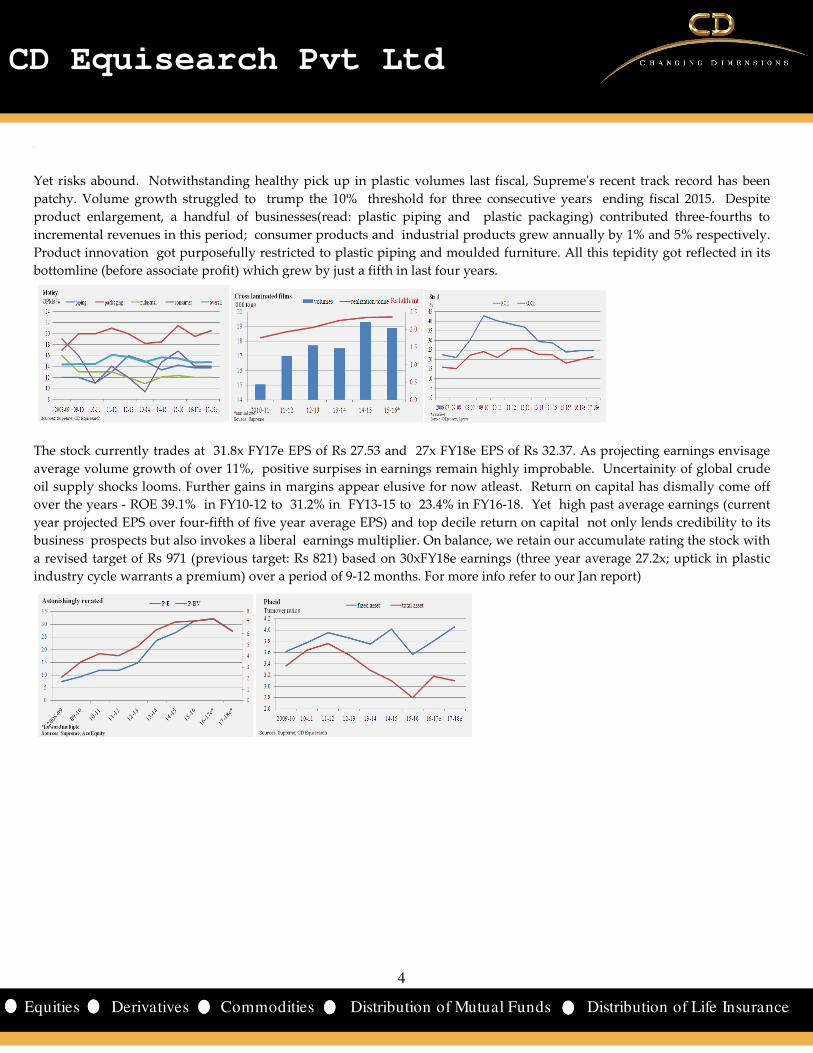
With favourable industry dynamics, SIL would process over 1.1m tons of plastics in three years ending fiscal 2018
compared to 0.87m tons in preceding three years (see exhibit on page 10). Helped by its proclivity to increase share of
value added products, OPMs have stabilized over 15% in last few years (FY10-12: 15.1%; FY13-FY15: 15.4%). Its flagship
plastic piping systems business has seen the most dramatic shift in its revenue mix over the years - share of value added
products climbed to 33.4% last fiscal from 12.8% in 2008-09. Yet value addition has awfully lagged in protective packaging
and cross laminated films. Specialty business (read: value added) turnover of these businesses has grown to 1.3x in last
four years compared to 1.45x for moulded furniture and 2x for plastic piping systems.
With stabilizing crude oil prices and sturdy plastic volumes, revenue growth would leapfrog to nearly 18% this year. Not
surprisingly, plastic piping systems and consumer products would stand out not least for their gut-wrenching volume
growth - 13% and 15% respectively. Without doubt launch of new plastic piping products - cPVC fire sprinker system.,
underground sewer & drainage systems, septic tanks et al. - and peddling of consumer products online would vitalize
offtake. Other growth propelling initiatives include launch of SIL's cross laminated films in US and leg up to industrial
products business from GOI's Swatch Bharat Abhiyan.
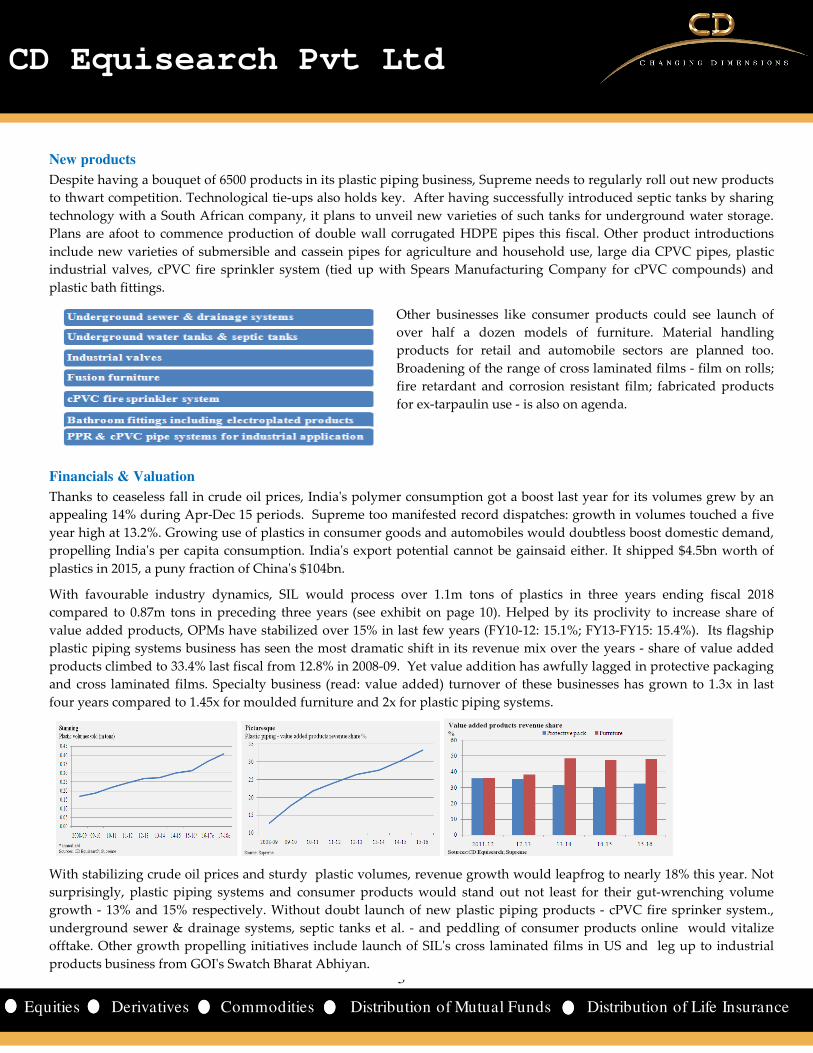
New products
Despite having a bouquet of 6500 products in its plastic piping business, Supreme needs to regularly roll out new products
to thwart competition. Technological tie-ups also holds key. After having successfully introduced septic tanks by sharing
technology with a South African company, it plans to unveil new varieties of such tanks for underground water storage.
Plans are afoot to commence production of double wall corrugated HDPE pipes this fiscal. Other product introductions
include new varieties of submersible and cassein pipes for agriculture and household use, large dia CPVC pipes, plastic
industrial valves, cPVC fire sprinkler system (tied up with Spears Manufacturing Company for cPVC compounds) and
plastic bath fittings.
Other businesses like consumer products could see launch of
over half a dozen models of furniture. Material handling
products for retail and automobile sectors are planned too.
Broadening of the range of cross laminated films - film on rolls;
fire retardant and corrosion resistant film; fabricated products
for ex-tarpaulin use - is also on agenda.
4
4
CD Equisearch Pvt Ltd
Equities Derivatives Commodities Distribution of Mutual Funds Distribution of Life Insurance
[
Yet risks abound. Notwithstanding healthy pick up in plastic volumes last fiscal, Supreme's recent track record has been
patchy. Volume growth struggled to trump the 10% threshold for three consecutive years ending fiscal 2015. Despite
product enlargement, a handful of businesses(read: plastic piping and plastic packaging) contributed three-fourths to
incremental revenues in this period; consumer products and industrial products grew annually by 1% and 5% respectively.
Product innovation got purposefully restricted to plastic piping and moulded furniture. All this tepidity got reflected in its
bottomline (before associate profit) which grew by just a fifth in last four years.
The stock currently trades at 31.8x FY17e EPS of Rs 27.53 and 27x FY18e EPS of Rs 32.37. As projecting earnings envisage
average volume growth of over 11%, positive surpises in earnings remain highly improbable. Uncertainity of global crude
oil supply shocks looms. Further gains in margins appear elusive for now atleast. Return on capital has dismally come off
over the years - ROE 39.1% in FY10-12 to 31.2% in FY13-15 to 23.4% in FY16-18. Yet high past average earnings (current
year projected EPS over four-fifth of five year average EPS) and top decile return on capital not only lends credibility to its
business prospects but also invokes a liberal earnings multiplier. On balance, we retain our accumulate rating the stock with
a revised target of Rs 971 (previous target: Rs 821) based on 30xFY18e earnings (three year average 27.2x; uptick in plastic
industry cycle warrants a premium) over a period of 9-12 months. For more info refer to our Jan report)
5
5
CD Equisearch Pvt Ltd
Equities Derivatives Commodities Distribution of Mutual Funds Distribution of Life Insurance
[
Risks and Concerns
Raw material costs
Though Supreme has diversified its revenue over the years, its business is still highly prone to variations in crude oil prices.
Tellingly, its revenues flatlined last fiscal not least due to sharp fluctuations in prices of its key raw materials - PVC resins,
polypropylene and polyethylene.
Competition
Supreme faces unhealthy competition in its plastics business - particularly in furniture - from the unorganized sector. Its
material handling products - aimed at the dairy industry - is witnessing cut throat competition from the regional and small
players. Emerging threat of counterfeit products especially in pipe system and XF products could undermine product
innovation.
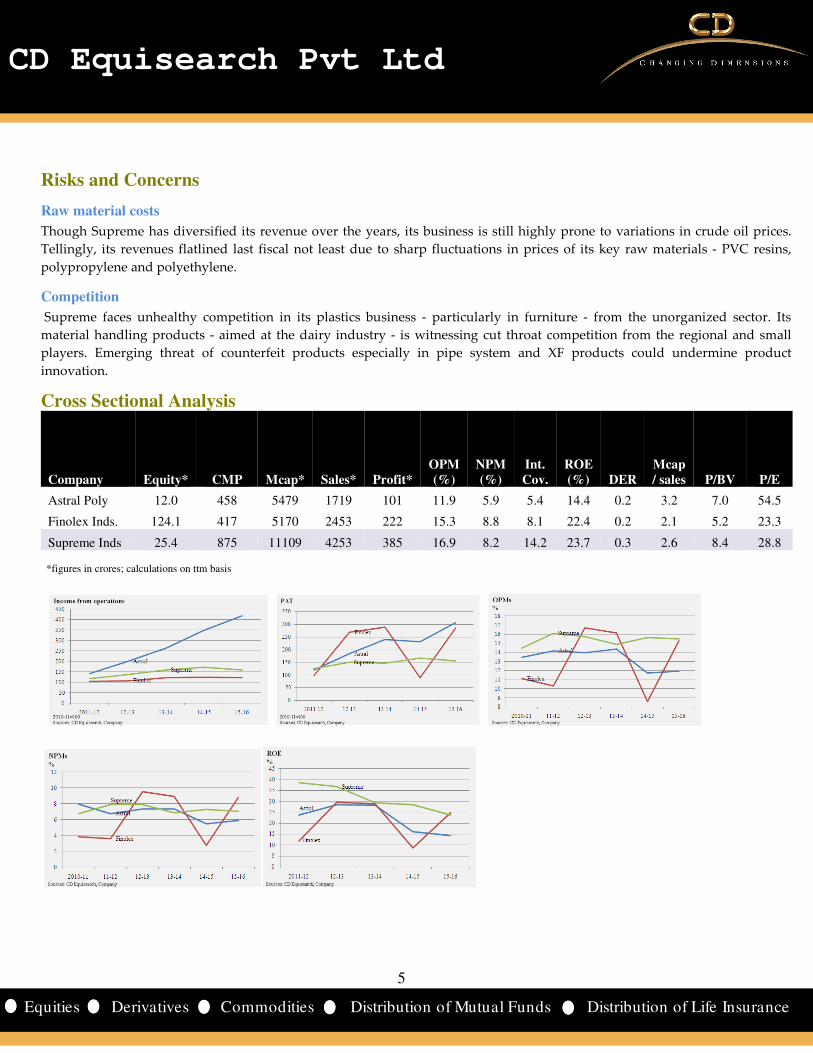
Cross Sectional Analysis
Company Equity* CMP Mcap* Sales* Profit*
OPM
(%)
NPM
(%)
Int.
Cov.
ROE
(%) DER
Mcap
/ sales P/BV P/E
Astral Poly 12.0 458 5479 1719 101 11.9 5.9 5.4 14.4 0.2 3.2 7.0 54.5
Finolex Inds. 124.1 417 5170 2453 222 15.3 8.8 8.1 22.4 0.2 2.1 5.2 23.3
Supreme Inds 25.4 875 11109 4253 385 16.9 8.2 14.2 23.7 0.3 2.6 8.4 28.8
*figures in crores; calculations on ttm basis
6
6
CD Equisearch Pvt Ltd
Equities Derivatives Commodities Distribution of Mutual Funds Distribution of Life Insurance
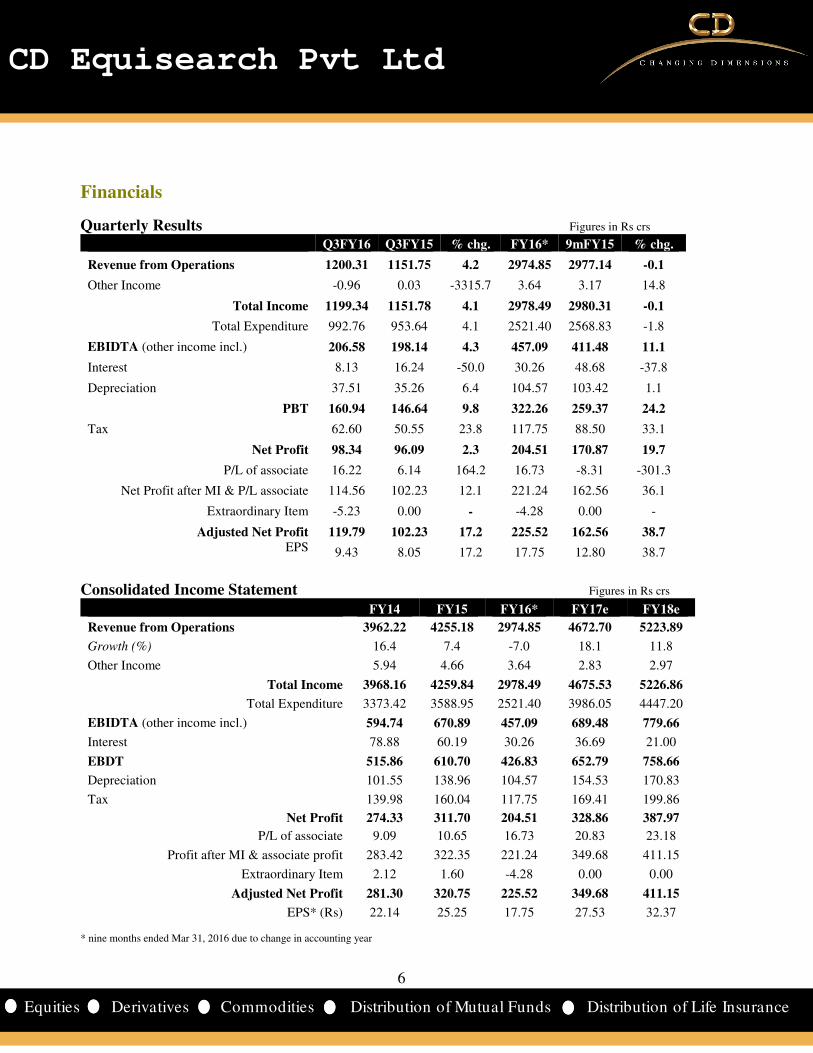
Financials
Quarterly Results Figures in Rs crs
Q3FY16 Q3FY15 % chg. FY16* 9mFY15 % chg.
Revenue from Operations 1200.31 1151.75 4.2 2974.85 2977.14 -0.1
Other Income -0.96 0.03 -3315.7 3.64 3.17 14.8
Total Income 1199.34 1151.78 4.1 2978.49 2980.31 -0.1
Total Expenditure 992.76 953.64 4.1 2521.40 2568.83 -1.8
EBIDTA (other income incl.) 206.58 198.14 4.3 457.09 411.48 11.1
Interest 8.13 16.24 -50.0 30.26 48.68 -37.8
Depreciation 37.51 35.26 6.4 104.57 103.42 1.1
PBT 160.94 146.64 9.8 322.26 259.37 24.2
Tax 62.60 50.55 23.8 117.75 88.50 33.1
Net Profit 98.34 96.09 2.3 204.51 170.87 19.7
P/L of associate 16.22 6.14 164.2 16.73 -8.31 -301.3
Net Profit after MI & P/L associate 114.56 102.23 12.1 221.24 162.56 36.1
Extraordinary Item -5.23 0.00 - -4.28 0.00 -
Adjusted Net Profit 119.79 102.23 17.2 225.52 162.56 38.7
EPS 9.43 8.05 17.2 17.75 12.80 38.7
Consolidated Income Statement Figures in Rs crs
FY14 FY15 FY16* FY17e FY18e
Revenue from Operations 3962.22 4255.18 2974.85 4672.70 5223.89
Growth (%) 16.4 7.4 -7.0 18.1 11.8
Other Income 5.94 4.66 3.64 2.83 2.97
Total Income 3968.16 4259.84 2978.49 4675.53 5226.86
Total Expenditure 3373.42 3588.95 2521.40 3986.05 4447.20
EBIDTA (other income incl.) 594.74 670.89 457.09 689.48 779.66
Interest 78.88 60.19 30.26 36.69 21.00
EBDT 515.86 610.70 426.83 652.79 758.66
Depreciation 101.55 138.96 104.57 154.53 170.83
Tax 139.98 160.04 117.75 169.41 199.86
Net Profit 274.33 311.70 204.51 328.86 387.97
P/L of associate 9.09 10.65 16.73 20.83 23.18
Profit after MI & associate profit 283.42 322.35 221.24 349.68 411.15
Extraordinary Item 2.12 1.60 -4.28 0.00 0.00
Adjusted Net Profit 281.30 320.75 225.52 349.68 411.15
EPS* (Rs) 22.14 25.25 17.75 27.53 32.37 * nine months ended Mar 31, 2016 due to change in accounting year
7
7
CD Equisearch Pvt Ltd
Equities Derivatives Commodities Distribution of Mutual Funds Distribution of Life Insurance
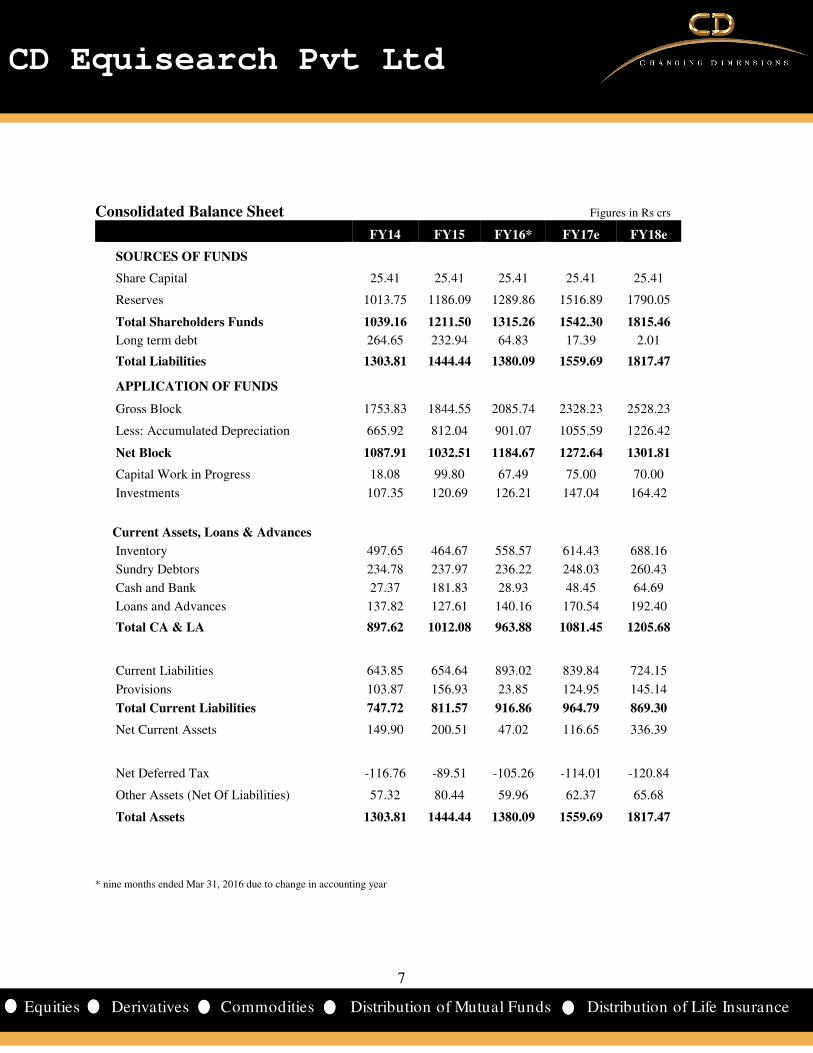
Consolidated Balance Sheet Figures in Rs crs
FY14 FY15 FY16* FY17e FY18e
SOURCES OF FUNDS
Share Capital 25.41 25.41 25.41 25.41 25.41
Reserves 1013.75 1186.09 1289.86 1516.89 1790.05
Total Shareholders Funds 1039.16 1211.50 1315.26 1542.30 1815.46
Long term debt 264.65 232.94 64.83 17.39 2.01
Total Liabilities 1303.81 1444.44 1380.09 1559.69 1817.47
APPLICATION OF FUNDS
Gross Block 1753.83 1844.55 2085.74 2328.23 2528.23
Less: Accumulated Depreciation 665.92 812.04 901.07 1055.59 1226.42
Net Block 1087.91 1032.51 1184.67 1272.64 1301.81
Capital Work in Progress 18.08 99.80 67.49 75.00 70.00
Investments 107.35 120.69 126.21 147.04 164.42
Current Assets, Loans & Advances
Inventory 497.65 464.67 558.57 614.43 688.16
Sundry Debtors 234.78 237.97 236.22 248.03 260.43
Cash and Bank 27.37 181.83 28.93 48.45 64.69
Loans and Advances 137.82 127.61 140.16 170.54 192.40
Total CA & LA 897.62 1012.08 963.88 1081.45 1205.68
Current Liabilities 643.85 654.64 893.02 839.84 724.15
Provisions 103.87 156.93 23.85 124.95 145.14
Total Current Liabilities 747.72 811.57 916.86 964.79 869.30
Net Current Assets 149.90 200.51 47.02 116.65 336.39
Net Deferred Tax -116.76 -89.51 -105.26 -114.01 -120.84
Other Assets (Net Of Liabilities) 57.32 80.44 59.96 62.37 65.68
Total Assets 1303.81 1444.44 1380.09 1559.69 1817.47
* nine months ended Mar 31, 2016 due to change in accounting year
8
8
CD Equisearch Pvt Ltd
Equities Derivatives Commodities Distribution of Mutual Funds Distribution of Life Insurance
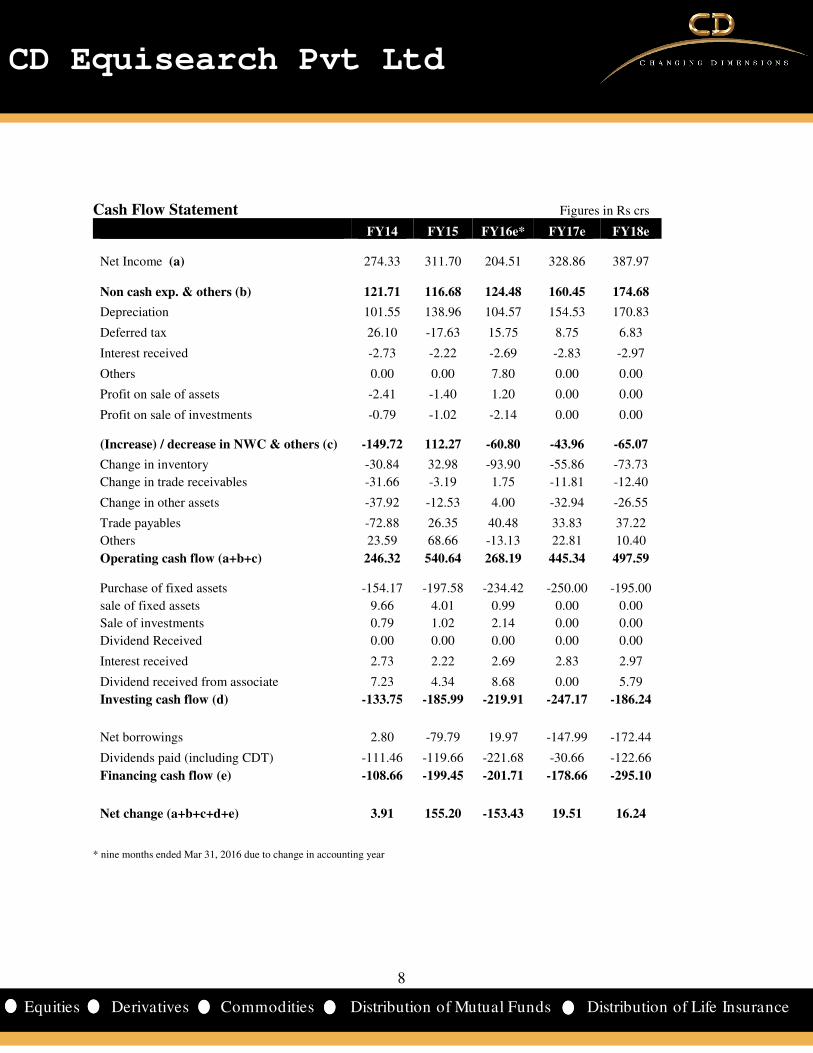
Cash Flow Statement Figures in Rs crs
FY14 FY15 FY16e* FY17e FY18e
Net Income (a) 274.33 311.70 204.51 328.86 387.97
Non cash exp. & others (b) 121.71 116.68 124.48 160.45 174.68
Depreciation 101.55 138.96 104.57 154.53 170.83
Deferred tax 26.10 -17.63 15.75 8.75 6.83
Interest received -2.73 -2.22 -2.69 -2.83 -2.97
Others 0.00 0.00 7.80 0.00 0.00
Profit on sale of assets -2.41 -1.40 1.20 0.00 0.00
Profit on sale of investments -0.79 -1.02 -2.14 0.00 0.00
(Increase) / decrease in NWC & others (c) -149.72 112.27 -60.80 -43.96 -65.07
Change in inventory -30.84 32.98 -93.90 -55.86 -73.73
Change in trade receivables -31.66 -3.19 1.75 -11.81 -12.40
Change in other assets -37.92 -12.53 4.00 -32.94 -26.55
Trade payables -72.88 26.35 40.48 33.83 37.22
Others 23.59 68.66 -13.13 22.81 10.40
Operating cash flow (a+b+c) 246.32 540.64 268.19 445.34 497.59
Purchase of fixed assets -154.17 -197.58 -234.42 -250.00 -195.00
sale of fixed assets 9.66 4.01 0.99 0.00 0.00
Sale of investments 0.79 1.02 2.14 0.00 0.00
Dividend Received 0.00 0.00 0.00 0.00 0.00
Interest received 2.73 2.22 2.69 2.83 2.97
Dividend received from associate 7.23 4.34 8.68 0.00 5.79
Investing cash flow (d) -133.75 -185.99 -219.91 -247.17 -186.24
Net borrowings 2.80 -79.79 19.97 -147.99 -172.44
Dividends paid (including CDT) -111.46 -119.66 -221.68 -30.66 -122.66
Financing cash flow (e) -108.66 -199.45 -201.71 -178.66 -295.10
Net change (a+b+c+d+e) 3.91 155.20 -153.43 19.51 16.24
* nine months ended Mar 31, 2016 due to change in accounting year
9
9
CD Equisearch Pvt Ltd
Equities Derivatives Commodities Distribution of Mutual Funds Distribution of Life Insurance
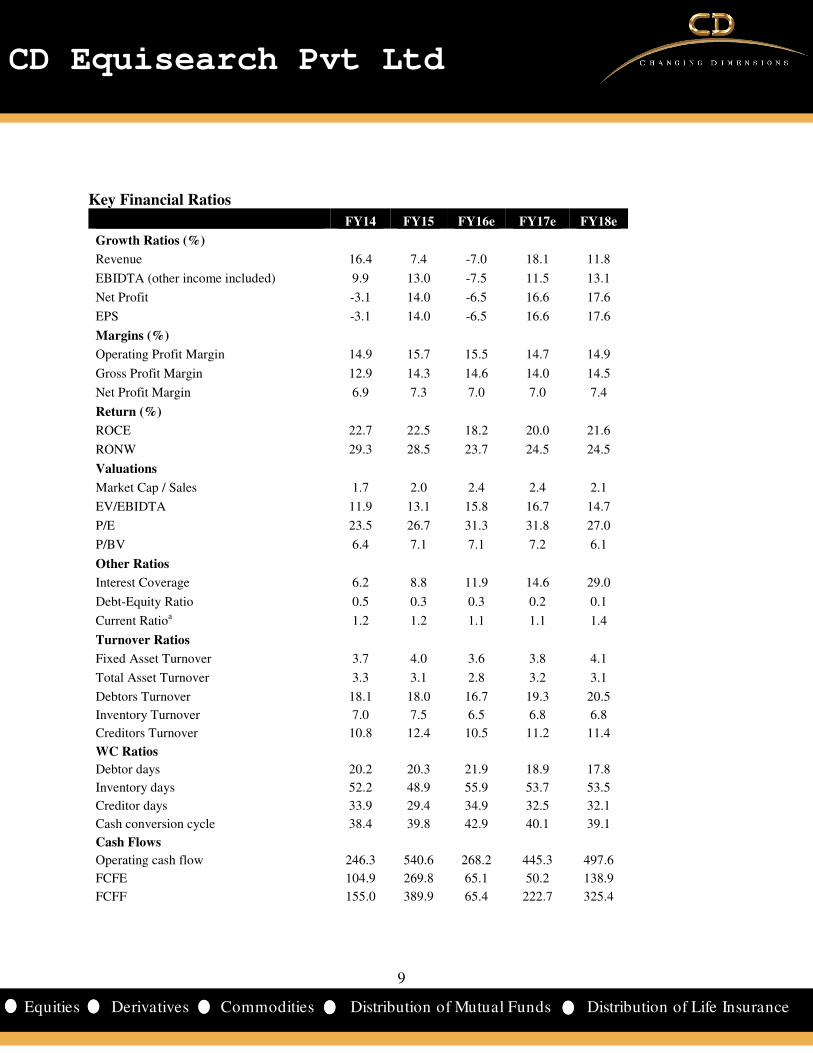
Key Financial Ratios
FY14 FY15 FY16e FY17e FY18e
Growth Ratios (%)
Revenue 16.4 7.4 -7.0 18.1 11.8
EBIDTA (other income included) 9.9 13.0 -7.5 11.5 13.1
Net Profit -3.1 14.0 -6.5 16.6 17.6
EPS -3.1 14.0 -6.5 16.6 17.6
Margins (%)
Operating Profit Margin 14.9 15.7 15.5 14.7 14.9
Gross Profit Margin 12.9 14.3 14.6 14.0 14.5
Net Profit Margin 6.9 7.3 7.0 7.0 7.4
Return (%)
ROCE 22.7 22.5 18.2 20.0 21.6
RONW 29.3 28.5 23.7 24.5 24.5
Valuations
Market Cap / Sales 1.7 2.0 2.4 2.4 2.1
EV/EBIDTA 11.9 13.1 15.8 16.7 14.7
P/E 23.5 26.7 31.3 31.8 27.0
P/BV 6.4 7.1 7.1 7.2 6.1
Other Ratios
Interest Coverage 6.2 8.8 11.9 14.6 29.0
Debt-Equity Ratio 0.5 0.3 0.3 0.2 0.1
Current Ratioa 1.2 1.2 1.1 1.1 1.4
Turnover Ratios
Fixed Asset Turnover 3.7 4.0 3.6 3.8 4.1
Total Asset Turnover 3.3 3.1 2.8 3.2 3.1
Debtors Turnover 18.1 18.0 16.7 19.3 20.5
Inventory Turnover 7.0 7.5 6.5 6.8 6.8
Creditors Turnover 10.8 12.4 10.5 11.2 11.4
WC Ratios
Debtor days 20.2 20.3 21.9 18.9 17.8
Inventory days 52.2 48.9 55.9 53.7 53.5
Creditor days 33.9 29.4 34.9 32.5 32.1
Cash conversion cycle 38.4 39.8 42.9 40.1 39.1
Cash Flows
Operating cash flow 246.3 540.6 268.2 445.3 497.6
FCFE 104.9 269.8 65.1 50.2 138.9
FCFF 155.0 389.9 65.4 222.7 325.4
10
10
CD Equisearch Pvt Ltd
Equities Derivatives Commodities Distribution of Mutual Funds Distribution of Life Insurance
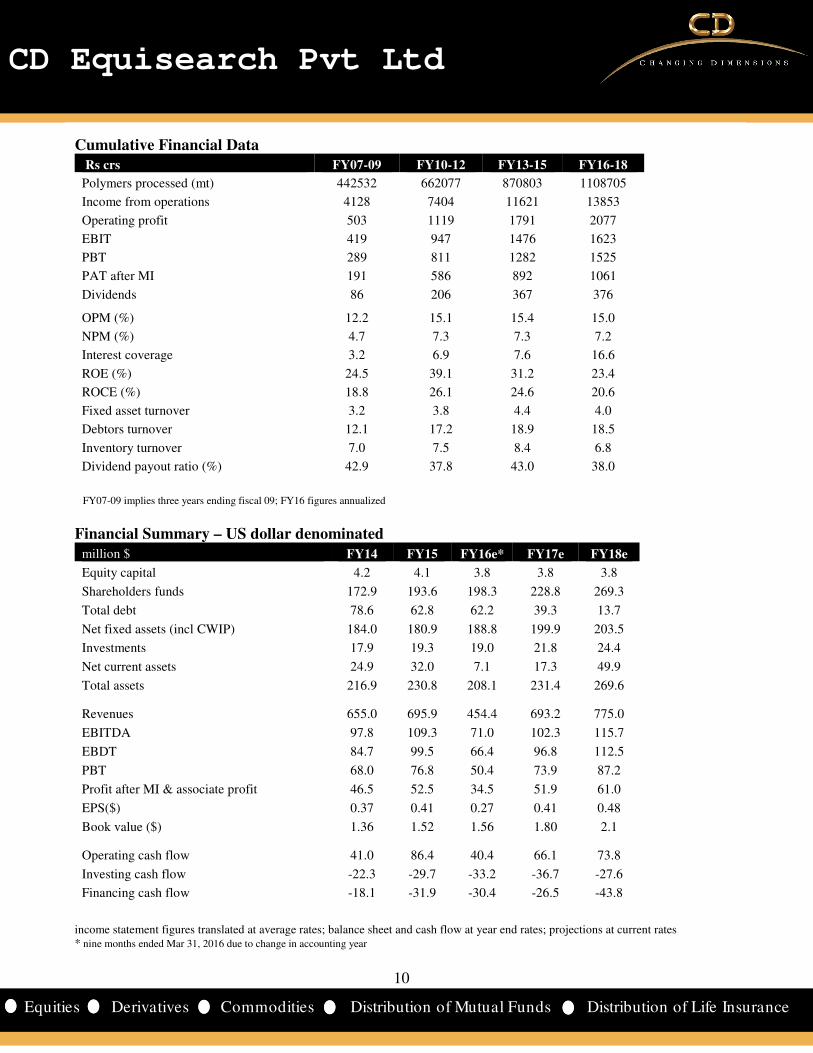
Cumulative Financial Data
Rs crs FY07-09 FY10-12 FY13-15 FY16-18
Polymers processed (mt) 442532 662077 870803 1108705
Income from operations 4128 7404 11621 13853
Operating profit 503 1119 1791 2077
EBIT 419 947 1476 1623
PBT 289 811 1282 1525
PAT after MI 191 586 892 1061
Dividends 86 206 367 376
OPM (%) 12.2 15.1 15.4 15.0
NPM (%) 4.7 7.3 7.3 7.2
Interest coverage 3.2 6.9 7.6 16.6
ROE (%) 24.5 39.1 31.2 23.4
ROCE (%) 18.8 26.1 24.6 20.6
Fixed asset turnover 3.2 3.8 4.4 4.0
Debtors turnover 12.1 17.2 18.9 18.5
Inventory turnover 7.0 7.5 8.4 6.8
Dividend payout ratio (%) 42.9 37.8 43.0 38.0
FY07-09 implies three years ending fiscal 09; FY16 figures annualized
Financial Summary – US dollar denominated
million $ FY14 FY15 FY16e* FY17e FY18e
Equity capital 4.2 4.1 3.8 3.8 3.8
Shareholders funds 172.9 193.6 198.3 228.8 269.3
Total debt 78.6 62.8 62.2 39.3 13.7
Net fixed assets (incl CWIP) 184.0 180.9 188.8 199.9 203.5
Investments 17.9 19.3 19.0 21.8 24.4
Net current assets 24.9 32.0 7.1 17.3 49.9
Total assets 216.9 230.8 208.1 231.4 269.6
Revenues 655.0 695.9 454.4 693.2 775.0
EBITDA 97.8 109.3 71.0 102.3 115.7
EBDT 84.7 99.5 66.4 96.8 112.5
PBT 68.0 76.8 50.4 73.9 87.2
Profit after MI & associate profit 46.5 52.5 34.5 51.9 61.0
EPS($) 0.37 0.41 0.27 0.41 0.48
Book value ($) 1.36 1.52 1.56 1.80 2.1
Operating cash flow 41.0 86.4 40.4 66.1 73.8
Investing cash flow -22.3 -29.7 -33.2 -36.7 -27.6
Financing cash flow -18.1 -31.9 -30.4 -26.5 -43.8
income statement figures translated at average rates; balance sheet and cash flow at year end rates; projections at current rates * nine months ended Mar 31, 2016 due to change in accounting year
11
11
CD Equisearch Pvt Ltd
Equities Derivatives Commodities Distribution of Mutual Funds Distribution of Life Insurance
Disclosure& Disclaimer CD Equisearch Private Limited (hereinafter referred to as ‘CD Equi’) is a Member registered with National Stock Exchange of India Limited,
Bombay Stock Exchange Limited and Metropolitan Stock Exchange of India Limited (Formerly known as MCX Stock Exchange Limited). CD
Equi is also registered as Depository Participant with CDSL and AMFI registered Mutual Fund Advisor. The associates of CD Equi are
engaged in activities relating to NBFC-ND - Financing and Investment, Commodity Broking, Real Estate, etc.
CD Equi is registered under SEBI (Research Analysts) Regulations, 2014 with SEBI Registration no INH300002274. Further, CD Equi hereby
declares that –
• No disciplinary action has been taken against CD Equi by any of the regulatory authorities.
• CD Equi/its associates/research analysts do not have any financial interest/beneficial interest of more than one percent/material
conflict of interest in the subject company(s) (kindly disclose if otherwise).
• CD Equi/its associates/research analysts have not received any compensation from the subject company(s) during the past twelve
months.
• CD Equi/its research analysts has not served as an officer, director or employee of company covered by analysts and has not been
engaged in market making activity of the company covered by analysts.
This document is solely for the personal information of the recipient and must not be singularly used as the basis of any investment decision.
Nothing in this document should be construed as investment or financial advice. Each recipient of this document should make such
investigations as they deem necessary to arrive at an independent evaluation of an investment in the securities of the companies referred to in
this document (including the merits and risks involved) and should consult their own advisors to determine the merits and risks of such an
investment.
Reports based on technical and derivative analysis center on studying charts of a stock's price movement, outstanding positions and trading
volume, as opposed to focusing on a company's fundamentals and as such, may not match with a report on a company's fundamentals.
The information in this document has been printed on the basis of publicly available information, internal data and other reliable sources
believed to be true but we do not represent that it is accurate or complete and it should not be relied on as such, as this document is for general
guidance only. CD Equi or any of its affiliates/group companies shall not be in any way responsible for any loss or damage that may arise to
any person from any inadvertent error in the information contained in this report. CD Equi has not independently verified all the information
contained within this document. Accordingly, we cannot testify nor make any representation or warranty, express or implied, to the accuracy,
contents or data contained within this document.
While, CD Equi endeavors to update on a reasonable basis the information discussed in this material, there may be regulatory compliance or
other reasons that prevent us from doing so.
This document is being supplied to you solely for your information and its contents, information or data may not be reproduced, redistributed
or passed on, directly or indirectly. Neither, CD Equi nor its directors, employees or affiliates shall be liable for any loss or damage that may
arise from or in connection with the use of this information.
CD Equisearch Private Limited (CIN: U67120WB1995PTC071521)
Registered Office: 37, Shakespeare Sarani, 1st Floor, Kolkata – 700 017; Phone: +91(33) 4488 0000; Fax: +91(33) 2289 2557 Corporate Office: 10,
Vasawani Mansion, 2nd Floor, Dinshaw Wachha Road, Churchgate, Mumbai – 400 020. Phone: +91(22) 2283 0652/0653; Fax: +91(22) 2283, 2276
Website: www.cdequi.com; Email: [email protected]
buy: >20% accumulate: >10% to ≤20% hold: ≥-10% to ≤10% reduce: ≥-20% to <-10% sell: <-20%
Related Documents