CCSD Discipline Analysis 2010-2011 Daniel Reschly ( [email protected] ) Disciplinary Infractions 58 categories used in CCSD Broad range of severity Analysis by gender and race/ethnicity Middle and High Schools included Limitations in data acknowledged throughout Reschly 1

CCSD Discipline Analysis 2010-2011
Dec 31, 2015
CCSD Discipline Analysis 2010-2011. Daniel Reschly ( [email protected] ) Disciplinary Infractions 58 categories used in CCSD Broad range of severity Analysis by gender and race/ethnicity Middle and High Schools included Limitations in data acknowledged throughout. Analyses. - PowerPoint PPT Presentation
Welcome message from author
This document is posted to help you gain knowledge. Please leave a comment to let me know what you think about it! Share it to your friends and learn new things together.
Transcript

CCSD Discipline Analysis 2010-2011
Daniel Reschly ([email protected])
Disciplinary Infractions 58 categories used in CCSD Broad range of severity
Analysis by gender and race/ethnicityMiddle and High Schools includedLimitations in data acknowledged throughout
Reschly 1
Analyses
Statistics used N=Number Risk=Percent of population Relative Risk=Risk of one group compared
to the combined risk for other groups Composition
Reschly 2

Problems with Interpretation of Composition
Hispanic students are 15% of the district enrollment, but 30 percent of the discipline infractions. What percent of Hispanics are charged with disciplinary infractions
1% 5% 10% 15% 30% 45%
Reschly 3

Reschly 4
173 ÷ 20744 (5+15+180+8+30+186)÷(1367+12290+63125+2051+7007
+52972)
Black AggressiveBehavior
Black Population
Combined Population for 6 groups=138,812
Combined aggressive Behaviors for 6 groups=424
Relative Risk Determination: Comparing the risk for one group to the combined risk for all other groups (See p. 8-9)
173 ÷ 20744 424 ÷ 138812 = 2.7
Relative Risk=2.7

Reschly 5
Group Pop N
Pop Composition %
AggressiveBeh. N
Risk RelativeRisk
CompositionAggressiveBeh.
AI/AK 1,367 1% 5 NA NA 0.8%
Asian 12,290 8% 15 0.1% 0.3 2.5%
Black 20,744 13% 173 0.8% 2.7 29.0%
Hispanic 63,125 40% 180 0.3% 0.7 30.2%
Haw/PI 2,051 1% 8 NA NA 1.3%
Two or More
7,007 4% 30 0.4% 1.2 5.0%
White 52,972 33% 186 0.4% 0.9 31.2%
Total 159,556 100% 597 0.4% 100%

Infractions Leading to Suspension (note limitation)
Male students overrepresented at >2 in 33 of 58 disciplinary infractions
Females in one (cyber bullying) Black students in 22 of 58 Hispanic in 2 Other groups not overrepresented
Reschly 6
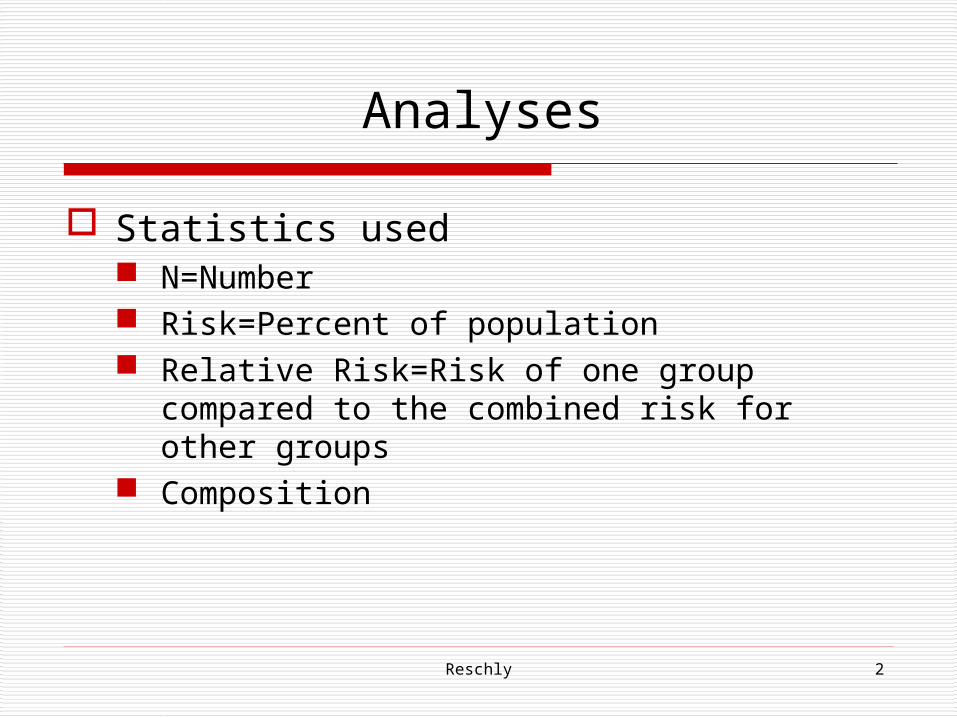
Infractions Leading to Suspension (note limitation, See Table 4 and p. 19)
Likelihood of Suspension by Group (Table 4 with summary on p. 19) Hispanic more likely in 6 infractions White students in 5 infractions American Indian/AK Native in 2 infractions Black in 2 infractions ≥2 Groups in 2 infractions Hawaiian/PI in 1 infraction
Summary: Black students have higher rates of infractions, but are not more likely to be suspended than other groups
Reschly 7

Reschly 8
Race/Ethnicity AnalysesSevereDisciplinary Infractions
2009-10Race/Eth Disprop
09-10RR
2010-11Race/EthDisprop
10-11RR
Violence to School Staff
Black 4.2 Black 3.0
Violence to Student
Black 3.2 Black 4.2
Extortion Black 6.2 None NAArson None NA Black 3.5Possession of Weapon
None NA None NA
Removal Weapon/ Drug
None NA None NA
Theft Black 2.7 Black 2.6Battery Black 3.0 Black 4.1Bullying Black 2.1 None NAVandalism None NA None NAImmoral Conduct
Black 2.5 None NA

School Withdrawal Outcomes
Most serious-involve change of school location and interruption of instruction Mandatory Behavior Program: Moved to alternative
education program for 4-9 weeks, can return to original school
Expulsion Modified to Conditional Enrollment: Expulsion referral modified to placement in a mandatory behavior program-return to comprehensive campus
Expulsion Board Action: Expelled for minimum of 18 weeks, placement in the continuation school, followed by trial enrollment in a comprehensive campus
Reschly 9

Reschly 10
Discipline Outcome
10-11Race/EthDisprop
10-11RR
10-11Gender
10-11RR
Suspension Black 2.2 None NARequired Parental Conference
Black 2.1 None NA
Mandatory Behavior Program
Black 2.3 Male 2.3
Expulsion to Conditional Enrollment
Black 2.2 Male 2.6
Expulsion by Board Action
Black 2.7 Male 3.6
SWD-Required Behavior Program
Black 2.3 Male 4.4
SWD-Expulsion to Conditional Enrollment
Black 4.1 Male 5.3
SWD-Expulsion Board Action
Black 5.8 Male 6.2
Summary Disciplinary Outcomes Middle and High Schools 2010-2011

Analyses by Disciplinary Outcomes by School Level and CCSD Area
School Level: Generally, disproportionate at both levels by gender and race/ethnicity
CCSD Areas levels of disproportionality were generally consistent, disproportionality by gender and race/ethnicity found consistently in Areas 1, 2, and 3
Substantial overrepresentation of students with disabilities by gender and race/ethnicity
Reschly 11

Interpretation of Results
Significant Issue Needing Attention!! Analyze carefully potential explanations Avoid extreme conclusions and simple
explanations
Avoid Extremes
Reschly 12
Blame Kids andCommunity
Blame Schools andEducators

Identify Additional Information and Explore Interventions Needed
Change culture and expectations for both schools/educators and parents/students/community
Prevention and Early Intervention Reading Mathematics Behavior
Explore programs like Positive Behavior Supports and Safe and Civil Schools
Reschly 13
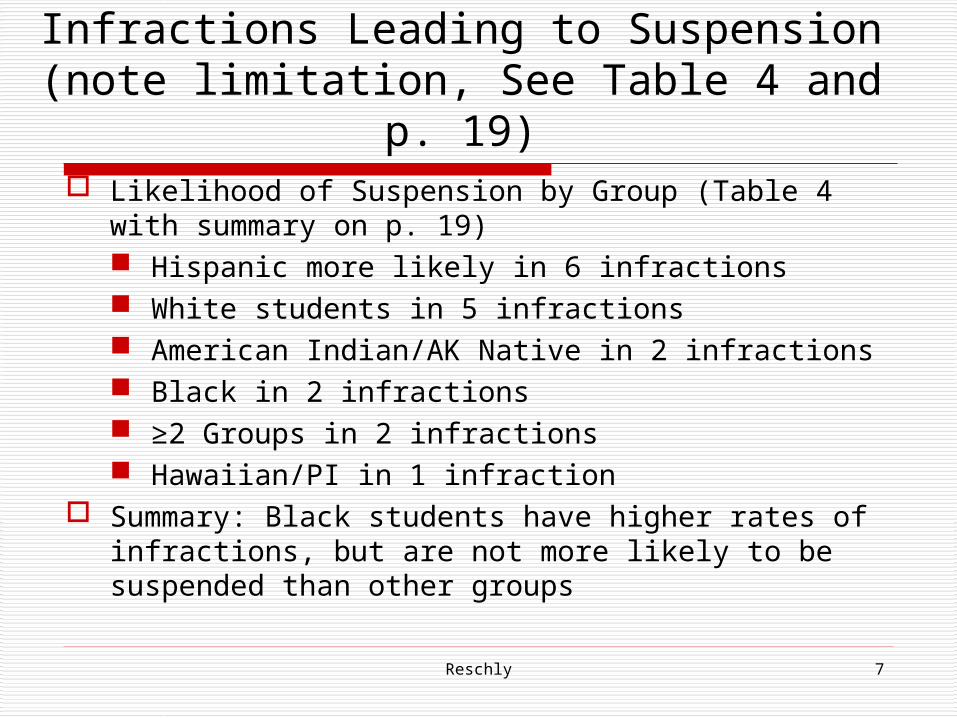
Limitations of Discipline Outcome Results
Limited to middle and high schools Do not have reasons for school withdrawal
disciplinary outcomes Desirable to have data by both gender and
race/ethnicity for more precise analysis Summarized only 1 school withdrawal per
student, e. g., in mandatory behavior and expulsion-conditional enrollment counted as 1 case
No equal treatment comparison data Subject to different interpretations
Reschly 14

Systematic Process of Change
Good baseline data Goals, systematic improvement over
time Challenging, realistic, achievable Public reporting by CCSD units
Alliance of community, students, schools, and teachers required
Reschly 15
Reschly 16
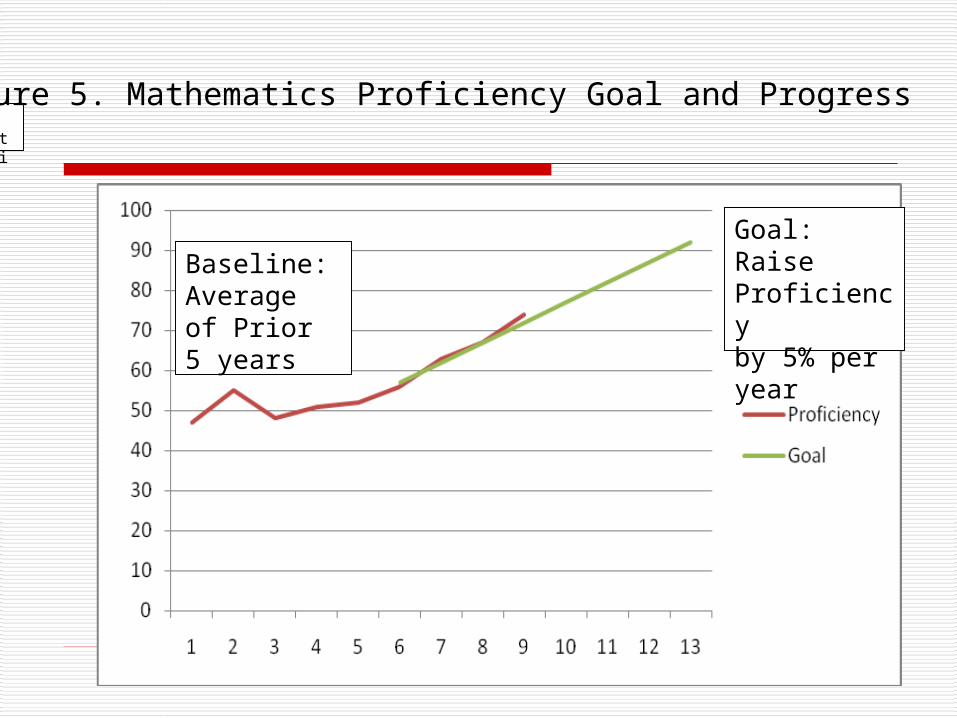
PercentProficient
Baseline: Average of Prior 5 years
Goal: Raise Proficiency by 5% per year
Figure 5. Mathematics Proficiency Goal and Progress

17
KTG: Initial Sound Fluency Fall to
January .
Benchmark: Winter KTG25 sounds correct/min.
New KTG Teacher and Traditional Instruction
Results for class are not satisfactoryMust improve curriculum, instruction or both
On all class-wide graphs look at level and progress
WaterLine
Reschly
18
0
10
20
30
40
50
60
70
1 3 5 7 9 11 13 15 17 19 21
FallJanuary
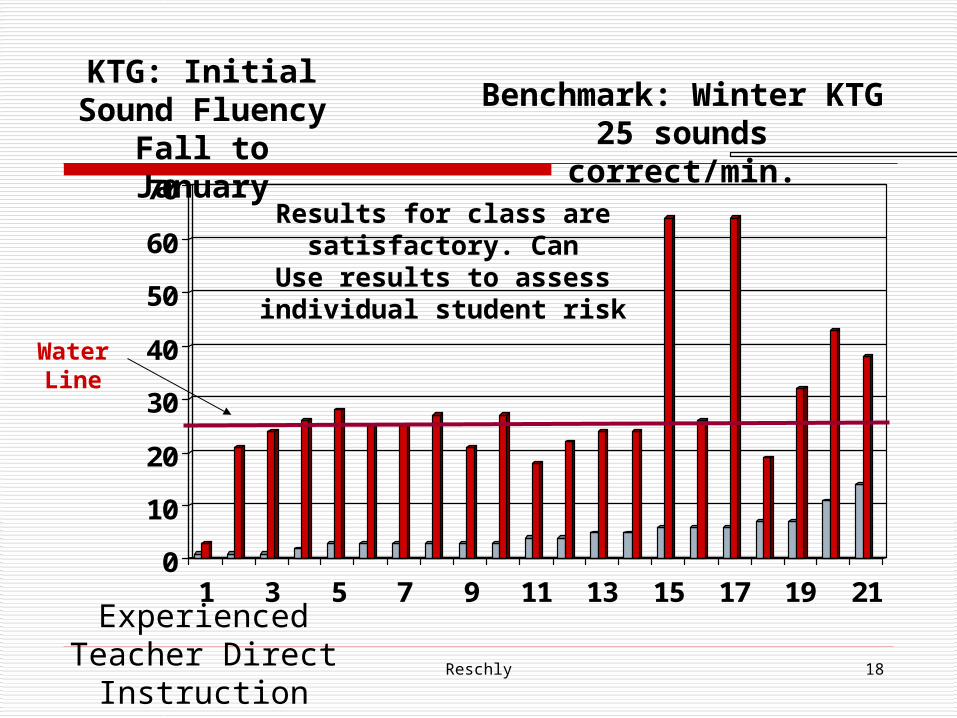
KTG: Initial Sound Fluency Fall to
January
Benchmark: Winter KTG25 sounds correct/min.
Experienced Teacher Direct Instruction
Results for class are satisfactory. Can
Use results to assess individual student risk
WaterLine
Reschly
19
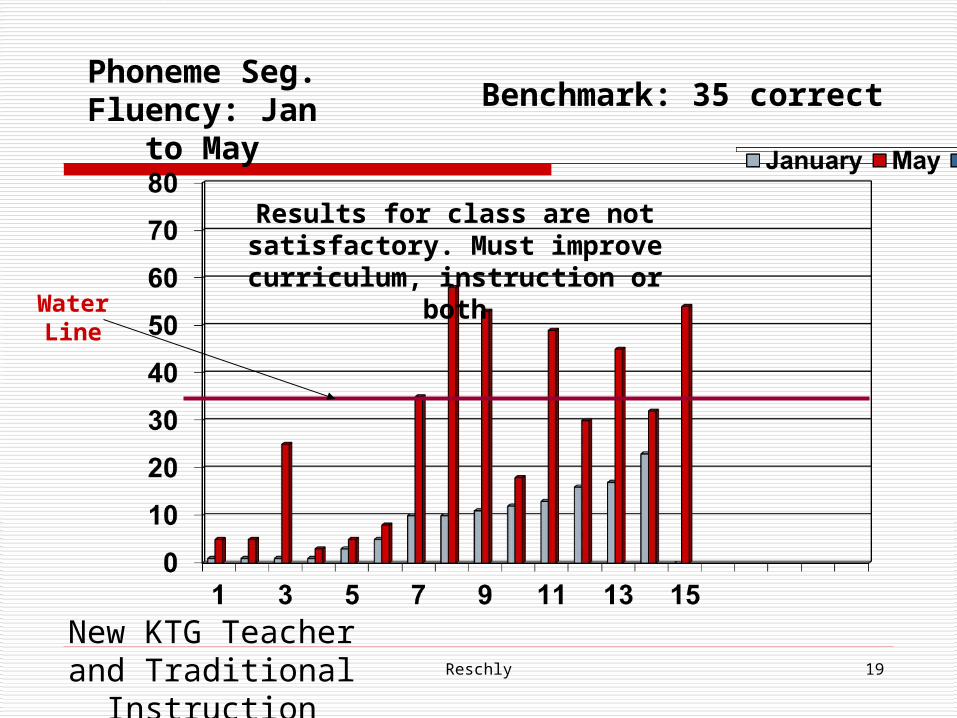
Phoneme Seg. Fluency: Jan to
May
Benchmark: 35 correct
New KTG Teacher and Traditional
Instruction
Results for class are not satisfactory. Must improve
curriculum, instruction or bothWaterLine
Reschly

Reschly 20
0
10
20
30
40
50
60
70
80
1 3 5 7 9 11 13 15 17 19 21
FallJanuary
Phoneme Seg. Fluency: Jan to
May
Benchmark: May 35 per minute
Experienced Teacher Direct Instruction
Results for class are satisfactory. Can
Use results to assess individual student risk
WaterLine
Related Documents