CCS Roadmap for Industry: High-purity CO 2 sources Sectoral Assessment – Final Draft Report Carbon Counts Company (UK) Ltd 02 September 2010 Prepared by: Paul Zakkour and Greg Cook Our Ref: 025 CCS Roadmap for Industry

Welcome message from author
This document is posted to help you gain knowledge. Please leave a comment to let me know what you think about it! Share it to your friends and learn new things together.
Transcript
CCS Roadmap for Industry: High-purity CO2 sources Sectoral Assessment – Final Draft Report Carbon Counts Company (UK) Ltd 02 September 2010 Prepared by: Paul Zakkour and Greg Cook Our Ref: 025 CCS Roadmap for Industry

CCS Industry Roadmap – High Purity CO2 Sources: Final Draft Sectoral Assessment
Carbon Counts Page 2
[this page is intentionally left blank]
CCS Industry Roadmap – High Purity CO2 Sources: Final Draft Sectoral Assessment
Carbon Counts Page 3
CONTENTS
1 INTRODUCTION .................................................................................................................. 5
2 BACKGROUND TO HIGH PURITY CO2 SOURCE SECTORS ........................................................ 7
2.1 Natural gas production ....................................................................................................... 7
2.1.1 Natural gas processing ......................................................................................... 11
2.2 Industrial hydrogen and synfuel production and use ...................................................... 13
2.2.1 Hydrogen production ........................................................................................... 13
2.2.2 Ammonia production ........................................................................................... 16
2.2.3 Synthetic fuel production ..................................................................................... 18
2.2.4 Refineries .............................................................................................................. 22
2.3 Ethylene oxide production ............................................................................................... 22
2.4 Technologies for industrial gas separation (“CO2 capture”) ............................................ 27
2.4.1 Membrane separation .......................................................................................... 27
2.4.2 Chemical solvents ................................................................................................. 28
2.4.3 Physical sorbents .................................................................................................. 30
2.4.4 Pressure swing adsorption ................................................................................... 30
2.4.5 Cryogenic separation processes ........................................................................... 31
3 EMISSIONS SOURCES, BASELINE AND FUTURE EMISSIONS ................................................. 32
3.1 Current emissions from high purity sources .................................................................... 32
3.1.1 Natural gas processing ......................................................................................... 33
3.1.2 Industrial hydrogen production and use .............................................................. 34
3.1.3 Ethylene oxide production ................................................................................... 35
3.2 Future emissions from high purity sectors ....................................................................... 37
4 CO2 CAPTURE AND STORAGE ............................................................................................ 40
4.1 Current activities .............................................................................................................. 40
4.1.1 Natural gas processing ......................................................................................... 40
4.1.2 Industrial hydrogen production and use .............................................................. 42
4.1.3 Ethylene oxide production ................................................................................... 43
4.2 Costs of CCS deployment.................................................................................................. 44
4.2.1 Costs ..................................................................................................................... 44
4.2.2 Factors influencing costs ...................................................................................... 46
4.3 Potential for CCS deployment to 2050 ............................................................................. 47
5 GAPS, BARRIERS, ACTIONS AND MILESTONES .................................................................... 51
5.1 Gaps and Barriers ............................................................................................................. 51
5.1.1 Data gaps .............................................................................................................. 53
5.1.2 Information gaps .................................................................................................. 54
5.1.3 Knowledge gaps.................................................................................................... 55
5.1.4 Policy and cross-cutting gaps and issues .............................................................. 56
5.2 Actions and Milestones .................................................................................................... 57

CCS Industry Roadmap – High Purity CO2 Sources: Final Draft Sectoral Assessment
Carbon Counts Page 4
5.2.1 Update technical and cost information ................................................................ 57
5.2.2 Improve engagement with industry ..................................................................... 58
5.2.3 Raise Awareness with policy makers.................................................................... 59
5.2.4 Build capacity ....................................................................................................... 59
REFERENCES .............................................................................................................................. 60
CCS Industry Roadmap – High Purity CO2 Sources: Final Draft Sectoral Assessment
Carbon Counts Page 5
1 INTRODUCTION
Implementation of carbon dioxide (CO2) capture and storage (CCS) technologies for most industrial
activities – for example boilers, turbines, iron & steel furnaces and cement kilns - requires a capture
step to convert a relatively dilute stream of CO2 to a higher concentration so as to allow economic
transportation and storage. In these applications, concentrations of CO2 in exhaust gas streams
range from approximately 3-20% CO2 (Metz et al, 2005), which typically need to be concentrated to
>85% prior to compression, transport and storage. CO2 capture processes thus entails the stripping
of the CO2 from other gases present in the exhaust gas stream, in particular nitrogen (N2), carbon
monoxide (CO) and elemental oxygen (O2). Alternatively, introduction of alternative combustion
methods can limit the amount of other gases present in exhaust streams, for example combusting
fuels in nearly pure oxygen.
In these contexts, a range of technologies are available for capturing the CO2, including:
Post combustion capture processes – where the flue gases exiting combustion plant are
treated using chemical or physical sorbents to selectively remove CO2 from the gas mixture.
The solvents are subsequently regenerated –using, for example steam – to produce a
concentrated CO2 stream from the stripping column. A range of novel solvents that reduce
regeneration energy requirements are also under consideration for post-combustion
capture, including chilled ammonia and hindered amines;
Pre-combustion capture processes – where input fossil fuel is gasified to a synfuel mixture,
which is then subject to water-gas shift reaction and subsequent gas clean up to separate
the produced hydrogen from the CO2. The gas clean up step is usually achieved using similar
methods employed as described for post-combustion processes, although there are
advantages to removing the CO2 from the syngas mainly associated with the pressure of the
gas which reduces compression energy requirements. The hydrogen is used as the input fuel
to the combustion process, whilst the CO2 is available in a concentrated form for
compression, transport and storage; and,
Oxyfuel technologies – where the combustion process takes place in a relatively pure
oxygen environment, resulting in flue gases of high CO2 concentration. In this case, the
exhaust gas requires little or no treatment prior to transport and storage.
In all cases, new equipment must be applied to the standard processes, which imposes additional
capital costs, whilst additional operating costs are involved with the operation of the plant, including
additional fuel and chemical solvents. Such modifications also require some process integration,
increasing the overall complexity of plant operation.
Notwithstanding the challenges of capturing CO2 from gas streams, some industrial activities already
employ technologies similar to those described as part of the standard industrial process. This
results in the generation of high purity, high concentration CO2 process offgas streams which are
readily available for dehydration, compression, transport and storage. The types of activities this
covers include natural gas processing, hydrogen production (including for the production of

CCS Industry Roadmap – High Purity CO2 Sources: Final Draft Sectoral Assessment
Carbon Counts Page 6
ammonia and subsequent fertilisers), synthetic fuel production (e.g. coal-to liquids; gas to liquids)
and certain organic chemical production processes (e.g. ethylene oxide production).
On a global scale, the CO2 emissions from these activities are relatively modest when compared to
emissions from other activities (around 400-450 million tCO2 per year – approximately 6% of global
emissions from industry; Figure 1). However, the scope for utilising these streams for ‘early
opportunity’1 CCS projects is an extremely important consideration for rolling-out the demonstration
of CCS technologies, in particular sub-surface storage aspects. This is because many of the
challenges posed by CO2 capture for other sectors do not apply to these activities. As such, high
purity sources allow early experience with CO2 storage to be gained in parallel with technology
developments for CO2 capture for other activities, potentially accelerating the rate at which CCS can
be fully demonstrated and ultimately deployed on a large-scale.
Figure 1 Global industrial emissions and high purity emissions (2007)
Source: global industry emissions taken from IEA (2009). See main report text for other sources.
This report focuses on the role of high purity CO2 sources in CCS demonstration and deployment. It
covers the following aspects that can illustrate a pathway to CCS demonstration and deployment for
high purity sectors to 2050, covering:
Characteristics of the sector;
The major processes in these sectors which generate high purity CO2;
The outlook for CO2 emissions and emissions abatement;
The scope for applying CCS, including estimated costs, global capture potential and
investment needs;
Gaps and barriers that need to be overcome; and
Actions and milestones that can support and measure deployment.
1 The Intergovernmental Panel on Climate Change Special Report on Carbon Dioxide Capture and Storage
(Metz et al. 2005) defines early opportunities as projects that *are likely to+ “involve CO2 captured from a high-purity, low-cost source, the transport of CO2 over distances of less than 50 km, coupled with CO2 storage in a value-added application such as EOR.”
430 MtCO2, 6%
7,175 MtCO2, 94%
Industry total = 7.6 GtCO2
High purity sources
Other industry
160.0 MtCO2, 37.2%
236.0 MtCO2, 54.9%
6.3 MtCO2, 1.5%
27.6 MtCO2, 6.4%
High purity total = 0.43 GtCO2
Gas Processing
Ammonia
Ethylene oxide
Coal-to-liquids
119.4 MtCO2 is available for CCS (27.8%)

CCS Industry Roadmap – High Purity CO2 Sources: Final Draft Sectoral Assessment
Carbon Counts Page 7
2 BACKGROUND TO HIGH PURITY CO2 SOURCE SECTORS
The high purity sector described in this Roadmap covers a diverse range of industrial activities,
including natural gas production, synthetic fuel production, and bulk inorganic and organic chemicals
production. A brief overview of the level of industrial activity in each sector is outline in the
following sections, covering:
Product uses and global market status
Production technologies and characteristics
Forecast production and demand growth / decline
Regional characteristics of the industry
2.1 Natural gas production
Natural gas is a source of hydrocarbon fossil fuel consisting primarily of methane (CH4), with trace
levels of other longer-chain hydrocarbon gases including ethane, butane and propane. It is
produced from geological reservoirs both in free gas phase (non-associated gas), in association with
natural gas liquids (condensates) and in association with oil (associated gas). Following processing to
remove any impurities, water and heavier hydrocarbon fractions including gases and liquids, it is
delivered to markets for end use via three main routes: pipelines, liquefaction and transport by ships
for re-gassing at the consumer market, or converted to synthetic gasoline, diesel or aviation fuel (see
Section 2.2.3 for discussion of the latter).
The principal market uses for pipeline and liquefied natural gas are power generation, feedstock in
industrial processes (e.g. fertilizer and petrochemicals production) and in commercial and domestic
heating and hot water use.
The natural gas production industry is characterised by two sets of producers, the international oil
companies (IOCs) and state owned oil companies (Table 1).
The six global major IOCs are widely considered to be ExxonMobil, BP, Royal Dutch Shell, Total,
Chevron and ConocoPhilips (the “supermajors”). In addition, a wide range of smaller but significant
“tier-two” IOCs (e.g. ENI, Repsol YPF, Marathon, Anadarko, Occidental, BG Group) also operate on an
increasingly global scale, whilst a range of other smaller exploration and production (E&P)
companies, largely prospecting in frontier provinces, are also a feature of the privately held oil and
gas sector.
In most oil and gas producing regions outside of the OECD, state owned national oil companies
(NOCs) dominate production, although they often operate under production sharing agreements
with super-majors and IOCs. Cooperation between NOCs is also becoming a feature of new
investment developments in the sector. The major NOCs include: Saudi Aramco (Saudi Arabia), JSC
Gazprom (Russia), CNPC (PetroChina), PDVSA (Venezuela), Petrobras (Brazil), Petronas (Malaysia),
and PEMEX (Mexico). Other large producers, in particular for gas production, include Qatar
Petroleum (Qatar), Sonatrach (Algeria), KPC (Kuwait), NOC (Libya), ADNOC (Abu Dhabi), National
Iranian Oil Company (NIOC), NNPC (Nigeria), CNOOC (China), Sinopec (China) and PTT (Thailand). In
CCS Industry Roadmap – High Purity CO2 Sources: Final Draft Sectoral Assessment
Carbon Counts Page 8
recent years, some of these companies have extended their areas of operation into emerging
production provinces, in particular in Africa.
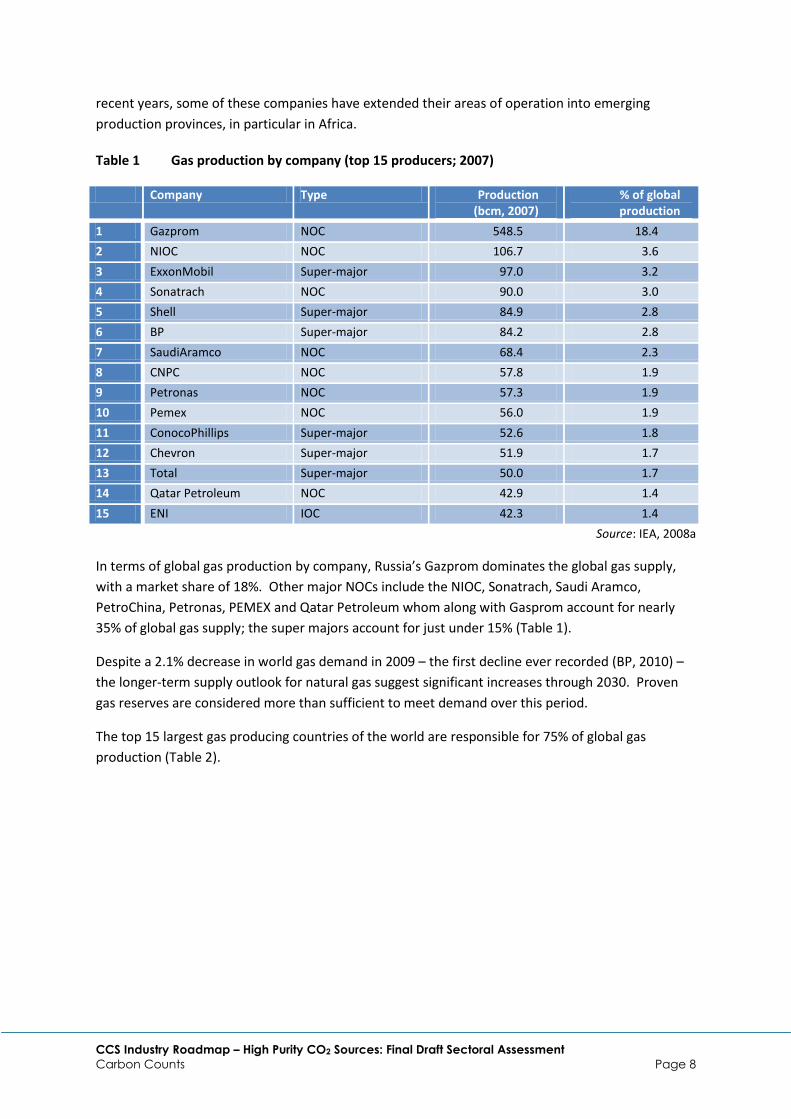
Table 1 Gas production by company (top 15 producers; 2007)
Company Type Production (bcm, 2007)
% of global production
1 Gazprom NOC 548.5 18.4
2 NIOC NOC 106.7 3.6
3 ExxonMobil Super-major 97.0 3.2
4 Sonatrach NOC 90.0 3.0
5 Shell Super-major 84.9 2.8
6 BP Super-major 84.2 2.8
7 SaudiAramco NOC 68.4 2.3
8 CNPC NOC 57.8 1.9
9 Petronas NOC 57.3 1.9
10 Pemex NOC 56.0 1.9
11 ConocoPhillips Super-major 52.6 1.8
12 Chevron Super-major 51.9 1.7
13 Total Super-major 50.0 1.7
14 Qatar Petroleum NOC 42.9 1.4
15 ENI IOC 42.3 1.4
Source: IEA, 2008a
In terms of global gas production by company, Russia’s Gazprom dominates the global gas supply,
with a market share of 18%. Other major NOCs include the NIOC, Sonatrach, Saudi Aramco,
PetroChina, Petronas, PEMEX and Qatar Petroleum whom along with Gasprom account for nearly
35% of global gas supply; the super majors account for just under 15% (Table 1).
Despite a 2.1% decrease in world gas demand in 2009 – the first decline ever recorded (BP, 2010) –
the longer-term supply outlook for natural gas suggest significant increases through 2030. Proven
gas reserves are considered more than sufficient to meet demand over this period.
The top 15 largest gas producing countries of the world are responsible for 75% of global gas
production (Table 2).

CCS Industry Roadmap – High Purity CO2 Sources: Final Draft Sectoral Assessment
Carbon Counts Page 9
Table 2 Gas production by country (top 15 producers; 2009)
Country Production (bcm, 2009)
% of global production
Reserves (tcm, 2009)
R:P ratio
1 United States 593.4 19.9 6.93 12
2 Russia 527.5 17.7 44.38 84
3 Canada 161.4 5.4 1.75 11
4 Iran 131.2 4.4 29.61 226
5 Norway 103.5 3.5 2.05 20
6 Qatar 89.3 3.0 25.37 284
7 China 85.2 2.9 2.46 29
8 Algeria 81.4 2.7 4.50 55
9 Saudi Arabia 77.5 2.6 7.92 102
10 Indonesia 71.9 2.4 3.18 44
11 Uzbekistan 64.4 2.2 1.68 26
12 Netherlands 62.7 2.1 1.09 17
13 Egypt 62.7 2.1 2.19 35
14 Malaysia 62.7 2.1 2.38 38
15 United Kingdom 59.6 2.0 0.29 5
Rest of the world 752.6 25.0 47.74 63
World total 2987.0 100 183.51 61
Notes: R:P Ratio = Reserves to production ratio. It is an indication of the expected lifetime of the natural gas
resource in years based on the current situation.
Source: BP, 2010
The precise nature of the growth in gas demand will be determined by the economics of delivering
gas to markets. Increasingly there is a geographical imbalance between supply and demand which is
met by increasingly more complex – and therefore costly – pipeline projects and a growing supply of
liquefied natural gas (LNG; Figure 2). The result of increases in gas supply costs, along with
increasing concerns over energy security and the challenges of raising debt for large projects due to
the global credit crises has led to unconventional gas becoming more attractive in some regions.
This is particularly the case in the United States, where production of unconventional gas (e.g.
coalbed methane) increased significantly during 2009 (BP, 2010). Increasing trade in natural gas,
coupled to increasing supplies of LNG will likely lead to the emergence of a single global gas price
that will seemingly be determined by the marginal cost of developing the required midstream
infrastructure over coming years.

CCS Industry Roadmap – High Purity CO2 Sources: Final Draft Sectoral Assessment
Carbon Counts Page 10
Figure 2 Major trade movements in natural gas (bcm, 2009)
Source: BP, 2010
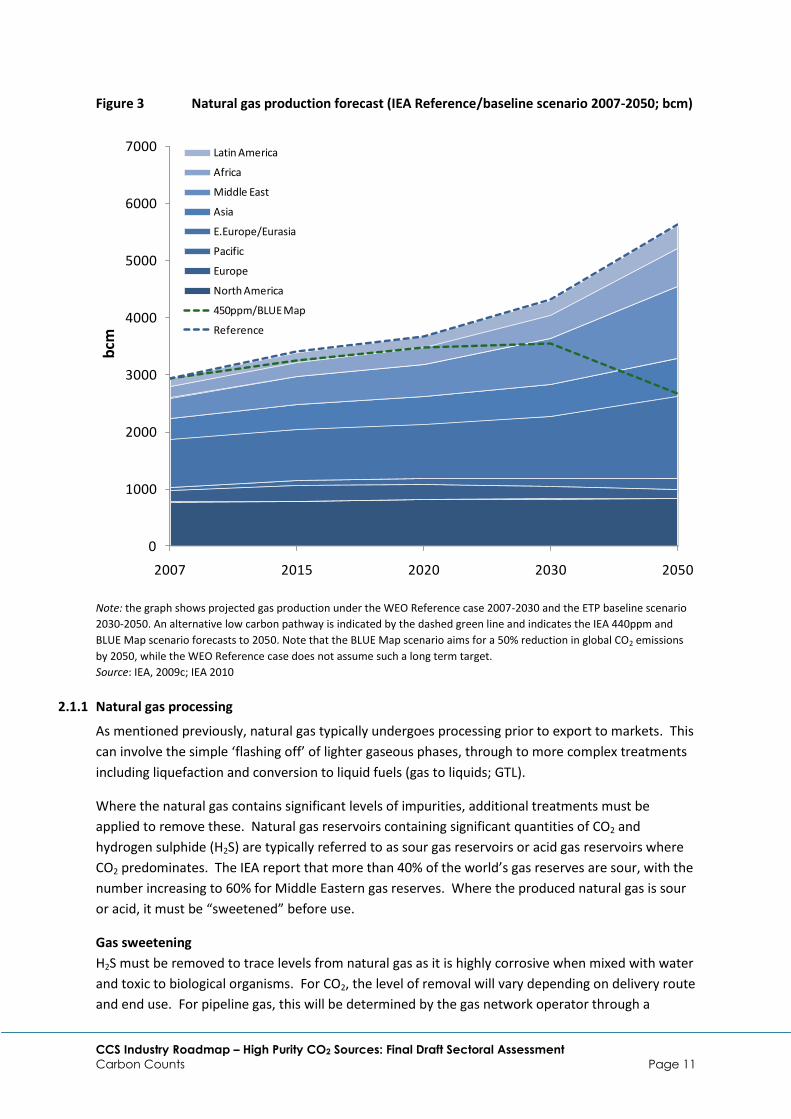
The IEA’s Reference Scenario (IEA, 2009c) suggests that natural gas consumption will grow by about
1.6% per year from the current 3 tcm per year to 4.3 tcm in 2030; this is forecast to increase to 5.6
tcm by the year 2050 (IEA, 2010), and is expected to be dominated by supplies from the Middle East
(in particular Iran and Qatar), Russia and Nigeria (Figure 3).
The IEA’s 450ppm and BLUE Map Scenarios forecast a lower rate of growth in gas supply through
2030 and 2050, reflecting an alternative low carbon pathway supported by a significant shift in
future climate policy and abatement incentives. Under these alternative scenarios, gas supply is
estimated to reach around 3.6 tcm per year in 2030 (IEA, 2009c) and 2.7 tcm in 2050 (IEA, 2010) – a
reduction of around 50% compared to the reference case by the year 2050.
CCS Industry Roadmap – High Purity CO2 Sources: Final Draft Sectoral Assessment
Carbon Counts Page 11
Figure 3 Natural gas production forecast (IEA Reference/baseline scenario 2007-2050; bcm)
Note: the graph shows projected gas production under the WEO Reference case 2007-2030 and the ETP baseline scenario
2030-2050. An alternative low carbon pathway is indicated by the dashed green line and indicates the IEA 440ppm and
BLUE Map scenario forecasts to 2050. Note that the BLUE Map scenario aims for a 50% reduction in global CO2 emissions
by 2050, while the WEO Reference case does not assume such a long term target.
Source: IEA, 2009c; IEA 2010
2.1.1 Natural gas processing
As mentioned previously, natural gas typically undergoes processing prior to export to markets. This
can involve the simple ‘flashing off’ of lighter gaseous phases, through to more complex treatments
including liquefaction and conversion to liquid fuels (gas to liquids; GTL).
Where the natural gas contains significant levels of impurities, additional treatments must be
applied to remove these. Natural gas reservoirs containing significant quantities of CO2 and
hydrogen sulphide (H2S) are typically referred to as sour gas reservoirs or acid gas reservoirs where
CO2 predominates. The IEA report that more than 40% of the world’s gas reserves are sour, with the
number increasing to 60% for Middle Eastern gas reserves. Where the produced natural gas is sour
or acid, it must be “sweetened” before use.
Gas sweetening
H2S must be removed to trace levels from natural gas as it is highly corrosive when mixed with water
and toxic to biological organisms. For CO2, the level of removal will vary depending on delivery route
and end use. For pipeline gas, this will be determined by the gas network operator through a
0
1000
2000
3000
4000
5000
6000
7000
2007 2015 2020 2030 2050
bcm
Latin America
Africa
Middle East
Asia
E.Europe/Eurasia
Pacific
Europe
North America
450ppm/BLUE Map
Reference
CCS Industry Roadmap – High Purity CO2 Sources: Final Draft Sectoral Assessment
Carbon Counts Page 12
contracted delivery specification for the gas, which in turn depends on the level of blending that may
be achieved. For some dedicated applications, these standards may be relaxed where low calorific
value (LCV) gas can be combusted (e.g. for use in modified gas turbines). Consequently,
specifications for pipeline gas will vary from 0.2% to up to 18% or 20% CO2 by volume, however,
typical specification for gas distribution grids are for less than 2% CO2 by volume.
For LNG and GTL, CO2 must be removed to trace levels in order to prevent CO2 solidifying during
compression (i.e. dry-ice formation), which has serious implications for process control. Typical
specifications for LNG and GTL feedstock is less than 0.2% by volume. Generalised process flows for
gas sweetening are highlighted below (Figure 4a and b).
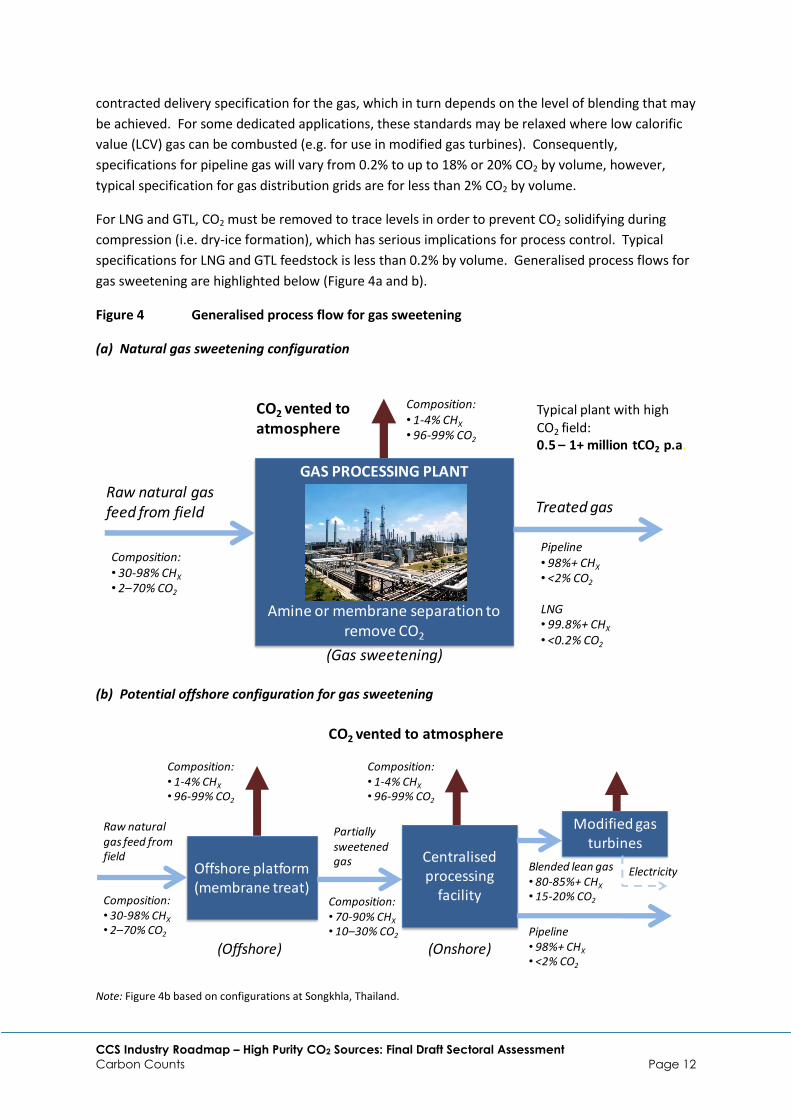
Figure 4 Generalised process flow for gas sweetening
(a) Natural gas sweetening configuration
(b) Potential offshore configuration for gas sweetening
Note: Figure 4b based on configurations at Songkhla, Thailand.
GAS PROCESSING PLANT
Amine or membrane separation to remove CO2
Raw natural gas feed from field
Composition:• 30-98% CHX
• 2–70% CO2
CO2 vented to atmosphere
Composition:• 1-4% CHX
• 96-99% CO2
Treated gas
Pipeline• 98%+ CHX
• <2% CO2
LNG• 99.8%+ CHX
• <0.2% CO2
(Gas sweetening)
Typical plant with high CO2 field:0.5 – 1+ million tCO2 p.a.
Offshore platform (membrane treat)
Raw natural gas feed from field
Composition:• 30-98% CHX
• 2–70% CO2
CO2 vented to atmosphere
Composition:• 1-4% CHX
• 96-99% CO2
Partially sweetened gas Centralised
processing facilityComposition:
• 70-90% CHX
• 10–30% CO2
Composition:• 1-4% CHX
• 96-99% CO2
(Offshore) (Onshore)Pipeline• 98%+ CHX
• <2% CO2
Blended lean gas• 80-85%+ CHX
• 15-20% CO2
Modified gas turbines
Electricity
CCS Industry Roadmap – High Purity CO2 Sources: Final Draft Sectoral Assessment
Carbon Counts Page 13
Figure 4a shows a generalised process configuration for gas sweetening, where raw gas from
reservoirs – either a single reservoir or multiple fields – is treated at a centralised processing facility
using an amine or membrane based treatment to remove CO2. The removed CO2 is vented to the
atmosphere and the treated gas is either exported to markets in pipelines or input to LNG or GTL
production. The gas may be further blended at other processing facilities prior to delivery to end
users.
Figure 4b shows an alternative treatment configuration that is sometimes employed offshore. In
this configuration, some processing takes place at the wellhead at the offshore platform prior to
transporting the natural gas onshore. Typically, because of weight and maintenance configurations,
the offshore platform uses a membrane treatment. Constraints on available energy may also
require the application of a single pass technology, which can only reduce the CO2 content to around
20-25% (depending on initial content). The partially sweetened gas is then transported to a
centralised processing facility onshore, where it is blended with gas from other sources. Typically
centralised processing facilities will be co-located with a bank of gas-fired power plants to provide
anchor demand for the gas. In some cases, the gas turbines may be modified to run on a low caloric
mixture of natural gas and CO2 (as much as 20% CO2) as a means of reducing the amount of gas
processing required. Treated gas will be exported to end users.
A more detailed description of the technologies employed to remove CO2 from natural gas mixtures
is presented in Section 2.4 below.
2.2 Industrial hydrogen and synfuel production and use
In the following section, several activities that are included in the high purity CO2 source category
are considered in the same context due to the similarity of the underlying process. All involve the
application of solid fuel gasification or natural gas reforming technologies to produce a syngas which
is purified via a gas clean-up step to produce a reformed syngas mix or hydrogen (H2) for use as
feedstock to for the production of various final products. The water-gas shift reaction process
converts syngas to a mixture of CO2 and hydrogen in varying amounts. In the case of hydrogen
production, the CO2 must be removed to produce a purified stream, whilst for synthetic fuel
production, the water-gas shift conversion and gas clean-up steps are carefully controlled to
optimise the H2/CO ratio. This type of technology covers the following sectors:
Ammonia (and fertiliser) production, and
Synthetic fuel production.
2.2.1 Hydrogen production
Globally, around 45-50 million tonnes of hydrogen are produced each year, the majority of which is
produced using fossil fuel feedstocks (Figure 5, Figure 6; Hydrogen Association; Evers, 2008). Around
half is used to produce ammonia, around a quarter is used for hydrocracking in petroleum refining,
with the balance used to make methanol and other industrial applications including coal-to-liquids
(Figure 5).

CCS Industry Roadmap – High Purity CO2 Sources: Final Draft Sectoral Assessment
Carbon Counts Page 14
Figure 5 Estimated world hydrogen production and use (2008)
Source: various as in text
There are several processes for producing hydrogen from fossil fuel or biomass feedstocks,
including: steam reforming, auto-thermal reforming (ATR), partial oxidation (POX), and gasification.
Technology selection depends on economics, plant flexibility and feedstock source. A generalised
schematic of the industrial hydrogen production process is shown below (Figure 6)
Figure 6 Generalised process flow for industrial hydrogen and syngas production
Note: SMR = Steam methane reforming; ATR = Auto thermal reforming; POX = Partial oxidation.
24 Mt
15 Mt
9 Mt
2 Mt
World H2 production
Natural gas
Oil
Coal
Electrolysis28 Mt
13 Mt
5 Mt
5 Mt
World H2 use
Ammonia production
Refining
Methanol production
Other uses
World H2 production approx. 50 Mt/yr
Feedstock in
Natural gas/naptha
Coal/Biomass
REFORMER(SMR/ATR)
PARTIAL OXI(POX)
SHIFT REACTOR
(Water –gas shiftH2O, H2, CO, CO2
shift to H2 & CO2)
O2 and/or Air
O2 and/or AirSteam
CO2:- Vented- To urea production- Enhanced oil recovery
Syngas(H2, CO,
CO2, H2O)
H2 and to ammonia and F-T processes
GAS CLEAN UP(H2 & CO2
separation)PSA, physical
absorption e.g. Selexol
GASIFIER
Natural gas/fuel oil

CCS Industry Roadmap – High Purity CO2 Sources: Final Draft Sectoral Assessment
Carbon Counts Page 15
Steam reforming
Steam reforming is the most widespread process in use today for industrial hydrogen production
(Metz et al., 2005). It typically involves the use of natural gas, where it is referred to as steam
methane reforming (SMR), but can also use other light hydrocarbons.
The first stage is the removal of sulphur, followed by the introduction of the hydrocarbon feedstock
into a reformer, where synthesis gas is produced at around 800-900°C in the presence of a nickel-
based catalyst. The process is endothermic, and additional heat is supplied to the reaction through
the partial burning of the fuels (secondary fuels). The reformed gas is cooled in a waste heat boiler,
which provides the steam for the reaction process. The reformed gas is then subject to shift
reactions and gas clean-up (Figure 6). Typically, carbon monoxide (CO) in the syngas is reduced to
0.2-0.3% through the water-gas shift reactor, resulting in a mixture of mainly CO2 and H2, from which
the CO2 is removed to produce pure hydrogen (Metz et al., 2005). Traditionally the CO2 was
removed from the syngas mixture using chemical based solvent absorption techniques, although
more modern plants may use pressure swing adsorption (Metz et al., 2005). The gas clean up
technique used has ramifications for subsequent CO2 compression, transport and storage, as
described in Section 2.4.
Partial oxidation
Partial oxidation (POX) processes involve the reacting of fuel with oxygen at high pressures. The
process is exothermic and therefore doesn’t require an external heat source, typically taking place at
temperatures around 1250-1400°C. The produced syngas is subject to water-gas shift and gas clean-
up as described for SMR above. The heat required for the reaction is supplied by the partial
combustion of the feedstock (Metz et al., 2005).
Oxygen is supplied from an air separation unit (ASU), which imposes a significant energy burden on
the gasification step compared to SMR. However, this is partially made up through the exothermic
nature of the reaction, and because it uses oxygen instead of air in the reactor, nitrogen is excluded
from the water-gas shift and gas clean up steps, reducing energy requirements in subsequent
processes. Generally, the POX process is less efficient than the SMR technique, however, it has the
benefit of being more widely adaptable to a range of feedstocks.
Auto-thermal reforming
Auto thermal reforming (ATR) is a combination of SMR and POX processes, with the required heat
being generated by the partial oxidation reaction using air or oxygen, but because steam is also
provided the endothermic reforming reaction occurs in the catalytic section of the reactor
downstream of the POX burner. It has advantages over the SMR process as no direct CO2 emissions
are produced because all of the heat release is internal (Metz et al., 2005). However, these benefits
are offset by the investment and operating costs of the ASU plant.
Gasification of solid fuels
Gasification is similar to the POX process, although with the addition of steam. A variety of different
gasifier configurations are currently in use, including fixed bed and entrained flow systems, all of
which have different requirements in terms of the oxidant used, operating pressure, feed system,
syngas cooling system and gas clean up steps (Metz et al., 2005). Most systems installed in the last
20 years employ the entrained flow system, of which there are three alternatives available on the
market (Metz et al., 2005).

CCS Industry Roadmap – High Purity CO2 Sources: Final Draft Sectoral Assessment
Carbon Counts Page 16
The gasification process results in the production of a syngas, which is then subject to water-gas shift
reactions and gas clean-up as described for other processes above.
2.2.2 Ammonia production
Production of hydrogen using processes described in the previous section is the first step in the
manufacture of ammonia in the Haber-Bosch process. The Haber-Bosch process involves the
synthesis of hydrogen with gaseous nitrogen using an iron or ruthenium enriched catalyst at high
temperature and high pressure.
Around 80% of all ammonia manufactured worldwide is used to produce inorganic nitrogen based
fertilisers. Other important uses of ammonia include the manufacture of nitric acid, nylon and other
polymides, refrigerants, dyes, explosives and cleaning solutions.
The challenges associated with storing and transporting hydrogen mean that ammonia and fertiliser
producers manufacture hydrogen onsite. The International Fertiliser Association (IFA) reports that
the predominant source of hydrogen for ammonia production is natural gas, although coal also
forms a significant proportion, especially in China (Figure 7). In terms of the preferred hydrogen
production method, a variety of different techniques as described in the previous section are used,
with no publically available data on the different types of plant in operation today.
Presently around 150 million tonnes of ammonia are produced globally (IFA, 2010a). The main
producing regions are East, Central and South Asia, where more than half of global ammonia
production is located (Table 3).
Table 3 Global ammonia production by region (2008)
Region Production (000’s tonnes; 2008)
Seven year trend (2001-2008)
Share of production
East Asia 57,619 4.3% 37.9%
E. Europe & C. Asia 21,690 3.0% 14.3%
South Asia 16,376 -0.1% 10.8%
North America 14,432 -4.0% 9.5%
West Asia (M. East) 10,928 6.8% 7.2%
West Europe 10,315 -2.2% 6.8%
Latin America 9,202 3.6% 6.1%
Africa 5,054 2.2% 3.3%
Central Europe 4,873 1.2% 3.2%
Oceania 1,415 8.9% 0.9%
Total 151,904 1.9% 100%
Source: IFA, 2010a
The Middle East has increased its production of ammonia in recent years, and is likely to be a major
source of ammonia in the future as production in OECD areas such as Europe and North America

CCS Industry Roadmap – High Purity CO2 Sources: Final Draft Sectoral Assessment
Carbon Counts Page 17
continues to decline. However, this will require a marked increase in global trade, which has
remained stable at around 11-13% over the period 1999-2008 (IFA, 2010b).
In terms of producers, the industry is highly diversified, with no major global companies dominating
the market. For many countries, the industry is strategically important either because of the
importance it plays in national food security (e.g. India) or because of its role in raising foreign direct
earnings through valoration of natural gas resources (e.g. the Middle East). In some cases, the
industry is largely within the control of state owned enterprises with close ties to the national oil
company (e.g. Saudi Basic Industries Corporation; SABIC). This is most likely the reason for the low
levels of trade in ammonia to date.
Figure 7 World ammonia production by feedstock type
Source: IFA, 2010b
The International Fertiliser Association reports that the industry already utilises around 36% of the
CO2 removed from the syngas in the gas clean-up step (IFA, 2010b). Of this, around 33% is used for
the synthesis of ammonia into urea, whilst the remaining 2.2% is sold on to other uses (5.2 MtCO2),
such as CO2 use for enhanced oil recovery (IFA, 2010b; see Figure 13; Section 3.1.2). This suggests
that 78 MtCO2 produced in ammonia production is consumed in urea manufacture globally.
However, these data should be modified in light of the stoichiometry of urea production using
ammonia, which is 0.733 tCO2/t NH3. Using this approach, the IFA report that global urea production
in 2008 was 146 Mt of product (IFA, 2010a), which would therefore suggest high utilisation rates of
CO2 in the fertiliser industry, at around 107 MtCO2 per annum.
Therefore, adopting the stoichiometric basis for use in urea production and adding in the 2.2% of
produced CO2 sold into other value chains, around 50% of produced CO2 is vented direct to the
atmosphere (119 MtCO2/yr). In addition to the high purity streams produced, ammonia plants also
produce impure CO2 streams, arising from combustion of fuels in reformers, boilers and gas turbines
(where power is produced on site), which have not been considered within the scope of this study.
Coal, 27%
Natural gas, 67%
World production approx. 152 Mt (2008)
Others, 1% Naphtha 2% INDIA 92%
Fuel oil 2% EUROPE 31%
CHINA 24%
INDIA 24%
Coal 27% CHINA 92%

CCS Industry Roadmap – High Purity CO2 Sources: Final Draft Sectoral Assessment
Carbon Counts Page 18
In a modern fertiliser plant, around 1.6-3.8 tonnes of CO2 are produced per tonne ammonia (IFA,
2009), of which around 1.15-2.60 tCO2 is produced from the production of hydrogen - depending on
the hydrogen production process and feedstock employed (Table 4).
Table 4 Typical performance data for ammonia production plants
Conventional reforming
Excess air reforming Partial oxidation
Total energy (GJ/t NH3) 32-35 32-35 39-45
Feedstock 24.5 26.0 32.0
Fuel 8-10 6-8 -
Outputs
Ammonia (t/d) 1000 – 1500 1000 – 1500 1000 – 1500
CO2 reformer (t/tNH3)a
1.15 – 1.30 1.15 – 1.30 2.0-2.6
Emissions
CO2 in flue gas (t/t NH3)b
0.5 0.4 – 0.5 n.a
a not including CO2 in flue gases.
b Assumes CO2 is used in plant and not vented.
Source: UNEP/UNIDO (1998)
The outlook for ammonia production is strongly driven by increasing demand for inorganic fertilisers
for food and biomass production. The IEA estimates that annual ammonia production will increase
by between 101 and 143 million tonnes between 2007 and 2050 (IEA, 2010) to as high as 303 million
tonnes, or double the current levels production levels. The main increases are expected to occur in
the Middle East (24-38 Mt,) developing Asia (24-38 Mt), Russia (11-15 Mt), Latin America (9-13 Mt)
and Africa (11-14 Mt) whilst production on Western Europe and North America is likely to remain at
current levels (ibid).
2.2.3 Synthetic fuel production
At present a small proportion of the synthesis gas produced globally is converted to synthetic fuels.
Synthetic fuels production is a means to substitute conventional liquid fossil fuels through
production of liquid fuels through alternative pathways, such as the conversion of coal and natural
gas. Options for synthetic fuel production include production of the following:
Synthetic diesel and jet fuel
Synthetic gasoline, and
Naphtha, DiMethyl Ether (DME) and methanol
Interest in the production of synthetic fuels as a substitute to oil derived products has risen in recent
years in response to increasing oil prices and concerns over energy security. The production of
synthetic fuels is energy intensive, and therefore it is only economic under high oil price scenarios.
Moreover, CO2 emissions from synthetic fuel production are also much higher than for conventional
fuel production, in particular for coal-based processes; gas based processes, such as gas-to-liquid
production, have lower emissions (Table 5; IEA, 2008c).

CCS Industry Roadmap – High Purity CO2 Sources: Final Draft Sectoral Assessment
Carbon Counts Page 19
Table 5 CO2 emission from various synthetic fuel production processes
Efficiency (%) CO2 (kg/GJ product) CO2 (Mt/yr/plant)
FT natural gas 70 7 0.25 - 0.5
FT coal 40 160 10 - 15
FT biomass 40 210 0.2
Methanol/DME from coal 65 110 5-10
Methanol/DME from natural gas 70 8 0.25 - 0.5
Source: IEA, 2008c and Steynberg and Nel, 2004
There are two main methods for coal liquefaction:
Indirect methods – Indirect methods for synthetic fuel production begins with similar
industrial gasification and reforming technologies as described previously (Figure 6).
However, the fundamental process involves the hydrogenation of CO, and thus unlike pure
H2 production, CO is required in the syngas feedstock to the Fischer-Tropsch (F-T) reactor. In
order to achieve this, the water-gas shift process is optimised to produce suitable ratios. For
coal gasification, the water-gas shift reaction typically produces a syngas with a ratio of
H2/CO of around 0.7, whilst the optimised ratio is around 2. Therefore, removal of some CO
in the form is CO2 is required via a gas clean-up stage. This is the main source of pure CO2 in
a coal based synfuel plant. For gas based F-T processes, significantly lower amounts of CO2
must be removed from the F-T reactor syngas feedstock, hence the lower emissions
associated with natural gas synfuel production processes. The indirect CTL production
method is the only technique in commercial operation today.
Direct methods – Direct methods of coal liquefaction, such as the NEDOL or ExxonDonor
Solvent process, have also been developed by some companies as an alternative to the
indirect method. The direct method involves mixing coal with a solvent and then cracking
the syngas with hydrogen using a catalyst. It produces a high H2/CO ratio, reducing CO2
removal requirements. Therefore it has lower emissions than the indirect method. However,
no commercial scale plant has ever been built. Presently, Shenhua Corporation’s CTL project
in the Ordos Basin, Inner Mongolia, which was recently commissioned, is an example of a
plant using the direct method for coal liquefaction.
Natural gas based synfuel production processes are a less interesting candidate for CCS compared to
coal-based processes, and are not considered further in this report.
Sasol’s Secunda CTL plant is the largest commercial scale CTL plant in operation worldwide. It
employs the indirect method of production involving coal gasification followed by F-T synthesis. Two
plants at Secunda have been in operation since 1980 and 1984, consuming more than 40 million
tonnes of coal per year (Sasol, undated) and producing around 130,000-160,000 barrels of product
per day. More recently, a number of other CTL projects have been proposed worldwide, including in
the United States, Australia and China. These include the Shenhua plant located in Ordos, Inner
Mongolia which has now begun operations. However, recent declines in oil prices have seen

CCS Industry Roadmap – High Purity CO2 Sources: Final Draft Sectoral Assessment
Carbon Counts Page 20
investment decisions deferred for most of the known proposals. It has been reported that 31 CTL
projects were proposed as of 2009 (Vallentin and Fischedick, 2009), although it has not been
possible to corroborate this number within this research and analysis. A summary of known current
and potential CTL projects are shown below (Table 6).
A similar coal gasification project, albeit for the production of substitute natural gas (SNG) and other
by-products from the gasification of brown coal (lignite), has been operated by Great Plains Synfuel
plant at in Beulah, North Dakota, USA since 1984. Almost 3 million tonnes of CO2 produced from the
Great Plains Synfuel plant is captured and transported 320 km to Saskatchewan for the purpose of
enhanced oil recovery, and is one of the few commercial scale of CCS projects in operation today
(see Box 1). Several other smaller SNG plant have been proposed in the US, although none have yet
come on stream (Table 6). China is also pursuing SNG produced from coal with an overall capacity of
around 15 bcm per year at present, as well as coal-to-DME, which stood at around 4 Mt DME per
year in 2008.
CCS Industry Roadmap – High Purity CO2 Sources: Final Draft Sectoral Assessment
Carbon Counts Page 21
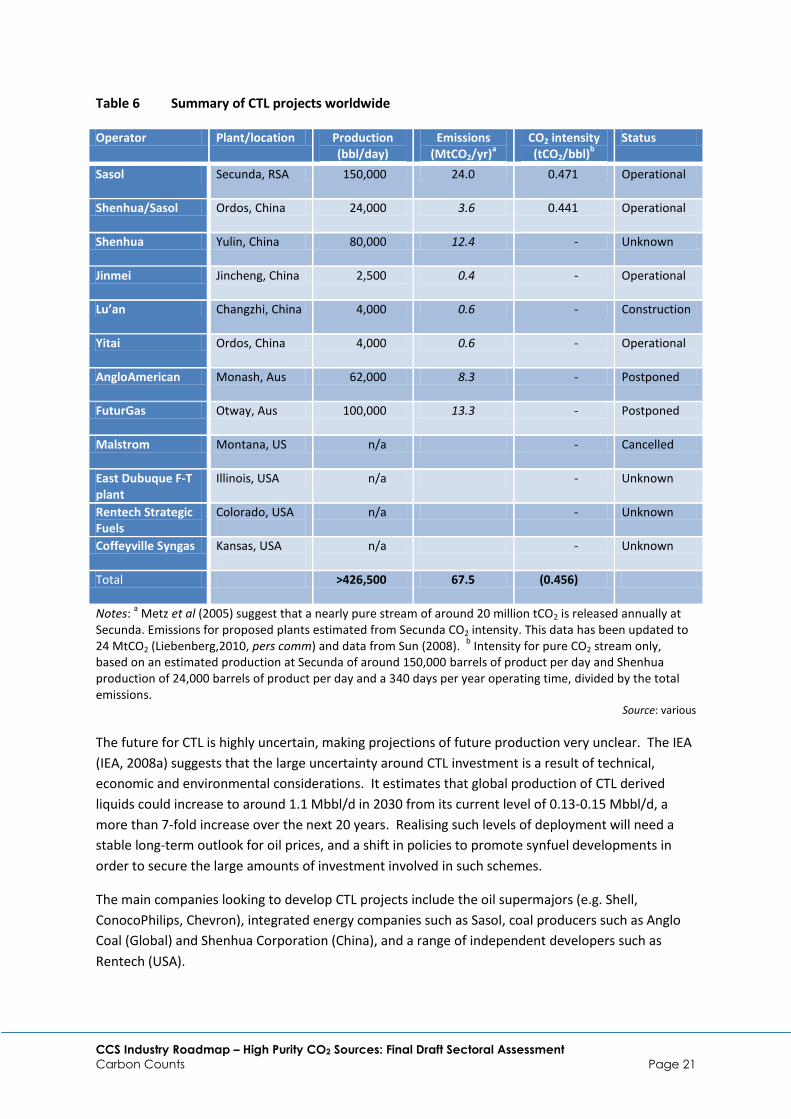
Table 6 Summary of CTL projects worldwide
Operator Plant/location Production (bbl/day)
Emissions (MtCO2/yr)
a CO2 intensity (tCO2/bbl)
b Status
Sasol Secunda, RSA 150,000 24.0 0.471 Operational
Shenhua/Sasol Ordos, China 24,000 3.6 0.441 Operational
Shenhua Yulin, China 80,000 12.4 - Unknown
Jinmei Jincheng, China 2,500 0.4 - Operational
Lu’an Changzhi, China 4,000 0.6 - Construction
Yitai Ordos, China 4,000 0.6 - Operational
AngloAmerican Monash, Aus 62,000 8.3 - Postponed
FuturGas Otway, Aus 100,000 13.3 - Postponed
Malstrom Montana, US n/a - Cancelled
East Dubuque F-T plant
Illinois, USA n/a - Unknown
Rentech Strategic Fuels
Colorado, USA
n/a - Unknown
Coffeyville Syngas Kansas, USA
n/a - Unknown
Total >426,500 67.5 (0.456)
Notes: a Metz et al (2005) suggest that a nearly pure stream of around 20 million tCO2 is released annually at
Secunda. Emissions for proposed plants estimated from Secunda CO2 intensity. This data has been updated to 24 MtCO2 (Liebenberg,2010, pers comm) and data from Sun (2008).
b Intensity for pure CO2 stream only,
based on an estimated production at Secunda of around 150,000 barrels of product per day and Shenhua production of 24,000 barrels of product per day and a 340 days per year operating time, divided by the total emissions.
Source: various
The future for CTL is highly uncertain, making projections of future production very unclear. The IEA
(IEA, 2008a) suggests that the large uncertainty around CTL investment is a result of technical,
economic and environmental considerations. It estimates that global production of CTL derived
liquids could increase to around 1.1 Mbbl/d in 2030 from its current level of 0.13-0.15 Mbbl/d, a
more than 7-fold increase over the next 20 years. Realising such levels of deployment will need a
stable long-term outlook for oil prices, and a shift in policies to promote synfuel developments in
order to secure the large amounts of investment involved in such schemes.
The main companies looking to develop CTL projects include the oil supermajors (e.g. Shell,
ConocoPhilips, Chevron), integrated energy companies such as Sasol, coal producers such as Anglo
Coal (Global) and Shenhua Corporation (China), and a range of independent developers such as
Rentech (USA).

CCS Industry Roadmap – High Purity CO2 Sources: Final Draft Sectoral Assessment
Carbon Counts Page 22
2.2.4 Refineries
As shown in Figure 5, around 15 million tonnes of hydrogen are produced annually for use in
petroleum refining. This is not covered in this report, but is discussed in detail in the refineries
Sectoral Assessment.
2.3 Ethylene oxide production
Ethylene oxide is a colourless flammable gas produced by direct oxidation of ethylene in the
presence of a silver catalyst. Because of its special molecular structure, ethylene oxide easily
participates in the addition reaction, allowing it to easily polymerize into larger compounds. It
therefore has a range of uses in the chemical sector.
The major industrial application of ethylene oxide is as a key raw material in the production of many
industrial chemicals and intermediates, including (Shell Chemicals, 2009):
Ethylene glycols –used in the production of antifreeze, polyester and polyethylene
terephthalate (PET, the raw material for plastic bottles), liquid coolants and solvents.
Polyethylene glycols - used in perfumes, cosmetics, pharmaceuticals, lubricants, paint
thinners and plasticizers
Ethylene glycol ethers - used as a key component of brake fluids, detergents, solvents,
lacquers and paints
Ethanol amines - used in the manufacture of soap and detergents and for purification of
natural gas
Ethoxylates – (produced through reaction of ethylene oxide with higher alcohols, acids or
amines) in the manufacture of detergents, surfactants, emulsifiers and dispersants
CCS Industry Roadmap – High Purity CO2 Sources: Final Draft Sectoral Assessment
Carbon Counts Page 23
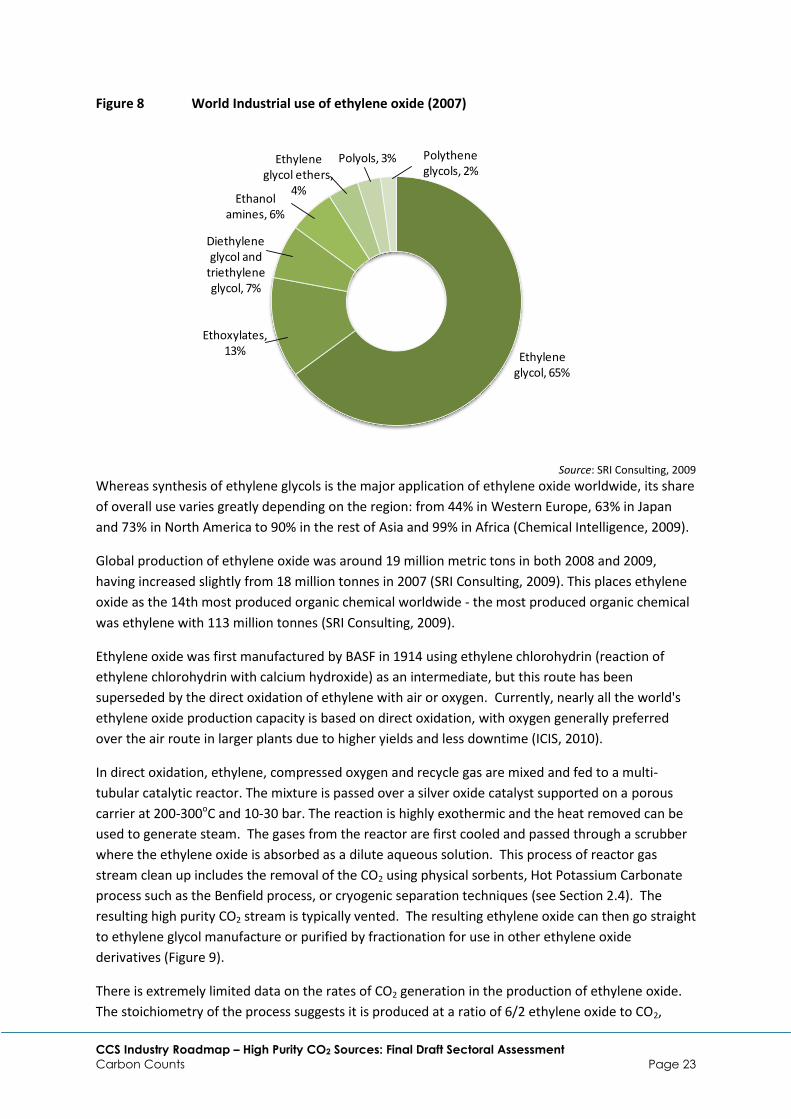
Figure 8 World Industrial use of ethylene oxide (2007)
Source: SRI Consulting, 2009
Whereas synthesis of ethylene glycols is the major application of ethylene oxide worldwide, its share
of overall use varies greatly depending on the region: from 44% in Western Europe, 63% in Japan
and 73% in North America to 90% in the rest of Asia and 99% in Africa (Chemical Intelligence, 2009).
Global production of ethylene oxide was around 19 million metric tons in both 2008 and 2009,
having increased slightly from 18 million tonnes in 2007 (SRI Consulting, 2009). This places ethylene
oxide as the 14th most produced organic chemical worldwide - the most produced organic chemical
was ethylene with 113 million tonnes (SRI Consulting, 2009).
Ethylene oxide was first manufactured by BASF in 1914 using ethylene chlorohydrin (reaction of
ethylene chlorohydrin with calcium hydroxide) as an intermediate, but this route has been
superseded by the direct oxidation of ethylene with air or oxygen. Currently, nearly all the world's
ethylene oxide production capacity is based on direct oxidation, with oxygen generally preferred
over the air route in larger plants due to higher yields and less downtime (ICIS, 2010).
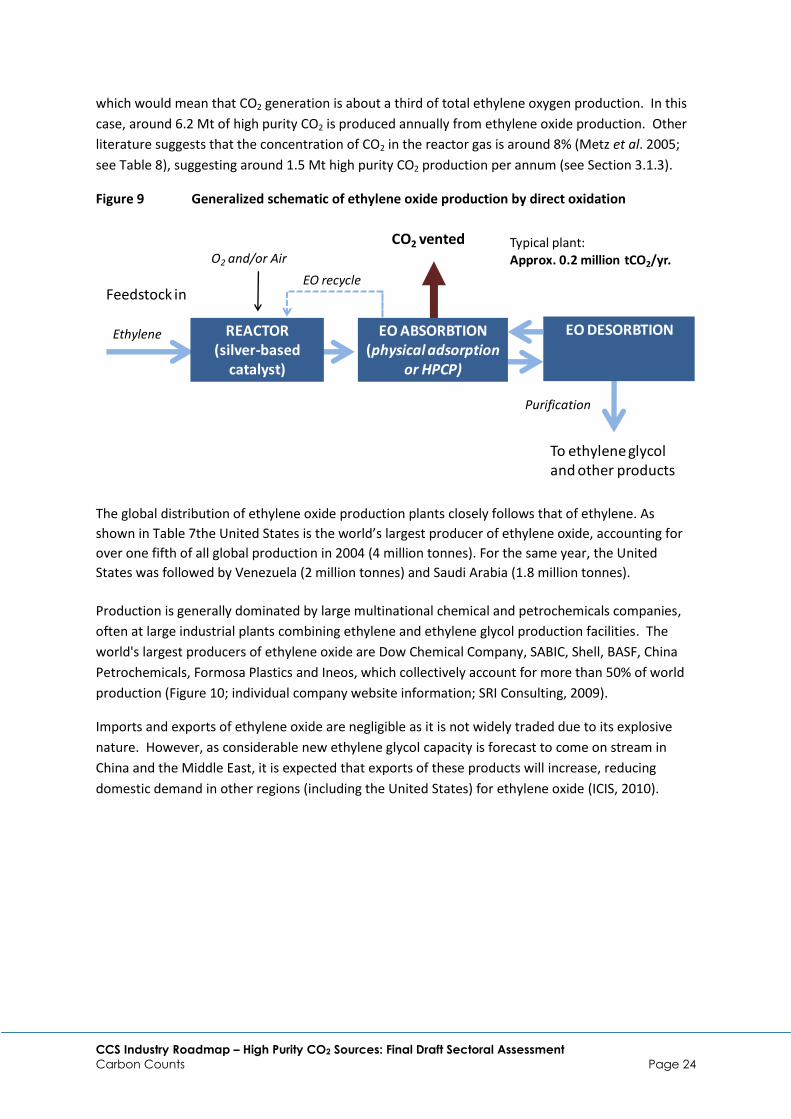
In direct oxidation, ethylene, compressed oxygen and recycle gas are mixed and fed to a multi-
tubular catalytic reactor. The mixture is passed over a silver oxide catalyst supported on a porous
carrier at 200-300oC and 10-30 bar. The reaction is highly exothermic and the heat removed can be
used to generate steam. The gases from the reactor are first cooled and passed through a scrubber
where the ethylene oxide is absorbed as a dilute aqueous solution. This process of reactor gas
stream clean up includes the removal of the CO2 using physical sorbents, Hot Potassium Carbonate
process such as the Benfield process, or cryogenic separation techniques (see Section 2.4). The
resulting high purity CO2 stream is typically vented. The resulting ethylene oxide can then go straight
to ethylene glycol manufacture or purified by fractionation for use in other ethylene oxide
derivatives (Figure 9).
There is extremely limited data on the rates of CO2 generation in the production of ethylene oxide.
The stoichiometry of the process suggests it is produced at a ratio of 6/2 ethylene oxide to CO2,
Ethylene glycol, 65%
Ethoxylates, 13%
Diethylene glycol and
triethylene glycol, 7%
Ethanol amines, 6%
Ethylene glycol ethers,
4%
Polyols, 3% Polythene glycols, 2%
CCS Industry Roadmap – High Purity CO2 Sources: Final Draft Sectoral Assessment
Carbon Counts Page 24
which would mean that CO2 generation is about a third of total ethylene oxygen production. In this
case, around 6.2 Mt of high purity CO2 is produced annually from ethylene oxide production. Other
literature suggests that the concentration of CO2 in the reactor gas is around 8% (Metz et al. 2005;
see Table 8), suggesting around 1.5 Mt high purity CO2 production per annum (see Section 3.1.3).
Figure 9 Generalized schematic of ethylene oxide production by direct oxidation
The global distribution of ethylene oxide production plants closely follows that of ethylene. As
shown in Table 7the United States is the world’s largest producer of ethylene oxide, accounting for
over one fifth of all global production in 2004 (4 million tonnes). For the same year, the United
States was followed by Venezuela (2 million tonnes) and Saudi Arabia (1.8 million tonnes).
Production is generally dominated by large multinational chemical and petrochemicals companies,
often at large industrial plants combining ethylene and ethylene glycol production facilities. The
world's largest producers of ethylene oxide are Dow Chemical Company, SABIC, Shell, BASF, China
Petrochemicals, Formosa Plastics and Ineos, which collectively account for more than 50% of world
production (Figure 10; individual company website information; SRI Consulting, 2009).
Imports and exports of ethylene oxide are negligible as it is not widely traded due to its explosive
nature. However, as considerable new ethylene glycol capacity is forecast to come on stream in
China and the Middle East, it is expected that exports of these products will increase, reducing
domestic demand in other regions (including the United States) for ethylene oxide (ICIS, 2010).
Feedstock in
Ethylene
Typical plant:Approx. 0.2 million tCO2/yr.
REACTOR (silver-based
catalyst)
EO ABSORBTION(physical adsorption
or HPCP)
CO2 vented
EO DESORBTION
To ethylene glycol and other products
O2 and/or Air
Purification
EO recycle

CCS Industry Roadmap – High Purity CO2 Sources: Final Draft Sectoral Assessment
Carbon Counts Page 25
Figure 10 World ethylene oxide production capacity by producer
Source: SRI Consulting, 2009
Monoethylene glycol (MEG) is the primary glycol which is used mainly to make polyester followed by
automotive antifreeze. MEG demand is expected to grow at 5-6% per year globally. This is partly
driven by the strong demand for polyester fibre in Asia where it is used in the production of textiles.
However, this has been at the expense of the developed markets of Western Europe and North
America where polyester fibre demand is stagnant. However, demand for PET bottle resin has been
growing strongly in all regions of the world as it replaces glass used in water, carbonated drinks and
food containers (ICIS, 2010). The second largest market for MEG is antifreeze formulations. This
market is in a slight decline due to antifreeze recycling, long-life coolants and substitution by
propylene-glycol based antifreeze. Alcohol ethoxylates are expected to see good demand growth,
partly due to declining demand for nonyl-phenol ethoxylates, which are suffering from
environmental and safety concerns (ibid).
Dow Chemicals16%
SABIC11%
Shell Chemicals6%
BASF6%
China Petrochemicals
5%Formosa Plastics5%
Ineos4%
SPDC3%
Reliance3%
Honan Petrochemical
3%
Others38%
World Production = 19 Mt EO (2006)

CCS Industry Roadmap – High Purity CO2 Sources: Final Draft Sectoral Assessment
Carbon Counts Page 26
Table 7 World production of ethylene oxide (2004)
Region Number of major producers Production (000’s tonnes)
North America
United States 10 4,009
Canada 3 1,084
Mexico 3 350
South America
Brazil 2 312
Venezuela 1 1,982
Europe
Belgium 2 770
France 1 215
Germany 4 995
Netherlands 2 460
Spain 1 100
Turkey 1 115
United Kingdom 1 300
Eastern Europe no data 950
Middle East
Iran 2 201
Kuwait 1 350
Saudi Arabia 2 1,781
Asia
China No data 1,354
Taiwan 4 820
India > 2 488
Indonesia 1 175
Japan 4 949
Malaysia 1 385
South Korea 3 740
Singapore 1 80
Total >52 18,965
Source: SRI Consulting, 2009
Global demand for ethylene oxide is forecast to grow at a rate of 5% per year from 2009 to 2014,
and around 3% per year from 2014 to 2019 (SRI Consulting, 2010). Most of the forecast growth is
expected to take place in non-OECD emerging economies. Production in the EU is expected to
decline in the future and demand growth in the US is also expected to be much lower than the
global average (ICIS, 2010).
Global capacity utilization of ethylene oxide production plant was 86% in 2009, less than that in
2008. Average global utilization rates are expected to range from the low 80s to the low 90s range
throughout the next decade (SRI Consulting, 2010). There is concern that planned increases in
capacity will outpace demand growth in the 2008-2011 period, leading to some overcapacity.
Chemical market analysts PCI estimates that 13-14 new ethylene oxide plants will come on-stream in
this period including four in Saudi Arabia, another two in the Middle East, five in China, and two or
three in India (PCI Xylenes & Polyesters, 2010).
CCS Industry Roadmap – High Purity CO2 Sources: Final Draft Sectoral Assessment
Carbon Counts Page 27
2.4 Technologies for industrial gas separation (“CO2 capture”)
The high purity sector covered in this Roadmap covers a diverse range of industrial activities,
including natural gas production, synthetic fuel production, and bulk inorganic and organic chemicals
production. The underlying production processes involved in all of these activities involves the
application of a CO2 removal step to purify intermediate or final products used in the production
process. The application of CO2 removal to these streams is more straightforward than application
to flue gases because of the smaller volumes, lower temperatures and higher pressure and partial
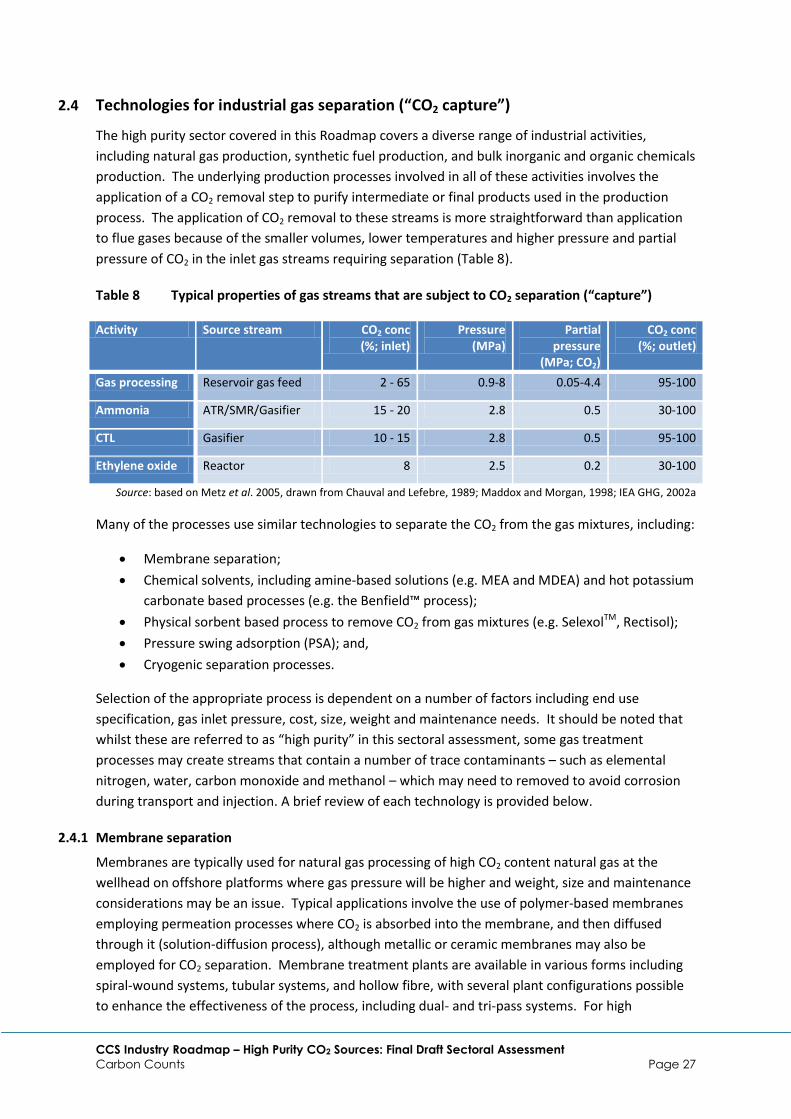
pressure of CO2 in the inlet gas streams requiring separation (Table 8).
Table 8 Typical properties of gas streams that are subject to CO2 separation (“capture”)
Activity Source stream CO2 conc (%; inlet)
Pressure (MPa)
Partial pressure
(MPa; CO2)
CO2 conc (%; outlet)
Gas processing Reservoir gas feed 2 - 65 0.9-8 0.05-4.4 95-100
Ammonia ATR/SMR/Gasifier 15 - 20 2.8 0.5 30-100
CTL Gasifier 10 - 15 2.8 0.5 95-100
Ethylene oxide Reactor 8 2.5 0.2 30-100
Source: based on Metz et al. 2005, drawn from Chauval and Lefebre, 1989; Maddox and Morgan, 1998; IEA GHG, 2002a
Many of the processes use similar technologies to separate the CO2 from the gas mixtures, including:
Membrane separation;
Chemical solvents, including amine-based solutions (e.g. MEA and MDEA) and hot potassium
carbonate based processes (e.g. the Benfield™ process);
Physical sorbent based process to remove CO2 from gas mixtures (e.g. SelexolTM, Rectisol);
Pressure swing adsorption (PSA); and,
Cryogenic separation processes.
Selection of the appropriate process is dependent on a number of factors including end use
specification, gas inlet pressure, cost, size, weight and maintenance needs. It should be noted that
whilst these are referred to as “high purity” in this sectoral assessment, some gas treatment
processes may create streams that contain a number of trace contaminants – such as elemental
nitrogen, water, carbon monoxide and methanol – which may need to removed to avoid corrosion
during transport and injection. A brief review of each technology is provided below.
2.4.1 Membrane separation
Membranes are typically used for natural gas processing of high CO2 content natural gas at the
wellhead on offshore platforms where gas pressure will be higher and weight, size and maintenance
considerations may be an issue. Typical applications involve the use of polymer-based membranes
employing permeation processes where CO2 is absorbed into the membrane, and then diffused
through it (solution-diffusion process), although metallic or ceramic membranes may also be
employed for CO2 separation. Membrane treatment plants are available in various forms including
spiral-wound systems, tubular systems, and hollow fibre, with several plant configurations possible
to enhance the effectiveness of the process, including dual- and tri-pass systems. For high

CCS Industry Roadmap – High Purity CO2 Sources: Final Draft Sectoral Assessment
Carbon Counts Page 28
concentration CO2 streams, membrane treatment is unlikely to be able to attain high levels of CO2
removal, and additional processing using chemical or physical adsorption processes will be required.
In all cases, the pressure of the gas – and importantly the pressure difference across the membrane -
is critical to induce flow across the membrane. This makes membranes largely uneconomic for use
in flue gas CO2 capture systems.
To date, membranes have not been effective at separating hydrogen and CO2 in syngas mixtures,
and therefore have not been used in industrial hydrogen and synfuel production processes.
However, several novel membrane treatment systems are under development for syngas treatment
and preferential removal of hydrogen2.
2.4.2 Chemical solvents
Chemical solvent processes are the most widely used technology for CO2 removal in natural gas
processing. They tend to be less common for syngas clean-up, where physical sorbents offer some
advantages in terms of energy requirements. Compared to physical solvent processes, most
chemical solvent processes, in particular those based on amines, offer faster reaction temperatures
meaning smaller plant size and are able to remove CO2 at low concentrations (and partial pressures)
making them suitable for low pressure low CO2 concentration gas streams as typically encountered
in natural gas sweetening.
The basic process involves introducing the gas mixture into an absorption tower containing the
chemical solvent. Typical chemical solvent used include amines and alkanoamines and variants upon
these including hindered amines (as produced by KEPCO and MHI). The BenfieldTM process and
others involve the use of a hot potassium carbonate mixture as the sorbent, which is better suited to
gases at partial pressures >0.70 MPa to produce a high purity CO2 stream. Hot potassium carbonate
methods have been widely employed for hydrogen purification in ammonia and ethylene oxide
production. Various novel chemical solvent technologies are under research, such as the use of
chilled methanol and chilled ammonia, to remove CO2.
On entering the absorber column, CO2 is preferentially absorbed by the solvent to form salts, while
the majority of other gases present pass through the vessel. Some residual quantities of
hydrocarbon gases will also be absorbed, but can be flashed off prior to solvent regeneration. The
chemical sorbent is continuously cycled through a stripper vessel, where the salts formed in the
absorber column are decomposed by heating, usually through the use of steam, and the CO2
released from the aqueous phase and made available for compression, transport and storage or
venting to atmosphere. The resulting regenerated solvent is recycled back to the absorber column
in a continuous cycle (Figure 11).
2 For example, the Hysep thin-film palladium membrane system under development by the Energy research
Centre of the Netherlands (ECN), described at: http://www.hysep.com/ or systems under development by the Membrane Technology and Research group, described at: http://www.mtrinc.com/hydrogen_separation_in_syngas_processes.html

CCS Industry Roadmap – High Purity CO2 Sources: Final Draft Sectoral Assessment
Carbon Counts Page 29
Figure 11 Generalised schematic for CO2 separation using sorbents/solvents
A range of different technologies are available on the market, employing different types of chemical
solvents (Table 9). Combinations with membranes are also under development, where a membrane
is included in the absorber column.
The main technical challenges posed by chemical absorption technologies are the heat requirements
for solvent regeneration and the energy requirements for cycling the solvent between the two
treatment stages and other auxiliary power uses such as blowers to move low pressure gas around
the plant.
Table 9 Common solvents used for natural gas sweetening and syngas clean-up
Solvent name Type Chemical name Vendors
Rectisol Physical Methanol Lurgi and Linde, Germany Lotepro Corporation, USA
Purisol Physical N-methyl-2-pyrolidone (NMP) Lurgi, Germany
Selexol Physical Dimethyl ethers of polyethylene glycol (DMPEG)
Union Carbide, USA
Benfield Giammarco-Vetrocoke Catacarb
Chemical Potassium carbonate UOP Giammarco-Vetrocoke Eickmeyer & Associates
MEA Chemical Monoethanolamine Various
MDEA Chemical Methyldiethylamine BASF and others
Sulfinol Chemical Tetrahydrothiophene1,1-dioxide (Sulfolane), an alkaloamine and water
Shell
Source: Metz et al. 2005
ABSORBER COLUMNCO2 capture
CO2
STRIPPER VESSELSorbent regeneration
Spent sorbentGas mixture incl. CO2
Gas mixture excl. CO2
Sorbent+CO2
Regenerated sorbent
Sorbent make-up

CCS Industry Roadmap – High Purity CO2 Sources: Final Draft Sectoral Assessment
Carbon Counts Page 30
2.4.3 Physical sorbents
Physical solvent-based processes are better suited to gas streams which have high partial pressures
(>0.35 MPa) and/or total pressure in order to ensure effective absorption of CO2 in the gas mixture
to the physical sorption chemicals (see Table 8). They are widely used to separate CO2 and H2 from
syngas mixtures in industrial hydrogen production and synthetic fuel production, but less common in
natural gas sweetening operations. The latter is a result of the generally lower CO2 partial pressures
in natural gas sweetening and the propensity of heavier hydrocarbon fractions (C3+) to also be
absorbed, leading to hydrocarbon losses.
The basic process is similar to that employed for chemical sorbents (Figure 11), with the main
difference being (a) the way in which the CO2 is absorbed, which utilises weak physical bonds as
opposed to chemical bonds used for chemical solvents; and (b) as a consequence, the way in which
the physical sorbent releases the CO2 and is regenerated, usually involving pressure release and less
commonly temperature swing. The alternative absorption and regeneration route offered by
physical solvent-based processes offers reductions in energy requirements compared to chemical
processes.
The range of solvents and processes available are highlighted in Table 9.
2.4.4 Pressure swing adsorption
Pressure swing adsorption (PSA) is commonly used for treatment of syngas to produce high purity H2
in ammonia plants and refineries. However, it is not able to selectively separate CO2 from gas
mixtures meaning that the tail gas stream may only consist 30-40% CO2, and additional treatments
must be applied to deliver a high purity CO2 stream. In most systems, the tail gases exiting the final
stage is a lean mixture of H2 and CO2, which can be used in a waste heat recovery boiler to raise
steam on-site. This makes recovery of all of the CO2 produced more complex.
The PSA process works on the basis that gases absorb to solid surfaces when under pressure; the
higher the pressure, the more gas that is adsorbed, and when the pressure is reduced, the gas
desorbs. A generalised configuration for a PSA plant involves a 4-step cycled process of (a) a
pressurisation step, where syngas feed is pressurised, (b) an adsorption step, where CO2 is adsorbed
to the packing media whilst the product gas is released from the vessel in gas phase (c)
depressurisation, which releases the CO2 from the adsorption media and (d) further purging of the
vessel to regenerate the adsorption media (Figure 12). Typical adsorbents used in PSA plants include
alumina, zeolites and activated carbon.

CCS Industry Roadmap – High Purity CO2 Sources: Final Draft Sectoral Assessment
Carbon Counts Page 31
Figure 12 Generalised schematic for pressure swing adsorption processes
A range of vendors offer PSA plant for syngas treatment and H2 separation. A number of PSA plants
are reported to be in operation in the ammonia industry3, although precise numbers are not
currently available. The lower concentration of CO2 in the tail gas from PSA plants could have
implications on the overall efficacy and cost of applying CCS at this type of plant, as they would likely
require an additional CO2 separation step to produce CO2 suitable for compression transport and
storage.
2.4.5 Cryogenic separation processes
Cryogenic CO2 separation is a possible means of removing CO2 from gas mixtures, as typically applied
for separating oxygen from air (cryogenic air separation). In terms of CO2 removal, the Ryan/Holmes
process has received most commercial interest, and is currently in use in several commercial
operations, including for the separation of “breakthrough”4 CO2 from gas mixtures in enhanced oil
recovery operations (EOR; Garner, 2008). It involves the use of a distillation column into which the
gas mixture is introduced at the base; as it migrates up through the column it is progressively cooled
and various fractions are separated out at different heights and dew points. A fairly high purity CO2
stream can be achieved using this technique.
ExxonMobil has also been developing a technique for cryogenic gas separation since the 1980’s,
termed Controlled Freeze Zone (CFZ), and has recently piloted it at its LaBarge gas processing plant
in Wyoming, USA. It expects CFZ to offer a low cost alternative method to develop gas which is high
in impurities (ExxonMobil, undated).
To date, cryogenic separation techniques for CO2 removal from gas mixtures have not achieved
widespread commercial deployment.
3 For example, the Linde Ammonia Concept (LAC) plant, which utilises PSA to separate H2 from syngas.
4 Breakthrough CO2 is injected CO2 that re-emerges with produced hydrocarbons in CO2-EOR operations.
STAGE 1
Pressurisation
Gas mixture incl. CO2
Product out e.g. H2
STAGE 2
Adsorption
STAGE 3
Depressurisation
STAGE 4
Regeneration
CO2 out
Purge gas e.g. product
Tail gas. To head of plant or waste heat boiler
Composition:• 30-60% CO2
• 40-70% others

CCS Industry Roadmap – High Purity CO2 Sources: Final Draft Sectoral Assessment
Carbon Counts Page 32
3 EMISSIONS SOURCES, BASELINE AND FUTURE EMISSIONS
Estimates of the current level of worldwide CO2 emissions for the high purity CO2 sectors falling
within the scope of this study have been presented previously (Figure 1). The sector and source
streams under study, however, suffer from extremely limited data availability, making precise
estimates of current emissions extremely challenging. Therefore, the data presented in Figure 1 is
subject to significant uncertainty, as outlined in the following section.
It is also important to note that the scope of this assessment is focussed on only the high purity
source streams that are associated with the process emissions from the activities described in
Section 2. Combustion emission sources or other types of CO2 emissions are not reviewed in this
Section and are excluded from the emissions estimates provided.
As the focus is on process source streams, the potential abatement measures available to reduce
emissions across the sector have not been considered in depth because the range of potential
abatement measures will be limited. Whilst there may be scope to optimise certain techniques such
as industrial hydrogen production within certain industrial activities, in general, the only way to
reduce emissions from process sources streams is to move to alternative production methods (e.g.
feedstock switching in ammonia production) or substitute product demand to less carbon intensive
product sources (e.g. greater use of organic fertilisers to replace mineral derived products). These
alternatives have not been considered here as significantly greater research is required to develop a
scenario under which reasoned assessment of the likelihood of such changes occurring can be made,
a task which is beyond the scope of this assessment.
3.1 Current emissions from high purity sources
Based on the estimates described below, the high purity CO2 sector currently generates around 430
MtCO2 per year, which is equal to around 6% of global industrial CO2 emissions (IEA, 2009, which
excludes emissions from fuel transformation). This represents an approximate central estimate
developed using various assumptions about current production activities in the sectors, as described
in Section 2.
Not all of this CO2 is available for CCS today. Around 117 MtCO2 generated during ammonia
production is utilised in other ways, principally for urea production and in CO2-EOR operations
(Section 2.2.2). Similarly, some 3-4 MtCO2 from coal gasification and natural gas processing is also
used in CO2-EOR operations, whilst some natural gas processors are already injecting and storing
around 2-3 MtCO2 per year at three sites in the world (Box 1). Consequently, around 124 MtCO2
currently produced from high purity sources is already utilised, whilst around 306 MtCO2 is available
for application of CCS today (Figure 13).

CCS Industry Roadmap – High Purity CO2 Sources: Final Draft Sectoral Assessment
Carbon Counts Page 33
Figure 13 Current emissions and CO2 utilisation in high purity sectors
The following sections describe current emissions in each sector in more detail.
3.1.1 Natural gas processing
There are presently no publicly available data sources which provide information on the levels of CO2
vented from natural gas processing operations. Privately held data on estimated CO2 concentrations
in gas reservoirs around the world do exist (e.g. IHS database, see Bakker et al. 2010). However,
much of the information is proprietary and commercially sensitive. Further, no gas producers
provide detailed reporting of vented emissions from gas production, making it extremely difficult to
gain an insight into the level of emissions from these activities. In addition, the picture is further
complicated by the production profiles for gas reservoirs, which may produce varying levels of CO2
across their operational life, whilst the distribution of fields with CO2 contamination is highly
heterogeneous making generalised estimates difficult and subject to large uncertainty.
Consequently, and recognising these factors, a range of estimates have been developed adopting
both bottom-up (e.g. IEA GHG, 2008) and top-down estimates of emissions from gas
processing/sweetening operations (e.g. Metz et al. 2005; Philibert et al., 2007). Drawing on these, a
summary of estimates of current and future emissions from venting CO2 in natural gas processing is
presented below (Table 10).
124 MtCO2, 29%
306 MtCO2, 71%
High purity total = 430 MtCO2
Utilised
Emitted
111.4 MtCO2, 90%
5.2 MtCO2, 4%
4.7 MtCO2, 4%
2.8 MtCO2, 2%
Current utlisation = 124 MtCO2
Urea production
CO2-EOR from
ammonia
CO2-EOR from gas
processing
CCS
CCS Industry Roadmap – High Purity CO2 Sources: Final Draft Sectoral Assessment
Carbon Counts Page 34
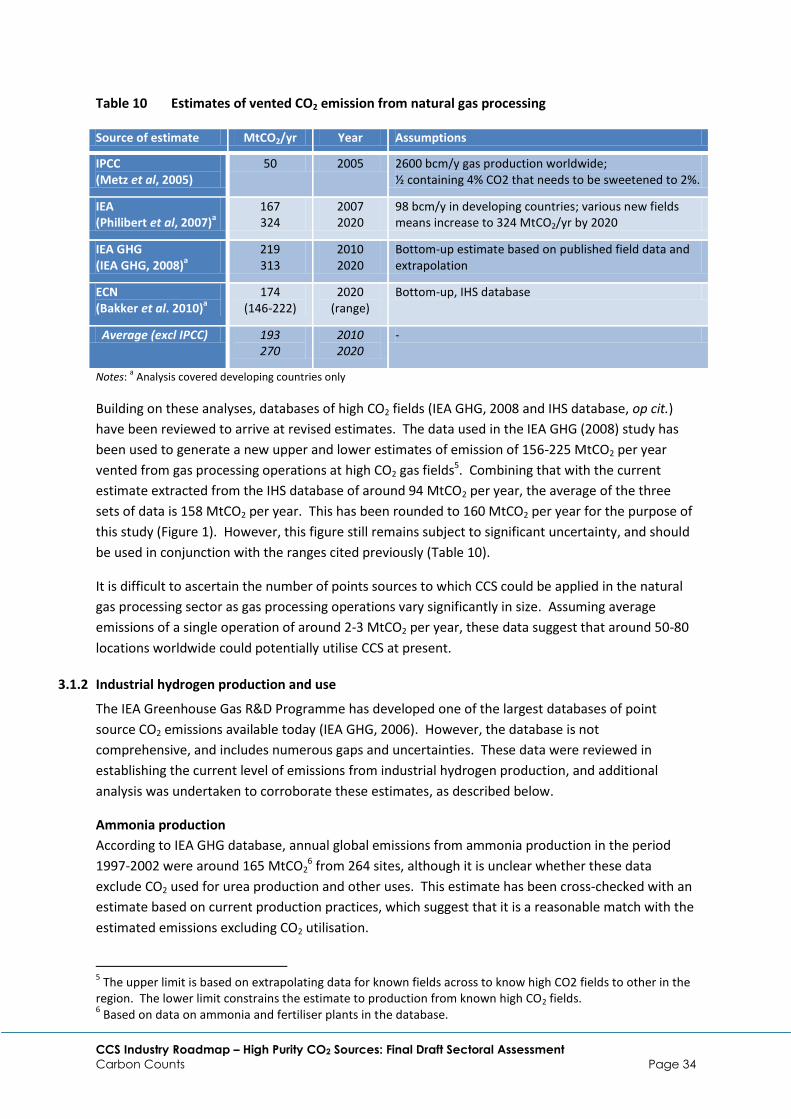
Table 10 Estimates of vented CO2 emission from natural gas processing
Source of estimate MtCO2/yr Year Assumptions
IPCC (Metz et al, 2005)
50 2005 2600 bcm/y gas production worldwide; ½ containing 4% CO2 that needs to be sweetened to 2%.
IEA (Philibert et al, 2007)
a
167 324
2007 2020
98 bcm/y in developing countries; various new fields means increase to 324 MtCO2/yr by 2020
IEA GHG (IEA GHG, 2008)
a
219 313
2010 2020
Bottom-up estimate based on published field data and extrapolation
ECN (Bakker et al. 2010)
a 174
(146-222) 2020
(range) Bottom-up, IHS database
Average (excl IPCC) 193 270
2010 2020
-
Notes: a Analysis covered developing countries only
Building on these analyses, databases of high CO2 fields (IEA GHG, 2008 and IHS database, op cit.)
have been reviewed to arrive at revised estimates. The data used in the IEA GHG (2008) study has
been used to generate a new upper and lower estimates of emission of 156-225 MtCO2 per year
vented from gas processing operations at high CO2 gas fields5. Combining that with the current
estimate extracted from the IHS database of around 94 MtCO2 per year, the average of the three
sets of data is 158 MtCO2 per year. This has been rounded to 160 MtCO2 per year for the purpose of
this study (Figure 1). However, this figure still remains subject to significant uncertainty, and should
be used in conjunction with the ranges cited previously (Table 10).
It is difficult to ascertain the number of points sources to which CCS could be applied in the natural
gas processing sector as gas processing operations vary significantly in size. Assuming average
emissions of a single operation of around 2-3 MtCO2 per year, these data suggest that around 50-80
locations worldwide could potentially utilise CCS at present.
3.1.2 Industrial hydrogen production and use
The IEA Greenhouse Gas R&D Programme has developed one of the largest databases of point
source CO2 emissions available today (IEA GHG, 2006). However, the database is not
comprehensive, and includes numerous gaps and uncertainties. These data were reviewed in
establishing the current level of emissions from industrial hydrogen production, and additional
analysis was undertaken to corroborate these estimates, as described below.
Ammonia production
According to IEA GHG database, annual global emissions from ammonia production in the period
1997-2002 were around 165 MtCO26 from 264 sites, although it is unclear whether these data
exclude CO2 used for urea production and other uses. This estimate has been cross-checked with an
estimate based on current production practices, which suggest that it is a reasonable match with the
estimated emissions excluding CO2 utilisation.
5 The upper limit is based on extrapolating data for known fields across to know high CO2 fields to other in the
region. The lower limit constrains the estimate to production from known high CO2 fields. 6 Based on data on ammonia and fertiliser plants in the database.
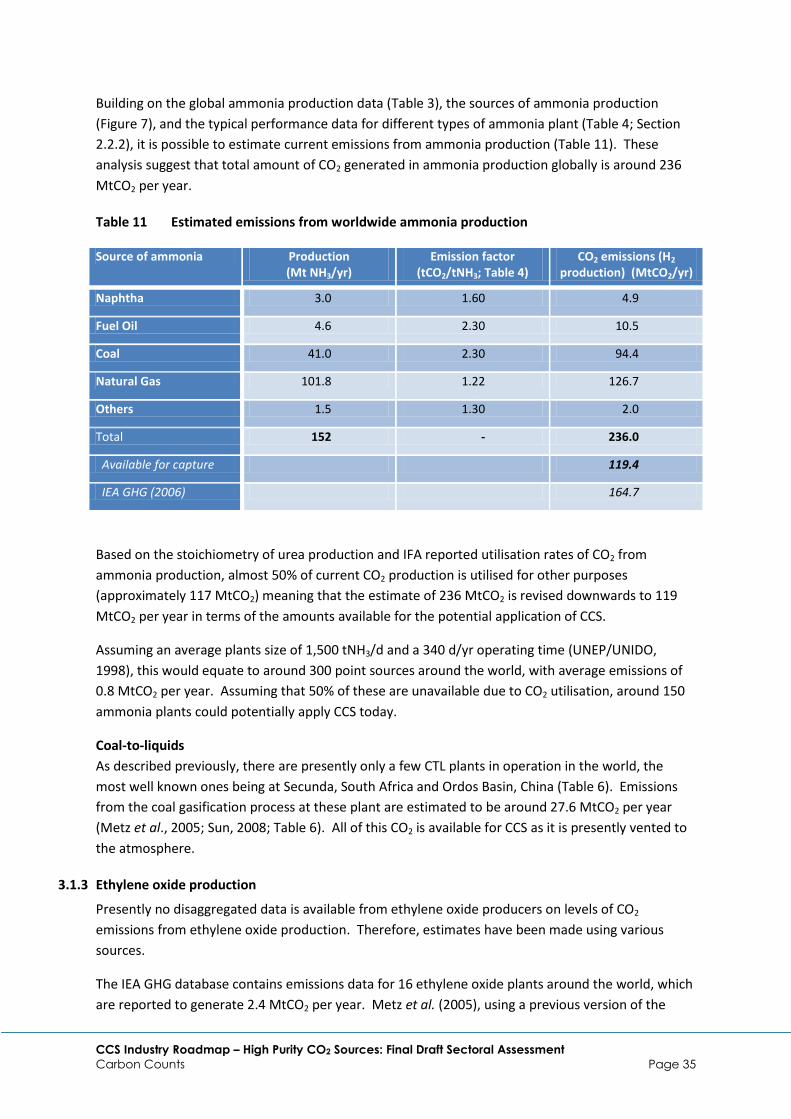
CCS Industry Roadmap – High Purity CO2 Sources: Final Draft Sectoral Assessment
Carbon Counts Page 35
Building on the global ammonia production data (Table 3), the sources of ammonia production
(Figure 7), and the typical performance data for different types of ammonia plant (Table 4; Section
2.2.2), it is possible to estimate current emissions from ammonia production (Table 11). These
analysis suggest that total amount of CO2 generated in ammonia production globally is around 236
MtCO2 per year.
Table 11 Estimated emissions from worldwide ammonia production
Source of ammonia Production (Mt NH3/yr)
Emission factor (tCO2/tNH3; Table 4)
CO2 emissions (H2 production) (MtCO2/yr)
Naphtha 3.0 1.60 4.9
Fuel Oil 4.6 2.30 10.5
Coal 41.0 2.30 94.4
Natural Gas 101.8 1.22 126.7
Others 1.5 1.30 2.0
Total 152 - 236.0
Available for capture 119.4
IEA GHG (2006) 164.7
Based on the stoichiometry of urea production and IFA reported utilisation rates of CO2 from
ammonia production, almost 50% of current CO2 production is utilised for other purposes
(approximately 117 MtCO2) meaning that the estimate of 236 MtCO2 is revised downwards to 119
MtCO2 per year in terms of the amounts available for the potential application of CCS.
Assuming an average plants size of 1,500 tNH3/d and a 340 d/yr operating time (UNEP/UNIDO,
1998), this would equate to around 300 point sources around the world, with average emissions of
0.8 MtCO2 per year. Assuming that 50% of these are unavailable due to CO2 utilisation, around 150
ammonia plants could potentially apply CCS today.
Coal-to-liquids
As described previously, there are presently only a few CTL plants in operation in the world, the
most well known ones being at Secunda, South Africa and Ordos Basin, China (Table 6). Emissions
from the coal gasification process at these plant are estimated to be around 27.6 MtCO2 per year
(Metz et al., 2005; Sun, 2008; Table 6). All of this CO2 is available for CCS as it is presently vented to
the atmosphere.
3.1.3 Ethylene oxide production
Presently no disaggregated data is available from ethylene oxide producers on levels of CO2
emissions from ethylene oxide production. Therefore, estimates have been made using various
sources.
The IEA GHG database contains emissions data for 16 ethylene oxide plants around the world, which
are reported to generate 2.4 MtCO2 per year. Metz et al. (2005), using a previous version of the

CCS Industry Roadmap – High Purity CO2 Sources: Final Draft Sectoral Assessment
Carbon Counts Page 36
same database, provide figures of 17 plants emitting a total 3 MtCO2 per year. Neither of these
estimates appears consistent with the estimated number of producers worldwide, which is
estimated to exceed 52 worldwide (Table 7). This may be due to some ethylene oxide plants being
integrated with ethylene plants and ethylene glycol plants, and thus captured elsewhere in the IEA
GHG database.
Given the uncertainty over these estimates, as an alternative it is possible to estimate emissions
based on the chemistry of the underlying production process. In this context, the stiochiometry of
ethylene oxide production using the direct oxidation method is given as:
7 CH2=CH2 + 6 O2 → 6 (CH2CH2)O + 2 CO2 + 2 H2O (Kilty and Sachtler, 1974)
This suggests that the ratio of ethylene oxide to CO2 generation is 6/27, meaning that for every tonne
of ethylene oxide produced, 0.33 tCO2 are generated. Therefore, for an annual production of 19
million tonnes (Table 7), 6.3 MtCO2 would be generated. This data would mean that for 52
production sites worldwide, average emissions would be 0.12 MtCO2 per year, which is in line with
estimates of typical emissions from ethylene oxide plant, and consistent with those included in the
IEA GHG database, which has an average emissions per plant of 150,000 tonnes CO2 per year.
Based on the analysis described in the previous sections, current emissions from the high purity CO2
sector are summarised below (Figure 14).
Figure 14 Summary of estimated current CO2 emission from high purity sources
7 Note: the molar weight of ethylene oxide is 44.05 g mol
-1, almost identical to carbon dioxide at 44.01 g mol
-1.
160.0 MtCO2, 37.2%
236.0 MtCO2, 54.9%
6.3 MtCO2, 1.5%
27.6 MtCO2, 6.4%
High purity total = 430 MtCO2
Gas Processing
Ammonia
Ethylene oxide
Coal-to-liquids
119.4 MtCO2 is available for CCS (27.8%)

CCS Industry Roadmap – High Purity CO2 Sources: Final Draft Sectoral Assessment
Carbon Counts Page 37
3.2 Future emissions from high purity sectors
The previous section highlighted the uncertainties in estimating current emissions from high purity
CO2 sources. Making projections for emissions from these sectors is even more challenging given
the uncertainty over a number of factors.
The major sources of uncertainty relate to the following factors:
Changes in demand for products – for example reduce demand for ethylene oxide in the
global chemicals industry;
The scope for product substitution – for example substitution of natural gas by SNG or other
forms of energy;
Changes in product delivery methods - for example, a shift to more LNG and GTL in natural
gas supply chains, which could result in higher emissions at gas processing plant (Figure 4);
Changes in input quality for some processes – in particular, in relation to changes in the
quality of natural gas and the effects that this may have on levels of CO2 removal in natural
gas processing;
Changes in production processes – for example, changes in the way hydrogen is synthesized,
including shifting towards greater use of electrolysis, especially from renewable energy
sources, and
Stock turnover in production plant - which should deliver improved efficiency of production
processes.
It has not been possible to undertake a full assessment of all of these factors for each sector within
this study. That would involve development of a more detailed scenario based analysis than has
been possible.
However, it has been possible to make an extrapolation of CO2 emissions for the sectors drawing on
estimated production forecasts as described in Section 2, and the emissions intensity of production
derived from Section 3. The results of this analysis and the supporting assumptions are shown below
(Figure 15).
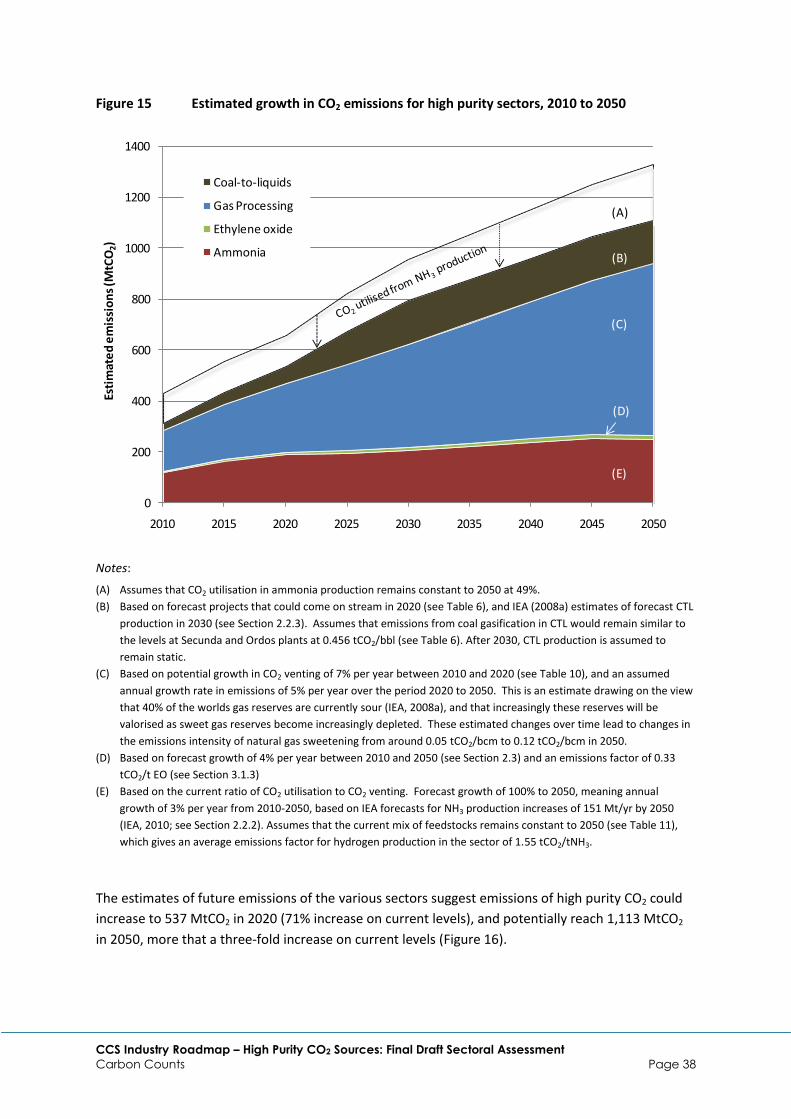
CCS Industry Roadmap – High Purity CO2 Sources: Final Draft Sectoral Assessment
Carbon Counts Page 38
Figure 15 Estimated growth in CO2 emissions for high purity sectors, 2010 to 2050
Notes:
(A) Assumes that CO2 utilisation in ammonia production remains constant to 2050 at 49%.
(B) Based on forecast projects that could come on stream in 2020 (see Table 6), and IEA (2008a) estimates of forecast CTL
production in 2030 (see Section 2.2.3). Assumes that emissions from coal gasification in CTL would remain similar to
the levels at Secunda and Ordos plants at 0.456 tCO2/bbl (see Table 6). After 2030, CTL production is assumed to
remain static.
(C) Based on potential growth in CO2 venting of 7% per year between 2010 and 2020 (see Table 10), and an assumed
annual growth rate in emissions of 5% per year over the period 2020 to 2050. This is an estimate drawing on the view
that 40% of the worlds gas reserves are currently sour (IEA, 2008a), and that increasingly these reserves will be
valorised as sweet gas reserves become increasingly depleted. These estimated changes over time lead to changes in
the emissions intensity of natural gas sweetening from around 0.05 tCO2/bcm to 0.12 tCO2/bcm in 2050.
(D) Based on forecast growth of 4% per year between 2010 and 2050 (see Section 2.3) and an emissions factor of 0.33
tCO2/t EO (see Section 3.1.3)
(E) Based on the current ratio of CO2 utilisation to CO2 venting. Forecast growth of 100% to 2050, meaning annual
growth of 3% per year from 2010-2050, based on IEA forecasts for NH3 production increases of 151 Mt/yr by 2050
(IEA, 2010; see Section 2.2.2). Assumes that the current mix of feedstocks remains constant to 2050 (see Table 11),
which gives an average emissions factor for hydrogen production in the sector of 1.55 tCO2/tNH3.
The estimates of future emissions of the various sectors suggest emissions of high purity CO2 could
increase to 537 MtCO2 in 2020 (71% increase on current levels), and potentially reach 1,113 MtCO2
in 2050, more that a three-fold increase on current levels (Figure 16).
0
200
400
600
800
1000
1200
1400
2010 2015 2020 2025 2030 2035 2040 2045 2050
Esti
mat
ed
em
issi
on
s (M
tCO
2)
Coal-to-liquids
Gas Processing
Ethylene oxide
Ammonia
(A)
(B)
(D)
(C)
(E)
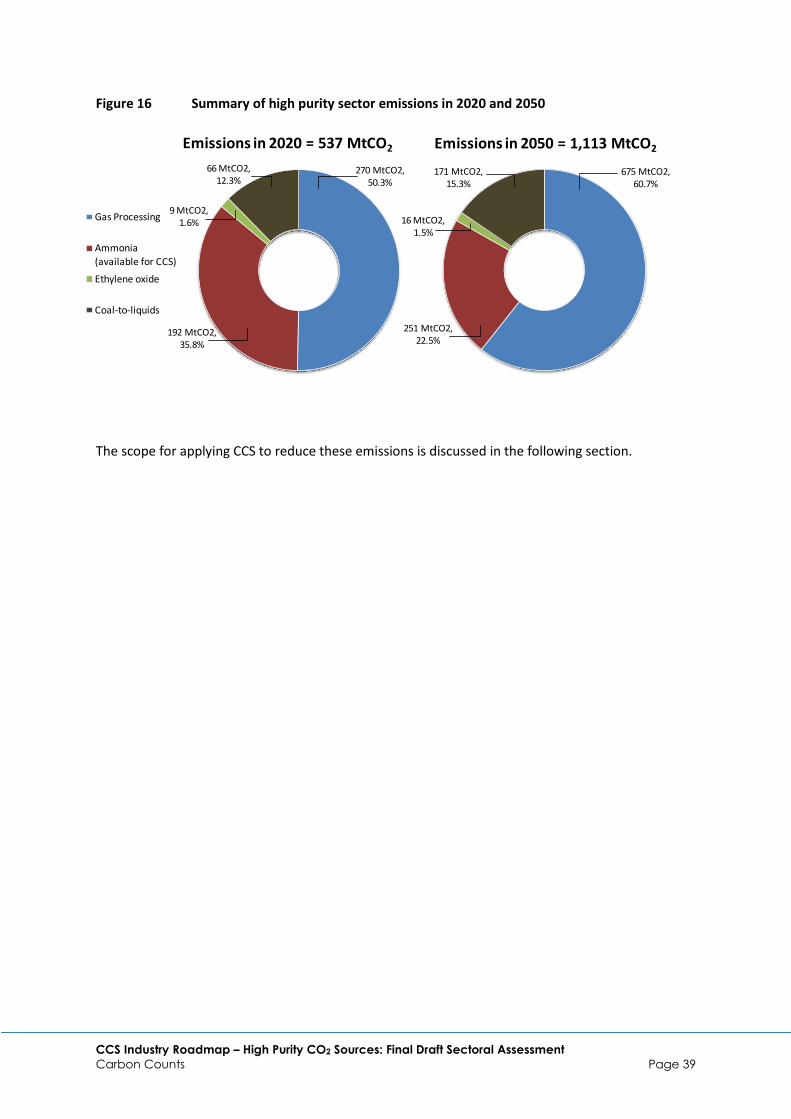
CCS Industry Roadmap – High Purity CO2 Sources: Final Draft Sectoral Assessment
Carbon Counts Page 39
Figure 16 Summary of high purity sector emissions in 2020 and 2050
The scope for applying CCS to reduce these emissions is discussed in the following section.
270 MtCO2, 50.3%
192 MtCO2, 35.8%
9 MtCO2, 1.6%
66 MtCO2, 12.3%
Emissions in 2020 = 537 MtCO2
Gas Processing
Ammonia
(available for CCS)
Ethylene oxide
Coal-to-liquids
675 MtCO2, 60.7%
251 MtCO2, 22.5%
16 MtCO2, 1.5%
171 MtCO2, 15.3%
Emissions in 2050 = 1,113 MtCO2

CCS Industry Roadmap – High Purity CO2 Sources: Final Draft Sectoral Assessment
Carbon Counts Page 40
4 CO2 CAPTURE AND STORAGE
4.1 Current activities
4.1.1 Natural gas processing
Capturing and storing CO2 from high-CO2 content natural gas field presents some of the least cost
‘earliest opportunities’ for large-scale deployment of integrated CCS projects across a number of
world regions. Gas processing facilities typically have access to in situ or close proximity storage
sites of known geological characteristics and there is a considerable skills and knowledge base within
the oil and gas industry required to undertake large commercial-scale projects. There are currently
five fully integrated, commercial-scale CCS projects in operation worldwide, of which four are
associated with the separation of CO2 from natural gas and one from coal-based SNG production
(Box 1).
The Sleipner and Snøhvit (Norway) and In Salah (Algeria) projects involve the stripping of CO2 from
high-CO2 content natural gas to achieve sales-grade quality natural gas. The CO2 is stripped,
collected and stored securely in underground geological formations. The Rangely project (United
States) also uses CO2 captured from natural gas processing at the ExxonMobil LaBarge gas plant in
Wyoming, but uses the CO2 for enhanced oil recovery (EOR) and storage at the Rangely field in
Colorado.
ChevronTexaco is currently in the final planning phases for one of the largest CCS projects in the
world involving capturing CO2 from the Gorgon natural gas field located 130km off the north-west
coast of Western Australia. The project comprises the establishment of a gas processing and LNG
facility on Barrow Island, which lies directly between the gas fields and the Australian mainland. The
Gorgon natural gas reservoirs contain naturally occurring CO2 levels of approximately 14%, which
requires removal before the gas can be liquefied. The removal is necessary as CO2 would freeze in
the LNG process, potentially damaging the equipment. Current standard practice by all operating
LNG facilities worldwide is to vent this CO2 to the atmosphere. Chevron have proposed that over 3.4
million tonnes of CO2 per year will be injected into the Dupuy saline reservoir beneath the north end
of Barrow Island. A re-injection facility to store CO2 beneath Barrow Island would be sized to
accommodate the full stream of separated reservoir CO2. Re-injection would commence as soon as
practicable after the gas processing facilities commissioning and start-up process. All studies
undertaken to date by the Gorgon joint venture indicate that re-injection is technically feasible and
the joint venture is committed to re-inject reservoir CO2 unless it is proven to be technically
infeasible or cost-prohibitive. Final approval for the development was granted in August 2009, and it
is predicted that customers in Western Australia will begin to be supplied from 2015 (IEA GHG,
2006).

CCS Industry Roadmap – High Purity CO2 Sources: Final Draft Sectoral Assessment
Carbon Counts Page 41
Box 1. Summary of existing CCS projects worldwide
Source: (IEA/CSLF, 2010)
Five fully-integrated, large scale CCS projects are in commercial operation today. Four projects – Sleipner, In
Salah, Snøhvit and Rangeley – inject CO2 from a natural gas production facility where it is separated from the
natural gas and sent to market. In the first three cases, the CO2 is injected into saline aquifers, while in the
fourth it is used for enhance oil recovery (EOR). A fifth project captures CO2 at the Great Plains Synfuels plant
and transports it for EOR to the Weyburn-Midale Project. All five are contributing to the knowledge base
needed for widespread CCS use.
Sleipner. The Sleipner project began in 1996 when Norway’s Statoil began injecting more than 1 million
tonnes a year of CO2 under the North Sea. This CO2 was extracted with natural gas from the offshore Sleipner
gas field. In order to avoid a government‐imposed carbon tax equivalent to about USD 55/tonne, Statoil built
a special offshore platform to separate CO2 from other gases. The CO2 is re-injected about 1km below the sea
floor into the Utsira saline formation located near the natural gas field. The formation is estimated to have a
capacity of about 600 billion tonnes of CO2, and is expected to continue receiving CO2 long after natural gas
extraction at Sleipner has ended.
In Salah. In August 2004, Sonatrach, the Algerian national oil and gas company, with partners BP and
Statoil, began injecting about 1 million tonnes per year of CO2 into the Krechba geologic formation near
their natural gas extraction site in the Sahara Desert. The Krechba formation lies 1, 800 metres below
ground and is expected to receive 17 million tonnes of CO2 over the life of the project.
Snøhvit. Europe’s first liquefied natural gas (LNG) plant also captures CO2 for injection and storage. Statoil
extracts natural gas and CO2 from the offshore Snøhvit gas field in the Barents Sea. It pipes the mixture 160
kilometres to shore for processing at its LNG plant near Hammerfest, Europe’s northernmost town.
Separating the CO2 is necessary to produce LNG and the Snøhvit project captures about 700,000 tonnes a
year of CO2. Starting in 2008, the captured CO2 is piped back to the offshore platform and injected in the
Tubåsen sandstone formation 2,600 metres under the seabed and below the geologic formation from which
natural gas is produced.
Rangely. The Rangely CO2 Project has been using CO2 for enhanced oil recovery since 1986. The Rangely
Weber Sand Unit is the largest oilfield in the Rocky Mountain region and was discovered in 1933. Gas is
separated and re-injected with CO2 from the LaBarge field in Wyoming. Since 1986, approximately 23‐25
million tonnes of CO2 have been stored in the reservoir. Computer modelling suggests nearly all of it is
dissolved in the formation water as aqueous CO2 and bicarbonate.
Weyburn‐Midale. About 2.8 million tonnes per year of CO2 are captured at the Great Plains Synfuels Plant in
the US State of North Dakota, a coal gasification plant that produces synthetic natural gas and various
chemicals. The CO2 is transported by pipeline 320 kilometres (200 miles) across the international border into
Saskatchewan, Canada and injected into depleting oil fields where it is used for EOR. Although it is a
commercial project, researchers from around the world have been monitoring the injected CO2. The IEA
Greenhouse Gas R&D Programme’s Weyburn‐Midale CO2 Monitoring and Storage Project was the first
project to scientifically study and monitor the underground behaviour of CO2. Canada’s Petroleum
Technologies Research Centre manages the monitoring effort. This effort is now in the second and final
phase (2007‐2011), of building the necessary framework to encourage global implementation of CO2
geological storage. The project will produce a best‐practices manual for carbon injection and storage.

CCS Industry Roadmap – High Purity CO2 Sources: Final Draft Sectoral Assessment
Carbon Counts Page 42
In addition to the projects described previously, there are several proposed projects at different
stages of development involving the capture and storage of CO2 from natural gas facilities. Other
proposed CCS projects at less advanced stages of development include (IEA/CSLF, 2010):
Browse LNG Development (Western Australia). The proposed CCS project would process gas
from three natural gas fields over 400 km offshore from Broome in Western Australia. The
Browse Joint Venture comprises Woodside Energy, BHP Billiton, BP, Chevron and Shell.
Front End Engineering and Design (FEED) studies are expected to be undertaken in 2011 to
enable a Final Investment Decision by mid-2012. The project is expected to capture up to 3
MtCO2 per year and commence operation in 2017.
Fort Nelson CCS Project (British Columbia, Canada). The project proposes to capture CO2
from Spectra’s Fort Nelson natural gas processing plant and store it in the deep saline
formations of the Western Canadian Sedimentary Basin. The Fort Nelson CCS Project is a
partnership initiative of Spectra Energy Transmission, the Energy & Environmental Research
Center Plains CO2 Reduction Partnership, the Province of British Columbia, and the
Government of Canada. The project is expected to initially capture 1.2 MtCO2 from a
demonstration plant in operation from 2010 to 2017 followed by an increased annual
capture of 2.2 MtCO2.
Occidental CCS Plant (Texas, United States). In June 2008 Occidental Petroleum and
SandRidge Energy announced plans to build a $1.1 billion natural gas processing and carbon
capture plant in west Texas. The CO2 is planned to be used in an EOR project. The gas
processing plant combined with the existing SandRidge gas processing plants could provide
over 8 MtCO2 per year for capture. A new 160-mile long pipeline will be constructed from
the plant, through McCamey, Texas, to the industry CO2 hub in Denver City, Texas.
4.1.2 Industrial hydrogen production and use
Ammonia & fertiliser production
CO2 is routinely captured from ammonia plants for use in the production of urea and nitro-
phosphates, often within the same integrated plant. Where demand for the CO2 stream does not
exist - either from urea or other nearby industrial production activities - the emissions are routinely
vented to atmosphere. The Enid Fertilizer plant in Oklahoma, United States, operated by the Koch
Nitrogen Company has captured over 600,000 tCO2 per year since 2003 for use in EOR and a CCS
project is being proposed at the Coffeyville Resources petroleum coke gasification-based ammonia
and urea ammonium nitrate production facility in Kansas. The project will also capture around
600,000 tCO2 per year for use in domestic EOR and/or geological storage (Blue Source media release,
21 August 2007).
In addition, the Indian fertilizer industry has begun capturing CO2 from flue gases to meet CO2
demand at natural gas-based ammonia-urea production plants. This is because the use of natural
gas as feedstock does not provide sufficient amounts of CO2 as required for urea production.
Consequently, the use of a Carbon Dioxide Recovery Plant (CDR) for the capture of CO2 from flue
gases emitted from existing fossil fuel combustion sources has been employed. Several of these

CCS Industry Roadmap – High Purity CO2 Sources: Final Draft Sectoral Assessment
Carbon Counts Page 43
projects have been recognised as eligible United Nations Clean Development Mechanism project
activities, based on Approved Methodology AM0050. This methodology was developed on the basis
of a proposed CDR project by the Indian Farmers Fertilizer Cooperative Ltd. The use of CDR to
supplement the CO2 balance for urea production represents an alternative to supplementing natural
gas with naphtha feedstock, which has higher carbon content and thus results in greater process CO2
emissions per unit of ammonia production.
Notwithstanding the use of ammonia derived EOR at two sites in the United States and the
emergence of CDR in the Indian fertiliser industry, there are presently no other proposals for CCS
projects in the ammonia production industry.
Coal-to-liquids production
Although no CCS projects are currently operational, several major plans to integrate CCS with CTL
production plants are under development in Australia and China. The Monash Energy CTL Project in
Victoria, Australia is a proposed project that will involve the drying and gasification of brown coal for
conversion to synthetic diesel, followed by the separation of the produced CO2 (up to 13 Mt per
year), with transport and injection into a suitable storage site. This project was originally planned to
commence in 2015 and was estimated to cost USD 6 billion to USD 7 billion. Partners involved in this
project include Monash Energy, Anglo American and Shell (IEA, 2008; CO2CRC, 2009). However, the
project has currently been postponed.
The FuturGas Project in South Australia is a joint venture between Hybrid Energy Australia and Strike
Oil to research and develop the CO2 storage component of another project which involves the
gasification of lignite for the production of synfuels. It is proposed that the CO2 (captured post-
gasification) will be stored in the Otway Basin to the south of the lignite resources. The project is
expected to begin by 2016 (Hybrid Energy, 2010).
China National Petroleum Corporation has begun construction of the nation's first potential
integrated CCS project, involving capture from the Shenhua Group's coal-to-liquid project in Ordos,
Inner Mongolia. The facility will initially be able to capture and store 100,000 tCO2 per year, with
annual capacity to be subsequently increased to 1-3 MtCO2 in two phases (China CSR, 2010). In
addition, in May 2007 Dow and Shenhua announced plans for coal-to-chemicals complex at the Yulin
chemical plant in Shaanxi Province, China. The project aims to convert coal to methanol to produce
ethylene and propylene, and could capture 5-10 MtCO2 per year by 2015 (IEA/CSLF, 2010).
Although not a CTL project, the Weyburn-Midale project in North America involves the capture of
CO2 from the Great Plains Synfuels coal-based SNG plant in North Dakota. The captured CO2 is
compressed and sent via pipeline to the Weyburn and Midale oil fields in Canada, where it is also
used for EOR as well as storage. Currently, over 5 Mt CO2/year is stored from these plants (Box 1;
IEA, 2009b).
4.1.3 Ethylene oxide production
There are no known plans to undertake capture and storage from ethylene oxide production at
present. As CO2 emissions from most existing plants are typically small (around 150-250 ktCO2 per
year) it is likely that economies of scale would preclude cost-effective capture unless emissions could
be captured as part of an integrated multi-source CCS network. Early opportunities may exist for

CCS Industry Roadmap – High Purity CO2 Sources: Final Draft Sectoral Assessment
Carbon Counts Page 44
integrated chemical complexes and larger facilities combined with ethylene and/or ethylene glycol
production.
4.2 Costs of CCS deployment
4.2.1 Costs
High purity CO2 sources represent relatively low cost CCS project opportunities because the costly
step of separating and capturing CO2 from the flue gas stream is avoided. The additional equipment
needed is likely to be limited to compressors, dryers, pumps and coolers, and depending on the
details of the project, on-site power generation to meet compressor power requirements. The cost
of transporting and storing CO2 from such sources may also be relatively low, given that candidate
plants are typically located at industrial complexes located at, or close to, coastal locations with
access to potential offshore storage sites. Ammonia and SMR hydrogen production facilities may in
some circumstances be situated in close proximity to natural gas reservoirs (for close proximity to
feedstock), whilst capture from some gas processing facilities may offer the potential for in situ CO2
injection.
Table 12 shows cost estimates of capture, transport and storage from a range of high purity
industrial CO2 sources.

CCS Industry Roadmap – High Purity CO2 Sources: Final Draft Sectoral Assessment
Carbon Counts Page 45
Table 12 CCS costs from high purity CO2 sources
Source Cost estimate (USD/tCO2)
Notes Notes
LNG plant 9 (A) Retrofit to existing LNG plant; compressed gas injected into a depleted gas field.
Offshore NGP
(deep water)
31 (A) Retrofit to existing deep water NGP facility; compressed gas injected into a depleted gas field.
Offshore NGP (shallow water)
18-21 (A) Range indicates difference in capital cost between retrofit and new-build NG plant (retrofit higher); compressed gas injected into a depleted gas field.
Onshore NGP 16-19 (A) Range indicates difference in capital cost between retrofit and new-build NG plant (retrofit higher); compressed gas injected into a depleted gas field.
Ammonia 4; 47 (B) Capture costs only; different figures indicates capture from pure CO2 stream and flue gas (8% CO2 content) respectively; data excludes cost of compression, which would add c. USD 10-15/tCO2
Hydrogen 15 (C) Capture costs only
Ethylene oxide - - No known cost studies
Coal-to-Liquids < 25 (D) Cost analysis covering liquid-only and poly-generation CTL production using Selexol
TM and
MEA capture indicates CCS is cost effective under carbon tax of USD 25/tCO2 at oil price of USD 100/bbl
Notes:
(A) IEA GHG (2008) Note: NGP = natural gas processing; all capital costs based on 2012 prices and discounted at 12.5%
over 21 years; T&S cost of service paid as gate fee by capture plant operator and reflects average cost across a range
of developing country gas fields and pipeline transport distances including in situ injection.
(B) Hendriks, C. et al (2004) Note: capital costs discounted at 10% over 25 years; EUR/tCO2 figures converted to USD/tCO2
on basis of 1 EUR: 1.3 USD
(C) Metz et al., (2005)
(D) Matripraganda, H.C. and Rubin, E. (2009)
The cost estimates for high purity CO2 sources are considerably lower than capture cost estimated
produced from studies of capture from power generation and other industrial sources (e.g. cement
kilns, refineries and iron and steel works). Previous work by the IEA GHG R&D Programme (IEA GHG,
2008) included analysis of the technical and economic potential for CCS deployment in natural gas
processing. That research suggested specific opportunities with total abatement potential in the
region 40-50 MtCO2 are present in the sector for less than USD 10 per tCO2, based on the potential
for onshore capture and in situ injection to be achievable for as low as USD5-10/tCO2. The same
study considers that abatement of around 150 MtCO2 may be available at costs of less than USD
20/tCO2, which is broadly in agreement with other studies of CCS potential in the natural gas
processing sector (e.g. IEEP, 2007; Metz et al., 2005).
CCS Industry Roadmap – High Purity CO2 Sources: Final Draft Sectoral Assessment
Carbon Counts Page 46
Other studies of full chain CCS applied to ammonia and hydrogen production (McKinsey & Company,
2009) lie in the range of EUR 30-40/tCO2 depending on retrofit or new build capture plant and
assuming a transport and storage cost of EUR 18/tCO2 abated.
Because the capture costs associated with high purity CO2 sources are typically low, the cost of
transport and storage dominate the total CCS abatement cost. <REFERENCE TO CROSS-CUTTING
TEXT ON TRANSPORT AND STORAGE COSTS>.
4.2.2 Factors influencing costs
A wide range of factors influence the cost of CCS across each component of the chain (capture,
transport and storage). Capture cost elements comprise capital investment costs and annual
operating costs, and include the following key cost variables:
Capital cost factors:
Scope of capture plant requirement - including whether additional compression is required at
the source site to enter pipeline and whether additional on-site power generation is
required.
Size of plant - with potential for economies of scale when capture is from large installations
and/or capture and compression equipment can be shared with adjacent capture sites
Retrofit vs. new build - in which the cost of integrating additional compression into a new
build plant design may result in significantly lower investment cost.
Cost of capital - which will vary by region and investment source based on required rate of
return reflected in different capital discount rates and debt repayment periods.
Reduction in equipment costs over time - as a function of technology learning over time
(likely to be limited for standard compression and dehydration units)
Project location and environment - as well as capital cost variations across world regions
(where some equipment may be procured from regional suppliers) higher engineering costs
may result in increased capital costs for offshore and remote plant locations as shown in
Table 12.
Operating cost factors:
Energy costs - which may dominate the cost of capture for high purity CO2 projects.
Depending on the size and location of the project, load requirements for compression may
be provided by electricity (from on- or off-site generation) or new build power plant. Energy
costs (electricity, fossil fuels, biomass) may vary considerably by region due to market
factors and/or energy price subsidies and may increase over the lifetime of the project.
Operation and maintenance costs (O&M) - which may vary significantly by region and project
technical details
In common with other CCS projects, the capture costs associated with high purity sources are highly-
specific to each case and are highly sensitive to a range of site, technology and regional factors
influencing the project economics.
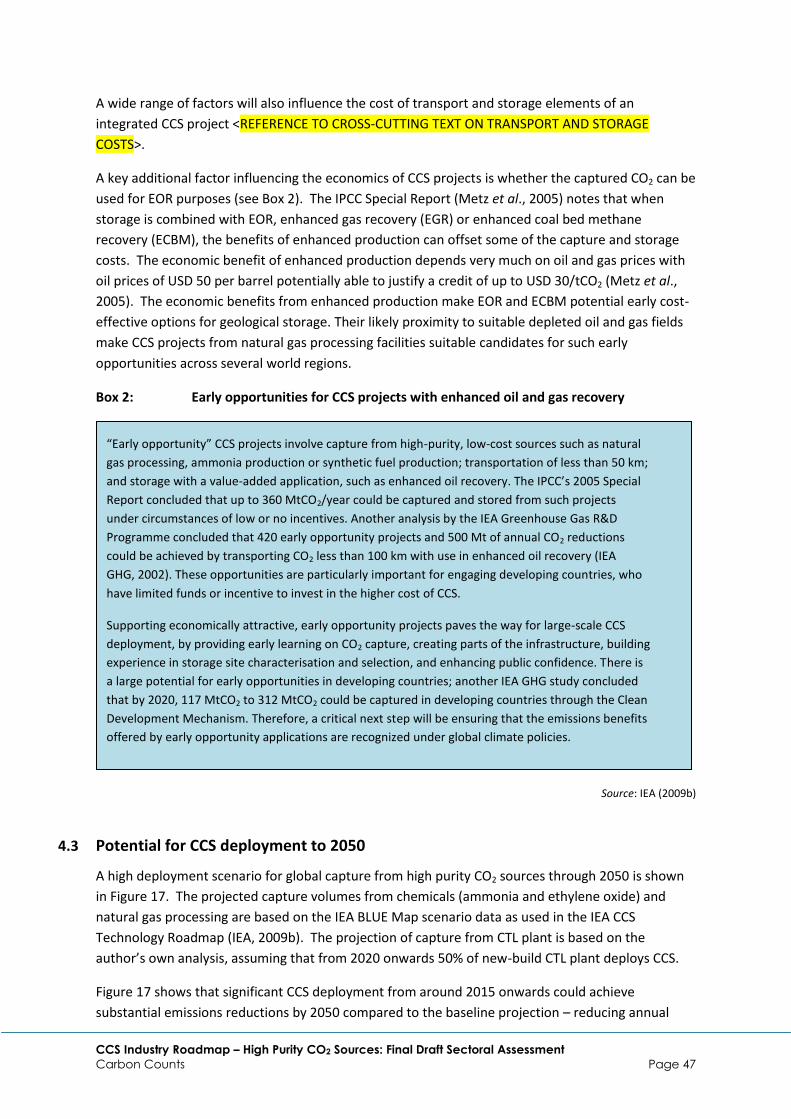
CCS Industry Roadmap – High Purity CO2 Sources: Final Draft Sectoral Assessment
Carbon Counts Page 47
A wide range of factors will also influence the cost of transport and storage elements of an
integrated CCS project <REFERENCE TO CROSS-CUTTING TEXT ON TRANSPORT AND STORAGE
COSTS>.
A key additional factor influencing the economics of CCS projects is whether the captured CO2 can be
used for EOR purposes (see Box 2). The IPCC Special Report (Metz et al., 2005) notes that when
storage is combined with EOR, enhanced gas recovery (EGR) or enhanced coal bed methane
recovery (ECBM), the benefits of enhanced production can offset some of the capture and storage
costs. The economic benefit of enhanced production depends very much on oil and gas prices with
oil prices of USD 50 per barrel potentially able to justify a credit of up to USD 30/tCO2 (Metz et al.,
2005). The economic benefits from enhanced production make EOR and ECBM potential early cost-
effective options for geological storage. Their likely proximity to suitable depleted oil and gas fields
make CCS projects from natural gas processing facilities suitable candidates for such early
opportunities across several world regions.
Box 2: Early opportunities for CCS projects with enhanced oil and gas recovery
Source: IEA (2009b)
4.3 Potential for CCS deployment to 2050
A high deployment scenario for global capture from high purity CO2 sources through 2050 is shown
in Figure 17. The projected capture volumes from chemicals (ammonia and ethylene oxide) and
natural gas processing are based on the IEA BLUE Map scenario data as used in the IEA CCS
Technology Roadmap (IEA, 2009b). The projection of capture from CTL plant is based on the
author’s own analysis, assuming that from 2020 onwards 50% of new-build CTL plant deploys CCS.
Figure 17 shows that significant CCS deployment from around 2015 onwards could achieve
substantial emissions reductions by 2050 compared to the baseline projection – reducing annual
“Early opportunity” CCS projects involve capture from high-purity, low-cost sources such as natural
gas processing, ammonia production or synthetic fuel production; transportation of less than 50 km;
and storage with a value-added application, such as enhanced oil recovery. The IPCC’s 2005 Special
Report concluded that up to 360 MtCO2/year could be captured and stored from such projects
under circumstances of low or no incentives. Another analysis by the IEA Greenhouse Gas R&D
Programme concluded that 420 early opportunity projects and 500 Mt of annual CO2 reductions
could be achieved by transporting CO2 less than 100 km with use in enhanced oil recovery (IEA
GHG, 2002). These opportunities are particularly important for engaging developing countries, who
have limited funds or incentive to invest in the higher cost of CCS.
Supporting economically attractive, early opportunity projects paves the way for large-scale CCS
deployment, by providing early learning on CO2 capture, creating parts of the infrastructure, building
experience in storage site characterisation and selection, and enhancing public confidence. There is
a large potential for early opportunities in developing countries; another IEA GHG study concluded
that by 2020, 117 MtCO2 to 312 MtCO2 could be captured in developing countries through the Clean
Development Mechanism. Therefore, a critical next step will be ensuring that the emissions benefits
offered by early opportunity applications are recognized under global climate policies.
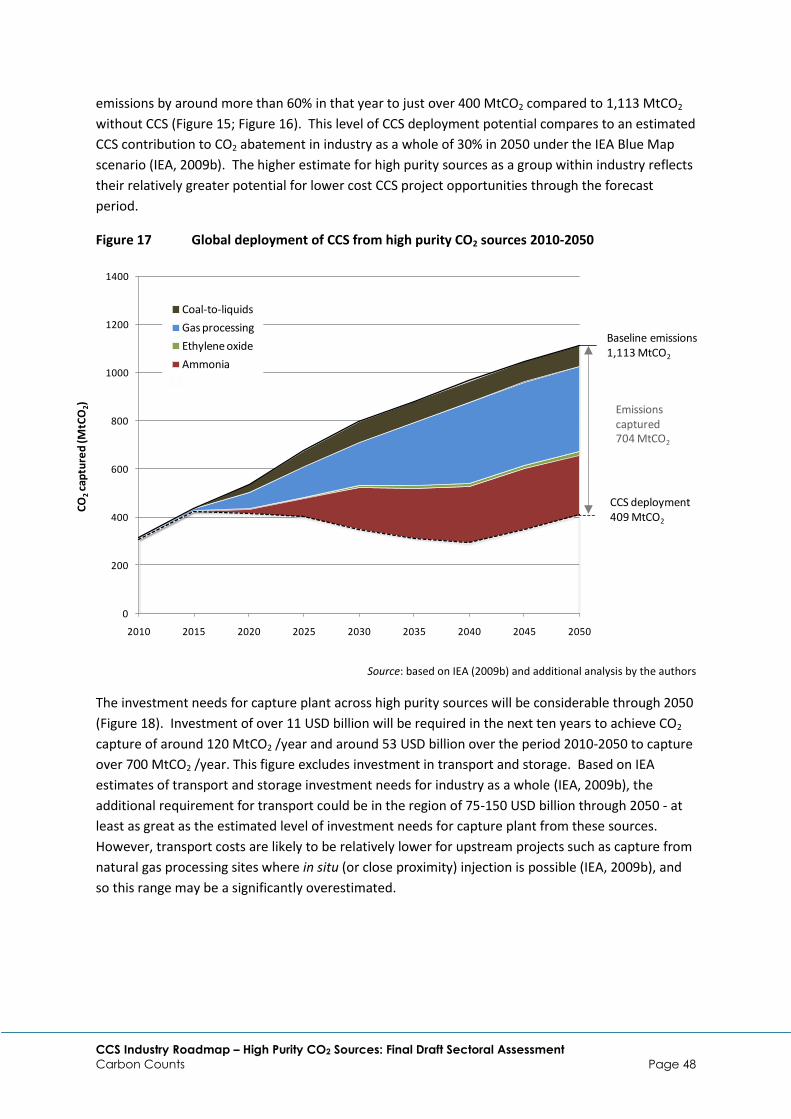
CCS Industry Roadmap – High Purity CO2 Sources: Final Draft Sectoral Assessment
Carbon Counts Page 48
emissions by around more than 60% in that year to just over 400 MtCO2 compared to 1,113 MtCO2
without CCS (Figure 15; Figure 16). This level of CCS deployment potential compares to an estimated
CCS contribution to CO2 abatement in industry as a whole of 30% in 2050 under the IEA Blue Map
scenario (IEA, 2009b). The higher estimate for high purity sources as a group within industry reflects
their relatively greater potential for lower cost CCS project opportunities through the forecast
period.
Figure 17 Global deployment of CCS from high purity CO2 sources 2010-2050
Source: based on IEA (2009b) and additional analysis by the authors
The investment needs for capture plant across high purity sources will be considerable through 2050
(Figure 18). Investment of over 11 USD billion will be required in the next ten years to achieve CO2
capture of around 120 MtCO2 /year and around 53 USD billion over the period 2010-2050 to capture
over 700 MtCO2 /year. This figure excludes investment in transport and storage. Based on IEA
estimates of transport and storage investment needs for industry as a whole (IEA, 2009b), the
additional requirement for transport could be in the region of 75-150 USD billion through 2050 - at
least as great as the estimated level of investment needs for capture plant from these sources.
However, transport costs are likely to be relatively lower for upstream projects such as capture from
natural gas processing sites where in situ (or close proximity) injection is possible (IEA, 2009b), and
so this range may be a significantly overestimated.
0
200
400
600
800
1000
1200
1400
2010 2015 2020 2025 2030 2035 2040 2045 2050
CO
2ca
ptu
red
(MtC
O2)
Coal-to-liquids
Gas processing
Ethylene oxide
Ammonia
Baseline emissions1,113 MtCO2
CCS deployment409 MtCO2
Emissions captured 704 MtCO2

CCS Industry Roadmap – High Purity CO2 Sources: Final Draft Sectoral Assessment
Carbon Counts Page 49
Figure 18 Global deployment of CCS from high purity CO2 sources
Source: based on IEA (2009b) and additional analysis by the author
The figure indicates that in the near term, over 50% of high purity CCS projects could be deployed
from capturing natural gas processing emissions. Again, their close proximity to suitable storage
sites combined with the potential for EOR activities suggests their importance as near term low cost
‘early opportunity’ for CCS demonstration and deployment. With the evolution of transport and
storage infrastructure, including optimised pipeline networks, and capture and storage hubs, an
increasing share of capture from typically smaller sources including ammonia and ethylene plants
could be possible.
The projections shown, largely based on the IEA Blue Map scenario (IEA, 2008b), are inherently
uncertain and achieving the levels of CCS deployment shown will require a wide range of financial,
regulatory and technical obstacles to be overcome - both in the next ten years when successful
demonstration of CCS across different regions and sectors is crucial, and in the longer term for
widespread commercial deployment. In addition to these uncertainties and the costs of CCS, the
sector-specific production pathways used in the analysis of capture potential must be treated with
some caution. The future production of chemicals and natural gas through 2050 will be subject to a
number of highly uncertain economic, policy and technical factors, including shifting trends in
patterns of energy use and production, as described previously (Section 3.2). For example, increased
investment in CTL plants and demand for synfuels through 2050 - being largely linked to national
energy policy objectives and expectations of future oil prices - is inherently uncertain and could
Gas
processing57%
Ammonia
14%
Ethylene
oxide1%
Coal-to-
liquids28%
Captured in 2020 (120 MtCO2/yr)
Gas
processing50%
Ammonia
36%
Ethylene oxide
2%
Coal-to-liquids12%
Captured in 2050 (704 MtCO2/yr)
Number of
projects
in 2020
Captured 2020
(MtCO2/year)
Additional
invest. 2010-
2020 (USD bn)*
Number of
projects
in 2050
Captured 2050
(MtCO2/year)
Additional
invest. 2010-
2050 (USD bn)*
Gas processing 18 69 6.4 90 353 32.7
Ammonia 10 17 0.6 181 251 8.6
Ethylene oxide 1 1 0.03 9 16 0.53
Coal-to-liquids 3 33 4.4 7 85 11.0
Total 32 120 11.4 287 704 52.8

CCS Industry Roadmap – High Purity CO2 Sources: Final Draft Sectoral Assessment
Carbon Counts Page 50
result in the CCS potential from these sources being significantly lower or higher than the
projections presented here.

CCS Industry Roadmap – High Purity CO2 Sources: Final Draft Sectoral Assessment
Carbon Counts Page 51
5 GAPS, BARRIERS, ACTIONS AND MILESTONES
5.1 Gaps and Barriers
Based on the previous section of the report and the inputs from sector experts at a workshop held in
Abu Dhabi on 30th June to 1st July 2010, this section highlights some of the current gaps and barriers
to CCS demonstration and deployment in high purity CO2 sectors. In the following sections, the gaps
and barriers are discussed together, clustered around four main themes:
1. Data gaps – where missing information inhibits understanding of the sector potential to
apply CCS;
2. Information gaps – where additional analysis of the sector characteristics may be warranted
to better understand the scope for CCS application in the sector; and
3. Knowledge gaps – where additional experience and knowledge-sharing, including potential
pilot and demonstration projects, is required to enhance understanding.
4. Policy gaps – where additional awareness, policy and regulatory developments by
governments may improve the prospects for deployment of CCS in high purity CO2 sectors.
Some of these are cross-cutting factors which are not specific to high purity CO2 sources.
These are summarised below (Table 13) and reviewed in more detail in subsequent sections.

CCS Industry Roadmap – High Purity CO2 Sources: Final Draft Sectoral Assessment
Carbon Counts Page 52
Table 13 Summary of gaps, barriers, actions and milestones identified in high purity sectoral assessment and workshop
GAPS BARRIERS ACTIONS MILESTONES Data gaps
Technology use data (gas treatment technologies, gasifier technologies)
Emissions data (venting, EO production)
Cost data (for CO2 treatment, compression etc.)
Commercially sensitive nature of sales data for industrial equipment
Sensitivity of natural gas industry in publishing venting data
Lack of information and knowledge on costs of CCS application to high purity CO2 sector
Engage to industry to assess limits of disclosure.
Establish working groups within sectors:
Natural gas processing - like World Bank Gas Flaring Partnership (GGFR)
Ammonia/fertiliser - through IFA Climate Change Task Force)
EO/Ammonia – through ICCA, CEFIC, UNIDO
Review monitoring and reporting protocols to identify scope for improved reporting of CO2 venting
Update IEA GHG CO2 source database
Set up meetings with established WGs within next 6-12 months
Set up CCS early opportunities conference – next 6-12 months
Review within 12-18 months
Within 24-48 months
Information gaps
Technical information (co-disposal of acid/sour gas, fertiliser delivery pathways
Economic issues (greenfield investment, high CO2 gas field development, risk of perverse outcomes; oil production economics and EOR)
Information on CO2/H2S co-disposal resides in industry
Unclear whether feasible to shift to alternative fertiliser delivery systems
Low greenfield oil production costs in Middle East mean little incentive for CO2-EOR
Commercially sensitive nature of gas reserves data and investment decision-making in O&G industry
Analysis of economic issues dependent on economics of CCS deployment, and in particular the level of incentives
Engage with industry to identify expertise and experience
Gain expert view on the factors affecting potential switch fertiliser production routes
Work with governments and industry to better understand the role CO2-EOR could play in oil-rich regions
Undertake scenario based analysis to evaluate CO2 price point that could trigger changes in fertiliser production and gas field development.
Assess the scope for perverse incentives to arise (linked to previous)
Within next 6-12 months
Within 12-24 months
Within 24-48 months
Knowledge gaps
Source-sink matching (focused on early opportunities projects, unclear if size of high purity soruces make it economically unattractive, esp for EOR)
Offshore EOR (lack of knowledge on the limitations, risks etc.)
Lack of source data. Lack of sink data. Resource intensive
Limited R&D and pilot efforts.
Revisit IEA GHG (2002) study on Early Opportunities, and update with new info
Role of EOR in supporting early opportunity projects using high-purity CO2 needs further analysis.
Review and document experience to date (e.g. BP/Miller, Statoil & Shell/Draugen field).
Within 12-24 months
Within 12-24 months
Within 12-24 months
Policy & cross cutting gaps
Lack of carbon price incentive (especially developing countries)
Lack of regulatory framework
Limited policy-maker focus on early opportunities
UNFCCC challenge for CDM and post-2012
EOR role in climate mitigation unclear
Unable to permit CCS projects in most regions
Focus tends to be on power setor. CSLF/IEA work for G8 didn’t move the topic forward
Limted attention to CCS in developing countries
Develop clearer position on the types of support mechanisms suitable for CCS & EOR deployment, especially in developing economies
Expedite regulatory developments
Develop more coherent industrial policies & strategy, and cooperation in key regions (e.g. ME)
IEA/CSLF develop revised early opportunity effort, building on information gaps highlighted above
More CCS capacity building in developing countries Gain insight into views and perspectives on CCS in key regions.
Within next 6-12 months
Roll out IEA Legal & Regulatory Guidelines. Next 12-24 months
Establish GCC task force on CCS. Next 12 months
Next 12 months
Continue capacity building efforts. Next 6-48 months
CCS Industry Roadmap – High Purity CO2 Sources: Final Draft Sectoral Assessment
Carbon Counts Page 53
5.1.1 Data gaps
The analysis presented highlights several existing data gaps. These include gaps relating to the
following key areas:
Current distribution of technology employed within sectors
Current levels of emissions
Costs associated with CO2 capture
Technology use
There is little data on the current distribution of different types of gasifiers, reformers and gas
treatment technologies employed in ammonia, natural gas processing, and ethylene oxide
production. It would be useful to have a better understanding of the distribution of different
treatment systems currently in use in order to understand whether there are any issues presented
within by current arrangements. The analysis outlined in this report has assumed that there are no
technical barriers to compressing, transporting and storing the CO2 offgas streams from the high
purity sectors analysed. However, the use of pressure swing adsorption (PSA) in ammonia
production could have impacts on the availability of high purity CO2 where the tail gas is used for low
grade heat production. The main barrier to accessing this type of information is likely to be
technology vendors; this type of information will usually be commercially sensitive and is therefore
unlikely to be placed in the public domain.
Emissions data
The analysis presented clearly highlights the paucity of data on levels of CO2 venting currently
carried out in natural gas processing. Although additional analysis may be possible to help refine the
projections presented, such an exercise would need to be facilitated by industry engagement. The
greatest barriers are likely to be the perceived sensitivity of the information, which will make
producers unwilling to disclose the extent of current venting activities. In particular, such an
exercise is likely to highlight a large degree of variability between producers, as the distribution of
the issue is heterogeneous i.e. producers in regions characterised by high levels of CO2
contamination will be more exposed than producers in other regions.
Additional analysis concerning CO2 emissions from ethylene oxide production may also be warranted
to attain improved certainty regarding the estimates provided in this report.
Cost data
There is significant uncertainty concerning the estimates of capture costs from high purity sources in
the existing literature. Although an in-depth study of CCS costs from different natural gas processing
facilities exists (IEA GHG, 2008), published costs data from other sources is less extensive, including
descriptions of technical and financial assumptions used. No known cost studies of capture from
ethylene oxide plant exist.
A key issue with using cost estimates from the current literature is the comparability of assumptions
within and between sectors (i.e. different high purity sources). Different studies typically use
different financial assumptions including the cost of capital and financial periods over which capital
costs are discounted. Similarly, the use of different energy costs in the calculation of operating costs
(mainly relating to compressor power requirements) may vary significantly leading to inconsistency
in the basis for comparing abatement costs. This partially reflects the variability of project settings

CCS Industry Roadmap – High Purity CO2 Sources: Final Draft Sectoral Assessment
Carbon Counts Page 54
described in the literature, which may in turn reflect typical regional lending terms, energy prices
etc. The relatively large component of energy to the overall cost of capture from high purity sources
suggests the usefulness of a comparative cost study for these sources based on available, or new,
data. Similar issues arise when considering the dates when cost studies were produced - prices
relating to both capital and operating costs vary over time as well as regions. Finally, there is little
detail in the literature concerning the potential scale economies associated with projects undertaken
at high purity sources. This concerns the potential to capture CO2 more cost-effectively from
integrated facilities (e.g. sites which produce both ethylene and ethylene oxide) as well as the
economics relating to different plant and CO2 volume sizes.
5.1.2 Information gaps
A number of information gaps exist in addition to the data gaps highlighted above. These generally
relate to the need to gain a more detailed understanding of the following aspects for CCS
deployment:
Technical information
Economic factors
Technical information
An important factor affecting the potential to deploy CCS in natural gas venting is the capacity to co-
dispose acid (CO2) and sour (H2S) gas. Further analysis of any potential technical limitations posed by
co-disposal of CO2 and H2S may be warranted given that future gas reserves are not only affected by
CO2 contamination, but more often H2S contamination. Introducing incentives for CCS deployment
for natural gas producers which allows for co-disposal may alter the economics of H2S waste
management, and potentially create perverse incentives for co-disposal (see Section 5.2.2).
In ammonia and fertiliser production, further analysis of the implications for CCS on fertilizer
production pathways may be warranted. Currently around a third of all CO2 produced in ammonia
plant is used for urea production. There may be scope to alter pathways for delivering nitrogen-
based fertilisers other than urea, freeing up CO2 for CCS (IEA, 2008c). However, it is unclear in this
context what the optimum pathway would be in terms of life-cycle CO2 emissions (IEA, 2008c). The
introduction of incentives for CCS for ammonia producers could force changes in fertiliser
production processes depending on the economics of the different CO2 use options. This could pose
implications in terms of creating perverse incentives for fertiliser producers (see Section 5.2.2).
An improved understanding of CO2 emissions from integrated ethylene/ethylene oxide/ethylene
glycol plants may also improve the understanding for CCS potential in this sector.
There is limited data available on the number of planned CTL projects worldwide. Consolidation of
current project proposals, including an assessment of their status, would facilitate a better
understanding of future emissions in the sector.
Furthermore, two additional areas that have not been considered in this assessment may also
warrant further research: the scope for application of CCS in methanol production, which currently
produces about 2.5 million tonnes of H2 per year (Figure 5); and, pure hydrogen production, as this
could be major source of CO2 if widespread uptake of hydrogen powered fuel cells occurs in the
future.

CCS Industry Roadmap – High Purity CO2 Sources: Final Draft Sectoral Assessment
Carbon Counts Page 55
Economic factors
In all cases where process offgas streams are concerned[1], there is scope for perverse outcomes in
terms of modification to underlying processes to maximise CO2 production and subsequent
abatement through CCS. The nature of this relationship warrants further investigation prior to
considering the types of incentives applicable to CCS for high purity CO2 sources. For example,
providing incentives for CCS at high CO2 natural gas field developments (green-field developments)
could alter the ranking/valuation of company portfolios of gas reserves because of potential
revenues from CCS operations, and/or by altering pathways for fertiliser production so as to
optimise CCS deployment potential. Further research on these aspects, including analysis of the
factors affecting decisions over future valoration of high CO2 gas reserves may be warranted.
However, it is questionable whether oil and gas producers would be prepared to disclose
information about their gas reserves and the decisions affecting investment in these assets.
Enhanced oil recovery was flagged as a major ‘pull’ factor for CCS amongst workshop participants
(Box 3).
Box 3 Enhanced oil and gas recovery and high purity CO2 sources
However, for those regions with emerging large high purity sources (e.g. ammonia production in the
Middle East) the marginal oil production cost for green-field projects is typically very low (e.g. <USD
10/barrel produced). This means that there is little incentive to leave these fields closed and
substitute production with CO2-EOR from more mature reservoirs production, where the marginal
production cost could be USD 20-30/barrel. The imposition of OPEC quotas also means that
flexibility in production is required in those regions. In most cases in the Middle East, use of CO2 in
EOR would substitute the use of natural gas for pressure maintenance, which would also mean that
a strategy would be required to handle the balance of natural gas, especially if the gas is associated
gas (i.e. produced in association with oil). Further analysis of these issues is required to articulate a
clearer business case for implementing CO2-EOR in oil-rich regions.
5.1.3 Knowledge gaps
Some additional gaps in the current knowledge base were identified in the Abu Dhabi workshop
relating to understanding the scope for CCS deployment in a given region through source-sink
matching, and the lack of experience with offshore CO2-EOR.
[1]
For example, HFC-23 offgas production from HCFC-22 manufacture, which has been subject to considerable controversy within the UN clean development mechanism.
Enhanced oil recovery using CO2 should act as a major pull factor to potentially develop early opportunity
CCS projects using CO2 from high purity sources. The evidence that this can be achieved is demonstrated
through the network of CO2 infrastructure in the United States. Here low cost and mined CO2 is supplied
at a price of about USD 35/tCO2 at the wellhead to oil field operators for tertiary oil recovery in mature
fields; the economic benefits are clear as 1tCO2 can deliver 2-3 incremental barrels of oil (this adds around
USD 11-17 to the marginal production cost per barrel in these regions, which is still economically
attractive). This issue was key theme of the Abu Dhabi workshop, where a focus was maintained on the
role of CO2-EOR in pulling in high-purity CO2 sources as a form of early demonstration for CCS technology
(in the absence of CO2 price incentives).

CCS Industry Roadmap – High Purity CO2 Sources: Final Draft Sectoral Assessment
Carbon Counts Page 56
Source-sink matching and early opportunities
There is a need for more studies that can provide an assessment of matching sinks and sources
(existing/future) – this should be carried out on a regional scale. In the context of high purity CO2
sources, it is also unclear whether high purity CO2 sources alone are sufficient to provide large
enough quantities needed for CO2-EOR in some regions. Further analysis on a region-by-region basis
is required to establish whether this is a genuine constraint to deployment.
Enhanced Oil Recovery offshore
Offshore CO2-EOR has not been undertaken anywhere in the world – refurbishing on an offshore
platform is expensive. The additional weight of compression and surface facilities for handling of
breakthrough CO2 will be determined by the ullage8 present on a particular platform. Also, matching
supply and demand is important as EOR may not necessarily require a continuous feed of CO2 on a
daily/monthly/annual period. Venting of CO2 offshore may pose new occupational health & safety
concerns for operators (e.g. asphyxiation risk) and needs to be more clearly understood prior to
commencing any projects of this type.
5.1.4 Policy and cross-cutting gaps and issues
Workshop participants identified the following policy and cross-cutting related gaps that should be
highlighted in the Roadmap.
Incentives
The lack of a carbon price signal which attaches a cost to venting of the CO2 and/or allows the
generation of tradable carbon commodities (“credits”) for CCS is a major barrier to CCS deployment
in developing regions. Presently CCS only creates additional costs and risks with no tangible (non-
environmental) benefits.
Legal and regulatory, liability
No developing country has a legal framework which sets out regulatory conditions for CCS
operators. Developed regions are still embarking on this process, and fully-fledged and tested
systems do not exist anywhere in the world. In certain instances, high-purity applications may
bypass these requirements (e.g. the In Salah CO2 injection project, which is regulated under existing
gas field management regulations). CO2-EOR may also be able to by-pass these concerns by allowing
regulation under existing oilfield management regulations.
Finance
The lack of sufficient and sustainable incentives for CCS means that it is virtually impossible to raise
debt finance for projects. Where public financial support in the form of grants, soft loans etc is not
available, this means that CCS projects must be financed from company balance sheets. It is unclear
whether high purity sectors have sufficient finance available to make investments at the scale
needed (Figure 18).
8 Ullage in this context refers to the spare weight capacity of the civil engineering assets on an offshore
platform
CCS Industry Roadmap – High Purity CO2 Sources: Final Draft Sectoral Assessment
Carbon Counts Page 57
Policy-makers focus
Whilst some efforts have been made to work towards CCS deployment in early opportunities (e..g
work by the CSLF/IEA on behalf of the G8), the focus of policy-makers tends to be on CCS
deployment in the power sector.
Operator perception
In the Middle East region, there is concern that CO2 could contaminate hydrocarbon resources.
Further development of the evidence base is warranted.
Transport gap
Regional transport infrastructure was highlighted in the workshop as a key issue. In many regions
there is no infrastructure which can gather high purity CO2 sources and transport them to end users,
in particular potential EOR operators.
5.2 Actions and Milestones
A number of areas for further research were highlighted in the previous section. Based on these,
some near term actions and milestones that could be implemented for high purity CO2 sources
include:
Update technical and cost information in several key areas
Identify candidate regions where CCS potential from high purity sources may be greatest
Improve engagement with the high purity CO2 sector on CCS issues
Improve awareness of the benefits of CCS ‘early opportunities’ with policy-makers
General capacity building
5.2.1 Update technical and cost information
There is significant scope to improve the current technical information that could help facilitate
improved understanding of the potential for CCS application in the high purity CO2 sector. Possible
actions include:
Update IEA GHG database of CO2 emissions sources (IEA GHG, 2006) to improve information
included. This is partly contingent on improving engagement with industry, as described in
the previous section.
Revisit and update IEA GHG work on early opportunities (IEA GHG, 2002b). The study should
be updated and its results re-evaluated in order to allow clearer assessment and
communication of CCS early opportunities.
An update of the IEA GHG CO2 emissions database (ops cit.) and an update review of ‘early
opportunities’ could help to identify candidate regions which may include e.g. Arabian
Gulf/Gulf of Thailand/South China Sea; North East Shelf Australia; North Sea.
CO2 demand side issues seem critical to getting early projects off the ground in the absence
of a CO2 price for emitters. CO2-EOR requirements, technical challenges and acceptance by
operators, all need to be clarified to enhance the “market pull” of CO2 use in EOR.
Thorough review and further analysis of capture costs from high purity CO2 sources. A study
of project costs on a comparative basis using recent data inputs would also help to inform

CCS Industry Roadmap – High Purity CO2 Sources: Final Draft Sectoral Assessment
Carbon Counts Page 58
consideration of candidate regions and describe key cost variables such as investment costs,
energy prices and scale/process integration effects.
A further area that may need development is in monitoring and reporting protocols for high purity
CO2 sources. This could help improve the resolution at which data is reported for individual high
purity sources.
Identify candidate regions
An improved level of up to date technical and cost information for high purity sources would provide
a more robust basis for identifying candidate regions for CCS deployment of early opportunities
within this sector.
Regional reviews of CCS potential could be developed focusing on low cost CO2 capture sources i.e.
high purity sources, informed by characterizing relevant factors and issues including e.g.
Proximity of high purity industrial sources to suitable storage sites; including as assessment
of project deployment scale (total CCS potential) according to transport distances and
onshore and offshore storage media (media type, capacity, etc)
Potential for CO2-EOR use, based on an understanding of market and policy factors
influencing current and expected regional EOR demand
Outlook for production - including changes in process and patterns of energy use -within the
high purity sector of each region
Cost factors influencing relative abatement costs from CCS deployment (e.g. identifying low-
cost opportunities based on inter alia energy prices, investment environment and project
loan risk, ability to integrate CCS into new-build plant, scale factors)
5.2.2 Improve engagement with industry
In order to close some of the data and information gaps highlighted previously, it will be important
to improve the way in which the industries associated with high purity CO2 sources engage with the
CCS debate; to date, the focus of the CCS debate has largely been on the power sector.
Some specific actions in this context could include:
Establish a natural gas producers working group to attempt to gain a better understanding
of current CO2 venting emissions from natural gas production, potential future emissions
and the effects of CCS on production economics. This could be similar to the Global Gas
Flaring Reduction Public Private Partnership of the World Bank, which has been effective in
establishing and communicating the technical and economic factors affecting flaring of
associated gas. The International Petroleum Industry Environment Conservation Association
(IPIECA), The International Association of Oil & Gas producers (OGP), or International Gas
Union could facilitate this process.
Improve communication between the ammonia industry and the CCS community. This could
be achieved through the establishment of a dialogue between the International Fertiliser
Association (IFA), national fertiliser associations (e.g. The Fertiliser Association of India; FAI)
and leading players in the CCS community e.g. the IEA or the Global CCS Institute (GCCSI).
Similarly, better communications between the CCS community and the chemicals industry is
warranted, as it cross-cuts both ammonia production and ethylene oxide production.

CCS Industry Roadmap – High Purity CO2 Sources: Final Draft Sectoral Assessment
Carbon Counts Page 59
More generally, the GCCSI or IEA should consider setting up a CCS “early opportunities” working
group with a view to improving the dialogue between these key sectors.
Some specific milestones in these contexts could include:
At least one global CCS conference and information exchange with key players in the high
purity CO2 source sector should be held within the next 12 months;
A dialogue with potential industry forums which could act as a focal point for CCS within the
relevant sectors should be completed within the next 6-12 months.
5.2.3 Raise Awareness with policy makers
Policy makers need a better understanding of the potential for applying CCS for high purity sectors,
including an understanding of the sources of high purity CO2 emissions (sectors, scale), and the
potential benefits the sector offers in terms of CCS demonstration, especially early demonstration of
CO2 storage. In this context:
Many of the actions referred to previously could help close the knowledge gap in this
respect, and the challenge will be to successfully communicate this with policy-makers.
Revisiting and revising the work by the CSLF/IEA on early opportunities could help bring the
topic to the attention of policy-makers, especially in key regions.
Development of regional CCS strategies can kick start discussions on creating CCS enabling
policy frameworks. Raising awareness about the long-term role that CO2-EOR can play in oil
producing regions needs to be undertaken. Greater awareness and cooperation should
allow governments to develop industrial strategies that support early utilization of high
purity CO2 sources in CCS demonstration, especially demonstration of storage (e.g. site
selection, regulation, monitoring etc). Gulf States are an early opportunity for CCS – greater
cooperation through existing forums is an important first step to raising awareness in this
region (e.g. Gulf Cooperation Council, OPEC).
Other more obvious cross-cutting issues for policy-makers include:
Incentives
CCS needs to be recognized as a mitigation activity under CDM or other incentive mechanism
applicable in developing countries. Suitable international emission reduction mechanism need to be
developed which includes CCS (e.g. Nationally Appropriate Mitigation Actions). Monitoring,
reporting and verification requirements under such schemes need to be clearly outlined.
Role of EOR
It is unclear whether CO2-EOR will be recognized as a climate mitigation technology. More detailed
analysis of the life-cycle carbon emissions associated with EOR activities should be undertaken to
better inform the debate.
5.2.4 Build capacity
For all issues raised, there is broad need to build capacity amongst industry and policy-makers,
especially in some high purity CO2 sources sectors (e.g. ammonia production) and in developing
countries.
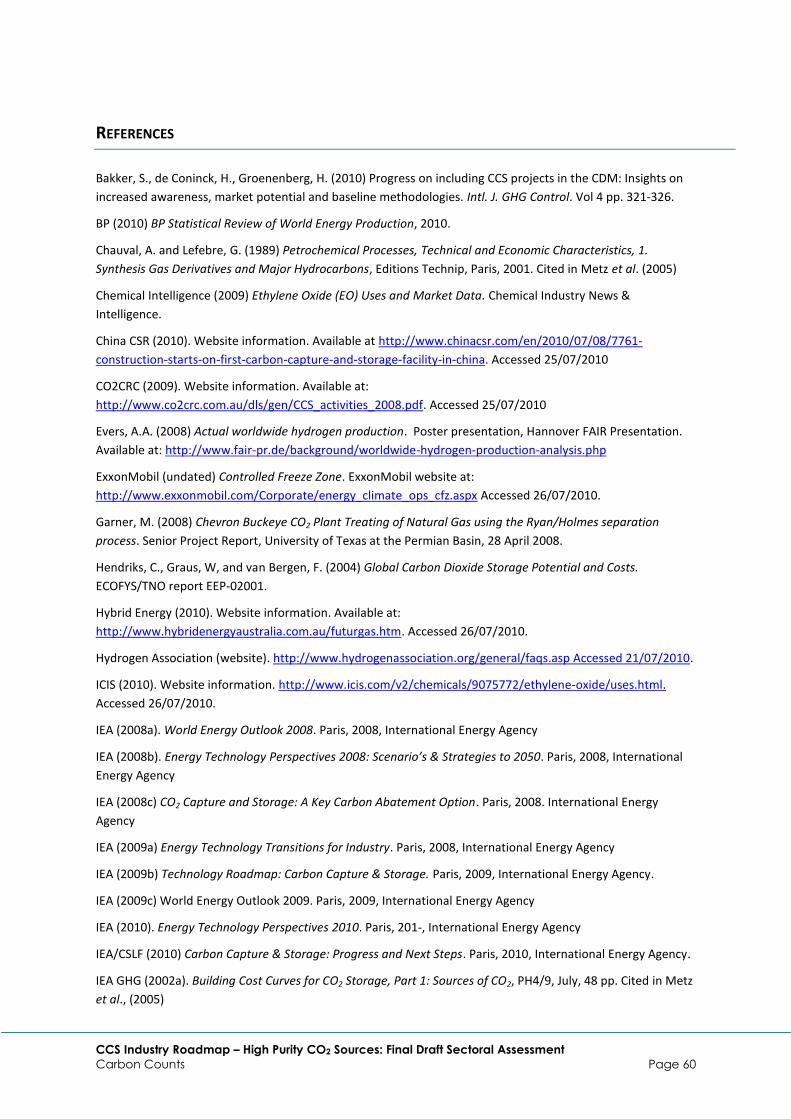
CCS Industry Roadmap – High Purity CO2 Sources: Final Draft Sectoral Assessment
Carbon Counts Page 60
REFERENCES
Bakker, S., de Coninck, H., Groenenberg, H. (2010) Progress on including CCS projects in the CDM: Insights on
increased awareness, market potential and baseline methodologies. Intl. J. GHG Control. Vol 4 pp. 321-326.
BP (2010) BP Statistical Review of World Energy Production, 2010.
Chauval, A. and Lefebre, G. (1989) Petrochemical Processes, Technical and Economic Characteristics, 1.
Synthesis Gas Derivatives and Major Hydrocarbons, Editions Technip, Paris, 2001. Cited in Metz et al. (2005)
Chemical Intelligence (2009) Ethylene Oxide (EO) Uses and Market Data. Chemical Industry News &
Intelligence.
China CSR (2010). Website information. Available at http://www.chinacsr.com/en/2010/07/08/7761-
construction-starts-on-first-carbon-capture-and-storage-facility-in-china. Accessed 25/07/2010
CO2CRC (2009). Website information. Available at:
http://www.co2crc.com.au/dls/gen/CCS_activities_2008.pdf. Accessed 25/07/2010
Evers, A.A. (2008) Actual worldwide hydrogen production. Poster presentation, Hannover FAIR Presentation.
Available at: http://www.fair-pr.de/background/worldwide-hydrogen-production-analysis.php
ExxonMobil (undated) Controlled Freeze Zone. ExxonMobil website at:
http://www.exxonmobil.com/Corporate/energy_climate_ops_cfz.aspx Accessed 26/07/2010.
Garner, M. (2008) Chevron Buckeye CO2 Plant Treating of Natural Gas using the Ryan/Holmes separation
process. Senior Project Report, University of Texas at the Permian Basin, 28 April 2008.
Hendriks, C., Graus, W, and van Bergen, F. (2004) Global Carbon Dioxide Storage Potential and Costs.
ECOFYS/TNO report EEP-02001.
Hybrid Energy (2010). Website information. Available at:
http://www.hybridenergyaustralia.com.au/futurgas.htm. Accessed 26/07/2010.
Hydrogen Association (website). http://www.hydrogenassociation.org/general/faqs.asp Accessed 21/07/2010.
ICIS (2010). Website information. http://www.icis.com/v2/chemicals/9075772/ethylene-oxide/uses.html.
Accessed 26/07/2010.
IEA (2008a). World Energy Outlook 2008. Paris, 2008, International Energy Agency
IEA (2008b). Energy Technology Perspectives 2008: Scenario’s & Strategies to 2050. Paris, 2008, International
Energy Agency
IEA (2008c) CO2 Capture and Storage: A Key Carbon Abatement Option. Paris, 2008. International Energy
Agency
IEA (2009a) Energy Technology Transitions for Industry. Paris, 2008, International Energy Agency
IEA (2009b) Technology Roadmap: Carbon Capture & Storage. Paris, 2009, International Energy Agency.
IEA (2009c) World Energy Outlook 2009. Paris, 2009, International Energy Agency
IEA (2010). Energy Technology Perspectives 2010. Paris, 201-, International Energy Agency
IEA/CSLF (2010) Carbon Capture & Storage: Progress and Next Steps. Paris, 2010, International Energy Agency.
IEA GHG (2002a). Building Cost Curves for CO2 Storage, Part 1: Sources of CO2, PH4/9, July, 48 pp. Cited in Metz
et al., (2005)

CCS Industry Roadmap – High Purity CO2 Sources: Final Draft Sectoral Assessment
Carbon Counts Page 61
IEA GHG (2002b). Opportunities for Early Application of CO2 Sequestration Technology. Report number PH4/10.
September 2002. IEA Greenhouse Gas R&D Programme, Cheltenham.
IEA GHG (2006) IEA GHG R&D Programme project database; sourced from website (www.ieaghg.org)
IEA GHG (2008) Carbon Dioxide Capture and Storage in the Clean Development Mechanism: Assessing market
effects of inclusion. 2008/13, November 2008. IEA Greenhouse Gas R&D Programme, Cheltenham.
IEEP (2007) CO2 Capture and Storage in Developing Countries and the role of the Clean Development
Mechanisms: A paper for WWF European Policy Office. Submitted to the UNFCCC in 2007 by WWF.
IFA (2010a) Fertiliser supply statistics. 3rd
February 2010. IFA website: http://www.fertilizer.org/ifa/Home-
Page/STATISTICS/Fertilizer-supply-statistics Accessed 23/07/2010
IFA (2010b) Greenhouse Gas Emissions and Fertiliser Production. IFA website:
http://www.fertilizer.org/ifa/Home-Page/SUSTAINABILITY/Climate-change/Emissions-from-production.html
Accessed 22/07/2010.
Liebenberg (2010). Sasol Secunda staff. Personal communication.
Maddox, R.N and Morgan, D.J. (1998) Gas Conditioning and Gas Treating, Volume 4: Gas treating and liquid
sweetening. Campbell Petroleum Series, OK, USA, 498 pp. Cited in Metz et al., (2005)
Matripraganda, H.C. and Rubin, E. (2009) CO2 reduction potential of coal-to-liquids (CTL) plants, Elsevier 2009.
McKinsey & Company (2009) Pathways to a Low-carbon Economy: Version 2 of the Global Greenhouse Gas
Abatement Curve.
Metz, B, Davidson, O., de Coninck, H. C., Loos, M., and Meyer, L. A. (eds.). (2005) IPCC Special Report on
Carbon Dioxide Capture and Storage. Prepared by Working Group III of the Intergovernmental Panel on
Climate Change Cambridge and New York: Cambridge University Press.
PCI Xylenes & Polyesters (2010). Cited in ICIS, 2010.
Sasol (undated). Unlocking the Potential Wealth of Coal. Sasol brochure. Available at:
http://www.sasol.com/sasol_internet/downloads/CTL_Brochure_1125921891488.pdf Accessed 23/7/2010
Shell Chemicals (2009) Ethylene oxide product overview, Ethylene oxide
SRI Consulting (2009) Ethylene Oxide WP Report
SRI Consulting (2010) Ethylene Oxide WP Report
Steynberg, A. P. and Nel, H.G. (2004) Clean Coal Conversion Options using Fischer-Tropsch Technology. Fuel,
vol. 83, no. 6, pp 765-770. Cited in IEA (2008c)
Sun, Q. (2008) ‘CTL Development in China’ presentation given April 24, 2008, Washington, D.C. See:
http://files.asme.org/asmeorg/NewsPublicPolicy/GovRelations/21387.pdf
UNEP/UNIDO (1998) Mineral Fertiliser Production and the Environment, Part I: The Fertiliser Industry’s
Manufacturing Processes and Environmental Issues. United Nations Environment Programme/United Nations
Industrial Development Organisation in collaboration with the International Fertiliser Associated. Paris.
Vallentin, D., Fischedick, M. (2009). The global comeback of coal-to-liquids (CTL) technologies: can CCS make
CTL compatible with climate protection needs? IOP conference series: Earth and Environmental Science 6.

CCS Industry Roadmap – High Purity CO2 Sources: Final Draft Sectoral Assessment
Carbon Counts Page 62
Related Documents