© Copyright 2010: Instituto de Astronomía, Universidad Nacional Autónoma de México Revista Mexicana de Astronom´ ıa y Astrof´ ısica, 46, 385–430 (2010) CCD UBVRI PHOTOMETRY OF THE GALACTIC OPEN CLUSTERS 1 : BE 89, RU 135, AND BE 10 ˙ Inci Akkaya, 2 William J. Schuster, 3 Ra´ ul Michel, 3 Carlos Chavarr´ ıa-K, 3 Andr´ e Moitinho, 4 Roberto V´ azquez, 3 and Y¨ uksel Karata¸ s 5 Received 2009 May 15; accepted 2010 August 15 RESUMEN Presentamos los par´ ametros fundamentales de enrojecimiento, metalicidad, edad y distancia de los c´ umulos abiertos poco estudiados Be 89, Ru 135 y Be 10, derivados de la fotometr´ ıa CCD UBVRI . Los enrojecimientos interestelares se mi- dieron en el diagrama color-color, y las metalicidades fotom´ etricas se derivaron del exceso de ultravioleta de las estrellas tipo F. Las distancias y edades se obtu- vieron ajustando isocronas a las secuencias observadas en cinco diagramas color- magnitud diferentes. Los promedios ponderados de los m´ odulos de distancia y distancias helioc´ entricas [(V 0 − M V ),d(kpc)] son: (11. m 90 ± 0. m 06, 2.4 ± 0.06) para Be 89, (9. m 58 ± 0. m 07, 0.81 ± 0.03) para Ru 135 y (11. m 16 ± 0. m 06, 1.7 ± 0.05) para Be 10, mientras que los promedios ponderados para las edades [log(A),A(Gyr)] son: (9.58 ± 0.06, 3.8 ± 0.6) para Be 89, (9.58 ± 0.06, 3.8 ± 0.7) para Ru 135 y (9.06 ± 0.05, 1.08 ± 0.08) para Be 10. ABSTRACT The fundamental parameters of reddening, metallicity, age, and distance are presented for the poorly studied open clusters Be 89, Ru 135, and Be 10, de- rived from their CCD UBVRI photometry. The interstellar reddenings, E(B–V ), were measured in the two-color diagram, and the photometric metallicities, [Fe/H], from the ultraviolet excesses of the F-type stars. By fitting isochrones to the ob- served sequences of the clusters in five different color-magnitude diagrams, the weighted averages of distance moduli and heliocentric distances [(V 0 –M V ),d(kpc)] are (11. m 90 ± 0. m 06, 2.4 ± 0.06) for Be 89, (9. m 58 ± 0. m 07, 0.81 ± 0.03) for Ru 135, and (11. m 16 ± 0. m 06, 1.7 ± 0.05) for Be 10, and the weighted averages of the ages [log(A),A(Gyr)] are (9.58 ± 0.06, 3.8 ± 0.6) for Be 89, (9.58 ± 0.06, 3.8 ± 0.7) for Ru 135, and (9.06 ± 0.05, 1.08 ± 0.08) for Be 10. Key Words: open clusters and associations: individual (Be10, Be89, Ru135) — stars: fundamental parameters — stars: Hertzsprung-Russell and C-M diagrams — techniques: photometric 1 Based on observations carried out at the San Pedro M´ artir National Astronomical Observatory (SPM), operated by In- stituto de Astronom´ ıa, Universidad Nacional Aut´ onoma de M´ exico, Ensenada, B. C., Mexico. 2 Department of Astronomy and Space Sciences, Erciyes University, Kayseri, Turkey. 3 Instituto de Astronom´ ıa, Universidad Nacional Aut´ onoma de M´ exico, Ensenada, B. C., Mexico. 4 SIM/IDL, Facultade de Ciencias da Universidade de Lis- boa, Lisboa, Portugal. 5 Istanbul University, Science Faculty, Department of As- tronomy and Space Sciences, Turkey. 1. INTRODUCTION Galactic open clusters, which contain a few tens to a few tens of thousands of stars and are a few parsecs across, are sparsely populated, loosely con- centrated, and gravitationally bound systems. With systematic image searches and follow-up photomet- ric surveys, new open clusters are currently be- ing discovered. By fitting the photometric observa- tions of open clusters to synthetic photometry result- ing from stellar models (i.e., theoretical isochrones), which include the newest input physics, stellar struc- ture, and differing heavy-element abundances, fun- 385

Welcome message from author
This document is posted to help you gain knowledge. Please leave a comment to let me know what you think about it! Share it to your friends and learn new things together.
Transcript

© C
op
yri
gh
t 2
01
0: In
stitu
to d
e A
stro
no
mía
, U
niv
ers
ida
d N
ac
ion
al A
utó
no
ma
de
Mé
xic
o
Revista Mexicana de Astronomıa y Astrofısica, 46, 385–430 (2010)
CCD UBVRI PHOTOMETRY OF THE GALACTIC OPEN
CLUSTERS1: BE 89, RU 135, AND BE 10
Inci Akkaya,2 William J. Schuster,3 Raul Michel,3 Carlos Chavarrıa-K,3 Andre Moitinho,4
Roberto Vazquez,3 and Yuksel Karatas5
Received 2009 May 15; accepted 2010 August 15
RESUMEN
Presentamos los parametros fundamentales de enrojecimiento, metalicidad,edad y distancia de los cumulos abiertos poco estudiados Be 89, Ru 135 y Be 10,derivados de la fotometrıa CCD UBVRI. Los enrojecimientos interestelares se mi-dieron en el diagrama color-color, y las metalicidades fotometricas se derivarondel exceso de ultravioleta de las estrellas tipo F. Las distancias y edades se obtu-vieron ajustando isocronas a las secuencias observadas en cinco diagramas color-magnitud diferentes. Los promedios ponderados de los modulos de distancia ydistancias heliocentricas [(V0 − MV ), d(kpc)] son: (11.m90 ± 0.m06, 2.4 ± 0.06) paraBe 89, (9.m58 ± 0.m07, 0.81 ± 0.03) para Ru 135 y (11.m16 ± 0.m06, 1.7 ± 0.05) paraBe 10, mientras que los promedios ponderados para las edades [log(A), A(Gyr)]son: (9.58 ± 0.06, 3.8 ± 0.6) para Be 89, (9.58 ± 0.06, 3.8 ± 0.7) para Ru 135 y(9.06 ± 0.05, 1.08 ± 0.08) para Be 10.
ABSTRACT
The fundamental parameters of reddening, metallicity, age, and distance arepresented for the poorly studied open clusters Be 89, Ru 135, and Be 10, de-rived from their CCD UBVRI photometry. The interstellar reddenings, E(B–V ),were measured in the two-color diagram, and the photometric metallicities, [Fe/H],from the ultraviolet excesses of the F-type stars. By fitting isochrones to the ob-served sequences of the clusters in five different color-magnitude diagrams, theweighted averages of distance moduli and heliocentric distances [(V0–MV ), d(kpc)]are (11.m90 ± 0.m06, 2.4 ± 0.06) for Be 89, (9.m58 ± 0.m07, 0.81 ± 0.03) for Ru 135,and (11.m16 ± 0.m06, 1.7 ± 0.05) for Be 10, and the weighted averages of the ages[log(A), A(Gyr)] are (9.58 ± 0.06, 3.8 ± 0.6) for Be 89, (9.58 ± 0.06, 3.8 ± 0.7) forRu 135, and (9.06 ± 0.05, 1.08 ± 0.08) for Be 10.
Key Words: open clusters and associations: individual (Be10, Be89, Ru135) —stars: fundamental parameters — stars: Hertzsprung-Russell andC-M diagrams — techniques: photometric
1Based on observations carried out at the San Pedro MartirNational Astronomical Observatory (SPM), operated by In-stituto de Astronomıa, Universidad Nacional Autonoma deMexico, Ensenada, B. C., Mexico.
2Department of Astronomy and Space Sciences, ErciyesUniversity, Kayseri, Turkey.
3Instituto de Astronomıa, Universidad NacionalAutonoma de Mexico, Ensenada, B. C., Mexico.
4SIM/IDL, Facultade de Ciencias da Universidade de Lis-boa, Lisboa, Portugal.
5Istanbul University, Science Faculty, Department of As-tronomy and Space Sciences, Turkey.
1. INTRODUCTION
Galactic open clusters, which contain a few tensto a few tens of thousands of stars and are a fewparsecs across, are sparsely populated, loosely con-centrated, and gravitationally bound systems. Withsystematic image searches and follow-up photomet-ric surveys, new open clusters are currently be-ing discovered. By fitting the photometric observa-tions of open clusters to synthetic photometry result-ing from stellar models (i.e., theoretical isochrones),which include the newest input physics, stellar struc-ture, and differing heavy-element abundances, fun-
385

© C
op
yri
gh
t 2
01
0: In
stitu
to d
e A
stro
no
mía
, U
niv
ers
ida
d N
ac
ion
al A
utó
no
ma
de
Mé
xic
o
386 AKKAYA ET AL.
damental parameters such as interstellar reddening,metallicity, distance modulus, and age can be pre-cisely and accurately determined. These parametershave great importance concerning the age-metallicityrelation and the metal-abundance gradient in theGalactic disk (e.g., Cameron 1985; Carraro & Chiosi1994; Friel 1995), as well as the luminosity and massfunctions of the open clusters (Piskunov et al. 2008).Open clusters are also very useful for testing the stel-lar evolutionary models, given that their stars wereformed at the same time, out of the same cloud,and under similar environmental conditions. Thus,open clusters are ideal entities for the study of stellarevolution since physical properties are tightly con-strained, being mainly distinguished by the stellarmass, so that theoretical models of stellar formationand evolution can be compared with real clusterswithout excessive complications. For these analy-ses, the fundamental parameters such as interstel-lar reddening, metallicity, distance modulus, and ageshould be determined as precisely and accurately aspossible.
In Galactic studies, one of the more severe obser-vational limitations is due to the absence of photo-metric data for nearly half of the approximately 1500open clusters known. Furthermore, there is a lackof homogeneity in the observations and analyses ofthe clusters studied. The catalogue of Lynga (1987),that resulted from a collection of data from manydifferent sources and which includes 422 open clus-ters, constituted the observational basis for a largenumber of astronomical studies, led to importantconclusions about the Galactic disk, and has beenvery useful for planning subsequent observations byother astronomers. However, this catalogue has beenbuilt from parameters obtained by various authors,with diverse observing techniques, distinct calibra-tions, and different criteria for determining the stel-lar ages, rendering it very inhomogeneous and lim-ited for studies requiring precision in the measure-ment of these fundamental parameters. As an ex-ample of the precision and accuracy that one canexpect due to the effects of these inhomogeneities,we refer to Janes & Adler (1982), who found thatdistance moduli of a given cluster obtained by twoor more authors have a mean difference of 0.m55.
Within the Sierra San Pedro Martir, National As-tronomical Observatory (hereafter SPM) open clus-ter project (cf. Schuster et al. 2007; Michael et al.2010, in preparation), the aims are the following:
1. A common UBVRI photometric scale for openclusters.
2. An atlas of color-color and color-magnitude di-agrams for these clusters.
3. A homogeneous set of cluster reddenings, dis-tances, ages, and, if possible, metallicities.
4. An increased number of old, significantly red-dened, or distant, open clusters.
5. A selection of interesting clusters for furtherstudy.
The open clusters for the present study were selectedfrom the large (and most complete) catalogue, “Op-tically visible open Clusters and Candidates” (Diaset al. 2002), which is now also available at the Centrede Donnees Astronomiques de Strasbourg (CDS)6.This work aims to provide the fundamental parame-ters of reddening, metallicity, distance modulus andage for the open clusters Be 89, Ru 135, and Be 10.Our final intention is to publish a set of homogeneousphotometric UBVRI data for over 300 Galactic clus-ters (Schuster et al. 2007; Tapia et al. 2010).
This paper is organized as follows: § 2 describesthe observations and reduction techniques. § 3 con-tains the derivation from the UBVRI photometry ofreddening and metallicity of the clusters from two-color diagrams, and the inference of distance moduliand ages from color-magnitude diagrams. Their un-certainties are also discussed. Comparisons of theseparameters with previous results from the literatureare made in § 4, and the conclusions are given in § 5.
2. OBSERVATION AND REDUCTIONTECHNIQUES
2.1. The observations
This CCD UBVRI project of northern open clus-ters has been undertaken at SPM using always thesame instrumental setup (telescope, CCD-detector,and filters), observing procedures, reduction meth-ods, and system of standard stars (Landolt 1983,1992). A par focal set of UBVRI Johnson-Cousinsfilters was used for our observations. The 0.84 m f/13Cassegrain telescope hosted the filter-wheel “Mex-man” provided with the SITE#1 (SI003) CCD cam-era, which has a 1024 × 1024 square pixel array anda 24 µm × 24 µm pixel size; this CCD has non-linearities less than 0.45% over a wide dynamicalrange, no evidence for fringing even in the I band,and Metachrome II and VISAR coverings to increasesensitivity in the blue and near ultraviolet. The sky-projected pixel size was 0.′′393, and the field of view
6http://www.astro.iag.usp.br/~wilton/.
© C
op
yri
gh
t 2
01
0: In
stitu
to d
e A
stro
no
mía
, U
niv
ers
ida
d N
ac
ion
al A
utó
no
ma
de
Mé
xic
o
UBVRI PHOTOMETRY OF OPEN CLUSTERS 387
TABLE 1
LANDOLT’S FIELDS OF STANDARD STARS
July 2001 February 2002
Region Nstds Region Nstds
PG1528+062 3 PG0918+029 5
PG1530+057 3 PG0942-029 5
PG1633+099 5 PG1047+003 4
PG1657+078 4 PG1323-086 5
PG2213-006 4 PG1528+062 3
PG2331+055 3 SA 95 5
MARK A 4 SA104 4
SA107 4
TOTAL 26 TOTAL 35
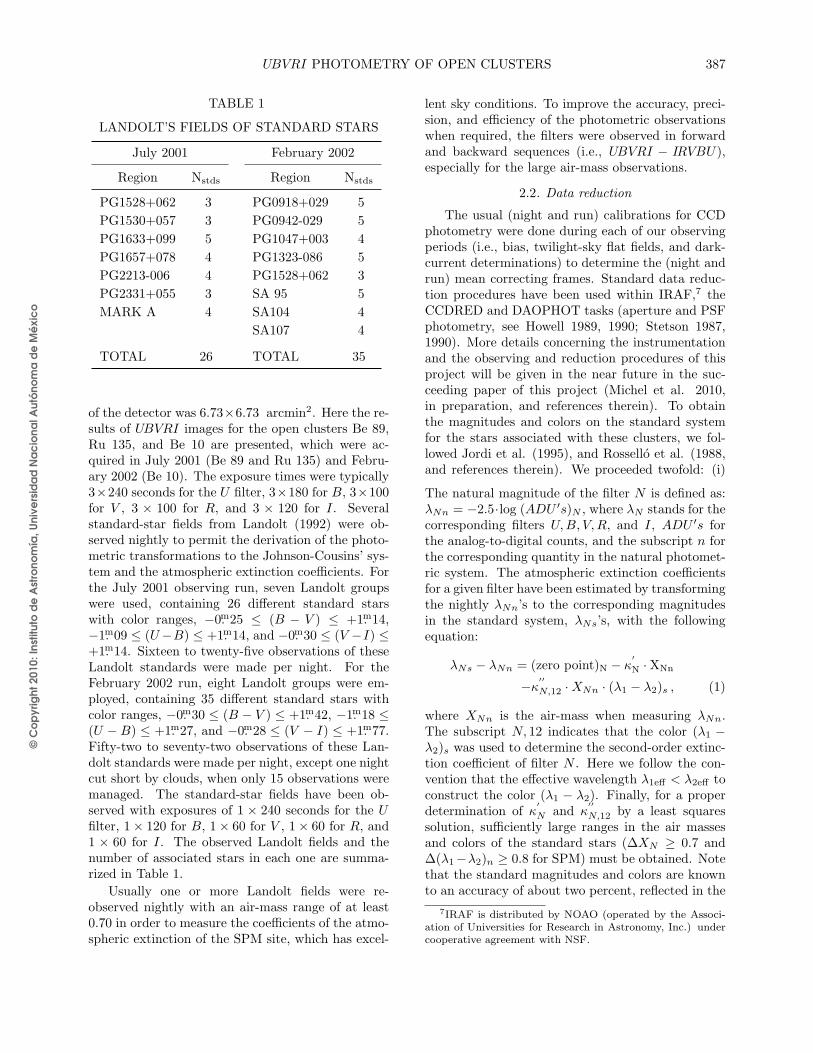
of the detector was 6.73×6.73 arcmin2. Here the re-sults of UBVRI images for the open clusters Be 89,Ru 135, and Be 10 are presented, which were ac-quired in July 2001 (Be 89 and Ru 135) and Febru-ary 2002 (Be 10). The exposure times were typically3×240 seconds for the U filter, 3×180 for B, 3×100for V , 3 × 100 for R, and 3 × 120 for I. Severalstandard-star fields from Landolt (1992) were ob-served nightly to permit the derivation of the photo-metric transformations to the Johnson-Cousins’ sys-tem and the atmospheric extinction coefficients. Forthe July 2001 observing run, seven Landolt groupswere used, containing 26 different standard starswith color ranges, −0.m25 ≤ (B − V ) ≤ +1.m14,−1.m09 ≤ (U−B) ≤ +1.m14, and −0.m30 ≤ (V −I) ≤+1.m14. Sixteen to twenty-five observations of theseLandolt standards were made per night. For theFebruary 2002 run, eight Landolt groups were em-ployed, containing 35 different standard stars withcolor ranges, −0.m30 ≤ (B − V ) ≤ +1.m42, −1.m18 ≤(U − B) ≤ +1.m27, and −0.m28 ≤ (V − I) ≤ +1.m77.Fifty-two to seventy-two observations of these Lan-dolt standards were made per night, except one nightcut short by clouds, when only 15 observations weremanaged. The standard-star fields have been ob-served with exposures of 1 × 240 seconds for the Ufilter, 1 × 120 for B, 1 × 60 for V , 1 × 60 for R, and1 × 60 for I. The observed Landolt fields and thenumber of associated stars in each one are summa-rized in Table 1.
Usually one or more Landolt fields were re-observed nightly with an air-mass range of at least0.70 in order to measure the coefficients of the atmo-spheric extinction of the SPM site, which has excel-
lent sky conditions. To improve the accuracy, preci-sion, and efficiency of the photometric observationswhen required, the filters were observed in forwardand backward sequences (i.e., UBVRI − IRVBU),especially for the large air-mass observations.
2.2. Data reduction
The usual (night and run) calibrations for CCDphotometry were done during each of our observingperiods (i.e., bias, twilight-sky flat fields, and dark-current determinations) to determine the (night andrun) mean correcting frames. Standard data reduc-tion procedures have been used within IRAF,7 theCCDRED and DAOPHOT tasks (aperture and PSFphotometry, see Howell 1989, 1990; Stetson 1987,1990). More details concerning the instrumentationand the observing and reduction procedures of thisproject will be given in the near future in the suc-ceeding paper of this project (Michel et al. 2010,in preparation, and references therein). To obtainthe magnitudes and colors on the standard systemfor the stars associated with these clusters, we fol-lowed Jordi et al. (1995), and Rossello et al. (1988,and references therein). We proceeded twofold: (i)
The natural magnitude of the filter N is defined as:λNn = −2.5·log (ADU ′s)N , where λN stands for thecorresponding filters U,B, V,R, and I, ADU ′s forthe analog-to-digital counts, and the subscript n forthe corresponding quantity in the natural photomet-ric system. The atmospheric extinction coefficientsfor a given filter have been estimated by transformingthe nightly λNn’s to the corresponding magnitudesin the standard system, λNs’s, with the followingequation:
λNs − λNn = (zero point)N − κ′
N · XNn
−κ′′
N,12 · XNn · (λ1 − λ2)s , (1)
where XNn is the air-mass when measuring λNn.The subscript N, 12 indicates that the color (λ1 −λ2)s was used to determine the second-order extinc-tion coefficient of filter N . Here we follow the con-vention that the effective wavelength λ1eff < λ2eff toconstruct the color (λ1 − λ2). Finally, for a properdetermination of κ
′
N and κ′′
N,12 by a least squaressolution, sufficiently large ranges in the air massesand colors of the standard stars (∆XN ≥ 0.7 and∆(λ1−λ2)n ≥ 0.8 for SPM) must be obtained. Notethat the standard magnitudes and colors are knownto an accuracy of about two percent, reflected in the
7IRAF is distributed by NOAO (operated by the Associ-ation of Universities for Research in Astronomy, Inc.) undercooperative agreement with NSF.

© C
op
yri
gh
t 2
01
0: In
stitu
to d
e A
stro
no
mía
, U
niv
ers
ida
d N
ac
ion
al A
utó
no
ma
de
Mé
xic
o
388 AKKAYA ET AL.
TABLE 2
ATMOSPHERIC EXTINCTION AND TRANSFORMATION COEFFICIENTS
Color λ1 λ2 λ3 κ′
1 κ′′
1,12 κ0,12 β12 γ12 rms
July 2001
(U − B) U B V 0.472 −0.056 +1.625 0.711 +0.263 0.028
(B − V ) B V – 0.243 −0.050 +0.409 1.016 −0.050 0.010
V V R – 0.106 +0.079 +2.375 0.033 −0.008 0.016
(V − R) V R – 0.104* +0.030* +0.027 0.973 +0.011 0.012
(V − I) V I – 0.087*−0.035*
−0.151 0.923 +0.070 0.010
February 2002
(U − B) U B V 0.325 −0.056 +1.765 0.751 +0.313 0.037
(B − V ) B V – 0.212 −0.050 +0.470 0.979 −0.023 0.018
V V R – 0.082 +0.079 +2.455 0.035 −0.054 0.027
(V − R) V R – 0.054* +0.030*−0.000 1.023 −0.008 0.012
(V − I) V I – 0.056*−0.035*
−0.165 1.038 +0.004 0.014
*Indicates that extinction coefficients refer to λ2, otherwise to λ1.
errors of the final transformations of the (bright)standard stars, and that the observed magnitudesand air masses are measured quantities that can havean even better precision. To further simplify theequations, the extra-atmospheric instrumental mag-nitudes were then introduced using the extinctioncoefficients of the night:
λNi = λNn−κ′
N ·XNn−κ′′
N,12 ·XNn ·(λ1−λ2)s . (2)
An instrumental color is the subtraction of two in-strumental magnitudes with different passbands,
(λ1 − λ2)i = λ1i − λ2i .
(ii) Once the atmospheric extinction coefficients κ′
N
and κ′′
N,12 have been determined and applied, thenightly transformation coefficients are calculated(i.e., β12 and γ12) with the following relations forthe colors:
(λ1−λ2)i = κ0,12 +β12 · (λ1−λ2)s +γ12 · (λ1−λ2)2s .
(3)Due to the Balmer discontinuity that lies in both theU and B passbands, a better transformation for theU − B color has been achieved by substituting thequadratic term on the right side of the above equa-tion with a linear term in the color B−V , obtainingthe following expression:
(λ1 −λ2)i = κ0,12 +β12 · (λ1 −λ2)s +γ12 · (λ2 −λ3)s,(4)
where λ1eff < λ2eff < λ3eff . For the case of the mag-nitude V , equation (3) has been used as follows:
Vi−Vs = κ01 +β12 ·(λ1−λ2)s +γ12 ·(λ1−λ2)2s . (5)
For equations (3)–(5), κ0,12 and κ01 are the zero-points of the transformations of the colors (λ1−λ2)s,i.e., U − B, B − V , V − R, V − I, etc., and of theV magnitude, respectively. The coefficients β12 andγ12 are the respective first- and second-order trans-formation coefficients.
In general, the second-order atmospheric extinc-tion coefficient κ
′′
V R is expected to be close to zerodue to the nearly constant level (ozone-band contri-bution) of the atmospheric extinction curve at SPMnear 5500 A (Schuster & Parrao 2001). The second-order extinction and linear-transformation coeffi-cients for correcting to extra-atmospheric standardmagnitudes and colors are very similar from nightto night, and also from run to run, because, (i) theSPM has excellent sky conditions, and (ii) the sameinstrumental setup, observing techniques, and datareduction procedures were used for all nights duringboth observing runs. In Table 2 the mean zero-pointcorrections, atmospheric extinction, and transforma-tion coefficients are given.
In Tables 3, 4, and 5 are given the final trans-formed CCD UBVRI photometric values for theopen clusters, Be 89, Ru 135, and Be 10, respec-tively. In these tables Columns 1 and 2 give the Xand Y (pixels) the position of a star in the CCD field;Columns 3, 5, 7, 9, and 11 the magnitude and colorindices V , (B − V ), (U −B), (V −R), and (V − I),respectively (in magnitudes); and Columns 4, 6,8, 10, and 12 the respective photometric errors,σV , σB−V , σU−B , σV −R, and σV −I (in magnitudes),as provided by IRAF.

© C
op
yri
gh
t 2
01
0: In
stitu
to d
e A
stro
no
mía
, U
niv
ers
ida
d N
ac
ion
al A
utó
no
ma
de
Mé
xic
o
UBVRI PHOTOMETRY OF OPEN CLUSTERS 389
TABLE 3
CCD UBVRI PHOTOMETRY OF BE 89
X Y V σV (B − V ) σB−V (U − B) σU−B (V − R) σV −R (V − I) σV −I
767.7 538.3 11.261 0.006 0.441 0.009 0.002 0.007 0.315 0.009 99.999 99.999
466.5 496.2 12.118 0.011 1.362 0.018 1.191 0.011 0.742 0.013 1.399 0.013
511.7 742.6 12.172 0.008 0.443 0.011 0.268 0.005 0.296 0.011 0.569 0.017
213 99.5 12.333 0.006 0.791 0.009 0.359 0.007 0.378 0.012 99.999 99.999
741.7 403.2 12.911 0.005 1.193 0.007 0.855 0.008 0.629 0.008 1.182 0.01
113.3 465.7 13.309 0.004 0.658 0.006 −0.019 0.006 0.351 0.005 0.705 0.006
678.3 596.5 13.754 0.006 1.921 0.014 1.75 0.024 1.058 0.009 2 0.012
464.6 338.7 13.761 0.006 0.706 0.01 0.07 0.01 0.396 0.008 0.725 0.007
834.1 610.2 13.972 0.004 0.735 0.007 0.113 0.009 0.403 0.007 0.777 0.006
701.2 578.9 13.98 0.005 0.875 0.009 0.333 0.011 0.508 0.01 0.932 0.008
254.5 280.4 14.089 0.004 0.819 0.007 0.176 0.009 0.463 0.006 0.897 0.006
198 28.1 14.141 0.016 1.317 0.025 0.695 0.015 0.871 0.019 1.663 0.017
312.4 276.8 14.279 0.004 1.948 0.014 2.029 0.041 1.023 0.006 1.985 0.007
541.6 770.5 14.368 0.01 1.818 0.059 1.688 0.058 0.95 0.015 1.842 0.015
334.6 31.2 14.416 0.006 0.779 0.01 0.179 0.012 0.425 0.009 0.853 0.008
842.2 789.4 14.475 0.004 2.238 0.012 99.999 99.999 1.33 0.006 2.632 0.011
592.1 526.6 14.528 0.006 0.79 0.011 0.104 0.011 0.422 0.009 0.858 0.009
560.7 782.1 14.593 0.006 0.868 0.009 0.25 0.013 0.454 0.007 0.902 0.007
613.3 190.6 14.663 0.006 1.711 0.018 99.999 99.999 0.907 0.01 1.785 0.008
675.9 887.1 14.669 0.005 0.846 0.009 0.241 0.013 0.481 0.006 0.929 0.006
360.9 268.5 14.678 0.004 1.717 0.011 1.441 0.032 0.901 0.006 1.683 0.006
482.7 702.4 14.727 0.005 1.649 0.011 1.23 0.029 0.895 0.007 1.752 0.007
645.6 248.1 14.744 0.006 0.691 0.009 0.366 0.013 0.353 0.008 0.787 0.007
268.8 739 14.759 0.005 1.001 0.01 0.655 0.015 0.55 0.007 1.024 0.007
399.4 206.7 14.83 0.006 0.914 0.01 0.308 0.015 0.518 0.007 0.95 0.007
323 88.8 14.851 0.006 0.726 0.009 0.131 0.013 0.409 0.007 0.829 0.007
791.4 99.7 14.862 0.005 1.574 0.012 1.299 0.033 0.872 0.008 1.696 0.007
416.2 595.1 14.916 0.006 0.829 0.012 0.256 0.015 0.443 0.008 0.878 0.008
219.1 264.4 14.92 0.004 0.83 0.008 0.184 0.014 0.481 0.006 0.913 0.006
758.7 277.5 15.017 0.003 1.582 0.01 1.294 0.035 0.868 0.006 1.68 0.005
385.7 51 15.02 0.005 1.059 0.01 0.974 0.022 0.612 0.007 1.092 0.007
797.4 412.5 15.033 0.004 1.676 0.012 1.436 0.042 0.916 0.007 1.763 0.006
196 157.7 15.054 0.004 1.644 0.013 1.39 0.041 0.89 0.007 1.715 0.006
365.3 316 15.062 0.006 0.687 0.01 0.347 0.013 0.363 0.007 0.79 0.007
338.1 499.2 15.082 0.029 1.49 0.048 99.999 99.999 0.897 0.037 1.713 0.032
579.6 621.2 15.095 0.006 1.553 0.018 1.32 0.046 0.874 0.012 1.684 0.013
738.4 183 15.1 0.005 0.983 0.01 0.543 0.024 0.495 0.006 0.986 0.006
640.5 610.8 15.128 0.006 1.618 0.015 1.289 0.042 0.917 0.01 1.726 0.009
535.4 889.9 15.137 0.004 1.647 0.01 1.373 0.041 0.884 0.006 1.718 0.006
521.7 859.9 15.181 0.004 1.652 0.012 1.448 0.042 0.909 0.007 1.733 0.007
923.2 159.1 15.185 0.007 0.816 0.015 0.248 0.02 0.465 0.01 0.974 0.009
648.5 469.9 15.227 0.006 1.596 0.015 1.371 0.044 0.878 0.01 99.999 99.999
620.5 76.6 15.257 0.006 0.906 0.011 0.312 0.018 0.508 0.007 0.998 0.007
408.6 525 15.258 0.006 0.705 0.012 0.313 0.017 0.408 0.009 0.884 0.007
574.2 818 15.283 0.004 1.718 0.013 1.414 0.049 0.914 0.007 1.785 0.007
697.8 177.7 15.297 0.005 1.225 0.012 0.75 0.027 0.643 0.007 1.283 0.007
916.7 274.2 15.308 0.004 1.523 0.012 1.284 0.037 0.818 0.007 1.602 0.006
601.1 523.6 15.338 0.007 0.671 0.012 0.251 0.015 0.403 0.01 0.884 0.01
53 615 15.445 0.008 1.002 0.016 0.516 0.026 0.527 0.011 1.011 0.01
350.5 182.5 15.466 0.006 0.911 0.011 0.326 0.025 0.5 0.008 1.006 0.007
112.3 890.9 15.494 0.011 0.863 0.019 0.22 0.022 0.521 0.016 0.961 0.024
389.8 609.1 15.51 0.006 0.807 0.011 0.09 0.016 0.456 0.008 0.885 0.007
803 547.1 15.534 0.005 1.337 0.012 1.052 0.041 0.763 0.008 1.397 0.007
538 360.7 15.571 0.007 1.071 0.014 0.379 0.02 0.641 0.009 1.239 0.008
925.7 533.9 15.576 0.006 0.997 0.011 0.578 0.026 0.537 0.007 1.01 0.007
594.4 466.9 15.658 0.007 0.873 0.013 0.559 0.023 0.471 0.01 1.031 0.009
653.4 273.1 15.665 0.006 0.77 0.012 0.357 0.02 0.456 0.008 0.952 0.008
299.5 235.1 15.713 0.006 1.038 0.012 0.406 0.026 0.609 0.008 1.23 0.007
298.7 224.4 15.766 0.006 0.979 0.011 0.271 0.024 0.542 0.008 1.115 0.007
330 898.6 15.832 0.007 2.318 0.023 99.999 99.999 1.272 0.009 2.36 0.007
969 823.5 15.875 0.007 1.662 0.018 1.08 0.063 0.982 0.01 1.87 0.008
328.6 933.5 15.876 0.008 0.839 0.015 0.127 0.02 0.491 0.011 0.959 0.01
281.7 565.7 15.921 0.006 0.979 0.014 0.506 0.03 0.497 0.008 0.976 0.009

© C
op
yri
gh
t 2
01
0: In
stitu
to d
e A
stro
no
mía
, U
niv
ers
ida
d N
ac
ion
al A
utó
no
ma
de
Mé
xic
o
390 AKKAYA ET AL.
TABLE 3 (CONTINUED)
X Y V σV (B − V ) σB−V (U − B) σU−B (V − R) σV −R (V − I) σV −I
337.1 623.4 15.964 0.033 1.211 0.052 0.477 0.035 0.656 0.047 1.349 0.035
375.5 847.5 15.993 0.007 0.994 0.015 0.453 0.031 0.542 0.009 1.044 0.009
110.4 961 16.023 0.012 0.917 0.022 0.315 0.027 0.567 0.018 1.051 0.034
713.7 22.8 16.05 0.014 0.946 0.023 0.373 0.035 0.559 0.034 1.207 0.023
451 508.7 16.078 0.006 1.176 0.016 0.392 0.041 0.679 0.009 1.366 0.009
369.5 170.1 16.087 0.006 1.074 0.014 0.431 0.03 0.641 0.008 1.262 0.007
162.3 731 16.115 0.008 1.018 0.016 0.458 0.031 0.582 0.01 1.158 0.009
271.3 105.4 16.162 0.008 0.983 0.016 0.297 0.029 0.551 0.01 1.104 0.01
471.7 585.8 16.185 0.006 1.207 0.015 0.464 0.037 0.655 0.01 1.359 0.008
356.9 708 16.191 0.006 1.081 0.016 0.463 0.029 0.634 0.008 1.33 0.007
476.4 570.8 16.2 0.012 1.113 0.024 0.451 0.037 0.639 0.029 1.285 0.026
181.2 944.2 16.211 0.009 1.182 0.021 0.455 0.036 0.724 0.016 1.34 0.027
802 593.9 16.212 0.007 0.882 0.015 0.252 0.029 0.494 0.009 0.956 0.009
22.8 76.8 16.24 0.012 0.897 0.022 0.305 0.032 0.57 0.017 1.103 0.015
276.6 796 16.241 0.007 2.443 0.026 99.999 99.999 1.332 0.009 2.534 0.008
512.7 161.5 16.248 0.007 1.015 0.015 0.379 0.035 0.588 0.01 1.206 0.008
234.9 633.8 16.28 0.006 1.634 0.019 1.317 0.087 0.901 0.008 1.712 0.007
329 471.8 16.291 0.011 1.307 0.024 1.078 0.055 0.727 0.019 1.429 0.026
489.9 562.9 16.304 0.007 0.927 0.016 0.405 0.031 0.53 0.01 1.098 0.009
733.2 794.9 16.312 0.006 1.208 0.016 0.617 0.04 0.717 0.009 1.435 0.008
305.2 840.3 16.322 0.005 1.173 0.016 0.614 0.045 0.694 0.008 1.378 0.008
437 570.1 16.329 0.008 1.223 0.019 0.526 0.04 0.682 0.012 1.393 0.01
535.2 540.7 16.358 0.008 1.619 0.022 1.143 0.081 0.92 0.011 1.736 0.01
918.4 181.7 16.358 0.008 1.065 0.018 0.713 0.056 0.585 0.012 1.102 0.009
800.1 734.7 16.359 0.006 1.084 0.015 0.722 0.042 0.595 0.009 1.122 0.008
550.3 660.5 16.378 0.007 0.987 0.016 0.35 0.027 0.531 0.01 1.121 0.009
32.2 883.4 16.394 0.015 0.99 0.028 0.285 0.037 0.585 0.02 99.999 99.999
985.1 387.1 16.407 0.008 2.525 0.035 99.999 99.999 1.364 0.01 2.644 0.008
31.9 844.7 16.409 0.015 1.148 0.028 0.624 0.051 0.631 0.02 99.999 99.999
172.4 134.1 16.413 0.008 1.067 0.019 0.538 0.044 0.613 0.011 1.262 0.01
196.1 310.2 16.421 0.007 1.047 0.016 0.436 0.037 0.558 0.009 1.102 0.009
624 463.7 16.428 0.008 0.975 0.016 0.5 0.043 0.533 0.011 1.055 0.012
860.7 116.4 16.432 0.007 1.057 0.019 0.44 0.039 0.643 0.012 1.289 0.009
555.2 346.8 16.457 0.012 1.537 0.022 1.151 0.074 0.851 0.011 1.67 0.009
659.5 820.6 16.457 0.007 1.293 0.019 0.622 0.052 0.739 0.01 1.471 0.009
502.4 82.9 16.467 0.007 1.077 0.017 0.407 0.038 0.648 0.01 1.279 0.01
797.1 496.5 16.472 0.007 1.024 0.016 0.397 0.035 0.625 0.011 1.275 0.008
89.5 532.4 16.492 0.008 1.681 0.023 99.999 99.999 0.924 0.011 1.786 0.009
852.3 148.8 16.501 0.01 0.886 0.021 0.361 0.035 0.551 0.014 1.051 0.029
602.7 723.9 16.515 0.008 2.703 0.043 99.999 99.999 1.587 0.01 3.138 0.008
910.3 744.4 16.523 0.007 1.097 0.018 0.384 0.033 0.679 0.01 1.35 0.009
474.6 116.8 16.527 0.007 1.121 0.019 0.381 0.041 0.642 0.01 1.271 0.009
155.5 37.2 16.538 0.01 1.145 0.021 0.705 0.05 0.638 0.014 1.212 0.03
667.2 46.2 16.554 0.007 1.143 0.016 99.999 99.999 0.569 0.01 1.123 0.009
340 851.1 16.556 0.008 1.061 0.018 0.213 0.041 0.605 0.011 1.195 0.01
612.5 514.7 16.565 0.008 1.09 0.018 0.459 0.04 0.618 0.012 1.301 0.011
638.7 75.3 16.576 0.007 1.082 0.019 0.376 0.041 0.626 0.011 1.26 0.01
121.6 104.7 16.587 0.01 2.263 0.036 99.999 99.999 1.248 0.013 2.36 0.011
148.3 445.5 16.587 0.008 1.048 0.018 0.335 0.036 0.6 0.01 1.217 0.009
566.6 490.7 16.594 0.011 1.077 0.025 0.411 0.049 0.656 0.019 1.314 0.014
489.2 177 16.597 0.007 1.148 0.019 0.428 0.05 0.623 0.01 1.271 0.009
190.8 98.6 16.61 0.009 1.016 0.02 0.394 0.043 0.528 0.012 1.074 0.011
16.9 777.2 16.621 0.013 1.13 0.027 0.337 0.046 0.646 0.018 1.275 0.017
634.9 654.1 16.621 0.009 1.07 0.019 0.304 0.039 0.622 0.013 1.25 0.012
366.6 579.9 16.632 0.007 1.145 0.02 0.421 0.043 0.691 0.011 1.383 0.01
481.7 654.7 16.632 0.008 1.155 0.021 0.491 0.048 0.649 0.012 1.371 0.01
951.4 209.9 16.633 0.012 1.097 0.025 0.623 0.05 0.594 0.02 1.104 0.029
809.9 321.1 16.646 0.007 1.114 0.019 0.429 0.042 0.645 0.011 1.276 0.009
479 327.2 16.669 0.008 1.193 0.021 0.889 0.064 0.626 0.012 1.168 0.011
540.8 337.6 16.68 0.013 1.412 0.024 1.014 0.08 0.819 0.013 1.583 0.011
804.6 180.9 16.684 0.018 1.015 0.036 0.396 0.063 0.421 0.049 1.112 0.043
705.8 675 16.7 0.008 1.016 0.019 0.349 0.036 0.609 0.011 1.254 0.011
126.4 135.2 16.706 0.008 1.022 0.018 0.358 0.038 0.564 0.012 1.127 0.011
70.3 281.9 16.71 0.007 1.154 0.021 0.568 0.055 0.678 0.012 1.367 0.011
231.1 990 16.711 0.009 1.063 0.023 0.424 0.05 0.65 0.016 1.302 0.014

© C
op
yri
gh
t 2
01
0: In
stitu
to d
e A
stro
no
mía
, U
niv
ers
ida
d N
ac
ion
al A
utó
no
ma
de
Mé
xic
o
UBVRI PHOTOMETRY OF OPEN CLUSTERS 391
TABLE 3 (CONTINUED)
X Y V σV (B − V ) σB−V (U − B) σU−B (V − R) σV −R (V − I) σV −I
699.6 149.3 16.725 0.008 1.137 0.02 0.445 0.05 0.629 0.011 1.279 0.01
521.1 506 16.726 0.007 1.203 0.022 0.423 0.051 0.69 0.012 1.379 0.01
535.5 304.3 16.752 0.014 99.999 99.999 99.999 99.999 0.548 0.05 99.999 99.999
228.4 593.8 16.755 0.008 1.067 0.018 0.297 0.049 0.643 0.012 1.264 0.012
457.6 417.9 16.765 0.008 1.084 0.02 0.501 0.049 0.612 0.011 1.239 0.01
341.7 150.6 16.767 0.007 1.055 0.02 0.343 0.05 0.632 0.011 1.209 0.01
117.5 677.4 16.768 0.007 1.098 0.021 0.412 0.056 0.699 0.012 1.341 0.009
609.1 701.3 16.776 0.008 0.944 0.018 0.242 0.044 0.574 0.012 1.171 0.01
285.2 586.1 16.781 0.008 1.19 0.02 0.556 0.058 0.709 0.011 1.379 0.01
137 372.4 16.781 0.008 1.079 0.021 0.407 0.05 0.629 0.012 1.224 0.011
283.5 57.3 16.786 0.008 1.033 0.021 0.301 0.041 0.611 0.011 1.225 0.01
875.4 230.6 16.791 0.009 1.686 0.025 99.999 99.999 0.932 0.012 1.824 0.01
646 637.8 16.793 0.008 0.941 0.018 0.255 0.046 0.579 0.01 1.061 0.01
950.4 189.7 16.796 0.009 1.119 0.022 0.444 0.047 0.617 0.014 1.303 0.012
702.9 955.9 16.802 0.008 1.073 0.021 0.389 0.051 0.648 0.013 1.277 0.011
791.6 205.4 16.805 0.007 1.029 0.018 0.396 0.041 0.571 0.01 1.208 0.009
444.9 34.3 16.806 0.011 1.078 0.029 0.605 0.058 0.661 0.019 1.244 0.032
27.9 886.1 16.809 0.015 1.125 0.031 0.408 0.055 0.581 0.042 99.999 99.999
346.7 344 16.846 0.009 1.112 0.021 0.456 0.059 0.63 0.012 1.311 0.012
865 505.3 16.847 0.007 1.166 0.022 0.525 0.047 0.705 0.012 1.397 0.01
528.3 698.1 16.851 0.008 1.096 0.019 0.392 0.05 0.634 0.012 1.291 0.01
796.7 158.7 16.856 0.009 2.059 0.037 99.999 99.999 1.138 0.012 2.192 0.009
89 808.1 16.857 0.012 2.062 0.037 99.999 99.999 1.105 0.017 2.137 0.014
875.6 485.8 16.857 0.008 1.21 0.025 0.575 0.055 0.599 0.014 1.234 0.011
337.5 763 16.858 0.011 1.084 0.025 0.489 0.057 0.571 0.018 1.149 0.016
363.3 573.6 16.872 0.009 0.991 0.019 0.256 0.047 0.583 0.012 1.194 0.011
345 253.6 16.885 0.007 1.132 0.02 0.474 0.047 0.657 0.011 1.347 0.011
397.1 845.7 16.891 0.008 1.041 0.02 0.36 0.048 0.628 0.012 1.278 0.01
559.6 440 16.897 0.008 1.09 0.022 0.364 0.051 0.616 0.013 1.282 0.011
737.7 258.6 16.903 0.011 0.866 0.021 0.513 0.05 0.515 0.014 1.087 0.013
64.4 175.6 16.906 0.009 1.845 0.032 99.999 99.999 1.05 0.013 2.038 0.011
441.6 469.4 16.912 0.008 1.121 0.022 0.537 0.056 0.677 0.013 1.294 0.012
621.1 540.1 16.914 0.01 1.047 0.023 0.406 0.055 0.601 0.013 1.146 0.012
548.5 711.8 16.916 0.008 1.117 0.024 0.302 0.054 0.642 0.013 1.285 0.011
393.8 473.8 16.919 0.015 1.134 0.034 0.38 0.052 0.726 0.045 1.456 0.019
960.9 931.9 16.927 0.008 1.093 0.022 0.691 0.061 0.649 0.015 1.345 0.013
474.1 552.7 16.932 0.008 1.165 0.023 0.553 0.069 0.649 0.012 1.333 0.012
228.6 274.8 16.936 0.01 0.965 0.023 0.636 0.06 0.559 0.013 1.093 0.012
490.7 545 16.941 0.01 1.693 0.03 99.999 99.999 0.94 0.013 1.866 0.011
507.7 216 16.978 0.007 1.122 0.023 0.517 0.061 0.646 0.012 1.27 0.011
907.1 680 16.98 0.008 1.142 0.021 0.464 0.067 0.631 0.011 1.326 0.01
763.3 911.5 16.987 0.008 1.076 0.025 0.419 0.05 0.654 0.012 1.322 0.012
199.4 13.4 16.989 0.01 1.065 0.025 0.363 0.056 0.597 0.016 1.266 0.015
431 371.1 16.995 0.009 2.693 0.051 99.999 99.999 1.471 0.012 2.801 0.009
465.3 114.7 17.017 0.014 1.188 0.03 99.999 99.999 0.744 0.021 1.357 0.036
307.3 234.8 17.022 0.01 2.23 0.043 99.999 99.999 1.252 0.012 2.387 0.011
539 303.5 17.023 0.017 99.999 99.999 99.999 99.999 0.508 0.06 99.999 99.999
723.5 743 17.031 0.01 1.928 0.035 99.999 99.999 1.046 0.012 2.081 0.011
676.3 716.3 17.037 0.006 1.093 0.02 0.316 0.056 0.613 0.011 1.253 0.01
960.1 844.3 17.038 0.011 1.191 0.026 0.519 0.067 0.719 0.015 1.408 0.012
462.5 542.5 17.054 0.011 0.865 0.023 0.454 0.054 0.557 0.014 1.073 0.012
644.8 122.5 17.064 0.012 1.052 0.031 0.46 0.063 0.596 0.019 1.226 0.014
938.6 483.7 17.065 0.009 1.026 0.022 0.48 0.059 0.607 0.012 1.3 0.012
910.1 919.8 17.07 0.008 1.079 0.023 0.349 0.065 0.646 0.013 1.281 0.013
473 611.3 17.076 0.009 1.165 0.026 0.467 0.064 0.676 0.014 1.342 0.012
110.2 642.8 17.086 0.01 1.142 0.024 0.466 0.065 0.645 0.014 1.319 0.013
743.3 347.4 17.09 0.01 1.134 0.023 0.465 0.058 0.615 0.014 1.292 0.013
139.5 848.1 17.095 0.012 0.986 0.025 0.325 0.06 0.594 0.018 1.171 0.015
444.2 599.1 17.101 0.008 1.133 0.025 0.35 0.06 0.66 0.012 1.338 0.012
802.7 294.5 17.103 0.006 1.031 0.022 0.533 0.068 0.613 0.011 1.164 0.01
262.2 983.6 17.11 0.01 1.12 0.025 0.45 0.066 0.61 0.015 1.226 0.013
30.5 544.8 17.116 0.009 1.1 0.026 0.282 0.06 0.629 0.015 1.3 0.013
352.4 618.3 17.135 0.008 1.107 0.025 0.372 0.07 0.609 0.012 1.285 0.011
588 777.6 17.138 0.008 1.07 0.024 0.36 0.067 0.618 0.012 1.226 0.011
328.1 375.7 17.139 0.011 1.051 0.026 0.389 0.066 0.578 0.015 1.176 0.014

© C
op
yri
gh
t 2
01
0: In
stitu
to d
e A
stro
no
mía
, U
niv
ers
ida
d N
ac
ion
al A
utó
no
ma
de
Mé
xic
o
392 AKKAYA ET AL.
TABLE 3 (CONTINUED)
X Y V σV (B − V ) σB−V (U − B) σU−B (V − R) σV −R (V − I) σV −I
483.7 613.6 17.148 0.009 1.14 0.026 0.647 0.083 0.666 0.015 1.34 0.013
863.8 539.9 17.151 0.01 1.026 0.025 0.254 0.058 0.562 0.014 1.119 0.012
433.7 875.2 17.155 0.009 1.105 0.022 0.388 0.068 0.587 0.012 1.241 0.011
659.9 385.8 17.156 0.008 2.042 0.036 99.999 99.999 1.122 0.012 2.142 0.01
6.8 313.8 17.16 0.013 1.108 0.028 0.39 0.061 0.616 0.017 1.308 0.016
798.5 918.2 17.16 0.009 1.403 0.024 99.999 99.999 0.821 0.012 1.626 0.01
500.4 607.6 17.163 0.009 1.122 0.025 0.462 0.061 0.631 0.014 1.316 0.013
122.5 981.5 17.164 0.011 1.112 0.03 0.407 0.066 0.646 0.02 1.298 0.017
105.6 945.9 17.172 0.012 1.529 0.034 99.999 99.999 0.865 0.018 1.588 0.034
228.4 154.3 17.183 0.011 1.112 0.028 0.403 0.062 0.645 0.016 1.287 0.015
422.2 539.7 17.183 0.008 1.046 0.026 0.412 0.073 0.636 0.012 1.299 0.012
370.6 439 17.184 0.009 1.051 0.027 0.351 0.055 0.638 0.014 1.285 0.012
234.2 343.7 17.186 0.011 1.187 0.026 99.999 99.999 0.655 0.017 1.367 0.016
227.1 821.9 17.192 0.008 1.085 0.023 0.339 0.062 0.65 0.014 1.322 0.012
465.7 248.2 17.192 0.009 1.103 0.027 0.514 0.08 0.649 0.014 1.316 0.012
939.4 176.1 17.192 0.01 1.276 0.026 99.999 99.999 0.68 0.013 1.285 0.011
698.4 981.9 17.203 0.009 1.132 0.023 0.379 0.073 0.675 0.013 1.323 0.012
577.4 617 17.206 0.017 1.051 0.04 0.388 0.076 0.648 0.026 1.316 0.023
841.5 346.2 17.211 0.011 0.902 0.023 0.442 0.052 0.545 0.013 1.135 0.012
191.2 676.1 17.226 0.012 1.195 0.026 0.488 0.083 0.723 0.014 1.361 0.012
433.9 990.1 17.239 0.007 1.035 0.024 0.315 0.066 0.632 0.013 1.306 0.011
990.5 723.5 17.239 0.009 1.11 0.027 0.497 0.071 0.661 0.014 1.364 0.013
256.6 669.7 17.24 0.009 1.123 0.024 0.443 0.09 0.653 0.014 1.331 0.012
72.1 429.1 17.242 0.01 1.236 0.026 0.365 0.079 0.65 0.016 1.36 0.014
718.7 71.2 17.242 0.011 1.323 0.03 99.999 99.999 0.798 0.013 1.492 0.013
78.1 850.3 17.252 0.012 1.131 0.032 0.516 0.081 0.644 0.02 1.243 0.017
18.5 219.1 17.275 0.01 1.147 0.025 0.244 0.067 0.65 0.018 1.289 0.014
155.1 955.3 17.275 0.012 1.127 0.032 0.594 0.094 0.648 0.021 1.242 0.018
167 21.9 17.281 0.015 1.143 0.035 99.999 99.999 0.647 0.021 1.348 0.018
295.3 505.3 17.283 0.011 1.932 0.042 99.999 99.999 1.1 0.014 2.109 0.012
828.6 353.3 17.287 0.01 1.08 0.025 0.365 0.065 0.631 0.014 1.299 0.013
225.2 114.1 17.3 0.013 1.36 0.038 99.999 99.999 0.828 0.017 1.567 0.015
768.4 225 17.306 0.01 1.067 0.028 0.302 0.072 0.631 0.016 1.253 0.013
756.9 386.8 17.307 0.008 1.145 0.025 0.255 0.07 0.664 0.013 1.308 0.011
441.8 494.7 17.311 0.011 1.193 0.026 0.398 0.069 0.7 0.015 1.36 0.014
838.2 847.6 17.316 0.009 1.105 0.027 0.333 0.056 0.676 0.013 1.354 0.012
916 358.1 17.327 0.01 1.089 0.026 0.611 0.096 0.652 0.015 1.349 0.013
900.7 93.4 17.331 0.01 1.051 0.029 0.715 0.082 0.687 0.017 1.401 0.012
273.2 622.7 17.333 0.007 1.028 0.022 0.578 0.072 0.642 0.012 1.301 0.011
537.3 569.2 17.337 0.011 1.088 0.026 0.335 0.074 0.69 0.015 1.322 0.014
292.2 742.1 17.348 0.011 1.107 0.025 0.443 0.086 0.686 0.015 1.348 0.016
522.9 33.2 17.354 0.01 1.308 0.031 99.999 99.999 0.678 0.014 1.315 0.012
520.8 847.5 17.357 0.011 1.113 0.028 99.999 99.999 0.657 0.016 1.275 0.014
331.5 821.6 17.364 0.008 1.062 0.025 0.413 0.065 0.648 0.014 1.246 0.013
491.6 464.3 17.373 0.01 1.119 0.027 0.275 0.068 0.644 0.016 1.314 0.014
496.6 132.8 17.374 0.011 1.092 0.029 0.496 0.105 0.671 0.016 1.317 0.014
715.5 758.5 17.381 0.012 1.233 0.03 99.999 99.999 0.667 0.015 1.335 0.014
560.8 66.1 17.383 0.012 1.208 0.032 99.999 99.999 0.683 0.016 1.405 0.013
649.7 229.5 17.384 0.01 2.199 0.048 99.999 99.999 1.168 0.014 2.263 0.011
451.4 513.5 17.391 0.016 1.191 0.036 99.999 99.999 0.661 0.02 1.423 0.018
27.4 448.9 17.395 0.01 1.132 0.029 0.41 0.093 0.671 0.014 1.359 0.013
91.2 632.9 17.397 0.009 1.184 0.029 0.378 0.088 0.638 0.015 1.274 0.013
694.9 797.3 17.397 0.01 1.134 0.028 0.531 0.075 0.656 0.016 1.364 0.016
282.6 702.2 17.406 0.011 1.08 0.028 0.427 0.082 0.688 0.013 1.344 0.013
729.7 314.3 17.419 0.011 1.022 0.029 0.365 0.078 0.576 0.015 1.232 0.013
480.3 645.2 17.432 0.013 2.001 0.045 99.999 99.999 1.109 0.016 2.17 0.014
719.4 230.2 17.447 0.014 1.186 0.03 0.51 0.098 0.709 0.016 1.38 0.014
863.8 60.3 17.447 0.01 2.317 0.056 99.999 99.999 1.247 0.015 2.393 0.012
915.3 33.9 17.455 0.011 1.029 0.03 0.333 0.081 0.667 0.017 1.35 0.014
885.8 159.6 17.46 0.009 1.176 0.029 0.371 0.078 0.619 0.014 1.301 0.012
368.6 506.4 17.463 0.013 1.159 0.033 99.999 99.999 0.704 0.021 1.269 0.036
475.2 921.3 17.465 0.011 1.088 0.026 99.999 99.999 0.629 0.015 1.249 0.013
813.4 464.2 17.469 0.01 1.595 0.032 99.999 99.999 0.876 0.014 1.738 0.012
421.9 770 17.474 0.009 1.131 0.03 0.577 0.098 0.638 0.014 1.316 0.012
937 240.9 17.488 0.011 1.094 0.027 0.427 0.116 0.673 0.016 1.328 0.014

© C
op
yri
gh
t 2
01
0: In
stitu
to d
e A
stro
no
mía
, U
niv
ers
ida
d N
ac
ion
al A
utó
no
ma
de
Mé
xic
o
UBVRI PHOTOMETRY OF OPEN CLUSTERS 393
TABLE 3 (CONTINUED)
X Y V σV (B − V ) σB−V (U − B) σU−B (V − R) σV −R (V − I) σV −I
98.1 961.1 17.492 0.016 1.336 0.041 99.999 99.999 0.827 0.022 1.519 0.02
295 455.6 17.506 0.01 1.227 0.027 99.999 99.999 0.679 0.014 1.31 0.012
786.1 494.9 17.507 0.011 1.211 0.032 0.568 0.098 0.639 0.017 1.222 0.015
301 57 17.508 0.011 1.831 0.044 99.999 99.999 0.982 0.015 1.973 0.012
201.2 626.5 17.51 0.011 1.173 0.028 99.999 99.999 0.721 0.016 1.443 0.014
393.9 344.5 17.53 0.01 1.082 0.026 0.392 0.082 0.628 0.017 1.285 0.013
550.5 185.3 17.535 0.012 1.089 0.031 0.378 0.092 0.645 0.017 1.254 0.016
299 296.1 17.553 0.013 2.269 0.062 99.999 99.999 1.24 0.017 2.391 0.013
252.5 767.4 17.554 0.012 1.231 0.034 0.417 0.095 0.673 0.015 1.299 0.014
515 472 17.566 0.015 1.214 0.034 0.3 0.074 0.692 0.019 1.306 0.018
298.1 519.4 17.569 0.011 1.054 0.031 99.999 99.999 0.68 0.016 1.282 0.013
697.3 560 17.573 0.011 0.994 0.031 0.284 0.079 0.618 0.016 1.299 0.015
600.6 109.6 17.593 0.012 1.082 0.033 0.214 0.082 0.586 0.018 1.201 0.015
264.2 721.5 17.612 0.013 1.205 0.036 99.999 99.999 0.656 0.017 1.379 0.015
590 536.8 17.625 0.011 1.03 0.032 0.499 0.108 0.633 0.017 1.281 0.015
343 560.6 17.628 0.013 1.189 0.033 99.999 99.999 0.655 0.017 1.359 0.015
868.5 185.7 17.632 0.01 2.19 0.063 99.999 99.999 1.318 0.014 2.502 0.011
420.9 615.5 17.638 0.015 1.232 0.037 99.999 99.999 0.666 0.022 1.389 0.02
947.8 483.3 17.65 0.01 1.645 0.039 99.999 99.999 0.95 0.014 1.785 0.012
777.9 17.2 17.662 0.015 1.007 0.037 0.514 0.095 0.606 0.021 1.248 0.02
355.5 944.5 17.688 0.013 1.041 0.036 99.999 99.999 0.673 0.017 1.31 0.015
265.5 580.4 17.689 0.027 1.214 0.037 0.376 0.124 0.738 0.017 1.422 0.016
167.8 837.6 17.694 0.016 1.051 0.036 99.999 99.999 0.663 0.023 1.347 0.02
693.8 599.4 17.698 0.01 1.03 0.032 0.395 0.097 0.617 0.017 1.289 0.016
156.8 336.5 17.698 0.011 1.012 0.031 0.427 0.123 0.652 0.016 1.296 0.015
477.9 777.1 17.701 0.013 1.133 0.035 99.999 99.999 0.714 0.018 1.397 0.014
150.4 402.6 17.702 0.014 1.175 0.037 99.999 99.999 0.689 0.018 1.349 0.016
797.1 769.8 17.709 0.013 1.872 0.053 99.999 99.999 1.037 0.016 2.009 0.014
460.4 236.6 17.71 0.013 1.162 0.032 99.999 99.999 0.635 0.016 1.296 0.015
332.4 289.9 17.714 0.01 1.195 0.034 99.999 99.999 0.679 0.015 1.28 0.013
637.3 500 17.715 0.014 1.079 0.031 0.282 0.086 0.667 0.019 1.323 0.018
654.7 130.4 17.717 0.014 1.059 0.031 99.999 99.999 0.657 0.018 1.295 0.015
270.3 570.8 17.736 0.011 1.018 0.028 99.999 99.999 0.62 0.016 1.215 0.013
773.2 789.6 17.756 0.013 1.221 0.031 99.999 99.999 0.629 0.018 1.279 0.015
947.8 510.1 17.757 0.014 1.173 0.039 99.999 99.999 0.684 0.018 1.383 0.016
848.4 634.6 17.758 0.013 1.104 0.031 99.999 99.999 0.674 0.017 1.372 0.015
271.4 293.9 17.762 0.013 1.327 0.04 99.999 99.999 0.748 0.017 1.501 0.014
599.7 480.7 17.762 0.013 1.08 0.035 99.999 99.999 0.648 0.018 1.341 0.014
396.1 530.2 17.764 0.014 1.121 0.035 99.999 99.999 0.686 0.018 1.344 0.015
171.3 697 17.768 0.012 1.24 0.032 99.999 99.999 0.697 0.017 1.339 0.014
473.7 619.3 17.771 0.014 1.16 0.037 99.999 99.999 0.711 0.018 1.336 0.017
352.8 601.4 17.775 0.015 2.14 0.075 99.999 99.999 1.231 0.02 2.34 0.017
644.7 501.5 17.781 0.013 1.382 0.039 99.999 99.999 0.856 0.017 1.499 0.015
495.8 754.9 17.782 0.011 99.999 99.999 99.999 99.999 1.138 0.015 2.198 0.012
612 731.4 17.783 0.015 1.084 0.031 99.999 99.999 0.647 0.02 99.999 99.999
594.3 135 17.786 0.015 1.1 0.035 99.999 99.999 0.658 0.019 1.315 0.018
894.3 258.4 17.786 0.013 1.11 0.033 99.999 99.999 0.624 0.017 1.396 0.014
176.1 418.4 17.787 0.012 1.145 0.036 99.999 99.999 0.692 0.017 1.318 0.014
37 537 17.798 0.012 1.108 0.035 0.296 0.108 0.65 0.019 1.301 0.017
202.8 614.2 17.816 0.015 1.15 0.037 99.999 99.999 0.699 0.021 1.325 0.0 2
100.3 831.9 17.817 0.018 1.254 0.044 99.999 99.999 0.781 0.023 1.535 0.02
349.5 443.3 17.818 0.014 1.244 0.035 99.999 99.999 0.722 0.019 1.46 0.016
620 710.2 17.823 0.016 0.953 0.032 99.999 99.999 0.526 0.021 1.116 0.019
697.3 808.6 17.825 0.012 1.166 0.036 99.999 99.999 0.667 0.016 1.332 0.015
702.2 313.4 17.826 0.01 0.929 0.032 0.337 0.083 0.635 0.016 1.224 0.015
901.3 624.2 17.829 0.013 1.18 0.037 99.999 99.999 0.674 0.017 1.351 0.015
40 988.9 17.831 0.017 1.087 0.044 99.999 99.999 0.642 0.027 1.285 0.023
853.3 284.8 17.831 0.013 1.142 0.031 99.999 99.999 0.652 0.016 1.301 0.015
395.1 491.5 17.841 0.016 1.121 0.037 99.999 99.999 0.713 0.022 1.415 0.019
701.8 917.8 17.841 0.014 1.113 0.034 99.999 99.999 0.565 0.019 1.197 0.016
680.3 990.6 17.844 0.014 1.105 0.034 99.999 99.999 0.66 0.018 1.341 0.015
18 523.6 17.853 0.016 1.836 0.056 99.999 99.999 0.99 0.021 2.025 0.018
454.2 604.3 17.875 0.014 1.13 0.04 99.999 99.999 0.661 0.018 1.306 0.016
808 847.1 17.901 0.014 1.144 0.037 99.999 99.999 0.671 0.018 1.37 0.016
423.7 945.2 17.902 0.015 1.178 0.039 99.999 99.999 0.662 0.019 1.354 0.017

© C
op
yri
gh
t 2
01
0: In
stitu
to d
e A
stro
no
mía
, U
niv
ers
ida
d N
ac
ion
al A
utó
no
ma
de
Mé
xic
o
394 AKKAYA ET AL.
TABLE 3 (CONTINUED)
X Y V σV (B − V ) σB−V (U − B) σU−B (V − R) σV −R (V − I) σV −I
934.4 643.1 17.907 0.023 1.1 0.035 0.362 0.103 0.697 0.018 1.411 0.016
158.7 860.2 17.909 0.014 1.164 0.037 99.999 99.999 0.593 0.02 1.298 0.018
933.2 454.9 17.915 0.014 1.82 0.054 99.999 99.999 1.113 0.017 2.093 0.014
212.8 312.1 17.918 0.017 1.966 0.062 99.999 99.999 1.062 0.022 2.11 0.017
423.1 473.2 17.923 0.014 1.285 0.042 99.999 99.999 0.678 0.021 1.334 0.018
256.8 290 17.926 0.022 1.18 0.053 99.999 99.999 0.746 0.031 1.418 0.026
768.3 456.2 17.927 0.015 1.095 0.04 99.999 99.999 0.767 0.019 1.477 0.017
800.6 29.4 17.937 0.014 1.333 0.038 99.999 99.999 0.755 0.019 1.517 0.015
408.6 342.1 17.938 0.011 1.383 0.041 99.999 99.999 0.851 0.018 1.676 0.013
819.9 70.2 17.941 0.015 1.177 0.038 99.999 99.999 0.699 0.02 1.347 0.017
619.3 600.4 17.942 0.015 1.16 0.038 99.999 99.999 0.718 0.02 1.414 0.018
685 318.2 17.947 0.022 1.167 0.045 0.338 0.145 0.653 0.031 99.999 99.999
759.6 596.5 17.949 0.015 1.039 0.037 99.999 99.999 0.669 0.02 1.294 0.019
631.4 957.1 17.954 0.015 1.155 0.038 99.999 99.999 0.665 0.02 1.334 0.017
103.3 152.3 17.956 0.012 1.875 0.057 99.999 99.999 1.035 0.018 2.017 0.013
168.4 572.7 17.957 0.015 1.202 0.038 99.999 99.999 0.657 0.02 1.305 0.018
232 672.9 17.957 0.014 1.076 0.035 99.999 99.999 0.659 0.019 1.312 0.016
833.2 591.5 17.963 0.015 1.228 0.041 99.999 99.999 0.677 0.02 1.362 0.018
540.5 391.8 17.966 0.014 2.186 0.077 99.999 99.999 1.34 0.018 2.453 0.015
732.5 883 17.971 0.014 1.174 0.042 99.999 99.999 0.655 0.019 1.271 0.016
598.9 30.6 17.974 0.014 1.311 0.043 99.999 99.999 0.739 0.019 1.44 0.018
740.2 383.7 17.987 0.014 1.058 0.036 99.999 99.999 0.683 0.018 1.383 0.018
802 146.5 17.987 0.017 1.962 0.08 99.999 99.999 1.105 0.021 2.155 0.018
885.8 577.4 17.992 0.014 1.125 0.039 99.999 99.999 0.768 0.019 1.429 0.017
532.5 462.6 18 0.017 1.157 0.045 99.999 99.999 0.687 0.021 1.312 0.021
894.3 338.5 18.007 0.015 2.014 0.058 99.999 99.999 1.14 0.019 2.213 0.016
515.8 864.9 18.019 0.014 1.205 0.045 99.999 99.999 0.741 0.021 1.374 0.022
795 576.5 18.019 0.015 1.112 0.036 99.999 99.999 0.618 0.021 1.33 0.018
149.5 240.8 18.021 0.016 1.349 0.048 99.999 99.999 0.756 0.02 1.502 0.018
920.5 611.5 18.024 0.014 1.123 0.037 99.999 99.999 0.71 0.019 1.44 0.017
305.1 181.3 18.027 0.018 1.35 0.044 99.999 99.999 0.735 0.023 1.521 0.02
61.8 47.7 18.035 0.015 1.319 0.054 99.999 99.999 0.737 0.021 1.495 0.018
365.8 415.3 18.037 0.021 1.221 0.049 99.999 99.999 0.707 0.034 1.434 0.027
802.9 423 18.046 0.015 1.632 0.051 99.999 99.999 0.922 0.019 1.883 0.016
357.9 121.2 18.047 0.014 1.069 0.036 99.999 99.999 0.601 0.02 1.27 0.016
227.5 614.8 18.05 0.015 1.885 0.061 99.999 99.999 1.044 0.019 2.069 0.016
221.6 732.1 18.058 0.016 1.354 0.044 99.999 99.999 0.726 0.02 1.401 0.018
668.8 333 18.073 0.016 1.1 0.043 99.999 99.999 0.621 0.021 1.31 0.019
675.5 609.9 18.074 0.016 1.119 0.041 99.999 99.999 0.69 0.022 1.268 0.043
531.4 458.6 18.077 0.018 1.193 0.047 99.999 99.999 0.62 0.023 1.33 0.02
613.9 660.8 18.087 0.015 1.106 0.04 99.999 99.999 0.646 0.019 1.327 0.017
224.7 288.7 18.089 0.016 2.236 0.074 99.999 99.999 1.198 0.021 2.306 0.017
493.7 688.9 18.093 0.014 1.382 0.048 99.999 99.999 0.768 0.019 1.521 0.017
761.6 179.8 18.096 0.016 1.225 0.046 99.999 99.999 0.584 0.021 1.25 0.019
163.1 475.8 18.108 0.015 1.132 0.043 99.999 99.999 0.694 0.022 1.307 0.019
729.5 255.7 18.112 0.018 2.025 0.085 99.999 99.999 1.153 0.023 2.206 0.019
438.5 375.8 18.12 0.014 1.361 0.043 99.999 99.999 0.788 0.019 1.495 0.016
619.9 803.7 18.129 0.017 1.054 0.042 99.999 99.999 0.69 0.02 1.349 0.019
653.4 98.1 18.137 0.018 1.188 0.044 99.999 99.999 0.709 0.024 1.439 0.021
536.9 405.5 18.143 0.015 1.175 0.04 99.999 99.999 0.652 0.021 1.362 0.018
447.6 730.4 18.145 0.016 1.235 0.049 99.999 99.999 0.675 0.02 1.375 0.019
701.6 478.9 18.146 0.017 1.485 0.055 99.999 99.999 0.956 0.021 1.982 0.018
15.4 93.9 18.154 0.018 1.272 0.051 99.999 99.999 0.727 0.026 1.413 0.021
598.9 253.9 18.159 0.015 1.367 0.045 99.999 99.999 0.74 0.02 1.453 0.017
877.5 267.3 18.166 0.016 1.282 0.044 99.999 99.999 0.71 0.022 1.41 0.018
791.9 189.1 18.168 0.014 1.401 0.05 99.999 99.999 0.802 0.02 1.445 0.017
388.8 719 18.172 0.017 1.161 0.049 99.999 99.999 0.669 0.022 1.362 0.019
621 585.4 18.177 0.015 1.159 0.042 99.999 99.999 0.707 0.021 1.377 0.018
641.8 476.2 18.178 0.02 1.327 0.055 99.999 99.999 0.689 0.027 1.43 0.022
462.2 293.6 18.192 0.017 1.472 0.051 99.999 99.999 0.753 0.023 1.451 0.019
472.3 832.6 18.197 0.015 1.195 0.046 99.999 99.999 0.692 0.021 1.398 0.017
905.9 445 18.2 0.016 1.039 0.041 99.999 99.999 0.664 0.021 1.325 0.019
530.1 781.7 18.206 0.014 1.257 0.042 99.999 99.999 0.708 0.019 1.351 0.019
240.9 511.2 18.21 0.016 1.105 0.043 99.999 99.999 0.597 0.02 1.258 0.018
959.8 257.1 18.213 0.015 1.313 0.052 99.999 99.999 0.776 0.021 1.546 0.018

© C
op
yri
gh
t 2
01
0: In
stitu
to d
e A
stro
no
mía
, U
niv
ers
ida
d N
ac
ion
al A
utó
no
ma
de
Mé
xic
o
UBVRI PHOTOMETRY OF OPEN CLUSTERS 395
TABLE 3 (CONTINUED)
X Y V σV (B − V ) σB−V (U − B) σU−B (V − R) σV −R (V − I) σV −I
237.3 582.9 18.223 0.014 2.026 0.087 99.999 99.999 1.101 0.019 2.082 0.016
621.9 282.1 18.223 0.016 1.277 0.041 99.999 99.999 0.678 0.022 1.307 0.019
883.9 455.7 18.224 0.019 1.351 0.054 99.999 99.999 0.85 0.024 1.542 0.021
205.8 201.7 18.229 0.018 1.372 0.049 99.999 99.999 0.748 0.023 1.478 0.021
787.6 590.6 18.231 0.016 1.22 0.042 99.999 99.999 0.746 0.022 1.435 0.019
634.7 113.5 18.232 0.016 1.209 0.048 99.999 99.999 0.629 0.021 1.333 0.019
558.8 400.5 18.24 0.016 1.086 0.043 99.999 99.999 0.621 0.023 1.283 0.019
572.2 773.6 18.241 0.016 1.268 0.044 99.999 99.999 0.692 0.021 1.355 0.02
850.5 399.2 18.255 0.015 1.172 0.05 99.999 99.999 0.708 0.02 1.416 0.018
516.6 271.4 18.261 0.018 1.145 0.049 99.999 99.999 0.648 0.024 1.328 0.021
554.8 69.2 18.261 0.019 1.212 0.049 99.999 99.999 0.727 0.024 1.418 0.021
892.2 366.9 18.263 0.017 1.127 0.048 99.999 99.999 0.693 0.022 1.381 0.021
17.4 245.4 18.266 0.017 1.784 0.084 99.999 99.999 0.979 0.022 1.973 0.019
439.4 832.7 18.267 0.017 1.143 0.045 99.999 99.999 0.64 0.022 1.311 0.021
810.8 114.7 18.271 0.02 1.284 0.054 99.999 99.999 0.644 0.026 1.307 0.023
463.5 323 18.272 0.015 1.095 0.044 99.999 99.999 0.692 0.02 1.321 0.018
930.3 154.4 18.274 0.02 1.912 0.086 99.999 99.999 1.08 0.025 2.096 0.021
86.9 655 18.281 0.019 1.068 0.049 99.999 99.999 0.676 0.023 1.321 0.022
907 828.6 18.284 0.017 0.973 0.041 99.999 99.999 0.632 0.023 1.337 0.02
367 705.1 18.289 0.016 1.188 0.05 99.999 99.999 0.645 0.022 1.337 0.019
244.2 136.1 18.29 0.02 1.204 0.046 99.999 99.999 0.637 0.026 1.301 0.022
781 975.6 18.292 0.023 1.174 0.055 99.999 99.999 0.759 0.031 1.466 0.058
208.4 499.8 18.293 0.016 1.255 0.05 99.999 99.999 0.683 0.022 1.44 0.02
597.4 714.8 18.304 0.018 99.999 99.999 99.999 99.999 1.101 0.023 2.184 0.02
891.4 673.7 18.314 0.015 1.836 0.074 99.999 99.999 1.029 0.021 2.029 0.016
361.8 962.8 18.317 0.015 1.698 0.058 99.999 99.999 0.964 0.02 1.999 0.017
351.6 639.1 18.324 0.019 1.153 0.053 99.999 99.999 0.711 0.024 1.358 0.021
546.2 74.2 18.326 0.019 1.496 0.065 99.999 99.999 0.798 0.025 1.659 0.021
935.6 741 18.335 0.014 1.212 0.05 99.999 99.999 0.717 0.02 1.436 0.017
12.2 735.5 18.349 0.019 1.903 0.078 99.999 99.999 1.045 0.026 2.07 0.021
625.1 494.4 18.351 0.018 1.22 0.049 99.999 99.999 0.739 0.025 1.368 0.022
278.9 767.7 18.355 0.02 1.338 0.057 99.999 99.999 0.674 0.027 1.465 0.024
520 986.4 18.365 0.019 1.278 0.051 99.999 99.999 0.655 0.026 1.351 0.022
563 579.2 18.371 0.018 1.01 0.049 99.999 99.999 0.689 0.025 1.32 0.021
332.9 348.7 18.375 0.019 1.35 0.063 99.999 99.999 0.77 0.026 1.454 0.022
469.5 563 18.393 0.02 1.21 0.051 99.999 99.999 0.665 0.027 1.433 0.024
403.8 125.3 18.394 0.02 99.999 99.999 99.999 99.999 0.786 0.025 1.588 0.022
411.4 552.6 18.397 0.021 1.344 0.059 99.999 99.999 0.7 0.027 1.409 0.024
321.3 465.6 18.414 0.02 1.148 0.046 99.999 99.999 0.687 0.027 1.394 0.025
387 641 18.416 0.017 1.798 0.092 99.999 99.999 1.077 0.022 2.111 0.019
36.1 704.7 18.421 0.019 1.391 0.069 99.999 99.999 0.777 0.025 1.478 0.022
820.9 571 18.421 0.017 1.227 0.058 99.999 99.999 0.847 0.022 1.556 0.02
951.9 619 18.425 0.017 1.454 0.063 99.999 99.999 0.869 0.023 1.771 0.019
666.2 213 18.428 0.019 1.053 0.048 99.999 99.999 0.724 0.025 1.362 0.022
570.6 947.2 18.43 0.017 1.142 0.058 99.999 99.999 0.69 0.022 1.348 0.02
803.1 989.2 18.43 0.015 1.456 0.061 99.999 99.999 0.852 0.024 1.572 0.022
679.4 847.1 18.434 0.017 1.176 0.053 99.999 99.999 0.729 0.021 1.46 0.019
600.5 568.2 18.438 0.02 1.13 0.053 99.999 99.999 0.671 0.027 1.408 0.023
720.7 449.5 18.457 0.02 1.203 0.051 99.999 99.999 0.648 0.028 1.373 0.023
725.9 703.4 18.469 0.017 1.391 0.063 99.999 99.999 0.782 0.022 1.621 0.019
827.4 880.4 18.475 0.02 1.186 0.055 99.999 99.999 0.699 0.025 1.394 0.023
15.9 411.4 18.476 0.022 1.653 0.083 99.999 99.999 0.955 0.028 1.799 0.024
56.8 736.7 18.477 0.022 1.117 0.055 99.999 99.999 0.74 0.028 1.402 0.025
888.8 854.7 18.479 0.019 1.084 0.052 99.999 99.999 0.742 0.025 1.398 0.022
981.2 553.4 18.483 0.018 1.378 0.059 99.999 99.999 0.669 0.024 1.418 0.021
406 258.3 18.484 0.017 99.999 99.999 99.999 99.999 0.853 0.024 1.547 0.02
406.2 35.9 18.485 0.02 1.315 0.059 99.999 99.999 0.651 0.026 1.365 0.023
441.8 798.6 18.485 0.02 1.262 0.059 99.999 99.999 0.635 0.025 1.376 0.022
172.9 502.5 18.486 0.019 1.209 0.058 99.999 99.999 0.679 0.024 1.426 0.023
173.6 727.2 18.486 0.019 1.394 0.065 99.999 99.999 0.737 0.025 1.377 0.022
426.2 354.7 18.488 0.019 1.768 0.08 99.999 99.999 1.056 0.025 2.073 0.02
734.2 470.6 18.491 0.019 1.138 0.052 99.999 99.999 0.681 0.024 1.388 0.024
888 539.8 18.496 0.019 1.882 0.097 99.999 99.999 1.103 0.026 2.092 0.022
105.8 106.7 18.498 0.019 1.485 0.075 99.999 99.999 0.969 0.026 1.861 0.022
634.7 659.3 18.507 0.02 1.102 0.05 99.999 99.999 0.679 0.027 1.355 0.023

© C
op
yri
gh
t 2
01
0: In
stitu
to d
e A
stro
no
mía
, U
niv
ers
ida
d N
ac
ion
al A
utó
no
ma
de
Mé
xic
o
396 AKKAYA ET AL.
TABLE 3 (CONTINUED)
X Y V σV (B − V ) σB−V (U − B) σU−B (V − R) σV −R (V − I) σV −I
839.3 690.7 18.507 0.021 1.326 0.063 99.999 99.999 0.729 0.027 1.398 0.024
433.4 812.5 18.524 0.021 1.128 0.06 99.999 99.999 0.67 0.027 1.37 0.025
775.2 917 18.527 0.018 1.191 0.054 99.999 99.999 0.719 0.024 1.444 0.021
6.7 420.3 18.529 0.02 1.166 0.054 99.999 99.999 0.681 0.027 1.455 0.023
733.6 48.3 18.529 0.022 1.287 0.063 99.999 99.999 0.807 0.029 1.576 0.024
162.1 236.6 18.53 0.022 1.199 0.063 99.999 99.999 0.774 0.028 1.415 0.026
879.8 393.4 18.531 0.021 1.074 0.053 99.999 99.999 0.756 0.028 1.521 0.024
95.3 992.1 18.532 0.029 1.219 0.068 99.999 99.999 0.763 0.043 1.484 0.06
297.4 334.9 18.546 0.02 1.262 0.069 99.999 99.999 0.782 0.026 1.46 0.024
671.1 823.1 18.552 0.014 1.87 0.088 99.999 99.999 1.144 0.021 2.197 0.016
426 601.5 18.57 0.021 99.999 99.999 99.999 99.999 1.114 0.028 2.175 0.023
88 649.9 18.573 0.02 1.128 0.059 99.999 99.999 0.669 0.028 1.364 0.024
561.4 469.1 18.58 0.019 1.143 0.051 99.999 99.999 0.789 0.025 1.397 0.024
494 329.9 18.582 0.02 1.125 0.058 99.999 99.999 0.703 0.026 1.409 0.024
220.3 609.4 18.592 0.019 1.201 0.059 99.999 99.999 0.699 0.025 1.389 0.021
929.4 100.7 18.599 0.019 1.093 0.053 99.999 99.999 0.664 0.028 1.359 0.023
657.5 710.9 18.6 0.019 1.262 0.068 99.999 99.999 0.692 0.026 1.453 0.022
658.8 425.5 18.601 0.02 1.083 0.066 99.999 99.999 0.678 0.027 1.41 0.023
692.9 956 18.601 0.021 1.256 0.062 99.999 99.999 0.746 0.027 1.446 0.025
797.3 787.9 18.606 0.02 1.412 0.07 99.999 99.999 0.799 0.028 1.499 0.024
225 319.2 18.609 0.019 1.77 0.088 99.999 99.999 1.011 0.025 2.037 0.02
394.2 560.6 18.624 0.023 1.181 0.061 99.999 99.999 0.727 0.029 1.445 0.026
186.5 176.4 18.626 0.022 1.727 0.106 99.999 99.999 0.997 0.028 2.076 0.024
402.9 759.5 18.633 0.024 1.173 0.064 99.999 99.999 0.713 0.029 1.385 0.027
465.6 176.8 18.636 0.021 1.256 0.062 99.999 99.999 0.695 0.028 1.427 0.024
272.8 725.2 18.637 0.02 1.18 0.06 99.999 99.999 0.796 0.026 1.482 0.025
693.1 7.2 18.64 0.018 1.077 0.054 99.999 99.999 0.672 0.025 1.38 0.022
458.4 752.8 18.646 0.022 1.182 0.062 99.999 99.999 0.718 0.029 1.406 0.025
93.2 893.1 18.649 0.024 1.155 0.07 99.999 99.999 0.708 0.033 1.411 0.028
591.8 234.8 18.655 0.021 1.091 0.058 99.999 99.999 0.764 0.027 1.435 0.024
280.8 895.1 18.659 0.02 1.236 0.071 99.999 99.999 0.705 0.027 1.473 0.023
935.1 711.8 18.659 0.018 1.458 0.068 99.999 99.999 0.767 0.024 1.442 0.021
930.1 130.4 18.66 0.02 1.181 0.063 99.999 99.999 0.724 0.028 1.447 0.026
595 258.4 18.662 0.023 1.292 0.067 99.999 99.999 0.708 0.029 1.431 0.027
614.2 792.3 18.663 0.023 1.322 0.069 99.999 99.999 0.802 0.03 1.562 0.026
794.7 868.4 18.668 0.02 1.37 0.066 99.999 99.999 0.803 0.025 1.627 0.022
721 157.3 18.671 0.021 99.999 99.999 99.999 99.999 1.159 0.028 2.278 0.022
654.6 611.3 18.675 0.022 1.265 0.067 99.999 99.999 0.76 0.027 1.418 0.026
907.4 893.5 18.676 0.021 1.916 0.089 99.999 99.999 1.021 0.027 2.031 0.022
65.7 578.3 18.677 0.02 1.256 0.077 99.999 99.999 0.863 0.026 1.654 0.023
430.1 567.4 18.696 0.021 1.289 0.073 99.999 99.999 0.785 0.029 1.55 0.025
275.2 459.6 18.699 0.021 1.168 0.063 99.999 99.999 0.695 0.028 1.415 0.026
117.1 252.6 18.706 0.022 1.209 0.076 99.999 99.999 0.789 0.03 1.522 0.025
238.7 332.1 18.707 0.022 1.273 0.063 99.999 99.999 0.733 0.028 1.485 0.024
608.8 898.4 18.709 0.02 1.311 0.068 99.999 99.999 0.724 0.026 1.422 0.023
523.2 129.9 18.712 0.022 1.091 0.069 99.999 99.999 0.694 0.028 1.379 0.026
245.7 564 18.717 0.023 1.195 0.071 99.999 99.999 0.704 0.029 1.447 0.025
726.4 51.2 18.719 0.024 1.101 0.066 99.999 99.999 0.705 0.03 1.403 0.027
859.9 211.4 18.721 0.024 1.136 0.064 99.999 99.999 0.705 0.032 1.363 0.03
565.1 651.9 18.722 0.022 1.177 0.065 99.999 99.999 0.762 0.029 1.448 0.027
277.8 299.6 18.725 0.021 1.394 0.087 99.999 99.999 0.764 0.029 1.512 0.023
238.2 140.8 18.727 0.02 1.25 0.07 99.999 99.999 0.833 0.025 1.588 0.024
809.9 303.2 18.729 0.024 1.082 0.06 99.999 99.999 0.712 0.031 1.371 0.027
55.8 807.8 18.73 0.024 1.373 0.081 99.999 99.999 0.753 0.032 1.572 0.027
395.8 103.6 18.735 0.023 1.215 0.068 99.999 99.999 0.762 0.03 1.615 0.026
268.8 801.9 18.741 0.025 1.145 0.065 99.999 99.999 0.722 0.03 1.479 0.029
591.5 119.9 18.743 0.021 1.159 0.07 99.999 99.999 0.688 0.028 1.442 0.024
891.8 212.7 18.744 0.019 1.225 0.076 99.999 99.999 0.692 0.028 1.445 0.023
912.1 684.9 18.745 0.026 1.251 0.063 99.999 99.999 0.76 0.032 1.482 0.028
198.7 828.7 18.75 0.024 1.297 0.075 99.999 99.999 0.737 0.031 1.449 0.028
125.7 224.4 18.75 0.026 1.297 0.082 99.999 99.999 0.807 0.034 1.508 0.029
347.4 581.8 18.756 0.025 1.258 0.072 99.999 99.999 0.607 0.031 1.328 0.028
942.1 673.1 18.757 0.02 1.201 0.076 99.999 99.999 0.755 0.027 1.421 0.023
741.3 946.6 18.763 0.021 99.999 99.999 99.999 99.999 0.716 0.026 1.432 0.025
140.3 207.4 18.763 0.026 1.45 0.094 99.999 99.999 0.749 0.034 1.548 0.029

© C
op
yri
gh
t 2
01
0: In
stitu
to d
e A
stro
no
mía
, U
niv
ers
ida
d N
ac
ion
al A
utó
no
ma
de
Mé
xic
o
UBVRI PHOTOMETRY OF OPEN CLUSTERS 397
TABLE 3 (CONTINUED)
X Y V σV (B − V ) σB−V (U − B) σU−B (V − R) σV −R (V − I) σV −I
351.4 347.3 18.765 0.027 1.316 0.083 99.999 99.999 0.734 0.034 1.465 0.031
150.3 363.3 18.767 0.026 1.226 0.074 99.999 99.999 0.669 0.034 1.386 0.029
466.5 652.6 18.778 0.023 1.82 0.121 99.999 99.999 1.079 0.028 2.077 0.024
8.9 594.7 18.778 0.027 1.061 0.075 99.999 99.999 0.738 0.035 99.999 99.999
50.1 352.3 18.779 0.025 1.284 0.071 99.999 99.999 0.813 0.03 1.49 0.029
545.7 421.9 18.779 0.023 1.144 0.07 99.999 99.999 0.749 0.032 1.417 0.027
511.5 47.3 18.785 0.025 1.352 0.084 99.999 99.999 0.81 0.033 1.668 0.027
702.3 563.3 18.786 0.023 1.173 0.074 99.999 99.999 0.646 0.032 1.373 0.029
356.5 291.2 18.787 0.026 1.23 0.069 99.999 99.999 0.8 0.036 1.585 0.03
64.4 558.1 18.787 0.025 1.204 0.074 99.999 99.999 0.64 0.035 1.327 0.028
540.5 58.1 18.787 0.018 99.999 99.999 99.999 99.999 1.115 0.025 2.121 0.019
262.6 9 18.8 0.025 1.289 0.076 99.999 99.999 0.687 0.033 1.436 0.028
486.4 693.1 18.802 0.027 1.422 0.082 99.999 99.999 0.813 0.036 1.446 0.07
335.1 469.9 18.806 0.023 1.31 0.08 99.999 99.999 0.737 0.029 1.485 0.028
150 217.5 18.809 0.023 1.1 0.065 99.999 99.999 0.74 0.031 1.425 0.026
277.6 883.6 18.81 0.021 99.999 99.999 99.999 99.999 1.061 0.028 2.08 0.023
901.4 713.3 18.811 0.022 1.186 0.072 99.999 99.999 0.747 0.029 1.417 0.026
24.7 696.2 18.817 0.027 99.999 99.999 99.999 99.999 1.196 0.034 2.237 0.029
2.7 814.9 18.819 0.026 1.34 0.088 99.999 99.999 0.887 0.037 1.718 0.03
43 43.5 18.827 0.023 1.423 0.076 99.999 99.999 0.798 0.033 1.607 0.027
857.4 830.6 18.835 0.023 1.187 0.073 99.999 99.999 0.724 0.03 1.417 0.026
512.6 419.2 18.836 0.024 1.339 0.087 99.999 99.999 0.725 0.032 1.482 0.028
664.9 298.5 18.842 0.024 1.202 0.073 99.999 99.999 0.67 0.032 1.509 0.026
948.2 586.2 18.844 0.023 1.339 0.074 99.999 99.999 0.766 0.03 1.627 0.026
172.3 532.8 18.847 0.027 1.233 0.079 99.999 99.999 0.734 0.035 1.491 0.031
691.2 336.4 18.848 0.025 1.257 0.076 99.999 99.999 0.777 0.032 1.472 0.029
751.7 942.3 18.849 0.023 1.518 0.102 99.999 99.999 0.92 0.031 1.642 0.025
34.1 957.5 18.852 0.027 99.999 99.999 99.999 99.999 1.154 0.036 2.21 0.029
777.4 446.8 18.853 0.027 1.112 0.072 99.999 99.999 0.722 0.034 1.419 0.03
239.2 294.5 18.854 0.025 1.475 0.09 99.999 99.999 0.824 0.033 1.601 0.029
944.3 845.7 18.857 0.022 1.698 0.112 99.999 99.999 1.066 0.028 2.034 0.024
152.8 972.9 18.863 0.027 1.678 0.128 99.999 99.999 0.828 0.034 1.571 0.033
860.9 341.8 18.871 0.027 1.232 0.081 99.999 99.999 0.713 0.034 1.414 0.029
310 334.4 18.875 0.023 1.18 0.073 99.999 99.999 0.766 0.032 1.471 0.027
632.8 988.9 18.877 0.023 1.259 0.076 99.999 99.999 0.65 0.029 1.361 0.028
348.4 561.9 18.884 0.024 1.366 0.078 99.999 99.999 0.694 0.033 1.428 0.028
550.6 206.7 18.886 0.027 1.425 0.085 99.999 99.999 0.775 0.035 1.492 0.031
387.7 486.7 18.891 0.027 99.999 99.999 99.999 99.999 0.776 0.038 1.552 0.032
466.4 687.2 18.892 0.025 1.241 0.068 99.999 99.999 0.698 0.034 1.474 0.028
169.6 66.9 18.895 0.025 1.265 0.092 99.999 99.999 0.831 0.035 1.658 0.028
614.7 642.8 18.897 0.025 1.108 0.075 99.999 99.999 0.671 0.033 1.356 0.029
560.2 617.6 18.902 0.024 1.239 0.086 99.999 99.999 0.713 0.031 1.356 0.029
536.2 155.9 18.906 0.023 99.999 99.999 99.999 99.999 1.01 0.029 2.009 0.025
545 735.4 18.907 0.024 1.326 0.079 99.999 99.999 0.697 0.03 1.403 0.028
556.1 395.7 18.909 0.021 1.159 0.068 99.999 99.999 0.652 0.03 1.387 0.025
181.3 621.1 18.925 0.026 99.999 99.999 99.999 99.999 0.949 0.034 2.001 0.027
623.1 451.9 18.927 0.03 99.999 99.999 99.999 99.999 0.757 0.038 1.411 0.035
485.2 430.9 18.929 0.029 1.186 0.086 99.999 99.999 0.69 0.037 1.424 0.034
975.5 386.4 18.929 0.023 1.439 0.092 99.999 99.999 0.841 0.032 1.603 0.027
597.1 413.6 18.935 0.026 1.276 0.085 99.999 99.999 0.801 0.036 1.533 0.03
275.3 424.3 18.939 0.024 99.999 99.999 99.999 99.999 0.835 0.033 1.705 0.027
412.9 240.8 18.945 0.021 1.414 0.098 99.999 99.999 0.897 0.028 1.598 0.023
979.6 659.5 18.946 0.026 1.298 0.08 99.999 99.999 0.671 0.034 1.435 0.028
488.9 460.3 18.947 0.025 1.098 0.083 99.999 99.999 0.745 0.036 1.487 0.031
171.6 458.6 18.957 0.029 1.238 0.082 99.999 99.999 0.721 0.038 1.393 0.033
693.7 910.9 18.96 0.025 1.233 0.085 99.999 99.999 0.685 0.033 1.352 0.031
668.4 472.2 18.964 0.027 1.578 0.112 99.999 99.999 1.063 0.035 1.967 0.033
184.3 299.9 18.965 0.028 1.151 0.084 99.999 99.999 0.721 0.035 1.468 0.032
50 754.7 18.968 0.025 99.999 99.999 99.999 99.999 1.12 0.034 2.201 0.027
576.4 740.5 18.974 0.026 1.053 0.068 99.999 99.999 0.751 0.035 1.385 0.03
757.6 779.7 18.975 0.027 1.537 0.106 99.999 99.999 0.785 0.037 99.999 99.999
376.1 876.9 18.976 0.027 1.212 0.075 99.999 99.999 0.743 0.034 1.388 0.03
349.6 294.8 18.98 0.027 1.006 0.073 99.999 99.999 0.731 0.035 1.503 0.031
929.2 388.7 18.983 0.028 1.214 0.085 99.999 99.999 0.774 0.038 1.525 0.032
198.4 796.7 18.998 0.027 99.999 99.999 99.999 99.999 0.89 0.033 1.83 0.029

© C
op
yri
gh
t 2
01
0: In
stitu
to d
e A
stro
no
mía
, U
niv
ers
ida
d N
ac
ion
al A
utó
no
ma
de
Mé
xic
o
398 AKKAYA ET AL.
TABLE 3 (CONTINUED)
X Y V σV (B − V ) σB−V (U − B) σU−B (V − R) σV −R (V − I) σV −I
861.5 155.3 18.999 0.025 1.493 0.093 99.999 99.999 0.986 0.032 2.153 0.027
670.2 608.5 19 0.03 1.249 0.086 99.999 99.999 0.84 0.04 1.502 0.042
734.8 350.9 19 0.027 1.318 0.09 99.999 99.999 0.799 0.036 1.665 0.03
579 230.4 19.007 0.029 1.608 0.127 99.999 99.999 1.03 0.038 1.896 0.032
19.5 529.3 19.011 0.03 1.088 0.084 99.999 99.999 0.788 0.038 1.405 0.035
17.1 340.5 19.012 0.024 1.449 0.089 99.999 99.999 0.673 0.033 1.466 0.029
667.3 366.7 19.013 0.024 1.272 0.079 99.999 99.999 0.735 0.032 1.523 0.027
981 611.8 19.017 0.025 1.456 0.095 99.999 99.999 0.832 0.033 1.692 0.029
229.2 141.3 19.019 0.024 1.331 0.095 99.999 99.999 0.709 0.033 1.439 0.029
562.9 592.9 19.023 0.029 1.216 0.079 99.999 99.999 0.77 0.045 1.399 0.033
173.4 175 19.029 0.026 1.172 0.097 99.999 99.999 0.727 0.034 1.476 0.03
949.5 891.4 19.032 0.024 1.401 0.096 99.999 99.999 1.036 0.031 2.1 0.025
937.4 618.2 19.033 0.024 1.579 0.102 99.999 99.999 0.961 0.032 1.736 0.027
698 721.7 19.037 0.025 1.131 0.083 99.999 99.999 0.798 0.032 1.517 0.028
271.4 750.5 19.039 0.03 1.18 0.094 99.999 99.999 0.798 0.04 1.538 0.035
317.9 576.3 19.052 0.027 99.999 99.999 99.999 99.999 1.027 0.035 1.91 0.029
413.3 647.7 19.059 0.026 1.327 0.092 99.999 99.999 0.813 0.034 1.487 0.03
771 820.2 19.065 0.025 1.461 0.106 99.999 99.999 1.017 0.033 1.909 0.027
224 687.2 19.071 0.029 99.999 99.999 99.999 99.999 0.996 0.037 1.9 0.032
233.9 766.3 19.071 0.024 99.999 99.999 99.999 99.999 1.115 0.032 2.141 0.027
722.2 846.2 19.079 0.023 1.334 0.094 99.999 99.999 0.736 0.031 1.433 0.028
402.4 260.7 19.086 0.035 99.999 99.999 99.999 99.999 0.653 0.045 1.487 0.039
232.1 186.3 19.087 0.027 99.999 99.999 99.999 99.999 0.82 0.036 1.7 0.03
213.3 389.2 19.094 0.031 1.402 0.111 99.999 99.999 0.75 0.04 1.547 0.035
501.3 143 19.098 0.023 1.22 0.084 99.999 99.999 0.76 0.033 1.525 0.027
276.2 643.8 19.104 0.026 1.214 0.089 99.999 99.999 0.813 0.035 1.49 0.032
831 73.2 19.106 0.028 1.2 0.088 99.999 99.999 0.866 0.037 1.63 0.032
570.2 460.2 19.108 0.025 1.488 0.102 99.999 99.999 0.769 0.034 1.474 0.031
507.6 642.2 19.109 0.028 1.337 0.094 99.999 99.999 0.792 0.037 1.581 0.031
760.9 778.7 19.12 0.032 1.369 0.113 99.999 99.999 0.808 0.043 99.999 99.999
534.9 478.8 19.126 0.025 1.333 0.113 99.999 99.999 0.818 0.031 1.616 0.029
226.9 6.4 19.132 0.033 1.37 0.106 99.999 99.999 0.767 0.041 1.659 0.036
104.2 808 19.132 0.028 99.999 99.999 99.999 99.999 0.704 0.039 1.455 0.032
429.2 419.6 19.134 0.029 1.172 0.089 99.999 99.999 0.663 0.038 1.421 0.033
594.5 788.4 19.134 0.03 1.297 0.09 99.999 99.999 0.77 0.038 1.507 0.034
769.1 613.9 19.134 0.027 99.999 99.999 99.999 99.999 1.019 0.035 1.987 0.03
558.6 731.8 19.145 0.029 99.999 99.999 99.999 99.999 1.156 0.037 2.132 0.031
668.6 771.5 19.148 0.034 1.164 0.096 99.999 99.999 0.729 0.044 1.504 0.038
39.4 213.1 19.151 0.029 1.171 0.09 99.999 99.999 0.72 0.038 1.532 0.033
558.4 911.3 19.161 0.029 1.171 0.098 99.999 99.999 0.749 0.039 1.4 0.033
168.9 230.6 19.169 0.027 99.999 99.999 99.999 99.999 0.767 0.037 1.501 0.032
327.9 155 19.174 0.026 1.198 0.105 99.999 99.999 0.791 0.036 1.43 0.03
201 656.9 19.182 0.03 1.24 0.1 99.999 99.999 0.777 0.038 1.452 0.034
990.9 145.5 19.19 0.04 1.174 0.092 99.999 99.999 0.722 0.048 1.437 0.044
900.6 979.6 19.195 0.029 99.999 99.999 99.999 99.999 1.066 0.038 2.435 0.03
506.9 504.6 19.215 0.028 1.373 0.121 99.999 99.999 0.739 0.038 1.539 0.032
479.8 341.5 19.217 0.033 1.648 0.129 99.999 99.999 0.834 0.042 1.604 0.038
296.1 587.5 19.223 0.034 99.999 99.999 99.999 99.999 0.91 0.043 1.79 0.037
334.8 580 19.229 0.024 99.999 99.999 99.999 99.999 0.73 0.033 1.572 0.029
629.2 158.7 19.232 0.028 0.98 0.087 99.999 99.999 0.856 0.037 1.648 0.032
135.9 886.4 19.233 0.026 99.999 99.999 99.999 99.999 1.038 0.036 2.093 0.028
252.3 695.7 19.244 0.027 1.307 0.122 99.999 99.999 0.86 0.036 1.625 0.032
941.5 249.1 19.261 0.027 1.269 0.095 99.999 99.999 0.778 0.037 1.555 0.032
11.8 120 19.268 0.031 99.999 99.999 99.999 99.999 0.784 0.043 1.513 0.038
89.6 298.8 19.273 0.034 1.246 0.133 99.999 99.999 0.778 0.042 1.471 0.038
352.1 224.3 19.274 0.025 99.999 99.999 99.999 99.999 0.782 0.037 1.467 0.032
871.6 626.3 19.274 0.032 99.999 99.999 99.999 99.999 0.807 0.04 1.532 0.036
658.1 13.8 19.275 0.031 1.184 0.125 99.999 99.999 0.72 0.043 1.577 0.038
851.6 854.6 19.276 0.028 1.402 0.11 99.999 99.999 0.702 0.038 1.452 0.034
781.8 587.7 19.277 0.038 1.023 0.09 99.999 99.999 0.686 0.047 1.484 0.043
837.6 23.8 19.279 0.036 99.999 99.999 99.999 99.999 0.929 0.046 1.625 0.042
172.2 822.1 19.293 0.035 99.999 99.999 99.999 99.999 0.766 0.045 1.491 0.039
25.1 391.8 19.299 0.033 1.18 0.104 99.999 99.999 0.739 0.044 1.511 0.037
400.3 121.8 19.307 0.035 99.999 99.999 99.999 99.999 0.778 0.047 1.509 0.039
443.6 558.8 19.309 0.035 99.999 99.999 99.999 99.999 0.808 0.045 1.626 0.039

© C
op
yri
gh
t 2
01
0: In
stitu
to d
e A
stro
no
mía
, U
niv
ers
ida
d N
ac
ion
al A
utó
no
ma
de
Mé
xic
o
UBVRI PHOTOMETRY OF OPEN CLUSTERS 399
TABLE 3 (CONTINUED)
X Y V σV (B − V ) σB−V (U − B) σU−B (V − R) σV −R (V − I) σV −I
444.7 621.8 19.309 0.034 1.228 0.103 99.999 99.999 0.781 0.042 1.514 0.039
456.8 550 19.309 0.039 1.448 0.128 99.999 99.999 0.735 0.053 1.484 0.05
728.4 917.1 19.314 0.025 99.999 99.999 99.999 99.999 0.919 0.033 1.728 0.03
462.2 411.7 19.318 0.029 99.999 99.999 99.999 99.999 0.947 0.039 1.675 0.034
277.9 409.2 19.319 0.032 1.394 0.111 99.999 99.999 0.763 0.043 1.523 0.034
56.8 911.5 19.322 0.032 99.999 99.999 99.999 99.999 0.757 0.044 1.532 0.038
677.5 105.9 19.326 0.03 99.999 99.999 99.999 99.999 1.054 0.04 2.148 0.031
27 900.4 19.329 0.024 99.999 99.999 99.999 99.999 0.744 0.035 1.549 0.031
622.8 122.7 19.334 0.032 99.999 99.999 99.999 99.999 0.893 0.04 1.6 0.037
602.8 732.5 19.338 0.032 99.999 99.999 99.999 99.999 0.845 0.042 1.981 0.039
938.8 787 19.339 0.031 0.058 0.049 −0.805 0.068 −0.014 0.051 99.999 99.999
63 668.3 19.342 0.035 99.999 99.999 99.999 99.999 0.932 0.045 1.785 0.039
825.8 224.6 19.344 0.03 1.391 0.128 99.999 99.999 0.923 0.039 1.644 0.036
275.4 629 19.345 0.033 1.179 0.127 99.999 99.999 0.694 0.042 1.487 0.037
391.1 897.3 19.346 0.025 99.999 99.999 99.999 99.999 0.81 0.034 1.552 0.03
637.1 836.8 19.347 0.034 1.119 0.105 99.999 99.999 0.795 0.045 1.547 0.039
436.3 498.3 19.349 0.034 99.999 99.999 99.999 99.999 0.921 0.044 1.863 0.038
539.7 616 19.352 0.036 0.989 0.112 99.999 99.999 0.747 0.046 1.48 0.041
464.9 20.1 19.357 0.034 99.999 99.999 99.999 99.999 1.036 0.042 2.132 0.036
294.7 203 19.359 0.036 99.999 99.999 99.999 99.999 0.842 0.046 1.649 0.039
849.2 313.5 19.359 0.031 99.999 99.999 99.999 99.999 0.809 0.041 1.512 0.035
666.8 410.8 19.361 0.034 99.999 99.999 99.999 99.999 0.856 0.043 1.542 0.038
466.8 965.6 19.366 0.035 1.287 0.116 99.999 99.999 0.752 0.046 1.431 0.04
388.6 817.6 19.374 0.031 99.999 99.999 99.999 99.999 0.997 0.04 1.83 0.037
735.7 421.1 19.378 0.027 99.999 99.999 99.999 99.999 0.789 0.038 1.559 0.034
882.1 491.4 19.378 0.039 1.297 0.121 99.999 99.999 0.777 0.049 1.575 0.043
635.9 714.2 19.385 0.046 99.999 99.999 99.999 99.999 0.773 0.057 1.455 0.052
668.2 864.9 19.387 0.042 99.999 99.999 99.999 99.999 0.798 0.054 1.537 0.048
330.7 54.1 19.388 0.032 99.999 99.999 99.999 99.999 0.757 0.043 1.49 0.036
215.4 168.8 19.389 0.034 99.999 99.999 99.999 99.999 0.647 0.047 1.336 0.04
560.4 642.7 19.391 0.032 99.999 99.999 99.999 99.999 0.851 0.042 1.644 0.036
290.7 346.6 19.396 0.035 99.999 99.999 99.999 99.999 0.905 0.046 1.718 0.038
141 482 19.4 0.038 99.999 99.999 99.999 99.999 0.794 0.047 1.655 0.041
603.6 656.6 19.401 0.04 99.999 99.999 99.999 99.999 0.641 0.05 1.385 0.044
477.4 62.9 19.402 0.032 99.999 99.999 99.999 99.999 0.887 0.043 1.788 0.036
119 76 19.402 0.036 99.999 99.999 99.999 99.999 0.741 0.047 1.436 0.042
280 985.5 19.406 0.031 99.999 99.999 99.999 99.999 0.661 0.043 1.476 0.039
819 832.4 19.407 0.034 1.239 0.139 99.999 99.999 0.802 0.042 1.491 0.038
475.8 228.1 19.408 0.034 1.075 0.103 99.999 99.999 0.794 0.044 1.474 0.041
119.9 860.2 19.408 0.033 99.999 99.999 99.999 99.999 0.897 0.044 1.647 0.038
858 819.3 19.417 0.032 99.999 99.999 99.999 99.999 0.891 0.042 1.776 0.035
264.9 442.4 19.421 0.032 99.999 99.999 99.999 99.999 0.712 0.044 1.467 0.036
512.4 862.4 19.422 0.034 99.999 99.999 99.999 99.999 0.923 0.045 1.66 0.042
666.2 195.5 19.422 0.039 99.999 99.999 99.999 99.999 0.661 0.051 1.418 0.045
457.7 270.4 19.423 0.036 99.999 99.999 99.999 99.999 0.959 0.044 1.946 0.038
882 94.6 19.431 0.035 1.163 0.121 99.999 99.999 0.73 0.045 1.481 0.04
483.8 917.2 19.433 0.035 1.173 0.108 99.999 99.999 0.729 0.046 1.489 0.041
180.5 491 19.434 0.031 99.999 99.999 99.999 99.999 0.755 0.044 1.516 0.037
929.2 603.3 19.434 0.033 1.238 0.123 99.999 99.999 0.708 0.046 1.439 0.039
266.8 795.7 19.441 0.037 99.999 99.999 99.999 99.999 0.876 0.046 1.742 0.042
473 738.9 19.446 0.04 99.999 99.999 99.999 99.999 0.744 0.051 1.498 0.045
640 382.5 19.446 0.034 99.999 99.999 99.999 99.999 0.864 0.045 1.681 0.039
561.2 888.2 19.448 0.038 1.073 0.101 99.999 99.999 0.778 0.049 1.55 0.043
209.9 849.7 19.449 0.038 99.999 99.999 99.999 99.999 0.862 0.049 1.65 0.041
188.3 892.2 19.457 0.044 99.999 99.999 99.999 99.999 0.768 0.056 1.594 0.048
517.8 221 19.462 0.043 99.999 99.999 99.999 99.999 0.717 0.054 1.517 0.049
320.9 870.5 19.486 0.039 99.999 99.999 99.999 99.999 0.874 0.05 1.501 0.045
358 176.4 19.49 0.036 99.999 99.999 99.999 99.999 0.887 0.049 1.506 0.042
666.5 985.4 19.495 0.04 99.999 99.999 99.999 99.999 0.724 0.051 1.451 0.045
938.4 939 19.496 0.032 99.999 99.999 99.999 99.999 0.802 0.045 1.625 0.035
408.2 250.5 19.52 0.036 99.999 99.999 99.999 99.999 0.803 0.051 1.662 0.042
77.9 68.8 19.522 0.037 99.999 99.999 99.999 99.999 0.736 0.052 1.391 0.043
589 948.4 19.524 0.037 99.999 99.999 99.999 99.999 0.729 0.049 1.413 0.042
852.4 637.8 19.524 0.037 99.999 99.999 99.999 99.999 0.835 0.047 1.611 0.043
463.8 163.5 19.53 0.043 99.999 99.999 99.999 99.999 0.707 0.054 1.526 0.047

© C
op
yri
gh
t 2
01
0: In
stitu
to d
e A
stro
no
mía
, U
niv
ers
ida
d N
ac
ion
al A
utó
no
ma
de
Mé
xic
o
400 AKKAYA ET AL.
TABLE 3 (CONTINUED)
X Y V σV (B − V ) σB−V (U − B) σU−B (V − R) σV −R (V − I) σV −I
75.8 40 19.53 0.048 99.999 99.999 99.999 99.999 0.659 0.064 1.378 0.06
908.5 71 19.532 0.034 99.999 99.999 99.999 99.999 0.783 0.044 1.484 0.041
103 212.9 19.533 0.038 99.999 99.999 99.999 99.999 0.821 0.051 1.507 0.045
77.8 159.4 19.539 0.037 99.999 99.999 99.999 99.999 0.745 0.05 1.469 0.044
121 789.5 19.557 0.038 99.999 99.999 99.999 99.999 0.818 0.05 1.575 0.043
259.3 467.2 19.559 0.042 99.999 99.999 99.999 99.999 0.8 0.054 1.578 0.048
925.9 666.9 19.575 0.041 99.999 99.999 99.999 99.999 0.746 0.055 1.606 0.049
131.7 412.9 19.58 0.031 99.999 99.999 99.999 99.999 1.095 0.041 2.149 0.033
767.5 963.8 19.594 0.032 1.055 0.111 99.999 99.999 0.717 0.044 1.519 0.037
302.2 521.8 19.614 0.045 99.999 99.999 99.999 99.999 0.999 0.061 2.143 0.046
95.2 29.1 19.614 0.036 99.999 99.999 99.999 99.999 0.718 0.05 1.589 0.045
899.7 502.3 19.631 0.035 1.345 0.184 99.999 99.999 0.998 0.046 1.983 0.039
486.9 320.5 19.638 0.042 99.999 99.999 99.999 99.999 0.709 0.056 1.443 0.05
649.4 871.7 19.639 0.039 99.999 99.999 99.999 99.999 0.946 0.049 1.839 0.043
916.2 643.2 19.64 0.041 99.999 99.999 99.999 99.999 1.102 0.053 2.141 0.043
498 253.8 19.654 0.045 99.999 99.999 99.999 99.999 0.997 0.059 1.877 0.052
194.4 621.4 19.66 0.047 99.999 99.999 99.999 99.999 0.891 0.061 1.646 0.051
844 421.1 19.66 0.043 99.999 99.999 99.999 99.999 0.928 0.055 1.806 0.047
737.2 608.8 19.688 0.04 99.999 99.999 99.999 99.999 0.894 0.052 1.663 0.046
581.6 705.3 19.693 0.041 99.999 99.999 99.999 99.999 0.659 0.053 1.452 0.047
229.5 337.6 19.697 0.046 99.999 99.999 99.999 99.999 0.924 0.059 1.842 0.049
469.2 856.7 19.7 0.05 99.999 99.999 99.999 99.999 1.015 0.063 1.862 0.054
46.7 803 19.714 0.045 99.999 99.999 99.999 99.999 0.774 0.057 1.553 0.05
592.9 612.6 19.716 0.043 99.999 99.999 99.999 99.999 0.834 0.056 1.589 0.049
178.3 404.1 19.721 0.043 99.999 99.999 99.999 99.999 0.788 0.057 1.674 0.049
503.6 544.1 19.729 0.046 99.999 99.999 99.999 99.999 0.819 0.058 1.774 0.05
712.3 14.6 19.732 0.045 99.999 99.999 99.999 99.999 0.794 0.063 1.554 0.055
961 523.3 19.732 0.045 99.999 99.999 99.999 99.999 0.903 0.058 1.805 0.049
299.2 702.9 19.736 0.041 99.999 99.999 99.999 99.999 0.807 0.054 1.557 0.047
752.7 202.8 19.736 0.046 99.999 99.999 99.999 99.999 0.796 0.062 1.516 0.053
180.5 340.6 19.737 0.048 99.999 99.999 99.999 99.999 0.872 0.065 1.657 0.055
436.2 340.9 19.738 0.042 0.991 0.154 99.999 99.999 0.61 0.057 1.383 0.049
750.6 306.8 19.739 0.036 99.999 99.999 99.999 99.999 0.737 0.049 1.497 0.041
173.4 566.1 19.75 0.048 99.999 99.999 99.999 99.999 0.803 0.064 1.464 0.056
411.3 299.1 19.753 0.041 99.999 99.999 99.999 99.999 0.809 0.054 1.547 0.047
792.5 268.9 19.765 0.036 99.999 99.999 99.999 99.999 0.826 0.05 1.767 0.042
161.2 795.5 19.767 0.054 99.999 99.999 99.999 99.999 0.793 0.067 1.646 0.057
991.4 267.2 19.77 0.036 99.999 99.999 99.999 99.999 0.628 0.049 1.346 0.043
467.9 142.5 19.782 0.049 99.999 99.999 99.999 99.999 0.799 0.063 1.71 0.052
128 626 19.803 0.044 99.999 99.999 99.999 99.999 0.748 0.058 1.63 0.049
14.1 894.9 19.814 0.051 99.999 99.999 99.999 99.999 0.889 0.068 1.702 0.058
865 526.6 19.817 0.046 99.999 99.999 99.999 99.999 0.823 0.059 1.599 0.053
392.3 593.1 19.849 0.051 99.999 99.999 99.999 99.999 0.767 0.068 1.598 0.057
365.9 301.3 19.911 0.047 99.999 99.999 99.999 99.999 1.17 0.063 2.019 0.052
588.6 395.2 19.94 0.049 99.999 99.999 99.999 99.999 0.713 0.068 1.476 0.056
579.9 668.7 19.969 0.048 99.999 99.999 99.999 99.999 1.129 0.06 2.104 0.052
558.7 713.5 19.985 0.053 99.999 99.999 99.999 99.999 1.096 0.068 2.086 0.058
354.3 350.4 19.988 0.058 99.999 99.999 99.999 99.999 1.099 0.074 2.062 0.063
593.7 641.3 19.992 0.057 99.999 99.999 99.999 99.999 1.104 0.073 2.013 0.063
552.9 428.6 20 0.062 99.999 99.999 99.999 99.999 0.999 0.078 1.859 0.068
892.1 376.9 20.015 0.049 99.999 99.999 99.999 99.999 0.983 0.066 1.759 0.058
554 864.7 20.018 0.05 99.999 99.999 99.999 99.999 0.999 0.064 1.977 0.055
761.4 639.3 20.019 0.053 99.999 99.999 99.999 99.999 0.965 0.07 1.771 0.058
714.2 712.7 20.025 0.056 99.999 99.999 99.999 99.999 0.95 0.071 1.773 0.061
765.7 728.1 20.037 0.06 99.999 99.999 99.999 99.999 1.167 0.075 2.653 0.061
226.7 516.2 20.043 0.053 99.999 99.999 99.999 99.999 0.954 0.069 1.796 0.06
746.9 729.5 20.045 0.051 99.999 99.999 99.999 99.999 1.082 0.065 2.086 0.055
709.1 884.1 20.051 0.06 99.999 99.999 99.999 99.999 0.939 0.075 1.743 0.066
569.3 542.4 20.07 0.054 99.999 99.999 99.999 99.999 0.836 0.071 1.621 0.062
591.2 654.5 20.073 0.04 99.999 99.999 99.999 99.999 0.869 0.054 1.614 0.049
880.7 884.8 20.073 0.064 99.999 99.999 99.999 99.999 0.873 0.081 1.621 0.073
367.8 97.3 20.092 0.049 99.999 99.999 99.999 99.999 0.823 0.067 1.563 0.058
950.8 985.3 20.096 0.062 99.999 99.999 99.999 99.999 0.843 0.08 1.656 0.069
934.6 609.6 20.102 0.062 99.999 99.999 99.999 99.999 0.85 0.079 1.701 0.068
764.4 625.4 20.103 0.061 99.999 99.999 99.999 99.999 0.842 0.079 1.731 0.068

© C
op
yri
gh
t 2
01
0: In
stitu
to d
e A
stro
no
mía
, U
niv
ers
ida
d N
ac
ion
al A
utó
no
ma
de
Mé
xic
o
UBVRI PHOTOMETRY OF OPEN CLUSTERS 401
TABLE 3 (CONTINUED)
X Y V σV (B − V ) σB−V (U − B) σU−B (V − R) σV −R (V − I) σV −I
417.5 218.9 20.105 0.058 99.999 99.999 99.999 99.999 0.879 0.075 1.816 0.063
88.7 573.6 20.105 0.056 99.999 99.999 99.999 99.999 0.838 0.072 1.649 0.063
964.3 194.1 20.109 0.052 99.999 99.999 99.999 99.999 0.865 0.067 1.622 0.061
473.2 382.4 20.111 0.05 99.999 99.999 99.999 99.999 0.936 0.067 1.724 0.057
583 379.1 20.113 0.058 99.999 99.999 99.999 99.999 0.89 0.077 1.741 0.066
849.2 940.4 20.113 0.058 99.999 99.999 99.999 99.999 0.874 0.079 1.723 0.065
635 683.9 20.117 0.055 99.999 99.999 99.999 99.999 0.834 0.071 1.764 0.061
686.7 646.6 20.118 0.062 99.999 99.999 99.999 99.999 0.834 0.081 1.697 0.069
831.9 651.2 20.122 0.053 99.999 99.999 99.999 99.999 0.99 0.068 2.078 0.057
285.4 96.9 20.127 0.058 99.999 99.999 99.999 99.999 0.826 0.078 1.626 0.067
506.3 66.5 20.128 0.078 99.999 99.999 99.999 99.999 0.871 0.097 1.794 0.083
503.3 964.5 20.132 0.063 99.999 99.999 99.999 99.999 0.841 0.081 1.593 0.071
788 246.9 20.132 0.063 99.999 99.999 99.999 99.999 1.038 0.08 1.841 0.07
645.4 973.6 20.144 0.061 99.999 99.999 99.999 99.999 0.765 0.081 1.65 0.069
158 173.2 20.15 0.063 99.999 99.999 99.999 99.999 0.85 0.081 1.721 0.075
252.2 787 20.154 0.054 99.999 99.999 99.999 99.999 0.763 0.075 1.564 0.062
969.6 273.4 20.161 0.056 99.999 99.999 99.999 99.999 0.731 0.078 1.694 0.062
322.6 825.9 20.165 0.064 99.999 99.999 99.999 99.999 1.02 0.084 99.999 99.999
909.1 870.4 20.172 0.053 99.999 99.999 99.999 99.999 0.764 0.072 1.539 0.061
853.6 959.5 20.174 0.056 99.999 99.999 99.999 99.999 0.913 0.071 1.708 0.064
512.3 830.4 20.185 0.068 99.999 99.999 99.999 99.999 0.781 0.088 1.463 0.077
981.4 802.5 20.196 0.049 99.999 99.999 99.999 99.999 1.012 0.064 2.157 0.053
605.7 36.3 20.21 0.055 99.999 99.999 99.999 99.999 0.826 0.074 1.676 0.065
147.8 580.8 20.217 0.074 99.999 99.999 99.999 99.999 0.757 0.094 1.442 0.085
805.1 669.4 20.219 0.063 99.999 99.999 99.999 99.999 0.787 0.082 1.687 0.07
754.5 909.6 20.221 0.066 99.999 99.999 99.999 99.999 1.162 0.082 1.901 0.073
475.5 443.1 20.225 0.066 99.999 99.999 99.999 99.999 1.036 0.083 1.813 0.073
419.7 609.3 20.226 0.062 99.999 99.999 99.999 99.999 1.068 0.079 1.914 0.071
880 326.8 20.227 0.081 99.999 99.999 99.999 99.999 0.744 0.1 1.675 0.088
253 170.9 20.236 0.064 99.999 99.999 99.999 99.999 0.642 0.089 1.399 0.077
825.6 339.4 20.239 0.08 99.999 99.999 99.999 99.999 0.861 0.102 1.667 0.088
533.3 500.4 20.24 0.053 99.999 99.999 99.999 99.999 0.827 0.075 1.543 0.063
870 192.3 20.24 0.074 99.999 99.999 99.999 99.999 1.169 0.095 2.122 0.081
584.9 751.6 20.244 0.073 99.999 99.999 99.999 99.999 0.869 0.093 1.801 0.079
971.2 349.6 20.246 0.064 99.999 99.999 99.999 99.999 0.994 0.083 1.929 0.069
568.3 359.6 20.252 0.074 99.999 99.999 99.999 99.999 0.787 0.096 1.691 0.081
901.7 900.1 20.253 0.055 99.999 99.999 99.999 99.999 0.945 0.075 1.747 0.061
990.6 313.4 20.254 0.059 99.999 99.999 99.999 99.999 0.836 0.079 1.78 0.064
784.3 437.1 20.266 0.062 99.999 99.999 99.999 99.999 0.913 0.08 1.661 0.072
404.5 364 20.27 0.069 99.999 99.999 99.999 99.999 0.76 0.089 1.6 0.078
809.9 811.1 20.283 0.071 99.999 99.999 99.999 99.999 1.089 0.089 2.181 0.075
109.2 527.1 20.284 0.091 99.999 99.999 99.999 99.999 0.771 0.115 1.674 0.097
726.7 99.4 20.286 0.066 99.999 99.999 99.999 99.999 0.689 0.085 1.695 0.073
833.3 120.9 20.29 0.075 99.999 99.999 99.999 99.999 0.811 0.098 1.545 0.082
993.4 453.6 20.302 0.067 99.999 99.999 99.999 99.999 0.825 0.084 1.805 0.071
961.8 444.3 20.321 0.068 99.999 99.999 99.999 99.999 0.888 0.089 1.768 0.073
605.6 244.7 20.342 0.074 99.999 99.999 99.999 99.999 0.794 0.096 1.636 0.082
666.7 741.3 20.364 0.064 99.999 99.999 99.999 99.999 0.884 0.082 1.768 0.072
795.7 224.1 20.365 0.074 99.999 99.999 99.999 99.999 0.871 0.097 1.794 0.08
960.8 103.9 20.395 0.082 99.999 99.999 99.999 99.999 0.832 0.105 1.804 0.087
941.4 45.4 20.398 0.074 99.999 99.999 99.999 99.999 0.766 0.1 1.65 0.084
943.9 654.6 20.409 0.072 99.999 99.999 99.999 99.999 0.899 0.094 1.637 0.082
871.2 251.2 20.423 0.072 99.999 99.999 99.999 99.999 0.918 0.095 1.676 0.082
889.1 833.8 20.445 0.099 99.999 99.999 99.999 99.999 1.046 0.126 1.884 0.112
606.2 427.6 20.516 0.091 99.999 99.999 99.999 99.999 1.033 0.117 2.15 0.096
2.3. The data inspection tools elipse and safe
Since the stellar density of a cluster increases to-wards its center with respect to the field stars, anawk macro (elipse, Moitinho 2003, private commu-nication) was used to extract the data of the centralregion of a given cluster, as defined by visual inspec-
tion in a visual (V ) or red (R) image, thus increasingthe contrast of the cluster with respect to the sur-rounding field stars. An ellipse was fitted visually tothe image in order to extract the photometric data ofthe central region of the cluster. To further supportthe analyses of the clusters, a Java-based computerprogram (safe, McFarland 2010) was developed and

© C
op
yri
gh
t 2
01
0: In
stitu
to d
e A
stro
no
mía
, U
niv
ers
ida
d N
ac
ion
al A
utó
no
ma
de
Mé
xic
o
402 AKKAYA ET AL.
TABLE 4
CCD UBVRI PHOTOMETRY OF RU 135
X Y V σV (B − V ) σB−V (U − B) σU−B (V − R) σV −R (V − I) σV −I
862.7 231.5 11.132 0.003 0.597 0.004 0.212 0.002 0.36 0.01 99.999 99.999
237.1 325.4 11.689 0.003 0.71 0.003 0.364 0.003 0.387 0.014 0.86 0.011
294 387.3 11.871 0.008 0.742 0.003 0.405 0.004 0.45 0.038 0.895 0.014
753.2 283.1 12.258 0.002 0.742 0.004 0.405 0.005 0.45 0.002 99.999 99.999
219.7 343 12.337 0.004 0.789 0.003 0.409 0.005 0.47 0.015 0.97 0.01
251.1 263.2 12.691 0.005 0.734 0.004 0.418 0.005 0.431 0.014 0.886 0.003
914.4 595.1 12.697 0.005 0.729 0.004 0.383 0.004 0.433 0.014 0.915 0.003
905.1 237 12.769 0.004 0.768 0.003 0.401 0.006 0.447 0.01 0.956 0.003
244 620.7 12.8 0.004 0.755 0.003 0.378 0.006 0.439 0.01 0.867 0.003
765.1 218 12.809 0.005 0.686 0.005 0.426 0.005 0.414 0.012 0.861 0.003
754.6 654.7 13.162 0.002 2.372 0.006 2.415 0.033 1.276 0.002 2.387 0.01
312 509.4 13.221 0.002 0.995 0.011 0.399 0.007 0.549 0.003 1.099 0.007
929 857.1 13.228 0.002 1.885 0.009 1.897 0.024 1.003 0.003 1.88 0.01
311.8 534.8 13.467 0.002 1.023 0.005 0.446 0.008 0.579 0.002 1.125 0.003
240.7 741.6 14.015 0.003 0.818 0.005 0.444 0.01 0.462 0.02 0.976 0.003
375.8 871.1 14.124 0.003 1.035 0.006 0.31 0.012 0.63 0.003 1.266 0.003
170 549.7 14.153 0.003 0.835 0.005 0.345 0.01 0.483 0.017 1.001 0.004
900.7 200.3 14.153 0.005 1.018 0.01 0.422 0.013 0.592 0.008 99.999 99.999
59.6 527.3 14.168 0.003 0.831 0.006 0.403 0.012 0.462 0.024 0.995 0.004
469.5 207.9 14.189 0.003 0.859 0.006 0.494 0.011 0.494 0.004 1.025 0.004
853.8 605.3 14.221 0.004 1.196 0.008 0.529 0.014 0.693 0.005 1.353 0.005
809.4 224 14.231 0.003 1.853 0.011 1.838 0.038 0.993 0.003 1.896 0.004
811.6 155.8 14.256 0.003 1.446 0.008 1.047 0.02 0.811 0.003 1.556 0.003
655.4 41.7 14.441 0.005 0.948 0.009 0.543 0.013 0.552 0.005 1.138 0.005
900.3 424.6 14.467 0.003 2.276 0.011 2.269 0.088 1.236 0.003 2.373 0.003
153.8 339.4 14.601 0.003 1.895 0.013 1.697 0.049 1.004 0.004 1.915 0.005
989.5 613.4 14.68 0.004 1.226 0.008 0.502 0.021 0.715 0.005 1.464 0.004
472.4 387.8 14.741 0.004 0.969 0.008 0.442 0.017 0.556 0.004 1.137 0.005
61.3 781.1 14.918 0.005 1.098 0.01 0.407 0.02 0.654 0.006 1.297 0.006
501.1 703.7 14.956 0.005 1.036 0.009 0.428 0.019 0.627 0.005 1.253 0.005
183.2 500.2 14.976 0.004 0.99 0.008 0.385 0.019 0.602 0.004 1.212 0.004
818.7 932 14.986 0.003 2.001 0.012 1.942 0.079 1.115 0.004 2.156 0.004
351.3 365.8 14.994 0.004 0.999 0.009 0.384 0.017 0.585 0.004 1.193 0.005
379.3 444 15.06 0.003 2.422 0.017 99.999 99.999 1.301 0.004 2.513 0.004
343.8 97.8 15.111 0.004 1.031 0.009 0.352 0.02 0.571 0.005 1.177 0.005
68.5 51 15.134 0.006 1.088 0.014 0.459 0.025 0.632 0.009 1.309 0.008
706.7 842.4 15.192 0.004 1.84 0.014 1.504 0.079 1.03 0.005 1.986 0.004
150.3 825.4 15.197 0.004 1.112 0.01 0.388 0.023 0.657 0.006 1.316 0.005
313.6 726.9 15.205 0.004 2.212 0.017 99.999 99.999 1.223 0.005 2.286 0.004
375.9 803.3 15.224 0.003 2.564 0.018 99.999 99.999 1.531 0.004 3.096 0.003
799.1 572.3 15.23 0.004 2.175 0.017 99.999 99.999 1.197 0.005 2.282 0.005
903.7 670.2 15.288 0.005 0.988 0.01 0.556 0.022 0.573 0.006 1.197 0.005
864.3 948.6 15.3 0.004 1.032 0.011 0.343 0.023 0.632 0.006 1.293 0.005
521.4 250.4 15.316 0.005 1.04 0.01 0.404 0.023 0.609 0.006 1.242 0.005
892.6 117 15.322 0.004 1.195 0.011 0.554 0.031 0.706 0.006 1.405 0.005
461.7 756.4 15.425 0.005 1.084 0.011 0.441 0.025 0.609 0.006 1.244 0.005
76.8 106.8 15.463 0.006 1.174 0.015 0.552 0.029 0.651 0.008 1.321 0.007
695.9 568.1 15.488 0.006 1.072 0.014 0.396 0.025 0.65 0.009 1.255 0.027
463 662.2 15.506 0.005 1.279 0.011 0.749 0.034 0.735 0.006 1.424 0.006
203.7 486 15.517 0.007 2.078 0.021 99.999 99.999 1.127 0.008 2.196 0.006
360.7 317 15.546 0.005 1.068 0.012 0.374 0.028 0.643 0.007 1.261 0.007
470.2 605.9 15.559 0.004 1.315 0.012 0.62 0.035 0.747 0.006 1.489 0.005
247.4 882.8 15.6 0.004 2.152 0.019 99.999 99.999 1.191 0.005 2.26 0.004
548 109.8 15.611 0.004 1.321 0.012 0.62 0.033 0.743 0.006 1.479 0.005
140.3 606.1 15.616 0.005 1.837 0.016 1.35 0.085 1.014 0.006 1.982 0.005
188.1 270.2 15.655 0.005 1.176 0.013 0.437 0.029 0.689 0.007 1.392 0.006
209.3 281.9 15.658 0.005 1.184 0.014 0.464 0.031 0.693 0.006 1.377 0.006
328.2 15.2 15.663 0.006 1.1 0.014 0.398 0.029 0.659 0.008 1.325 0.007
88 309.4 15.683 0.005 1.884 0.018 1.365 0.119 1.005 0.006 1.983 0.005
211 583.4 15.74 0.004 1.191 0.013 0.571 0.033 0.699 0.006 1.372 0.005
627.1 302.6 15.745 0.005 1.194 0.013 0.591 0.034 0.717 0.006 1.432 0.006
358.2 286.1 15.779 0.004 1.274 0.014 0.588 0.037 0.737 0.007 1.462 0.006
333.6 329.6 15.836 0.008 1.821 0.024 99.999 99.999 0.987 0.012 1.85 0.027
444 138.8 15.841 0.005 1.097 0.014 0.394 0.031 0.614 0.006 1.263 0.006

© C
op
yri
gh
t 2
01
0: In
stitu
to d
e A
stro
no
mía
, U
niv
ers
ida
d N
ac
ion
al A
utó
no
ma
de
Mé
xic
o
UBVRI PHOTOMETRY OF OPEN CLUSTERS 403
TABLE 4 (CONTINUED)
X Y V σV (B − V ) σB−V (U − B) σU−B (V − R) σV −R (V − I) σV −I
184.3 820 15.872 0.006 2.283 0.023 99.999 99.999 1.231 0.007 2.301 0.006
290.3 303.8 15.937 0.005 1.284 0.016 0.499 0.038 0.723 0.007 1.418 0.007
185.1 234.9 16.002 0.006 2.123 0.027 99.999 99.999 1.139 0.007 2.165 0.006
752.2 402 16.035 0.005 1.217 0.016 0.546 0.043 0.715 0.008 1.418 0.007
882.7 333.3 16.039 0.006 1.919 0.021 99.999 99.999 1.051 0.007 2.013 0.006
752.8 733.8 16.051 0.004 1.208 0.015 0.579 0.042 0.727 0.006 1.435 0.006
366.3 480.5 16.091 0.006 2.366 0.027 99.999 99.999 1.308 0.007 2.527 0.006
768.8 543 16.107 0.006 2.45 0.028 99.999 99.999 1.312 0.008 2.477 0.006
338.2 90.7 16.112 0.006 1.23 0.017 0.653 0.05 0.762 0.009 1.471 0.008
824.9 64.7 16.124 0.006 2.435 0.032 99.999 99.999 1.381 0.008 2.598 0.006
886.1 231.2 16.133 0.006 1.304 0.019 99.999 99.999 0.718 0.008 1.438 0.007
306.2 824.7 16.141 0.006 1.819 0.02 99.999 99.999 0.921 0.008 1.676 0.006
191.6 669.5 16.186 0.005 1.206 0.016 0.543 0.044 0.708 0.008 1.429 0.007
92 678 16.2 0.006 1.869 0.025 99.999 99.999 0.999 0.008 1.928 0.006
415.8 968.1 16.235 0.006 1.435 0.019 0.716 0.063 0.793 0.008 1.576 0.007
413.4 213.4 16.237 0.007 2.121 0.028 99.999 99.999 1.122 0.008 2.164 0.007
95.5 889.5 16.243 0.006 1.18 0.017 0.262 0.04 0.649 0.009 1.354 0.008
24.3 299.1 16.3 0.006 1.182 0.018 0.353 0.047 0.701 0.01 1.439 0.008
815.3 887.9 16.324 0.006 1.194 0.02 0.593 0.054 0.76 0.009 1.495 0.008
813.1 638.1 16.356 0.006 1.982 0.024 99.999 99.999 1.103 0.008 2.116 0.007
515.2 188.3 16.388 0.007 1.684 0.025 99.999 99.999 0.941 0.008 1.798 0.007
610.2 294 16.405 0.006 1.342 0.022 0.947 0.081 0.769 0.009 1.516 0.008
282.9 830.9 16.434 0.006 1.129 0.018 0.392 0.045 0.709 0.008 1.405 0.008
630.8 635.4 16.465 0.007 1.319 0.021 0.568 0.059 0.785 0.01 1.499 0.009
344.2 162.9 16.467 0.007 1.347 0.021 0.765 0.07 0.768 0.009 1.506 0.008
79.3 270.1 16.506 0.008 1.229 0.021 99.999 99.999 0.74 0.01 1.461 0.008
572.8 213.6 16.526 0.021 1.805 0.034 99.999 99.999 1.028 0.067 99.999 99.999
129.5 127 16.538 0.006 1.239 0.021 0.392 0.059 0.714 0.01 1.408 0.009
737.2 811.1 16.557 0.013 1.498 0.023 0.822 0.107 0.862 0.01 1.671 0.009
264.5 777.8 16.594 0.007 2.012 0.031 99.999 99.999 1.095 0.008 2.074 0.007
934.5 237.7 16.614 0.009 2.107 0.038 99.999 99.999 1.144 0.012 2.187 0.01
760.6 550.9 16.634 0.008 1.309 0.022 0.639 0.071 0.777 0.009 1.533 0.009
61.3 553.6 16.652 0.007 1.884 0.03 99.999 99.999 1.057 0.009 2.061 0.008
746.1 114.2 16.664 0.008 2.049 0.033 99.999 99.999 1.109 0.01 2.11 0.008
137 235.2 16.673 0.007 1.193 0.022 0.559 0.074 0.743 0.01 1.437 0.009
490.8 408.2 16.687 0.008 1.758 0.029 99.999 99.999 1.029 0.01 2.007 0.008
409.1 283.6 16.709 0.008 1.326 0.023 0.727 0.077 0.763 0.011 1.498 0.01
95.7 22.9 16.717 0.01 1.954 0.034 99.999 99.999 1.103 0.012 2.117 0.011
354.4 941.2 16.733 0.007 1.144 0.023 0.481 0.064 0.698 0.01 1.407 0.01
812.7 355.6 16.742 0.007 1.902 0.031 99.999 99.999 1.057 0.009 2.031 0.008
505.7 194.2 16.752 0.009 1.286 0.025 0.652 0.098 0.752 0.012 1.481 0.011
863.5 537.6 16.767 0.008 1.727 0.03 99.999 99.999 1.082 0.01 2.244 0.008
972.6 730.3 16.781 0.009 1.918 0.033 99.999 99.999 1.026 0.011 2.028 0.009
2.1 118.5 16.789 0.009 2.02 0.04 99.999 99.999 1.077 0.012 2.098 0.01
391.1 830.6 16.817 0.009 1.322 0.026 0.71 0.095 0.76 0.011 1.488 0.01
873.1 206.6 16.842 0.01 1.587 0.032 99.999 99.999 0.878 0.012 1.721 0.011
586.2 658.1 16.85 0.008 1.634 0.031 99.999 99.999 0.874 0.01 1.742 0.009
290 63.5 16.873 0.009 2.045 0.036 99.999 99.999 1.175 0.011 2.249 0.009
725.5 100.3 16.877 0.008 1.24 0.025 0.451 0.082 0.718 0.011 1.433 0.01
555 250.4 16.887 0.008 1.771 0.034 99.999 99.999 0.988 0.011 1.947 0.009
854 771.5 16.893 0.013 1.408 0.027 0.58 0.111 0.796 0.012 1.58 0.011
461.8 176.8 16.913 0.008 1.371 0.028 99.999 99.999 0.773 0.011 1.49 0.01
905.1 15.1 16.923 0.011 1.366 0.029 0.665 0.088 0.772 0.013 1.539 0.011
456.4 781.6 16.941 0.007 2.022 0.036 99.999 99.999 1.123 0.009 2.116 0.008
99.2 770.3 16.949 0.01 99.999 99.999 99.999 99.999 1.036 0.013 2.123 0.039
927.5 475 16.953 0.009 1.58 0.03 99.999 99.999 0.939 0.011 1.806 0.01
680.8 105.6 16.967 0.008 1.871 0.036 99.999 99.999 1.029 0.01 2.015 0.009
213.2 622.9 16.969 0.009 1.477 0.03 99.999 99.999 0.851 0.012 1.668 0.01
406.4 861.7 16.987 0.009 1.7 0.035 99.999 99.999 0.979 0.011 1.894 0.009
419 210.8 16.995 0.011 1.88 0.043 99.999 99.999 1.037 0.014 2.012 0.014
586.2 482.6 17.031 0.01 1.26 0.025 0.761 0.103 0.741 0.012 1.467 0.01
794.2 705.6 17.04 0.009 1.926 0.043 99.999 99.999 1.098 0.011 2.084 0.009
678.4 942 17.043 0.012 2.349 0.061 99.999 99.999 1.293 0.016 2.421 0.013
849.3 61.4 17.07 0.01 1.88 0.04 99.999 99.999 1.07 0.012 2.077 0.01
365.7 892.8 17.073 0.01 1.297 0.03 99.999 99.999 0.828 0.013 1.58 0.011
156.4 570 17.083 0.008 1.268 0.026 99.999 99.999 0.764 0.011 1.493 0.009

© C
op
yri
gh
t 2
01
0: In
stitu
to d
e A
stro
no
mía
, U
niv
ers
ida
d N
ac
ion
al A
utó
no
ma
de
Mé
xic
o
404 AKKAYA ET AL.
TABLE 4 (CONTINUED)
X Y V σV (B − V ) σB−V (U − B) σU−B (V − R) σV −R (V − I) σV −I
368.6 275.1 17.086 0.009 2.122 0.051 99.999 99.999 1.196 0.011 2.257 0.009
445.4 296.3 17.104 0.011 1.301 0.029 99.999 99.999 0.746 0.014 1.485 0.012
218.5 564.4 17.138 0.009 1.362 0.033 99.999 99.999 0.757 0.012 1.519 0.01
476.3 271.1 17.139 0.01 1.332 0.028 99.999 99.999 0.758 0.013 1.494 0.011
822 108.5 17.151 0.01 2.077 0.049 99.999 99.999 1.21 0.013 2.301 0.011
906.3 510.2 17.165 0.01 1.756 0.039 99.999 99.999 0.991 0.013 1.952 0.01
482.2 595.9 17.168 0.009 1.926 0.045 99.999 99.999 1.131 0.012 2.12 0.01
237.5 120.7 17.173 0.009 2.32 0.052 99.999 99.999 1.267 0.012 2.38 0.01
527.7 735.7 17.181 0.009 1.942 0.045 99.999 99.999 1.052 0.011 1.994 0.009
906.9 842.3 17.183 0.011 1.385 0.034 99.999 99.999 0.8 0.014 1.585 0.012
201.5 732.9 17.184 0.009 1.217 0.031 99.999 99.999 0.8 0.012 1.525 0.011
925.6 149.5 17.197 0.015 99.999 99.999 99.999 99.999 0.83 0.022 1.654 0.019
466 902.1 17.217 0.009 1.854 0.043 99.999 99.999 0.993 0.011 1.949 0.009
446.9 492.6 17.218 0.014 99.999 99.999 99.999 99.999 1.086 0.019 99.999 99.999
745.3 579.2 17.219 0.011 1.391 0.034 99.999 99.999 0.881 0.014 1.718 0.012
751.7 152.2 17.219 0.011 1.897 0.053 99.999 99.999 1.078 0.015 2.063 0.012
607.5 572.6 17.223 0.011 1.342 0.033 99.999 99.999 0.786 0.014 1.55 0.012
753.5 233.6 17.224 0.011 1.803 0.038 99.999 99.999 1.094 0.014 2.079 0.012
319.2 878.6 17.236 0.01 1.311 0.031 99.999 99.999 0.75 0.013 1.474 0.011
810 904 17.241 0.011 1.403 0.035 99.999 99.999 0.861 0.015 1.66 0.013
110.2 933.7 17.245 0.011 1.413 0.035 99.999 99.999 0.787 0.015 1.558 0.013
357.8 451.6 17.249 0.01 1.513 0.034 99.999 99.999 0.825 0.013 1.591 0.011
328.3 762.8 17.26 0.01 1.815 0.041 99.999 99.999 1.021 0.013 1.969 0.011
818.2 740.1 17.263 0.01 1.784 0.041 99.999 99.999 1.012 0.013 1.956 0.011
611.8 964.6 17.306 0.011 1.419 0.035 99.999 99.999 0.804 0.015 1.572 0.014
508 75.8 17.31 0.012 1.431 0.035 99.999 99.999 0.81 0.014 1.613 0.013
971.1 836.7 17.322 0.011 1.909 0.05 99.999 99.999 1.064 0.014 2.097 0.012
919.6 70.5 17.327 0.012 1.279 0.038 99.999 99.999 0.767 0.015 1.542 0.013
547.2 231.7 17.357 0.011 1.756 0.048 99.999 99.999 1.025 0.014 1.975 0.012
824.3 986.5 17.382 0.011 1.823 0.052 99.999 99.999 1.022 0.014 1.953 0.012
7.8 319.3 17.389 0.013 2.027 0.051 99.999 99.999 1.085 0.016 2.095 0.013
869.9 635.1 17.397 0.01 1.69 0.046 99.999 99.999 1.029 0.013 1.973 0.011
974.9 118.1 17.418 0.009 2.62 0.081 99.999 99.999 1.382 0.012 2.67 0.01
792.6 311.8 17.424 0.015 1.873 0.055 99.999 99.999 1.034 0.019 1.989 0.016
31.4 739.7 17.429 0.013 2.082 0.063 99.999 99.999 1.137 0.016 2.149 0.013
518.1 429.3 17.43 0.012 1.284 0.037 99.999 99.999 0.757 0.016 1.542 0.014
334.7 347.9 17.448 0.013 1.36 0.036 99.999 99.999 0.796 0.016 1.521 0.014
87.4 480.8 17.453 0.011 2.005 0.058 99.999 99.999 1.093 0.014 2.092 0.012
87.5 256.5 17.459 0.012 2.073 0.068 99.999 99.999 1.098 0.015 2.116 0.012
469.8 867.5 17.461 0.012 1.473 0.041 99.999 99.999 0.854 0.015 1.673 0.013
655.5 726.6 17.461 0.011 1.536 0.039 99.999 99.999 0.858 0.014 1.66 0.012
528.4 217.8 17.463 0.012 2.028 0.067 99.999 99.999 1.127 0.016 2.086 0.013
137.2 585.6 17.469 0.011 1.984 0.051 99.999 99.999 1.097 0.014 2.082 0.012
111.4 515.9 17.476 0.014 1.968 0.058 99.999 99.999 1.092 0.019 2.107 0.015
201.9 138.1 17.485 0.012 2.028 0.063 99.999 99.999 1.17 0.016 2.187 0.013
7.3 466.3 17.487 0.011 1.361 0.035 99.999 99.999 0.78 0.016 1.54 0.012
164.5 186.9 17.489 0.013 1.42 0.037 99.999 99.999 0.789 0.017 1.548 0.015
229.5 520.9 17.505 0.011 1.33 0.042 99.999 99.999 0.812 0.015 1.523 0.013
167.3 429.6 17.511 0.012 1.653 0.053 99.999 99.999 1.014 0.015 1.966 0.013
608.8 72.8 17.522 0.012 1.609 0.046 99.999 99.999 0.846 0.015 1.679 0.013
72.4 217.1 17.532 0.013 1.351 0.043 99.999 99.999 0.77 0.017 1.537 0.015
434.2 710.5 17.534 0.012 1.447 0.054 99.999 99.999 0.914 0.015 1.728 0.014
734.2 460.8 17.542 0.012 1.702 0.047 99.999 99.999 0.974 0.015 1.843 0.013
659.9 85.5 17.547 0.013 2.064 0.052 99.999 99.999 1.102 0.017 2.127 0.014
468.6 705.9 17.551 0.012 1.368 0.038 99.999 99.999 0.812 0.015 1.61 0.013
690.6 801.2 17.57 0.012 1.328 0.04 99.999 99.999 0.828 0.017 1.662 0.014
795.7 485.1 17.582 0.014 99.999 99.999 99.999 99.999 1.103 0.018 2.119 0.015
205.9 514 17.583 0.014 2.232 0.07 99.999 99.999 1.212 0.018 2.285 0.015
879.8 929.6 17.584 0.012 1.381 0.044 99.999 99.999 0.803 0.015 1.618 0.013
873.3 723.2 17.587 0.011 1.898 0.05 99.999 99.999 1.123 0.014 2.092 0.012
714.3 66.9 17.594 0.013 1.376 0.044 99.999 99.999 0.8 0.017 1.574 0.015
601.7 607.3 17.623 0.012 2.037 0.073 99.999 99.999 1.104 0.015 2.101 0.013
24.5 766.4 17.627 0.015 1.367 0.045 99.999 99.999 0.758 0.018 1.545 0.016
331.1 211.7 17.632 0.014 1.393 0.045 99.999 99.999 0.835 0.018 1.554 0.016
768.7 25.7 17.642 0.012 2.137 0.077 99.999 99.999 1.201 0.016 2.278 0.013
282.8 367.4 17.643 0.014 99.999 99.999 99.999 99.999 1.004 0.018 1.968 0.016

© C
op
yri
gh
t 2
01
0: In
stitu
to d
e A
stro
no
mía
, U
niv
ers
ida
d N
ac
ion
al A
utó
no
ma
de
Mé
xic
o
UBVRI PHOTOMETRY OF OPEN CLUSTERS 405
TABLE 4 (CONTINUED)
X Y V σV (B − V ) σB−V (U − B) σU−B (V − R) σV −R (V − I) σV −I
271 201.8 17.667 0.013 99.999 99.999 99.999 99.999 1.113 0.018 2.15 0.014
410.2 815.2 17.667 0.015 2.004 0.065 99.999 99.999 1.171 0.02 2.15 0.016
174.1 880.8 17.669 0.014 1.98 0.065 99.999 99.999 1.109 0.019 2.12 0.016
451.2 656.3 17.669 0.015 1.413 0.045 99.999 99.999 0.727 0.019 1.478 0.016
310.9 206.9 17.67 0.012 1.611 0.051 99.999 99.999 0.882 0.016 1.75 0.014
654.1 576.7 17.672 0.013 2.396 0.086 99.999 99.999 1.263 0.017 2.388 0.014
789.2 702.1 17.683 0.014 1.487 0.048 99.999 99.999 0.826 0.019 1.652 0.016
775.5 886.6 17.685 0.014 1.056 0.037 99.999 99.999 0.658 0.019 1.364 0.017
348.7 659.8 17.694 0.013 1.294 0.041 99.999 99.999 0.753 0.018 1.529 0.015
210.8 480.9 17.701 0.013 2.119 0.077 99.999 99.999 1.122 0.017 2.14 0.014
544.3 696.3 17.701 0.015 1.373 0.045 99.999 99.999 0.831 0.019 1.64 0.016
323.4 401.1 17.708 0.014 2.048 0.074 99.999 99.999 1.048 0.018 1.956 0.015
902.9 681.7 17.715 0.012 2.119 0.066 99.999 99.999 1.185 0.016 2.209 0.013
296.1 529.6 17.717 0.014 1.454 0.05 99.999 99.999 0.817 0.019 1.569 0.016
356 482.3 17.728 0.013 1.282 0.045 99.999 99.999 0.818 0.017 1.611 0.014
779.3 599.5 17.733 0.015 1.307 0.062 99.999 99.999 0.778 0.02 1.535 0.017
363.4 109.5 17.74 0.014 1.812 0.06 99.999 99.999 1 0.018 1.911 0.016
547.8 846.7 17.756 0.015 1.413 0.049 99.999 99.999 0.831 0.019 1.632 0.017
780.8 604.5 17.761 0.016 1.361 0.063 99.999 99.999 0.879 0.024 1.686 0.02
203 36.2 17.767 0.015 1.781 0.067 99.999 99.999 1.064 0.019 2.072 0.016
92.1 990.2 17.767 0.017 1.47 0.049 99.999 99.999 0.797 0.024 1.56 0.02
702.2 601.4 17.768 0.014 1.339 0.041 99.999 99.999 0.828 0.018 1.609 0.016
662.5 917.2 17.769 0.014 1.962 0.062 99.999 99.999 1.058 0.018 2.044 0.015
725.8 623 17.775 0.013 1.525 0.05 99.999 99.999 0.897 0.017 1.742 0.014
877.3 477.7 17.777 0.013 2.019 0.067 99.999 99.999 1.091 0.017 2.078 0.014
985.6 318.6 17.784 0.016 1.468 0.054 99.999 99.999 0.825 0.023 1.595 0.019
218.7 812.3 17.789 0.014 1.235 0.043 99.999 99.999 0.789 0.018 1.573 0.016
951.4 441 17.796 0.013 1.41 0.05 99.999 99.999 0.79 0.017 1.571 0.015
275.4 536.2 17.799 0.015 1.899 0.074 99.999 99.999 1.156 0.019 2.143 0.016
555.7 140.9 17.803 0.012 1.857 0.064 99.999 99.999 1.158 0.016 2.171 0.013
246 723.6 17.818 0.014 1.866 0.078 99.999 99.999 1.13 0.018 2.125 0.015
850.1 803.5 17.819 0.014 1.613 0.051 99.999 99.999 0.868 0.018 1.65 0.016
129.8 227.8 17.822 0.015 1.398 0.049 99.999 99.999 0.868 0.018 1.63 0.017
768.6 616.3 17.826 0.015 1.358 0.049 99.999 99.999 0.833 0.02 1.656 0.02
226.9 302.7 17.83 0.015 2.57 0.116 99.999 99.999 1.193 0.019 2.303 0.015
848.3 122.4 17.842 0.019 99.999 99.999 99.999 99.999 1.086 0.024 2.079 0.02
624.2 13.8 17.843 0.015 1.392 0.049 99.999 99.999 0.844 0.02 1.607 0.018
656.1 636.9 17.859 0.016 1.834 0.074 99.999 99.999 1.18 0.02 2.467 0.016
924.3 881 17.873 0.015 2.234 0.144 99.999 99.999 1.974 0.02 4.023 0.016
485.3 54.3 17.878 0.015 1.752 0.07 99.999 99.999 0.986 0.019 1.968 0.017
776.4 547.5 17.878 0.016 1.894 0.074 99.999 99.999 1.086 0.02 2.068 0.017
626.6 918.6 17.891 0.015 1.644 0.061 99.999 99.999 0.991 0.019 1.87 0.016
169.6 332.3 17.892 0.018 1.62 0.066 99.999 99.999 0.904 0.023 1.844 0.02
475.8 951.5 17.894 0.014 1.815 0.075 99.999 99.999 1.039 0.018 2.036 0.015
615.9 635.6 17.927 0.016 1.859 0.074 99.999 99.999 1.086 0.021 2.107 0.018
668.5 725.7 17.93 0.016 1.474 0.055 99.999 99.999 0.858 0.02 1.685 0.018
981.7 950.3 17.934 0.017 1.544 0.055 99.999 99.999 0.887 0.023 1.728 0.02
88.4 816.2 17.936 0.014 1.761 0.074 99.999 99.999 1.037 0.019 1.989 0.016
473.4 164.6 17.939 0.015 1.801 0.072 99.999 99.999 1.124 0.019 2.07 0.016
695.6 330.1 17.943 0.019 1.944 0.083 99.999 99.999 1.13 0.026 99.999 99.999
125.4 340 17.946 0.016 1.876 0.073 99.999 99.999 1.089 0.02 2.093 0.017
71.7 473.4 17.949 0.015 2.197 0.096 99.999 99.999 1.098 0.02 2.188 0.016
781.7 480.8 17.958 0.016 1.83 0.074 99.999 99.999 0.997 0.021 1.972 0.017
19.2 716.9 17.964 0.015 1.341 0.055 99.999 99.999 0.781 0.019 1.552 0.016
384.2 612.5 17.968 0.014 1.563 0.058 99.999 99.999 0.882 0.019 1.744 0.015
71.3 314.4 17.97 0.019 1.929 0.075 99.999 99.999 1.103 0.023 2.052 0.02
293.6 642.1 17.974 0.017 1.661 0.071 99.999 99.999 0.979 0.022 1.907 0.019
234.5 252.3 17.978 0.017 1.8 0.074 99.999 99.999 0.975 0.021 1.939 0.018
794.2 761 17.983 0.02 2.19 0.101 99.999 99.999 1.16 0.026 2.207 0.021
686.7 183.9 17.991 0.015 1.378 0.06 99.999 99.999 0.862 0.02 1.676 0.018
381.4 217.1 17.995 0.016 2.145 0.103 99.999 99.999 1.202 0.02 2.232 0.017
262.2 294.3 17.997 0.018 2.129 0.102 99.999 99.999 1.164 0.022 2.223 0.018
240.9 236.3 17.999 0.017 99.999 99.999 99.999 99.999 1.041 0.022 1.954 0.018
732.9 758.2 18.004 0.015 1.675 0.065 99.999 99.999 0.916 0.02 1.793 0.016
452.9 189.2 18.011 0.018 1.444 0.065 99.999 99.999 0.852 0.023 1.645 0.021
564.3 495.4 18.017 0.016 1.859 0.069 99.999 99.999 1.2 0.02 2.208 0.017

© C
op
yri
gh
t 2
01
0: In
stitu
to d
e A
stro
no
mía
, U
niv
ers
ida
d N
ac
ion
al A
utó
no
ma
de
Mé
xic
o
406 AKKAYA ET AL.
TABLE 4 (CONTINUED)
X Y V σV (B − V ) σB−V (U − B) σU−B (V − R) σV −R (V − I) σV −I
784.2 128.7 18.022 0.015 2.148 0.088 99.999 99.999 1.192 0.02 2.261 0.015
86 981.2 18.029 0.016 1.98 0.088 99.999 99.999 1.055 0.021 2.044 0.017
559.1 342.8 18.031 0.016 1.299 0.06 99.999 99.999 0.839 0.022 1.645 0.019
621.8 401.8 18.038 0.017 1.493 0.064 99.999 99.999 0.887 0.022 1.685 0.019
89.1 656.5 18.039 0.022 99.999 99.999 99.999 99.999 0.807 0.031 1.608 0.028
565.2 744.2 18.053 0.017 1.386 0.057 99.999 99.999 0.855 0.022 1.639 0.019
770 383.1 18.055 0.022 1.488 0.072 99.999 99.999 0.853 0.031 1.702 0.026
936 416.7 18.057 0.015 1.618 0.061 99.999 99.999 0.909 0.02 1.789 0.017
64.9 663.2 18.068 0.017 1.828 0.09 99.999 99.999 1.04 0.022 2.018 0.018
561.6 865.9 18.07 0.016 1.428 0.06 99.999 99.999 0.836 0.021 1.62 0.018
339.2 141.5 18.074 0.017 1.326 0.058 99.999 99.999 0.741 0.023 1.488 0.02
29.4 688.4 18.1 0.019 99.999 99.999 99.999 99.999 1.057 0.024 2.019 0.02
639.4 780.1 18.101 0.019 2.005 0.086 99.999 99.999 1.115 0.024 2.153 0.019
942.9 270 18.101 0.018 1.596 0.071 99.999 99.999 0.899 0.024 1.693 0.02
660 510.9 18.104 0.023 1.76 0.09 99.999 99.999 1.015 0.03 99.999 99.999
538.7 10.3 18.109 0.017 1.532 0.074 99.999 99.999 0.813 0.022 1.646 0.019
534 206.9 18.114 0.019 1.979 0.087 99.999 99.999 1.072 0.024 2.005 0.02
104.2 768.2 18.117 0.023 99.999 99.999 99.999 99.999 0.851 0.031 99.999 99.999
702.1 852.9 18.118 0.018 1.589 0.074 99.999 99.999 0.917 0.024 1.785 0.02
634.1 309.7 18.123 0.018 1.809 0.081 99.999 99.999 0.98 0.023 1.95 0.019
18.8 612.5 18.126 0.018 1.946 0.082 99.999 99.999 1.028 0.023 2.036 0.019
301.3 286.2 18.13 0.018 99.999 99.999 99.999 99.999 0.833 0.025 1.548 0.02
154.6 58.7 18.143 0.018 1.457 0.065 99.999 99.999 0.845 0.023 1.665 0.019
180.2 599.2 18.148 0.018 1.716 0.076 99.999 99.999 0.924 0.022 1.912 0.019
384.4 351.1 18.155 0.02 1.228 0.061 99.999 99.999 0.854 0.028 1.574 0.024
367.9 577.9 18.17 0.019 1.586 0.071 99.999 99.999 0.804 0.024 1.66 0.021
321.6 180.6 18.174 0.02 1.019 0.054 99.999 99.999 0.532 0.026 1.198 0.024
617 889.7 18.182 0.018 1.43 0.065 99.999 99.999 0.894 0.023 1.689 0.02
396.5 755.3 18.187 0.018 99.999 99.999 99.999 99.999 1.183 0.023 2.231 0.019
243.6 499.2 18.188 0.017 1.309 0.065 99.999 99.999 0.848 0.022 1.596 0.02
708.6 913 18.197 0.02 1.445 0.066 99.999 99.999 0.877 0.027 1.683 0.024
424.6 215.9 18.198 0.022 1.574 0.076 99.999 99.999 0.844 0.029 1.611 0.036
253.4 805.6 18.204 0.02 0.938 0.049 99.999 99.999 0.491 0.027 1.119 0.023
112.5 255.6 18.207 0.022 1.442 0.067 99.999 99.999 0.795 0.029 1.616 0.024
389.1 792.5 18.211 0.017 1.574 0.071 99.999 99.999 0.838 0.024 1.67 0.022
298.2 225.2 18.214 0.021 1.365 0.073 99.999 99.999 0.802 0.027 1.571 0.025
423.5 27.7 18.215 0.021 99.999 99.999 99.999 99.999 1.157 0.027 2.236 0.022
922.1 394.6 18.22 0.022 1.356 0.078 99.999 99.999 0.835 0.031 1.643 0.028
361 686.7 18.225 0.022 99.999 99.999 99.999 99.999 1.07 0.028 1.994 0.024
111 342.2 18.225 0.019 1.185 0.062 99.999 99.999 0.773 0.025 1.57 0.021
398.2 318.1 18.237 0.019 1.697 0.089 99.999 99.999 1.03 0.025 2.009 0.022
405.6 308 18.237 0.017 1.904 0.102 99.999 99.999 1.024 0.022 1.998 0.019
363.4 868 18.238 0.02 1.409 0.074 99.999 99.999 0.799 0.027 1.622 0.024
472.3 304.8 18.245 0.019 1.863 0.099 99.999 99.999 1.07 0.025 2.073 0.02
508.4 17.4 18.246 0.019 1.405 0.064 99.999 99.999 0.88 0.024 1.716 0.02
532.6 313.5 18.246 0.02 1.317 0.069 99.999 99.999 0.785 0.025 1.582 0.021
440.5 448.8 18.253 0.021 1.903 0.098 99.999 99.999 1.11 0.027 2.102 0.023
320.9 42.3 18.257 0.019 1.64 0.078 99.999 99.999 0.884 0.024 1.748 0.021
986.6 232.2 18.258 0.019 1.978 0.104 99.999 99.999 0.952 0.025 1.912 0.02
450 290 18.265 0.021 1.365 0.064 99.999 99.999 0.834 0.028 1.655 0.023
316.1 846.9 18.267 0.023 99.999 99.999 99.999 99.999 0.861 0.032 1.686 0.029
372.5 958.6 18.267 0.02 1.298 0.069 99.999 99.999 0.757 0.025 1.512 0.022
783.9 820.6 18.271 0.016 1.419 0.073 99.999 99.999 0.872 0.022 1.663 0.018
829.5 860.4 18.278 0.024 1.401 0.077 99.999 99.999 0.818 0.034 1.638 0.029
705.8 462.1 18.284 0.02 1.89 0.088 99.999 99.999 1.043 0.025 2.021 0.021
464.5 233.2 18.285 0.023 1.72 0.107 99.999 99.999 0.866 0.031 1.69 0.027
813.9 651.7 18.287 0.016 1.365 0.068 99.999 99.999 0.826 0.023 1.684 0.018
19.2 121.5 18.293 0.019 1.905 0.102 99.999 99.999 1.126 0.026 2.129 0.021
512.9 118.8 18.315 0.021 1.412 0.071 99.999 99.999 0.875 0.026 1.69 0.023
222.8 499.6 18.32 0.021 1.965 0.102 99.999 99.999 1.152 0.027 2.143 0.023
600.4 429 18.32 0.02 1.612 0.087 99.999 99.999 1.006 0.025 1.89 0.021
540.9 912.4 18.325 0.019 1.841 0.106 99.999 99.999 0.941 0.025 1.843 0.021
636.8 506.6 18.335 0.019 1.504 0.075 99.999 99.999 0.853 0.025 1.648 0.022
21.3 444.2 18.338 0.021 1.371 0.066 99.999 99.999 0.874 0.028 1.735 0.024
889.9 539.7 18.343 0.02 1.877 0.088 99.999 99.999 1.076 0.026 2.048 0.022
21.5 597.5 18.346 0.022 1.346 0.072 99.999 99.999 0.774 0.028 1.577 0.025

© C
op
yri
gh
t 2
01
0: In
stitu
to d
e A
stro
no
mía
, U
niv
ers
ida
d N
ac
ion
al A
utó
no
ma
de
Mé
xic
o
UBVRI PHOTOMETRY OF OPEN CLUSTERS 407
TABLE 4 (CONTINUED)
X Y V σV (B − V ) σB−V (U − B) σU−B (V − R) σV −R (V − I) σV −I
639.9 912.8 18.351 0.02 99.999 99.999 99.999 99.999 1.076 0.026 2.029 0.022
122.9 438.9 18.356 0.019 2.021 0.128 99.999 99.999 1 0.025 2.035 0.02
127.3 48.8 18.363 0.021 1.369 0.075 99.999 99.999 0.876 0.028 1.682 0.024
540.9 740.8 18.372 0.021 1.293 0.079 99.999 99.999 0.876 0.028 1.654 0.025
978.6 104 18.374 0.02 1.343 0.078 99.999 99.999 0.858 0.027 1.618 0.024
659 782.1 18.377 0.019 1.354 0.066 99.999 99.999 0.858 0.026 1.646 0.021
104 207.9 18.382 0.023 1.993 0.102 99.999 99.999 1.042 0.029 2.059 0.024
770.3 966.7 18.389 0.021 1.532 0.085 99.999 99.999 0.95 0.026 1.793 0.022
899.1 688.8 18.391 0.02 1.712 0.09 99.999 99.999 0.834 0.028 1.676 0.024
180.3 472.9 18.395 0.021 1.473 0.081 99.999 99.999 0.985 0.029 1.814 0.025
345 502.8 18.395 0.022 1.844 0.108 99.999 99.999 0.988 0.03 1.964 0.024
980.7 395.9 18.404 0.024 99.999 99.999 99.999 99.999 1.021 0.031 1.913 0.026
406.1 164.1 18.405 0.021 1.656 0.103 99.999 99.999 0.986 0.027 1.937 0.023
303.4 159.3 18.409 0.023 1.512 0.083 99.999 99.999 0.835 0.029 1.619 0.025
515.2 91.2 18.409 0.022 1.413 0.091 99.999 99.999 0.943 0.028 1.806 0.025
396.6 620.2 18.411 0.021 1.497 0.084 99.999 99.999 0.958 0.027 1.759 0.023
823.8 537.1 18.411 0.021 1.484 0.088 99.999 99.999 0.87 0.027 1.662 0.024
432.4 593.6 18.415 0.021 1.636 0.095 99.999 99.999 0.937 0.027 1.814 0.023
52 700.1 18.424 0.024 1.852 0.122 99.999 99.999 1.044 0.032 2.025 0.026
215.9 235.4 18.429 0.021 99.999 99.999 99.999 99.999 1.16 0.027 2.277 0.022
375.3 600.2 18.433 0.022 1.477 0.081 99.999 99.999 0.993 0.028 1.941 0.023
260 848.6 18.439 0.022 1.408 0.083 99.999 99.999 0.955 0.028 1.775 0.025
267.9 915.8 18.443 0.022 1.594 0.093 99.999 99.999 1.07 0.029 2.051 0.024
154.6 810.4 18.445 0.022 1.359 0.083 99.999 99.999 0.827 0.029 1.625 0.025
206.2 388.7 18.451 0.02 1.383 0.081 99.999 99.999 0.923 0.025 1.776 0.022
221.3 943.6 18.458 0.024 2.053 0.139 99.999 99.999 1.143 0.03 2.151 0.025
814.4 882.2 18.472 0.031 99.999 99.999 99.999 99.999 0.913 0.041 1.728 0.034
785.2 358.9 18.485 0.023 99.999 99.999 99.999 99.999 1.052 0.029 2.032 0.025
376.4 573 18.486 0.025 1.586 0.094 99.999 99.999 1.068 0.031 2.026 0.026
60.1 85.2 18.488 0.026 1.612 0.107 99.999 99.999 0.917 0.033 1.739 0.028
173.3 748.6 18.492 0.024 99.999 99.999 99.999 99.999 1.101 0.03 2.03 0.026
757.7 317 18.494 0.023 1.46 0.088 99.999 99.999 0.794 0.03 1.602 0.025
130.9 109.1 18.496 0.023 1.187 0.075 99.999 99.999 0.861 0.03 1.633 0.025
508.9 918.3 18.501 0.023 1.763 0.114 99.999 99.999 0.975 0.029 1.954 0.024
14.3 826.2 18.505 0.02 1.176 0.071 99.999 99.999 0.799 0.027 1.56 0.023
839.1 774.3 18.515 0.028 1.266 0.076 99.999 99.999 0.899 0.036 1.744 0.032
143.1 282.5 18.52 0.025 1.335 0.09 99.999 99.999 0.843 0.035 1.668 0.03
777.5 523.5 18.521 0.023 1.276 0.076 99.999 99.999 0.872 0.03 1.668 0.026
980.3 451 18.522 0.021 1.768 0.124 99.999 99.999 0.952 0.027 1.888 0.023
667.4 220.8 18.526 0.023 1.723 0.102 99.999 99.999 1.005 0.031 1.975 0.025
262.9 39.2 18.527 0.025 1.252 0.075 99.999 99.999 0.896 0.033 1.68 0.028
484.1 551 18.53 0.021 99.999 99.999 99.999 99.999 0.968 0.028 1.913 0.023
367.6 877.7 18.541 0.025 1.708 0.118 99.999 99.999 0.853 0.035 1.63 0.031
823 324.7 18.549 0.022 1.38 0.079 99.999 99.999 0.899 0.029 1.813 0.024
303.9 589.4 18.551 0.023 1.505 0.087 99.999 99.999 0.856 0.03 1.702 0.026
516.4 894.4 18.557 0.024 99.999 99.999 99.999 99.999 0.88 0.031 1.712 0.026
799.6 652.7 18.561 0.023 1.459 0.089 99.999 99.999 0.834 0.031 1.653 0.026
855.3 665 18.564 0.025 1.465 0.102 99.999 99.999 0.853 0.032 1.697 0.027
197.1 930 18.566 0.023 99.999 99.999 99.999 99.999 1.085 0.03 2.083 0.025
403.5 623.1 18.566 0.025 1.69 0.105 99.999 99.999 1.072 0.032 2.093 0.026
818.2 83.4 18.57 0.025 1.54 0.098 99.999 99.999 0.942 0.033 1.782 0.031
704.8 960.7 18.576 0.022 1.553 0.083 99.999 99.999 0.872 0.028 1.689 0.025
28.5 126.4 18.578 0.027 99.999 99.999 99.999 99.999 1.05 0.034 2.069 0.029
165.3 308.2 18.585 0.027 1.856 0.136 99.999 99.999 1.183 0.035 2.167 0.029
22.7 787.2 18.589 0.024 1.583 0.122 99.999 99.999 0.921 0.032 1.721 0.028
185.4 44.3 18.598 0.026 1.487 0.102 99.999 99.999 0.992 0.033 1.901 0.028
621.6 79.5 18.607 0.028 1.828 0.145 99.999 99.999 1.004 0.035 2.002 0.03
330.4 36.6 18.61 0.026 1.31 0.092 99.999 99.999 0.876 0.035 1.657 0.031
315.5 662.9 18.627 0.024 1.479 0.098 99.999 99.999 0.808 0.032 1.629 0.028
53.7 504.4 18.634 0.027 99.999 99.999 99.999 99.999 0.998 0.034 1.951 0.028
439.8 228.9 18.634 0.023 1.46 0.084 99.999 99.999 0.796 0.032 1.656 0.03
5.5 523.6 18.636 0.023 1.511 0.105 99.999 99.999 0.871 0.03 1.685 0.026
980.2 401.1 18.638 0.033 99.999 99.999 99.999 99.999 1.007 0.044 1.948 0.038
680.5 293.2 18.643 0.024 1.658 0.116 99.999 99.999 0.973 0.033 1.796 0.028
541.5 879.7 18.646 0.027 99.999 99.999 99.999 99.999 0.996 0.035 2.026 0.029
512.2 846.2 18.648 0.026 99.999 99.999 99.999 99.999 1.068 0.033 2.021 0.028

© C
op
yri
gh
t 2
01
0: In
stitu
to d
e A
stro
no
mía
, U
niv
ers
ida
d N
ac
ion
al A
utó
no
ma
de
Mé
xic
o
408 AKKAYA ET AL.
TABLE 4 (CONTINUED)
X Y V σV (B − V ) σB−V (U − B) σU−B (V − R) σV −R (V − I) σV −I
843.5 66.1 18.651 0.025 99.999 99.999 99.999 99.999 1.124 0.032 2.155 0.028
551.7 960.8 18.656 0.026 1.477 0.101 99.999 99.999 0.911 0.035 1.761 0.03
563.2 503.2 18.666 0.026 1.485 0.096 99.999 99.999 0.844 0.032 1.699 0.028
153.6 563.6 18.674 0.03 99.999 99.999 99.999 99.999 0.914 0.041 1.751 0.034
677.8 429.4 18.675 0.026 99.999 99.999 99.999 99.999 1.028 0.033 1.99 0.028
673.5 800 18.676 0.025 1.295 0.081 99.999 99.999 0.854 0.032 1.717 0.027
447 635.2 18.68 0.023 99.999 99.999 99.999 99.999 1.093 0.029 1.996 0.026
171.2 179.8 18.682 0.027 1.598 0.117 99.999 99.999 0.988 0.035 1.847 0.03
111.4 715.1 18.688 0.025 99.999 99.999 99.999 99.999 1.106 0.032 2.015 0.027
897.7 829.8 18.689 0.028 1.507 0.123 99.999 99.999 0.825 0.035 1.728 0.031
438.2 606 18.694 0.022 99.999 99.999 99.999 99.999 1.154 0.029 2.162 0.024
728.5 738.8 18.694 0.023 1.754 0.122 99.999 99.999 0.985 0.029 1.828 0.025
526.3 242.4 18.7 0.032 99.999 99.999 99.999 99.999 0.879 0.041 1.758 0.035
493.5 172.3 18.71 0.03 1.57 0.114 99.999 99.999 1.146 0.039 2.108 0.032
971.6 311.4 18.713 0.023 99.999 99.999 99.999 99.999 1.165 0.029 2.188 0.025
953.2 469.3 18.715 0.023 1.178 0.076 99.999 99.999 0.831 0.03 1.629 0.026
956.6 93.3 18.717 0.025 1.625 0.129 99.999 99.999 1.071 0.032 2.083 0.027
573.8 722.6 18.722 0.027 99.999 99.999 99.999 99.999 1.178 0.035 2.152 0.029
335.5 821.2 18.725 0.028 1.439 0.1 99.999 99.999 0.748 0.036 1.537 0.031
668.1 847.1 18.727 0.024 1.679 0.134 99.999 99.999 0.917 0.032 1.763 0.027
708.8 372.7 18.727 0.03 99.999 99.999 99.999 99.999 1.073 0.038 2.178 0.031
885.7 830.7 18.738 0.026 1.609 0.108 99.999 99.999 1.009 0.035 1.961 0.028
406.5 489 18.739 0.028 99.999 99.999 99.999 99.999 1.123 0.036 2.148 0.031
481.8 464.8 18.74 0.026 1.557 0.097 99.999 99.999 0.899 0.033 1.728 0.029
616 294.4 18.741 0.031 99.999 99.999 99.999 99.999 1.123 0.039 2.12 0.033
62.7 607.4 18.742 0.026 1.334 0.095 99.999 99.999 0.781 0.033 1.621 0.029
727.2 225.2 18.743 0.028 99.999 99.999 99.999 99.999 0.975 0.036 1.983 0.03
231.5 800.9 18.756 0.025 1.347 0.11 99.999 99.999 0.956 0.034 1.771 0.028
891.7 47.4 18.758 0.031 99.999 99.999 99.999 99.999 1.105 0.04 2.104 0.033
407.4 719.7 18.76 0.024 1.447 0.089 99.999 99.999 0.872 0.033 1.685 0.027
228.8 163.8 18.763 0.028 1.479 0.116 99.999 99.999 1.011 0.036 1.865 0.031
453.3 952.2 18.765 0.03 99.999 99.999 99.999 99.999 0.998 0.037 1.977 0.032
388 228.9 18.767 0.03 1.289 0.093 99.999 99.999 0.883 0.04 1.665 0.036
630 728.3 18.768 0.026 99.999 99.999 99.999 99.999 1.048 0.033 2.059 0.027
195.9 842.3 18.772 0.031 99.999 99.999 99.999 99.999 1.055 0.043 1.995 0.035
204.1 638.4 18.775 0.028 1.74 0.146 99.999 99.999 0.999 0.037 1.905 0.031
323.9 106.6 18.778 0.028 99.999 99.999 99.999 99.999 0.803 0.036 1.586 0.03
698.5 703.8 18.779 0.029 99.999 99.999 99.999 99.999 1.076 0.038 2.062 0.031
121.7 623.8 18.781 0.027 1.666 0.128 99.999 99.999 0.991 0.036 1.895 0.03
603.2 270.6 18.783 0.028 1.429 0.095 99.999 99.999 0.896 0.036 1.646 0.032
414.9 714.9 18.79 0.028 99.999 99.999 99.999 99.999 1.095 0.037 2.058 0.031
624.4 101.3 18.791 0.028 1.47 0.135 99.999 99.999 1.07 0.036 2.058 0.03
674.2 204.7 18.791 0.029 1.497 0.108 99.999 99.999 0.918 0.039 1.723 0.032
809.2 752.9 18.803 0.026 1.589 0.117 99.999 99.999 0.921 0.036 1.763 0.03
111.2 882.9 18.81 0.03 99.999 99.999 99.999 99.999 0.981 0.038 1.802 0.033
641.6 926.8 18.827 0.029 99.999 99.999 99.999 99.999 1.019 0.036 1.981 0.031
706.7 788.2 18.834 0.025 1.265 0.101 99.999 99.999 0.813 0.034 1.643 0.028
162.7 433.5 18.835 0.031 99.999 99.999 99.999 99.999 0.866 0.042 1.667 0.037
33 905.9 18.841 0.031 99.999 99.999 99.999 99.999 1.079 0.039 2.028 0.033
786.1 2.5 18.847 0.032 1.372 0.131 99.999 99.999 0.977 0.04 1.836 0.035
426.4 625.7 18.849 0.029 0.984 0.09 99.999 99.999 0.704 0.038 1.467 0.033
439.5 710.4 18.849 0.031 99.999 99.999 99.999 99.999 0.84 0.041 1.577 0.038
71.7 287.8 18.849 0.028 99.999 99.999 99.999 99.999 0.971 0.037 1.853 0.031
567.8 948.9 18.855 0.03 99.999 99.999 99.999 99.999 0.93 0.038 1.76 0.033
709.3 427.2 18.855 0.028 99.999 99.999 99.999 99.999 1.011 0.037 1.898 0.031
20.2 423.8 18.862 0.029 99.999 99.999 99.999 99.999 0.888 0.038 1.73 0.033
207.7 655.7 18.873 0.03 1.327 0.096 99.999 99.999 0.859 0.04 1.688 0.033
488.5 348.6 18.873 0.027 1.502 0.116 99.999 99.999 0.87 0.036 1.696 0.031
386.1 88.4 18.885 0.029 99.999 99.999 99.999 99.999 0.988 0.039 1.954 0.032
961.5 305.3 18.901 0.028 1.321 0.11 99.999 99.999 0.772 0.036 1.62 0.031
254.6 839.7 18.904 0.03 1.582 0.133 99.999 99.999 1.062 0.04 2.02 0.033
879 274.3 18.904 0.033 99.999 99.999 99.999 99.999 0.866 0.042 1.709 0.037
13.3 125.9 18.904 0.032 1.273 0.126 99.999 99.999 0.88 0.04 1.704 0.036
295 239.5 18.906 0.026 99.999 99.999 99.999 99.999 1.079 0.035 2.038 0.029
849.6 504.2 18.906 0.033 99.999 99.999 99.999 99.999 0.955 0.041 1.862 0.035
168.7 806.8 18.917 0.029 99.999 99.999 99.999 99.999 1.066 0.039 2.091 0.031

© C
op
yri
gh
t 2
01
0: In
stitu
to d
e A
stro
no
mía
, U
niv
ers
ida
d N
ac
ion
al A
utó
no
ma
de
Mé
xic
o
UBVRI PHOTOMETRY OF OPEN CLUSTERS 409
TABLE 4 (CONTINUED)
X Y V σV (B − V ) σB−V (U − B) σU−B (V − R) σV −R (V − I) σV −I
832.4 227.2 18.917 0.034 99.999 99.999 99.999 99.999 1.13 0.043 2.156 0.037
446.1 669.5 18.919 0.031 99.999 99.999 99.999 99.999 1.101 0.041 1.936 0.035
37.5 479.3 18.92 0.033 99.999 99.999 99.999 99.999 0.871 0.042 1.787 0.037
808.3 302.7 18.92 0.032 99.999 99.999 99.999 99.999 0.826 0.042 1.61 0.036
591.6 730.9 18.926 0.034 99.999 99.999 99.999 99.999 0.971 0.044 1.788 0.038
890.1 733.4 18.932 0.035 1.506 0.149 99.999 99.999 0.821 0.045 1.69 0.038
256.4 755 18.938 0.029 1.337 0.141 99.999 99.999 0.834 0.039 1.652 0.035
599.7 249.7 18.946 0.033 1.331 0.104 99.999 99.999 0.883 0.042 1.747 0.036
529.8 978.5 18.95 0.032 1.47 0.124 99.999 99.999 0.912 0.042 1.734 0.036
467.2 562.9 18.951 0.034 99.999 99.999 99.999 99.999 0.946 0.043 1.884 0.037
534.2 423 18.951 0.031 99.999 99.999 99.999 99.999 0.821 0.04 1.681 0.035
970.9 901.3 18.952 0.031 99.999 99.999 99.999 99.999 0.999 0.039 1.955 0.034
3.7 773.8 18.959 0.031 99.999 99.999 99.999 99.999 0.989 0.04 1.947 0.033
349.1 285.4 18.961 0.03 99.999 99.999 99.999 99.999 0.868 0.038 1.734 0.034
557.9 39.3 18.965 0.037 99.999 99.999 99.999 99.999 1.045 0.046 1.992 0.04
186.3 279 18.969 0.035 99.999 99.999 99.999 99.999 1.031 0.045 1.951 0.038
586.5 607.7 18.973 0.034 1.471 0.151 99.999 99.999 0.898 0.044 1.765 0.038
785.8 525.9 18.98 0.029 99.999 99.999 99.999 99.999 1.059 0.038 1.987 0.031
444.9 392.6 18.982 0.033 99.999 99.999 99.999 99.999 1.231 0.043 2.186 0.036
59.1 848.2 18.984 0.034 1.293 0.142 99.999 99.999 0.887 0.044 1.723 0.038
364.8 400.4 18.995 0.032 99.999 99.999 99.999 99.999 1.143 0.041 2.128 0.034
401.7 374.8 18.997 0.029 99.999 99.999 99.999 99.999 0.923 0.04 1.765 0.034
534.8 32.3 18.997 0.033 99.999 99.999 99.999 99.999 1.202 0.043 2.196 0.035
986.6 77.2 19.001 0.033 99.999 99.999 99.999 99.999 0.964 0.043 1.821 0.036
488.6 556.3 19.008 0.034 99.999 99.999 99.999 99.999 1.172 0.044 2.098 0.036
514.2 836.6 19.015 0.041 99.999 99.999 99.999 99.999 0.704 0.053 1.486 0.046
175.8 646.1 19.019 0.033 1.58 0.158 99.999 99.999 0.873 0.043 1.701 0.036
841.3 28.8 19.019 0.04 99.999 99.999 99.999 99.999 1.047 0.056 1.925 0.043
247.6 412.4 19.02 0.031 99.999 99.999 99.999 99.999 0.922 0.039 1.768 0.036
850.1 365.6 19.028 0.029 99.999 99.999 99.999 99.999 0.935 0.039 1.816 0.032
263.3 603.1 19.031 0.047 99.999 99.999 99.999 99.999 1.062 0.062 2.053 0.051
138.2 688.8 19.037 0.036 99.999 99.999 99.999 99.999 0.994 0.046 1.891 0.039
141.4 365.1 19.039 0.033 99.999 99.999 99.999 99.999 0.921 0.044 1.784 0.037
214.2 363.3 19.043 0.036 99.999 99.999 99.999 99.999 1.058 0.047 2.001 0.04
69.6 857.8 19.043 0.037 99.999 99.999 99.999 99.999 0.992 0.047 1.921 0.04
420.3 632.8 19.044 0.03 99.999 99.999 99.999 99.999 1.027 0.039 1.861 0.034
915.2 778.7 19.044 0.034 99.999 99.999 99.999 99.999 0.74 0.045 1.495 0.04
410.9 352.7 19.045 0.036 99.999 99.999 99.999 99.999 0.869 0.046 1.784 0.039
316.2 29.8 19.048 0.04 99.999 99.999 99.999 99.999 1.112 0.05 2.124 0.043
403.4 251.8 19.05 0.035 99.999 99.999 99.999 99.999 1.015 0.045 1.91 0.039
593.6 279.8 19.05 0.035 99.999 99.999 99.999 99.999 0.966 0.046 1.784 0.039
676.9 240.2 19.056 0.033 99.999 99.999 99.999 99.999 0.983 0.043 1.85 0.036
285.4 736.2 19.057 0.037 99.999 99.999 99.999 99.999 0.863 0.048 1.815 0.039
286.7 960 19.057 0.033 99.999 99.999 99.999 99.999 0.966 0.041 1.86 0.036
233.6 276.2 19.058 0.035 99.999 99.999 99.999 99.999 1.032 0.047 2.015 0.038
512.6 742.4 19.062 0.035 99.999 99.999 99.999 99.999 0.921 0.044 1.742 0.038
242.3 279.1 19.069 0.042 99.999 99.999 99.999 99.999 0.719 0.057 1.553 0.048
926 569.8 19.069 0.032 99.999 99.999 99.999 99.999 1.189 0.041 2.15 0.034
722.6 206.6 19.077 0.034 99.999 99.999 99.999 99.999 1.005 0.044 2.004 0.037
34.2 928.4 19.084 0.041 99.999 99.999 99.999 99.999 1.018 0.055 2.027 0.045
651 25.9 19.084 0.032 99.999 99.999 99.999 99.999 0.944 0.042 1.788 0.036
836.3 636.9 19.084 0.04 99.999 99.999 99.999 99.999 0.974 0.05 1.909 0.042
43.8 36.4 19.085 0.037 99.999 99.999 99.999 99.999 0.971 0.049 1.842 0.041
73.1 861.1 19.085 0.041 99.999 99.999 99.999 99.999 1.031 0.053 2.106 0.044
983.4 742.3 19.085 0.037 99.999 99.999 99.999 99.999 0.861 0.048 1.718 0.041
494.7 53.5 19.09 0.037 99.999 99.999 99.999 99.999 0.966 0.047 1.921 0.04
320.2 656.5 19.098 0.036 99.999 99.999 99.999 99.999 0.885 0.047 1.73 0.041
325.6 344 19.101 0.037 99.999 99.999 99.999 99.999 0.959 0.048 1.798 0.042
161.5 370.8 19.103 0.038 99.999 99.999 99.999 99.999 0.94 0.05 1.783 0.042
449.4 759.5 19.105 0.036 1.435 0.172 99.999 99.999 1.045 0.047 1.886 0.04
880.9 593.5 19.107 0.034 99.999 99.999 99.999 99.999 0.996 0.045 1.839 0.037
336.7 768.1 19.118 0.034 99.999 99.999 99.999 99.999 0.849 0.045 1.713 0.039
928.6 885.5 19.121 0.038 99.999 99.999 99.999 99.999 1.093 0.049 99.999 99.999
76.9 119.6 19.133 0.039 99.999 99.999 99.999 99.999 1.02 0.049 1.982 0.041
34.9 210.5 19.139 0.034 99.999 99.999 99.999 99.999 1.047 0.044 2.03 0.036
943.4 779.2 19.14 0.04 99.999 99.999 99.999 99.999 0.876 0.053 1.764 0.044

© C
op
yri
gh
t 2
01
0: In
stitu
to d
e A
stro
no
mía
, U
niv
ers
ida
d N
ac
ion
al A
utó
no
ma
de
Mé
xic
o
410 AKKAYA ET AL.
TABLE 4 (CONTINUED)
X Y V σV (B − V ) σB−V (U − B) σU−B (V − R) σV −R (V − I) σV −I
531.2 900.2 19.146 0.035 99.999 99.999 99.999 99.999 0.933 0.046 1.736 0.04
573.9 235.7 19.152 0.039 99.999 99.999 99.999 99.999 0.957 0.049 1.839 0.042
167.8 394.8 19.153 0.043 99.999 99.999 99.999 99.999 0.721 0.056 1.646 0.047
742.1 70.2 19.154 0.035 99.999 99.999 99.999 99.999 1.082 0.044 2.094 0.038
131.4 559.3 19.156 0.039 99.999 99.999 99.999 99.999 0.93 0.05 1.817 0.043
254.2 283.7 19.161 0.047 99.999 99.999 99.999 99.999 0.986 0.06 1.986 0.051
325.1 500.9 19.161 0.042 99.999 99.999 99.999 99.999 0.853 0.058 1.738 0.046
123.8 717.4 19.167 0.035 99.999 99.999 99.999 99.999 1.078 0.045 2.006 0.038
712 860.4 19.169 0.036 99.999 99.999 99.999 99.999 0.955 0.046 1.834 0.04
138.6 125.4 19.172 0.035 99.999 99.999 99.999 99.999 0.916 0.045 1.796 0.038
308 749.5 19.173 0.039 99.999 99.999 99.999 99.999 0.839 0.05 1.674 0.045
413.7 652.5 19.178 0.04 99.999 99.999 99.999 99.999 0.776 0.052 1.618 0.045
694.2 164.3 19.179 0.034 99.999 99.999 99.999 99.999 1.148 0.044 2.102 0.037
791.7 876.4 19.18 0.036 99.999 99.999 99.999 99.999 0.943 0.049 1.83 0.041
92.9 368.4 19.187 0.034 99.999 99.999 99.999 99.999 0.936 0.045 1.797 0.039
746.4 31.5 19.19 0.039 99.999 99.999 99.999 99.999 1.141 0.049 2.147 0.042
806.8 851.7 19.194 0.04 99.999 99.999 99.999 99.999 0.904 0.052 1.744 0.044
188.5 851.8 19.204 0.041 99.999 99.999 99.999 99.999 0.953 0.053 1.758 0.045
342.8 414.4 19.206 0.038 99.999 99.999 99.999 99.999 0.949 0.048 1.786 0.042
150 833.7 19.214 0.046 99.999 99.999 99.999 99.999 0.971 0.059 1.846 0.051
431.9 777.5 19.214 0.034 99.999 99.999 99.999 99.999 1.122 0.046 2.029 0.038
79.9 764.1 19.219 0.033 99.999 99.999 99.999 99.999 0.775 0.047 1.618 0.039
74.2 879 19.22 0.036 99.999 99.999 99.999 99.999 1.032 0.046 2.034 0.038
195.8 326.2 19.222 0.044 99.999 99.999 99.999 99.999 0.993 0.058 1.984 0.047
313.9 624.6 19.225 0.042 99.999 99.999 99.999 99.999 0.988 0.053 1.887 0.046
122.9 640 19.227 0.04 99.999 99.999 99.999 99.999 0.908 0.054 1.713 0.047
447.3 274.1 19.228 0.038 99.999 99.999 99.999 99.999 1.149 0.053 2.101 0.043
786.7 978.3 19.229 0.037 99.999 99.999 99.999 99.999 0.881 0.048 1.723 0.042
49.7 856 19.233 0.043 99.999 99.999 99.999 99.999 0.823 0.056 1.624 0.048
462.2 742.5 19.233 0.042 99.999 99.999 99.999 99.999 1.042 0.053 2.05 0.045
816.8 116.7 19.234 0.043 99.999 99.999 99.999 99.999 0.919 0.057 1.797 0.049
335.6 798.7 19.239 0.035 99.999 99.999 99.999 99.999 0.881 0.047 1.678 0.042
529.1 938.4 19.25 0.034 99.999 99.999 99.999 99.999 0.839 0.046 1.695 0.038
127.2 668.9 19.25 0.035 99.999 99.999 99.999 99.999 0.869 0.046 1.749 0.039
373.5 717.6 19.256 0.043 99.999 99.999 99.999 99.999 0.904 0.056 1.726 0.047
545.3 746.5 19.258 0.036 99.999 99.999 99.999 99.999 0.985 0.048 1.863 0.041
869.2 36.7 19.258 0.045 99.999 99.999 99.999 99.999 0.746 0.057 1.591 0.049
946 704.9 19.259 0.042 99.999 99.999 99.999 99.999 0.913 0.053 1.826 0.045
817.1 251.3 19.265 0.044 99.999 99.999 99.999 99.999 1.169 0.056 2.164 0.047
433 989.5 19.266 0.046 99.999 99.999 99.999 99.999 0.883 0.059 1.641 0.052
169 221.6 19.272 0.04 99.999 99.999 99.999 99.999 1.081 0.051 2 0.045
627.9 410.5 19.272 0.045 99.999 99.999 99.999 99.999 1.076 0.058 2.036 0.048
407.8 195.7 19.274 0.039 99.999 99.999 99.999 99.999 0.969 0.053 99.999 99.999
190.4 612.7 19.275 0.041 99.999 99.999 99.999 99.999 0.979 0.054 1.796 0.046
521.2 511.6 19.276 0.039 99.999 99.999 99.999 99.999 1.096 0.049 2.113 0.042
955.9 461.1 19.277 0.043 99.999 99.999 99.999 99.999 0.787 0.055 1.58 0.049
308 175.1 19.282 0.036 99.999 99.999 99.999 99.999 0.964 0.046 1.81 0.043
811.5 848.3 19.285 0.038 99.999 99.999 99.999 99.999 1.021 0.049 1.972 0.041
662.4 949.2 19.289 0.036 99.999 99.999 99.999 99.999 0.951 0.048 1.808 0.041
567.6 126 19.29 0.041 99.999 99.999 99.999 99.999 1.019 0.055 1.891 0.045
275.9 620.7 19.292 0.04 99.999 99.999 99.999 99.999 0.962 0.052 1.768 0.045
320.2 922.2 19.292 0.046 99.999 99.999 99.999 99.999 0.852 0.061 1.663 0.053
547.3 323.5 19.294 0.038 99.999 99.999 99.999 99.999 0.912 0.05 1.726 0.042
583.3 393.4 19.294 0.05 99.999 99.999 99.999 99.999 0.741 0.062 1.518 0.056
869.8 64.6 19.299 0.046 99.999 99.999 99.999 99.999 0.953 0.059 1.822 0.051
257.1 148.2 19.304 0.043 99.999 99.999 99.999 99.999 0.924 0.054 1.754 0.048
696.3 493.3 19.304 0.041 99.999 99.999 99.999 99.999 0.87 0.054 1.695 0.047
561.9 187.3 19.308 0.038 99.999 99.999 99.999 99.999 0.714 0.051 1.496 0.047
837.7 366.4 19.308 0.041 99.999 99.999 99.999 99.999 0.975 0.055 1.77 0.047
440 614.4 19.309 0.042 99.999 99.999 99.999 99.999 0.908 0.055 1.891 0.045
714.5 256.1 19.319 0.043 99.999 99.999 99.999 99.999 0.926 0.056 1.76 0.049
856.5 310.3 19.32 0.045 99.999 99.999 99.999 99.999 0.938 0.058 1.788 0.049
965.3 600.1 19.323 0.042 99.999 99.999 99.999 99.999 0.918 0.054 1.789 0.046
429 162.8 19.324 0.043 99.999 99.999 99.999 99.999 0.993 0.057 1.875 0.05
616.2 504.1 19.327 0.042 99.999 99.999 99.999 99.999 1.033 0.053 2.053 0.045
105.3 984.4 19.328 0.044 99.999 99.999 99.999 99.999 0.877 0.057 1.755 0.048

© C
op
yri
gh
t 2
01
0: In
stitu
to d
e A
stro
no
mía
, U
niv
ers
ida
d N
ac
ion
al A
utó
no
ma
de
Mé
xic
o
UBVRI PHOTOMETRY OF OPEN CLUSTERS 411
TABLE 4 (CONTINUED)
X Y V σV (B − V ) σB−V (U − B) σU−B (V − R) σV −R (V − I) σV −I
522 825.8 19.33 0.047 99.999 99.999 99.999 99.999 1.049 0.06 1.921 0.051
854.9 956.3 19.331 0.043 99.999 99.999 99.999 99.999 0.987 0.055 1.853 0.046
91.4 319.3 19.332 0.046 99.999 99.999 99.999 99.999 0.94 0.059 1.942 0.049
80.9 819.9 19.334 0.046 99.999 99.999 99.999 99.999 0.839 0.058 1.667 0.051
609.4 303.9 19.34 0.041 99.999 99.999 99.999 99.999 1.101 0.055 2.041 0.044
535.1 329.2 19.344 0.039 99.999 99.999 99.999 99.999 0.957 0.052 1.934 0.043
142 157.2 19.352 0.041 99.999 99.999 99.999 99.999 0.979 0.055 1.869 0.046
234.7 697.3 19.352 0.045 99.999 99.999 99.999 99.999 1.004 0.056 1.963 0.049
576.9 548.7 19.352 0.042 99.999 99.999 99.999 99.999 0.927 0.055 1.784 0.046
265.2 901.1 19.355 0.045 99.999 99.999 99.999 99.999 0.972 0.059 1.942 0.049
484.4 851.3 19.362 0.041 99.999 99.999 99.999 99.999 1.076 0.052 2.053 0.045
863 798.4 19.367 0.046 99.999 99.999 99.999 99.999 1.187 0.059 2.081 0.05
952.6 283 19.369 0.041 99.999 99.999 99.999 99.999 0.885 0.053 1.827 0.046
423.5 221.9 19.371 0.048 99.999 99.999 99.999 99.999 0.875 0.064 1.673 0.062
875.3 527.4 19.374 0.042 99.999 99.999 99.999 99.999 0.978 0.054 1.745 0.048
725 383.6 19.375 0.038 99.999 99.999 99.999 99.999 0.86 0.051 1.695 0.044
101.1 109.3 19.381 0.049 99.999 99.999 99.999 99.999 0.784 0.066 1.49 0.061
458.5 264.4 19.382 0.041 99.999 99.999 99.999 99.999 0.99 0.054 1.942 0.046
209.6 859.9 19.385 0.043 99.999 99.999 99.999 99.999 0.859 0.055 1.651 0.048
22 191.8 19.386 0.049 99.999 99.999 99.999 99.999 0.883 0.063 1.815 0.053
740.2 583.8 19.388 0.042 99.999 99.999 99.999 99.999 0.915 0.056 1.752 0.048
213.7 176.1 19.389 0.045 99.999 99.999 99.999 99.999 1.037 0.058 1.973 0.049
804 958.7 19.393 0.042 99.999 99.999 99.999 99.999 1.018 0.053 1.744 0.048
581.8 575.3 19.397 0.039 99.999 99.999 99.999 99.999 1.01 0.052 1.891 0.042
771.5 105.9 19.398 0.043 99.999 99.999 99.999 99.999 0.902 0.057 1.716 0.049
636.8 551.3 19.402 0.048 99.999 99.999 99.999 99.999 0.997 0.061 1.819 0.053
878.9 86.3 19.402 0.045 99.999 99.999 99.999 99.999 1.071 0.06 2.068 0.05
471.6 39.2 19.408 0.043 99.999 99.999 99.999 99.999 0.824 0.058 1.693 0.046
691.4 295.5 19.41 0.052 99.999 99.999 99.999 99.999 0.991 0.066 1.879 0.058
351.3 551.2 19.415 0.043 99.999 99.999 99.999 99.999 0.898 0.057 1.819 0.049
691.6 260.6 19.417 0.054 99.999 99.999 99.999 99.999 0.992 0.068 1.836 0.059
418.6 797.3 19.418 0.043 99.999 99.999 99.999 99.999 1.03 0.056 2.015 0.046
674.6 861.3 19.418 0.049 99.999 99.999 99.999 99.999 0.969 0.062 1.889 0.053
283.6 326.6 19.42 0.05 99.999 99.999 99.999 99.999 0.97 0.063 1.946 0.053
876.5 381.7 19.428 0.048 99.999 99.999 99.999 99.999 0.907 0.062 1.724 0.053
489.4 954.1 19.429 0.042 99.999 99.999 99.999 99.999 0.917 0.055 1.69 0.049
821.5 201.3 19.433 0.052 99.999 99.999 99.999 99.999 0.957 0.068 1.826 0.058
844.3 771 19.434 0.042 99.999 99.999 99.999 99.999 0.848 0.056 1.764 0.047
924 43.5 19.435 0.043 99.999 99.999 99.999 99.999 1.099 0.057 2.106 0.047
823.5 190.9 19.436 0.049 99.999 99.999 99.999 99.999 0.868 0.067 1.654 0.058
457.9 304.7 19.44 0.044 99.999 99.999 99.999 99.999 1.021 0.06 1.885 0.049
673 123.3 19.441 0.048 99.999 99.999 99.999 99.999 0.844 0.062 1.715 0.053
783.8 80.5 19.444 0.044 99.999 99.999 99.999 99.999 0.974 0.058 1.951 0.048
254.4 396.2 19.445 0.056 99.999 99.999 99.999 99.999 1.024 0.071 2.03 0.06
586.7 798.9 19.445 0.054 99.999 99.999 99.999 99.999 0.874 0.07 1.746 0.061
317.8 648.7 19.446 0.05 99.999 99.999 99.999 99.999 1.044 0.064 2.039 0.054
436.8 981.3 19.447 0.046 99.999 99.999 99.999 99.999 0.83 0.059 1.718 0.05
604.8 709.5 19.447 0.044 99.999 99.999 99.999 99.999 1.068 0.057 2.055 0.048
693.5 953.8 19.447 0.044 99.999 99.999 99.999 99.999 0.881 0.058 1.648 0.05
818.4 496.8 19.448 0.046 99.999 99.999 99.999 99.999 0.965 0.058 1.907 0.05
891.9 457 19.448 0.052 99.999 99.999 99.999 99.999 0.843 0.066 1.699 0.057
648.6 812 19.451 0.043 99.999 99.999 99.999 99.999 0.995 0.056 2.095 0.049
355.5 988.2 19.452 0.046 99.999 99.999 99.999 99.999 0.751 0.059 1.502 0.053
198.1 413.6 19.453 0.05 99.999 99.999 99.999 99.999 0.904 0.068 1.767 0.057
6.3 591.5 19.453 0.041 99.999 99.999 99.999 99.999 0.862 0.055 1.805 0.045
970.5 498.7 19.454 0.049 99.999 99.999 99.999 99.999 0.868 0.064 1.694 0.054
561.3 532.2 19.457 0.039 99.999 99.999 99.999 99.999 0.955 0.052 1.828 0.044
461.6 339.1 19.459 0.051 99.999 99.999 99.999 99.999 0.956 0.069 1.788 0.06
700.3 262.3 19.461 0.048 99.999 99.999 99.999 99.999 0.958 0.061 1.9 0.053
277.2 208.1 19.464 0.05 99.999 99.999 99.999 99.999 0.933 0.063 1.714 0.056
107.9 142.1 19.474 0.048 99.999 99.999 99.999 99.999 0.833 0.061 1.788 0.053
868.5 871.5 19.477 0.047 99.999 99.999 99.999 99.999 0.815 0.061 1.739 0.052
162.4 718.3 19.479 0.06 99.999 99.999 99.999 99.999 0.951 0.079 1.847 0.067
216.5 495.2 19.48 0.049 99.999 99.999 99.999 99.999 1.033 0.066 99.999 99.999
588.3 340.1 19.48 0.05 99.999 99.999 99.999 99.999 0.96 0.064 1.785 0.055
485.5 581.3 19.482 0.048 99.999 99.999 99.999 99.999 0.896 0.063 1.758 0.054

© C
op
yri
gh
t 2
01
0: In
stitu
to d
e A
stro
no
mía
, U
niv
ers
ida
d N
ac
ion
al A
utó
no
ma
de
Mé
xic
o
412 AKKAYA ET AL.
TABLE 4 (CONTINUED)
X Y V σV (B − V ) σB−V (U − B) σU−B (V − R) σV −R (V − I) σV −I
733.2 573.2 19.483 0.054 99.999 99.999 99.999 99.999 0.944 0.068 1.815 0.058
188.1 797.7 19.49 0.044 99.999 99.999 99.999 99.999 1.041 0.057 1.99 0.048
241.6 767.1 19.49 0.072 99.999 99.999 99.999 99.999 1.021 0.091 1.979 0.077
336.6 835.3 19.492 0.046 99.999 99.999 99.999 99.999 1.05 0.059 1.884 0.051
123.8 569.2 19.493 0.048 99.999 99.999 99.999 99.999 0.858 0.062 1.746 0.055
271.4 485.6 19.496 0.05 99.999 99.999 99.999 99.999 1.046 0.063 1.924 0.054
272.9 688.4 19.5 0.049 99.999 99.999 99.999 99.999 0.916 0.064 1.731 0.055
479.4 377.8 19.501 0.055 99.999 99.999 99.999 99.999 0.839 0.072 1.665 0.061
40.7 395.6 19.506 0.046 99.999 99.999 99.999 99.999 0.926 0.06 1.796 0.051
521.9 932.5 19.513 0.043 99.999 99.999 99.999 99.999 0.955 0.058 1.777 0.048
445.2 244.8 19.519 0.05 99.999 99.999 99.999 99.999 0.862 0.063 1.726 0.056
404.4 657.8 19.523 0.054 99.999 99.999 99.999 99.999 0.929 0.07 1.776 0.061
706.5 360.4 19.524 0.045 99.999 99.999 99.999 99.999 0.861 0.061 1.766 0.05
479.3 412.5 19.532 0.055 99.999 99.999 99.999 99.999 0.992 0.078 1.753 0.063
274.8 721.5 19.533 0.051 99.999 99.999 99.999 99.999 1.014 0.065 1.944 0.055
681.5 737.3 19.533 0.056 99.999 99.999 99.999 99.999 0.973 0.071 1.792 0.063
42.7 866.7 19.535 0.054 99.999 99.999 99.999 99.999 0.984 0.07 1.839 0.059
743.6 422.6 19.54 0.046 99.999 99.999 99.999 99.999 0.836 0.06 1.651 0.054
364.5 72.2 19.545 0.05 99.999 99.999 99.999 99.999 0.935 0.064 1.769 0.055
801.8 622.5 19.545 0.054 99.999 99.999 99.999 99.999 0.942 0.068 1.757 0.059
147 624.1 19.547 0.048 99.999 99.999 99.999 99.999 0.89 0.063 1.712 0.054
699.5 552.8 19.55 0.059 99.999 99.999 99.999 99.999 0.952 0.076 1.714 0.064
770.9 247.1 19.551 0.048 99.999 99.999 99.999 99.999 0.882 0.065 1.673 0.055
12.4 438.3 19.555 0.048 99.999 99.999 99.999 99.999 0.702 0.064 1.608 0.053
102.6 841.7 19.557 0.05 99.999 99.999 99.999 99.999 1.002 0.065 1.8 0.056
255.3 777.6 19.559 0.047 99.999 99.999 99.999 99.999 0.993 0.063 1.81 0.054
288.1 417.9 19.56 0.044 99.999 99.999 99.999 99.999 0.905 0.059 1.741 0.052
781.3 771.4 19.561 0.052 99.999 99.999 99.999 99.999 0.893 0.068 1.77 0.057
512.4 673.6 19.564 0.058 99.999 99.999 99.999 99.999 0.783 0.073 1.765 0.062
536 237.2 19.568 0.062 99.999 99.999 99.999 99.999 0.936 0.077 99.999 99.999
608.4 883.8 19.568 0.065 99.999 99.999 99.999 99.999 0.865 0.082 1.697 0.071
236.3 764 19.572 0.054 99.999 99.999 99.999 99.999 0.913 0.069 1.728 0.06
963.2 975.4 19.582 0.054 99.999 99.999 99.999 99.999 1.102 0.07 1.999 0.059
353.3 781.1 19.586 0.056 99.999 99.999 99.999 99.999 0.975 0.073 1.731 0.064
415.2 384.8 19.59 0.049 99.999 99.999 99.999 99.999 0.91 0.065 1.821 0.055
421.8 576.3 19.593 0.054 99.999 99.999 99.999 99.999 0.875 0.07 1.671 0.062
337.1 622.5 19.596 0.046 99.999 99.999 99.999 99.999 0.941 0.062 1.661 0.056
942.6 783.6 19.599 0.055 99.999 99.999 99.999 99.999 0.945 0.073 1.789 0.06
357.5 735.8 19.6 0.058 99.999 99.999 99.999 99.999 0.848 0.075 1.715 0.064
305.1 291 19.604 0.05 99.999 99.999 99.999 99.999 0.879 0.069 1.627 0.058
124.5 394.4 19.61 0.061 99.999 99.999 99.999 99.999 0.703 0.077 1.571 0.068
634.3 810.2 19.613 0.059 99.999 99.999 99.999 99.999 0.839 0.076 1.718 0.065
305.6 975.8 19.616 0.057 99.999 99.999 99.999 99.999 0.993 0.075 1.891 0.064
758 429.6 19.62 0.056 99.999 99.999 99.999 99.999 0.875 0.072 1.725 0.064
302.2 192.3 19.629 0.052 99.999 99.999 99.999 99.999 0.839 0.068 1.73 0.061
614 741.7 19.637 0.061 99.999 99.999 99.999 99.999 0.925 0.079 1.762 0.068
98.1 710.2 19.646 0.055 99.999 99.999 99.999 99.999 0.868 0.072 1.799 0.06
382.1 974.2 19.675 0.05 99.999 99.999 99.999 99.999 0.824 0.066 1.602 0.06
489.2 372.2 19.681 0.064 99.999 99.999 99.999 99.999 0.796 0.081 1.629 0.07
552 807.5 19.683 0.052 99.999 99.999 99.999 99.999 0.765 0.069 1.598 0.059
382.4 941.8 19.693 0.059 99.999 99.999 99.999 99.999 0.672 0.077 1.541 0.066
897 613.9 19.707 0.054 99.999 99.999 99.999 99.999 0.811 0.074 1.623 0.064
666.9 571.6 19.711 0.065 99.999 99.999 99.999 99.999 1.076 0.082 1.893 0.071
958.8 258.5 19.72 0.068 99.999 99.999 99.999 99.999 0.823 0.085 1.605 0.078
46.7 519.8 19.735 0.067 99.999 99.999 99.999 99.999 0.921 0.086 1.911 0.072
696.3 668.3 19.737 0.069 99.999 99.999 99.999 99.999 1.204 0.089 2.166 0.075
68.7 355.7 19.746 0.06 99.999 99.999 99.999 99.999 1.169 0.077 2.212 0.064
796.6 933.4 19.796 0.073 99.999 99.999 99.999 99.999 1.062 0.092 2.041 0.079
334.2 698.1 19.804 0.056 99.999 99.999 99.999 99.999 1.069 0.072 2.015 0.062
675.3 679.1 19.819 0.063 99.999 99.999 99.999 99.999 1.033 0.081 1.913 0.07
811.8 19.6 19.819 0.06 99.999 99.999 99.999 99.999 0.978 0.076 2.086 0.064
677.6 61.9 19.857 0.066 99.999 99.999 99.999 99.999 0.903 0.09 1.797 0.072

© C
op
yri
gh
t 2
01
0: In
stitu
to d
e A
stro
no
mía
, U
niv
ers
ida
d N
ac
ion
al A
utó
no
ma
de
Mé
xic
o
UBVRI PHOTOMETRY OF OPEN CLUSTERS 413
TABLE 5 CCD UBVRI PHOTOMETRY OF BE 10
X Y V σV (B − V ) σB−V (U − B) σU−B (V − R) σV −R (V − I) σV −I
374.5 153.4 11.244 0.004 0.433 0.004 0.246 0.002 0.22 0.005 0.5 0.004
528.6 217.9 12.352 0.002 1.483 0.004 1.346 0.009 0.851 0.003 1.631 0.003
804.6 881.2 12.746 0.003 0.738 0.014 0.231 0.004 0.44 0.014 0.873 0.005
102.5 174.5 13.562 0.002 0.771 0.012 0.174 0.008 0.499 0.006 0.971 0.003
85.1 74.1 13.573 0.003 0.794 0.009 0.213 0.008 0.493 0.01 0.994 0.005
400.8 856.8 13.729 0.002 0.823 0.004 0.227 0.007 0.548 0.003 1.047 0.002
491.8 510.5 13.945 0.003 1.083 0.006 1.061 0.013 0.631 0.005 1.185 0.004
213.6 723.9 14.418 0.003 0.861 0.006 0.496 0.012 0.568 0.004 1.152 0.003
206.6 867.4 14.437 0.003 1.655 0.009 0.976 0.029 0.93 0.004 1.859 0.004
517.1 851.9 14.542 0.003 1.759 0.009 1.117 0.039 0.991 0.004 1.963 0.004
508.4 866.6 14.555 0.003 0.95 0.006 0.52 0.014 0.584 0.004 1.217 0.003
444.3 880.9 14.646 0.004 1.57 0.009 0.914 0.029 0.973 0.004 1.898 0.003
908.6 351.2 14.664 0.005 1.603 0.009 0.96 0.032 0.953 0.005 1.87 0.004
407.5 366.4 14.681 0.005 1.387 0.008 0.694 0.02 0.834 0.005 1.638 0.004
633.4 848 14.681 0.004 0.876 0.007 0.567 0.018 0.578 0.005 1.191 0.004
741.7 698.6 14.689 0.005 1.573 0.009 1.054 0.034 0.982 0.004 1.911 0.004
31.6 851.7 14.741 0.004 0.975 0.007 0.547 0.013 0.599 0.005 1.275 0.004
589.3 431.3 14.783 0.004 1.062 0.009 0.579 0.018 0.677 0.005 1.376 0.004
863.5 657.2 14.814 0.004 0.925 0.008 0.572 0.016 0.598 0.005 1.217 0.004
519.3 148.1 14.868 0.004 1.009 0.008 0.572 0.017 0.65 0.005 1.353 0.004
567.4 597.2 14.908 0.005 0.907 0.01 0.476 0.019 0.605 0.007 1.248 0.006
450.5 539.8 14.955 0.004 1.024 0.009 0.557 0.018 0.618 0.006 1.289 0.005
706.6 23.4 14.967 0.005 0.99 0.01 0.642 0.019 0.632 0.007 1.313 0.006
639.9 578.8 15.018 0.004 1.656 0.011 1.017 0.043 0.994 0.005 1.986 0.004
622.6 800.4 15.028 0.004 0.907 0.008 0.535 0.018 0.557 0.005 1.161 0.004
586.6 361.2 15.161 0.005 1.029 0.01 0.61 0.021 0.658 0.006 1.357 0.005
595.8 449.5 15.205 0.005 0.964 0.01 0.523 0.02 0.594 0.006 1.256 0.006
209.6 597 15.27 0.004 0.846 0.009 0.512 0.021 0.534 0.005 1.113 0.005
751.6 369 15.352 0.005 1.04 0.011 0.567 0.027 0.668 0.006 1.397 0.005
616.3 399.1 15.353 0.004 1.037 0.01 0.552 0.026 0.649 0.006 1.337 0.005
177.9 451.3 15.365 0.007 0.988 0.014 99.999 99.999 0.606 0.008 1.262 0.007
567.3 534.7 15.391 0.005 0.948 0.011 0.545 0.026 0.577 0.006 1.264 0.006
116.4 346 15.472 0.007 1.739 0.015 1.021 0.07 1.084 0.005 2.128 0.004
541.2 770.4 15.507 0.005 0.894 0.01 0.568 0.025 0.581 0.006 1.198 0.005
841 133 15.568 0.006 1.184 0.012 0.646 0.034 0.715 0.007 1.381 0.006
483.6 451.3 15.593 0.005 1.022 0.012 0.542 0.027 0.62 0.007 1.29 0.006
603.6 643.9 15.598 0.005 1.042 0.011 0.518 0.026 0.635 0.007 1.345 0.006
104.1 201.2 15.609 0.006 1.105 0.012 0.655 0.032 0.707 0.007 1.358 0.006
371.1 561.6 15.696 0.005 0.952 0.012 0.478 0.028 0.51 0.007 1.169 0.006
468.5 477 15.712 0.006 1.048 0.012 0.583 0.027 0.602 0.007 1.329 0.006
379.1 857.6 15.732 0.005 1.139 0.012 0.41 0.029 0.697 0.006 1.421 0.005
688.2 56.5 15.734 0.006 0.99 0.013 0.576 0.026 0.614 0.007 1.293 0.006
100.7 7.4 15.771 0.007 2.373 0.022 99.999 99.999 1.413 0.009 2.839 0.007
607.3 180.7 15.78 0.007 1.302 0.015 1.238 0.059 0.82 0.007 1.523 0.006
432.8 785.3 15.8 0.006 1.125 0.012 0.44 0.033 0.732 0.006 1.487 0.005
752.4 40.7 15.804 0.006 0.955 0.012 0.708 0.037 0.643 0.007 1.324 0.006
176.1 445.9 15.804 0.009 1.002 0.02 99.999 99.999 0.621 0.01 1.271 0.01
761.4 451.7 15.818 0.005 0.987 0.012 0.53 0.03 0.597 0.007 1.253 0.006
334.6 223.5 15.869 0.006 1.027 0.013 0.597 0.032 0.622 0.007 1.392 0.006
483.1 963.5 15.918 0.006 0.987 0.012 0.511 0.033 0.608 0.007 1.281 0.006
852.3 189.3 15.93 0.009 1.355 0.015 1.184 0.056 0.929 0.007 1.81 0.006
470.5 507.4 15.934 0.006 1.941 0.019 99.999 99.999 1.128 0.007 2.184 0.006
103.4 84.9 15.943 0.009 1.465 0.016 0.72 0.053 0.88 0.007 1.831 0.006
743.2 35.5 15.994 0.007 1.005 0.017 0.68 0.04 0.594 0.008 1.265 0.008
423.8 387.4 16.024 0.007 1.058 0.016 0.558 0.037 0.612 0.008 1.298 0.007
214.1 792.8 16.045 0.006 0.904 0.013 0.538 0.033 0.598 0.007 1.216 0.006
650.9 521.1 16.106 0.007 0.969 0.015 0.555 0.035 0.579 0.008 1.209 0.007
310.3 345.1 16.106 0.007 1.112 0.016 0.539 0.041 0.665 0.008 1.41 0.007
578.3 415.5 16.194 0.007 1.084 0.015 0.575 0.041 0.649 0.009 1.363 0.008
299.7 814.6 16.248 0.01 1.415 0.018 0.792 0.063 0.881 0.008 1.775 0.007
390 775.1 16.254 0.007 0.972 0.015 0.5 0.042 0.552 0.008 1.22 0.008
459.5 58.4 16.259 0.007 1.014 0.017 0.63 0.046 0.645 0.008 1.339 0.008
530.2 848.3 16.284 0.008 1.025 0.017 0.572 0.047 0.629 0.009 1.317 0.008
173.2 655 16.373 0.008 0.949 0.017 0.514 0.041 0.599 0.01 1.235 0.008
644.8 610.1 16.383 0.007 1.153 0.018 0.455 0.05 0.708 0.008 1.467 0.007
637.7 392.2 16.4 0.008 1.081 0.018 0.596 0.05 0.653 0.009 1.351 0.008

© C
op
yri
gh
t 2
01
0: In
stitu
to d
e A
stro
no
mía
, U
niv
ers
ida
d N
ac
ion
al A
utó
no
ma
de
Mé
xic
o
414 AKKAYA ET AL.
TABLE 5 (CONTINUED)
X Y V σV (B − V ) σB−V (U − B) σU−B (V − R) σV −R (V − I) σV −I
884.7 48.6 16.466 0.008 1.086 0.02 0.582 0.055 0.682 0.01 1.432 0.009
208.4 805.8 16.475 0.008 1.024 0.018 0.511 0.047 0.643 0.009 1.329 0.008
503 790.6 16.51 0.008 1.006 0.019 0.488 0.046 0.611 0.009 1.271 0.008
341.8 333.4 16.511 0.008 1.129 0.02 0.472 0.055 0.625 0.009 1.327 0.008
848.8 423.3 16.524 0.008 1.026 0.017 0.602 0.052 0.665 0.009 1.333 0.008
56.6 322.6 16.606 0.01 1.935 0.029 99.999 99.999 1.089 0.01 2.228 0.008
511.8 242.7 16.662 0.011 1.341 0.025 0.556 0.072 0.801 0.01 1.702 0.009
461.4 238.9 16.689 0.009 1.125 0.022 0.507 0.053 0.705 0.01 1.466 0.009
890.3 254.8 16.715 0.009 1.14 0.023 0.518 0.063 0.672 0.011 1.401 0.009
127.6 688.2 16.715 0.009 1.047 0.022 0.381 0.087 0.643 0.011 1.34 0.009
830.3 571.3 16.725 0.01 1.637 0.028 99.999 99.999 1.015 0.011 2.004 0.009
706.8 653.2 16.785 0.01 1.056 0.023 0.478 0.059 0.659 0.012 1.354 0.01
857.7 686.4 16.872 0.011 1.904 0.035 99.999 99.999 1.129 0.011 2.153 0.009
313 474.9 16.925 0.012 1.122 0.025 0.556 0.076 0.74 0.013 1.505 0.011
407.9 892.1 16.949 0.012 1.302 0.028 0.395 0.079 0.792 0.012 1.595 0.01
213.7 569.5 16.953 0.013 1.287 0.028 99.999 99.999 0.719 0.016 1.445 0.014
898.4 763.7 17.005 0.011 1.021 0.025 0.351 0.064 0.677 0.013 1.353 0.011
889.5 213.6 17.022 0.011 1.114 0.029 0.542 0.081 0.686 0.012 1.397 0.011
365.8 56.9 17.048 0.016 1.443 0.031 0.552 0.113 0.878 0.014 1.739 0.012
715.2 204.4 17.055 0.013 1.254 0.028 0.469 0.093 0.821 0.012 1.633 0.011
357.7 727 17.073 0.011 1.263 0.028 99.999 99.999 0.83 0.012 1.682 0.011
784.3 880.8 17.087 0.012 1.403 0.035 99.999 99.999 0.875 0.014 1.728 0.012
181.3 413 17.117 0.012 1.17 0.029 0.525 0.095 0.737 0.013 1.513 0.011
522.8 437.4 17.118 0.012 1.295 0.03 0.428 0.099 0.75 0.013 1.565 0.011
455.4 6.7 17.126 0.012 1.307 0.028 0.36 0.099 0.759 0.013 1.594 0.011
536.7 965.8 17.159 0.012 1.075 0.028 0.559 0.088 0.685 0.014 1.419 0.012
572.6 539.7 17.166 0.013 1.082 0.029 99.999 99.999 0.733 0.015 1.476 0.013
574.3 574 17.175 0.011 1.081 0.026 0.412 0.076 0.688 0.013 1.421 0.011
855.7 929.1 17.194 0.013 1.31 0.031 99.999 99.999 0.855 0.015 1.567 0.013
96.4 221.9 17.246 0.012 1.057 0.029 0.576 0.089 0.629 0.014 1.387 0.012
440.9 474.2 17.249 0.013 1.181 0.032 99.999 99.999 0.733 0.016 1.521 0.014
292.2 905.7 17.372 0.014 0.91 0.03 0.391 0.082 0.518 0.018 1.134 0.015
149.1 325.6 17.39 0.016 1.512 0.042 99.999 99.999 0.98 0.016 1.856 0.014
371.1 428.8 17.396 0.017 1.202 0.035 0.396 0.105 0.785 0.017 1.635 0.014
349.9 730.6 17.412 0.017 1.324 0.044 99.999 99.999 0.801 0.027 99.999 99.999
607 409.2 17.414 0.014 1.71 0.048 99.999 99.999 1.005 0.015 2.008 0.012
423.8 676.4 17.521 0.014 1.159 0.037 99.999 99.999 0.74 0.015 1.539 0.014
441.5 467.7 17.548 0.018 1.225 0.042 0.274 0.119 0.766 0.02 1.565 0.017
36.8 252.1 17.565 0.016 1.302 0.042 99.999 99.999 0.791 0.018 1.631 0.015
715.7 474.9 17.578 0.015 1.21 0.04 99.999 99.999 0.723 0.017 1.521 0.015
144.7 66.3 17.578 0.016 1.36 0.042 99.999 99.999 0.811 0.017 1.647 0.016
802.6 738.1 17.587 0.014 1.354 0.042 99.999 99.999 0.812 0.015 1.655 0.014
774.7 680.8 17.64 0.016 1.149 0.038 0.329 0.115 0.762 0.017 1.505 0.015
191.5 383.9 17.646 0.017 1.286 0.042 99.999 99.999 0.797 0.018 1.64 0.016
514.3 656.5 17.666 0.015 1.21 0.039 99.999 99.999 0.705 0.018 1.437 0.015
99 636.6 17.676 0.016 1.118 0.039 99.999 99.999 0.783 0.018 1.49 0.015
893.2 772 17.676 0.017 1.512 0.047 99.999 99.999 0.942 0.018 1.802 0.015
12.1 285.9 17.685 0.017 2.008 0.066 99.999 99.999 1.197 0.018 2.364 0.015
39.7 492.9 17.708 0.018 1.833 0.061 99.999 99.999 1.07 0.018 2.129 0.015
474.5 639 17.72 0.018 1.213 0.045 99.999 99.999 0.778 0.02 1.545 0.017
409 384.8 17.738 0.018 1.276 0.047 99.999 99.999 0.802 0.02 1.637 0.018
243.4 985.8 17.772 0.02 1.189 0.05 99.999 99.999 0.769 0.022 1.614 0.019
887.8 66 17.774 0.018 1.255 0.047 99.999 99.999 0.771 0.021 1.636 0.017
327.7 808.9 17.787 0.017 1.19 0.047 99.999 99.999 0.798 0.02 1.576 0.017
513.6 755.5 17.796 0.018 1.189 0.047 99.999 99.999 0.753 0.021 1.546 0.017
260.1 268.5 17.802 0.015 1.352 0.05 99.999 99.999 0.797 0.018 1.668 0.015
523.4 410 17.822 0.02 1.218 0.049 99.999 99.999 0.765 0.022 1.563 0.019
114.3 942.4 17.856 0.019 1.384 0.051 99.999 99.999 0.872 0.02 1.692 0.018
866.3 423.4 17.867 0.019 1.156 0.052 99.999 99.999 0.716 0.021 1.514 0.019
290.3 127.4 17.882 0.018 1.424 0.055 99.999 99.999 0.944 0.019 1.89 0.016
14.3 632 17.885 0.018 1.144 0.045 99.999 99.999 0.675 0.021 1.487 0.018
564.4 466.8 17.917 0.02 1.354 0.054 99.999 99.999 0.742 0.023 1.599 0.019
730.8 894.1 17.936 0.022 1.58 0.064 99.999 99.999 1.026 0.022 1.892 0.019
261.7 687.5 17.968 0.019 1.199 0.047 99.999 99.999 0.668 0.022 1.44 0.018
706.4 601.3 17.993 0.02 1.141 0.054 99.999 99.999 0.783 0.022 1.586 0.019
802 334 18.008 0.021 1.223 0.053 99.999 99.999 0.781 0.023 1.527 0.021

© C
op
yri
gh
t 2
01
0: In
stitu
to d
e A
stro
no
mía
, U
niv
ers
ida
d N
ac
ion
al A
utó
no
ma
de
Mé
xic
o
UBVRI PHOTOMETRY OF OPEN CLUSTERS 415
TABLE 5 (CONTINUED)
X Y V σV (B − V ) σB−V (U − B) σU−B (V − R) σV −R (V − I) σV −I
535.4 613.7 18.015 0.019 1.177 0.052 99.999 99.999 0.788 0.022 1.584 0.019
1.8 843.6 18.024 0.026 99.999 99.999 99.999 99.999 0.806 0.028 1.643 0.025
131.7 267.7 18.042 0.021 1.376 0.058 99.999 99.999 0.868 0.023 1.751 0.02
299.4 501.5 18.047 0.019 1.43 0.063 99.999 99.999 0.826 0.021 1.707 0.018
849.6 729.5 18.062 0.024 1.465 0.073 99.999 99.999 0.929 0.025 1.84 0.021
689.8 859.2 18.094 0.023 1.259 0.069 99.999 99.999 0.719 0.026 1.5 0.022
534.8 528.8 18.117 0.02 1.365 0.068 99.999 99.999 0.8 0.023 1.617 0.019
292.6 554.1 18.124 0.024 1.263 0.063 99.999 99.999 0.682 0.026 1.553 0.023
282.5 893.1 18.183 0.023 1.156 0.061 99.999 99.999 0.77 0.026 1.535 0.022
714.4 700.2 18.208 0.023 1.247 0.066 99.999 99.999 0.868 0.026 1.672 0.022
858.6 508 18.238 0.025 1.095 0.063 99.999 99.999 0.785 0.027 1.553 0.024
839.7 656.6 18.259 0.025 1.207 0.065 99.999 99.999 0.754 0.028 1.515 0.024
648.3 735.1 18.272 0.024 1.333 0.087 99.999 99.999 0.811 0.026 1.597 0.023
171.7 905.5 18.286 0.023 1.402 0.07 99.999 99.999 0.868 0.025 1.748 0.022
841 620.1 18.289 0.025 99.999 99.999 99.999 99.999 0.782 0.028 1.521 0.024
166.7 606.4 18.324 0.023 1.254 0.077 99.999 99.999 0.723 0.027 1.533 0.023
451.1 430 18.348 0.026 1.444 0.08 99.999 99.999 0.854 0.027 1.735 0.025
405.4 637.9 18.352 0.028 1.482 0.08 99.999 99.999 0.829 0.031 1.693 0.026
545 575.8 18.401 0.03 1.26 0.08 99.999 99.999 0.82 0.032 1.674 0.028
263.3 242.9 18.407 0.027 1.567 0.091 99.999 99.999 1.028 0.028 1.917 0.024
628 293.8 18.446 0.028 1.358 0.088 99.999 99.999 0.842 0.03 1.735 0.026
836.7 425.5 18.459 0.029 1.248 0.081 99.999 99.999 0.762 0.031 1.58 0.028
212.6 459.4 18.459 0.029 1.188 0.076 99.999 99.999 0.814 0.031 1.606 0.028
183.9 340.2 18.474 0.029 1.357 0.085 99.999 99.999 0.844 0.031 1.728 0.028
412 648 18.491 0.028 1.274 0.077 99.999 99.999 0.961 0.03 1.855 0.025
394.7 881.8 18.494 0.028 1.647 0.103 99.999 99.999 0.942 0.029 1.849 0.026
474 96.9 18.5 0.029 1.768 0.109 99.999 99.999 0.954 0.03 1.854 0.026
418.6 440.8 18.501 0.031 1.587 0.092 99.999 99.999 0.877 0.033 1.756 0.028
867.5 598 18.507 0.031 99.999 99.999 99.999 99.999 1.092 0.03 2.078 0.027
533.3 252 18.551 0.033 99.999 99.999 99.999 99.999 0.875 0.035 1.784 0.031
833.6 631.9 18.578 0.031 1.44 0.097 99.999 99.999 0.827 0.035 1.644 0.029
785 971.5 18.581 0.032 99.999 99.999 99.999 99.999 0.907 0.033 1.75 0.03
147.5 315.8 18.593 0.032 1.31 0.09 99.999 99.999 0.876 0.034 1.779 0.03
923.2 618.1 18.603 0.03 1.326 0.091 99.999 99.999 0.934 0.031 1.832 0.028
751.8 244 18.632 0.033 1.431 0.098 99.999 99.999 1.016 0.034 1.964 0.029
318.5 481.2 18.654 0.039 1.68 0.14 99.999 99.999 0.96 0.04 1.868 0.035
396.5 260.3 18.673 0.033 1.371 0.101 99.999 99.999 0.732 0.036 1.642 0.032
468.1 232.5 18.694 0.031 99.999 99.999 99.999 99.999 0.83 0.034 1.744 0.03
896.9 706.3 18.702 0.034 99.999 99.999 99.999 99.999 0.731 0.037 1.609 0.033
396.9 404.3 18.707 0.033 99.999 99.999 99.999 99.999 0.918 0.035 1.794 0.031
348.2 679.7 18.707 0.032 1.097 0.089 99.999 99.999 0.824 0.035 1.644 0.031
113.9 727 18.714 0.035 1.267 0.105 99.999 99.999 0.865 0.037 1.666 0.032
123.9 544.8 18.716 0.036 1.283 0.1 99.999 99.999 0.822 0.04 1.598 0.034
188.5 861 18.72 0.03 1.243 0.101 99.999 99.999 0.822 0.034 1.635 0.03
459.8 343.8 18.732 0.036 1.533 0.136 99.999 99.999 0.796 0.04 1.679 0.034
916.2 835.9 18.735 0.036 1.225 0.1 99.999 99.999 0.833 0.039 1.65 0.034
497 118.9 18.745 0.03 99.999 99.999 99.999 99.999 0.813 0.033 1.769 0.029
368.5 578.8 18.757 0.036 1.458 0.126 99.999 99.999 0.905 0.037 1.844 0.033
776.1 687.7 18.758 0.033 1.258 0.101 99.999 99.999 0.745 0.038 1.586 0.032
170.7 934.1 18.838 0.036 99.999 99.999 99.999 99.999 1.064 0.036 2.07 0.032
148.2 394.9 18.877 0.036 99.999 99.999 99.999 99.999 0.93 0.039 1.791 0.033
189.2 460.1 18.887 0.047 99.999 99.999 99.999 99.999 1.111 0.045 2.138 0.04
378.7 407.8 18.897 0.037 99.999 99.999 99.999 99.999 0.891 0.039 1.749 0.034
263.5 664.5 18.899 0.039 99.999 99.999 99.999 99.999 0.788 0.042 1.58 0.037
104.9 695 18.934 0.042 1.154 0.116 99.999 99.999 0.819 0.045 1.632 0.039
24.9 681.5 18.938 0.038 1.184 0.113 99.999 99.999 0.763 0.042 1.529 0.037
422.7 449.4 18.968 0.037 99.999 99.999 99.999 99.999 0.884 0.039 1.783 0.035
306.5 767.3 18.971 0.042 99.999 99.999 99.999 99.999 0.797 0.045 1.645 0.04
277.9 498.6 18.973 0.043 99.999 99.999 99.999 99.999 0.826 0.047 1.69 0.04
186 556.3 18.978 0.045 1.271 0.133 99.999 99.999 0.804 0.049 1.638 0.043
533.3 407.9 18.983 0.044 99.999 99.999 99.999 99.999 0.866 0.045 1.76 0.04
253.5 678.5 19.008 0.04 1.121 0.103 99.999 99.999 0.69 0.045 1.423 0.041
715.4 275.5 19.048 0.04 99.999 99.999 99.999 99.999 0.815 0.042 1.766 0.038
712.4 485.8 19.074 0.046 99.999 99.999 99.999 99.999 0.977 0.048 1.808 0.041
448.1 839.3 19.079 0.043 99.999 99.999 99.999 99.999 0.803 0.046 1.624 0.041
609.2 585.4 19.098 0.052 99.999 99.999 99.999 99.999 1.169 0.049 2.38 0.043

© C
op
yri
gh
t 2
01
0: In
stitu
to d
e A
stro
no
mía
, U
niv
ers
ida
d N
ac
ion
al A
utó
no
ma
de
Mé
xic
o
416 AKKAYA ET AL.
TABLE 5 (CONTINUED)
X Y V σV (B − V ) σB−V (U − B) σU−B (V − R) σV −R (V − I) σV −I
167 666.8 19.103 0.045 99.999 99.999 99.999 99.999 0.722 0.049 1.51 0.043
660.7 542.1 19.15 0.054 99.999 99.999 99.999 99.999 0.909 0.055 1.812 0.049
840.5 711 19.152 0.043 99.999 99.999 99.999 99.999 0.855 0.046 1.658 0.041
747.2 514.5 19.16 0.045 99.999 99.999 99.999 99.999 0.911 0.047 1.802 0.042
791.4 338.5 19.163 0.047 1.091 0.134 99.999 99.999 1.029 0.048 1.882 0.043
884.2 936 19.165 0.051 99.999 99.999 99.999 99.999 0.982 0.051 1.883 0.046
799.2 629.2 19.181 0.052 0.898 0.122 99.999 99.999 0.858 0.054 1.651 0.049
315.9 924 19.202 0.05 99.999 99.999 99.999 99.999 0.923 0.052 1.83 0.046
325.3 790.9 19.204 0.052 99.999 99.999 99.999 99.999 0.875 0.055 1.748 0.048
425 25.3 19.212 0.044 99.999 99.999 99.999 99.999 0.935 0.046 1.814 0.041
151.9 459 19.217 0.047 99.999 99.999 99.999 99.999 0.799 0.05 1.651 0.046
568.2 3.8 19.221 0.054 99.999 99.999 99.999 99.999 0.835 0.056 1.794 0.05
75.1 753.4 19.235 0.048 99.999 99.999 99.999 99.999 0.765 0.051 1.586 0.047
660.3 809 19.244 0.052 99.999 99.999 99.999 99.999 0.846 0.054 1.677 0.049
277.2 874.9 19.248 0.057 99.999 99.999 99.999 99.999 0.866 0.058 1.697 0.053
636.9 698.1 19.254 0.045 99.999 99.999 99.999 99.999 0.738 0.05 1.543 0.043
854.3 293.3 19.257 0.055 99.999 99.999 99.999 99.999 0.83 0.057 1.646 0.052
170.4 418.7 19.273 0.055 99.999 99.999 99.999 99.999 0.856 0.058 1.768 0.051
740 805.2 19.313 0.051 99.999 99.999 99.999 99.999 0.914 0.053 1.897 0.046
305.6 336.1 19.324 0.057 99.999 99.999 99.999 99.999 0.888 0.062 1.794 0.053
861.4 623.4 19.326 0.058 99.999 99.999 99.999 99.999 0.985 0.059 2.026 0.051
780.4 105.5 19.33 0.055 99.999 99.999 99.999 99.999 0.838 0.058 1.746 0.051
891.1 150.2 19.334 0.055 1.12 0.15 99.999 99.999 0.772 0.062 1.6 0.053
384.8 755.5 19.344 0.055 99.999 99.999 99.999 99.999 0.848 0.058 1.678 0.051
637.2 613.8 19.358 0.055 99.999 99.999 99.999 99.999 0.871 0.058 1.628 0.052
680.1 860.1 19.359 0.059 99.999 99.999 99.999 99.999 0.798 0.061 1.688 0.056
50 455.1 19.363 0.055 99.999 99.999 99.999 99.999 0.807 0.058 1.878 0.051
215.8 223.9 19.368 0.058 99.999 99.999 99.999 99.999 0.845 0.06 1.786 0.053
10.3 605.8 19.382 0.057 99.999 99.999 99.999 99.999 0.799 0.061 1.702 0.055
537.4 942.8 19.389 0.064 99.999 99.999 99.999 99.999 0.841 0.066 1.734 0.059
255.4 599.4 19.402 0.059 99.999 99.999 99.999 99.999 0.946 0.059 1.764 0.054
49 671.7 19.409 0.064 99.999 99.999 99.999 99.999 1.089 0.062 2.069 0.055
847.1 541.9 19.419 0.062 99.999 99.999 99.999 99.999 0.748 0.066 1.66 0.059
550.9 454.9 19.421 0.057 99.999 99.999 99.999 99.999 0.939 0.058 1.903 0.051
576.3 687.7 19.428 0.055 99.999 99.999 99.999 99.999 0.747 0.063 1.659 0.054
680 429 19.428 0.067 99.999 99.999 99.999 99.999 0.844 0.068 1.673 0.063
751.4 450.8 19.432 0.055 99.999 99.999 99.999 99.999 0.942 0.057 1.76 0.052
429.8 251.6 19.437 0.061 99.999 99.999 99.999 99.999 0.739 0.066 1.616 0.058
394.7 367 19.449 0.07 99.999 99.999 99.999 99.999 0.955 0.071 1.734 0.064
249.1 983.9 19.45 0.074 99.999 99.999 99.999 99.999 1.107 0.071 2.083 0.063
295.1 657 19.451 0.058 99.999 99.999 99.999 99.999 1.154 0.057 2.063 0.05
340.6 456.9 19.502 0.06 99.999 99.999 99.999 99.999 0.86 0.064 1.765 0.055
863.5 383.3 19.553 0.066 99.999 99.999 99.999 99.999 0.812 0.071 1.646 0.062
376.6 539.7 19.579 0.066 99.999 99.999 99.999 99.999 0.706 0.074 1.493 0.065
732.4 168.4 19.58 0.067 99.999 99.999 99.999 99.999 0.877 0.068 1.819 0.062
673.3 587.1 19.593 0.073 99.999 99.999 99.999 99.999 1.04 0.072 1.947 0.064
136.6 393.6 19.593 0.067 99.999 99.999 99.999 99.999 0.855 0.069 1.816 0.061
892.5 688.9 19.595 0.067 99.999 99.999 99.999 99.999 0.782 0.072 1.72 0.064
284.6 219.6 19.607 0.067 99.999 99.999 99.999 99.999 0.787 0.074 1.794 0.063
466.8 246.1 19.614 0.067 99.999 99.999 99.999 99.999 0.828 0.071 1.802 0.063
669.1 739.3 19.63 0.066 99.999 99.999 99.999 99.999 0.834 0.072 1.711 0.062
187.3 543.2 19.651 0.074 99.999 99.999 99.999 99.999 0.59 0.081 1.558 0.074
595.7 889.6 19.668 0.077 99.999 99.999 99.999 99.999 0.868 0.079 1.744 0.073
630.9 198.8 19.671 0.075 99.999 99.999 99.999 99.999 0.842 0.08 1.804 0.069
340.1 373 19.671 0.067 99.999 99.999 99.999 99.999 0.813 0.074 1.711 0.063
915.1 27.4 19.683 0.075 99.999 99.999 99.999 99.999 1.065 0.074 2.101 0.066
607.4 290.5 19.686 0.073 99.999 99.999 99.999 99.999 0.876 0.074 1.854 0.067
512.5 302.7 19.723 0.087 99.999 99.999 99.999 99.999 1.044 0.083 2.022 0.076
500.5 973.7 19.725 0.077 99.999 99.999 99.999 99.999 0.659 0.085 1.552 0.076
645.4 154.5 19.733 0.08 99.999 99.999 99.999 99.999 0.884 0.08 1.757 0.073
280.7 123.8 19.778 0.08 99.999 99.999 99.999 99.999 0.997 0.08 1.972 0.071
636.5 933 19.805 0.095 99.999 99.999 99.999 99.999 0.729 0.098 1.584 0.088
64.8 500.9 19.82 0.096 99.999 99.999 99.999 99.999 1.05 0.092 2.009 0.082
111.6 32.8 19.867 0.104 99.999 99.999 99.999 99.999 1.086 0.102 2.178 0.088
819.8 718.2 19.902 0.083 99.999 99.999 99.999 99.999 0.717 0.092 1.592 0.08
65.4 714.9 19.921 0.083 99.999 99.999 99.999 99.999 0.707 0.094 1.598 0.082

© C
op
yri
gh
t 2
01
0: In
stitu
to d
e A
stro
no
mía
, U
niv
ers
ida
d N
ac
ion
al A
utó
no
ma
de
Mé
xic
o
UBVRI PHOTOMETRY OF OPEN CLUSTERS 417
used to help us in the visualization and analysis ofthe photometric data (e.g., Schuster et al. 2007).These programs facilitate the elimination of field andapparent non-member stars of a given cluster fromthe diagnostic diagrams used to enhance the apper-ception of cluster features. Once a satisfactory firstestimate of the parameters was obtained, a full-framesolution was also consulted and refined.
safe is capable of displaying simultaneously indifferent color-color (CC) and color-magnitude (CM)diagrams the cluster’s data and has an interactiveway to identify a (group of) star(s) in one partic-ular diagram and to see where it falls in the otherdiagrams. This program is capable of displaying upto 16 different diagrams for a given cluster and isvery useful for the determination of a cluster’s phys-ical parameters. Figure 1a-c presents the DSS red-filter images of Be 89 (Panel a), Ru 135 (Panel b)and Be 10 (Panel c), with the regions analyzed inthis work enclosed by ellipses. The central (X,Y )pixel coordinates of the nearly circular regions inFigure 1a-c, which are considered for the photomet-ric analyses are the following: (584, 488) pixels forBe 89, (542, 504) for Ru 135, and (517, 493) forBe 10. The diameters in arcminutes (∆X, ∆Y ) ofnearly circular regions in Figure 1a-c are the follow-ing: (2.27, 2.65) for Be 89, (2.62, 2.67) for Ru 135,and (3.12, 2.34) for Be 10.
3. ANALYSES OF THE OPEN CLUSTERSBE 89, RU 135, AND BE 10
The (U − B,B − V ), two-color or CC, diagram,and five CM diagrams have been used together withthe zero-age-main-sequence (ZAMS) intrinsic-colorcalibrations of Schmidt-Kaler (1982, hereafter SK82)and with the Padova isochrones (Girardi et al. 2000,hereafter GBBC; Bertelli et al. 2008; Marigo et al.2008, hereafter MGBG) to obtain reddenings, metal-licities, distance moduli, and ages for these clusters.
Our analysis technique for our program clustersplaces particular emphasis upon the fit of the ZAMSintrinsic colors and Padova isochrones to the obser-vational data of the clusters, and this depends in turnupon important characteristics of the CM and CCdiagrams for open clusters (e.g., Paunzen & Netopil2006, their § 3), which are summarized as follows:
1. A procedure for eliminating non-members.
2. A determination of the interstellar reddening asaccurately as possible.
3. Visibility of the turn-off.
Fig. 1. DSS red-filter images of the Galactic open clustersBe 89 (Panel a), Ru 135 (Panel b), and Be 10 (Panel c).The regions analyzed with the elipse inspection tool,to derive first estimates for the fundamental parameters,are enclosed by ellipses. Orientation as usual: north isup, and east to the left.

© C
op
yri
gh
t 2
01
0: In
stitu
to d
e A
stro
no
mía
, U
niv
ers
ida
d N
ac
ion
al A
utó
no
ma
de
Mé
xic
o
418 AKKAYA ET AL.
4. Compensation for binary stars which tend towiden the main-sequence distribution.
5. Consideration of the red-clump stars (if present)to improve the isochrone fit.
6. An appropriate choice of the isochrone whichcorresponds to the correct heavy-element abun-dance (Z).
Regarding the locus of the main sequence in aCM diagram, and independent of any cosmic disper-sion, the main-sequence strips or bands in the CMdiagrams are affected by the contamination of binaryand multiple stars; particularly, the mid-points areshifted to brighter magnitudes and the colors to red-der values due to this contamination, and also some-times due to variable intercluster extinction. For thisreason, the SK82 ZAMS and the MGBG isochroneshave been fitted to the blue- and faint-most concen-trations within the observed broad main-sequencebands whenever possible, assuming that these con-centrations reflect the single-star distribution (e.g.,Carney 2001), and that most stars observed red- andbright-ward of these are in fact binary, or multiple,systems.
In the absence of proper-motion/radial-velocitymeasurements to insure cluster membership, and tominimize the effects of field-star contamination, wehave concentrated more on the central regions of theclusters rather than using the full-frame CCD im-ages; this has been accomplished by using the elipse
or safe programs, described above. These have beenused to select an elliptical, or polygonal area (withas many as 10 sides), centered on the open cluster asseen in a V or R image, excluding stars outside thisarea from further analyses. (See Figure 1). Theseinteractive analyses greatly increase the contrast ofcluster members with respect to the field stars, andthus the scatter in the CM and CC diagrams is sig-nificantly reduced.
Also, the observational errors, e.g., σ(U−B), ofthese three clusters have been considered as a crite-rion in selecting the more reliable data for furtheranalyses. The values of σ(U−B) are almost alwayslarger than the ones of σ(B−V ) due to the smallersensitivity of the CCD in the ultraviolet, and theerrors σ(R−I), σ(V −I), and σ(V −R) are among thesmallest. The observational errors, such as σ(U−B),σ(B−V ), and σ(B−R), have been selected to be lessthan ≈ 0.m10 (and sometimes
∼< 0.m05) in some of the
diagnostic diagrams presented in the analyses to fol-low, such as the (U − B, B − V ), (V, B − V ), and(V, B − R) diagrams.
Interstellar reddenings of the program clustershave been estimated from shifts of the intrinsic-colorsequences of SK82 in the (U − B, B − V ) dia-gram, until the best fit to the data of the clusterswas achieved: along the U − B axis by 0.72 E(B −V ) + 0.05 E(B − V )2 and along the (B − V ) axisby E(B − V ). For this, F-type stars have been fit-ted above the main sequence of SK82 [i.e., blue-wardin (U −B)], and simultaneously the red-clump starsabove the red-giant colors of SK82 with consistent ul-traviolet excesses according to the normalizations ofSandage (1969). The two-color sequence of SK82 hasbeen constructed from the intrinsic colors of SK82for zero-age dwarfs [(B −V )0 ∼
< 0.m75] and for giants[(B − V )0 ∼
> 0.m75].Once the two-color sequence of SK82 has been
fixed as indicated above, to determine the photo-metric metal abundance, [Fe/H], one first locates theF-type stars in the (U−B, B−V ) diagram and com-pares their location with that of their counterpartsof known metallicity (e.g., the SK82’s ZAMS calibra-tion). Deviations between the two are due mainly totheir differences in metal content, an ultraviolet ex-cess, δ(U − B), being caused by differences in lineblanketing. The metal-deficient F-type cluster stars,if present, lie blue-ward of the “hump region” of theZAMS sequence, where an eyeball-fitted osculatingcurve similar to “the hump” has been fitted to thedata points of the F-stars (i.e., the thick line abovethe hump of the F-star region in Figures 2, 5, and8) and, simultaneously, to the red-clump stars (ifpresent), since they also will lie blue-ward of the red-giant colors of SK82 with a corresponding ultravio-let excess. This ultraviolet excess is correlated withthe photometric metallicity of the cluster. Then, ametallicity value, [Fe/H], for a cluster can be derivedfrom the empirical calibration, [Fe/H]-δ(U − B)0.6,of Karatas & Schuster (2006), allowing the determi-nation of [Fe/H] independently of the isochrones tobe fitted to the data, thus reducing from three to twothe free parameters to be derived from the CM dia-grams. Heavy-element abundances (Z) of the threeclusters have been obtained from the photometricmetal abundances [Fe/H] with the expression
Z = Z⊙ · 10[Fe/H], Z⊙ = +0.019 . (6)
Finally, the appropriate isochrones of MGBG werecomputed online in terms of the resulting heavy-element abundance for further analyses of the clus-ters (distances and ages).
To estimate the the age of a cluster (A) andthe true distance modulus (DM = V0 − MV ) ina CM diagram, for example the (V, B − V ) dia-

© C
op
yri
gh
t 2
01
0: In
stitu
to d
e A
stro
no
mía
, U
niv
ers
ida
d N
ac
ion
al A
utó
no
ma
de
Mé
xic
o
UBVRI PHOTOMETRY OF OPEN CLUSTERS 419
TABLE 6
ADOPTED INTERSTELLAREXTINCTION LAW
E(V −I)E(B−V )
E(R−I)E(B−V )
E(V −R)E(B−V )
E(B−R)E(B−V )
1.25 0.69 0.56 1.56
gram, the absolute magnitudes, MV , of the MGBGisochrones have been shifted by DM +3.1 E(B−V )along the magnitude axis and their correspondingcolors, (B−V )0, reddened by adding the color excessE(B − V ) until some DM value provides a good fitof the appropriate isochrone to the faint/blue con-centration of the observed lower main sequence ofthe cluster and, if present, of the red-clump stars.One has to take into account when determining theDM that metal-poor stars are sub-luminous as com-pared with their solar-like counterparts by determin-ing a reliable value for Z from the CC diagram. Toinfer the age of the cluster, the (logarithm of the)age of the isochrones, log A, has been varied untila good match with the observed sequences, i.e., theupper main-sequence (MS), the turn-off (TO) stars,and, if present, the red-clump (RC) stars, has beenachieved. A fine tuning of the DM has been made ifnecessary. The uncertainties of E(B − V ), Z, DM ,and log A are discussed in § 3.4.
Following a similar procedure to that outlinedabove, the distance moduli and cluster ages havealso been derived from analyses of four other CMdiagrams for each of the clusters. The correspond-ing color excesses applied in the diagrams were it-erated starting with the previously derived color ex-cess estimates, E(B−V ), and the results were inter-compared by means of the standard interstellar ex-tinction law adopted (see Table 6; also cf. Dean,Warren, & Cousins 1978; Mathis 1990; Straizys1995) until satisfactory solutions were obtained forall the CM diagrams. The derived extinction lawsdo not differ significantly from that of Table 6.
3.1. Be 89
The (U − B, B − V ) diagram of Be 89 isshown in Figure 2. An interstellar reddening of(B − V ) = 0.m60 ± 0.m09 has been derived by shift-ing the intrinsic two-color stellar sequence of SK82along the reddening vector as described in the pre-vious section. (Another possibility, to fit the starsby E(B − V ) ≃ 0.m73 to the blue (B-star) branch ofthe ZAMS curve, would leave many stars far froma good fit). Six stars apparently in the cluster arenoticed with (B − V ) ≈ 1.m6 and (U − B) ≈ 1.m4
Fig. 2. The (U − B, B − V ) diagram of Be 89. The“S” curves (upper parts, ZAMS, and lower parts, redgiants) have been taken from the two-color relations ofSK82 and are displayed for the interstellar reddening val-ues E(B − V ) = 0.m00 and 0.m60 (the bluer and redderversions, respectively). A reddening vector is also shownas an arrow, and big open circles mark the six RC can-didates, and open squares, the blue-straggler ones. Aheavy solid curve represents our best fit to the data;this has been adjusted to the main-sequence F-type starsabove (i.e., blue-ward of) the ZAMS colors of SK82 and,simultaneously, to the RC stars above the red-giant col-ors of SK82. This fit has been used to estimate theheavy-element abundance of the cluster, which is shownin Table 7.
(big open circles in Figure 2) lying near, but above(i.e., blue-ward of) the giant sequence of SK82, theexpected location of the RC stars; their subsequentlocations in the CM diagrams confirm this classifi-cation (see Figures 3 and 4). A seventh candidatefalls further from the expected RC locus in four ofthe five CM diagrams.
The F-type and RC stars of Be 89 (cf. Figure 2,(B − V ) ≈ 1.m0 and ≈ 1.m6, respectively) lie abovethe (reddened) ZAMS two-color calibration of SK82by δ(U −B) ≃ 0.m1. Our best eyeball fit to the datais shown as the heavy solid curve in Figure 2. In thedereddened two-color diagram, the heavy line givesa value of (U −B)0 = −0.m10± 0.m02 at (B − V )0 =0.m44, and at this same color index, the highest pointof the SK82 hump has (U − B)0 = −0.m02. The re-sulting ultraviolet excess, δ(U−B) = +0.m08±0.m02,has been converted to δ(0.6) = +0.m10 ± 0.m02 at

© C
op
yri
gh
t 2
01
0: In
stitu
to d
e A
stro
no
mía
, U
niv
ers
ida
d N
ac
ion
al A
utó
no
ma
de
Mé
xic
o
420 AKKAYA ET AL.
Fig. 3. CM diagrams, (V, B − V ) and (V, R − I), forBe 89. Solid lines show the interpolated Z = +0.008isochrones of MGBG (cf. Table 7 for the inferred metal-licity). Big open circles denote the RC candidates, andopen squares, the blue-straggler ones. See the text andTable 8 for the inferred values of the distance modulusand age.
(B−V ) = +0.m60 with the normalization ratios givenby Sandage (1969, his Table 1A). These values havebeen listed in Table 7, together with the correspond-ing photometric metallicity [Fe/H]= −0.35±0.02 dexderived with help of the calibration [Fe/H]-δ(0.6) of
Fig. 4. CM diagrams, (V, V − I), (V, V − R), and(V, B−R), (top, center and bottom panels, respectively)for Be 89. The isochrone curves and the symbols have thesame meaning as in Figure 3. See the text and Table 7for the inferred values of reddening and metallicity, andTable 8 for the distance modulus and age.

© C
op
yri
gh
t 2
01
0: In
stitu
to d
e A
stro
no
mía
, U
niv
ers
ida
d N
ac
ion
al A
utó
no
ma
de
Mé
xic
o
UBVRI PHOTOMETRY OF OPEN CLUSTERS 421
Fig. 5. The CC diagram of Ru135. The SK82 curvesand the symbols have the same meaning as in Figure 2.See the text and Table 7 for the inferred values of thereddening and metallicity.
Karatas & Schuster (2006). Note that the δ(0.6)in the notation of the latter authors corresponds todelta(0.6) in the notation of Sandage (1969). Apply-ing the above relation between [Fe/H] and Z, where[Fe/H] has been estimated as −0.35±0.02 dex, givesZ = +0.008 ± 0.0003. The online isochrones ofMGBG have been iterated using this metal abun-dance when further analyzing Be 89.
In Figures 3 and 4, the isochrones of MGBGfor Z = +0.008 have been over-plotted in five CMdiagrams: (V, B − V ), (V, R − I), (V, V − I),(V, V − R), and (V, B − R) after reddening theisochrones along the color axis with a color excesscorresponding to E(B − V ) = 0.m60, converted withhelp of Table 6, and adding a visual extinction ofAV = 3.1 · E(B − V ) = 1.m86 to the absolutemagnitudes of the isochrones. The isochrones havethen been shifted vertically to obtain the best fitto the observed lower-MS and and RC sequences.This vertical shift is the (true) distance modulus,DM = (V0 − MV). The best fit for Be 89 isDM = 11.m90 ± 0.m06 (d = 2.4 ± 0.06 kpc, cf. Ta-ble 8).
To derive an age estimate for Be 89, theisochrones of MGBG for Z = +0.008 have beenshifted in the CM planes as above, i.e., MV +3.1E(B−V )+DM and C0(λ1−λ2)+E[C(λ1−λ2)],respectively, where the latter color excesses have
been computed from E(B−V ) with help of Table 6,and then the isochrone ages have been varied until asatisfactory fit to the data has been obtained throughthe observed upper-MS, TO, and RC sequences ofthe cluster (cf. Figures 3–4). The resulting in-ferred mean age of Be 89 is log(A) = 9.58± 0.06 dex(A = 3.8 ± 0.6 Gyr).
For all of these CM diagrams of Be 89, twoisochrones have been plotted to provide a meansfor appreciating the uncertainties of the derived dis-tances and ages. In Table 8 the range in ages pro-vided by these isochrone pairs, the final values forthe distances and ages from each CM diagram, andthe mean values for each cluster are given. Errorestimates of (V0 − MV) and log(A) are discussed in§ 3.4 below, and the mean results given in Table 8have been calculated with equations (8) and (9) in-serting the corresponding parameters summarized inthe table.
3.2. Ru 135
The same procedures outlined in § 3, and § 3.1for Be 89, have also been used for the clusters Ru 135and Be 10. A reddening of E(B−V ) = 0.m63±0.m12has been derived for Ru 135 (cf. Figure 5). How-ever, a clump of A-type stars at (B − V ) ≃ 0.m8and (U − B) ≃ 0.m4 seems to be present, with ahorizontal-like distribution which does not fit sat-isfactorily the reddened two-color ZAMS curve ofSK82. These stars (Sp ≈ A-types) are probably lessreddened than Ru 135 by ≃ 0.m3 in E(B−V ), nearer,and most probably not cluster members (cf. the opensquares in the CC and CM diagrams of Figures 5, 6,and 7), or they could be blue stragglers belongingto the cluster. For this latter case, they would bepeculiar because of an ultraviolet-flux excess presentin their spectral energy distributions (SEDs), andonly a spectroscopic study with good signal-to-noiseratios would reveal more about their true nature.
Ru 135 contains a considerable number of F- andlater-type stars, and appears to have its blue-mostturn-off limit at (B−V ) ≈ +1.m0 and (U−B) ≈ 0.m4,corresponding to a dereddened (B − V ) ≈ +0.m43(i.e., Sp ≈ F5V). The best fit to the observed F-hump sequence in the (U − B, B − V ) diagram isthe solid curve shifted blue-ward with respect to thetwo-color SK82 curve (cf. Figure 5). From the ul-traviolet excess of these cluster F stars and follow-ing the procedure outlined at the beginning of § 3,[Fe/H]= −0.71±0.02 dex (Z = +0.004±0.0002) hasbeen derived. The isochrones of MGBG with thismetallicity have been computed on line and used inthe following analyses.

© C
op
yri
gh
t 2
01
0: In
stitu
to d
e A
stro
no
mía
, U
niv
ers
ida
d N
ac
ion
al A
utó
no
ma
de
Mé
xic
o
422 AKKAYA ET AL.
TABLE 7
NORMALIZED (U-B) EXCESSES AND DERIVED METALLICITIES
Cluster (U − B)SK82 (U − B)0,fit δ(U − B) δ(0.6) [Fe/H] Z
[mag] [mag] [mag] [mag] [dex]
Be 89 −0.02 −0.10 0.08 0.10 −0.35 0.008
Ru 135 −0.02 −0.16 0.14 0.14 −0.71 0.004
Be 10 −0.02 −0.09 0.07 0.11 −0.49 0.006
error ≤ ±0.01 ±0.02 ±0.02 ±0.02 ±0.02 ≤ ±0.001
TABLE 8
DISTANCE AND AGE ESTIMATES OF THE CLUSTERS
Color (V0 − MV ) d log(A) log(A) A
[mag] [kpc] range [Gyr]
Be 89: E(B − V ) = 0.60 ± 0.09 & Z = +0.008 ± 0.001
(B − V ) 11.90 ± 0.10 2.4 ± 0.1 9.45–9.55 9.55 ± 0.15 3.6 ± 1.4
(R − I) 11.90 ± 0.20 2.4 ± 0.2 9.50–9.60 9.60 ± 0.20 4.0 ± 2.3
(V − I) 11.90 ± 0.15 2.4 ± 0.2 9.50–9.60 9.60 ± 0.20 4.0 ± 2.3
(V − R) 11.90 ± 0.10 2.4 ± 0.1 9.50–9.60 9.60 ± 0.15 4.0 ± 1.6
(B − R) 11.90 ± 0.20 2.4 ± 0.2 9.45–9.55 9.55 ± 0.10 3.6 ± 0.9
Mean 11.90 ± 0.06 2.4 ± 0.06 9.58 ± 0.06 3.8 ± 0.6
Ru 135: E(B − V ) = 0.63 ± 0.12 & Z = +0.004 ± 0.001
(B − V ) 9.50 ± 0.15 0.75 ± 0.05 9.60–9.70 9.60 ± 0.15 4.0 ± 1.6
(R − I) 9.70 ± 0.15 0.87 ± 0.06 9.55–9.65 9.55 ± 0.15 3.6 ± 1.5
(V − I) 9.60 ± 0.20 0.83 ± 0.08 9.55–9.65 9.55 ± 0.15 3.6 ± 1.5
(V − R) 9.60 ± 0.15 0.83 ± 0.06 9.55–9.65 9.60 ± 0.15 4.0 ± 1.5
(B − R) 9.50 ± 0.20 0.75 ± 0.07 9.60–9.70 9.60 ± 0.15 4.0 ± 1.6
Mean 9.58 ± 0.07 0.81 ± 0.03 9.58 ± 0.06 3.8 ± 0.7
Be 10: E(B − V ) = 0.75 ± 0.09 & Z = +0.006 ± 0.001
(B − V ) 11.20 ± 0.11 1.7 ± 0.1 9.05–9.15 9.05 ± 0.10 1.1 ± 0.3
(R − I) 11.10 ± 0.20 1.7 ± 0.2 9.10–9.20 9.10 ± 0.10 1.3 ± 0.3
(V − I) 11.15 ± 0.15 1.7 ± 0.1 9.05–9.15 9.05 ± 0.15 1.1 ± 0.3
(V − R) 11.15 ± 0.20 1.7 ± 0.2 9.05–9.15 9.05 ± 0.10 1.1 ± 0.3
(B − R) 11.20 ± 0.10 1.7 ± 0.1 9.05–9.15 9.05 ± 0.05 1.1 ± 0.1
Mean 11.16 ± 0.06 1.70 ± 0.05 9.06 ± 0.05 1.08 ± 0.08
The five CM diagrams, (V, B − V ) through(V, B−R), of Ru 135 are displayed in Figures 6 and7 together with the reddened isochrones that best fitthe data for the derived color excess and metallicity,E(B − V ) = 0.m63 and Z = +0.004. The distancemoduli, (V0 − MV ), and ages, A, found from thesefive CM diagrams and their respective isochrone fit-tings are given in Table 8.
In these CM diagrams a significant number ofstars are seen extending to brighter magnitudes andred-ward from the fainter and redder observationallimits of the main sequences, i.e., the stars extending
red-ward and upward from (V, B−V ) ≈ (18.m5, 1.m5)or (V, R − I) ≈ (18.m5, 0.m9) (cf. Figure 6). Theseare probably field red-giant stars contributed by theGalactic bulge, as suggested by the Galactic longi-tude and latitude of Ru 135, ℓ ≃ 16.4◦ and b ≃ +6.2◦
(see Binney & Merrifield 1998; Stanek et al. 1996,Figures 3.5 and 2, respectively). The fact thatRu 135 lies near the direction of the Galactic cen-tral region also explains the significant number ofbrighter and bluer foreground stars seen in its CCand CM diagrams.

© C
op
yri
gh
t 2
01
0: In
stitu
to d
e A
stro
no
mía
, U
niv
ers
ida
d N
ac
ion
al A
utó
no
ma
de
Mé
xic
o
UBVRI PHOTOMETRY OF OPEN CLUSTERS 423
Fig. 6. The (V, B − V ) and (V, R − I) diagrams forRu 135. Solid lines show the isochrones of MGBG inter-polated to Z = +0.004. See the text, and Tables 7 and8, for the inferred values of reddening, metallicity, dis-tance modulus, and age. Stars shown with open-squaresymbols are most likely field, or blue-straggler, stars.
3.3. Be 10
In Figure 8 the loci of stars observed in the di-rection of Be 10 are shown in the (U − B, B − V )diagram, together with the standard interstellar red-dening vector and the two-color curve of SK82,shifted along this vector to procure the best fit tothe data. From the fits along the (B − V ) and(U −B) axes, E(B−V ) = 0.m75±0.m09 and ([Fe/H],
Fig. 7. The (V, V − I), (V, V − R) and (V, B − R)diagrams for Ru 135. The symbols are the same as inFigure 6. See the text, and Tables 7 and 8, for the in-ferred values of reddening, metallicity, distance modulus,and age.

© C
op
yri
gh
t 2
01
0: In
stitu
to d
e A
stro
no
mía
, U
niv
ers
ida
d N
ac
ion
al A
utó
no
ma
de
Mé
xic
o
424 AKKAYA ET AL.
Fig. 8. The (U −B, B − V ) plot of Be 10. The symbolsand the curves are the same as in Figure 2.
Z) = (−0.49± 0.02 dex, +0.006± 0.0003) are found,following the procedures described in § 3 and § 3.1(see Table 8 for partial and mean results). Again,the appropriate isochrones of MGBG have been com-puted online with this corresponding metallicity andare used below for further analyses of Be 10.
For Be 10, DM = (V − 3.1 ·E(B − V )− MV ) =11.m16 ± 0.m06, the distance, d = 1.7 ± 0.05 kpc,the metallicity, Z = +0.006 ± 0.0003, log(A) =9.06 ± 0.05, and the age, A = 1.08 ± 0.08 Gyr havebeen measured. Our results are listed in Tables 7 and8. The resulting (best) isochrone fitting to the cor-responding Be 10 data in the (V, B−V ), (V, R−I),(V, V − I), (V, V −R) and (V, B−R) diagrams aredisplayed in Figures 9 and 10, where one can see thatthe isochrones reproduce well the observed lower andupper MS, the TO, and RC sequences of this cluster.
3.4. Estimated errors and weighted averages
In Table 7, the ultraviolet excesses and the metal-licities are given for Be 89, Ru 135, and Be 10, andin Table 8, the mean values for the distance moduli,heliocentric distances, logarithmic ages, and ages, to-gether with the corresponding estimates of precision.The errors were calculated in a straightforward man-ner (cf. Bevington & Robinson 2003, and referencestherein). In the following the details of this erroranalysis are presented.
Fig. 9. The (V, B−V ) and (V, R−I) diagrams for Be 10.Solid lines show the isochrones of MGBG interpolated toZ = +0.006. The larger open circles identify the RC can-didates. See the text, and Tables 7 and 8, for the inferredvalues for reddening, metallicity, distance modulus, andage.
3.4.1. Errors in E(B − V ) and Z
The random errors in the color excess E(B − V )and photometric metallicity [Fe/H] were estimatedas follows:
(i) By moving the two-color curve of SK82 back-ward and forward along the standard reddening

© C
op
yri
gh
t 2
01
0: In
stitu
to d
e A
stro
no
mía
, U
niv
ers
ida
d N
ac
ion
al A
utó
no
ma
de
Mé
xic
o
UBVRI PHOTOMETRY OF OPEN CLUSTERS 425
Fig. 10. The (V, V − I), (V, V − R) and (V, B − R)diagrams for Be 10. The symbols are the same as in Fig-ure 9. See the text, and Tables 7 and 8, for the inferredvalues for reddening, metallicity, distance modulus, andage.
vector in the (U − B, B − V ) diagram until agood fit with the observed GK-type, RC, andF-hump sequences was achieved. (No BA-typesequences were present for these clusters.) Theprecision of the determinations also depends onthe scatter of the data points (cf. Figure 5 ofRu 135 and Figure 8 of Be 10 for good andfair cases, respectively). The uncertainties givenin Tables 7 and 8 reflect this. Following thisprocedure, a typical error in E(B − V ) for thequality of the reduced data of our clusters is(conservatively) ≈ 0.m04. The systematic errorin E(B − V ) depends on the color calibrationused. In the case of SK82, the uncertainty canbe safely assumed to be, at the most, of the or-der of the difference between two adjacent spec-tral subclasses.
(ii) The random photometric-metallicity uncer-tainty has then been estimated from theparabolic (eyeball) fit to the data of the max-imum characterizing the ultraviolet flux excessof the stars at the dereddened color (B−V )0 ≃0.m44 (Sp ≃ F5) and then following Sandage’s(1969) normalization procedure.
The uncertainty of the metal content Z was de-termined from the relation (e.g., Bevington &Robinson 2003):
σZ = ln 10 × Z × σ[Fe/H] . (7)
σ[Fe/H] has been estimated from the uncertaintyin the ultraviolet excess δ(U − B) at the Fhump between the observed and the SK82 two-color curves and is typically ±0.m02. Assuming〈Z〉 = 0.006 (the mean of the three clusters)| σZ | ≤ 0.0003 is obtained with equation (7)above. Assuming an error of about 0.001 for Zis, in our case, a quite conservative estimate.
(iii) On the other hand, the deviation of the assumedreddening vector from the “true” one dependson the quotient E(U −B)/E(B−V ), which canstrongly deviate locally from its canonical valueof 0.72 (see Chavarrıa, de Lara, & Hasse 1987;Johnson 1977). This uncertainty may produceerrors larger than the precision quoted above.For a crude estimate, using the extremes of thecited values of E(U − B)/E(B − V ) and a typ-ical color excess of E(B − V ) = 0.m50, the un-certainty in δ(U −B) could be as large as 0.m15-0.m20. However, since our displacements of theSK82 curve in the CM-diagrams are consistentwith the canonical value for the interstellar ex-

© C
op
yri
gh
t 2
01
0: In
stitu
to d
e A
stro
no
mía
, U
niv
ers
ida
d N
ac
ion
al A
utó
no
ma
de
Mé
xic
o
426 AKKAYA ET AL.
tinction law, we assume that this error contri-bution is negligible statistically.
(iv) Another systematic uncertainty results from thetwo-color calibration of SK82: from the uncer-tainty of (U − B) or (B − V ) in the two-colorcalibration curve of SK82, which is expected tobe of the order of the difference between twotypical spectral subclasses (in our case
∼< 0.m05)
for the (U-B) index; and from the fit of thewhole curve to a cluster data set, of the or-der
∼<
(
0.m05/√
N)
, where there are N pivotalpoints considered when adjusting the SK2 two-color curve (the BA-type, the F-hump, the GK-type, and the RC sequences; i.e., N
∼> 3). Sum-
marizing, the systematic uncertainty in δ(U−B)should be less than roughly three times thatgiven by the precision of the flux measurements.
3.4.2. Errors in the distance moduli and ages
(i) The uncertainties σDMi for the moduli given inTable 8 that result from fitting the appropri-ate isochrones to the data in the CM diagramsdepend on the photometric uncertainties (fluxmeasurement and standard-transformation er-rors), the absolute magnitude and intrinsic colorcalibration errors (see for example, SK82), thecolor excess uncertainty of a given color [whichdepends on E(B−V )], and on the reddening lawadopted. We assume that the isochrones onlycontain the errors of the absolute magnitude andintrinsic-color calibrations and that the pho-tometric and transformation errors are small(≈ 0.m03) when compared to the other sourcesof error. In our case, the largest contribution tothe distance modulus uncertainty is due to theuncertainty in the absolute-magnitude scale, fol-lowed by the uncertainty in the slope of the red-dening vector, and the color-excess error, about0.m3, 0.m15 and 0.m12, respectively, which com-bine to give an expected total uncertainty aslarge as σDMi
∼= 0.m25.
The moduli resulting from the CM diagrams ofeach object and the mean moduli for the threeclusters are given in Table 8, and the mean ofthe moduli has been derived from the five mod-uli, weighted with their respective (usually un-equal) precisions, with the following expression:
DM =Σ(DM)i/σ2
DMi
Σ[
1/σ2DMi
] ; (i = 1, ..., 5), (8)
and the associated mean uncertainty is esti-mated from the individual uncertainties of the
five CM-diagrams of a given cluster by the rela-tion:
1
(σmean)2=
∑ 1
(σDM )2i(9)
The combined error is the square root of the sumof the squared uncertainties and is expected tobe about 0.m15, or even less.
(ii) The uncertainty in the log(A) has a random er-ror due to the (eyeball) fit of the isochrone withthe appropriate metallicity to a given CM di-agram of a cluster in question, and a quanti-tative estimate is obtained by jiggling bright-ward and faint-ward the isochrone curve untila good fit of the lower main sequence producesthe DM . Then the age of the isochrone is var-ied until a good fit to the upper main sequence,the TO, and the RC sequences is achieved. Thetwo isochrones shown in the CM diagrams of theprogram clusters give a quantitative estimate ofthis last error. Several different authors havecomputed isochrones as function of the metallic-ity, and the physics behind seems to be well un-derstood. One does not expect a large variationin the log(A) error due to any uncertainty in thephysics, and the uncertainties of E(B − V ) and(V0−MV ) play a secondary role because the ageerrors depend more on the form of the isochronecurve and how it embraces the data (i.e., the theupper main-sequence and TO regions and theRC sequence) and, less significantly, on the red-dening law (except perhaps the blue and near-ultraviolet filters). More problematic is the casewhen the TO region is not well defined (i.e., iso-lated from field stars) and/or the RC sequenceis not present. In our case, the errors for thedifferent colors of Table 8 reflect these uncer-tainties.
4. COMPARISON OF FUNDAMENTALPARAMETERS OF THE THREE CLUSTERS
The reddening values of our three clusters havebeen compared to ones derived from the dust mapsof Schlegel, Finkbeiner & Davis (1998; hereafter,SFD); these are based on the COBE/DIRBE andIRAS/ISSA maps, and take into account the dustabsorption all the way to infinity. E(B − V )(ℓ, b)∞values of our three clusters have been taken fromSFD maps using the web pages of NED8. TheseE(B − V )(ℓ, b)∞ values are 0.m99 for Be 89, and1.m06 for both Ru 135 and Be 10. However, Arce &
8http://nedwww.ipac.caltech.edu/forms/calculator.
html.

© C
op
yri
gh
t 2
01
0: In
stitu
to d
e A
stro
no
mía
, U
niv
ers
ida
d N
ac
ion
al A
utó
no
ma
de
Mé
xic
o
UBVRI PHOTOMETRY OF OPEN CLUSTERS 427
TABLE 9
FUNDAMENTAL PARAMETERS OF BE 89, RU 135, AND BE 10
Cluster (l◦, b◦) E(B − V ) [Fe/H] Z (V0 − MV ) d log(A) Isochrone RGC Reference
[mag] [dex] [mag] [kpc] [kpc]
Be 89 83.16, +4.82 0.60 −0.35 +0.008 11.90 2.40 9.58 m8† 8.55 this work
1.03 − solar 12.40 3.00 8.93 b4 − Tadross 2008a
1.05 − solar 11.54 2.04 9.02 g0 − Subramaniam et al. 2010
Ru 135 16.42, +6.23 0.63 −0.71 +0.004 9.58 0.81 9.58 m8 7.72 this work
1.10 − solar 11.33 1.85 8.70 b4 − Tadross 2008b
Be 10 138.62, +8.88 0.75 −0.49 +0.006 11.16 1.70 9.06 m8 9.84 this work
0.87 − +0.008 11.80 2.30 8.80 g2 − Lata et al. 2004
0.71 − solar 11.26 1.79 9.00 B4 − MN07
†Isochrone sources: B4 = Bertelli et al. (1994); b4 = Bonatto et al. (2004); g0 = GBBC; g2 = Girardi et al. (2002);m8 = MGBG.
Goodman (1999) caution that SFD reddening mapsoverestimate the reddening values when the color ex-cess E(B − V ) is more than ≈ 0.m15. For the re-vision of SFD reddening estimates, the equationsof Bonifacio, Monai & Beers (2000) and Schusteret al. (2004) have been adopted. Then the finalreddening, E(B − V )A, for a given star is reducedcompared to the total reddening E(B − V )(ℓ, b)∞by a factor {1 − exp[−d sin |b|/H]}, where b, d,and H are the Galactic latitude (Column 2 of Ta-ble 9), the distance from the observer to the ob-ject (Column 7 of Table 9), and the scale height ofthe dust layer in the Galaxy, respectively; here wehave assumed H = 125 pc (Bonifacio et al. 2000).Note that Galactic latitudes of our three clusters areless than 10◦. These reduced final reddenings areE(B − V )A = 0.m54 for Be 89, 0.m36 for Ru 135, and0.m64 for Be 10.
For Be 89, our reddening value of 0.m60 is in goodagreement with the value of 0.m54 obtained from thedust maps of SFD. For Be 10 our reddening valueof E(B − V ) = 0.m75 is within about 1σ of thevalue 0.m64 derived from the SFD dust maps, andfor Ru 135, our reddening value of 0.m63 differs byabout 2σ from the value of 0.m36 obtained from theseSFD maps. These reddening values derived by differ-ent methods are in reasonable agreement with eachother, giving confidence to our results.
As can be seen from the summarized resultsgiven in Table 9, the reddening value 0.m60 foundhere for Be 89 is smaller than the E(B − V ) =1.m03 of Tadross (2008a; hereafter T08a), and thanthe E(B − V ) = 1.m05 of Subramaniam, Car-raro, & Janes (2010, hereafter S10). Our deriveddistance modulus and distance for Be 89, [(V0 −MV ), d(kpc)] = (11.m90±0.m06, 2.4±0.06), are smallerthan the values of (12.m39, 3.00) of T08a and largerthan the (11.m54, 2.04) of S10. Our inferred age
[log(A), A(Gyr)] = (9.58, 3.8 Gyr) for this clusteris considerably older than (8.93, 0.85 Gyr) given byT08a and larger than the estimate (9.02, 1.06 Gyr)by S10. For the analysis of Be 89, T08a used JHKphotometry and the isochrones of Bonatto, Bica, &Girardi (2004) with a solar metallicity. This is, par-tially, the origin of the disagreement between the twoage estimates, since our lower metallicity for Be 89will necessarily lead to a larger age for a given TO.Also, most probably, the differences are partially dueto the different procedural approaches for estimatingthe fundamental parameters; we derive in a straight-forward manner the estimates for the interstellar ex-tinction and metallicity: by fitting SK82’s ZAMS tothe data in the (U − B,B − V ) diagram, by thenmeasuring the ultraviolet excess of the F-type starsto derive a cluster metallicity, and finally using theappropriate isochrones in CM diagrams to estimatethe true distance modulus and age of Be 89. Two pa-rameters (reddening and metallicity) are estimatedin a CC diagram separately from the other two pa-rameters (distance and age) from the CM diagrams.S10 have also assumed a solar metallicity (Z⊙) fortheir isochrones (from GBBC) and have used onlyCM diagrams to estimate the reddening, distance,and age of Be 89.
Previous results in the literature for Ru 135are found in the work by Tadross (2008b; here-after T08b), and for Be 10 in the papers by Lataet al. (2004; L04) and Maciejewski & Niedzielski(2007; MN07). Our reddening value E(B − V ) =0.m63± 0.m12 for Ru 135 is significantly smaller com-pared to the reddening value of 1.m10 given by T08b.Also, our derived distance modulus and distance,[(V0 − MV ), d(kpc)] = (9.m58, 0.81), for Ru 135 aresignificantly smaller than (11.m33, 1.85), and our in-ferred age [log(A), A] = (9.58, 3.80 Gyr) is consider-ably older than (8.70, 0.50 Gyr), values by T08b.

© C
op
yri
gh
t 2
01
0: In
stitu
to d
e A
stro
no
mía
, U
niv
ers
ida
d N
ac
ion
al A
utó
no
ma
de
Mé
xic
o
428 AKKAYA ET AL.
In defense of the present results, our value forE(B − V ) (0.m63) falls between the value derivedfrom SFD (0.m36) and the value of T08b (1.m10); ourvalue is in much better agreement with SFD. T08bused the solar-metallicity isochrones of Bonatto etal. (2004), and his results are based on the compar-ison of isochrones to observed data in the J, (J −H)and K, (J−K) planes of infrared photometry. Thesedifferences between our values and those of T08b areprobably due mainly to the largely different valuesfor the interstellar reddening, but also to the differ-ence in the assumed metallicities, to the use of dif-ferent stellar models and isochrone sets, which makeuse of differing input physics and colour-temperaturetransformations, and to distinct photometric datasets.
For the Be 10 open cluster, our reddening valueE(B − V ) = 0.m75 is in reasonable agreement withthe value of E(B − V ) = 0.m87 given by L04, andin good agreement with E(B − V ) = 0.m71 byMN07. For the metallicity of the Be 10 cluster,L04 adopt the Z = +0.008 isochrones of Girardi etal. (2002), and MN07 adopt the solar isochronesof Bertelli et al. (1994). From our two-color di-agram, Z = +0.006 has been derived (see § 3.3),which is in agreement, within the error bars, withthe value of L04. Our distance modulus and dis-tance for Be 10, [(V0 − MV ), d(kpc)]= (11.m16, 1.70)differ from the values (11.m8, 2.3) of L04, but verylittle from the values of MN07, (11.m26, 1.79). Ourinferred age [log(A), A] = (9.06, 1.08 Gyr) for thiscluster disagrees by almost a factor of two (0.5 Gyr)with L04, but is in good agreement with MN07,(9.00, 1.00 Gyr). Again, our interstellar reddeningfor Be 10, E(B − V ) = 0.m75 falls between the valuederived from SFD (0.m64) and the value 0.m87 by L04.
The age values in Table 9 have been comparedto ages estimated with the (age, ∆V ) calibrationgiven by Carraro & Chiosi (1994; their equation 3).Note that this last calibration does not consider themetal abundance of the cluster. Here, ∆V meansthe magnitude difference between the RC and TO,which is well known as an age indicator. Both openclusters Be 89 and Be 10 have RC candidates (seethe CM plots for these two clusters, Figures 3–4,and Figures 9–10, respectively). TO values occurat V ≈ 16.m5 for Be 89 and V ≈ 14.m8 for Be 10,whereas the RCs occur at V ≈ 15.m3 and V ≈ 14.m7,respectively. From this age-∆V calibration of Car-raro & Chiosi (1994), ages have been estimated aslog(A) = 9.1 (1.3 Gyr) for Be 89 and log(A) = 8.6(0.4 Gyr) for the Be 10.
The average age values given by us, log(A) = 9.58(3.8 Gyr) for Be 89 and log(A) = 9.06 (1.08 Gyr)for Be 10 are somewhat older than the ones esti-mated from this relation of Carraro & Chiosi (1994).However, these age differences are at least partiallyexplained by the sub-solar metallicities of these twoclusters ([Fe/H]= −0.35 dex for Be 89 and −0.49dex for Be 10; see § 3.1, § 3.3, and Table 9). Lowermetallicities require larger ages for the same TO.
In Table 9 our results are summarized for Be 89,Ru 135, and Be 10: Columns 1 and 2 contain thecluster name and Galactic coordinates, respectively.The resulting reddening, E(B − V ), is given in Col-umn 3. The metallicity and heavy-element abun-dances, [Fe/H] and (Z), are given in Columns 4and 5, respectively. True distance modulus values,(V0 −MV ), and their corresponding heliocentric dis-tances to the observer are given in Columns 6 and7, respectively. Column 8 gives the average age (i.e.,log(A); where A is in years), as derived from the fiveCM diagrams. Different isochrones used by us andby other authors are referenced in Column 9. Aver-age Galactocentric distances are listed in Column 10.The corresponding references from the literature arelisted in Column 11.
5. CONCLUSIONS
CCD UBVRI photometry of three poorly stud-ied Galactic open clusters, Be 89, Ru 135, and Be 10,has been analyzed, based on new SPM observations.The fundamental parameters of reddening, metallic-ity, age, and distance of these open clusters havebeen inferred and presented in Tables 7–9.
The interstellar reddenings and metallicities ofthese three clusters have been determined from two-color, (U − B, B − V ), diagrams prior to the use ofthe CM diagrams. Heavy element abundances, Z, ofthe three clusters have been found from the ultravi-olet excess, δ(U − B), of the F-stars by comparisonwith the two-color curve of SK82 (ZSK82 = Z⊙), byusing the normalizations of Sandage (1969), and byapplying the calibration, [Fe/H]-δ(0.6), of Karatas &Schuster (2006), with the advantage of reducing bytwo the number of free parameters of the isochroneswhen fitting to the data in the CM diagrams. Whennecessary, we have iterated slightly afterwards fora better, more consistent, solution for the four clus-ter parameters (reddening, metallicity, distance, andage). Deeper U frames would improve our deter-minations employing this method, which allows usto estimate the reddening and metallicity indepen-dently using a CC diagram, in contrast to the exclu-sive fitting of isochrones to CM diagrams and the use

© C
op
yri
gh
t 2
01
0: In
stitu
to d
e A
stro
no
mía
, U
niv
ers
ida
d N
ac
ion
al A
utó
no
ma
de
Mé
xic
o
UBVRI PHOTOMETRY OF OPEN CLUSTERS 429
of the solar metallicity, which are the more commontechniques used in the literature.
The present adjustments of the SK82, CC rela-tions to the MS and RC stars, and of the MGBGisochrones to MS, TO, and RC stars in the CM di-agrams show good consistency and appropriate fitsfor all three open clusters, in the one CC diagramand all five CM diagrams. Good consistency is seenin the Figures 2–4 for Be 89, Figures 5–7 for Ru 135,and Figures 8–10 for Be 10.
The CC and CM diagrams of Be 89 and Ru 135suggest that they are metal-poor and old for theirlocation in the Galaxy, compared to other open clus-ters.
For Be 89, stars with V < 16.m2 and (B − V ) ≤0.m9 are most likely foreground or blue-stragglerstars. The blue-straggler and RC candidates in thefield of Be 89 need spectroscopic and/or astrometricobservations to test their cluster membership and toelucidate their nature.
Similar candidates for blue-straggler or brightforeground stars are seen in the CC and CM dia-grams of Ru 135 and Be 10, Figures 5–7 and 8–10,respectively. In the case of Ru 135 and for stars withV fainter than about 14.m2, the onset of the clustersequence in the CM diagrams is clearly seen. Objectsbrighter than this limit and with (B −V ) ≤ 0.m9 areprobably blue stragglers or bright foreground stars.
Despite its similar age to Be 89, no RC stars arenoticeable in the CM diagrams of Ru 135. On theother hand, the CC and CM diagrams of Be 10 showclear evidence for an RC grouping, although it issomewhat younger than the other two clusters. Thelack of any RC stars in the CM diagrams of Ru 135,contrasting with Be 89 and Be 10, may result eitherfrom relative differences in mass segregation and ouremphasis on the inner regions of these clusters, orfrom the poorness of these cluster fields and small-number statistics. Ru 135, being closer to the Galac-tic center, may be more perturbed and less dynami-cally relaxed than the other two clusters. Also, Be 89and Be 10 each show only eight, or fewer, RC candi-date stars, and it is not clear that all of these are infact cluster members.
For the typical accuracy of photometric observa-tions (and we are no exception), the final error esti-mates are fixed by the accuracy of the cluster param-eters as given by the systematic uncertainties in theabsolute-magnitude, intrinsic-color, and reddening-vector calibrations, for example, the adequacies, ornot, of the SK82 colors, the MGBG isochrones, andthe standard interstellar-reddening curve.
Finally, further radial velocity and proper mo-tion information for these clusters will allow us toclean with more assurance most non-members fromthe CC and CM diagrams in order to obtain betterdeterminations of their physical parameters and tobetter understand the nature of the blue-stragglerand red-clump candidates in these three open clus-ters. Deeper photometric observations, especially inthe U and B bands, will provide clearer, cleaner, andmore precise solutions from the CC diagram.
This work was supported by the Conacyt projects33940, 45014, 49434 and PAPIIT-Universidad Na-cional Autonoma de Mexico IN111500 (Mexico). IAacknowledges a grant from the Mexican Government(Secretarıa de Relaciones Exteriores). YK acknowl-edges financial support of the Scientific and Techni-cal Research Council of Turkey (TUBITAK, BIDEB-2219). This research made use of the WEBDA opencluster database of J.-C. Mermilliod. We also thankan anonymous referee for valuable suggestions andcomments that helped improve this work substan-tially.
REFERENCES
Arce, H. G., & Goodman, A. A. 1999, ApJ, 512, L135Bertelli, G., Bressan, A., Chiosi, C., Fagotto, F., & Nasi,
E. 1994, A&AS, 106, 275Bertelli, G., Girardi, L., Marigo, P., & Nasi, E. 2008,
A&A, 484, 815Bevington, P. R., & Robinson, D. K. 2003, Data Reduc-
tion and Error Analysis for the Physical Sciences (3thed.; Boston: McGraw-Hill)
Binney, J., & Merrifield, M. 1998, Galactic Astronomy(Princeton: Princeton Univ. Press)
Bonatto, Ch., Bica, E., & Girardi, L. 2004, A&A, 415,571
Bonifacio, P., Monai, S., & Beers, T. C. 2000, AJ, 120,2065
Cameron, L. M. 1985, A&A, 147, 47Carney, B. 2001, in Star Clusters, ed. L. Labhardt &
B. Binggeli (Berlin: Springer-Verlag), 1Carraro, G., & Chiosi, C. 1994, A&A, 287, 761Chavarrıa-K, C., de Lara, E., & Hasse, G. 1987, A&A,
171, 216Dean, J. F., Warren, P. R., & Cousins, A. W. J. 1978,
MNRAS, 183, 569Dias, W. S., Alessi, B. S., Moitinho, A., & Lepine,
J. R. D. 2002, A&A, 389, 871Friel, E. D. 1995, ARA&A, 33, 381Girardi, L., Bressan, A., Bertelli, G., & Chiosi, C. 2000,
A&AS, 141, 371 (GBBC)Girardi, L., et al. 2002, A&A, 391, 195Howell, S. B. 1989, PASP, 101, 616
. 1990, in ASP Conf. Ser. 8, CCDs in Astron-omy, ed. G. H. Jacoby (San Francisco: ASP), 312

© C
op
yri
gh
t 2
01
0: In
stitu
to d
e A
stro
no
mía
, U
niv
ers
ida
d N
ac
ion
al A
utó
no
ma
de
Mé
xic
o
430 AKKAYA ET AL.
Janes, K. A., & Adler, D. 1982, ApJS, 49, 425Johnson, H. L. 1977, RevMexAA, 2, 175Jordi, C., Galadı-Enrıquez, D., Trullols, E., & Lahulla,
F. 1995, A&AS, 114, 489Karatas, Y., & Schuster, W. J. 2006, MNRAS, 371, 1793Landolt, A. U. 1983, AJ, 88, 439
. 1992, AJ, 104, 340Lata, S., Mohan, V., Pandey, A. K., & Sagar, R. 2004,
Bull. Astron. Soc. India, 32, 59 (L04)Lynga, G. 1987, Computer Based Catalogue of Open
Cluster Data (5th ed.; Strasbourg: CDS)Maciejewski, G., & Niedzielski, A. 2007, A&A, 467, 1065
(MN07)Marigo, P., Girardi, L., Bressan, A., Groenewegen,
M. A. T., Silva, L., & Granato, G. L. 2008, A&A,482, 883 (MGBG)
Mathis, J. 1990, ARA&A, 28, 37McFarland, J. 2010, PhD Thesis, Universidad Autonoma
de Baja California, MexicoPaunzen, E., & Netopil, M. 2006, MNRAS, 371, 1641Piskunov, A. E., Kharchenko, N. V., Schilbach, E., Roser,
S., Scholz, R. D., & Zinnecker, H. 2008, A&A, 487,557
Rossello, G., Figueras, F., Jordi, C., Nunez, J., Paredes,J. M., Sala, F., & Torra, J. 1988, A&AS, 75, 21
Sandage, A. 1969, ApJ, 158, 1115Schlegel, D. J., Finkbeiner, D. P., & Davis, M. 1998, ApJ,
500, 525 (SFD)
Inci Akkaya: Department of Astronomy and Space Sciences, Faculty of Arts and Sciences, Erciyes University,Talas Yolu, 38039, Kayseri, Turkey ([email protected]).
William J. Schuster, Raul Michel, Carlos Chavarrıa-K, and Roberto Vazquez: Observatorio Astronomico Na-cional, Instituto de Astronomıa, Universidad Nacional Autonoma de Mexico, Apdo. Postal 877, 22800Ensenada, B. C., Mexico (schuster, rmm, chavarri, [email protected]).
Andre Moitinho: SIM/IDL, Facultade de Ciencias da Universidade de Lisboa, Ed. C8, Campo Grande, 1749-016,Lisboa, Portugal ([email protected]).
Yuksel Karatas: Istanbul University, Science Faculty, Department of Astronomy and Space Sciences, 34119,Universite-Istanbul, Turkey ([email protected]).
Schmidt-Kaler, Th. 1982, in Landolt Bornstein New Se-ries, Group VI, Vol. 2b, Stars and Stars Clusters, ed.K. Schaifers & H. H. Voigt (Berlin: SpringerVerlag),14 (SK82)
Schuster, W. J., Beers, T. C., Michel, R., Nissen, P. E.,& Garcıa, G. 2004, A&A, 422, 527
Schuster, W. J., & Parrao, L. 2001, RevMexAA, 37, 187Schuster, W. J., et al. 2007, in IAU Symp. 235, Galaxy
Evolution Across the Hubble Time, ed. F. Combes &J. Palous (Cambridge, Cambridge Univ. Press), 331
Stanek, K. Z., Mateo, M., Udalski, A., Szymanski, M.,Kaluzny, J., Kubiak, M., & Krzeminski, W. 1996,in IAU Symp. 169, Unsolved Problems of the MilkyWay, ed. L. Blitz & P. Teuben (Dordrecht: Kluwer),103
Stetson, P. B. 1987, PASP, 99, 191. 1990, PASP, 102, 932
Straizys, V. 1995, Multicolor Stellar Photometry, Astron-omy and Astrophysics Series, Vol. 15, ed. A. G. Pa-cholczyk (Tucson, Arizona: Pachart Pub. House)
Subramaniam, A., Carraro, G., & Janes, K. A. 2010, MN-RAS, 404, 1385 (S10)
Tadross, A. L. 2008a, MNRAS, 389, 285 (T08a). 2008b, New Astron., 13, 370 (T08b)
Tapia, M. T., Schuster, W. J., Michel, R., Chavarrıa-K,C., Dias, W. S., Vazquez, R., & Moitinho, A. 2010,MNRAS 401, 621
Related Documents