MEMBER FIRM, NATIONAL COUNCIL OF ACOUSTICAL CONSULTANTS SENIOR AND STAFF CONSULTANTS ALEXANDER G. BAGNALL ANDREW C. CARBALLEIRA EMILY L. CROSS, P. ENG WILLIAM J. ELLIOT AARON M. FARBO JOHN T. FOULKES BRION G. KONING MICHAEL D. MAYNARD, CTS CHRISTOPHER A. STORCH MARKETING MANAGER PATRICIA A. CASASANTO ASSOCIATED CONSULTANTS NICHOLAS BROWSE, SMPTE STEWART RANDALL, CTS-D MARTIN CALVERLEY, CTS SENIOR PRINCIPALS WILLIAM J. CAVANAUGH, FASA, Emeritus GREGORY C. TOCCI, PE, FASA, PRESIDENT PRINCIPALS DOUGLAS H. BELL LINCOLN B. BERRY TIMOTHY J. FOULKES, FASA, INCE, Bd. Cert. MATTHEW J. MOORE, CTS ADMINISTRATOR DONNA L. RAFUS CAVANAUGH TOCCI ASSOCIATES, INCORPORATED 327 F BOSTON POST ROAD, SUDBURY, MA 01776-3027 • TEL: (978) 443-7871 • FAX: (978) 443-7873 • E-MAIL: [email protected] November 10, 2010 Ms. Eleanor Tillinghast Green Berkshires Incorporated 292 Main Street Great Barrington, MA 01230 Subject: Ambient Environmental Sound Measurements – Ridge Hill Area, Ashfield, MA Dear Ms. Tillinghast, Cavanaugh Tocci Associates, Inc. (CTA) has been retained by Green Berkshires Inc. to measure and report existing ambient environmental sound levels and frequency characteristics in the vicinity of Ridge Hill, Ashfield, MA. Purpose The purpose of the measurements is to document the existing acoustical environment in the vicinity of Ridge Hill, in accordance with the acoustical criteria for wind turbine evaluations promulgated by the Massachusetts Department of Environmental Protection (MassDEP). Attachments Tables 1 and 2 summarize ninetieth percentile background sound levels (L 90 ) measured in the vicinity of Ridge Hill in accordance with the MassDEP sound level policy, as further discussed herein. Figure 1 is an area map, annotated to show sound measurement locations used for the Ridge Hill area ambient environmental sound survey. Appendix A contains a glossary of acoustical terminology and the MassDEP acoustical criteria. Appendix B contains A-weighted and C-weighted sound levels measured in 10-minute time intervals for a period of one week in the vicinity of Ridge Hill using unattended sound monitors. Appendix C contains octave and one-third octave band sound level data measured by CTA staff using an integrating sound level meter/spectrum analyzer. Attended sound measurements are helpful in relating audible sound with measured frequency characteristics, and are used to augment long-term sound monitoring data collected by unattended sound monitors. In addition to data presented in this letter report, all measured sound level data collected for this project have been retained in electronic file format, and are available for our further analysis if required.

Welcome message from author
This document is posted to help you gain knowledge. Please leave a comment to let me know what you think about it! Share it to your friends and learn new things together.
Transcript
MEMBER FIRM, NATIONAL COUNCIL OF ACOUSTICAL CONSULTANTS
SENIOR AND STAFF CONSULTANTS ALEXANDER G. BAGNALL
ANDREW C. CARBALLEIRA EMILY L. CROSS, P. ENG
WILLIAM J. ELLIOT AARON M. FARBO JOHN T. FOULKES BRION G. KONING
MICHAEL D. MAYNARD, CTS CHRISTOPHER A. STORCH
MARKETING MANAGER PATRICIA A. CASASANTO
ASSOCIATED CONSULTANTS NICHOLAS BROWSE, SMPTE STEWART RANDALL, CTS-D
MARTIN CALVERLEY, CTS
SENIOR PRINCIPALS WILLIAM J. CAVANAUGH, FASA, Emeritus GREGORY C. TOCCI, PE, FASA, PRESIDENT
PRINCIPALS DOUGLAS H. BELL LINCOLN B. BERRY TIMOTHY J. FOULKES, FASA, INCE, Bd. Cert. MATTHEW J. MOORE, CTS
ADMINISTRATOR DONNA L. RAFUS
CAVANAUGH TOCCI ASSOCIATES, INCORPORATED 327 F BOSTON POST ROAD, SUDBURY, MA 01776-3027 • TEL: (978) 443-7871 • FAX: (978) 443-7873 • E-MAIL: [email protected]
November 10, 2010 Ms. Eleanor Tillinghast Green Berkshires Incorporated 292 Main Street Great Barrington, MA 01230
Subject: Ambient Environmental Sound Measurements – Ridge Hill Area, Ashfield, MA Dear Ms. Tillinghast, Cavanaugh Tocci Associates, Inc. (CTA) has been retained by Green Berkshires Inc. to measure and report existing ambient environmental sound levels and frequency characteristics in the vicinity of Ridge Hill, Ashfield, MA. Purpose The purpose of the measurements is to document the existing acoustical environment in the vicinity of Ridge Hill, in accordance with the acoustical criteria for wind turbine evaluations promulgated by the Massachusetts Department of Environmental Protection (MassDEP). Attachments Tables 1 and 2 summarize ninetieth percentile background sound levels (L90) measured in the vicinity of Ridge Hill in accordance with the MassDEP sound level policy, as further discussed herein. Figure 1 is an area map, annotated to show sound measurement locations used for the Ridge Hill area ambient environmental sound survey. Appendix A contains a glossary of acoustical terminology and the MassDEP acoustical criteria. Appendix B contains A-weighted and C-weighted sound levels measured in 10-minute time intervals for a period of one week in the vicinity of Ridge Hill using unattended sound monitors. Appendix C contains octave and one-third octave band sound level data measured by CTA staff using an integrating sound level meter/spectrum analyzer. Attended sound measurements are helpful in relating audible sound with measured frequency characteristics, and are used to augment long-term sound monitoring data collected by unattended sound monitors. In addition to data presented in this letter report, all measured sound level data collected for this project have been retained in electronic file format, and are available for our further analysis if required.
Green Berkshires Incorporated Page 2 Ambient Environmental Sound Measurements – Ashfield, MA November 10, 2010
Acoustical Terminology and Criteria The MassDEP requires that environmental sound produced on a property and transmitted to the property line and/or to nearest dwelling(s) must not increase the broadband sound level by more than 10 dBA above the pre-existing ambient (dBA is the abbreviation for “decibels, A-weighted”, the most commonly used descriptor for quantifying sound level as perceived by human hearing. The ambient is defined by MassDEP in terms of the 90th percentile sound level, symbolized L90.) In addition, the MDEP prohibits a “pure-tone” condition, and defines a pure-tone to exist when the sound level in any one octave band exceeds the sound levels in both adjacent octave bands by 3 decibels (dB) or more. (See Appendix A for further explanation of terminology and criteria.) Ashfield Sound Survey Measurements The ambient sound survey in the Ridge Hill area of Ashfield, MA has included two separate, yet related types of measurements:
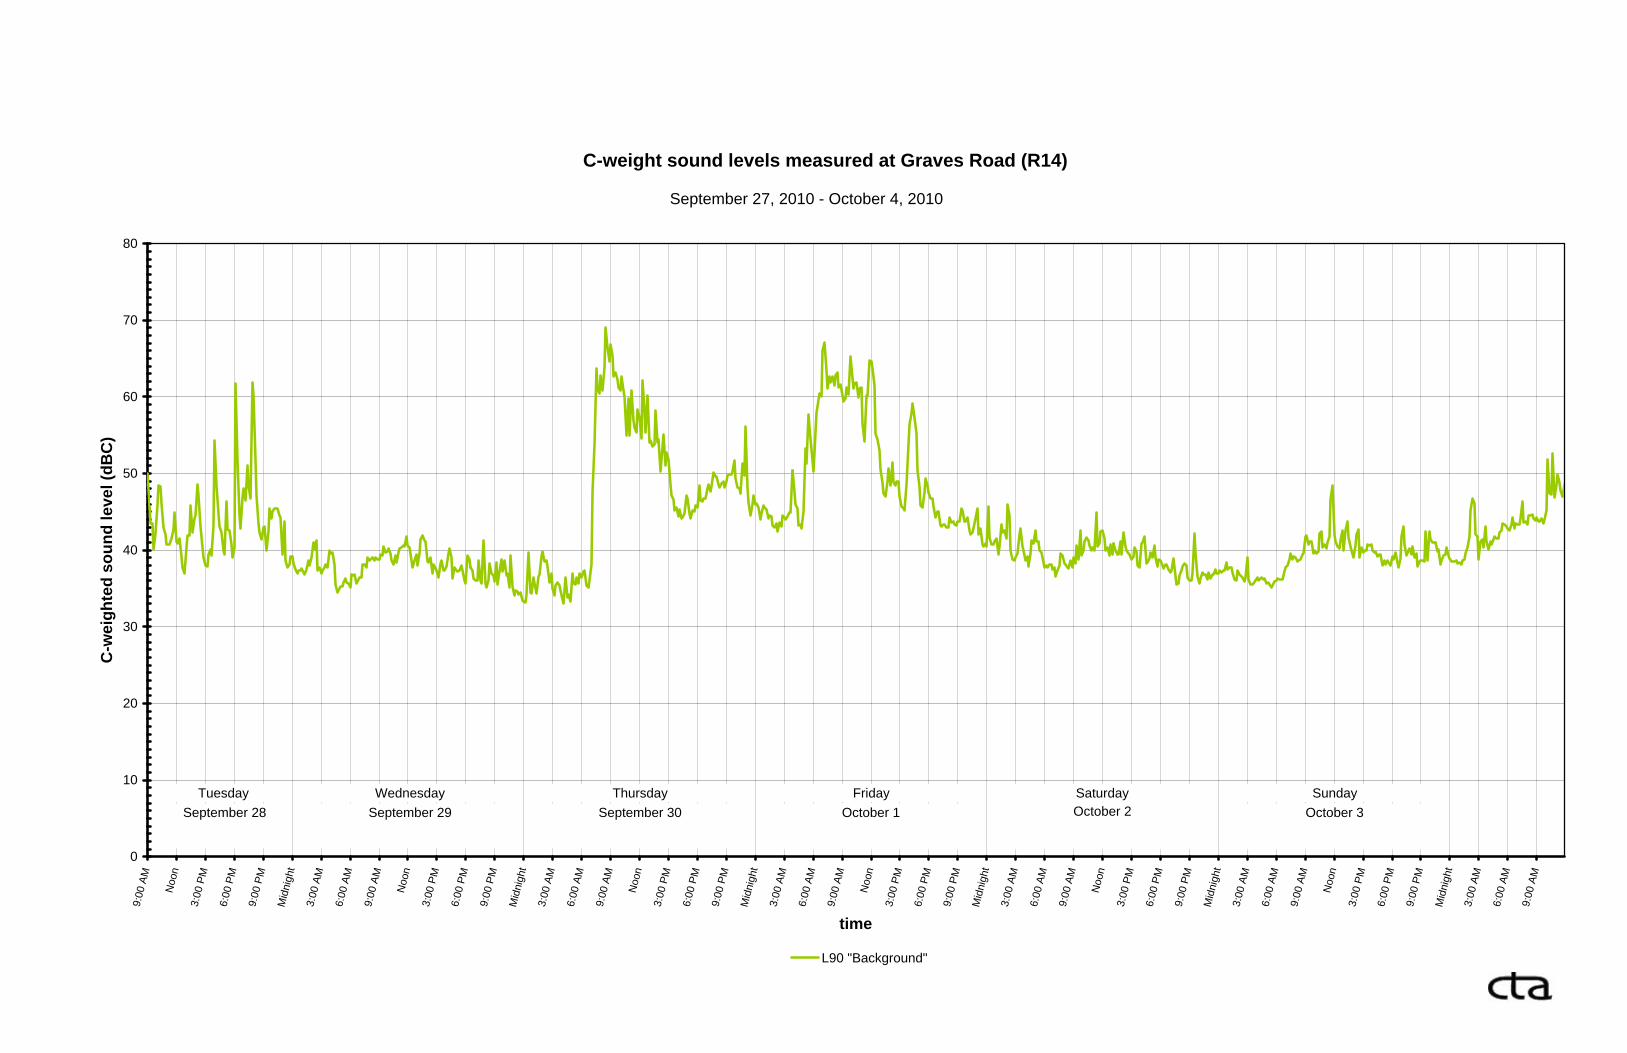
1. The first type of measurement was conducted by installing battery-powered, unattended sound monitors at five (5) residential neighborhood locations in the vicinity of and generally surrounding Ridge Hill. The sound monitors were programmed to report A-weighted (dBA) sound levels in sequential 10-minute time intervals, for a sound monitoring time period of one week. As requested by our client, at one of the sound monitoring locations (Graves Road) generally centered within the sound monitoring area) an additional sound monitor was installed to report C-weighted (dBC) sound levels, thereby providing simultaneous A-weighted and C-weighted sound level monitoring at a central location within the sound monitoring area. All the sound monitors were time-synchronized and sound-level-calibrated together at the beginning of the week-long sound monitoring time period; time-synchronization and calibration were confirmed at the end of the monitoring time period.
2. The second type of measurement was conducted using an integrating sound level meter/ frequency spectrum analyzer, with a CTA staff member present simultaneously observing and listening to the environment, and measuring sound levels and frequency characteristics during selected 10-minute time intervals over two sequential days within the week-long monitoring time period. The measurement data collected with the spectrum analyzer include A-weighted sound levels (dBA), C-weighted sound levels (dBC), and un-weighted octave and 1/3 octave band sound levels extending throughout the full range of human hearing (approximately 20 Hz to 20,000 Hz), and extending below the range of human hearing into the range of infrasound.
The measurements with the spectrum analyzer were conducted by a CTA staff person roving between long-term sound monitoring locations; conducting visual observations, listening evaluations, and measurements with the spectrum analyzer over 10-minute time intervals. The CTA staff person conducted three sets of roving measurements over a 24-hour period, i.e. during afternoon/evening, late at night/early in the morning, and again during morning daylight hours.
Following the measurements, data were downloaded from stationary monitors and the sound level analyzer for processing and presentation.
Green Berkshires Incorporated Page 3 Ambient Environmental Sound Measurements – Ashfield, MA November 10, 2010
Data Presentation Measured data most relevant to characterizing the ambient sound in the vicinity of Ridge Hill as required by the MassDEP community sound level policy are presented in Appendices B and C attached to this letter. These data include:
• A-weighted 90th percentile sound levels (L90) defined as the “ambient sound level” in the MassDEP policy and also referred to as the “background sound level” or the “residual sound level.”
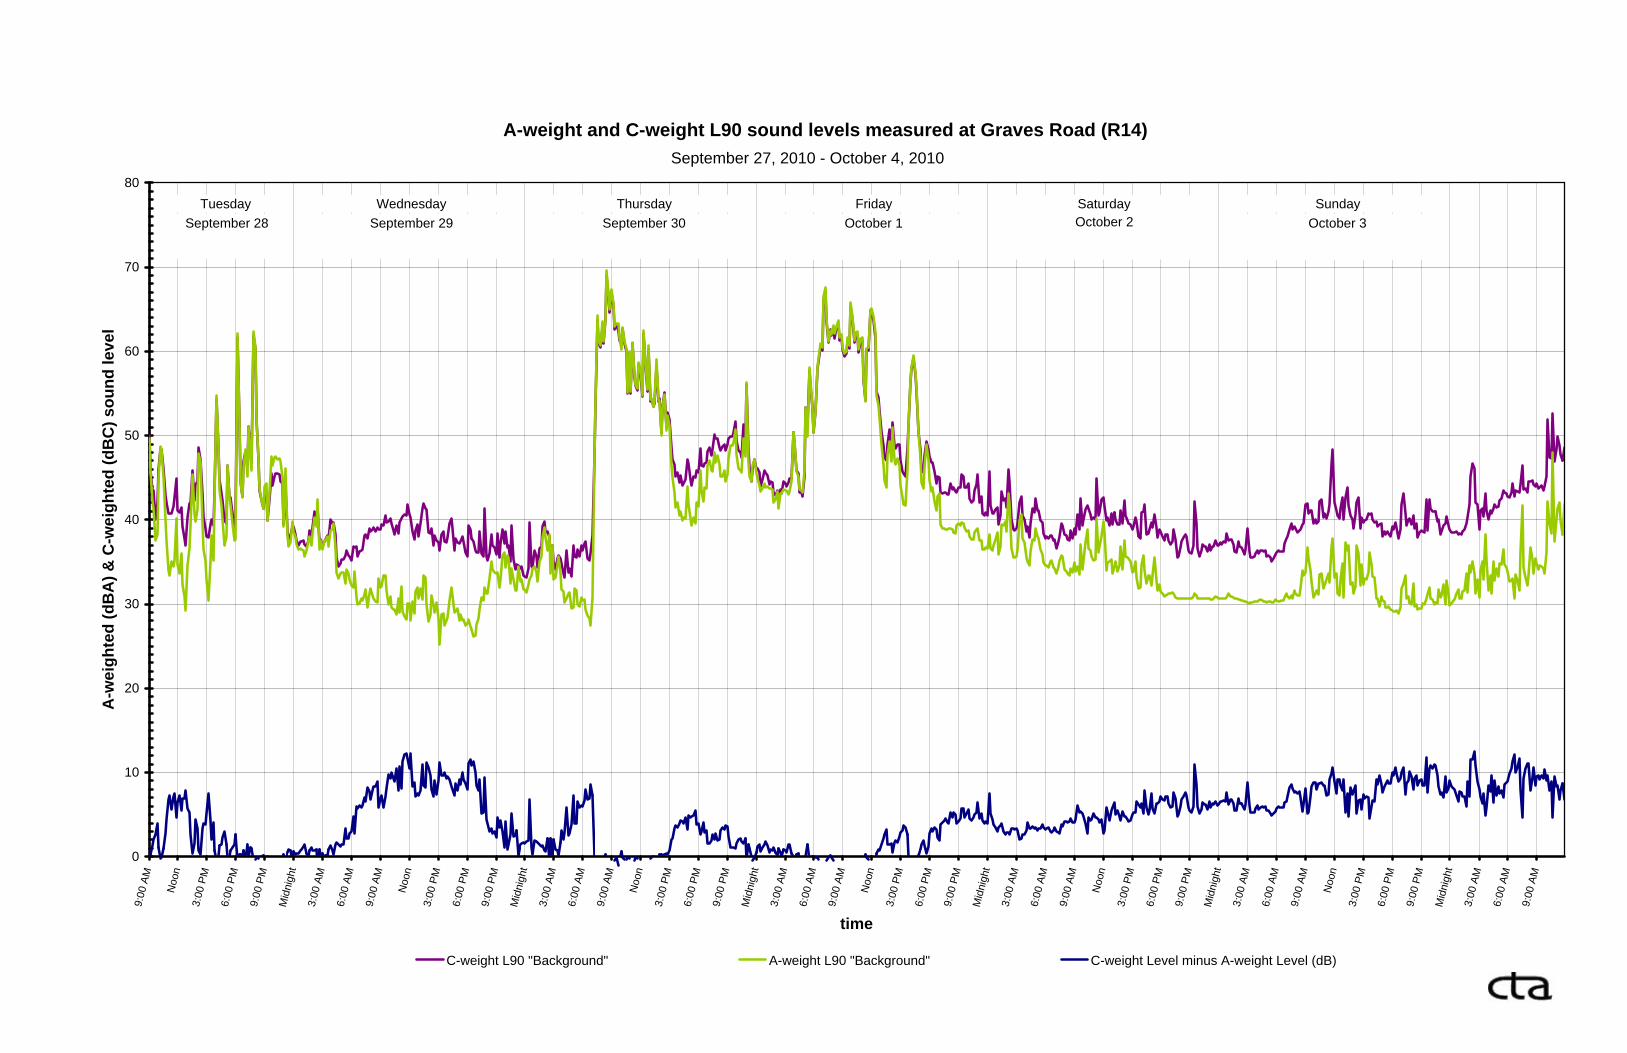
• Un-weighted octave and 1/3 octave band L90 sound levels. Appendix B also reports both A-weight and C-weight sound levels measured at Graves Road and the arithmetic difference between C-weighted and A-weighted sound levels. It is interesting to note that the differences between C-weighted and A-weighted sound levels tend to be 10 dB or less. A defective monitor keypad prevented data collection at the 56 South Street sound monitoring location. However, attended measurements of sound level and spectral characteristics at 56 South Street were completed to document the existing background sound level environment in the downtown Main Street area of Ashfield. Review of Data Collected The most important data for this sound survey are the:
• Ninetieth percentile (L90) sound levels as the MassDEP policy on community sound uses the L90 sound level descriptor
• Octave band sound level spectra as the MassDEP policy evaluates the presence of tonal sound using octave band spectra.
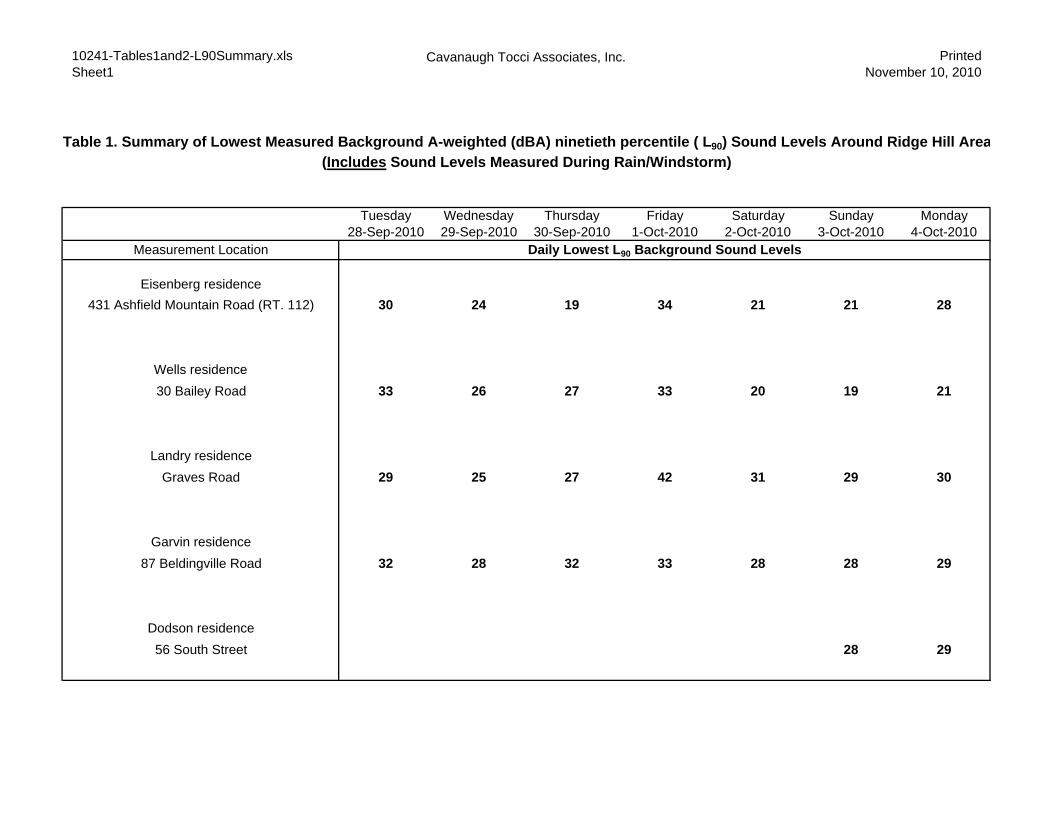
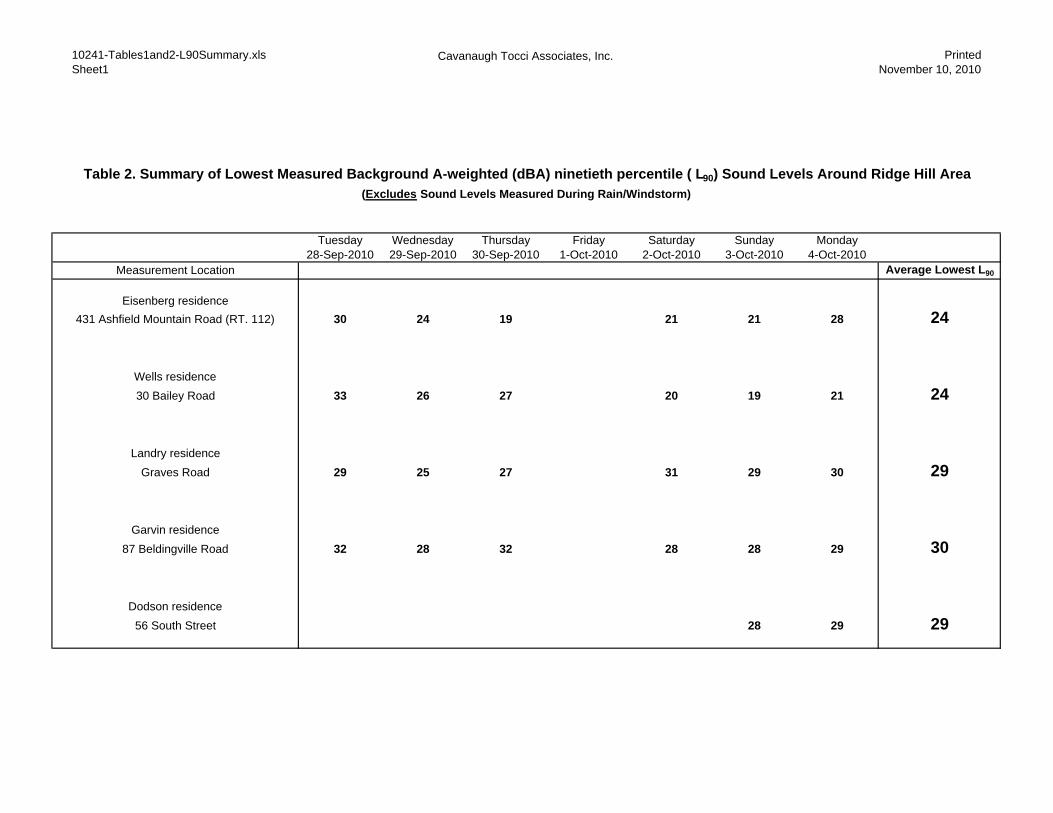
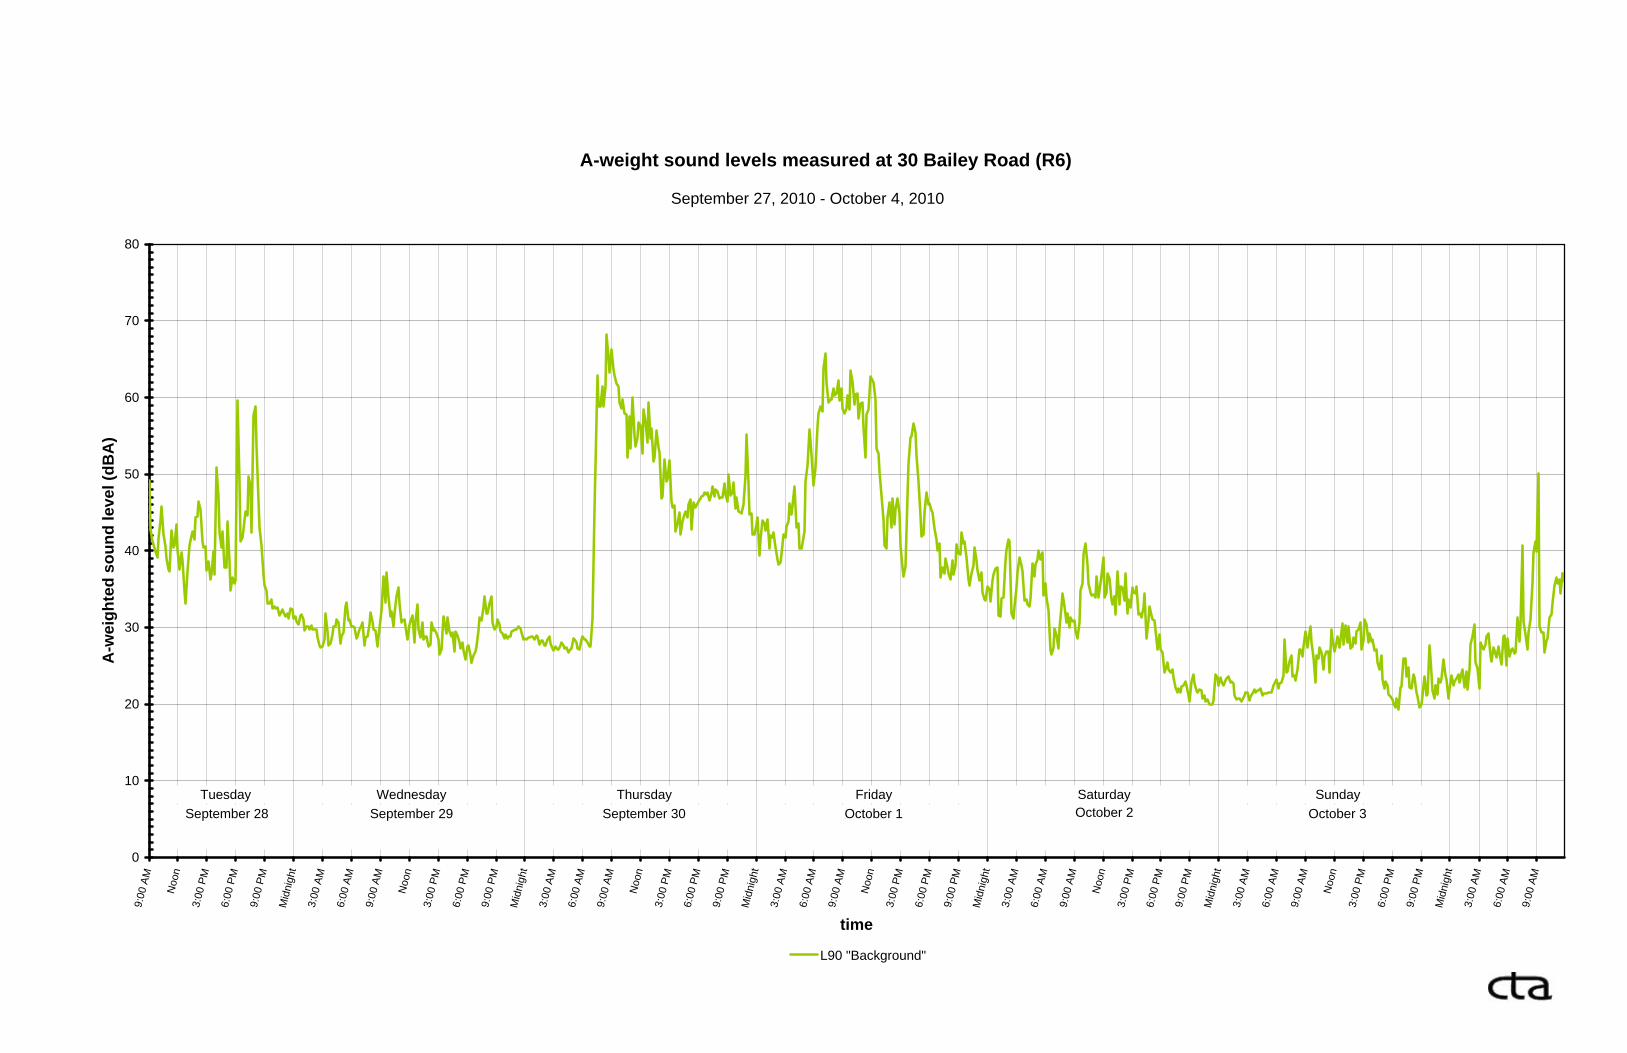
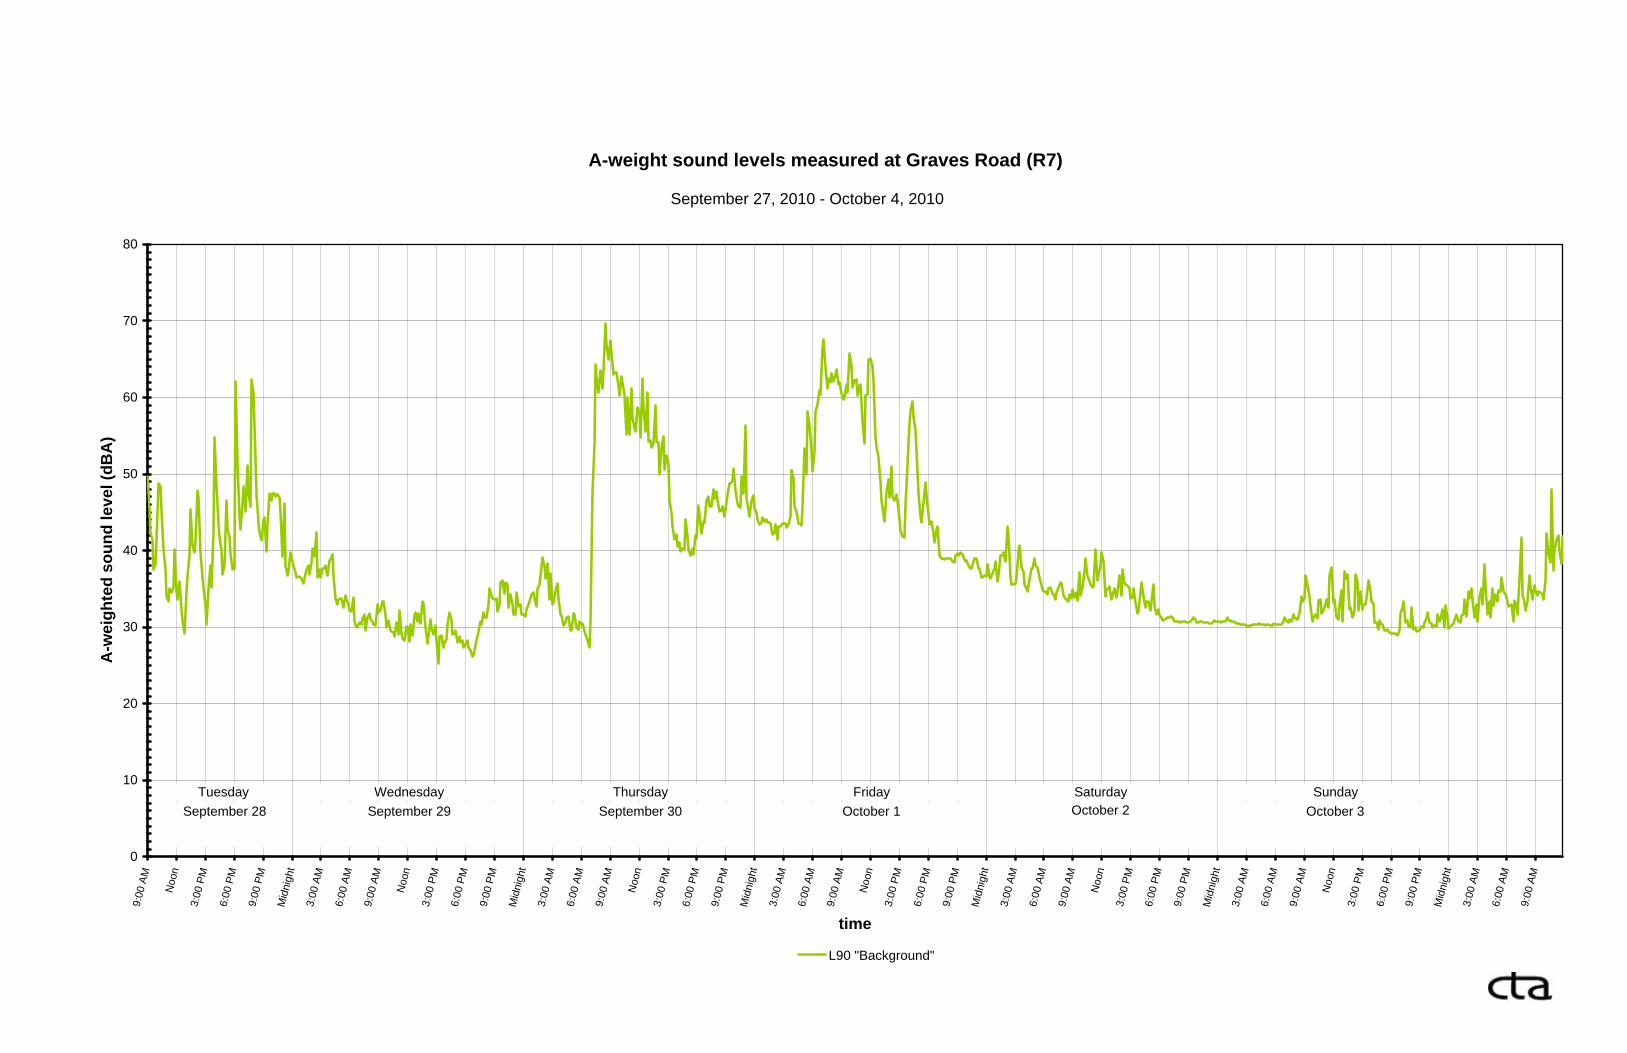
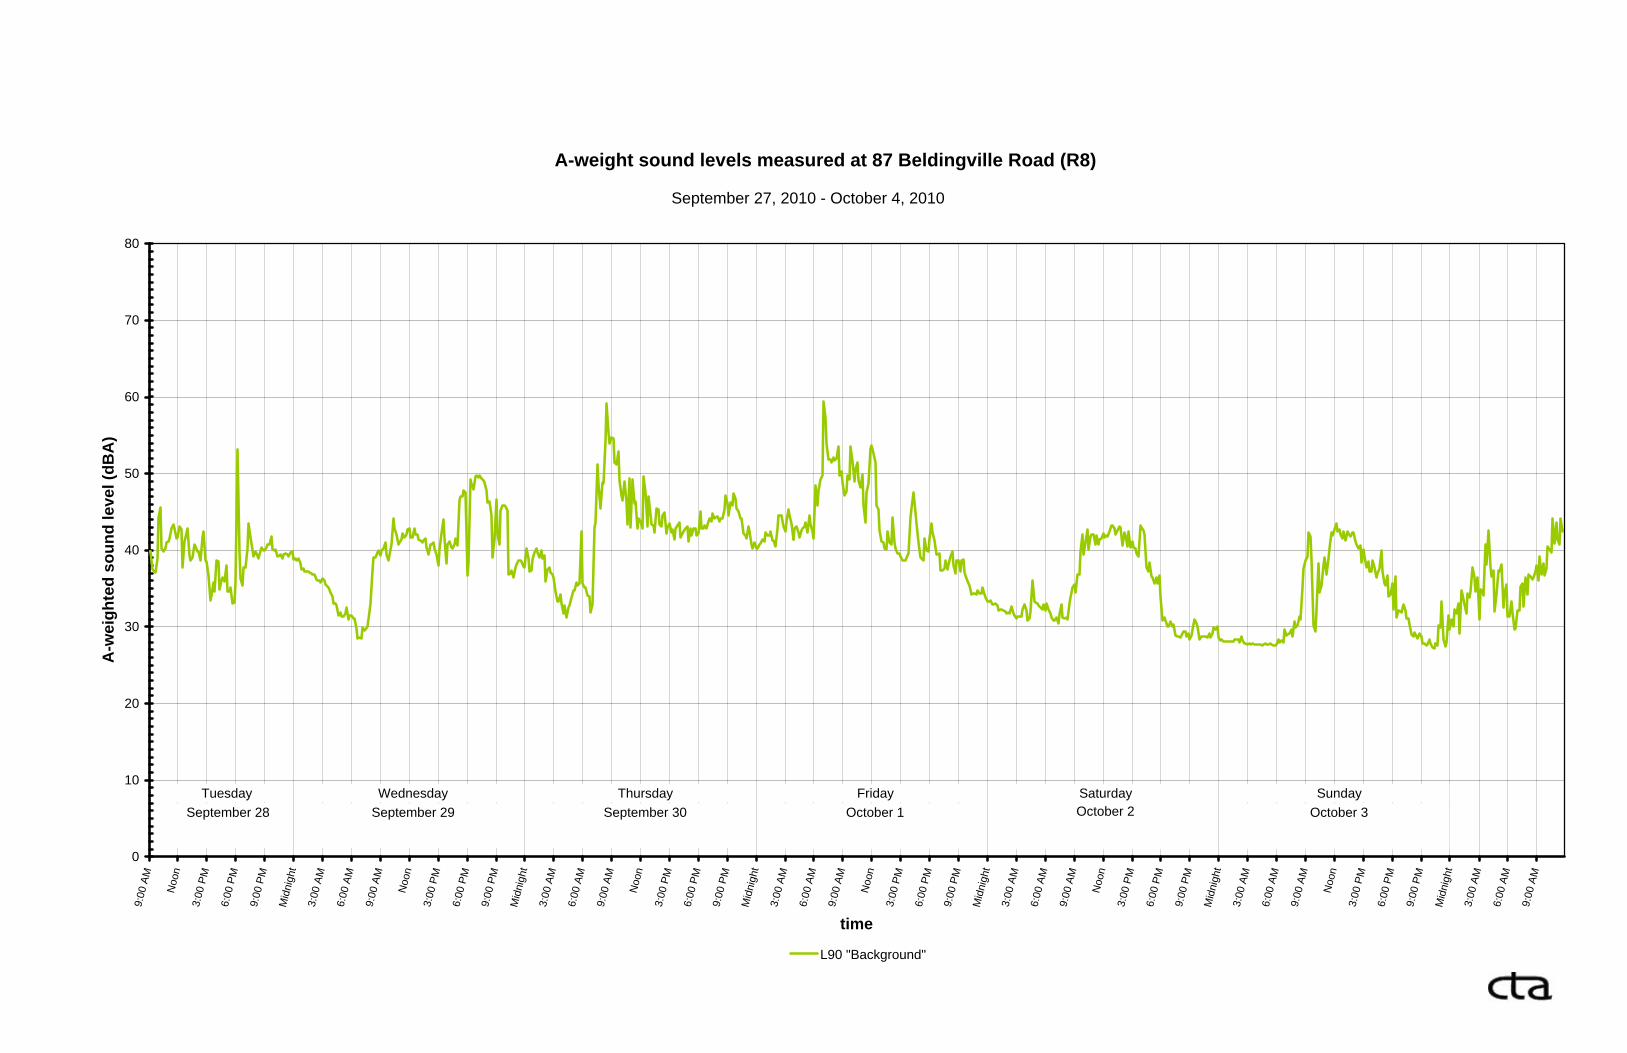
The long-term sound monitoring data shown in Appendix B have been used to derive summary tables that list the daily lowest L90 sound levels measured at each monitoring location. It is important to note that a significant rain/windstorm occurred mid-week during the sound monitoring time period, causing a significant and unusual increase in background sound levels during the storm. As can be observed in the Appendix B sound monitoring data, the elevated sound levels associated with the storm commenced late-morning on Thursday September 30 and extended to early-afternoon Friday, November 1. Weather conditions during the storm on Friday, October 1 are atypical of the area. High winds and rain resulted in unrepresentatively high sound levels during that day. Lowest measured L90 sound levels for all days monitored, including October 1, are reported in Table 1. In Table 2, the anomalous October 1 data are not included. Table 2 also reports the averages of lowest background sound levels measured over the one-week period, but without the anomalous October 1 sound level data. In addition, both tables include the lowest-measured L90 sound levels data collected at the Dobson residence (56 South Street) on two separate days with the sound level meter spectrum analyzer attended and operated by a CTA staff person. Evaluation In general summary, the long-term sound monitoring data (augmented with attended sound level meter spectrum analyzer data) demonstrate that average lowest background L90 sound levels in the vicinity of Ridge Hill range between 24 and 30 dBA and occur late at night during calm, dry weather conditions.

Green Berkshires Incorporated Page 4 Ambient Environmental Sound Measurements – Ashfield, MA November 10, 2010
If we can provide any further information, please do not hesitate to contact us. Thank you. Sincerely,
Cavanaugh Tocci Associates, Inc.
Brion G. Koning, Senior Consultant Gregory C. Tocci, PE, President
10241-GreenBerkshiresAmbientMeasurements-11-10-10-bgkgctgct.doc
10241-Tables1and2-L90Summary.xlsSheet1
Cavanaugh Tocci Associates, Inc. PrintedNovember 10, 2010
Tuesday Wednesday Thursday Friday Saturday Sunday Monday28-Sep-2010 29-Sep-2010 30-Sep-2010 1-Oct-2010 2-Oct-2010 3-Oct-2010 4-Oct-2010
Measurement Location
Eisenberg residence431 Ashfield Mountain Road (RT. 112) 30 24 19 34 21 21 28
Wells residence30 Bailey Road 33 26 27 33 20 19 21
Landry residenceGraves Road 29 25 27 42 31 29 30
Garvin residence87 Beldingville Road 32 28 32 33 28 28 29
Dodson residence56 South Street 28 29
Table 1. Summary of Lowest Measured Background A-weighted (dBA) ninetieth percentile ( L90) Sound Levels Around Ridge Hill Area
Daily Lowest L90 Background Sound Levels
(Includes Sound Levels Measured During Rain/Windstorm)
10241-Tables1and2-L90Summary.xlsSheet1
Cavanaugh Tocci Associates, Inc. PrintedNovember 10, 2010
Tuesday Wednesday Thursday Friday Saturday Sunday Monday28-Sep-2010 29-Sep-2010 30-Sep-2010 1-Oct-2010 2-Oct-2010 3-Oct-2010 4-Oct-2010
Measurement Location Average Lowest L90
Eisenberg residence431 Ashfield Mountain Road (RT. 112) 30 24 19 21 21 28 24
Wells residence30 Bailey Road 33 26 27 20 19 21 24
Landry residenceGraves Road 29 25 27 31 29 30 29
Garvin residence87 Beldingville Road 32 28 32 28 28 29 30
Dodson residence56 South Street 28 29 29
(Excludes Sound Levels Measured During Rain/Windstorm)Table 2. Summary of Lowest Measured Background A-weighted (dBA) ninetieth percentile ( L90) Sound Levels Around Ridge Hill Area
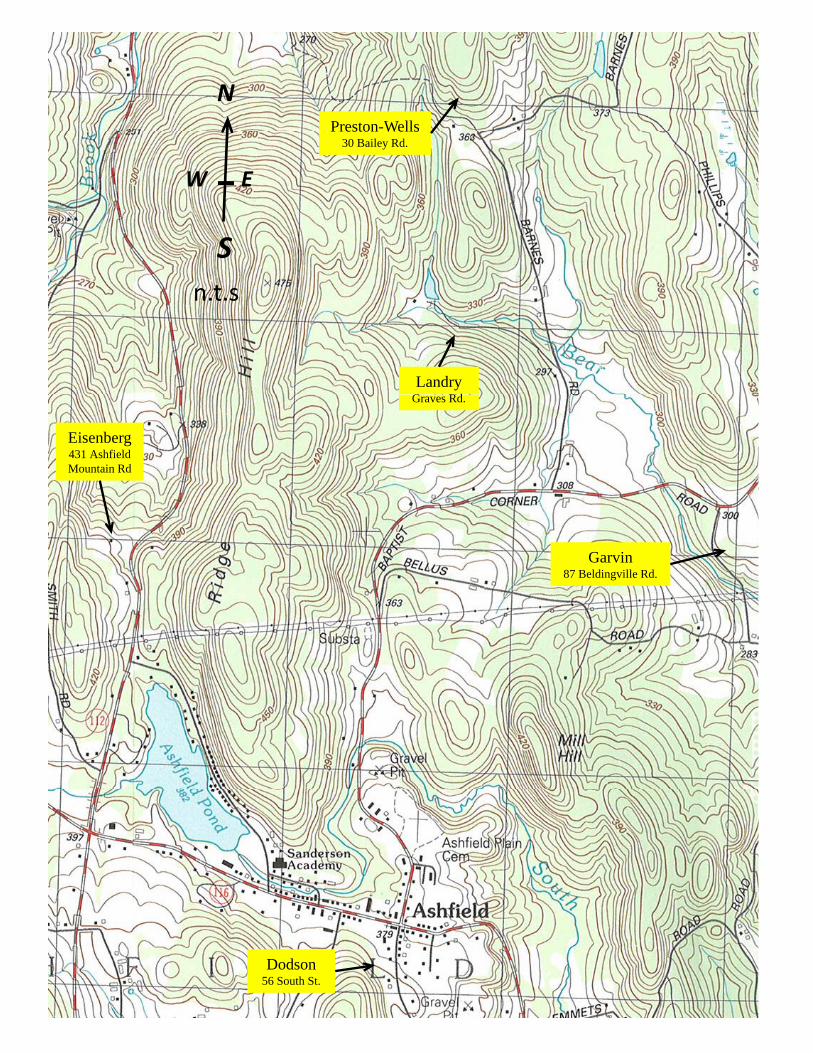
Preston-Wells
NPreston Wells
30 Bailey Rd.
S
EW
n.t.s
LandryG Rd
Eisenberg 431 Ashfield Mountain Rd
Graves Rd.
Garvin87 Beldingville Rd.
Dodson56 South St.
APPENDIX A ____________________________________________________________________________________________________________________________________________________________________________________________________________________________________
Glossary of Pertinent Acoustical Terminology
and MDEP Community Sound Levels Criteria
Basic Principles of Acoustics
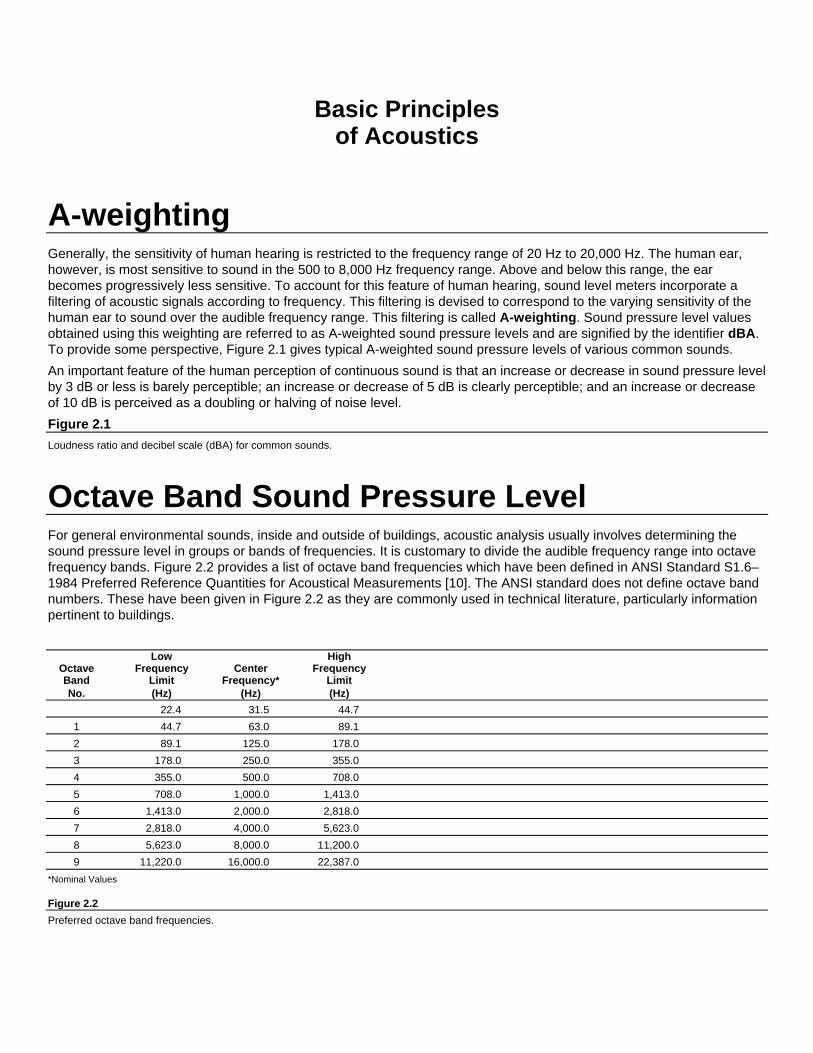
A-weighting Generally, the sensitivity of human hearing is restricted to the frequency range of 20 Hz to 20,000 Hz. The human ear, however, is most sensitive to sound in the 500 to 8,000 Hz frequency range. Above and below this range, the ear becomes progressively less sensitive. To account for this feature of human hearing, sound level meters incorporate a filtering of acoustic signals according to frequency. This filtering is devised to correspond to the varying sensitivity of the human ear to sound over the audible frequency range. This filtering is called A-weighting. Sound pressure level values obtained using this weighting are referred to as A-weighted sound pressure levels and are signified by the identifier dBA. To provide some perspective, Figure 2.1 gives typical A-weighted sound pressure levels of various common sounds. An important feature of the human perception of continuous sound is that an increase or decrease in sound pressure level by 3 dB or less is barely perceptible; an increase or decrease of 5 dB is clearly perceptible; and an increase or decrease of 10 dB is perceived as a doubling or halving of noise level. Figure 2.1 Loudness ratio and decibel scale (dBA) for common sounds. Octave Band Sound Pressure Level For general environmental sounds, inside and outside of buildings, acoustic analysis usually involves determining the sound pressure level in groups or bands of frequencies. It is customary to divide the audible frequency range into octave frequency bands. Figure 2.2 provides a list of octave band frequencies which have been defined in ANSI Standard S1.6–1984 Preferred Reference Quantities for Acoustical Measurements [10]. The ANSI standard does not define octave band numbers. These have been given in Figure 2.2 as they are commonly used in technical literature, particularly information pertinent to buildings. Low High Octave Frequency Center Frequency Band Limit Frequency* Limit No. (Hz) (Hz) (Hz) 22.4 31.5 44.7 1 44.7 63.0 89.1 2 89.1 125.0 178.0 3 178.0 250.0 355.0 4 355.0 500.0 708.0 5 708.0 1,000.0 1,413.0 6 1,413.0 2,000.0 2,818.0 7 2,818.0 4,000.0 5,623.0 8 5,623.0 8,000.0 11,200.0 9 11,220.0 16,000.0 22,387.0 *Nominal Values Figure 2.2 Preferred octave band frequencies.
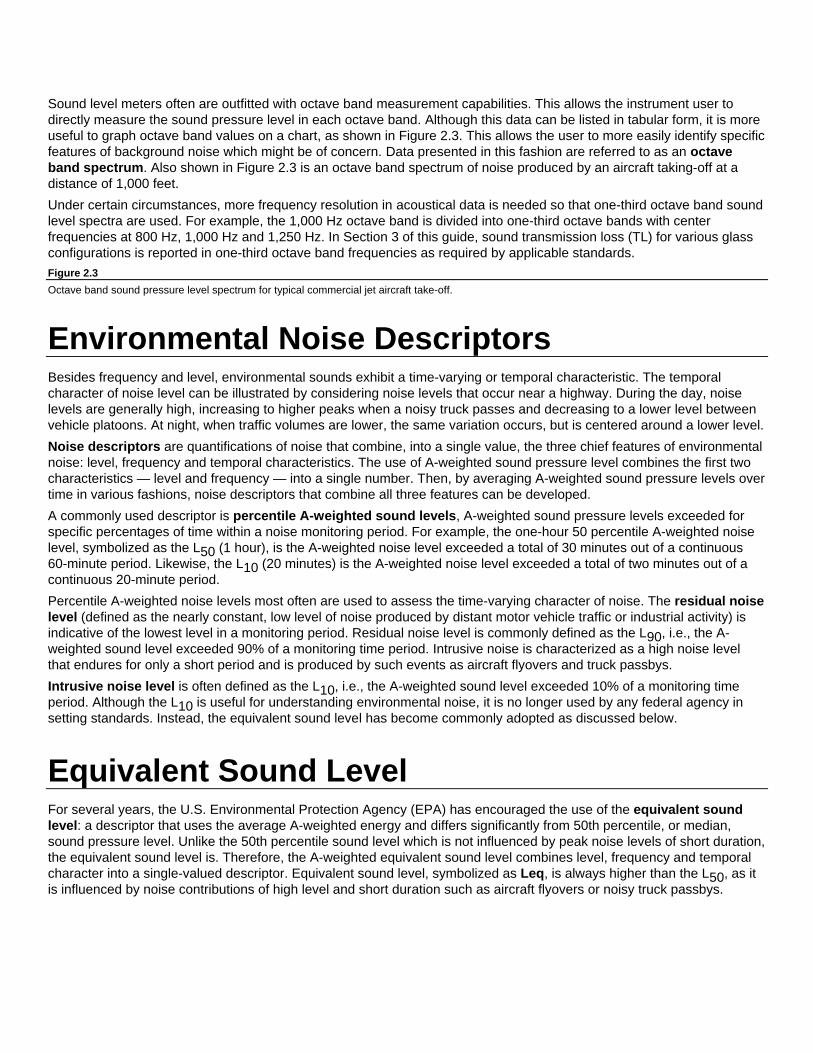
Sound level meters often are outfitted with octave band measurement capabilities. This allows the instrument user to directly measure the sound pressure level in each octave band. Although this data can be listed in tabular form, it is more useful to graph octave band values on a chart, as shown in Figure 2.3. This allows the user to more easily identify specific features of background noise which might be of concern. Data presented in this fashion are referred to as an octave band spectrum. Also shown in Figure 2.3 is an octave band spectrum of noise produced by an aircraft taking-off at a distance of 1,000 feet. Under certain circumstances, more frequency resolution in acoustical data is needed so that one-third octave band sound level spectra are used. For example, the 1,000 Hz octave band is divided into one-third octave bands with center frequencies at 800 Hz, 1,000 Hz and 1,250 Hz. In Section 3 of this guide, sound transmission loss (TL) for various glass configurations is reported in one-third octave band frequencies as required by applicable standards. Figure 2.3 Octave band sound pressure level spectrum for typical commercial jet aircraft take-off.
Environmental Noise Descriptors Besides frequency and level, environmental sounds exhibit a time-varying or temporal characteristic. The temporal character of noise level can be illustrated by considering noise levels that occur near a highway. During the day, noise levels are generally high, increasing to higher peaks when a noisy truck passes and decreasing to a lower level between vehicle platoons. At night, when traffic volumes are lower, the same variation occurs, but is centered around a lower level. Noise descriptors are quantifications of noise that combine, into a single value, the three chief features of environmental noise: level, frequency and temporal characteristics. The use of A-weighted sound pressure level combines the first two characteristics — level and frequency — into a single number. Then, by averaging A-weighted sound pressure levels over time in various fashions, noise descriptors that combine all three features can be developed. A commonly used descriptor is percentile A-weighted sound levels, A-weighted sound pressure levels exceeded for specific percentages of time within a noise monitoring period. For example, the one-hour 50 percentile A-weighted noise level, symbolized as the L50 (1 hour), is the A-weighted noise level exceeded a total of 30 minutes out of a continuous 60-minute period. Likewise, the L10 (20 minutes) is the A-weighted noise level exceeded a total of two minutes out of a continuous 20-minute period. Percentile A-weighted noise levels most often are used to assess the time-varying character of noise. The residual noise level (defined as the nearly constant, low level of noise produced by distant motor vehicle traffic or industrial activity) is indicative of the lowest level in a monitoring period. Residual noise level is commonly defined as the L90, i.e., the A-weighted sound level exceeded 90% of a monitoring time period. Intrusive noise is characterized as a high noise level that endures for only a short period and is produced by such events as aircraft flyovers and truck passbys. Intrusive noise level is often defined as the L10, i.e., the A-weighted sound level exceeded 10% of a monitoring time period. Although the L10 is useful for understanding environmental noise, it is no longer used by any federal agency in setting standards. Instead, the equivalent sound level has become commonly adopted as discussed below.
Equivalent Sound Level For several years, the U.S. Environmental Protection Agency (EPA) has encouraged the use of the equivalent sound level: a descriptor that uses the average A-weighted energy and differs significantly from 50th percentile, or median, sound pressure level. Unlike the 50th percentile sound level which is not influenced by peak noise levels of short duration, the equivalent sound level is. Therefore, the A-weighted equivalent sound level combines level, frequency and temporal character into a single-valued descriptor. Equivalent sound level, symbolized as Leq, is always higher than the L50, as it is influenced by noise contributions of high level and short duration such as aircraft flyovers or noisy truck passbys.
noisefs • Page 1 of 1
Massachusetts Department of
Environmental Protection
One Winter Street
Boston, MA 02108-4746
Commonwealth of
Massachusetts
Mitt Romney, Governor
Executive Office of
Environmental Affairs
Ellen Roy Herzfelder, Secretary
Department of
Environmental Protection
Edward P. Kunce,
Acting Commissioner
Produced by the
Bureau of Waste Prevention
February 2003.
Printed on recycled paper.
This information is available in
alternate format by calling our
ADA Coordinator at
(617) 574-6872.
f a c t s h e e t Noise Background Noise is a type of air pollution that results from sounds that cause a nuisance, are or could injure public health, or unreasonably interfere with the comfortable enjoyment of life, property, or the conduct of business. Types of sounds that may cause noise include:
• “Loud” continuous sounds from industrial or commercial activity, demolition, or highly amplified music;
• Sounds in narrow frequency ranges such as “squealing” fans or other rotary equipment; and
• Intermittent or “impact” sounds such as those from pile drivers, jackhammers, slamming truck tailgates, public address systems, etc.
Policy A noise source will be considered to be violating the Department’s noise regulation (310 CMR 7.10) if the source:
1. Increases the broadband sound level by more than 10 dB(A) above ambient, or
2. Produce a “pure tone” condition – when any octave band center frequency sound pressure level exceeds the two adjacent center frequency sound pressure levels by 3 decibels or more.
These criteria are measured both at the property line and at the nearest inhabited residence. “Ambient” is defined as the background A-weighted sound level that is exceeded 90% of the time, measured during equipment operating hours. “Ambient” may also be established by other means with consent of the Department. For more information: For complaints about specific noise sources, call the Board of Health for the municipality in which the noise source is located. To learn more about responding to noise, odor and dust complaints or to request state assistance or support, please contact the service center in the nearest DEP regional office.
• Central Region, Worcester: (508) 792-7683 • Northeast Region, Wilmington: (978) 661-7677 • Southeast Region, Lakeville: (508) 946-2714 • Western Region, Springfield: (413) 755-2214 This Policy was originally adopted by the MA Department of Public Health in the early 1970’s. It was reaffirmed by DEP’s Division of Air Quality Control on February 1, 1990, and has remained in effect.
APPENDIX B ____________________________________________________________________________________________________________________________________________________________________________________________________________________________________
A-weighted and C-weighted
Sound Levels Monitoring Data

0
10
20
30
40
50
60
70
80
9:00
AM
Noo
n
3:00
PM
6:00
PM
9:00
PM
Mid
nigh
t
3:00
AM
6:00
AM
9:00
AM
Noo
n
3:00
PM
6:00
PM
9:00
PM
Mid
nigh
t
3:00
AM
6:00
AM
9:00
AM
Noo
n
3:00
PM
6:00
PM
9:00
PM
Mid
nigh
t
3:00
AM
6:00
AM
9:00
AM
Noo
n
3:00
PM
6:00
PM
9:00
PM
Mid
nigh
t
3:00
AM
6:00
AM
9:00
AM
Noo
n
3:00
PM
6:00
PM
9:00
PM
Mid
nigh
t
3:00
AM
6:00
AM
9:00
AM
Noo
n
3:00
PM
6:00
PM
9:00
PM
Mid
nigh
t
3:00
AM
6:00
AM
9:00
AM
time
A-w
eigh
ted
soun
d le
vel (
dBA
)
L90 "Background"
September 27, 2010 - October 4, 2010
Tuesday Thursday Friday SaturdaySeptember 28 September 29 September 30 October 1 October 2
A-weight sound levels measured at 431 Ashfield Mountain Road (R4)
SundayOctober 3
Wednesday
0
10
20
30
40
50
60
70
80
9:00
AM
Noo
n
3:00
PM
6:00
PM
9:00
PM
Mid
nigh
t
3:00
AM
6:00
AM
9:00
AM
Noo
n
3:00
PM
6:00
PM
9:00
PM
Mid
nigh
t
3:00
AM
6:00
AM
9:00
AM
Noo
n
3:00
PM
6:00
PM
9:00
PM
Mid
nigh
t
3:00
AM
6:00
AM
9:00
AM
Noo
n
3:00
PM
6:00
PM
9:00
PM
Mid
nigh
t
3:00
AM
6:00
AM
9:00
AM
Noo
n
3:00
PM
6:00
PM
9:00
PM
Mid
nigh
t
3:00
AM
6:00
AM
9:00
AM
Noo
n
3:00
PM
6:00
PM
9:00
PM
Mid
nigh
t
3:00
AM
6:00
AM
9:00
AM
time
A-w
eigh
ted
soun
d le
vel (
dBA
)
L90 "Background"
September 27, 2010 - October 4, 2010
A-weight sound levels measured at 30 Bailey Road (R6)
Tuesday Thursday Friday SaturdaySeptember 28 September 29 September 30 October 1 October 2
SundayOctober 3
Wednesday
0
10
20
30
40
50
60
70
80
9:00
AM
Noo
n
3:00
PM
6:00
PM
9:00
PM
Mid
nigh
t
3:00
AM
6:00
AM
9:00
AM
Noo
n
3:00
PM
6:00
PM
9:00
PM
Mid
nigh
t
3:00
AM
6:00
AM
9:00
AM
Noo
n
3:00
PM
6:00
PM
9:00
PM
Mid
nigh
t
3:00
AM
6:00
AM
9:00
AM
Noo
n
3:00
PM
6:00
PM
9:00
PM
Mid
nigh
t
3:00
AM
6:00
AM
9:00
AM
Noo
n
3:00
PM
6:00
PM
9:00
PM
Mid
nigh
t
3:00
AM
6:00
AM
9:00
AM
Noo
n
3:00
PM
6:00
PM
9:00
PM
Mid
nigh
t
3:00
AM
6:00
AM
9:00
AM
time
A-w
eigh
ted
soun
d le
vel (
dBA
)
L90 "Background"
September 27, 2010 - October 4, 2010
A-weight sound levels measured at Graves Road (R7)
Tuesday Thursday Friday SaturdaySeptember 28 September 29 September 30 October 1 October 2
SundayOctober 3
Wednesday
0
10
20
30
40
50
60
70
80
9:00
AM
Noo
n
3:00
PM
6:00
PM
9:00
PM
Mid
nigh
t
3:00
AM
6:00
AM
9:00
AM
Noo
n
3:00
PM
6:00
PM
9:00
PM
Mid
nigh
t
3:00
AM
6:00
AM
9:00
AM
Noo
n
3:00
PM
6:00
PM
9:00
PM
Mid
nigh
t
3:00
AM
6:00
AM
9:00
AM
Noo
n
3:00
PM
6:00
PM
9:00
PM
Mid
nigh
t
3:00
AM
6:00
AM
9:00
AM
Noo
n
3:00
PM
6:00
PM
9:00
PM
Mid
nigh
t
3:00
AM
6:00
AM
9:00
AM
Noo
n
3:00
PM
6:00
PM
9:00
PM
Mid
nigh
t
3:00
AM
6:00
AM
9:00
AM
time
A-w
eigh
ted
soun
d le
vel (
dBA
)
L90 "Background"
September 27, 2010 - October 4, 2010
A-weight sound levels measured at 87 Beldingville Road (R8)
Tuesday Thursday Friday SaturdaySeptember 28 September 29 September 30 October 1 October 2
SundayOctober 3
Wednesday
0
10
20
30
40
50
60
70
80
9:00
AM
Noo
n
3:00
PM
6:00
PM
9:00
PM
Mid
nigh
t
3:00
AM
6:00
AM
9:00
AM
Noo
n
3:00
PM
6:00
PM
9:00
PM
Mid
nigh
t
3:00
AM
6:00
AM
9:00
AM
Noo
n
3:00
PM
6:00
PM
9:00
PM
Mid
nigh
t
3:00
AM
6:00
AM
9:00
AM
Noo
n
3:00
PM
6:00
PM
9:00
PM
Mid
nigh
t
3:00
AM
6:00
AM
9:00
AM
Noo
n
3:00
PM
6:00
PM
9:00
PM
Mid
nigh
t
3:00
AM
6:00
AM
9:00
AM
Noo
n
3:00
PM
6:00
PM
9:00
PM
Mid
nigh
t
3:00
AM
6:00
AM
9:00
AM
time
C-w
eigh
ted
soun
d le
vel (
dBC
)
L90 "Background"
September 27, 2010 - October 4, 2010
C-weight sound levels measured at Graves Road (R14)
Tuesday Thursday Friday SaturdaySeptember 28 September 29 September 30 October 1 October 2
SundayOctober 3
Wednesday
0
10
20
30
40
50
60
70
80
9:00
AM
Noo
n
3:00
PM
6:00
PM
9:00
PM
Mid
nigh
t
3:00
AM
6:00
AM
9:00
AM
Noo
n
3:00
PM
6:00
PM
9:00
PM
Mid
nigh
t
3:00
AM
6:00
AM
9:00
AM
Noo
n
3:00
PM
6:00
PM
9:00
PM
Mid
nigh
t
3:00
AM
6:00
AM
9:00
AM
Noo
n
3:00
PM
6:00
PM
9:00
PM
Mid
nigh
t
3:00
AM
6:00
AM
9:00
AM
Noo
n
3:00
PM
6:00
PM
9:00
PM
Mid
nigh
t
3:00
AM
6:00
AM
9:00
AM
Noo
n
3:00
PM
6:00
PM
9:00
PM
Mid
nigh
t
3:00
AM
6:00
AM
9:00
AM
time
A-w
eigh
ted
(dB
A) &
C-w
eigh
ted
(dB
C) s
ound
leve
l
C-weight L90 "Background" A-weight L90 "Background" C-weight Level minus A-weight Level (dB)
September 27, 2010 - October 4, 2010
A-weight and C-weight L90 sound levels measured at Graves Road (R14)
Tuesday Thursday Friday SaturdaySeptember 28 September 29 September 30 October 1 October 2
SundayOctober 3
Wednesday
APPENDIX C ____________________________________________________________________________________________________________________________________________________________________________________________________________________________________
1/3 Octave and 1/1 Octave
Sound Level/Frequency Spectra
0
10
20
30
40
50
60
70
80
90
6.3 12.5 25 50 100 200 400 800 1600 3150 6300 12500
1/3 octave band center frequency (Hz)
soun
d pr
essu
re le
vel (
dB re
: 20 μP
a)
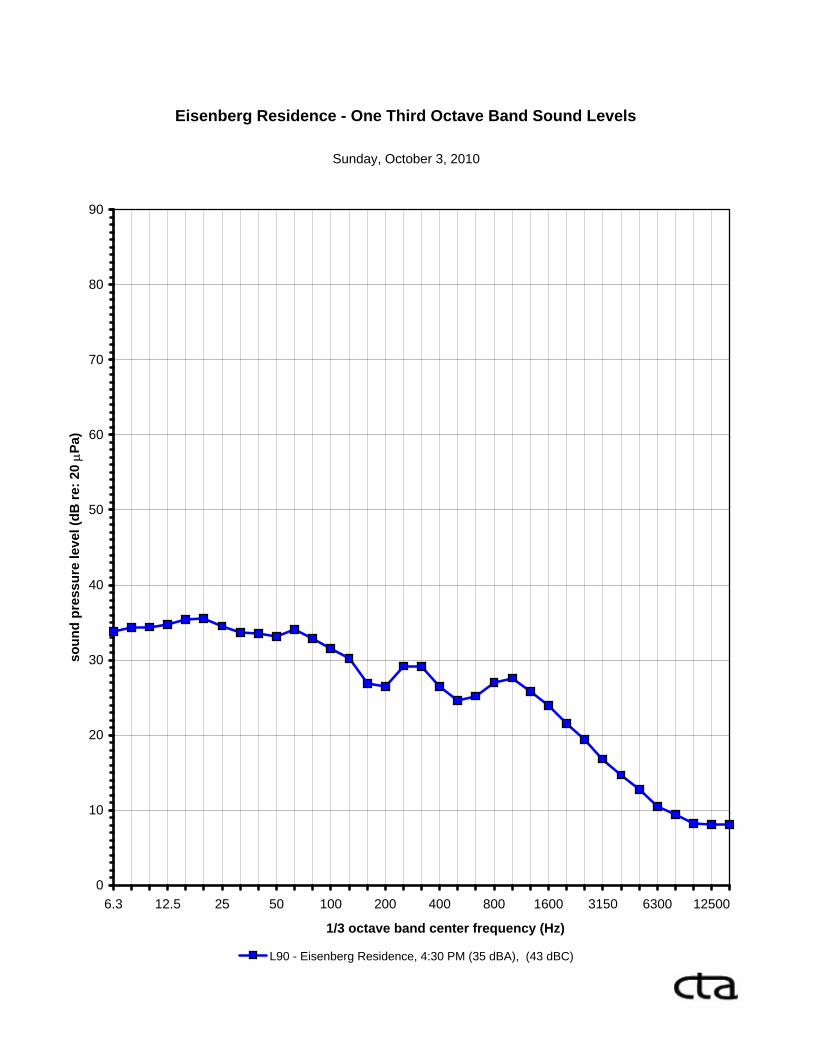
L90 - Eisenberg Residence, 4:30 PM (35 dBA), (43 dBC)
Eisenberg Residence - One Third Octave Band Sound Levels
Sunday, October 3, 2010
0
10
20
30
40
50
60
70
80
90
8 16 31.5 63 125 250 500 1000 2000 4000 8000 16000
octave band center frequency (Hz)
soun
d pr
essu
re le
vel (
dB re
: 20 μP
a)
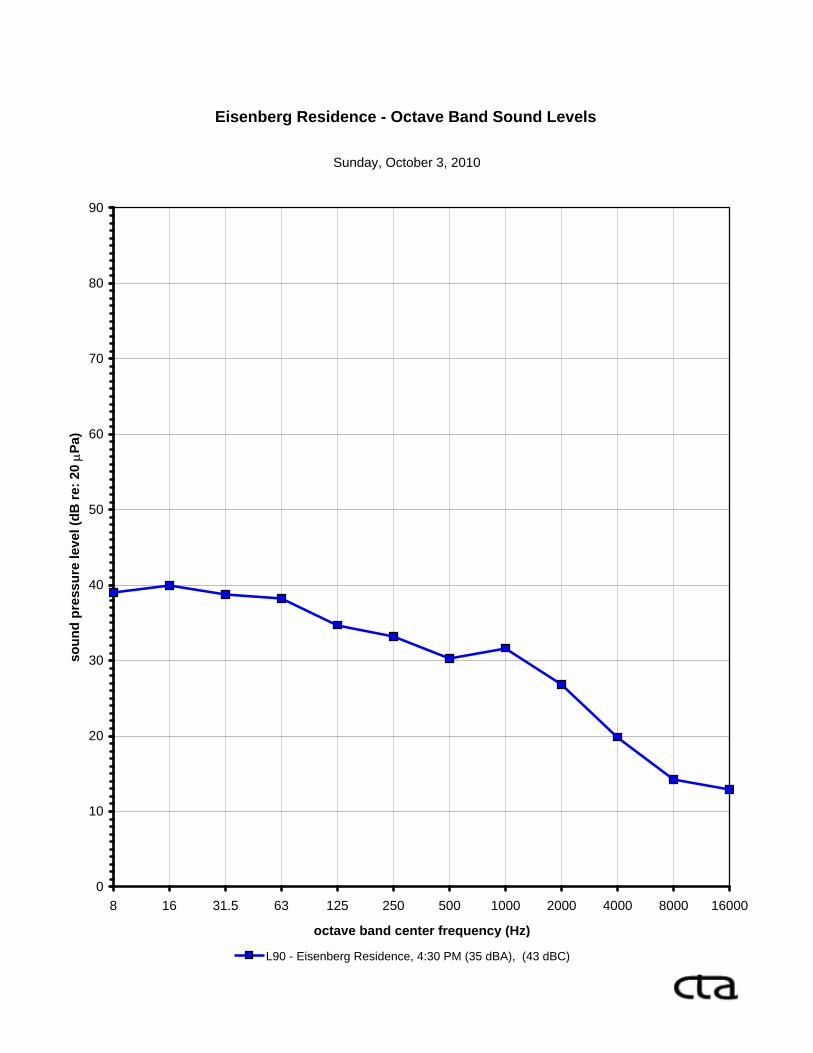
L90 - Eisenberg Residence, 4:30 PM (35 dBA), (43 dBC)
Eisenberg Residence - Octave Band Sound Levels
Sunday, October 3, 2010
0
10
20
30
40
50
60
70
80
90
6.3 12.5 25 50 100 200 400 800 1600 3150 6300 12500
1/3 octave band center frequency (Hz)
soun
d pr
essu
re le
vel (
dB re
: 20 μP
a)
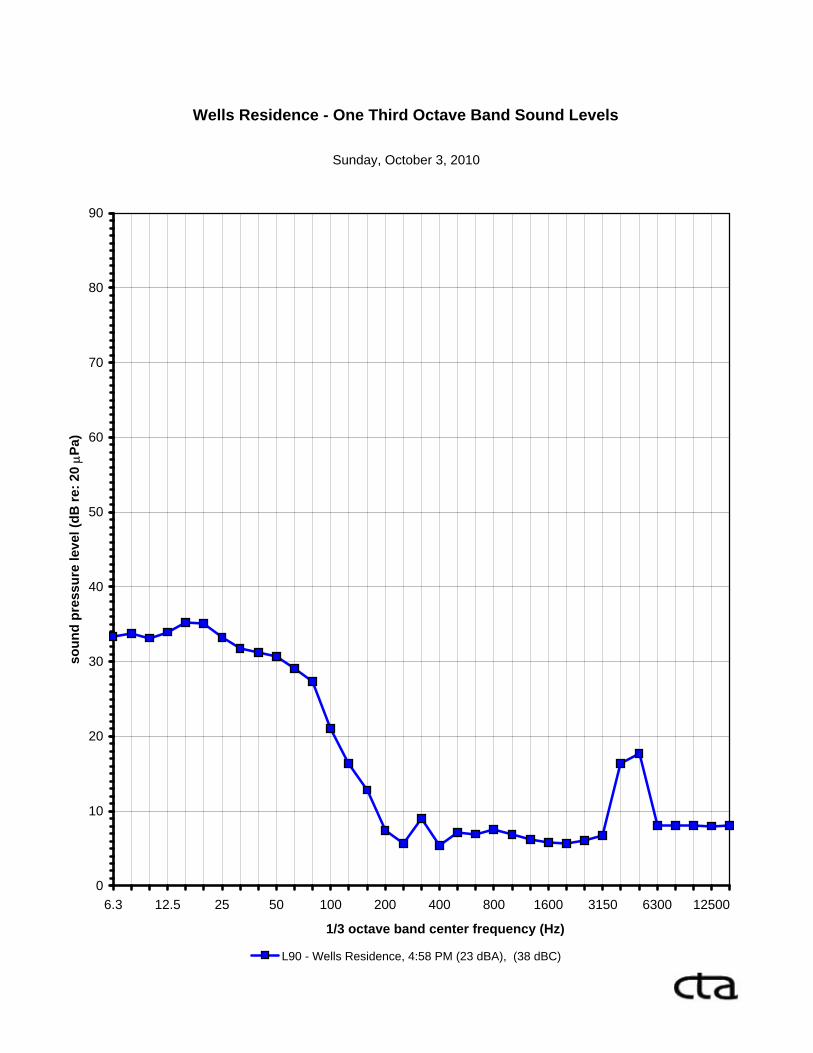
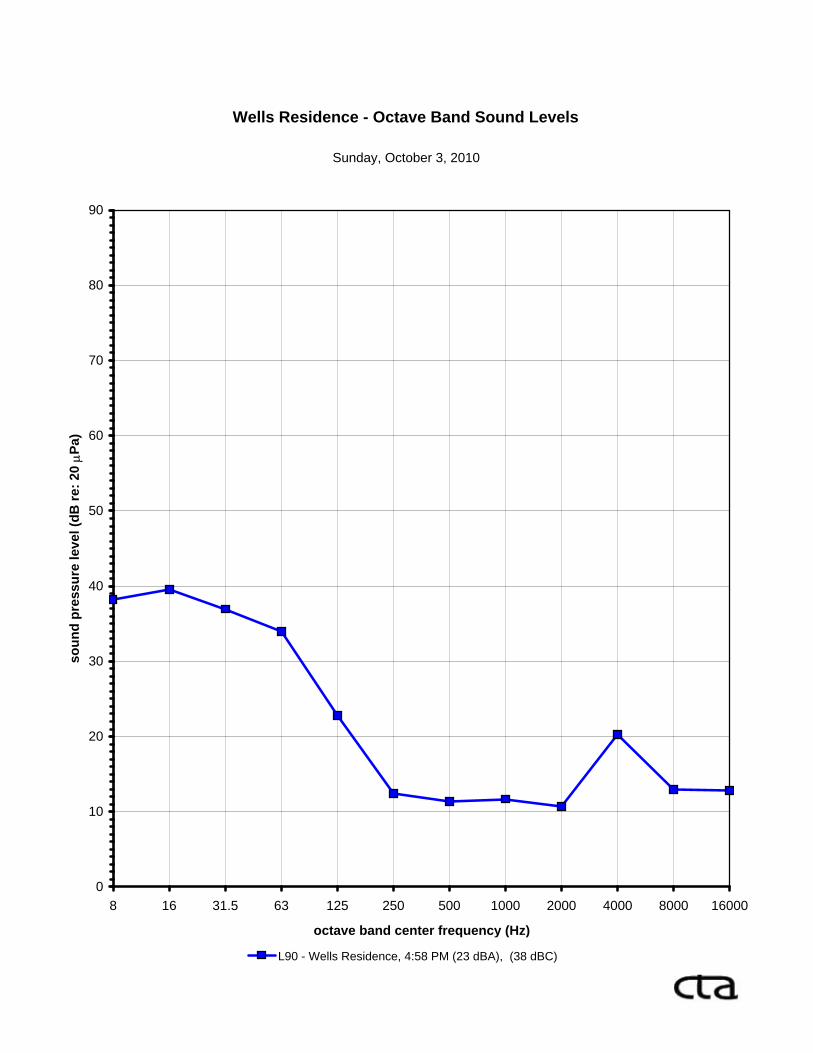
L90 - Wells Residence, 4:58 PM (23 dBA), (38 dBC)
Wells Residence - One Third Octave Band Sound Levels
Sunday, October 3, 2010
0
10
20
30
40
50
60
70
80
90
8 16 31.5 63 125 250 500 1000 2000 4000 8000 16000
octave band center frequency (Hz)
soun
d pr
essu
re le
vel (
dB re
: 20 μP
a)
L90 - Wells Residence, 4:58 PM (23 dBA), (38 dBC)
Wells Residence - Octave Band Sound Levels
Sunday, October 3, 2010
0
10
20
30
40
50
60
70
80
90
6.3 12.5 25 50 100 200 400 800 1600 3150 6300 12500
1/3 octave band center frequency (Hz)
soun
d pr
essu
re le
vel (
dB re
: 20 μP
a)
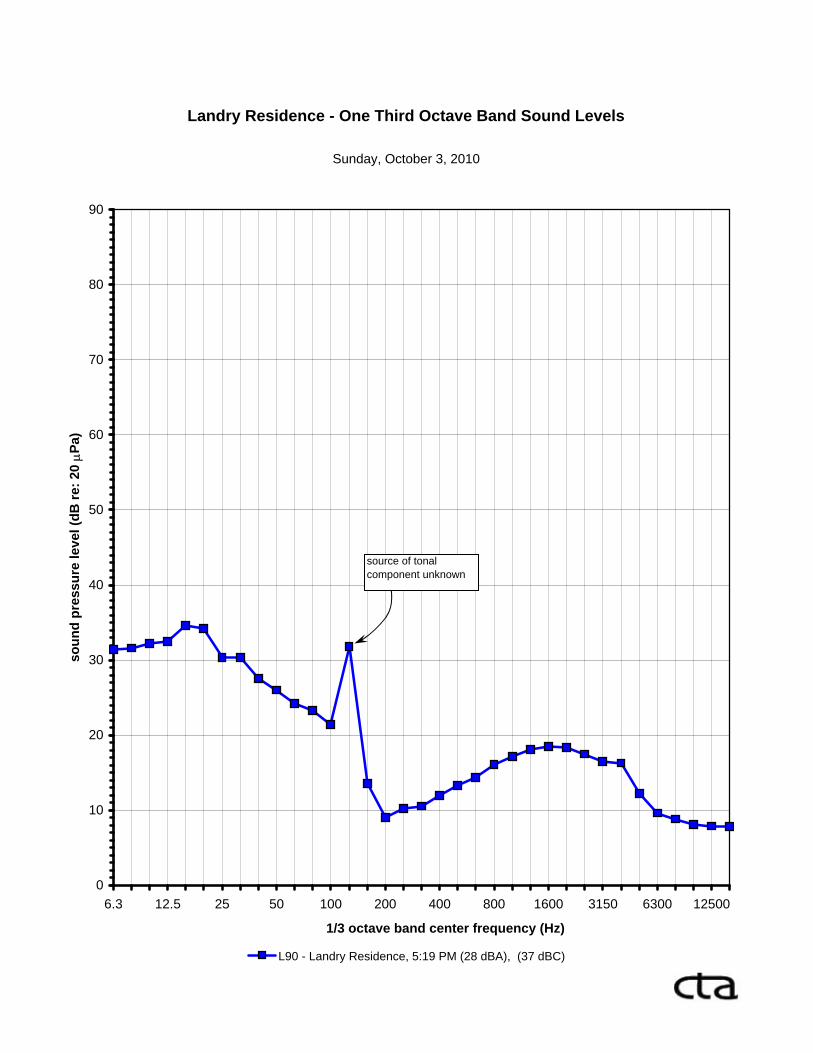
L90 - Landry Residence, 5:19 PM (28 dBA), (37 dBC)
Landry Residence - One Third Octave Band Sound Levels
Sunday, October 3, 2010
source of tonal component unknown

0
10
20
30
40
50
60
70
80
90
8 16 31.5 63 125 250 500 1000 2000 4000 8000 16000
octave band center frequency (Hz)
soun
d pr
essu
re le
vel (
dB re
: 20 μP
a)
L90 - Landry Residence, 5:19 PM (28 dBA), (37 dBC)
Landry Residence - Octave Band Sound Levels
Sunday, October 3, 2010
source of tonal component unknown
0
10
20
30
40
50
60
70
80
90
6.3 12.5 25 50 100 200 400 800 1600 3150 6300 12500
1/3 octave band center frequency (Hz)
soun
d pr
essu
re le
vel (
dB re
: 20 μP
a)
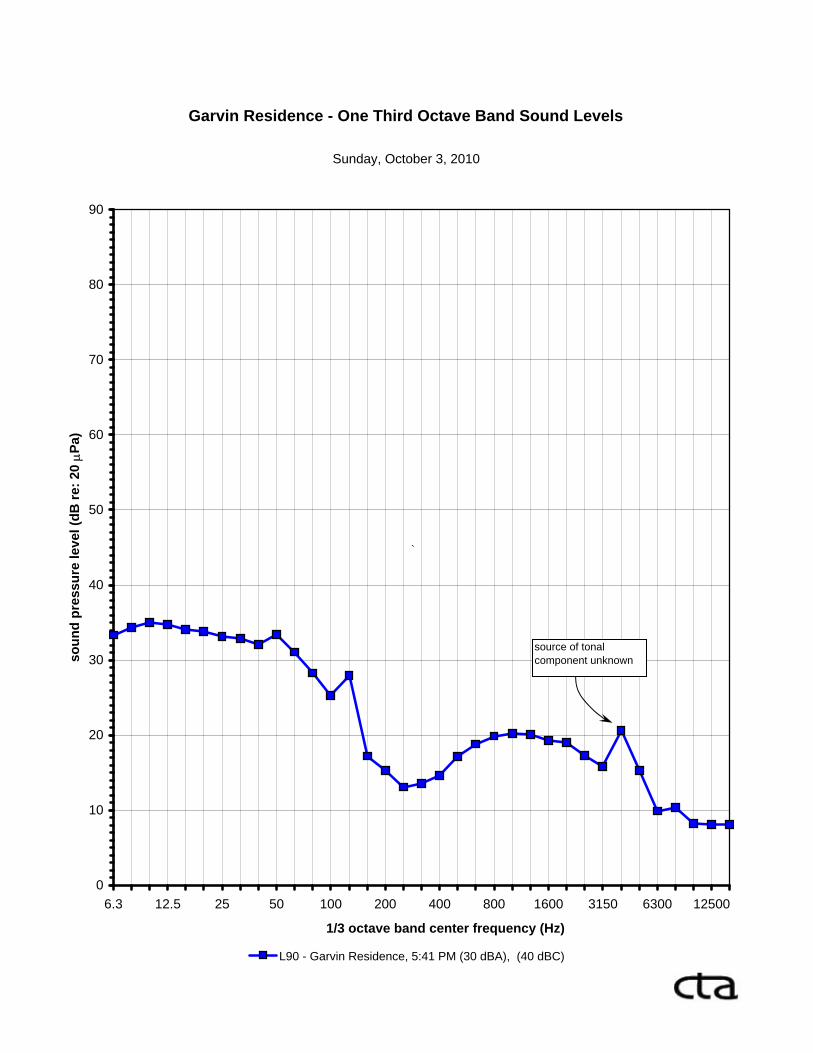
L90 - Garvin Residence, 5:41 PM (30 dBA), (40 dBC)
Garvin Residence - One Third Octave Band Sound Levels
Sunday, October 3, 2010
source of tonal component unknown
`
0
10
20
30
40
50
60
70
80
90
8 16 31.5 63 125 250 500 1000 2000 4000 8000 16000
octave band center frequency (Hz)
soun
d pr
essu
re le
vel (
dB re
: 20 μP
a)
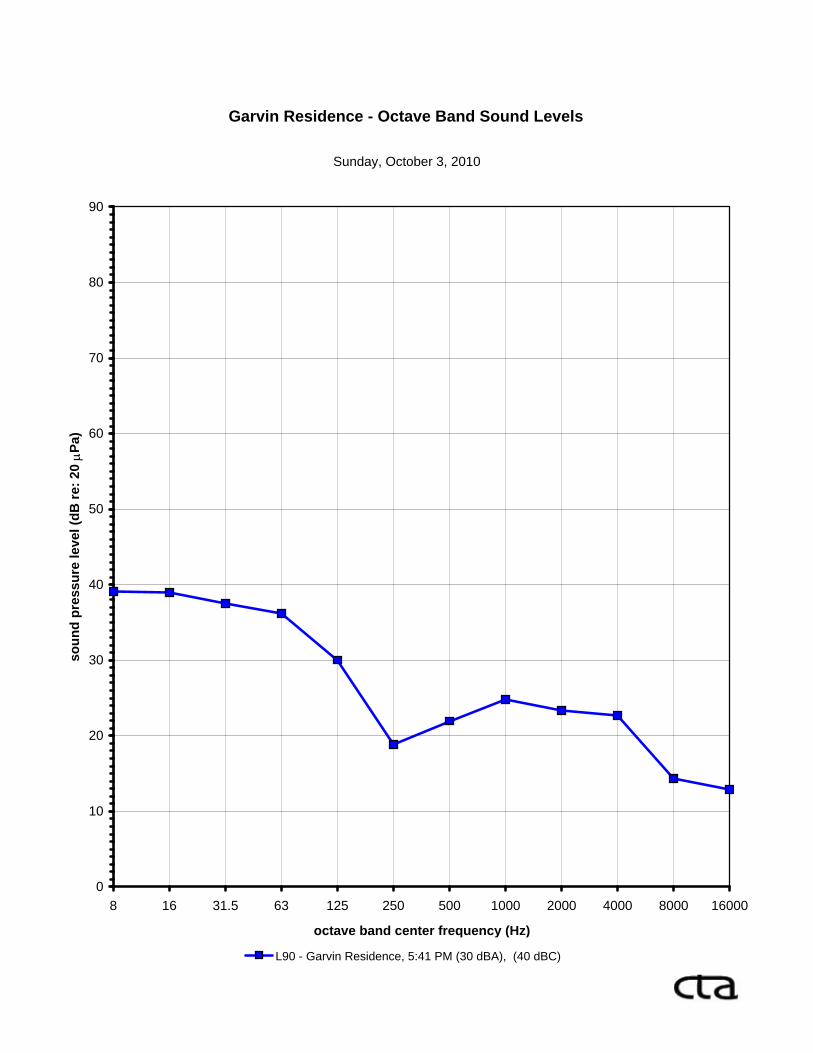
L90 - Garvin Residence, 5:41 PM (30 dBA), (40 dBC)
Garvin Residence - Octave Band Sound Levels
Sunday, October 3, 2010

0
10
20
30
40
50
60
70
80
90
6.3 12.5 25 50 100 200 400 800 1600 3150 6300 12500
1/3 octave band center frequency (Hz)
soun
d pr
essu
re le
vel (
dB re
: 20 μP
a)
L90 - Dodson Residence, 6:04 PM (28 dBA), (42 dBC)
Dodson Residence - One Third Octave Band Sound Levels
Sunday, October 3, 2010
source of tonal component unknown

0
10
20
30
40
50
60
70
80
90
8 16 31.5 63 125 250 500 1000 2000 4000 8000 16000
octave band center frequency (Hz)
soun
d pr
essu
re le
vel (
dB re
: 20 μP
a)
L90 - Dodson Residence, 6:04 PM (28 dBA), (42 dBC)
Dodson Residence - Octave Band Sound Levels
Sunday, October 3, 2010
source of tonal component unknown

0
10
20
30
40
50
60
70
80
90
6.3 12.5 25 50 100 200 400 800 1600 3150 6300 12500
1/3 octave band center frequency (Hz)
soun
d pr
essu
re le
vel (
dB re
: 20 μP
a)
L90 - Eisenberg Residence, 12:10 AM (32 dBA), (38 dBC)
Eisenberg Residence - One Third Octave Band Sound Levels
Monday, October 4, 2010
0
10
20
30
40
50
60
70
80
90
8 16 31.5 63 125 250 500 1000 2000 4000 8000 16000
octave band center frequency (Hz)
soun
d pr
essu
re le
vel (
dB re
: 20 μP
a)
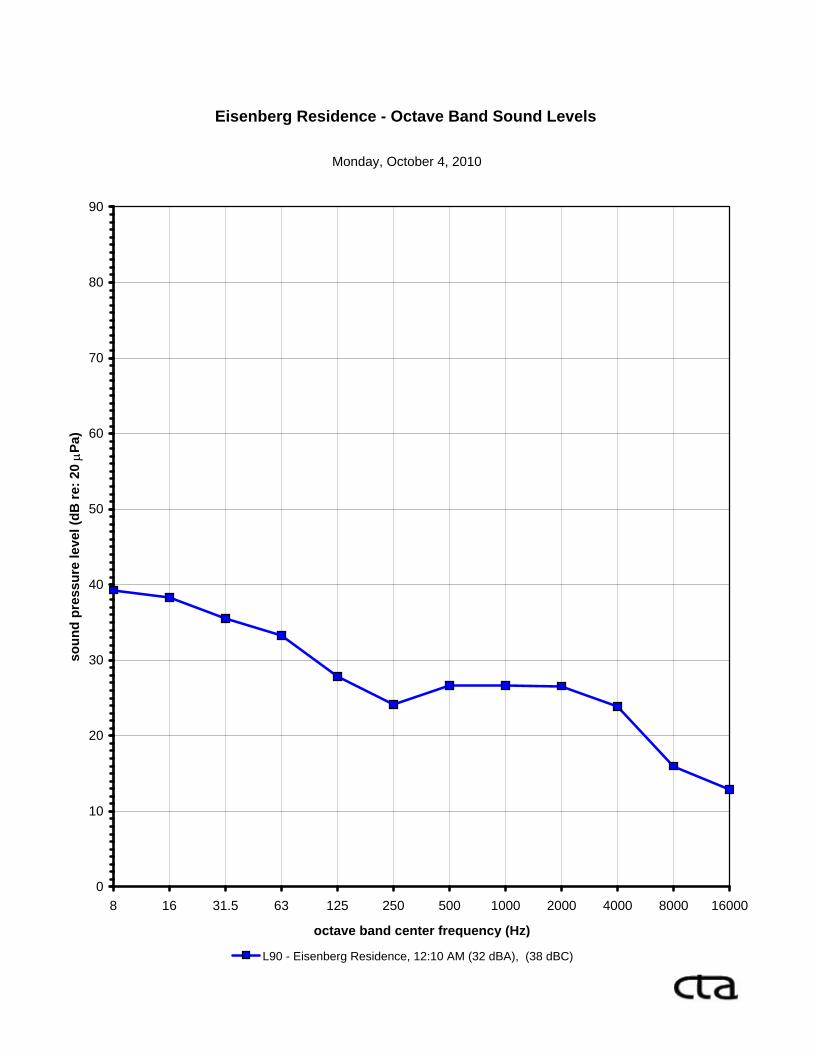
L90 - Eisenberg Residence, 12:10 AM (32 dBA), (38 dBC)
Eisenberg Residence - Octave Band Sound Levels
Monday, October 4, 2010

0
10
20
30
40
50
60
70
80
90
6.3 12.5 25 50 100 200 400 800 1600 3150 6300 12500
1/3 octave band center frequency (Hz)
soun
d pr
essu
re le
vel (
dB re
: 20 μP
a)
L90 - Wells Residence, 12:34 AM (22 dBA), (38 dBC)
Wells Residence - One Third Octave Band Sound Levels
Monday, October 4, 2010
0
10
20
30
40
50
60
70
80
90
8 16 31.5 63 125 250 500 1000 2000 4000 8000 16000
octave band center frequency (Hz)
soun
d pr
essu
re le
vel (
dB re
: 20 μP
a)
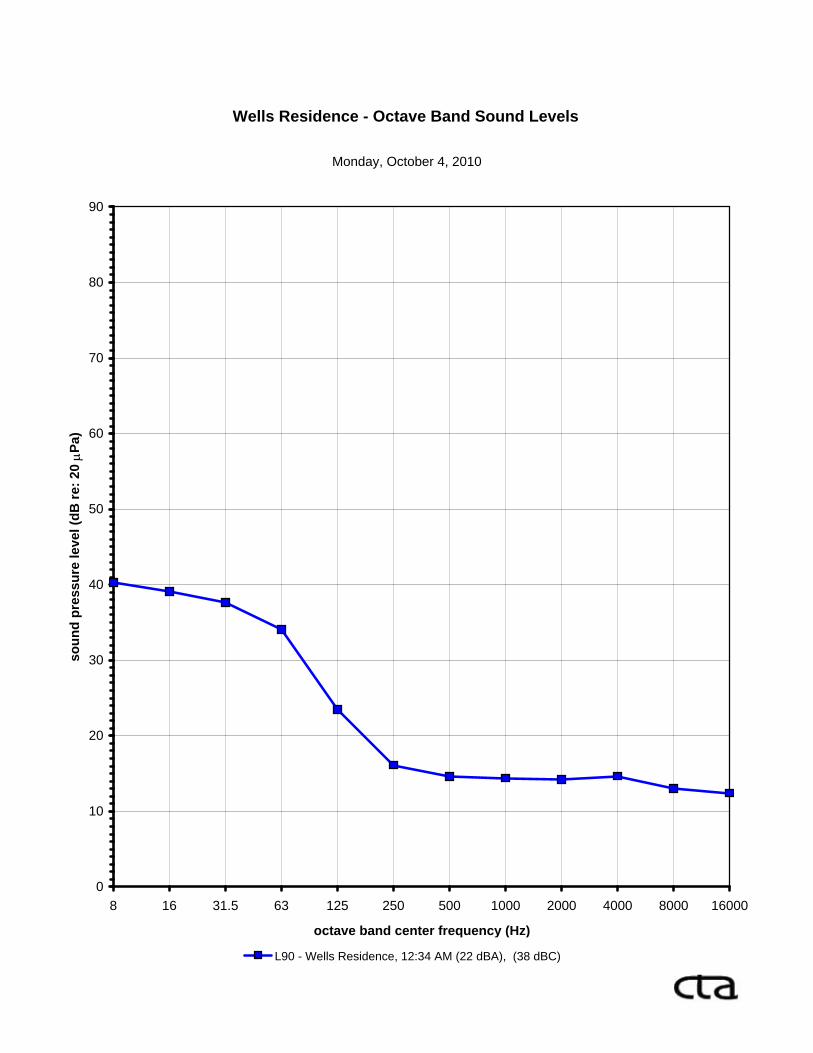
L90 - Wells Residence, 12:34 AM (22 dBA), (38 dBC)
Wells Residence - Octave Band Sound Levels
Monday, October 4, 2010
0
10
20
30
40
50
60
70
80
90
6.3 12.5 25 50 100 200 400 800 1600 3150 6300 12500
1/3 octave band center frequency (Hz)
soun
d pr
essu
re le
vel (
dB re
: 20 μP
a)
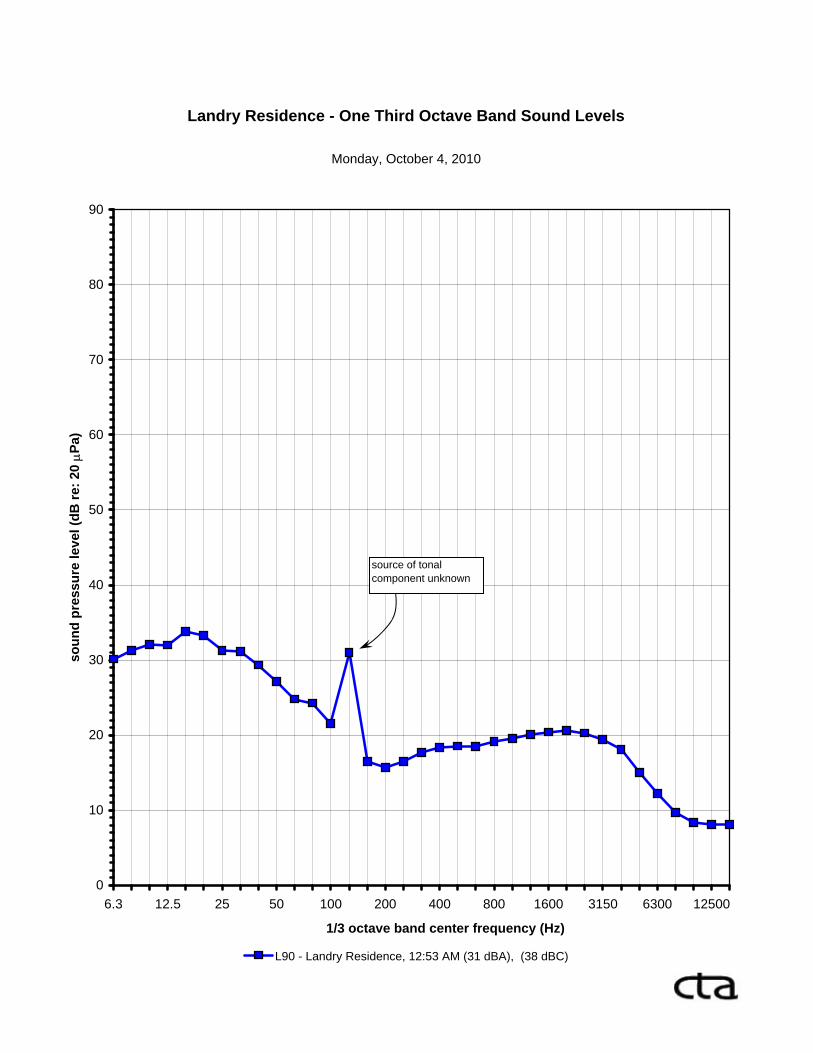
L90 - Landry Residence, 12:53 AM (31 dBA), (38 dBC)
Landry Residence - One Third Octave Band Sound Levels
Monday, October 4, 2010
source of tonal component unknown
0
10
20
30
40
50
60
70
80
90
8 16 31.5 63 125 250 500 1000 2000 4000 8000 16000
octave band center frequency (Hz)
soun
d pr
essu
re le
vel (
dB re
: 20 μP
a)
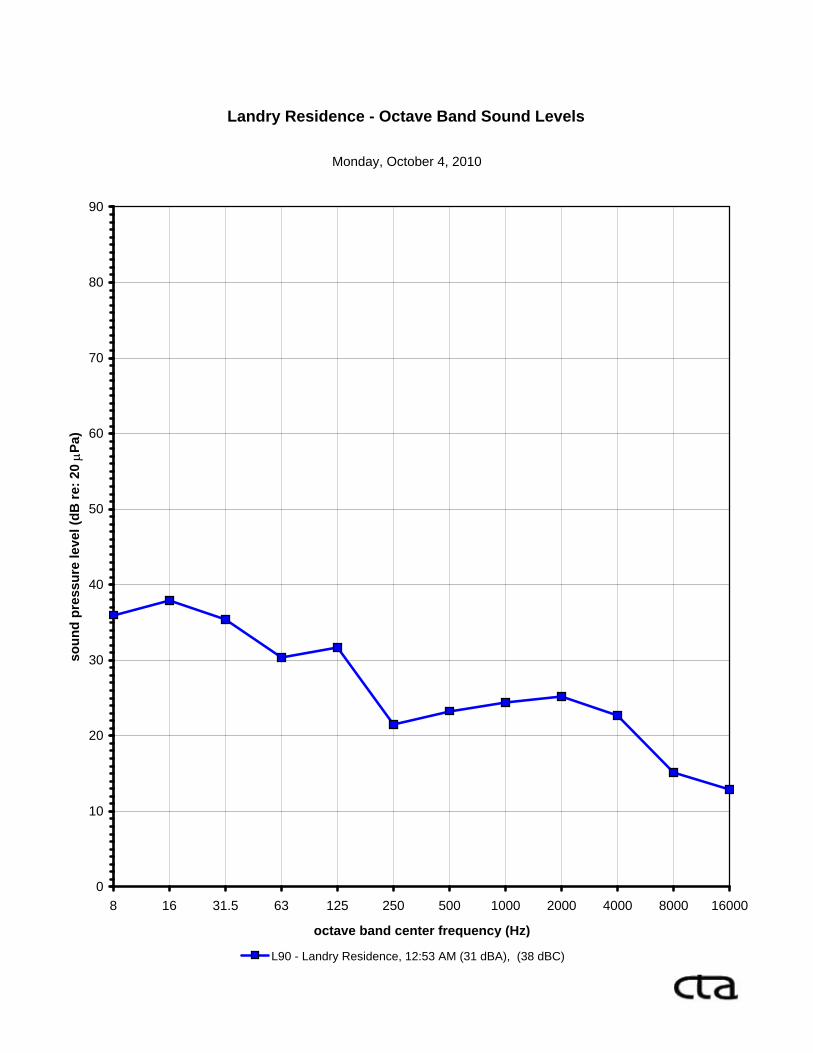
L90 - Landry Residence, 12:53 AM (31 dBA), (38 dBC)
Landry Residence - Octave Band Sound Levels
Monday, October 4, 2010

0
10
20
30
40
50
60
70
80
90
6.3 12.5 25 50 100 200 400 800 1600 3150 6300 12500
1/3 octave band center frequency (Hz)
soun
d pr
essu
re le
vel (
dB re
: 20 μP
a)
L90 - Garvin Residence, 1:12 AM (34 dBA), (41 dBC)
Garvin Residence - One Third Octave Band Sound Levels
Monday, October 4, 2010

0
10
20
30
40
50
60
70
80
90
8 16 31.5 63 125 250 500 1000 2000 4000 8000 16000
octave band center frequency (Hz)
soun
d pr
essu
re le
vel (
dB re
: 20 μP
a)
L90 - Garvin Residence, 1:12 AM (34 dBA), (41 dBC)
Garvin Residence - Octave Band Sound Levels
Monday, October 4, 2010
0
10
20
30
40
50
60
70
80
90
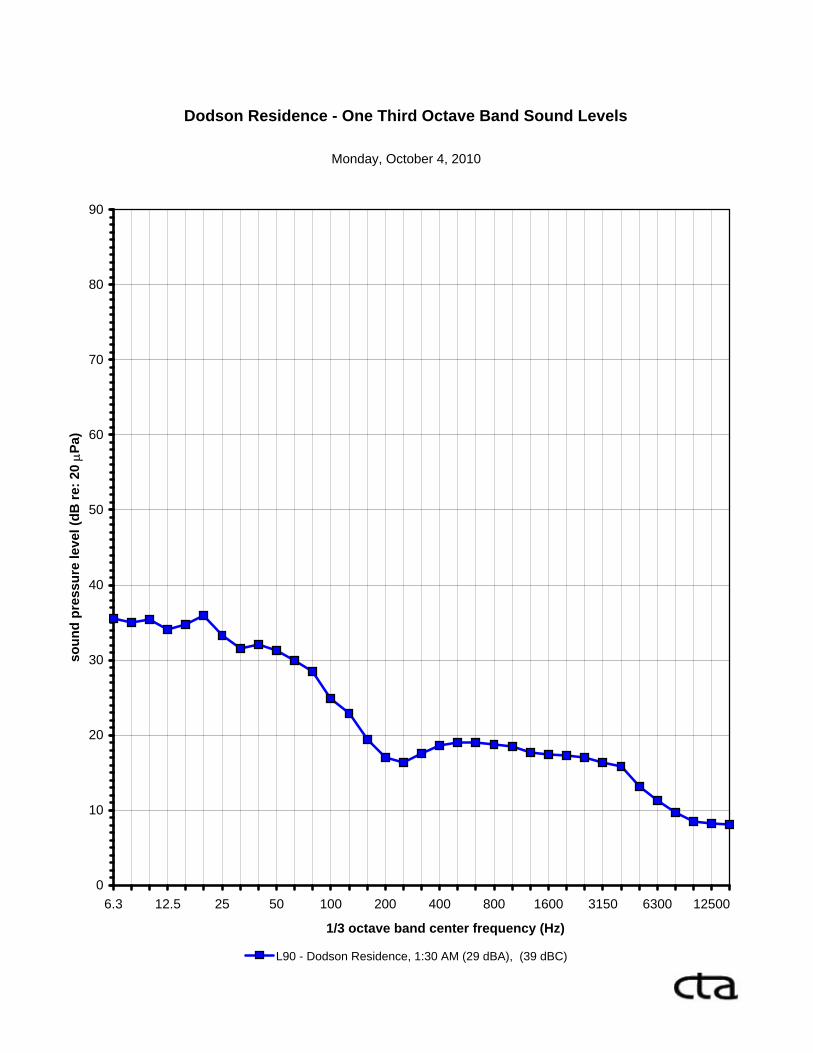
6.3 12.5 25 50 100 200 400 800 1600 3150 6300 12500
1/3 octave band center frequency (Hz)
soun
d pr
essu
re le
vel (
dB re
: 20 μP
a)
L90 - Dodson Residence, 1:30 AM (29 dBA), (39 dBC)
Dodson Residence - One Third Octave Band Sound Levels
Monday, October 4, 2010

0
10
20
30
40
50
60
70
80
90
8 16 31.5 63 125 250 500 1000 2000 4000 8000 16000
octave band center frequency (Hz)
soun
d pr
essu
re le
vel (
dB re
: 20 μP
a)
L90 - Dodson Residence, 1:30 AM (29 dBA), (39 dBC)
Dodson Residence - Octave Band Sound Levels
Monday, October 4, 2010

0
10
20
30
40
50
60
70
80
90
6.3 12.5 25 50 100 200 400 800 1600 3150 6300 12500
1/3 octave band center frequency (Hz)
soun
d pr
essu
re le
vel (
dB re
: 20 μP
a)
L90 - Eisenberg Residence, 9:27 AM (35 dBA), (44 dBC)
Eisenberg Residence - One Third Octave Band Sound Levels
Monday, October 4, 2010
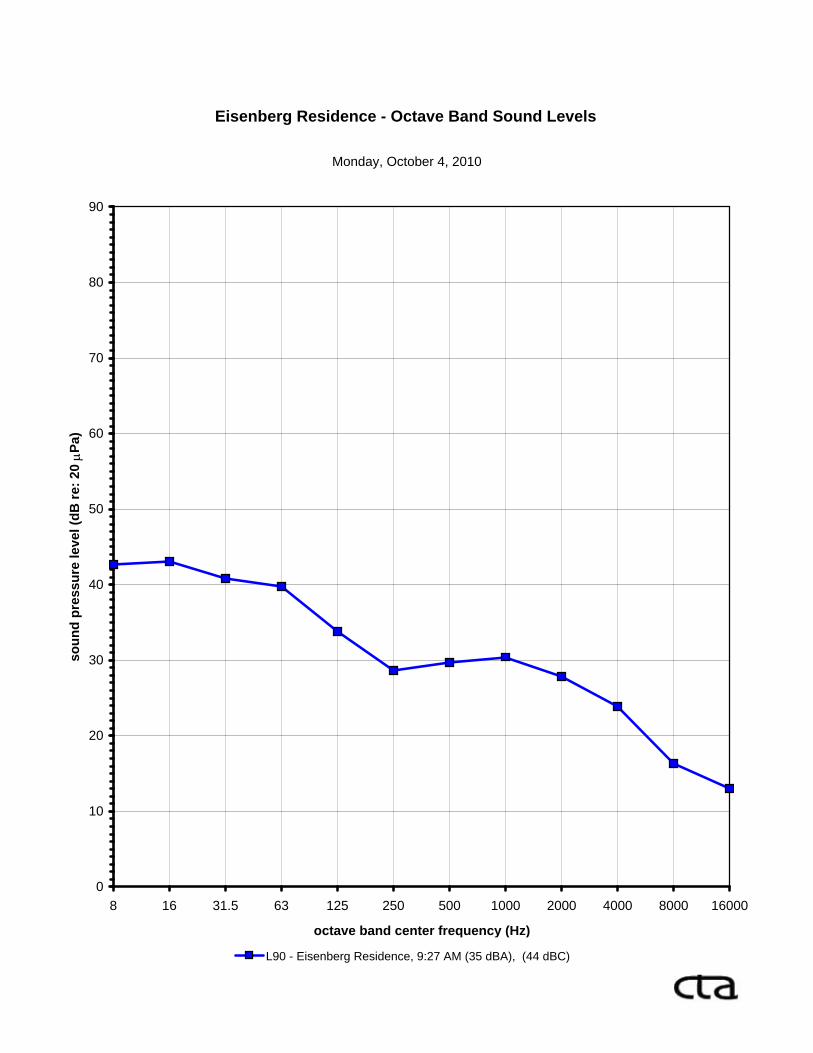
0
10
20
30
40
50
60
70
80
90
8 16 31.5 63 125 250 500 1000 2000 4000 8000 16000
octave band center frequency (Hz)
soun
d pr
essu
re le
vel (
dB re
: 20 μP
a)
L90 - Eisenberg Residence, 9:27 AM (35 dBA), (44 dBC)
Eisenberg Residence - Octave Band Sound Levels
Monday, October 4, 2010

0
10
20
30
40
50
60
70
80
90
6.3 12.5 25 50 100 200 400 800 1600 3150 6300 12500
1/3 octave band center frequency (Hz)
soun
d pr
essu
re le
vel (
dB re
: 20 μP
a)
L90 - Wells Residence, 10:09 AM (26 dBA), (41 dBC)
Wells Residence - One Third Octave Band Sound Levels
Monday, October 4, 2010

0
10
20
30
40
50
60
70
80
90
8 16 31.5 63 125 250 500 1000 2000 4000 8000 16000
octave band center frequency (Hz)
soun
d pr
essu
re le
vel (
dB re
: 20 μP
a)
L90 - Wells Residence, 10:09 AM (26 dBA), (41 dBC)
Wells Residence - Octave Band Sound Levels
Monday, October 4, 2010
0
10
20
30
40
50
60
70
80
90
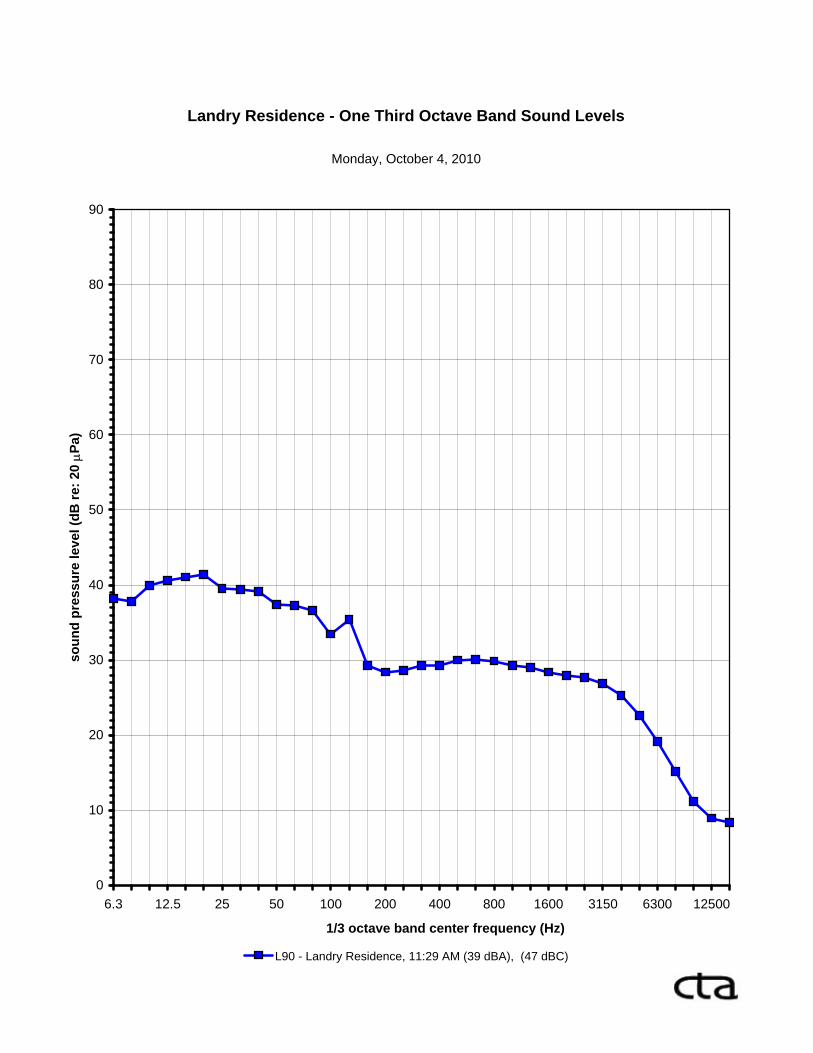
6.3 12.5 25 50 100 200 400 800 1600 3150 6300 12500
1/3 octave band center frequency (Hz)
soun
d pr
essu
re le
vel (
dB re
: 20 μP
a)
L90 - Landry Residence, 11:29 AM (39 dBA), (47 dBC)
Landry Residence - One Third Octave Band Sound Levels
Monday, October 4, 2010
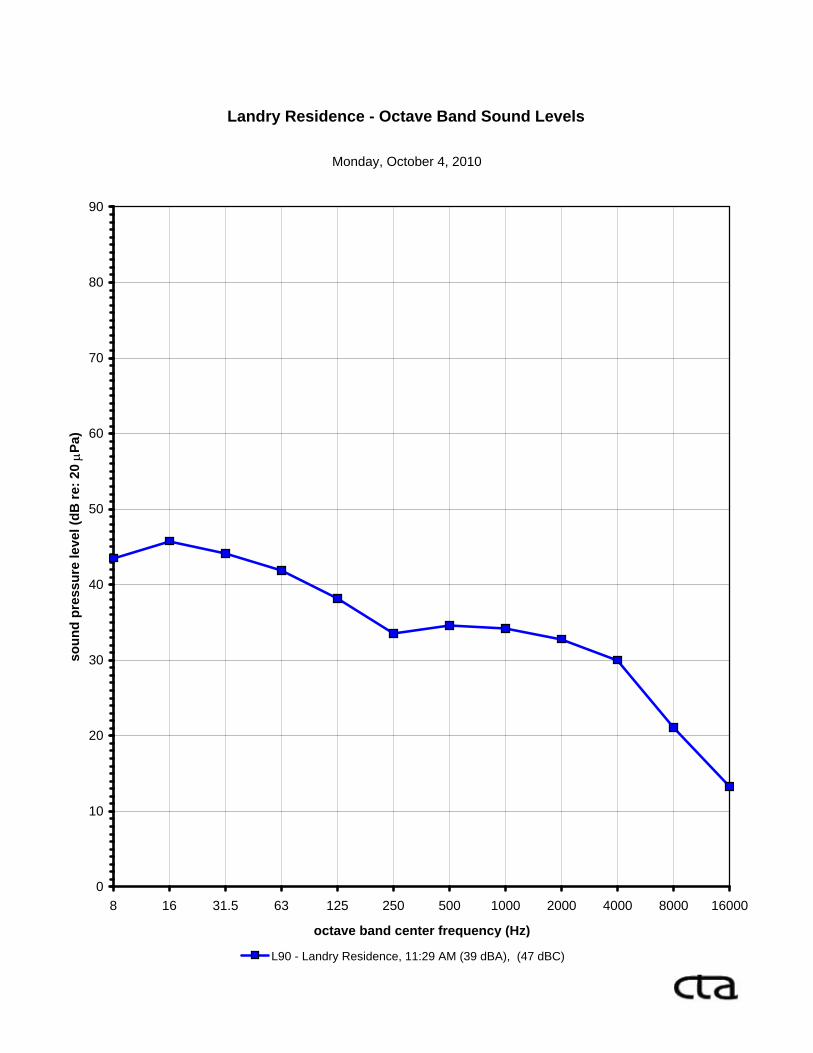
0
10
20
30
40
50
60
70
80
90
8 16 31.5 63 125 250 500 1000 2000 4000 8000 16000
octave band center frequency (Hz)
soun
d pr
essu
re le
vel (
dB re
: 20 μP
a)
L90 - Landry Residence, 11:29 AM (39 dBA), (47 dBC)
Landry Residence - Octave Band Sound Levels
Monday, October 4, 2010

0
10
20
30
40
50
60
70
80
90
6.3 12.5 25 50 100 200 400 800 1600 3150 6300 12500
1/3 octave band center frequency (Hz)
soun
d pr
essu
re le
vel (
dB re
: 20 μP
a)
L90 - Garvin Residence, 11:47 AM (39 dBA), (49 dBC)
Garvin Residence - One Third Octave Band Sound Levels
Monday, October 4, 2010
0
10
20
30
40
50
60
70
80
90
8 16 31.5 63 125 250 500 1000 2000 4000 8000 16000
octave band center frequency (Hz)
soun
d pr
essu
re le
vel (
dB re
: 20 μP
a)
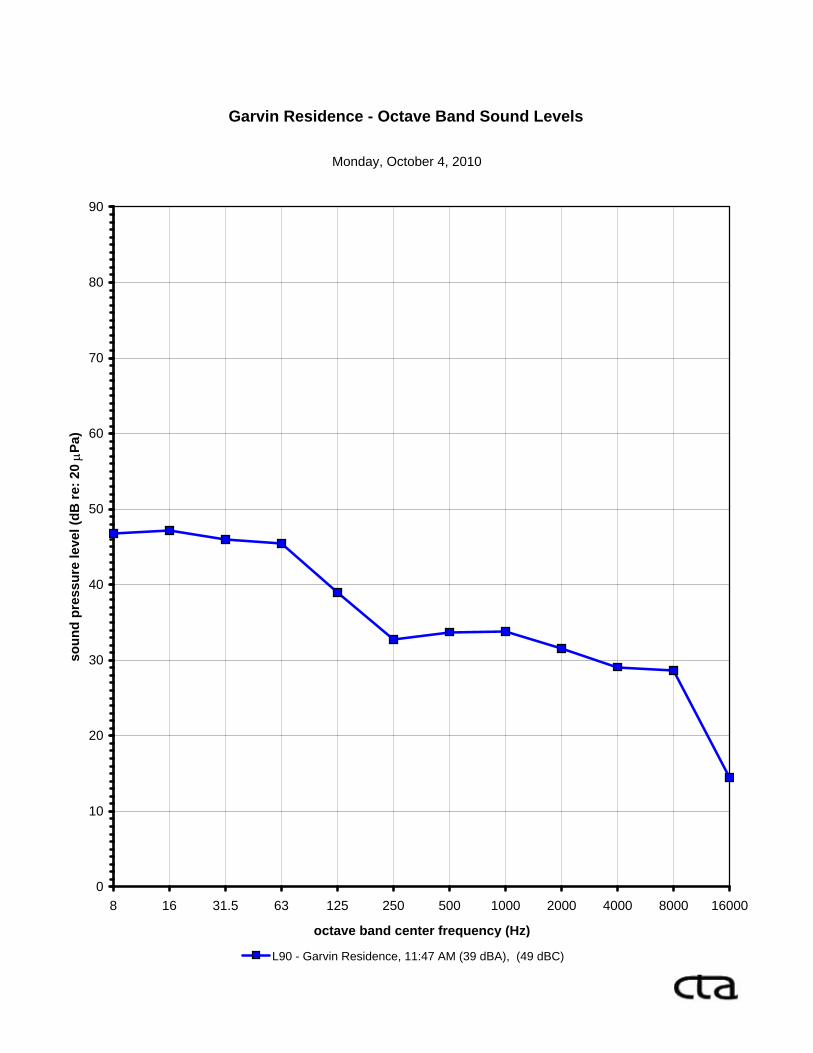
L90 - Garvin Residence, 11:47 AM (39 dBA), (49 dBC)
Garvin Residence - Octave Band Sound Levels
Monday, October 4, 2010
0
10
20
30
40
50
60
70
80
90
6.3 12.5 25 50 100 200 400 800 1600 3150 6300 12500
1/3 octave band center frequency (Hz)
soun
d pr
essu
re le
vel (
dB re
: 20 μP
a)
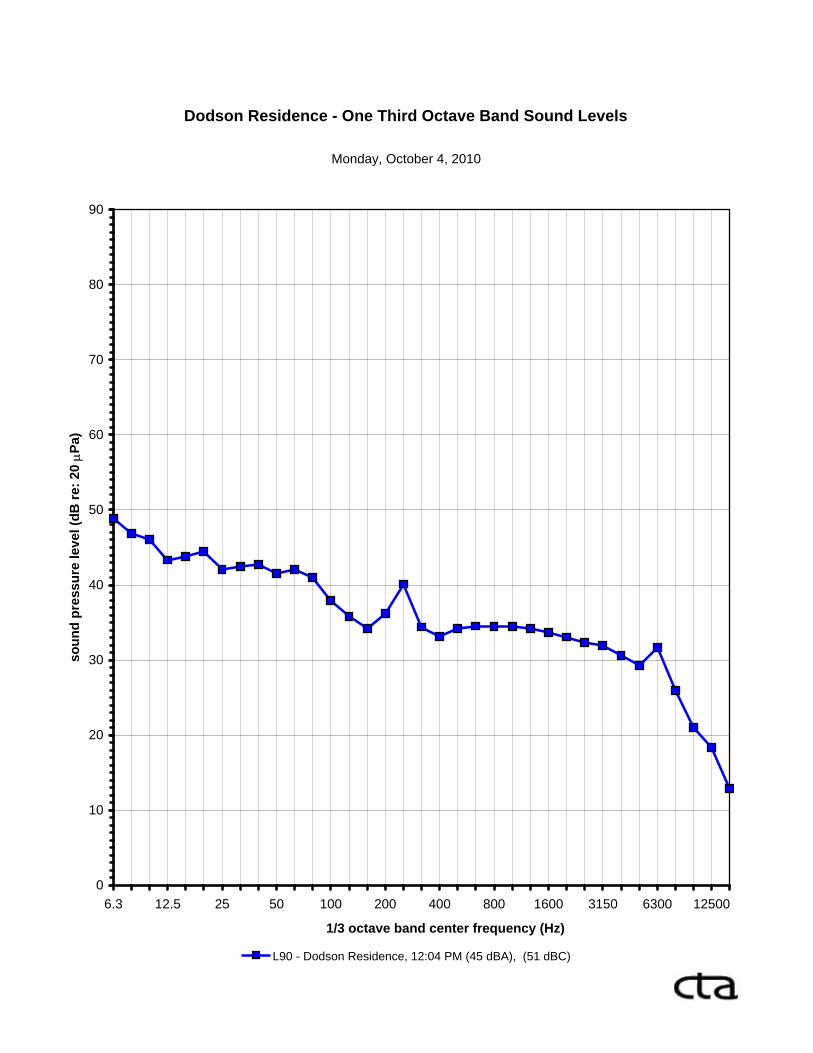
L90 - Dodson Residence, 12:04 PM (45 dBA), (51 dBC)
Dodson Residence - One Third Octave Band Sound Levels
Monday, October 4, 2010

0
10
20
30
40
50
60
70
80
90
8 16 31.5 63 125 250 500 1000 2000 4000 8000 16000
octave band center frequency (Hz)
soun
d pr
essu
re le
vel (
dB re
: 20 μP
a)
L90 - Dodson Residence, 12:04 PM (45 dBA), (51 dBC)
Dodson Residence - Octave Band Sound Levels
Monday, October 4, 2010
Related Documents