1 | Page CAUSES OF RURAL-URBAN MIGRATION AND EMPLOYMENT CHALLENGES IN URBAN ETHIOPIAN: (A Case Study of South Wollo Administrative Zone) Dr.ABEBE FENTAW NEBEBE (Ph.D) 1 Abstract The internal migration has become a major issue of influencing government policies and program efforts. Thus, the main objective of the study is to analyze the socio-economic factors associated with the movement of rural-urban migration and employment challenges in urban Ethiopia. A total of 400 both rural-urban and urban-urban migrants were covered in the three purposively selected urban areas. Of all migrated population, 72% of them migrated from rural areas while 28 percent was within-urban migration. The Binary logistic model was chosen as an appropriate model and the dependent variable (y * i ) is binary which takes 1 for migrants mainly who migrated from rural to urban area, 0 otherwise. The coefficient of distance from birth area is negatively related with the dependent variable (rural-urban migration) and as distance from place of origin decreases, migrants are more likely to be expected to be pulled towards urban areas compared to migrants from remote rural areas. Conversely, the coefficients of illiterate, adult and religious, primary, high school and preparatory education levels, reasons for migration; (to seek employment, advancing in education, shortage of agricultural land, job transfer) and source of information are positively associated with rural migration and the likelihood of moving out from rural areas increases by 24.57%, 26.68%, 27.24%, 27.05%, 27.54%, 24.43%, 23.91%, and 23.73%, 9.77% respectively. This implies that not only more educated, but also illiterate and less educated migrants are more likely to be pulled toward urban areas and the main causes for rural-urban migration in the study are found to be economic factors, which is in line with the Harris Todaro model of rural-urban migration. Subsequently, the study proposes generating more employment opportunities through self- employment and wage employment opportunities to be created simultaneously both in rural and urban areas. Moreover, the rural development policies should pave the opportunities to enable youth migrants to involve in farm and nonfarm investments. The poor should participate in the new productive safety- net program similar to urban areas, or expanding the food-for-program apart from creating permanent job opportunities in labor-intensive public works so as to reduce the role of push factors. Education is one of the significant characteristics inducing rural-urban migration. Besides, technical and Vocational Educational Training (TEVT) should be given for rural migrants to equip them with the necessary skills and make them competitive in the non-farm labor market. KEYWORDS: Rural-Urban Migration, South Wollo, Ethiopia, Employment Challenges 1 Assistant professor in Economics at Wollo University, Dessie Ethiopia IJISET - International Journal of Innovative Science, Engineering & Technology, Vol. 7 Issue 4, April 2020 ISSN (Online) 2348 – 7968 | Impact Factor (2019) – 6.248 www.ijiset.com

Welcome message from author
This document is posted to help you gain knowledge. Please leave a comment to let me know what you think about it! Share it to your friends and learn new things together.
Transcript

1 | P a g e
CAUSES OF RURAL-URBAN MIGRATION AND EMPLOYMENT CHALLENGES IN URBAN ETHIOPIAN:
(A Case Study of South Wollo Administrative Zone)
Dr.ABEBE FENTAW NEBEBE (Ph.D)1
Abstract
The internal migration has become a major issue of influencing government policies and program
efforts. Thus, the main objective of the study is to analyze the socio-economic factors associated with
the movement of rural-urban migration and employment challenges in urban Ethiopia. A total of 400
both rural-urban and urban-urban migrants were covered in the three purposively selected urban
areas. Of all migrated population, 72% of them migrated from rural areas while 28 percent was
within-urban migration. The Binary logistic model was chosen as an appropriate model and the
dependent variable (y*i) is binary which takes 1 for migrants mainly who migrated from rural to
urban area, 0 otherwise. The coefficient of distance from birth area is negatively related with the
dependent variable (rural-urban migration) and as distance from place of origin decreases, migrants
are more likely to be expected to be pulled towards urban areas compared to migrants from remote
rural areas. Conversely, the coefficients of illiterate, adult and religious, primary, high school and
preparatory education levels, reasons for migration; (to seek employment, advancing in education,
shortage of agricultural land, job transfer) and source of information are positively associated with
rural migration and the likelihood of moving out from rural areas increases by 24.57%, 26.68%,
27.24%, 27.05%, 27.54%, 24.43%, 23.91%, and 23.73%, 9.77% respectively. This implies that not
only more educated, but also illiterate and less educated migrants are more likely to be pulled toward
urban areas and the main causes for rural-urban migration in the study are found to be economic
factors, which is in line with the Harris Todaro model of rural-urban migration.
Subsequently, the study proposes generating more employment opportunities through self-
employment and wage employment opportunities to be created simultaneously both in rural and
urban areas. Moreover, the rural development policies should pave the opportunities to enable youth
migrants to involve in farm and nonfarm investments. The poor should participate in the new
productive safety- net program similar to urban areas, or expanding the food-for-program apart
from creating permanent job opportunities in labor-intensive public works so as to reduce the role of
push factors. Education is one of the significant characteristics inducing rural-urban migration.
Besides, technical and Vocational Educational Training (TEVT) should be given for rural migrants to
equip them with the necessary skills and make them competitive in the non-farm labor market.
KEYWORDS: Rural-Urban Migration, South Wollo, Ethiopia, Employment Challenges
1 Assistant professor in Economics at Wollo University, Dessie Ethiopia
IJISET - International Journal of Innovative Science, Engineering & Technology, Vol. 7 Issue 4, April 2020ISSN (Online) 2348 – 7968 | Impact Factor (2019) – 6.248
www.ijiset.com
2 | P a g e
1. Introduction
Migration is a basic major component of population dynamics which is characterized by the
deliberate rational decision of the migrant, whereas international migration exacts some forms of
checks and limit on intending migrants, internal migration on the other hand is easily more
achievable. As the most developing countries of the world, internal migration has become a major
issue of influencing government policies and program efforts. Crucial among these issues are
problems of unplanned urbanization, growing urban crimes, rural poverty, neglect of agriculture and
unbalanced population concentration. These suggest the effect of the dominant pattern of rural-urban
migration and its effect on national life.
However, Ethiopia is urbanizing very fast, but it started from a low base compared to other
developing countries. While it has a high rate of urbanization (estimated at 4.4% per year), the level
of urbanization is still very low, even, considering Africa standards, (2014). Only 19% of the
population resided in urban areas of at least 2,000 people. For the whole Africa, Sub-Saharan and
East African Countries, however, the percentage was 40%, 37% and 25%, in their order.. The urban
population is expected to reach 22 million people by 2020, based on the 4.4% estimated annual
growth rate (PASDEP 2006 cited in Muzzi 2008).
However, until recently, researchers have not paid much attention to the rural –urban drift and
employment challenges in urban centres in Africa in general and in Ethiopia in particular, except
very few researches conducted on the causes of internal migration in Ethiopian and Africa. The
essence of this research work is, therefore, to identify the causes of rural migration and whether the
newly arrived rural-urban migrant is left out in the bitter in terms of employment opportunities.
Analysis involves estimation of a binary logistic model to examine socioeconomic factors associated
with rural-urban migration to identify whether or not the migrant is more likely to have adverse
employment prospects in urban Ethiopia.
Objective
The objective of the study is to analyze the socio-economic factors associated with the movement of
rural-urban migration and employment challenges in urban Ethiopia: A case study of South Wollo
Administrative Zone, Amhara National Regional State.
The remainder of this paper is organized as follows: Section 2 describes the theoretical and empirical
review, in the existing literature, vis-à-vis the situation and factors associated with the causes of
rural-urban migration. Section 3 highlights the nature of data and methodological issues. Results and
discussions are present in section 4 which shows the detailed analysis of factors associated with the
causes of rural migration and employment challenges. Finally, Section 5 summarizes the findings of
and policy recommendations of the study.
IJISET - International Journal of Innovative Science, Engineering & Technology, Vol. 7 Issue 4, April 2020ISSN (Online) 2348 – 7968 | Impact Factor (2019) – 6.248
www.ijiset.com
3 | P a g e
2. Literature and Empirical Review
The process of economic development has usually been seen as a transformation of the rural
agricultural sector of the urban manufacturing sector. This process, in the two sectors is driven by
labor migration and capital accumulation. According to W.Arthur Lewis in his work on ‘Economic
development with unlimited supplies of labor’ (1954) analyzed the labor market dualism and the
structural difference between the subsistence sector and capitalistic sector in developing economies.
The two sectors in the Lewis model were named as subsistence and capitalistic sectors originally and
then they were renamed as traditional and modern sectors. The Lewis model was also formalized and
extended by John Fei and Gus Ranis in 1961 and the combination is named as the Lewis Ranis and
Fei (LRF) model. The model, which takes to account the context of developing countries, explains a
dual economy model of economic development with an assumption that there exists surplus labor in
the traditional (agricultural) sector, which is to be re-allocated to fill the rising modern (urban) sector
labor demands. This means that the loss of labor in the traditional agriculture sector does not reduce
agricultural production as a result of migration of labor to the modern sector. The traditional
agricultural sector is characterized by low wages and very low/ zero marginal productivity of
workers.
Hence, the labor in the modern manufacturing sector has a positive marginal product and because of
incentives in the modern sector individuals in traditional sector is motivated to migrate to the modern
manufacturing sector. The model also points out the importance of surplus labor in generating inter-
sectoral shift of employment and then triggering economic growth without increase in real wages in
the formal sector. As pointed out by Ranis4 (2004), the dual economy model continued to be relevant
and an important policy guide for labor abundant countries with heavy population pressure and
scarcity of cultivable land.
However, Oded Stark and David E Bloom in 1985 realized the concept of the New Economics of
Labor Migration (NELM) model which provides a new insight by shifting the way how the migration
decision is made and by linking rural-urban migration with development as described below. The
NELM model shifts the focus of migration model from individual to mutual affair where migration
decisions are influenced by other actors, i.e. by households or families. The decision to migrate is a
collective action done by the migrants themselves and their families, where the head of the family
takes a lead in the decision making process. According to the model, variations in the characteristics
of a household and its members can potentially affect the earnings of household members as well as
the motivations of migrants to remit part of their earnings to the household.
Nevertheless, the NELM model has brought a new direction in migration research; it has also been
criticized by some scholars by Cortes (2007) as well as Folbre (1986), the household model
emphasized on the strong cooperative bonds among household members and considers households as
a single unit but neglecting the conflicts and inequalities of power existing within a household. The
other phenomenon is regarded migration networks. Distorted information about the host region,
which is transmitted via networks in the destination, can mislead potential migrants. Absence of
IJISET - International Journal of Innovative Science, Engineering & Technology, Vol. 7 Issue 4, April 2020ISSN (Online) 2348 – 7968 | Impact Factor (2019) – 6.248
www.ijiset.com
4 | P a g e
networks and contacts in destination region can also make potential migrants not to access the right
information and depend entirely on their families for transportation and adjustment costs. This in turn
increases the cost of migration and then affecting the decision to migrate.
There are several reasons for population mobility from place to place. The causes of migration are
usually identified as two broad categories, namely “pushing” and “pulling” factors. People of a
certain area may be pushed off by poverty and other natural factor to move towards towns for
employment. On the other hand, better employment opportunities or the need for better facilities in
urban areas may also pull people to different urban areas. In addition, the decision to migrate from
one place to another may also be influenced by non-economic factors such as the need to join
relatives, the need to be free from cultural and family restriction and obligation and so on. In general,
however, as to the causes of migration scholars conclude that migration is a response of humans to a
series of economic and non-economic factors (Lewis, 1982; Todaro, 1997).
A research conducted by Birhan A. M (2011) in North Wollo zone identified that a large number of
migrants were single (unmarried) when they came to Woldiya town. The dominant divorcees and
widowers were females in at rural origin. Most of the migrants had formal education. However, more
males than females had formal educations in both migrants of urban and rural origin. A greater
number of migrants were either students/trainees or unemployed or sick/disabled before they migrate
to Woldiya. Among the employed most of them were farmers. Most migrants moved basically for
economic reasons such as seeking employment, job transfer, to open up or extend personal business,
to gain education and training services. On the other hand, some of them were moved to Woldiya for
non-economic reasons, such as to be free from cultural or family restriction and obligation, and to
join relatives or friends in the town.
According to the research examined by Niels, et al, 2015, the internal migration in Ethiopia is
focused on the linkages among internal migration, education and wages. Descriptive statistics
indicate that migrants are better off than non-migrants on average in terms of both their education
and their wages. When moving to the multivariate analysis, these preliminary results are
strengthened: not only do migrants also obtain higher wages when other factors (including education)
are controlled for, they also obtain higher returns to their education than non-migrant, controlling for
other factors. That is, the results suggest that the more educated are the winners from increased
migration, while the less educated are the losers. That is, “the winner takes it all”: the more educated
reap higher returns both from benefitting more from migration and from being better educated to
begin with, leaving the less educated—especially among the migrant population—as the losers.
The study conducted by Fasil E and Mohammed B (2017) had examined the central characteristics of
migrants and determinants of rural-urban migration in Southern Ethiopia based on the snow ball
sampling and a survey of 665 sample migrants using descriptive and econometric analysis. The
study finding revealed that individuals who were young, educated and unmarried tend to be more
mobile; they seek works that match their age, higher skills and experiences and which pay the return
on education costs incurred. The results of Probit regression analysis model also indicated that age,
years of schooling, relatives at receiving areas, monthly income at sending areas and family size
significantly affect rural-urban migration.
IJISET - International Journal of Innovative Science, Engineering & Technology, Vol. 7 Issue 4, April 2020ISSN (Online) 2348 – 7968 | Impact Factor (2019) – 6.248
www.ijiset.com

5 | P a g e
However, until recently, researchers have not paid much attention to the causes of rural –urban flow
in line with their employment challenges in urban centres in Africa in general and in Ethiopia in
particular, except very few researches conducted on the causes of internal migration in Ethiopian and
Africa. The essence of this research work is, therefore, to identify the causes of rural migration and
whether the newly arrived rural-urban migrant is left out in the bitter in terms of employment
opportunities.
3. Data, Methods and Model Specification
3.1.Data Type and Source The data used in this study has come from a primary individual survey conducted by the researcher
from three cities ( Dessie, Kombolcha and Hayq) of South Wollo Administrative Zone. Data
collection process undertakes through a face to face (personal) interview and group discussion with
purposively selected both urban-urban and rural-urban migrants in the study areas. A total of 400
internal migrants were included in the survey. In addition to the primary data collected using the
household survey, pertinent documents such as books, previous working literatures and policy
evaluation reports, statistics, and checklists of facts and figures and unpublished materials were
utilized.
3.2.Sampling Techniques There are various sampling techniques; the non-probability sampling (purposive and snowball
sampling) and probability sampling. In this research, therefore, the emphasis was given to non-
probability sampling specifically on purposive and snowball sampling procedures. It is the most
common methods of sampling, it is “walk and ask”, used when the universe/ population is not clearly
defined and sampling units or it may be difficult to identify the sampling frame or a complete source
list of units (the names of all items) in kebele2 registry office. Only migrants were purposively
selected in more crowded and slum areas, in the street, open market areas, construction sites,
employment agency offices, bars and restaurants, individual houses, informal business operators,
causal workers, housemaids etc were assumed to be found and were interviewed to talk based on
their sex, varying age group, marital status and above all their potential to say what they would have
had in their life-their ability to share factor for their migration, livelihood and their life experiences at
large. Accordingly, a purposive sampling technique used to sample 400 migrants in some selected
cities of South Wollo Administrative zone. The reference period for the study were 2017/18 and
2018/19
In south wollo administrative, there are two major and medium / emerging cities (Dessie and
Kombolcha) and 16 small district towns/ cities. For this reason, the study was following a multistage
sampling technique. In the first stage of sampling technique the central part, more crowded and slum
areas/ cities, etc., Dessie, Kombolcha and Hayq, were directly selected according to their population
size and number of migrants and the proportion of migrant households engaged in non agricultural
activities to represent major, medium and small cities/district centers for the purpose of intensive
rural- urban migration analysis.
2 Kebelle is the smallest administrative unit in Ethiopia
IJISET - International Journal of Innovative Science, Engineering & Technology, Vol. 7 Issue 4, April 2020ISSN (Online) 2348 – 7968 | Impact Factor (2019) – 6.248
www.ijiset.com
6 | P a g e
In the second stage more crowded and slum areas of Kebeles were also purposefully selected from a
list of cables in each town by excluding the expansion and rural kebeles. That is 6 (1,2,3, 6, 9 and
10 out of 15) in Dessie, in kombolcha 3 (2,3 & 5 out of 5), and in Hayq 3 (1, 2, 5, out of 5) central
slum and very crowded urban kebeles were selected, respectively
For simplicity, therefore, the researcher used the survey result of CSA (2013) and appropriate sample
size formulae of Fowler (2001) for finite population, which is indicated by as follows. Among recent
migrants (those who migrated in the last five years before the survey), rural to urban migrants
account for 39%, while the rural to rural migrants account for only 27%.
In the third stage, the above predetermined total sample size of 420 migrants was determined as
follows in the study areas.
2
2
2/ 1
E
ppzn
(1)
Where N=size of households, n= number of surveyed population; Zα/2 = the two-tailed critical value
at 95 percent confidence interval (2.1); P = assumed only the share of rural-urban migration in
Ethiopia (P) =0.39), by excluding the share of urban-urban migration taking E = marginal error
between the sample and population size (0.05).
Hence the estimated sample size will be determined by using the above formula
420
)05.0(
39.0139.01.22
2
n(Approximately)
In this research, 5% margin of error is accepted as a minimum margin to cover a large sample size in
the study area and in order to be confident with a higher degree of precision.
In addition to this, since the researcher did not have any information/data/ about the exact number or
lists of rural-urban and urban-urban migration, a predetermined total sample size of n=420 was
purposefully distributed on the basis of the minimum proportion of the population (CSA, 2008) in
each city (Table 1.1). In the final analysis, for compatibility and comparability, however, it was
desirable to distinguish only between urban and rural origin of migration in the study area
Table 1. 1: Distribution of Sampled Urban Areas and Respondents
Source: Own Computation, 2019
City Population
(CSA 2008)
Actual
Proportion in%
Expected
Sample size (%) Sample size
Proportion
in %
Actual
Data
collected
Proportion
in %
Dessie 151,174 60.67 50-60 231 55 224 56.00
Kombolcha 85,367 34.26 30-35 139 33 129 32.25
Haiq 12,640 5.07 5-12 50 12 47 11.75
Total 249,181 100 100% 420 100 400 100%
IJISET - International Journal of Innovative Science, Engineering & Technology, Vol. 7 Issue 4, April 2020ISSN (Online) 2348 – 7968 | Impact Factor (2019) – 6.248
www.ijiset.com

7 | P a g e
3.3.Model Specification
3.3.1. Logit/ Probit Model for Binary Response
The Binary logistic model is chosen as an appropriate model when we assume the random
component of the response variable follows a binomial distribution and when more explanatory
variables have categorical responses Thus the dependent variable in this analysis is households’
internal/ rural-urban/ migrants. The presence of one migrant individual and above in the household
represents as migrants’ household who migrate from rural and urban to the study areas. Hence, the
dependent variable (y*i) is binary which takes 1 for migrants mainly who migrated from rural to
urban area, 0 otherwise. The analysis involves estimation of a logit model to examine factors
associated with the decision for migration
iiki uxyurbanrural i * (2)
Where ui stochastic error term which is normally distributed in logit model, that is, 2,0 Nui ;
k is vector of model parameters; and xi is a vector of independent variables, yi* is the latent variable
indicating the status of migration
The Marginal/ Partial Changes)
The marginal /partial changes/in Pr(Yi= j)for the particular variable Xk is;
J
jijkjki
k
i XjYxXjYX
jY
1
)/Pr()/Pr()Pr(
........................(3)
Note a few things about the above expression
The marginal effect varies as the function of a banch of thing, including
o The probability itself
o The value of the coefficient estimate
o The sum of the other coefficients for that covariat
This means that the
J
jijkjk XjYx
1
)/Pr( term signs the marginal effect which in turn
means that the marginal effect may or may not have the same sign as the coefficient estimate
itself. And note that the study has to calculate separately for each of the J possible outcomes for.
That is the Probability of rural-urban migration (yi=1) =)'exp(1
)'exp(
x
x
------(4)
IJISET - International Journal of Innovative Science, Engineering & Technology, Vol. 7 Issue 4, April 2020ISSN (Online) 2348 – 7968 | Impact Factor (2019) – 6.248
www.ijiset.com

8 | P a g e
4. Results and Discussion4.1.Place of Birth and the Length of Years Stay in the study Area
4.2.1. Region, Zone and Zone of Migrants
In many developing countries, the largest proportions of migrants are coming from rural areas
(Caldwe ll, 1969). This fact coincides with the rural-agrarian dominated nature of these
developing countries, where the majority of the people reside in rural localities. Ravenstein also
argues that migration is common from rural agrarian economy to urban industrialized ones
(Lewis, 1982).
For that reason, almost all migrants arrived in the study areas came from three regions and
Capital city of Ethiopia, but a considerable share came from the areas surrounding study areas,
Dessie, Kombolcha and Haiq, Amhara (96%), Oromiya (2%), Tigray (1.75%) and Addis Ababa
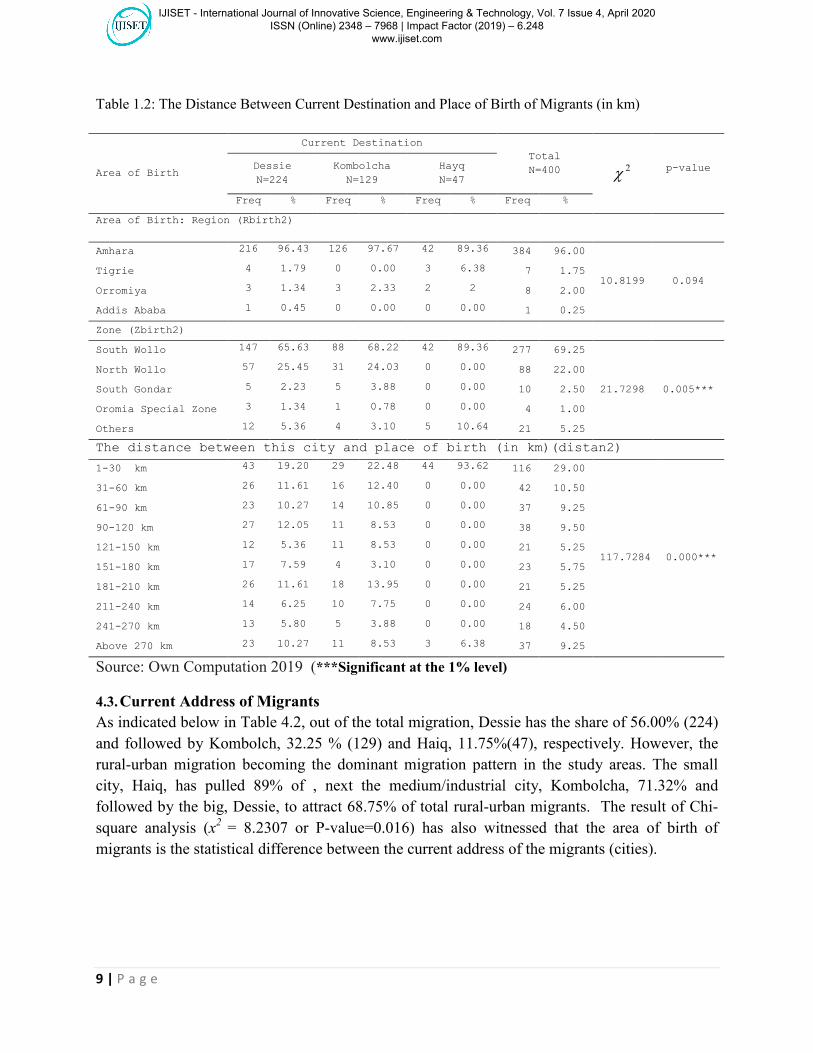
(0.25%), respectively (Table 1.2) . As a result, the results of the Chi-square (chi2=10.8199 and
p=0.094) revealed that the closer the distance is between the sending and destination areas, the
higher the rate of out migration and their difference is statistically significant at the 10 percent
level.
Among the other areas, relevant out-migration zones to the study areas are those in northern
Ethiopia:, South Wollo, South Gonder, Oromia Special zone, North Shewa, some part of Oromia
and Tigray regions, For example South Wollo 68.75%, North Wollo 22%, South Gondar 2.5%
are the main regions which contributed a lion share of all migrants living in study areas, Dessie,
Kombolcha and Hayq city Administrations (Table 1.2). Hence, the Chi-square (chi2=65.0083
and p=0.000) showed that their difference is statistically significant or there is a strong
association between zone and destination areas of migrants at 1% level. In general the number of
migrants decreases as distance from sending areas increases because increases the cost of rural-
urban migration and may reduce the wave migration. Thus, most of the migrants to the study
areas are short distance migrants and the volume of urban ward migration decreases with an
increase in distance.
IJISET - International Journal of Innovative Science, Engineering & Technology, Vol. 7 Issue 4, April 2020ISSN (Online) 2348 – 7968 | Impact Factor (2019) – 6.248
www.ijiset.com
9 | P a g e
Table 1.2: The Distance Between Current Destination and Place of Birth of Migrants (in km)
Area of Birth
Current Destination
Total
N=400 2 p-valueDessie
N=224
Kombolcha
N=129
Hayq
N=47
Freq % Freq % Freq % Freq %
Area of Birth: Region (Rbirth2)
Amhara 216 96.43 126 97.67 42 89.36 384 96.00
10.8199 0.094Tigrie 4 1.79 0 0.00 3 6.38 7 1.75
Orromiya 3 1.34 3 2.33 2 2 8 2.00
Addis Ababa 1 0.45 0 0.00 0 0.00 1 0.25
Zone (Zbirth2)
South Wollo 147 65.63 88 68.22 42 89.36 277 69.25
21.7298 0.005***
North Wollo 57 25.45 31 24.03 0 0.00 88 22.00
South Gondar 5 2.23 5 3.88 0 0.00 10 2.50
Oromia Special Zone 3 1.34 1 0.78 0 0.00 4 1.00
Others 12 5.36 4 3.10 5 10.64 21 5.25
The distance between this city and place of birth (in km)(distan2)
1-30 km 43 19.20 29 22.48 44 93.62 116 29.00
117.7284 0.000***
31-60 km 26 11.61 16 12.40 0 0.00 42 10.50
61-90 km 23 10.27 14 10.85 0 0.00 37 9.25
90-120 km 27 12.05 11 8.53 0 0.00 38 9.50
121-150 km 12 5.36 11 8.53 0 0.00 21 5.25
151-180 km 17 7.59 4 3.10 0 0.00 23 5.75
181-210 km 26 11.61 18 13.95 0 0.00 21 5.25
211-240 km 14 6.25 10 7.75 0 0.00 24 6.00
241-270 km 13 5.80 5 3.88 0 0.00 18 4.50
Above 270 km 23 10.27 11 8.53 3 6.38 37 9.25
Source: Own Computation 2019 (***Significant at the 1% level)
4.3. Current Address of Migrants
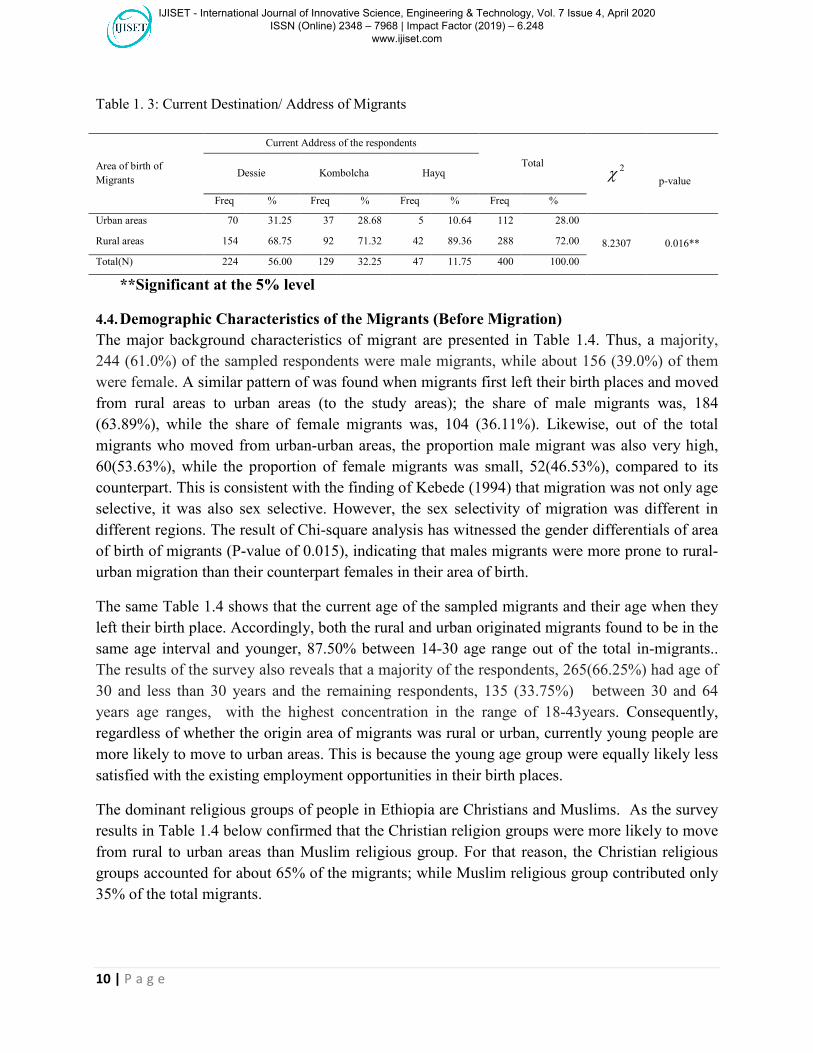
As indicated below in Table 4.2, out of the total migration, Dessie has the share of 56.00% (224)
and followed by Kombolch, 32.25 % (129) and Haiq, 11.75%(47), respectively. However, the
rural-urban migration becoming the dominant migration pattern in the study areas. The small
city, Haiq, has pulled 89% of , next the medium/industrial city, Kombolcha, 71.32% and
followed by the big, Dessie, to attract 68.75% of total rural-urban migrants. The result of Chi-
square analysis (x2 = 8.2307 or P-value=0.016) has also witnessed that the area of birth of
migrants is the statistical difference between the current address of the migrants (cities).
IJISET - International Journal of Innovative Science, Engineering & Technology, Vol. 7 Issue 4, April 2020ISSN (Online) 2348 – 7968 | Impact Factor (2019) – 6.248
www.ijiset.com
10 | P a g e
Table 1. 3: Current Destination/ Address of Migrants
Area of birth of
Migrants
Current Address of the respondents
Total 2p-value
Dessie Kombolcha Hayq
Freq % Freq % Freq % Freq %
Urban areas 70 31.25 37 28.68 5 10.64 112 28.00
8.2307 0.016** Rural areas 154 68.75 92 71.32 42 89.36 288 72.00
Total(N) 224 56.00 129 32.25 47 11.75 400 100.00
**Significant at the 5% level
4.4. Demographic Characteristics of the Migrants (Before Migration)
The major background characteristics of migrant are presented in Table 1.4. Thus, a majority,
244 (61.0%) of the sampled respondents were male migrants, while about 156 (39.0%) of them
were female. A similar pattern of was found when migrants first left their birth places and moved
from rural areas to urban areas (to the study areas); the share of male migrants was, 184
(63.89%), while the share of female migrants was, 104 (36.11%). Likewise, out of the total
migrants who moved from urban-urban areas, the proportion male migrant was also very high,
60(53.63%), while the proportion of female migrants was small, 52(46.53%), compared to its
counterpart. This is consistent with the finding of Kebede (1994) that migration was not only age
selective, it was also sex selective. However, the sex selectivity of migration was different in
different regions. The result of Chi-square analysis has witnessed the gender differentials of area
of birth of migrants (P-value of 0.015), indicating that males migrants were more prone to rural-
urban migration than their counterpart females in their area of birth.
The same Table 1.4 shows that the current age of the sampled migrants and their age when they
left their birth place. Accordingly, both the rural and urban originated migrants found to be in the
same age interval and younger, 87.50% between 14-30 age range out of the total in-migrants..
The results of the survey also reveals that a majority of the respondents, 265(66.25%) had age of
30 and less than 30 years and the remaining respondents, 135 (33.75%) between 30 and 64
years age ranges, with the highest concentration in the range of 18-43years. Consequently,
regardless of whether the origin area of migrants was rural or urban, currently young people are
more likely to move to urban areas. This is because the young age group were equally likely less
satisfied with the existing employment opportunities in their birth places.
The dominant religious groups of people in Ethiopia are Christians and Muslims. As the survey
results in Table 1.4 below confirmed that the Christian religion groups were more likely to move
from rural to urban areas than Muslim religious group. For that reason, the Christian religious
groups accounted for about 65% of the migrants; while Muslim religious group contributed only
35% of the total migrants.
IJISET - International Journal of Innovative Science, Engineering & Technology, Vol. 7 Issue 4, April 2020ISSN (Online) 2348 – 7968 | Impact Factor (2019) – 6.248
www.ijiset.com
11 | P a g e
It is quite natural that the largest proportion of the migrants has come from the same
administrative region, i.e. Amhara Region, mainly because of the proximity to the study area, the
importance of networking and cultural ties in migration decision. Thus, Table 1.4 shows that the
ethnic background of migrants and it was observed that Amhara migrants contributed the lion
share, (97.25%), followed by Tigre (1.5%) and Oromo (1.25%), respectively.
Marital status is another important characteristic influencing the propensity to migrate. That is,
the matter of being married, unmarried (single), divorced and widowed, has an effect on the
decision to migrate. Single persons have less responsibility than married ones. As such, the
propensity to migrate is higher among the single than married ones. According to many studies,
many of the migrants were unmarried at the time they migrated, (Kebede, 1994 and Birhan, A ,
2011)). Equally, the survey results and the response given by the respondents strengthen the
above empirical literature. As indicated in the same Table 1.4 below, though their difference is
not statistically significant, about 18% of the respondents were married, while 82% were single
before they migrated to towns. It may be inferred that most of the urban-urban migrants, 84.82%,
were single, while 80.90% of rural-urban migrants were single before they came to urban areas. .
Regarding Household family size in the place of origin, most of the migrants were single and lived
with their parents and relatives. In particular, about 73.75% migrants were single before they left
their places of origin. However, as indicated in Table4.5, the majority of the migrants ,22.75%, were
reported to come from households 1-3 members; 47.5% were from households having 4-6 members;
26.50% from 7-9 members and only 3.25% were belonged to come from households greater than 9
members.
It was also reported during the survey period that the majority of the migrants (83.00%) had 1-3
household members, (of which 52.75% of migrants were living alone, 16% were with 2 and 14%
migrants were with 3 family members), while 47.5% of them have 4-6 members; only 1.25 and
0.25% had 7-9 members and greater than 9 members. The family size of rural-urban migrant
households is smaller than that of urban-migrant households, suggesting that smaller families are
more likely to have rural migrant members. Thus, as the survey result (Table 1.4) indicates, about
80.90% of rural migrants were single compared to 84.82% of urban migrants when they left their
birth places. On the other hand, migrants were asked to mention the relation /position/to their
households/ family/ when they left their birth place or past residence or place of origin, the
assessment of household composition shows that 305 (76.25%) of the sampled migrants were
sons/daughters, followed by spouse/partner, 50(12.50%) , head 35[( 8.75%) , parent of head/spouse 6
(1.50%), while other relatives had the smallest share, 4 (1.0%).
For education, sampled migrants were asked how many years of schooling they had completed, and
primary school was tallied with if someone had 1-8 years of schooling and secondary school counted
for anyone who had more than 8 years of schooling. However, the distribution of the respondents by
education level, prior to their move to the current destination, showed that there little improvement
in all level , such as 69(17.25%) were illiterate, 18(4.50%) were in adult and religious education,
162(40.50%) were primary education ( grade 1-8 level), followed by High school, 115 (28.75%) ,
IJISET - International Journal of Innovative Science, Engineering & Technology, Vol. 7 Issue 4, April 2020ISSN (Online) 2348 – 7968 | Impact Factor (2019) – 6.248
www.ijiset.com

12 | P a g e
and preparatory (grade 10-12 level) (26.1%), Technical and Vocational education (TVET) and
Diploma 19(4.75%) and university level, 17 (4.25%). This implies that the trade off between
education and migration seems relevant. The probability of migration is higher for individuals with
junior high school education and tends to fall for those with secondary and tertiary education.
Table 1.4: Demographic Characteristics of Migrants (Current and Before)
Demographic Characteristics of Migrants
Area of birth of Migrants Total
2 p-value Urban areas Rural areas
Freq % Freq % freq %
Gender Male 60 53.67 184 63.89 244 61.00
3.6083 0.057* Female 52 46.33 104 36.11 156 39.00
Age (birth pace) Age <14years 10 8.93 17 5.90 27 6.75
2.3778 0.305 Age 14-30years 98 87.50 252 87.50 350 87.50
Age>30 and =<64 4 3.57 19 6.60 23 5.75
Religion Christian 75 66.96 185 64.24 260 65.00
0.2638 0.608 Muslim 37 33.04 103 35.76 140 35.00
Ethnicity
Amhara 104 92.86 285 98.96 389 97.25
11.4648 0.003*** Tigre 4 3.57 2 0.69 6 1.50
Oromo 4 3.57 1 0.35 5 1.25
mrts (birth place) Single 95 84.82 233 80.90 328 82.00
0.8390 0.360 Married 17 12.18 55 19.10 72 18.00
fsize2(own family in
the place of origin)
1-3 108 96.43 266 92.36 374 93.50
5.0478 0.148 4.6 2 1.79 19 9.60 21 5.25
7-9 2 1.79 2 0.69 4 1.00
Greater than 9 0 0.00 1 0.35 1 0.25
fsize3(parent family
size in birth place)
1-3 25 22.32 66 22.92 91 22.75
1.5922 0.661 4.6 52 46.43 138 47.92 190 47.50
7-9 33 29.46 73 25.35 106 26.50
Greater than 9 2 1.79 11 3.82 13 3.25
relative(relation
/position/to family
in birth place)
Head 6 10.71 29 10.07 35 8.75
5.7339 0.220
Spouse/ partner 12 10.71 38 13.19 50 12.50
Son/daughter 93 83.04 212 73.61 305 76.25
Parent of head/spouse 0 0.00 6 2.08 6 1.50
Other/ relative 1 0.89 3 1.04 4 1.00
edul2 ( birth place)
Illiterate 17 15.18 52 18.02 69 17.25
9.9673 0.076*
Adult/Religious
education 1 0.89 17 5.90 18 4.50
Primary education (1-8) 47 41.96 115 39.93 162 40.50
High school &
Preparatory (10-12) 31 27.68 84 29.17 115 28.75
TVET & College
Diploma 8 7.14 11 3.82 19 4.75
University Education 8 7.14 9 3.13 17 4.25
*Significant at the 10% level;**Significant at the 5%level;***Significant at the 1% level
Source: Own Survey, 2019conomic Status of Migrants
4.5. Economic Status of Migration (Before Migration) Table 1.5 depict that the majority (73.00%) of out migrants (at migration) were unemployed either
due to lack of employment opportunities (65.00%), being young, student, housewife, old age or
IJISET - International Journal of Innovative Science, Engineering & Technology, Vol. 7 Issue 4, April 2020ISSN (Online) 2348 – 7968 | Impact Factor (2019) – 6.248
www.ijiset.com
13 | P a g e
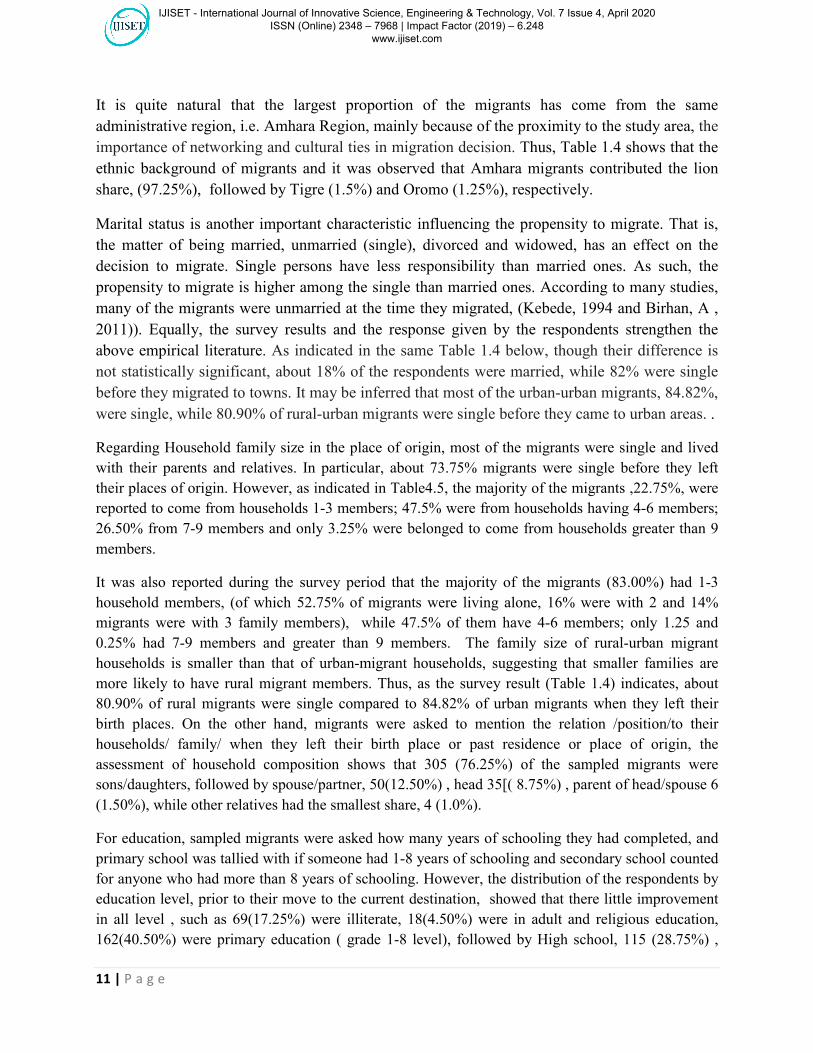
health problems (8.00%) out of the total in-migrants., while only 27.00% of them were employed ,
before they moved to their current destinations. The occupational distribution of sampled migrants,
among employed in-migrants, shows that the highest percentages were farmer, 16.75%, followed by
self employment, 6.00%, private employees, 2.50%, and only 1.75% of them were government
employees, respectively. Thus the unemployed-employed difference among rural and urban migrants
is statistically significant (p=0.0.45) at 5% significant level. Nonetheless, the unemployment
proportion, (63.54%) of rural migrants was less compared to the other urban migrant categories
(68.75%) before they moved to the study areas (towns). This implies that unemployment at their
place of departure is the main reason to migrate to a big (Dessie), medium (Kombolcha) and small
(Hayq) cities, which will be discussed in detail next.
Table 1. 5: Economic Status of Migrants (Before Migration)
Economic Status of Migrants (Before
Migration)
Area of birth of Migrants Total
N=400 2 p-value Urban
N=112
Rural
N=288
freq % freq % freq %
employment
(pastemp)
Yes 25 22.32 84 29.17 109 27.25 1.9060 0.167
No 87 77.68 204 70.87 291 72.75
Main
occupation
Self-Employed 11 9.82 13 4.51 24 6.00
11.3636 0.045**
Government/ NGO Employee 2 1.79 5 1.74 7 1.75
Private Employee 4 3.57 7 2.43 11 2.75
Farmer 9 8.04 58 20.14 67 16.75
Other/young/ student/
housewife… 10 8.93 22 7.64 32 8.00
Unemployed 77 68.75 183 63.54 261 65.00
job waiting Yes 17 15.18 50 17.36 67 16.75 0.2755 0.600
No 95 84.82 238 82.64 333 83.25
*Significant at the 10% level;**Significant at the 5%level;***Significant at the 1% level
Source: Own Computation 2019
4.6.The Causes for Migration As many literatures indicate that the causes of migration are usually identified as two broad
categories, namely “pushing” and “pulling” factors. In the same way, better employment
opportunities or the need for better facilities in urban areas may also pull people to different urban
areas. In addition, the decision to migrate from one place to another may also be influenced by non-
economic factors such as the need to join relatives, the need to be free from cultural and family
restriction and obligation and so on.
Thus the result of this study confirmed the above migration theories that people move for better
employment opportunities or the need for better facilities (example advancing in education...) in
urban areas had pulled people to different urban areas from rural areas and small city centres. The
survey result also shows that the majority of in-migrants that accounted for 61.75% of the total
surveyed migrants moved to urban areas to obtain job or seek employment, followed by to seek
advancing in education, 14.25% (16.07% of urban-urban and 4.26% of rural-urban) , despite the fact
that very few proportion of sampled in-migrants moved to the study areas as a result of shortage of
IJISET - International Journal of Innovative Science, Engineering & Technology, Vol. 7 Issue 4, April 2020ISSN (Online) 2348 – 7968 | Impact Factor (2019) – 6.248
www.ijiset.com

14 | P a g e
land and oxen, burden of family ties, inadequate social amenities in their origin, to avoid burden of
agriculture, to join friends and relatives/family reasons, job transfer, to open up/extend own business
and old age/health problems. The same Table 1.6 below further indicates that there was only a small
variation between rural and urban origin migrants. About 61.61% of surveyed urban migrants moved
to urban areas to seek employment whereas 61.81% of urban migrants moved to other urban areas to
seek employment.
Table 1.6: Socio-Economic Factors Influencing Migration by the Place of Birth
Cause of Migration
Area of birth of Migrants Total
N=400 2p-value
Urban
N=112
Rural
N=288
freq % freq % Freq %
To seek employment 69 61.61 176 61.81 247 61.75
12.3181 0.196
Advancing Education 14 12.50 43 14.93 57 14.25
Shortage of land and oxen 1 0.89 13 4.51 14 3.50
In adequate social amenities 2 1.79 10 3.47 12 3.00
Burden of family ties 6 5.36 17 5.90 23 5.75
To avoid burden of agriculture 5 4.46 4 1.39 9 2.25
To join friend and relatives/ family reason/ 2 1.79 2 0.69 4 1.00
Job transfer/ job moved/ 3 2.68 8 2.78 11 2.75
To open up or extended personal business 5 4.46 9 3.13 14 3.50
Other / old age, health problem….) 5 4.46 4 1.39 9 2,25
Source: Own Survey 2019
4.7.Current Economic Characteristics of Migrants As revealed in the Table 1.7 below, about 77% were employed, whereas 23% of the migrants were unemployed at the time of the survey period. This may imply that employment rate was higher among migrants because they highly competed for any types of job opportunity than non-migrants in new destination areas. However, there is only a big variation proportion of unemployment migrants among big (Dessie) medium or industrial (Kombolcha) and small (Hayq) city destinations. About 33.25% of surveyed in-migrants were unemployed in Dessie, followed by Kombolcha, 15.50% and Hayq, 4.26%, respectively. Hence, compared with small towns, the problem of unemployment with in-migrant population is very high in big and medium cities. This implies that employment opportunity in big cities is a very low compare to medium and small cities. Thus, their occupational differences among big, medium and small migrant population is statistically significant (p=0.062) at 10 percent significant levels.
The same Table 1.7 further points out the nature presence jobs of migrants that out of the total of employed migrants, about 36.69% of them were engaged in temporary jobs (46.675% in Dessie, 19.27% in Kombolcha and 44.44% in Hayq), pursued by 25.65% engaged in casual/housemaid/ jobs (Dessie; 19.48%, Kombolcha; 36.70%, and Hayq; 20.0% ) , 22.73 in permanent jobs (19.48% in Dessie, 22.94% in Kombolcha and 33.33% in Hayq) and 14.94% (Dessie14.29%; Kombolcha; 22.10 %; and Hayq; 2.22% ) of them were engaged in seasonal jobs. Consequently, big and medium cities are more fitting for temporary jobs than small cities, whereas medium and small cities are more appropriate for permanent and casual jobs and their occupational difference is statistically significant (chi2=27.2823 p=0.00) at the 1% significance level.
Thus, most of the migrants were employed in self employment and private organization seasonally/ part of the year (41.88%), once a while (29.55%), while only a small proportion, 28.57%, of them were
IJISET - International Journal of Innovative Science, Engineering & Technology, Vol. 7 Issue 4, April 2020ISSN (Online) 2348 – 7968 | Impact Factor (2019) – 6.248
www.ijiset.com

15 | P a g e
employed throughout the year in all occupations. Likewise, self-employed respondents were also asked in which type of own self-employed they were engaged. As regards 37.42% self-employed migrants were engaged in street vendor, followed by petty-trade, 30.32%, shoeshine, 15.48%, construction, 4.53%, preparing food and selling of local drinks, 3.23%, hotel/cafeteria service, 2.58%, barber, 2.58%, metal and wood work, 1.29%, tailor, 1.29% and a very small proportion of them were engaged in handicraft/embroidery and pottery (0.65%t) and broker (0.65%). The difference was especially great between big, medium and small cities, but the value of chi2 (p=530) reveals that their difference is not statistically significant.
Table 1.7: Current Economic Characteristics of Migrants
Current Economic Status of Migrants
Current Address of the respondents
Total (N=400) 2 p-value Dessie
(N=224) Kombolcha
(N=129) Hayq
(N=47)
Freq % Freq % Freq % Freq %
main occupation
Self-employed 89 39.73 44 34.11 22 46.81 155 38.75
49.3771 0.000***
Government/NGO/ employee 3 1.34 1 0.78 5 10.64 9 2.25
Private employee 32 14.29 24 18.60 9 19.15 65 16.25
Casual /housemaid worker 30 13.39 40 31.01 9 19.15 79 19.75
Unemployed 70 31.25 20 15.50 2 4.26 92 23.00
nature of presence
work;
Permanent 30 19.48 25 22.94 15 33.33 70 23.73
32.6710 0.000***
Temporary 72 46.75 21 19.27 20 44.44 113 36.69
Seasonal 22 14.29 23 21.10 1 2.22 46 14.94
Casual 30 19.48 40 36.70 9 20.00 79 25.65
duration of employment
(durationemp)
Throughout the year 36 23.38 35 32.11 17 37.78 88 28.57
27.2823 0.000*** seasonally /part of the year/ 70 45.45 54 49.54 5 11.11 129 41.88
Once a while 48 31.17 20 18.35 23 51.11 91 29.55
type of self-employed
(currselfemp)
Petty-trade/guilt 26 29.21 12 27.27 9 40.91 47 30.32
18.8772 0.530
Street vendor 30 33.71 19 43.18 9 40.91 58 37.42
Metal and wood work 1 1.12 1 2.27 0 0.00 2 1.29
Hotel/ cafeteria service 4 4.29 0 0.00 0 0.00 4 2.58
Food and selling of local drinks 5 5.62 0 0.00 0 0.00 5 3.23
Handicraft/embroidery/pottery/ 1 1.03 0 0.00 0 0.00 1 0.65
Construction 5 5.62 2 4.55 0 0.00 7 4.52
Tailor 2 2.25 0 0.00 0 0.00 2 1.29
Shoeshine 10 11.24 10 22.73 4 18.18 24 15.48
Barber 4 4.49 0 0.00 0 0.00 4 2.58
Broker 1 1.12 0 0.00 0 0.00 1 0.65
No 104 67.53 50 45.87 27 60.00 181 58.77
main reason (s) for being unemployed (curreasons
Had no formal education 14 20.00 4 20.00 1 50.00 19 20.65
2.3479 0.672 Lack of job opportunity 52 74.29 16 80.00 1 50.00 69 75.00
Lack of land/oxen/ 4 5.71 0 0.00 2 0.00 4 4.35
**Significant at the 5%level;***Significant at the 1% level
Source: Own Computation 2019
IJISET - International Journal of Innovative Science, Engineering & Technology, Vol. 7 Issue 4, April 2020ISSN (Online) 2348 – 7968 | Impact Factor (2019) – 6.248
www.ijiset.com

16 | P a g e
4.8.Problem faced by Migrants (After Arrival at Urban Areas) Taking all respondents together, 48.50% of them were reported to have faced serious unemployed problem followed by shelter/housing problem, 22.50%, foods and other consumer goods, 10.25%, and inadequate social services and other social utilities, 3.25%, and others/ working places.../ problems (1.75%), while only 13.75% of them were reported to have no difficulties they faced during their first arrival at their destinations. The employment challenge is very high in medium (51.16%) and big (48.21%) cities compared with small (42.55%) district city. The P-value of the Chi-square analysis also revealed that there is a strong association between area of destinations and the main problems faced at 5 percent level of significance (P=0.039).
Currently, about 41.25% of them replied that they faced the same serious unemployed challenge pursued by ever increasing challenge of shelter/housing, 31.25%, foods and other consumer goods, 7.0%, and inadequate social services and other social utilities, 8.25% and others/ working places.../ problems, 1.50%), while only 10.75% of them were reported to have no difficulties they faced during their first arrival at their destinations. Similarly, the employment challenge is very high in a big (48.21%) city than in medium/ industrial (40.28%) and small district (41.25%) cities. Nevertheless, the P-value of the Chi-square analysis revealed that there was no strong association between area of destination and main challenges they are facing now (P=0.967) in current destinations/ cities/. One can therefore conclude that the main difficulties being faced by migrants were obtaining formal jobs, inadequate supply of housing, inadequate supply of social services, inadequate social utilities and working places.
Table 1.8: Main Challenges of Migrants by the Area of Destinations (After Arrival)
Main challenges
Current Address of the respondents
Total N=400 2 p-value
Dessie N=224
Kombolcha N=129
Hayq N=47
Freq % Freq % Freq
% Freq %
1. Main challenge (s) they faced during their first arrival in each city (challenge_03);
Employment 108 48.21 66 51.16 20 42.55 194 48.50
19.1196 0.039**
Shelter (house) 57 25.45 26 20.16 7 14.89 90 22.50
Food and other consumer goods 20 8.93 9 6.98 12 25.53 41 10.25
Inadequate Social service and other social utilities
6 2.68 6 4.65 1 2.13 13 3.25
Others/ working places…..) 3 1.34 2 1.55 2 4.26 7 1.75
No difficulties 30 13.39 20 15.50 5 10.64 55 13.75
2. Awareness about the above challenges before they migrated to each city (awaredif);
Yes 77 34.53 51 39.53 28 59.57 156 39.10 10.2413 0.006***
No 146 65.47 78 60.47 19 40.43 243 60.90
3. Main challenge (s) they are facing now in each city (currdifucal_01);
Employment 109 48.66 40 31.01 16 34.04 165 41.25
26.7642 0.003***
Shelter (house) 68 30.68 47 36.43 10 21.28 125 31.25
Food and other consumer goods 14 6.25 7 5.43 7 14.89 28 7.00
Inadequate Social service and other social utilities
15 6.70 12 9.30 6 12.77 33 8.25
Others/ working places…..) 4 1.79 1 0.78 1 2.13 6 1.50
No difficulties 14 6.25 22 17.05 7 14.89 43 10.75
Source: Own Computation 2019 (**Significant at the 5%level;***Significant at the 1% levels)
IJISET - International Journal of Innovative Science, Engineering & Technology, Vol. 7 Issue 4, April 2020ISSN (Online) 2348 – 7968 | Impact Factor (2019) – 6.248
www.ijiset.com

17 | P a g e
4.9. Econometric Analysis Logistic regression method is a powerful technique because it is relatively free of limitations /or
restrictions/ and it allows analyzing a mix of all types of predictors. For that reason, the study applies a
Binary Logistic Model to identify the determinant of migration decision. Hence, the dependent variable
(y*i) is binary which takes 1 for migrants mainly who migrated from rural to urban area, 0 otherwise. Prior
to running the binary logistic econometrics analysis, all the hypothesised explanatory were checked by
using various post-estimation tests like the Wald test, Cronbach’s alpha test and contingency coefficient,
Hetroskedasticity, Multicollinearity tests.
Hetroskedsticity: Bruish Pagan (hettest) was employed just to detect hetroskedasticity problem, the case
in which the estimate variance of the residual from regression are dependent on values of the independent
variables. The test result detected presence of hetroskedasticity problem. The hypothesis for the existence
of homoskedasticitty was rejected as Prob>chi2=0.0013. In this study there is a hetroskedasticity problem
and hence robust standard errors were estimated to tackle hetroskedasticity problem in the data (Annex
Table 1)
Multicollinearity: In most economic variables it is likely that a set of independent variables within
themselves correlated each other. There are two measures are often suggested to test the existence of
multi-collearity, such as, Variation Inflation Factor (VIF) for association among the continuous
explanatory variables and contingency coefficients for dummy variables. The VIF values displayed in
Annex Table 2.4 have shown that all the continuous explanatory variables are the rule of thumb, 10 have
no series multicolinearity problem. Then, before analyzing the effects of independent explanatory
variables on the dependent variable, all variables, which were hypothesized to migration decision by
origin of birth, were checked for multicolinearity using bivariate correlation matrix tables. The result of
the test confirmed that there is no significant collinearity between each other and both hypothesized
continuous and dummy variables could be included into the model.
Tests of Model Fit: The model validation statistics was also checked by using Pearson or Hosmer–
Lemeshow goodness-of-fit test (2000, 147-150) after logit model estimation (Annex Tables 11.1 and
11.2). Hence both Pearson (p>chi2>0.0.1337) and Hosmer-Lemeshow (p>0.6677) goodness of fit
tests indicate that we cannot reject the null hypothesis that the model is normally well fitted at 1%
significant, suggesting that the error in the model is normally distributed and our model fits reasonably
well running logistic model is appropriate for analysis of determinants of rural-urban migration decision.
In the same way, the study has spent much of its time in the data exploration process. To begin with, the
statistics of the overall model indicate that the logistic regression is a good fit, with the Wald chi-square
statistics of the , chi2(23)=46.77 and p-value>chi2=0.0024, shows the overall model as a good fit with
LR of 209.71253 and exemplifies at least some of the slope coefficients are significantly different from
zero. Furthermore, the fit of the model is also checked using Akaike Information Criteria (AIC) and
Bayesian Information Criteria (BIC). Accordingly, at 24 degrees of freedom, the fitted model improves
upon the null model in explaining the variation of the response variable (Annex Table 2.6). However, as
with the BIC, a smaller AIC indicates a better-fitting model.
IJISET - International Journal of Innovative Science, Engineering & Technology, Vol. 7 Issue 4, April 2020ISSN (Online) 2348 – 7968 | Impact Factor (2019) – 6.248
www.ijiset.com
18 | P a g e
In addition to this, Hteroskedasticity is not a serious problem. That is the variance of the error term is
constant (Homoskedasticity) and our logistic regression cannot produce biased and misleading parameter
estimates. The normality and specification error tests are also carried out (Annex Table 2.2)
As shown in the following Table 1.9, the results of logistic regression model, some are statistically
significant at 1%, 5% and 10% level while others are not significant even at the 10% level of significance.
Nevertheless almost all explanatory variables entered with expected signs and are influential to identify
the reasons of rural people migration decision to urban areas, except married, family size, , inadequate
social services in rural areas, burden of ties, burden of agricultural works, to join with relatives/friends, to
open up or extended business and past employment status of urban residents. On the other hand, the
coefficients of the variables, with positive signs, are positively associated and coefficients, with a negative
sign, are negatively correlated with the probability of being rural-urban migration.
As a result, among variables, distance between birth of place and urban destination, the education
dummy; adult and religious education, other education dummies; illiterate, primary (1-8 grade level) high
school and preparatory (9-12 grade levels), dummies reason for migration; advancing in education
(reference category as university education), dummy sources of information about living conditions of
cities; ‘yes’, dummies reasons for migration; to seek employment , shortage of agricultural land job
transfer suggest that they are significant to affect the decision of rural migrant to move to urban areas,
(either as being permanent or temporarily resident), at 5% (or at 99% , 95% and 90% confidence levels),
respectively.
Concerning the marginal effect of these variables, however, the survey found different results. Table 1.9
also reveals that the coefficient of distance from birth area is negatively related with the dependent
variable (rural-urban migration). This implies that as distance from sending area increases by 1 kilo
meter, the possibility of migrants to be pulled towards urban areas will be decreased by 0.08%. Thus the
finding is consistent with the research hypothesis and many empirical literatures like Ravenstein (1885)
that indicated the basic laws of rural-urban migration. This implies that as distance from place of origin
decreases, migrants are more likely to be expected to be pulled towards urban areas compared to migrants
from remote rural areas.
As can be seen from Table 1.9, the coefficient of education dummies; illiterate, adult and religious
education, primary education (1-8 grade levels), high school and preparatory education (9-12 grade
levels) are positive and statistically significant in affecting rural-urban migration and the probability of to
be pushed out of rural areas to urban areas 24.57%, 26.68%, 27.24% and 27.05%, respectively. Equally,
though the coefficients of education dummy technical and vocational education training (TVET) and
diploma education levels is positive and statistically insignificant in affecting the decision of rural-urban
migration, the likelihood of rural migrants to be pushed out of their birth place increases by 14.22%.
The main sources of rural-urban migrants may be school dropouts in rural areas and one factor for low
educational attainment of migrants of rural origin. In addition, in rural areas parents may not be willing to
send their children to attend education rather they keep them at home to help them in farming and other
related activities before they migrated to urban areas. This implies that both less educated; and younger
IJISET - International Journal of Innovative Science, Engineering & Technology, Vol. 7 Issue 4, April 2020ISSN (Online) 2348 – 7968 | Impact Factor (2019) – 6.248
www.ijiset.com
19 | P a g e
individuals are more likely to out migrate from the country sides in the study areas, similar to the result
obtained by Fasil and Mohammed (2017) in Southern Ethiopia.
The main reasons for rural-urban migration in the study areas are better jobs opportunities at urban areas,
search for further education, shortage of agricultural land, inadequate social amenities, to open up and
extend business, to be free burden of family ties, burden of agriculture, to join friends and relatives, job
transfer, etc. Regarding to the coefficients and marginal effects of reasons for migration dummies; to
seek employment, advancing in education, shortage of agricultural land, job transfer; they are positively
associated with rural migration and the likelihood of moving out from rural areas increases by ,27.54%,
24.43%, 23.91%, and 23.73%, in that order. Thus, the study confirmed that the main causes for rural-
urban migration in the study are found to be economic factors (employment and job transfer) and this is in
line with the Harris Todaro model of rural-urban migration.
Similarly, the coefficient of the source of information dummy, yes; is positive related and statistically
significant in affecting rural-urban migration and the probability of to be pulled out of rural areas to urban
areas increases by 9.77%. It implies that the migrants who have positive or encouraging access to
information about living conditions and facilities, pulling factor, such as the availability of housing,
health care, employment opportunities, etc of their current destinations before leaving their previous
residences, are more likely to be pulled from rural toward urban areas.
Converse, among variables positively correlated with probability of rural to urban migration sex dummy
male; dummy religion; Christian; dummy married; family size (fsize2) in the place of origin; dummy
education level;TVET & college diploma,; dummy reasons for migration; inadequate social amenities in
rural areas, burden of family ties, burden of agricultural activities, to open up/extend/ own business; and
dummy in past employment, yes are statistically insignificant but the probability of an individual to
migrate from rural to urban areas increase by 6.76%, 3.34%, 0.84%, 18.92%, 16.62%, 6.15%, 12.22% and
5.74%.
Even if statistically insignificant, the coefficient of dummy male is positive it implies that male migrants
are more likely to be pulled either by the attraction of job opportunities, or higher expected income in
urban areas, further educational advancement, to open up or extend new business or pushed out of the
rural areas due to the non-availability of jobs ,shortage of agricultural land, burden of agricultural
activities and family ties than women counter parts, as reference category, which is in contrary with some
empirical literature that women are more likely to move to cities; men are more likely to move to rural
areas in Ethiopia.
Regarding the coefficient of family size of the parents of the migrants, there is positive and statistically
insignificant relationship between family size and the dependent variable, the pull versus push factors.
The higher family size in rural areas induces rural out migration due to push factors or large family size
induces push out of the rural area, as predicted by economic theory, holding other things constant. This is
in line with the finding of Fasil and Mohammed (2014) in Southern Ethiopia.; that is, since there are
many families with large family members in rural Ethiopian; it may be difficult to provide those
additional family members with food and shelter and because of large number of family members (family
burden), many people migrate to cities and live separately.
IJISET - International Journal of Innovative Science, Engineering & Technology, Vol. 7 Issue 4, April 2020ISSN (Online) 2348 – 7968 | Impact Factor (2019) – 6.248
www.ijiset.com
20 | P a g e
One of the dominant religious groups of people in Ethiopia is Christian in general; Orthodox Christians in
particular, is more likely than all other denominations to move to urban areas. This implies that Muslims
(as reference group) are less likely than Orthodox Christians to move to urban areas.
The marital status dummy shows that marital status influences the rural migrants’ perception of the
benefits of rural urban migration. Married migrants who start up their own families might have additional
family responsibilities and the amount of remittances to be sent for parents in origin might be affected.
The implication is that the married migrants have a more positive perception of the benefits of rural-urban
migration than unmarried ones, which is compatible with the study prediction and many empirical
literatures.
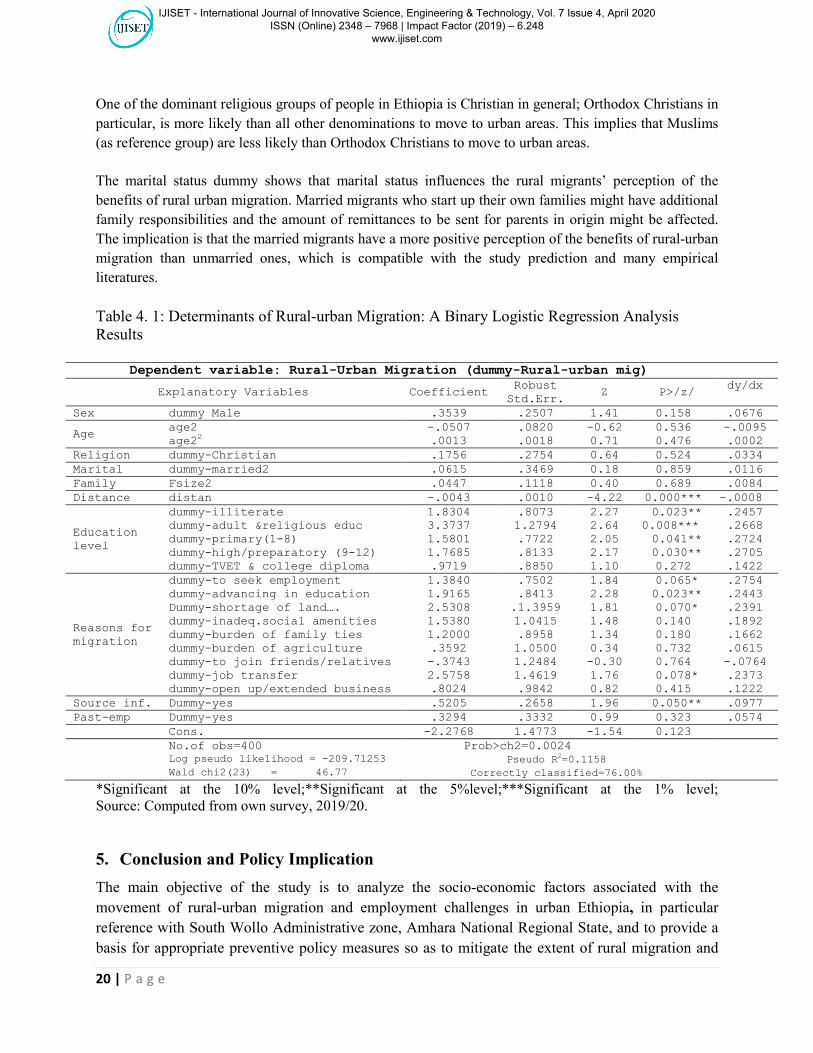
Table 4. 1: Determinants of Rural-urban Migration: A Binary Logistic Regression Analysis Results
Dependent variable: Rural-Urban Migration (dummy-Rural-urban mig)
Explanatory Variables Coefficient Robust Std.Err.
Z P>/z/dy/dx
Sex dummy Male .3539 .2507 1.41 0.158 .0676
Ageage2 -.0507 .0820 -0.62 0.536 -.0095age22 .0013 .0018 0.71 0.476 .0002
Religion dummy-Christian .1756 .2754 0.64 0.524 .0334Marital dummy-married2 .0615 .3469 0.18 0.859 .0116Family Fsize2 .0447 .1118 0.40 0.689 .0084Distance distan -.0043 .0010 -4.22 0.000*** -.0008
Educationlevel
dummy-illiterate 1.8304 .8073 2.27 0.023** .2457dummy-adult &religious educ 3.3737 1.2794 2.64 0.008*** .2668dummy-primary(1-8) 1.5801 .7722 2.05 0.041** .2724dummy-high/preparatory (9-12) 1.7685 .8133 2.17 0.030** .2705dummy-TVET & college diploma .9719 .8850 1.10 0.272 .1422
Reasons formigration
dummy-to seek employment 1.3840 .7502 1.84 0.065* .2754dummy-advancing in education 1.9165 .8413 2.28 0.023** .2443Dummy-shortage of land…. 2.5308 .1.3959 1.81 0.070* .2391dummy-inadeq.social amenities 1.5380 1.0415 1.48 0.140 .1892dummy-burden of family ties 1.2000 .8958 1.34 0.180 .1662dummy-burden of agriculture .3592 1.0500 0.34 0.732 .0615dummy-to join friends/relatives -.3743 1.2484 -0.30 0.764 -.0764dummy-job transfer 2.5758 1.4619 1.76 0.078* .2373dummy-open up/extended business .8024 .9842 0.82 0.415 .1222
Source inf. Dummy-yes .5205 .2658 1.96 0.050** .0977Past-emp Dummy-yes .3294 .3332 0.99 0.323 .0574
Cons. -2.2768 1.4773 -1.54 0.123No.of obs=400 Prob>ch2=0.0024Log pseudo likelihood = -209.71253 Pseudo R2=0.1158Wald chi2(23) = 46.77 Correctly classified=76.00%
*Significant at the 10% level;**Significant at the 5%level;***Significant at the 1% level;Source: Computed from own survey, 2019/20.
5. Conclusion and Policy Implication
The main objective of the study is to analyze the socio-economic factors associated with the
movement of rural-urban migration and employment challenges in urban Ethiopia, in particular
reference with South Wollo Administrative zone, Amhara National Regional State, and to provide a
basis for appropriate preventive policy measures so as to mitigate the extent of rural migration and
IJISET - International Journal of Innovative Science, Engineering & Technology, Vol. 7 Issue 4, April 2020ISSN (Online) 2348 – 7968 | Impact Factor (2019) – 6.248
www.ijiset.com

21 | P a g e
employment challenges. The study used primary data, a cross-sectional individual level analysis and
covered a total of 400 both rural-urban and urban-urban migrants were covered in the study areas.
Since it was difficult to obtain and identify the sampling frame or a complete source list of units (the
names of rural-urban and urban-urban migrants) in each city administrative offices, in this research,
the emphasis was given to non-probability sampling specifically on purposive and snowball sampling
procedures. On the other hand, only migrants were purposively selected to achieve the above
predetermined objectives..
As mentioned in the Binary Regression analysis above, among variables, distance between birth
of place and urban destination, the education levels; adult and religious education, illiterate,
primary (1-8 grade level) high school and preparatory (9-12 grade levels) (reference category as
university education); reason for migration; to seek employment, advancing in education,
shortage of agricultural land job transfer; and sources of information about living conditions of
cities;, suggest that they are statistically significant to affect the decision of rural migrant to
move to urban areas,
The study also reveals that not only more educated, but also illiterate and less educated migrants
are more likely to be pulled toward urban areas due to availability of jobs or income earning
opportunities/business/, job transfer, access to education, its networks or access to information.
Therefore, education is not only the relevant factors in accounting for rural-urban migration in
the study areas. This implies that the main sources of rural-urban migrants may be school
dropouts in rural areas and one factor for low educational attainment of migrants of rural origin.
In addition, in rural areas parents may not be willing to send their children to attend education
rather they keep them at home to help them in farming and other related activities before they
migrated to urban areas. This implies that both less educated; and younger individuals are more
likely to out migrate from the country sides in the study areas, similar to the result obtained by
Fasil and Mohammed (2017) in Southern Ethiopia
The other indicator of succession migration to the study area is the flow of information to the
recipient. During the interview and discussion, respondents pointed out that information about
the situation of the study areas has been put across through people they knew before in the study
areas (their relatives and friends). In particular, the role of already settled in-migrants is vital to
“pull” their follows to urban areas from their place of origin and provide migrants some
IJISET - International Journal of Innovative Science, Engineering & Technology, Vol. 7 Issue 4, April 2020ISSN (Online) 2348 – 7968 | Impact Factor (2019) – 6.248
www.ijiset.com
22 | P a g e
important assistants in order to adjust themselves to different urban life and to strengthen their
economy
5.2. Policy Implication
The internal migration has become a major issue of influencing government policies and
program efforts. Crucial among these issues are problems of unplanned urbanization, growing
urban crimes, rural poverty, neglect of agriculture and unbalanced population concentration.
These suggest the effect of the dominant pattern of rural-urban migration and its effect on
national life. Thus the result of this study also confirmed the above migration theories that people
move for better employment opportunities or the need for better facilities (example advancing in
education...) had pulled people from rural areas and small city centres to different big, medium
and small cities in Ethiopia.
Then after analyzing the causes of rural-urban migration to Urban Ethiopia, the determinants of
current employments status and Problem faced by Migrants (After Arrival in Urban Areas) the
study proposes the following recommendations that could be implemented by policy makers and
interested organizations at country, regional, zonal and district levels:
1. Rural development policies should also be designed in ways of enhancing the
productivity of labor and improving the living standard of the rural population and
contribute for the process of rural transformations. Moreover, rural development policies
should pave opportunities to enable migrants to involve in farm and nonfarm
investments. Non-farm enterprises serve as a means of rural livelihood diversification and
reduce the pressure on land. Furthermore, rural development policies should pay a special
attention for the poorest groups of the rural population who migrate as a result of chronic
poverty. The poor should participate from the planning to evaluation of rural
development projects in this regard.
1.1.Designing a new productive safety- net program similar to urban areas, or
expanding the food-for-program apart from creating permanent job opportunities
in labor-intensive public works so as to provide effective grants for unemployed
and casual workers and to ensure fair adults participation in rural and in small
district urban centers public works projects in order to reduce the extent of rural-
urban migration to urban areas.
IJISET - International Journal of Innovative Science, Engineering & Technology, Vol. 7 Issue 4, April 2020ISSN (Online) 2348 – 7968 | Impact Factor (2019) – 6.248
www.ijiset.com

23 | P a g e
1.2. The direct support program intended to provide grants to households who are
labor-poor and cannot undertake public works. Beneficiaries, in this regard, will
include, orphans, low earner pensioners/retired people, disabled and elderly
households and other labor-poor high risk households with sick individuals (such
as people living with HIV/AIDS), and the majority of female-headed households
with young children; and
1.3. Cash and food transfers (through direct public distribution system) for food
insecure households are another policy recommendation in the form of social
security. In particular, the public distribution system (PDS) is the most important
and far-reaching poverty alleviation programme to provide food security to poor
households by supplying essential commodities at subsidized prices.
2. Education is one of the significant characteristics inducing rural-urban migration.
The decision to migrate is also more likely influenced by educational attainment. The
probability of migration is higher for individuals with junior high school education and
tends to fall for those with secondary and tertiary education. One plausible explanation is
that young people abandon school before completing their secondary level to migrate.
That is school dropouts were found to be high in the rural areas, which is partly
associated with the highest internal migration of youths to urban areas.
2.1.Both the regional, zonal and local level education departments should work hard
as how to minimize school dropouts by improving the quality of education.
Unless otherwise, more students will chose to terminate schooling intended to
migrate to Urban areas
2.2. Technical and Vocational Educational Training (TEVT) should be given for rural
migrants to equip them with the necessary skills and make them competitive in
the non-farm labor market. Similarly, favorable conditions should be created to
enable migrants transfer their skill gained from commercial farms and industries
to their rural origin.
3. The availability of land is an important asset for the rural population livelihood. The
study found that shortage of land and its fragmentation as a result of population growth is
one of the challenges of rural households forcing households to migrate, particularly in
IJISET - International Journal of Innovative Science, Engineering & Technology, Vol. 7 Issue 4, April 2020ISSN (Online) 2348 – 7968 | Impact Factor (2019) – 6.248
www.ijiset.com
24 | P a g e
densest populated districts of the country such as in all rural areas of the country, in
general, and in the study areas, in particular. The growth of labor force in rural areas is
too high as compared to the growth of available resources and employment opportunities.
Thus, land distribution policies should be revised again to incorporate the new demand of
youth population in rural areas.
Besides, resettlement on voluntary basis from highly degraded areas to where
there are vacant and potentially productive irrigable lands can reduce the flow of
people towards urban areas
4. The life in the rural area is seen to be hard and difficult and many of the
empirical literature believed that this is due to the lack of schools, electricity, running
water, health services, communication, paid employment and material things.
Accordingly, rural migrants took the chance to change their lives to something better by
moving to urban areas. Thus;
4.1.Urbanization and rural-urban linkages should be supported by the development of
infrastructure such as road and transportation facilities both in urban and rural
areas.
4.2. As many empirical literatures and this study indicated that migrants prefer to
move to a town or city that is close to their origin areas and families, many end up
migrating to regional capitals, big and medium cities, where economic
opportunities and services are better. Investments in smaller cities and towns can
avoid an overconcentration of people in large cities. In addition, research has
shown that development of towns and secondary cities has a bigger poverty-
reduction effect than concentration in mega, big and medium cities
4.3.During the survey, it was observed and discussed with respondents that internal
migrants got information regarding the opportunities in urban regions from
friends or relatives informally. In such cases, information is often biased and
exaggerated leading to excess migration to urban centers, increasing the
unemployment level, exploitation of labor and human trafficking. Thus, access to
information should be improved for potential rural migrants. Providing job
search assistance, such as the provision of easily accessible information on jobs
available (or where and how to seek jobs) and related support services
IJISET - International Journal of Innovative Science, Engineering & Technology, Vol. 7 Issue 4, April 2020ISSN (Online) 2348 – 7968 | Impact Factor (2019) – 6.248
www.ijiset.com
25 | P a g e
(accommodation, training opportunities, one-stop shops, credit facilities, housing,
working conditions, etc.)
Thus, well established institutional framework and localized migrant youth
consultation may provide important information about the challenges, constraints
and priorities of youth and may allow the youth to engage in the process of
seeking solutions.
4.4. Designing an internal labor mobility strategy and policy that acknowledges
labor mobility as a positive livelihood option and that aims to maximize the
benefits of internal migration while mitigating the risks. This strategy would also
need to include sensitization of local authorities and law enforcement to better
understand the concept of mobility and migration and the reasons behind it.
5. The life in the rural area is seen to be hard and difficult and many of the empirical
literature believed that this is due to the lack of schools, electricity, running water, health
services, communication, paid employment and material things. Accordingly;
5.1.Urbanization and rural-urban linkages should be supported by the development of
infrastructure such as road and transportation facilities both in urban and rural
areas.
5.2. As in this study indicated that migrants prefer to move to a town or city that is
close to their origin areas and families, many end up migrating to regional
capitals, big and medium cities, where economic opportunities and services are
better. Investments in smaller cities and towns can avoid an overconcentration of
people in large cities. In addition, research has shown that development of towns
and secondary cities has a bigger poverty-reduction effect than concentration in
mega, big and medium cities
6. Finally, the development of Agro-allied industries and small scale farming system must
be set-up in the rural areas to reduce rural-urban migration in order to provide job
opportunities for the people of the rural area. The agricultural inputs and farming
technologies should be introduced to the rural people to improve the production level.
Good road should be constructed for the rural area and credit facilities should be provided
for the rural people to improve their production level, which will lead to improvement in
their standard of living.
IJISET - International Journal of Innovative Science, Engineering & Technology, Vol. 7 Issue 4, April 2020ISSN (Online) 2348 – 7968 | Impact Factor (2019) – 6.248
www.ijiset.com

26 | P a g e
Reference Adepoju A. 1977: Migration, Agricultural Activity and Socioeconomic Change in Ife
Division of Southwest Nigeria. Dakar: IDEP.
Adepoju, A. 1974: Rural-urban socio-economic links: The example of migrants in
southwest Nigeria. In Modern migrations in western Africa, ed. J. Arnin.
London: Oxford University Press.
AdewaleJ.,G, 2005, : Socio-Economic Factors Associated with Urban-Rural Migration in
Nigeria: A Case Study of Oyo State, Nigeria, Department of Agricultural Economics
and Extension, Faculty of Agricultural Sciences, Ladoke Akintola University of
Technology, Ogbomoso, Nigeria, J. Hum. Ecol., 17(1): 13-16 (2005)
Akinyemi A.I1. and Olaopa O3.Oloruntimehin O2 : MIGRATION DYNAMICS AND
CHANGING RURAL-URBAN LINKAGES IN NIGERIA1;.
Beladi and Naqvi (1988: 365-375) on their works on ‘Urban unemployment and non-
immiserizing growth’ reviewed the Harris-Todaro assumption to show the implication of
economic expansion for urban unemployment and sectoral output.
Birhan A., M, 2011: ‘Causes And Consequences Of Rural-Urban Migration: The Case F
Woldiya Town, North Ethiopia .
Cortes, R. (2007). Children and women left behind in labor sending countries: an appraisal
of social risks. Global Report on Migration and Children; UNICEF-UNDP initiative
CSA (2008): “Population Size by Age and Sex”; Summary & Statistical Report of the 2007
Census, Addis Ababa, Ethiopia
CSA(2014): “STATISTICAL REPORT ONTHE 2013 NATIONAL LABOUR FORCE
SURVEY”, STATISTICAL BULLETIN, Addis Ababa, Ethiopia.
Ethiopian (2014/15): https;//en.wikipendia.org/wiki/South_Wollo
Fasil E and Mohammed B (2017): Dynamics and determinants of rural-urban migration in
Southern Ethiopia: Department of Economics, Arba Minch University, Arba Minch,
Ethiopia
Folbre (1986:5) particularly identified significant differences between the economic position
of men, women and children in a household calling for a structured analysis of gender and
age inequalities rather than taking a household as a single representative unit.
Gujarati (2004), “Basic Econometrics”, the Fourth Edition, the McGraw-Hill Companies
Harris, J., and Todaro, M. 1970 Migration, unemployment and development: A two sector
analysis, American Economic Review 60(1): 126-42.
Harris, JR & Todaro, MP (1970). Migration, Unemployment and Development: A Two-
Sector Analysis. The American Economic Review, American Economic Association,
Vol. 60, No. 1:126-142
Lewis, W. A., 1954, Economic Development with Unlimited Supplies of Labour; The
Liao, T.F.(1994). Interpreting probability models. Logit, probit and other generalized linear
models. Quantitative Applications in the Social Sciences. Sage Publications.
Maddala (1992): “Introduction to Econometrics”,Second Edition, Macmillan Publishing
IJISET - International Journal of Innovative Science, Engineering & Technology, Vol. 7 Issue 4, April 2020ISSN (Online) 2348 – 7968 | Impact Factor (2019) – 6.248
www.ijiset.com
27 | P a g e
Company, New York, Manchester School, 22, 2, 139-191.
Marchiori, L., Maystadt,J.F., and Scumacher,I. (2010) Another Inconvenient Truth: climate
change and migration in Sub-Saharan Africa. Conference on the Transnationality of
Migrants (TOM) Marie Curie Research Training Network ‘International Migration:
Transnational links, Effects and Policies’ September 16-18, 2010. Hosted by Venice
International University
MoFED and UN (2012): “Assessing Progress towards the Millennium Development Goals:
Ethiopia MDGs Report 2012”, Addis Ababa, Ethiopia.
Muzzini, E. (2008), “Urban Poverty in Ethiopian: A Multi-faceted and Spatial Perspective”,
the World Bank, Washington, D.C.
Niels-Hugo Blunch Caterina Ruggeri Laderchi, 2015;, “Internal Migration, Education and
Wages in Ethiopia”, discussion papers Series, IZA DP No. 8926
Ranis, G. & J. C. H. Fei, 1961, A Theory of Economic Development, American
Tesfaye, A.G (2006): “The Dynamics of Poverty in Urban Ethiopia”, University of Sydney,
Australia.
Todaro, M. P., 1969, A Model of Labour Migration and Urban Unemployment in Less
Developed Countries, American Economic Review, 59, 1, 138-148.
Tom Bundervoet (2018): Internal migration in Ethiopia evidence from a quantitative and
qualitative study: The World Bank 1818 H Street NW, Washington DC 20433
UN (2014): “World Urban Prospects”: The 2014 Revision, Department of Economic &
Social Affaire, Network.
World Bank (2010): The Characteristics, Motives and Outcomes of Migrants to Addis
Ababa: Poverty Reduction and Economic Management, Africa Region, Report No.
55731-ET, Newyork, USA
Yanyi K. Djamba , Sidney Goldstein and Alice Goldstein :Urban Migrants and Occupational
Change in Three Countries Undergoing Transitions; USA
IJISET - International Journal of Innovative Science, Engineering & Technology, Vol. 7 Issue 4, April 2020ISSN (Online) 2348 – 7968 | Impact Factor (2019) – 6.248
www.ijiset.com

28 | P a g e
Annex Tables
Annex Table 1: Validity and Reliability of the Instruments
Compute interitem correlations (covariances) and Cronbach’s alpha
Average interitem correlation: 0.0812
Number of items in the scale: 28
Scale reliability coefficient: 0.7121
Annex Table 2: Post Estimation Test After Binary Logistic Regression Analysis
Annex Table 2.1: Breusch-Pagan / Cook-Weisberg test for heteroskedasticity
Ho: Constant variance
Variables: fitted values of dummyAbirth2
chi2(1) = 7.17
Prob > chi2 = 0.0074
Annex Table 2.2: Skweness ?kurtosis for Normality test
Cameron & Trivedi's decomposition of IM-test
---------------------------------------------------
Source | chi2 df p
---------------------+-----------------------------
Heteroskedasticity | 218.35 192 0.0932
Skewness | 188.86 23 0.0000
Kurtosis | 17.09 1 0.0000
---------------------+-----------------------------
Total | 424.30 216 0.0000
---------------------------------------------------
Annex Table 2.3: Specification error tests for omitted varible
Ramsey RESET test using powers of the fitted values of dummyAbirth2
Ho: model has no omitted variables
F(3, 373) = 1.70
Prob > F = 0.1676
IJISET - International Journal of Innovative Science, Engineering & Technology, Vol. 7 Issue 4, April 2020ISSN (Online) 2348 – 7968 | Impact Factor (2019) – 6.248
www.ijiset.com

29 | P a g e
Annex Table 2.4: Variation Inflation Factor (VIF) for Multicollinearit test
For Continuous Explanatory Variables
Variable | VIF 1/VIF
-------------+----------------------
age22 | 18.46 0.054179
age2 | 17.93 0.055769
fsize2 | 1.14 0.873378
distan | 1.02 0.976434
-------------+----------------------
Mean VIF | 9.64
IJISET - International Journal of Innovative Science, Engineering & Technology, Vol. 7 Issue 4, April 2020ISSN (Online) 2348 – 7968 | Impact Factor (2019) – 6.248
www.ijiset.com
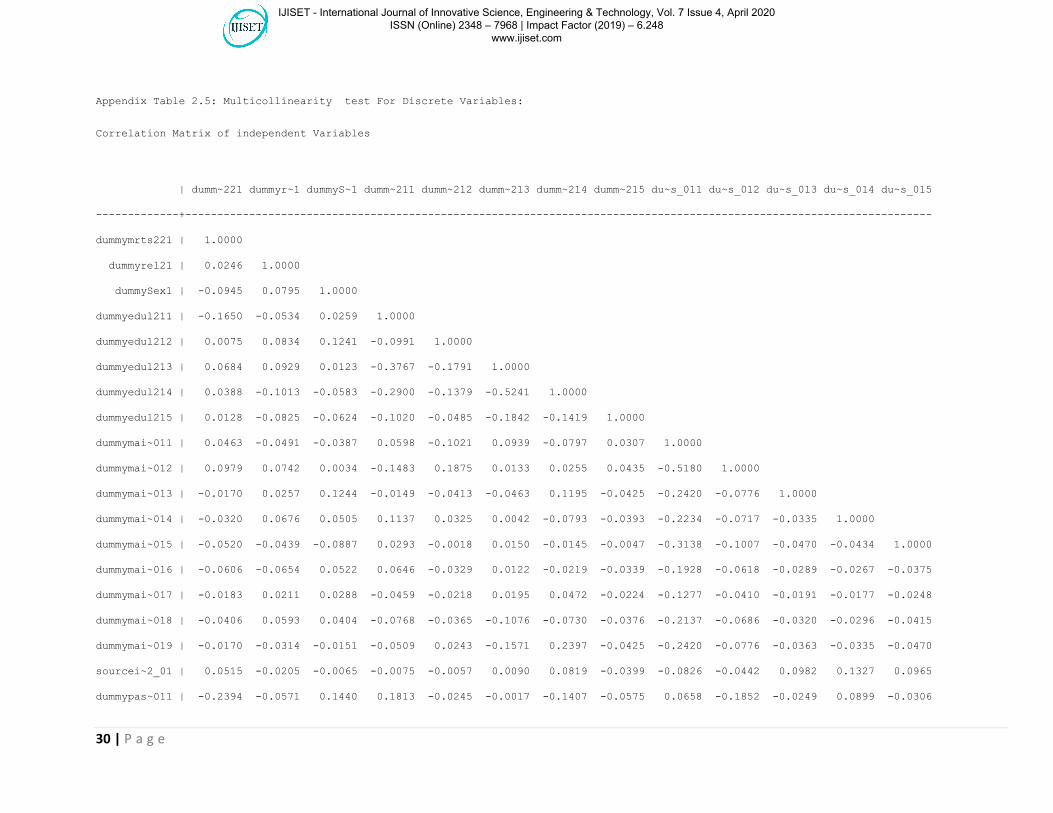
30 | P a g e
Appendix Table 2.5: Multicollinearity test For Discrete Variables:
Correlation Matrix of independent Variables
| dumm~221 dummyr~1 dummyS~1 dumm~211 dumm~212 dumm~213 dumm~214 dumm~215 du~s_011 du~s_012 du~s_013 du~s_014 du~s_015
-------------+---------------------------------------------------------------------------------------------------------------------
dummymrts221 | 1.0000
dummyrel21 | 0.0246 1.0000
dummySex1 | -0.0945 0.0795 1.0000
dummyedul211 | -0.1650 -0.0534 0.0259 1.0000
dummyedul212 | 0.0075 0.0834 0.1241 -0.0991 1.0000
dummyedul213 | 0.0684 0.0929 0.0123 -0.3767 -0.1791 1.0000
dummyedul214 | 0.0388 -0.1013 -0.0583 -0.2900 -0.1379 -0.5241 1.0000
dummyedul215 | 0.0128 -0.0825 -0.0624 -0.1020 -0.0485 -0.1842 -0.1419 1.0000
dummymai~011 | 0.0463 -0.0491 -0.0387 0.0598 -0.1021 0.0939 -0.0797 0.0307 1.0000
dummymai~012 | 0.0979 0.0742 0.0034 -0.1483 0.1875 0.0133 0.0255 0.0435 -0.5180 1.0000
dummymai~013 | -0.0170 0.0257 0.1244 -0.0149 -0.0413 -0.0463 0.1195 -0.0425 -0.2420 -0.0776 1.0000
dummymai~014 | -0.0320 0.0676 0.0505 0.1137 0.0325 0.0042 -0.0793 -0.0393 -0.2234 -0.0717 -0.0335 1.0000
dummymai~015 | -0.0520 -0.0439 -0.0887 0.0293 -0.0018 0.0150 -0.0145 -0.0047 -0.3138 -0.1007 -0.0470 -0.0434 1.0000
dummymai~016 | -0.0606 -0.0654 0.0522 0.0646 -0.0329 0.0122 -0.0219 -0.0339 -0.1928 -0.0618 -0.0289 -0.0267 -0.0375
dummymai~017 | -0.0183 0.0211 0.0288 -0.0459 -0.0218 0.0195 0.0472 -0.0224 -0.1277 -0.0410 -0.0191 -0.0177 -0.0248
dummymai~018 | -0.0406 0.0593 0.0404 -0.0768 -0.0365 -0.1076 -0.0730 -0.0376 -0.2137 -0.0686 -0.0320 -0.0296 -0.0415
dummymai~019 | -0.0170 -0.0314 -0.0151 -0.0509 0.0243 -0.1571 0.2397 -0.0425 -0.2420 -0.0776 -0.0363 -0.0335 -0.0470
sourcei~2_01 | 0.0515 -0.0205 -0.0065 -0.0075 -0.0057 0.0090 0.0819 -0.0399 -0.0826 -0.0442 0.0982 0.1327 0.0965
dummypas~011 | -0.2394 -0.0571 0.1440 0.1813 -0.0245 -0.0017 -0.1407 -0.0575 0.0658 -0.1852 -0.0249 0.0899 -0.0306
IJISET - International Journal of Innovative Science, Engineering & Technology, Vol. 7 Issue 4, April 2020ISSN (Online) 2348 – 7968 | Impact Factor (2019) – 6.248
www.ijiset.com

31 | P a g e
| dummym~6 dumm~017 dumm~018 dumm~019 sou~2_01 du~p_011
-------------+------------------------------------------------------
dummymai~016 | 1.0000
dummymai~017 | -0.0152 1.0000
dummymai~018 | -0.0255 -0.0169 1.0000
dummymai~019 | -0.0289 -0.0191 -0.0320 1.0000
sourcei~2_01 | -0.0040 0.0590 -0.0931 -0.0111 1.0000
dummypas~011 | -0.0550 -0.0615 0.1031 0.0362 -0.0098 1.0000
Annex Table 2.6: Akaike's information criterion and Bayesian information criterion
estat ic
-----------------------------------------------------------------------------
Model | Obs ll(null) ll(model) df AIC BIC
-------------+---------------------------------------------------------------
. | 400 -247.2815 -218.8403 24 485.6806 581.4758
-----------------------------------------------------------------------------
Note: N=Obs used in calculating BIC; see [R] BIC note
IJISET - International Journal of Innovative Science, Engineering & Technology, Vol. 7 Issue 4, April 2020ISSN (Online) 2348 – 7968 | Impact Factor (2019) – 6.248
www.ijiset.com
Related Documents