LETTER Causes and projections of abrupt climate-driven ecosystem shifts in the North Atlantic Gre ´ gory Beaugrand, 1 * Martin Edwards, 2 Keith Brander, 3 Christophe Luczak 1,4 and Frederic Ibanez 5 Abstract Warming of the global climate is now unequivocal and its impact on EarthÕ functional units has become more apparent. Here, we show that marine ecosystems are not equally sensitive to climate change and reveal a critical thermal boundary where a small increase in temperature triggers abrupt ecosystem shifts seen across multiple trophic levels. This large-scale boundary is located in regions where abrupt ecosystem shifts have been reported in the North Atlantic sector and thereby allows us to link these shifts by a global common phenomenon. We show that these changes alter the biodiversity and carrying capacity of ecosystems and may, combined with fishing, precipitate the reduction of some stocks of Atlantic cod already severely impacted by exploitation. These findings offer a way to anticipate major ecosystem changes and to propose adaptive strategies for marine exploited resources such as cod in order to minimize social and economic consequences. Keywords Abrupt ecosystem shift, critical thermal boundary, North Atlantic Ocean, plankton, the Atlantic cod, variance. Ecology Letters (2008) 11: 1157–1168 INTRODUCTION Warming of the global climate is now unambiguous and its impact on EarthÕs functional units has become more apparent (Intergovernmental Panel on Climate Change 2007). In recent years, evidence has grown that climate variation can impact the biodiversity, structure and func- tioning of marine ecosystems (Beaugrand et al. 2002; Drinkwater et al. 2003; Edwards & Richardson 2004; Ottersen et al. 2004). Many significant covariations between changes in climate and in the abundance of marine species, ranging from plankton to fish to seabirds, have been reported (Aebischer et al. 1990; Beaugrand & Reid 2003). Latitudinal or biogeographical shifts have been identified and interpreted as reflecting the response of the ecosystems to rising temperature (Beaugrand et al. 2002; Perry et al. 2005). Some works have suggested that climate may also modify the timing of important developmental and behavio- ural events of organisms (Edwards & Richardson 2004). Such phenological shifts have been detected for some planktonic groups in the North Sea (Edwards & Richardson 2004). Generally, biological changes are species-dependent (Beaugrand et al. 2002; Edwards & Richardson 2004), which can involve community reassembly in time and space (Parmesan & Matthews 2006). Community reassembly is thought to be among the most worrisome consequences of climate change on ecosystems (Parmesan & Matthews 2006) because this process may unbalance the trophodynamics of ecosystems, having the potential to involve trophic mis- match or to perturb prey–predator relationships (Beaugrand et al. 2003; Edwards & Richardson 2004). In some regions, climate variation has been at the origin of large-scale abrupt 1 Centre National de la Recherche Scientifique, Laboratoire dÕOce ´ anologie et de Ge ´ osciencesÕ, UMR LOG CNRS 8187, Station Marine, Universite ´ des Sciences et Technologies de Lille – Lille 1 BP 80, 62930 Wimereux, France 2 Sir Alister Hardy Foundation for Ocean Science, Citadel Hill The Hoe, Plymouth PL1 2PB, UK 3 DTU Aqua, Charlottenlund Slot, 2920 Charlottenlund, Denmark 4 Universite ´ d’Artois, IUFM Nord-Pas-de-Calais, Centre de Grav- elines, 40, rue Victor Hugo, BP 129, 59820 Gravelines, France 5 Laboratoire dÕOceanographie de Villefranche (LOV), BP 28, 06234 Villefranche-sur-Mer Cedex, France *Correspondence: E-mail: [email protected] Ecology Letters, (2008) 11: 1157–1168 doi: 10.1111/j.1461-0248.2008.01218.x Ó 2008 Blackwell Publishing Ltd/CNRS

Welcome message from author
This document is posted to help you gain knowledge. Please leave a comment to let me know what you think about it! Share it to your friends and learn new things together.
Transcript

L E T T E RCauses and projections of abrupt climate-driven
ecosystem shifts in the North Atlantic
Gregory Beaugrand,1* Martin
Edwards,2 Keith Brander,3
Christophe Luczak1,4 and Frederic
Ibanez5
Abstract
Warming of the global climate is now unequivocal and its impact on Earth� functional
units has become more apparent. Here, we show that marine ecosystems are not equally
sensitive to climate change and reveal a critical thermal boundary where a small increase
in temperature triggers abrupt ecosystem shifts seen across multiple trophic levels. This
large-scale boundary is located in regions where abrupt ecosystem shifts have been
reported in the North Atlantic sector and thereby allows us to link these shifts by a
global common phenomenon. We show that these changes alter the biodiversity and
carrying capacity of ecosystems and may, combined with fishing, precipitate the
reduction of some stocks of Atlantic cod already severely impacted by exploitation.
These findings offer a way to anticipate major ecosystem changes and to propose
adaptive strategies for marine exploited resources such as cod in order to minimize social
and economic consequences.
Keywords
Abrupt ecosystem shift, critical thermal boundary, North Atlantic Ocean, plankton,
the Atlantic cod, variance.
Ecology Letters (2008) 11: 1157–1168
I N T R O D U C T I O N
Warming of the global climate is now unambiguous and its
impact on Earth�s functional units has become more
apparent (Intergovernmental Panel on Climate Change
2007). In recent years, evidence has grown that climate
variation can impact the biodiversity, structure and func-
tioning of marine ecosystems (Beaugrand et al. 2002;
Drinkwater et al. 2003; Edwards & Richardson 2004;
Ottersen et al. 2004). Many significant covariations between
changes in climate and in the abundance of marine species,
ranging from plankton to fish to seabirds, have been
reported (Aebischer et al. 1990; Beaugrand & Reid 2003).
Latitudinal or biogeographical shifts have been identified
and interpreted as reflecting the response of the ecosystems
to rising temperature (Beaugrand et al. 2002; Perry et al.
2005). Some works have suggested that climate may also
modify the timing of important developmental and behavio-
ural events of organisms (Edwards & Richardson 2004).
Such phenological shifts have been detected for some
planktonic groups in the North Sea (Edwards & Richardson
2004). Generally, biological changes are species-dependent
(Beaugrand et al. 2002; Edwards & Richardson 2004), which
can involve community reassembly in time and space
(Parmesan & Matthews 2006). Community reassembly is
thought to be among the most worrisome consequences of
climate change on ecosystems (Parmesan & Matthews 2006)
because this process may unbalance the trophodynamics of
ecosystems, having the potential to involve trophic mis-
match or to perturb prey–predator relationships (Beaugrand
et al. 2003; Edwards & Richardson 2004). In some regions,
climate variation has been at the origin of large-scale abrupt
1Centre National de la Recherche Scientifique, Laboratoire
d�Oceanologie et de Geosciences�, UMR LOG CNRS 8187, Station
Marine, Universite des Sciences et Technologies de Lille – Lille 1
BP 80, 62930 Wimereux, France2Sir Alister Hardy Foundation for Ocean Science, Citadel Hill
The Hoe, Plymouth PL1 2PB, UK
3DTU Aqua, Charlottenlund Slot, 2920 Charlottenlund, Denmark4Universite d’Artois, IUFM Nord-Pas-de-Calais, Centre de Grav-
elines, 40, rue Victor Hugo, BP 129, 59820 Gravelines, France5Laboratoire d�Oceanographie de Villefranche (LOV), BP 28,
06234 Villefranche-sur-Mer Cedex, France
*Correspondence: E-mail: [email protected]
Ecology Letters, (2008) 11: 1157–1168 doi: 10.1111/j.1461-0248.2008.01218.x
� 2008 Blackwell Publishing Ltd/CNRS

ecosystem shifts (Hare & Mantua 2000; Reid et al. 2001;
Beaugrand et al. 2002). Such phenomena, also called
regime shifts (Hare & Mantua 2000; Reid et al. 2001), are
characterized by a sudden and substantial change in the state
of an ecosystem (Scheffer et al. 2001) and involve major
biological modifications such as those documented above,
often with implications for exploited resources (Cury et al.
2003). These phenomena remain generally poorly
understood, and some abrupt changes (e.g. the North
Pacific Ocean (Hare & Mantua 2000) and the North Sea
(Reid et al. 2001)) have only been reported years or decades
after they had actually occurred (Hare & Mantua 2000; Reid
et al. 2001). It is likely that climate change will intensify the
frequency of these phenomena (Beaugrand 2004b).
However, climate also interacts with anthropogenic forces
such as fishing (Cury et al. 2003), which has also been
involved in abrupt ecosystem shifts ( Frank et al. 2005).
Some important effects of overfishing include depletion of
spawning stock biomass and truncation of the age–size
structure of stocks (Hsieh et al. 2006). These effects tend to
concentrate the reproduction in time and space and reduce
the quantity and the quality of eggs, which in turn decrease
the resilience of stocks to environmental variability (Cury
et al. 2003). In extreme cases, fishing makes the population
dynamics almost exclusively driven by fluctuations in
recruitment, which is likely to increase sensitivity of the
stocks to climate variability (Hsieh et al. 2006). Climate and
fishing interactions remain difficult to disentangle and
quantify in space and time making it difficult to generalize
across systems. In this report, using a new technique based
on the estimation of the local variance, we first identify a
large-scale ecological threshold in the North Atlantic
influenced by the temperature regime and at the origin of
pronounced biological changes seen across multiple trophic
levels (phytoplankton to zooplankton to the Atlantic cod).
Then, we investigate the long-term decadal changes in the
location of this boundary and show the link between
the long-term changes in its location and a major and
well-documented ecosystem shift in the North Sea. We
suggest that this threshold, mediated by the temperature
regime, provides an improved understanding on phenomena
at the origin of climate-driven ecosystem shifts. The possible
link between spatial changes in the large-scale ecological
threshold and other documented ecosystem shifts is also
discussed. These results allow us to predict the likely
location and timing of future prominent ecosystem changes
(and associated shifts in the carrying capacity of the
ecosystem and in cod recruitment) in the North Atlantic.
In this study, climate change refers to any change in
climate either due to natural variability or as a result of
human activity ( Intergovernmental Panel on Climate
Change 2007). Marine ecosystems may already be
responding to global warming, but they will do in a complex
manner through existing hydro-climatic channels such as the
North Atlantic Oscillation (NAO).
M A T E R I A L S A N D M E T H O D S
Biological and physical data
Phytoplankton data
We used upper-ocean chlorophyll concentration as an
indicator of the carrying capacity of the ecosystem
(Longhurst 1998). This parameter has been extensively used
by Longhurst (1998) to divide the marine biosphere into
biomes and provinces. Data come from a monthly
climatology (1997–2006) derived from the project and
satellite SeaWIFS (Sea-viewing Wide Field-of-view Sensor;
http://oceancolor.gsfc.nasa.gov). When long-term changes
were investigated (1958–2005), we used instead the Phyto-
plankton Colour Index (PCI). This parameter was assessed
by the Continuous Plankton Recorder (CPR) survey, an
upper layer plankton community monitoring programme
that has been operated on a routine monthly basis in the
North Atlantic and in the North Sea since 1946 (Reid et al.
2003). A recent study has shown that PCI covaries well
with satellite-based upper-ocean chlorophyll concentration
(Raitsos et al. 2005).
Zooplankton data
Zooplankton data also originated from the CPR survey
(1958–2005). We focussed on diversity and mean size of
calanoid copepods. Both diversity and mean size of
organisms are key properties of a pelagic ecosystem
(Longhurst 1998; Beaugrand 2005). The parameters distin-
guish well different types of pelagic ecosystems and can
potentially be used as indicators to detect a biogeographical
shift (Beaugrand 2005). Both descriptors inform on the state
of the ecosystem and the way it works (Brown et al. 2004).
We assessed these two functional attributes for calanoid
copepods because this group is well sampled by the CPR
survey and taxonomic identification goes to the species level
(Beaugrand et al. 2003). Diversity of calanoid copepods was
assessed by the Gini coefficient (Lande 1996). It corre-
sponds to the probability that two randomly chosen
individuals from a given community are different species.
It has been demonstrated that a non-biased estimator exists
for this index (Lande 1996). We chose the minimum size of
female as adult females or copepodite stage V to represent
the majority of copepods caught in the samples (Beaugrand
et al. 2003).
Plankton community structure in the North Sea
The CPR survey has monitored more than 400 plankton
species or taxa (phytoplankton and zooplankton) since 1958
on a monthly basis. We also used this information to
1158 G. Beaugrand et al. Letter
� 2008 Blackwell Publishing Ltd/CNRS

characterize plankton ecosystem changes that occurred in
the North Sea during the period 1958–2005. We extend the
index on copepod community structure proposed by
(Beaugrand 2004b) to the whole plankton. An annual mean
was calculated for all species or taxonomic groups using the
procedure described in (Beaugrand 2004a). Then, species or
taxonomic groups with an annual relative abundance
> 0.001 and a presence > 30% for all years of the period
1958–2005 were selected, following the procedure described
in Ibanez & Dauvin (1988). This procedure allowed the
selection of 115 species or taxonomic groups (50 diatom
species, 23 dinoflagellates species, 22 copepod species and
20 other zooplankton taxa including fish eggs and larvae).
Abundance data in the matrix (48 years · 115 species or
taxonomic group) were transformed using the function
log10(x + 1). Then, a principal component analysis (PCA)
was performed on the correlation matrix (115 · 115
species) to identify the main pattern of long-term changes
in plankton community structure (examination of principal
components). We retained the first principal component as
an index of plankton community structure change for the
period 1958–2005.
Probability of cod occurrence and long-term changes in Atlantic cod
recruitment (age 1)
To examine potential consequences of plankton changes
on higher trophic levels, we selected data on the Atlantic
cod (Gadus morhua L.). This important species is well
represented in the spatial domain covered by the CPR
survey and a large amount of information exists for it. We
selected the species because previous studies suggest that
the annual recruitment of the Atlantic cod could be linked
to plankton changes, either directly through prey–predator
interaction during the larval stage (Beaugrand et al. 2003)
or indirectly if our plankton indicators reflect more than
changes in plankton ecosystems. Many studies have
recently provided compelling evidence of a tight ben-
thic–pelagic coupling (e.g. Beaugrand et al. 2003; Frank
et al. 2005). To the best of our knowledge, this test of a
link between the Atlantic cod and plankton has not been
attempted at ocean basin scale. Data of probability of cod
occurrence was taken from Fishbase (http://www.fish-
base.org). Probability data of cod occurrence originated
from a relative habitat suitability model initially developed
for mapping mammal species distribution (Kaschner et al.
2006) and then adapted to map the probability of
occurrence of all marine organisms. A total of 62 160
data points were used to produce the probability map. No
distinction was made on age but data reflect mainly the
occurrence of cod ‡ 1 year (http://www.fishbase.org).
Data on cod recruitment (at age 1) for the period 1963–
2005 were derived from virtual population analysis and
obtained from http://www.ices.dk. These data were used
to examine the impact of changes in the spatial location
of the large-scale ecological boundary on the North Sea
ecosystem state.
Sea surface temperature
Observed sea surface temperature (SST) data (1960–2005)
were extracted from the database International Compre-
hensive Ocean-Atmosphere Data Set (ICOADS, longitudes
with a spatial resolution of 1� longitude · 1� latitude;
http://icoads.noaa.gov; Woodruff et al. 1987). We also used
ICOADS SST data with a spatial resolution of 2�longitude · 2� latitude to cover the period 1958–2005 in
the North Sea.
To assess the potential impact of changes in SST on
North Atlantic plankton ecosystems, data (1990–2100) from
the ECHAM 4 (EC for European Centre and HAM for
Hambourg) model were used. This Atmosphere-Ocean
General Circulation Model (AOGCM) has a horizontal
resolution of 2.8� latitude and 2.8� longitude (Roeckner et al.
1996). The present data were selected by the Intergovern-
mental Panel on Climate Change based on criteria among
which are physical plausibility and consistency with global
projections. Data are projections of monthly skin temper-
ature equivalent above the sea to SST (http://ipcc-
ddc.cru.uea.ac.uk). Data used here are modelled data based
on scenario A2 (concentration of carbon dioxide of
856 ppmv by 2100) and B2 (concentration of carbon
dioxide of 621 ppmv by 2100) (Intergovernmental Panel on
Climate Change 2007). Scenario A2 supposes an increase of
CO2 with a rate similar to what is currently observed. In
scenarios A2 and B2, the world population reaches 15.1 and
10.4 billion people by 2100 respectively (Intergovernmental
Panel on Climate Change 2007). Data are projections of
monthly skin temperature equivalent above the sea to SST
(http://ipcc-ddc.cru.uea.ac.uk).
Oxygen data
Dissolved oxygen data (in mL L)1) were obtained from the
World Ocean Atlas (2001). This monthly climatology has a
spatial resolution of 1� longitude · 1� latitude.
Analyses of the data
Analysis 1: spatial interpolation of biological data
An annual climatology was calculated for upper-ocean
chlorophyll concentration (1997–2006), diversity and mean
size of calanoid copepods (1958–2005), probability of cod
occurrence and all environmental parameters (SST; 1960–
2005). Spatial interpolation of the data was used to create a
common spatial grid for all biological and physical param-
eters. We used the inverse squared distance interpolation
technique (Beaugrand et al. 2002). The spatial grid (from
99.5 �W to 19.5 � E and from 30.5 � to 69.5 �N) had a spatial
Letter Causes and projections of abrupt climate-driven ecosystem shifts 1159
� 2008 Blackwell Publishing Ltd/CNRS

resolution of 1� latitude · 1� longitude. These data were used
to evaluate how upper-ocean chlorophyll concentration,
mean size and diversity of calanoid copepods and probability
of cod occurrence change as a function of SST (Fig. 1).
Analysis 2: assessment of the local variance of biological parameters as
a function of temperature or time
The magnitude of biological changes was assessed by
calculating the local variance of biological parameters as a
(a)
(b)
(c)
(d)
Figure 1 Climatological annual mean distribution of upper-ocean chlorophyll concentration as measured by SeaWIFS (a, left; 1997–2006);
diversity (Gini index; 1958–2005) of calanoid copepods as measured by the CPR survey (b, left); mean size of female calanoid copepods (c,
left; 1958–2005), mean probability of cod occurrence (d, left) and the local variance of these biological parameters as a function of sea surface
temperature (right). Each point denotes a geographical pixel on the map. High values of local biological variance are mainly detected between
9 and 12 �C with a maximum between 9 and 10 �C, indicating substantial variability in these functional attributes in regions with a
temperature regime of 9–10 �C. Red bars, showing the assessment of the (multivariate) variance when all three indicators are combined,
confirmed that high values of variance are located between 9 and 10 �C. Grey lines denote the isobath 200 m.
1160 G. Beaugrand et al. Letter
� 2008 Blackwell Publishing Ltd/CNRS

function of SST (Fig. 1) or time (Fig. 3). We used a
technique that we derived from the method of point
cumulative semi-variogram (PCSV) proposed by Sen (1998)
and recently applied and tested in the marine realm by
Beaugrand & Ibanez (2002). Let X(m,p) be a matrix with m
observations and p biological variables and Y(m,1) the vector
of SST or time corresponding to the m observations of X.
When P = 1 (univariate case), the PCSV c(i) of X(m,1) at
observation i (1 £ i £ m) can be calculated as follows (Sen
1998):
c ið Þ ¼1
2
Xm�1
j¼1
xi � xj
� �2; ð1Þ
where xi the value of X at observation i and xj the value of X
corresponding to the jth observation (1 £ j £ m ) 1). In the
multivariate case (P > 1), the p variables of the matrix X(m,p)
are first scaled to unit 1 by scaling normalization by means of
the Pythagoras formula (Legendre & Legendre 1998). Each
vector (variable) in X has a length of one and therefore
contributes equally to the assessment of the local variance. We
calculated the PCSV c(i) in the multivariate case as follows:
c ið Þ ¼1
2
Xm�1
j¼1
Xp
k¼1
xi;k� xj ;k
� �2; ð2Þ
where xi,k the value of the kth variable of X (1 £ k £ p) at
observation i and xj,k the value of the kth variable of X
corresponding to the jth observation (1 £ j £ m ) 1). In the
uni- and multivariate cases, eqn 1 or 2 leads to a matrix
G(m)1,m) that encompasses the half-squared differences
between all biological values. Simple measures of distance can
then be utilized to evaluate how the local variance of X(m,p)
increased with the distance from observation i. The distance
between an interval (i and j ) of the physical variable or time
was calculated identically in the uni- and multivariate cases:
dðiÞ ¼Xm�1
j¼1
yi � yj
�� ��; ð3Þ
where yi the value of Y at observation i and yj the j th value
of Y. This step leads to a matrix D(m )1,m). Then, each
column of D is sorted by increasing order and the
corresponding variances in G are rearranged. For each
column, variance c(i ) of the sorted matrix G are progres-
sively pooled and the cumulated local variance of X can be
plotted as a function of the distance from observation i
(Beaugrand & Ibanez 2002). Each column of the sorted and
cumulated variance matrix G*(m )1,m) represents a PCSV, and
there are therefore as many local assessments of the variance
of x as values of Y. This analysis allows an examination of
the local behaviour of the biological variable(s) X(m, p)
around observation i of the physical variable (or time).
Finally, fixing a value of distance (i.e. temperature change or
time difference) allows the determination of a value of local
variance at observation i. It then becomes possible to plot
and examine the local variance of the biological parameter(s)
as a function of SST or time. In this study, all analyses were
carried out by considering a difference threshold of ±0.2 �C
of SST change when temperature data were used (Fig. 1)
and a difference threshold of ±5 years when calculation was
based on time (Fig. 3b). An average of values of variance
was calculated for each degree of temperature change or
each year when the analysis was based on time. If the
response of the biology to change in temperature is linear,
the variance should remain constant. However, if the
response is nonlinear, a pronounced increase in variance
allows shift or bifurcation points to be detected.
Analysis 3: mapping of changes in SST
Mean annual SST were mapped for each decade from 1960
to 1999, for the period 2000–2005 and for the period 2090–
2099 to see how the ecological boundary changed from
1960 onwards and where it is expected to be located if
temperature changes follow a scenario B2 (Fig. 2).
Analysis 4: long-term changes in ecosystem state and variability
A PCA was applied on the matrix �Years (1958–2005)� ·�5 ecosystem indicators� using the CPR PCI, the diversity
and mean size of calanoid copepods, cod recruitments data
and the index of plankton ecosystem structure to examine
long-term changes in the ecosystem state in the North Sea
(Fig. 3). The local variance (see Analysis 2, univariate case)
was calculated directly on the first principal component to
examine long-term changes in ecosystem variability.
Analysis 5: SST changes in the Eastern Scotian Shelf and the Baltic
Sea
We examine the mean annual SST changes in two regions
[the Eastern Scotian Shelf (Frank et al. 2005); the Baltic Sea
(Alheit et al. 2005)] where ecosystem shifts have been
documented (Fig. 4). We calculated the average of annual
SST for two periods 1960–1979 and 1990–2005 (before and
after the shifts) and the difference of mean annual SST
between 1990–2005 and 1960–1979.
Analysis 6: projection of temperature changes (scenarios A2 and B2)
We used ECHAM 4 data (scenarios A2 and B2) to
determine the year when the temperature regime becomes
> 10 �C (Fig. 5). The threshold of 10 �C was selected
because it corresponds to the establishment of the Atlantic
Westerly Winds Biome. Prior to the mapping, we spatially
reinterpolated the data, which were originally on 2.8�longitude · 2.8� latitude, on a grid of 1� longitude · 1�latitude.
When correlation was calculated between time series, the
probability of the correlation coefficient was corrected by
Letter Causes and projections of abrupt climate-driven ecosystem shifts 1161
� 2008 Blackwell Publishing Ltd/CNRS

adjusting the degree of freedom to consider temporal
autocorrelation (Beaugrand & Reid 2003).
R E S U L T S A N D D I S C U S S I O N
We focussed on the relationships between biological
variance, sea temperature and time in the North Atlantic
Ocean and its adjacent seas. The variance of a popula-
tion ⁄ system has been used in ecology in the past as a
measure of �temporal stability� and more recently as an
indicator of an approaching major phase transition (Car-
penter & Brock 2006). We assessed changes in the (local)
variance of upper-ocean chlorophyll concentration (as
measured by SeaWIFS), both diversity and mean size of
calanoid copepods, a taxonomic group well monitored by
the CPR survey and probability of cod occurrence derived
from an habitat model (Kaschner et al. 2006) as a function
of mean annual SST (Analysis 2). The plankton parameters
are key indicators of a biome (Longhurst 1998) and some of
them (diversity and mean size) covaried significantly to long-
term changes in cod recruitment in the North Sea
(Beaugrand 2003; Beaugrand et al. 2003). We found a
pronounced nonlinearity in the response of all four
biological parameters to temperature (Fig. 1), showing high
local biological variance at temperatures (i.e. annual mean of
SST) in the range from 9 to 12 �C with a maximum located
between 9 and 10 �C. The zone of high variability is a bit
larger for chlorophyll concentration because of a secondary
relationships between this indicator and both the bathym-
etry and the proximity to the coasts. It is notable that we
found the same critical thermal boundary for chlorophyll
concentration (SeaWIFS), diversity and size of calanoids as
well as probability of cod occurrence, data encompassing
three different trophic levels and of different origin. Our
results indicate that the sensitivity of ecosystems to
temperature change depends on whether they are close to
the critical thermal boundary of 9–10 �C, which represents a
large-scale ecological threshold in the North Atlantic Ocean.
The critical thermal boundary coincided with the transi-
tional region between the Atlantic Polar and the Atlantic
Westerly Winds biome (Longhurst 1998; Fig. 2a). These
results indicate that the southern edge of the spatial
distribution of cod is linked to the position of the boundary
between the Atlantic Polar Biome and the Atlantic Westerly
Winds Biome (Longhurst 1998). The concomitant increase
in variance between 9 and 10 �C of plankton indicators and
cod shows that the cod distribution is tightly coupled with a
system characterized by higher concentration in chlorophyll,
lower diversity but copepods of greater size and obviously
annual SST lower than 10 �C. Our study cannot definitively
conclude on the mechanisms at work. However, three
hypotheses can be formulated. First, the impact of plankton
might happen through biological interactions during the
larval stage (Cushing 1997; Beaugrand et al. 2003). Second,
the plankton parameters we used might be indicators of the
whole ecosystem. Indeed, strong benthic–pelagic coupling
has been suggested in some ecosystems of the North
Atlantic [the Eastern Scotian Shelf (Frank et al. 2005); the
North Sea (Kirby et al. 2007)]. For example, the abrupt
ecosystem shift reported in the North Sea has been detected
(a) (d)
(b) (e)
(c) (f)
Figure 2 Decadal changes in sea surface
temperature and in the isotherm 9–10 �C
(observed and projected). Observed mean
annual sea surface temperature in the North
Atlantic Ocean in the 1960s (a), 1970s (b),
1980s (c), 1990s (d), the period 2000–2005
(e) and projected mean annual sea surface
temperature for the 2090s using scenario B2
(f). The use of scenario A2 gave similar
results to scenario B2 and is not shown here
(Fig. 4). The location of the critical thermal
boundary (9–10 �C) is indicated by �+�.
1162 G. Beaugrand et al. Letter
� 2008 Blackwell Publishing Ltd/CNRS

in both pelagic and benthic ecosystems (Kroncke et al. 1998;
Reid et al. 2001). Using a large number of both biological
(benthic and pelagic organisms) and physical parameters,
Weijerman et al. (2005) also found a clear indication of a
regime shift in the North Sea. Third, as already stated, our
plankton parameters are good indicators of the ecosystem
state and have quite different value in the Atlantic Westerly
Winds and Atlantic Arctic biomes. It is possible that no
direct functional link exists between our plankton indicators
and cod. However, the results are interesting because they
reflect on the capacity of the system to support the fish. If
the boundary moves northwards with climate warming, it is
likely that the cod will have to move northwards. Such a
pattern of change has been detected in the North Sea (Perry
et al. 2005; Rindorf & Lewy 2006) and likely mechanisms
proposed (Beaugrand et al. 2003). However, a debate
remains on whether the species will be able to acclimatize
or whether variability in prey has implications for survival at
the larval stage (e.g. Brander et al. 2006; Neat & Righton
2007).
Our analysis revealed that biome boundaries are highly
sensitive to climate change and that a climate-driven
modification in their geographical locations may be at the
origin of pronounced ecosystem shifts. Examination of the
long-term changes in its position showed a northward shift
with a rate of propagation more rapid in the north-eastern
side of the Atlantic, especially in the North Sea (Fig. 2a–e).
Using forecast temperature data from the coupled AOGCM
ECHAM 4, the critical thermal boundary could move
northwards up to 10� in latitude by 2100 (Fig. 2f). The
threshold coincides with the maximum upper lethal tem-
perature of polar species (Peck & Conway 2000). For
example, the upper critical temperature limit of the
Antarctic eelpout (Pachycara brachycephalum) is c. 9 �C (Dick
van et al. 1999). Heat-induced hyperglycaemia was observed
in this species at both temperatures of 9 and 10 �C. The
cause invoked by the authors to explain final death was a
respiratory possibly associated with a circulation failure. Our
results therefore indicate a possible link between the critical
thermal boundary detected at a macroecological scale and
(a)
(b)
(c)
(d)
Figure 3 (a) Long-term changes in the state of the ecosystem (in blue, first principal component, 65.24% of the total variance) calculated by
applying a PCA on five biological parameters [phytoplankton colour index: correlation r with first principal component: 0.91; mean size of
calanoids: r = 0.84; mean calanoid diversity (Gini index): 0.82; plankton change index: 0.76; cod recruitment: )0.69]. (b) Long-term changes in
ecosystem variability (in red). The light grey rectangle shows the unstable period (1980–1989). (c) Observed mean annual sea surface temperature
in the North Sea during 1960–1981. (d) Observed mean annual sea surface temperature in the North Sea during 1988–2005. The location of the
critical thermal boundary (9–10 �C) is indicated by �+�. The periods 1960–1981 and 1988–2005 were selected on the basis of Fig. 3a,b.
Letter Causes and projections of abrupt climate-driven ecosystem shifts 1163
� 2008 Blackwell Publishing Ltd/CNRS
limits detected at the physiological level. Recent studies have
demonstrated that thermal constraints exist on oxygen
transport (Peck & Conway 2000; Portner & Knust 2007).
Spatial changes in annual mean SST and surface oxygen
concentration are evidently related negatively (r = )0.98;
P < 0.0001; n = 37055 using data from a grid of 1� · 1� for
the whole of the oceanic hydrosphere). Given the excellent
relationships between mean annual SST and mean annual
concentration in oxygen, the critical thermal boundary
detected between 9 and 10 �C means that substantial
changes in the ecosystem state arise when a concentration of
oxygen of between 6.45 and 6.60 mg L)1 is crossed
(Fig. S1). The ecological threshold we identified could
reflect an abrupt change in oxygen limitation, which could
impact organism physiology through mechanisms such as
the capacity of organisms to perform aerobically (Portner &
Knust 2007).
Annual wind intensity, mainly driven by the North
Atlantic Oscillation (Dickson et al. 1996), increased from the
beginning of the 1980s, reinforced in the 1990s and then
decreased from 2000 onwards (Fig. S2). This increase in
wind intensity, with a strong positive meridional component
(west-southwesterly wind), is likely to have amplified the
progression of the critical thermal boundary polewards in
(a)
(b)
(c)
(d)
(e)
(f)
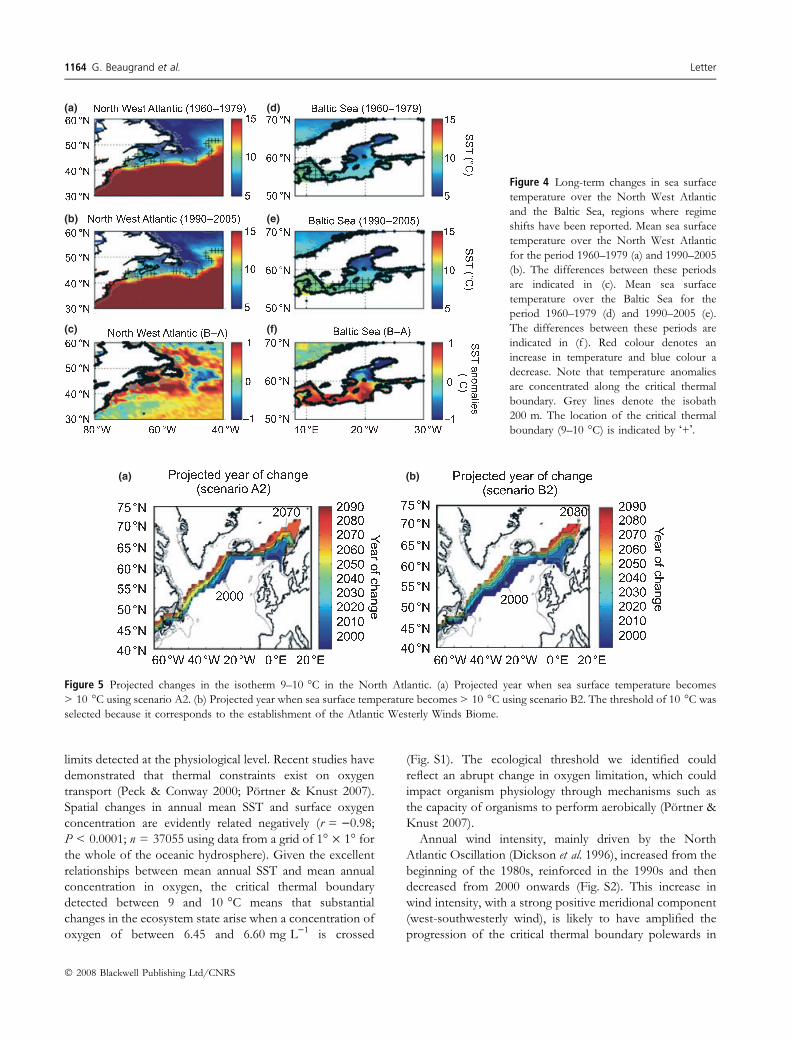
Figure 4 Long-term changes in sea surface
temperature over the North West Atlantic
and the Baltic Sea, regions where regime
shifts have been reported. Mean sea surface
temperature over the North West Atlantic
for the period 1960–1979 (a) and 1990–2005
(b). The differences between these periods
are indicated in (c). Mean sea surface
temperature over the Baltic Sea for the
period 1960–1979 (d) and 1990–2005 (e).
The differences between these periods are
indicated in (f ). Red colour denotes an
increase in temperature and blue colour a
decrease. Note that temperature anomalies
are concentrated along the critical thermal
boundary. Grey lines denote the isobath
200 m. The location of the critical thermal
boundary (9–10 �C) is indicated by �+�.
(a) (b)
Figure 5 Projected changes in the isotherm 9–10 �C in the North Atlantic. (a) Projected year when sea surface temperature becomes
> 10 �C using scenario A2. (b) Projected year when sea surface temperature becomes > 10 �C using scenario B2. The threshold of 10 �C was
selected because it corresponds to the establishment of the Atlantic Westerly Winds Biome.
1164 G. Beaugrand et al. Letter
� 2008 Blackwell Publishing Ltd/CNRS

the north-eastern part of the North Atlantic and may have
well contributed to the northward biogeographical move-
ments of some planktonic groups reported in this region
(Beaugrand et al. 2002). The smaller changes observed in the
western side are probably related to greater hydrological
forcing (Krauss et al. 1990) and weaker and westerly winds,
thereby limiting northward advection over the Canadian
shelf.
The North Sea is among the most biologically productive
ecosystems in the world and supports important fisheries
(Reid & Edwards 2001). Major changes, called regime shift
(Reid et al. 2001), have been reported in this region
(Beaugrand 2004b). We examined whether the large-scale
northward movements in the location of the critical thermal
boundary (Fig. 2) could be at the origin of the shift. We
compiled data from the CPR survey for the period 1958–
2005 using for the first time all available species or
taxonomic groups. An index of the ecosystem state was
created by applying a standardized PCA on five biological
parameters [index of the plankton community structure
(first principal component, representing a significant part of
total variance of 18.95%, from a PCA performed on 115
plankton species, see Supplementary material), mean size
and diversity of calanoids, PCI, cod recruitment at age 1,
Fig. S3] for the period 1958–2005 (Fig. 3a). This analysis
combined with the assessment of local temporal variance of
the first principal component revealed that the 1980s is
overall a period of high variability (Fig. 3b). All five
biological parameters considered in the analysis were highly
correlated to the first principal component (PCI: correlation
r with first principal component: 0.91; mean size of
calanoids: r = 0.84; mean calanoid diversity (Gini index):
0.82; plankton change index: 0.76; cod recruitment: )0.69;
P < 0.05 for all parameters after adjusting for temporal
autocorrelation), explaining 65.24% of the total variance.
Changes in the ecosystem state and variability coincided
with the northward shift in the biome boundary linked to
temperature changes (Fig. 3c–d, Fig. S4). It is important to
remember that the northward shift has probably been
exacerbated by the increase in west-southwesterly winds
linked to a prolonged positive phase of the North Atlantic
Oscillation. As expected, the coefficient of variation (CV) of
the first principal component (index of the ecosystem state
representing 18% of the total variance, see Fig. 3c) for the
first period (1960–1981; CV = 36.98%) was greater than
during the second period (1988–2005; CV = 10.26%) and
this despite the higher variability in the temperature regime
in 1988–2005 (mean annual SST = 9.86 �C and CV in
annual SST = 3.33% for 1960–1981 and mean annual
SST = 10.50 �C and CV in annual SST = 3.86% for 1988–
2005).
It is interesting to note that the critical thermal boundary
links two other regions (the Baltic Sea and the North West
Atlantic) where abrupt ecosystem shifts have been reported
(Alheit et al. 2005; Frank et al. 2005). Strong increases in
temperature were detected in the two regions (Fig. 4,
Fig. S5). The pronounced change in the dynamic regime of
the Eastern Scotian Shelf ecosystem (and adjacent systems)
has been primarily driven by overfishing but it has also been
suggested that climate could have played a role (Frank et al.
2005). No such ecosystem shift has been reported in other
regions covered by this study, which seems to indicate that
shifts are likely to occur over vulnerability hot spots
(regional discontinuities characterized by high biological
variance) represented here by the isotherm 9–10 �C. The
Southern Gulf of St Lawrence, Grand Banks and Flemish
Cap are also crossed by the critical thermal boundary.
Although we present evidence for the effect of the
boundary shift on ecosystems and on cod populations,
there are of course many areas in which this explanation
does not apply. Cod populations have declined in most areas
due to fishing pressure and where they have also been
subject to adverse environmental change (e.g. West Green-
land, South Labrador; Brander et al. 2006), the populations
collapsed, which may have resulted in increases in their prey
populations and in major ecosystem changes. We did not
evaluate the impact of fishing on cod. Future work could
use the proposed technique to identify and quantify
potential tipping point, which might differ from a region
to another depending upon the carrying capacity of the
ecosystem. In this study, we think we provide compelling
evidence to explain ecosystem shifts associated with the
movement of a biogeographical boundary represented by
the isotherm of 9–10 �C and mediated by climate, not
changes related fishing pressure or the direct effects of
adverse environmental changes on cod.
We believe that ecosystem changes observed in this study
are mainly related to temperatures as this is the only
parameter that links the western to the eastern part of the
North Atlantic, the North Sea and the Baltic Sea. However,
the critical thermal boundary found in this study is a proxy
for many environmental conditions. For example, annual
mean and seasonal variability (assessed here by the
calculation of the CV) in SST are significantly correlated
negatively (r = )0.70, P = 0.0003, n = 29 523; period
1960–2005 using data from a grid of 1� · 1� for the whole
of the oceanic hydrosphere). Therefore, seasonal stability
increases when temperature rises. Such factors are among
the most important candidates to explain the ecogeograph-
ical pattern in species richness observed between the poles
and the tropics (Rohde 1992). This increase in temperature
(and seasonal stability) could explain the augmentation in
North Sea calanoid copepod diversity observed in this study
as temperature rose by c. 1 �C. These changes in diversity
was temporally synchronous with a reduction in the mean
size of copepods (r = )0.75, P = 0.0021; Fig. S2). Such
Letter Causes and projections of abrupt climate-driven ecosystem shifts 1165
� 2008 Blackwell Publishing Ltd/CNRS

modifications are expected from the large-scale distribution
of these parameters (Fig. 1). The increase in diversity should
not be interpreted either as an indication of an improved
stability of North Sea ecosystems or being positive for
ecosystem resilience but rather as an adaptation of the
ecosystem to temperature rise (and less seasonality) or a
fingerprint of a climate-induced biome shift.
Using ECHAM 4 modelled temperature data, we show
the time from when SST is expected to become > 10 �C in
the North Atlantic (i.e. when the system develops into a full
temperate biome; Fig. 5a,b). Before performing the analy-
ses, we compared observed and modelled data for the
period 1990–2005 (Fig. S6). Modelled and observed data on
annual SST were highly positively correlated in the area
covered by this study (Fig. S5; r = 0.95, P < 0.0001,
n = 1809), showing that the model captures relatively well
the complexity of the hydro-climatic environment of the
region at a decadal scale. However, it should be noted that
the North Atlantic Ocean is a region where natural hydro-
climatological variability is large (Keenlyside et al. 2008).
Although the correlation between modelled and observed
SST data on a year-to-year basis is also significantly high
(r = 0.93, P < 0.0001, n = 29527) for the period of
reference 1990–2005, the difference between observed and
modelled SST data is greater than when averaged at a
decadal scale, indicating that the projections are sensitive to
large-scale natural variability at a year-to-year scale. Scenar-
ios of changes in SST, in addition to observed sea
temperature changes (Fig. 2), suggest that an increase in
cod stock to pre-1980s conditions in the North Sea is
extremely improbable (even with a substantial decrease in
fishing pressure). This region is now well above the critical
thermal boundary (Fig. 2) and recruitment is likely to remain
low in comparison with other periods (e.g. the gadoid
outburst) because the physiological stress related to tem-
perature rise (e.g. increase in larval metabolism and its effect
on energetic demand) has been accompanied by a reduction
in the quantity and quality of prey as well as a mismatch
between the timing of prey and larval occurrence (and
therefore a decrease in energetic gain) (Beaugrand et al.
2003). The coarse spatial resolution of most AOGCM
models (e.g. ECHAM 4) makes the projections of the
isotherm 9–10 �C more difficult to achieve near the coast
and above continental shelves. This potential caveat does
not seem to affect strongly our results but it is clear that
future studies will benefit from improved spatial resolution
of the AOGCM models.
Abrupt shifts are expected to proliferate northwards
during the next century in the south-western part of Norway
(Fig. 5a,b). The boundary propagates quickly but perpen-
dicularly to Norwegian coasts. The migration is more limited
off Canadian coasts but is orientated towards the continent.
This will progressively restrict cod habitat up to the South
Labrador region. There, the interplay between fishing and
climate is likely to be maximal. The ecosystems can exhibit
local stability but are globally unstable (Begon et al. 2006).
Overfishing in these transitional areas could precipitate
collapses of fish stocks, possibly many decades before they
would be expected to occur by the action of climate alone.
Because of the direction of temperature change, the system
is likely to be impossible to reverse once it has shifted
(Scheffer et al. 2001). It is thereby important to adopt a
precautionary approach limiting fishing mortality. This
should, however, remain compatible with social and
economical constraints and new management strategies,
which anticipate the characteristics of the changing ecosys-
tem, should also be prepared. Our projection of temperature
changes are scenarios and should not be considered as exact
prediction, but rather as general guidelines on what could
happen and as an aid in conceptualizing a broad strategy on
future climate and fishing interaction.
Our study shows that regions in which a biome
boundary shift occurs appear to be the areas most
vulnerable to climate change impacts in the North Atlantic
while other regions spatially embedded deeply within a
major biome can remain relatively ecologically stable over
long periods. The speed and magnitude of climate warming
is expected to be elevated (Intergovernmental Panel on
Climate Change 2007). It will lead to abrupt ecosystem
shifts and interact with fishing on exploited resources.
Rising variance gives an early warning for ecosystem
managers of an impending abrupt shift. Our results suggest
that we should abandon the paradigm of relative stability
of marine ecosystems and implement a proactive, dynamic
and flexible management strategy, based on a large-scale
ecosystem approach and regular monitoring (Hughes et al.
2005).
A C K N O W L E D G E M E N T S
We are grateful to all past and present members and
supporters of the Sir Alister Hardy Foundation for Ocean
Science whose sustained help has allowed the establishment
and maintenance of the CPR data-set in the long-term.
Consortium support for the CPR survey is provided by
agencies from the following countries: UK, USA, Canada,
Faroe Islands, France, Ireland, the Netherlands, Portugal,
the IOC and the European Union. We thank the owners,
masters and crews of the ships that tow the CPRs on a
voluntary basis. We thank Pierre Helaouet for helping with
the extraction of the SeaWIFS data, Jean-Claude Dauvin for
exiting discussion and Kristin Kaschner (Sea Around Us
Project) for helping with the understanding of the interpo-
lated fish data. This research is part of the French
Programme ZOOPNEC and the European network of
Excellence EUR-OCEANS.
1166 G. Beaugrand et al. Letter
� 2008 Blackwell Publishing Ltd/CNRS

R E F E R E N C E S
Aebischer, N.J., Coulson, J.C. & Colebrook, J.M. (1990). Parallel
long-term trends across four marine trophic levels and weather.
Nature, 347, 753–755.
Alheit, J., Mollmann, C., Dutz, J., Kornilovs, G., Loewe, P.,
Mohrholz, V. et al. (2005). Synchronous ecological regime shifts
in the central Baltic and the North Sea in the late 1980s. ICES
J. Mar. Sci., 62, 1205–1215.
Beaugrand, G. (2003). Long-term changes in copepod abundance
and diversity in the north-east Atlantic in relation to fluctuations
in the hydro-climatic environment. Fisheries Oceanography, 12,
270–283.
Beaugrand, G. (2004a). Monitoring marine plankton ecosystems
(1): description of an ecosystem approach based on plankton
indicators. Mar. Ecol. Prog. Ser., 269, 69–81.
Beaugrand, G. (2004b). The North Sea regime shift: evidence,
causes, mechanisms and consequences. Prog. Oceanogr., 60, 245–
262.
Beaugrand, G. (2005). Monitoring pelagic ecosystems from
plankton indicators. ICES J. Mar. Sci., 62, 333–338.
Beaugrand, G. & Ibanez, F. (2002). Spatial dependence of pelagic
diversity in the North Atlantic Ocean. Mar. Ecol. Prog. Ser., 232,
197–211.
Beaugrand, G. & Reid, P.C. (2003). Long-term changes in phyto-
plankton, zooplankton and salmon linked to climate change.
Global Change Biology, 9, 801–817.
Beaugrand, G., Reid, P.C., Ibanez, F., Lindley, J.A. & Edwards, M.
(2002). Reorganisation of North Atlantic marine copepod bio-
diversity and climate. Science, 296, 1692–1694.
Beaugrand, G., Brander, K.M., Lindley, J.A., Souissi, S. & Reid,
P.C. (2003). Plankton effect on cod recruitment in the North
Sea. Nature, 426, 661–664.
Begon, M., Townsend, C.R. & Harper, J.L. (2006). Ecology. From
Individuals to Ecosystems, 4th edn. Blackwell Publishing, Bath.
Brander, K., Ottersen, G., Wieland, K. & Lilly, G. (2006). Decline
and recovery of North Atlantic cod stocks. GLOBEC interna-
tional Newsletter, 12, 10–12.
Brown, J.H., Gillooly, J.F., Allen, A.P., Savage, V.M. & West, G.B.
(2004). Toward a metabolic theory of ecology. Ecology, 85, 1771–
1789.
Carpenter, S.R. & Brock, W.A. (2006). Rising variance: a
leading indicator of ecological transition. Ecology Letters, 9,
311–318.
Cury, P., Shannon, L. & Shin, Y.-J. (2003). The functioning of
marine ecosystems: a fisheries perspective. In: Responsible Fisheries
in the Marine Ecosystem (eds Sinclair, M. & Valdimarsson, G.).
FAO and CAB international, Rome, pp. 103–123.
Cushing, D.H. (1997). Towards a Science of Recruitment in Fish Popu-
lations. Ecology Institute, Oldendorf ⁄ Luhe.
Dick van, P.L.M., Tesch, C., Hardewig, I. & Portner, H.O.
(1999). Physiological disturbances at critically high tempera-
tures: a comparison between stenothermal antarctic and
eurythermal temperate eelpouts (Zoarcidae). J. Exp. Biol., 202,
3611–3621.
Dickson, R., Lazier, J., Meincke, J., Rhines, P. & Swift, J. (1996).
Long-term coordinated changes in the convective activity of the
North Atlantic. Prog. Oceanogr., 38, 241–295.
Drinkwater, K.F., Belgrano, A., Borja, A., Conversi, A., Edwards,
M., Greene, C.H. et al. (2003). The response of marine ecosys-
tems to climatic variability associated with the North Atlantic
Oscillation. Geophysical monograph, 134, 211–234.
Edwards, M. & Richardson, A.J. (2004). Impact of climate change
on marine pelagic phenology and trophic mismatch. Nature, 430,
881–884.
Frank, K.T., Petrie, B., Choi, J.S. & Leggett, W.C. (2005). Trophic
cascades in a formerly cod-dominated ecosystem. Science, 308,
1621–1623.
Hare, S.R. & Mantua, N.J. (2000). Empirical evidence for North
Pacific regime shifts in 1977 and 1989. Prog. Oceanogr., 47, 103–
145.
Hsieh, C.-H., Reiss, C.S., Hunter, J.R., Beddington, J.R., May, R.M.
& Sugihara, G. (2006). Fishing elevates variability in the abun-
dance of exploited species. Nature, 443, 859–862.
Hughes, T.P., Bellwood, D.R., Folke, C., Steneck, R.S. & Wilson, J.
(2005). New paradigms for supporting the resilience of marine
ecosystems. Trends Ecol. Evol., 20, 380–386.
Ibanez, F. & Dauvin, J.-C. (1988). Long-term changes (1977 to
1987) in a muddy fine sand Abra alba - Melinna palmata com-
munity from the western English Channel: multivariate time
series analysis. Mar. Ecol. Prog. Ser., 49, 65–81.
Intergovernmental Panel on Climate Change, WGI (2007). Climate
Change 2007: Impacts, Adaptation and Vulnerability. Cambridge
University Press, Cambridge.
Kalnay, E., Kanamitsu, M., Kistler, R., Collins, W., Deaven, D.,
Gandin, L. et al. (1996). The NCEP ⁄ NCAR 40-year reanalysis
project. Bulletin of the American meteorology society, 77, 437–470.
Kaschner, K., Watson, R., Trites, A.W. & Pauly, D. (2006). Map-
ping world-wide distributions of marine mammal species using a
relative environmental suitability (RES) model. Mar. Ecol. Prog.
Ser., 316, 285–310.
Keenlyside, N.S., Latif, M., Jungclaus, J., Kornblueh, L. & Roe-
ckner, E. (2008). Advancing decadal-scale climate prediction in
the North Atlantic sector. Nature, 453, 84–88.
Kirby, R.R., Beaugrand, G., Lindley, J.A., Richardson, A.J.,
Edwards, M. & Reid, P.C. (2007). Climate effects and benthic-
pelagic coupling in the North Sea. Mar. Ecol. Prog. Ser., 330,
31–38.
Krauss, W., Kase, R.H. & Hinrichsen, H.-H. (1990). The branching
of the Gulf Stream southeast of the Grand Banks. J. Geophys.
Res., 95, 13089–13103.
Kroncke, I., Dippner, J.W., Heyen, H. & Zeiss, B. (1998). Long-
term changes in macrofaunal communities off Norderney (East
Frisia, Germany) in relation to climate variability. Mar. Ecol. Prog.
Ser., 167, 25–36.
Lande, R. (1996). Statistics and partitioning of species diversity, and
similarity among communities. Oikos, 76, 5–13.
Legendre, P. & Legendre, L. (1998). Numerical Ecology, 2nd edn.
Elsevier Science B.V., the Netherlands.
Longhurst, A. (1998). Ecological Geography of the Sea. Academic Press,
London.
Neat, F. & Righton, D. (2007). Warm water occupancy by North
Sea cod. Proceedings - Royal Society of Edinburgh. Section B: Biology,
274, 789–798.
Ottersen, G., Stenseth, N.C. & Hurrell, J.H. (2004). Climatic
fluctuations and marine systems: a general introduction to the
ecological effects. In: Marine Ecosystems and Climate Variation. The
North Atlantic, a Comparative Perspective (eds Stenseth, N.C.,
Ottersen, G., Hurrell, J.H. & Belgrano, A.). Oxford University
Press, Chippenham, pp. 3–14.
Letter Causes and projections of abrupt climate-driven ecosystem shifts 1167
� 2008 Blackwell Publishing Ltd/CNRS

Parmesan, C. & Matthews, J. (2006). Biological impacts of climate
change. In: Principles of Concervation Biology (eds Groom, M.J.,
Meffe, G.K. & Carroll, C.R.). Sinauer Associates, Inc, Sunder-
land, pp. 333–360.
Peck, L.S. & Conway, L.Z. (2000). The myth of metabolic cold
adaptation: oxygen consumption in stenothermal Antarctic
bivalves. In: The Evolutionary Biology of the Bivalvia (eds Harper,
E.M., Taylor, J.D. & Crame, J.A.). The Geological Society of
London, London, pp. 441–450.
Perry, A.I., Low, P.J., Ellis, J.R. & Reynolds, J.D. (2005). Climate
change and distribution shifts in marine fishes. Science, 308,
1912–1915.
Portner, H.O. & Knust, R. (2007). Climate change affects marine
fishes through the oxygen limitation of thermal tolerance. Science,
315, 95–97.
Raitsos, D.E., Reid, P.C., Lavender, S.J., Edwards, M. & Rich-
ardson, A.J. (2005). Extending the SeaWIFS chlorophyll data set
back 50 years in the northeast Atlantic. Geophys. Res. Lett., 32,
L06603, doi:10.1029/2005GL022484.
Reid, P.C. & Edwards, M. (2001). Long-term changes in the pel-
agos, benthos and fisheries of the North Sea. Senckenb. Marit, 32,
107–115.
Reid, P.C., Borges, M. & Svenden, E. (2001). A regime shift in the
North Sea circa 1988 linked to changes in the North Sea horse
mackerel fishery. Fish. Res., 50, 163–171.
Reid, P.C., Colebrook, J.M., Matthews, J.B.L., Aiken, J.,
Barnard, R., Batten, S.D. et al. (2003). The Continuous Plankton
Recorder: concepts and history, from plankton indicator to
undulating recorders. Prog. Oceanogr., 58, 117–173.
Rindorf, A. & Lewy, P. (2006). Warm, windy winters drive cod
north and homing of spawners keeps them there. Journal of
Applied Ecology, 43, 445–453.
Roeckner, E., Arpe, K., Bengtsson, L., Christoph, M., Claussen,
M., Dumenil, L. et al. (1996). The atmospheric general circu-
lation model ECHAM-4: Model description and simulation of
present-day climate. In: MPI Report 218, edited by the Max-
Planck Institut fur Meteorologie, Hamburg, 90 pp.
Rohde, K. (1992). Latitudinal gradients in species diversity: the
search for the primary cause. Oikos, 65, 514–527.
Scheffer, M., Carpenter, S., Foley, J.A., Folke, C. & Walker, B.
(2001). Catastrophic shifts in ecosystems. Nature, 413, 591–
596.
Sen, Z. (1998). Point cumulative semivariogram for identification
of heterogeneities in regional seismicity of Turkey. Math. Geol.,
30, 767–787.
Weijerman, M., Lindeboom, H. & Zuur, A.F. (2005). Regime shifts
in marine ecosystems of the North Sea and Wadden Sea. Mar.
Ecol. Prog. Ser., 298, 21–39.
Woodruff, S., Slutz, R., Jenne, R. & Steurer, P. (1987). A com-
prehensive ocean-atmosphere dataset. Bulletin of the American
meteorology society, 68, 1239–1250.
S U P P O R T I N G I N F O R M A T I O N
Additional Supporting Information may be found in the
online version of this article.
Figure S1 Relationship between mean annual SST and the
mean annual concentration in oxygen for the whole ocean.
Figure S2 Observed mean annual wind intensity and
direction in the North Atlantic Ocean in the 1960–70s (a),
1980s (b), 1990s (c) and the period 2000–2005 (d).
Figure S3 Long-term biological changes in the North Sea
(1958–2005).
Figure S4 Observed mean annual sea surface temperature in
the North Sea for the period 1980–1989.
Figure S5 Differences in sea surface temperature and wind
intensity between the 1980s and the period 1960–1979
(a, d), the 1990s and the period 1960–1979 (b, e), and the
period 2000–2005 and the period 1960–1979 (c, f).
Figure S6 Relationships between annual observed (COADS)
and modelled (ECHAM 4) SST for the period 1990–2005 in
the North Atlantic (40–80 �N, 80 �W–30 �E).
Please note: Wiley-Blackwell are not responsible for the
content or functionality of any supporting materials supplied
by the authors. Any queries (other than missing material)
should be directed to the corresponding author for the
article.
Editor, Boris Worm
Manuscript received 24 January 2008
First decision made 3 March 2008
Second decision made 7 May 2008
Manuscript accepted 23 May 2008
1168 G. Beaugrand et al. Letter
� 2008 Blackwell Publishing Ltd/CNRS
Related Documents