Cause-specific neonatal mortality: analysis of 3772 neonatal deaths in Nepal, Bangladesh, Malawi and India Edward Fottrell, 1 David Osrin, 1 Glyn Alcock, 1 Kishwar Azad, 2 Ujwala Bapat, 3 James Beard, 1 Austin Bondo, 4 Tim Colbourn, 1 Sushmita Das, 3 Carina King, 1 Dharma Manandhar, 5 Sunil Manandhar, 5 Joanna Morrison, 1 Charles Mwansambo, 6 Nirmala Nair, 7 Bejoy Nambiar, 1 Melissa Neuman, 1 Tambosi Phiri, 8 Naomi Saville, 1 Aman Sen, 5 Nadine Seward, 1 Neena Shah Moore, 3 Bhim Prasad Shrestha, 5 Bright Singini, 8 Kirti Man Tumbahangphe, 5 Anthony Costello, 1 Audrey Prost 1 ▸ Additional material is published online only. To view please visit the journal online (http://dx.doi.org/10.1136/ archdischild-2014-307636). For numbered affiliations see end of article. Correspondence to Dr Edward Fottrell, University College London, Institute for Global Health, 30 Guilford Street, London WC1N 1EH, UK; [email protected] Received 2 October 2014 Revised 13 April 2015 Accepted 14 April 2015 To cite: Fottrell E, Osrin D, Alcock G, et al. Arch Dis Child Fetal Neonatal Ed Published Online First: [ please include Day Month Year] doi:10.1136/ archdischild-2014-307636 ABSTRACT Objective Understanding the causes of death is key to tackling the burden of three million annual neonatal deaths. Resource-poor settings lack effective vital registration systems for births, deaths and causes of death. We set out to describe cause-specific neonatal mortality in rural areas of Malawi, Bangladesh, Nepal and rural and urban India using verbal autopsy (VA) data. Design We prospectively recorded births, neonatal deaths and stillbirths in seven population surveillance sites. VAs were carried out to ascertain cause of death. We applied descriptive epidemiological techniques and the InterVA method to characterise the burden, timing and causes of neonatal mortality at each site. Results Analysis included 3772 neonatal deaths and 3256 stillbirths. Between 63% and 82% of neonatal deaths occurred in the first week of life, and males were more likely to die than females. Prematurity, birth asphyxia and infections accounted for most neonatal deaths, but important subnational and regional differences were observed. More than one-third of deaths in urban India were attributed to asphyxia, making it the leading cause of death in this setting. Conclusions Population-based VA methods can fill information gaps on the burden and causes of neonatal mortality in resource-poor and data-poor settings. Local data should be used to inform and monitor the implementation of interventions to improve newborn health. High rates of home births demand a particular focus on community interventions to improve hygienic delivery and essential newborn care. INTRODUCTION Each year, approximately three million children die in the first 28 days after birth, predominantly due to complications of preterm birth, asphyxia and sepsis. 1–3 With postneonatal mortality declining faster than neonatal mortality, 4 these deaths account for a growing proportion of under-five deaths. Understanding the numbers and causes of neonatal deaths, as well as gender differences and national and subnational variation, is key to realis- ing the Every Newborn Action Plan and post-Millennium Development Goals of a ‘grand convergence’ in health, with substantial reductions in neonatal and child mortality. 5–8 Unfortunately, the resource-poor settings that bear the burden of more than 98% of neonatal deaths often lack the effective vital registration systems crucial to under- standing mortality and planning services or interventions. Advances in epidemiological modelling methods have recently been applied to pooled datasets to characterise neonatal mortality. 5 9 Such estimates are useful at a global level, but have limitations. Broad underlying assumptions, lack of transparency in the data and methods used and restrictions on disaggregating the data limit their relevance at sub- national levels, where there can be substantial vari- ation in rates, trends and cause distributions. There is a growing recognition that measurement rather than modelling is needed 10 11 and frustration at What is already known on this topic? ▸ Globally, there are three million neonatal deaths every year, mostly from prematurity, asphyxia and sepsis. ▸ Ninety-eight per cent of these deaths occur in low-income countries, where poor mortality data hinders intervention strategies. ▸ More direct measurement could guide policy and practice at national and subnational levels. What this study adds? ▸ Population-based verbal autopsy (VA) tools such as InterVA offer a standardised method to directly measure the burden and causes of neonatal mortality in low-income settings. ▸ Although patterns of neonatal death differ between sites, both early and late neonatal mortality remain unacceptably high. ▸ Localised, direct measurement reveals important subnational variations in mortality rates and causes, which might be masked by estimation methods at the national level. Fottrell E, et al. Arch Dis Child Fetal Neonatal Ed 2015;0:F1–F9. doi:10.1136/archdischild-2014-307636 F1 Global child health ADC-FNN Online First, published on May 13, 2015 as 10.1136/archdischild-2014-307636 Copyright Article author (or their employer) 2015. Produced by BMJ Publishing Group Ltd (& RCPCH) under licence. group.bmj.com on May 14, 2015 - Published by http://fn.bmj.com/ Downloaded from

Welcome message from author
This document is posted to help you gain knowledge. Please leave a comment to let me know what you think about it! Share it to your friends and learn new things together.
Transcript
Cause-specific neonatal mortality: analysis of 3772neonatal deaths in Nepal, Bangladesh, Malawiand IndiaEdward Fottrell,1 David Osrin,1 Glyn Alcock,1 Kishwar Azad,2 Ujwala Bapat,3
James Beard,1 Austin Bondo,4 Tim Colbourn,1 Sushmita Das,3 Carina King,1
Dharma Manandhar,5 Sunil Manandhar,5 Joanna Morrison,1 Charles Mwansambo,6
Nirmala Nair,7 Bejoy Nambiar,1 Melissa Neuman,1 Tambosi Phiri,8 Naomi Saville,1
Aman Sen,5 Nadine Seward,1 Neena Shah Moore,3 Bhim Prasad Shrestha,5
Bright Singini,8 Kirti Man Tumbahangphe,5 Anthony Costello,1 Audrey Prost1
▸ Additional material ispublished online only. To viewplease visit the journal online(http://dx.doi.org/10.1136/archdischild-2014-307636).
For numbered affiliations seeend of article.
Correspondence toDr Edward Fottrell, UniversityCollege London, Institute forGlobal Health, 30 GuilfordStreet, London WC1N 1EH,UK; [email protected]
Received 2 October 2014Revised 13 April 2015Accepted 14 April 2015
To cite: Fottrell E, Osrin D,Alcock G, et al. Arch DisChild Fetal Neonatal EdPublished Online First:[please include Day MonthYear] doi:10.1136/archdischild-2014-307636
ABSTRACTObjective Understanding the causes of death is key totackling the burden of three million annual neonataldeaths. Resource-poor settings lack effective vitalregistration systems for births, deaths and causes ofdeath. We set out to describe cause-specific neonatalmortality in rural areas of Malawi, Bangladesh, Nepaland rural and urban India using verbal autopsy (VA)data.Design We prospectively recorded births, neonataldeaths and stillbirths in seven population surveillancesites. VAs were carried out to ascertain cause of death.We applied descriptive epidemiological techniques andthe InterVA method to characterise the burden, timingand causes of neonatal mortality at each site.Results Analysis included 3772 neonatal deaths and3256 stillbirths. Between 63% and 82% of neonataldeaths occurred in the first week of life, and males weremore likely to die than females. Prematurity, birthasphyxia and infections accounted for most neonataldeaths, but important subnational and regionaldifferences were observed. More than one-third ofdeaths in urban India were attributed to asphyxia,making it the leading cause of death in this setting.Conclusions Population-based VA methods can fillinformation gaps on the burden and causes of neonatalmortality in resource-poor and data-poor settings. Localdata should be used to inform and monitor theimplementation of interventions to improve newbornhealth. High rates of home births demand a particularfocus on community interventions to improve hygienicdelivery and essential newborn care.
INTRODUCTIONEach year, approximately three million children diein the first 28 days after birth, predominantly dueto complications of preterm birth, asphyxia andsepsis.1–3 With postneonatal mortality decliningfaster than neonatal mortality,4 these deathsaccount for a growing proportion of under-fivedeaths. Understanding the numbers and causes ofneonatal deaths, as well as gender differences andnational and subnational variation, is key to realis-ing the Every Newborn Action Plan andpost-Millennium Development Goals of a ‘grand
convergence’ in health, with substantial reductionsin neonatal and child mortality.5–8 Unfortunately,the resource-poor settings that bear the burden ofmore than 98% of neonatal deaths often lack theeffective vital registration systems crucial to under-standing mortality and planning services orinterventions.Advances in epidemiological modelling methods
have recently been applied to pooled datasets tocharacterise neonatal mortality.5 9 Such estimatesare useful at a global level, but have limitations.Broad underlying assumptions, lack of transparencyin the data and methods used and restrictions ondisaggregating the data limit their relevance at sub-national levels, where there can be substantial vari-ation in rates, trends and cause distributions. Thereis a growing recognition that measurement ratherthan modelling is needed10 11 and frustration at
What is already known on this topic?
▸ Globally, there are three million neonataldeaths every year, mostly from prematurity,asphyxia and sepsis.
▸ Ninety-eight per cent of these deaths occur inlow-income countries, where poor mortalitydata hinders intervention strategies.
▸ More direct measurement could guide policyand practice at national and subnational levels.
What this study adds?
▸ Population-based verbal autopsy (VA) toolssuch as InterVA offer a standardised method todirectly measure the burden and causes ofneonatal mortality in low-income settings.
▸ Although patterns of neonatal death differbetween sites, both early and late neonatalmortality remain unacceptably high.
▸ Localised, direct measurement revealsimportant subnational variations in mortalityrates and causes, which might be masked byestimation methods at the national level.
Fottrell E, et al. Arch Dis Child Fetal Neonatal Ed 2015;0:F1–F9. doi:10.1136/archdischild-2014-307636 F1
Global child health ADC-FNN Online First, published on May 13, 2015 as 10.1136/archdischild-2014-307636
Copyright Article author (or their employer) 2015. Produced by BMJ Publishing Group Ltd (& RCPCH) under licence.
group.bmj.com on May 14, 2015 - Published by http://fn.bmj.com/Downloaded from
unsatisfactory progress with civil registration systems. Globalbodies, including the WHO, call for the application offit-for-purpose methods for registering deaths and assigningtheir causes in a consistent, systematic and timely manner.12–16
Since 2001, we have implemented community-based surveil-lance of perinatal events along with verbal autopsies (VA) inrural Nepal, Bangladesh, Malawi and urban and rural India.This has enabled us to prospectively document births, neonataldeaths and their causes within geographical areas covering atotal population of approximately 2.4 million. Using these data,we describe the rates, timing and causes of neonatal mortalityfor 3772 deaths from low-income and middle-income settings,highlighting regional and gender disparities and identifyingpriorities for public health intervention.
METHODSStudy populationsWe used data gathered between 2001 and 2011 in cluster rando-mised controlled trials of community mobilisation ‘women’sgroup’ interventions in Bangladesh (Perinatal Care Project(PCP)17 18), Malawi (MaiMwana19 and MaiKhanda20), India(Society for Nutrition, Education and Health Action(SNEHA)21 and Ekjut22) and Nepal (Makwanpur andDhanusha23). The data represent 118 084 births recorded inseven locations with community-based surveillance of perinatalevents. Characteristics of each study population, study timelinesand basic neonatal health indicators are summarised in table 1.Given the documented effect of the women’s group interventionon neonatal mortality,24 only data from counterfactual clusterswithout women’s groups were included in the analysis.Counterfactual clusters were not pure control areas in everysetting: in MaiMwana, Malawi, a breastfeeding counsellingintervention was implemented and tested in 12 of the 24 coun-terfactual clusters;19 in PCP, Bangladesh, four of the nine clus-ters received training of traditional birth attendants onresuscitation;25 in Dhanusha, Nepal, a community-based neo-natal sepsis management intervention was implemented in 9 ofthe 30 counterfactual clusters.26
Community-based surveillance and verbal autopsySurveillance systems for births and newborn deaths were estab-lished in each setting. Their design and implementation havebeen described elsewhere.17 20 21 23 26–30 Field-based key infor-mants recruited in cluster subareas identified births and deaths,which were then verified by trained interviewers. At all sites,stillbirths were distinguished from very early neonatal deathsbased on the absence of signs of life (movement, breathing,crying) when the infant was born, according to the mother orother caregivers. In MaiKhanda, Malawi, a simple algorithmwas used to classify deaths as stillbirths or neonatal deaths fromdata pertaining to these reported signs of life.30
To ascertain likely causes of neonatal deaths, trained lay inter-viewers conducted VAs. VA is the process of interviewing a care-giver, relative or witness to ascertain the presence, absence ornature of signs, symptoms and circumstances observed at oraround the time of death.31 Interviewers used a structured ques-tionnaire to gather VA information, usually from the mother ofthe deceased child. Questionnaires comprised a series offixed-response questions, with space to record open-ended com-ments, but this open-ended information was not included in thecurrent analysis, as previous work has shown that it does notadd to biomedical interpretations of cause of death using auto-mated methods.32 The questionnaires were similar in all settings(see online supplementary table S1), and interviewers were
trained to ask all relevant questions on the VA questionnaire,adhering to predefined skip patterns, regardless of perceivedrelevance to the specific case. Interviews were conducted after aculturally appropriate mourning period. Only VAs with sex andage at death data were considered to be complete and includedin the study. The VA completion rates for each site are sum-marised in table 1.
Data management and quality controlRegistered vital events identified by incentivised key informantsor salaried enumerators were confirmed by interviewer visits tohouseholds and, in a subsample of cases, through field super-visor visits. Trends were compared with local public systemregistration figures. Further quality checks during in-countryelectronic data entry mandated referral back to the field for cor-rection when errors were detected.17–23 26–30
Interpreting verbal autopsyVA data were interpreted through InterVA V.4.02 (http://www.interva.net), an automated method for interpreting signs, symp-toms and circumstances.33 Based on the reported presence orabsence of indicators, Bayesian reasoning is applied to calculatethe likelihood of 60 possible cause-of-death categories compat-ible with the International Classification of Diseases V.10.Following procedures outlined in the InterVA user guide,34 vari-ables describing specific signs and symptoms were mapped toequivalent InterVA indicators to generate files to be processedthrough the Bayesian model. For example, any positiveresponses to questions about intermittent or fast breathing,chest in-drawing, grunting or nasal flaring before death wereused to generate a positive response in InterVA’s ‘difficultybreathing’ indicator. One member of the research team (EF)reviewed the mapping between each study site’s data and theInterVA input file as a quality control measure to check plausi-bility of symptom frequencies.
InterVA requires population HIV and malaria prevalence to bespecified so that the model can account for baseline differencesbetween locations. Previous research has shown that simpledescriptions of ‘very low’, ‘low’ or ‘high’ prevalence, corre-sponding to increasing orders of magnitude, are adequate forthis.35 Malaria and HIV settings for each site are summarised intable 1.
InterVA reports the probability of up to three of the mostlikely causes for each death.33 We summed the likelihoods ofeach cause from every individual death to estimate the burdenof each at population level. Dividing this estimate by the totalnumber of deaths provided population cause-specific mortalityfractions (CSMFs), and dividing by the number of live births ateach study site provided estimates of cause-specific mortalityrates (CSMRs). In MaiMwana (Malawi) and all Asian sites, itwas possible to calculate mortality rates by sex, based on the dir-ectly measured number of liveborn males and females. InMaiKhanda (Malawi), however, sex was not recorded for all livebirths, and estimates of the numbers of liveborn males andfemales were derived by splitting the total number on the basisof the 2010 Demographic and Health Survey live-birth sex ratiofor 2007–2010.36
Ethical considerationsThe trials in which the current data were gathered wereapproved by either the University College London or the GreatOrmond Street Hospital Research Ethics Committee in the UK,and by ethical review committees in each setting: the EthicalReview Committee of the Diabetic Association of Bangladesh,
F2 Fottrell E, et al. Arch Dis Child Fetal Neonatal Ed 2015;0:F1–F9. doi:10.1136/archdischild-2014-307636
Global child health
group.bmj.com on May 14, 2015 - Published by http://fn.bmj.com/Downloaded from

the Nepal Health Research Council (with a Memorandum ofUnderstanding with the Government of Nepal Ministry ofHealth), the Independent Ethics Committee for Research onHuman Subjects (Mumbai), an independent ethical committeein Jamshedpur, India, and the Malawi National Health SciencesResearch Committee.
RESULTSA total of 3772 neonatal deaths with complete age and sex datawere included in the analysis. The average time from death toVA interview varied between study sites, with an average of3 weeks at Ekjut and SNEHA (India), 5–6 weeks at PCP(Bangladesh) and Dhanusha (Nepal), 29 weeks at MaiMwanaand 67 weeks at MaiKhanda (Malawi). The relatively longdeath-to-interview time in MaiKhanda reflects the fact that alarge number of VAs were not completed initially, but ratherincluded as part of a verification exercise after the trial ended inMay 2011.30 Interview dates were not available for Makwanpur(Nepal). The average number of VA indicators per case was12 for MaiKhanda, 13 for Makwanpur, 14 for Dhanusha, Ekjutand MaiMwana, 15 for SNEHA and 17 for PCP. Numbers ofstillbirths and neonatal deaths contributed by each study site arepresented in table 2, which also shows crude and sex-specificmortality rates and mortality rate ratios comparing males withfemales.
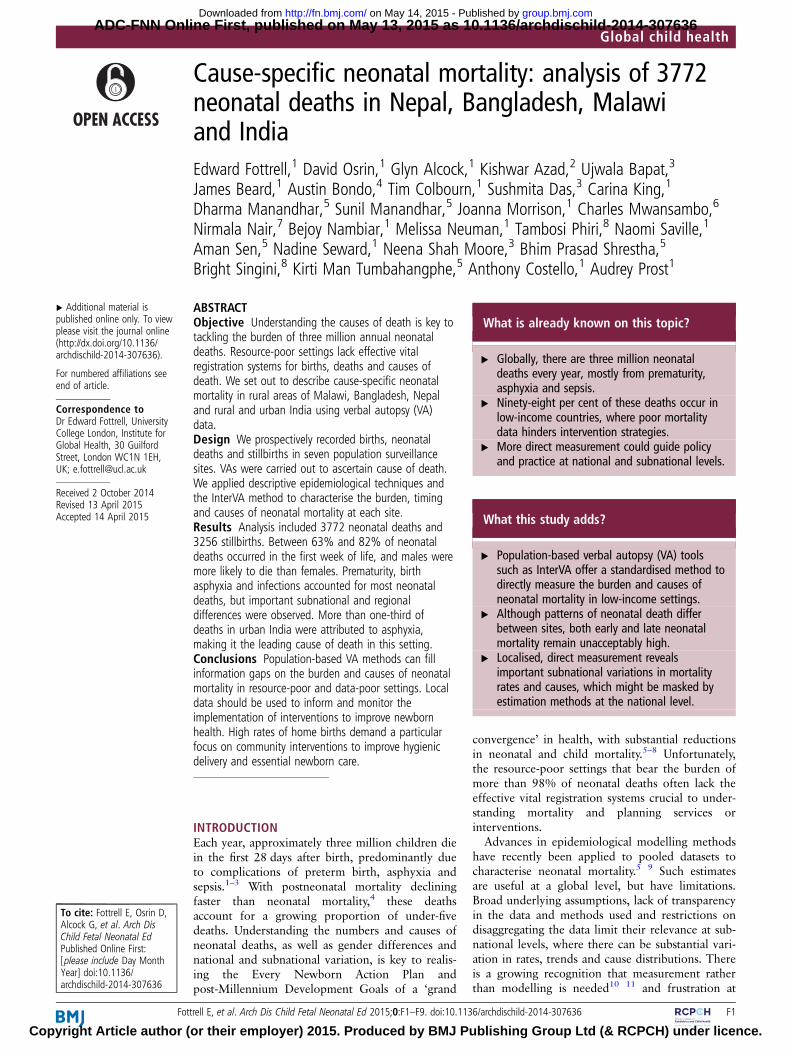
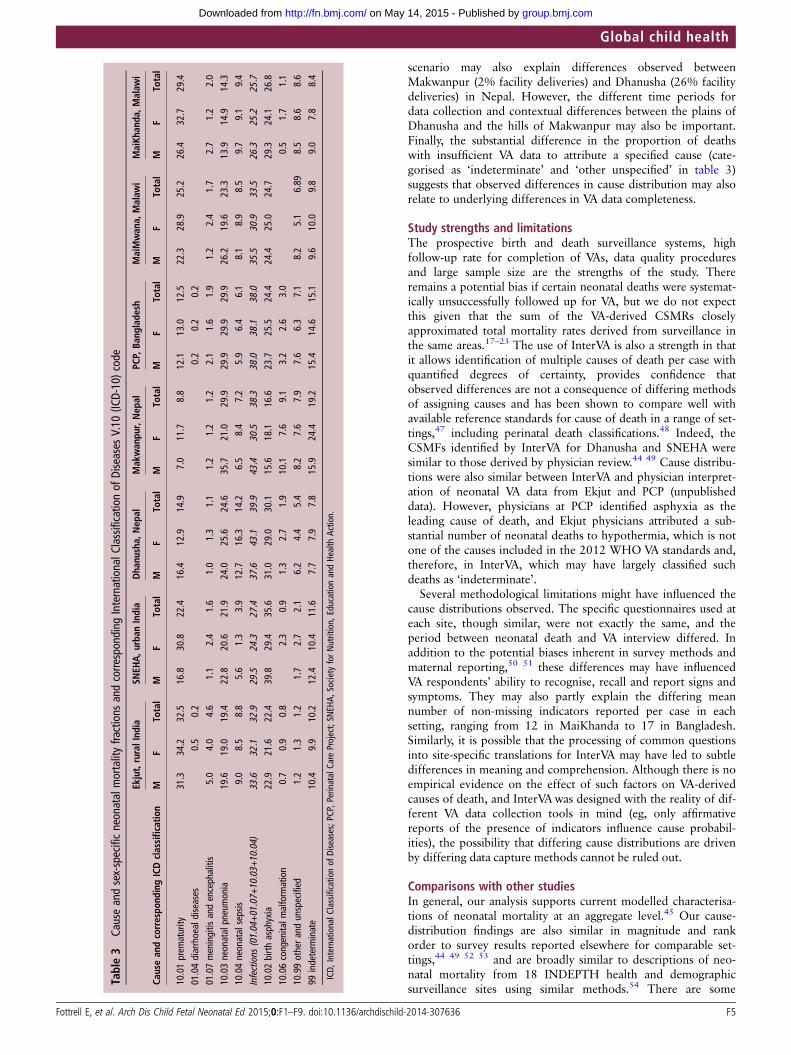
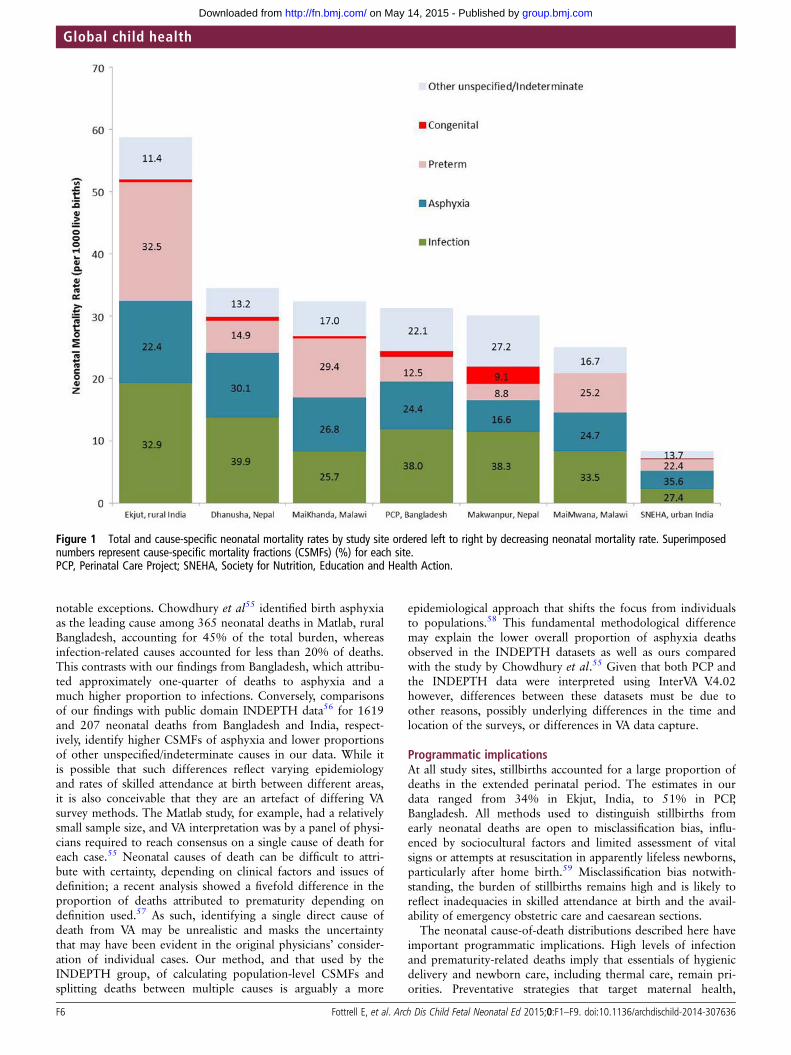
Table 3 shows sex-specific and cause-specific neonatal mortal-ity fractions for all InterVA-derived cause categories. Infectiouscauses—diarrhoeal disease, meningitis and encephalitis, pneu-monia and sepsis—were consolidated into a broad cause cat-egory of infection, and the categories ‘other and unspecified’and ‘indeterminate’ were consolidated to facilitate presentationof cause-specific rates and overall fractions in figure 1.
Crude sex-specific neonatal mortality rates and rate ratios(table 2) show that males had 20%–50% higher mortality thanfemales, with rate ratios (95% CIs) ranging from 1.2 (1.0–1.3)in MaiKhanda to 1.5 (1.1–2.0) in Makwanpur. In most settings,there were no obvious important differences between cause dis-tributions by sex (table 3). However, at SNEHA in urban Indiaand, to a lesser extent, Makwanpur in Nepal, a larger propor-tion of female deaths were attributed to prematurity.
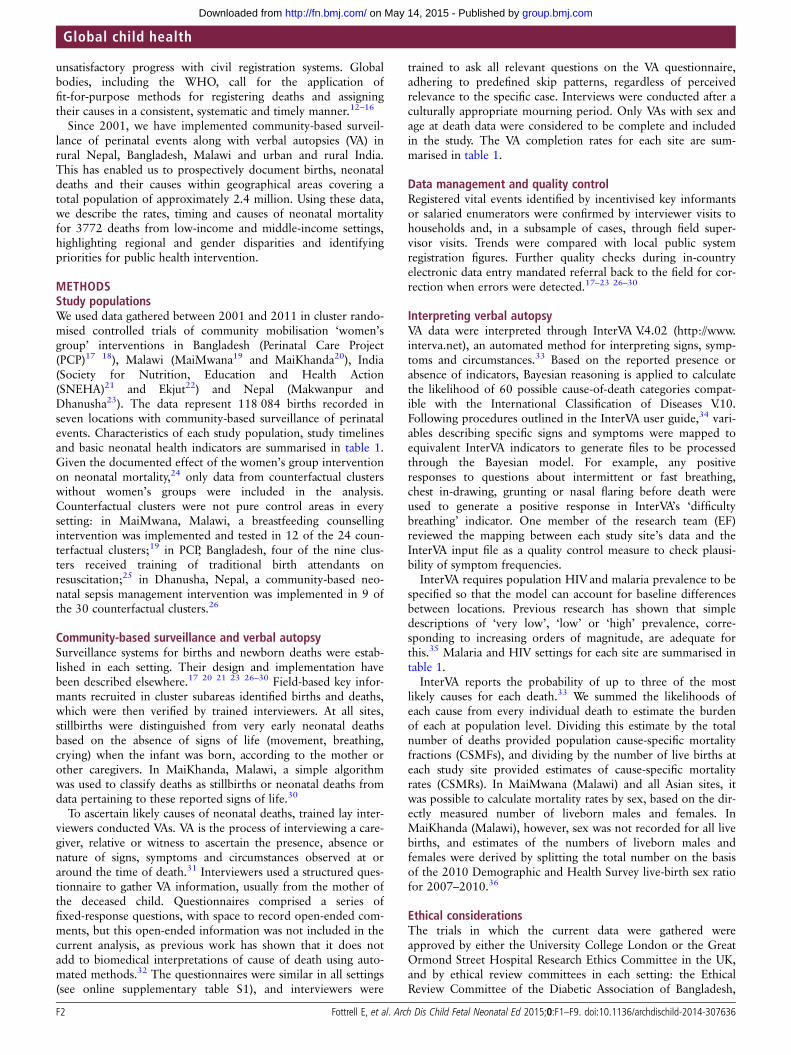
Figure 2 shows CSMFs by day of death. Across all Asian sites,approximately one-third of neonatal deaths occurred on the firstday of life. This proportion was greater than 40% in bothMalawian sites, and, in all settings, the first week of lifeaccounted for most neonatal deaths, ranging from 63% inMakwanpur (Nepal) and SNEHA (India) to 82% in MaiKhanda(Malawi).
DISCUSSIONUsing prospective data from seven community-based surveil-lance systems, we applied an automated method of VA interpret-ation to provide a uniquely standardised summary andcomparison of neonatal mortality across four low-income andmiddle-income settings. Across all settings, and particularly inrural areas, neonatal mortality rates were unacceptably high anddriven by prematurity, birth asphyxia (intrapartum-relateddeaths) and infections, which were particularly important in therural Asian sites. The first days of life remain the most risky,with more than one-third of deaths occurring on the first day,half in the first 2 days and three-quarters in the first week.
Gender disparitiesMale gender disadvantage was observed in all study sites, withboys being up to 50% more likely to die than girls. While our
observation could be a consequence of methodological bias,whereby social desirability may lead to an over-reporting formale offspring, a neonatal mortality ratio of males to females ofat least 1.2 has been reported previously.37 38 Recent researchhas also shown that boys are more likely to be born prematurelyand have a higher incidence of infections and encephalop-athy.39–41 With the exception of Dhanusha (Nepal) and PCP(Bangladesh), sex differentials in CSMFs in table 3 suggestedmore infections in males, although prematurity appeared to actin the opposite direction, and was responsible for a higher pro-portion of female deaths. Similar findings for late neonataldeaths have been observed in other studies from Nepal38 andIndia,42 and may reflect overarching gender preference or pref-erential care-seeking as well as interactions between ethnicity,sex and the presence of prior siblings. The extent to whichobserved sex differentials reflect biological phenomena or are aconsequence of modifiable socioeconomic factors demandsfurther investigation.
Differences between countriesThere were important differences in overall mortality and causedistributions between settings. PCP (Bangladesh) and the sites inMalawi and Nepal had similar overall neonatal mortality ratesof 25–35 deaths per 1000 live births. However, the proportionof deaths attributed to prematurity, birth asphyxia and infectionsvaried considerably between settings. In the Bangladesh site andboth Nepal sites, the burden of the combined infectious causesof death accounted for almost two-fifths of the total mortalityburden, whereas in Malawi, the burden ranged from 26% to34%, and a greater proportion of prematurity-related mortalitywas observed. This is perhaps unsurprising given that Malawi isreported to have the highest prematurity rate in the world, at18%.43
Differences within countriesEkjut, in rural India, had the highest neonatal mortality rate of59 deaths per 1000 live births, almost seven times greater thanSNEHA in urban Mumbai, reflecting huge subnational variation.Infections and prematurity each accounted for around one-thirdof neonatal deaths in Ekjut. While infections and prematurityremained in the top three causes in Mumbai, more thanone-third of deaths were attributed to asphyxia, making it theleading cause of death. This is in agreement with a neonatal VAstudy from the same setting, which identified one-third ofasphyxia deaths as being associated with obstetric complica-tions.44 Observed differences between rural and urban India arelikely to reflect documented shifts in cause patterns as overallmortality rates fall, largely driven by decreases in the rates ofdeath from infections, particularly pneumonia.45
Within-country differences were also observed in Malawi andNepal, but are not easily explained by underlying mortalityrates. In Malawi, data from MaiMwana suggest that approxi-mately one-third of neonatal deaths were attributable to neo-natal pneumonia/sepsis, approximately 8% greater than theburden identified at the MaiKhanda site, where slightly higherburdens of prematurity and asphyxia were observed. BothMaiMwana and MaiKhanda represent rural Malawian popula-tions, but at slightly different times and within a period of rapidincrease in institutional deliveries.36 More births occurred infacilities in MaiKhanda than in MaiMwana (table 1). Given thathome deliveries are associated with less hygienic practices andhigher rates of infectious causes of neonatal death,46 the higherproportion of institutional delivery in MaiKhanda may partlyexplain the differences in cause-specific mortality. A similar
Fottrell E, et al. Arch Dis Child Fetal Neonatal Ed 2015;0:F1–F9. doi:10.1136/archdischild-2014-307636 F3
Global child health
group.bmj.com on May 14, 2015 - Published by http://fn.bmj.com/Downloaded from
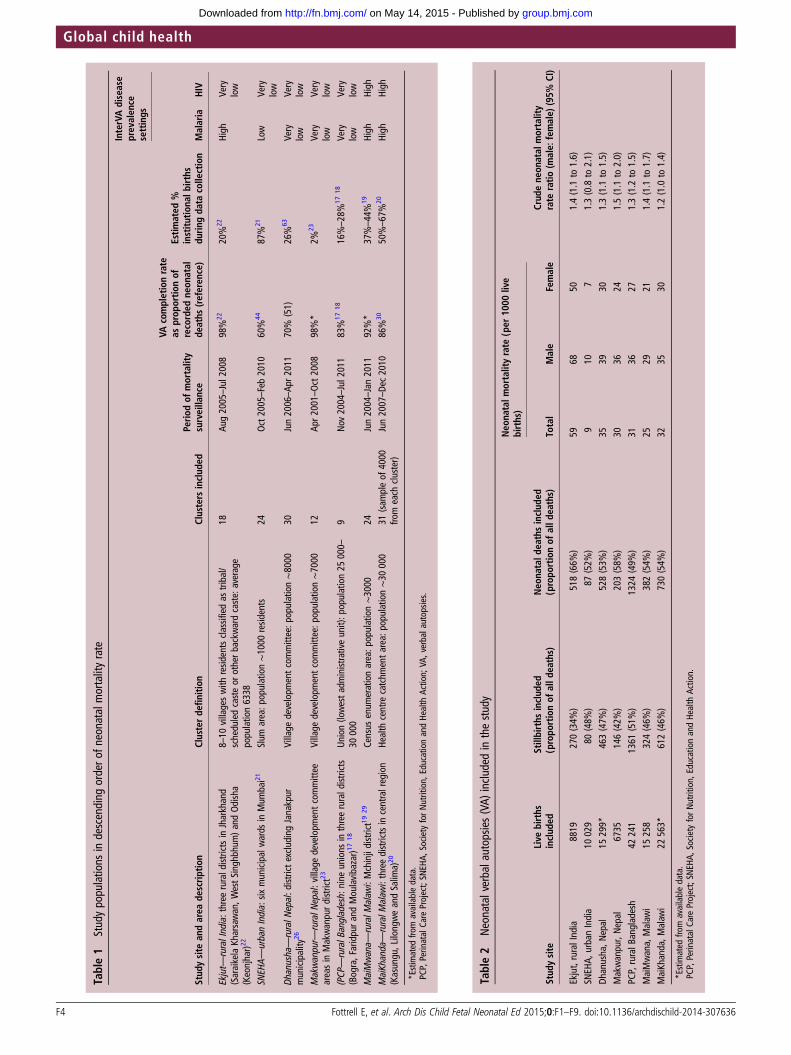
Table1
Studypopulations
indescending
ordero
fneonatalm
ortalityrate
InterVAdisease
prevalen
cesettings
Stud
ysite
andarea
descrip
tion
Clusterde
finition
Clusters
includ
edPerio
dof
mortality
surveillance
VAcompletionrate
asprop
ortio
nof
recorded
neon
atal
deaths
(referen
ce)
Estim
ated
%institu
tiona
lbirths
durin
gda
tacollection
Malaria
HIV
Ekjut—
ruralIndia:three
ruraldistrictsinJharkhand
(SaraikelaKharsawan,W
estSinghbhum)a
ndOdisha
(Keonjhar)2
2
8–10
villageswith
resid
entsclassifiedas
tribal/
scheduledcasteor
otherbackwardcaste:average
population6338
18Au
g2005–Jul2
008
98%
2220%
22High
Very
low
SNEH
A—urbanIndia:
sixmunicipalwards
inMum
bai21
Slum
area:p
opulation∼1000
resid
ents
24Oct2005–Feb2010
60%
4487%
21Low
Very
low
Dhanusha—ruralN
epal:d
istrictexcludingJanakpur
municipality
26Village
developm
entcommittee:p
opulation∼8000
30Jun2006–Ap
r2011
70%
(51)
26%
63Very
low
Very
low
Makwanpur—
ruralN
epal:villagedevelopm
entcommittee
areasin
Makwanpurdistrict23
Village
developm
entcommittee:p
opulation∼7000
12Ap
r2001–Oct2008
98%*
2%23
Very
low
Very
low
(PCP
—ruralB
angladesh:
nine
unions
inthreerurald
istricts
(Bogra,Faridpura
ndMoulavibazar)1
718
Union(lowestadministrativeunit):p
opulation25
000–
30000
9Nov
2004–Jul2
011
83%
1718
16%–28%
1718
Very
low
Very
low
MaiMwana—
ruralM
alaw
i:Mchinjidistrict1929
Census
enum
erationarea:p
opulation∼3000
24Jun2004–Jan2011
92%*
37%–44%
19High
High
MaiKhanda—
ruralM
alaw
i:threedistrictsincentralregion
(Kasungu,LilongweandSalim
a)20
Health
centre
catchm
entarea:p
opulation∼30
000
31(sam
pleof
4000
from
each
cluster)
Jun2007–De
c2010
86%
3050%–67%
20High
High
*Estimated
from
availabledata.
PCP,PerinatalCare
Project;SN
EHA,
SocietyforNutrition,
EducationandHe
alth
Action;
VA,verbalautopsie
s.
Table2
Neonatalverbalautopsie
s(VA)
included
inthestudy
Neo
natalm
ortalityrate
(per
1000
live
births)
Stud
ysite
Live
births
includ
edStillbirths
includ
ed(propo
rtionof
alld
eaths)
Neo
natald
eathsinclud
ed(propo
rtionof
alld
eaths)
Total
Male
Female
Crud
ene
onatal
mortality
rate
ratio
(male:
female)
(95%
CI)
Ekjut,ruralIndia
8819
270(34%
)518(66%
)59
6850
1.4(1.1
to1.6)
SNEH
A,urbanIndia
10029
80(48%
)87
(52%
)9
107
1.3(0.8
to2.1)
Dhanusha,N
epal
15299*
463(47%
)528(53%
)35
3930
1.3(1.1
to1.5)
Makwanpur,Nepal
6735
146(42%
)203(58%
)30
3624
1.5(1.1
to2.0)
PCP,ruralB
angladesh
42241
1361
(51%
)1324
(49%
)31
3627
1.3(1.2
to1.5)
MaiMwana,Malaw
i15
258
324(46%
)382(54%
)25
2921
1.4(1.1
to1.7)
MaiKhanda,M
alaw
i22
563*
612(46%
)730(54%
)32
3530
1.2(1.0
to1.4)
*Estimated
from
availabledata.
PCP,PerinatalCare
Project;SN
EHA,
SocietyforNutrition,
EducationandHe
alth
Action.
F4 Fottrell E, et al. Arch Dis Child Fetal Neonatal Ed 2015;0:F1–F9. doi:10.1136/archdischild-2014-307636
Global child health
group.bmj.com on May 14, 2015 - Published by http://fn.bmj.com/Downloaded from
scenario may also explain differences observed betweenMakwanpur (2% facility deliveries) and Dhanusha (26% facilitydeliveries) in Nepal. However, the different time periods fordata collection and contextual differences between the plains ofDhanusha and the hills of Makwanpur may also be important.Finally, the substantial difference in the proportion of deathswith insufficient VA data to attribute a specified cause (cate-gorised as ‘indeterminate’ and ‘other unspecified’ in table 3)suggests that observed differences in cause distribution may alsorelate to underlying differences in VA data completeness.
Study strengths and limitationsThe prospective birth and death surveillance systems, highfollow-up rate for completion of VAs, data quality proceduresand large sample size are the strengths of the study. Thereremains a potential bias if certain neonatal deaths were systemat-ically unsuccessfully followed up for VA, but we do not expectthis given that the sum of the VA-derived CSMRs closelyapproximated total mortality rates derived from surveillance inthe same areas.17–23 The use of InterVA is also a strength in thatit allows identification of multiple causes of death per case withquantified degrees of certainty, provides confidence thatobserved differences are not a consequence of differing methodsof assigning causes and has been shown to compare well withavailable reference standards for cause of death in a range of set-tings,47 including perinatal death classifications.48 Indeed, theCSMFs identified by InterVA for Dhanusha and SNEHA weresimilar to those derived by physician review.44 49 Cause distribu-tions were also similar between InterVA and physician interpret-ation of neonatal VA data from Ekjut and PCP (unpublisheddata). However, physicians at PCP identified asphyxia as theleading cause of death, and Ekjut physicians attributed a sub-stantial number of neonatal deaths to hypothermia, which is notone of the causes included in the 2012 WHO VA standards and,therefore, in InterVA, which may have largely classified suchdeaths as ‘indeterminate’.
Several methodological limitations might have influenced thecause distributions observed. The specific questionnaires used ateach site, though similar, were not exactly the same, and theperiod between neonatal death and VA interview differed. Inaddition to the potential biases inherent in survey methods andmaternal reporting,50 51 these differences may have influencedVA respondents’ ability to recognise, recall and report signs andsymptoms. They may also partly explain the differing meannumber of non-missing indicators reported per case in eachsetting, ranging from 12 in MaiKhanda to 17 in Bangladesh.Similarly, it is possible that the processing of common questionsinto site-specific translations for InterVA may have led to subtledifferences in meaning and comprehension. Although there is noempirical evidence on the effect of such factors on VA-derivedcauses of death, and InterVAwas designed with the reality of dif-ferent VA data collection tools in mind (eg, only affirmativereports of the presence of indicators influence cause probabil-ities), the possibility that differing cause distributions are drivenby differing data capture methods cannot be ruled out.
Comparisons with other studiesIn general, our analysis supports current modelled characterisa-tions of neonatal mortality at an aggregate level.45 Our cause-distribution findings are also similar in magnitude and rankorder to survey results reported elsewhere for comparable set-tings,44 49 52 53 and are broadly similar to descriptions of neo-natal mortality from 18 INDEPTH health and demographicsurveillance sites using similar methods.54 There are some
Table3
Causeandsex-specificneonatalmortalityfractions
andcorresponding
InternationalC
lassificationof
Diseases
V.10
(ICD-10)code
Ekjut,ruralInd
iaSN
EHA,u
rban
India
Dha
nusha,
Nep
alMakwan
pur,Nep
alPC
P,Ba
nglade
shMaiMwan
a,Malaw
iMaiKh
anda
,Malaw
i
Causean
dcorrespo
ndingICDclassification
MF
Total
MF
Total
MF
Total
MF
Total
MF
Total
MF
Total
MF
Total
10.01prem
aturity
31.3
34.2
32.5
16.8
30.8
22.4
16.4
12.9
14.9
7.0
11.7
8.8
12.1
13.0
12.5
22.3
28.9
25.2
26.4
32.7
29.4
01.04diarrhoealdiseases
0.5
0.2
0.2
0.2
0.2
01.07meningitis
andencephalitis
5.0
4.0
4.6
1.1
2.4
1.6
1.0
1.3
1.1
1.2
1.2
1.2
2.1
1.6
1.9
1.2
2.4
1.7
2.7
1.2
2.0
10.03neonatalpneumonia
19.6
19.0
19.4
22.8
20.6
21.9
24.0
25.6
24.6
35.7
21.0
29.9
29.9
29.9
29.9
26.2
19.6
23.3
13.9
14.9
14.3
10.04neonatalsepsis
9.0
8.5
8.8
5.6
1.3
3.9
12.7
16.3
14.2
6.5
8.4
7.2
5.9
6.4
6.1
8.1
8.9
8.5
9.7
9.1
9.4
Infections
(01.04+01.07+
10.03+
10.04)
33.6
32.1
32.9
29.5
24.3
27.4
37.6
43.1
39.9
43.4
30.5
38.3
38.0
38.1
38.0
35.5
30.9
33.5
26.3
25.2
25.7
10.02birth
asphyxia
22.9
21.6
22.4
39.8
29.4
35.6
31.0
29.0
30.1
15.6
18.1
16.6
23.7
25.5
24.4
24.4
25.0
24.7
29.3
24.1
26.8
10.06congenitalm
alform
ation
0.7
0.9
0.8
2.3
0.9
1.3
2.7
1.9
10.1
7.6
9.1
3.2
2.6
3.0
0.5
1.7
1.1
10.99othera
ndunspecified
1.2
1.3
1.2
1.7
2.7
2.1
6.2
4.4
5.4
8.2
7.6
7.9
7.6
6.3
7.1
8.2
5.1
6.89
8.5
8.6
8.6
99indeterm
inate
10.4
9.9
10.2
12.4
10.4
11.6
7.7
7.9
7.8
15.9
24.4
19.2
15.4
14.6
15.1
9.6
10.0
9.8
9.0
7.8
8.4
ICD,
InternationalC
lassificationof
Diseases;P
CP,P
erinatalCare
Project;SN
EHA,
SocietyforNutrition,
EducationandHe
alth
Action.
Fottrell E, et al. Arch Dis Child Fetal Neonatal Ed 2015;0:F1–F9. doi:10.1136/archdischild-2014-307636 F5
Global child health
group.bmj.com on May 14, 2015 - Published by http://fn.bmj.com/Downloaded from
notable exceptions. Chowdhury et al55 identified birth asphyxiaas the leading cause among 365 neonatal deaths in Matlab, ruralBangladesh, accounting for 45% of the total burden, whereasinfection-related causes accounted for less than 20% of deaths.This contrasts with our findings from Bangladesh, which attribu-ted approximately one-quarter of deaths to asphyxia and amuch higher proportion to infections. Conversely, comparisonsof our findings with public domain INDEPTH data56 for 1619and 207 neonatal deaths from Bangladesh and India, respect-ively, identify higher CSMFs of asphyxia and lower proportionsof other unspecified/indeterminate causes in our data. While itis possible that such differences reflect varying epidemiologyand rates of skilled attendance at birth between different areas,it is also conceivable that they are an artefact of differing VAsurvey methods. The Matlab study, for example, had a relativelysmall sample size, and VA interpretation was by a panel of physi-cians required to reach consensus on a single cause of death foreach case.55 Neonatal causes of death can be difficult to attri-bute with certainty, depending on clinical factors and issues ofdefinition; a recent analysis showed a fivefold difference in theproportion of deaths attributed to prematurity depending ondefinition used.57 As such, identifying a single direct cause ofdeath from VA may be unrealistic and masks the uncertaintythat may have been evident in the original physicians’ consider-ation of individual cases. Our method, and that used by theINDEPTH group, of calculating population-level CSMFs andsplitting deaths between multiple causes is arguably a more
epidemiological approach that shifts the focus from individualsto populations.58 This fundamental methodological differencemay explain the lower overall proportion of asphyxia deathsobserved in the INDEPTH datasets as well as ours comparedwith the study by Chowdhury et al.55 Given that both PCP andthe INDEPTH data were interpreted using InterVA V.4.02however, differences between these datasets must be due toother reasons, possibly underlying differences in the time andlocation of the surveys, or differences in VA data capture.
Programmatic implicationsAt all study sites, stillbirths accounted for a large proportion ofdeaths in the extended perinatal period. The estimates in ourdata ranged from 34% in Ekjut, India, to 51% in PCP,Bangladesh. All methods used to distinguish stillbirths fromearly neonatal deaths are open to misclassification bias, influ-enced by sociocultural factors and limited assessment of vitalsigns or attempts at resuscitation in apparently lifeless newborns,particularly after home birth.59 Misclassification bias notwith-standing, the burden of stillbirths remains high and is likely toreflect inadequacies in skilled attendance at birth and the avail-ability of emergency obstetric care and caesarean sections.
The neonatal cause-of-death distributions described here haveimportant programmatic implications. High levels of infectionand prematurity-related deaths imply that essentials of hygienicdelivery and newborn care, including thermal care, remain pri-orities. Preventative strategies that target maternal health,
Figure 1 Total and cause-specific neonatal mortality rates by study site ordered left to right by decreasing neonatal mortality rate. Superimposednumbers represent cause-specific mortality fractions (CSMFs) (%) for each site.PCP, Perinatal Care Project; SNEHA, Society for Nutrition, Education and Health Action.
F6 Fottrell E, et al. Arch Dis Child Fetal Neonatal Ed 2015;0:F1–F9. doi:10.1136/archdischild-2014-307636
Global child health
group.bmj.com on May 14, 2015 - Published by http://fn.bmj.com/Downloaded from

recognising the importance of nutrition and vector-borne dis-eases such as malaria, a major cause of anaemia in malariaendemic regions, must also be prioritised. At the same time, themajor burden of asphyxia mortality demands a focus on theintrapartum period, with improved capacity within facilities tomanage obstetric complications and awareness of the import-ance of skilled attendance at birth among communities andexpectant mothers. Given the high rates of home births, inter-vention strategies must think beyond the biomedical aspects ofmortality described by VA results and consider the distal, socialdeterminants of mortality and the three delays model.60 In thisregard, there is a clear need to focus on community
interventions for newborn health that also encompass the healthof the mother and the continuum of preconception, pregnancyand the intrapartum and postpartum periods, and whichpromote hygienic practices, thermal care, the recognition ofdanger signs and appropriate care-seeking. There is a growingbody of evidence suggesting that cost-effective community inter-ventions achieving impact on neonatal mortality should bescaled up as a matter of urgency.24 61 62
CONCLUSIONThe application of simple mortality surveillance and VAmethods in localised, low-income and middle-income settings
Figure 2 Cause-specific mortality fractions (CSMFs) by day of death and study site ordered left to right by decreasing neonatal mortality rate.PCP, Perinatal Care Project; SNEHA, Society for Nutrition, Education and Health Action.
Fottrell E, et al. Arch Dis Child Fetal Neonatal Ed 2015;0:F1–F9. doi:10.1136/archdischild-2014-307636 F7
Global child health
group.bmj.com on May 14, 2015 - Published by http://fn.bmj.com/Downloaded from

reveals important regional and subnational variation in the epi-demiology of neonatal mortality that may be masked by aggre-gate or modelled estimates. Although population health surveyand VA approaches are likely to be imperfect compared withcomplete vital registration and medical cause of death certifica-tion, methodological advances enable the generation of timely,low-cost and consistent cause-specific mortality estimates neces-sary to direct local policy in settings with little or no existingdata. The wider application of these methods beyond researchsettings to better inform and strengthen health systems is aglobal priority. However, it is not for lack of data that theburden of neonatal mortality remains so high; efforts mustfocus on implementing proven interventions to protect the threemillion newborns who die every year.
Author affiliations1University College London, Institute for Global Health, London, UK2Diabetic Association of Bangladesh, Perinatal Care Project, Dhaka, Bangladesh3Society for Nutrition, Education and Health Action, Mumbai, India4Parent and Child Health Initiative, Lilongwe, Malawi5Mother and Infant Research Activities, Kathmandu, Nepal6Ministry of Health, Government of Malawi, Lilongwe, Malawi7Ekjut, Chakradharpur, India8MaiMwana Project, Mchinji, Malawi
Twitter Follow Edward Fottrell at @fottrell
Acknowledgements The authors gratefully acknowledge fieldwork, coordinationand management teams in the Perinatal Care Project, Bangladesh; the Society forNutrition, Education and Health Action, India; the Parent and Child Health Initiative,Malawi; Mother and Infant Research Activities, Nepal; Ekjut, India; and theMaiMwana Project, Malawi, for their crucial role in data acquisition.
Contributors EF conceived the study, carried out analysis and wrote the first draftof the manuscript. DO, GA, UB, SD and NSM led data capture activities and dataprocessing in Mumbai. EF, KA and JB led data capture activities and data processingin Bangladesh. AB, TC, CK, CM, BN, TP and BS led data capture activities and dataprocessing and interpretation in Malawi. DM, SM, JM, NSa, AS, BPS, KMT and JBled data capture activities and data processing and interpretation in Nepal. NN andAP led data capture activities and data processing in Ekjut, rural India. MN and NSecontributed to data pooling and processing. AC established the internationalcollaboration between all partners and helped to design the analysis plan. EF, AP,DO, TC, MN and NN provided technical oversight to analysis and interpretation ofdata. All authors contributed to context-specific interpretation of the results andrevisions of the manuscript.
Funding This work was supported by a Wellcome Trust Strategic Award(085417ma/Z/08/Z).
Competing interests None declared.
Ethics approval The University College London or the Great Ormond StreetHospital Research Ethics Committee, UK; the Ethical Review Committee of theDiabetic Association of Bangladesh; the Nepal Health Research Council (with aMemorandum of Understanding with the Government of Nepal Ministry of Health);the Independent Ethics Committee for Research on Human Subjects (Mumbai), India;the Malawi National Health Sciences Research Committee.
Provenance and peer review Not commissioned; externally peer reviewed.
Data sharing statement We will make an anonymised version of the datasetused for the analyses in this article available to researchers upon completion of asimple data request form, which can be obtained from Dr Audrey Prost ([email protected]).
Open Access This is an Open Access article distributed in accordance with theterms of the Creative Commons Attribution (CC BY 4.0) license, which permitsothers to distribute, remix, adapt and build upon this work, for commercial use,provided the original work is properly cited. See: http://creativecommons.org/licenses/by/4.0/
REFERENCES1 Lozano R, Wang H, Foreman KJ, et al. Progress towards Millennium Development
Goals 4 and 5 on maternal and child mortality: an updated systematic analysis.Lancet 2011;378:1139–65.
2 Kinney MV, Kerber KJ, Black RE, et al. Sub-Saharan Africa’s Mothers, Newborns,and Children: Where and Why Do They Die? PLoS Med 2010;7:e1000294.
3 Black RE, Cousens S, Johnson HL, et al. Global, regional, and national causes ofchild mortality in 2008: a systematic analysis. Lancet 2010;375:1969–87.
4 Lawn J, Kinney M, Black R, et al. Newborn survival: a multi-country analysis of adecade of change. Health Policy Plan 2012;27:iii6–iii28.
5 Oestergaard MZ, Inoue M, Yoshida S, et al. Neonatal mortality levels for 193countries in 2009 with trends since 1990: a systematic analysis of progress,projections and priorities. PLoS Med 2011;8:e1001080.
6 Jamison DT, Summers LH, Alleyne G, et al. Global health 2035: a world convergingwithin a generation. Lancet 2013;382:1898–955.
7 WHO. Every Newborn: a draft actionplan to end preventable deaths. Geneva: WorldHealth Organization, 2014.
8 Lawn JE, Blencowe H, Oza S, et al. Progress, priorities, and potential beyondsurvival. Lancet 2014;384:189–205.
9 Lozano R, Naghavi M, Foreman K, et al. Global and regional mortality from 235causes of death for 20 age groups in 1990 and 2010: a systematic analysis for theGlobal Burden of Disease Study 2010. Lancet 2012;380:2095–128.
10 Byass P, de Courten M, Graham WJ, et al. Reflections on the Global Burden ofDisease 2010 Estimates. PLoS Med 2013;10:e1001477.
11 Mathers CD, Boerma T. Mortality measurement matters: improving data collectionand estimation methods for child and Adult Mortality. PLoS Med 2010;7:e1000265.
12 Chan M. From new estimates to better data. Lancet 2012;380:2054.13 WHO. Verbal autopsy standards: the 2012 WHO verbal autopsy instruments (release
candidate 1). Geneva: WHO, 2012.14 Byass P. The UN needs joined-up thinking on vital registration. Lancet 2012;380:1643.15 WHO. Commission on information and accountability for Women’s and Children’s
Health: keeping promises, measuring results. Geneva: World Health Organization,2011.
16 WHO. Every Woman, Every Child: strengthening equity and dignity through health:the second report of the independent Expert Review Group (iERG) on informationand accountability for Women’s and Children’s health. Geneva: World HealthOrganization, 2013.
17 Azad K, Barnett S, Banerjee B, et al. Effect of scaling up women’s groups on birthoutcomes in three rural districts in Bangladesh: a cluster-randomised controlled trial.Lancet 2010;375:1193–202.
18 Fottrell E, Azad K, Kuddus A, et al. The effect of increased coverage of participatorywomen’s groups on neonatal mortality in Bangladesh: a cluster randomized trial.JAMA Pediatr 2013;167:816–25.
19 Lewycka S, Mwansambo C, Rosato M, et al. Effect of women’s groups andvolunteer peer counsellors on mortality, morbidity and health behaviours amongmothers and children in rural Malawi: the MaiMwana cluster randomised controlledtrial. Lancet 2013;381:1721–35.
20 Colbourn T, Nambiar B, Bondo A, et al. Effects of quality improvement in healthfacilities and community mobilisation through women’s groups on maternal,neonatal and perinatal mortality in three districts of Malawi: MaiKhanda, a clusterrandomised controlled effectiveness trial. Int Health 2013;5:180–95.
21 More NS, Bapat U, Das S, et al. Community Mobilization in Mumbai Slums toImprove Perinatal Care and Outcomes: A Cluster Randomized Controlled Trial.PLoS Med 2012;9:e1001257.
22 Tripathy P, Nair N, Barnett S, et al. Effect of a participatory intervention withwomen’s groups on birth outcomes and maternal depression in Jharkhand andOrissa, India: a cluster-randomised controlled trial. Lancet 2010;375:1182–92.
23 Manandhar DS, Osrin D, Shrestha BP, et al. Effect of a participatory interventionwith women’s groups on birth outcomes in Nepal: cluster-randomised controlledtrial. Lancet 2004;364:970–9.
24 Prost A, Colbourn T, Seward N, et al. Women’s groups practising participatorylearning and action to improve maternal and newborn health in low-resourcesettings: a systematic review and meta-analysis. Lancet 2013;381:1736–46.
25 Azad K. The impact of TBA resuscitation training on early neonatal mortality inBangladesh: results and implications. Presentation from Towards 4+5 conference;25–26 May 2010. London, UK: DfID, 2010.
26 Shrestha BP, Bhandari B, Manandhar DS, et al. Community interventions to reducechild mortality in Dhanusha, Nepal: study protocol for a cluster randomizedcontrolled trial. Trials 2011;12:136.
27 Osrin D, Manandhar A, Shrestha A, et al. Design of a surveillance system forpregnancy and its outcomes in rural Nepal. J Nepal Med Assoc 2003;41:411–22.
28 Barnett S, Nair N, Tripathy P, et al. A prospective key informant surveillance systemto measure maternal mortality—findings from indigenous populations in Jharkhandand Orissa, India. BMC Pregnancy & Childbirth 2008;8:6.
29 Lewycka S, Mwansambo C, Kazembe P, et al. A cluster randomised controlled trialof the community effectiveness of two interventions in rural Malawi to improvehealth care and to reduce maternal, newborn and infant mortality. Trials2010;11:88.
30 Colbourn T, Nambiar B, Costello A. MaiKhanda—Final evaluation report.The impact of quality improvement at health facilities and community mobilisationby women’s groups on birth outcomes: an effectiveness study in three districts ofMalawi. London: The Health Foundation, 2013.
31 Fottrell E, Byass P. Verbal autopsy: methods in transition. Epidemiol Rev2010;32:38–55.
F8 Fottrell E, et al. Arch Dis Child Fetal Neonatal Ed 2015;0:F1–F9. doi:10.1136/archdischild-2014-307636
Global child health
group.bmj.com on May 14, 2015 - Published by http://fn.bmj.com/Downloaded from
32 Fottrell E, Byass P, Ouedraogo T, et al. Revealing the burden of maternal mortality:a probabilistic model for determining pregnancy-related causes of death from verbalautopsies. Popul Health Metr 2007;5:1.
33 Byass P, Chandramohan D, D’Ambruoso L, et al. Strengthening standardizedinterpretation of verbal autopsy data: the new InterVA-4 tool. Global Health Action2012;5:1–8.
34 InterVA. User Guide.35 Fottrell E, Kahn K, Tollman SM, et al. Probabilistic methods for verbal autopsy
interpretation: InterVA robustness in relation to variations in a priori probabilities.PLoS ONE 2011;6:e27200.
36 National Statistical Office (NSO) and ICF Macro. Malawi Demographic and HealthSurvey 2010. Zomba, Malawi, and Calverton, Maryland, USA: NSO and ICF Macro,2011.
37 Lawn J, Kerber K, Enweronu-Laryea C, et al. 3.6 million neonatal deaths—what isprogressing and what is not? Semin Perinatol 2010;34:371–86.
38 Rosenstock S, Katz J, Mullany L, et al. Sex differences in neonatal mortality inSarlahi, Nepal: the role of biology and environment. J Epidemiol Community Health2013;67:986–91.
39 Lawn J, Blencowe H, Darmstadt G, et al. Beyond newborn survival: the world youare born into determines your risk of disability-free survival. Pediatr Res2013;74:1–3.
40 Lee A, Kozuki N, Blencowe H, et al. Intrapartum-related neonatal encephalopathyincidence and impairment at regional and global levels for 2010 with trends from1990. Pediatr Res 2013;74(Suppl 1):50–72.
41 Seale A, Blencowe H, Zaidi A, et al. Neonatal severe bacterial infection impairmentestimates in South Asia, sub-Saharan Africa, and Latin America for 2010. PediatrRes 2013;74(Suppl 1):73–85.
42 Krishnan A, Ng N, Kapoor S, et al. Temporal trends and gender differentials incauses of childhood deaths at Ballabgarh, India—need for revisiting child survivalstrategies. BMC Public Health 2012;12:555.
43 March of Dimes, PMNCH, Save the Children, WHO. Born Too Soon: The GlobalAction Report on Preterm Birth. In Howson CP, Kinney MV, Lawn JE, eds. Geneva:World Health Organization, 2012.
44 Bapat U, Alcock G, More N, et al. Stillbirths and newborn deaths in slumsettlements in Mumbai, India: a prospective verbal autopsy study. BMC PregnancyChildbirth 2012;12:39.
45 Bhutta ZA, Black RE. Global maternal, newborn and child health—so near yet sofar. N Engl J Med 2013;639:2226–35.
46 Seward N, Osrin D, Li L, et al. Association between clean delivery kit use, cleandelivery practices, and neonatal survival: pooled analysis of data from three sites inSouth Asia. PLoS Med 2012;9:e1001180.
47 Byass P, Herbst A, Fottrell E, et al. Comparing verbal autopsy cause of deathfindings as determined by physician coding and probabilistic modelling:a public health analysis of 54,000 deaths in Africa and Asia. J Glob Health2015;5:010402.
48 Vergnano S, Fottrell E, Osrin D, et al. Adaptation of a probabilistic method (InterVA)of verbal autopsy to improve the interpretation of cause of stillbirth and neonataldeath in Malawi, Nepal and Zimbabwe. Popul Health Metr 2011;9:48.
49 Manandhar S, Ojha A, Manandhar D, et al. Causes of stillbirths and neonataldeaths in Dhanusha district, Nepal: a verbal autopsy study. Kathmandu Univ Med J(KUMJ) 2010;8:62–72.
50 Yoder P, Rosato M, Mahmud R, et al. Women’s recall of delivery and neonatal care:a study of terms, concepts and survey questions. Calverton, Maryland, USA: ICFMacro, 2010.
51 Snow RW, Basto de Azevedo I, Forster D, et al. Maternal recall of symptoms associatedwith childhood deaths in rural east Africa. Int J Epidemiol 1993;22:677–83.
52 Baqui AH, Darmstadt GL, Williams EK, et al. Rates, timing and causes of neonataldeaths in rural India: implications for neonatal health programmes. Bull WorldHealth Organ 2006;84:706–13.
53 Khanal S, Gc V, Dawson P, et al. Verbal autopsy to ascertain causes of neonataldeaths in a community setting: a study from Morang, Nepal. JNMA J Nepal MedAssoc 2011;51:21–7.
54 Streatfield P, Khan W, Bhuiya A, et al. Cause-specific childhood mortality in Africaand Asia: evidence from INDEPTH health and demographic surveillance systems.Glob Health Action 2014;7:25363.
55 Chowdhury H, Thompson S, Ali M, et al. Causes of neonatal deaths in a ruralsubdistrict of Bangladesh: implications for intervention. J Health Popul Nutr2010;28:375–82.
56 INDPETH. Africa, Asia, Oceania—INDEPTH Network Cause-Specific Mortality—Release 2014. 2014. http://www.indepth-ishare.org/index.php/catalog/48
57 Byass P. Usefulness of the Population Health Metrics Research Consortium goldstandard verbal autopsy data for general verbal autopsy methods. BMC Med2014;12:23.
58 Byass P, Kahn K, Fottrell E, et al. Moving from data on deaths to public healthpolicy in Agincourt, South Africa: approaches to analysing and understanding verbalautopsy findings. PLoS Med 2010;7:e1000325.
59 Fron J, Gordin S, Abdel-Aleem H, et al. Making stillbirths count, making numbers talk—issues in data collection for stillbirths. BMC Pregnancy Childbirth 2009;9:58.
60 Upadhyay R, Krishnan A, Rai S, et al. Need to focus beyond the medical causes:a systematic review of the social factors affecting neonatal deaths. Paediatr PerinatalEpidemiol 2014;28:127–37.
61 Kirkwood B, Manu A, ten Asbroek A, et al. Effect of the Newhints home-visitsintervention on neonatal mortality rate and care practices in Ghana: a clusterrandomised controlled trial. Lancet 2013;381:2184–92.
62 Lawn J, Mwansa-Kambafwile J, Horta B, et al. ‘Kangaroo mother care’ to preventneonatal deaths due to preterm birth complications. Int J Epidemiol 2010;39(suppl1):i144–i54.
63 Clarke K, Saville N, Shrestha B, et al. Predictors of psychological distress amongpostnatal mothers in rural Nepal: A cross-sectional community-based study. J AffectDisord 2014;156:76–86.
Fottrell E, et al. Arch Dis Child Fetal Neonatal Ed 2015;0:F1–F9. doi:10.1136/archdischild-2014-307636 F9
Global child health
group.bmj.com on May 14, 2015 - Published by http://fn.bmj.com/Downloaded from

Malawi and India3772 neonatal deaths in Nepal, Bangladesh, Cause-specific neonatal mortality: analysis of
Costello and Audrey ProstAnthonyBhim Prasad Shrestha, Bright Singini, Kirti Man Tumbahangphe,
Phiri, Naomi Saville, Aman Sen, Nadine Seward, Neena Shah Moore,Mwansambo, Nirmala Nair, Bejoy Nambiar, Melissa Neuman, Tambosi Dharma Manandhar, Sunil Manandhar, Joanna Morrison, CharlesJames Beard, Austin Bondo, Tim Colbourn, Sushmita Das, Carina King, Edward Fottrell, David Osrin, Glyn Alcock, Kishwar Azad, Ujwala Bapat,
published online May 13, 2015Arch Dis Child Fetal Neonatal Ed
http://fn.bmj.com/content/early/2015/05/13/archdischild-2014-307636Updated information and services can be found at:
These include:
MaterialSupplementary
.DC1.htmlhttp://fn.bmj.com/content/suppl/2015/05/13/archdischild-2014-307636Supplementary material can be found at:
References
#BIBLhttp://fn.bmj.com/content/early/2015/05/13/archdischild-2014-307636This article cites 50 articles, 6 of which you can access for free at:
Open Access
http://creativecommons.org/licenses/by/4.0/use, provided the original work is properly cited. See: others to distribute, remix, adapt and build upon this work, for commercialthe Creative Commons Attribution (CC BY 4.0) license, which permits This is an Open Access article distributed in accordance with the terms of
serviceEmail alerting
box at the top right corner of the online article. Receive free email alerts when new articles cite this article. Sign up in the
CollectionsTopic Articles on similar topics can be found in the following collections
(1481)Pregnancy (173)Trauma
(164)Injury (857)Epidemiologic studies
(37)Open access
http://group.bmj.com/group/rights-licensing/permissionsTo request permissions go to:
http://journals.bmj.com/cgi/reprintformTo order reprints go to:
http://group.bmj.com/subscribe/To subscribe to BMJ go to:
group.bmj.com on May 14, 2015 - Published by http://fn.bmj.com/Downloaded from

Notes
http://group.bmj.com/group/rights-licensing/permissionsTo request permissions go to:
http://journals.bmj.com/cgi/reprintformTo order reprints go to:
http://group.bmj.com/subscribe/To subscribe to BMJ go to:
group.bmj.com on May 14, 2015 - Published by http://fn.bmj.com/Downloaded from
Related Documents