Caudate nucleus volumes in stroke and vascular dementia Jeffrey Chee Leong Looi a, ⁎, Vanessa Tatham a , Rajeev Kumar a , Jerome J. Maller b,f , Ellen Millard a , Wei Wen c,d , Xiaohua Chen c,d , Henry Brodaty c,e , Perminder Sachdev c,d a Research Centre for the Neurosciences of Ageing, Academic Unit of Psychological Medicine, Australian National University Medical School, Building 4, Level 2, The Canberra Hospital, P.O. Box 11, Woden Australian Capital Territory 2605, Australia b Alfred Psychiatry Research Centre, Monash University, Melbourne, Victoria, Australia c School of Psychiatry, Faculty of Medicine, University of New South Wales, Prince of Wales Hospital, Sydney, Australia d Neuropsychiatric Institute, Prince of Wales Hospital, Sydney, Australia e Primary Dementia Collaborative Research Centre, University of New South Wales, Sydney, Australia f Centre for Mental Health Research, Australian National University, Canberrra, Australia abstract article info Article history: Received 25 August 2008 Received in revised form 19 January 2009 Accepted 15 April 2009 Keywords: Caudate nucleus Volumetrics Manual tracing Stroke Vascular dementia White matter Hyperintensities Fronto-subcortical circuits We aimed to assess the volume of the nucleus caudatus as a neuroanatomical substrate of fronto-subcortical circuits, in stroke patients with/without dementia, and the relationship to potential determinants of neural circuit integrity such as white matter hyperintensities (WMH) and stroke volume. Stroke only (Stroke) (n = 19) and stroke with Vascular Dementia (VaD) (n = 16) and healthy control (n = 20) subjects, matched on demographic variables, underwent extensive neuropsychiatric assessments and manual MRI-based volumetric measurements for intracranial area (ICA), stroke volume, and bilateral caudate volume. WMH on MRI were quantified using an automated algorithm. Multivariate analysis of covariance (controlling for age and ICA), revealed that across the three groups, caudate volumes were significantly different. There was a significant difference in bilateral caudate nucleus volume between subjects by diagnosis (Stroke, VaD, control). The control group was largest in overall mean volume of the diagnostic groups, followed by the Stroke group (86% of controls), and finally, the VaD group (72%). There was a partial correlation between total caudate volume and the total volume of deep WMH including periventricular regions and brainstem, controlling for ICA; and for total stroke volume. Stroke patients with VaD have smaller caudate nuclei compared to those without dementia and healthy controls, with the stroke-only patients being intermediate in their caudate volume status. There was preliminary evidence of negative correlation of caudate volume with volume of deep WMH and total stroke volume, suggesting cerebrovascular disease contributes to caudate atrophy, which, in turn may disrupt fronto-subcortical circuits. © 2009 Elsevier Ireland Ltd. All rights reserved. 1. Introduction Vascular Dementia (VaD) is considered to be the second leading cause of dementia (Sachdev et al., 1999). Interest has focused on neuropathology that underpins the development of vascular dementia. The caudate nucleus, in the basal ganglia, is a candidate region which is potentially vulnerable to ischemia and disconnection via damage to white matter (WM) due to cerebrovascular disease. The basal ganglia are part of the extrapyramidal motor pathways (Allen and Tsukahara, 1974). Functional magnetic resonance imaging (fMRI) confirms the roles that the caudate plays in cognition (Middleton and Strick, 1994; Seger and Cincotta, 2005), as have lesion studies of neuropsychiatric manifestations of basal ganglia disorders (Bhatia and Marsden, 1994; Ring and Serra-Mestres, 2002; Nishio et al., 2003). For example, subacute strokes in the caudate nucleus have been associated with perseveration independent of hemi-neglect (Nys et al., 2006). The caudate nucleus has relevance as a neuroanatomical substrate of dysfunction in relation to frontal-subcortical circuits in stroke and vascular dementia. We previously suggested frontal-subcortical circuit dysfunction as the substrate of executive dysfunction in stroke, vascular cognitive impairment and post-stroke apathy (Looi and Sachdev, 2000; Brodaty et al., 2005). The caudate plays a crucial role in relaying inputs from the prefrontal cortex in animals and thus may be involved in processing higher executive cognitive functions associated with these regions (Alexander et al., 1986; Sachdev et al., 2004; Hannestad et al., 2006). Anatomical studies have shown the existence of functionally segregated projections from prefrontal and parietal association cortices to, primarily, the caudate nucleus (Parent and Hazrati, 1995). The ventral striatum, especially the caudate, is implicated in cognition (Clark et al., 2005). The extensive interconnec- tions of the human caudate nucleus with the prefrontal cortex, temporal gyri, frontal eye fields, cerebellum and thalami have been Psychiatry Research: Neuroimaging 174 (2009) 67–75 ⁎ Corresponding author. Tel.: +61 2 6244-3500; fax: +61 2 6244 4964. E-mail address: [email protected] (J.C.L. Looi). 0925-4927/$ – see front matter © 2009 Elsevier Ireland Ltd. All rights reserved. doi:10.1016/j.pscychresns.2009.04.002 Contents lists available at ScienceDirect Psychiatry Research: Neuroimaging journal homepage: www.elsevier.com/locate/psychresns

Welcome message from author
This document is posted to help you gain knowledge. Please leave a comment to let me know what you think about it! Share it to your friends and learn new things together.
Transcript
Psychiatry Research: Neuroimaging 174 (2009) 67–75
Contents lists available at ScienceDirect
Psychiatry Research: Neuroimaging
j ourna l homepage: www.e lsev ie r.com/ locate /psychresns
Caudate nucleus volumes in stroke and vascular dementia
Jeffrey Chee Leong Looi a,⁎, Vanessa Tatham a, Rajeev Kumar a, Jerome J. Maller b,f, Ellen Millard a, Wei Wen c,d,Xiaohua Chen c,d, Henry Brodaty c,e, Perminder Sachdev c,d
a Research Centre for the Neurosciences of Ageing, Academic Unit of Psychological Medicine, Australian National University Medical School, Building 4, Level 2, The Canberra Hospital, P.O.Box 11, Woden Australian Capital Territory 2605, Australiab Alfred Psychiatry Research Centre, Monash University, Melbourne, Victoria, Australiac School of Psychiatry, Faculty of Medicine, University of New South Wales, Prince of Wales Hospital, Sydney, Australiad Neuropsychiatric Institute, Prince of Wales Hospital, Sydney, Australiae Primary Dementia Collaborative Research Centre, University of New South Wales, Sydney, Australiaf Centre for Mental Health Research, Australian National University, Canberrra, Australia
⁎ Corresponding author. Tel.: +61 2 6244-3500; fax:E-mail address: [email protected] (J.C.L. Looi).
0925-4927/$ – see front matter © 2009 Elsevier Irelanddoi:10.1016/j.pscychresns.2009.04.002
a b s t r a c t
a r t i c l e i n f oArticle history:Received 25 August 2008Received in revised form 19 January 2009Accepted 15 April 2009
Keywords:Caudate nucleusVolumetricsManual tracingStrokeVascular dementiaWhite matter HyperintensitiesFronto-subcortical circuits
We aimed to assess the volume of the nucleus caudatus as a neuroanatomical substrate of fronto-subcorticalcircuits, in stroke patients with/without dementia, and the relationship to potential determinants of neuralcircuit integrity such as white matter hyperintensities (WMH) and stroke volume. Stroke only (Stroke)(n=19) and strokewith Vascular Dementia (VaD) (n=16) and healthy control (n=20) subjects, matched ondemographic variables, underwent extensive neuropsychiatric assessments andmanualMRI-based volumetricmeasurements for intracranial area (ICA), stroke volume, and bilateral caudate volume. WMH on MRI werequantified using an automated algorithm. Multivariate analysis of covariance (controlling for age and ICA),revealed that across the three groups, caudate volumes were significantly different. There was a significantdifference in bilateral caudate nucleus volume between subjects by diagnosis (Stroke, VaD, control). Thecontrol group was largest in overall mean volume of the diagnostic groups, followed by the Stroke group(86% of controls), and finally, the VaD group (72%). There was a partial correlation between total caudatevolume and the total volume of deep WMH including periventricular regions and brainstem, controlling forICA; and for total stroke volume. Stroke patients with VaD have smaller caudate nuclei compared to thosewithout dementia and healthy controls, with the stroke-only patients being intermediate in their caudatevolume status. There was preliminary evidence of negative correlation of caudate volume with volumeof deep WMH and total stroke volume, suggesting cerebrovascular disease contributes to caudate atrophy,which, in turn may disrupt fronto-subcortical circuits.
© 2009 Elsevier Ireland Ltd. All rights reserved.
1. Introduction
Vascular Dementia (VaD) is considered to be the second leadingcause of dementia (Sachdev et al., 1999). Interest has focused onneuropathology that underpins the development of vascular dementia.
The caudate nucleus, in the basal ganglia, is a candidate regionwhichis potentially vulnerable to ischemia and disconnection via damage towhite matter (WM) due to cerebrovascular disease. The basal gangliaare part of the extrapyramidal motor pathways (Allen and Tsukahara,1974). Functionalmagnetic resonance imaging (fMRI) confirms the rolesthat the caudate plays in cognition (Middleton and Strick, 1994; Segerand Cincotta, 2005), as have lesion studies of neuropsychiatricmanifestations of basal ganglia disorders (Bhatia and Marsden, 1994;Ring and Serra-Mestres, 2002; Nishio et al., 2003). For example,
+61 2 6244 4964.
Ltd. All rights reserved.
subacute strokes in the caudate nucleus have been associated withperseveration independent of hemi-neglect (Nys et al., 2006).
The caudate nucleus has relevance as a neuroanatomical substrateof dysfunction in relation to frontal-subcortical circuits in stroke andvascular dementia.We previously suggested frontal-subcortical circuitdysfunction as the substrate of executive dysfunction in stroke,vascular cognitive impairment and post-stroke apathy (Looi andSachdev, 2000; Brodaty et al., 2005). The caudate plays a crucial role inrelaying inputs from the prefrontal cortex in animals and thus may beinvolved in processing higher executive cognitive functions associatedwith these regions (Alexander et al., 1986; Sachdev et al., 2004;Hannestad et al., 2006). Anatomical studies have shown the existenceof functionally segregated projections from prefrontal and parietalassociation cortices to, primarily, the caudate nucleus (Parent andHazrati, 1995). The ventral striatum, especially the caudate, isimplicated in cognition (Clark et al., 2005). The extensive interconnec-tions of the human caudate nucleus with the prefrontal cortex,temporal gyri, frontal eye fields, cerebellum and thalami have been
68 J.C.L. Looi et al. / Psychiatry Research: Neuroimaging 174 (2009) 67–75
demonstrated using diffusion tensor imaging (Lehericy et al., 2004;Leh et al., 2007). Damage to such circuits may potentially disconnectand degrade cognition subserved by such circuits (Looi and Sachdev,2000). WM comprises a likely site in which such disconnection mayoccur. Damage to fibres in circuits connecting to the caudate, may, viadenervation, cause atrophy (Hannestad et al., 2006). Similarly, caudateatrophy occurs post-cingulotomy (Rauch et al., 2000). Therefore,functionally salient WM ischemic lesions may be reflected in reducedcaudate volumes in stroke, vascular cognitive impairment, and late lifedepression (Hannestad et al., 2006). Similarly, any compromise ofblood supply to the caudate, including that from perinatal anddevelopmental causes, may thus result in reduced caudate volume(Looi et al., 2009). There is evidence of the salience of the caudate incognition and evidence of associated neuropathology whichmay havea role in etiopathogenesis of cognitive changes in stroke and VaD.
The cognitive manifestations of VaD may be partly due to reducedstriatal activity, and because the caudate nucleus relays input fromfrontal regions attributed to cognition, it may be a key structureaffected. The frontal executive features that have specifically beenimplicated in VaD include declines in working memory, abstraction,reasoning, mental flexibility and fluency (Looi and Sachdev, 1999). Wehypothesized that if the caudate is involved in the pathologicalprocess of VaD, it could be demonstrated quantitatively by a reductionin caudate volumes in comparison to matched controls, and that thevolumes of caudate nuclei in stroke subjects without VaD should thenbe intermediate between these groups. Hemispheric differences willbe analyzed, based upon previous studies that had found lateralizedeffects for caudate volume (Looi et al., 2008b, 2009).
We also hypothesized that WM lesions in regions adjacent to, orpotentially connected to, the caudate may cause disconnection of thecaudate from afferent or efferent tracts. We hypothesized that thevolume ofWM lesions in such regions may have a negative correlationwith caudate volume.
Strokes may also cause disconnection, via damage to cortical orsubcortical structures, including WM. Thus, another measure of theseverity of cerebrovascular disease is stroke volume. In those withcerebrovascular disease, we hypothesized that stroke volume wouldbe negatively correlated with caudate nucleus volume.
2. Methods
2.1. Sample
Subjectswere randomly selected from the Sydney Stroke study cohortbased upon availability of MRI at baseline and image quality for tracing,excluding those with a stroke in the caudate (Sachdev et al., 2004).
Subjects were recruited between May 1997 and June 2000.Subjects were aged 58–85 years, did not have a diagnosis of dementiaor other neurologic disorder prior to the stroke, did not have severeaphasia as a significant limiting factor for assessment (a score of b3 onthe Aphasia Severity Rating Scale of the Boston Diagnostic AphasiaExamination) (Goodglass and Kaplan, 1983), and were well enough toconsent to participate. Subjects had a decline of b5 points on the 16-item IQCODE (Jorm and Jacomb, 1989) over the 5 years preceding thestroke, as rated by an informant who had a minimum of once weeklycontact with the subject in this period. Healthy control subjects wereunpaid volunteers, recruited from the same neighborhood as thestroke subjects, matched for age, and who had no history of stroke, orother neurologic or psychiatric disorder. An attempt was made tomatch the subjects on sex and years of education.
Fifty-five participants (36 male and 19 female) were categorizedinto three groups. The first group (n=16) comprised patients whohad suffered a stroke andwere diagnosed with VaD (VaD); the secondgroup (n=19) included individuals who had a stroke (Stroke) butwere without cognitive impairment; and the third group (n=20)comprised healthy controls.
2.1.1. AssessmentStroke subjects had a baseline assessment within 1 week of
admission to hospital, which included a detailed medical history andexamination, history of risk factors for cerebrovascular disease anddementia, a functional assessment, and the Mini-Mental StateExamination (MMSE) (Folstein et al., 1975). Between 3 and 6 monthsafter the index stroke, a detailed neuropsychological assessment andmedical and psychiatric examination were performed, and subjectshad a brain MRI scan. The control group had a similar assessmentperformed in one stage.
2.1.2. Neuropsychological assessmentThe battery comprised the following tests pertaining to various
cognitive domains: verbal memory (Logical Memory [LM] I and IIsubtests from Wechsler Memory Scale-Revised [WMS-R]) (Wechsler,1987); visual memory (Visual Reproduction [VR] I & II from WMS-R)(Wechsler, 1987); working memory (Digit Span backwards, Arith-metic from Wechsler Adult Intelligence Scale Revised [WAIS-R])(Wechsler, 1981); attention (Digit Span forwards [WAIS-R]) (Wechs-ler, 1981); mental control (WMS-R) (Wechsler, 1987); language (15-item Boston Naming Test) (Mack et al., 1992); information processingspeed (Trail Making Test Part A, Reitan and Wolfson, 1985, SymbolDigit Modalities Test [SDMT], Smith, 1991); visuoconstruction (BlockDesign [WAIS-R], Wechsler, 1981 and copying simple figures); praxis-gnosis (Western Aphasia Battery ideomotor apraxia subtest items,Kertesz, 1983, finger gnosis and stereognosis, Benton et al., 1983; Struband Black, 1985); abstract reasoning (Similarities, Picture Completion[WAIS-R]) (Wechsler, 1981); mental flexibility (Color Form SortingText, Weigl, 1941, Trail Making Test Part B, Reitan and Wolfson, 1985);verbal fluency (phonemic [FAS], Benton and Hamsher, 1978, andsemantic [animals], Morris et al., 1989). Mental flexibility and verbalfluency were together characterized as executive function. Premorbidability was estimated using the National Adult Reading Test-Revised(NART-R) (Nelson and Willison, 1982). Trained clinical psychol-ogists performed assessments. Subjects were given breaks whereappropriate to minimize the effects of fatigue on performance.Subjects judged to be clinically depressed were not tested until theirdepression had been satisfactorily treated as judged by a total scoreon the Global Depression Scale of 5, a reduction in self-reportedsymptoms of depression, informant report, or further psychiatricassessment (Sachdev et al., 2004).
2.1.3. Medical and psychiatric assessmentMedical and psychiatric assessment comprised the following:
medical history; functional assessment (Social and OccupationalFunctioning Scale [SOFAS], American Psychiatric Association, 1994),Activities of Daily Living [ADL] (Katz et al., 1963), and InstrumentalADL [IADL]) (Lawton and Brody, 1969); a standard neurologicexamination (European Stroke Scale) (Hanston et al., 1994); anddetailed psychiatric assessment (past psychiatric history, StructuredClinical Interview for Diagnostic and Statistical Manual of MentalDisorders-IV (First et al., 1997), 28-item General Health Questionnaire(Goldberg and Hillier, 1979), 15-item Geriatric Depression Scale(Sheikh and Yesavage, 1986), Hamilton Depression Rating Scale(Hamilton, 1960), and Neuropsychiatric Inventory (Cummings et al.,1994).
2.1.4. Stroke subjects and dementia diagnosisThe stroke subjects were part of a group of 10–20% of consecutive
patients admitted to two large teaching hospitals affiliated with theUniversity of New South Wales who had recently had an ischemicstroke as diagnosed by two neurologists independently. Exclusionswere for various reasons e.g. prior dementia, too sick, non-Englishspeaking etc. and refusal (Sachdev et al., 2004). An ischemic strokewas defined as “rapidly developing clinical signs of focal (or global)disturbance of cerebral function, with symptoms lasting 24 h or
69J.C.L. Looi et al. / Psychiatry Research: Neuroimaging 174 (2009) 67–75
longer, with no apparent cause other than of vascular origin” in whicha brain CT or MRI scan did not show intracranial hemorrhage.
The diagnosis was assigned to each subject in a case conference atwhich all medical, psychiatric, neuropsychological, and neuroimagingdatawere presented, and a consensuswas reached. A neuropsychiatrist,a psychogeriatrician, a neurologist, and one or more research psychol-ogists attended the meeting. Guidelines were drawn up for a diagnosisof dementia, VaD, and vascular cognitive impairment (VCI) (Sachdevet al., 2004).
For dementia (VaD) diagnosis, a subject must have definite impair-ment in two or more cognitive domains (impairment in memory wasnot necessary), demonstrate evidence of functional decline because ofthe cognitive deficits, and have evidence of cerebrovascular disease onMRI or CT scan judged to be sufficient to account for cognitive impair-ment. Definite cognitive impairmentwas defined as performance belowthe 5th percentile relative to age-adjusted published normative data,and functional decline was a decline in SOFAS score of 20 from thepremorbid estimate or failure on one item of ADL or two items of IADLdue to cognitive deficits as judged by consensus.
For a diagnosis of VCI, the subject must have definite impairmentin one domain ormarginal impairment in two domains or, if therewasimpairment in more domains, the functional decline criterion for VaDwas not met. Marginal impairment was performance at 5th to 10thpercentiles of age-matched normative data.
Those subjects had suffered a stroke, but no demonstrable impair-ment which would be included in the VaD or VCI categories, wereclassified as stroke only (Stroke) subjects.
2.1.5. ControlsHealthy control subjects were unpaid volunteers, recruited from
the same neighborhood as the stroke subjects, matched for age, andwho had no history of stroke, or other neurologic or psychiatricdisorder. An attempt was made tomatch the subjects on sex and yearsof education.
2.2. MRI scans
MRI was performed on a 1.5 T Sigma GE scanner (GE Systems,Milwaukee, WI) using the following protocol: a scout midsagittal cut(two-dimensional, repetition time [TR] 300 ms, echo time [TE] 14 ms,5 mm thick, number of excitations 1.5); 1.5-mm-thick T1-weightedcontiguous coronal sections through whole brain using a FSPGRsequence and three-dimensional acquisition (TR 14.3 ms, TE 5.4 ms);4-mm-thick (0 skip) T2-weighted fluid-attenuated inversion recovery(T2-FLAIR) coronal slices through whole brain (TR 8900, TE 145,inversion time 2200, field of view 25, 256×192).
2.3. Image analysis
2.3.1. Caudate volume measurementsAll ratings were carried out on a workstation using ANALYZE 6.0
(Mayo Foundation, Rochester, MI) software. The caudate nucleus wasmanually traced bilaterally in the axial plane in every slice that itappeared using a protocol described in a previous paper (Looi et al.,2008a). Images with strokes within the caudate were excluded andanother scan randomly selected. Tracings were cross referenced inboth coronal and sagittal planes to increase accuracy with reference tostandard images (Duvernoy, 1999; Haines, 2000). T2 Flair MRI imageswere examined to ensure the exclusion of WM hyperintensities. Allportions of the caudate nucleus were included until the tail curvedventrally to border the lateral atrium of the lateral ventricles; here itwas excluded from measurements. The intracranial area (ICA) wasused as a covariate in within and between group comparisons as ameans of adjusting caudate volume in relation to brain volume. Theintracranial area (ICA) was obtained by location of the midsagittalsection by using anatomical landmarks in a hierarchical order adapted
from MRI anatomy text (Duvernoy, 1999; Haines, 2000). (Theselandmarks were, firstly, no or only minimal WM in the cortical mantlesurrounding the cerebral cortex, secondly, the interthalamic adhesion,and thirdly, the transparent septum and the cerebral aqueduct.) MRImeasurements were performed blind to the subjects' diagnosis status.(See Fig. 1–Online publication).
All tracings were carried out by a single trained rater (VT) withgood inter-rater reliability. The intra-class correlations were per-formed using SPSS 15.0 (SPSS Inc, Chicago, Illinois, USA). VT obtainedan intra-rater class correlation ICC (1,1), one-way single measurereliability (Shrout and Fleiss, 1979), of 0.90 on five scans (involving 10comparisons e.g. right and left caudate). Inter-rater mean classcorrelation ICC (1,k), one-way model single and average measure,was 0.99 on five scans (again involving 10 comparisons) with EM.
2.3.2. Measurement of stroke volumeStroke volume was measured by an experienced rater (JCLL) using
ANALYZE 5.0 (Mayo Foundation, Rochester, MI) to manually outlinestrokes identified with reference to T1-weighted and FLAIR images. Theslice-by-slicemanually delineated strokes were summated to produce avolume by adjustment for slice thickness. Very small, lacunar infarctionswere measured measuring the greatest diameter and then calculatingvolume based upon a sphere with the traced diameter. Intra-raterreliability on various measures was 0.8–0.92 on 20 scans.
2.3.3. Automated image analysis for WMHThe automated image analysis method for WMH has been
previously described (Wen and Sachdev, 2004).The first stage was the automated detection, delineation, severity
rating, and volumetric measurement of WMHs from FLAIR images. Insummary, we constructed an age-specific FLAIR template in MontrealNeurological Institute (MNI)-space (Evans et al., 1993; Wen andSachdev, 2004). Spatial normalization of the co-registered FLAIR andT1-weighted MRI was then performed using FLAIR template as thetarget. Then detection and grading of WMH from each normalizedFLAIR image with T1-weighted image as reference were carried out.We visually inspected each WMH map generated by the computeralgorithm and manually removed false classification of WMH fromthe map.
WMHmaps thus generatedwere binary images, the voxel values ofwhich indicated either the presence or absence of WMH on thatlocation. Linear and nonlinear transforms were applied onto eachindividual MRI in warping them into MNI-space. The WMH thusmeasured is the relative WMH lesion load rather than the absolutevolume. Removal of stroke infarcts that appeared to have similarsignal intensities withWMH in FLAIR scans was done manually on theWMH map by referencing it to its corresponding 3D T1-weightedanatomical image to confirm the stroke infarct site.
The second main component was region of interest (ROI) andvoxel-wise analysis of WMH brain maps reported in a previous paper(Wen and Sachdev, 2004). In the previous study, quantitative ROIanalysis was used in investigating the WMH volume differencesbetween the stroke and control groups in anatomical regions andarterial territorial partitions (Wen and Sachdev, 2004). A subset of theWMH data from the previous study (Wen and Sachdev, 2004): WMHvolumes for the subjects included in this study, was used for ouranalyses for correlation with caudate volume.
Voxel-wise analysis was performed to generate statistical pa-rametric maps in detectingWM anatomical structures with significantdifferences between two groups. To prepare the images, we applied aGaussian smoothing kernel (full width at half maximum, 10 mm) onthe individual WMH map to increase the signal-to-noise ratio. Theresulting blurred WMH map may be considered an estimate of theprobability that the subject has a WMH at that location.
As the abnormal WM signal varied in intensity, we categorized itinto “low” and “high” intensity lesions (Wen and Sachdev, 2004). The
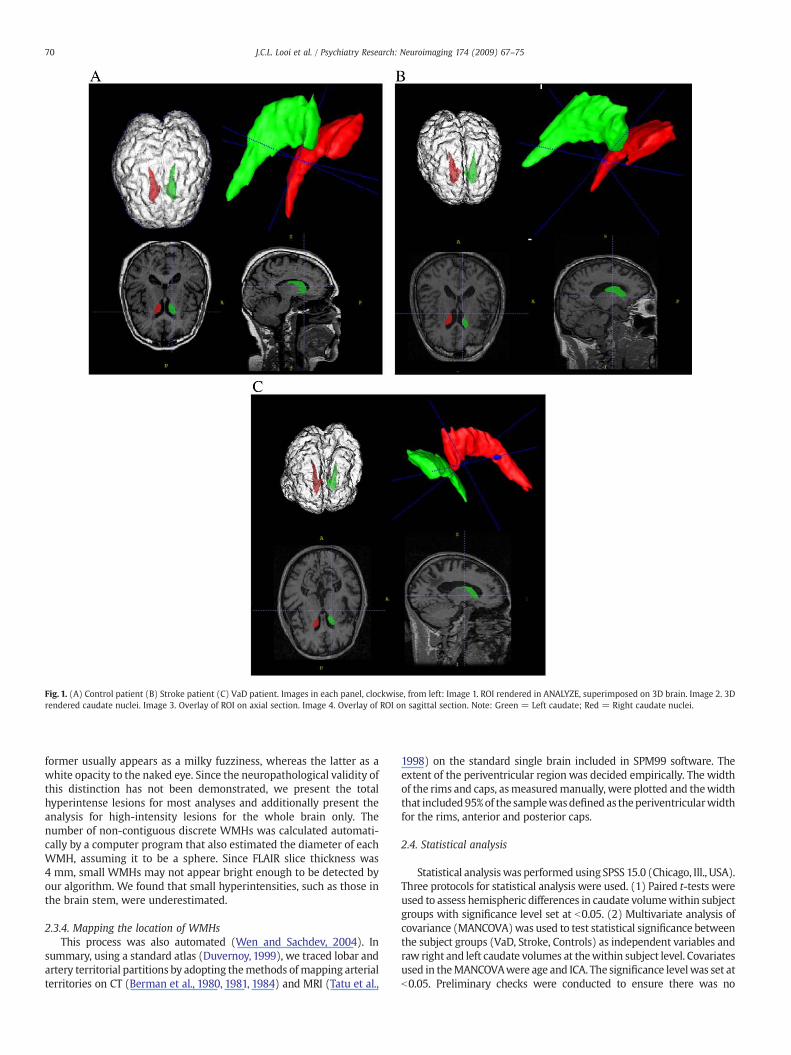
Fig. 1. (A) Control patient (B) Stroke patient (C) VaD patient. Images in each panel, clockwise, from left: Image 1. ROI rendered in ANALYZE, superimposed on 3D brain. Image 2. 3Drendered caudate nuclei. Image 3. Overlay of ROI on axial section. Image 4. Overlay of ROI on sagittal section. Note: Green = Left caudate; Red = Right caudate nuclei.
70 J.C.L. Looi et al. / Psychiatry Research: Neuroimaging 174 (2009) 67–75
former usually appears as a milky fuzziness, whereas the latter as awhite opacity to the naked eye. Since the neuropathological validity ofthis distinction has not been demonstrated, we present the totalhyperintense lesions for most analyses and additionally present theanalysis for high-intensity lesions for the whole brain only. Thenumber of non-contiguous discrete WMHs was calculated automati-cally by a computer program that also estimated the diameter of eachWMH, assuming it to be a sphere. Since FLAIR slice thickness was4 mm, small WMHs may not appear bright enough to be detected byour algorithm. We found that small hyperintensities, such as those inthe brain stem, were underestimated.
2.3.4. Mapping the location of WMHsThis process was also automated (Wen and Sachdev, 2004). In
summary, using a standard atlas (Duvernoy, 1999), we traced lobar andartery territorial partitions by adopting themethods of mapping arterialterritories on CT (Berman et al., 1980, 1981, 1984) and MRI (Tatu et al.,
1998) on the standard single brain included in SPM99 software. Theextent of the periventricular region was decided empirically. The widthof the rims and caps, asmeasuredmanually, were plotted and thewidththat included95%of the samplewasdefinedas theperiventricularwidthfor the rims, anterior and posterior caps.
2.4. Statistical analysis
Statistical analysiswas performed using SPSS 15.0 (Chicago, Ill., USA).Three protocols for statistical analysis were used. (1) Paired t-tests wereused to assess hemispheric differences in caudate volumewithin subjectgroups with significance level set at b0.05. (2) Multivariate analysis ofcovariance (MANCOVA)was used to test statistical significance betweenthe subject groups (VaD, Stroke, Controls) as independent variables andraw right and left caudate volumes at thewithin subject level. Covariatesused in theMANCOVAwere age and ICA. The significance levelwas set atb0.05. Preliminary checks were conducted to ensure there was no
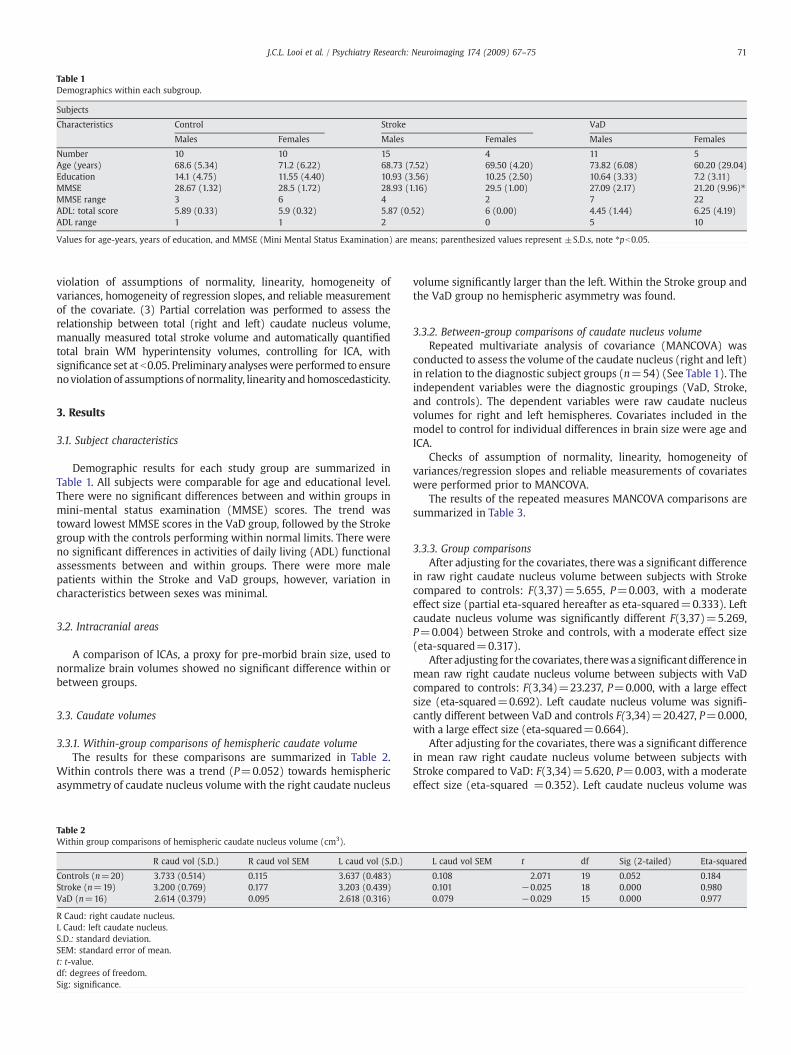
Table 1Demographics within each subgroup.
Subjects
Characteristics Control Stroke VaD
Males Females Males Females Males Females
Number 10 10 15 4 11 5Age (years) 68.6 (5.34) 71.2 (6.22) 68.73 (7.52) 69.50 (4.20) 73.82 (6.08) 60.20 (29.04)Education 14.1 (4.75) 11.55 (4.40) 10.93 (3.56) 10.25 (2.50) 10.64 (3.33) 7.2 (3.11)MMSE 28.67 (1.32) 28.5 (1.72) 28.93 (1.16) 29.5 (1.00) 27.09 (2.17) 21.20 (9.96)⁎MMSE range 3 6 4 2 7 22ADL: total score 5.89 (0.33) 5.9 (0.32) 5.87 (0.52) 6 (0.00) 4.45 (1.44) 6.25 (4.19)ADL range 1 1 2 0 5 10
Values for age-years, years of education, and MMSE (Mini Mental Status Examination) are means; parenthesized values represent ±S.D.s, note ⁎pb0.05.
71J.C.L. Looi et al. / Psychiatry Research: Neuroimaging 174 (2009) 67–75
violation of assumptions of normality, linearity, homogeneity ofvariances, homogeneity of regression slopes, and reliable measurementof the covariate. (3) Partial correlation was performed to assess therelationship between total (right and left) caudate nucleus volume,manually measured total stroke volume and automatically quantifiedtotal brain WM hyperintensity volumes, controlling for ICA, withsignificance set at b0.05. Preliminary analyseswere performed to ensurenoviolation of assumptions of normality, linearity andhomoscedasticity.
3. Results
3.1. Subject characteristics
Demographic results for each study group are summarized inTable 1. All subjects were comparable for age and educational level.There were no significant differences between and within groups inmini-mental status examination (MMSE) scores. The trend wastoward lowest MMSE scores in the VaD group, followed by the Strokegroup with the controls performing within normal limits. There wereno significant differences in activities of daily living (ADL) functionalassessments between and within groups. There were more malepatients within the Stroke and VaD groups, however, variation incharacteristics between sexes was minimal.
3.2. Intracranial areas
A comparison of ICAs, a proxy for pre-morbid brain size, used tonormalize brain volumes showed no significant difference within orbetween groups.
3.3. Caudate volumes
3.3.1. Within-group comparisons of hemispheric caudate volumeThe results for these comparisons are summarized in Table 2.
Within controls there was a trend (P=0.052) towards hemisphericasymmetry of caudate nucleus volume with the right caudate nucleus
Table 2Within group comparisons of hemispheric caudate nucleus volume (cm3).
R caud vol (S.D.) R caud vol SEM L caud vol (S.D.)
Controls (n=20) 3.733 (0.514) 0.115 3.637 (0.483)Stroke (n=19) 3.200 (0.769) 0.177 3.203 (0.439)VaD (n=16) 2.614 (0.379) 0.095 2.618 (0.316)
R Caud: right caudate nucleus.L Caud: left caudate nucleus.S.D.: standard deviation.SEM: standard error of mean.t: t-value.df: degrees of freedom.Sig: significance.
volume significantly larger than the left. Within the Stroke group andthe VaD group no hemispheric asymmetry was found.
3.3.2. Between-group comparisons of caudate nucleus volumeRepeated multivariate analysis of covariance (MANCOVA) was
conducted to assess the volume of the caudate nucleus (right and left)in relation to the diagnostic subject groups (n=54) (See Table 1). Theindependent variables were the diagnostic groupings (VaD, Stroke,and controls). The dependent variables were raw caudate nucleusvolumes for right and left hemispheres. Covariates included in themodel to control for individual differences in brain size were age andICA.
Checks of assumption of normality, linearity, homogeneity ofvariances/regression slopes and reliable measurements of covariateswere performed prior to MANCOVA.
The results of the repeated measures MANCOVA comparisons aresummarized in Table 3.
3.3.3. Group comparisonsAfter adjusting for the covariates, there was a significant difference
in raw right caudate nucleus volume between subjects with Strokecompared to controls: F(3,37)=5.655, P=0.003, with a moderateeffect size (partial eta-squared hereafter as eta-squared=0.333). Leftcaudate nucleus volume was significantly different F(3,37)=5.269,P=0.004) between Stroke and controls, with a moderate effect size(eta-squared=0.317).
After adjusting for the covariates, therewas a significantdifference inmean raw right caudate nucleus volume between subjects with VaDcompared to controls: F(3,34)=23.237, P=0.000, with a large effectsize (eta-squared=0.692). Left caudate nucleus volume was signifi-cantly different between VaD and controls F(3,34)=20.427, P=0.000,with a large effect size (eta-squared=0.664).
After adjusting for the covariates, there was a significant differencein mean raw right caudate nucleus volume between subjects withStroke compared to VaD: F(3,34)=5.620, P=0.003, with a moderateeffect size (eta-squared =0.352). Left caudate nucleus volume was
L caud vol SEM t df Sig (2-tailed) Eta-squared
0.108 2.071 19 0.052 0.1840.101 −0.025 18 0.000 0.9800.079 −0.029 15 0.000 0.977
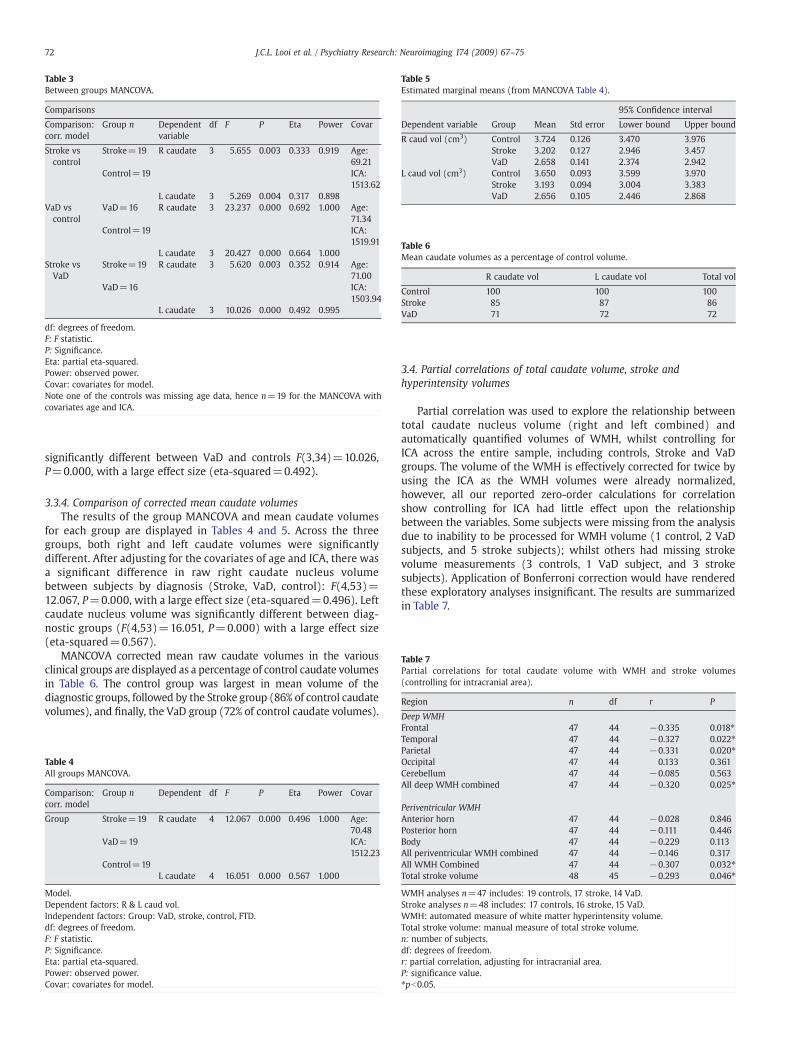
Table 3Between groups MANCOVA.
Comparisons
Comparison:corr. model
Group n Dependentvariable
df F P Eta Power Covar
Stroke vscontrol
Stroke=19 R caudate 3 5.655 0.003 0.333 0.919 Age:69.21
Control=19 ICA:1513.62
L caudate 3 5.269 0.004 0.317 0.898VaD vscontrol
VaD=16 R caudate 3 23.237 0.000 0.692 1.000 Age:71.34
Control=19 ICA:1519.91
L caudate 3 20.427 0.000 0.664 1.000Stroke vsVaD
Stroke=19 R caudate 3 5.620 0.003 0.352 0.914 Age:71.00
VaD=16 ICA:1503.94
L caudate 3 10.026 0.000 0.492 0.995
df: degrees of freedom.F: F statistic.P: Significance.Eta: partial eta-squared.Power: observed power.Covar: covariates for model.Note one of the controls was missing age data, hence n=19 for the MANCOVA withcovariates age and ICA.
Table 5Estimated marginal means (from MANCOVA Table 4).
95% Confidence interval
Dependent variable Group Mean Std error Lower bound Upper bound
R caud vol (cm3) Control 3.724 0.126 3.470 3.976Stroke 3.202 0.127 2.946 3.457VaD 2.658 0.141 2.374 2.942
L caud vol (cm3) Control 3.650 0.093 3.599 3.970Stroke 3.193 0.094 3.004 3.383VaD 2.656 0.105 2.446 2.868
Table 6Mean caudate volumes as a percentage of control volume.
R caudate vol L caudate vol Total vol
Control 100 100 100Stroke 85 87 86VaD 71 72 72
Table 7Partial correlations for total caudate volume with WMH and stroke volumes(controlling for intracranial area).
Region n df r P
Deep WMH
72 J.C.L. Looi et al. / Psychiatry Research: Neuroimaging 174 (2009) 67–75
significantly different between VaD and controls F(3,34)=10.026,P=0.000, with a large effect size (eta-squared=0.492).
3.3.4. Comparison of corrected mean caudate volumesThe results of the group MANCOVA and mean caudate volumes
for each group are displayed in Tables 4 and 5. Across the threegroups, both right and left caudate volumes were significantlydifferent. After adjusting for the covariates of age and ICA, there wasa significant difference in raw right caudate nucleus volumebetween subjects by diagnosis (Stroke, VaD, control): F(4,53)=12.067, P=0.000, with a large effect size (eta-squared=0.496). Leftcaudate nucleus volume was significantly different between diag-nostic groups (F(4,53)=16.051, P=0.000) with a large effect size(eta-squared=0.567).
MANCOVA corrected mean raw caudate volumes in the variousclinical groups are displayed as a percentage of control caudate volumesin Table 6. The control group was largest in mean volume of thediagnostic groups, followed by the Stroke group (86% of control caudatevolumes), and finally, the VaD group (72% of control caudate volumes).
Table 4All groups MANCOVA.
Comparison:corr. model
Group n Dependent df F P Eta Power Covar
Group Stroke=19 R caudate 4 12.067 0.000 0.496 1.000 Age:70.48
VaD=19 ICA:1512.23
Control=19L caudate 4 16.051 0.000 0.567 1.000
Model.Dependent factors: R & L caud vol.Independent factors: Group: VaD, stroke, control, FTD.df: degrees of freedom.F: F statistic.P: Significance.Eta: partial eta-squared.Power: observed power.Covar: covariates for model.
3.4. Partial correlations of total caudate volume, stroke andhyperintensity volumes
Partial correlation was used to explore the relationship betweentotal caudate nucleus volume (right and left combined) andautomatically quantified volumes of WMH, whilst controlling forICA across the entire sample, including controls, Stroke and VaDgroups. The volume of the WMH is effectively corrected for twice byusing the ICA as the WMH volumes were already normalized,however, all our reported zero-order calculations for correlationshow controlling for ICA had little effect upon the relationshipbetween the variables. Some subjects were missing from the analysisdue to inability to be processed for WMH volume (1 control, 2 VaDsubjects, and 5 stroke subjects); whilst others had missing strokevolume measurements (3 controls, 1 VaD subject, and 3 strokesubjects). Application of Bonferroni correction would have renderedthese exploratory analyses insignificant. The results are summarizedin Table 7.
Frontal 47 44 −0.335 0.018⁎Temporal 47 44 −0.327 0.022⁎Parietal 47 44 −0.331 0.020⁎Occipital 47 44 0.133 0.361Cerebellum 47 44 −0.085 0.563All deep WMH combined 47 44 −0.320 0.025⁎
Periventricular WMHAnterior horn 47 44 −0.028 0.846Posterior horn 47 44 −0.111 0.446Body 47 44 −0.229 0.113All periventricular WMH combined 47 44 −0.146 0.317All WMH Combined 47 44 −0.307 0.032⁎Total stroke volume 48 45 −0.293 0.046⁎
WMH analyses n=47 includes: 19 controls, 17 stroke, 14 VaD.Stroke analyses n=48 includes: 17 controls, 16 stroke, 15 VaD.WMH: automated measure of white matter hyperintensity volume.Total stroke volume: manual measure of total stroke volume.n: number of subjects.df: degrees of freedom.r: partial correlation, adjusting for intracranial area.P: significance value.⁎pb0.05.
73J.C.L. Looi et al. / Psychiatry Research: Neuroimaging 174 (2009) 67–75
3.4.1. Deep WMH volumeThere was a moderate, negative, partial correlation between total
caudate volume and the total volume of deep WMH (excludingperiventricular regions), controlling for ICA (r=−0.320, n=50,P=0.025). Inspection of the zero order correlation (r=−0.304),suggested that controlling for ICA had little effect upon the strength ofthe relationship between the variables.
Subgroup analyses by region of deep WMH (excluding periventri-cular regions) and controlling for ICA showed significant correlations forfrontal (r=−0.335, n=50, P=0.018), temporal (r=−0.327, n=50,P=0.022), and parietal (r=−0.331, n=50, P=0.020) regions, butnot for occipital or cerebellar regions.
3.4.2. Periventricular WMH volumeThere was no significant correlation between total caudate volume
and the total volume of WMH within periventricular regions,controlling for ICA, or within subgroups of periventricular WMH.
3.4.3. Total WMH volumeThere was a moderate negative partial correlation between total
caudate volume and the total volume of deep WMH includingperiventricular regions and brainstem, controlling for ICA (r=−0.320, n=50, P=0.032). Inspection of the zero order correlation(r=−0.297), suggested that controlling for ICA had little effect uponthe strength of the relationship between the variables.
3.4.4. Total stroke volumeThere was a small negative partial correlation between total
caudate volume and the total stroke volume, controlling for ICA (r=−0.293, n=48, P=0.046). Inspection of the zero order correlation(r=−0.322) suggested once again that controlling for ICA had littleeffect upon the strength of the relationship between the variables.
4. Discussion
This study revealed significant differences in the volume of the headand body of the caudate nucleus between diagnostic groups. Smallercaudate nucleus volumes were found in association with increasingseverity of cognitive deficit. Healthy control subjects had the largestmean caudate nucleus volumes. The Stroke group had a significantlysmaller mean caudate volume than the control group. Thus, thecerebrovascular disease (Stroke) group is intermediate in caudatenucleus volume. Those with VaD had the smallest mean bilateralcaudate nucleus volume. The relative differences in caudate nucleusvolumes may be due to a number of factors, such as cerebrovascularinsufficiency, WM disconnection and generalized atrophy.
Increasing cerebrovascular insufficiency or compromise is believedto contribute to cerebrovascular disease and stroke (Astrup et al.,1981; Baron, 1999). The volume of the caudate may vary acrosscontrol, VaD and Stroke groups due to differential cerebrovascularinsufficiency. An adequately perfused organ or structure, should, ce-teris paribus, be normal in size and function. A poorly perfusedstructure, lacking nutriments, would be dysmorphic and, therefore,reduced in size and function. On the basis of blood supply, controlsshould have an adequate blood supply to the caudate and thus havethe largest volume, whilst stroke subjects have demonstratedcerebrovascular insufficiency which, in turn, may reduce the bloodsupply of the caudate. Similarly, those with the greatest cerebrovas-cular insufficiency, the VaD group, would therefore be expected tohave the smallest volume of the caudate. Partial correlation of totalstroke volume, controlling for brain size, showed a small and negativecorrelation with total caudate nucleus volume. Thus, increasedcerebrovascular disease, as measured as stroke volume, was signifi-cantly correlated with decreased caudate nucleus volume, partiallysupporting the hypothesis. However, the correlation coefficients
showed only 10% shared variance between total stroke volume andcaudate volume, hence, other factors may be important.
Loss of afferent or efferentWMconnectionsmight impact upon theactivity; and, via neuroplasticity, on caudate volume. Thus, WMlesions adjacent to or impinging upon the caudatemight be associatedwith reduced caudate volume, as has been found in late life depressionassociated cerebrovascular disease (Hannestad et al., 2006). Partialcorrelation analysis revealed relatively weak negative correlationbetweenWMH volume and total caudate volume for frontal, temporaland parietal regional deep WMH, as well as for total brain WMH, butnot for periventricular WMH (anterior horn, posterior horn orperiventricular body). That is, greater volumes of deep WMH inregions relevant to the caudate were associated with decreased totalcaudate volume, providing partial support for the hypothesis thatdisconnection phenomena due to strategic WMH may impact oncaudate volume. However, the correlations are relatively weak, andapplication of a Bonferroni correction would render them insignif-icant. Furthermore, correlation coefficients show only 10–11% sharedvariance between deep WMH volume and caudate volume, so otherfactors may be important. Periventricular WMH have been postulatedto relate to involutional tissue signal intensity changes rather thanbeing specific cerebrovascular WMH, perhaps explaining the lack ofassociation of these lesions with caudate volume. We consider thatthese relatively weak correlations suggest preliminary directions forfurther research, with larger samples and longitudinally.
Afferent cortical inputs are relayed via the ventral caudate through tothe putamen, globus pallidus, thalamus and thence to frontal cortex,comprising a cortico-striato-pallido-thalamic-cortical loop (Clark et al.,2005). Generalized cerebral atrophy may thus also reduce the afferentfunctional connectivity of the caudate, and, via neuroplasticity, affect thevolume of the caudate. VaD has the greatest compromise of cognition,which, in turn may reduce inputs via the caudate causing reduction infunctional activity and result in neuroplasticity-mediated atrophy.Similarly, white matter hyperintensities due to cerebrovascular insuffi-ciencymaydisconnect the afferent and efferent pathways of the caudateand lead to neuroplastic atrophy. However,we need longitudinal studiesto investigate whether white matter disease (leukoaraiosis) is asso-ciated with a decline in caudate volume and have conducted a pilotstudy that supports this hypothesis (Looi et al., Unpublished). Therefore,it is possible that interactive effects of: cerebrovascular insufficiency;combined with disconnection phenomena due to leukoaraiosis; up anddownstream effects from caudate and cortical atrophy may allcontribute to the cognitive consequences of stroke.
Effects of such reductions in caudate nucleus volume are related tothe functions served by the fronto-subcortical circuits traversing thecaudate. One key function of the fronto-subcortical circuits is tomediate higher order dorsolateral prefrontal-executive cognition,including organizing, sequencing and anticipating future conse-quences (Tekin and Cummings, 2002). Frontal-executive cognitivedysfunction has been demonstrated with stroke, such that fronto-subcortical dysfunction may be the mechanism underlying vasculardementia (Looi and Sachdev, 2000). Previously, we found volumetricreduction of the caudate in a gradient according to the putativeinvolvement of fronto-subcortical dysfunction in frontotemporal lobardegeneration (Looi et al., 2008b).
Volumetric reduction in the caudate with increasing cerebrovas-cular disease such as stroke, mediated by WMH and infarction,interacting with leukoaraiosis, may contribute to disruption of theintegrity of fronto-subcortical circuits and hence, frontal-executivecognitive dysfunction in stroke. Stroke-related interactions betweencortical atrophy, cerebrovascular insufficiency and disconnectionphenomena may both further contribute to caudate atrophy, causingfurther decrements in frontal-executive cognitive function.
Strengths of this study include selection of subjects well matched forage, education and past medical history including duration and severityof condition; and a well characterized control group. The diagnostic
74 J.C.L. Looi et al. / Psychiatry Research: Neuroimaging 174 (2009) 67–75
process for VaD was thorough, encompassing clinical assessments,neurological examination, neuropsychological testing as well asconsensus analysis of MRI (Sachdev et al., 2004). Volumetrics wereperformed by a trained single rater, using a standardized peer-reviewedprotocol, blinded to diagnostic group with good inter and intra-raterreliability (Looi et al., 2008a). Arguably,manual tracing remains the goldstandard for MRI volumetric quantification for structures or volumesthat can be reliably manually delineated (Looi et al., 2008a). In contrast,WMH, being diffuse and distributed throughout the brain, are morereliably measured using automated methods, where manual tracingwould be time-consuming and impractical.
While a potential limitation of this study is the small number ofsubjects in some groups, thereby reducing statistical power todetermine significant differences, this renders our results moreconservative. There was also a gender bias, due to a significantlylarger proportion of males in the study, but there was no significanteffect of gender on caudate size adjusted for brain volume and theproportion of males was similar in the Stroke and VaD groups.Arguably, it would be preferable to normalize volumes usingintracranial volume instead of ICA; however, this was a covariate intheMANCOVA and controlled for in the partial correlation, rather thanused as a ratio for normalization. Strokes located in proximity to thecaudate may significantly impact upon caudate function, and conse-quently, volume.We therefore excluded subjects with infarction in thecaudate itself. Finally, we used a combination of manual and voxel-based morphometric methods (VBM) over a decade of work byvarious members of the group, and acknowledge a more puremethodological approach would have been to use entirely automatedor entirely manual methods. We could not use VBM at the time ofcaudate tracing to quantify the caudate, and retain some reservationsabout partial volume effects on such measures due to proximity to thelateral ventricle. Similarly, we could not at the time quantify the strokevolumes using VBMwhich were measured manually close to a decadeago. We were therefore limited by different developmental timelinesfor the methods and were unable to transform the manually tracedcaudate (binaries for which were not saved at the time) into the sameMNI space as the VBM measures, which would have been ideal forvolumetrics.
5. Conclusions
We have shown that the caudate nucleus volume is significantlysmaller in those with Stroke and VaD as compared to controls.Furthermore, there is a gradient in caudate volume, with controlshaving the largest volumes; those with Stroke having intermediatevolume; and those with VaD having the smallest volume. MRIvolumetric reduction of the caudate may be related to the severityof cerebrovascular disease. Marked caudate atrophy in VaD suggests apossible subcortical basis for dementia in cerebrovascular disease.There are preliminary negative correlations of stroke and WMHvolumes, measures of cerebrovascular disease, with total caudatevolume, meriting further investigation. Resultant caudate volume lossmay disrupt fronto-subcortical circuits traversing the caudate andthus, contribute to frontal-executive cognitive dysfunction found instroke.
Future research, involving larger samples, should also encompassmapping and quantification of WM disease to investigate therelationship of WM to volume of the caudate in stroke. This mayalso inform us of the salience of cerebrovascular insufficiency to thevolume of the caudate. Correlation of these findings with volumetricsof afferent and efferents of the fronto-subcortical circuits mayelucidate the drivers of neuroplasticity-mediated volumetric change.
The impact of caudate volume loss should be investigated inrelation to neuropsychological and neuropsychiatric features ofstroke, to determine the implications for clinical presentation andpractice.
Author contributions
JCLL designed and is guarantor of the study: supervised training,performed statistical analysis; performed manual measurements ofstroke volume; recruited controls; performedmedical, neurologic andpsychiatric assessments; wrote the final draft, and is equal first co-authorwith VT. VT performed caudatemeasurements and preliminarystatistical analysis. JJM and RK supervised training, caudate measure-ments and preliminary statistical analysis. EM assisted with caudatemeasurements. WW & PS developed the automated image WMHanalysis. XC assisted with data analysis for automated data. HB and PSwere principal investigators for the Sydney Stroke Study. All authorscontributed to the writing of the paper.
Disclosures
None.
Acknowledgement
The Sydney Stroke Study was supported by grants from theNational Health and Medical Research Council of Australia.
References
Allen, G.I., Tsukahara, N., 1974. Cerebrocerebellar communications systems. Physiolog-ical Review 54, 957–1006.
Alexander, G.E., DeLong, M.R., Strick, P.L., 1986. Parallel organization of functionallysegregated circuits linking basal ganglia and cortex. Annual Review of Neurosci-ences 9, 357–381.
American Psychiatric Association, 1994. Diagnostic and Statistical Manual of MentalDisorders, 4th ed. American Psychiatric Association, Washington DC, USA.
Astrup, J., Siesjo, B.K., Symon, L., 1981. Thresholds in cerebral ischemia: the ischemicpenumbra. Stroke 12, 723–725.
Baron, J., 1999. Mapping the ischaemic penumbra with PET: implications for acutestroke treatment. Cerebrovascular Disease 9, 193–201.
Benton, A.L., Hamsher, K., 1978. Multilingual Aphasia Examination manual. University ofIowa, Iowa City.
Benton, A.L., Hamsher, K.deS., Varney, N.R., Spreen, O., 1983. Contributions to neuro-psychological assessment. Oxford University Press, New York.
Berman, S.A., Hayman, L.A., Hinck, V.C., 1980. Correlation of CT cerebral vascu-lar territories with function: 1. Anterior cerebral artery. American Journal ofRoentgentology 135, 253–257.
Berman, S.A., Hayman, L.A., Hinck, V.C., 1981. Correlation of CT cerebral vascular terri-tories with function: 2. Posterior cerebral artery. American Journal of Roentgentol-ogy 137, 13–19.
Berman, S.A., Hayman, L.A., Hinck, V.C., 1984. Correlation of CT cerebral vascularterritories with function: 3. Middle cerebral artery. American Journal of Roentgen-tology 142, 1035–1040.
Bhatia, K.P., Marsden, C.D., 1994. The behavioural and motor consequences of focallesions of the basal ganglia in man. Brain 117 (part 4), 859–876.
Brodaty, H., Sachdev, P., Withall, A., Koschera, A., Valenzuela, M., Lorentz, L., 2005.Frequency and clinical, neuropsychological and neuroimaging correlates of apathyfollowing stroke—the Sydney Stroke Study. Psychological Medicine 35, 1707–1716.
Clark, D., Boutros, N., Mendez, M., 2005. The brain and behaviour. Cambridge UniversityPress, Cambridge, UK.
Cummings, J.L., Mega, M., Gray, K., Rosenberg-Thompson, S., Carusi, D.A., Gornbein, J.,1994. The Neuropsychiatric Inventory. Comprehensive assessment of psycho-pathology in dementia. Neurology 44, 2308–2314.
Duvernoy, H.M., 1999. The Human Brain: Surface, three-dimensional sectional anatomywith MRI, and blood supply, 2nd ed. Springer, Vienna-New York.
Evans, A.C., Collins, D.L., Mills, Brown, E.D., Kelly, R.L., Peters, T.M., 1993. 3D statisticalneuroanatomical models from 305 MRI volumes. Proceedings of IEEE-NuclearScience Symposium and Medical Imaging Conference, pp. 1813–1817.
First, M.B., Spitzer, R.L., Gibbon, M., Williams, J.B.W., 1997. User's guide for theStructured Clinical Interview for DSM-IV Axis 1 Disorders-Clinician Version (SCID-CV). American Psychiatric Press, Washington, DC.
Folstein, M.F., Folstein, S.E., McHugh, P.R., 1975. “Mini-mental state” A practical methodfor grading the cognitive state of patients for the clinician. Journal of PsychiatricResearch 12, 189–198.
Goldberg, D.P., Hillier, V.F., 1979. A scaled version of the General Health Questionnaire.Psychological Medicine 9, 139–145.
Goodglass, H., Kaplan, E., 1983. The assessment of aphasia and related disorders. Lea &Feiberger, Philadelphia, USA.
Haines, D.E., 2000. Caudate nucleus structures. In: Kelly, P.J. (Ed.), Neuroanatomy—anatlas of structures, sections and systems. Lippincott, Williams and Wilkins,Baltimore, USA, pp. 64–67.
Hamilton, M., 1960. A rating scale for depression. Journal of Neurology Neurosurgeryand Psychiatry 23, 56–62.
75J.C.L. Looi et al. / Psychiatry Research: Neuroimaging 174 (2009) 67–75
Hannestad, J., Taylor, W.D., McQuoid, D.R., Payne, M.E., Krishnan, K.R.R., Steffens, D.C.,MacFall, J.R., 2006. White matter lesion volumes and caudate volumes in late lifedepression. International Journal of Geriatric Psychiatry 21, 1193–1198.
Hanston, L., De Weerdt, W., De Keyser, J., et al., 1994. The European Stroke Scale. Stroke25, 2215–2219.
Jorm, A.F., Jacomb, P., 1989. The informant questionnaire on cognitive decline in theelderly (IQCODE): sociodemographics, reliability, validity and some norms.Psychological Medicine 19, 1015–1022.
Katz, S., Ford, A.B., Moskowitz, R.W., Jackson, B.A., Jaffe, M.W., 1963. Studies of the aged:index of ADL, a standardized measure of biological and psychological function.JAMA 185, 914–919.
Kertesz, A. (Ed.), 1983. Western Aphasia Battery. The Psychological Corporation, SanAntonio, Texas.
Lawton, M.P., Brody, E.M., 1969. Assessment of older people: self-maintaining andinstrumental activities of daily living. Gerontologist 9, 179–186.
Leh, S.E., Ptito, A., Chakravaty, M.M., Strafella, A.P., 2007. Fronto-striatal connections inthe human brain: a probabilistic diffusion tractography study. Neuroscience Letters419, 113–118.
Lehericy, S., Ducros, M., Van de Moortele, P.-F., Francois, C., Thivard, L., Poupon, C.,Swindale, N., Ugurbil, K., Kim, D.-S., 2004. Diffusion tensor fiber tracking showsdistinct corticostriatal circuits in humans. Annals of Neurology 55, 522–529.
Looi, J.C.L., Sachdev, P.S., 1999. The differentiation of vascular dementia fromAlzheimer's disease on neuropsychological tests. Neurology 53, 670–678.
Looi, J.C.L., Sachdev, P.S., 2000. Vascular dementia as a frontal subcortical systemdysfunction. Psychological Medicine 30, 997–1003.
Looi, J.C.L., Lindberg, O., Liberg, B., Tatham, V., Kumar, R., Maller, J., Millard, E., Sachdev, P.S.,Hogberg, G., Pagani,M., Botes, L., Engman, E.-L., Zhang, Y., Svensson, L.,Wahlund, L.-O.,2008a. Volumetrics of the caudate nucleus: reliability and validity of a new manualtracing protocol. Psychiatry Research Neuroimaging 163, 279–288.
Looi, J.C.L., Lindberg, O., Zandbelt, B.B., Östberg, P., Andersen, C., Botes, L., Svensson, L.,Wahlund, L.-O., 2008b. Caudate nucleus volumes in frontotemporal lobardegeneration: differential atrophy in subtypes. American Journal of Neuroradiology29, 1537–1543.
Looi, J.C.L., Maller, J., Lindberg, O., Liberg, B., Hogberg, G., Pagani, M., Botes, L., Engman,E.-L., Zhang, Y., Svensson, L., Wahlund, L.-O., 2009. Caudate volumes in publictransportation workers exposed to trauma in the Stockholm train system.Psychiatry Research: Neuroimaging 171, 138–143.
Mack, W.J., Freed, D.M., Williams, B.W., Henderson, V.W., 1992. Boston Naming Test.Shortened version for use in Alzheimer's disease. Journal of Gerontology 47, 164–168.
Middleton, F.A., Strick, P.L., 1994. Anatomical evidence for cerebellar and basal gangliainvolvement in higher cognitive function. Science 266, 458–461.
Morris, J.C., Heyman, A., Mohs, R.C., et al., 1989. The Consortium to establish a registryfor Alzheimer’s disease (CERAD). Part 1. Clinical and neuropsychological assess-ment of Alzheimer's disease. Neurology 39, 1159–1165.
Nelson, H., Willison, J., 1982. National Adult Reading Test (NART): test manual, 2nd ed.NFER Nelson, Windsor, UK.
Nishio, Y., Nakano, Y., Matsumoto, K., Hashimoto, M., Kazui, H., Hirono, N., Ishii, K., Mori,E., 2003. Striatal infarcts mimicking frontotemporal dementia: a case report.European Journal of Neurology 10, 457–460.
Nys, G.M.S., van Zandvoort, M.J.E., van derWorp, H.B., Kapelle, K.J., de Haan, E.H.F., 2006.Neuropsychological and neuroanatomical correlates of perseverative responses insubacute stroke. Brain 129, 2148–2157.
Parent, A., Hazrati, L.N., 1995. Functional anatomy of the basal ganglia. I. The cortico-basal gangliotalamo-cortical loop. Brain Research Reviews 20, 91–127.
Rauch, S.L., Kim, H., Makris, N., Cosgrove, G.R., Cassem, E.H., Savage, C.R., Price, B.H.,Nierenberg, A.A., Shera, D., Baer, L., Buchbinder, B., Caviness, V.S., Jenike, M.L., 2000.Volume reduction in the caudate nucleus following stereotactic placement oflesions in the anterior cingulate cortex in humans: a morphometric magneticresonance imaging study. Journal of Neurosurgery 93, 1019–1025.
Reitan, R.M., Wolfson, D., 1985. The Halstead–Reitan Neuropsychological Test Battery.Neuropsychology Press, Tucson.
Ring, H.A., Serra-Mestres, J., 2002. Neuropsychiatry of the basal ganglia. Journal ofNeurology, Neurosurgery and Psychiatry 72, 12–21.
Sachdev, P.S., Brodaty, H., Looi, J.C., 1999. Vascular dementia: diagnosis, managementand possible prevention. Medical Journal of Australia 170, 81–85.
Sachdev, P.S., Brodaty, H., Valenzuela, M.J., Lorentz, L., Looi, J.C.L., Wen, W., Zagami, A.,2004. The neuropsychological profile of vascular cognitive impairment in strokeand TIA patients. Neurology 62, 912–919.
Seger, C.A., Cincotta, C.M., 2005. The roles of the caudate nucleus in human classificationlearning. Journal of Neuroscience 25, 2941–2951.
Sheikh, J.I., Yesavage, J., 1986. Geriatric Depression Scales (GDS): recent evidence anddevelopment of a short version. Clinical Gerontology 5, 165–173.
Shrout, P.E., Fleiss, J.L., 1979. Intraclass correlations: uses in assessing rater reliability.Psychological Bulletin 86, 420–428.
Smith, A., 1991. Symbol Digit Modalities Test. Western Psychological Services, Los Angeles.Strub, R.L., Black, F.W., 1985. Mental status examination in neurology, 2nd ed. Davis,
Philadelphia.Tatu, L., Moulin, T., Bogousslavsky, J., Duvernoy, H., 1998. Arterial territories of the
human brain; cerebral hemispheres. Neurology 50, 1699–1708.Tekin, S., Cummings, J.L., 2002. Frontal-subcortical neuronal circuits and clinical
neuropsychiatry: an update. Journal of Psychosomatic Research 53, 647–654.Wechsler, D., 1981. Wechsler Adult Intelligence Scale-Revised. The Psychological
Corporation, New York.Wechsler, D., 1987. Wechsler Memory Scale-Revised. The Psychological Corporation,
San Antonio.Weigl, E., 1941. On the psychology of so-called abstraction. Journal of Normal Social
Psychology 36, 3–33.Wen,W., Sachdev, P., 2004. The extent and distribution of whitematter hyperintensities
in stroke patients—the Sydney stroke study. Stroke 35, 2183–2189.
Related Documents