DNA Electrochemistry with Tethered Methylene Blue Catrina G. Pheeney and Jacqueline K. Barton Division of Chemistry and Chemical Engineering, California Institute of Technology, Pasadena, California 91125, United States Abstract Methylene blue (MB′), covalently attached to DNA through a flexible C 12 alkyl linker, provides a sensitive redox reporter in DNA electrochemistry measurements. Tethered, intercalated MB′ is reduced through DNA-mediated charge transport; the incorporation of a single base mismatch at position 3, 10, or 14 of a 17-mer causes an attenuation of the signal to 62 ± 3% of the well- matched DNA, irrespective of position in the duplex. The redox signal intensity for MB′–DNA is found to be least 3-fold larger than that of Nile blue (NB)–DNA, indicating that MB′ is even more strongly coupled to the π-stack. The signal attenuation due to an intervening mismatch does, however, depend on DNA film density and the backfilling agent used to passivate the surface. These results highlight two mechanisms for reduction of MB′ on the DNA-modified electrode: reduction mediated by the DNA base pair stack and direct surface reduction of MB′ at the electrode. These two mechanisms are distinguished by their rates of electron transfer that differ by 20-fold. The extent of direct reduction at the surface can be controlled by assembly and buffer conditions. INTRODUCTION Since the discovery that DNA can efficiently serve to conduct electrical current, its properties have been exploited across numerous platforms. 1–14 DNA-mediated charge transport (CT) is exquisitely sensitive to perturbations in the intervening base stack, including single base mismatches, lesions, or structural changes caused by proteins. 14–16 Electrochemistry experiments on DNA-modified electrodes have been particularly valuable in probing ground state DNA CT and in the development of new DNA-based sensors. 11–19 To study and exploit the sensitivity of DNA CT, it is essential that the redox moiety makes an electronic interaction with the base stack of the DNA. 17,20 Over the past decade, various reporters have been used for DNA electrochemistry; some redox reporters have been well coupled and others not at all. 14–38 Early applications of © 2012 American Chemical Society Correspondence to: Jacqueline K. Barton. The authors declare no competing financial interest. NIH Public Access Author Manuscript Langmuir. Author manuscript; available in PMC 2013 May 01. Published in final edited form as: Langmuir. 2012 May 1; 28(17): 7063–7070. doi:10.1021/la300566x. NIH-PA Author Manuscript NIH-PA Author Manuscript NIH-PA Author Manuscript

Welcome message from author
This document is posted to help you gain knowledge. Please leave a comment to let me know what you think about it! Share it to your friends and learn new things together.
Transcript

DNA Electrochemistry with Tethered Methylene Blue
Catrina G. Pheeney and Jacqueline K. BartonDivision of Chemistry and Chemical Engineering, California Institute of Technology, Pasadena,California 91125, United States
AbstractMethylene blue (MB′), covalently attached to DNA through a flexible C12 alkyl linker, provides asensitive redox reporter in DNA electrochemistry measurements. Tethered, intercalated MB′ isreduced through DNA-mediated charge transport; the incorporation of a single base mismatch atposition 3, 10, or 14 of a 17-mer causes an attenuation of the signal to 62 ± 3% of the well-matched DNA, irrespective of position in the duplex. The redox signal intensity for MB′–DNA isfound to be least 3-fold larger than that of Nile blue (NB)–DNA, indicating that MB′ is even morestrongly coupled to the π-stack. The signal attenuation due to an intervening mismatch does,however, depend on DNA film density and the backfilling agent used to passivate the surface.These results highlight two mechanisms for reduction of MB′ on the DNA-modified electrode:reduction mediated by the DNA base pair stack and direct surface reduction of MB′ at theelectrode. These two mechanisms are distinguished by their rates of electron transfer that differ by20-fold. The extent of direct reduction at the surface can be controlled by assembly and bufferconditions.
INTRODUCTIONSince the discovery that DNA can efficiently serve to conduct electrical current, itsproperties have been exploited across numerous platforms.1–14 DNA-mediated chargetransport (CT) is exquisitely sensitive to perturbations in the intervening base stack,including single base mismatches, lesions, or structural changes caused by proteins.14–16
Electrochemistry experiments on DNA-modified electrodes have been particularly valuablein probing ground state DNA CT and in the development of new DNA-based sensors.11–19
To study and exploit the sensitivity of DNA CT, it is essential that the redox moiety makesan electronic interaction with the base stack of the DNA.17,20
Over the past decade, various reporters have been used for DNA electrochemistry; someredox reporters have been well coupled and others not at all.14–38 Early applications of
© 2012 American Chemical Society
Correspondence to: Jacqueline K. Barton.
The authors declare no competing financial interest.
NIH Public AccessAuthor ManuscriptLangmuir. Author manuscript; available in PMC 2013 May 01.
Published in final edited form as:Langmuir. 2012 May 1; 28(17): 7063–7070. doi:10.1021/la300566x.
NIH
-PA Author Manuscript
NIH
-PA Author Manuscript
NIH
-PA Author Manuscript

DNA-modified electrodes primarily depended on the use of noncovalent redox reporters.Noncovalent methylene blue (MB) was widely used as a reporter for DNA CT as itintercalates into the base stack.11,13 Studies with noncovalent MB demonstrated theexquisite sensitivity of the π-stack to subtle perturbations, and MB had the additionaladvantage that it undergoes electrocatalytic signal amplification.38
However, noncovalent reporters incurred a number of constraints, including the inability tocontrol probe placement and the stringent requirement for high quality DNA films. As such,covalent tethering has been explored to address these issues. Covalent tethering of thereporter results in its restricted mobility; therefore, it must be ensured that coupling betweenthe reporter and base stack is still feasible. The degree of coupling varies based on themechanism of interaction between the reporter and the base stack.17 Coupling to the basestack has been shown to be possible through various mechanisms including intercalation,18
end-capping,20 and direct conjugation to a nucleic acid base.17 The degree to which thereporter is coupled to the base stack determines the overall efficiency of DNA CT.
Daunomycin, when covalently tethered to the DNA through a short alkyl linkage, has beenshown to yield exceptionally strong electrochemical signals.14,16,21 This evidence of strongcoupling agrees with the crystal structure that shows daunomycin is tightly intercalated intothe base stack.39,40 Despite the exceptional coupling of daunomycin, the field of DNA-mediated CT sensors has evolved to use other reporters as DNA modified with daunomycinis difficult to prepare, is unstable, and has sequence constraints.
More recently, Nile blue (NB) has been used as an electrochemical reporter of DNACT.12,17 The preparation of NB–DNA does not possess the synthetic limitations ofdaunomycin, and it is well coupled to the base stack through direct conjugation of NB with amodified uracil.12 In the present study, we built upon this work by developing a system tocovalently tether MB, as it has previously been shown to strongly intercalate into the basestack.
MB′–DNA was tethered through a flexible C12 alkyl linkage to a modified uracil (Figure 1).This linkage further improves the coupling of the reporter by providing the conformationalfreedom for MB′ to interact with the base stack through intercalation. However, with theenhanced flexibility of the reporter, its ability to be reduced directly at the surface of theelectrode must be taken into account.
Various probes have been covalently tethered to the DNA through flexible alkyl linkagesand shown to be reduced directly at the electrode surface, including both MB andferrocene.20,22–37 This has led to a new class of DNA-modified biosensors based uponbinding of either oligonucleotides22–32 or DNA-binding proteins33 that causeconformational changes that attenuate the observed signal by physically diminishing thesurface accessibility of the reporter. These biosensors are based on the surface reduction ofthe reporter, and thus the reporter does not couple with the base stack. Ferrocene has beenshown to be a common reporter for this platform given its poor coupling to the base stackand yielding efficient reduction at the electrode surface.37 More recently, MB-modifiedDNA has been frequently used.22–33
In this work, the mechanism of reduction for MB′ covalently tethered to DNA through aflexible C12 alkyl linkage to a modified uracil is investigated (Figure 1). MB′–DNA,covalently tethered through this flexible linkage, couples to the base stack throughintercalation. This is compared to the previously established reporter, NB–DNA, which iscovalently tethered through a short rigid linkage and couples to the base stack through directconjugation. MB′–DNA is shown not only to be reduced via DNA CT but is also capable of
Pheeney and Barton Page 2
Langmuir. Author manuscript; available in PMC 2013 May 01.
NIH
-PA Author Manuscript
NIH
-PA Author Manuscript
NIH
-PA Author Manuscript

being reduced directly at the surface. We describe the conditions under which DNA CT isthe primary mechanism for MB′ reduction.
EXPERIMENTAL SECTIONSynthesis of Modified NHS Ester Activated Methylene Blue′ (Scheme 1)
All materials were used as purchased from Sigma-Aldrich.
2-Amino-5-(dimethylamino)phenylthiosulfonic Acid (3) Preparation—3 wasprepared according to the procedure described by Wanger41 by separately dissolvingaluminum sulfate octadecahydrate (43.6 mg, 65 mmol), sodium thiosulfate (22.0 g, 140mmol), and zinc chloride (8.8 g, 63 mmol) in 100, 80, and 12 mL of water, respectively, andadded to N,N-dimethylphenylenediamine (1) (10 g, 73 mmol) in a 500 mL round-bottomflask. The reaction mixture was then cooled to 0 °C while continuously stirring. Potassiumdichromate (5.0 g, 17 mmol) was dissolved in 30 mL of water and added dropwise to thereaction mixture over 15 min. The reaction was kept at 0 °C for 2 h and then slowly allowedto warm to room temperature. The precipitate was isolated by vacuum distillation andwashed with water, acetone, and ether. The purple solid (7.4 g, 30 mmol, 41% yield) wasconfirmed as the desired product by 1H NMR (DMSO-d6) and was used in subsequentreactions without further purification.
N-Methyl-N-(carboxypropyl)aniline (4) Preparation—4 was prepared according tothe procedure described by Whitten.42 N-Methylaniline (2) (15.17 mL, 140 mmol) wasrefluxed with ethyl-4-bromobutyrate (20.0 mL, 140 mmol) for 16 h in a 100 mL round-bottom flask. The reaction mixture was then cooled to room temperature, and water (15 mL)was added. The crude reaction mixture was then made basic by the dropwise addition ofsaturated sodium hydroxide and extracted with ether (3 × 50 mL). The extract was washedwith water and dried over MgSO4, and the ether was removed under reduced pressure. PureN-methyl-N-ethyl-4-butanoate aniline (16.3 g, 74 mmol, 53% yield) was isolated, as a clearliquid, by vacuum filtration at 110 °C at 0.2 mmHg. The product was confirmed by 1HNMR and 13C NMR (CDCl3) and an observed mass of 221.3 g/mol (calculated mass of221.3 g/mol) in ESI-MS in acetonitrile: water:acetic acid (1:1:0.1%).
The ester product (9.4 g, 43 mmol) was subsequently hydrolyzed in 5% KOH (150 mL) byrefluxing for 2 h to form the desired carboxylic acid. The reaction was cooled to roomtemperature and washed with ether (2 × 70 mL). Concentrated hydrochloric acid was addeddropwise to the aqueous layer to adjust the pH to 5.5, and then the product was extractedwith ether (3 × 100 mL) and dried over MgSO4, and the solvent was removed under reducedpressure. The desired product, 4 (5.1 g, 26 mmol, 62% yield), was confirmed by 1H NMRand 13C NMR (CDCl3) and an observed mass of 193.2 g/mol (calculated mass of 193.2 g/mol) with ESI-MS in acetonitrile:water:-acetic acid (1:1:0.1%).
N-(Carboxypropyl)methlyene Blue (MB′) Preparation—MB′ was prepared by anadapted procedure from Wagner.41 3 (2.4 g, 9.7 mmol) and 4 (1.87 g, 9.7 mmol) werecombined and dissolved in a methanol:water mixture (200 mL:80 mL). The reaction washeated to just below reflux (60 °C), and 50% w/w silver carbonate on Celite (10 g) wasslowly added. The reaction was then refluxed for 2 h. The reaction was left to cool to roomtemperature and was vacuum filtered, and the solvent was removed under reduced pressure.The desired product MB′ (0.9 g, 2.5 mmol, 26% yield) was isolated by drychromatography43 as conventional chromatography techniques were unsuccessful.Impurities were eluted using 20 mL portions of chloroform:methanol:acetic acid(100:15:1.5), and the blue band (MB′) was eluted using portions of
Pheeney and Barton Page 3
Langmuir. Author manuscript; available in PMC 2013 May 01.
NIH
-PA Author Manuscript
NIH
-PA Author Manuscript
NIH
-PA Author Manuscript

chloroform:methanol:acetic acid (100:30:1.5). The final product was confirmed by anobserved mass of 356.3 g/mol (calculated mass of 357.13 g/mol) with ESI-MS inacetonitrile:water:acetic acid (1:1:0.1%).
MB′–NHS Ester Preparation—MB′ (8 mg, 0.022 mmol) was dissolved in DMF (1 mL)and combined with N,N′-dicyclohexylcarbodiimide (9.3 mg, 0.045 mmol) and N-hydroxysuccinimide (5.2 mg, 0.045 mmol). The reaction proceeded at room temperature for24 h. The solvent was removed under reduced pressure, and the material was resuspended inDMSO. Successful ester activation was confirmed by a mass of 454.5 g/mol (calculatedmass of 454.54 g/mol) in ESI-MS in acetonitrile:water:acetic acid (1:1:0.1%). Activatedester was not found to be stable for extended periods of time; therefore, it was freshlyprepared directly before tethering to amino-modified DNA.
Synthesis of Modified OligonucleotidesThe synthesis and purification of NB and thiol-modified oligonucleotides were carried outfollowing the previously reported protocol.17 Thiol-modified and NHS ester uracil analoguephosphoramidites were purchased from Glen Research.
MB′-modified oligonucleotides were synthesized similarly to NB–DNA with thesubstitution of an amino-C6-uracil analogue purchased from Glen Research. Amino-modified DNA was purified using standard protocols and then coupled in solution to MB′–NHS ester.
Amino-modified DNA was suspended in 200 µL of a 0.1 M NaHCO3 solution in order tobuffer the reaction to a pH of 8.3–8.4. MB′–NHS ester was suspended in DMSO (100 µL)and added to the DNA solution in roughly a 10-fold excess of MB′–NHS ester to amino-modified DNA. The reaction was left to proceed for 12–24 h. A final round of purificationwas performed by high-performance liquid chromatography (HPLC) using a 50 mMammonium acetate buffer/acetonitrile gradient with a PLRP-S Column (Agilent). The MB′–DNA mass was confirmed by matrix-assisted laser desorption/ionization-time-of-flight massspectrometry. A mass of 5695 g/mol was found for well-matched MB′–DNA, agreeing withwith the calculated mass of 5695 g/mol (see Figure 2).
DNA stock solutions were prepared in low salt buffer (5.0 mM phosphate, 50 mM NaCl, pH7) and quantified as previously reported. The extinction coefficient for single-stranded MB′-DNA at 260 nm was corrected for the absorbance of MB′. This correction was performed byadding the extinction coefficient of MB′ at 260 nm (10 300 M−1 cm−1) to the calculatedextinction coefficient for single-stranded DNA. All DNA solutions were thoroughlydeoxygenated with argon prior to annealing. Equimolar amounts of thiol-modified andprobe-modified oligonucleotides were combined and annealed by heating to 90 °C andcooling to ambient temperature over 90 min to form duplexes.
Preparation of DNA Monolayers and Electrochemical MeasurementsMultiplex chips, previously reported,17 were employed for the electrochemical experiments.Each chip contains 16 gold electrodes (2 mm2 area) which were prepared with up to fourdifferent kinds of DNA. Equimolar amounts of single-stranded thiol-modified and probe-modified DNA were annealed prior to the electrode assembly. HPLC analysis of duplexDNA stocks were performed prior to electrode assembly to ensure that there were no single-stranded impurities (data not shown). The duplex DNA (25 µL of 25 µM) was thenassembled on the electrode surface overnight (20–24 h) in a humid environment to allow formonolayer formation with or without 100 mM MgCl2. Once DNA films were assembled andthoroughly washed with low salt buffer, the electrodes were backfilled with either 1 mM 6-
Pheeney and Barton Page 4
Langmuir. Author manuscript; available in PMC 2013 May 01.
NIH
-PA Author Manuscript
NIH
-PA Author Manuscript
NIH
-PA Author Manuscript

mercaptohexanol (MCH) or 6-mercaptohexanoic acid (MHA) for 45 min in low salt bufferwith 5% glycerol. The electrodes were again washed to ensure removal of trace alkanethiols.The electrodes were scanned in a common running buffer of either low salt buffer (5.0 mMphosphate, 50 mM NaCl, and pH 7) or spermidine buffer (5.0 mM phosphate, 50 mM NaCl,4 mM MgCl2, 4 mM spermidine, 50 µM EDTA, 10% glycerol, and pH 7). An analogousbuffer to spermidine buffer was prepared that lacked spermidine, and minimal changes wereobserved in the electrochemistry (data not shown). Thus, electrochemical differences arebest attributed to the effect of adding spermidine. Electrochemical measurements wereperformed with a CHI620D electrochemical analyzer and a 16-channel multiplexer from CHInstruments. A three-electrode setup was used, with a common Ag/AgCl reference and a Ptwire auxiliary electrodes placed in the central buffer solution.
Cyclic voltammetry (CV) data were collected at 100 mV/s, with the exception of the scanrate dependence experiments where the scan rate is indicated. In order to minimize errorsassociated with thiol oxidation and surface quality, all CVs overlaid and compared wereacquired on the same multiplexed chip with the thiol-modified strand being equivalent in allduplexes.
The film density (Γ) of MB′–DNA and NB–DNA was calculated by the area under thereductive peaks of CVs at 100 mV/s (eq 1).
(1)
In eq 1, Q is the area of the reductive signal, n is the number of electrons per redox event (n= 2 for both NB and MB′), F is Faraday’s constant, and A is the area of the gold electrode.
RESULTSElectrochemistry of MB′–DNA with Intervening Mismatches
In this investigation MB′ has been confined to the distal end of the duplex through a flexibleC12-linker appended off the terminally modified uracil (Figure 1). As seen in Figure 2, theresulting CVs from scanning the electrodes in spermidine buffer exhibit strong reductive andoxidative peaks with a midpoint potential of −290 mV versus Ag/AgCl. This is the samereduction potential as freely diffusing MB indicating that covalently tethering MB′ to theDNA through a flexible alkyl chain does not alter its electronic properties.44 The areas of thereductive and oxidative signals were 7.8 ± 0.4 and 7.5 ± 0.3 nC, respectively. Surface-boundspecies reduced by DNA CT have previously been shown to have cathodic/anodic signalswith ratios of nearly unity, which we have ascribed to the fact that the binding affinity ofMB for duplex DNA is lowered upon reduction.19,38
In order to demonstrate that the reduction of MB′–DNA occurs via DNA CT, the signalattenuation from the introduction of a single mismatched base pair (CA) interveningbetween the surface and the probe was compared to that of well matched MB′–DNA. Byperforming these experiments on multiplexed chips, any variation that can be observed frombackfilling the electrodes is removed. Under these conditions, any signal differentialobtained between well-matched and mismatched DNA on the same multiplexed chip can beattributed to deficiencies in the CT properties of the mismatched DNA.19 Introduction of asignal base mismatch has been well documented to cause attenuations in DNA CT in bothphotophysical studies and DNA electrochemistry studies.1–16
Thiol-modified DNA was annealed to the complementary well-matched (WM) DNAsequence and three different mismatched DNA sequences, where the position of the
Pheeney and Barton Page 5
Langmuir. Author manuscript; available in PMC 2013 May 01.
NIH
-PA Author Manuscript
NIH
-PA Author Manuscript
NIH
-PA Author Manuscript

mismatch was varied. The mismatches varied from proximal to the electrode (MM3), in themiddle (MM10), and at the distal end (MM14) of the duplex (Figure 2). The four quadrantsof a multiplexed chip were used to simultaneously assemble each type of DNA overnightwithout MgCl2 (Figure 2). In this case the electrodes were passivated by backfilling withMHA and scanned in spermidine buffer. The ratio of the mismatched to well-matchedreduction signal areas was quantified in all cases to determine the percent mismatch signal.The signal area of well-matched MB′–DNA was found to be 7.8 ± 0.4 nC. For the variousmismatches, the percent signal remaining was 65%, 64%, and 59% for a mismatchincorporated at position 3, 10, or 14, respectively. Under these assembly conditions, thepercent signal remaining, due to the incorporation of the CA mismatch, was essentiallyequivalent regardless of the position in the duplex. The suppression of the MB′ signal froma single CA mismatch validated that MB′ is well coupled to the π-stack and the electronsthat reduce MB′ are traveling through the intervening DNA.
It should be noted that we observed signal attenuation from a CA mismatch at the 14thposition of the 17-mer, indicating that MB′ must intercalate within 3 base pairs of where itis covalently tethered; if MB′ intercalates further away, there would be no observed signalattenuation. This confinement of MB′ is also consistent with what is predicted from modelbuilding. Therefore, when MB′ is tethered to the distal end of the duplex, any perturbationto the base stack occurring below the top 7.2 Å will be reported.
Comparison with NB–DNAMB′–DNA was then compared with the previously described DNA CT reporter, Nile blue(NB). This comparison used electrodes assembled with 100 mM MgCl2, passivated withMCH, and scanned in spermidine buffer. The area of the reductive signal for MB′–DNA issignificantly larger than the signal observed with NB–DNA, 12.5 ± 1.2nC compared to 4.3 ±0.2 nC, respectively (Figure 3).
Additionally, when the same electrodes are scanned in low salt buffer, NB–DNA has anaverage signal area of 0.2 ± 0.1 nC (Figure 3), while the reductive peak area for MB′–DNAremains relatively unchanged at 11.8 ± 0.5 nC. Despite the area of MB′ remainingminimally affected, other peak characteristics were significantly altered. Switching to a lowsalt buffer resulted in a broadening of the peak and an increase in the peak splitting. Thesharper peaks in spermidine buffer indicate that the film is more homogeneous. The peaksplitting between the oxidative and reductive peaks decreases from 140 mV in low saltbuffer to 30 mV in spermidine buffer. These peak changes are largely reversible; there is,however, not a complete restoration of the peak observed in low salt buffer, indicating thatthe spermidine is not fully removed.
Variation in Running Buffer for Optimized Mismatch DiscriminationThe degree of signal attenuation upon introduction of a single mismatched base (MB′–MM10 DNA) was compared in low salt buffer and spermidine buffer. The DNA wasassembled with 100 mM MgCl2 and backfilled with MHA. Well-matched MB′–DNAshows a reductive signal area of 11.1 ± 0.2 nC while mismatched MB′–DNA shows a signalarea of 4.0 ± 0.4 nC in spermidine buffer. The percent signal remaining after theintroduction of a CA mismatch is 36 ± 6% (Figure 4). When the same experiment isperformed with NB–DNA in spermidine buffer, a 50 ± 10% decrease is observed (data notshown). This result agrees with the previously reported values with NB–DNA in that thepercent signal remaining due to a CA mismatch ranges from 30 to 60%.12,19
When the same MB′–DNA electrodes were then examined in low salt buffer, themismatched reductive signal is significantly broadened and decreased in intensity, yielding
Pheeney and Barton Page 6
Langmuir. Author manuscript; available in PMC 2013 May 01.
NIH
-PA Author Manuscript
NIH
-PA Author Manuscript
NIH
-PA Author Manuscript
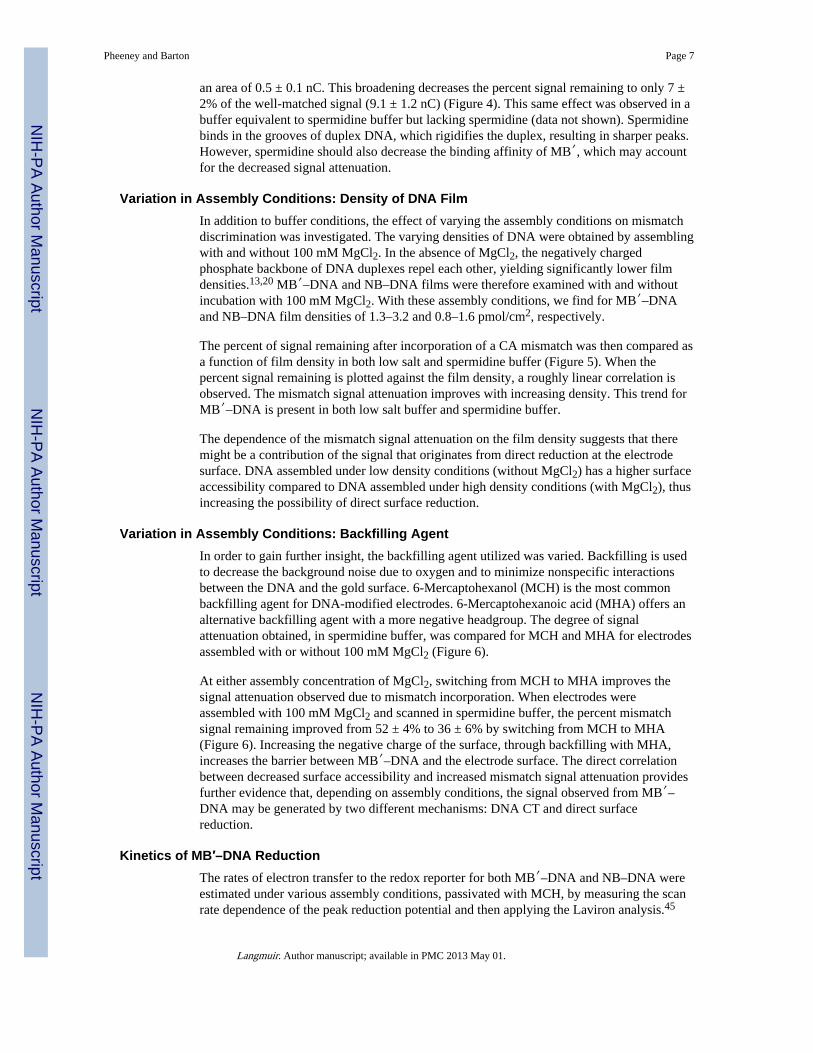
an area of 0.5 ± 0.1 nC. This broadening decreases the percent signal remaining to only 7 ±2% of the well-matched signal (9.1 ± 1.2 nC) (Figure 4). This same effect was observed in abuffer equivalent to spermidine buffer but lacking spermidine (data not shown). Spermidinebinds in the grooves of duplex DNA, which rigidifies the duplex, resulting in sharper peaks.However, spermidine should also decrease the binding affinity of MB′, which may accountfor the decreased signal attenuation.
Variation in Assembly Conditions: Density of DNA FilmIn addition to buffer conditions, the effect of varying the assembly conditions on mismatchdiscrimination was investigated. The varying densities of DNA were obtained by assemblingwith and without 100 mM MgCl2. In the absence of MgCl2, the negatively chargedphosphate backbone of DNA duplexes repel each other, yielding significantly lower filmdensities.13,20 MB′–DNA and NB–DNA films were therefore examined with and withoutincubation with 100 mM MgCl2. With these assembly conditions, we find for MB′–DNAand NB–DNA film densities of 1.3–3.2 and 0.8–1.6 pmol/cm2, respectively.
The percent of signal remaining after incorporation of a CA mismatch was then compared asa function of film density in both low salt and spermidine buffer (Figure 5). When thepercent signal remaining is plotted against the film density, a roughly linear correlation isobserved. The mismatch signal attenuation improves with increasing density. This trend forMB′–DNA is present in both low salt buffer and spermidine buffer.
The dependence of the mismatch signal attenuation on the film density suggests that theremight be a contribution of the signal that originates from direct reduction at the electrodesurface. DNA assembled under low density conditions (without MgCl2) has a higher surfaceaccessibility compared to DNA assembled under high density conditions (with MgCl2), thusincreasing the possibility of direct surface reduction.
Variation in Assembly Conditions: Backfilling AgentIn order to gain further insight, the backfilling agent utilized was varied. Backfilling is usedto decrease the background noise due to oxygen and to minimize nonspecific interactionsbetween the DNA and the gold surface. 6-Mercaptohexanol (MCH) is the most commonbackfilling agent for DNA-modified electrodes. 6-Mercaptohexanoic acid (MHA) offers analternative backfilling agent with a more negative headgroup. The degree of signalattenuation obtained, in spermidine buffer, was compared for MCH and MHA for electrodesassembled with or without 100 mM MgCl2 (Figure 6).
At either assembly concentration of MgCl2, switching from MCH to MHA improves thesignal attenuation observed due to mismatch incorporation. When electrodes wereassembled with 100 mM MgCl2 and scanned in spermidine buffer, the percent mismatchsignal remaining improved from 52 ± 4% to 36 ± 6% by switching from MCH to MHA(Figure 6). Increasing the negative charge of the surface, through backfilling with MHA,increases the barrier between MB′–DNA and the electrode surface. The direct correlationbetween decreased surface accessibility and increased mismatch signal attenuation providesfurther evidence that, depending on assembly conditions, the signal observed from MB′–DNA may be generated by two different mechanisms: DNA CT and direct surfacereduction.
Kinetics of MB′–DNA ReductionThe rates of electron transfer to the redox reporter for both MB′–DNA and NB–DNA wereestimated under various assembly conditions, passivated with MCH, by measuring the scanrate dependence of the peak reduction potential and then applying the Laviron analysis.45
Pheeney and Barton Page 7
Langmuir. Author manuscript; available in PMC 2013 May 01.
NIH
-PA Author Manuscript
NIH
-PA Author Manuscript
NIH
-PA Author Manuscript

The Laviron analysis used to determine the rates of electron transfer has been routinelyemployed for rate determinations in these systems.12,21 Consistently, we find for DNA-mediated electrochemistry that tunneling through the linker is rate-determining and the rateis slower than with direct reduction. The same analysis was applied here to comparereduction of the reporter by DNA CT to direct surface reduction. Electrodes assembled withonly single stranded (ss) MB′–DNA and NB–DNA were used to estimate the rate ofelectron transfer by the direct surface reduction mechanism. In this case, the complementarythiol-modified strand was omitted during assembly, ensuring that there could be no DNA-mediated contribution to the observed signal; ssDNA does not efficiently conduct chargeand has a high affinity for the gold surface. For comparison, the rates of electron transfer forthe DNA-mediated reduction of MB′–DNA and NB–DNA were determined underconditions where the signal attenuation due to an incorporated mismatch was maximal(double-stranded (ds) DNA assembled with 100 mM MgCl2).
It has been previously established that the rate for ssNB–DNA is 10–30-fold faster than therate of electron transfer in dsNB–DNA, assembled with 100 mM MgCl2 and acquired inspermidine buffer.12 The rate for dsDNA is limited by tunneling through the C6-alkanelinkage to the surface.12 This previous result for NB–DNA was reproduced in this study(Table 1). Furthermore, the rate of electron transfer for dsMB′–DNA, with 100 mM MgCl2,is 20-fold slower than ssMB′–DNA in both spermidine and low salt buffers (Table 1). Thisresult confirms that dsMB′–DNA is reduced via DNA CT when assembled with 100 mMMgCl2.
The rates of electron transfer were then examined under conditions where DNA CT is notthe sole mechanism for MB′–DNA reduction, evidenced by reduced signal attenuation froma CA mismatch (dsDNA without MgCl2). At fast scan rates (5 V/s) for dsMB′–DNA, tworeductive peaks are resolved with a 15-fold rate differential in both spermidine and low saltbuffer (Figure 7 and Table 1). These data indicate that rates of electron transfer for these twomodes of reduction correspond with direct surface reduction and DNA-mediated reductionof MB′–DNA. Well-matched and mismatched dsMB′–DNA were compared at 5 V/s, andsignal attenuation due to mismatch incorporation was observed only in the peak with aslower rate of electron transfer, consistent with it being a DNA-mediated process (data notshown). Alternatively, for dsNB–DNA only a single peak is observed in spermidine bufferwith a rate that is 20-fold slower than ssNB–DNA. This observation suggests that whiledsNB–DNA is only capable of being reduced via DNA CT, dsMB′–DNA may be reducedby either a DNA-mediated pathway or direct surface reduction. The ability of MB′–DNA tobe reduced directly at the surface is likely due to the flexibility of the linkage through whichMB′ is covalently tethered (Figure 7).
DISCUSSIONIn this work, MB′ is covalently tethered to DNA with a flexible C12 alkyl linkage to amodified uracil. MB′–DNA produces a reversible redox couple via DNA CT. Incorporationof a single CA mismatch within a 17-mer can attenuate the mismatch signal to 7 ± 2% of thewell-matched signal. The degree to which the mismatch signal is attenuated was found to behighly dependent on assembly conditions. Under conditions where DNA CT is the soleavailable mechanism for MB′ reduction, a 10-fold improvement in the mismatch sensitivityis obtained, when compared to previously utilized nonamplified DNA-mediatedplatforms.12,19 MB′–DNA was found also to be capable of being reduced directly by thesurface of the electrode. The extent to which this mechanism contributes to the observedsignal was found to be directly influenced by assembly conditions.
Pheeney and Barton Page 8
Langmuir. Author manuscript; available in PMC 2013 May 01.
NIH
-PA Author Manuscript
NIH
-PA Author Manuscript
NIH
-PA Author Manuscript

Therefore, MB′–DNA can both report on DNA CT through the intercalation of MB′ intothe base stack and report on the surface accessibility of the reporter through direct surfacereduction of MB′. We can discern which mechanism of MB′ reduction is dominating underany given assembly condition by examining the signal sensitivity to π-stack perturbations orby examining the rate of electron transfer.
The fact that assembly conditions can alter which mechanism is dominant for MB′reduction has relevance in the further development of DNA-based biosensors. Sensors usingdirect surface reduction typically function through the formation of duplex DNA to attenuatethe observed signal by increasing the separation between MB′ and the electrode.22–32 Ourwork shows that upon duplex formation a new pathway for dsMB′–DNA reduction has beenintroduced, DNA CT, which can contribute to the residual observed signal.
Recent work performed to optimize these direct surface reduction-based platforms hasdemonstrated that, upon duplex formation, no signal suppression is observed at slow scanrates (100 mV/s), and the duplex signal yielded a rate of electron transfer slower than that ofthe nonduplex DNA structure.23 In order to optimize these devices, the scan rates wereincreased to minimize the contributions from the dsMB′–DNA.23 The trends observed inthis work are consistent with the work presented here and demonstrate that the DNA-mediated reduction of duplex MB′–DNA can significantly contribute to the observed signal.
It is clear that both direct reduction and DNA-mediated reduction need to be considered asimportant mechanisms in DNA-modified electrodes and that MB′–DNA is a viable reporterfor both systems. Furthering our understanding of the underlying mechanism for thereduction of dsMB′–DNA is essential for exploiting both DNA CT and direct surfacereduction based biosensors to their full extent. Only when both mechanisms are consideredcan the highest overall sensitivity be achieved.
AcknowledgmentsThis research was supported by the National Institute of Health (GM61077). The authors thank N. Muren fordiscussions and her contributions in fabricating the multiplexed chips. This work was completed in part in theCaltech Micro Nano Fabrication Laboratory.
REFERENCES1. Murphy CJ, Arkin MR, Jenkins Y, Ghatlia ND, Bossmann SH, Turro NJ, Barton JK. Long Range
Photoinduced Electron Transfer through a DNA Helix. Science. 1993; 262:1025–1029. [PubMed:7802858]
2. Holmlin ER, Dandliker PJ, Barton JK. Charge Transfer Through the DNA Base Stack. Angew.Chem., Int. Ed. 1997; 36:2714–2730.
3. Genereux JC, Boal AK, Barton JK. DNA-Mediated Charge Transport in Redox Sensing andSignaling. J. Am. Chem. Soc. 2010; 132:891–905. [PubMed: 20047321]
4. Schuster, GB., editor. Topics in Current Chemistry. Vol. Vol. 237. Berlin: Springer-Verlag; 2004.Long Range Charge Transfer in DNA II; p. 103
5. Wagenknecht, HA., editor. Charge Transfer in DNA: From Mechanism to Application. Weiheim:Wiley-VCH Verlag GmbH & Co KGaA; 2005.
6. Genereux JG, Barton JK. Mechanisms for DNA Charge Transport. Chem. Rev. 2010; 110:1642–1662. [PubMed: 20214403]
7. Hall DB, Holmlin RE, Barton JK. Oxidative DNA Damage through Long Range Electron Transfer.Nature. 1996; 382:731–735. [PubMed: 8751447]
8. Kelley SO, Barton JK. Electron Transfer Between Bases in Double Helical DNA. Science. 1999;283:375–381. [PubMed: 9888851]
Pheeney and Barton Page 9
Langmuir. Author manuscript; available in PMC 2013 May 01.
NIH
-PA Author Manuscript
NIH
-PA Author Manuscript
NIH
-PA Author Manuscript

9. Delaney S, Barton JK. Long-Range DNA Charge Transport. J. Org. Chem. 2003; 68:6475–6483.[PubMed: 12919006]
10. Kelley SO, Holmlin RE, Stemp EDA, Barton JK. Photoinduced Electron Transfer in Ethidium-Modified DNA Duplexes: Dependence on Distance and Base Stacking. J. Am. Chem. Soc. 1997;119:9861–9870.
11. Gorodetsky A, Buzzeo MC, Barton JK. DNA-mediated Electrochemistry. Bioconjugate Chem.2008; 19:2285–2296.
12. Slinker J, Muren N, Renfrew S, Barton JK. DNA charge transport over 34 nm. Nat. Chem. 2011;3:228–233. [PubMed: 21336329]
13. Kelley SO, Jackson NM, Hill MG, Barton JK. Long Range Electron Transfer Through DNA Films.Angew. Chem., Int. Ed. 1999; 38:941.
14. Boon EM, Salas JE, Barton JK. An Electrical Probe of Protein-DNA Interactions on DNA-Modified Surfaces. Nat. Biotechnol. 2002; 20:282–286. [PubMed: 11875430]
15. Kelley SO, Boon EM, Barton JK, Jackson NM, Hill MG. Single-Base Mismatch Detection Basedon Charge Transduction Through DNA. Nucleic Acids Res. 1999; 27:4830–4837. [PubMed:10572185]
16. Boon EM, Ceres DM, Drummond TG, Hill MG, Barton JK. Mutation Detection byElectrocatalysis at DNA-Modified Electrodes. Nat. Biotechnol. 2000; 18:1096–1100. [PubMed:11017050]
17. Gorodetsky A, Green O, Yavin E, Barton JK. Coupling into the Base Pair Stack is Necessary forDNA-mediated Electrochemistry. Bioconjugate Chem. 2007; 18:1434–1441.
18. Kelley SO, Barton JK, Jackson N, Hill MG. Electrochemistry of Methylene Blue bound to a DNA-Modified Electrode. Bioconjugate Chem. 1997; 8:31–37.
19. Slinker J, Muren N, Gorodetsky A, Barton JK. Multiplexed DNA-Modified Electrodes. J. Am.Chem. Soc. 2010; 132:2769–2774. [PubMed: 20131780]
20. Boon E, Jackson N, Wightman M, Kelley S, Hill M, Barton JK. Intercalative Stacking: A CriticalFeature of DNA Charge-Transport Electrochemistry. J. Phys. Chem. B. 2003; 107:11805–11812.
21. Drummond TG, Hill MG, Barton JK. Electron Transfer Rates in DNA Films as a Function ofTether Length. J. Am. Chem. Soc. 2004; 126:15010–15011. [PubMed: 15547981]
22. Kang D, Zuo X, Yang R, Xia F, Plaxco K, White R. Comparing the Properties of Electrochemical-Based DNA Sensors Employing Different Redox Tags. Anal. Chem. 2009; 81:9109–9113.[PubMed: 19810694]
23. Yang W, Lai RY. Comparison of the Stem-Loop and Linear Probe-Based Electrochemical DNASensors by Alternating Current Voltammetry and Cyclic Voltammetry. Langmuir. 2011;27:14669–14677. [PubMed: 21981414]
24. Xiang Y, Qian X, Chen Y, Zhang Y, Chai Y, Yuan R. A reagentless and disposable electronicgenosensor: from multiplexed analysis to molecular logic gates. Chem. Commun. 2011; 47:2080–2082.
25. Yang W, Lai RY. Effect of diluent chain length on the performance of the electrochemical DNAsensor at elevated temperatures. Analyst. 2011; 136:134–139. [PubMed: 20927441]
26. Zhao S, Yang W, Lai RY. A folding-based electrochemical aptasensor for detection of vascularendothelial growth factor in human whole blood. Biosens. Bioelectron. 2011; 26:2442–2447.[PubMed: 21081271]
27. Yang W, Lai RY. Integration of two different sensing modes in an electrochemical DNA sensor forapproximation of target mismatch location. Electrochem. Commun. 2011; 13:989–992.
28. Farjami E, Clima L, Gothelf K, Ferapontova EE. “Off-On” Electrochemical Hairpin-DNA-BasedGenosensor for Cancer Diagnostics. Anal. Chem. 2011; 83:1594–1602.
29. Xiao Y, Lai R, Plaxco K. Preparation of electrode-immobilized, redox-modified oligonucleotidesfor electrochemical DNA and aptamer-based sensing. Nat. Protocols. 2007; 2:2875–2880.
30. Xiao Y, Lou X, Uzawa T, Plakos K, Plaxco K, Soh HT. An Electrochemical Sensor for SingleNucleotide Polymorphism Detection in Serum Based on a Triple-Stem DNA Probe. J. Am. Chem.Soc. 2009; 131:15311–15316. [PubMed: 19807078]
Pheeney and Barton Page 10
Langmuir. Author manuscript; available in PMC 2013 May 01.
NIH
-PA Author Manuscript
NIH
-PA Author Manuscript
NIH
-PA Author Manuscript

31. Lubin A, Vander Stoep Hunt B, White R, Plaxco K. Effects of Probe Length, Probe Geometry, andRedox-Tag Placement on the Performance of the Electrochemical E-DNA Sensor. Anal. Chem.2009; 81:2150–2158. [PubMed: 19215066]
32. Cash K, Heeger A, Plaxco K, Xiao Y. Optimization of a Reusable, DNA Pseudoknot-BasedElectrochemical Sensor for Sequence-Specific DNA Detection in Blood Serum. Anal. Chem.2009; 81:656–661. [PubMed: 19093760]
33. Ricci F, Bonham A, Mason A, Reich N, Plaxco K. Reagentless, Electrochemical Approach for theSpecific Detection of Double-and Single-Stranded DNA Binding Proteins. Anal. Chem. 2009;81:1608–1614. [PubMed: 19199570]
34. Zuo W, Song S, Zhang J, Pan D, Wang L, Fan C. A Target-Responsive Electrochemical AptamerSwitch (TREAS) for Reagentless Detection of Nanomolar ATP. J. Am. Chem. Soc. 2007;129:1042–1043. [PubMed: 17263380]
35. Di Giusto DA, Wlassoff WA, Giesebrecht S, Gooding JJ, King GC. Enzymatic Synthesis ofRedox-Labeled RNA and Dual-Potential Detection at DNA-modified Electrodes. Angew. Chem.,Int. Ed. 2004; 43:2809–2812.
36. Di Giusto DA, Wlassoff WA, Giesebrecht S, Gooding JJ, King GC. MultipotentialElectrochemical Detection of Primer Extension Reactions on DNA Self-Assembled Monolayers. J.Am. Chem. Soc. 2004; 126:4120–4121. [PubMed: 15053597]
37. Anne A, Bouchardon A, Moiroux J. 3′-Ferrocene-Labeled Oligonucleotide Chains End-Tetheredto Gold Electrode Surfaces: Novel Model Systems for Exploring Flexibility of Short DNA UsingCyclic Voltammetry. J. Am. Chem. Soc. 2003; 125:1112–1113. [PubMed: 12553781]
38. Boon EM, Barton JK, Bhaghat V, Nerissian M, Wang W, Hill MG. Reduction of Ferricyanide byMethylene Blue at a DNA-Modified Rotating-Disk Electrode. Langmuir. 2003; 19:9255–9259.
39. Leng F, Savkur R, Fokt I, Przewloka T, RPiebe W, Chaires JB. Base Specific and RegioselectiveChemical Cross-Linking of Daunorubicin to DNA. J. Am. Chem. Soc. 1996; 118:4732.
40. Wang AHJ, Gao YG, Liaw YC, Li YK. Formaldehyde crosslinks daunorubicin and DNAefficiently: HPLC and x-ray diffraction studies. Biochemistry. 1991; 30:3812. [PubMed: 2018756]
41. Wagner SJ, Skripchenko A, Robinette D, Foley JW, Cincotta L. Factors Affecting VirusPhotoinactivation by a Series of Phenothiazine Dyes. Photochem. Photobiol. 1998; 67:343–349.[PubMed: 9523534]
42. Chen H, Herkstroeter WG, Perlstein J, Law KY, Whitten DG. Aggregation of a SurfactantSquaraine in Langmuir-Blodgett Films, Solids, and Solution. J. Phys. Chem. 1994; 98:5138–5146.
43. Pedersen DS, Rosenbohm C. Dry Column Vacuum Chromatography. Synthesis. 2001; 16:2431–2434.
44. The reduction potential of NB is shifted positive by 200mV due to the direct conjugation of NB tothe nucleobase.
45. Laviron EJ. General expression of the linear potential sweep voltammagram in the case ofdiffusionless electrochemical systems. J. Electroanal. Chem. 1979; 101:19–28.
Pheeney and Barton Page 11
Langmuir. Author manuscript; available in PMC 2013 May 01.
NIH
-PA Author Manuscript
NIH
-PA Author Manuscript
NIH
-PA Author Manuscript

Figure 1.Left: schematic illustration of MB′–DNA (top) and NB–DNA (bottom) monolayers boundto an electrode. The reporter is appended to the distal base of the duplex. The intended pathfor electrochemical reduction is indicated. Right: the chemical structure of both MB′ andNB covalently tethered to a modified uracil.
Pheeney and Barton Page 12
Langmuir. Author manuscript; available in PMC 2013 May 01.
NIH
-PA Author Manuscript
NIH
-PA Author Manuscript
NIH
-PA Author Manuscript

Figure 2.Electrochemistry of MB′–DNA with a single intervening CA mismatch. Left: cyclicvoltammetry was acquired at 100 mV/s with either a well-matched sequence (blue) or asequence containing a single mismatch (red). All four sequences (middle) of MB′–DNAwere assembled on the same multiplexed chip and assembled without MgCl2, passivatedwith MHA, and scanned in spermidine buffer. Right: the area of the reductive signal wasused to quantify the signals observed, and the errors denoted are determined from thevariation across four different electrodes.
Pheeney and Barton Page 13
Langmuir. Author manuscript; available in PMC 2013 May 01.
NIH
-PA Author Manuscript
NIH
-PA Author Manuscript
NIH
-PA Author Manuscript

Figure 3.Comparison of the signal from NB–DNA (dotted) and MB′–DNA (solid). The electrodeswere assembled with 100 mM MgCl2 and passivated with MCH. CVs were acquired at 100mV/s, and all electrodes were scanned in both a low salt buffer (5.0 mM phosphate, 50 mMNaCl, and pH 7) (gray) and a spermidine buffer (5.0 mM phosphate, 50 mM NaCl, 4 mMMgCl2, 4 mM spermidine, 50 µM EDTA, 10% glycerol, and pH 7) (black). The CVs showsthe overall signal changes in response to the running buffer. The reductive peak areas werequantified to show that the amount of MB′–DNA being reduced is relatively unchangedregardless of the buffer. The errors denoted are determined from the variation across fourdifferent electrodes.
Pheeney and Barton Page 14
Langmuir. Author manuscript; available in PMC 2013 May 01.
NIH
-PA Author Manuscript
NIH
-PA Author Manuscript
NIH
-PA Author Manuscript

Figure 4.Optimization of mismatch discrimination depending on the running buffer. Both WM MB′–DNA (solid) and MM10 MB′–DNA (dotted) modified electrodes were assembled with 100mM MgCl2, passivated with MHA, and scanned in both a low salt buffer (5.0 mMphosphate, 50 mM NaCl, and pH 7) (right) and a spermidine buffer (5.0 mM phosphate, 50mM NaCl, 4 mM MgCl2, 4 mM spermidine, 50 µM EDTA, 10% glycerol, and pH 7) (left).The areas of the reductive peaks were used to quantify the reductive signal size (black) anddetermine the percent signal remaining ([MM]/[WM] × 100) (gray) from the incorporationof a single mismatch. The gray arrows denote the decrease in signal area with the optimalpercent signal attenuation being in low salt buffer. The errors denoted were determined bythe standard deviation from four electrodes averages, for each sequence of DNA, acrossthree chips.
Pheeney and Barton Page 15
Langmuir. Author manuscript; available in PMC 2013 May 01.
NIH
-PA Author Manuscript
NIH
-PA Author Manuscript
NIH
-PA Author Manuscript

Figure 5.Dependence of mismatch signal attenuation on film density for both MB′–DNA (black) andNB–DNA (gray). Percent MB′–DNA signal remaining due to the incorporation of a CAmismatch was determined in both low salt buffer (×) and spermidine buffer (squares).
Pheeney and Barton Page 16
Langmuir. Author manuscript; available in PMC 2013 May 01.
NIH
-PA Author Manuscript
NIH
-PA Author Manuscript
NIH
-PA Author Manuscript

Figure 6.Dependence on assembly conditions of the percent mismatch signal remaining for MB′–DNA. Well-matched signal area (black) and the percent signal remaining (gray) were from12 electrodes averaged across three chips. The backfilling agent (1 mM MCH or MHA) andconcentration of MgCl2 are indicated. Scans were acquired in spermidine buffer.
Pheeney and Barton Page 17
Langmuir. Author manuscript; available in PMC 2013 May 01.
NIH
-PA Author Manuscript
NIH
-PA Author Manuscript
NIH
-PA Author Manuscript

Figure 7.Top: schematic illustration of reporter reduction mechanisms. Bottom: CV at 5 V/s (bottom)for NB–DNA (left) and MB′–DNA (center) assembled without MgCl2 and MB′–DNAassembled with 100 mM MgCl2 (right). Electrodes were backfilled with mercaptohexanoland scanned in spermidine buffer. The red arrows indicate the peaks quantified in order todetermine the rate of the various processes for reporter reduction.
Pheeney and Barton Page 18
Langmuir. Author manuscript; available in PMC 2013 May 01.
NIH
-PA Author Manuscript
NIH
-PA Author Manuscript
NIH
-PA Author Manuscript

Scheme 1.Synthetic Strategy for the Preparation of N-Carboxypropyl Methylene Blue (MB′)
Pheeney and Barton Page 19
Langmuir. Author manuscript; available in PMC 2013 May 01.
NIH
-PA Author Manuscript
NIH
-PA Author Manuscript
NIH
-PA Author Manuscript

NIH
-PA Author Manuscript
NIH
-PA Author Manuscript
NIH
-PA Author Manuscript
Pheeney and Barton Page 20
Tabl
e 1
Ele
ctro
n-T
rans
fer
Rat
e C
onst
ants
of
NB
–DN
A (
k NB
–DN
A)
and
MB′–
DN
A (
k MB′–
DN
A)
as S
ingl
e-St
rand
ed D
NA
(ss
DN
A)
and
Dou
ble-
Stra
nded
DN
A(d
sDN
A)
unde
r D
iffe
rent
Run
ning
Con
ditio
ns
ssD
NA
cds
DN
Ac
(0 m
M M
gCl 2
)ds
DN
Ac
(100
mM
MgC
l 2)
log(
k MB′–
DN
A/s
−1)a
log(
k NB
–DN
A/s
−1)a
log(
k MB′–
DN
A/s
−1)a
log(
k NB
–DN
A/s
−1)a
log(
k MB′–
DN
A/s
−1)a
log(
k NB
–DN
A/s
−1)a
sper
mid
ine
buff
erb
1.6
1.6
0.5
and
1.6e
0.3
0.5
0.6
low
sal
t buf
ferb
1.2
1.6
−0.
2 an
d 1.
6eN
/Ad
0.4
N/A
d
a The
ele
ctro
n tr
ansf
er r
ates
wer
e de
term
ined
by
appl
ying
Lav
iron
ana
lysi
s to
CV
dat
a ac
quir
ed a
t sca
n ra
tes
rang
ing
from
50
mV
/s to
13
V/s
. The
unc
erta
intie
s ar
e ~1
0% o
f th
e lo
g(k)
val
ues.
45
b Low
sal
t buf
fer
is 5
.0 m
M p
hosp
hate
, 50
mM
NaC
l, an
d pH
7. S
perm
idin
e bu
ffer
is 5
.0 m
M p
hosp
hate
, 50
mM
NaC
l, 4
mM
MgC
l 2, 4
mM
spe
rmid
ine,
50
µM E
DT
A, 1
0% g
lyce
rol,
and
pH 7
.
c Ass
embl
ed o
vern
ight
with
25
µM o
f ss
DN
A (
prob
e st
rand
lack
ing
thio
l com
plem
ent)
or
dsD
NA
, with
or
with
out 1
00 m
M M
gCl 2
.
d The
rat
e fo
r do
uble
-str
ande
d N
B–D
NA
cou
ld n
ot b
e de
term
ined
in lo
w s
alt b
uffe
r as
the
sign
als
wer
e to
o sm
all.
e Tw
o di
stin
ct r
educ
tive
peak
s w
ere
obse
rved
for
MB′–
DN
A w
hen
asse
mbl
ed w
ithou
t MgC
l 2 (
Figu
re 7
).
Langmuir. Author manuscript; available in PMC 2013 May 01.
Related Documents