CATFISH FARMER'S HANDBOOK

Catfish Farmers Handbook
Oct 24, 2014
Welcome message from author
This document is posted to help you gain knowledge. Please leave a comment to let me know what you think about it! Share it to your friends and learn new things together.
Transcript
CATFISH FARMER'S HANDBOOK
Fred S. Conte
PDF file created by UC Davis; California Aquacultur,6-00; JSC
CATFISH FARMER'S
HANDBOOK This handbook gives the basic information new catfish
farmers need to get through their first production season with minimum problems. Although there is no guarantee against a catastrophic loss, the new catfish farmer can certainly reduce the chances of such a loss by following the production methods outlined.
The information is presented in outline form with few technical details on why something will or will not work. If you need additional or more technical information on a specific subject, refer to the section "Suggested Reading" for a list of books, articles, bulletins, and other publications on catfish farming.
Catfish farming is much more than just stocking a pond with fish, feeding them, and then reaping the profits a few months later. It requires a large investment and carries a high risk. Intensive catfish culture requires management almost 24 hours a day during most of the year, and unless you are willing to provide this type of management, you should look at another type of enterprise.
The information provided in this handbook pertains primarily to the culture of channel catfish (lctalurus punctatus). However, much of it can also be used in the production of other species of catfish.
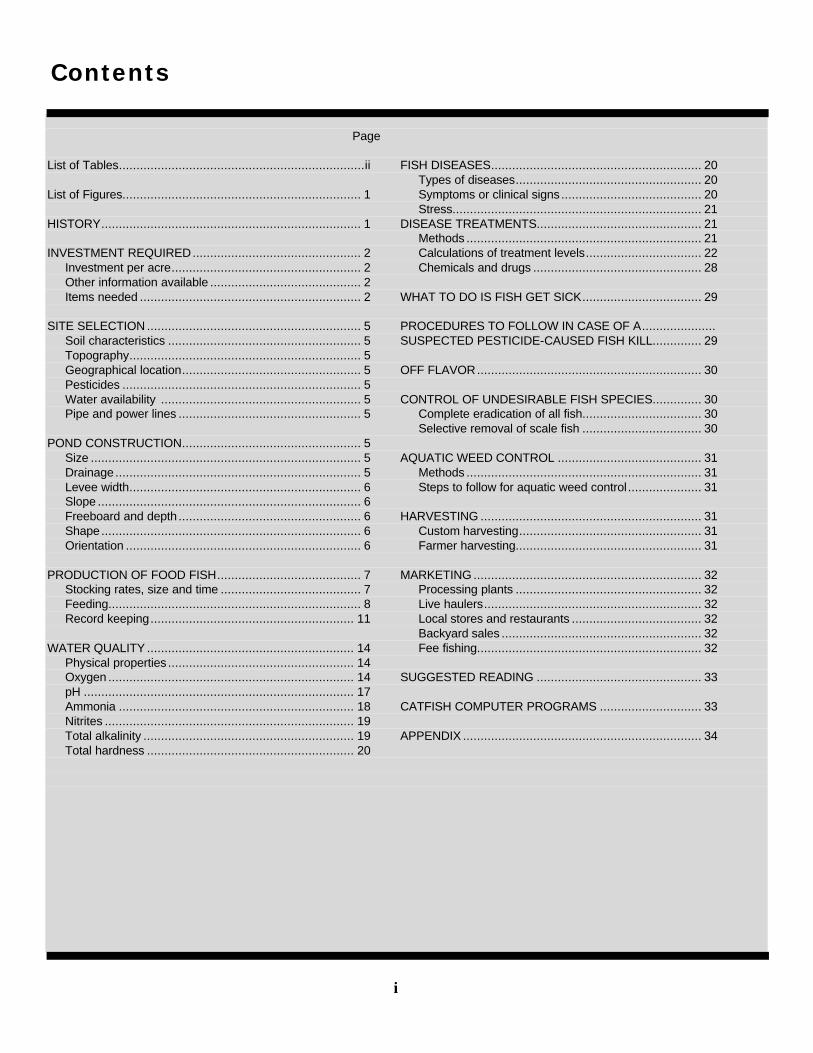
Page List of Tables......................................................................ii FISH DISEASES............................................................ 20 Types of diseases..................................................... 20 List of Figures.................................................................... 1 Symptoms or clinical signs ........................................ 20 Stress....................................................................... 21 HISTORY.......................................................................... 1 DISEASE TREATMENTS............................................... 21 Methods ................................................................... 21 INVESTMENT REQUIRED................................................ 2 Calculations of treatment levels................................. 22 Investment per acre...................................................... 2 Chemicals and drugs ................................................ 28 Other information available ........................................... 2 Items needed ............................................................... 2 WHAT TO DO IS FISH GET SICK.................................. 29 SITE SELECTION ............................................................. 5 PROCEDURES TO FOLLOW IN CASE OF A..................... Soil characteristics ....................................................... 5 SUSPECTED PESTICIDE-CAUSED FISH KILL.............. 29 Topography.................................................................. 5 Geographical location................................................... 5 OFF FLAVOR................................................................ 30 Pesticides .................................................................... 5 Water availability ......................................................... 5 CONTROL OF UNDESIRABLE FISH SPECIES.............. 30 Pipe and power lines .................................................... 5 Complete eradication of all fish.................................. 30 Selective removal of scale fish .................................. 30 POND CONSTRUCTION................................................... 5 Size ............................................................................. 5 AQUATIC WEED CONTROL ......................................... 31 Drainage ...................................................................... 5 Methods ................................................................... 31 Levee width.................................................................. 6 Steps to follow for aquatic weed control ..................... 31 Slope ........................................................................... 6 Freeboard and depth .................................................... 6 HARVESTING ............................................................... 31 Shape.......................................................................... 6 Custom harvesting.................................................... 31 Orientation ................................................................... 6 Farmer harvesting..................................................... 31 PRODUCTION OF FOOD FISH......................................... 7 MARKETING ................................................................. 32 Stocking rates, size and time ........................................ 7 Processing plants ..................................................... 32 Feeding........................................................................ 8 Live haulers.............................................................. 32 Record keeping.......................................................... 11 Local stores and restaurants ..................................... 32 Backyard sales ......................................................... 32 WATER QUALITY ........................................................... 14 Fee fishing................................................................ 32 Physical properties ..................................................... 14 Oxygen ...................................................................... 14 SUGGESTED READING ............................................... 33 pH ............................................................................. 17 Ammonia ................................................................... 18 CATFISH COMPUTER PROGRAMS ............................. 33 Nitrites ....................................................................... 19 Total alkalinity ............................................................ 19 APPENDIX .................................................................... 34 Total hardness ........................................................... 20
Contents
i
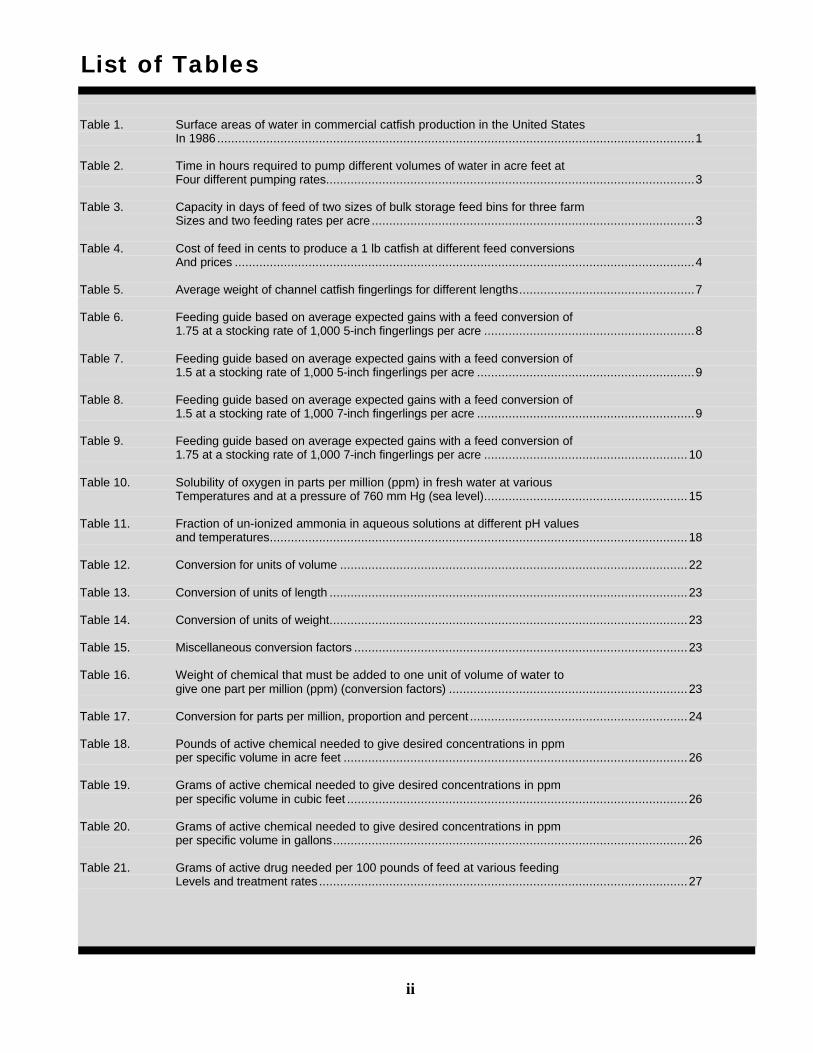
List of Tables Table 1. Surface areas of water in commercial catfish production in the United States In 1986........................................................................................................................................1 Table 2. Time in hours required to pump different volumes of water in acre feet at Four different pumping rates.........................................................................................................3 Table 3. Capacity in days of feed of two sizes of bulk storage feed bins for three farm Sizes and two feeding rates per acre ............................................................................................3 Table 4. Cost of feed in cents to produce a 1 lb catfish at different feed conversions And prices ...................................................................................................................................4 Table 5. Average weight of channel catfish fingerlings for different lengths..................................................7 Table 6. Feeding guide based on average expected gains with a feed conversion of 1.75 at a stocking rate of 1,000 5-inch fingerlings per acre ............................................................8 Table 7. Feeding guide based on average expected gains with a feed conversion of 1.5 at a stocking rate of 1,000 5-inch fingerlings per acre ..............................................................9 Table 8. Feeding guide based on average expected gains with a feed conversion of 1.5 at a stocking rate of 1,000 7-inch fingerlings per acre ..............................................................9 Table 9. Feeding guide based on average expected gains with a feed conversion of 1.75 at a stocking rate of 1,000 7-inch fingerlings per acre ..........................................................10 Table 10. Solubility of oxygen in parts per million (ppm) in fresh water at various Temperatures and at a pressure of 760 mm Hg (sea level)..........................................................15 Table 11. Fraction of un-ionized ammonia in aqueous solutions at different pH values and temperatures.......................................................................................................................18 Table 12. Conversion for units of volume ...................................................................................................22 Table 13. Conversion of units of length ......................................................................................................23 Table 14. Conversion of units of weight......................................................................................................23 Table 15. Miscellaneous conversion factors ...............................................................................................23 Table 16. Weight of chemical that must be added to one unit of volume of water to give one part per million (ppm) (conversion factors) ....................................................................23 Table 17. Conversion for parts per million, proportion and percent ..............................................................24 Table 18. Pounds of active chemical needed to give desired concentrations in ppm per specific volume in acre feet ..................................................................................................26 Table 19. Grams of active chemical needed to give desired concentrations in ppm per specific volume in cubic feet .................................................................................................26 Table 20. Grams of active chemical needed to give desired concentrations in ppm per specific volume in gallons.....................................................................................................26 Table 21. Grams of active drug needed per 100 pounds of feed at various feeding Levels and treatment rates .........................................................................................................27
ii
List of Figures Figure 1. Catfish pond layout...................................................................................................................... 6 Figure 2. 24-hour oxygen cycle in ponds................................................................................................... 14 Figure 3. Graphic method of predicting nighttime oxygen depletions in catfish ponds ................................. 16 Figure 4. Graphic method of predicting nighttime oxygen depletions in catfish ponds ................................. 16 Figure 5. Graphic method of predicting nighttime oxygen depletions in catfish ponds ................................. 16 Figure 6. 24-hour pH cycle ....................................................................................................................... 17 Figure 7. Nitrogen cycle ........................................................................................................................... 19
History of Farm Raised Catfish
The first efforts at raising catfish were made in the early 1900's at several federal and state fish hatcheries. In the 1950's commercial catfish farming first started in Kansas and Arkansas. Much of the information used by the early catfish farmers in the 1950's and 60's was provided by Dr. H. S. Swingle and his co-workers at Auburn University.
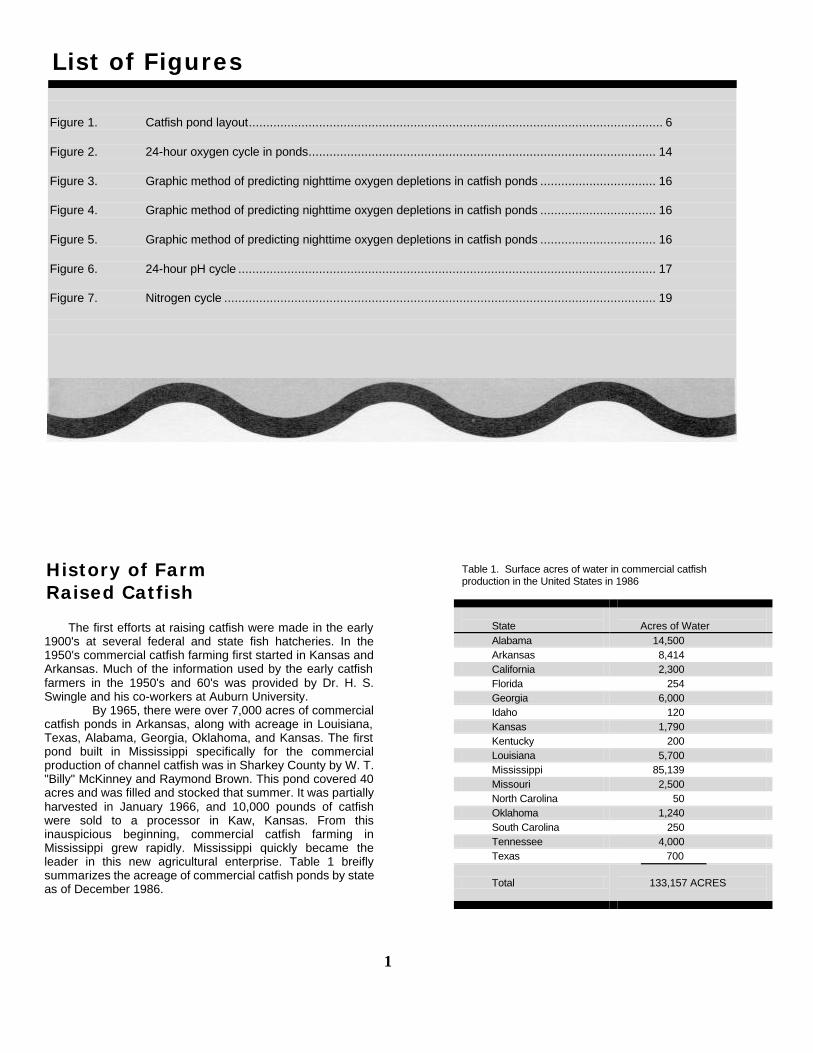
By 1965, there were over 7,000 acres of commercial catfish ponds in Arkansas, along with acreage in Louisiana, Texas, Alabama, Georgia, Oklahoma, and Kansas. The first pond built in Mississippi specifically for the commercial production of channel catfish was in Sharkey County by W. T. "Billy" McKinney and Raymond Brown. This pond covered 40 acres and was filled and stocked that summer. It was partially harvested in January 1966, and 10,000 pounds of catfish were sold to a processor in Kaw, Kansas. From this inauspicious beginning, commercial catfish farming in Mississippi grew rapidly. Mississippi quickly became the leader in this new agricultural enterprise. Table 1 breifly summarizes the acreage of commercial catfish ponds by state as of December 1986.
Table 1. Surface acres of water in commercial catfish production in the United States in 1986
State
Acres of Water
Alabama 14,500 Arkansas 8,414 California 2,300 Florida 254 Georgia 6,000 Idaho 120 Kansas 1,790 Kentucky 200 Louisiana 5,700 Mississippi 85,139 Missouri 2,500 North Carolina 50 Oklahoma 1,240 South Carolina 250 Tennessee 4,000 Texas 700
Total
133,157 ACRES
1
Investment Required
The investment required per acre to get into catfish farming varies depending on factors such as these:
1. Do you own or will you buy the land? 2. Who will do the construction work, you or a con tractor? 3. The amount of dirt that must be moved. 4. The depth and size of the well(s) needed. 5. Do you own or will you have to buy equipment such as
tractors, boats, motors and trucks for use on the farm? Other information on the economics of producing catfish is
contained in two publications available from your County Agent or the Extension Wildlife and Fisheries Department, Mississippi State University:
1. Giachelli, J. W., R. E. Coats, Jr., and J. E. Waldrop. 1982. Mississippi Farm-Raised Catfish January 1982 Cost of Production Estimates. Mississippi State University MAFES Agriculture Economics Research Rep. No. 134, 41 pp.
2. Giachelli, J. W. and J. E. Waldrop. 1983. Cash Flows Associated with Farm-Raised Catfish Production. Mississippi State University, Agricult. Econ. Tech. Publ. No. 46, 37 pp.
Items Needed
Put in your estimated cost, if any, for the items listed below. Since the costs will vary, you must determine what is needed for your situation and what its cost will be.
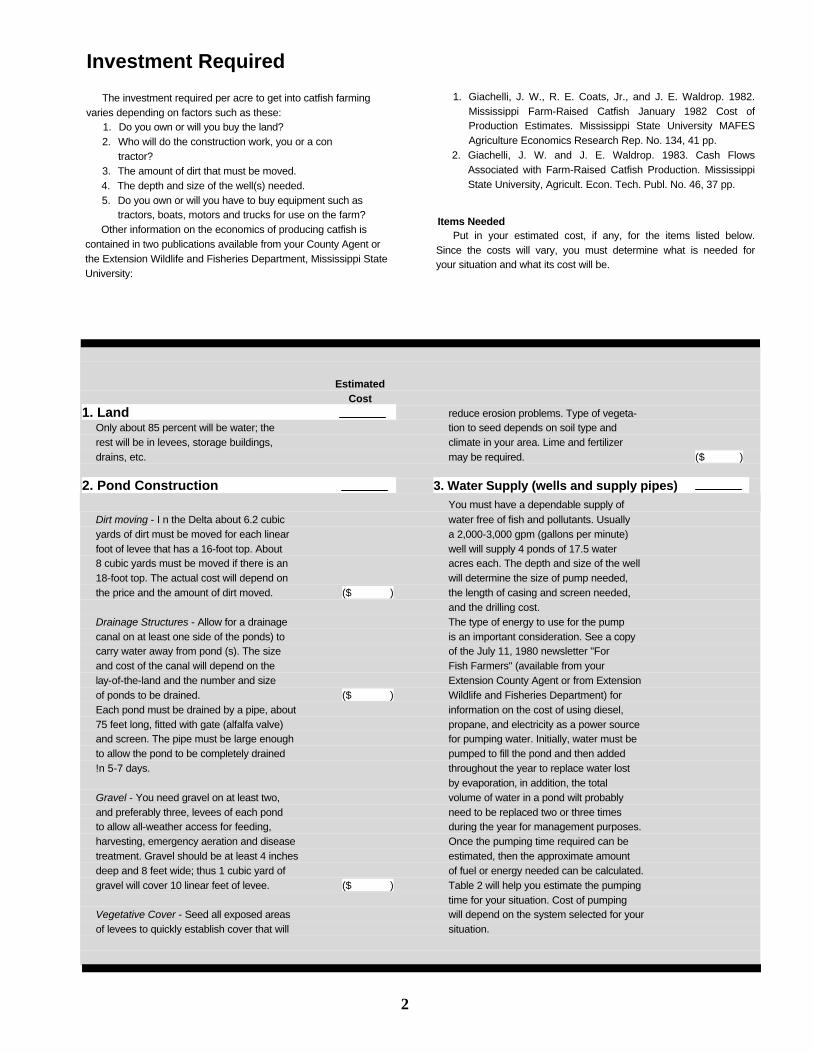
Estimated Cost 1. Land reduce erosion problems. Type of vegeta- Only about 85 percent will be water; the tion to seed depends on soil type and rest will be in levees, storage buildings, climate in your area. Lime and fertilizer drains, etc. may be required. ($ ) 2. Pond Construction 3. Water Supply (wells and supply pipes)
You must have a dependable supply of Dirt moving - I n the Delta about 6.2 cubic water free of fish and pollutants. Usually yards of dirt must be moved for each linear a 2,000-3,000 gpm (gallons per minute) foot of levee that has a 16-foot top. About well will supply 4 ponds of 17.5 water 8 cubic yards must be moved if there is an acres each. The depth and size of the well 18-foot top. The actual cost will depend on will determine the size of pump needed, the price and the amount of dirt moved. ($ ) the length of casing and screen needed, and the drilling cost. Drainage Structures - Allow for a drainage The type of energy to use for the pump canal on at least one side of the ponds) to is an important consideration. See a copy carry water away from pond (s). The size of the July 11, 1980 newsletter "For and cost of the canal will depend on the Fish Farmers" (available from your lay-of-the-land and the number and size Extension County Agent or from Extension of ponds to be drained. ($ ) Wildlife and Fisheries Department) for Each pond must be drained by a pipe, about information on the cost of using diesel, 75 feet long, fitted with gate (alfalfa valve) propane, and electricity as a power source and screen. The pipe must be large enough for pumping water. Initially, water must be to allow the pond to be completely drained pumped to fill the pond and then added !n 5-7 days. throughout the year to replace water lost by evaporation, in addition, the total Gravel - You need gravel on at least two, volume of water in a pond wilt probably and preferably three, levees of each pond need to be replaced two or three times to allow all-weather access for feeding, during the year for management purposes. harvesting, emergency aeration and disease Once the pumping time required can be treatment. Gravel should be at least 4 inches estimated, then the approximate amount deep and 8 feet wide; thus 1 cubic yard of of fuel or energy needed can be calculated. gravel will cover 10 linear feet of levee. ($ ) Table 2 will help you estimate the pumping time for your situation. Cost of pumping Vegetative Cover - Seed all exposed areas will depend on the system selected for your of levees to quickly establish cover that will situation.
2
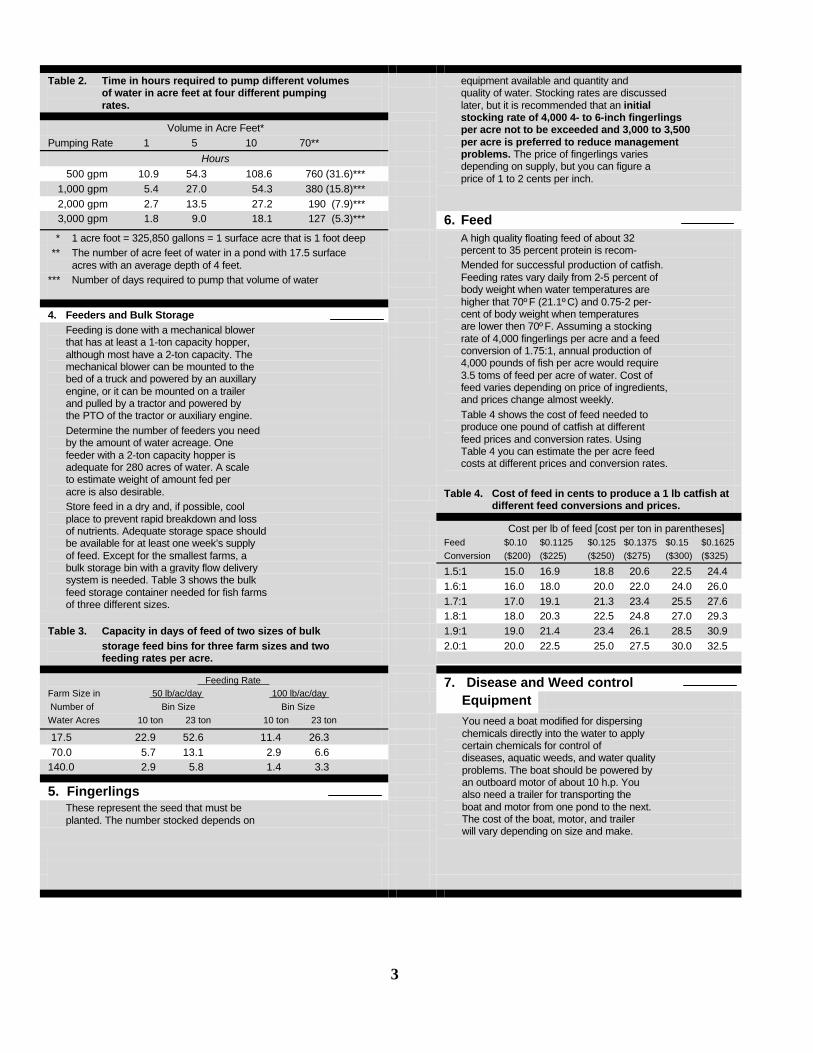
Table 2. Time in hours required to pump different volumes of water in acre feet at four different pumping rates.
Volume in Acre Feet* Pumping Rate 1 5 10 70**
Hours 500 gpm 10.9 54.3 108.6 760 (31.6)*** 1,000 gpm 5.4 27.0 54.3 380 (15.8)*** 2,000 gpm 2.7 13.5 27.2 190 (7.9)***
equipment available and quantity and quality of water. Stocking rates are discussed later, but it is recommended that an initial stocking rate of 4,000 4- to 6-inch fingerlings per acre not to be exceeded and 3,000 to 3,500 per acre is preferred to reduce management problems. The price of fingerlings varies depending on supply, but you can figure a price of 1 to 2 cents per inch.
3,000 gpm 1.8 9.0 18.1 127 (5.3)*** 6. Feed * 1 acre foot = 325,850 gallons = 1 surface acre that is 1 foot deep ** The number of acre feet of water in a pond with 17.5 surface
acres with an average depth of 4 feet.
*** Number of days required to pump that volume of water
4. Feeders and Bulk Storage
Feeding is done with a mechanical blower that has at least a 1-ton capacity hopper, although most have a 2-ton capacity. The mechanical blower can be mounted to the bed of a truck and powered by an auxillary engine, or it can be mounted on a trailer and pulled by a tractor and powered by the PTO of the tractor or auxiliary engine.
A high quality floating feed of about 32 percent to 35 percent protein is recom- Mended for successful production of catfish. Feeding rates vary daily from 2-5 percent of body weight when water temperatures are higher that 70º F (21.1º C) and 0.75-2 per- cent of body weight when temperatures are lower then 70º F. Assuming a stocking rate of 4,000 fingerlings per acre and a feed conversion of 1.75:1, annual production of 4,000 pounds of fish per acre would require 3.5 toms of feed per acre of water. Cost of feed varies depending on price of ingredients, and prices change almost weekly. Table 4 shows the cost of feed needed to produce one pound of catfish at different feed prices and conversion rates. Using Table 4 you can estimate the per acre feed costs at different prices and conversion rates.
Table 4. Cost of feed in cents to produce a 1 lb catfish at different feed conversions and prices.
Cost per lb of feed [cost per ton in parentheses] Feed $0.10 $0.1125 $0.125 $0.1375 $0.15 $0.1625
Conversion ($200) ($225) ($250) ($275) ($300) ($325)
1.5:1 15.0 16.9 18.8 20.6 22.5 24.4 1.6:1 16.0 18.0 20.0 22.0 24.0 26.0 1.7:1 17.0 19.1 21.3 23.4 25.5 27.6
Determine the number of feeders you need by the amount of water acreage. One feeder with a 2-ton capacity hopper is adequate for 280 acres of water. A scale to estimate weight of amount fed per acre is also desirable. Store feed in a dry and, if possible, cool place to prevent rapid breakdown and loss of nutrients. Adequate storage space should be available for at least one week’s supply of feed. Except for the smallest farms, a bulk storage bin with a gravity flow delivery system is needed. Table 3 shows the bulk feed storage container needed for fish farms of three different sizes.
1.8:1 18.0 20.3 22.5 24.8 27.0 29.3 Table 3. Capacity in days of feed of two sizes of bulk 1.9:1 19.0 21.4 23.4 26.1 28.5 30.9
storage feed bins for three farm sizes and two feeding rates per acre.
2.0:1 20.0 22.5 25.0 27.5 30.0 32.5
7. Disease and Weed control Feeding Rate Farm Size in 50 lb/ac/day 100 lb/ac/day
Number of Bin Size Bin Size Equipment
Water Acres 10 ton 23 ton 10 ton 23 ton
17.5 22.9 52.6 11.4 26.3 70.0 5.7 13.1 2.9 6.6 140.0 2.9 5.8 1.4 3.3
5. Fingerlings
These represent the seed that must be planted. The number stocked depends on
You need a boat modified for dispersing chemicals directly into the water to apply certain chemicals for control of diseases, aquatic weeds, and water quality problems. The boat should be powered by an outboard motor of about 10 h.p. You also need a trailer for transporting the boat and motor from one pond to the next. The cost of the boat, motor, and trailer will vary depending on size and make.
3
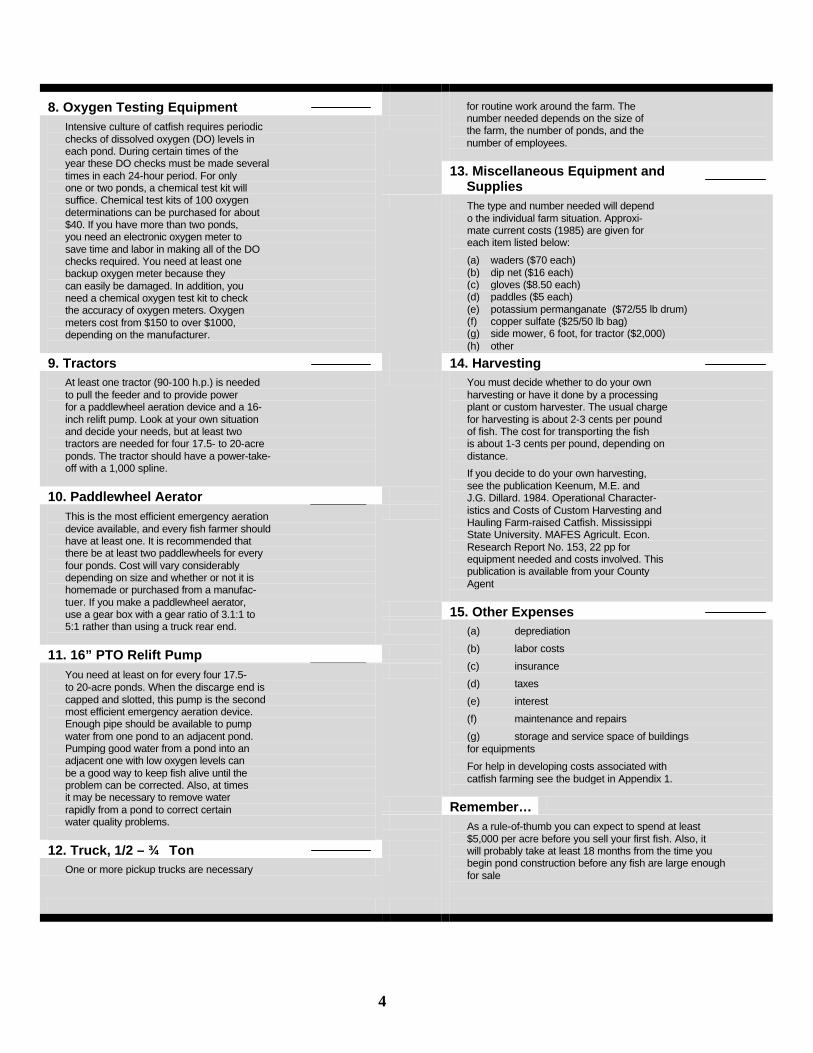
8. Oxygen Testing Equipment
for routine work around the farm. The number needed depends on the size of the farm, the number of ponds, and the number of employees.
13. Miscellaneous Equipment and Supplies
Intensive culture of catfish requires periodic checks of dissolved oxygen (DO) levels in each pond. During certain times of the year these DO checks must be made several times in each 24-hour period. For only one or two ponds, a chemical test kit will suffice. Chemical test kits of 100 oxygen determinations can be purchased for about $40. If you have more than two ponds, you need an electronic oxygen meter to save time and labor in making all of the DO checks required. You need at least one backup oxygen meter because they can easily be damaged. In addition, you need a chemical oxygen test kit to check the accuracy of oxygen meters. Oxygen meters cost from $150 to over $1000, depending on the manufacturer.
The type and number needed will depend o the individual farm situation. Approxi- mate current costs (1985) are given for each item listed below:
(a) waders ($70 each) (b) dip net ($16 each) (c) gloves ($8.50 each) (d) paddles ($5 each) (e) potassium permanganate ($72/55 lb drum) (f) copper sulfate ($25/50 lb bag) (g) side mower, 6 foot, for tractor ($2,000) (h) other
9. Tractors 14. Harvesting At least one tractor (90-100 h.p.) is needed to pull the feeder and to provide power for a paddlewheel aeration device and a 16- inch relift pump. Look at your own situation and decide your needs, but at least two tractors are needed for four 17.5- to 20-acre ponds. The tractor should have a power-take- off with a 1,000 spline.
10. Paddlewheel Aerator
You must decide whether to do your own harvesting or have it done by a processing plant or custom harvester. The usual charge for harvesting is about 2-3 cents per pound of fish. The cost for transporting the fish is about 1-3 cents per pound, depending on distance.
If you decide to do your own harvesting, see the publication Keenum, M.E. and J.G. Dillard. 1984. Operational Character- istics and Costs of Custom Harvesting and Hauling Farm-raised Catfish. Mississippi State University. MAFES Agricult. Econ. Research Report No. 153, 22 pp for equipment needed and costs involved. This publication is available from your County Agent
15. Other Expenses
This is the most efficient emergency aeration device available, and every fish farmer should have at least one. It is recommended that there be at least two paddlewheels for every four ponds. Cost will vary considerably depending on size and whether or not it is homemade or purchased from a manufac- tuer. If you make a paddlewheel aerator, use a gear box with a gear ratio of 3.1:1 to 5:1 rather than using a truck rear end.
11. 16” PTO Relift Pump
(a) deprediation
(b) labor costs
(c) insurance
(d) taxes
(e) interest
(f) maintenance and repairs
(g) storage and service space of buildings for equipments
For help in developing costs associated with catfish farming see the budget in Appendix 1.
Remember…
You need at least on for every four 17.5- to 20-acre ponds. When the discarge end is capped and slotted, this pump is the second most efficient emergency aeration device. Enough pipe should be available to pump water from one pond to an adjacent pond. Pumping good water from a pond into an adjacent one with low oxygen levels can be a good way to keep fish alive until the problem can be corrected. Also, at times it may be necessary to remove water rapidly from a pond to correct certain water quality problems.
12. Truck, 1/2 – ¾ Ton
One or more pickup trucks are necessary
As a rule-of-thumb you can expect to spend at least $5,000 per acre before you sell your first fish. Also, it will probably take at least 18 months from the time you begin pond construction before any fish are large enough for sale
4
Site Selection Soil Characteristics
The soil should hold water, so clay soils are desirable. Before starting construction, be sure to have borings made to insure that sand, gravel, or undesirable soils will not be exposed by the construction.
Topography Lay-of-the-land will determine the amount of dirt that has
to be moved. Less dirt must be moved on flat land than in hilly or rolling land, so dirt-moving costs will be less. For flat land, about 1,100 to 1,200 cubic yards of dirt must be moved per acre. This is just an estimate, and the actual amount can vary greatly from this figure.
• Wetlands. Before clearing or building ponds on "wetlands," a permit is required from the U. S. Army Corps of Engineers. "Wetlands" are defined as: "Those areas that are inundated or saturated by surface or ground water at a frequency and duration sufficient to support, and that under normal circumstances do support, a prevalence of vegetation typically adapted for life in saturated soil conditions. Wetlands generally include swamps, marshes, bogs and similar areas."
• Draining. Select sites to permit draining ponds by gravity flow and to insure that drainage from a neighbor's land isn't blocked.
Geographical location Make sure the area will not be subject to flooding.
Pesticides Check the soil for pesticide residues if row crops were
ever grown on or adjacent to the site. There are three areas within a field that must be checked because of the potential for high residue levels:
• Low areas where run-off collects. An area such as this could have very high levels of pesticides even though a higher area just a short distance away could have low pesticide concentrations that would not be harmful to fish.
• Any area where spray equipment, either aerial or ground, was filled with pesticides. Because of spillage, a fill-area can have high concentrations of pesticides that could kill fish if a pond were constructed there.
• Any area in the field where pesticides were stored or were disposed of are potential danger sites for pond construction.
Collect the soil samples from several locations around the proposed pond site, and pay particular attention to any area that may be similar to those mentioned above. The sample does not have to be large. One that is several square inches deep is adequate. Put samples in a soil sample container which can be obtained from your County Agent. Label each sample so you can later identify the location from which it was taken. Send the samples to the State Chemical Laboratory, P. O. Box CR, Mississippi State, MS 39762, for analysis. Request that the sample be checked for chlorinated hydrocarbons with particular emphasis on
toxaphene and endrin. The cost of the analysis is approximately $53 per sample (as of May 1985), and each resident of Mississippi annually receives $100 worth of analyses at no charge. This means you can get two samples checked at a cost of only $6.
Water Availability
Intensive production of catfish requires a dependable supply of large volumes of water. Usually one well with capacity of 2,000 -3,000 gpm is adequate for four 17.5 acre ponds (See Table 2 for pumping time). Before drilling a well larger than 6 inches, get a permit from the Department of Natural Resources, Jackson, Mississippi. The cost of this permit is $10. The end of the inflow pipe should be provided with an alfalfa valve to increase oxygenation of the inflowing water. Pipelines and Power Lines
Before building ponds over pipelines or underpower lines, check with the utility company to avoid possible legal problems later.
Pond Construction Size
Average ponds are 17.5 water acres on 20 acres of land. Larger ponds are more difficult to manage, and smaller ponds are more expensive to construct.
Drainage
Select site and construct ponds so they can be drained by gravity flow. The lowest part of the pond must be higher than the canal or ditch into which the pond is being drained. Pond bottom should be flat and slope from the shallow to the deep end. Slope of bottom should be about 0.1 - 0.2 feet per 100 feet from shallow to deep end. A flat sloping bottom is necessary for harvesting and draining. Do not build a harvest basin inside or outside the pond.
• Inside drain. Most common is the turn-down pipe or modified Canfield outlet which is located at the lowest point in the pond. The level of water is determined by pivoting the pipe up or down. It must be securely held in position to prevent unplanned drainage. This can be done with a chain from the end of the drain to a post on the bank. Heavily grease swivel joints to allow easy movement. Maintenance of swivel joints can be a problem since work has to be done under water or when the pond is drained.
• Outside drain. The drain pipe is laid through the levee at the lowest point in the pond. The inside end of pipe is screened and extends out from toe of slope at least 5-10 feet to prevent clogging caused by sloughing of dirt from levee.
The outside end of the pipe should extend at least 5 feet past the toe of the slope to prevent excessive erosion of the levee when water is being drained. The end of the pipe is fitted with a "T" and a stand pipe of a height that
5
will maintain the desired normal water level in the pond. The end of the "T" is fitted with an alfalfa valve for water level manipulation and complete draining if needed. The drain should be at least 2 feet above the surface of the water in the drainage ditch to prevent wild fish from entering the pond through the drain.
Another method is to have the outside standpipe 24 inches high, rather than height of normal water level in the pond, and fitted with an alfalfa valve. The end of the "T" is capped. Normal water level is maintained by opening alfalfa valve to remove any excess water due to rain. This system permits rapid draining of up to three feet of water from the pond with slight danger of wild fish entering the pond through the drain pipe. The pond can be completely drained by removing cap at end of "T."
Levee Width
Levee should be a minimum of 16 feet wide, and main levees where wells are located should be 20 feet wide to allow an easier flow of vehicle traffic. Gravel should be on top of levee on at least two sides of each pond to permit all-weather access for harvesting, disease and weed treatments, oxygen monitoring, feeding, and moving aeration equipment.
Slope
A slope of 3:1 is satisfactory if properly compacted. Increasing the slope to 4:1 or 5:1 will substantially increase the amount of dirt that must be moved. For an 80-acre unit with 4 ponds, a 4:1 slope will cost $6,000 more in dirt moving costs than a 3:1 slope. A 5:1 slope will cost $10,000 more than a 3:1 slope.
Freeboard and Depth
Freeboard is the height of the top of the levee above the normal water line. The amount of freeboard should not exceed two feet nor be less than one foot.
Depth of the pond should be at least three feet at the toe of the slope on the shallow end and should not be greater than six feet at the toe of the slope at the deep end.
Shape
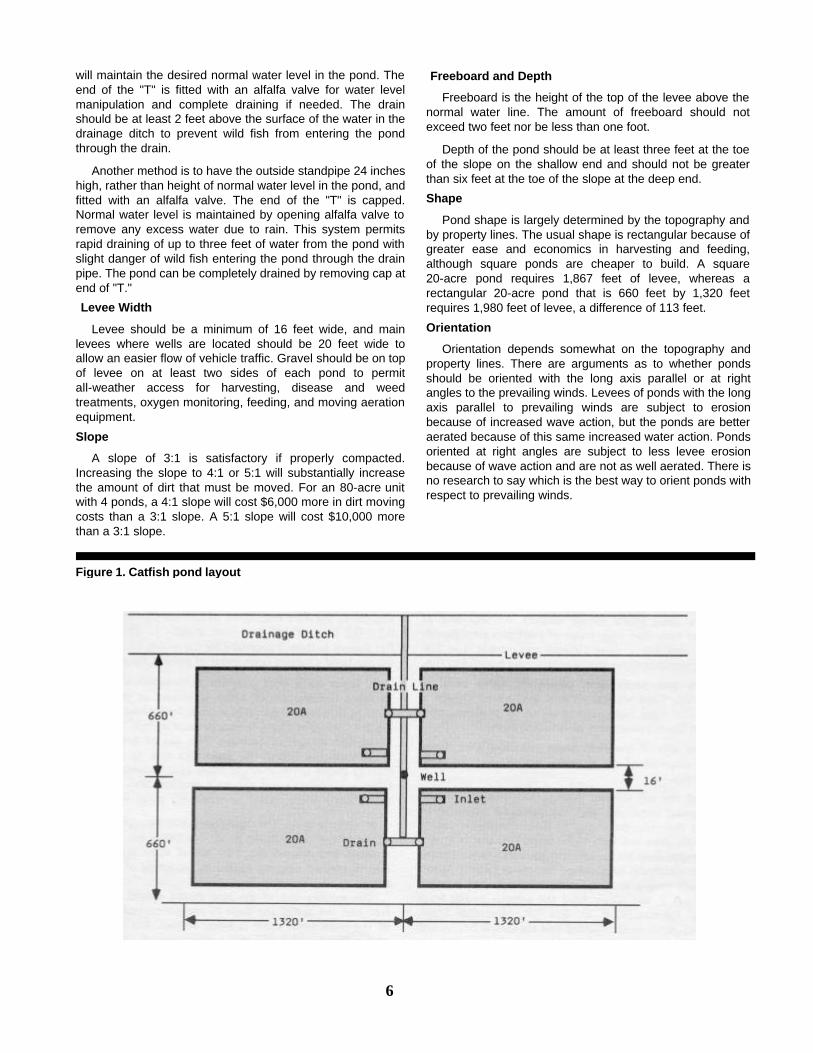
Pond shape is largely determined by the topography and by property lines. The usual shape is rectangular because of greater ease and economics in harvesting and feeding, although square ponds are cheaper to build. A square 20-acre pond requires 1,867 feet of levee, whereas a rectangular 20-acre pond that is 660 feet by 1,320 feet requires 1,980 feet of levee, a difference of 113 feet.
Orientation
Orientation depends somewhat on the topography and property lines. There are arguments as to whether ponds should be oriented with the long axis parallel or at right angles to the prevailing winds. Levees of ponds with the long axis parallel to prevailing winds are subject to erosion because of increased wave action, but the ponds are better aerated because of this same increased water action. Ponds oriented at right angles are subject to less levee erosion because of wave action and are not as well aerated. There is no research to say which is the best way to orient ponds with respect to prevailing winds.
Figure 1. Catfish pond layout
6
Production of Food Fish
Stocking Rates, Size, and Time • Rates. New producers should not exceed a stocking
rate of 3,000 to 3,500 catfish per acre for the first growing season. You can gain experience in management procedures while reducing potential problems. Exceeding this rate increases the chance of substantial losses caused by water quality problems and diseases. In intensive pond culture systems, the stocking rate varies from 3,000 catfish per acre and upward. As the number per acre increases, management problems increase. In ponds with limited or no water available except runoff, stocking rates should not exceed 2,000 catfish per acre, and a rate 1,000 to 1,500 per acre would probably be better.
• Size. Stockers 6-8 inches long are preferred when available since they will reach a size of 1.5 pounds in about 210 feeding days when water temperatures are above 70ºF (21 ºC).
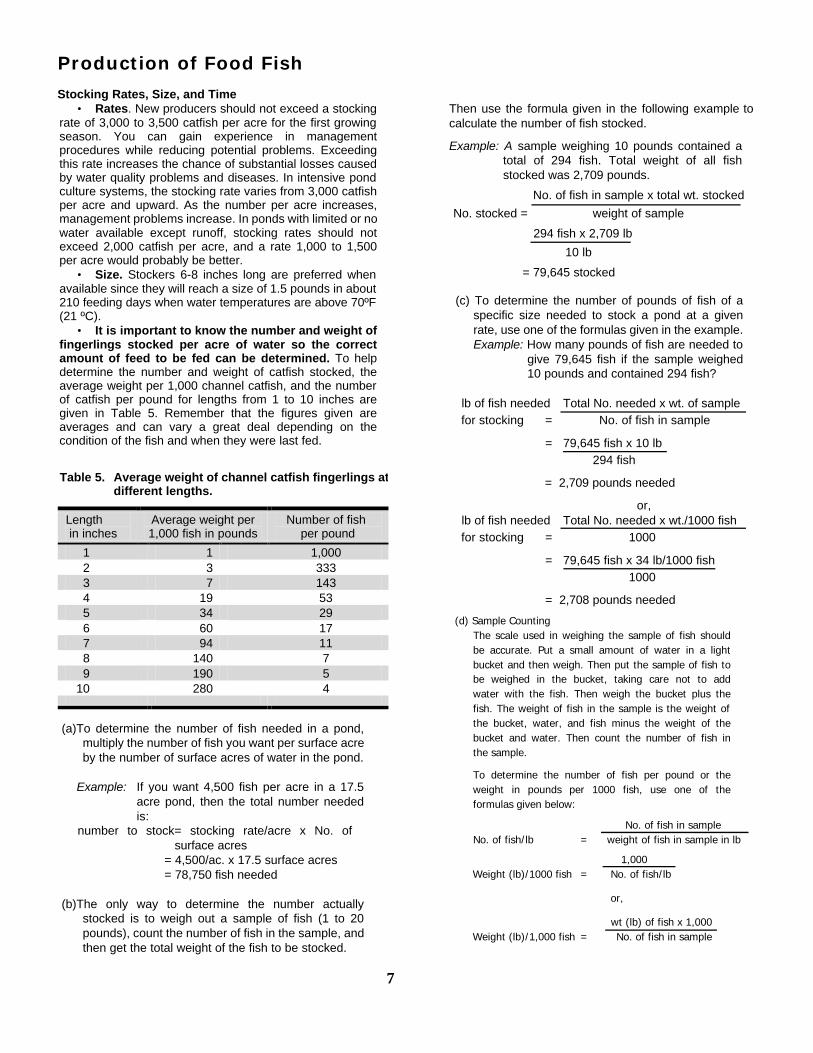
• It is important to know the number and weight of fingerlings stocked per acre of water so the correct amount of feed to be fed can be determined. To help determine the number and weight of catfish stocked, the average weight per 1,000 channel catfish, and the number of catfish per pound for lengths from 1 to 10 inches are given in Table 5. Remember that the figures given are averages and can vary a great deal depending on the condition of the fish and when they were last fed.
Then use the formula given in the following example to calculate the number of fish stocked.
Example: A sample weighing 10 pounds contained a total of 294 fish. Total weight of all fish stocked was 2,709 pounds.
No. of fish in sample x total wt. stocked
No. stocked = weight of sample
294 fish x 2,709 lb
10 lb
= 79,645 stocked
(c) To determine the number of pounds of fish of a specific size needed to stock a pond at a given rate, use one of the formulas given in the example. Example: How many pounds of fish are needed to
give 79,645 fish if the sample weighed 10 pounds and contained 294 fish?
lb of fish needed Total No. needed x wt. of sample for stocking = No. of fish in sample
= 79,645 fish x 10 lb 294 fish
= 2,709 pounds needed
or, lb of fish needed Total No. needed x wt./1000 fish for stocking = 1000
= 79,645 fish x 34 lb/1000 fish 1000
= 2,708 pounds needed
(d) Sample Counting The scale used in weighing the sample of fish should be accurate. Put a small amount of water in a light bucket and then weigh. Then put the sample of fish to be weighed in the bucket, taking care not to add water with the fish. Then weigh the bucket plus the fish. The weight of fish in the sample is the weight of the bucket, water, and fish minus the weight of the bucket and water. Then count the number of fish in the sample.
To determine the number of fish per pound or the weight in pounds per 1000 fish, use one of the formulas given below:
No. of fish in sample No. of fish/lb = weight of fish in sample in lb
1,000 Weight (lb)/1000 fish = No. of fish/lb
or, wt (lb) of fish x 1,000
Weight (lb)/1,000 fish = No. of fish in sample
Table 5. Average weight of channel catfish fingerlings at different lengths.
Length in inches
Average weight per 1,000 fish in pounds
Number of fish per pound
1 1 1,000 2 3 333 3 7 143 4 19 53 5 34 29 6 60 17 7 94 11 8 140 7 9 190 5 10 280 4
(a)To determine the number of fish needed in a pond, multiply the number of fish you want per surface acre by the number of surface acres of water in the pond.
Example: If you want 4,500 fish per acre in a 17.5
acre pond, then the total number needed is:
number to stock= stocking rate/acre x No. of surface acres
= 4,500/ac. x 17.5 surface acres = 78,750 fish needed
(b)The only way to determine the number actually stocked is to weigh out a sample of fish (1 to 20 pounds), count the number of fish in the sample, and then get the total weight of the fish to be stocked.
7
7
• Time. Initial stocking is done as soon as there is water in the pond, and catfish of an acceptable size are available.
When a pond is "clean cropped," or all the fish are harvested at one time, restock the pond as soon as it is one-fourth to one-half full and stocker-sized catfish are available.
When a pond is "topped," or multiple harvested, restock as soon as possible after harvest with one 5-8 inch fingerling for each fish harvested.
In a topping or multiple harvest production system, a pond is stocked initially and fed until about 1/4 to 1/3 of the fish are larger than 3/4 pound. At that time, seine the pond with a seine having a mesh size of 1 3/8 to 1 5/8 inches. The seine will capture those fish that weigh 3/4 pounds or more and will allow smaller fish to escape. Replace fish removed by stocking one fingerling for each fish harvested.
Determine the number to restock after partial harvesting by using the formula given in the example below. You must know the total weight in pounds of fish harvested from the pond and a sample of the fish harvested must be weighed and counted.
Example: pounds harvested = 12,200
sample weight in lb = 48 No. of fish in sample = 39
No. in sample x total wt. harvested No. to restock = weight of sample 39 fish x 12,200 lb = 48 lb = 9,913 fish
Under this system, the pond is never drained, and water is added only to replace that lost by evaporation or for management of water quality.
Feeding - Remember "no feed, no gain!"
• Feed size. It is important to match feed size to fish size. Feed must be small enough so fish can eat it. In ponds with mixed sizes of fish, use mixed feed sizes or use feed that can be eaten by the smaller fish.
• Quality of feed. Use feed that has 32-35% protein. Vitamins, particularly Vitamin C, must be added. Use floating feed when water temperatures are above 60ºF (15.6ºC) and sinking feed when temperatures are lower.
• Feeding rates. Several factors control the amount of food fish eat:
(a) water temperature (b)water quality (oxygen, pH, etc.) (c) size of the food (d) palatability or taste of the food (e)frequency of feeding (f) the way the fish are fed (g) location of feeding sites (h) type of pellet used, floating or sinking
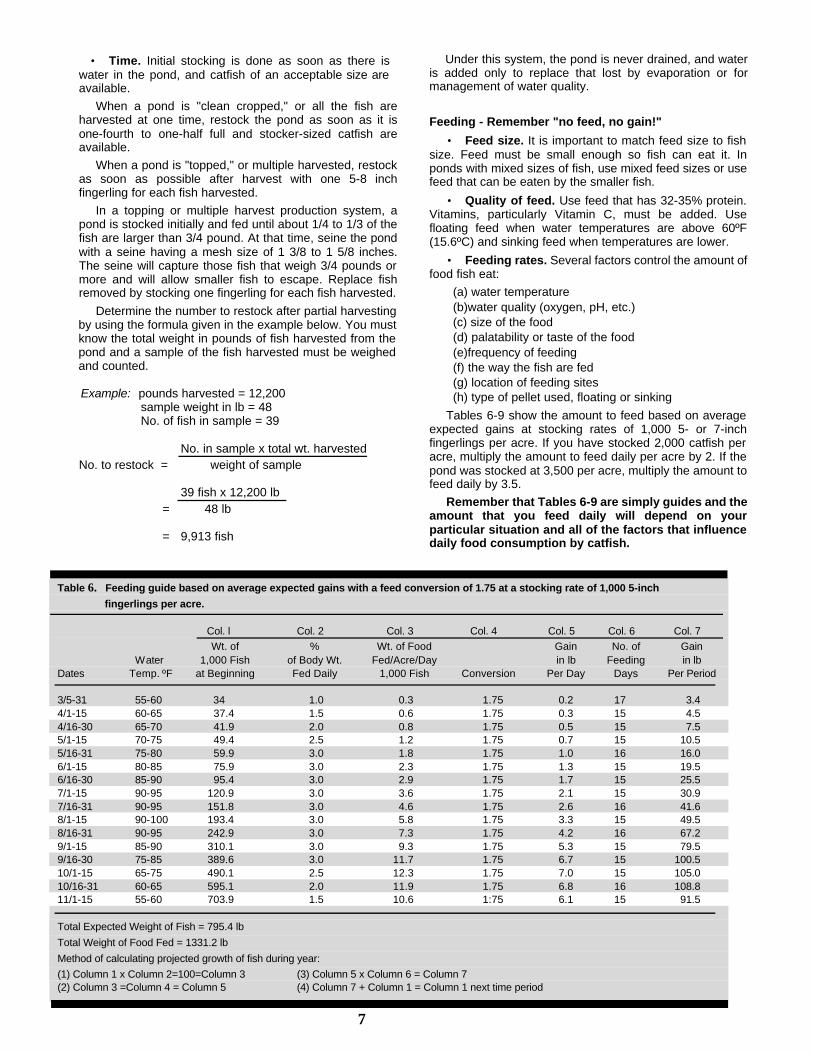
Tables 6-9 show the amount to feed based on average expected gains at stocking rates of 1,000 5- or 7-inch fingerlings per acre. If you have stocked 2,000 catfish per acre, multiply the amount to feed daily per acre by 2. If the pond was stocked at 3,500 per acre, multiply the amount to feed daily by 3.5.
Remember that Tables 6-9 are simply guides and the amount that you feed daily will depend on your particular situation and all of the factors that influence daily food consumption by catfish.
Table 6. Feeding guide based on average expected gains with a feed conversion of 1.75 at a stocking rate of 1,000 5-inch
fingerlings per acre. Col. l Col. 2 Col. 3 Col. 4 Col. 5 Col. 6 Col. 7
Wt. of % Wt. of Food Gain No. of Gain Water 1,000 Fish of Body Wt. Fed/Acre/Day in lb Feeding in lb Dates Temp. ºF at Beginning Fed Daily 1,000 Fish Conversion Per Day Days Per Period 3/5-31 55-60 34 1.0 0.3 1.75 0.2 17 3.4 4/1-15 60-65 37.4 1.5 0.6 1.75 0.3 15 4.5 4/16-30 65-70 41.9 2.0 0.8 1.75 0.5 15 7.5 5/1-15 70-75 49.4 2.5 1.2 1.75 0.7 15 10.5 5/16-31 75-80 59.9 3.0 1.8 1.75 1.0 16 16.0 6/1-15 80-85 75.9 3.0 2.3 1.75 1.3 15 19.5 6/16-30 85-90 95.4 3.0 2.9 1.75 1.7 15 25.5 7/1-15 90-95 120.9 3.0 3.6 1.75 2.1 15 30.9 7/16-31 90-95 151.8 3.0 4.6 1.75 2.6 16 41.6 8/1-15 90-100 193.4 3.0 5.8 1.75 3.3 15 49.5 8/16-31 90-95 242.9 3.0 7.3 1.75 4.2 16 67.2 9/1-15 85-90 310.1 3.0 9.3 1.75 5.3 15 79.5 9/16-30 75-85 389.6 3.0 11.7 1.75 6.7 15 100.5 10/1-15 65-75 490.1 2.5 12.3 1.75 7.0 15 105.0 10/16-31 60-65 595.1 2.0 11.9 1.75 6.8 16 108.8 11/1-15 55-60 703.9 1.5 10.6 1:75 6.1 15 91.5
Total Expected Weight of Fish = 795.4 lb
Total Weight of Food Fed = 1331.2 lb
Method of calculating projected growth of fish during year:
(1) Column 1 x Column 2=100=Column 3 (3) Column 5 x Column 6 = Column 7 (2) Column 3 =Column 4 = Column 5 (4) Column 7 + Column 1 = Column 1 next time period
9
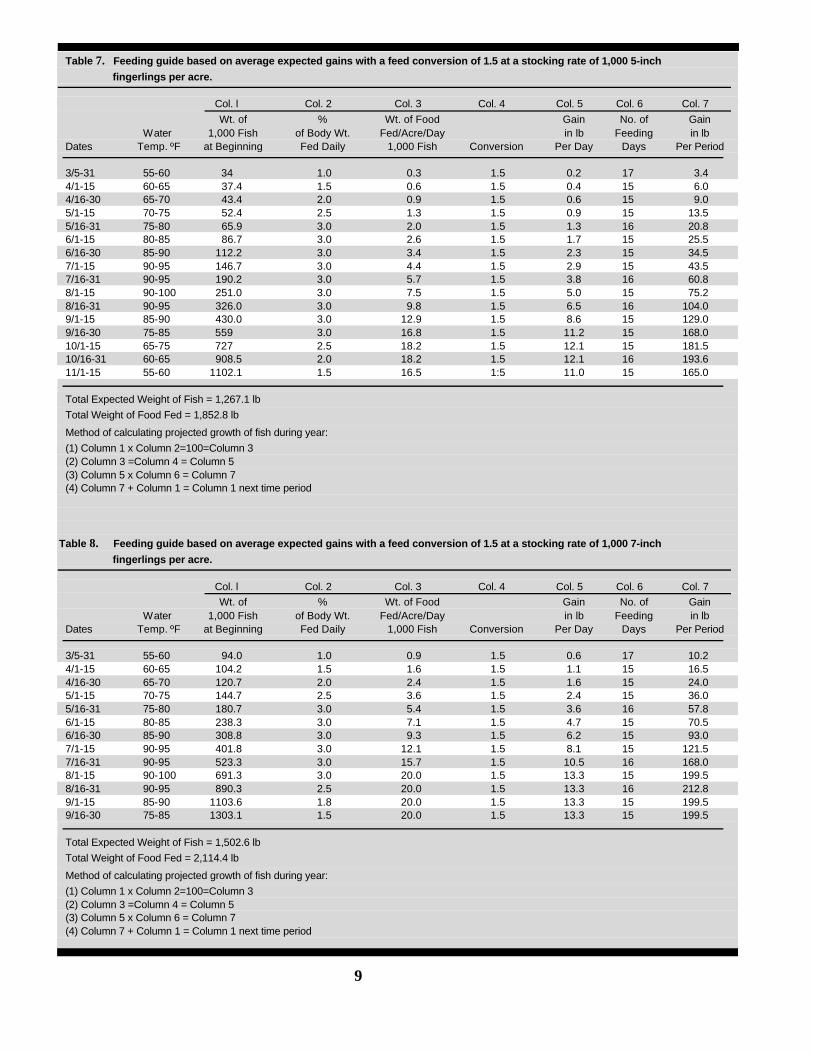
Table 7. Feeding guide based on average expected gains with a feed conversion of 1.5 at a stocking rate of 1,000 5-inch
fingerlings per acre. Col. l Col. 2 Col. 3 Col. 4 Col. 5 Col. 6 Col. 7
Wt. of % Wt. of Food Gain No. of Gain Water 1,000 Fish of Body Wt. Fed/Acre/Day in lb Feeding in lb Dates Temp. ºF at Beginning Fed Daily 1,000 Fish Conversion Per Day Days Per Period 3/5-31 55-60 34 1.0 0.3 1.5 0.2 17 3.4 4/1-15 60-65 37.4 1.5 0.6 1.5 0.4 15 6.0 4/16-30 65-70 43.4 2.0 0.9 1.5 0.6 15 9.0 5/1-15 70-75 52.4 2.5 1.3 1.5 0.9 15 13.5 5/16-31 75-80 65.9 3.0 2.0 1.5 1.3 16 20.8 6/1-15 80-85 86.7 3.0 2.6 1.5 1.7 15 25.5 6/16-30 85-90 112.2 3.0 3.4 1.5 2.3 15 34.5 7/1-15 90-95 146.7 3.0 4.4 1.5 2.9 15 43.5 7/16-31 90-95 190.2 3.0 5.7 1.5 3.8 16 60.8 8/1-15 90-100 251.0 3.0 7.5 1.5 5.0 15 75.2 8/16-31 90-95 326.0 3.0 9.8 1.5 6.5 16 104.0 9/1-15 85-90 430.0 3.0 12.9 1.5 8.6 15 129.0 9/16-30 75-85 559 3.0 16.8 1.5 11.2 15 168.0 10/1-15 65-75 727 2.5 18.2 1.5 12.1 15 181.5 10/16-31 60-65 908.5 2.0 18.2 1.5 12.1 16 193.6 11/1-15 55-60 1102.1 1.5 16.5 1:5 11.0 15 165.0
Total Expected Weight of Fish = 1,267.1 lb
Total Weight of Food Fed = 1,852.8 lb
Method of calculating projected growth of fish during year:
(1) Column 1 x Column 2=100=Column 3 (2) Column 3 =Column 4 = Column 5 (3) Column 5 x Column 6 = Column 7 (4) Column 7 + Column 1 = Column 1 next time period
Table 8. Feeding guide based on average expected gains with a feed conversion of 1.5 at a stocking rate of 1,000 7-inch
fingerlings per acre. Col. l Col. 2 Col. 3 Col. 4 Col. 5 Col. 6 Col. 7
Wt. of % Wt. of Food Gain No. of Gain Water 1,000 Fish of Body Wt. Fed/Acre/Day in lb Feeding in lb Dates Temp. ºF at Beginning Fed Daily 1,000 Fish Conversion Per Day Days Per Period 3/5-31 55-60 94.0 1.0 0.9 1.5 0.6 17 10.2 4/1-15 60-65 104.2 1.5 1.6 1.5 1.1 15 16.5 4/16-30 65-70 120.7 2.0 2.4 1.5 1.6 15 24.0 5/1-15 70-75 144.7 2.5 3.6 1.5 2.4 15 36.0 5/16-31 75-80 180.7 3.0 5.4 1.5 3.6 16 57.8 6/1-15 80-85 238.3 3.0 7.1 1.5 4.7 15 70.5 6/16-30 85-90 308.8 3.0 9.3 1.5 6.2 15 93.0 7/1-15 90-95 401.8 3.0 12.1 1.5 8.1 15 121.5 7/16-31 90-95 523.3 3.0 15.7 1.5 10.5 16 168.0 8/1-15 90-100 691.3 3.0 20.0 1.5 13.3 15 199.5 8/16-31 90-95 890.3 2.5 20.0 1.5 13.3 16 212.8 9/1-15 85-90 1103.6 1.8 20.0 1.5 13.3 15 199.5 9/16-30 75-85 1303.1 1.5 20.0 1.5 13.3 15 199.5
Total Expected Weight of Fish = 1,502.6 lb
Total Weight of Food Fed = 2,114.4 lb
Method of calculating projected growth of fish during year:
(1) Column 1 x Column 2=100=Column 3 (2) Column 3 =Column 4 = Column 5 (3) Column 5 x Column 6 = Column 7 (4) Column 7 + Column 1 = Column 1 next time period
10
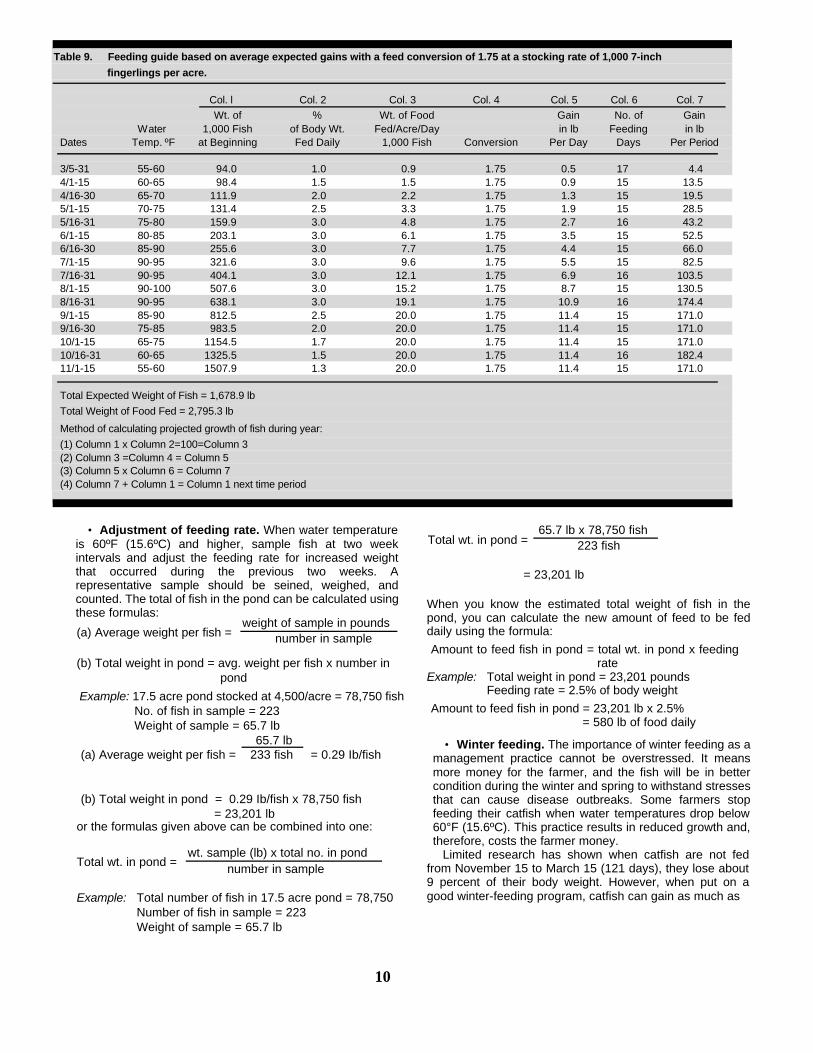
Table 9. Feeding guide based on average expected gains with a feed conversion of 1.75 at a stocking rate of 1,000 7-inch
fingerlings per acre. Col. l Col. 2 Col. 3 Col. 4 Col. 5 Col. 6 Col. 7
Wt. of % Wt. of Food Gain No. of Gain Water 1,000 Fish of Body Wt. Fed/Acre/Day in lb Feeding in lb Dates Temp. ºF at Beginning Fed Daily 1,000 Fish Conversion Per Day Days Per Period 3/5-31 55-60 94.0 1.0 0.9 1.75 0.5 17 4.4 4/1-15 60-65 98.4 1.5 1.5 1.75 0.9 15 13.5 4/16-30 65-70 111.9 2.0 2.2 1.75 1.3 15 19.5 5/1-15 70-75 131.4 2.5 3.3 1.75 1.9 15 28.5 5/16-31 75-80 159.9 3.0 4.8 1.75 2.7 16 43.2 6/1-15 80-85 203.1 3.0 6.1 1.75 3.5 15 52.5 6/16-30 85-90 255.6 3.0 7.7 1.75 4.4 15 66.0 7/1-15 90-95 321.6 3.0 9.6 1.75 5.5 15 82.5 7/16-31 90-95 404.1 3.0 12.1 1.75 6.9 16 103.5 8/1-15 90-100 507.6 3.0 15.2 1.75 8.7 15 130.5 8/16-31 90-95 638.1 3.0 19.1 1.75 10.9 16 174.4 9/1-15 85-90 812.5 2.5 20.0 1.75 11.4 15 171.0 9/16-30 75-85 983.5 2.0 20.0 1.75 11.4 15 171.0 10/1-15 65-75 1154.5 1.7 20.0 1.75 11.4 15 171.0 10/16-31 60-65 1325.5 1.5 20.0 1.75 11.4 16 182.4 11/1-15 55-60 1507.9 1.3 20.0 1.75 11.4 15 171.0
Total Expected Weight of Fish = 1,678.9 lb
Total Weight of Food Fed = 2,795.3 lb
Method of calculating projected growth of fish during year:
(1) Column 1 x Column 2=100=Column 3 (2) Column 3 =Column 4 = Column 5 (3) Column 5 x Column 6 = Column 7 (4) Column 7 + Column 1 = Column 1 next time period
• Adjustment of feeding rate. When water temperature is 60ºF (15.6ºC) and higher, sample fish at two week intervals and adjust the feeding rate for increased weight that occurred during the previous two weeks. A representative sample should be seined, weighed, and counted. The total of fish in the pond can be calculated using these formulas:
(a) Average weight per fish = weight of sample in pounds
number in sample
(b) Total weight in pond = avg. weight per fish x number in pond
Example: 17.5 acre pond stocked at 4,500/acre = 78,750 fish No. of fish in sample = 223 Weight of sample = 65.7 lb
65.7 lb (a) Average weight per fish = 233 fish = 0.29 Ib/fish
(b) Total weight in pond = 0.29 Ib/fish x 78,750 fish = 23,201 lb
or the formulas given above can be combined into one:
wt. sample (lb) x total no. in pond number in sample
Example: Total number of fish in 17.5 acre pond = 78,750 Number of fish in sample = 223 Weight of sample = 65.7 lb
Total wt. in pond =
Total wt. in pond = 65.7 lb x 78,750 fish
223 fish
= 23,201 lb
When you know the estimated total weight of fish in the pond, you can calculate the new amount of feed to be fed daily using the formula:
Amount to feed fish in pond = total wt. in pond x feeding rate
Example: Total weight in pond = 23,201 pounds Feeding rate = 2.5% of body weight
Amount to feed fish in pond = 23,201 lb x 2.5% = 580 lb of food daily
• Winter feeding. The importance of winter feeding as a management practice cannot be overstressed. It means more money for the farmer, and the fish will be in better condition during the winter and spring to withstand stresses that can cause disease outbreaks. Some farmers stop feeding their catfish when water temperatures drop below 60°F (15.6ºC). This practice results in reduced growth and, therefore, costs the farmer money.
Limited research has shown when catfish are not fed from November 15 to March 15 (121 days), they lose about 9 percent of their body weight. However, when put on a good winter-feeding program, catfish can gain as much as
11
20 percent of their body weight from November 15 to March 15. Here are two types of winter feeding programs:
(a) Feed sinking feed at 0.5 to 1 percent of the body weight on alternate days, or
(b) Feed at 0.5 to 1 percent of the body weight whenever the water temperature at a depth of three feet is 54ºF (12.2ºC) or warmer.
• Feeding time and frequency. Feeding twice daily, if possible, will usually improve food consumption and food conversion. This means that one-half of the daily allowance is fed in the morning, and the other half in the late morning or early afternoon.
Research indicates that feeding in the late afternoon increases the amount of fat deposited, and this can affect the quality of the processed fish. Since low oxygen concentrations are usually at their lowest in the morning, it is generally best to wait until 8 or 9 a.m. before feeding. Also, it is best not to feed late in the afternoon to prevent the fishes' increased oxygen requirement from coinciding with decreasing oxygen concentrations in the pond. Feeding daily can reduce production time by four weeks when compared to feeding only six times a week.
Feed along the entire length of the pond and preferably along two sides. By feeding along two sides, more fish have a chance to get their share, thus resulting in better growth rates and feed conversions.
Remember that feeding is the most important task in the production of catfish; thus the person responsible for feeding should be an experienced fish culturist. Under normal circumstances, the only time fish in the pond are seen is when they are coming up to feed, and their feeding behavior can be an important clue to the general health of the fish and the condition of the pond. Therefore, the person feeding must be
able to tell whether or not the fish are feeding normally. If the fish are not feeding normally, the feeder must recognize the fact and alert the manager that a potential problem may be developing.
• Record keeping. You must know the number of fish
and the weight of fish in every pond at any given time if you want to be successful at raising fish. If the weight of fish in a pond is underestimated, not enough food will be fed, resulting in poor growth, poor feed conversions, and increased time required to get the fish to harvestable size. If the weight of fish in a pond is overestimated, the result will be overfeeding, poor feed conversions, and very likely, severe water quality problems.
An important reason for keeping good records is that many lending institutions require good records before they will lend money. Also, without good records you don't know if you are making or losing money, and you can't identify problem areas that need correcting for the most efficient and economical management.
An excellent computer program for catfish record keeping is available for these microcomputers: Radio Shack Model I I, III, and 16 and IBM PC. A copy of the documentation and software is available from your County Agent, or the Extension Computer Applications and Services Department, P. O. Box 5446, Mississippi State, MS 39762.
If you don't have a computer, you can develop your own system, use the forms given here, or use some modification of these forms.
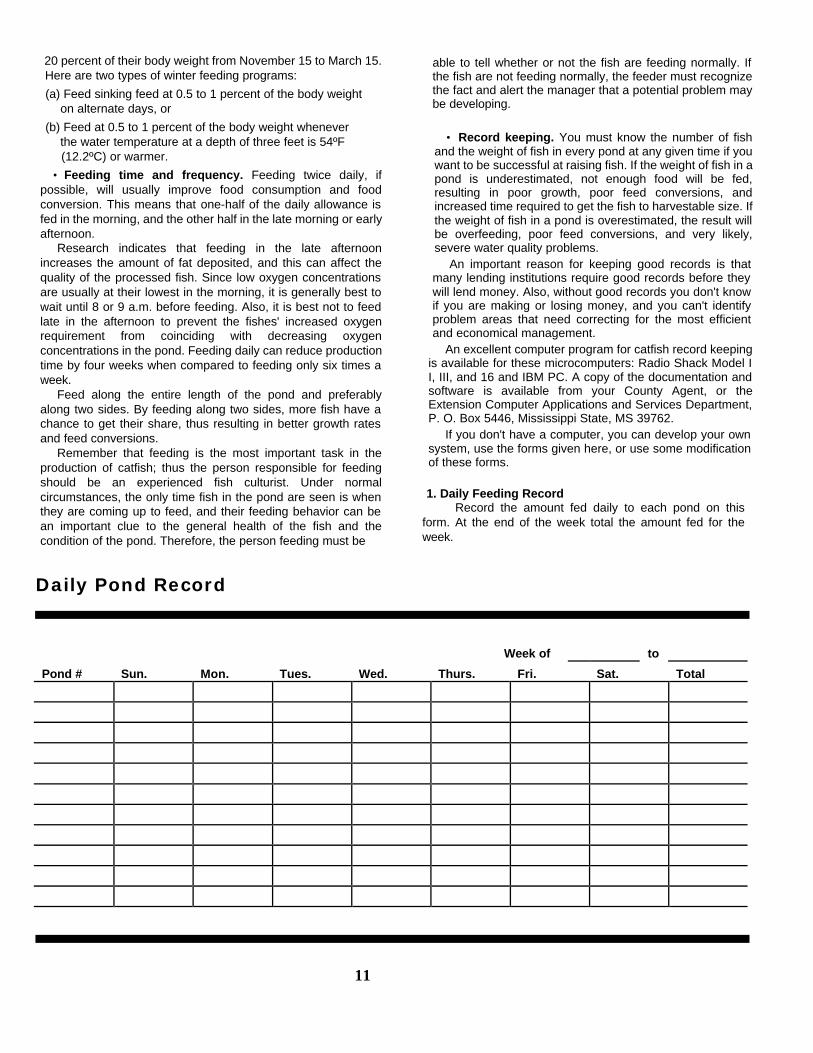
1. Daily Feeding Record Record the amount fed daily to each pond on this
form. At the end of the week total the amount fed for the week.
Daily Pond Record
Week of to
Pond # Sun. Mon. Tues. Wed. Thurs. Fri. Sat. Total
12
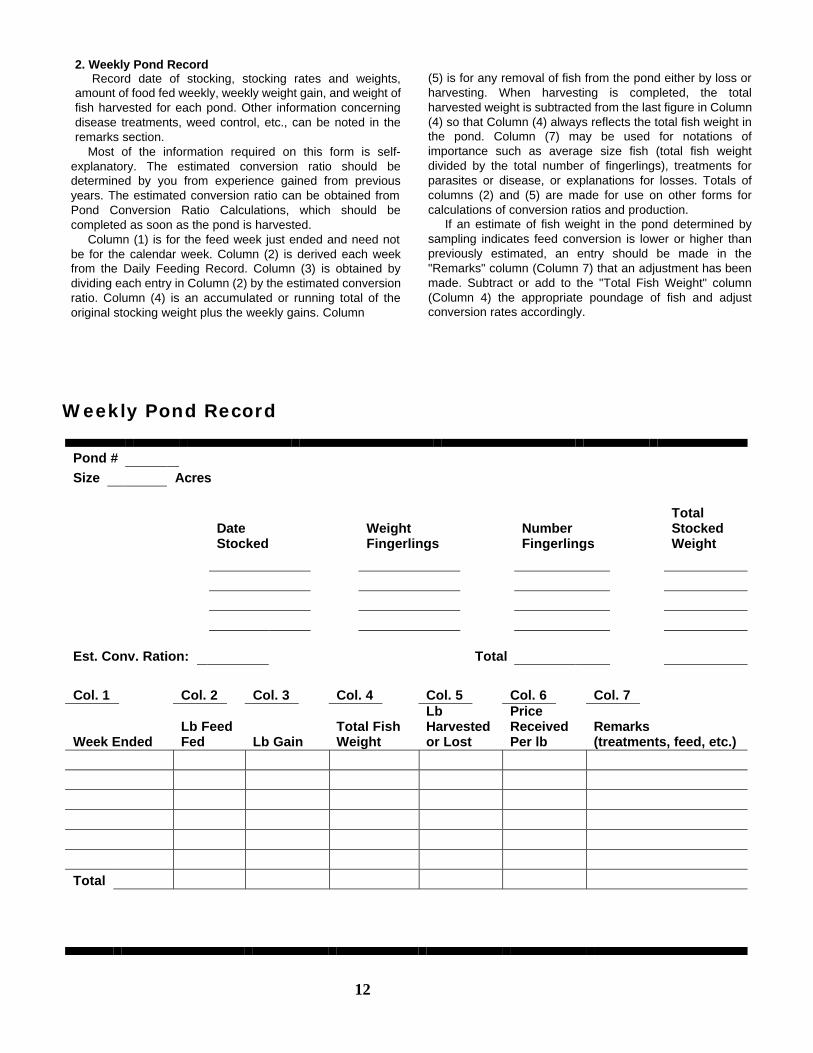
2. Weekly Pond Record Record date of stocking, stocking rates and weights,
amount of food fed weekly, weekly weight gain, and weight of fish harvested for each pond. Other information concerning disease treatments, weed control, etc., can be noted in the remarks section.
Most of the information required on this form is self-explanatory. The estimated conversion ratio should be determined by you from experience gained from previous years. The estimated conversion ratio can be obtained from Pond Conversion Ratio Calculations, which should be completed as soon as the pond is harvested.
Column (1) is for the feed week just ended and need not be for the calendar week. Column (2) is derived each week from the Daily Feeding Record. Column (3) is obtained by dividing each entry in Column (2) by the estimated conversion ratio. Column (4) is an accumulated or running total of the original stocking weight plus the weekly gains. Column
(5) is for any removal of fish from the pond either by loss or harvesting. When harvesting is completed, the total harvested weight is subtracted from the last figure in Column (4) so that Column (4) always reflects the total fish weight in the pond. Column (7) may be used for notations of importance such as average size fish (total fish weight divided by the total number of fingerlings), treatments for parasites or disease, or explanations for losses. Totals of columns (2) and (5) are made for use on other forms for calculations of conversion ratios and production.
If an estimate of fish weight in the pond determined by sampling indicates feed conversion is lower or higher than previously estimated, an entry should be made in the "Remarks" column (Column 7) that an adjustment has been made. Subtract or add to the "Total Fish Weight" column (Column 4) the appropriate poundage of fish and adjust conversion rates accordingly.
Pond # Size Acres
Date Stocked
Weight Fingerlings
Number Fingerlings
Total Stocked Weight
Est. Conv. Ration: Total Col. 1 Col. 2 Col. 3 Col. 4 Col. 5 Col. 6 Col. 7
Week Ended Lb Feed Fed Lb Gain
Total Fish Weight
Lb Harvested or Lost
Price Received Per lb
Remarks (treatments, feed, etc.)
Total
Weekly Pond Record
13
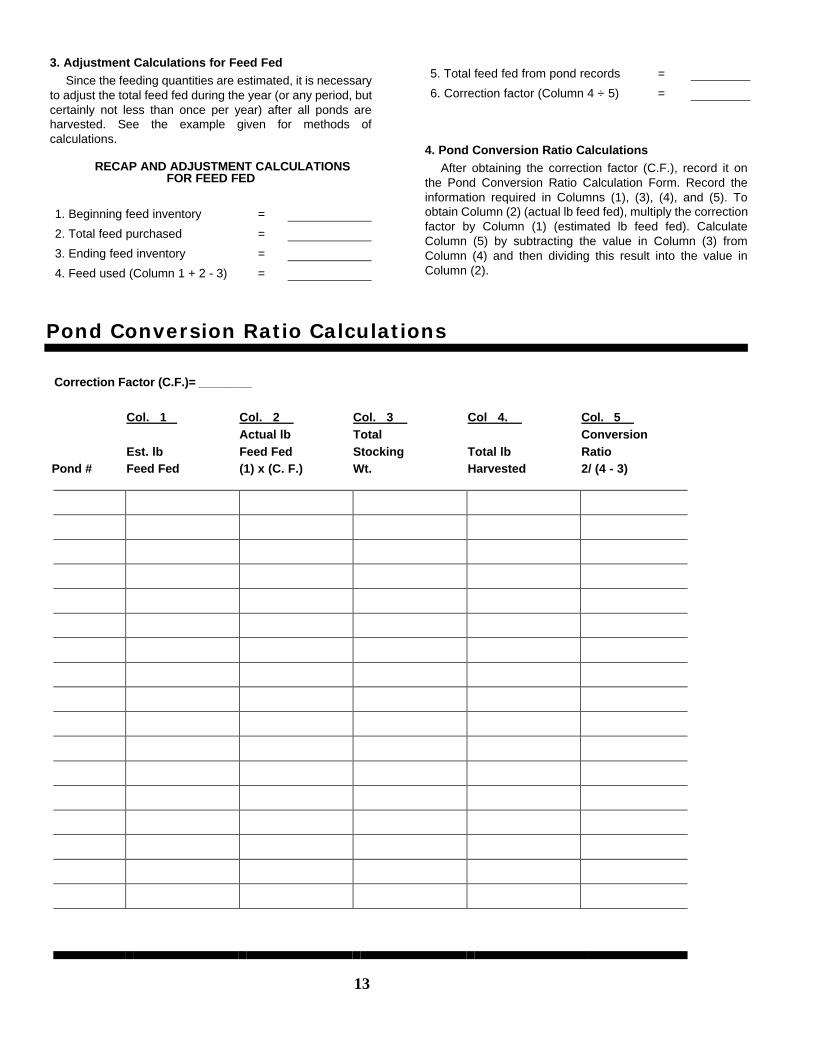
3. Adjustment Calculations for Feed Fed Since the feeding quantities are estimated, it is necessary
to adjust the total feed fed during the year (or any period, but certainly not less than once per year) after all ponds are harvested. See the example given for methods of calculations.
RECAP AND ADJUSTMENT CALCULATIONS
FOR FEED FED
1. Beginning feed inventory =
2. Total feed purchased =
3. Ending feed inventory =
4. Feed used (Column 1 + 2 - 3) =
4. Pond Conversion Ratio Calculations After obtaining the correction factor (C.F.), record it on
the Pond Conversion Ratio Calculation Form. Record the information required in Columns (1), (3), (4), and (5). To obtain Column (2) (actual lb feed fed), multiply the correction factor by Column (1) (estimated lb feed fed). Calculate Column (5) by subtracting the value in Column (3) from Column (4) and then dividing this result into the value in Column (2).
5. Total feed fed from pond records =
6. Correction factor (Column 4 ÷ 5) =
Col. 1 Col. 2 Col. 3 Col 4. Col. 5 Actual lb Total Conversion Est. lb Feed Fed Stocking Total lb Ratio Pond # Feed Fed (1) x (C. F.) Wt. Harvested 2/ (4 - 3)
Pond Conversion Ratio Calculations
Correction Factor (C.F.)= ________
Water duality Maintaining good water quality in production ponds is
absolutely essential. Failure to do so will result, at best, in poor growth and high feed conversions or, at worst, a total loss of all fish in the pond. Remember that the fish in the pond are living in their own wastes. Thus, the weight of fish that can be produced in a pond is limited by the ability of that pond to provide adequate oxygen, not only to keep the fish alive but to enable them to metabolize their food and grow, and to break down nitrogenous wastes.
To achieve production rates in excess of 2,500 pounds per acre per year, the farmer must be able to insure that good water quality is maintained 24 hours a day, 365 days a year.
Water is the universal solvent; is essential for all life; does not exist in pure state under natural conditions; and is relatively stable both chemically and physically. A fish farmer should be aware of the physical and chemical properties of water:
Physical Properties
• Water is most dense at 39.5ºF (4ºC). Water colder or warmer than 39.5ºF (4ºC) is lighter. If it were not for this fact, water would freeze from the bottom up, thus no aquatic life could exist in temperate and arctic areas.
• Water changes temperature more slowly than the surrounding air or soil changes temperature.
• In still water, differences in temperature cause a layering effect known as stratification. Upper layers are warm and bottom layers are cool in summer. The reverse is true in the winter.
• Considerable force is required to break down stratification if temperature differences are great.
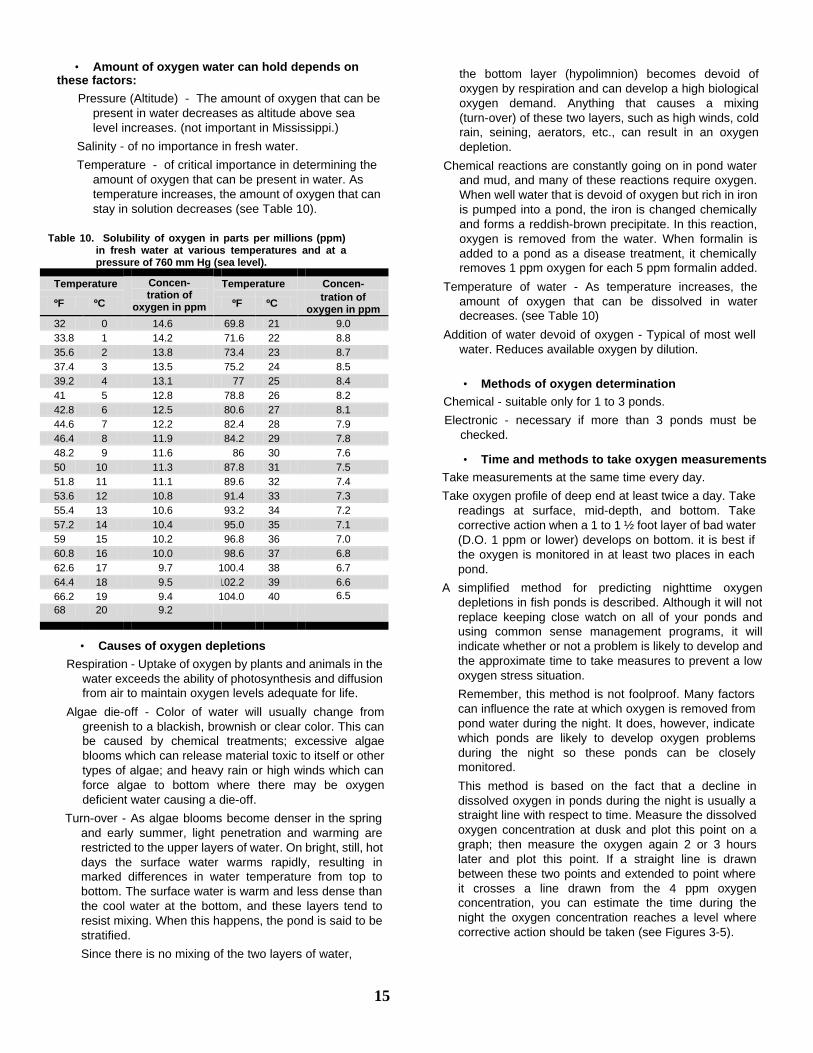
Oxygen
Oxygen is necessary for all life to make available energy contained in food. The atmosphere is 21-23 percent oxygen at sea level.
• Source of oxygen in water. Oxygen dissolves in water and occurs as a simple solution. It does not combine chemically with water.
Diffusion - of minor importance. The rate at which oxygen diffuses into water is governed by physical laws which relate to the solubility of gases. Rate of diffusion can be increased by agitation which allows more contact of surface water with air.
Photosynthesis - the single most important source of oxygen in pond water. All green plants manufacture food by a process called photosynthesis. Plants use nutrients (N, P, K, etc.), carbon dioxide (C02), water (H20), and energy from sunlight to make their food. A waste product of this process is oxygen which is given off and is dissolved in the water.
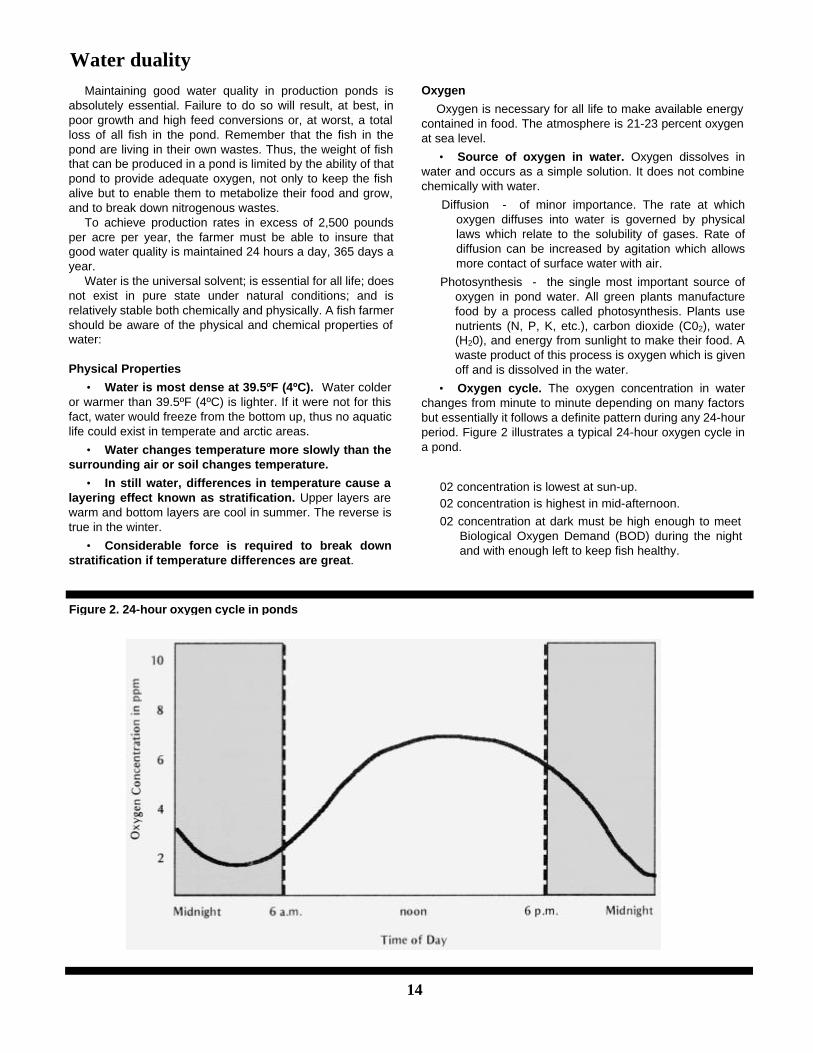
• Oxygen cycle. The oxygen concentration in water changes from minute to minute depending on many factors but essentially it follows a definite pattern during any 24-hour period. Figure 2 illustrates a typical 24-hour oxygen cycle in a pond.
02 concentration is lowest at sun-up. 02 concentration is highest in mid-afternoon.
02 concentration at dark must be high enough to meet Biological Oxygen Demand (BOD) during the night and with enough left to keep fish healthy.
Figure 2. 24-hour oxygen cycle in ponds
14
• Amount of oxygen water can hold depends on these factors:
Pressure (Altitude) - The amount of oxygen that can be present in water decreases as altitude above sea level increases. (not important in Mississippi.)
Salinity - of no importance in fresh water.
Temperature - of critical importance in determining the amount of oxygen that can be present in water. As temperature increases, the amount of oxygen that can stay in solution decreases (see Table 10).
the bottom layer (hypolimnion) becomes devoid of oxygen by respiration and can develop a high biological oxygen demand. Anything that causes a mixing (turn-over) of these two layers, such as high winds, cold rain, seining, aerators, etc., can result in an oxygen depletion.
Chemical reactions are constantly going on in pond water and mud, and many of these reactions require oxygen. When well water that is devoid of oxygen but rich in iron is pumped into a pond, the iron is changed chemically and forms a reddish-brown precipitate. In this reaction, oxygen is removed from the water. When formalin is added to a pond as a disease treatment, it chemically removes 1 ppm oxygen for each 5 ppm formalin added.
Temperature of water - As temperature increases, the amount of oxygen that can be dissolved in water decreases. (see Table 10)
Addition of water devoid of oxygen - Typical of most well water. Reduces available oxygen by dilution.
• Methods of oxygen determination
Chemical - suitable only for 1 to 3 ponds.
Electronic - necessary if more than 3 ponds must be checked.
• Time and methods to take oxygen measurements Take measurements at the same time every day.
Take oxygen profile of deep end at least twice a day. Take readings at surface, mid-depth, and bottom. Take corrective action when a 1 to 1 ½ foot layer of bad water (D.O. 1 ppm or lower) develops on bottom. it is best if the oxygen is monitored in at least two places in each pond.
A simplified method for predicting nighttime oxygen depletions in fish ponds is described. Although it will not replace keeping close watch on all of your ponds and using common sense management programs, it will indicate whether or not a problem is likely to develop and the approximate time to take measures to prevent a low oxygen stress situation.
Remember, this method is not foolproof. Many factors can influence the rate at which oxygen is removed from pond water during the night. It does, however, indicate which ponds are likely to develop oxygen problems during the night so these ponds can be closely monitored.
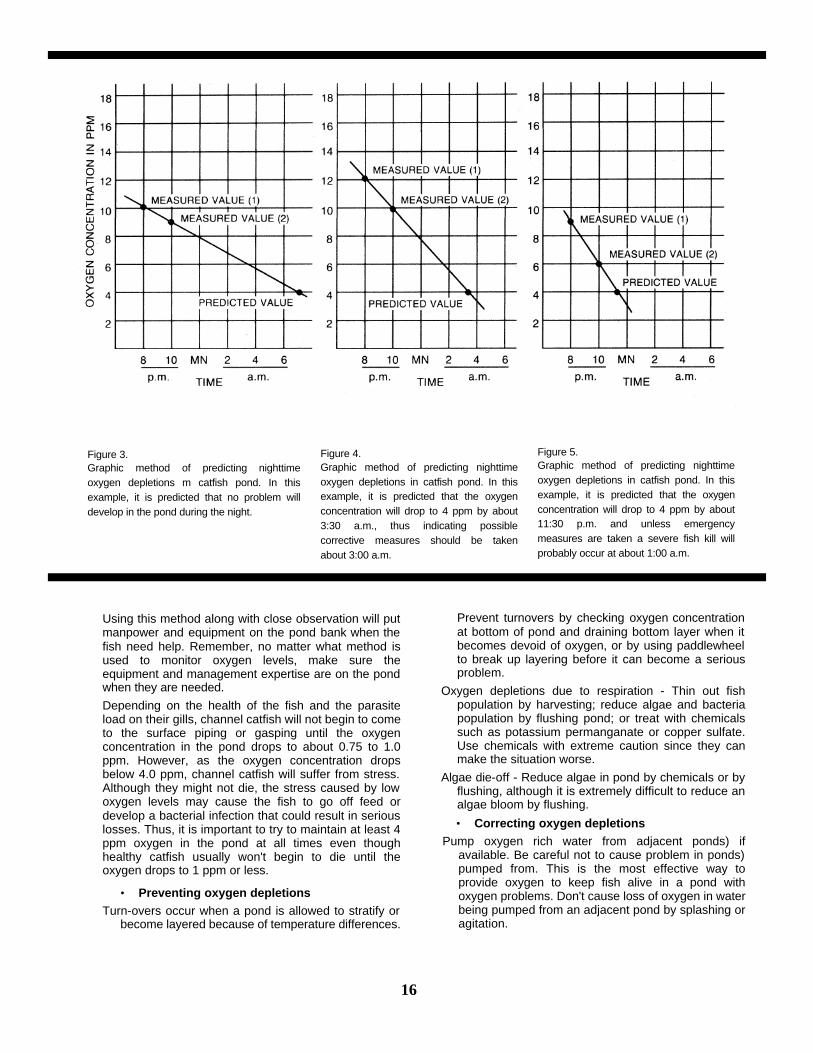
This method is based on the fact that a decline in dissolved oxygen in ponds during the night is usually a straight line with respect to time. Measure the dissolved oxygen concentration at dusk and plot this point on a graph; then measure the oxygen again 2 or 3 hours later and plot this point. If a straight line is drawn between these two points and extended to point where it crosses a line drawn from the 4 ppm oxygen concentration, you can estimate the time during the night the oxygen concentration reaches a level where corrective action should be taken (see Figures 3-5).
15
• Causes of oxygen depletions
Respiration - Uptake of oxygen by plants and animals in the water exceeds the ability of photosynthesis and diffusion from air to maintain oxygen levels adequate for life.
Algae die-off - Color of water will usually change from greenish to a blackish, brownish or clear color. This can be caused by chemical treatments; excessive algae blooms which can release material toxic to itself or other types of algae; and heavy rain or high winds which can force algae to bottom where there may be oxygen deficient water causing a die-off.
Turn-over - As algae blooms become denser in the spring and early summer, light penetration and warming are restricted to the upper layers of water. On bright, still, hot days the surface water warms rapidly, resulting in marked differences in water temperature from top to bottom. The surface water is warm and less dense than the cool water at the bottom, and these layers tend to resist mixing. When this happens, the pond is said to be stratified.
Since there is no mixing of the two layers of water,
Table 10. Solubility of oxygen in parts per millions (ppm) in fresh water at various temperatures and at a pressure of 760 mm Hg (sea level).
Temperature Temperature Concen-
ºF ºC
Concen-tration of
oxygen in ppm ºF ºC tration of oxygen in ppm
32 0 14.6 69.8 21 9.0 33.8 1 14.2 71.6 22 8.8 35.6 2 13.8 73.4 23 8.7 37.4 3 13.5 75.2 24 8.5 39.2 4 13.1 77 25 8.4 41 5 12.8 78.8 26 8.2 42.8 6 12.5 80.6 27 8.1 44.6 7 12.2 82.4 28 7.9 46.4 8 11.9 84.2 29 7.8 48.2 9 11.6 86 30 7.6 50 10 11.3 87.8 31 7.5 51.8 11 11.1 89.6 32 7.4 53.6 12 10.8 91.4 33 7.3 55.4 13 10.6 93.2 34 7.2 57.2 14 10.4 95.0 35 7.1 59 15 10.2 96.8 36 7.0 60.8 16 10.0 98.6 37 6.8 62.6 17 9.7 100.4 38 6.7 64.4 18 9.5 102.2 39 6.6 66.2 19 9.4 104.0 40 6.5 68 20 9.2
16
Figure 4. Graphic method of predicting nighttime oxygen depletions in catfish pond. In this example, it is predicted that the oxygen concentration will drop to 4 ppm by about 3:30 a.m., thus indicating possible corrective measures should be taken about 3:00 a.m.
Figure 3. Graphic method of predicting nighttime oxygen depletions m catfish pond. In this example, it is predicted that no problem will develop in the pond during the night.
Figure 5. Graphic method of predicting nighttime oxygen depletions in catfish pond. In this example, it is predicted that the oxygen concentration will drop to 4 ppm by about 11:30 p.m. and unless emergency measures are taken a severe fish kill will probably occur at about 1:00 a.m.
Using this method along with close observation will put manpower and equipment on the pond bank when the fish need help. Remember, no matter what method is used to monitor oxygen levels, make sure the equipment and management expertise are on the pond when they are needed.
Depending on the health of the fish and the parasite load on their gills, channel catfish will not begin to come to the surface piping or gasping until the oxygen concentration in the pond drops to about 0.75 to 1.0 ppm. However, as the oxygen concentration drops below 4.0 ppm, channel catfish will suffer from stress. Although they might not die, the stress caused by low oxygen levels may cause the fish to go off feed or develop a bacterial infection that could result in serious losses. Thus, it is important to try to maintain at least 4 ppm oxygen in the pond at all times even though healthy catfish usually won't begin to die until the oxygen drops to 1 ppm or less.
• Preventing oxygen depletions Turn-overs occur when a pond is allowed to stratify or
become layered because of temperature differences.
Prevent turnovers by checking oxygen concentration at bottom of pond and draining bottom layer when it becomes devoid of oxygen, or by using paddlewheel to break up layering before it can become a serious problem.
Oxygen depletions due to respiration - Thin out fish population by harvesting; reduce algae and bacteria population by flushing pond; or treat with chemicals such as potassium permanganate or copper sulfate. Use chemicals with extreme caution since they can make the situation worse.
Algae die-off - Reduce algae in pond by chemicals or by flushing, although it is extremely difficult to reduce an algae bloom by flushing.
• Correcting oxygen depletions Pump oxygen rich water from adjacent ponds) if
available. Be careful not to cause problem in ponds) pumped from. This is the most effective way to provide oxygen to keep fish alive in a pond with oxygen problems. Don't cause loss of oxygen in water being pumped from an adjacent pond by splashing or agitation.
Paddlewheel Aerators - There are many different designs but until recently there has only been limited research to indicate which is most effective at adding oxygen to the water and most economical in terms of cost per pound of oxygen added. Research at the Mississippi State University Delta Branch Experiment Station has shown that a paddlewheel with a 20-inch drum is more cost efficient than one with a 4-inch drum.
Depth at which the paddlewheel is placed is also very important. Increasing paddlewheel depth from 4 to 14 inches tripled the oxygen transfer rate but only increased fuel consumption by about ½ gallon per hour (see "For Fish Farmers," No. 83-2, dated April 29, 1983).
The number of paddlewheels to use and the site in the pond where they should be located depends on the situation.
Crisifulli or relift pumps - most effective if discharge end is capped and the sides slotted to allow aeration of water.
Well water usually has no oxygen and must be sprayed to aerate when being added to pond.
Positioning of aeration equipment in a pond is critical. Place equipment in area where the oxygen concentration is highest. Be sure the fish are in this area and not trapped in another area of the pond. Also, be careful not to strand the fish by removing the aeration device before the oxygen is high enough to support them.
pH
pH is a numerical expression of the acidity or alkalinity of a substance or the relationship between hydrogen (H+)
and hydroxyl (OH-) ions. The scientific definition of pH is that it is the negative logarithm of the hydrogen ion concentration.
• pH values always fall between 0 and 14 on the pH scale.
• At pH 7.0 the number of H+ and OH- ions are equal and the solution is neutral.
• Values below pH 7.0 denote increasing acidity (H+ ions). Values above pH 7.0 denote increasing alkalinity (OH- ions).
• Each one unit change in pH represents a 10 fold change in the H+ ion concentration.
• pH values for a given body of water reflect complex interactions between various types of plants, amount of photosynthesis taking place, basic chemical composition of the water supply, and respiration of the living organisms present.
• pH 4 and pH 11 are the acid and alkaline death points of fish.
• Optimum pH range for fish culture is about 6.5 to 9.0.
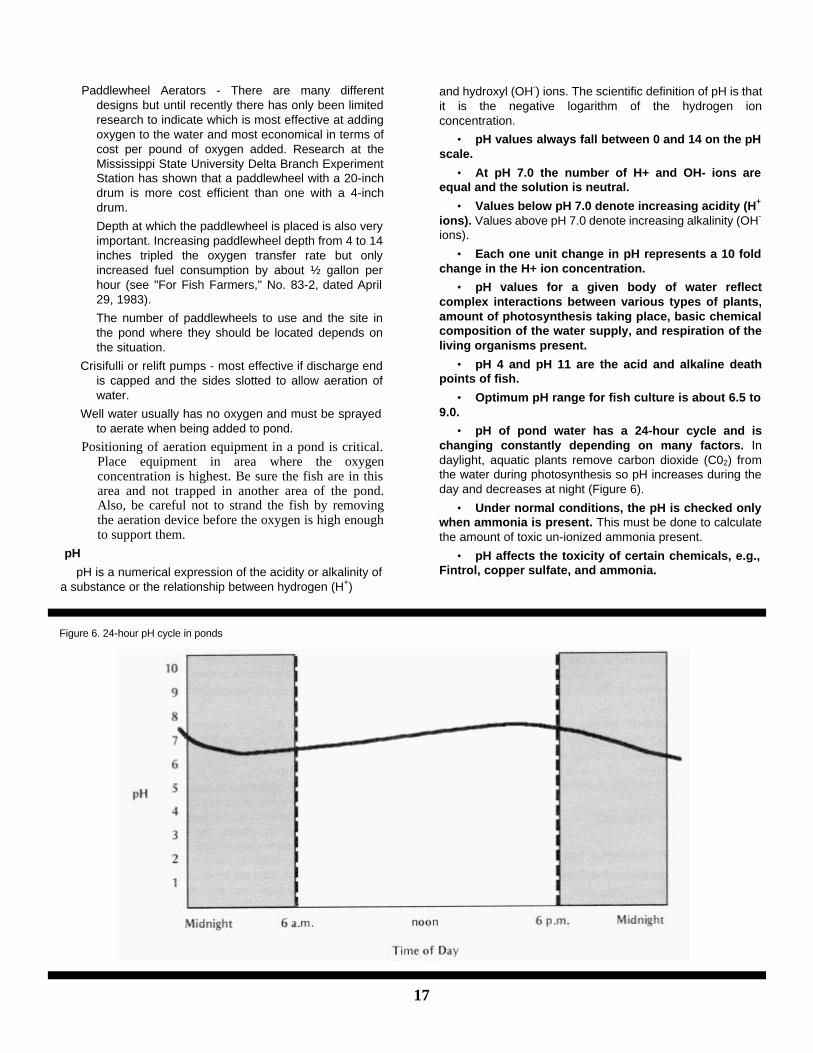
• pH of pond water has a 24-hour cycle and is changing constantly depending on many factors. In daylight, aquatic plants remove carbon dioxide (C02) from the water during photosynthesis so pH increases during the day and decreases at night (Figure 6).
• Under normal conditions, the pH is checked only when ammonia is present. This must be done to calculate the amount of toxic un-ionized ammonia present.
• pH affects the toxicity of certain chemicals, e.g., Fintrol, copper sulfate, and ammonia.
Figure 6. 24-hour pH cycle in ponds
17
Ammonia Ammonia is present in water in two forms, ionized and
un-ionized. The Total Ammonia Nitrogen (TAN) concentration in pond water is the sum of the ionized plus un-ionized ammonia present (NH4 + NH3 = TAN). Nitrogen (N), a major component of protein, is necessary for all life forms. Ammonia gets into a pond in several ways, but the main source is feed. Effective removal of ammonia from the pond depends primarily on biological processes.
• Ionized ammonia (NH+) is non-toxic to fish.
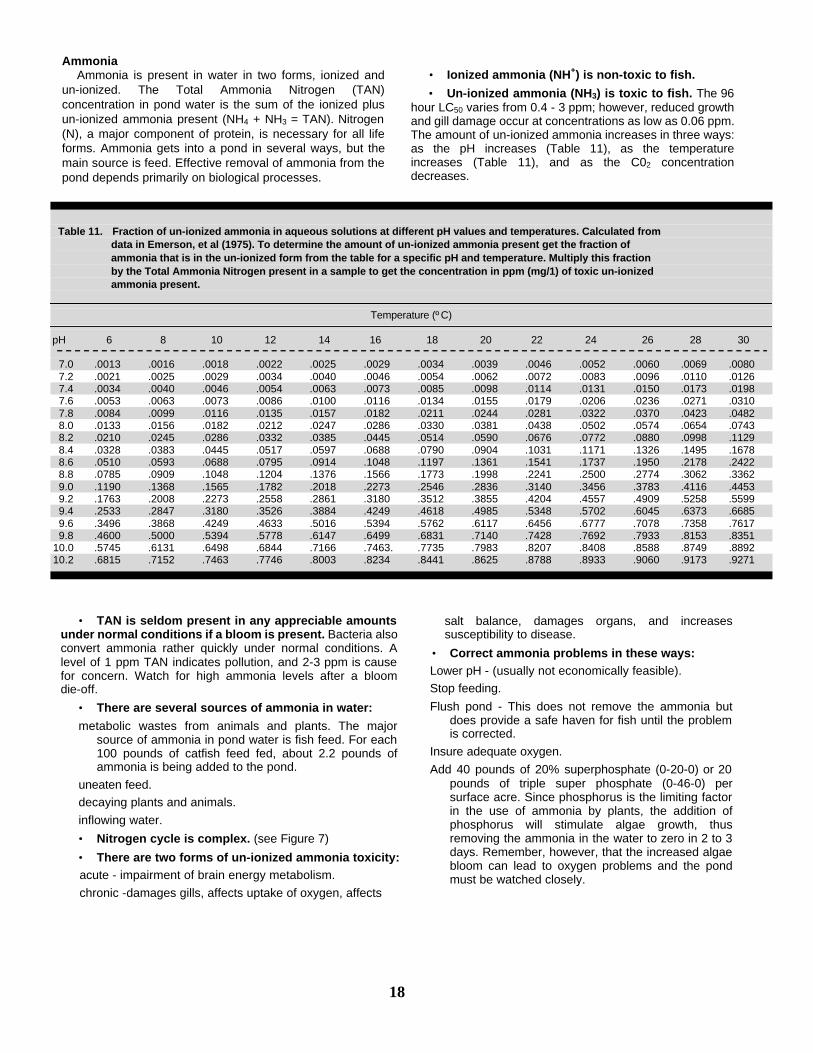
• Un-ionized ammonia (NH3) is toxic to fish. The 96 hour LC50 varies from 0.4 - 3 ppm; however, reduced growth and gill damage occur at concentrations as low as 0.06 ppm. The amount of un-ionized ammonia increases in three ways: as the pH increases (Table 11), as the temperature increases (Table 11), and as the C02 concentration decreases.
Table 11. Fraction of un-ionized ammonia in aqueous solutions at different pH values and temperatures. Calculated from data in Emerson, et al (1975). To determine the amount of un-ionized ammonia present get the fraction of ammonia that is in the un-ionized form from the table for a specific pH and temperature. Multiply this fraction by the Total Ammonia Nitrogen present in a sample to get the concentration in ppm (mg/1) of toxic un-ionized ammonia present.
Temperature (º C)
pH 6 8 10 12 14 16 18 20 22 24 26 28 30
7.0 .0013 .0016 .0018 .0022 .0025 .0029 .0034 .0039 .0046 .0052 .0060 .0069 .0080 7.2 .0021 .0025 .0029 .0034 .0040 .0046 .0054 .0062 .0072 .0083 .0096 .0110 .0126 7.4 .0034 .0040 .0046 .0054 .0063 .0073 .0085 .0098 .0114 .0131 .0150 .0173 .0198 7.6 .0053 .0063 .0073 .0086 .0100 .0116 .0134 .0155 .0179 .0206 .0236 .0271 .0310 7.8 .0084 .0099 .0116 .0135 .0157 .0182 .0211 .0244 .0281 .0322 .0370 .0423 .0482 8.0 .0133 .0156 .0182 .0212 .0247 .0286 .0330 .0381 .0438 .0502 .0574 .0654 .0743 8.2 .0210 .0245 .0286 .0332 .0385 .0445 .0514 .0590 .0676 .0772 .0880 .0998 .1129 8.4 .0328 .0383 .0445 .0517 .0597 .0688 .0790 .0904 .1031 .1171 .1326 .1495 .1678 8.6 .0510 .0593 .0688 .0795 .0914 .1048 .1197 .1361 .1541 .1737 .1950 .2178 .2422 8.8 .0785 .0909 .1048 .1204 .1376 .1566 .1773 .1998 .2241 .2500 .2774 .3062 .3362 9.0 .1190 .1368 .1565 .1782 .2018 .2273 .2546 .2836 .3140 .3456 .3783 .4116 .4453 9.2 .1763 .2008 .2273 .2558 .2861 .3180 .3512 .3855 .4204 .4557 .4909 .5258 .5599 9.4 .2533 .2847 .3180 .3526 .3884 .4249 .4618 .4985 .5348 .5702 .6045 .6373 .6685 9.6 .3496 .3868 .4249 .4633 .5016 .5394 .5762 .6117 .6456 .6777 .7078 .7358 .7617 9.8 .4600 .5000 .5394 .5778 .6147 .6499 .6831 .7140 .7428 .7692 .7933 .8153 .8351 10.0 .5745 .6131 .6498 .6844 .7166 .7463. .7735 .7983 .8207 .8408 .8588 .8749 .8892 10.2 .6815 .7152 .7463 .7746 .8003 .8234 .8441 .8625 .8788 .8933 .9060 .9173 .9271
• TAN is seldom present in any appreciable amounts under normal conditions if a bloom is present. Bacteria also convert ammonia rather quickly under normal conditions. A level of 1 ppm TAN indicates pollution, and 2-3 ppm is cause for concern. Watch for high ammonia levels after a bloom die-off.
• There are several sources of ammonia in water:
metabolic wastes from animals and plants. The major source of ammonia in pond water is fish feed. For each 100 pounds of catfish feed fed, about 2.2 pounds of ammonia is being added to the pond.
uneaten feed.
decaying plants and animals.
inflowing water.
• Nitrogen cycle is complex. (see Figure 7)
• There are two forms of un-ionized ammonia toxicity: acute - impairment of brain energy metabolism.
chronic -damages gills, affects uptake of oxygen, affects
18
salt balance, damages organs, and increases susceptibility to disease.
• Correct ammonia problems in these ways: Lower pH - (usually not economically feasible).
Stop feeding.
Flush pond - This does not remove the ammonia but does provide a safe haven for fish until the problem is corrected.
Insure adequate oxygen.
Add 40 pounds of 20% superphosphate (0-20-0) or 20 pounds of triple super phosphate (0-46-0) per surface acre. Since phosphorus is the limiting factor in the use of ammonia by plants, the addition of phosphorus will stimulate algae growth, thus removing the ammonia in the water to zero in 2 to 3 days. Remember, however, that the increased algae bloom can lead to oxygen problems and the pond must be watched closely.
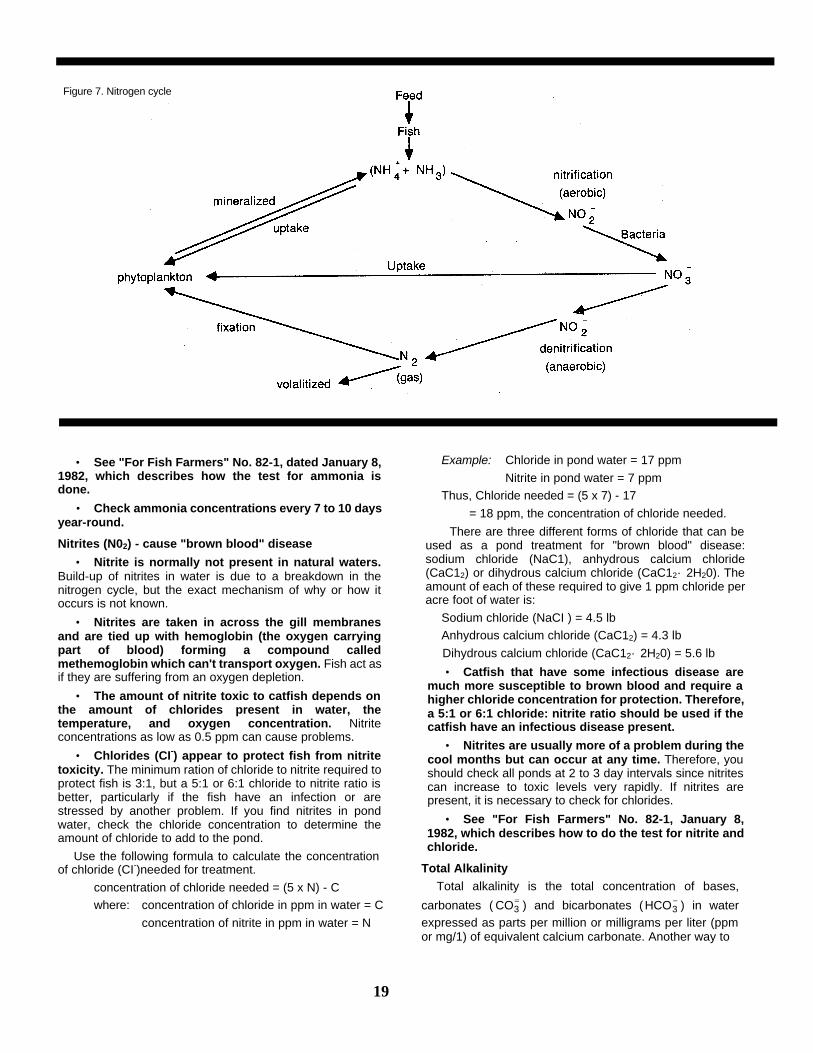
Figure 7. Nitrogen cycle
Example: Chloride in pond water = 17 ppm
Nitrite in pond water = 7 ppm
Thus, Chloride needed = (5 x 7) - 17
= 18 ppm, the concentration of chloride needed.
There are three different forms of chloride that can be used as a pond treatment for "brown blood" disease: sodium chloride (NaC1), anhydrous calcium chloride (CaC12) or dihydrous calcium chloride (CaC12· 2H20). The amount of each of these required to give 1 ppm chloride per acre foot of water is:
Sodium chloride (NaCI ) = 4.5 lb
Anhydrous calcium chloride (CaC12) = 4.3 lb
Dihydrous calcium chloride (CaC12· 2H20) = 5.6 lb
• Catfish that have some infectious disease are much more susceptible to brown blood and require a higher chloride concentration for protection. Therefore, a 5:1 or 6:1 chloride: nitrite ratio should be used if the catfish have an infectious disease present.
• Nitrites are usually more of a problem during the cool months but can occur at any time. Therefore, you should check all ponds at 2 to 3 day intervals since nitrites can increase to toxic levels very rapidly. If nitrites are present, it is necessary to check for chlorides.
• See "For Fish Farmers" No. 82-1, January 8, 1982, which describes how to do the test for nitrite and chloride.
Total Alkalinity Total alkalinity is the total concentration of bases,
carbonates ( =3CO ) and bicarbonates ( −
3HCO ) in water expressed as parts per million or milligrams per liter (ppm or mg/1) of equivalent calcium carbonate. Another way to
• See "For Fish Farmers" No. 82-1, dated January 8, 1982, which describes how the test for ammonia is done.
• Check ammonia concentrations every 7 to 10 days year-round.
Nitrites (N02) - cause "brown blood" disease
• Nitrite is normally not present in natural waters. Build-up of nitrites in water is due to a breakdown in the nitrogen cycle, but the exact mechanism of why or how it occurs is not known.
• Nitrites are taken in across the gill membranes and are tied up with hemoglobin (the oxygen carrying part of blood) forming a compound called methemoglobin which can't transport oxygen. Fish act as if they are suffering from an oxygen depletion.
• The amount of nitrite toxic to catfish depends on the amount of chlorides present in water, the temperature, and oxygen concentration. Nitrite concentrations as low as 0.5 ppm can cause problems.
• Chlorides (CI-) appear to protect fish from nitrite toxicity. The minimum ration of chloride to nitrite required to protect fish is 3:1, but a 5:1 or 6:1 chloride to nitrite ratio is better, particularly if the fish have an infection or are stressed by another problem. If you find nitrites in pond water, check the chloride concentration to determine the amount of chloride to add to the pond.
Use the following formula to calculate the concentration of chloride (CI-)needed for treatment.
concentration of chloride needed = (5 x N) - C
where: concentration of chloride in ppm in water = C
concentration of nitrite in ppm in water = N
19
think of alkalinity is in terms of resistance to pH change; the amount of acid required to cause a specific change in pH in a given volume increases as total alkalinity increases. In other words, it is a measure of the buffering capacity of water.
• Desirable range is from 20 to 300 ppm (mg/1).
• The most productive water has a total alkalinity and total hardness of about the same value. Waters which have greatly different values can be very difficult to manage.
• Total alkalinity affects the toxicity of copper sulfate and must be checked before treating with copper sulfate. The total alkalinity divided by 100 will give the concentration of copper sulfate in ppm (mg/1) that can safely be used. If the total alkalinity is less than 50 ppm, do not use copper sulfate without first doing a bioassay.
Total Hardness Total hardness is a measure of the total concentration of
divalent metal ions, usually calcium (Ca+) and magnesium (Mg+), in water and is expressed in ppm (mg/1) of equivalent calcium carbonate.
• Desirable range is from 20 to 300 ppm (mg/1).
• Concentrations less than 20 ppm (mg/1) may cause problems in hatcheries but can be corrected usually by adding calcium in the form of agriculture lime (CaC03) or calcium chloride (CaCl2).
• Water with a total hardness higher than 300 ppm (mg/1) can cause some management problems, but there is no practical way to reduce total hardness to desirable levels.
Fish Diseases
Disease can be defined in many terms, but perhaps the easiest is that disease is any process than can cause a fish discomfort and can lead to death. Diseases can be broken down into two broad categories, infectious and noninfectious.
Infectious - (diseases caused by a living organism)
• Parasite. An organism that lives in or on another at the expense of its host is a parasite. There are many different kinds of parasites, both internal and external, ranging from the very small (8/25,000 inch = 8 microns) to some that are 5-6 inches long. Most problems are caused by protozoans (single-cell animals) that live on the gills.
• Bacteria. There are many different kinds that can cause serious losses of catfish. Most are internal, although a few occur on the skin and gills. Specialized laboratory techniques are necessary for their isolation and identification. Most are about 3/25,000 inch long (3 microns), though some may be 10-12 microns long.
• Fungi. Fungi are a specific group of plants that lack chlorophyll and are mainly secondary invaders of fish. Usually they can grow only on dead organic matter. Therefore, fungal infections indicate there is something else wrong with the fish.
• Viruses. Submicroscopic particles that live within the cells of living organisms are called viruses. Sophisticated laboratory techniques are required for diagnosis. Their location makes them almost impossible to treat with chemicals or drugs.
Non-infectious - (diseases caused by other than living organisms)
• Nutritional. Caused by too much or too little food or nutrients.
• Environmental. Oxygen depletions, gas bubble disease, toxic algae, brown blood disease, ammonia, etc. The environment changes so rapidly or to such a degree that the fish are not able to adjust to the changes.
• Physiological. A change in blood pH of 0.2 pH point due to overexertion, feeding in relation to time of harvest, or a malfunction of the organ systems.
• Chemcial toxicants. Pesticides, overtreatment.
Symptoms or Clinical Signs of Disease Appearance or actions can indicate the fish is not normal.
Usually the first indication that fish may be sick is a reduction in feeding activity. It is, therefore, very important that the person feeding the fish be an experienced fish culturist to detect any change in feeding behavior. Any unusual behavior or abnormal physical appearance should be a "red flag" that something is wrong and should be checked immediately. Failure to do so could result in the loss of some or all of the fish in the pond.
• Physical - external and internal. You must know what a normal fish looks like to be able to tell if abnormalities are present. Here are some abnormalities to look for:
sores discolored areas bloody spots, external and internal frayed fins popeye (exophthalmia) curved backbone swollen belly pale internal organs
• Behavior. You must know how normal fish acts. Here are some abnormal behavior patterns to look for:
listless
reduced or no feeding (anorexia)
piping or gasping (anoxia)
flashing or scratching
convulsions or erratic behavior in shallow water
grouping around in- or outflowing water
death
20
OHHCOOHCO
COHHCO
HHCOCOOH
323
33
322
+⇔+
+⇔
+⇔+
−=
=+−
+−
Stress
Stress is the inability of fish to adapt to change. There are several causes of stress:
• Dissolved oxygen. Minimum of 4 ppm; maximum not to exceed 150 percent saturation for 4-6 hours.
• Water temperature. Minimum 33ºF (0.6ºC), maximum 120ºF (48.9ºC). Don't exceed a rapid 10ºF (5.6ºC) increase or decrease.
Temperature dependence of diseases -- Each disease organism has an optimum growth temperature.
Temperature dependence of host immune system Effective response is impaired by temperatures that are too high or too low.
Temperature regulation of chemical toxicity
• pH. Minimum 4.5, maximum 10.5. Also affects toxicity of natural and synthetic toxicants. Natural toxic materials, such as ammonia, increase or decrease in their toxicity to fish depending on pH of the water. In the case of ammonia, it becomes more toxic at a high pH and less toxic at a low pH. Many synthetic toxins become more or less toxic as the pH changes. Copper sulfate is more toxic at a low pH than at a high pH.
• Nutrition vitamins
essential amino acids
excess or lack of protein, fat or carbohydrates minerals
• Improper feeding practices during low
oxygen feeding prior to transport
time of day
• Handling rough handling
holding too long in confinement
• Chemical toxicants improper dosage used in treatment
improper chemicals used in treatment
improper application of chemical treatment
accidental application of agricultural chemicals
chemical residue in soil or feed
• Poor water quality increase in number of disease organisms
reduced ability of fish to resist infection
Disease Treatments Before treating any fish, consider the following questions
and decide whether or not treatment is warranted:
1. What is the prognosis? Is the disease treatable, and what is the possibility of a successful treatment?
2. Is it feasible to treat the fish where they are, considering
the cost, handling, prognosis, etc.
3. Is it worthwhile to treat, or will the cost of treating
exceed the value of the fish?
4. Can the fish withstand the treatment considering their
condition?
5. Does the loss rate and the disease present warrant treat-
ment?
Before any treatment is started, know the following four factors:
• Know your water. Know the volume of water of the holding or rearing unit to be treated before you apply any treatment.
• Know your fish. Fish of different species and ages will react differently to the same drug or chemical.
• Know your chemical. Know the toxicity of the chemical to the particular species of fish to be treated. The effect of water chemistry on the toxicity of the chemical should also be known.
• Know the disease. Although this factor appears to be self-evident, it is one which is widely disregarded, much to the regret of many fish farmers.
Methods of Treatment
Various methods of treatment and drug application have been used to control fish diseases.
• Dip. A strong solution of a chemical is used for a relatively short time. This method can be dangerous because the solutions used are concentrated. The difference between an effective dose and a killing one is usually very slight.
Fish are usually placed in a net and dipped into a strong solution of the chemical for a short time, usually 15 to 45 seconds, depending on the type of chemical, the concentration, and the species of fish being treated.
• Flush. This method is fairly simple and consists of adding a stock solution of a chemical to the upper end of the unit to be treated, then allowing it to flush through the unit. An adequate water flow must be available so the chemical can be flushed through the unit or system in a short period of time. This method cannot be used in ponds.
• Prolonged. There are two types of prolonged treatments: a short term, or bath, and an indefinite prolonged treatment.
Bath - the required amount of chemical or drug is added directly to the rearing or holding unit and left for a specified time, usually one hour. The chemical or drug is then quickly flushed with fresh water. Several precautions must be observed with this treatment to prevent serious losses. Although a treatment time of one hour may be recommended, always observe the fish during the treatment period. At the first sign of distress add fresh water quickly. Install aerators of some type in the unit being treated to insure an adequate oxygen supply for the fish. Use extreme caution to insure that the chemical is evenly distributed throughout the unit to prevent the occurrence of a "hot spot" of the chemical. Adjust the temperature of the water to prevent temperature shock when water is changed.
21
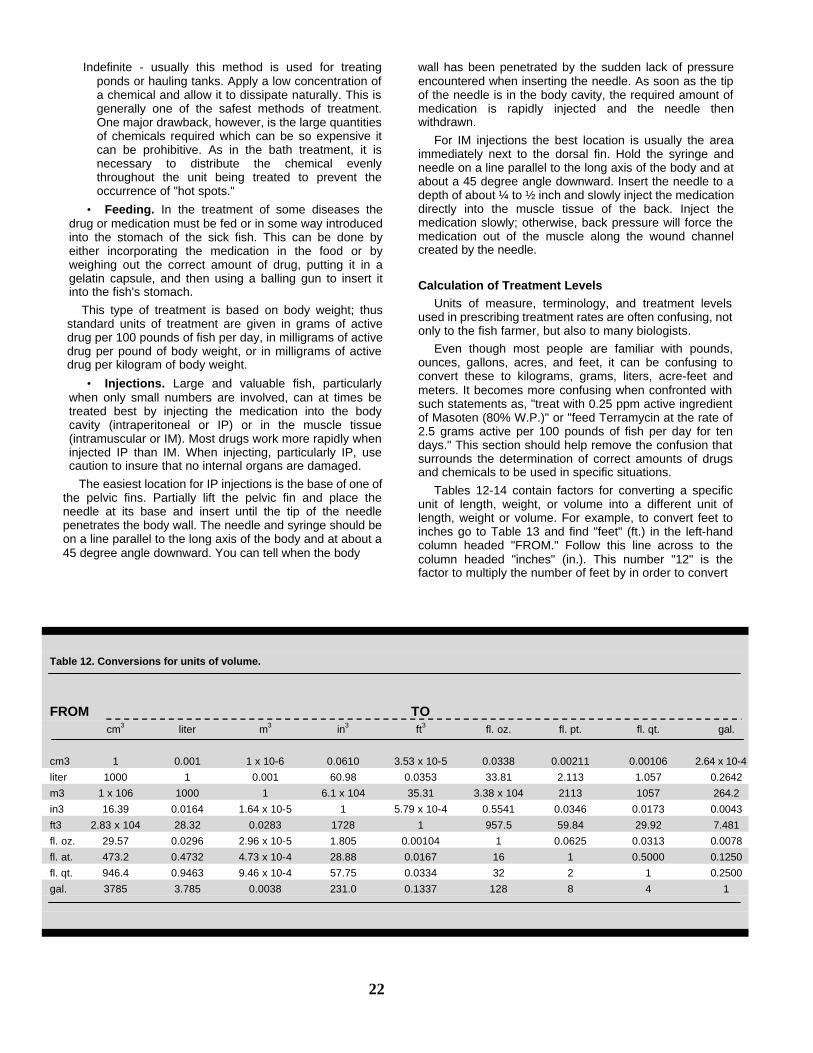
Indefinite - usually this method is used for treating ponds or hauling tanks. Apply a low concentration of a chemical and allow it to dissipate naturally. This is generally one of the safest methods of treatment. One major drawback, however, is the large quantities of chemicals required which can be so expensive it can be prohibitive. As in the bath treatment, it is necessary to distribute the chemical evenly throughout the unit being treated to prevent the occurrence of "hot spots."
• Feeding. In the treatment of some diseases the drug or medication must be fed or in some way introduced into the stomach of the sick fish. This can be done by either incorporating the medication in the food or by weighing out the correct amount of drug, putting it in a gelatin capsule, and then using a balling gun to insert it into the fish's stomach.
This type of treatment is based on body weight; thus standard units of treatment are given in grams of active drug per 100 pounds of fish per day, in milligrams of active drug per pound of body weight, or in milligrams of active drug per kilogram of body weight.
• Injections. Large and valuable fish, particularly when only small numbers are involved, can at times be treated best by injecting the medication into the body cavity (intraperitoneal or IP) or in the muscle tissue (intramuscular or IM). Most drugs work more rapidly when injected IP than IM. When injecting, particularly IP, use caution to insure that no internal organs are damaged.
The easiest location for IP injections is the base of one of the pelvic fins. Partially lift the pelvic fin and place the needle at its base and insert until the tip of the needle penetrates the body wall. The needle and syringe should be on a line parallel to the long axis of the body and at about a 45 degree angle downward. You can tell when the body
wall has been penetrated by the sudden lack of pressure encountered when inserting the needle. As soon as the tip of the needle is in the body cavity, the required amount of medication is rapidly injected and the needle then withdrawn.
For IM injections the best location is usually the area immediately next to the dorsal fin. Hold the syringe and needle on a line parallel to the long axis of the body and at about a 45 degree angle downward. Insert the needle to a depth of about ¼ to ½ inch and slowly inject the medication directly into the muscle tissue of the back. Inject the medication slowly; otherwise, back pressure will force the medication out of the muscle along the wound channel created by the needle.
Calculation of Treatment Levels Units of measure, terminology, and treatment levels
used in prescribing treatment rates are often confusing, not only to the fish farmer, but also to many biologists.
Even though most people are familiar with pounds, ounces, gallons, acres, and feet, it can be confusing to convert these to kilograms, grams, liters, acre-feet and meters. It becomes more confusing when confronted with such statements as, "treat with 0.25 ppm active ingredient of Masoten (80% W.P.)" or "feed Terramycin at the rate of 2.5 grams active per 100 pounds of fish per day for ten days." This section should help remove the confusion that surrounds the determination of correct amounts of drugs and chemicals to be used in specific situations.
Tables 12-14 contain factors for converting a specific unit of length, weight, or volume into a different unit of length, weight or volume. For example, to convert feet to inches go to Table 13 and find "feet" (ft.) in the left-hand column headed "FROM." Follow this line across to the column headed "inches" (in.). This number "12" is the factor to multiply the number of feet by in order to convert
Table 12. Conversions for units of volume.
FROM TO cm3 liter m3 in3 ft3 fl. oz. fl. pt. fl. qt. gal.
cm3 1 0.001 1 x 10⁻⁶ 0.0610 3.53 x 10⁻⁵ 0.0338 0.00211 0.00106 2.64 x 10⁻⁴
liter 1000 1 0.001 60.98 0.0353 33.81 2.113 1.057 0.2642
m3 1 x 10⁶ 1000 1 6.1 x 10⁴ 35.31 3.38 x 10⁴ 2113 1057 264.2
in3 16.39 0.0164 1.64 x 10⁻⁵ 1 5.79 x 10⁻⁴ 0.5541 0.0346 0.0173 0.0043
ft3 2.83 x 10⁴ 28.32 0.0283 1728 1 957.5 59.84 29.92 7.481
fl. oz. 29.57 0.0296 2.96 x 10⁻⁵ 1.805 0.00104 1 0.0625 0.0313 0.0078
fl. at. 473.2 0.4732 4.73 x 10⁻⁴ 28.88 0.0167 16 1 0.5000 0.1250
fl. qt. 946.4 0.9463 9.46 x 10⁻⁴ 57.75 0.0334 32 2 1 0.2500
gal. 3785 3.785 0.0038 231.0 0.1337 128 8 4 1
22
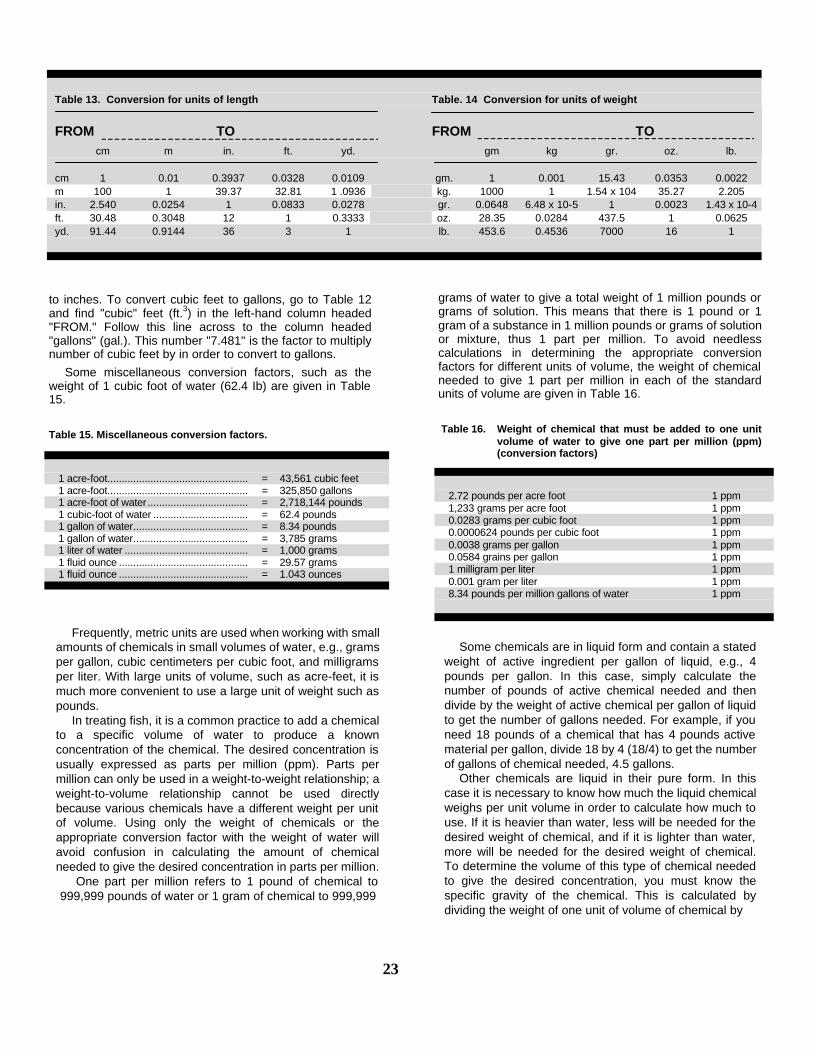
Table 13. Conversion for units of length Table. 14 Conversion for units of weight
FROM TO FROM TO cm m in. ft. yd. gm kg gr. oz. lb. cm 1 0.01 0.3937 0.0328 0.0109 gm. 1 0.001 15.43 0.0353 0.0022 m 100 1 39.37 32.81 1 .0936 kg. 1000 1 1.54 x 10⁴ 35.27 2.205 in. 2.540 0.0254 1 0.0833 0.0278 gr. 0.0648 6.48 x 10⁻⁵ 1 0.0023 1.43 x 10⁻⁴ ft. 30.48 0.3048 12 1 0.3333 oz. 28.35 0.0284 437.5 1 0.0625 yd. 91.44 0.9144 36 3 1 lb. 453.6 0.4536 7000 16 1
to inches. To convert cubic feet to gallons, go to Table 12 and find "cubic" feet (ft.3) in the left-hand column headed "FROM." Follow this line across to the column headed "gallons" (gal.). This number "7.481" is the factor to multiply number of cubic feet by in order to convert to gallons.
Some miscellaneous conversion factors, such as the weight of 1 cubic foot of water (62.4 Ib) are given in Table 15.
Table 15. Miscellaneous conversion factors.
grams of water to give a total weight of 1 million pounds or grams of solution. This means that there is 1 pound or 1 gram of a substance in 1 million pounds or grams of solution or mixture, thus 1 part per million. To avoid needless calculations in determining the appropriate conversion factors for different units of volume, the weight of chemical needed to give 1 part per million in each of the standard units of volume are given in Table 16.
Table 16. Weight of chemical that must be added to one unit
volume of water to give one part per million (ppm) (conversion factors)
2.72 pounds per acre foot 1 ppm 1,233 grams per acre foot 1 ppm 0.0283 grams per cubic foot 1 ppm 0.0000624 pounds per cubic foot 1 ppm 0.0038 grams per gallon 1 ppm 0.0584 grains per gallon 1 ppm 1 milligram per liter 1 ppm 0.001 gram per liter 1 ppm 8.34 pounds per million gallons of water 1 ppm
Frequently, metric units are used when working with small amounts of chemicals in small volumes of water, e.g., grams per gallon, cubic centimeters per cubic foot, and milligrams per liter. With large units of volume, such as acre-feet, it is much more convenient to use a large unit of weight such as pounds.
In treating fish, it is a common practice to add a chemical to a specific volume of water to produce a known concentration of the chemical. The desired concentration is usually expressed as parts per million (ppm). Parts per million can only be used in a weight-to-weight relationship; a weight-to-volume relationship cannot be used directly because various chemicals have a different weight per unit of volume. Using only the weight of chemicals or the appropriate conversion factor with the weight of water will avoid confusion in calculating the amount of chemical needed to give the desired concentration in parts per million.
One part per million refers to 1 pound of chemical to 999,999 pounds of water or 1 gram of chemical to 999,999
Some chemicals are in liquid form and contain a stated weight of active ingredient per gallon of liquid, e.g., 4 pounds per gallon. In this case, simply calculate the number of pounds of active chemical needed and then divide by the weight of active chemical per gallon of liquid to get the number of gallons needed. For example, if you need 18 pounds of a chemical that has 4 pounds active material per gallon, divide 18 by 4 (18/4) to get the number of gallons of chemical needed, 4.5 gallons.
Other chemicals are liquid in their pure form. In this case it is necessary to know how much the liquid chemical weighs per unit volume in order to calculate how much to use. If it is heavier than water, less will be needed for the desired weight of chemical, and if it is lighter than water, more will be needed for the desired weight of chemical. To determine the volume of this type of chemical needed to give the desired concentration, you must know the specific gravity of the chemical. This is calculated by dividing the weight of one unit of volume of chemical by
1 acre-foot................................................. = 43,561 cubic feet 1 acre-foot................................................. = 325,850 gallons 1 acre-foot of water ................................... = 2,718,144 pounds 1 cubic-foot of water ................................. = 62.4 pounds 1 gallon of water........................................ = 8.34 pounds 1 gallon of water........................................ = 3,785 grams 1 liter of water ........................................... = 1,000 grams 1 fluid ounce ............................................. = 29.57 grams 1 fluid ounce ............................................. = 1.043 ounces
23
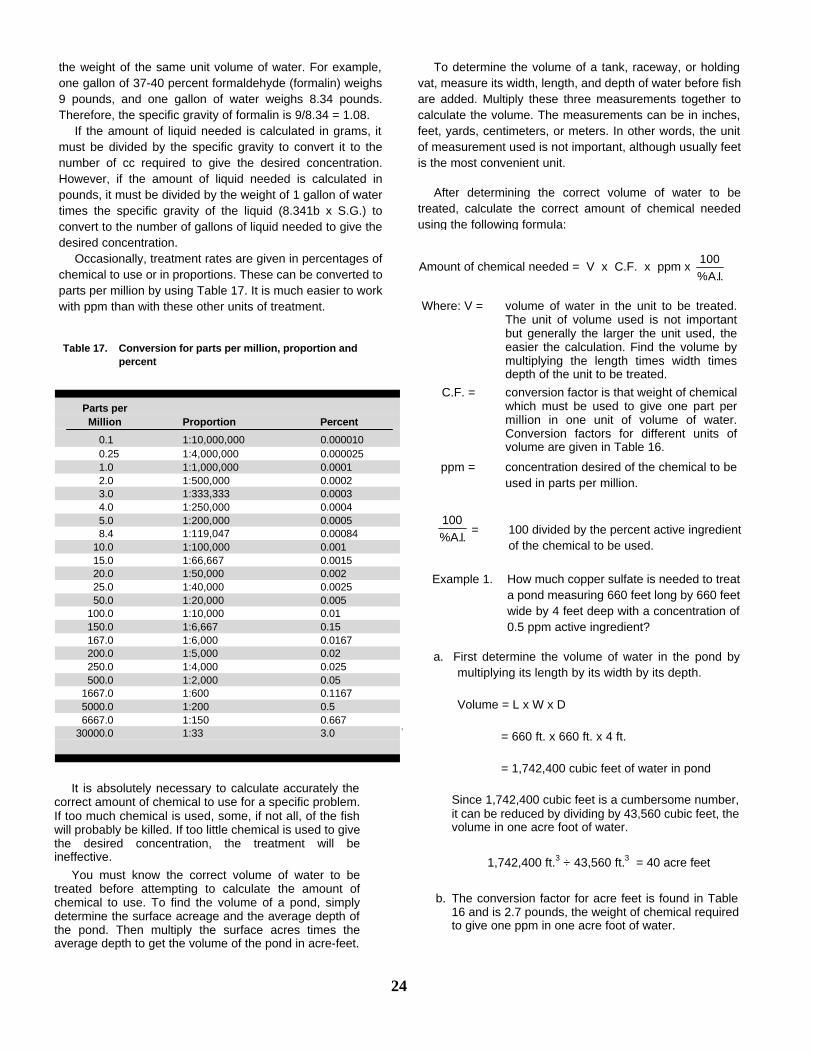
.I.A%100
the weight of the same unit volume of water. For example, one gallon of 37-40 percent formaldehyde (formalin) weighs 9 pounds, and one gallon of water weighs 8.34 pounds. Therefore, the specific gravity of formalin is 9/8.34 = 1.08.
If the amount of liquid needed is calculated in grams, it must be divided by the specific gravity to convert it to the number of cc required to give the desired concentration. However, if the amount of liquid needed is calculated in pounds, it must be divided by the weight of 1 gallon of water times the specific gravity of the liquid (8.341b x S.G.) to convert to the number of gallons of liquid needed to give the desired concentration.
Occasionally, treatment rates are given in percentages of chemical to use or in proportions. These can be converted to parts per million by using Table 17. It is much easier to work with ppm than with these other units of treatment. Table 17. Conversion for parts per million, proportion and
percent
Parts per Million Proportion Percent
0.1 1:10,000,000 0.000010 0.25 1:4,000,000 0.000025 1.0 1:1,000,000 0.0001 2.0 1:500,000 0.0002 3.0 1:333,333 0.0003 4.0 1:250,000 0.0004 5.0 1:200,000 0.0005 8.4 1:119,047 0.00084 10.0 1:100,000 0.001 15.0 1:66,667 0.0015 20.0 1:50,000 0.002 25.0 1:40,000 0.0025 50.0 1:20,000 0.005 100.0 1:10,000 0.01 150.0 1:6,667 0.15 167.0 1:6,000 0.0167 200.0 1:5,000 0.02 250.0 1:4,000 0.025 500.0 1:2,000 0.05 1667.0 1:600 0.1167 5000.0 1:200 0.5 6667.0 1:150 0.667 30000.0 1:33 3.0
It is absolutely necessary to calculate accurately the correct amount of chemical to use for a specific problem. If too much chemical is used, some, if not all, of the fish will probably be killed. If too little chemical is used to give the desired concentration, the treatment will be ineffective.
You must know the correct volume of water to be treated before attempting to calculate the amount of chemical to use. To find the volume of a pond, simply determine the surface acreage and the average depth of the pond. Then multiply the surface acres times the average depth to get the volume of the pond in acre-feet.
24
To determine the volume of a tank, raceway, or holding vat, measure its width, length, and depth of water before fish are added. Multiply these three measurements together to calculate the volume. The measurements can be in inches, feet, yards, centimeters, or meters. In other words, the unit of measurement used is not important, although usually feet is the most convenient unit.
After determining the correct volume of water to be treated, calculate the correct amount of chemical needed using the following formula:
Amount of chemical needed = V x C.F. x ppm x .I.A%
100
Where: V = volume of water in the unit to be treated. The unit of volume used is not important but generally the larger the unit used, the easier the calculation. Find the volume by multiplying the length times width times depth of the unit to be treated.
C.F. = conversion factor is that weight of chemical which must be used to give one part per million in one unit of volume of water. Conversion factors for different units of volume are given in Table 16.
ppm = concentration desired of the chemical to be used in parts per million.
= 100 divided by the percent active ingredient of the chemical to be used.
Example 1. How much copper sulfate is needed to treat a pond measuring 660 feet long by 660 feet wide by 4 feet deep with a concentration of 0.5 ppm active ingredient?
a. First determine the volume of water in the pond by
multiplying its length by its width by its depth.
Volume = L x W x D = 660 ft. x 660 ft. x 4 ft. = 1,742,400 cubic feet of water in pond
Since 1,742,400 cubic feet is a cumbersome number, it can be reduced by dividing by 43,560 cubic feet, the volume in one acre foot of water.
1,742,400 ft.3 ÷ 43,560 ft.3 = 40 acre feet
b. The conversion factor for acre feet is found in Table 16 and is 2.7 pounds, the weight of chemical required to give one ppm in one acre foot of water.
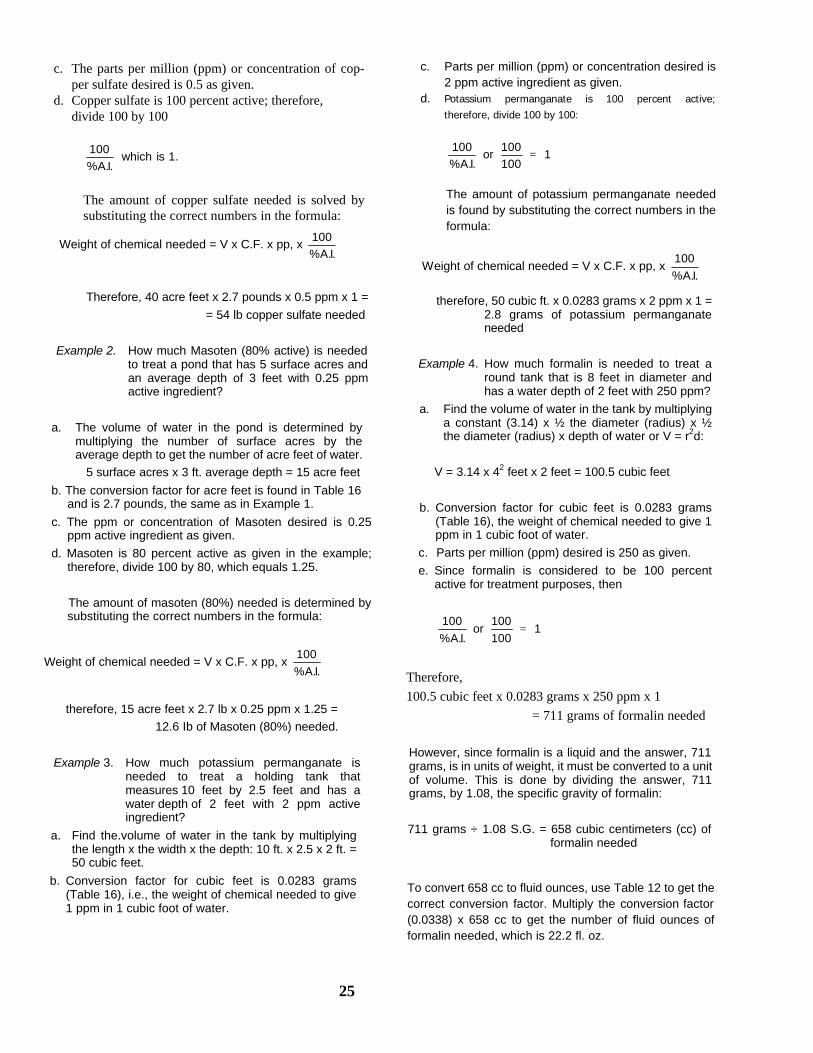
c. The parts per million (ppm) or concentration of cop-per sulfate desired is 0.5 as given.
d. Copper sulfate is 100 percent active; therefore, divide 100 by 100
.1iswhich.I.A%
100
The amount of copper sulfate needed is solved by substituting the correct numbers in the formula:
Weight of chemical needed = V x C.F. x pp, x .I.A%
100
Therefore, 40 acre feet x 2.7 pounds x 0.5 ppm x 1 =
= 54 lb copper sulfate needed
Example 2. How much Masoten (80% active) is needed to treat a pond that has 5 surface acres and an average depth of 3 feet with 0.25 ppm active ingredient?
a. The volume of water in the pond is determined by multiplying the number of surface acres by the average depth to get the number of acre feet of water.
5 surface acres x 3 ft. average depth = 15 acre feet
b. The conversion factor for acre feet is found in Table 16 and is 2.7 pounds, the same as in Example 1.
c. The ppm or concentration of Masoten desired is 0.25 ppm active ingredient as given.
d. Masoten is 80 percent active as given in the example; therefore, divide 100 by 80, which equals 1.25.
The amount of masoten (80%) needed is determined by substituting the correct numbers in the formula:
Weight of chemical needed = V x C.F. x pp, x .I.A%
100
therefore, 15 acre feet x 2.7 lb x 0.25 ppm x 1.25 =
12.6 Ib of Masoten (80%) needed.
Example 3. How much potassium permanganate is needed to treat a holding tank that measures 10 feet by 2.5 feet and has a water depth of 2 feet with 2 ppm active ingredient?
a. Find the.volume of water in the tank by multiplying the length x the width x the depth: 10 ft. x 2.5 x 2 ft. = 50 cubic feet.
b. Conversion factor for cubic feet is 0.0283 grams (Table 16), i.e., the weight of chemical needed to give 1 ppm in 1 cubic foot of water.
c. Parts per million (ppm) or concentration desired is 2 ppm active ingredient as given.
d. Potassium permanganate is 100 percent active;
therefore, divide 100 by 100:
1100100
or.I.A%
100=
The amount of potassium permanganate needed is found by substituting the correct numbers in the formula:
Weight of chemical needed = V x C.F. x pp, x .I.A%
100
therefore, 50 cubic ft. x 0.0283 grams x 2 ppm x 1 = 2.8 grams of potassium permanganate needed
Example 4. How much formalin is needed to treat a round tank that is 8 feet in diameter and has a water depth of 2 feet with 250 ppm?
a. Find the volume of water in the tank by multiplying a constant (3.14) x ½ the diameter (radius) x ½ the diameter (radius) x depth of water or V = r2d:
V = 3.14 x 42 feet x 2 feet = 100.5 cubic feet
b. Conversion factor for cubic feet is 0.0283 grams (Table 16), the weight of chemical needed to give 1 ppm in 1 cubic foot of water.
c. Parts per million (ppm) desired is 250 as given.
e. Since formalin is considered to be 100 percent active for treatment purposes, then
1100
100or
.I.A%
100=
Therefore,
100.5 cubic feet x 0.0283 grams x 250 ppm x 1
= 711 grams of formalin needed
However, since formalin is a liquid and the answer, 711 grams, is in units of weight, it must be converted to a unit of volume. This is done by dividing the answer, 711 grams, by 1.08, the specific gravity of formalin:
711 grams ÷ 1.08 S.G. = 658 cubic centimeters (cc) of formalin needed
To convert 658 cc to fluid ounces, use Table 12 to get the correct conversion factor. Multiply the conversion factor (0.0338) x 658 cc to get the number of fluid ounces of formalin needed, which is 22.2 fl. oz.
25
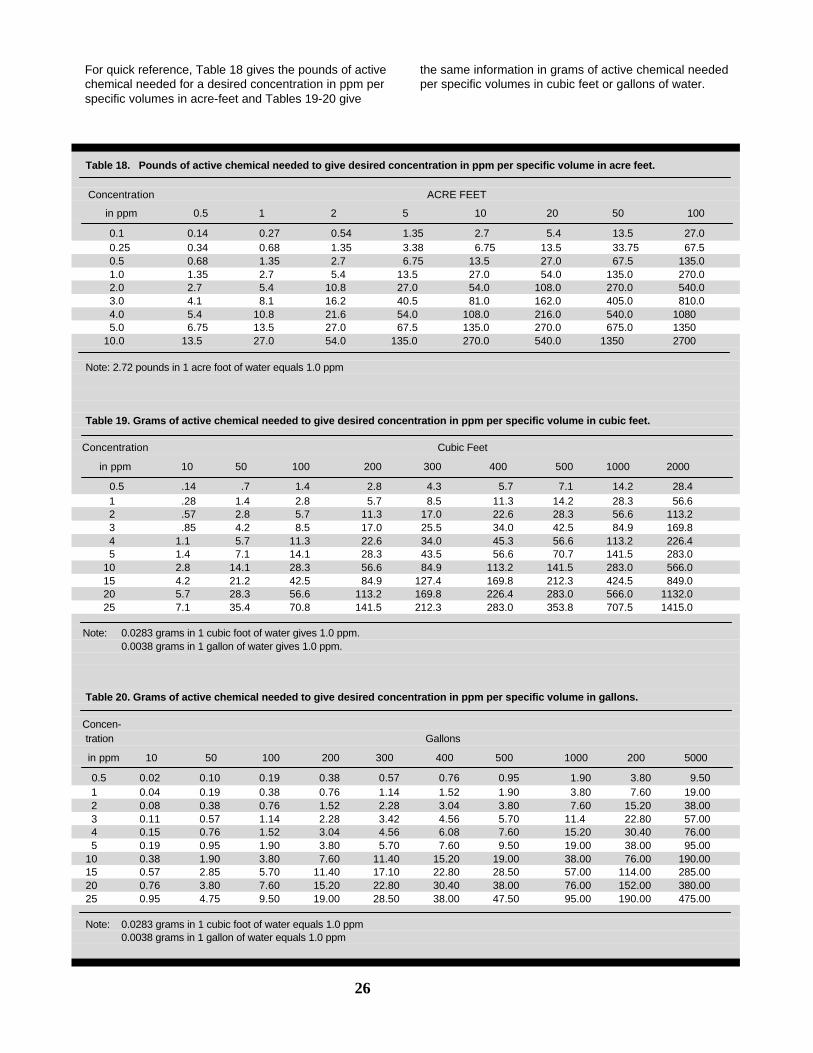
For quick reference, Table 18 gives the pounds of active the same information in grams of active chemical needed chemical needed for a desired concentration in ppm per per specific volumes in cubic feet or gallons of water. specific volumes in acre-feet and Tables 19-20 give
Table 18. Pounds of active chemical needed to give desired concentration in ppm per specific volume in acre feet. Concentration ACRE FEET
in ppm 0.5 1 2 5 10 20 50 100
0.1 0.14 0.27 0.54 1.35 2.7 5.4 13.5 27.0 0.25 0.34 0.68 1.35 3.38 6.75 13.5 33.75 67.5 0.5 0.68 1.35 2.7 6.75 13.5 27.0 67.5 135.0 1.0 1.35 2.7 5.4 13.5 27.0 54.0 135.0 270.0 2.0 2.7 5.4 10.8 27.0 54.0 108.0 270.0 540.0 3.0 4.1 8.1 16.2 40.5 81.0 162.0 405.0 810.0 4.0 5.4 10.8 21.6 54.0 108.0 216.0 540.0 1080 5.0 6.75 13.5 27.0 67.5 135.0 270.0 675.0 1350 10.0 13.5 27.0 54.0 135.0 270.0 540.0 1350 2700 Note: 2.72 pounds in 1 acre foot of water equals 1.0 ppm Table 19. Grams of active chemical needed to give desired concentration in ppm per specific volume in cubic feet. Concentration Cubic Feet
in ppm 10 50 100 200 300 400 500 1000 2000
0.5 .14 .7 1.4 2.8 4.3 5.7 7.1 14.2 28.4 1 .28 1.4 2.8 5.7 8.5 11.3 14.2 28.3 56.6 2 .57 2.8 5.7 11.3 17.0 22.6 28.3 56.6 113.2 3 .85 4.2 8.5 17.0 25.5 34.0 42.5 84.9 169.8 4 1.1 5.7 11.3 22.6 34.0 45.3 56.6 113.2 226.4 5 1.4 7.1 14.1 28.3 43.5 56.6 70.7 141.5 283.0 10 2.8 14.1 28.3 56.6 84.9 113.2 141.5 283.0 566.0 15 4.2 21.2 42.5 84.9 127.4 169.8 212.3 424.5 849.0 20 5.7 28.3 56.6 113.2 169.8 226.4 283.0 566.0 1132.0 25 7.1 35.4 70.8 141.5 212.3 283.0 353.8 707.5 1415.0 Note: 0.0283 grams in 1 cubic foot of water gives 1.0 ppm.
0.0038 grams in 1 gallon of water gives 1.0 ppm. Table 20. Grams of active chemical needed to give desired concentration in ppm per specific volume in gallons. Concen- tration Gallons
in ppm 10 50 100 200 300 400 500 1000 200 5000
0.5 0.02 0.10 0.19 0.38 0.57 0.76 0.95 1.90 3.80 9.50 1 0.04 0.19 0.38 0.76 1.14 1.52 1.90 3.80 7.60 19.00 2 0.08 0.38 0.76 1.52 2.28 3.04 3.80 7.60 15.20 38.00 3 0.11 0.57 1.14 2.28 3.42 4.56 5.70 11.4 22.80 57.00 4 0.15 0.76 1.52 3.04 4.56 6.08 7.60 15.20 30.40 76.00 5 0.19 0.95 1.90 3.80 5.70 7.60 9.50 19.00 38.00 95.00 10 0.38 1.90 3.80 7.60 11.40 15.20 19.00 38.00 76.00 190.00 15 0.57 2.85 5.70 11.40 17.10 22.80 28.50 57.00 114.00 285.00 20 0.76 3.80 7.60 15.20 22.80 30.40 38.00 76.00 152.00 380.00 25 0.95 4.75 9.50 19.00 28.50 38.00 47.50 95.00 190.00 475.00 Note: 0.0283 grams in 1 cubic foot of water equals 1.0 ppm 0.0038 grams in 1 gallon of water equals 1.0 ppm
26
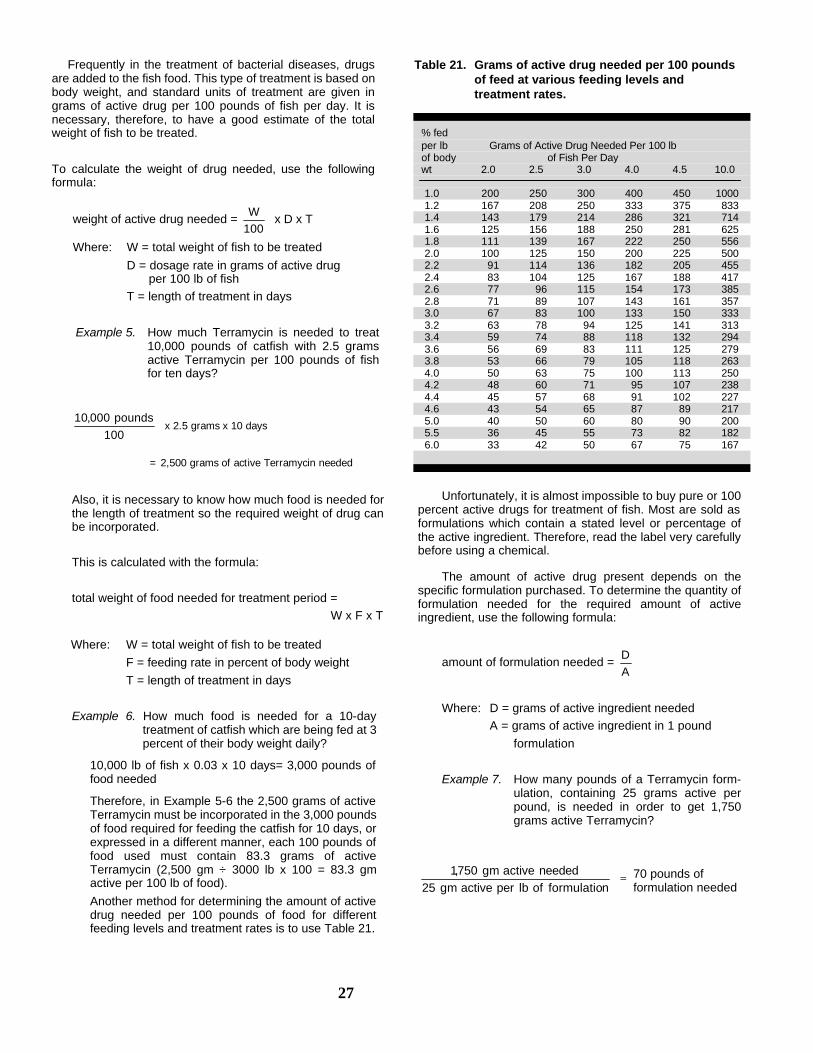
Frequently in the treatment of bacterial diseases, drugs are added to the fish food. This type of treatment is based on body weight, and standard units of treatment are given in grams of active drug per 100 pounds of fish per day. It is necessary, therefore, to have a good estimate of the total weight of fish to be treated.
To calculate the weight of drug needed, use the following formula:
weight of active drug needed = 100W
x D x T
Where: W = total weight of fish to be treated
D = dosage rate in grams of active drug per 100 lb of fish
T = length of treatment in days
Example 5. How much Terramycin is needed to treat 10,000 pounds of catfish with 2.5 grams active Terramycin per 100 pounds of fish for ten days?
100
pounds000,10 x 2.5 grams x 10 days
= 2,500 grams of active Terramycin needed
Also, it is necessary to know how much food is needed for the length of treatment so the required weight of drug can be incorporated.
This is calculated with the formula:
total weight of food needed for treatment period =
W x F x T
Where: W = total weight of fish to be treated
F = feeding rate in percent of body weight
T = length of treatment in days
Example 6. How much food is needed for a 10-day treatment of catfish which are being fed at 3 percent of their body weight daily?
10,000 lb of fish x 0.03 x 10 days= 3,000 pounds of food needed
Therefore, in Example 5-6 the 2,500 grams of active Terramycin must be incorporated in the 3,000 pounds of food required for feeding the catfish for 10 days, or expressed in a different manner, each 100 pounds of food used must contain 83.3 grams of active Terramycin (2,500 gm ÷ 3000 lb x 100 = 83.3 gm active per 100 lb of food).
Another method for determining the amount of active drug needed per 100 pounds of food for different feeding levels and treatment rates is to use Table 21.
Table 21. Grams of active drug needed per 100 pounds of feed at various feeding levels and treatment rates.
% fed per lb Grams of Active Drug Needed Per 100 lb of body of Fish Per Day wt 2.0 2.5 3.0 4.0 4.5 10.0 1.0 200 250 300 400 450 1000 1.2 167 208 250 333 375 833 1.4 143 179 214 286 321 714 1.6 125 156 188 250 281 625 1.8 111 139 167 222 250 556 2.0 100 125 150 200 225 500 2.2 91 114 136 182 205 455 2.4 83 104 125 167 188 417 2.6 77 96 115 154 173 385 2.8 71 89 107 143 161 357 3.0 67 83 100 133 150 333 3.2 63 78 94 125 141 313 3.4 59 74 88 118 132 294 3.6 56 69 83 111 125 279 3.8 53 66 79 105 118 263 4.0 50 63 75 100 113 250 4.2 48 60 71 95 107 238 4.4 45 57 68 91 102 227 4.6 43 54 65 87 89 217 5.0 40 50 60 80 90 200 5.5 36 45 55 73 82 182 6.0 33 42 50 67 75 167
Unfortunately, it is almost impossible to buy pure or 100 percent active drugs for treatment of fish. Most are sold as formulations which contain a stated level or percentage of the active ingredient. Therefore, read the label very carefully before using a chemical.
The amount of active drug present depends on the specific formulation purchased. To determine the quantity of formulation needed for the required amount of active ingredient, use the following formula:
amount of formulation needed = AD
Where: D = grams of active ingredient needed
A = grams of active ingredient in 1 pound
formulation
Example 7. How many pounds of a Terramycin form-ulation, containing 25 grams active per pound, is needed in order to get 1,750 grams active Terramycin?
70 pounds of formulation needed
27
=nformulatiooflbperactivegm25
neededactivegm750,1
Chemicals and Drugs Many different chemicals and drugs have been used in
treatment of fish diseases, but only those that have commonly been used in the culture of catfish and are economically feasible to use will be discussed.
Listing of these drugs and chemicals in no way implies our recommendation for their use, nor does it imply that they have been approved for use by the Food and Drug Administration or the Environmental Protection Agency.
It is the responsibility of the individual who treats catfish to determine if a specific drug or chemical can legally be used for the purpose intended.
• Betadine - or providone-iodine solution. Betadine has been used as a disinfectant and has potential for use on channel catfish eggs. Preliminary research indicates that a bath of 10 to 100 ppm for 10 minutes on 1 to 2 day-old egg masses is safe. Eyed or hatching eggs should not be treated because the toxicity of chemicals is usually greater at this stage of development.
• Copper sulfate. This is one of the oldest and most commonly used chemicals in fish culture and considered to be 100 percent active. It has wide applications of use in aquatic environments as an algacide and has also been widely used as an effective control for a variety of ectoparasites, mainly protozoans such as Trichodina, Costia (= lchthyoboda), Trfchophyra, Scyphidia (= Ambiphrya) and Ich.
It has one very serious drawback in that its toxicity to fish varies according to total alkalinity of water. It is most toxic in water of low alkalinity. Never use copper sulfate as an algacide or parasite treatment unless a bioassay is run to determine its toxicity to fish in the situation it is to be used in. Even where it has been used with previous success, heavy rainfall has been known to dilute water in a pond to the point that previously used concentrations of copper sulfate were no longer safe and killed a number of catfish.
Copper sulfate is generally used as treatment in ponds. As a "rule-of-thumb," the concentration to use varies with the total alkalinity. To determine the amount of copper sulfate that can be safely used, divide the total alkalinity of the water by 100. The answer is the concentration parts per million (ppm) of copper sulfate to use. If the total alkalinity of the water is less than 50 ppm, run a bioassay to determine the effective concentration needed. In water with a total alkalinity 200 ppm or greater, do not use copper sulfate since it is precipitated as copper carbonate and is ineffective.
It has also been used as a dip treatment at 500 ppm (1.9 gm per gal.) for 1 minute. Use this treatment with caution as its toxicity to fish and effectiveness in controlling ectoparasites will depend on the total alkalinity.
Copper sulfate is of little benefit in the treatment of external bacterial infections caused by myxobacteria.
• Dylox (Masoten). Dylox can be obtained in a variety of formulations although the most common is the 80 percent
wettable powder (W.P.). It is generally used as an indefinite pond treatment to control ectoparasites such as monogenetic trematodes, anchor parasites, fish lice, and leeches at the rate of 0.25 ppm active (0.84 lb of 80 percent W. P. per acre foot). One treatment will suffice for monogenetic trematodes, leeches, and fish lice, but for effective control of anchor parasites, apply Dylox at 5-7 day intervals for a total of four treatments.
Because Dylox breaks down rapidly under conditions of high water temperature and high pH, you may get inconsistent results with its use during the summer. During the summer, apply Dylox early in the morning for best results.
• Formalin - (37 percent by weight Formaldehyde gas in water). Buy formalin that contains 10-15 percent methanol. Methanol acts as a preservative to help retard formation of paraformaldehyde, which is much more toxic than formalin. Store formalin at temperatures above 40ºF (4.4ºC). On long standing, and when exposed to temperatures below 40ºF, paraformaldehyde is formed. Formalin is a clear liquid, and a white precipitate at the bottom of the container or cloudy material in suspension indicates paraformaldehyde is present. Contaminated formalin can be filtered to remove the unwanted paraformaldehyde.
Formalin is considered to be 100 percent active for the purpose of treating fish. It is effective against many ectoparasites, such as Trichodina, Costia (= lchthyoboda), Ich and monogenetic trematodes. Although it is of little value in treating external fungus or bacterial infections of fish, high concentrations (1600-2000 ppm for 15 min.) have successfully controlled fungus infections on eggs. Use caution when treating eggs at these high concentrations.
Formalin is widely used as a bath treatment at 125-250 ppm (4.4-8.8 cc per 10 gal.; 32.8-65.5 cc per 10 cu. ft.) for one hour. However, at these concentrations water temperature will affect the toxicity of formalin to fish. Above 70ºF (21.2ºC) formalin becomes more toxic and the concentration used should not exceed 167 ppm (5.9 cc per 10 gal.; 43.8 cc per 10 cu. ft.). Provide aeration during the treatment to prevent low oxygen conditions from developing. At the first sign of any stress, add fresh water to flush out the treatment.
As an indefinite treatment in ponds, tanks or acquaria, formalin is generally used at 15-25 ppm (4.5-7.5 gal. per acre ft.; 0.53-0.88 cc per 10 gal.; 3.9-6.6 cc per 10 cu. ft.). Since formalin has the property of reducing oxygen concentrations at the rate of 1 ppm for each 5 ppm formalin, use caution, particularly in summer months, to reduce the chance of an oxygen depletion in the pond or tank.
• Potassium permanganate. This is another chemical widely used in warm water fish culture. It is 100 percent active and is used to control external protozoan parasites, monogenetic trematodes, and external fungus and bacterial infections. Recommendations for its use varies from 2 ppm (5.4 lb per acre ft.) to as much as 8 ppm (21.6 lb per acre ft.) as an indefinite pond treatment. At 2 ppm it is not
28
toxic to catfish, but above this concentration, potassium permanganate can be very toxic, depending on the amount of organic matter in the water. Therefore, it is imperative that before you use a concentration higher than 2 ppm, you run a bioassay with both fish and water from the unit to be treated. In most situations, it is best to use 2 ppm although the treatment may have to be reapplied within 24 hours or less for it to be effective.
Potassium permanganate colors the water a deep winered color. Upon breaking down, the color changes to a yellowish-brown. If a color change occurs in less than 12 hours after the potassium permanganate has been applied, it is necessary to retreat.
• Romet-30 (RO-5 or Ormetoprim + Sulfadimethoxine). This drug has now been labelled by the Food and Drug Administration for use in controlling systemic infections of Edwardsiella ictaluri and Terramycin resistant Aeromonds sp. in channel catfish.
Dose rate is 50 mg active ingredient per kilogram of body weight daily for 5 days. This corresponds to adding 66.6 pounds of the 30 percent active formulation to one ton of feed and feeding the mixture at a rate of 0.5 percent of the live fish body weight daily. Fish cannot be slaughtered and used for human food until 5 days after the last feeding day with Romet-30.
This potentiated sulfonamide appears to be effective against systemic gram-negative bacteria which cause problems in channel catfish culture.
• Terramycin (Oxytetracyciine). Terramycin is a broad spectrum antibiotic widely used to control both external and systemic bacterial infections in fish. It is available in many formulations, both liquid and powder.
As a bath treatment in tanks, at 1 5 ppm active (0.57 gm active per 10 gal.; 4.25 gm active per 10 cu. ft.) for 24 hours. The treatment may have to be repeated on 2-4 successive clays. It has also been used in hauling tanks at the same concentration.
Where a small number of large or valuable fish are involved, it can be injected IP or IM at 25 mg. per pound of body weight.
Where it is necessary to administer Terramycin orally, feed at 2.5-3.5 gms active per 100 pounds of fish per day for 10 days. Therefore, if the fish are being fed at approximately 3 percent of their body weight daily, it is necessary to have 83.3-116.7 gms active Terramycin per 100 pounds of food. Under no circumstances should the treatment be for less than 10 days.
What To Do it fish Get Sick
• Get quick and accurate diagnosis. Contact the Extension Wildlife and Fisheries Department at Mississippi State University (601 /325-3174) or its Area Fisheries Office at Stoneville (601 /686-9311) for assistance.
• Determine most effective and economical drug.
• Determine most effective method of treatment.
• Determine correct dosage level and treatment time.
Procedures To Follow In Case of a Suspected Pesticide-Caused Fish Kill
When a fish kill starts, or if you suspect that fish have been exposed to a toxic chemical, try to determine the exact cause of the problem. Immediately contact your County Agent or any of the Extension fish disease specialists listed and request their assistance in determining the cause of the fish losses.
Extension Fisheries Specialist Mississippi Cooperative Extension Service Stoneville, MS 38776 (601) 686-9311
Extension Fisheries Specialist P. O. Box 5446 Mississippi State, MS 39762 (601) 325-3174
If you think that a fish kill may be due to pesticides, con-tact the individuals listed below:
Director Division of Plant Industry P. O. Box 5207 Mississippi State, MS 39762 (601) 325-3390 State Chemist Mississippi State Chemical Laboratory P. O. Box CR Mississippi State, MS 39762 (601) 325-3324 Field Director Agricultural Aviation Board Lake Road Moorhead, MS 38761 (601) 246-8800
By law, the Division of Plant Industry must be notified within 60 days of the date the pesticide kill is first suspected if the kill is a result of aerial spraying. If this is not done, there is no recourse under law.
There is no legal requirement of notification if the pesticide-caused fish kill was the result of spray spraying by ground rigs.
As preventive measures, a fish farmer should take the following steps:
1. Get the name and phone number of all adjacent landowners and farmers so they can be contacted in case of a suspected pesticide or herbicide drift.
2. Advise all adjacent landowners of the location of your fish ponds.
3. Get the name and phone number of all aerial applicators who will be flying for the adjacent landowners. Advise them of the location of all ponds on your property. Obtain a description of their plane(s) and "N" numbers. Also, give them your telephone number where you can be contacted.
29
If fish losses occur, take the following actions IMMEDI-ATELY:
1. Request assistance from your County Agent or one of the Extension fish disease specialists in determining the cause of the losses. If the investigation indicates that a pesticide or herbicide may be responsible for the losses, notify all adjacent landowners and aerial applicators who may have been involved.
2. Advise the Mississippi Division of Plant Industry and the Mississippi Agricultural Aviation Board of the problem.
3. Advise all parties of the number and location of ponds where losses are occurring, the number, size and kind of fish stocked in each pond, and number of fish lost as of that date.
4. Make sure that official samples of fish and water for analysis are collected from the ponds involved. These samples should be taken by the County Agent, Extension fish disease specialist, or by a representative of the Mississippi Division of Plant Industry or the Mississippi Agricultural Aviation Board. The method of collecting and preserving samples of sick fish for diagnostic purposes is described in the Cooperative Extension Information Sheet 667 Selecting and Shipping Samples to Use in Determining Cause of Fish Kills. Copies are available from your County Agent or from the Extension Wildlife and Fisheries Department, P. O. Box 5446, Mississippi State, MS 39762.
All samples collected for pesticide or herbicide analysis must be properly labeled, iced (in the case of fish), and accompanied by a completed Laboratory Sample Submission Form. Extra copies of the Laboratory Sample Submission Form are available from county agents, any of the five individuals listed above, or at the Laboratory Office, Room 112, Hand Chemical Laboratory, Mississippi State University.
5. If possible, find out from the adjacent landowner and chemical applicator the kind of chemical used and rate of application. Also, try to obtain a sample of the chemical used. The following information should also be noted and given to all parties involved:
• time of day the kill first started
• kinds of fish in the pond and what kinds of fish are dying
• number of fish killed
• number of fish in pond, when stocked, amount of food being fed, and type of food
• whether a kill is occurring in adjacent ponds and, if so, where they are in relation to ponds where no kill has occurred
• location of farm lands in relation to the affected pond(s) and the type of crop being grown
• location of any pesticide spraying, either by ground or air, in the area, and type of pesticide being used
• identification number of any spray planes in the area or ferrying over affected ponds
• wind speed and direction
Adjacent landowners and aerial applicators who are
advised that their operations may have been responsible for fish losses should take the following steps:
1. Verify by an on-site visit, as soon as possible, that a fish kill has occurred.
2. Cooperate as fully as possible with all parties in determining the cause of the fish losses.
It is the responsibility of all landowners, aerial applicators and operators of ground rigs to insure that there is no direct application or drift of material (regardless of what kind) into any pond.
Off-Flavor Off-flavor is a serious problem. There is no economical
method of treatment at this time.
Certain types of algae, mainly blue-greens, release a chemical called geosmin in the water. Geosmin is absorbed by fish and causes a musty taste that varies from barely noticeable to highly offensive. This condition can be corrected in 3-10 days if affected fish can be put in water that does not contain geosmin.
In production ponds, the only possible remedy at this time is to flush the pond or reduce the algae load in the pond by treatment. Neither method has proven satisfactory. Off-flavor can be eliminated from affected catfish by removing them from the production pond and putting them in a facility (raceway or small pond) in which the total water volume can be exchanged at least two times a day. Affected catfish will eliminate the compounds that cause off-flavor within 3 to 7 days depending on the concentration in their tissue and the water temperature. Remember, the water used for flushing must be free of off-flavor compounds, so well water should be used.
Control of Undesirable Fish Species Complete Eradication of All Fish
• Drain and dry ponds.
• Rotenone. Use 3 lb of 5 percent Rotenone powder, 3 pints of 5 percent emulsifiable Rotenone, or 6 pints of 2.5 percent emulsifiable Rotenone per acre foot of water. Insure adequate mixing. Results are best when water temperature is above 70°F (21.1°C).
You can detoxify using 2 pounds of potassium permanganate for each pound or pint of rotenone used.
Selective Removal of Scale Fish
• Antimycin A or Fintrol. Cleared for use in commercial catfish ponds by FDA.
• Fintrol. The amount needed to effectively eliminate scale fish from a catfish pond depends on both the water temperature and pH. Check both before use. Usually the best time to apply it is early in the morning since the pH of the water is lowest at daybreak and is highest in the late afternoon. The recommended amount to use at different pH's and temperatures is given in parts per billion (ppb):
pH 8.4 or less pH 8.5 or higher
ppb5.7Fº60
ppb5)Cº6.15(Fº60 <>
ppb10
Fº60ppb5.7
Fº60 <>
30
For most economical results, use one-fifth of the recommended rate. By doing this, you can effectively and economically eliminate scale fish from a pond with no danger to the catfish.
Fintrol is packaged as a liquid in two bottles; one bottle is the active material and one is diluent. They must be mixed in order for the active material to be toxic. Do not mix until just before use, and mix only the amount needed for the treatment, since it breaks down 24 hours after mixing.
Aquatic Weed Control
Methods
• Mechanical control and evironmental manipulation. Mechanical methods may be as simple as cutting a willow tree or pulling or digging up a few objectionable plants that have just gotten started along the water margin. Mechanical methods also include using expensive and complicated underwater mowers. While cutting or removing a few plants by hand can be effective in small or limited areas, mechanical aquatic weed control on a large scale is generally useless. Environmental manipulation is usually a drawdown which is of little benefit in a catfish pond.
• Biological control. This has been touted as the most promising form of aquatic weed control. Unfortuantely, biological control is still in the research stage and is not yet practical and safe for wide-spread use.
• Chemical Control. Herbicides at this time are the most economical, safe, and practical means of controlling aquatic weeds in most cases. However, chemical control also has its limitations.
Before you try any chemical control, you must accurately identify the aquatic weed, choose the correct and most economical herbicide, and the proper treatment rate. Accurately measure the water volume or surface area to be treated. MCES Information Sheet 673 gives procedures for calculating the amount of chemical to use and can be obtained from your County Agent.
No control or inadequate control of an aquatic weed means that you selected the wrong chemical, used an inadequate treatment rate, chose the wrong formulation, or applied the chemical improperly. Excessive use of a herbicide, use at the wrong time, or use of the wrong chemical can create an oxygen depletion and result in a partial or total loss of all fish in the body of water treated. Any time aquatic plants are treated, oxygen levels should be monitored closely for 5-7 days, and you should be ready to use emergency measures to prevent an oxygen depletion from occurring. ALWAYS READ AND OBSERVE LABEL PRECAUTIONS BEFORE USING ANY CHEMICAL IN AN AQUATIC ENVIRONMENT.
Steps To Follow for Aquatic Weed Control 1. Identify the problem weed.
2. Choose the most economical and efficient control
method.
3. If you select a chemical method of control, be sure
it is both economical and safe, as well as effective.
4. Calculate pond area and volume to be treated.
5. Follow label instructions.
Harvesting
Although modern equipment such as tractors, seine reels, etc., are used in removing catfish from a pond, harvesting is done basically as it has been since the dawn of recorded history, by seine. Each farmer must decide whether to do his own harvesting or whether to rely on custom harvesters. There are advantages and disadvantages for each choice.
Custom Harvesting
• Cost varies, but is usually about 3 cents per pound.
• Contact custom harvester well ahead of the anticipated harvest date both for scheduling purposes and to determine the cost.
• Be sure you have a market for your fish and that they are "on-flavor" before harvesting.
• Find out from the custom harvester the equipment and labor you must provide, if any. Generally, custom harvesters require that you provide two tractors for pulling the seine, plus a tractor and a paddlewheel for aeration. However, this will vary depending on the custom harvester.
Farmer Harvesting
• The actual equipment and labor required for doing your own harvesting depends on the size and shape of your ponds and the size of the farm.
Equipment needs will vary, but a basic list is given below:
− hydraulic-powered seine reel mounted on a two wheel trailer
− seine 10 feet deep; length varies, but minimum would be 3 feet of seine for every 2 feet of width of pond to be seined; must have floats and mud line
− 14-foot John boat with 10-25 h.p. motor − boom truck with hoist, in-line scales, and fish − basket − two tractors with hydraulic system for pulling the − seine − cutting seines or live cars; dip nets, waders,
gloves, − and other miscellaneous items − pickup truck for moving boat
A basic seining operation is outlined below:
− Stretch seine across one end of pond. Seine toward end where inflow pipe is located.
− Attach free end of seine to one tractor, leaving un-used part of seine on reel which is hooked to second tractor.
31
− Put seine in water and pull slowly to other end of pond.
− Because of the levee slope, the seine is pulled off the bottom at the pond edges. Thus, it is necessary for two men to get into the water and move with the seine using a foot to keep the mud line on bottom. The boat used in harvesting has a bracket mounted on the front. The bracket is rectangular shaped, made of ½" to ¾" metal rods, and extends down into the water about 3 feet; it is used to push the center of the seine to empty mud that can build up on the mud line.
− The boat is run back and forth along the back side of the seine to move fish ahead.
− After the seine is pulled through the pond, the tractor with the seine reel stops at one corner while the other tractor turns the corner and moves slowly toward the seine reel.
− At this time the hydraulically powered seine reel begins pulling the seine in.
− Once the fish are concentrated, a cutting seine, usually 50 feet long and 10 feet deep, is pulled through the area within the main seine to concentrate fish near the bank for loading onto the hauling truck.
− Live-cars can be used rather than cutting seines. Once the fish are concentrated by the main seine, a live car with a circumference of 60 feet with a bottom made of the same seining material is attached to the main seine where a draw-string opening is located. Fish arc allowed to move into the live car which is detached and another live-car attached to the main seine. The fish are allowed to stay in the live cars for several hours prior to loading out to allow time for the smaller fish to grade out.
− When the fish are ready for loading, the boom truck lowers a basket into the pond where workers using dip nets load it. The baskets will hold 800-1800 pounds of fish. The basket is lifted directly over a water-filled tank on the live-haul truck. The weight of the fish in the basket is recorded from the in-line set of scales, then the basket is emptied into the tank. The time required to seine a pond depends on many factors, but it usually takes about two hours or less. Loading time depends on the amount of fish to be loaded.
− Have the concentrated fish located near the inflow pipe so fresh water is available if needed. Also have emergency aeration equipment available if needed, or set up and running if the fish are to be held overnight before loading.
Marketing It doesn't matter how many catfish you raise or how
efficiently, if you can't sell them at a profit. Where and how the catfish will be sold should be the first concern of anyone thinking about raising catfish. Catfish farmers traditionally sell or market their catfish to (a) processing
32
plants, (b) live haulers, (c) local stores and restaurants, (d) backyard or pond bank sales to local residents, or (e) use their catfish in a fee-fishing operation. Obviously, there are variations of the marketing schemes, but these are the main outlets.
Processing Plants In Mississippi processing plants will not send a
harvesting crew more than 50 miles from the plant, and they charge about 3 cents a pound for harvesting. In addition, they charge from 1 to 3 cents per pound for transportation. The minimum load that the processing plants will take is 8,000 to 10,000 pounds and, with one exception, none will send a truck more than 50 miles one way for a load of catfish. Arrangements for selling your fish to a processing plant usually must be made 7 to 60 days before harvest. This means most hill farmers will not be able to sell their fish to a processing plant because of the distance involved and the lack of enough fish.
Live Haulers Like the processing plants, most live haulers will not take
fewer than 8,000 pounds a load. Also, they do not provide harvesting crews. This means the farmers must harvest the fish. Live handlers want catfish only during a four- to five-month period, mid-April to mid-September. Therefore, the farmer must set his production and harvesting schedules to the live hauler's schedule. This will entail over-wintering fish and draining for harvest when there is usually little rain for refilling the pond.
Local Stores and Restaurants These are among the best markets for catfish from stock
ponds. Local stores and restaurants usually want fish all year on a weekly basis. This means a farmer must be able to harvest fish weekly either by seining or trapping. One main problem is that many stores and restaurants will take only dressed fish, so the small catfish farmer must be willing to hand-process his fish.
Backyard Sales Depending on location, area population, size of the
catfish operation, the number and size of other catfish operations in the area, and other factors, this marketing method can be excellent or poor. Fish are available year-round and are sold live or dressed. Another method used is to harvest once a year and advertise by local radio and newspapers that fish will be available live at the pond bank on a certain date.
Fee Fishing In the method of marketing catfish, the farmer grows the
fish in one or more ponds and permits fishing in any or all the ponds for a fee, usually so much per day or rod and so much per pound. The pond may be open for fishing all year or just on certain days or weeks. In addition to the usual management problems, this system means that someone must be at the pond when it is open for fishing.
Suggested Reading Dixon, D. A., Jr., J. S. Miller, J. R. Conner, and J. E.
Waldrop. 1982. Survey of Market Channels for Farm-Raised Catfish. AEC Research Report No. 132, Mississippi State University, 27 pp.
Dupree, H. K. and J. V. Huner. 1984. Third Report to the Fish Farmer. U. S. Fish and Wildlife Service, 270 pp.
Giachelli, J. W. and J. E. Waldrop. 1983. Cash Flows Associated with Farm-Raised Catfish Production. Agricult. Econ. Tech. Publ. No. 46, Mississippi State University, 37 pp.
Giachelli, J. W., R. E. Coats, Jr., and J. E. Waldrop. 1982. Mississippi Farm-Raised Catfish. January 1982 Cost of Production Estimates. Agricult. Econ. Research Report No. 134, 41 pp.
Keenum, M. E. and J. G. Dillard. 1984. Operational Characteristics and Costs of Custom Harvesting and Hauling Farm-Raised Catfish. Agricult. Econ. Research Report No. 153, Mississippi State University, 22 pp.
Lee, J. S. 1981. Commercial Catfish Farming. 2nd Edition. The Interstate Printers & Publishers, Inc., Danville, Ill., 310 pp.
Catfish Computer Programs (Request from your County Agent)
Hickel, R., W. Killcreas, and J. E. Waldrop. 1983. A Catfish Growth Simulation Model for use with TRS-80 Models II, III, 16 and IBM PC Microcomputers. Agricult. Econ. Tech. Pub]. No. 42, Mississippi State University, 11 pp.
Killcreas, W., S. Ishee, N. Wilkes, D. McWilliams, J. Leng, W. Wolfe, and J. Waldrop. 1985. A Records Program for Catfish and Shrimp Production; Financial Data and Management Decisions for IBM PC and Compatible
Plumb, John A. (Editor). 1985. Principle Diseases of Farm Raised Catfish. Southern Cooperative Series Bulletin No. 225, Alabama Agricult. Experiment Station, Auburn University, 76 pp.
Robinson, E. H. and R. T. Lovell. (Editors). 1984. Nutrition and Feeding of Channel Catfish. Southern Cooperative Series Bulletin No. 296, Texas Agricult. Experiment Station, Texas A&M University, 57 pp.
Tucker, C. S. (Editor). 1983. Water Quality in Channel Catfish Ponds. Southern Cooperative Series Bulletin No. 290, 53 pp.
Tucker, C. S. (Editor). 1985. Channel Catfish Culture. Elsevier Science Publishers, Amsterdam, The Netherlands, 657 pp.
Wellborn, T. L., T. E. Schwedler, J. R. MacMillan. 1985. Channel Catfish Fingerling Production. Mississippi Cooperative Extension Service Publ. 1460, Mississippi State University, 15 pp.
Computers, Agricult. Econ. Tech. Publ. No. 55, Mississippi State University, 80 pp.
Killcreas, W., S. Ishee, N. Wilkes, N. Kennedy, and E. Walker. 1985. MSU Farm Records: Summarized Capabilities, Installation, Operation and Example Reports, Agricult. Econ. Tech. Publ. No. 54, Mississippi State University, 19 pp.
33
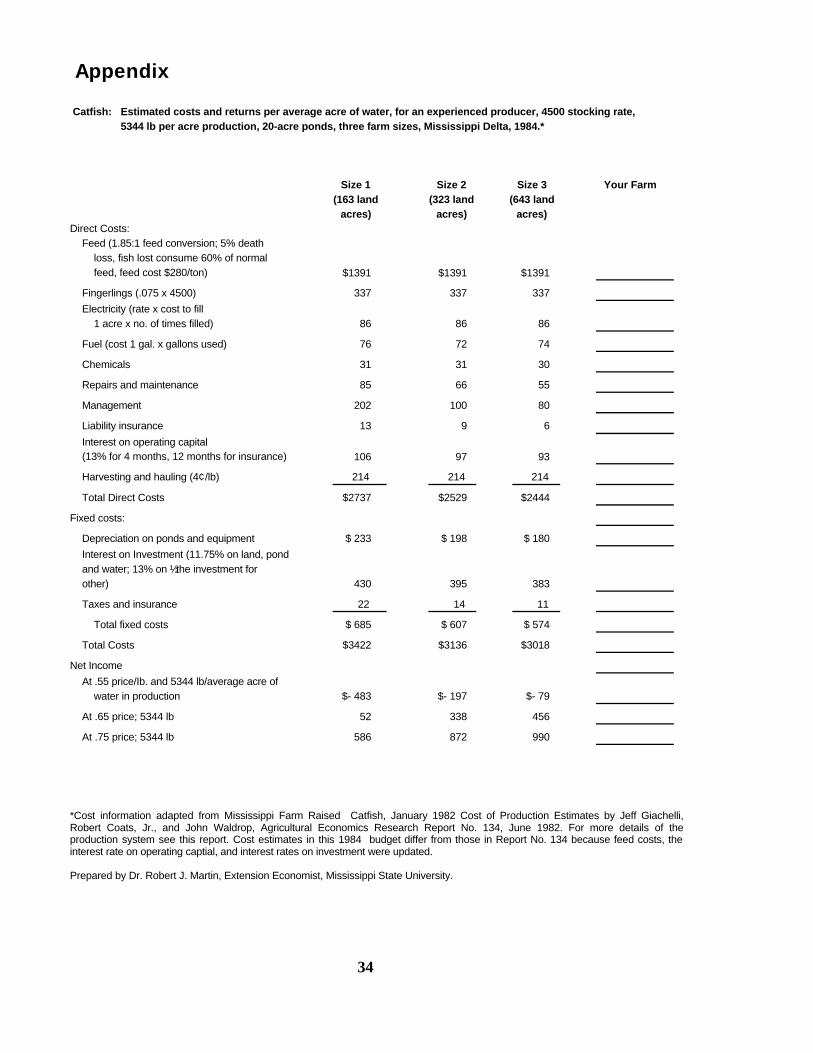
Appendix Catfish: Estimated costs and returns per average acre of water, for an experienced producer, 4500 stocking rate,
5344 lb per acre production, 20-acre ponds, three farm sizes, Mississippi Delta, 1984.* Size 1
(163 land acres)
Size 2 (323 land
acres)
Size 3 (643 land
acres)
Your Farm
Direct Costs: Feed (1.85:1 feed conversion; 5% death loss, fish lost consume 60% of normal feed, feed cost $280/ton) $1391 $1391 $1391
Fingerlings (.075 x 4500) 337 337 337
Electricity (rate x cost to fill 1 acre x no. of times filled) 86 86 86
Fuel (cost 1 gal. x gallons used) 76 72 74
Chemicals 31 31 30
Repairs and maintenance 85 66 55
Management 202 100 80
Liability insurance 13 9 6
Interest on operating capital (13% for 4 months, 12 months for insurance) 106 97 93
Harvesting and hauling (4¢ /lb) 214 214 214
Total Direct Costs $2737 $2529 $2444
Fixed costs:
Depreciation on ponds and equipment $ 233 $ 198 $ 180
Interest on Investment (11.75% on land, pond and water; 13% on ½ the investment for other) 430 395 383
Taxes and insurance 22 14 11
Total fixed costs $ 685 $ 607 $ 574
Total Costs $3422 $3136 $3018
Net Income
At .55 price/Ib. and 5344 lb/average acre of water in production $- 483 $- 197 $- 79
At .65 price; 5344 lb 52 338 456
At .75 price; 5344 lb 586 872 990 *Cost information adapted from Mississippi Farm Raised Catfish, January 1982 Cost of Production Estimates by Jeff Giachelli, Robert Coats, Jr., and John Waldrop, Agricultural Economics Research Report No. 134, June 1982. For more details of the production system see this report. Cost estimates in this 1984 budget differ from those in Report No. 134 because feed costs, the interest rate on operating captial, and interest rates on investment were updated. Prepared by Dr. Robert J. Martin, Extension Economist, Mississippi State University.
34
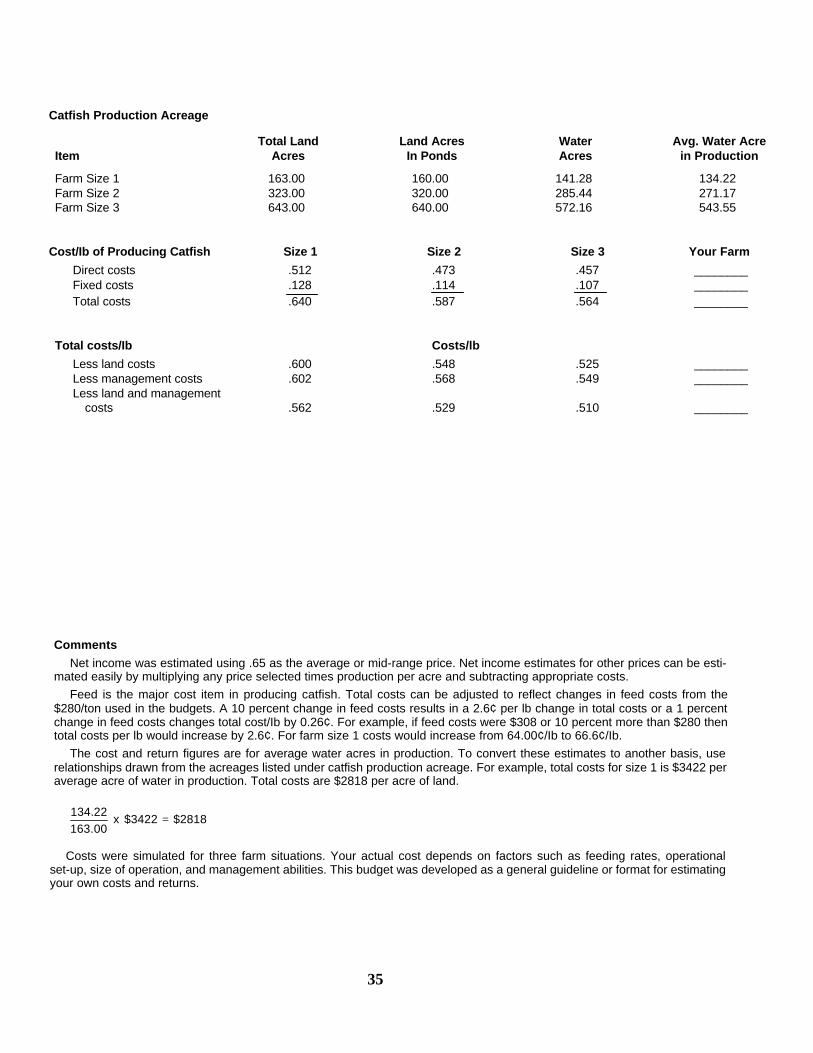
Catfish Production Acreage Total Land Land Acres Water Avg. Water Acre Item Acres In Ponds Acres in Production
Farm Size 1 163.00 160.00 141.28 134.22 Farm Size 2 323.00 320.00 285.44 271.17 Farm Size 3 643.00 640.00 572.16 543.55 Cost/Ib of Producing Catfish Size 1 Size 2 Size 3 Your Farm
Direct costs .512 .473 .457 ________ Fixed costs .128 .114 .107 ________ Total costs .640 .587 .564 ________ Total costs/Ib Costs/lb
Less land costs .600 .548 .525 ________ Less management costs .602 .568 .549 ________ Less land and management costs .562 .529 .510 ________
Comments
Net income was estimated using .65 as the average or mid-range price. Net income estimates for other prices can be esti-mated easily by multiplying any price selected times production per acre and subtracting appropriate costs.
Feed is the major cost item in producing catfish. Total costs can be adjusted to reflect changes in feed costs from the $280/ton used in the budgets. A 10 percent change in feed costs results in a 2.6¢ per lb change in total costs or a 1 percent change in feed costs changes total cost/Ib by 0.26¢. For example, if feed costs were $308 or 10 percent more than $280 then total costs per lb would increase by 2.6¢. For farm size 1 costs would increase from 64.00¢/Ib to 66.6¢/Ib.
The cost and return figures are for average water acres in production. To convert these estimates to another basis, use relationships drawn from the acreages listed under catfish production acreage. For example, total costs for size 1 is $3422 per average acre of water in production. Total costs are $2818 per acre of land.
2818$3422$x00.16322.134
=
Costs were simulated for three farm situations. Your actual cost depends on factors such as feeding rates, operational set-up, size of operation, and management abilities. This budget was developed as a general guideline or format for estimating your own costs and returns.
35

By Dr. Thomas L. Wellborn, Jr., Leader, Extension Wildlife and Fisheries Department Mississippi State University does not discriminate on grounds of race, color, religion, national origin, sex, age, or handicap.
Publication 1549 Extension Service of Mississippi State University, cooperating with U. S. Department of Agriculture. Published in furtherance of Acts of Congress, May 8 and June 30, 1914. JAMES R. CARPENTER, Director (2M-4-87)
Related Documents