ORIGINAL ARTICLE J. Hofmann H. Behrendt A. Gilbert R. Janssen A. Kannen J. Kappenberg H. Lenhart W. Lise C. Nunneri W. Windhorst Catchment–coastal zone interaction based upon scenario and model analysis: Elbe and the German Bight case study Received: 9 April 2003 / Accepted: 7 June 2004 / Published online: 15 October 2004 Ó Springer-Verlag 2004 Abstract This paper presents a holistic strategy on the interaction of activities in the Elbe river basin and their effects on eutrophication in the coastal waters of the German Bight. This catchment–coastal zone interaction is the main target of the EUROCAT (EUROpean CATchments, catchment changes and their impact on the coast) research project, with the Elbe being one of eight case studies. The definition of socio-economic scenarios is linked with the application of models to evaluate measures in the catchment by estimation of nutrient emissions with MONERIS (MOdelling Nutri- ent Emissions in RIver Systems), and their effects on coastal waters with the ecosystem model ERSEM (European Regional Seas Ecosystem Model). The cost effectiveness of reduction measures will then be evalu- ated by application of the CENER model (Cost-Effec- tive Nutrient Emission Reduction) and a multi-criteria analysis. Finally, the interpretation of ecological integ- rity is used as a measure to describe ecological impacts in an aggregated form. Keywords Scenarios Nutrients Elbe Water framework directive Coastal zone Introduction The Elbe catchment is part of one of eight case studies within the EUROCAT project. Aim of the project is to achieve Integrated River Basin Management (IRBM), as targeted in the Water Framework Directive (WFD) 2000/60/EC (http://europa.eu.int/comm/environment/ water/water-framework/index_en.html), in order to prevent and mitigate possible externalities induced in the coastal zone by considering the anthropogenic influence from the spring to the outlet within a given river basin. The new element is the holistic river district approach, which takes into account the socio-economic develop- ment in the catchment. The WFD demands a link be- tween IRBM and Integrated Coastal Zone Management (ICZM). Implementation of the WFD will be a major issue in future debates on local as well as regional levels, which makes the EUROCAT approach relevant for fu- ture discussions concerning sustainable regional devel- opment (EEA 1999; European Community 2000). Within the scope of EUROCAT, the Driver-Pressure- State-Impact-Response approach (DPSIR) of the European Environment Agency is the analytical frame- work selected to handle complex humankind–ecosystem interactions (Behrendt et al. 2000). Scenarios assess how different human activities could come into existence, thus causing an impact on the environment and poten- tially damaging the (coastal) ecological integrity. Fur- thermore, scenarios represent plausible images of the future, in which environmental risk perception and therewith interpretation of environmental risk and (coastal) vulnerability will considerably influence politi- J. Hofmann (&) H. Behrendt Dept. of Lowland Rivers and Shallow Lakes, Leibniz Institute of Freshwater Ecology and Inland Fisheries (IGB), Mu¨ggelseedamm 310, 12587 Berlin, Germany E-mail: [email protected] Fax: +49-30-64181799 A. Gilbert R. Janssen W. Lise Institute for Environmental Studies, Faculty of Earth and Life Sciences, Vrije Universiteit, De Boelelaan 1087, 1081 HV Amsterdam, The Netherlands A. Kannen Research and Technology Centre Westcoast (FTZ), Christian-Albrechts-University of Kiel, Hafentoern, 25761 Buesum, Germany H. Lenhart Institute for Marine Research, University of Hamburg, Bundesstr. 53, 20146 Hamburg, Germany J. Kappenberg C. Nunneri Institute for Coastal Research, GKSS Research Centre, Max-Planck-Str., 21502 Geesthacht, Germany W. Windhorst Ecology Center, Division of Ecosystem Research, Christian-Albrechts-University of Kiel, Schauenburgerstraße 112, 24118 Kiel, Germany Reg Environ Change (2005) 5: 54–81 DOI 10.1007/s10113-004-0082-y

Welcome message from author
This document is posted to help you gain knowledge. Please leave a comment to let me know what you think about it! Share it to your friends and learn new things together.
Transcript
ORIGINAL ARTICLE
J. Hofmann Æ H. Behrendt Æ A. Gilbert Æ R. JanssenA. Kannen Æ J. Kappenberg Æ H. Lenhart Æ W. Lise
C. Nunneri Æ W. Windhorst
Catchment–coastal zone interaction based upon scenario and modelanalysis: Elbe and the German Bight case study
Received: 9 April 2003 / Accepted: 7 June 2004 / Published online: 15 October 2004� Springer-Verlag 2004
Abstract This paper presents a holistic strategy on theinteraction of activities in the Elbe river basin and theireffects on eutrophication in the coastal waters of theGerman Bight. This catchment–coastal zone interactionis the main target of the EUROCAT (EUROpeanCATchments, catchment changes and their impact onthe coast) research project, with the Elbe being one ofeight case studies. The definition of socio-economicscenarios is linked with the application of models toevaluate measures in the catchment by estimation ofnutrient emissions with MONERIS (MOdelling Nutri-ent Emissions in RIver Systems), and their effects oncoastal waters with the ecosystem model ERSEM(European Regional Seas Ecosystem Model). The costeffectiveness of reduction measures will then be evalu-ated by application of the CENER model (Cost-Effec-tive Nutrient Emission Reduction) and a multi-criteria
analysis. Finally, the interpretation of ecological integ-rity is used as a measure to describe ecological impacts inan aggregated form.
Keywords Scenarios Æ Nutrients Æ Elbe Æ Waterframework directive Æ Coastal zone
Introduction
The Elbe catchment is part of one of eight case studieswithin the EUROCAT project. Aim of the project is toachieve Integrated River Basin Management (IRBM), astargeted in the Water Framework Directive (WFD)2000/60/EC (http://europa.eu.int/comm/environment/water/water-framework/index_en.html), in order toprevent and mitigate possible externalities induced in thecoastal zone by considering the anthropogenic influencefrom the spring to the outlet within a given river basin.The new element is the holistic river district approach,which takes into account the socio-economic develop-ment in the catchment. The WFD demands a link be-tween IRBM and Integrated Coastal Zone Management(ICZM). Implementation of the WFD will be a majorissue in future debates on local as well as regional levels,which makes the EUROCAT approach relevant for fu-ture discussions concerning sustainable regional devel-opment (EEA 1999; European Community 2000).
Within the scope of EUROCAT, the Driver-Pressure-State-Impact-Response approach (DPSIR) of theEuropean Environment Agency is the analytical frame-work selected to handle complex humankind–ecosysteminteractions (Behrendt et al. 2000). Scenarios assess howdifferent human activities could come into existence,thus causing an impact on the environment and poten-tially damaging the (coastal) ecological integrity. Fur-thermore, scenarios represent plausible images of thefuture, in which environmental risk perception andtherewith interpretation of environmental risk and(coastal) vulnerability will considerably influence politi-
J. Hofmann (&) Æ H. BehrendtDept. of Lowland Rivers and Shallow Lakes,Leibniz Institute of Freshwater Ecology and Inland Fisheries(IGB), Muggelseedamm 310, 12587 Berlin, GermanyE-mail: [email protected]: +49-30-64181799
A. Gilbert Æ R. Janssen Æ W. LiseInstitute for Environmental Studies,Faculty of Earth and Life Sciences,Vrije Universiteit, De Boelelaan 1087,1081 HV Amsterdam, The Netherlands
A. KannenResearch and Technology Centre Westcoast (FTZ),Christian-Albrechts-University of Kiel,Hafentoern, 25761 Buesum, Germany
H. LenhartInstitute for Marine Research, University of Hamburg,Bundesstr. 53, 20146 Hamburg, Germany
J. Kappenberg Æ C. NunneriInstitute for Coastal Research, GKSS Research Centre,Max-Planck-Str., 21502 Geesthacht, Germany
W. WindhorstEcology Center, Division of Ecosystem Research,Christian-Albrechts-University of Kiel,Schauenburgerstraße 112, 24118 Kiel, Germany
Reg Environ Change (2005) 5: 54–81DOI 10.1007/s10113-004-0082-y
cal targets. The political issues, lifestyles of the society,and social values characterising each scenario will exertpressures on the environment. Some societal drivers,such as urbanisation and food demand and their eco-logical impact on ecosystem integrity and function (e.g.heterogeneity), are qualitatively assessed under eachscenario. A relative evaluation of the different pressureintensities under different future conditions is the basisfor deriving ecosystem state indicators (e.g. speciescomposition and ratio diatoms/flagellates for heteroge-neity) and aggregated impact indicators correspondingto the demand of the WFD (Janssen et al. 2001). TheElbe case study focuses on coastal eutrophication of theNorth Sea, thus concentrating on analysis of nutrientemissions originating from the catchment, and theirpotential reduction through different management op-tions (Hofmann et al. 2002; Nunneri and Hofmann2002). With respect to coastal eutrophication, nitrogenand phosphorus are quantitatively the most relevantcomponents (De Jonge et al. 2002). In order to proposea reduction of eutrophication of the North Sea based ona better inland management, the following questions areaddressed:
– What must be achieved in river basins (reduction ofnutrient loads of nitrogen and phosphorus) to meetstandards (e.g. good ecological status) desired by thesociety in the coastal zone?
– What are the effects of the changes of nutrient loadsin the river basin on the ecosystem in the coastalzone?
The outline of this paper is as follows. The sectionStudy area provides a description of the Elbe catchment,estuary and coast, delineating the study area and focusof this paper. The section Methodology points out themethodology used for the study of the Elbe catchment–coast continuum. The qualitative methodology isquantified in the section Modelling tools and informationexchange by a number of models, describing the waterquality in the catchment, ecological quality by indicatorsat the coast, and the linkage between the catchment andthe coast via a transfer function. Furthermore, thecoastal indicators and the costs of taking measures andother indicators are used for a multi-criteria analysis ofnutrient reduction policy options, while the coastalindicators are also used for an ecosystem integrityanalysis. The result of these models are presented in thesection Results. The final section draws conclusions.
Study area
Catchment and estuary of the Elbe River
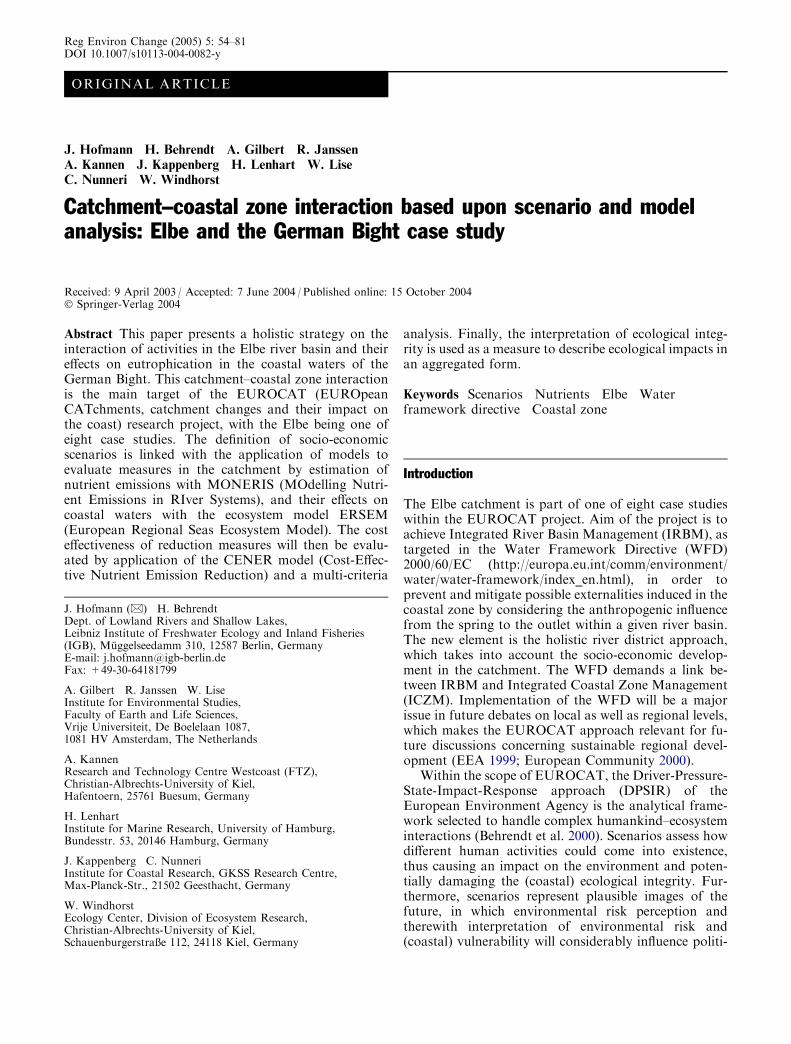
With an area of 148,268 km2 and a river length of1,091 km, the Elbe catchment is the 12th largest riverbasin in Europe (Fig. 1). About two thirds of thecatchment area belongs to Germany, and one third tothe Czech Republic. Austria and Poland have nearly thesame small shares in the catchment. Conventionally, theElbe is divided into three parts:
Fig. 1 The Elbe river basin
55
– the upper Elbe (from the spring to Elbekm 96—Schloss Hirschstein) comprises the middlemountain relief with elevations of ca. 200–300 m tomax. 1,600 m a.s.l., and Palaeozoic rocks as well asbroad basins like the Bohemian basin consisting ofsoft Cretaceous rocks;
– the middle Elbe (from Elbe km 96 to Elbekm 585.9—weir Geesthacht) with a hilly landscapeand dominant forming processes during the Pleisto-cene glaciations and deglaciations (moraines, outwashplains, melt-water drainage systems, loess deposits),and the Holocene (river meadows, floodplains, lakes);
– the lower Elbe (from Elbe km 585.9 to the North Sea,Elbe km 727.7—Cuxhaven-Kugelbake) with flat low-lands<50 m a.s.l., and a transition to an estuary riverzone downstream of Hamburg (the description of thecoastal zone is given in the section The German Bight).
The climatic conditions are characterised by theinteraction of humid maritime air masses coming fromsouthwest to northwest directions, and dry continentalair masses of easterly direction. As a result, the precip-itation in the northern and western part of the northGerman lowland is much higher than in the eastern partwith continental influence (Wit 1999). Average annualprecipitation ranges from 450 mm year�1 in the loessarea east of the Harz mountains to more than1,200 mm year�1 in the spring region of the Elbe(Krkonose mountains, Riesengebirge). The mean annualprecipitation for the entire Elbe catchment amounts to630 mm year�1 (period 1961–1990). The average annualriver discharge in the river Elbe is 717 m3 s�1 (period1977–1999), with minimum values of 461 m3 s�1 inSeptember and maximum values of 1,140 m3 s�1 inApril (Lenhart and Patsch 2001).
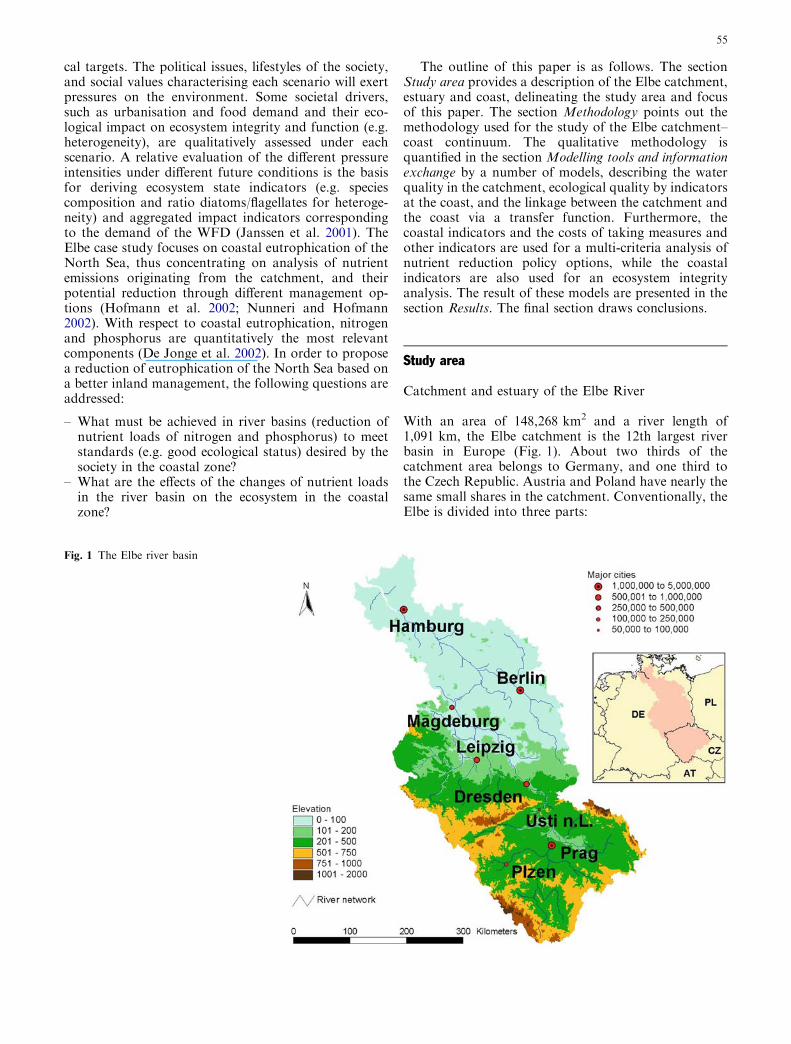
At present about 61% of the catchment is used foragriculture, 29% is covered by forests, and 6% is urbanarea. The regionalized land use for the Czech part andthe WFD coordination regions in the German part ofthe Elbe are shown in Fig. 2. Different economic activ-ities are concerned with nutrient emissions: agriculture,drinking water supply, industry and tourism often rep-resent conflicting interests.
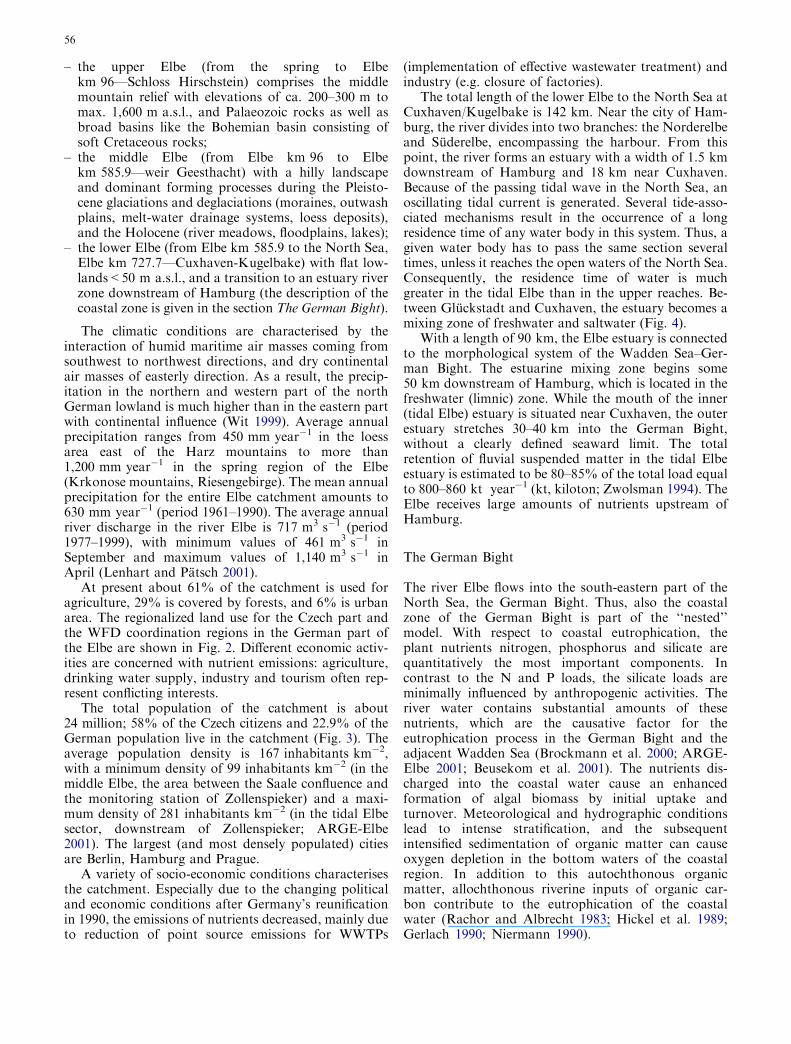
The total population of the catchment is about24 million; 58% of the Czech citizens and 22.9% of theGerman population live in the catchment (Fig. 3). Theaverage population density is 167 inhabitants km�2,with a minimum density of 99 inhabitants km�2 (in themiddle Elbe, the area between the Saale confluence andthe monitoring station of Zollenspieker) and a maxi-mum density of 281 inhabitants km�2 (in the tidal Elbesector, downstream of Zollenspieker; ARGE-Elbe2001). The largest (and most densely populated) citiesare Berlin, Hamburg and Prague.
A variety of socio-economic conditions characterisesthe catchment. Especially due to the changing politicaland economic conditions after Germany’s reunificationin 1990, the emissions of nutrients decreased, mainly dueto reduction of point source emissions for WWTPs
(implementation of effective wastewater treatment) andindustry (e.g. closure of factories).
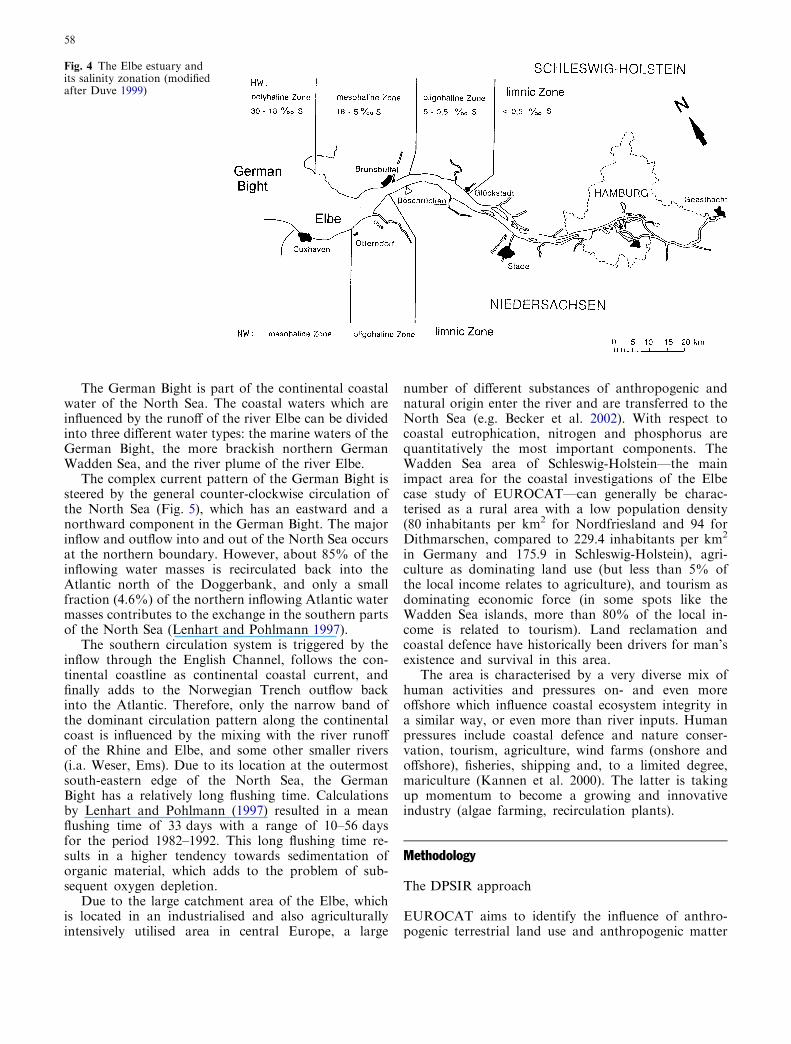
The total length of the lower Elbe to the North Sea atCuxhaven/Kugelbake is 142 km. Near the city of Ham-burg, the river divides into two branches: the Norderelbeand Suderelbe, encompassing the harbour. From thispoint, the river forms an estuary with a width of 1.5 kmdownstream of Hamburg and 18 km near Cuxhaven.Because of the passing tidal wave in the North Sea, anoscillating tidal current is generated. Several tide-asso-ciated mechanisms result in the occurrence of a longresidence time of any water body in this system. Thus, agiven water body has to pass the same section severaltimes, unless it reaches the open waters of the North Sea.Consequently, the residence time of water is muchgreater in the tidal Elbe than in the upper reaches. Be-tween Gluckstadt and Cuxhaven, the estuary becomes amixing zone of freshwater and saltwater (Fig. 4).
With a length of 90 km, the Elbe estuary is connectedto the morphological system of the Wadden Sea–Ger-man Bight. The estuarine mixing zone begins some50 km downstream of Hamburg, which is located in thefreshwater (limnic) zone. While the mouth of the inner(tidal Elbe) estuary is situated near Cuxhaven, the outerestuary stretches 30–40 km into the German Bight,without a clearly defined seaward limit. The totalretention of fluvial suspended matter in the tidal Elbeestuary is estimated to be 80–85% of the total load equalto 800–860 kt year�1 (kt, kiloton; Zwolsman 1994). TheElbe receives large amounts of nutrients upstream ofHamburg.
The German Bight
The river Elbe flows into the south-eastern part of theNorth Sea, the German Bight. Thus, also the coastalzone of the German Bight is part of the ‘‘nested’’model. With respect to coastal eutrophication, theplant nutrients nitrogen, phosphorus and silicate arequantitatively the most important components. Incontrast to the N and P loads, the silicate loads areminimally influenced by anthropogenic activities. Theriver water contains substantial amounts of thesenutrients, which are the causative factor for theeutrophication process in the German Bight and theadjacent Wadden Sea (Brockmann et al. 2000; ARGE-Elbe 2001; Beusekom et al. 2001). The nutrients dis-charged into the coastal water cause an enhancedformation of algal biomass by initial uptake andturnover. Meteorological and hydrographic conditionslead to intense stratification, and the subsequentintensified sedimentation of organic matter can causeoxygen depletion in the bottom waters of the coastalregion. In addition to this autochthonous organicmatter, allochthonous riverine inputs of organic car-bon contribute to the eutrophication of the coastalwater (Rachor and Albrecht 1983; Hickel et al. 1989;Gerlach 1990; Niermann 1990).
56
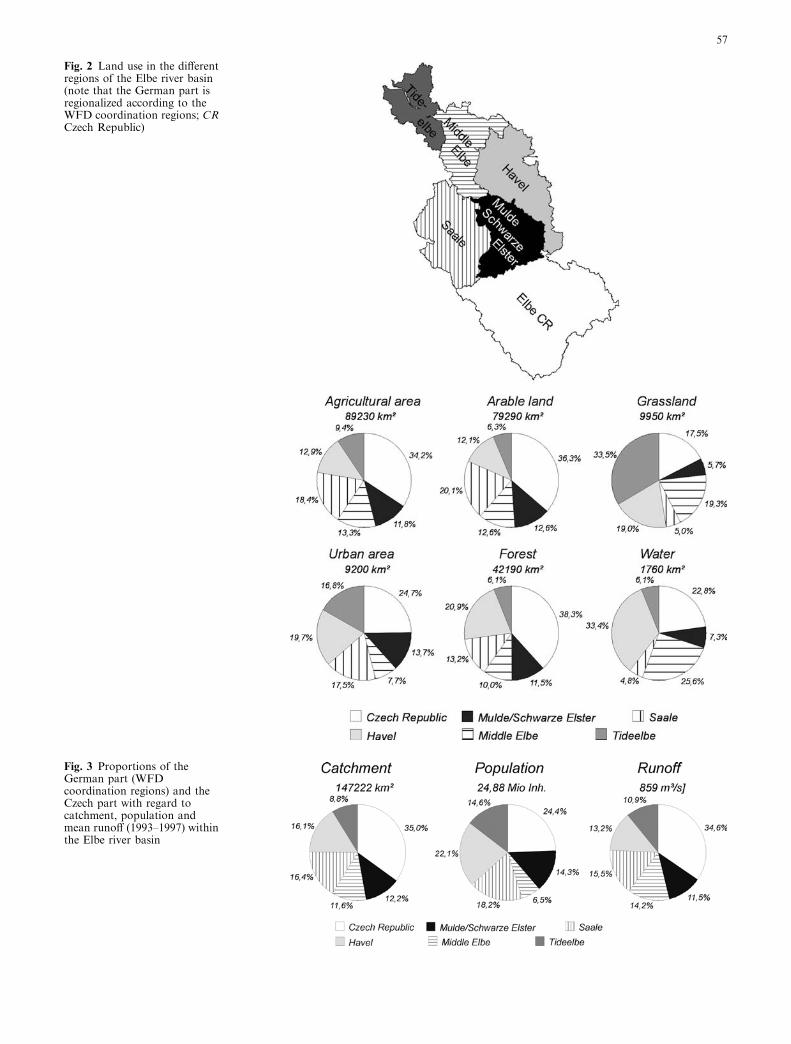
Fig. 3 Proportions of theGerman part (WFDcoordination regions) and theCzech part with regard tocatchment, population andmean runoff (1993–1997) withinthe Elbe river basin
Fig. 2 Land use in the differentregions of the Elbe river basin(note that the German part isregionalized according to theWFD coordination regions; CRCzech Republic)
57
The German Bight is part of the continental coastalwater of the North Sea. The coastal waters which areinfluenced by the runoff of the river Elbe can be dividedinto three different water types: the marine waters of theGerman Bight, the more brackish northern GermanWadden Sea, and the river plume of the river Elbe.
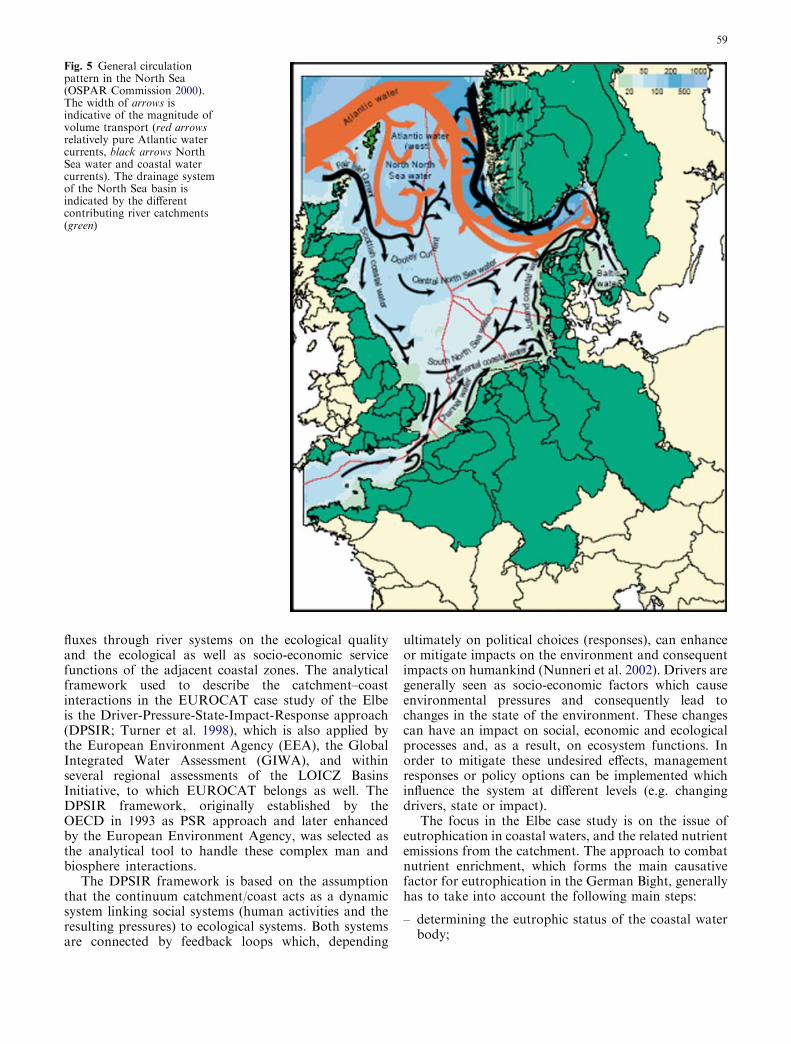
The complex current pattern of the German Bight issteered by the general counter-clockwise circulation ofthe North Sea (Fig. 5), which has an eastward and anorthward component in the German Bight. The majorinflow and outflow into and out of the North Sea occursat the northern boundary. However, about 85% of theinflowing water masses is recirculated back into theAtlantic north of the Doggerbank, and only a smallfraction (4.6%) of the northern inflowing Atlantic watermasses contributes to the exchange in the southern partsof the North Sea (Lenhart and Pohlmann 1997).
The southern circulation system is triggered by theinflow through the English Channel, follows the con-tinental coastline as continental coastal current, andfinally adds to the Norwegian Trench outflow backinto the Atlantic. Therefore, only the narrow band ofthe dominant circulation pattern along the continentalcoast is influenced by the mixing with the river runoffof the Rhine and Elbe, and some other smaller rivers(i.a. Weser, Ems). Due to its location at the outermostsouth-eastern edge of the North Sea, the GermanBight has a relatively long flushing time. Calculationsby Lenhart and Pohlmann (1997) resulted in a meanflushing time of 33 days with a range of 10–56 daysfor the period 1982–1992. This long flushing time re-sults in a higher tendency towards sedimentation oforganic material, which adds to the problem of sub-sequent oxygen depletion.
Due to the large catchment area of the Elbe, whichis located in an industrialised and also agriculturallyintensively utilised area in central Europe, a large
number of different substances of anthropogenic andnatural origin enter the river and are transferred to theNorth Sea (e.g. Becker et al. 2002). With respect tocoastal eutrophication, nitrogen and phosphorus arequantitatively the most important components. TheWadden Sea area of Schleswig-Holstein—the mainimpact area for the coastal investigations of the Elbecase study of EUROCAT—can generally be charac-terised as a rural area with a low population density(80 inhabitants per km2 for Nordfriesland and 94 forDithmarschen, compared to 229.4 inhabitants per km2
in Germany and 175.9 in Schleswig-Holstein), agri-culture as dominating land use (but less than 5% ofthe local income relates to agriculture), and tourism asdominating economic force (in some spots like theWadden Sea islands, more than 80% of the local in-come is related to tourism). Land reclamation andcoastal defence have historically been drivers for man’sexistence and survival in this area.
The area is characterised by a very diverse mix ofhuman activities and pressures on- and even moreoffshore which influence coastal ecosystem integrity ina similar way, or even more than river inputs. Humanpressures include coastal defence and nature conser-vation, tourism, agriculture, wind farms (onshore andoffshore), fisheries, shipping and, to a limited degree,mariculture (Kannen et al. 2000). The latter is takingup momentum to become a growing and innovativeindustry (algae farming, recirculation plants).
Methodology
The DPSIR approach
EUROCAT aims to identify the influence of anthro-pogenic terrestrial land use and anthropogenic matter
Fig. 4 The Elbe estuary andits salinity zonation (modifiedafter Duve 1999)
58
fluxes through river systems on the ecological qualityand the ecological as well as socio-economic servicefunctions of the adjacent coastal zones. The analyticalframework used to describe the catchment–coastinteractions in the EUROCAT case study of the Elbeis the Driver-Pressure-State-Impact-Response approach(DPSIR; Turner et al. 1998), which is also applied bythe European Environment Agency (EEA), the GlobalIntegrated Water Assessment (GIWA), and withinseveral regional assessments of the LOICZ BasinsInitiative, to which EUROCAT belongs as well. TheDPSIR framework, originally established by theOECD in 1993 as PSR approach and later enhancedby the European Environment Agency, was selected asthe analytical tool to handle these complex man andbiosphere interactions.
The DPSIR framework is based on the assumptionthat the continuum catchment/coast acts as a dynamicsystem linking social systems (human activities and theresulting pressures) to ecological systems. Both systemsare connected by feedback loops which, depending
ultimately on political choices (responses), can enhanceor mitigate impacts on the environment and consequentimpacts on humankind (Nunneri et al. 2002). Drivers aregenerally seen as socio-economic factors which causeenvironmental pressures and consequently lead tochanges in the state of the environment. These changescan have an impact on social, economic and ecologicalprocesses and, as a result, on ecosystem functions. Inorder to mitigate these undesired effects, managementresponses or policy options can be implemented whichinfluence the system at different levels (e.g. changingdrivers, state or impact).
The focus in the Elbe case study is on the issue ofeutrophication in coastal waters, and the related nutrientemissions from the catchment. The approach to combatnutrient enrichment, which forms the main causativefactor for eutrophication in the German Bight, generallyhas to take into account the following main steps:
– determining the eutrophic status of the coastal waterbody;
Fig. 5 General circulationpattern in the North Sea(OSPAR Commission 2000).The width of arrows isindicative of the magnitude ofvolume transport (red arrowsrelatively pure Atlantic watercurrents, black arrows NorthSea water and coastal watercurrents). The drainage systemof the North Sea basin isindicated by the differentcontributing river catchments(green)
59
– setting goals for water-body restoration according tothe WFD, in order to reach (or maintain) a goodecological status of the coastal waters;
– analysing the relationship between loadings and im-pacts to coastal waters, by using process-specificindicators (e.g. productivity of algal biomass);
– determining critical value ranges related to societalconditions (quantitative, qualitative or in relativeterms) for indicators; and
– identifying the most effective strategy which can beimplemented for nutrient load reduction (e.g. throughcost-effectiveness analysis and multi-criteria analysis),among a selected pool of measures.
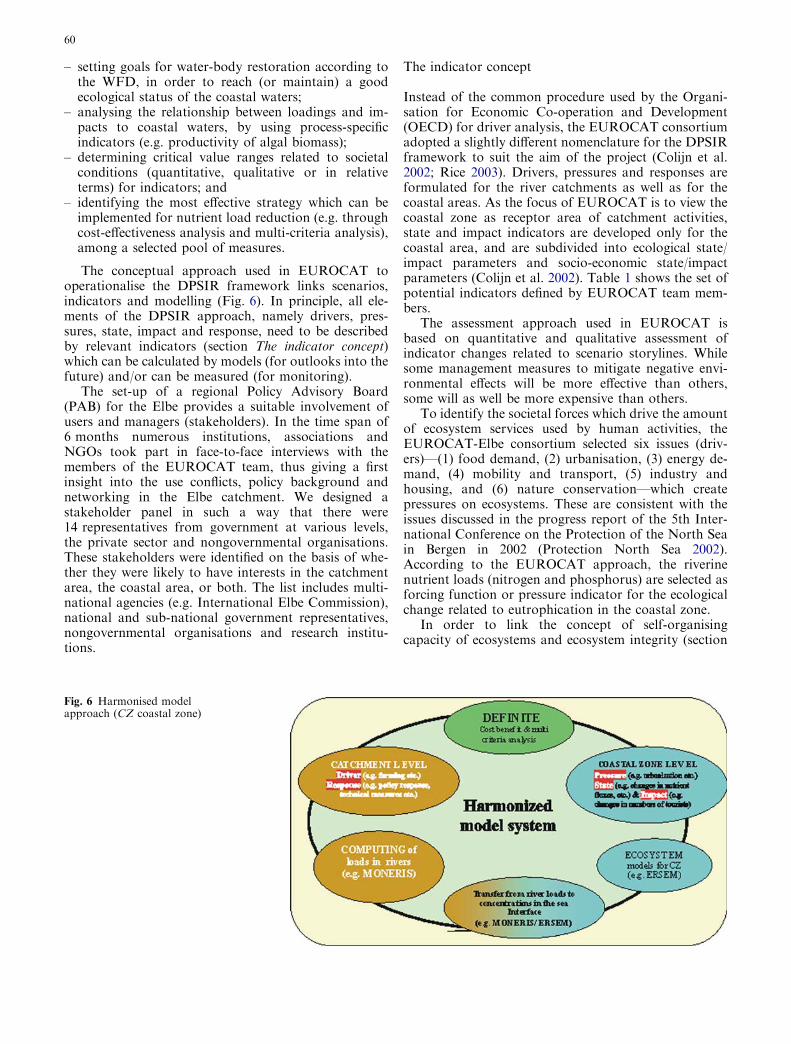
The conceptual approach used in EUROCAT tooperationalise the DPSIR framework links scenarios,indicators and modelling (Fig. 6). In principle, all ele-ments of the DPSIR approach, namely drivers, pres-sures, state, impact and response, need to be describedby relevant indicators (section The indicator concept)which can be calculated by models (for outlooks into thefuture) and/or can be measured (for monitoring).
The set-up of a regional Policy Advisory Board(PAB) for the Elbe provides a suitable involvement ofusers and managers (stakeholders). In the time span of6 months numerous institutions, associations andNGOs took part in face-to-face interviews with themembers of the EUROCAT team, thus giving a firstinsight into the use conflicts, policy background andnetworking in the Elbe catchment. We designed astakeholder panel in such a way that there were14 representatives from government at various levels,the private sector and nongovernmental organisations.These stakeholders were identified on the basis of whe-ther they were likely to have interests in the catchmentarea, the coastal area, or both. The list includes multi-national agencies (e.g. International Elbe Commission),national and sub-national government representatives,nongovernmental organisations and research institu-tions.
The indicator concept
Instead of the common procedure used by the Organi-sation for Economic Co-operation and Development(OECD) for driver analysis, the EUROCAT consortiumadopted a slightly different nomenclature for the DPSIRframework to suit the aim of the project (Colijn et al.2002; Rice 2003). Drivers, pressures and responses areformulated for the river catchments as well as for thecoastal areas. As the focus of EUROCAT is to view thecoastal zone as receptor area of catchment activities,state and impact indicators are developed only for thecoastal area, and are subdivided into ecological state/impact parameters and socio-economic state/impactparameters (Colijn et al. 2002). Table 1 shows the set ofpotential indicators defined by EUROCAT team mem-bers.
The assessment approach used in EUROCAT isbased on quantitative and qualitative assessment ofindicator changes related to scenario storylines. Whilesome management measures to mitigate negative envi-ronmental effects will be more effective than others,some will as well be more expensive than others.
To identify the societal forces which drive the amountof ecosystem services used by human activities, theEUROCAT-Elbe consortium selected six issues (driv-ers)—(1) food demand, (2) urbanisation, (3) energy de-mand, (4) mobility and transport, (5) industry andhousing, and (6) nature conservation—which createpressures on ecosystems. These are consistent with theissues discussed in the progress report of the 5th Inter-national Conference on the Protection of the North Seain Bergen in 2002 (Protection North Sea 2002).According to the EUROCAT approach, the riverinenutrient loads (nitrogen and phosphorus) are selected asforcing function or pressure indicator for the ecologicalchange related to eutrophication in the coastal zone.
In order to link the concept of self-organisingcapacity of ecosystems and ecosystem integrity (section
Fig. 6 Harmonised modelapproach (CZ coastal zone)
60
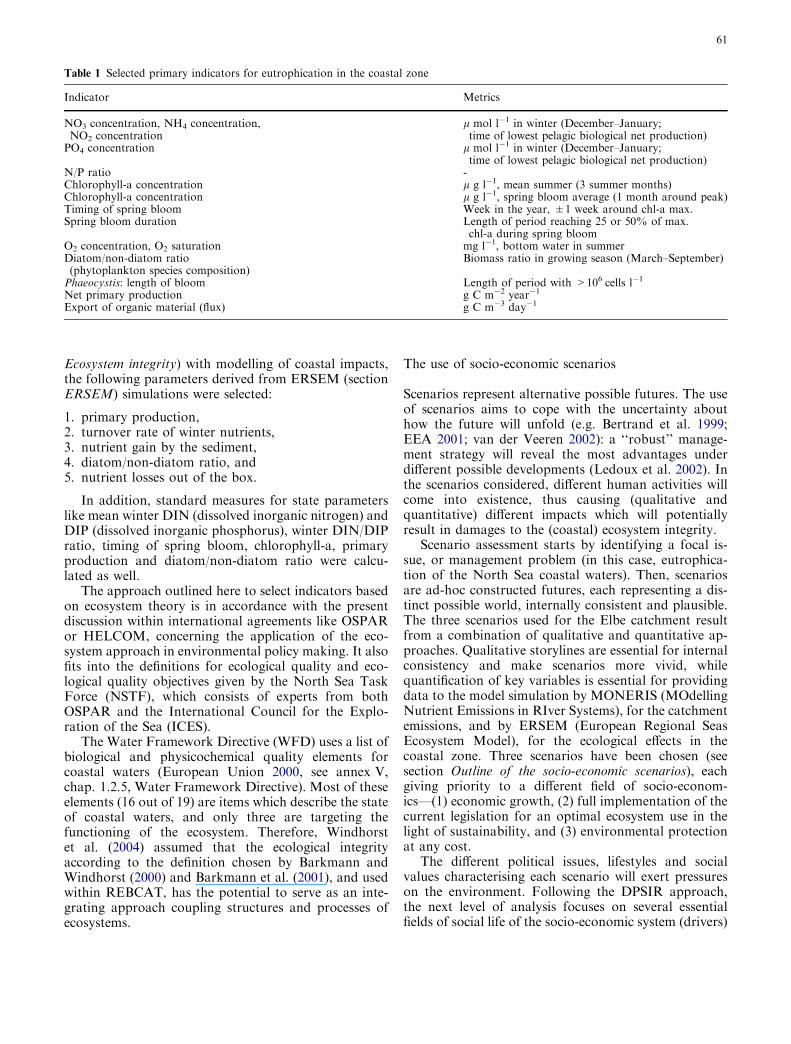
Ecosystem integrity) with modelling of coastal impacts,the following parameters derived from ERSEM (sectionERSEM) simulations were selected:
1. primary production,2. turnover rate of winter nutrients,3. nutrient gain by the sediment,4. diatom/non-diatom ratio, and5. nutrient losses out of the box.
In addition, standard measures for state parameterslike mean winter DIN (dissolved inorganic nitrogen) andDIP (dissolved inorganic phosphorus), winter DIN/DIPratio, timing of spring bloom, chlorophyll-a, primaryproduction and diatom/non-diatom ratio were calcu-lated as well.
The approach outlined here to select indicators basedon ecosystem theory is in accordance with the presentdiscussion within international agreements like OSPARor HELCOM, concerning the application of the eco-system approach in environmental policy making. It alsofits into the definitions for ecological quality and eco-logical quality objectives given by the North Sea TaskForce (NSTF), which consists of experts from bothOSPAR and the International Council for the Explo-ration of the Sea (ICES).
The Water Framework Directive (WFD) uses a list ofbiological and physicochemical quality elements forcoastal waters (European Union 2000, see annex V,chap. 1.2.5, Water Framework Directive). Most of theseelements (16 out of 19) are items which describe the stateof coastal waters, and only three are targeting thefunctioning of the ecosystem. Therefore, Windhorstet al. (2004) assumed that the ecological integrityaccording to the definition chosen by Barkmann andWindhorst (2000) and Barkmann et al. (2001), and usedwithin REBCAT, has the potential to serve as an inte-grating approach coupling structures and processes ofecosystems.
The use of socio-economic scenarios
Scenarios represent alternative possible futures. The useof scenarios aims to cope with the uncertainty abouthow the future will unfold (e.g. Bertrand et al. 1999;EEA 2001; van der Veeren 2002): a ‘‘robust’’ manage-ment strategy will reveal the most advantages underdifferent possible developments (Ledoux et al. 2002). Inthe scenarios considered, different human activities willcome into existence, thus causing (qualitative andquantitative) different impacts which will potentiallyresult in damages to the (coastal) ecosystem integrity.
Scenario assessment starts by identifying a focal is-sue, or management problem (in this case, eutrophica-tion of the North Sea coastal waters). Then, scenariosare ad-hoc constructed futures, each representing a dis-tinct possible world, internally consistent and plausible.The three scenarios used for the Elbe catchment resultfrom a combination of qualitative and quantitative ap-proaches. Qualitative storylines are essential for internalconsistency and make scenarios more vivid, whilequantification of key variables is essential for providingdata to the model simulation by MONERIS (MOdellingNutrient Emissions in RIver Systems), for the catchmentemissions, and by ERSEM (European Regional SeasEcosystem Model), for the ecological effects in thecoastal zone. Three scenarios have been chosen (seesection Outline of the socio-economic scenarios), eachgiving priority to a different field of socio-econom-ics—(1) economic growth, (2) full implementation of thecurrent legislation for an optimal ecosystem use in thelight of sustainability, and (3) environmental protectionat any cost.
The different political issues, lifestyles and socialvalues characterising each scenario will exert pressureson the environment. Following the DPSIR approach,the next level of analysis focuses on several essentialfields of social life of the socio-economic system (drivers)
Table 1 Selected primary indicators for eutrophication in the coastal zone
Indicator Metrics
NO3 concentration, NH4 concentration,NO2 concentration
l mol l�1 in winter (December–January;time of lowest pelagic biological net production)
PO4 concentration l mol l�1 in winter (December–January;time of lowest pelagic biological net production)
N/P ratio -Chlorophyll-a concentration l g l�1, mean summer (3 summer months)Chlorophyll-a concentration l g l�1, spring bloom average (1 month around peak)Timing of spring bloom Week in the year, ±1 week around chl-a max.Spring bloom duration Length of period reaching 25 or 50% of max.
chl-a during spring bloomO2 concentration, O2 saturation mg l�1, bottom water in summerDiatom/non-diatom ratio(phytoplankton species composition)
Biomass ratio in growing season (March–September)
Phaeocystis: length of bloom Length of period with >106 cells l�1
Net primary production g C m�2 year�1
Export of organic material (flux) g C m�3 day�1
61
which, in turn, depend on the societal value settingscharacterising different scenarios. The scenarios are theframework for evaluating different management mea-sures aiming at nutrient emission reduction in the Elbecatchment (see section Assessment for the ecosystemintegrity, Perspectives). Particularly the goals for nutri-ent reduction will be different under different scenarios(see sections Nutrient emissions in the Elbe catchment andtheir possible reduction and Effects of simulated river loadreductions to the coastal waters), due to the differentpriorities (maximum under the third scenario, andminimum under the first one).
Modelling tools and information exchange
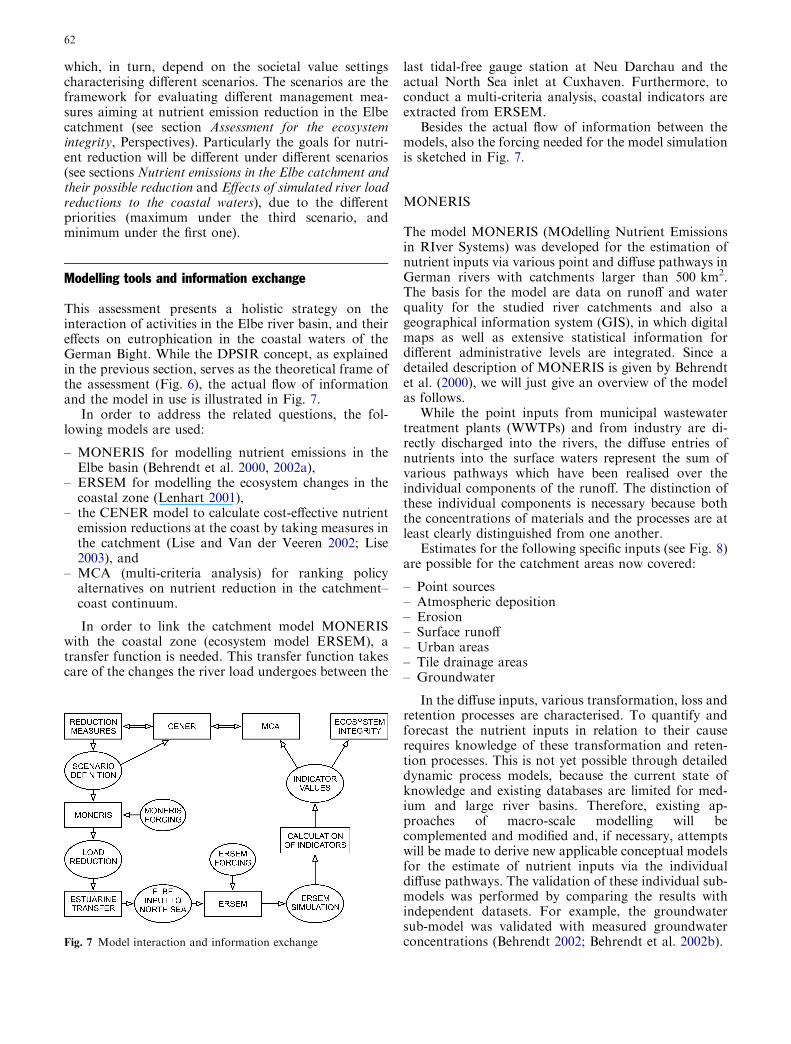
This assessment presents a holistic strategy on theinteraction of activities in the Elbe river basin, and theireffects on eutrophication in the coastal waters of theGerman Bight. While the DPSIR concept, as explainedin the previous section, serves as the theoretical frame ofthe assessment (Fig. 6), the actual flow of informationand the model in use is illustrated in Fig. 7.
In order to address the related questions, the fol-lowing models are used:
– MONERIS for modelling nutrient emissions in theElbe basin (Behrendt et al. 2000, 2002a),
– ERSEM for modelling the ecosystem changes in thecoastal zone (Lenhart 2001),
– the CENER model to calculate cost-effective nutrientemission reductions at the coast by taking measures inthe catchment (Lise and Van der Veeren 2002; Lise2003), and
– MCA (multi-criteria analysis) for ranking policyalternatives on nutrient reduction in the catchment–coast continuum.
In order to link the catchment model MONERISwith the coastal zone (ecosystem model ERSEM), atransfer function is needed. This transfer function takescare of the changes the river load undergoes between the
last tidal-free gauge station at Neu Darchau and theactual North Sea inlet at Cuxhaven. Furthermore, toconduct a multi-criteria analysis, coastal indicators areextracted from ERSEM.
Besides the actual flow of information between themodels, also the forcing needed for the model simulationis sketched in Fig. 7.
MONERIS
The model MONERIS (MOdelling Nutrient Emissionsin RIver Systems) was developed for the estimation ofnutrient inputs via various point and diffuse pathways inGerman rivers with catchments larger than 500 km2.The basis for the model are data on runoff and waterquality for the studied river catchments and also ageographical information system (GIS), in which digitalmaps as well as extensive statistical information fordifferent administrative levels are integrated. Since adetailed description of MONERIS is given by Behrendtet al. (2000), we will just give an overview of the modelas follows.
While the point inputs from municipal wastewatertreatment plants (WWTPs) and from industry are di-rectly discharged into the rivers, the diffuse entries ofnutrients into the surface waters represent the sum ofvarious pathways which have been realised over theindividual components of the runoff. The distinction ofthese individual components is necessary because boththe concentrations of materials and the processes are atleast clearly distinguished from one another.
Estimates for the following specific inputs (see Fig. 8)are possible for the catchment areas now covered:
– Point sources– Atmospheric deposition– Erosion– Surface runoff– Urban areas– Tile drainage areas– Groundwater
In the diffuse inputs, various transformation, loss andretention processes are characterised. To quantify andforecast the nutrient inputs in relation to their causerequires knowledge of these transformation and reten-tion processes. This is not yet possible through detaileddynamic process models, because the current state ofknowledge and existing databases are limited for med-ium and large river basins. Therefore, existing ap-proaches of macro-scale modelling will becomplemented and modified and, if necessary, attemptswill be made to derive new applicable conceptual modelsfor the estimate of nutrient inputs via the individualdiffuse pathways. The validation of these individual sub-models was performed by comparing the results withindependent datasets. For example, the groundwatersub-model was validated with measured groundwaterconcentrations (Behrendt 2002; Behrendt et al. 2002b).Fig. 7 Model interaction and information exchange
62
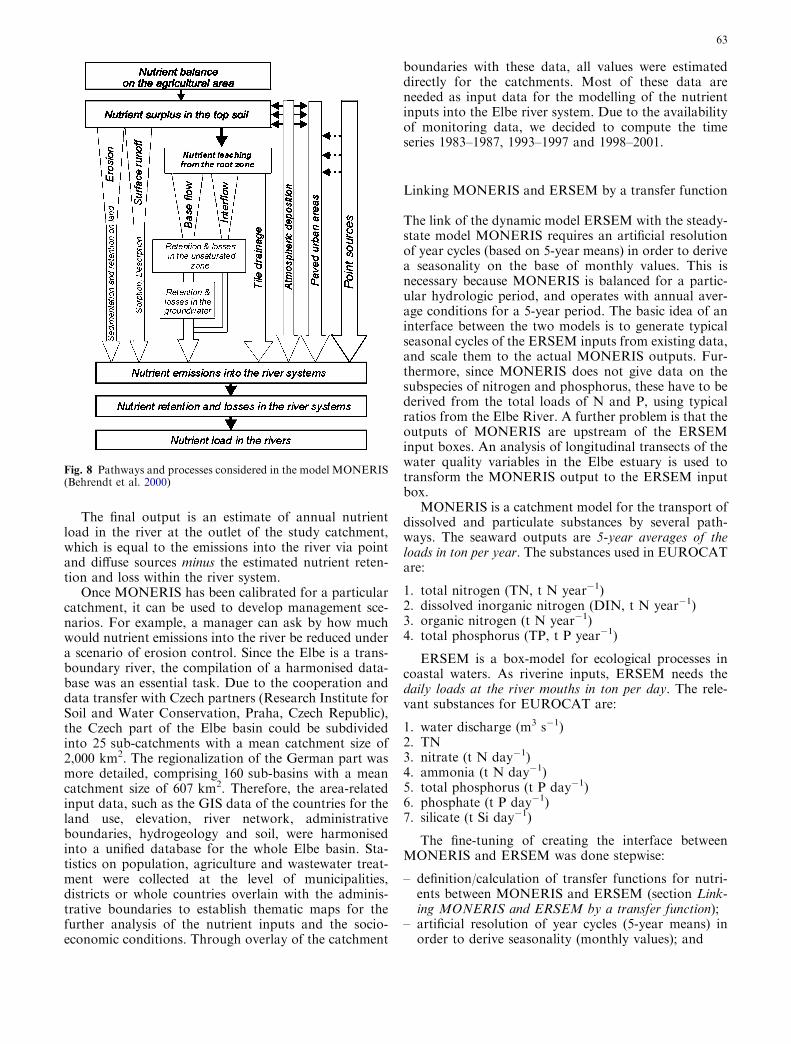
The final output is an estimate of annual nutrientload in the river at the outlet of the study catchment,which is equal to the emissions into the river via pointand diffuse sources minus the estimated nutrient reten-tion and loss within the river system.
Once MONERIS has been calibrated for a particularcatchment, it can be used to develop management sce-narios. For example, a manager can ask by how muchwould nutrient emissions into the river be reduced undera scenario of erosion control. Since the Elbe is a trans-boundary river, the compilation of a harmonised data-base was an essential task. Due to the cooperation anddata transfer with Czech partners (Research Institute forSoil and Water Conservation, Praha, Czech Republic),the Czech part of the Elbe basin could be subdividedinto 25 sub-catchments with a mean catchment size of2,000 km2. The regionalization of the German part wasmore detailed, comprising 160 sub-basins with a meancatchment size of 607 km2. Therefore, the area-relatedinput data, such as the GIS data of the countries for theland use, elevation, river network, administrativeboundaries, hydrogeology and soil, were harmonisedinto a unified database for the whole Elbe basin. Sta-tistics on population, agriculture and wastewater treat-ment were collected at the level of municipalities,districts or whole countries overlain with the adminis-trative boundaries to establish thematic maps for thefurther analysis of the nutrient inputs and the socio-economic conditions. Through overlay of the catchment
boundaries with these data, all values were estimateddirectly for the catchments. Most of these data areneeded as input data for the modelling of the nutrientinputs into the Elbe river system. Due to the availabilityof monitoring data, we decided to compute the timeseries 1983–1987, 1993–1997 and 1998–2001.
Linking MONERIS and ERSEM by a transfer function
The link of the dynamic model ERSEM with the steady-state model MONERIS requires an artificial resolutionof year cycles (based on 5-year means) in order to derivea seasonality on the base of monthly values. This isnecessary because MONERIS is balanced for a partic-ular hydrologic period, and operates with annual aver-age conditions for a 5-year period. The basic idea of aninterface between the two models is to generate typicalseasonal cycles of the ERSEM inputs from existing data,and scale them to the actual MONERIS outputs. Fur-thermore, since MONERIS does not give data on thesubspecies of nitrogen and phosphorus, these have to bederived from the total loads of N and P, using typicalratios from the Elbe River. A further problem is that theoutputs of MONERIS are upstream of the ERSEMinput boxes. An analysis of longitudinal transects of thewater quality variables in the Elbe estuary is used totransform the MONERIS output to the ERSEM inputbox.
MONERIS is a catchment model for the transport ofdissolved and particulate substances by several path-ways. The seaward outputs are 5-year averages of theloads in ton per year. The substances used in EUROCATare:
1. total nitrogen (TN, t N year�1)2. dissolved inorganic nitrogen (DIN, t N year�1)3. organic nitrogen (t N year�1)4. total phosphorus (TP, t P year�1)
ERSEM is a box-model for ecological processes incoastal waters. As riverine inputs, ERSEM needs thedaily loads at the river mouths in ton per day. The rele-vant substances for EUROCAT are:
1. water discharge (m3 s�1)2. TN3. nitrate (t N day�1)4. ammonia (t N day�1)5. total phosphorus (t P day�1)6. phosphate (t P day�1)7. silicate (t Si day�1)
The fine-tuning of creating the interface betweenMONERIS and ERSEM was done stepwise:
– definition/calculation of transfer functions for nutri-ents between MONERIS and ERSEM (section Link-ing MONERIS and ERSEM by a transfer function);
– artificial resolution of year cycles (5-year means) inorder to derive seasonality (monthly values); and
Fig. 8 Pathways and processes considered in the model MONERIS(Behrendt et al. 2000)
63
– data processing of MONERIS data output toERSEM data input.
From existing ERSEM input files, a 5-year period ischosen centred at the year of interest, e.g. 1995. Totake care of the problem of leap-years in the averagingprocess, the yearly data are interpolated to a regulartemporal grid of 0.002-year spacing. The yearly dataare then normalised (integral of the normalised timeseries=1). The five normalized yearly time series arethen averaged to give a standard normalised year.From the original yearly data for very ERSEM vari-able, the typical scaling factors for the relation of thesubspecies of nitrogen and phosphorus to the total Nand P loads are then calculated. The standard norma-lised yearly data for the total N and P loads (on the0.002-year grid) are then interpolated to the real daysof the reference year 1995, and multiplied by a transferfactor which is derived from the analysis of longitudi-nal transects of total N and P in the estuary. In thefinal step, these (normalised) reference year data aremultiplied by the MONERIS output TN and TP, giv-ing the ERSEM input for the standard year for totalnitrogen and phosphorus. Using the scaling factors fornitrate, ammonia and phosphate, the data for TN andTP are then used to generate the ERSEM input for theremaining variables.
Since there is no way to derive silicate loads from theMONERIS output, the original ERSEM input data forthe Elbe are only average according to the proceduredescribed above, as are the water discharges.
ERSEM
For the simulation of the response in the coastal zonecaused by changing nutrient loads from the river man-agement strategies, the ecosystem model ERSEM(European Regional Seas Ecosystem Model) has beenapplied. The ERSEM model (Baretta et al. 1995) hasbeen used to simulate reduction scenarios in a number ofcases, both for the North Sea (Lenhart et al. 1995; Ru-ardij and Van Raaphorst 1995; OSPAR 1998; Lenhart2001) as well as for the continental coastal shelf region(Heath et al. 2002).
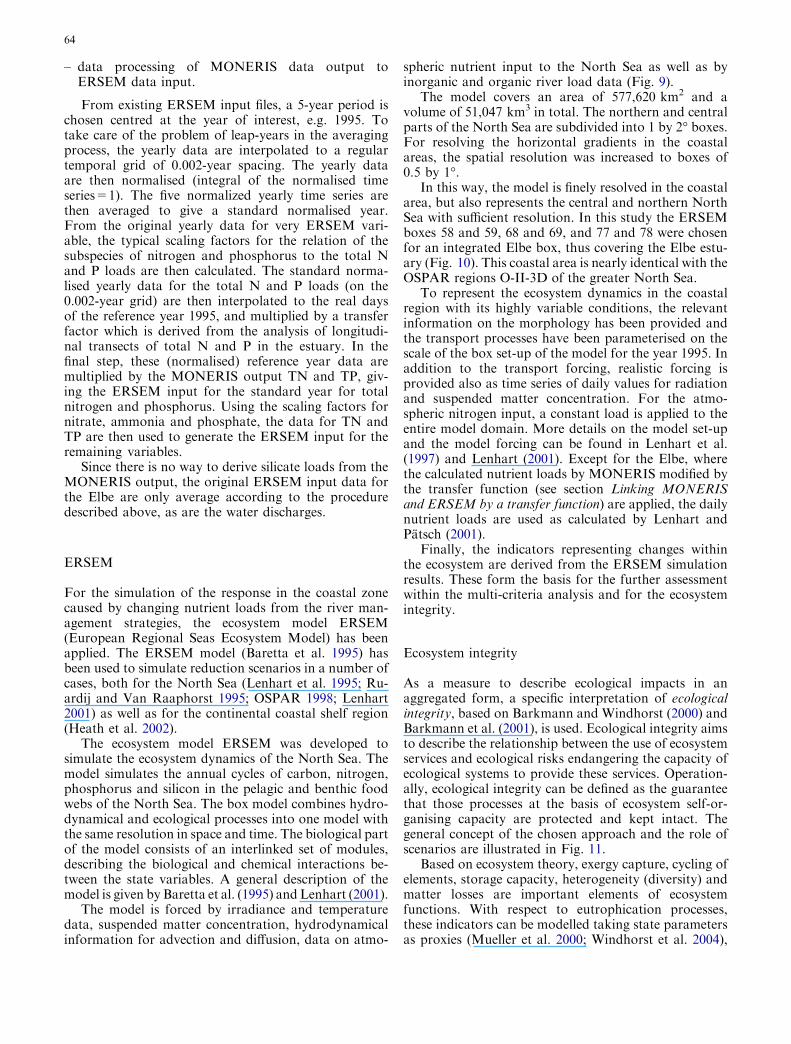
The ecosystem model ERSEM was developed tosimulate the ecosystem dynamics of the North Sea. Themodel simulates the annual cycles of carbon, nitrogen,phosphorus and silicon in the pelagic and benthic foodwebs of the North Sea. The box model combines hydro-dynamical and ecological processes into one model withthe same resolution in space and time. The biological partof the model consists of an interlinked set of modules,describing the biological and chemical interactions be-tween the state variables. A general description of themodel is given by Baretta et al. (1995) and Lenhart (2001).
The model is forced by irradiance and temperaturedata, suspended matter concentration, hydrodynamicalinformation for advection and diffusion, data on atmo-
spheric nutrient input to the North Sea as well as byinorganic and organic river load data (Fig. 9).
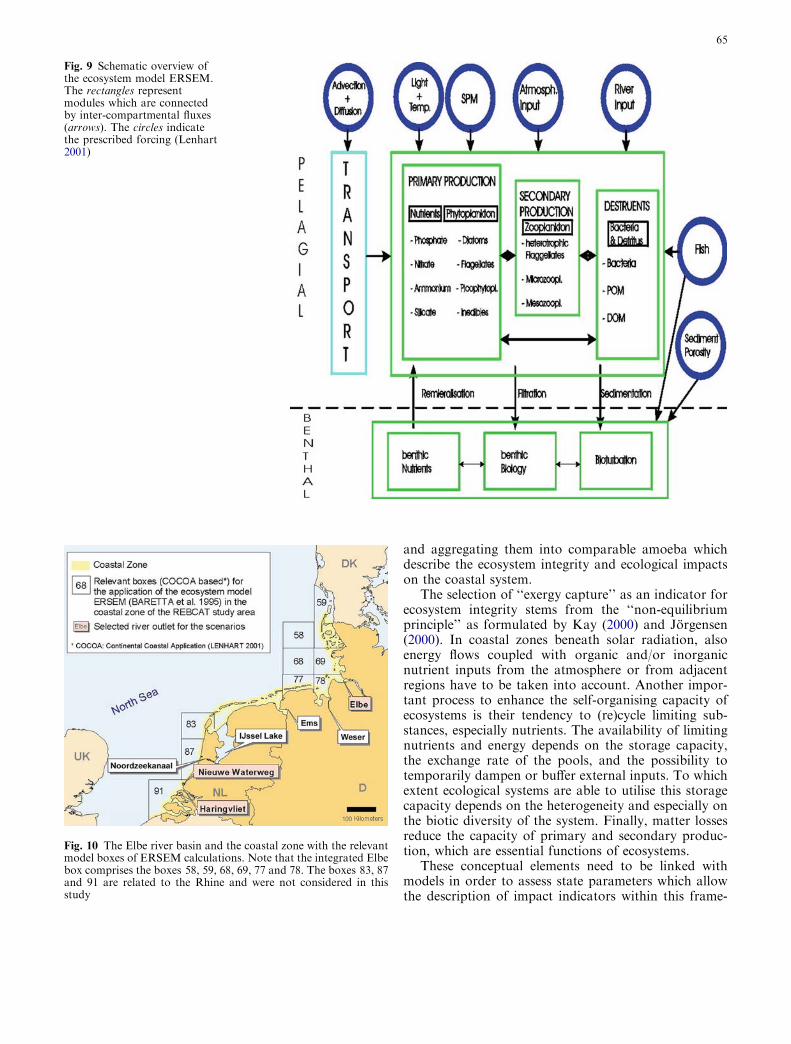
The model covers an area of 577,620 km2 and avolume of 51,047 km3 in total. The northern and centralparts of the North Sea are subdivided into 1 by 2� boxes.For resolving the horizontal gradients in the coastalareas, the spatial resolution was increased to boxes of0.5 by 1�.
In this way, the model is finely resolved in the coastalarea, but also represents the central and northern NorthSea with sufficient resolution. In this study the ERSEMboxes 58 and 59, 68 and 69, and 77 and 78 were chosenfor an integrated Elbe box, thus covering the Elbe estu-ary (Fig. 10). This coastal area is nearly identical with theOSPAR regions O-II-3D of the greater North Sea.
To represent the ecosystem dynamics in the coastalregion with its highly variable conditions, the relevantinformation on the morphology has been provided andthe transport processes have been parameterised on thescale of the box set-up of the model for the year 1995. Inaddition to the transport forcing, realistic forcing isprovided also as time series of daily values for radiationand suspended matter concentration. For the atmo-spheric nitrogen input, a constant load is applied to theentire model domain. More details on the model set-upand the model forcing can be found in Lenhart et al.(1997) and Lenhart (2001). Except for the Elbe, wherethe calculated nutrient loads by MONERIS modified bythe transfer function (see section Linking MONERISand ERSEM by a transfer function) are applied, the dailynutrient loads are used as calculated by Lenhart andPatsch (2001).
Finally, the indicators representing changes withinthe ecosystem are derived from the ERSEM simulationresults. These form the basis for the further assessmentwithin the multi-criteria analysis and for the ecosystemintegrity.
Ecosystem integrity
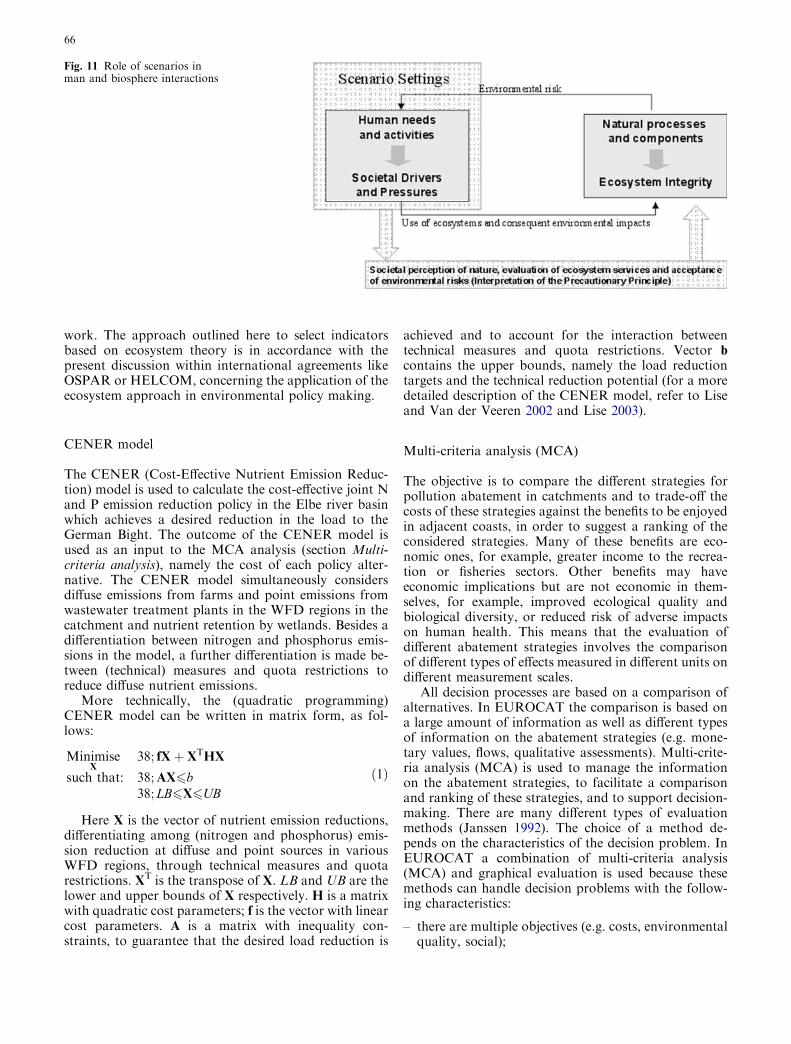
As a measure to describe ecological impacts in anaggregated form, a specific interpretation of ecologicalintegrity, based on Barkmann and Windhorst (2000) andBarkmann et al. (2001), is used. Ecological integrity aimsto describe the relationship between the use of ecosystemservices and ecological risks endangering the capacity ofecological systems to provide these services. Operation-ally, ecological integrity can be defined as the guaranteethat those processes at the basis of ecosystem self-or-ganising capacity are protected and kept intact. Thegeneral concept of the chosen approach and the role ofscenarios are illustrated in Fig. 11.
Based on ecosystem theory, exergy capture, cycling ofelements, storage capacity, heterogeneity (diversity) andmatter losses are important elements of ecosystemfunctions. With respect to eutrophication processes,these indicators can be modelled taking state parametersas proxies (Mueller et al. 2000; Windhorst et al. 2004),
64
and aggregating them into comparable amoeba whichdescribe the ecosystem integrity and ecological impactson the coastal system.
The selection of ‘‘exergy capture’’ as an indicator forecosystem integrity stems from the ‘‘non-equilibriumprinciple’’ as formulated by Kay (2000) and Jorgensen(2000). In coastal zones beneath solar radiation, alsoenergy flows coupled with organic and/or inorganicnutrient inputs from the atmosphere or from adjacentregions have to be taken into account. Another impor-tant process to enhance the self-organising capacity ofecosystems is their tendency to (re)cycle limiting sub-stances, especially nutrients. The availability of limitingnutrients and energy depends on the storage capacity,the exchange rate of the pools, and the possibility totemporarily dampen or buffer external inputs. To whichextent ecological systems are able to utilise this storagecapacity depends on the heterogeneity and especially onthe biotic diversity of the system. Finally, matter lossesreduce the capacity of primary and secondary produc-tion, which are essential functions of ecosystems.
These conceptual elements need to be linked withmodels in order to assess state parameters which allowthe description of impact indicators within this frame-
Fig. 9 Schematic overview ofthe ecosystem model ERSEM.The rectangles representmodules which are connectedby inter-compartmental fluxes(arrows). The circles indicatethe prescribed forcing (Lenhart2001)
Fig. 10 The Elbe river basin and the coastal zone with the relevantmodel boxes of ERSEM calculations. Note that the integrated Elbebox comprises the boxes 58, 59, 68, 69, 77 and 78. The boxes 83, 87and 91 are related to the Rhine and were not considered in thisstudy
65
work. The approach outlined here to select indicatorsbased on ecosystem theory is in accordance with thepresent discussion within international agreements likeOSPAR or HELCOM, concerning the application of theecosystem approach in environmental policy making.
CENER model
The CENER (Cost-Effective Nutrient Emission Reduc-tion) model is used to calculate the cost-effective joint Nand P emission reduction policy in the Elbe river basinwhich achieves a desired reduction in the load to theGerman Bight. The outcome of the CENER model isused as an input to the MCA analysis (section Multi-criteria analysis), namely the cost of each policy alter-native. The CENER model simultaneously considersdiffuse emissions from farms and point emissions fromwastewater treatment plants in the WFD regions in thecatchment and nutrient retention by wetlands. Besides adifferentiation between nitrogen and phosphorus emis-sions in the model, a further differentiation is made be-tween (technical) measures and quota restrictions toreduce diffuse nutrient emissions.
More technically, the (quadratic programming)CENER model can be written in matrix form, as fol-lows:
MinimiseX
38; fXþ XTHX
such that: 38;AX6b38; LB6X6UB
ð1Þ
Here X is the vector of nutrient emission reductions,differentiating among (nitrogen and phosphorus) emis-sion reduction at diffuse and point sources in variousWFD regions, through technical measures and quotarestrictions. XT is the transpose of X. LB and UB are thelower and upper bounds of X respectively. H is a matrixwith quadratic cost parameters; f is the vector with linearcost parameters. A is a matrix with inequality con-straints, to guarantee that the desired load reduction is
achieved and to account for the interaction betweentechnical measures and quota restrictions. Vector b
contains the upper bounds, namely the load reductiontargets and the technical reduction potential (for a moredetailed description of the CENER model, refer to Liseand Van der Veeren 2002 and Lise 2003).
Multi-criteria analysis (MCA)
The objective is to compare the different strategies forpollution abatement in catchments and to trade-off thecosts of these strategies against the benefits to be enjoyedin adjacent coasts, in order to suggest a ranking of theconsidered strategies. Many of these benefits are eco-nomic ones, for example, greater income to the recrea-tion or fisheries sectors. Other benefits may haveeconomic implications but are not economic in them-selves, for example, improved ecological quality andbiological diversity, or reduced risk of adverse impactson human health. This means that the evaluation ofdifferent abatement strategies involves the comparisonof different types of effects measured in different units ondifferent measurement scales.
All decision processes are based on a comparison ofalternatives. In EUROCAT the comparison is based ona large amount of information as well as different typesof information on the abatement strategies (e.g. mone-tary values, flows, qualitative assessments). Multi-crite-ria analysis (MCA) is used to manage the informationon the abatement strategies, to facilitate a comparisonand ranking of these strategies, and to support decision-making. There are many different types of evaluationmethods (Janssen 1992). The choice of a method de-pends on the characteristics of the decision problem. InEUROCAT a combination of multi-criteria analysis(MCA) and graphical evaluation is used because thesemethods can handle decision problems with the follow-ing characteristics:
– there are multiple objectives (e.g. costs, environmentalquality, social);
Fig. 11 Role of scenarios inman and biosphere interactions
66
– these objectives are measured in different units (e.g.M€, t year�1);
– there is a finite number of alternatives to compare;– it is required to rank alternatives, reject inferior
alternatives, and/or choose the best alternative.
Multi-criteria methods transform the input, perfor-mance scores and weights, to a ranking using a decisionrule specific to that method. The MCA method ‘‘weigh-ted summation’’ is a good candidate to use in EURO-CAT. Weighted summation is theoretically wellestablished, can be easily explained, and is easy to use(Janssen 1992; Janssen et al. 2001). There is therefore lesschance that the user will view the method as a ‘‘blackbox’’. The formula used for weighted summation is:
score aj� �¼XN
i¼1wi � sij ð2Þ
where A is the set of alternatives with aj (j=1..M), C isthe set of effects with ci (i=1..N), sij is the score oralternative aj for effect ci, sij is the standardised score ofalternative aj for effect ci, and wi is the weight of effect ci.
The result is a set of rankings linked to the prioritiesof the various stakeholders involved (section The DPSIRapproach) Because priorities differ, it is not expected thatone strategy is best for all stakeholders. Rather thanproducing the best alternative, the MCA provides in-sight in the relation between priorities and alternatives.The results are presented to the stakeholders for feed-back. This feedback has been used to improve theabatement strategies.
Results
Outline of the socio-economic scenarios
Three scenarios have been assessed, each giving partic-ular relevance to one of three aspects which play a rel-evant role in the present environmental and socio-cultural situation, namely (1) market liberalisation andthe related consumerism and globalisation; (2) centralleadership of the EU, and (3) as a countertrend toglobalisation, a trend towards regionalized and self-based economy and life. The time horizon of all sce-narios spans the period 1995 (reference year) to 2025.Scenario 1 (business as usual) and 3 (deep green) pindown the outer limits of plausibility, thus delineatingextreme borders, while scenario 2 (policy targets) illus-trates a middle position, representing somehow the mostlikely future (Nunneri et al. 2002). The storylines arebriefly reported below.
1. Business As Usual scenario (BAU): the present trendstowards globalisation and resource exploitation areprojected into the future. Priority is given to eco-nomic growth. Unrepressed individual needs lead toincreased consumerism. This, combined with the
globalisation trend, causes an increase of transpor-tation, low-cost productive processes and free mar-kets. People are short-term planners, who give natureexclusively an aesthetic and use value. In such a risk-inclined society, environmental targets are laxlyimplemented and enforced.
2. Policy Target scenario (PT): the European Union(EU) gains leadership in economic, social and envi-ronmental policy, promoting a consistent integrativepolicy. The present trend towards globalisation stops(e.g. restrictions on market liberalisation, restrictionson trade). Increased awareness of environmental vul-nerability leads to incremented environmental pro-tection. The EU strongly enforces clear directives andexplicit regulations in order to achieve sustainability.People are educated to be respectful of regulations,and are aware of the need for nature preservation, thusembracing the way towards sustainable developmentfor the sake of future generations by seeking an opti-mum mix of economic development and protection ofresources for the future.
3. Deep Green scenario (DG): angered by BSE crises,food contamination scandals (such as the nitrophenescandal in Germany in 2002), the Elbe flooding andother catastrophes, people turn spontaneously to a‘‘greener’’ lifestyle, aimed at valorising and protectingthe environment. This implies a change in mentalitywith respect to the present situation. The inversion ofthe globalisation trend results in regionalized life,characterised by self-supply, mutual help and com-munitarian values. Priority is given to environmentalissues and nature conservation (over-compliance withthe WFD). People are long-term, risk-averse plan-ners, who attempt to minimise environmental risk,even at high costs.
The different political issues, lifestyles and socialvalues characterising each scenario will exert pressureson the environment. Following the DPSIR approach,the next level of analysis focuses on several essentialfields of social life of the socio-economic system (drivers)which, in turn, depend on the societal value settingscharacterising different scenarios.
In this context, food demand can be considered oneof the most relevant drivers connected to eutrophication.In fact, given the good quality of WWTPs in the Elbecatchment (Reincke, personal communication), diffusenutrient emissions due to agriculture at the catchmentlevel will strongly depend on the quantity and quality offood demand (Isermann and Isermann 2001).
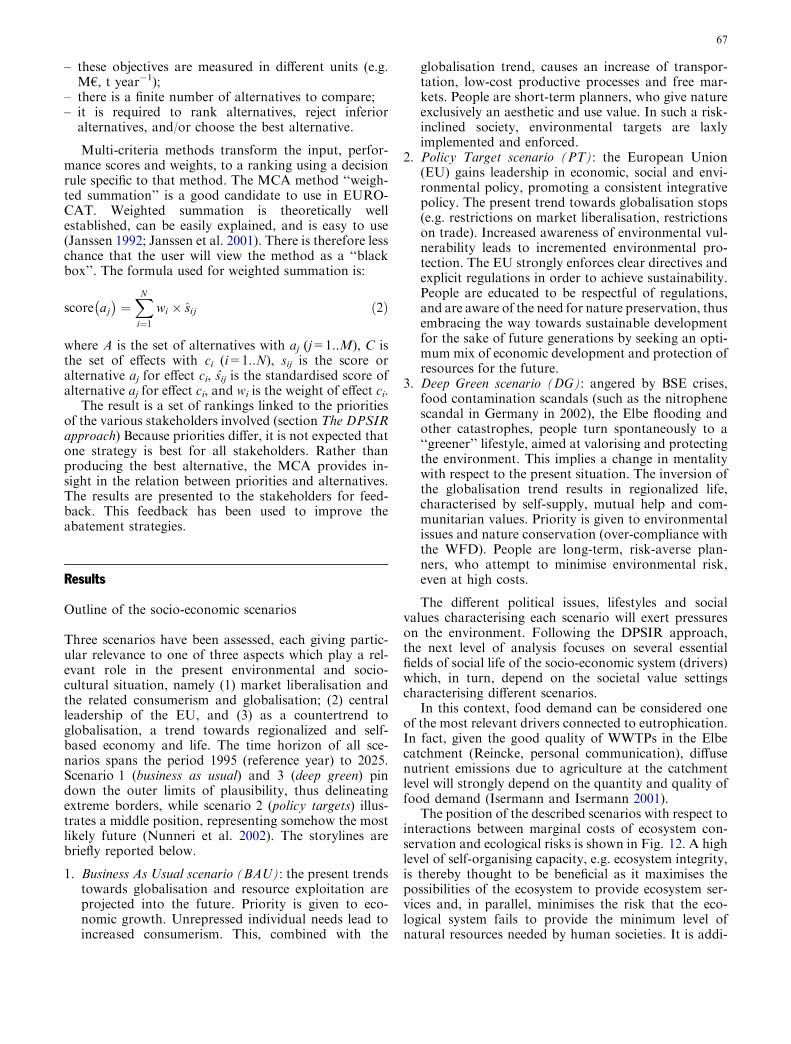
The position of the described scenarios with respect tointeractions between marginal costs of ecosystem con-servation and ecological risks is shown in Fig. 12. A highlevel of self-organising capacity, e.g. ecosystem integrity,is thereby thought to be beneficial as it maximises thepossibilities of the ecosystem to provide ecosystem ser-vices and, in parallel, minimises the risk that the eco-logical system fails to provide the minimum level ofnatural resources needed by human societies. It is addi-
67
tionally assumed that, with an increasing use of ecosys-tem services, socio-economic risks decrease as the re-source availability increases, which is in accordance withan attitude averting economic risks. In parallel, however,the ecosystem integrity is decreasing as well, causingincreasing ecological risks.(Windhorst et al. 2004).
As example for ecological risks in coastal zones, theincreasing occurrence of anoxic zones could be taken(Niermann Rachor and Albrecht 1983; Niermann 1990).Risk aversion requires the reduced use of ecosystem ser-vices, and thus possibilities to reduce the nutrient lossescaused by, for example, different land use systems in thecatchments could be studied. As these possibilities areconnected either with lower yields or with higher tech-nical efforts, it is necessary to keep both economic andecological risks as low as feasible (Windhorst et al. 2004).
The scenario settings described above are in agree-ment with those used in other projects like GLOWAElbe (Global Change in the Hydrological Cycle, http://www.glowa.org/eng/elbe) and also reflects, although notentailing climate change, the basic ideas underlyingIPCC scenarios A1 and B2 (IPCC 2000). Based on thescenarios described, different strategies for nutrientabatement are considered and evaluated.
The natural background as a ‘‘yardstick’’
The general objective is to gain insight in the back-ground or natural concentrations of nutrients in theElbe basin, thus representing the natural reference level.With regard to natural background concentrations, wehave adopted the definition of Laane (1992): ‘‘Naturalbackground concentrations are defined as those concen-trations that could be found in the environment in theabsence of any human activity’’.
Reference conditions for the various ecologicalcomponents (phytoplankton, phyto- and zoobenthos,macrophytes and fish) in inland waters are related tonutrient concentrations and not to nutrient emissions or
loadings. This reference condition is important to definethe optimal concentration (e.g. target levels) under hu-man influence. Based only on this knowledge, manage-ment measures can be evaluated. Knowledge of naturalbackground is necessary in relation to the achievementof water quality guidelines, i.e. good ecological waterconditions as the basis of reference conditions, i.e. in theabsence of human influence. To achieve this aim, it is notsufficient just to model nutrient emissions by consideringindividual pathways from diffuse and point sources. Thisallows only a limited analysis of the sources of theseemissions; in particular, one cannot quantify the pro-portion of emissions attributable to agriculture. This isonly possible when, in addition, the emissions for nat-ural background conditions, i.e. the quantity of emis-sions independent of human influence, are modelled.
In relation to the Water Framework Directive(WFD), a ‘‘nutrient background scenario’’ for the studysystem, based on calculated background concentrationsfor the determination of reference conditions, is carriedout. The general objective is to gain insight into thebackground or natural concentrations of nutrients in theElbe basin, thus representing the natural reference level.
In the following, an attempt is made to determinerealistic background emissions based on the mean an-nual discharge conditions for 1993–1997, and the fol-lowing defined conditions.
– Nutrient inputs from point sources and urban areasare nonexistent. The same applies to inputs fromdrainage.
– Areas which are agricultural or urban today areconsidered as woodland.
– With the exception of areas subject to natural erosion(Alpine and foothills), soil input through erosion isignored.
– There is a surplus of around 5 kg N ha�1 year�1) ofnitrogen emissions to the air over nitrogen depositionunder background conditions, which applies to allregions.
Fig. 12 Principal interactionsbetween marginal costs ofecosystem conservation andecological risks (Nunneri et al.2002)
68
– The P concentrations in groundwater of all wetlandsis the same.
– The ratio of total to dissolved phosphorus concen-trations under anaerobic groundwater conditions is1.5, instead of 2.5.
On the basis of these statements, and using a path-way-related model like MONERIS (section MONE-RIS), it is possible to calculate both nutrient loadingsand concentration with background conditions forindividual catchments.
For the calculated background concentrations for thedetermination of reference conditions in relation to theWater Framework Directive (WFD), it has to be borne inmind that the calculated concentrations have a retentionfactor dependent on the hydrological and morphologicalconditions in the water bodies. The calculated back-ground values clearly represent an upper limit of ex-pected nutrient concentrations under backgroundconditions. From the estimates of nutrient emissionsunder background conditions, it is possible to distinguishthe proportion of emissions related to human activities,namely agriculture, forestry and urban activities.
Nutrient emissions in the Elbe catchmentand their possible reduction
The following results refer to the German part of theElbe catchment, as they were published recently byBehrendt et al. (2003). The estimation of the nutrientemissions was carried out for 160 different catchment
areas covering the Elbe basin. For all catchments, thesame method was applied. All calculations were done byconsideration of the different flow conditions within thetime periods, and for normalised conditions to detect thechanges caused by human activities. The results of thecalculations of the nutrient emissions into the Germanparts of the Elbe river basins are presented in Tables 2and 3, and Figs. 13, 14 and 15.
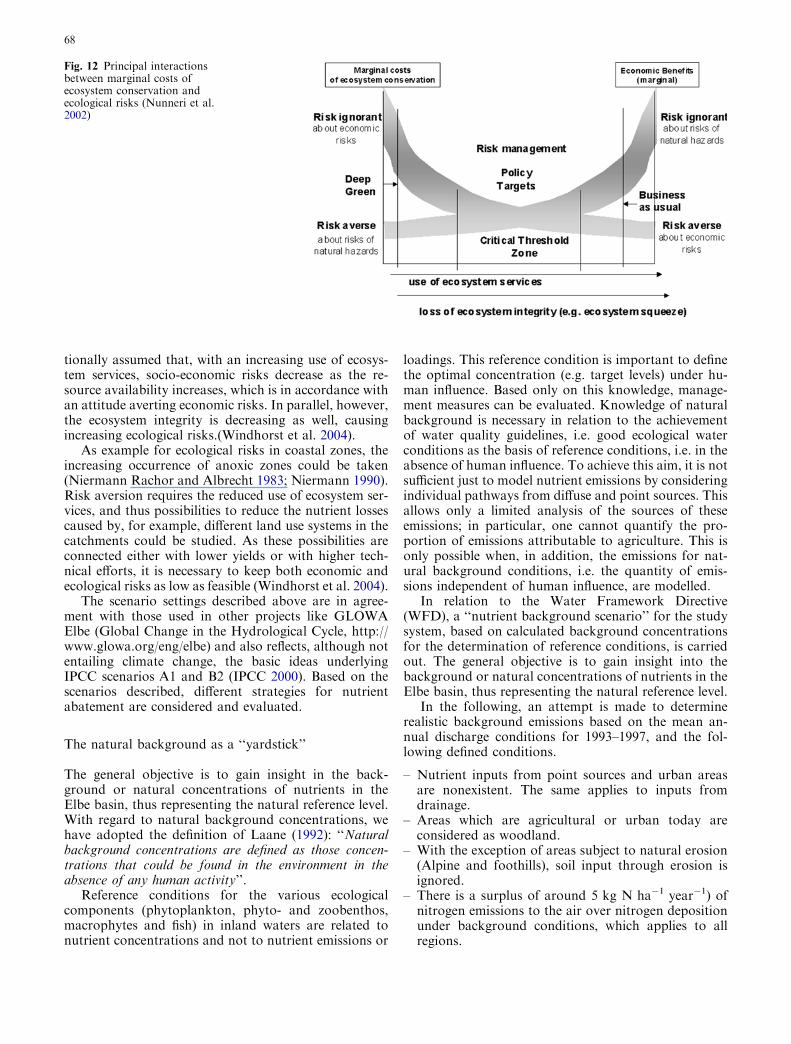
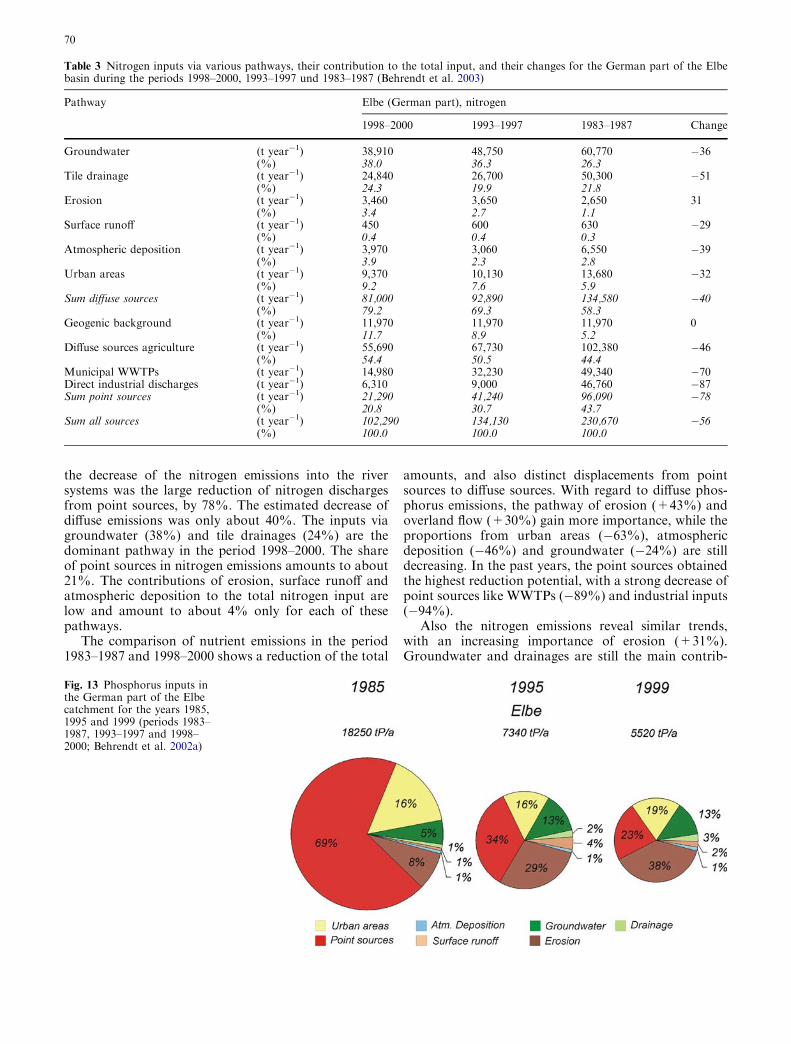
The total phosphorus emissions into the Elbe riverbasin were about 5.53 kt P year�1 in the period 1998–2000 (Fig. 13, Table 2). Compared with the period1983–1987, the phosphorus emissions were reduced byabout 12.7 kt P year�1 or 70%. The target of a 50%reduction of the phosphorus loads into the North Seawas reached. Again, the decrease of phosphorus emis-sions is mainly caused by a 90% reduction of pointsources. The decrease of diffuse phosphorus emissionswas larger than for nitrogen, which is caused by a 59%reduction of the emissions from urban areas. In spite ofthe enormous reduction of phosphorus discharges frompoint sources, these sources remain the dominant path-way of phosphorus emissions, with 27% in the period1998–2000. Among the diffuse pathways, emissions byerosion dominate and represent 26% of the total input.
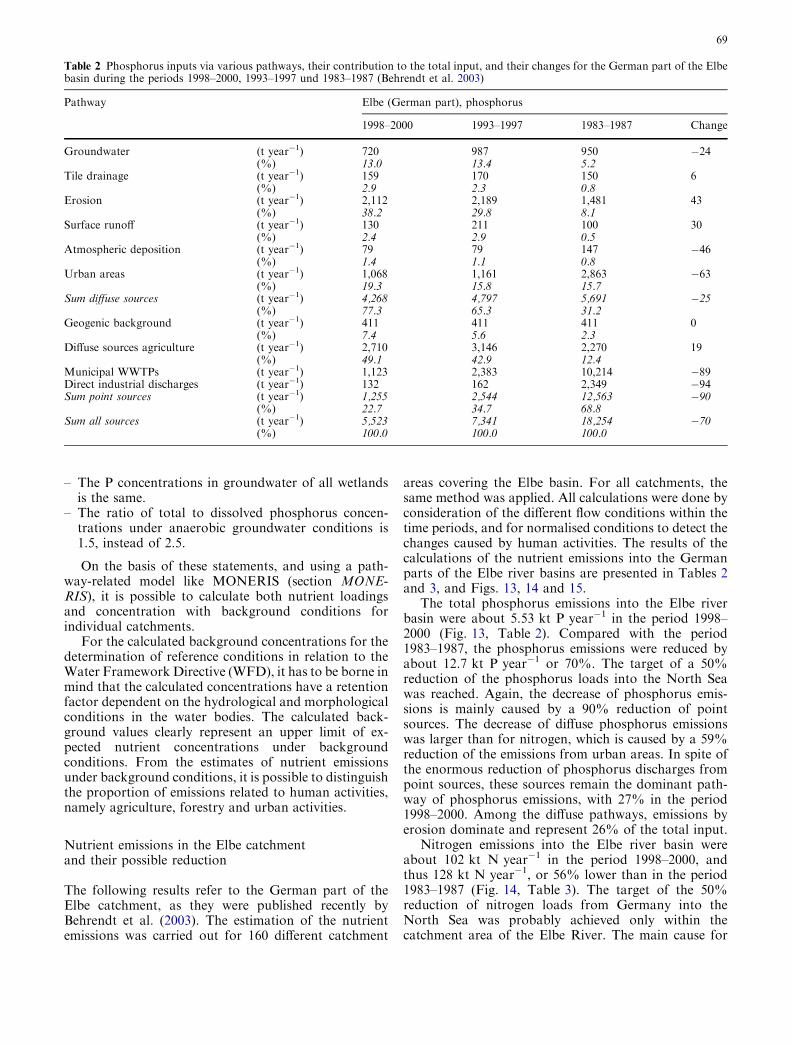
Nitrogen emissions into the Elbe river basin wereabout 102 kt N year�1 in the period 1998–2000, andthus 128 kt N year�1, or 56% lower than in the period1983–1987 (Fig. 14, Table 3). The target of the 50%reduction of nitrogen loads from Germany into theNorth Sea was probably achieved only within thecatchment area of the Elbe River. The main cause for
Table 2 Phosphorus inputs via various pathways, their contribution to the total input, and their changes for the German part of the Elbebasin during the periods 1998–2000, 1993–1997 und 1983–1987 (Behrendt et al. 2003)
Pathway Elbe (German part), phosphorus
1998–2000 1993–1997 1983–1987 Change
Groundwater (t year�1) 720 987 950 �24(%) 13.0 13.4 5.2
Tile drainage (t year�1) 159 170 150 6(%) 2.9 2.3 0.8
Erosion (t year�1) 2,112 2,189 1,481 43(%) 38.2 29.8 8.1
Surface runoff (t year�1) 130 211 100 30(%) 2.4 2.9 0.5
Atmospheric deposition (t year�1) 79 79 147 �46(%) 1.4 1.1 0.8
Urban areas (t year�1) 1,068 1,161 2,863 �63(%) 19.3 15.8 15.7
Sum diffuse sources (t year�1) 4,268 4,797 5,691 �25(%) 77.3 65.3 31.2
Geogenic background (t year�1) 411 411 411 0(%) 7.4 5.6 2.3
Diffuse sources agriculture (t year�1) 2,710 3,146 2,270 19(%) 49.1 42.9 12.4
Municipal WWTPs (t year�1) 1,123 2,383 10,214 �89Direct industrial discharges (t year�1) 132 162 2,349 �94Sum point sources (t year�1) 1,255 2,544 12,563 �90
(%) 22.7 34.7 68.8Sum all sources (t year�1) 5,523 7,341 18,254 �70
(%) 100.0 100.0 100.0
69
the decrease of the nitrogen emissions into the riversystems was the large reduction of nitrogen dischargesfrom point sources, by 78%. The estimated decrease ofdiffuse emissions was only about 40%. The inputs viagroundwater (38%) and tile drainages (24%) are thedominant pathway in the period 1998–2000. The shareof point sources in nitrogen emissions amounts to about21%. The contributions of erosion, surface runoff andatmospheric deposition to the total nitrogen input arelow and amount to about 4% only for each of thesepathways.
The comparison of nutrient emissions in the period1983–1987 and 1998–2000 shows a reduction of the total
amounts, and also distinct displacements from pointsources to diffuse sources. With regard to diffuse phos-phorus emissions, the pathway of erosion (+43%) andoverland flow (+30%) gain more importance, while theproportions from urban areas (�63%), atmosphericdeposition (�46%) and groundwater (�24%) are stilldecreasing. In the past years, the point sources obtainedthe highest reduction potential, with a strong decrease ofpoint sources like WWTPs (�89%) and industrial inputs(�94%).
Also the nitrogen emissions reveal similar trends,with an increasing importance of erosion (+31%).Groundwater and drainages are still the main contrib-
Fig. 13 Phosphorus inputs inthe German part of the Elbecatchment for the years 1985,1995 and 1999 (periods 1983–1987, 1993–1997 and 1998–2000; Behrendt et al. 2002a)
Table 3 Nitrogen inputs via various pathways, their contribution to the total input, and their changes for the German part of the Elbebasin during the periods 1998–2000, 1993–1997 und 1983–1987 (Behrendt et al. 2003)
Pathway Elbe (German part), nitrogen
1998–2000 1993–1997 1983–1987 Change
Groundwater (t year�1) 38,910 48,750 60,770 �36(%) 38.0 36.3 26.3
Tile drainage (t year�1) 24,840 26,700 50,300 �51(%) 24.3 19.9 21.8
Erosion (t year�1) 3,460 3,650 2,650 31(%) 3.4 2.7 1.1
Surface runoff (t year�1) 450 600 630 �29(%) 0.4 0.4 0.3
Atmospheric deposition (t year�1) 3,970 3,060 6,550 �39(%) 3.9 2.3 2.8
Urban areas (t year�1) 9,370 10,130 13,680 �32(%) 9.2 7.6 5.9
Sum diffuse sources (t year�1) 81,000 92,890 134,580 �40(%) 79.2 69.3 58.3
Geogenic background (t year�1) 11,970 11,970 11,970 0(%) 11.7 8.9 5.2
Diffuse sources agriculture (t year�1) 55,690 67,730 102,380 �46(%) 54.4 50.5 44.4
Municipal WWTPs (t year�1) 14,980 32,230 49,340 �70Direct industrial discharges (t year�1) 6,310 9,000 46,760 �87Sum point sources (t year�1) 21,290 41,240 96,090 �78
(%) 20.8 30.7 43.7Sum all sources (t year�1) 102,290 134,130 230,670 �56
(%) 100.0 100.0 100.0
70
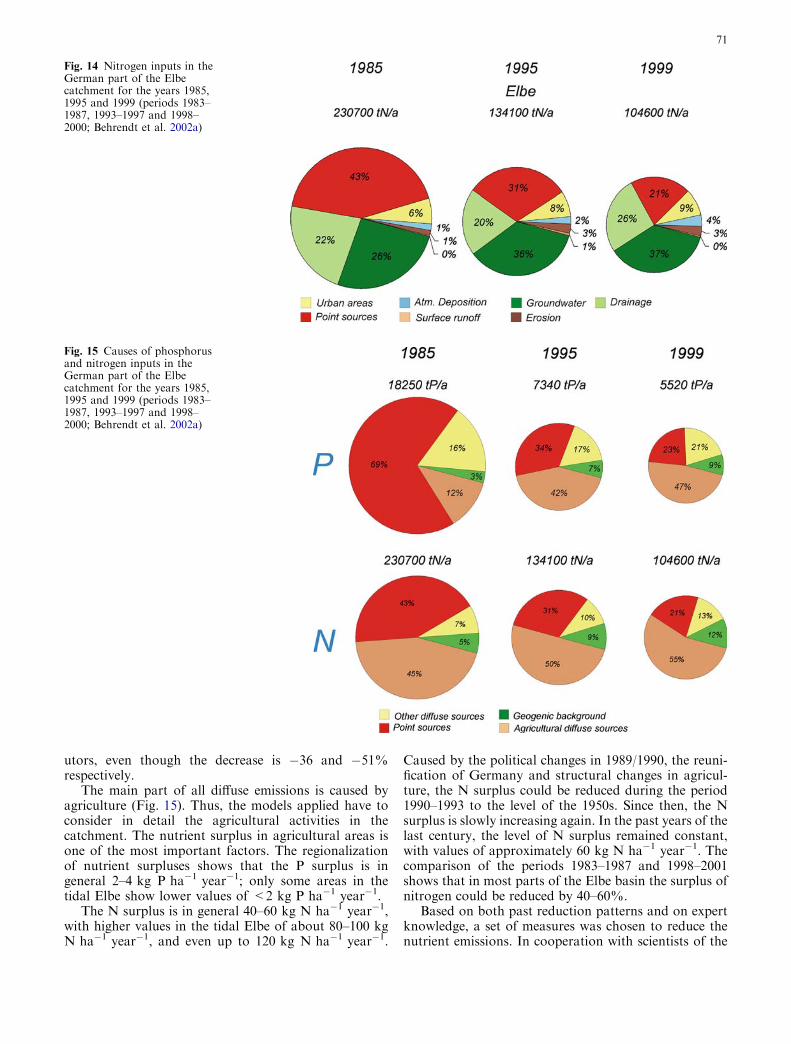
utors, even though the decrease is �36 and �51%respectively.
The main part of all diffuse emissions is caused byagriculture (Fig. 15). Thus, the models applied have toconsider in detail the agricultural activities in thecatchment. The nutrient surplus in agricultural areas isone of the most important factors. The regionalizationof nutrient surpluses shows that the P surplus is ingeneral 2–4 kg P ha�1 year�1; only some areas in thetidal Elbe show lower values of <2 kg P ha�1 year�1.
The N surplus is in general 40–60 kg N ha�1 year�1,with higher values in the tidal Elbe of about 80–100 kgN ha�1 year�1, and even up to 120 kg N ha�1 year�1.
Caused by the political changes in 1989/1990, the reuni-fication of Germany and structural changes in agricul-ture, the N surplus could be reduced during the period1990–1993 to the level of the 1950s. Since then, the Nsurplus is slowly increasing again. In the past years of thelast century, the level of N surplus remained constant,with values of approximately 60 kg N ha�1 year�1. Thecomparison of the periods 1983–1987 and 1998–2001shows that in most parts of the Elbe basin the surplus ofnitrogen could be reduced by 40–60%.
Based on both past reduction patterns and on expertknowledge, a set of measures was chosen to reduce thenutrient emissions. In cooperation with scientists of the
Fig. 15 Causes of phosphorusand nitrogen inputs in theGerman part of the Elbecatchment for the years 1985,1995 and 1999 (periods 1983–1987, 1993–1997 and 1998–2000; Behrendt et al. 2002a)
Fig. 14 Nitrogen inputs in theGerman part of the Elbecatchment for the years 1985,1995 and 1999 (periods 1983–1987, 1993–1997 and 1998–2000; Behrendt et al. 2002a)
71
FAA Forschungsgesellschaft fur Agrarpolitik undAgrarsoziologie e.V., Bonn (Dr. H. Gomann, homepagehttp://www.faa-bonn.de), the measures and theirembedding in the agricultural policy framework for thescenarios were harmonised.
The measures for the different scenarios are as fol-lows:
– reduction of tile drained areas,– application of conservative tillage in agriculture to
avoid soil erosion,– introduction of P-free detergents in the Czech
Republic,– all particulate sewage from population not connected
to sewers is transported to WWTPs,– increase of storage for combined sewers,– WWTP emissions correspond to EU wastewater
guidelines,– introduction of microfiltration in all WWTPs larger
than 100,000 popequiv (population equivalent), and– transfer of wetlands (according to CORINE land use)
to effective retention areas.
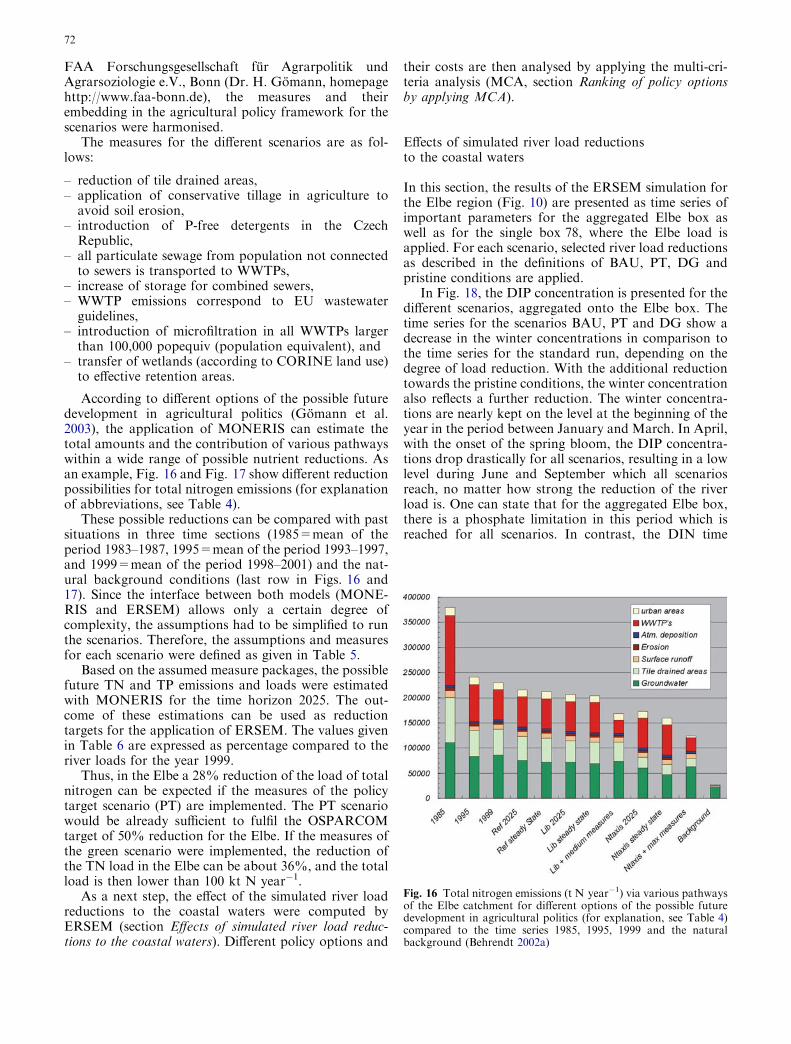
According to different options of the possible futuredevelopment in agricultural politics (Gomann et al.2003), the application of MONERIS can estimate thetotal amounts and the contribution of various pathwayswithin a wide range of possible nutrient reductions. Asan example, Fig. 16 and Fig. 17 show different reductionpossibilities for total nitrogen emissions (for explanationof abbreviations, see Table 4).
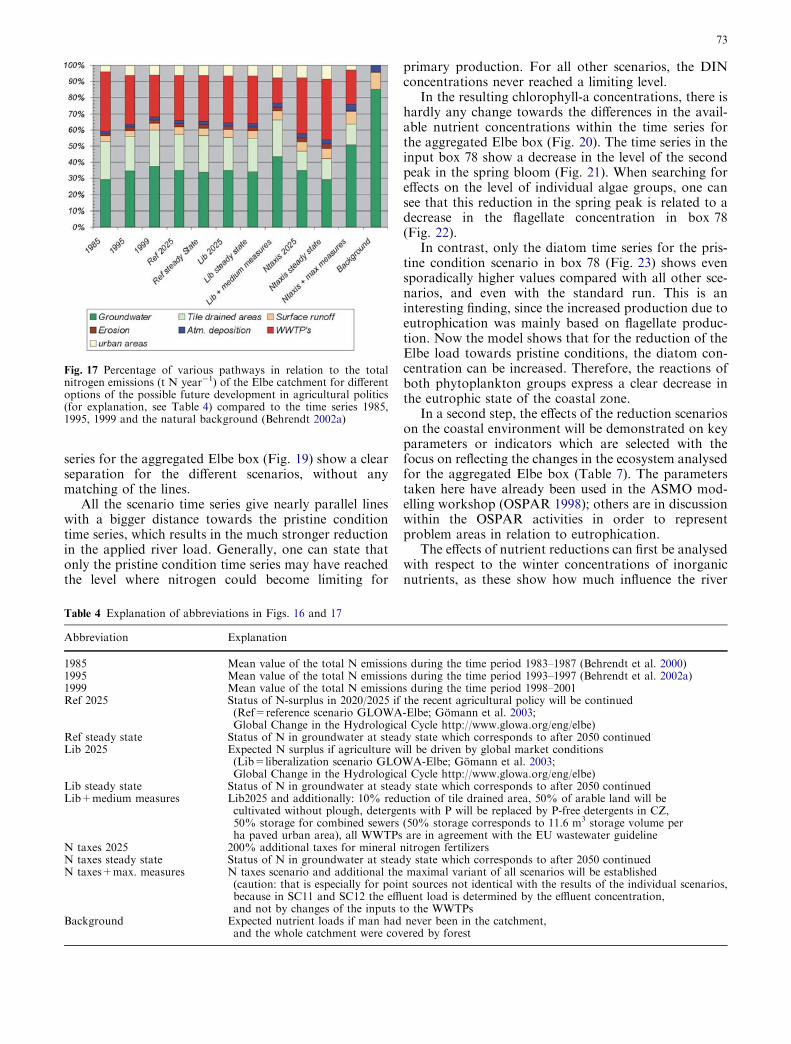
These possible reductions can be compared with pastsituations in three time sections (1985=mean of theperiod 1983–1987, 1995=mean of the period 1993–1997,and 1999=mean of the period 1998–2001) and the nat-ural background conditions (last row in Figs. 16 and17). Since the interface between both models (MONE-RIS and ERSEM) allows only a certain degree ofcomplexity, the assumptions had to be simplified to runthe scenarios. Therefore, the assumptions and measuresfor each scenario were defined as given in Table 5.
Based on the assumed measure packages, the possiblefuture TN and TP emissions and loads were estimatedwith MONERIS for the time horizon 2025. The out-come of these estimations can be used as reductiontargets for the application of ERSEM. The values givenin Table 6 are expressed as percentage compared to theriver loads for the year 1999.
Thus, in the Elbe a 28% reduction of the load of totalnitrogen can be expected if the measures of the policytarget scenario (PT) are implemented. The PT scenariowould be already sufficient to fulfil the OSPARCOMtarget of 50% reduction for the Elbe. If the measures ofthe green scenario were implemented, the reduction ofthe TN load in the Elbe can be about 36%, and the totalload is then lower than 100 kt N year�1.
As a next step, the effect of the simulated river loadreductions to the coastal waters were computed byERSEM (section Effects of simulated river load reduc-tions to the coastal waters). Different policy options and
their costs are then analysed by applying the multi-cri-teria analysis (MCA, section Ranking of policy optionsby applying MCA).
Effects of simulated river load reductionsto the coastal waters
In this section, the results of the ERSEM simulation forthe Elbe region (Fig. 10) are presented as time series ofimportant parameters for the aggregated Elbe box aswell as for the single box 78, where the Elbe load isapplied. For each scenario, selected river load reductionsas described in the definitions of BAU, PT, DG andpristine conditions are applied.
In Fig. 18, the DIP concentration is presented for thedifferent scenarios, aggregated onto the Elbe box. Thetime series for the scenarios BAU, PT and DG show adecrease in the winter concentrations in comparison tothe time series for the standard run, depending on thedegree of load reduction. With the additional reductiontowards the pristine conditions, the winter concentrationalso reflects a further reduction. The winter concentra-tions are nearly kept on the level at the beginning of theyear in the period between January and March. In April,with the onset of the spring bloom, the DIP concentra-tions drop drastically for all scenarios, resulting in a lowlevel during June and September which all scenariosreach, no matter how strong the reduction of the riverload is. One can state that for the aggregated Elbe box,there is a phosphate limitation in this period which isreached for all scenarios. In contrast, the DIN time
Fig. 16 Total nitrogen emissions (t N year�1) via various pathwaysof the Elbe catchment for different options of the possible futuredevelopment in agricultural politics (for explanation, see Table 4)compared to the time series 1985, 1995, 1999 and the naturalbackground (Behrendt 2002a)
72
series for the aggregated Elbe box (Fig. 19) show a clearseparation for the different scenarios, without anymatching of the lines.
All the scenario time series give nearly parallel lineswith a bigger distance towards the pristine conditiontime series, which results in the much stronger reductionin the applied river load. Generally, one can state thatonly the pristine condition time series may have reachedthe level where nitrogen could become limiting for
primary production. For all other scenarios, the DINconcentrations never reached a limiting level.
In the resulting chlorophyll-a concentrations, there ishardly any change towards the differences in the avail-able nutrient concentrations within the time series forthe aggregated Elbe box (Fig. 20). The time series in theinput box 78 show a decrease in the level of the secondpeak in the spring bloom (Fig. 21). When searching foreffects on the level of individual algae groups, one cansee that this reduction in the spring peak is related to adecrease in the flagellate concentration in box 78(Fig. 22).
In contrast, only the diatom time series for the pris-tine condition scenario in box 78 (Fig. 23) shows evensporadically higher values compared with all other sce-narios, and even with the standard run. This is aninteresting finding, since the increased production due toeutrophication was mainly based on flagellate produc-tion. Now the model shows that for the reduction of theElbe load towards pristine conditions, the diatom con-centration can be increased. Therefore, the reactions ofboth phytoplankton groups express a clear decrease inthe eutrophic state of the coastal zone.
In a second step, the effects of the reduction scenarioson the coastal environment will be demonstrated on keyparameters or indicators which are selected with thefocus on reflecting the changes in the ecosystem analysedfor the aggregated Elbe box (Table 7). The parameterstaken here have already been used in the ASMO mod-elling workshop (OSPAR 1998); others are in discussionwithin the OSPAR activities in order to representproblem areas in relation to eutrophication.
The effects of nutrient reductions can first be analysedwith respect to the winter concentrations of inorganicnutrients, as these show how much influence the river
Table 4 Explanation of abbreviations in Figs. 16 and 17
Abbreviation Explanation
1985 Mean value of the total N emissions during the time period 1983–1987 (Behrendt et al. 2000)1995 Mean value of the total N emissions during the time period 1993–1997 (Behrendt et al. 2002a)1999 Mean value of the total N emissions during the time period 1998–2001Ref 2025 Status of N-surplus in 2020/2025 if the recent agricultural policy will be continued
(Ref=reference scenario GLOWA-Elbe; Gomann et al. 2003;Global Change in the Hydrological Cycle http://www.glowa.org/eng/elbe)
Ref steady state Status of N in groundwater at steady state which corresponds to after 2050 continuedLib 2025 Expected N surplus if agriculture will be driven by global market conditions
(Lib=liberalization scenario GLOWA-Elbe; Gomann et al. 2003;Global Change in the Hydrological Cycle http://www.glowa.org/eng/elbe)
Lib steady state Status of N in groundwater at steady state which corresponds to after 2050 continuedLib+medium measures Lib2025 and additionally: 10% reduction of tile drained area, 50% of arable land will be
cultivated without plough, detergents with P will be replaced by P-free detergents in CZ,50% storage for combined sewers (50% storage corresponds to 11.6 m3 storage volume perha paved urban area), all WWTPs are in agreement with the EU wastewater guideline
N taxes 2025 200% additional taxes for mineral nitrogen fertilizersN taxes steady state Status of N in groundwater at steady state which corresponds to after 2050 continuedN taxes+max. measures N taxes scenario and additional the maximal variant of all scenarios will be established
(caution: that is especially for point sources not identical with the results of the individual scenarios,because in SC11 and SC12 the effluent load is determined by the effluent concentration,and not by changes of the inputs to the WWTPs
Background Expected nutrient loads if man had never been in the catchment,and the whole catchment were covered by forest
Fig. 17 Percentage of various pathways in relation to the totalnitrogen emissions (t N year�1) of the Elbe catchment for differentoptions of the possible future development in agricultural politics(for explanation, see Table 4) compared to the time series 1985,1995, 1999 and the natural background (Behrendt 2002a)
73
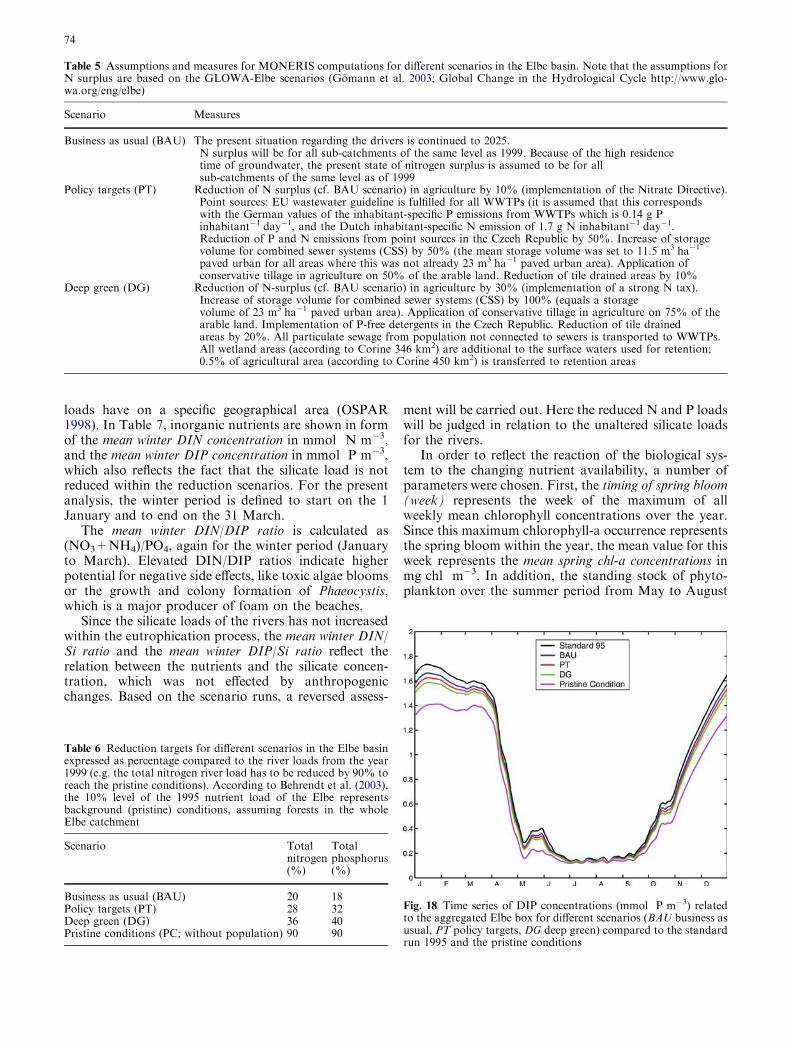
loads have on a specific geographical area (OSPAR1998). In Table 7, inorganic nutrients are shown in formof the mean winter DIN concentration in mmol N m�3,and the mean winter DIP concentration in mmol P m�3,which also reflects the fact that the silicate load is notreduced within the reduction scenarios. For the presentanalysis, the winter period is defined to start on the 1January and to end on the 31 March.
The mean winter DIN/DIP ratio is calculated as(NO3+NH4)/PO4, again for the winter period (Januaryto March). Elevated DIN/DIP ratios indicate higherpotential for negative side effects, like toxic algae bloomsor the growth and colony formation of Phaeocystis,which is a major producer of foam on the beaches.
Since the silicate loads of the rivers has not increasedwithin the eutrophication process, the mean winter DIN/Si ratio and the mean winter DIP/Si ratio reflect therelation between the nutrients and the silicate concen-tration, which was not effected by anthropogenicchanges. Based on the scenario runs, a reversed assess-
ment will be carried out. Here the reduced N and P loadswill be judged in relation to the unaltered silicate loadsfor the rivers.
In order to reflect the reaction of the biological sys-tem to the changing nutrient availability, a number ofparameters were chosen. First, the timing of spring bloom(week) represents the week of the maximum of allweekly mean chlorophyll concentrations over the year.Since this maximum chlorophyll-a occurrence representsthe spring bloom within the year, the mean value for thisweek represents the mean spring chl-a concentrations inmg chl m�3. In addition, the standing stock of phyto-plankton over the summer period from May to August
Table 5 Assumptions and measures for MONERIS computations for different scenarios in the Elbe basin. Note that the assumptions forN surplus are based on the GLOWA-Elbe scenarios (Gomann et al. 2003; Global Change in the Hydrological Cycle http://www.glo-wa.org/eng/elbe)
Scenario Measures
Business as usual (BAU) The present situation regarding the drivers is continued to 2025.N surplus will be for all sub-catchments of the same level as 1999. Because of the high residencetime of groundwater, the present state of nitrogen surplus is assumed to be for allsub-catchments of the same level as of 1999
Policy targets (PT) Reduction of N surplus (cf. BAU scenario) in agriculture by 10% (implementation of the Nitrate Directive).Point sources: EU wastewater guideline is fulfilled for all WWTPs (it is assumed that this correspondswith the German values of the inhabitant-specific P emissions from WWTPs which is 0.14 g Pinhabitant�1 day�1, and the Dutch inhabitant-specific N emission of 1.7 g N inhabitant�1 day�1.Reduction of P and N emissions from point sources in the Czech Republic by 50%. Increase of storagevolume for combined sewer systems (CSS) by 50% (the mean storage volume was set to 11.5 m3 ha�1
paved urban for all areas where this was not already 23 m3 ha�1 paved urban area). Application ofconservative tillage in agriculture on 50% of the arable land. Reduction of tile drained areas by 10%
Deep green (DG) Reduction of N-surplus (cf. BAU scenario) in agriculture by 30% (implementation of a strong N tax).Increase of storage volume for combined sewer systems (CSS) by 100% (equals a storagevolume of 23 m3 ha�1 paved urban area). Application of conservative tillage in agriculture on 75% of thearable land. Implementation of P-free detergents in the Czech Republic. Reduction of tile drainedareas by 20%. All particulate sewage from population not connected to sewers is transported to WWTPs.All wetland areas (according to Corine 346 km2) are additional to the surface waters used for retention;0.5% of agricultural area (according to Corine 450 km2) is transferred to retention areas
Table 6 Reduction targets for different scenarios in the Elbe basinexpressed as percentage compared to the river loads from the year1999 (e.g. the total nitrogen river load has to be reduced by 90% toreach the pristine conditions). According to Behrendt et al. (2003),the 10% level of the 1995 nutrient load of the Elbe representsbackground (pristine) conditions, assuming forests in the wholeElbe catchment
Scenario Totalnitrogen
Totalphosphorus
(%) (%)
Business as usual (BAU) 20 18Policy targets (PT) 28 32Deep green (DG) 36 40Pristine conditions (PC; without population) 90 90
Fig. 18 Time series of DIP concentrations (mmol P m�3) relatedto the aggregated Elbe box for different scenarios (BAU business asusual, PT policy targets, DG deep green) compared to the standardrun 1995 and the pristine conditions
74
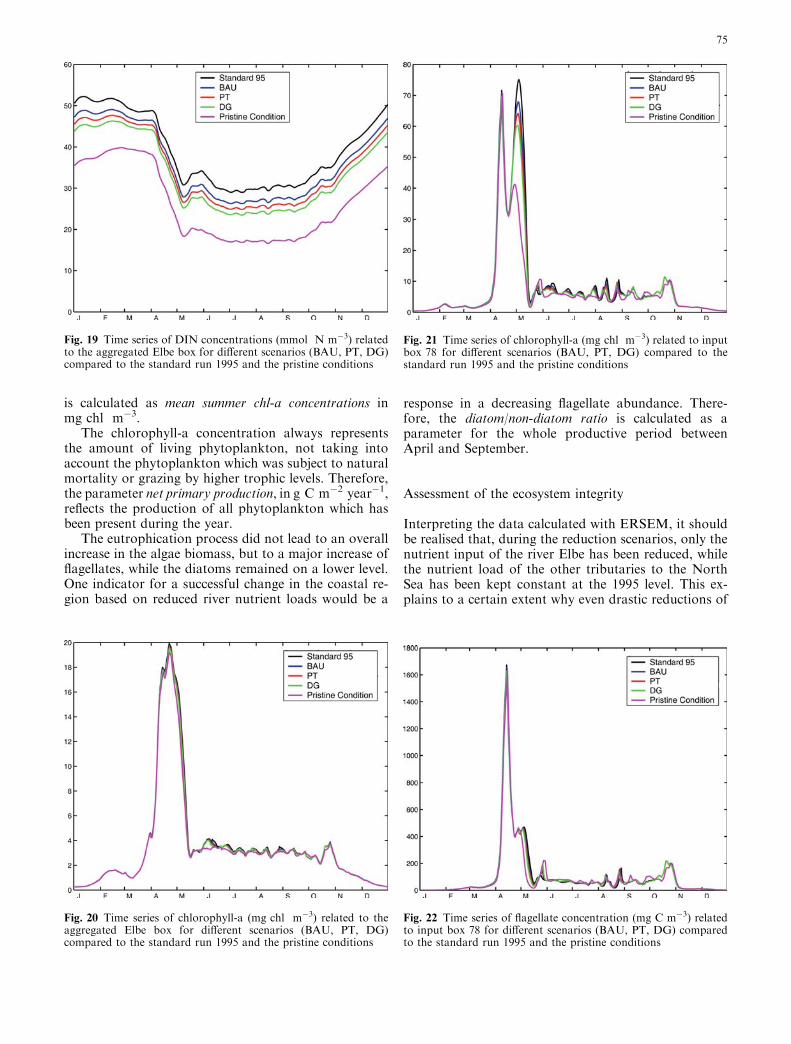
is calculated as mean summer chl-a concentrations inmg chl m�3.
The chlorophyll-a concentration always representsthe amount of living phytoplankton, not taking intoaccount the phytoplankton which was subject to naturalmortality or grazing by higher trophic levels. Therefore,the parameter net primary production, in g C m�2 year�1,reflects the production of all phytoplankton which hasbeen present during the year.
The eutrophication process did not lead to an overallincrease in the algae biomass, but to a major increase offlagellates, while the diatoms remained on a lower level.One indicator for a successful change in the coastal re-gion based on reduced river nutrient loads would be a
response in a decreasing flagellate abundance. There-fore, the diatom/non-diatom ratio is calculated as aparameter for the whole productive period betweenApril and September.
Assessment of the ecosystem integrity
Interpreting the data calculated with ERSEM, it shouldbe realised that, during the reduction scenarios, only thenutrient input of the river Elbe has been reduced, whilethe nutrient load of the other tributaries to the NorthSea has been kept constant at the 1995 level. This ex-plains to a certain extent why even drastic reductions of
Fig. 19 Time series of DIN concentrations (mmol N m�3) relatedto the aggregated Elbe box for different scenarios (BAU, PT, DG)compared to the standard run 1995 and the pristine conditions
Fig. 20 Time series of chlorophyll-a (mg chl m�3) related to theaggregated Elbe box for different scenarios (BAU, PT, DG)compared to the standard run 1995 and the pristine conditions
Fig. 21 Time series of chlorophyll-a (mg chl m�3) related to inputbox 78 for different scenarios (BAU, PT, DG) compared to thestandard run 1995 and the pristine conditions
Fig. 22 Time series of flagellate concentration (mg C m�3) relatedto input box 78 for different scenarios (BAU, PT, DG) comparedto the standard run 1995 and the pristine conditions
75
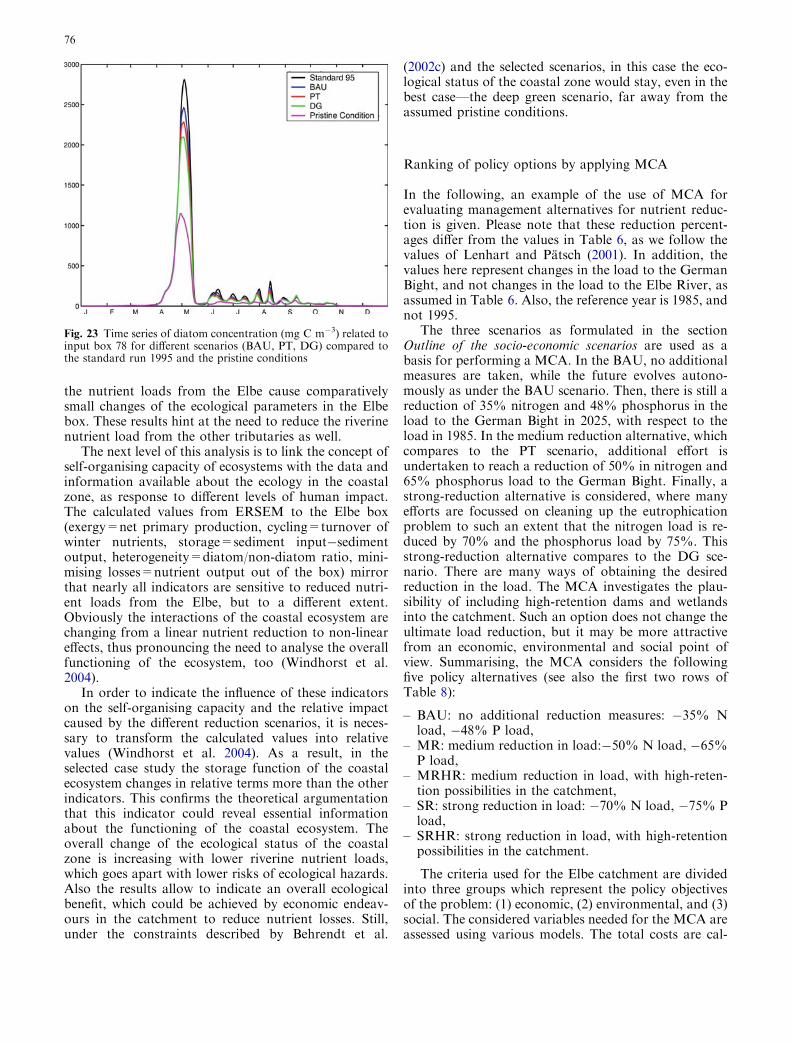
the nutrient loads from the Elbe cause comparativelysmall changes of the ecological parameters in the Elbebox. These results hint at the need to reduce the riverinenutrient load from the other tributaries as well.
The next level of this analysis is to link the concept ofself-organising capacity of ecosystems with the data andinformation available about the ecology in the coastalzone, as response to different levels of human impact.The calculated values from ERSEM to the Elbe box(exergy=net primary production, cycling=turnover ofwinter nutrients, storage=sediment input�sedimentoutput, heterogeneity=diatom/non-diatom ratio, mini-mising losses=nutrient output out of the box) mirrorthat nearly all indicators are sensitive to reduced nutri-ent loads from the Elbe, but to a different extent.Obviously the interactions of the coastal ecosystem arechanging from a linear nutrient reduction to non-lineareffects, thus pronouncing the need to analyse the overallfunctioning of the ecosystem, too (Windhorst et al.2004).
In order to indicate the influence of these indicatorson the self-organising capacity and the relative impactcaused by the different reduction scenarios, it is neces-sary to transform the calculated values into relativevalues (Windhorst et al. 2004). As a result, in theselected case study the storage function of the coastalecosystem changes in relative terms more than the otherindicators. This confirms the theoretical argumentationthat this indicator could reveal essential informationabout the functioning of the coastal ecosystem. Theoverall change of the ecological status of the coastalzone is increasing with lower riverine nutrient loads,which goes apart with lower risks of ecological hazards.Also the results allow to indicate an overall ecologicalbenefit, which could be achieved by economic endeav-ours in the catchment to reduce nutrient losses. Still,under the constraints described by Behrendt et al.
(2002c) and the selected scenarios, in this case the eco-logical status of the coastal zone would stay, even in thebest case—the deep green scenario, far away from theassumed pristine conditions.
Ranking of policy options by applying MCA
In the following, an example of the use of MCA forevaluating management alternatives for nutrient reduc-tion is given. Please note that these reduction percent-ages differ from the values in Table 6, as we follow thevalues of Lenhart and Patsch (2001). In addition, thevalues here represent changes in the load to the GermanBight, and not changes in the load to the Elbe River, asassumed in Table 6. Also, the reference year is 1985, andnot 1995.
The three scenarios as formulated in the sectionOutline of the socio-economic scenarios are used as abasis for performing a MCA. In the BAU, no additionalmeasures are taken, while the future evolves autono-mously as under the BAU scenario. Then, there is still areduction of 35% nitrogen and 48% phosphorus in theload to the German Bight in 2025, with respect to theload in 1985. In the medium reduction alternative, whichcompares to the PT scenario, additional effort isundertaken to reach a reduction of 50% in nitrogen and65% phosphorus load to the German Bight. Finally, astrong-reduction alternative is considered, where manyefforts are focussed on cleaning up the eutrophicationproblem to such an extent that the nitrogen load is re-duced by 70% and the phosphorus load by 75%. Thisstrong-reduction alternative compares to the DG sce-nario. There are many ways of obtaining the desiredreduction in the load. The MCA investigates the plau-sibility of including high-retention dams and wetlandsinto the catchment. Such an option does not change theultimate load reduction, but it may be more attractivefrom an economic, environmental and social point ofview. Summarising, the MCA considers the followingfive policy alternatives (see also the first two rows ofTable 8):
– BAU: no additional reduction measures: �35% Nload, �48% P load,
– MR: medium reduction in load:�50% N load, �65%P load,
– MRHR: medium reduction in load, with high-reten-tion possibilities in the catchment,
– SR: strong reduction in load: �70% N load, �75% Pload,
– SRHR: strong reduction in load, with high-retentionpossibilities in the catchment.
The criteria used for the Elbe catchment are dividedinto three groups which represent the policy objectivesof the problem: (1) economic, (2) environmental, and (3)social. The considered variables needed for the MCA areassessed using various models. The total costs are cal-
Fig. 23 Time series of diatom concentration (mg C m�3) related toinput box 78 for different scenarios (BAU, PT, DG) compared tothe standard run 1995 and the pristine conditions
76
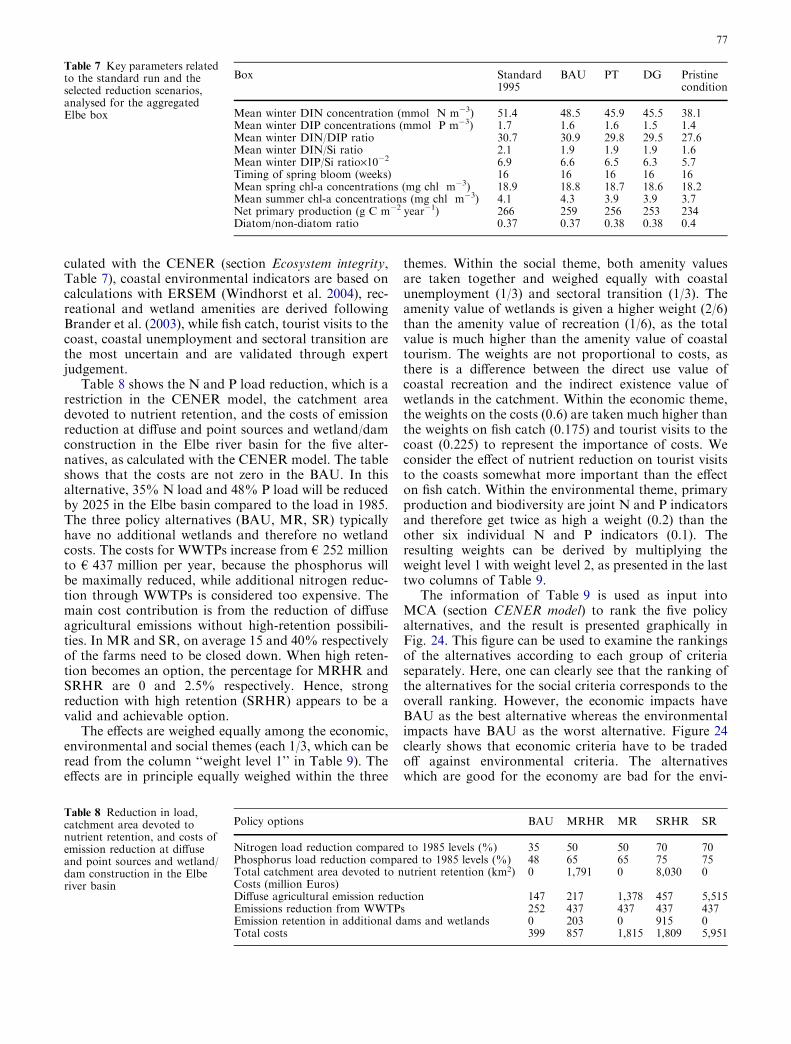
culated with the CENER (section Ecosystem integrity,Table 7), coastal environmental indicators are based oncalculations with ERSEM (Windhorst et al. 2004), rec-reational and wetland amenities are derived followingBrander et al. (2003), while fish catch, tourist visits to thecoast, coastal unemployment and sectoral transition arethe most uncertain and are validated through expertjudgement.
Table 8 shows the N and P load reduction, which is arestriction in the CENER model, the catchment areadevoted to nutrient retention, and the costs of emissionreduction at diffuse and point sources and wetland/damconstruction in the Elbe river basin for the five alter-natives, as calculated with the CENER model. The tableshows that the costs are not zero in the BAU. In thisalternative, 35% N load and 48% P load will be reducedby 2025 in the Elbe basin compared to the load in 1985.The three policy alternatives (BAU, MR, SR) typicallyhave no additional wetlands and therefore no wetlandcosts. The costs for WWTPs increase from € 252 millionto € 437 million per year, because the phosphorus willbe maximally reduced, while additional nitrogen reduc-tion through WWTPs is considered too expensive. Themain cost contribution is from the reduction of diffuseagricultural emissions without high-retention possibili-ties. In MR and SR, on average 15 and 40% respectivelyof the farms need to be closed down. When high reten-tion becomes an option, the percentage for MRHR andSRHR are 0 and 2.5% respectively. Hence, strongreduction with high retention (SRHR) appears to be avalid and achievable option.
The effects are weighed equally among the economic,environmental and social themes (each 1/3, which can beread from the column ‘‘weight level 1’’ in Table 9). Theeffects are in principle equally weighed within the three
themes. Within the social theme, both amenity valuesare taken together and weighed equally with coastalunemployment (1/3) and sectoral transition (1/3). Theamenity value of wetlands is given a higher weight (2/6)than the amenity value of recreation (1/6), as the totalvalue is much higher than the amenity value of coastaltourism. The weights are not proportional to costs, asthere is a difference between the direct use value ofcoastal recreation and the indirect existence value ofwetlands in the catchment. Within the economic theme,the weights on the costs (0.6) are taken much higher thanthe weights on fish catch (0.175) and tourist visits to thecoast (0.225) to represent the importance of costs. Weconsider the effect of nutrient reduction on tourist visitsto the coasts somewhat more important than the effecton fish catch. Within the environmental theme, primaryproduction and biodiversity are joint N and P indicatorsand therefore get twice as high a weight (0.2) than theother six individual N and P indicators (0.1). Theresulting weights can be derived by multiplying theweight level 1 with weight level 2, as presented in the lasttwo columns of Table 9.
The information of Table 9 is used as input intoMCA (section CENER model) to rank the five policyalternatives, and the result is presented graphically inFig. 24. This figure can be used to examine the rankingsof the alternatives according to each group of criteriaseparately. Here, one can clearly see that the ranking ofthe alternatives for the social criteria corresponds to theoverall ranking. However, the economic impacts haveBAU as the best alternative whereas the environmentalimpacts have BAU as the worst alternative. Figure 24clearly shows that economic criteria have to be tradedoff against environmental criteria. The alternativeswhich are good for the economy are bad for the envi-
Table 7 Key parameters relatedto the standard run and theselected reduction scenarios,analysed for the aggregatedElbe box
Box Standard1995
BAU PT DG Pristinecondition
Mean winter DIN concentration (mmol N m�3) 51.4 48.5 45.9 45.5 38.1Mean winter DIP concentrations (mmol P m�3) 1.7 1.6 1.6 1.5 1.4Mean winter DIN/DIP ratio 30.7 30.9 29.8 29.5 27.6Mean winter DIN/Si ratio 2.1 1.9 1.9 1.9 1.6Mean winter DIP/Si ratio·10�2 6.9 6.6 6.5 6.3 5.7Timing of spring bloom (weeks) 16 16 16 16 16Mean spring chl-a concentrations (mg chl m�3) 18.9 18.8 18.7 18.6 18.2Mean summer chl-a concentrations (mg chl m�3) 4.1 4.3 3.9 3.9 3.7Net primary production (g C m�2 year�1) 266 259 256 253 234Diatom/non-diatom ratio 0.37 0.37 0.38 0.38 0.4
Table 8 Reduction in load,catchment area devoted tonutrient retention, and costs ofemission reduction at diffuseand point sources and wetland/dam construction in the Elberiver basin
Policy options BAU MRHR MR SRHR SR
Nitrogen load reduction compared to 1985 levels (%) 35 50 50 70 70Phosphorus load reduction compared to 1985 levels (%) 48 65 65 75 75Total catchment area devoted to nutrient retention (km2) 0 1,791 0 8,030 0Costs (million Euros)Diffuse agricultural emission reduction 147 217 1,378 457 5,515Emissions reduction from WWTPs 252 437 437 437 437Emission retention in additional dams and wetlands 0 203 0 915 0Total costs 399 857 1,815 1,809 5,951
77
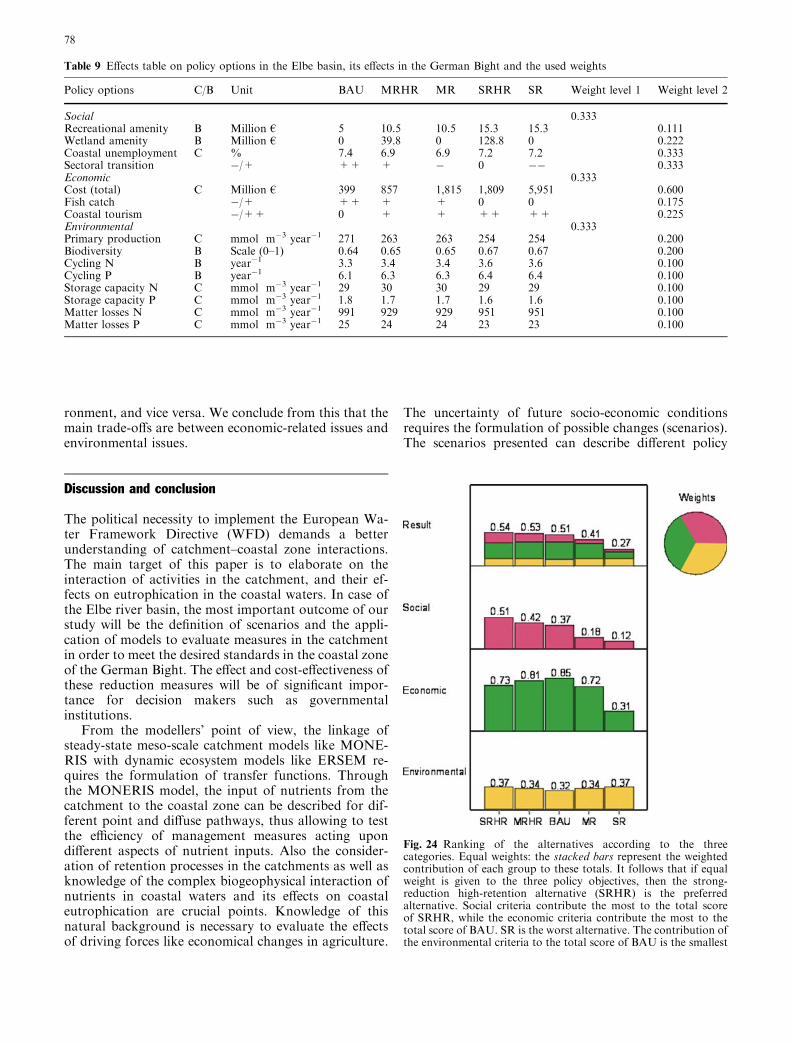
ronment, and vice versa. We conclude from this that themain trade-offs are between economic-related issues andenvironmental issues.
Discussion and conclusion
The political necessity to implement the European Wa-ter Framework Directive (WFD) demands a betterunderstanding of catchment–coastal zone interactions.The main target of this paper is to elaborate on theinteraction of activities in the catchment, and their ef-fects on eutrophication in the coastal waters. In case ofthe Elbe river basin, the most important outcome of ourstudy will be the definition of scenarios and the appli-cation of models to evaluate measures in the catchmentin order to meet the desired standards in the coastal zoneof the German Bight. The effect and cost-effectiveness ofthese reduction measures will be of significant impor-tance for decision makers such as governmentalinstitutions.
From the modellers’ point of view, the linkage ofsteady-state meso-scale catchment models like MONE-RIS with dynamic ecosystem models like ERSEM re-quires the formulation of transfer functions. Throughthe MONERIS model, the input of nutrients from thecatchment to the coastal zone can be described for dif-ferent point and diffuse pathways, thus allowing to testthe efficiency of management measures acting upondifferent aspects of nutrient inputs. Also the consider-ation of retention processes in the catchments as well asknowledge of the complex biogeophysical interaction ofnutrients in coastal waters and its effects on coastaleutrophication are crucial points. Knowledge of thisnatural background is necessary to evaluate the effectsof driving forces like economical changes in agriculture.
The uncertainty of future socio-economic conditionsrequires the formulation of possible changes (scenarios).The scenarios presented can describe different policy
Table 9 Effects table on policy options in the Elbe basin, its effects in the German Bight and the used weights
Policy options C/B Unit BAU MRHR MR SRHR SR Weight level 1 Weight level 2
Social 0.333Recreational amenity B Million € 5 10.5 10.5 15.3 15.3 0.111Wetland amenity B Million € 0 39.8 0 128.8 0 0.222Coastal unemployment C % 7.4 6.9 6.9 7.2 7.2 0.333Sectoral transition �/+ ++ + � 0 �� 0.333Economic 0.333Cost (total) C Million € 399 857 1,815 1,809 5,951 0.600Fish catch �/+ ++ + + 0 0 0.175Coastal tourism �/++ 0 + + ++ ++ 0.225Environmental 0.333Primary production C mmol m�3 year�1 271 263 263 254 254 0.200Biodiversity B Scale (0–1) 0.64 0.65 0.65 0.67 0.67 0.200Cycling N B year�1 3.3 3.4 3.4 3.6 3.6 0.100Cycling P B year�1 6.1 6.3 6.3 6.4 6.4 0.100Storage capacity N C mmol m�3 year�1 29 30 30 29 29 0.100Storage capacity P C mmol m�3 year�1 1.8 1.7 1.7 1.6 1.6 0.100Matter losses N C mmol m�3 year�1 991 929 929 951 951 0.100Matter losses P C mmol m�3 year�1 25 24 24 23 23 0.100
Fig. 24 Ranking of the alternatives according to the threecategories. Equal weights: the stacked bars represent the weightedcontribution of each group to these totals. It follows that if equalweight is given to the three policy objectives, then the strong-reduction high-retention alternative (SRHR) is the preferredalternative. Social criteria contribute the most to the total scoreof SRHR, while the economic criteria contribute the most to thetotal score of BAU. SR is the worst alternative. The contribution ofthe environmental criteria to the total score of BAU is the smallest
78
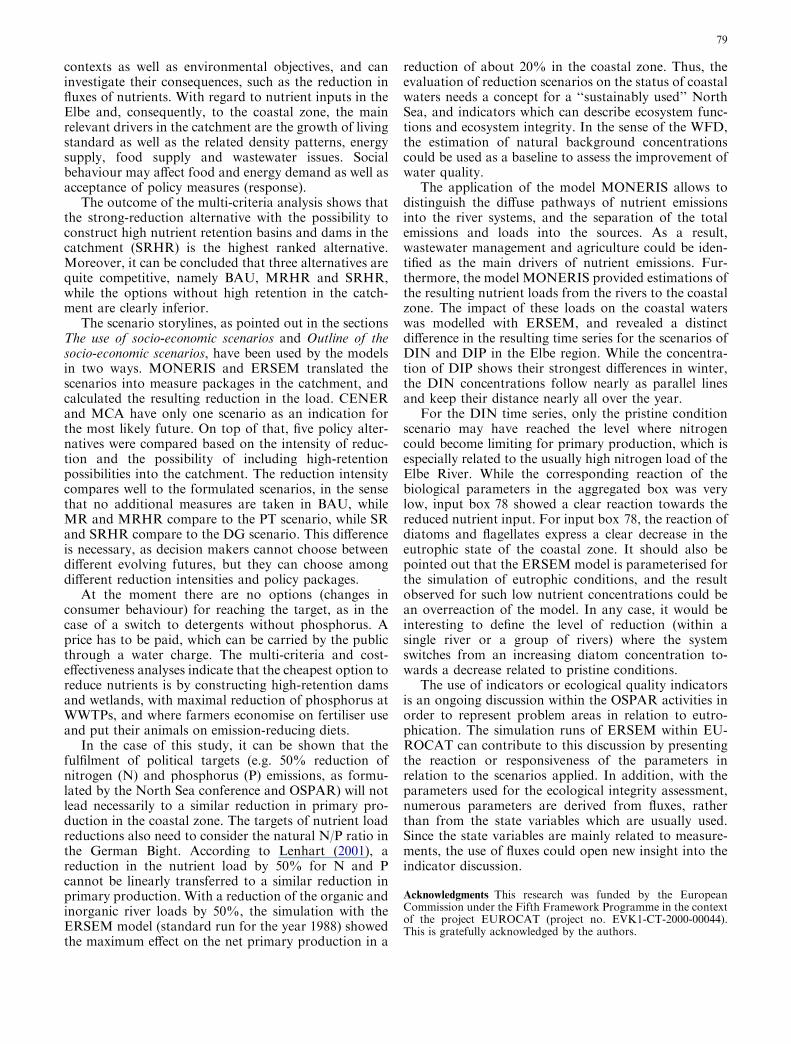
contexts as well as environmental objectives, and caninvestigate their consequences, such as the reduction influxes of nutrients. With regard to nutrient inputs in theElbe and, consequently, to the coastal zone, the mainrelevant drivers in the catchment are the growth of livingstandard as well as the related density patterns, energysupply, food supply and wastewater issues. Socialbehaviour may affect food and energy demand as well asacceptance of policy measures (response).
The outcome of the multi-criteria analysis shows thatthe strong-reduction alternative with the possibility toconstruct high nutrient retention basins and dams in thecatchment (SRHR) is the highest ranked alternative.Moreover, it can be concluded that three alternatives arequite competitive, namely BAU, MRHR and SRHR,while the options without high retention in the catch-ment are clearly inferior.
The scenario storylines, as pointed out in the sectionsThe use of socio-economic scenarios and Outline of thesocio-economic scenarios, have been used by the modelsin two ways. MONERIS and ERSEM translated thescenarios into measure packages in the catchment, andcalculated the resulting reduction in the load. CENERand MCA have only one scenario as an indication forthe most likely future. On top of that, five policy alter-natives were compared based on the intensity of reduc-tion and the possibility of including high-retentionpossibilities into the catchment. The reduction intensitycompares well to the formulated scenarios, in the sensethat no additional measures are taken in BAU, whileMR and MRHR compare to the PT scenario, while SRand SRHR compare to the DG scenario. This differenceis necessary, as decision makers cannot choose betweendifferent evolving futures, but they can choose amongdifferent reduction intensities and policy packages.
At the moment there are no options (changes inconsumer behaviour) for reaching the target, as in thecase of a switch to detergents without phosphorus. Aprice has to be paid, which can be carried by the publicthrough a water charge. The multi-criteria and cost-effectiveness analyses indicate that the cheapest option toreduce nutrients is by constructing high-retention damsand wetlands, with maximal reduction of phosphorus atWWTPs, and where farmers economise on fertiliser useand put their animals on emission-reducing diets.
In the case of this study, it can be shown that thefulfilment of political targets (e.g. 50% reduction ofnitrogen (N) and phosphorus (P) emissions, as formu-lated by the North Sea conference and OSPAR) will notlead necessarily to a similar reduction in primary pro-duction in the coastal zone. The targets of nutrient loadreductions also need to consider the natural N/P ratio inthe German Bight. According to Lenhart (2001), areduction in the nutrient load by 50% for N and Pcannot be linearly transferred to a similar reduction inprimary production. With a reduction of the organic andinorganic river loads by 50%, the simulation with theERSEM model (standard run for the year 1988) showedthe maximum effect on the net primary production in a
reduction of about 20% in the coastal zone. Thus, theevaluation of reduction scenarios on the status of coastalwaters needs a concept for a ‘‘sustainably used’’ NorthSea, and indicators which can describe ecosystem func-tions and ecosystem integrity. In the sense of the WFD,the estimation of natural background concentrationscould be used as a baseline to assess the improvement ofwater quality.
The application of the model MONERIS allows todistinguish the diffuse pathways of nutrient emissionsinto the river systems, and the separation of the totalemissions and loads into the sources. As a result,wastewater management and agriculture could be iden-tified as the main drivers of nutrient emissions. Fur-thermore, the model MONERIS provided estimations ofthe resulting nutrient loads from the rivers to the coastalzone. The impact of these loads on the coastal waterswas modelled with ERSEM, and revealed a distinctdifference in the resulting time series for the scenarios ofDIN and DIP in the Elbe region. While the concentra-tion of DIP shows their strongest differences in winter,the DIN concentrations follow nearly as parallel linesand keep their distance nearly all over the year.
For the DIN time series, only the pristine conditionscenario may have reached the level where nitrogencould become limiting for primary production, which isespecially related to the usually high nitrogen load of theElbe River. While the corresponding reaction of thebiological parameters in the aggregated box was verylow, input box 78 showed a clear reaction towards thereduced nutrient input. For input box 78, the reaction ofdiatoms and flagellates express a clear decrease in theeutrophic state of the coastal zone. It should also bepointed out that the ERSEM model is parameterised forthe simulation of eutrophic conditions, and the resultobserved for such low nutrient concentrations could bean overreaction of the model. In any case, it would beinteresting to define the level of reduction (within asingle river or a group of rivers) where the systemswitches from an increasing diatom concentration to-wards a decrease related to pristine conditions.
The use of indicators or ecological quality indicatorsis an ongoing discussion within the OSPAR activities inorder to represent problem areas in relation to eutro-phication. The simulation runs of ERSEM within EU-ROCAT can contribute to this discussion by presentingthe reaction or responsiveness of the parameters inrelation to the scenarios applied. In addition, with theparameters used for the ecological integrity assessment,numerous parameters are derived from fluxes, ratherthan from the state variables which are usually used.Since the state variables are mainly related to measure-ments, the use of fluxes could open new insight into theindicator discussion.
Acknowledgments This research was funded by the EuropeanCommission under the Fifth Framework Programme in the contextof the project EUROCAT (project no. EVK1-CT-2000-00044).This is gratefully acknowledged by the authors.
79
References
ARGE-Elbe (2001) Analyse der Nahrstoffkonzentrationen, -frachten und -eintrage im Elbeeinzugsgebiet. Bearbeitet, WGPagenkopf WG. Aufgestellt, H Reincke. Arbeitsgemeinschaftfur die Reinhaltung der Elbe, Hamburg
Baretta JW, Ebenhoh W, Ruardij P (1995) An overview over theEuropean Regional Sea Ecosystem Model, a complex marineecosystem model. Neth J Sea Res 33 (3/4):233–246
Barkmann J, Windhorst W (2000) Hedging our bets: the utility ofecological integrity. In: Jorgensen SE, Muller F (eds) Hand-book of ecosystem theories and management III,1.2. Lewis,Boca Raton, FL, pp 497–517
Barkmann J, Baumann R, Meyer U, Muller F, Windhorst W(2001) Okologische Integritat: Risikovorsorge im nachhaltigenLandschaftsmanagement. GAIA 10(2):97–107
Becker A, Behrendt H, Haberlandt U, Klocking B, Krysanova V,Lahmer W (2002) Auswirkungen der Landnutzung auf denWasser- und Stoffhaushalt der Elbe und ihres Einzugsgebietes.Forschungsber Potsdam Institute for Climate Impact Research(PIK)
Behrendt H (2002) Nahrstoffeintrage im Einzugsgebiet derSpree und ihre Veranderungen. In: Kohler J, Gelbrecht J,Pusch M (eds) Die Spree—Zustand, Probleme und Ent-wicklungsmoglichkeiten. Schweizerbart’sche, Stuttgart, Lim-nologie aktuell Bd 10, pp 62–73
Behrendt H, Huber P, Kornmilch M, Opitz D, Schmoll O, ScholzG, Uebe R (2000) Nutrient emissions into river basins of Ger-many. Federal Environmental Agency Res Rep 296 25 515,UBA-Texte 23/00, Berlin
Behrendt H, Bach M, Kunkel R, Opitz D, Pagenkopf WG,Scholz G, Wendland F (2002a) Quantifizierung der Nahr-stoffeintrage der Flußgebiete Deutschlands auf der Grundlageeines harmonisierten Vorgehens. Bericht im Rahmen desUmweltforschungsplan des Bundesministers fur Umwelt, Na-turschutz und Reaktorsicherheit, Berlin, Forschungsvorhaben29922285
Behrendt H, Huber P, Kornmilch M, Opitz D, Schmoll O, ScholzG, Uebe R (2002b) Estimation of the nutrient inputs into riverbasins—experiences from German rivers. Region EnvironChange 3:107–117
Behrendt H, Opitz D, Pagenkopf WG, Schmoll O (2002c) Sto-ffeintrage in die Gewasser des Landes Brandenburg. Lande-sumweltamtes Brandenburg, Potsdam, Fachbeitrage 68
Behrendt H, Bach M, Kunkel R, Opitz D, Pagenkopf WG, ScholzG, Wendland F (2003) Nutrient emissions into river basins ofGermany on the basis of a hamonized procedure. FederalMinistry for the Environment, Nature Conservation and Nu-clear Safety, Berlin, Res Rep 29922285
Bertrand G, Michalski A, Pench LR (1999) Scenarios Europe 2010:five possible futures for Europe. European Commission For-ward Studies Unit Work Pap July 1999
Beusekom JEE van, Fock H, de Jong F, Diel-Christiansen S,Christiansen B (2001) Wadden Sea specific eutrophicationcriteria. Common Wadden Sea Secretariat, Wilhelmshaven,Germany
Brander L, Florax R, Vermaat J (2003) The empirics of wetlandvaluation: a comprehensive summary and meta-analysis of theliterature. Free University, Amsterdam, Institute for Environ-mental Studies Work Pap W03-30
Brockmann U, Hesse K-J, Heyden B, Ladwig N (2000) Initialapplication of the comprehensive procedure to the GermanBight. Revised Interim Rep OSPAR doc ETG 00/03/02-E,August 2000, UBA-FKZ 29825233
Colijn F, Kannen A, Windhorst W (2002) The use of indicators andcritical loads. EUROCAT Deliverable 2.1 (http://www.iia-cnr.unical.it/EUROCAT/project.htm)
De Jonge V, Elliott M, Orive E (2002) Causes, historical develop-ment, effects and future challenges of a common environmentalproblem: eutrophication. Hydrobiologia 475/476:1–19
Duve J (1999) Bilanzierung des Stoffaustausches zwischen Elbeund Deichvorland am Beispiel zweier tidebeeinflussterUntersuchungsgebiete. Hamburger Bodenkund Arb 43
EEA (1999) Environment in the European Union at the turn of thecentury. Environmental European Agency EnvironmentalAssessment Rep no 2
EEA (2001) Scenarios as tools for international environmentalassessments. Environmental Issue Rep no 24. Experts’ CornerRep Prospects and Scenarios no 5. Environmental EuropeanAgency, Copenhagen
European Community (2000) Communication from the commis-sion on the precautionary principle. Brussels 02.02.2000 COM(2000) 1
European Union (2000) Directive 2000/60/EC of the EuropeanParliament and of the Council of 23 October 2000 establishing aframework for community action in the field of water policy.Brussels, Official J European Communities L 327
Gerlach SA (1990) Nitrogen, phosphorus, plankton and oxygendeficiency in the German Bight and in Kiel Bay—final report onthe project ‘‘Eutrophication of the North Sea and the BalticSea’’. Kieler Meeresforsch Sonderheft
Gomann H, Kreins P, Julius C (2003) Regionalisierung des makr-oskaligen Angebots-verhaltens landwirtschaftlicher Landnutzerim Elbeeinzugsgebiet bei Szenarien zu Klima- und Agrar-marktanderungen—Endbericht des Teilvorhabens im Rahmendes Projektes GLOWA-Elbe (Integrierte Analyse der Ausw-irkungen des Globalen Wandels auf die Umwelt und dieGesellschaft im Elbegebiet). Forschungsgesellschaft fur Agrar-politik und Agrarsoziologie eV, Bonn
Heath MR, Edwards AC, Patsch J, Turell WR (2002) Modellingthe behaviour of nutrients in the coastal waters of Scotland.Fisheries Research Services Marine Laboratory Aberdeen,Scottish Executive Central Research Unit Contract
Hickel W, Bauerfeind E, Niermann U, von Westernhagen H (1989)Oxygen deficiency in the south-eastern North Sea: sources andbiological effects. Ber Biol Anst Helgol vol 4, pp 143
Hofmann J, Behrendt H, Nunneri C (2002) EUROCAT—DasFlussgebiet der Elbe als Teil der Rhein/Elbe Fallstudie (REB-CAT). In: GellerW, Puncochar P, Guhr H, TumplingW,MedekJ, Smrt’ak J, Feldmann H, Uhlmann O (eds) Die Elbe—neueHorizonte des Flussgebietsmanagements. In: 10th MagdeburgerGewasserschutzsem, Teubner, Stuttgart, pp 151–152
IPCC (2000) Emission scenarios, summary for policy makers.Intergovernmental Panel for Climate Change Work Group IIISpec Rep (http://www.ipcc.ch/pub/reports.htm)
Isermann K, Isermann R (2001) Nachhaltige Konsumption- undProduktion aus der Sicht der Ernahrung vor dem Hintergrundder Wende in der Agrar-, Ernahrungs- und Umweltpolitik vonDeutschland und der EU (2001) als Beitrag auch fur dennachhaltigen Bodenschutz. Mitteil Deutsch Bodenkund Gesell96:739–740
Janssen R (1992) Multiobjective decision support for environ-mental management. Kluwer, Dordrecht
Janssen R, Herwijnen M v, Beinat E (2001) DEFINITE for Win-dows. A system to support decisions on a finite set of alterna-tives (software package and user manual). Institute forEnvironmental Studies (IVM), Vrije Universiteit, Amsterdam
Jørgensen SE (2000) The tentative fourth law of thermodynamics.In: Jørgensen SE, Muller F (eds) Handbook of ecosystemtheories and management. Lewis, Boca Raton, FL, pp 161–175
Kannen A, Gee K, Ulich E, Schneider E (2000) ‘‘Management ofchange’’ und nachhaltige Regionalentwicklung in Kustenzonenam Beispiel der Nordseekuste Schleswig-Holsteins. In: Blot-evogel HH, Oßenbrugge J, Wood G (eds) Lokal verank-ert—weltweit vernetzt. Verhandlungsband 52. DeutschenGeographentages 1999. Franz Steiner, Stuttgart, pp 130–135
Kay JJ (2000) Ecosystems as self-organising holarchic opensystems: narratives and the second law of thermodynamics.In: Jørgensen SE, Muller F (eds) Handbook of ecosystemtheories and management. Lewis, Boca Raton, FL, pp 135–159
80
Laane RWPM (ed) (1992) Background concentrations of naturalcompounds. Rijkswaterstaat, Den Haag, Rep DGW-92.033
Ledoux L, Cave R, Turner RK (2002) The use of scenarios inintegrated environmental assessment of coastal-catchmentzones: the Humber Estuary, UK. In: LOICZ Newslett no 23,June 2002 (http://www.nioz.nl/loicz/nwl.htm)
Lenhart HJ (2001) Effects of river nutrient load reduction on theeutrophication of the North Sea, simulated with the ecosys-tem model ERSEM. In: Kroncke I, Turkay M, Sundermann J(eds) Burning issues of North Sea ecology. Proc 14th IntSenckenberg Conf North Sea 2000. Senckenbergiana marit31(2):299–311
Lenhart HJ, Patsch J (2001) Daily nutrient loads for the Europeancontinental rivers during 1977–1998. Discharges and loads ofrivers entering the North Sea. ZMK Ber Nr 40
Lenhart HJ, Pohlmann T (1997) The ICES-boxes approach inrelation to results of a North Sea circulation model. Tellus49A:139–160
Lenhart HJ, Radach G, Backhaus JO, Pohlmann T (1995) Simu-lations of the North Sea circulation, its variability, and itsimplementation as hydrodynamical forcing in ERSEM. Neth JSea Res 33(3/4):271–299
Lenhart HJ, Radach G, Ruardij P (1997) The effects of river inputon the ecosystem dynamics in the continental coastal zone ofthe North Sea using ERSEM. J Sea Res 38:249–274
Lise W (2003) The CENER model: cost-effective nutrient emissionreduction (CENER) of the load to the North Sea from theRhine and Elbe basin. IVM Rep R-03/07
Lise W, van der Veeren RJHM (2002) Cost-effective nutrientemission reductions in the Rhine River Basin. Integrated Assess3(4):321–342
Mueller F, Hoffmann-Kroll R, Wiggering H (2000) Indicatingecosystem integrity—theoretical concepts and environmentalrequirements. Ecol Model 130:13–23
Niermann U (1990) Oxygen deficiency in the south eastern NorthSea in summer 1989. ICES CM 1990, pp 18
Nunneri C, Hofmann J (2002) EUROCAT—Soziookonomischeund Umweltanderungs-Szenarien fur das Elbeeinzugsgebiet. In:Geller W, Puncochar P, Guhr H, Tumpling W, Medek J,Smrt’ak J, Feldmann H, Uhlmann O (eds) Die Elbe—neueHorizonte des Flussgebietsmanagements. In: 10th MagdeburgerGewasserschutzsem, Teubner, Stuttgart, pp 165–166
Nunneri C, Windhorst W, Kannen A (2002) Scenarios and indi-cators: a link for pressures and impacts in the Elbe catchmentfollowing the DPSIR-approach. In: Ledoux K, Burgess D (eds)The implications of the Water Framework Directive. SWAPConf Proc, 1–4 September 2002, University of East Anglia,Norwich, pp 243–258
OSPAR (1998) Report ASMO Modelling Worksh EutrophicationIssues, 5–8 November 1996. OSPAR Commission, The Hague
OSPAR Commission (2000) Quality Status Report 2000, RegionII—Greater North Sea. OSPAR Commission, London, pp 136(http://www.ospar.org)
Protection North Sea (2002) Progress report 5th Conf Protection ofthe North Sea, 20–21 March 2002, Bergen, Prog Rep 2002
Rachor E, Albrecht H (1983) Sauerstoff-Mangel im Bodenwasserder Deutschen Bucht. Veroff Inst Meeresforsch Bremerhaven19:209–227
Rice J (2003) Environmental health indicators. Ocean CoastalManage 46:235–259
Ruardij P, Van Raaphorst W (1995) Benthic nutrient regenerationin the ERSEM ecosystem model of North Sea. Neth J Sea Res33(3/4):435–483
Turner RK, Adger N, Lorenzoni I (1998) Towards integratedmodelling and analysis in coastal zones: principles and practice.Texel, IGBP/LOICZ Rep Stud no 11
Veeren RJHM van der (2002) Economic analyses of nutrientabatement policies in the Rhine basin. PhD Thesis, Vrije Uni-versiteit, Amsterdam
Windhorst W, Colijn F, Kabuta S, Laane R, Lenhart H (2004)Defining a good ecological status of coastal waters—a casestudy for the Elbe Plume. In: Ledoux L, Vermaat JE, BouwerR, Salomons W, Turner RK (eds) Managing European coasts:past, present and future. Contrib ELOISE BtB Worksh, 2–5June 2003, Noordwijkerhoud, The Netherlands. Springer,Berlin Heidelberg New York (in press)
Wit MJM (1999) Nutrient fluxes in the Rhine and Elbe basins.Universiteit Utrecht, Drukkerij Elinkwijk, Utrecht
Zwolsman JJG (1994) North Sea estuaries as filters for contami-nants. Rep for National Institute for Coastal and MarineManagement (RIKZ). Delft Hydraulics, Delft
81
Related Documents