CATAWBA COLLEGE FOOTBALL RECORDS INDIVIDUAL RECORDS RUSHING YARDS GAINED GAME - 298 by Todd Scott vs. Lenoir-Rhyne, 1990(34-7). SEASON - 1,141 by Jamelle Cuthbertson in 10 games, 2008. CAREER - 3,769 by Rodney Wallace in 46 games, 2001-04. ONE QUARTER - 133 by Chris Cook vs. Lenoir-Rhyne, 1980(24-30). ONE HALF - 176 by Rodney Wallace at Lenoir-Rhyne, 2002(37-17). LONGEST RUN - 98 by Roy Pickens vs. Elon, 1959(12-26). ATTEMPTS GAME - 36 by Todd Scott vs. Lenoir-Rhyne, 1990(34-7). SEASON - 203 by Eamon Smart in 11 games, 2017. CAREER - 769 by Rodney Wallace in 46 games, 2001-04. TOUCHDOWNS GAME - 5 by Red Meehan vs. Western Carolina, 1936(53-6). SEASON - 18 by George Bell in 13 games, 2007. CAREER - 41 by Rodney Wallace in 46 games, 2001-04. 100 YARD GAMES CONSECUTIVE - 4 by Andre Marshall, 1993; by Jamelle Cuthbertson, 2008. SEASON - 7 by Jamelle Cuthbertson, 2008. CAREER - 12 by Rodney Wallace, 2001-04. PASSING YARDS GAINED GAME - 492 by Luke Samples at Carson-Newman, 2003(36-41). SEASON - 3,322 by Brad Roach in 13 games, 2007. CAREER - 9,650 by Luke Samples in 46 games, 2001-04. ONE QUARTER - 258 by Harry Monokian vs. Presbyterian, 1970(22-28). ONE HALF - 313 by Luke Samples at Carson-Newman, 2003(36-41). LONGEST PASS - 97 yards, Donnie Davis to Jim Bucher vs. Lenoir-Rhyne, 1972(27-3). ATTEMPTS GAME - 66 by Luke Samples at Carson-Newman, 2003(36-41). SEASON - 384 by Brad Roach in 11 games, 2005. CAREER - 1,279 by Luke Samples in 46 games, 2001-04. COMPLETIONS GAME - 38 by Luke Samples at Carson-Newman, 2003(36-41). SEASON - 248 by Danny O’Brien in 10 games, 2013. CAREER - 744 by Luke Samples in 46 games, 2001-04. ONE QUARTER - 18 by Harry Monokian vs. Presbyterian, 1970(22-28). ONE HALF - 23 by Luke Samples at Carson-Newman, 2003(36-41). CONSECUTIVE COMPLETIONS - 10 by Bobby Myers vs. Davidson, 1984(15-30). TOUCHDOWN PASSES GAME - 5 by Brad Roach vs. Albany State, 2007(66-35); by Patrick Dennis vs. Livingstone, 2008(49-7). SEASON - 32 by Brad Roach in 13 games, 2007. CAREER - 74 by Luke Samples in 46 games, 2001-04. COMPLETION PERCENTAGE SEASON - 67.9% (248-365) by Danny O’Brien in 10 games, 2013. CAREER - 60.6% (388-640) by Patrick Dennis in 34 games, 2007-10. EFFICIENCY RATING SEASON – 168.4 by Patrick Dennis in 10 games, 2008. CAREER – 144.1 by Patrick Dennis in 34 games, 2007-10.

Welcome message from author
This document is posted to help you gain knowledge. Please leave a comment to let me know what you think about it! Share it to your friends and learn new things together.
Transcript
CATAWBA COLLEGE FOOTBALL RECORDS
INDIVIDUAL RECORDS
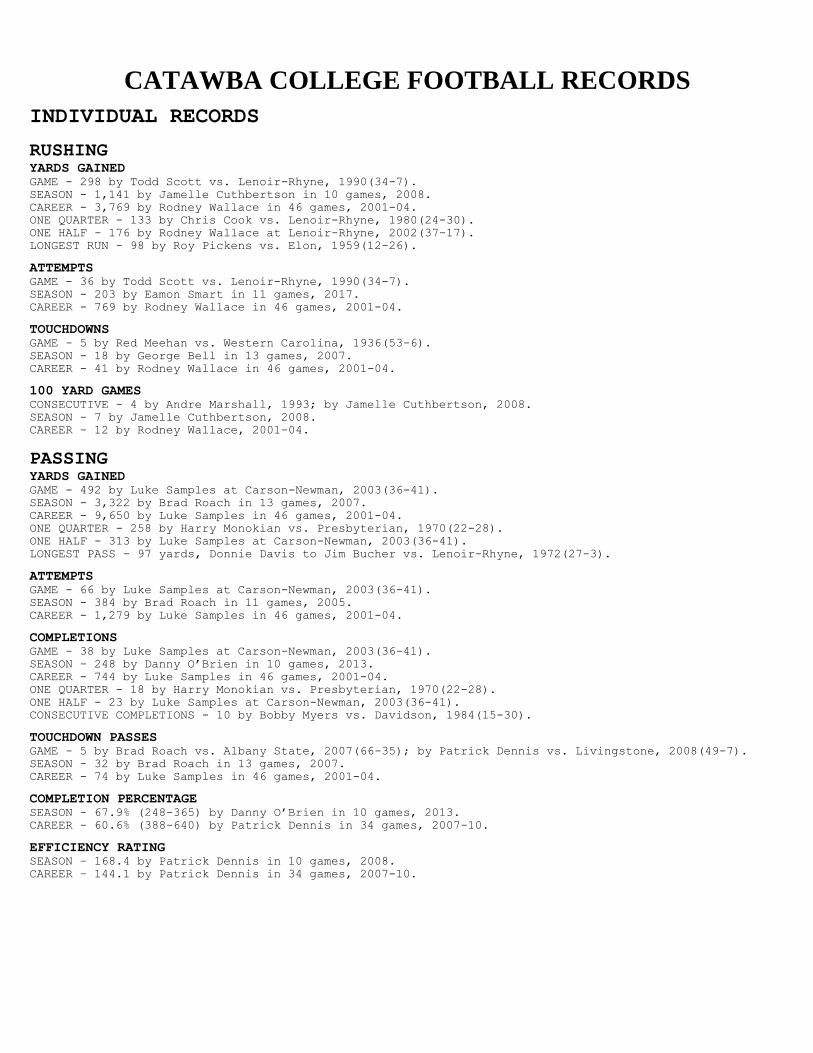
RUSHING YARDS GAINED GAME - 298 by Todd Scott vs. Lenoir-Rhyne, 1990(34-7).
SEASON - 1,141 by Jamelle Cuthbertson in 10 games, 2008.
CAREER - 3,769 by Rodney Wallace in 46 games, 2001-04.
ONE QUARTER - 133 by Chris Cook vs. Lenoir-Rhyne, 1980(24-30).
ONE HALF - 176 by Rodney Wallace at Lenoir-Rhyne, 2002(37-17).
LONGEST RUN - 98 by Roy Pickens vs. Elon, 1959(12-26).
ATTEMPTS GAME - 36 by Todd Scott vs. Lenoir-Rhyne, 1990(34-7).
SEASON - 203 by Eamon Smart in 11 games, 2017.
CAREER - 769 by Rodney Wallace in 46 games, 2001-04.
TOUCHDOWNS GAME - 5 by Red Meehan vs. Western Carolina, 1936(53-6).
SEASON - 18 by George Bell in 13 games, 2007.
CAREER - 41 by Rodney Wallace in 46 games, 2001-04.
100 YARD GAMES CONSECUTIVE - 4 by Andre Marshall, 1993; by Jamelle Cuthbertson, 2008.
SEASON - 7 by Jamelle Cuthbertson, 2008.
CAREER - 12 by Rodney Wallace, 2001-04.
PASSING YARDS GAINED GAME - 492 by Luke Samples at Carson-Newman, 2003(36-41).
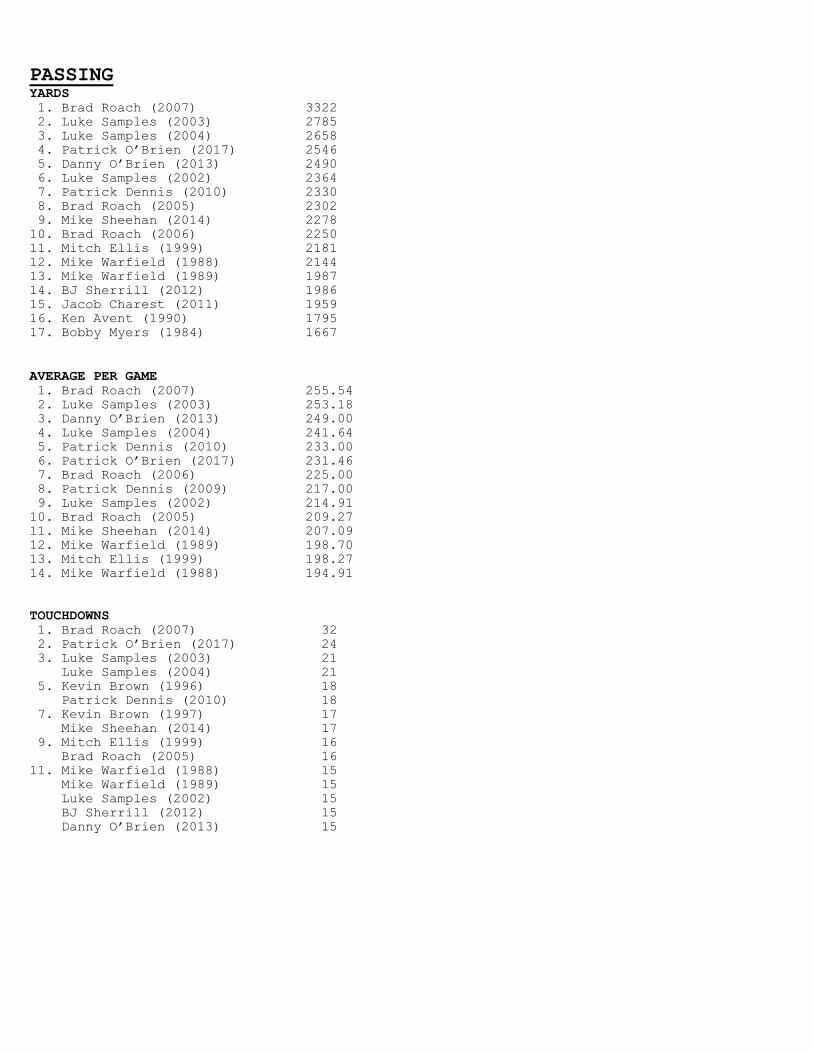
SEASON - 3,322 by Brad Roach in 13 games, 2007.
CAREER - 9,650 by Luke Samples in 46 games, 2001-04.
ONE QUARTER - 258 by Harry Monokian vs. Presbyterian, 1970(22-28).
ONE HALF - 313 by Luke Samples at Carson-Newman, 2003(36-41).
LONGEST PASS - 97 yards, Donnie Davis to Jim Bucher vs. Lenoir-Rhyne, 1972(27-3).
ATTEMPTS GAME - 66 by Luke Samples at Carson-Newman, 2003(36-41).
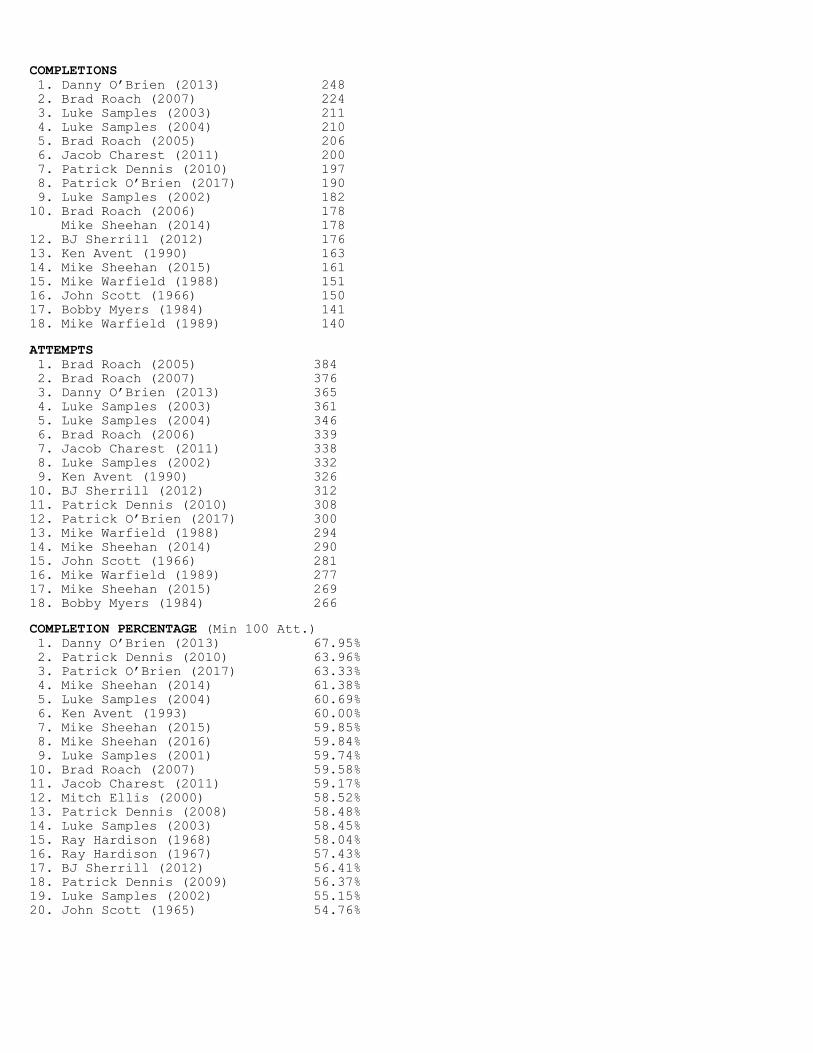
SEASON - 384 by Brad Roach in 11 games, 2005.
CAREER - 1,279 by Luke Samples in 46 games, 2001-04.
COMPLETIONS GAME - 38 by Luke Samples at Carson-Newman, 2003(36-41).
SEASON - 248 by Danny O’Brien in 10 games, 2013.
CAREER - 744 by Luke Samples in 46 games, 2001-04.
ONE QUARTER - 18 by Harry Monokian vs. Presbyterian, 1970(22-28).
ONE HALF - 23 by Luke Samples at Carson-Newman, 2003(36-41).
CONSECUTIVE COMPLETIONS - 10 by Bobby Myers vs. Davidson, 1984(15-30).
TOUCHDOWN PASSES GAME - 5 by Brad Roach vs. Albany State, 2007(66-35); by Patrick Dennis vs. Livingstone, 2008(49-7).
SEASON - 32 by Brad Roach in 13 games, 2007.
CAREER - 74 by Luke Samples in 46 games, 2001-04.
COMPLETION PERCENTAGE SEASON - 67.9% (248-365) by Danny O’Brien in 10 games, 2013.
CAREER - 60.6% (388-640) by Patrick Dennis in 34 games, 2007-10.
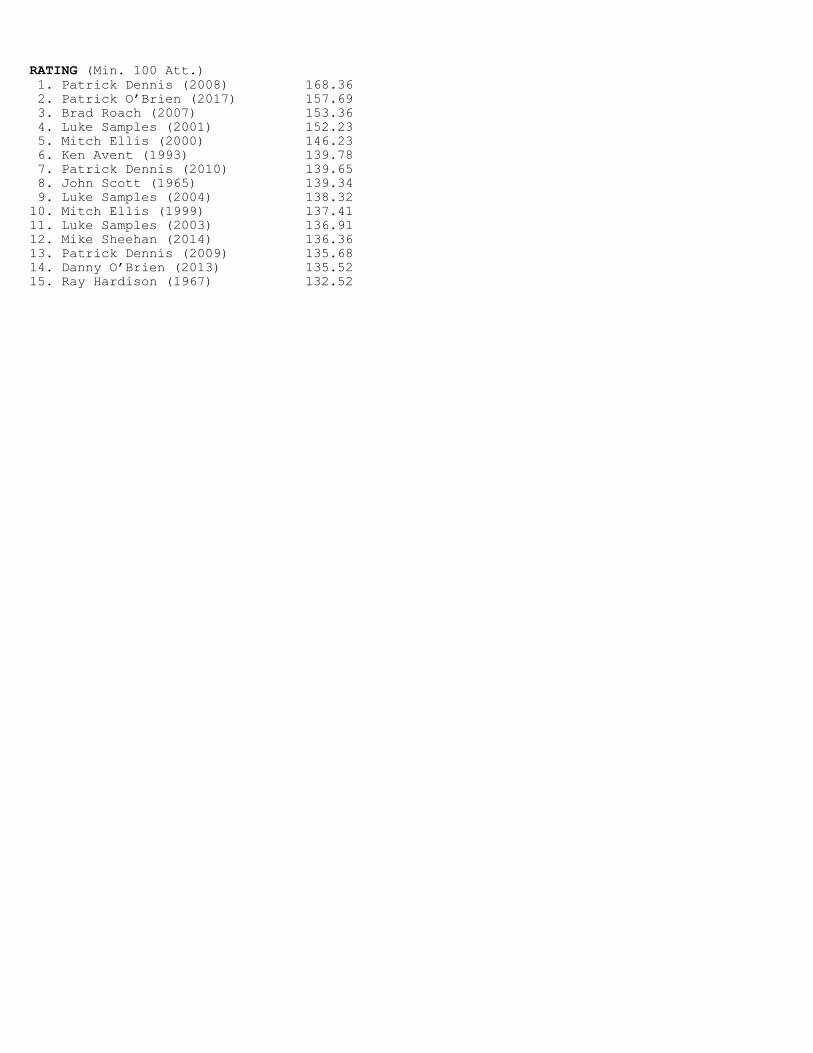
EFFICIENCY RATING SEASON – 168.4 by Patrick Dennis in 10 games, 2008.
CAREER – 144.1 by Patrick Dennis in 34 games, 2007-10.
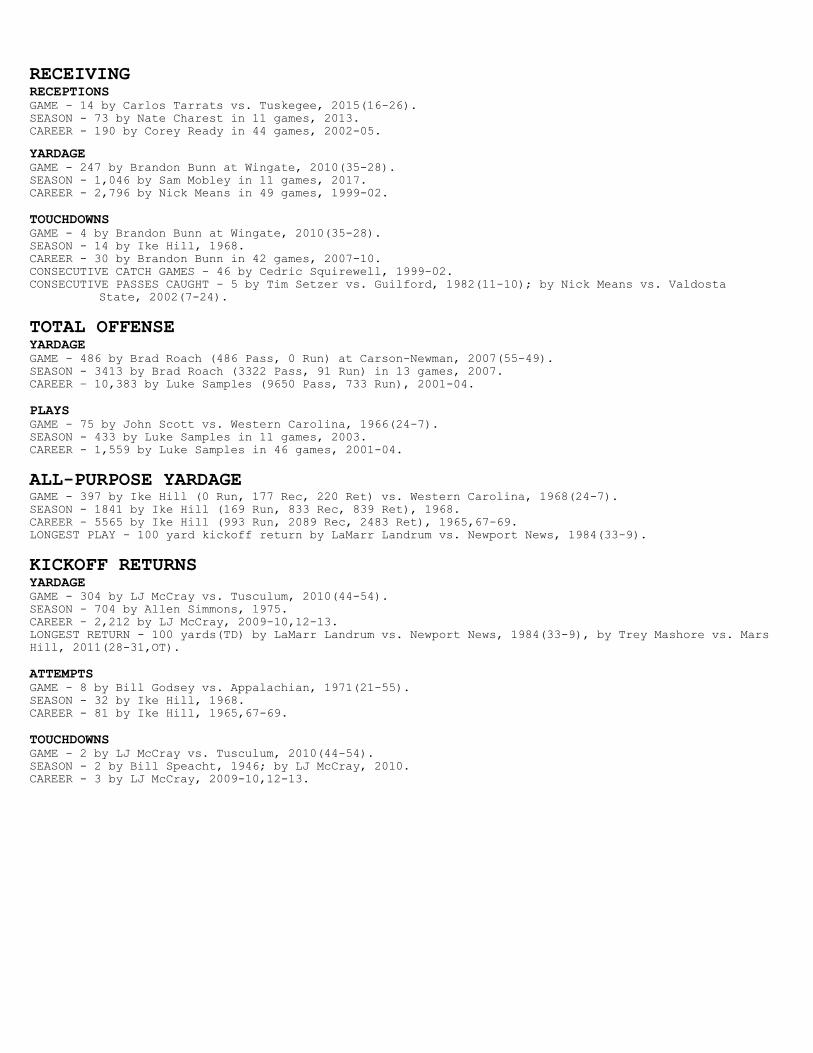
RECEIVING RECEPTIONS GAME - 14 by Carlos Tarrats vs. Tuskegee, 2015(16-26).
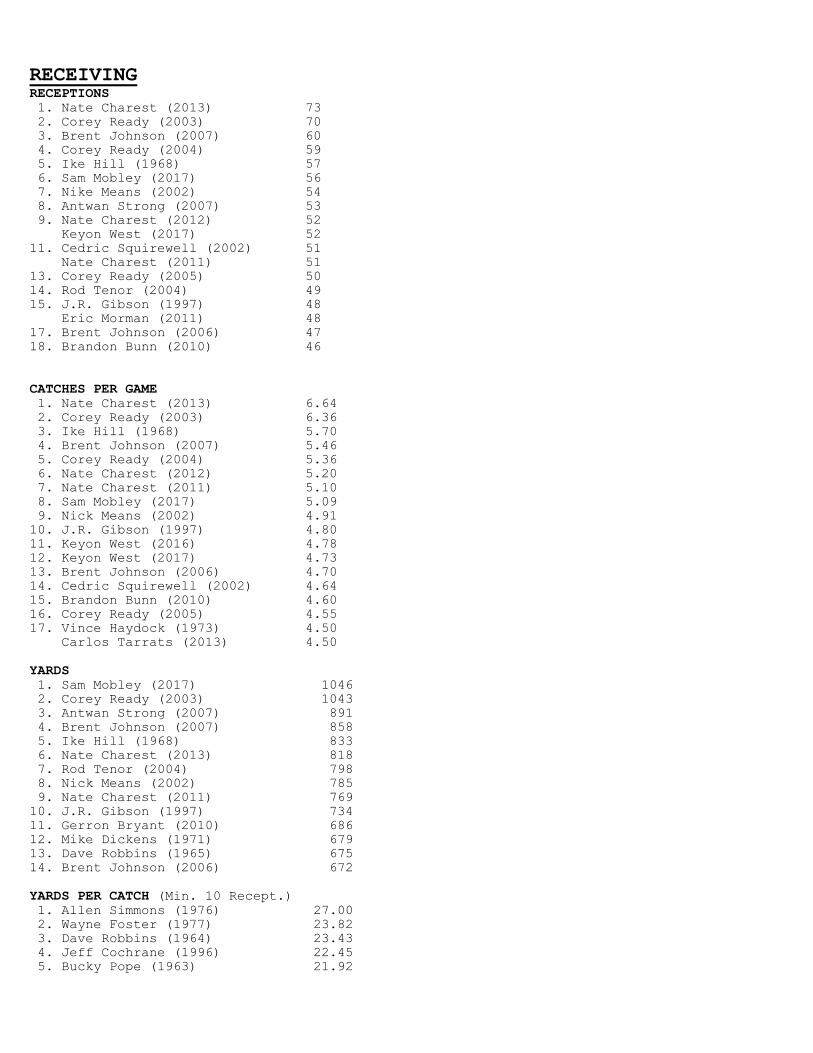
SEASON - 73 by Nate Charest in 11 games, 2013.
CAREER - 190 by Corey Ready in 44 games, 2002-05.
YARDAGE GAME - 247 by Brandon Bunn at Wingate, 2010(35-28).
SEASON - 1,046 by Sam Mobley in 11 games, 2017.
CAREER - 2,796 by Nick Means in 49 games, 1999-02.
TOUCHDOWNS GAME - 4 by Brandon Bunn at Wingate, 2010(35-28).
SEASON - 14 by Ike Hill, 1968.
CAREER - 30 by Brandon Bunn in 42 games, 2007-10.
CONSECUTIVE CATCH GAMES - 46 by Cedric Squirewell, 1999-02.
CONSECUTIVE PASSES CAUGHT - 5 by Tim Setzer vs. Guilford, 1982(11-10); by Nick Means vs. Valdosta
State, 2002(7-24).
TOTAL OFFENSE YARDAGE GAME - 486 by Brad Roach (486 Pass, 0 Run) at Carson-Newman, 2007(55-49).
SEASON - 3413 by Brad Roach (3322 Pass, 91 Run) in 13 games, 2007.
CAREER – 10,383 by Luke Samples (9650 Pass, 733 Run), 2001-04.
PLAYS GAME - 75 by John Scott vs. Western Carolina, 1966(24-7).
SEASON - 433 by Luke Samples in 11 games, 2003.
CAREER - 1,559 by Luke Samples in 46 games, 2001-04.
ALL-PURPOSE YARDAGE GAME - 397 by Ike Hill (0 Run, 177 Rec, 220 Ret) vs. Western Carolina, 1968(24-7).
SEASON - 1841 by Ike Hill (169 Run, 833 Rec, 839 Ret), 1968.
CAREER - 5565 by Ike Hill (993 Run, 2089 Rec, 2483 Ret), 1965,67-69.
LONGEST PLAY - 100 yard kickoff return by LaMarr Landrum vs. Newport News, 1984(33-9).
KICKOFF RETURNS YARDAGE GAME - 304 by LJ McCray vs. Tusculum, 2010(44-54).
SEASON - 704 by Allen Simmons, 1975.
CAREER - 2,212 by LJ McCray, 2009-10,12-13.
LONGEST RETURN - 100 yards(TD) by LaMarr Landrum vs. Newport News, 1984(33-9), by Trey Mashore vs. Mars
Hill, 2011(28-31,OT).
ATTEMPTS GAME - 8 by Bill Godsey vs. Appalachian, 1971(21-55).
SEASON - 32 by Ike Hill, 1968.
CAREER - 81 by Ike Hill, 1965,67-69.
TOUCHDOWNS GAME - 2 by LJ McCray vs. Tusculum, 2010(44-54).
SEASON - 2 by Bill Speacht, 1946; by LJ McCray, 2010.
CAREER - 3 by LJ McCray, 2009-10,12-13.
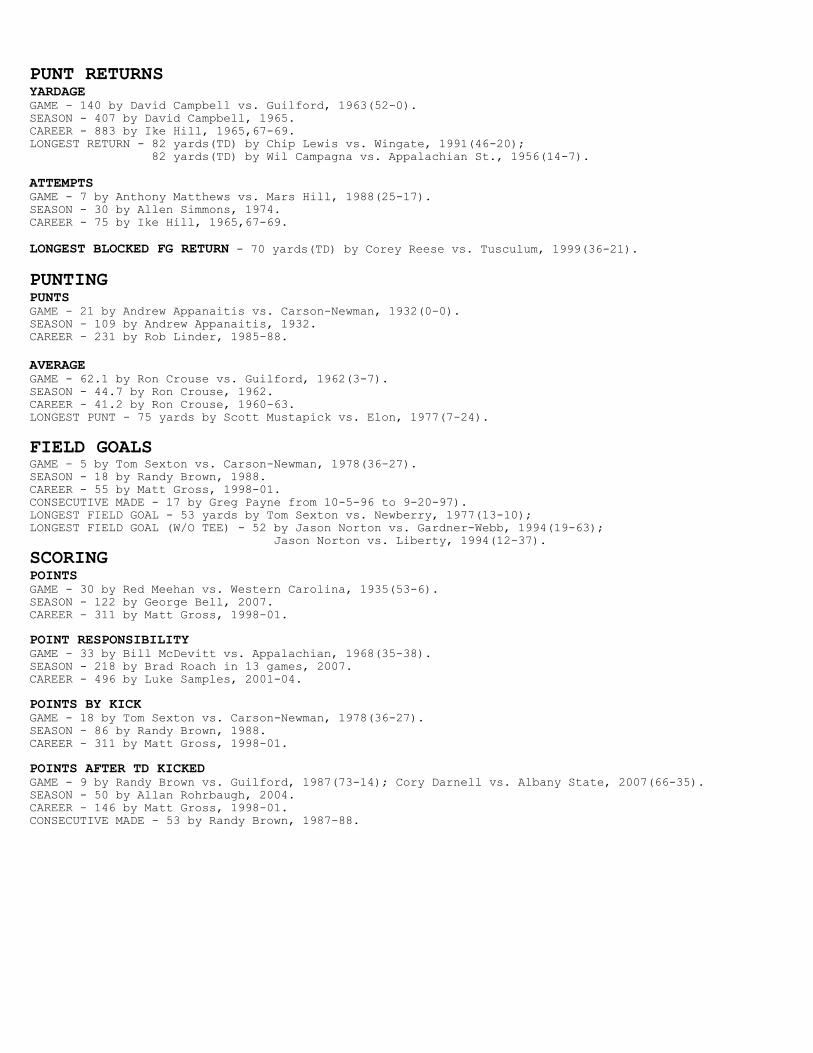
PUNT RETURNS YARDAGE GAME - 140 by David Campbell vs. Guilford, 1963(52-0).
SEASON - 407 by David Campbell, 1965.
CAREER - 883 by Ike Hill, 1965,67-69.
LONGEST RETURN - 82 yards(TD) by Chip Lewis vs. Wingate, 1991(46-20);
82 yards(TD) by Wil Campagna vs. Appalachian St., 1956(14-7).
ATTEMPTS GAME - 7 by Anthony Matthews vs. Mars Hill, 1988(25-17).
SEASON - 30 by Allen Simmons, 1974.
CAREER - 75 by Ike Hill, 1965,67-69.
LONGEST BLOCKED FG RETURN - 70 yards(TD) by Corey Reese vs. Tusculum, 1999(36-21).
PUNTING PUNTS GAME - 21 by Andrew Appanaitis vs. Carson-Newman, 1932(0-0).
SEASON - 109 by Andrew Appanaitis, 1932.
CAREER - 231 by Rob Linder, 1985-88.
AVERAGE GAME - 62.1 by Ron Crouse vs. Guilford, 1962(3-7).
SEASON - 44.7 by Ron Crouse, 1962.
CAREER - 41.2 by Ron Crouse, 1960-63.
LONGEST PUNT - 75 yards by Scott Mustapick vs. Elon, 1977(7-24).
FIELD GOALS GAME - 5 by Tom Sexton vs. Carson-Newman, 1978(36-27).
SEASON - 18 by Randy Brown, 1988.
CAREER - 55 by Matt Gross, 1998-01.
CONSECUTIVE MADE - 17 by Greg Payne from 10-5-96 to 9-20-97).
LONGEST FIELD GOAL - 53 yards by Tom Sexton vs. Newberry, 1977(13-10);
LONGEST FIELD GOAL (W/O TEE) - 52 by Jason Norton vs. Gardner-Webb, 1994(19-63);
Jason Norton vs. Liberty, 1994(12-37).
SCORING POINTS GAME - 30 by Red Meehan vs. Western Carolina, 1935(53-6).
SEASON - 122 by George Bell, 2007.
CAREER - 311 by Matt Gross, 1998-01.
POINT RESPONSIBILITY GAME - 33 by Bill McDevitt vs. Appalachian, 1968(35-38).
SEASON - 218 by Brad Roach in 13 games, 2007.
CAREER - 496 by Luke Samples, 2001-04.
POINTS BY KICK GAME - 18 by Tom Sexton vs. Carson-Newman, 1978(36-27).
SEASON - 86 by Randy Brown, 1988.
CAREER - 311 by Matt Gross, 1998-01.
POINTS AFTER TD KICKED GAME - 9 by Randy Brown vs. Guilford, 1987(73-14); Cory Darnell vs. Albany State, 2007(66-35).
SEASON - 50 by Allan Rohrbaugh, 2004.
CAREER - 146 by Matt Gross, 1998-01.
CONSECUTIVE MADE - 53 by Randy Brown, 1987-88.
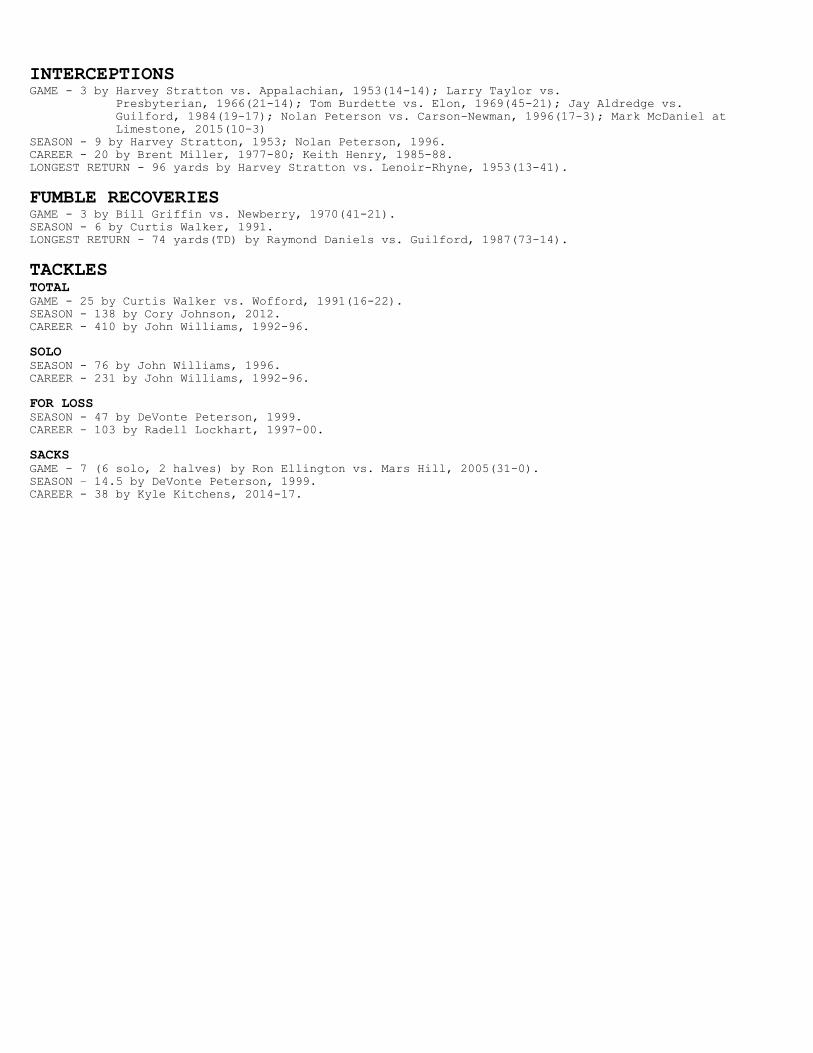
INTERCEPTIONS GAME - 3 by Harvey Stratton vs. Appalachian, 1953(14-14); Larry Taylor vs.
Presbyterian, 1966(21-14); Tom Burdette vs. Elon, 1969(45-21); Jay Aldredge vs.
Guilford, 1984(19-17); Nolan Peterson vs. Carson-Newman, 1996(17-3); Mark McDaniel at
Limestone, 2015(10-3)
SEASON - 9 by Harvey Stratton, 1953; Nolan Peterson, 1996.
CAREER - 20 by Brent Miller, 1977-80; Keith Henry, 1985-88.
LONGEST RETURN - 96 yards by Harvey Stratton vs. Lenoir-Rhyne, 1953(13-41).
FUMBLE RECOVERIES GAME - 3 by Bill Griffin vs. Newberry, 1970(41-21).
SEASON - 6 by Curtis Walker, 1991.
LONGEST RETURN - 74 yards(TD) by Raymond Daniels vs. Guilford, 1987(73-14).
TACKLES TOTAL GAME - 25 by Curtis Walker vs. Wofford, 1991(16-22).
SEASON - 138 by Cory Johnson, 2012.
CAREER - 410 by John Williams, 1992-96.
SOLO SEASON - 76 by John Williams, 1996.
CAREER - 231 by John Williams, 1992-96.
FOR LOSS SEASON - 47 by DeVonte Peterson, 1999.
CAREER - 103 by Radell Lockhart, 1997-00.
SACKS GAME - 7 (6 solo, 2 halves) by Ron Ellington vs. Mars Hill, 2005(31-0).
SEASON – 14.5 by DeVonte Peterson, 1999.
CAREER - 38 by Kyle Kitchens, 2014-17.
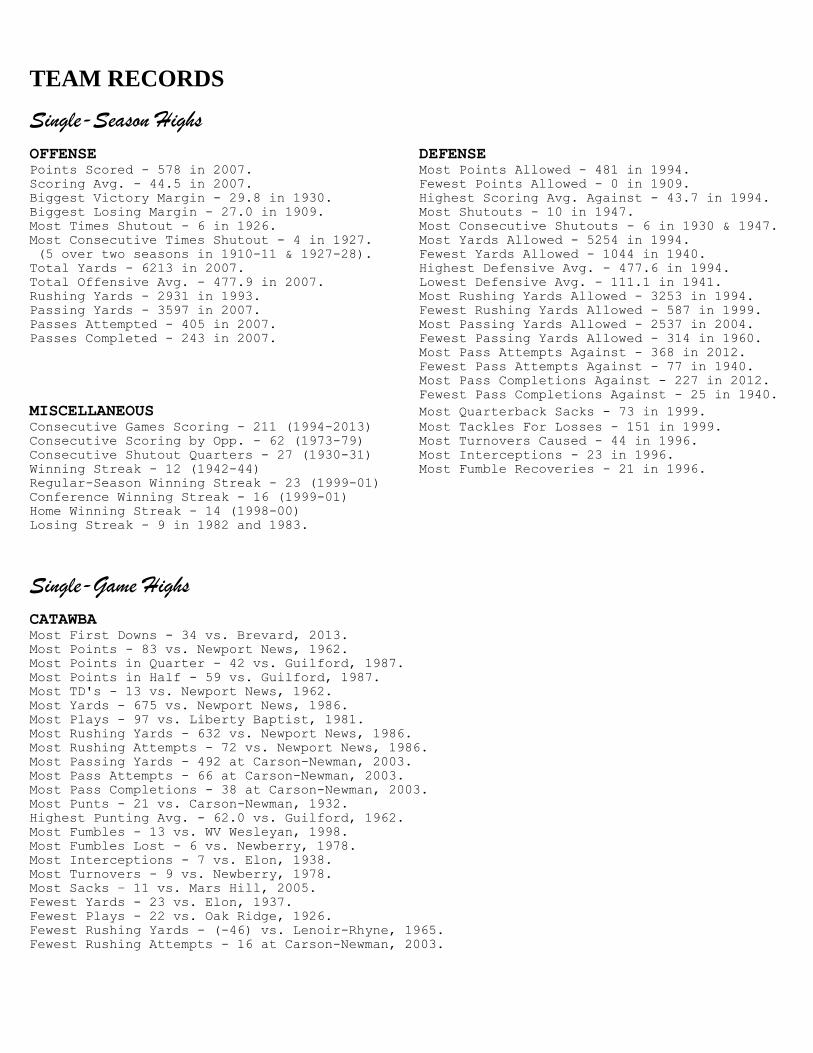
TEAM RECORDS
Single-Season Highs
OFFENSE DEFENSE Points Scored - 578 in 2007. Most Points Allowed - 481 in 1994.
Scoring Avg. - 44.5 in 2007. Fewest Points Allowed - 0 in 1909.
Biggest Victory Margin - 29.8 in 1930. Highest Scoring Avg. Against - 43.7 in 1994.
Biggest Losing Margin - 27.0 in 1909. Most Shutouts - 10 in 1947.
Most Times Shutout - 6 in 1926. Most Consecutive Shutouts - 6 in 1930 & 1947.
Most Consecutive Times Shutout - 4 in 1927. Most Yards Allowed - 5254 in 1994.
(5 over two seasons in 1910-11 & 1927-28). Fewest Yards Allowed - 1044 in 1940.
Total Yards - 6213 in 2007. Highest Defensive Avg. - 477.6 in 1994.
Total Offensive Avg. - 477.9 in 2007. Lowest Defensive Avg. - 111.1 in 1941.
Rushing Yards - 2931 in 1993. Most Rushing Yards Allowed - 3253 in 1994.
Passing Yards - 3597 in 2007. Fewest Rushing Yards Allowed - 587 in 1999.
Passes Attempted - 405 in 2007. Most Passing Yards Allowed - 2537 in 2004.
Passes Completed - 243 in 2007. Fewest Passing Yards Allowed - 314 in 1960.
Most Pass Attempts Against - 368 in 2012.
Fewest Pass Attempts Against - 77 in 1940.
Most Pass Completions Against - 227 in 2012.
Fewest Pass Completions Against - 25 in 1940.
MISCELLANEOUS Most Quarterback Sacks - 73 in 1999.
Consecutive Games Scoring - 211 (1994-2013) Most Tackles For Losses - 151 in 1999.
Consecutive Scoring by Opp. - 62 (1973-79) Most Turnovers Caused - 44 in 1996.
Consecutive Shutout Quarters - 27 (1930-31) Most Interceptions - 23 in 1996.
Winning Streak - 12 (1942-44) Most Fumble Recoveries - 21 in 1996.
Regular-Season Winning Streak - 23 (1999-01)
Conference Winning Streak - 16 (1999-01)
Home Winning Streak - 14 (1998-00)
Losing Streak - 9 in 1982 and 1983.
Single-Game Highs
CATAWBA Most First Downs - 34 vs. Brevard, 2013.
Most Points - 83 vs. Newport News, 1962.
Most Points in Quarter - 42 vs. Guilford, 1987.
Most Points in Half - 59 vs. Guilford, 1987.
Most TD's - 13 vs. Newport News, 1962.
Most Yards - 675 vs. Newport News, 1986.
Most Plays - 97 vs. Liberty Baptist, 1981.
Most Rushing Yards - 632 vs. Newport News, 1986.
Most Rushing Attempts - 72 vs. Newport News, 1986.
Most Passing Yards - 492 at Carson-Newman, 2003.
Most Pass Attempts - 66 at Carson-Newman, 2003.
Most Pass Completions - 38 at Carson-Newman, 2003.
Most Punts - 21 vs. Carson-Newman, 1932.
Highest Punting Avg. - 62.0 vs. Guilford, 1962.
Most Fumbles - 13 vs. WV Wesleyan, 1998.
Most Fumbles Lost - 6 vs. Newberry, 1978.
Most Interceptions - 7 vs. Elon, 1938.
Most Turnovers - 9 vs. Newberry, 1978.
Most Sacks – 11 vs. Mars Hill, 2005.
Fewest Yards - 23 vs. Elon, 1937.
Fewest Plays - 22 vs. Oak Ridge, 1926.
Fewest Rushing Yards - (-46) vs. Lenoir-Rhyne, 1965.
Fewest Rushing Attempts - 16 at Carson-Newman, 2003.
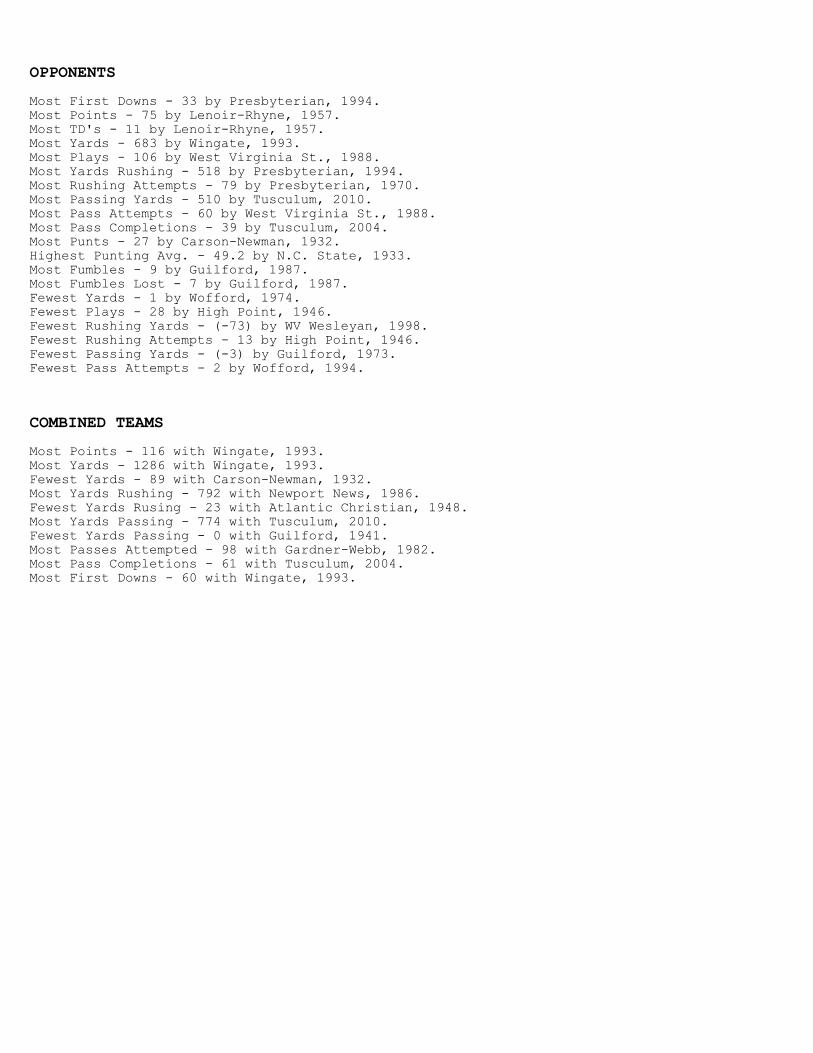
OPPONENTS
Most First Downs - 33 by Presbyterian, 1994.
Most Points - 75 by Lenoir-Rhyne, 1957.
Most TD's - 11 by Lenoir-Rhyne, 1957.
Most Yards - 683 by Wingate, 1993.
Most Plays - 106 by West Virginia St., 1988.
Most Yards Rushing - 518 by Presbyterian, 1994.
Most Rushing Attempts - 79 by Presbyterian, 1970.
Most Passing Yards - 510 by Tusculum, 2010.
Most Pass Attempts - 60 by West Virginia St., 1988.
Most Pass Completions - 39 by Tusculum, 2004.
Most Punts - 27 by Carson-Newman, 1932.
Highest Punting Avg. - 49.2 by N.C. State, 1933.
Most Fumbles - 9 by Guilford, 1987.
Most Fumbles Lost - 7 by Guilford, 1987.
Fewest Yards - 1 by Wofford, 1974.
Fewest Plays - 28 by High Point, 1946.
Fewest Rushing Yards - (-73) by WV Wesleyan, 1998.
Fewest Rushing Attempts - 13 by High Point, 1946.
Fewest Passing Yards - (-3) by Guilford, 1973.
Fewest Pass Attempts - 2 by Wofford, 1994.
COMBINED TEAMS
Most Points - 116 with Wingate, 1993.
Most Yards - 1286 with Wingate, 1993.
Fewest Yards - 89 with Carson-Newman, 1932.
Most Yards Rushing - 792 with Newport News, 1986.
Fewest Yards Rusing - 23 with Atlantic Christian, 1948.
Most Yards Passing - 774 with Tusculum, 2010.
Fewest Yards Passing - 0 with Guilford, 1941.
Most Passes Attempted - 98 with Gardner-Webb, 1982.
Most Pass Completions - 61 with Tusculum, 2004.
Most First Downs - 60 with Wingate, 1993.
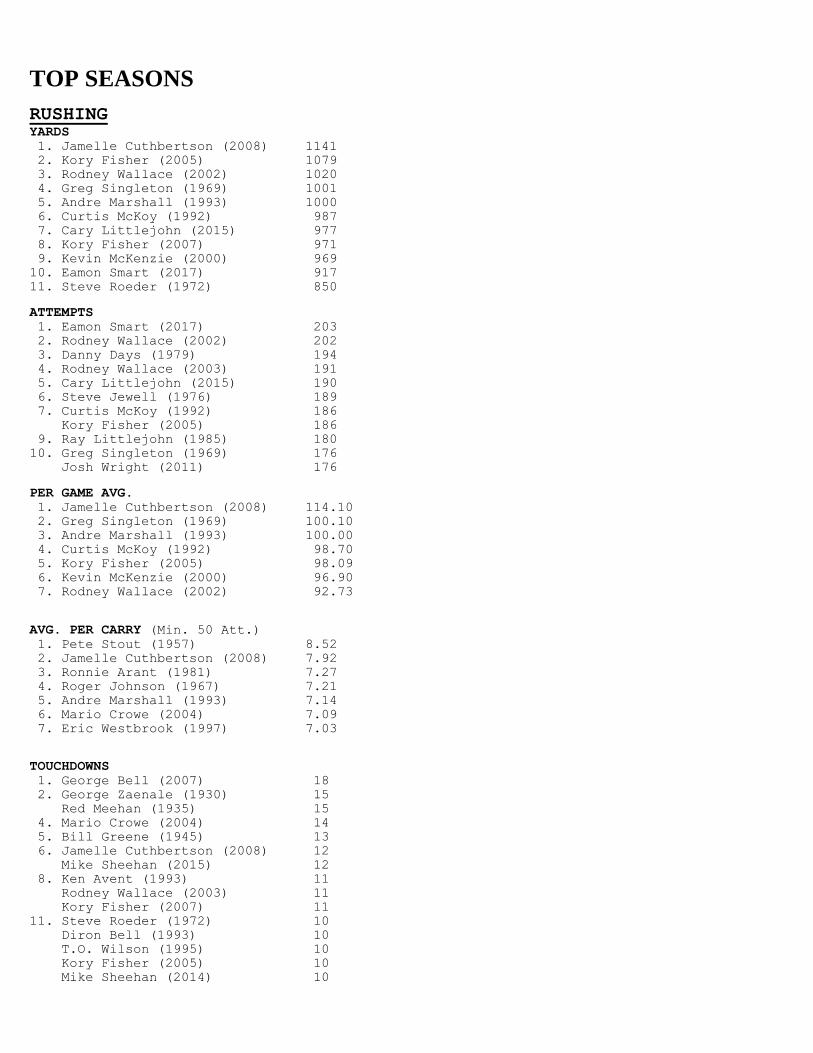
TOP SEASONS
RUSHING YARDS
1. Jamelle Cuthbertson (2008) 1141
2. Kory Fisher (2005) 1079
3. Rodney Wallace (2002) 1020
4. Greg Singleton (1969) 1001
5. Andre Marshall (1993) 1000
6. Curtis McKoy (1992) 987
7. Cary Littlejohn (2015) 977
8. Kory Fisher (2007) 971
9. Kevin McKenzie (2000) 969
10. Eamon Smart (2017) 917
11. Steve Roeder (1972) 850
ATTEMPTS
1. Eamon Smart (2017) 203
2. Rodney Wallace (2002) 202
3. Danny Days (1979) 194
4. Rodney Wallace (2003) 191
5. Cary Littlejohn (2015) 190
6. Steve Jewell (1976) 189
7. Curtis McKoy (1992) 186
Kory Fisher (2005) 186
9. Ray Littlejohn (1985) 180
10. Greg Singleton (1969) 176
Josh Wright (2011) 176
PER GAME AVG.
1. Jamelle Cuthbertson (2008) 114.10
2. Greg Singleton (1969) 100.10
3. Andre Marshall (1993) 100.00
4. Curtis McKoy (1992) 98.70
5. Kory Fisher (2005) 98.09
6. Kevin McKenzie (2000) 96.90
7. Rodney Wallace (2002) 92.73
AVG. PER CARRY (Min. 50 Att.)
1. Pete Stout (1957) 8.52
2. Jamelle Cuthbertson (2008) 7.92
3. Ronnie Arant (1981) 7.27
4. Roger Johnson (1967) 7.21
5. Andre Marshall (1993) 7.14
6. Mario Crowe (2004) 7.09
7. Eric Westbrook (1997) 7.03
TOUCHDOWNS
1. George Bell (2007) 18
2. George Zaenale (1930) 15
Red Meehan (1935) 15
4. Mario Crowe (2004) 14
5. Bill Greene (1945) 13
6. Jamelle Cuthbertson (2008) 12
Mike Sheehan (2015) 12
8. Ken Avent (1993) 11
Rodney Wallace (2003) 11
Kory Fisher (2007) 11
11. Steve Roeder (1972) 10
Diron Bell (1993) 10
T.O. Wilson (1995) 10
Kory Fisher (2005) 10
Mike Sheehan (2014) 10
PASSING
YARDS
1. Brad Roach (2007) 3322
2. Luke Samples (2003) 2785
3. Luke Samples (2004) 2658
4. Patrick O’Brien (2017) 2546
5. Danny O’Brien (2013) 2490
6. Luke Samples (2002) 2364
7. Patrick Dennis (2010) 2330
8. Brad Roach (2005) 2302
9. Mike Sheehan (2014) 2278
10. Brad Roach (2006) 2250
11. Mitch Ellis (1999) 2181
12. Mike Warfield (1988) 2144
13. Mike Warfield (1989) 1987
14. BJ Sherrill (2012) 1986
15. Jacob Charest (2011) 1959
16. Ken Avent (1990) 1795
17. Bobby Myers (1984) 1667
AVERAGE PER GAME
1. Brad Roach (2007) 255.54
2. Luke Samples (2003) 253.18
3. Danny O’Brien (2013) 249.00
4. Luke Samples (2004) 241.64
5. Patrick Dennis (2010) 233.00
6. Patrick O’Brien (2017) 231.46
7. Brad Roach (2006) 225.00
8. Patrick Dennis (2009) 217.00
9. Luke Samples (2002) 214.91
10. Brad Roach (2005) 209.27
11. Mike Sheehan (2014) 207.09
12. Mike Warfield (1989) 198.70
13. Mitch Ellis (1999) 198.27
14. Mike Warfield (1988) 194.91
TOUCHDOWNS
1. Brad Roach (2007) 32
2. Patrick O’Brien (2017) 24
3. Luke Samples (2003) 21
Luke Samples (2004) 21
5. Kevin Brown (1996) 18
Patrick Dennis (2010) 18
7. Kevin Brown (1997) 17
Mike Sheehan (2014) 17
9. Mitch Ellis (1999) 16
Brad Roach (2005) 16
11. Mike Warfield (1988) 15
Mike Warfield (1989) 15
Luke Samples (2002) 15
BJ Sherrill (2012) 15
Danny O’Brien (2013) 15
COMPLETIONS
1. Danny O’Brien (2013) 248
2. Brad Roach (2007) 224
3. Luke Samples (2003) 211
4. Luke Samples (2004) 210
5. Brad Roach (2005) 206
6. Jacob Charest (2011) 200
7. Patrick Dennis (2010) 197
8. Patrick O’Brien (2017) 190
9. Luke Samples (2002) 182
10. Brad Roach (2006) 178
Mike Sheehan (2014) 178
12. BJ Sherrill (2012) 176
13. Ken Avent (1990) 163
14. Mike Sheehan (2015) 161
15. Mike Warfield (1988) 151
16. John Scott (1966) 150
17. Bobby Myers (1984) 141
18. Mike Warfield (1989) 140
ATTEMPTS
1. Brad Roach (2005) 384
2. Brad Roach (2007) 376
3. Danny O’Brien (2013) 365
4. Luke Samples (2003) 361
5. Luke Samples (2004) 346
6. Brad Roach (2006) 339
7. Jacob Charest (2011) 338
8. Luke Samples (2002) 332
9. Ken Avent (1990) 326
10. BJ Sherrill (2012) 312
11. Patrick Dennis (2010) 308
12. Patrick O’Brien (2017) 300
13. Mike Warfield (1988) 294
14. Mike Sheehan (2014) 290
15. John Scott (1966) 281
16. Mike Warfield (1989) 277
17. Mike Sheehan (2015) 269
18. Bobby Myers (1984) 266
COMPLETION PERCENTAGE (Min 100 Att.)
1. Danny O’Brien (2013) 67.95%
2. Patrick Dennis (2010) 63.96%
3. Patrick O’Brien (2017) 63.33%
4. Mike Sheehan (2014) 61.38%
5. Luke Samples (2004) 60.69%
6. Ken Avent (1993) 60.00%
7. Mike Sheehan (2015) 59.85%
8. Mike Sheehan (2016) 59.84%
9. Luke Samples (2001) 59.74%
10. Brad Roach (2007) 59.58%
11. Jacob Charest (2011) 59.17%
12. Mitch Ellis (2000) 58.52%
13. Patrick Dennis (2008) 58.48%
14. Luke Samples (2003) 58.45%
15. Ray Hardison (1968) 58.04%
16. Ray Hardison (1967) 57.43%
17. BJ Sherrill (2012) 56.41%
18. Patrick Dennis (2009) 56.37%
19. Luke Samples (2002) 55.15%
20. John Scott (1965) 54.76%
RATING (Min. 100 Att.)
1. Patrick Dennis (2008) 168.36
2. Patrick O’Brien (2017) 157.69
3. Brad Roach (2007) 153.36
4. Luke Samples (2001) 152.23
5. Mitch Ellis (2000) 146.23
6. Ken Avent (1993) 139.78
7. Patrick Dennis (2010) 139.65
8. John Scott (1965) 139.34
9. Luke Samples (2004) 138.32
10. Mitch Ellis (1999) 137.41
11. Luke Samples (2003) 136.91
12. Mike Sheehan (2014) 136.36
13. Patrick Dennis (2009) 135.68
14. Danny O’Brien (2013) 135.52
15. Ray Hardison (1967) 132.52
RECEIVING
RECEPTIONS
1. Nate Charest (2013) 73
2. Corey Ready (2003) 70
3. Brent Johnson (2007) 60
4. Corey Ready (2004) 59
5. Ike Hill (1968) 57
6. Sam Mobley (2017) 56
7. Nike Means (2002) 54
8. Antwan Strong (2007) 53
9. Nate Charest (2012) 52
Keyon West (2017) 52
11. Cedric Squirewell (2002) 51
Nate Charest (2011) 51
13. Corey Ready (2005) 50
14. Rod Tenor (2004) 49
15. J.R. Gibson (1997) 48
Eric Morman (2011) 48
17. Brent Johnson (2006) 47
18. Brandon Bunn (2010) 46
CATCHES PER GAME
1. Nate Charest (2013) 6.64
2. Corey Ready (2003) 6.36
3. Ike Hill (1968) 5.70
4. Brent Johnson (2007) 5.46
5. Corey Ready (2004) 5.36
6. Nate Charest (2012) 5.20
7. Nate Charest (2011) 5.10
8. Sam Mobley (2017) 5.09
9. Nick Means (2002) 4.91
10. J.R. Gibson (1997) 4.80
11. Keyon West (2016) 4.78
12. Keyon West (2017) 4.73
13. Brent Johnson (2006) 4.70
14. Cedric Squirewell (2002) 4.64
15. Brandon Bunn (2010) 4.60
16. Corey Ready (2005) 4.55
17. Vince Haydock (1973) 4.50
Carlos Tarrats (2013) 4.50
YARDS
1. Sam Mobley (2017) 1046
2. Corey Ready (2003) 1043
3. Antwan Strong (2007) 891
4. Brent Johnson (2007) 858
5. Ike Hill (1968) 833
6. Nate Charest (2013) 818
7. Rod Tenor (2004) 798
8. Nick Means (2002) 785
9. Nate Charest (2011) 769
10. J.R. Gibson (1997) 734
11. Gerron Bryant (2010) 686
12. Mike Dickens (1971) 679
13. Dave Robbins (1965) 675
14. Brent Johnson (2006) 672
YARDS PER CATCH (Min. 10 Recept.)
1. Allen Simmons (1976) 27.00
2. Wayne Foster (1977) 23.82
3. Dave Robbins (1964) 23.43
4. Jeff Cochrane (1996) 22.45
5. Bucky Pope (1963) 21.92
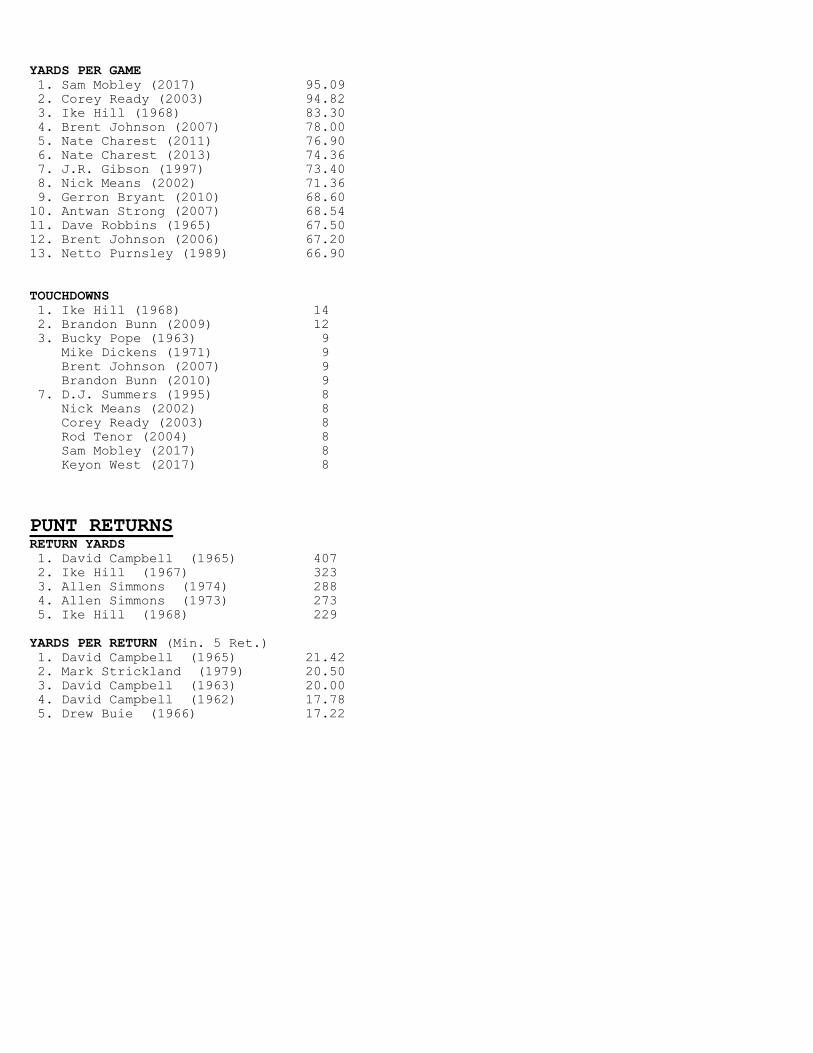
YARDS PER GAME
1. Sam Mobley (2017) 95.09
2. Corey Ready (2003) 94.82
3. Ike Hill (1968) 83.30
4. Brent Johnson (2007) 78.00
5. Nate Charest (2011) 76.90
6. Nate Charest (2013) 74.36
7. J.R. Gibson (1997) 73.40
8. Nick Means (2002) 71.36
9. Gerron Bryant (2010) 68.60
10. Antwan Strong (2007) 68.54
11. Dave Robbins (1965) 67.50
12. Brent Johnson (2006) 67.20
13. Netto Purnsley (1989) 66.90
TOUCHDOWNS
1. Ike Hill (1968) 14
2. Brandon Bunn (2009) 12
3. Bucky Pope (1963) 9
Mike Dickens (1971) 9
Brent Johnson (2007) 9
Brandon Bunn (2010) 9
7. D.J. Summers (1995) 8
Nick Means (2002) 8
Corey Ready (2003) 8
Rod Tenor (2004) 8
Sam Mobley (2017) 8
Keyon West (2017) 8
PUNT RETURNS
RETURN YARDS
1. David Campbell (1965) 407
2. Ike Hill (1967) 323
3. Allen Simmons (1974) 288
4. Allen Simmons (1973) 273
5. Ike Hill (1968) 229
YARDS PER RETURN (Min. 5 Ret.)
1. David Campbell (1965) 21.42
2. Mark Strickland (1979) 20.50
3. David Campbell (1963) 20.00
4. David Campbell (1962) 17.78
5. Drew Buie (1966) 17.22
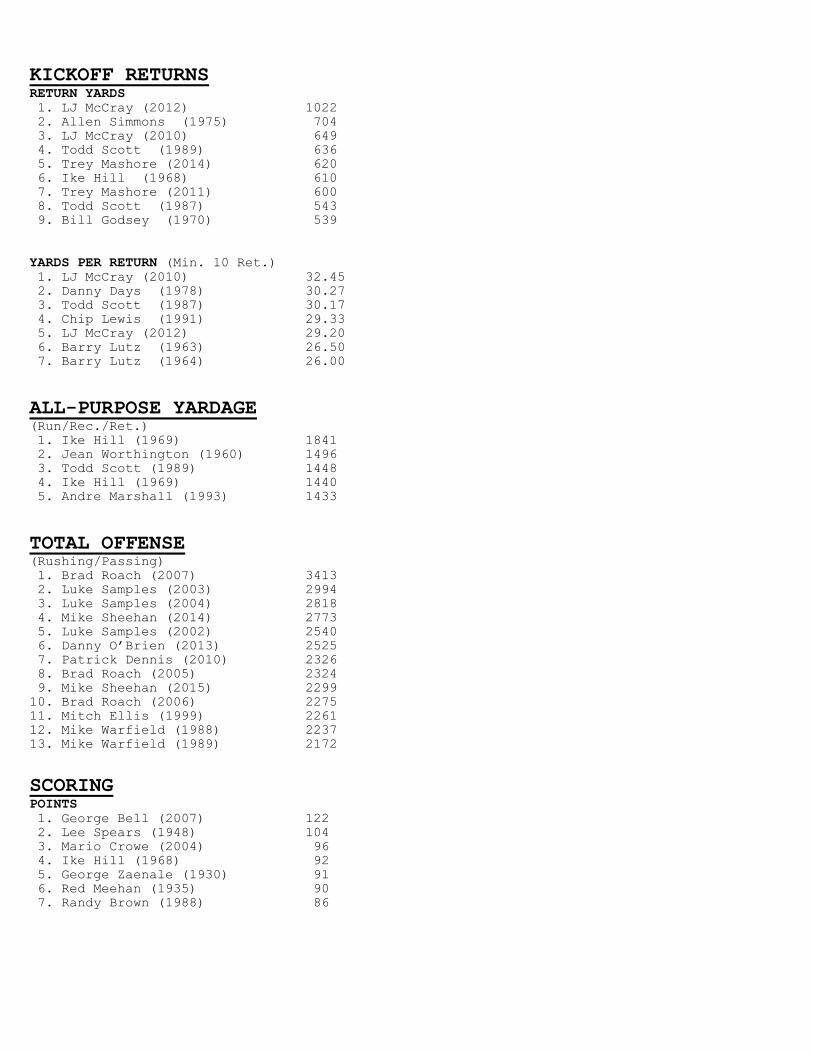
KICKOFF RETURNS
RETURN YARDS
1. LJ McCray (2012) 1022
2. Allen Simmons (1975) 704
3. LJ McCray (2010) 649
4. Todd Scott (1989) 636
5. Trey Mashore (2014) 620
6. Ike Hill (1968) 610
7. Trey Mashore (2011) 600
8. Todd Scott (1987) 543
9. Bill Godsey (1970) 539
YARDS PER RETURN (Min. 10 Ret.)
1. LJ McCray (2010) 32.45
2. Danny Days (1978) 30.27
3. Todd Scott (1987) 30.17
4. Chip Lewis (1991) 29.33
5. LJ McCray (2012) 29.20
6. Barry Lutz (1963) 26.50
7. Barry Lutz (1964) 26.00
ALL-PURPOSE YARDAGE
(Run/Rec./Ret.)
1. Ike Hill (1969) 1841
2. Jean Worthington (1960) 1496
3. Todd Scott (1989) 1448
4. Ike Hill (1969) 1440
5. Andre Marshall (1993) 1433
TOTAL OFFENSE (Rushing/Passing)
1. Brad Roach (2007) 3413
2. Luke Samples (2003) 2994
3. Luke Samples (2004) 2818
4. Mike Sheehan (2014) 2773
5. Luke Samples (2002) 2540
6. Danny O’Brien (2013) 2525
7. Patrick Dennis (2010) 2326
8. Brad Roach (2005) 2324
9. Mike Sheehan (2015) 2299
10. Brad Roach (2006) 2275
11. Mitch Ellis (1999) 2261
12. Mike Warfield (1988) 2237
13. Mike Warfield (1989) 2172
SCORING
POINTS
1. George Bell (2007) 122
2. Lee Spears (1948) 104
3. Mario Crowe (2004) 96
4. Ike Hill (1968) 92
5. George Zaenale (1930) 91
6. Red Meehan (1935) 90
7. Randy Brown (1988) 86
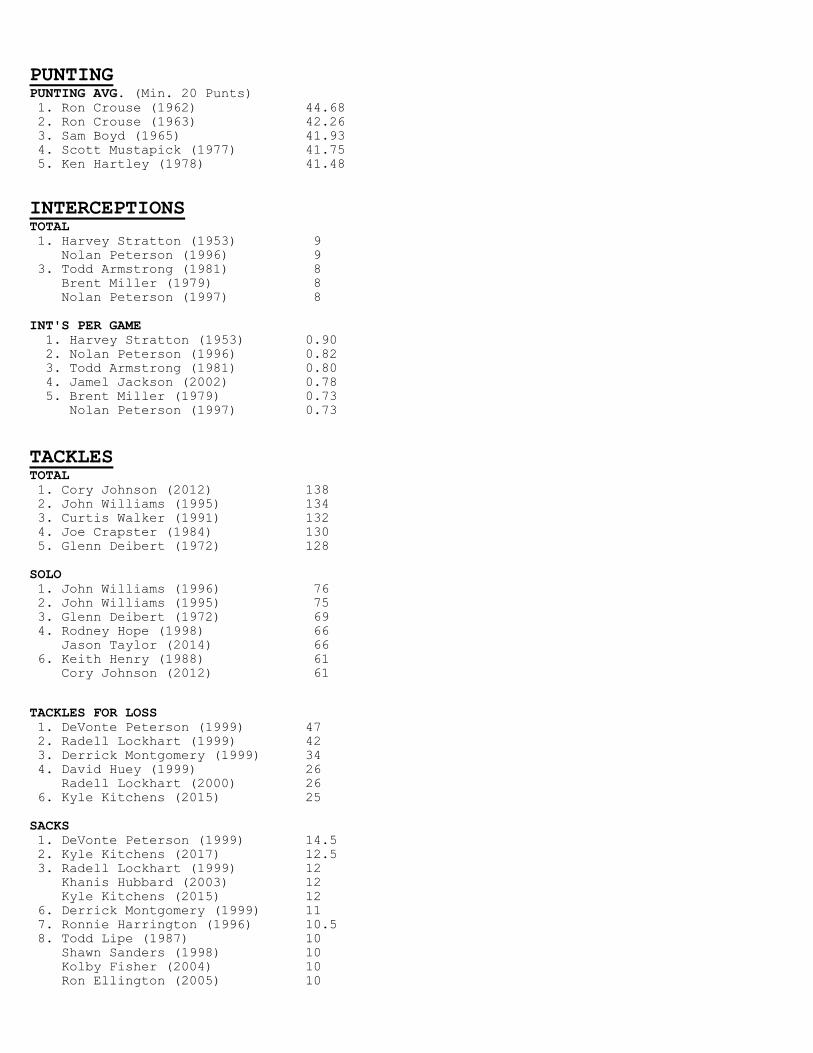
PUNTING
PUNTING AVG. (Min. 20 Punts)
1. Ron Crouse (1962) 44.68
2. Ron Crouse (1963) 42.26
3. Sam Boyd (1965) 41.93
4. Scott Mustapick (1977) 41.75
5. Ken Hartley (1978) 41.48
INTERCEPTIONS
TOTAL
1. Harvey Stratton (1953) 9
Nolan Peterson (1996) 9
3. Todd Armstrong (1981) 8
Brent Miller (1979) 8
Nolan Peterson (1997) 8
INT'S PER GAME
1. Harvey Stratton (1953) 0.90
2. Nolan Peterson (1996) 0.82
3. Todd Armstrong (1981) 0.80
4. Jamel Jackson (2002) 0.78
5. Brent Miller (1979) 0.73
Nolan Peterson (1997) 0.73
TACKLES
TOTAL
1. Cory Johnson (2012) 138
2. John Williams (1995) 134
3. Curtis Walker (1991) 132
4. Joe Crapster (1984) 130
5. Glenn Deibert (1972) 128
SOLO
1. John Williams (1996) 76
2. John Williams (1995) 75
3. Glenn Deibert (1972) 69
4. Rodney Hope (1998) 66
Jason Taylor (2014) 66
6. Keith Henry (1988) 61
Cory Johnson (2012) 61
TACKLES FOR LOSS
1. DeVonte Peterson (1999) 47
2. Radell Lockhart (1999) 42
3. Derrick Montgomery (1999) 34
4. David Huey (1999) 26
Radell Lockhart (2000) 26
6. Kyle Kitchens (2015) 25
SACKS
1. DeVonte Peterson (1999) 14.5
2. Kyle Kitchens (2017) 12.5
3. Radell Lockhart (1999) 12
Khanis Hubbard (2003) 12
Kyle Kitchens (2015) 12
6. Derrick Montgomery (1999) 11
7. Ronnie Harrington (1996) 10.5 8. Todd Lipe (1987) 10
Shawn Sanders (1998) 10
Kolby Fisher (2004) 10
Ron Ellington (2005) 10
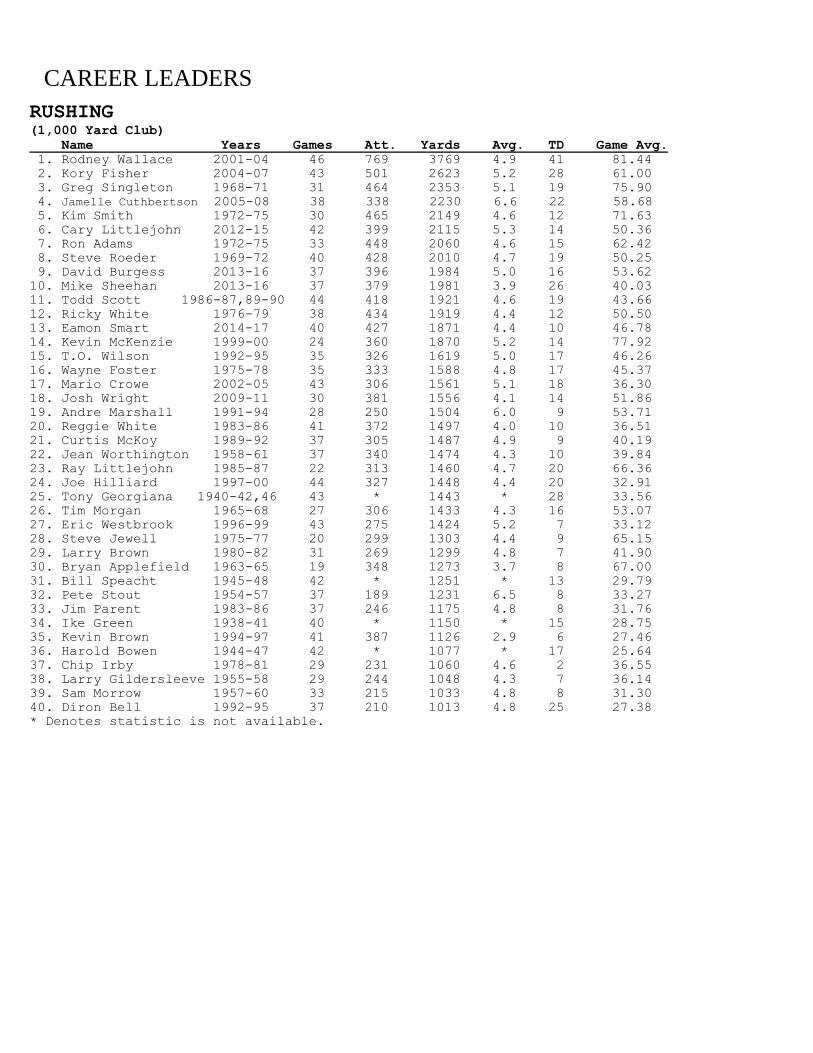
CAREER LEADERS
RUSHING (1,000 Yard Club)
Name Years Games Att. Yards Avg. TD Game Avg.
1. Rodney Wallace 2001-04 46 769 3769 4.9 41 81.44
2. Kory Fisher 2004-07 43 501 2623 5.2 28 61.00
3. Greg Singleton 1968-71 31 464 2353 5.1 19 75.90
4. Jamelle Cuthbertson 2005-08 38 338 2230 6.6 22 58.68
5. Kim Smith 1972-75 30 465 2149 4.6 12 71.63
6. Cary Littlejohn 2012-15 42 399 2115 5.3 14 50.36
7. Ron Adams 1972-75 33 448 2060 4.6 15 62.42
8. Steve Roeder 1969-72 40 428 2010 4.7 19 50.25
9. David Burgess 2013-16 37 396 1984 5.0 16 53.62
10. Mike Sheehan 2013-16 37 379 1981 3.9 26 40.03
11. Todd Scott 1986-87,89-90 44 418 1921 4.6 19 43.66
12. Ricky White 1976-79 38 434 1919 4.4 12 50.50
13. Eamon Smart 2014-17 40 427 1871 4.4 10 46.78
14. Kevin McKenzie 1999-00 24 360 1870 5.2 14 77.92
15. T.O. Wilson 1992-95 35 326 1619 5.0 17 46.26
16. Wayne Foster 1975-78 35 333 1588 4.8 17 45.37
17. Mario Crowe 2002-05 43 306 1561 5.1 18 36.30
18. Josh Wright 2009-11 30 381 1556 4.1 14 51.86
19. Andre Marshall 1991-94 28 250 1504 6.0 9 53.71
20. Reggie White 1983-86 41 372 1497 4.0 10 36.51
21. Curtis McKoy 1989-92 37 305 1487 4.9 9 40.19
22. Jean Worthington 1958-61 37 340 1474 4.3 10 39.84
23. Ray Littlejohn 1985-87 22 313 1460 4.7 20 66.36
24. Joe Hilliard 1997-00 44 327 1448 4.4 20 32.91
25. Tony Georgiana 1940-42,46 43 * 1443 * 28 33.56
26. Tim Morgan 1965-68 27 306 1433 4.3 16 53.07
27. Eric Westbrook 1996-99 43 275 1424 5.2 7 33.12
28. Steve Jewell 1975-77 20 299 1303 4.4 9 65.15
29. Larry Brown 1980-82 31 269 1299 4.8 7 41.90
30. Bryan Applefield 1963-65 19 348 1273 3.7 8 67.00
31. Bill Speacht 1945-48 42 * 1251 * 13 29.79
32. Pete Stout 1954-57 37 189 1231 6.5 8 33.27
33. Jim Parent 1983-86 37 246 1175 4.8 8 31.76
34. Ike Green 1938-41 40 * 1150 * 15 28.75
35. Kevin Brown 1994-97 41 387 1126 2.9 6 27.46
36. Harold Bowen 1944-47 42 * 1077 * 17 25.64
37. Chip Irby 1978-81 29 231 1060 4.6 2 36.55
38. Larry Gildersleeve 1955-58 29 244 1048 4.3 7 36.14
39. Sam Morrow 1957-60 33 215 1033 4.8 8 31.30
40. Diron Bell 1992-95 37 210 1013 4.8 25 27.38
* Denotes statistic is not available.
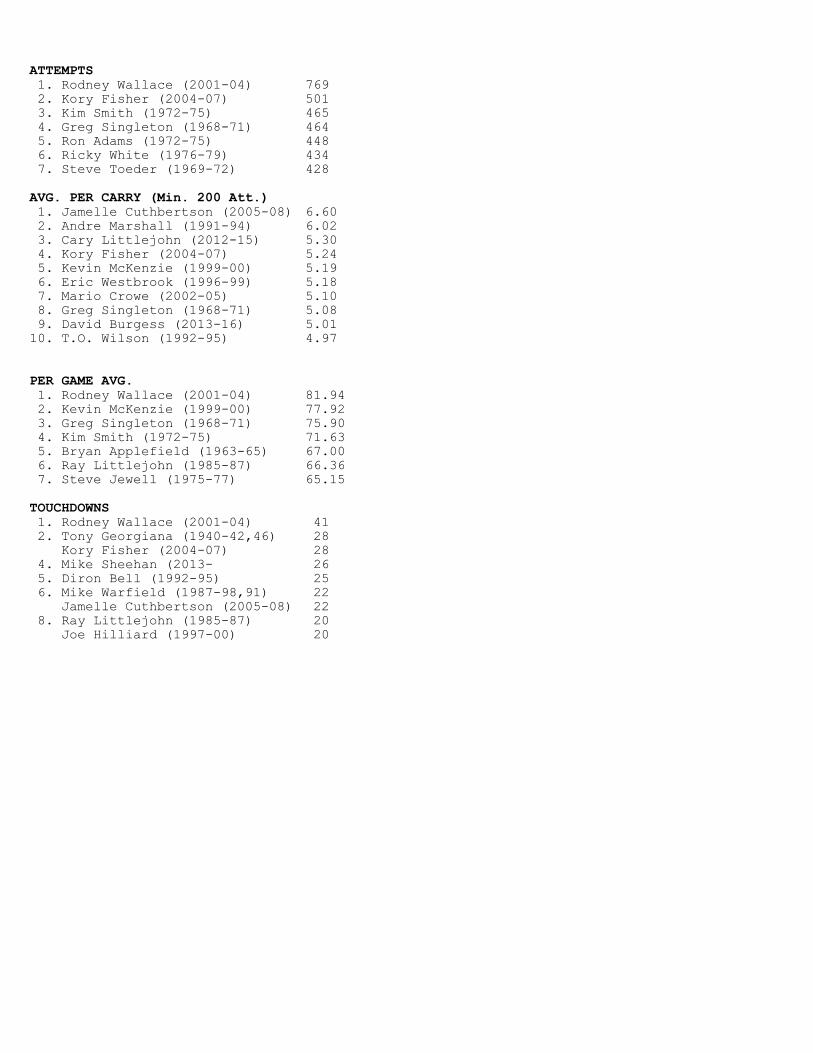
ATTEMPTS
1. Rodney Wallace (2001-04) 769
2. Kory Fisher (2004-07) 501
3. Kim Smith (1972-75) 465
4. Greg Singleton (1968-71) 464
5. Ron Adams (1972-75) 448
6. Ricky White (1976-79) 434
7. Steve Toeder (1969-72) 428
AVG. PER CARRY (Min. 200 Att.)
1. Jamelle Cuthbertson (2005-08) 6.60
2. Andre Marshall (1991-94) 6.02
3. Cary Littlejohn (2012-15) 5.30
4. Kory Fisher (2004-07) 5.24
5. Kevin McKenzie (1999-00) 5.19
6. Eric Westbrook (1996-99) 5.18
7. Mario Crowe (2002-05) 5.10
8. Greg Singleton (1968-71) 5.08
9. David Burgess (2013-16) 5.01
10. T.O. Wilson (1992-95) 4.97
PER GAME AVG.
1. Rodney Wallace (2001-04) 81.94
2. Kevin McKenzie (1999-00) 77.92
3. Greg Singleton (1968-71) 75.90
4. Kim Smith (1972-75) 71.63
5. Bryan Applefield (1963-65) 67.00
6. Ray Littlejohn (1985-87) 66.36
7. Steve Jewell (1975-77) 65.15
TOUCHDOWNS
1. Rodney Wallace (2001-04) 41
2. Tony Georgiana (1940-42,46) 28
Kory Fisher (2004-07) 28
4. Mike Sheehan (2013- 26
5. Diron Bell (1992-95) 25
6. Mike Warfield (1987-98,91) 22
Jamelle Cuthbertson (2005-08) 22
8. Ray Littlejohn (1985-87) 20
Joe Hilliard (1997-00) 20
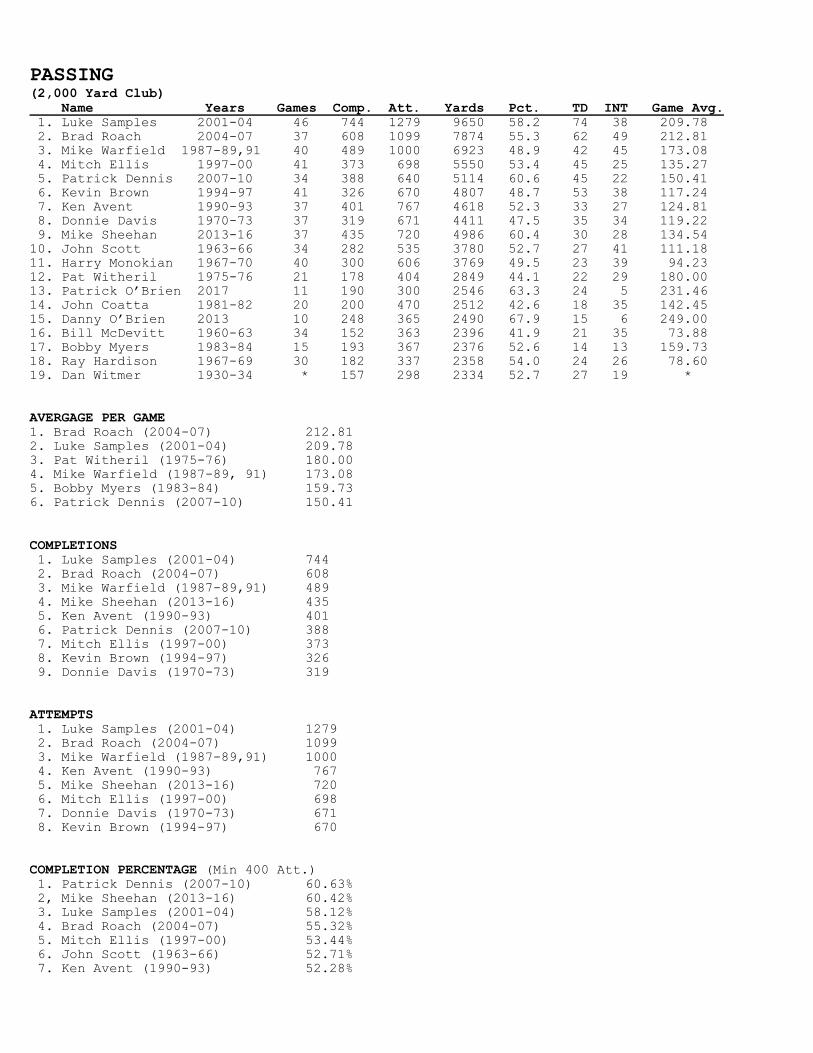
PASSING
(2,000 Yard Club)
Name Years Games Comp. Att. Yards Pct. TD INT Game Avg.
1. Luke Samples 2001-04 46 744 1279 9650 58.2 74 38 209.78
2. Brad Roach 2004-07 37 608 1099 7874 55.3 62 49 212.81
3. Mike Warfield 1987-89,91 40 489 1000 6923 48.9 42 45 173.08
4. Mitch Ellis 1997-00 41 373 698 5550 53.4 45 25 135.27
5. Patrick Dennis 2007-10 34 388 640 5114 60.6 45 22 150.41
6. Kevin Brown 1994-97 41 326 670 4807 48.7 53 38 117.24
7. Ken Avent 1990-93 37 401 767 4618 52.3 33 27 124.81
8. Donnie Davis 1970-73 37 319 671 4411 47.5 35 34 119.22
9. Mike Sheehan 2013-16 37 435 720 4986 60.4 30 28 134.54
10. John Scott 1963-66 34 282 535 3780 52.7 27 41 111.18
11. Harry Monokian 1967-70 40 300 606 3769 49.5 23 39 94.23
12. Pat Witheril 1975-76 21 178 404 2849 44.1 22 29 180.00
13. Patrick O’Brien 2017 11 190 300 2546 63.3 24 5 231.46
14. John Coatta 1981-82 20 200 470 2512 42.6 18 35 142.45
15. Danny O’Brien 2013 10 248 365 2490 67.9 15 6 249.00
16. Bill McDevitt 1960-63 34 152 363 2396 41.9 21 35 73.88
17. Bobby Myers 1983-84 15 193 367 2376 52.6 14 13 159.73
18. Ray Hardison 1967-69 30 182 337 2358 54.0 24 26 78.60
19. Dan Witmer 1930-34 * 157 298 2334 52.7 27 19 *
AVERGAGE PER GAME
1. Brad Roach (2004-07) 212.81
2. Luke Samples (2001-04) 209.78
3. Pat Witheril (1975-76) 180.00
4. Mike Warfield (1987-89, 91) 173.08
5. Bobby Myers (1983-84) 159.73
6. Patrick Dennis (2007-10) 150.41
COMPLETIONS
1. Luke Samples (2001-04) 744
2. Brad Roach (2004-07) 608
3. Mike Warfield (1987-89,91) 489
4. Mike Sheehan (2013-16) 435
5. Ken Avent (1990-93) 401
6. Patrick Dennis (2007-10) 388
7. Mitch Ellis (1997-00) 373
8. Kevin Brown (1994-97) 326
9. Donnie Davis (1970-73) 319
ATTEMPTS
1. Luke Samples (2001-04) 1279
2. Brad Roach (2004-07) 1099
3. Mike Warfield (1987-89,91) 1000
4. Ken Avent (1990-93) 767
5. Mike Sheehan (2013-16) 720
6. Mitch Ellis (1997-00) 698
7. Donnie Davis (1970-73) 671
8. Kevin Brown (1994-97) 670
COMPLETION PERCENTAGE (Min 400 Att.)
1. Patrick Dennis (2007-10) 60.63%
2, Mike Sheehan (2013-16) 60.42%
3. Luke Samples (2001-04) 58.12%
4. Brad Roach (2004-07) 55.32%
5. Mitch Ellis (1997-00) 53.44%
6. John Scott (1963-66) 52.71%
7. Ken Avent (1990-93) 52.28%
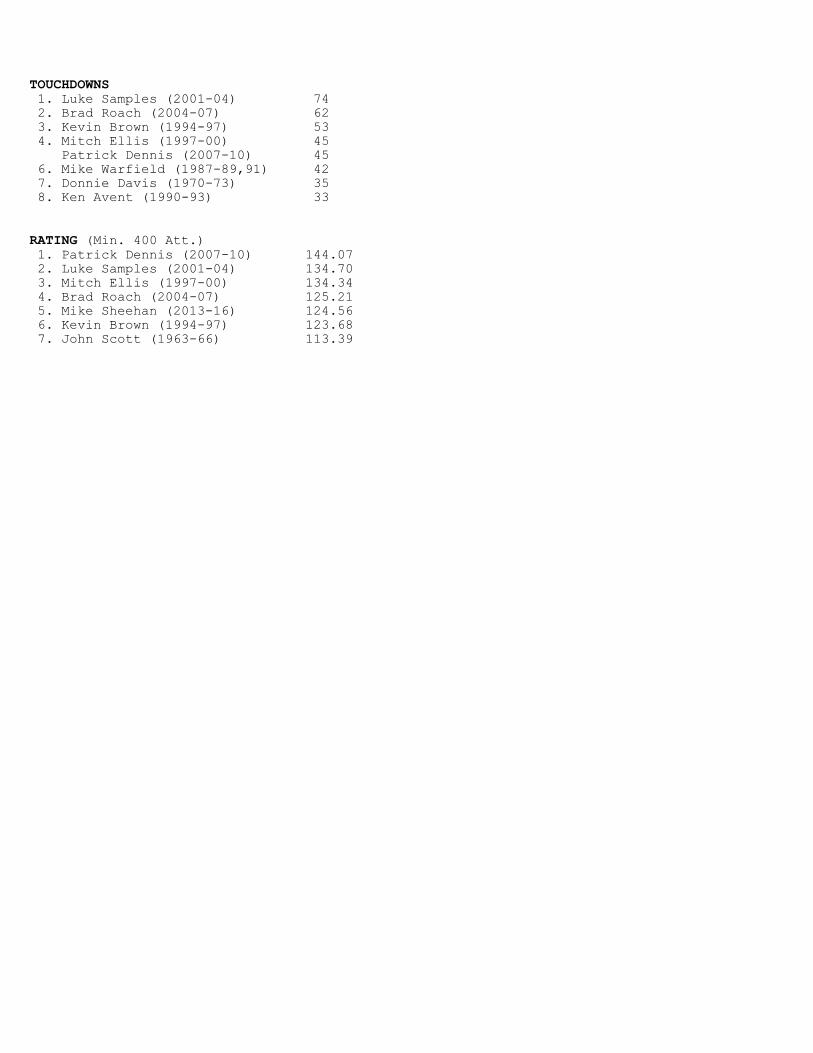
TOUCHDOWNS
1. Luke Samples (2001-04) 74
2. Brad Roach (2004-07) 62
3. Kevin Brown (1994-97) 53
4. Mitch Ellis (1997-00) 45
Patrick Dennis (2007-10) 45
6. Mike Warfield (1987-89,91) 42
7. Donnie Davis (1970-73) 35
8. Ken Avent (1990-93) 33
RATING (Min. 400 Att.)
1. Patrick Dennis (2007-10) 144.07
2. Luke Samples (2001-04) 134.70
3. Mitch Ellis (1997-00) 134.34
4. Brad Roach (2004-07) 125.21
5. Mike Sheehan (2013-16) 124.56
6. Kevin Brown (1994-97) 123.68
7. John Scott (1963-66) 113.39
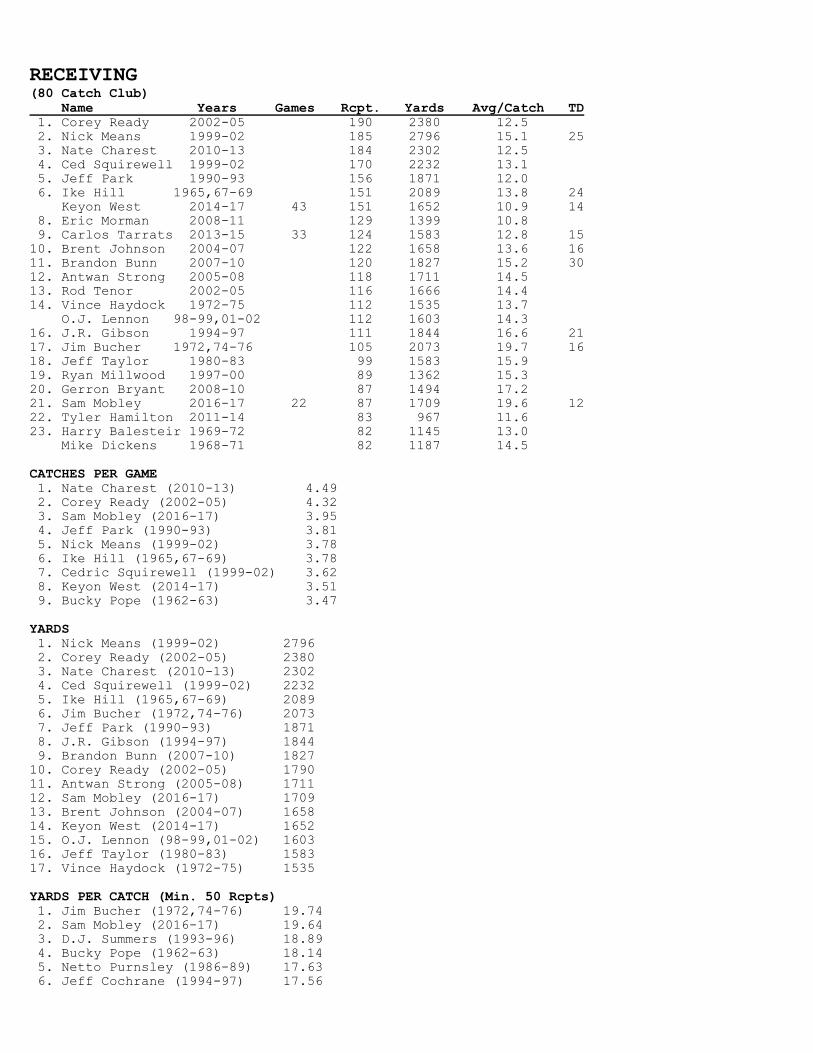
RECEIVING
(80 Catch Club)
Name Years Games Rcpt. Yards Avg/Catch TD
1. Corey Ready 2002-05 190 2380 12.5
2. Nick Means 1999-02 185 2796 15.1 25
3. Nate Charest 2010-13 184 2302 12.5
4. Ced Squirewell 1999-02 170 2232 13.1
5. Jeff Park 1990-93 156 1871 12.0
6. Ike Hill 1965,67-69 151 2089 13.8 24
Keyon West 2014-17 43 151 1652 10.9 14
8. Eric Morman 2008-11 129 1399 10.8
9. Carlos Tarrats 2013-15 33 124 1583 12.8 15
10. Brent Johnson 2004-07 122 1658 13.6 16
11. Brandon Bunn 2007-10 120 1827 15.2 30
12. Antwan Strong 2005-08 118 1711 14.5
13. Rod Tenor 2002-05 116 1666 14.4
14. Vince Haydock 1972-75 112 1535 13.7
O.J. Lennon 98-99,01-02 112 1603 14.3
16. J.R. Gibson 1994-97 111 1844 16.6 21
17. Jim Bucher 1972,74-76 105 2073 19.7 16
18. Jeff Taylor 1980-83 99 1583 15.9
19. Ryan Millwood 1997-00 89 1362 15.3
20. Gerron Bryant 2008-10 87 1494 17.2
21. Sam Mobley 2016-17 22 87 1709 19.6 12
22. Tyler Hamilton 2011-14 83 967 11.6
23. Harry Balesteir 1969-72 82 1145 13.0
Mike Dickens 1968-71 82 1187 14.5
CATCHES PER GAME
1. Nate Charest (2010-13) 4.49
2. Corey Ready (2002-05) 4.32
3. Sam Mobley (2016-17) 3.95
4. Jeff Park (1990-93) 3.81
5. Nick Means (1999-02) 3.78
6. Ike Hill (1965,67-69) 3.78
7. Cedric Squirewell (1999-02) 3.62
8. Keyon West (2014-17) 3.51
9. Bucky Pope (1962-63) 3.47
YARDS
1. Nick Means (1999-02) 2796
2. Corey Ready (2002-05) 2380
3. Nate Charest (2010-13) 2302
4. Ced Squirewell (1999-02) 2232
5. Ike Hill (1965,67-69) 2089
6. Jim Bucher (1972,74-76) 2073
7. Jeff Park (1990-93) 1871
8. J.R. Gibson (1994-97) 1844
9. Brandon Bunn (2007-10) 1827
10. Corey Ready (2002-05) 1790
11. Antwan Strong (2005-08) 1711
12. Sam Mobley (2016-17) 1709
13. Brent Johnson (2004-07) 1658
14. Keyon West (2014-17) 1652
15. O.J. Lennon (98-99,01-02) 1603
16. Jeff Taylor (1980-83) 1583
17. Vince Haydock (1972-75) 1535
YARDS PER CATCH (Min. 50 Rcpts)
1. Jim Bucher (1972,74-76) 19.74
2. Sam Mobley (2016-17) 19.64
3. D.J. Summers (1993-96) 18.89
4. Bucky Pope (1962-63) 18.14
5. Netto Purnsley (1986-89) 17.63
6. Jeff Cochrane (1994-97) 17.56
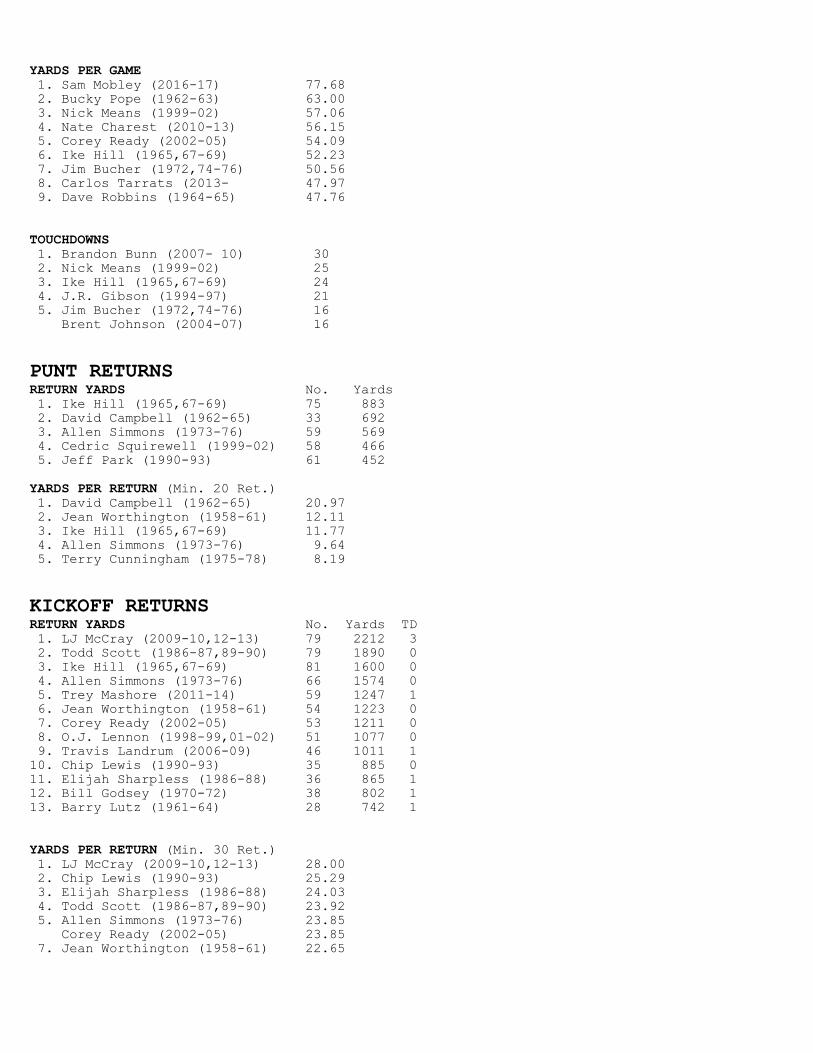
YARDS PER GAME
1. Sam Mobley (2016-17) 77.68
2. Bucky Pope (1962-63) 63.00
3. Nick Means (1999-02) 57.06
4. Nate Charest (2010-13) 56.15
5. Corey Ready (2002-05) 54.09
6. Ike Hill (1965,67-69) 52.23
7. Jim Bucher (1972,74-76) 50.56
8. Carlos Tarrats (2013- 47.97
9. Dave Robbins (1964-65) 47.76
TOUCHDOWNS
1. Brandon Bunn (2007- 10) 30
2. Nick Means (1999-02) 25
3. Ike Hill (1965,67-69) 24
4. J.R. Gibson (1994-97) 21
5. Jim Bucher (1972,74-76) 16
Brent Johnson (2004-07) 16
PUNT RETURNS
RETURN YARDS No. Yards
1. Ike Hill (1965,67-69) 75 883
2. David Campbell (1962-65) 33 692
3. Allen Simmons (1973-76) 59 569
4. Cedric Squirewell (1999-02) 58 466
5. Jeff Park (1990-93) 61 452
YARDS PER RETURN (Min. 20 Ret.)
1. David Campbell (1962-65) 20.97
2. Jean Worthington (1958-61) 12.11
3. Ike Hill (1965,67-69) 11.77
4. Allen Simmons (1973-76) 9.64
5. Terry Cunningham (1975-78) 8.19
KICKOFF RETURNS
RETURN YARDS No. Yards TD
1. LJ McCray (2009-10,12-13) 79 2212 3
2. Todd Scott (1986-87,89-90) 79 1890 0
3. Ike Hill (1965,67-69) 81 1600 0
4. Allen Simmons (1973-76) 66 1574 0
5. Trey Mashore (2011-14) 59 1247 1
6. Jean Worthington (1958-61) 54 1223 0
7. Corey Ready (2002-05) 53 1211 0
8. O.J. Lennon (1998-99,01-02) 51 1077 0
9. Travis Landrum (2006-09) 46 1011 1
10. Chip Lewis (1990-93) 35 885 0
11. Elijah Sharpless (1986-88) 36 865 1
12. Bill Godsey (1970-72) 38 802 1
13. Barry Lutz (1961-64) 28 742 1
YARDS PER RETURN (Min. 30 Ret.)
1. LJ McCray (2009-10,12-13) 28.00
2. Chip Lewis (1990-93) 25.29
3. Elijah Sharpless (1986-88) 24.03
4. Todd Scott (1986-87,89-90) 23.92
5. Allen Simmons (1973-76) 23.85
Corey Ready (2002-05) 23.85
7. Jean Worthington (1958-61) 22.65
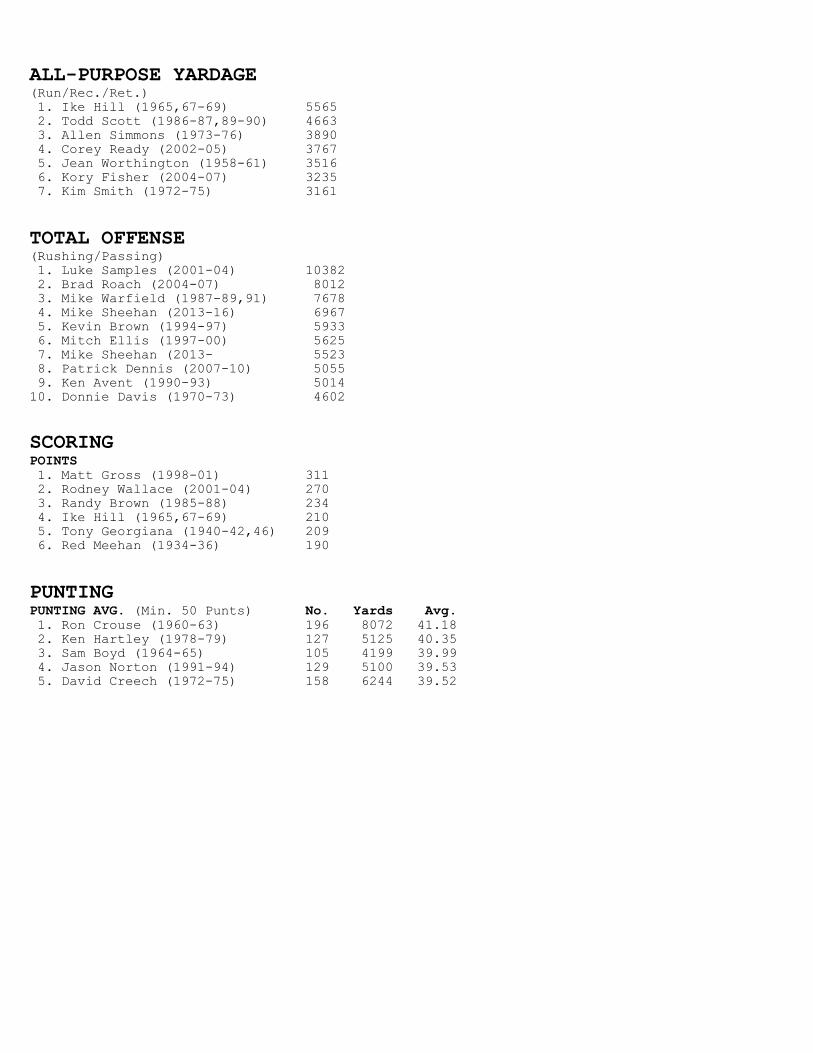
ALL-PURPOSE YARDAGE
(Run/Rec./Ret.)
1. Ike Hill (1965,67-69) 5565
2. Todd Scott (1986-87,89-90) 4663
3. Allen Simmons (1973-76) 3890
4. Corey Ready (2002-05) 3767
5. Jean Worthington (1958-61) 3516
6. Kory Fisher (2004-07) 3235
7. Kim Smith (1972-75) 3161
TOTAL OFFENSE (Rushing/Passing)
1. Luke Samples (2001-04) 10382
2. Brad Roach (2004-07) 8012
3. Mike Warfield (1987-89,91) 7678
4. Mike Sheehan (2013-16) 6967
5. Kevin Brown (1994-97) 5933
6. Mitch Ellis (1997-00) 5625
7. Mike Sheehan (2013- 5523
8. Patrick Dennis (2007-10) 5055
9. Ken Avent (1990-93) 5014
10. Donnie Davis (1970-73) 4602
SCORING
POINTS
1. Matt Gross (1998-01) 311
2. Rodney Wallace (2001-04) 270
3. Randy Brown (1985-88) 234
4. Ike Hill (1965,67-69) 210
5. Tony Georgiana (1940-42,46) 209
6. Red Meehan (1934-36) 190
PUNTING PUNTING AVG. (Min. 50 Punts) No. Yards Avg.
1. Ron Crouse (1960-63) 196 8072 41.18
2. Ken Hartley (1978-79) 127 5125 40.35
3. Sam Boyd (1964-65) 105 4199 39.99
4. Jason Norton (1991-94) 129 5100 39.53
5. David Creech (1972-75) 158 6244 39.52
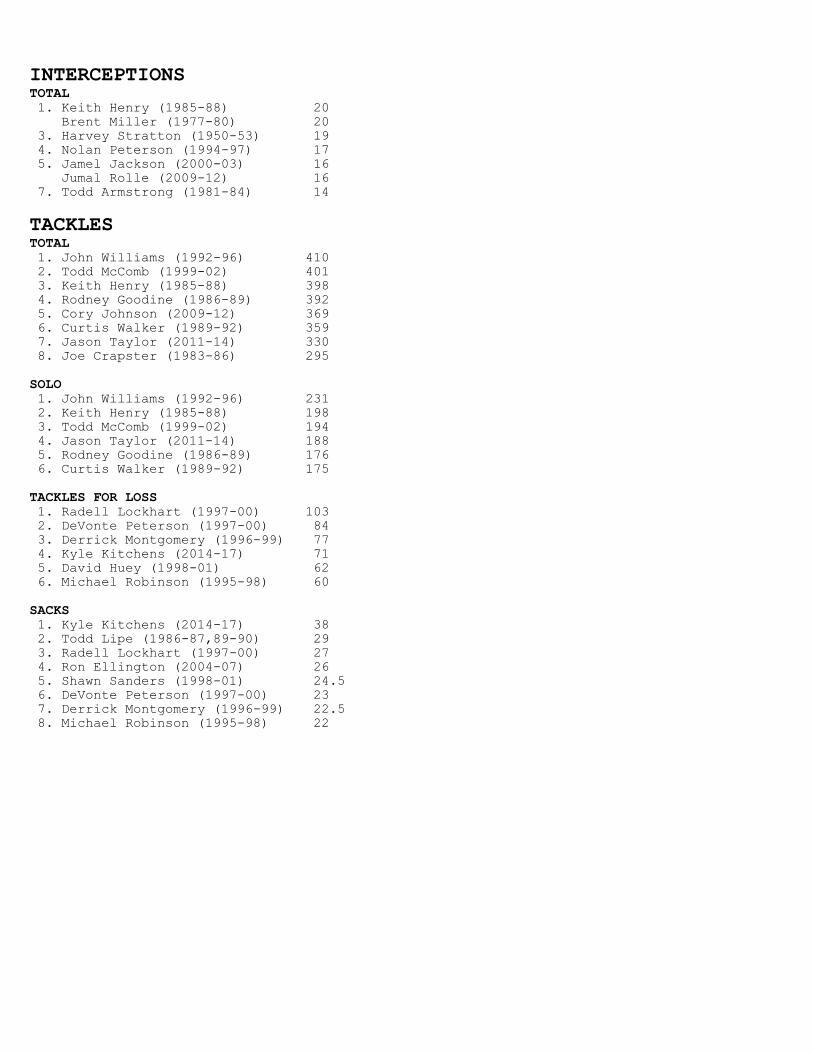
INTERCEPTIONS
TOTAL
1. Keith Henry (1985-88) 20
Brent Miller (1977-80) 20
3. Harvey Stratton (1950-53) 19
4. Nolan Peterson (1994-97) 17
5. Jamel Jackson (2000-03) 16
Jumal Rolle (2009-12) 16
7. Todd Armstrong (1981-84) 14
TACKLES
TOTAL
1. John Williams (1992-96) 410
2. Todd McComb (1999-02) 401
3. Keith Henry (1985-88) 398
4. Rodney Goodine (1986-89) 392
5. Cory Johnson (2009-12) 369
6. Curtis Walker (1989-92) 359
7. Jason Taylor (2011-14) 330
8. Joe Crapster (1983-86) 295
SOLO
1. John Williams (1992-96) 231
2. Keith Henry (1985-88) 198
3. Todd McComb (1999-02) 194
4. Jason Taylor (2011-14) 188
5. Rodney Goodine (1986-89) 176
6. Curtis Walker (1989-92) 175
TACKLES FOR LOSS
1. Radell Lockhart (1997-00) 103
2. DeVonte Peterson (1997-00) 84
3. Derrick Montgomery (1996-99) 77
4. Kyle Kitchens (2014-17) 71
5. David Huey (1998-01) 62 6. Michael Robinson (1995-98) 60
SACKS
1. Kyle Kitchens (2014-17) 38
2. Todd Lipe (1986-87,89-90) 29
3. Radell Lockhart (1997-00) 27
4. Ron Ellington (2004-07) 26
5. Shawn Sanders (1998-01) 24.5
6. DeVonte Peterson (1997-00) 23
7. Derrick Montgomery (1996-99) 22.5
8. Michael Robinson (1995-98) 22
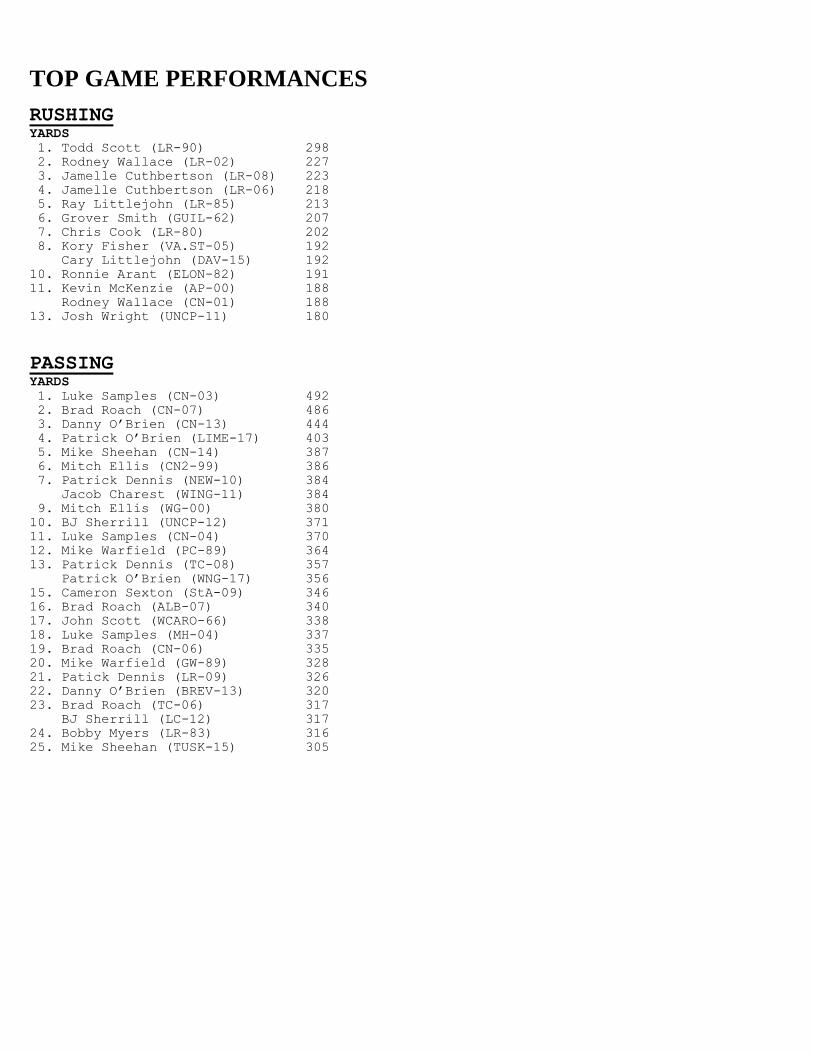
TOP GAME PERFORMANCES
RUSHING
YARDS
1. Todd Scott (LR-90) 298
2. Rodney Wallace (LR-02) 227
3. Jamelle Cuthbertson (LR-08) 223
4. Jamelle Cuthbertson (LR-06) 218
5. Ray Littlejohn (LR-85) 213
6. Grover Smith (GUIL-62) 207
7. Chris Cook (LR-80) 202
8. Kory Fisher (VA.ST-05) 192
Cary Littlejohn (DAV-15) 192
10. Ronnie Arant (ELON-82) 191
11. Kevin McKenzie (AP-00) 188
Rodney Wallace (CN-01) 188
13. Josh Wright (UNCP-11) 180
PASSING YARDS
1. Luke Samples (CN-03) 492
2. Brad Roach (CN-07) 486
3. Danny O’Brien (CN-13) 444
4. Patrick O’Brien (LIME-17) 403
5. Mike Sheehan (CN-14) 387
6. Mitch Ellis (CN2-99) 386
7. Patrick Dennis (NEW-10) 384
Jacob Charest (WING-11) 384
9. Mitch Ellis (WG-00) 380
10. BJ Sherrill (UNCP-12) 371
11. Luke Samples (CN-04) 370
12. Mike Warfield (PC-89) 364
13. Patrick Dennis (TC-08) 357
Patrick O’Brien (WNG-17) 356
15. Cameron Sexton (StA-09) 346
16. Brad Roach (ALB-07) 340
17. John Scott (WCARO-66) 338
18. Luke Samples (MH-04) 337
19. Brad Roach (CN-06) 335
20. Mike Warfield (GW-89) 328
21. Patick Dennis (LR-09) 326
22. Danny O’Brien (BREV-13) 320
23. Brad Roach (TC-06) 317
BJ Sherrill (LC-12) 317
24. Bobby Myers (LR-83) 316
25. Mike Sheehan (TUSK-15) 305
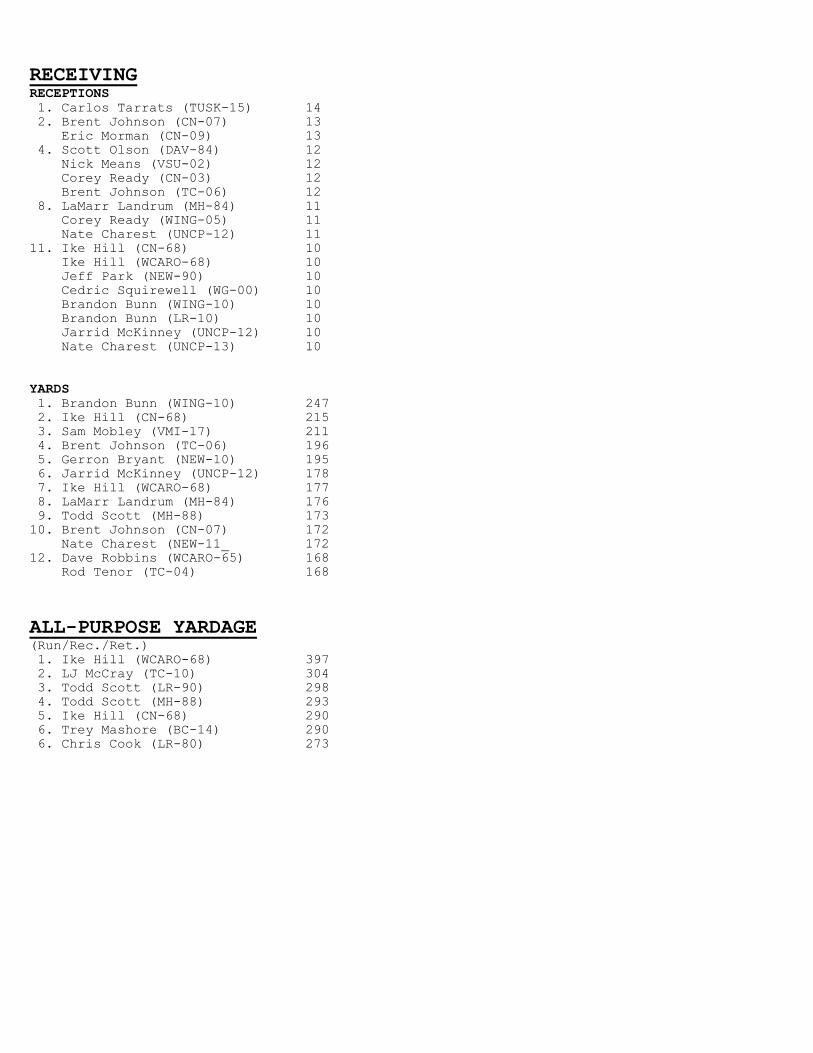
RECEIVING
RECEPTIONS
1. Carlos Tarrats (TUSK-15) 14
2. Brent Johnson (CN-07) 13
Eric Morman (CN-09) 13
4. Scott Olson (DAV-84) 12
Nick Means (VSU-02) 12
Corey Ready (CN-03) 12
Brent Johnson (TC-06) 12
8. LaMarr Landrum (MH-84) 11
Corey Ready (WING-05) 11
Nate Charest (UNCP-12) 11
11. Ike Hill (CN-68) 10
Ike Hill (WCARO-68) 10
Jeff Park (NEW-90) 10
Cedric Squirewell (WG-00) 10
Brandon Bunn (WING-10) 10
Brandon Bunn (LR-10) 10
Jarrid McKinney (UNCP-12) 10
Nate Charest (UNCP-13) 10
YARDS
1. Brandon Bunn (WING-10) 247
2. Ike Hill (CN-68) 215
3. Sam Mobley (VMI-17) 211
4. Brent Johnson (TC-06) 196
5. Gerron Bryant (NEW-10) 195
6. Jarrid McKinney (UNCP-12) 178
7. Ike Hill (WCARO-68) 177
8. LaMarr Landrum (MH-84) 176
9. Todd Scott (MH-88) 173
10. Brent Johnson (CN-07) 172
Nate Charest (NEW-11_ 172
12. Dave Robbins (WCARO-65) 168
Rod Tenor (TC-04) 168
ALL-PURPOSE YARDAGE
(Run/Rec./Ret.)
1. Ike Hill (WCARO-68) 397
2. LJ McCray (TC-10) 304
3. Todd Scott (LR-90) 298
4. Todd Scott (MH-88) 293
5. Ike Hill (CN-68) 290
6. Trey Mashore (BC-14) 290
6. Chris Cook (LR-80) 273
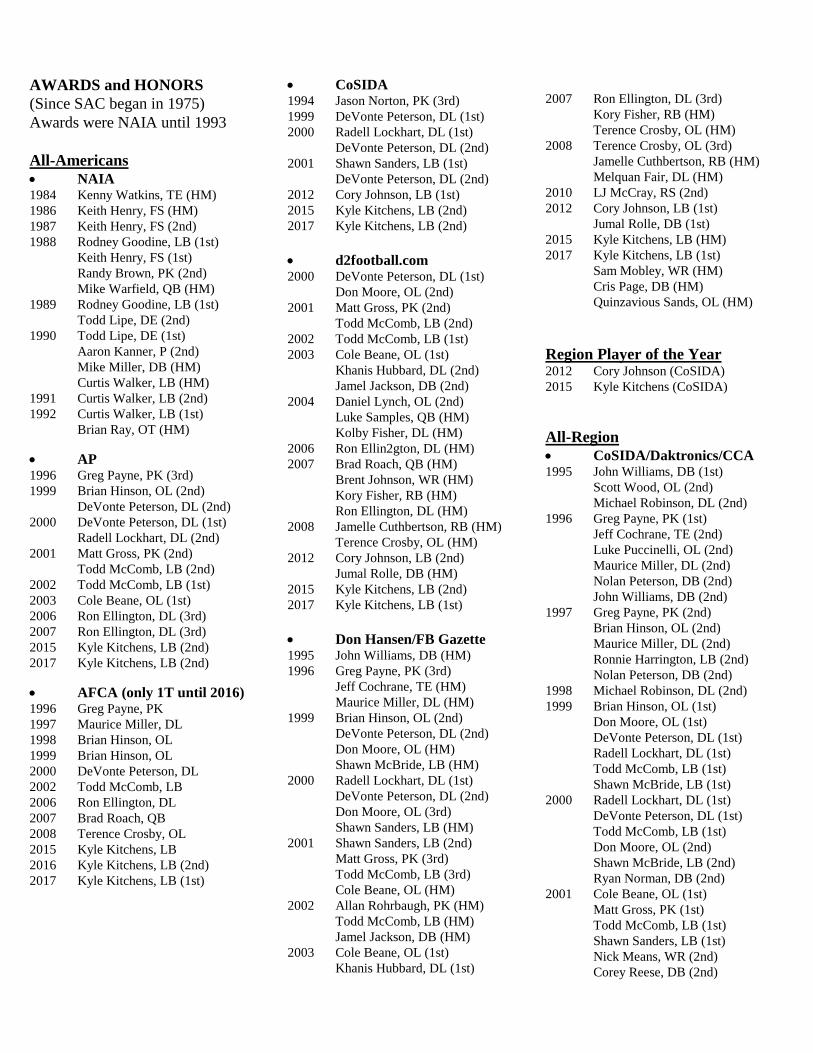
AWARDS and HONORS
(Since SAC began in 1975)
Awards were NAIA until 1993
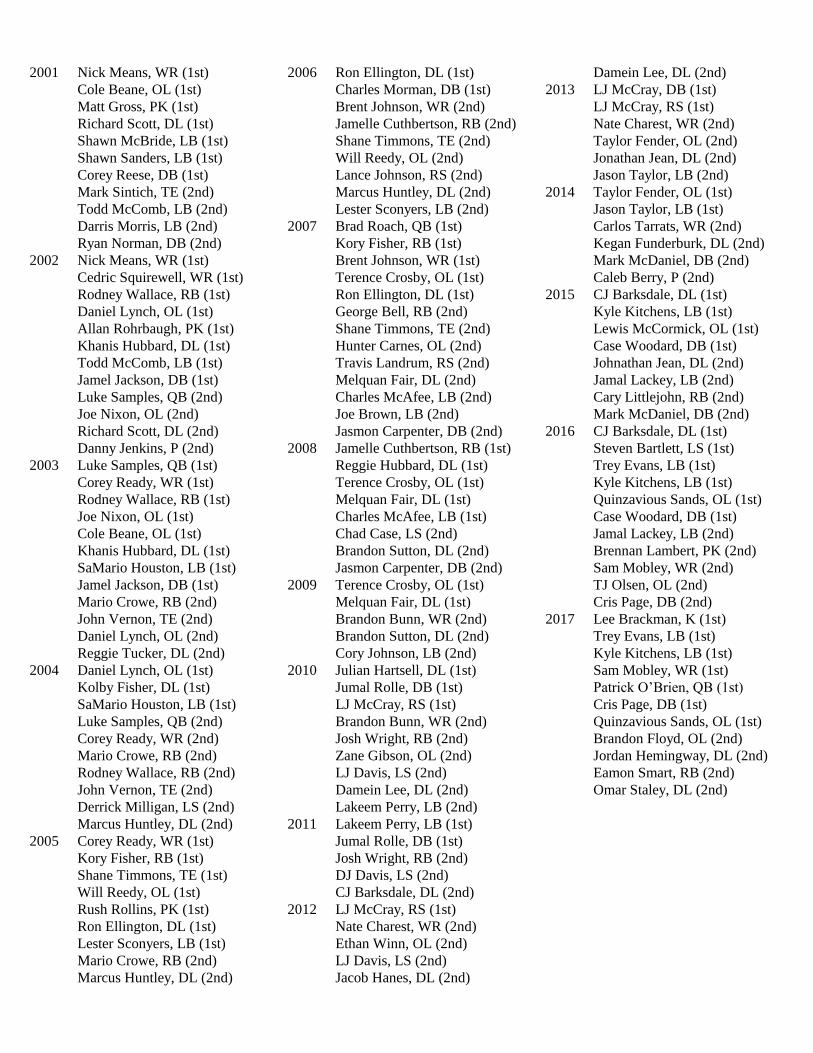
All-Americans
NAIA 1984 Kenny Watkins, TE (HM)
1986 Keith Henry, FS (HM)
1987 Keith Henry, FS (2nd)
1988 Rodney Goodine, LB (1st)
Keith Henry, FS (1st)
Randy Brown, PK (2nd)
Mike Warfield, QB (HM)
1989 Rodney Goodine, LB (1st)
Todd Lipe, DE (2nd)
1990 Todd Lipe, DE (1st)
Aaron Kanner, P (2nd)
Mike Miller, DB (HM)
Curtis Walker, LB (HM)
1991 Curtis Walker, LB (2nd)
1992 Curtis Walker, LB (1st)
Brian Ray, OT (HM)
AP 1996 Greg Payne, PK (3rd)
1999 Brian Hinson, OL (2nd)
DeVonte Peterson, DL (2nd)
2000 DeVonte Peterson, DL (1st)
Radell Lockhart, DL (2nd)
2001 Matt Gross, PK (2nd)
Todd McComb, LB (2nd)
2002 Todd McComb, LB (1st)
2003 Cole Beane, OL (1st)
2006 Ron Ellington, DL (3rd)
2007 Ron Ellington, DL (3rd)
2015 Kyle Kitchens, LB (2nd)
2017 Kyle Kitchens, LB (2nd)
AFCA (only 1T until 2016) 1996 Greg Payne, PK
1997 Maurice Miller, DL
1998 Brian Hinson, OL
1999 Brian Hinson, OL
2000 DeVonte Peterson, DL
2002 Todd McComb, LB
2006 Ron Ellington, DL
2007 Brad Roach, QB
2008 Terence Crosby, OL
2015 Kyle Kitchens, LB
2016 Kyle Kitchens, LB (2nd)
2017 Kyle Kitchens, LB (1st)
CoSIDA 1994 Jason Norton, PK (3rd)
1999 DeVonte Peterson, DL (1st)
2000 Radell Lockhart, DL (1st)
DeVonte Peterson, DL (2nd)
2001 Shawn Sanders, LB (1st)
DeVonte Peterson, DL (2nd)
2012 Cory Johnson, LB (1st)
2015 Kyle Kitchens, LB (2nd)
2017 Kyle Kitchens, LB (2nd)
d2football.com 2000 DeVonte Peterson, DL (1st)
Don Moore, OL (2nd)
2001 Matt Gross, PK (2nd)
Todd McComb, LB (2nd)
2002 Todd McComb, LB (1st)
2003 Cole Beane, OL (1st)
Khanis Hubbard, DL (2nd)
Jamel Jackson, DB (2nd)
2004 Daniel Lynch, OL (2nd)
Luke Samples, QB (HM)
Kolby Fisher, DL (HM)
2006 Ron Ellin2gton, DL (HM)
2007 Brad Roach, QB (HM)
Brent Johnson, WR (HM)
Kory Fisher, RB (HM)
Ron Ellington, DL (HM)
2008 Jamelle Cuthbertson, RB (HM)
Terence Crosby, OL (HM)
2012 Cory Johnson, LB (2nd)
Jumal Rolle, DB (HM)
2015 Kyle Kitchens, LB (2nd)
2017 Kyle Kitchens, LB (1st)
Don Hansen/FB Gazette 1995 John Williams, DB (HM)
1996 Greg Payne, PK (3rd)
Jeff Cochrane, TE (HM)
Maurice Miller, DL (HM)
1999 Brian Hinson, OL (2nd)
DeVonte Peterson, DL (2nd)
Don Moore, OL (HM)
Shawn McBride, LB (HM)
2000 Radell Lockhart, DL (1st)
DeVonte Peterson, DL (2nd)
Don Moore, OL (3rd)
Shawn Sanders, LB (HM)
2001 Shawn Sanders, LB (2nd)
Matt Gross, PK (3rd)
Todd McComb, LB (3rd)
Cole Beane, OL (HM)
2002 Allan Rohrbaugh, PK (HM)
Todd McComb, LB (HM)
Jamel Jackson, DB (HM)
2003 Cole Beane, OL (1st)
Khanis Hubbard, DL (1st)
2007 Ron Ellington, DL (3rd)
Kory Fisher, RB (HM)
Terence Crosby, OL (HM)
2008 Terence Crosby, OL (3rd)
Jamelle Cuthbertson, RB (HM)
Melquan Fair, DL (HM)
2010 LJ McCray, RS (2nd)
2012 Cory Johnson, LB (1st)
Jumal Rolle, DB (1st)
2015 Kyle Kitchens, LB (HM)
2017 Kyle Kitchens, LB (1st)
Sam Mobley, WR (HM)
Cris Page, DB (HM)
Quinzavious Sands, OL (HM)
Region Player of the Year 2012 Cory Johnson (CoSIDA)
2015 Kyle Kitchens (CoSIDA)
All-Region
CoSIDA/Daktronics/CCA 1995 John Williams, DB (1st)
Scott Wood, OL (2nd)
Michael Robinson, DL (2nd)
1996 Greg Payne, PK (1st)
Jeff Cochrane, TE (2nd)
Luke Puccinelli, OL (2nd)
Maurice Miller, DL (2nd)
Nolan Peterson, DB (2nd)
John Williams, DB (2nd)
1997 Greg Payne, PK (2nd)
Brian Hinson, OL (2nd)
Maurice Miller, DL (2nd)
Ronnie Harrington, LB (2nd)
Nolan Peterson, DB (2nd)
1998 Michael Robinson, DL (2nd)
1999 Brian Hinson, OL (1st)
Don Moore, OL (1st)
DeVonte Peterson, DL (1st)
Radell Lockhart, DL (1st)
Todd McComb, LB (1st)
Shawn McBride, LB (1st)
2000 Radell Lockhart, DL (1st)
DeVonte Peterson, DL (1st)
Todd McComb, LB (1st)
Don Moore, OL (2nd)
Shawn McBride, LB (2nd)
Ryan Norman, DB (2nd)
2001 Cole Beane, OL (1st)
Matt Gross, PK (1st)
Todd McComb, LB (1st)
Shawn Sanders, LB (1st)
Nick Means, WR (2nd)
Corey Reese, DB (2nd)
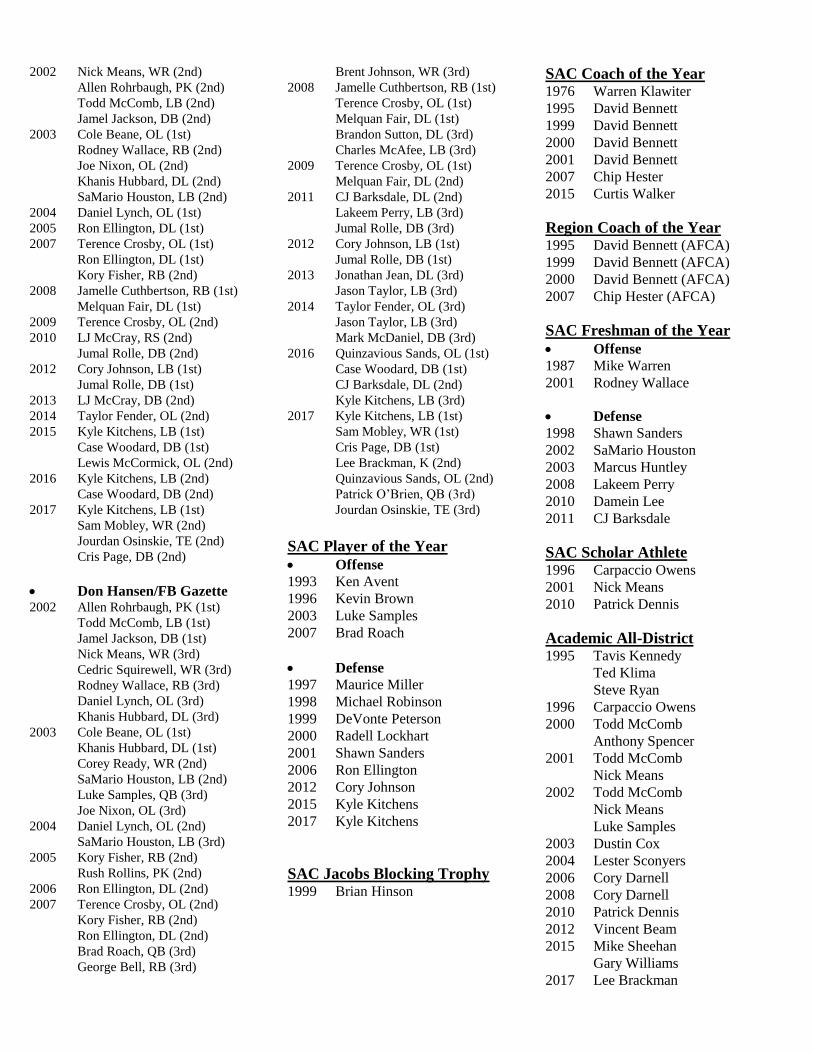
2002 Nick Means, WR (2nd)
Allen Rohrbaugh, PK (2nd)
Todd McComb, LB (2nd)
Jamel Jackson, DB (2nd)
2003 Cole Beane, OL (1st)
Rodney Wallace, RB (2nd)
Joe Nixon, OL (2nd)
Khanis Hubbard, DL (2nd)
SaMario Houston, LB (2nd)
2004 Daniel Lynch, OL (1st)
2005 Ron Ellington, DL (1st)
2007 Terence Crosby, OL (1st)
Ron Ellington, DL (1st)
Kory Fisher, RB (2nd)
2008 Jamelle Cuthbertson, RB (1st)
Melquan Fair, DL (1st)
2009 Terence Crosby, OL (2nd)
2010 LJ McCray, RS (2nd)
Jumal Rolle, DB (2nd)
2012 Cory Johnson, LB (1st)
Jumal Rolle, DB (1st)
2013 LJ McCray, DB (2nd)
2014 Taylor Fender, OL (2nd)
2015 Kyle Kitchens, LB (1st)
Case Woodard, DB (1st)
Lewis McCormick, OL (2nd)
2016 Kyle Kitchens, LB (2nd)
Case Woodard, DB (2nd)
2017 Kyle Kitchens, LB (1st)
Sam Mobley, WR (2nd)
Jourdan Osinskie, TE (2nd)
Cris Page, DB (2nd)
Don Hansen/FB Gazette 2002 Allen Rohrbaugh, PK (1st)
Todd McComb, LB (1st)
Jamel Jackson, DB (1st)
Nick Means, WR (3rd)
Cedric Squirewell, WR (3rd)
Rodney Wallace, RB (3rd)
Daniel Lynch, OL (3rd)
Khanis Hubbard, DL (3rd)
2003 Cole Beane, OL (1st)
Khanis Hubbard, DL (1st)
Corey Ready, WR (2nd)
SaMario Houston, LB (2nd)
Luke Samples, QB (3rd)
Joe Nixon, OL (3rd)
2004 Daniel Lynch, OL (2nd)
SaMario Houston, LB (3rd)
2005 Kory Fisher, RB (2nd)
Rush Rollins, PK (2nd)
2006 Ron Ellington, DL (2nd)
2007 Terence Crosby, OL (2nd)
Kory Fisher, RB (2nd)
Ron Ellington, DL (2nd)
Brad Roach, QB (3rd)
George Bell, RB (3rd)
Brent Johnson, WR (3rd)
2008 Jamelle Cuthbertson, RB (1st)
Terence Crosby, OL (1st)
Melquan Fair, DL (1st)
Brandon Sutton, DL (3rd)
Charles McAfee, LB (3rd)
2009 Terence Crosby, OL (1st)
Melquan Fair, DL (2nd)
2011 CJ Barksdale, DL (2nd)
Lakeem Perry, LB (3rd)
Jumal Rolle, DB (3rd)
2012 Cory Johnson, LB (1st)
Jumal Rolle, DB (1st)
2013 Jonathan Jean, DL (3rd)
Jason Taylor, LB (3rd)
2014 Taylor Fender, OL (3rd)
Jason Taylor, LB (3rd)
Mark McDaniel, DB (3rd)
2016 Quinzavious Sands, OL (1st)
Case Woodard, DB (1st)
CJ Barksdale, DL (2nd)
Kyle Kitchens, LB (3rd)
2017 Kyle Kitchens, LB (1st)
Sam Mobley, WR (1st)
Cris Page, DB (1st)
Lee Brackman, K (2nd)
Quinzavious Sands, OL (2nd)
Patrick O’Brien, QB (3rd)
Jourdan Osinskie, TE (3rd)
SAC Player of the Year
Offense
1993 Ken Avent
1996 Kevin Brown
2003 Luke Samples
2007 Brad Roach
Defense
1997 Maurice Miller 1998 Michael Robinson
1999 DeVonte Peterson
2000 Radell Lockhart
2001 Shawn Sanders
2006 Ron Ellington
2012 Cory Johnson
2015 Kyle Kitchens
2017 Kyle Kitchens
SAC Jacobs Blocking Trophy 1999 Brian Hinson
SAC Coach of the Year 1976 Warren Klawiter
1995 David Bennett
1999 David Bennett
2000 David Bennett
2001 David Bennett
2007 Chip Hester
2015 Curtis Walker
Region Coach of the Year 1995 David Bennett (AFCA)
1999 David Bennett (AFCA)
2000 David Bennett (AFCA)
2007 Chip Hester (AFCA)
SAC Freshman of the Year
Offense
1987 Mike Warren
2001 Rodney Wallace
Defense
1998 Shawn Sanders
2002 SaMario Houston
2003 Marcus Huntley
2008 Lakeem Perry
2010 Damein Lee
2011 CJ Barksdale
SAC Scholar Athlete 1996 Carpaccio Owens
2001 Nick Means
2010 Patrick Dennis
Academic All-District 1995 Tavis Kennedy
Ted Klima
Steve Ryan
1996 Carpaccio Owens
2000 Todd McComb
Anthony Spencer
2001 Todd McComb
Nick Means
2002 Todd McComb
Nick Means
Luke Samples
2003 Dustin Cox
2004 Lester Sconyers
2006 Cory Darnell
2008 Cory Darnell
2010 Patrick Dennis
2012 Vincent Beam
2015 Mike Sheehan
Gary Williams
2017 Lee Brackman
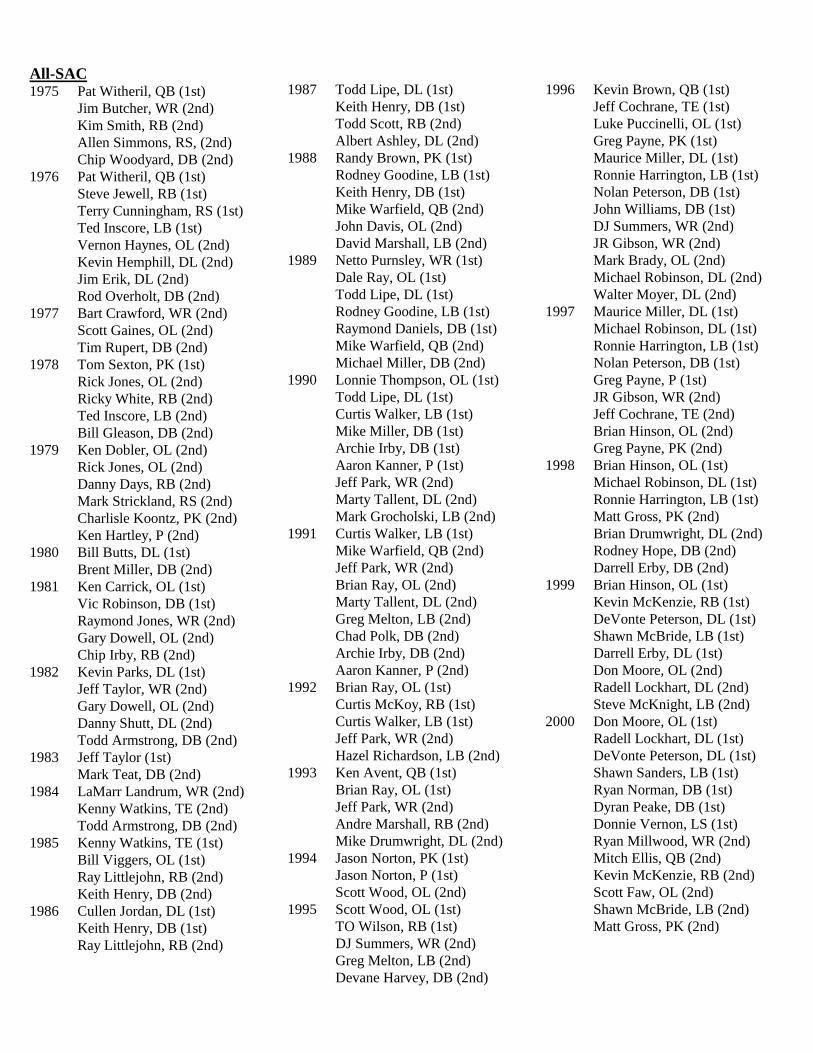
All-SAC 1975 Pat Witheril, QB (1st)
Jim Butcher, WR (2nd)
Kim Smith, RB (2nd)
Allen Simmons, RS, (2nd)
Chip Woodyard, DB (2nd)
1976 Pat Witheril, QB (1st)
Steve Jewell, RB (1st)
Terry Cunningham, RS (1st)
Ted Inscore, LB (1st)
Vernon Haynes, OL (2nd)
Kevin Hemphill, DL (2nd)
Jim Erik, DL (2nd)
Rod Overholt, DB (2nd)
1977 Bart Crawford, WR (2nd)
Scott Gaines, OL (2nd)
Tim Rupert, DB (2nd)
1978 Tom Sexton, PK (1st)
Rick Jones, OL (2nd)
Ricky White, RB (2nd)
Ted Inscore, LB (2nd)
Bill Gleason, DB (2nd)
1979 Ken Dobler, OL (2nd)
Rick Jones, OL (2nd)
Danny Days, RB (2nd)
Mark Strickland, RS (2nd)
Charlisle Koontz, PK (2nd)
Ken Hartley, P (2nd)
1980 Bill Butts, DL (1st)
Brent Miller, DB (2nd)
1981 Ken Carrick, OL (1st)
Vic Robinson, DB (1st)
Raymond Jones, WR (2nd)
Gary Dowell, OL (2nd)
Chip Irby, RB (2nd)
1982 Kevin Parks, DL (1st)
Jeff Taylor, WR (2nd)
Gary Dowell, OL (2nd)
Danny Shutt, DL (2nd)
Todd Armstrong, DB (2nd)
1983 Jeff Taylor (1st)
Mark Teat, DB (2nd)
1984 LaMarr Landrum, WR (2nd)
Kenny Watkins, TE (2nd)
Todd Armstrong, DB (2nd)
1985 Kenny Watkins, TE (1st)
Bill Viggers, OL (1st)
Ray Littlejohn, RB (2nd)
Keith Henry, DB (2nd)
1986 Cullen Jordan, DL (1st)
Keith Henry, DB (1st)
Ray Littlejohn, RB (2nd)
1987 Todd Lipe, DL (1st)
Keith Henry, DB (1st)
Todd Scott, RB (2nd)
Albert Ashley, DL (2nd)
1988 Randy Brown, PK (1st)
Rodney Goodine, LB (1st)
Keith Henry, DB (1st)
Mike Warfield, QB (2nd)
John Davis, OL (2nd)
David Marshall, LB (2nd)
1989 Netto Purnsley, WR (1st)
Dale Ray, OL (1st)
Todd Lipe, DL (1st)
Rodney Goodine, LB (1st)
Raymond Daniels, DB (1st)
Mike Warfield, QB (2nd)
Michael Miller, DB (2nd)
1990 Lonnie Thompson, OL (1st)
Todd Lipe, DL (1st)
Curtis Walker, LB (1st)
Mike Miller, DB (1st)
Archie Irby, DB (1st)
Aaron Kanner, P (1st)
Jeff Park, WR (2nd)
Marty Tallent, DL (2nd)
Mark Grocholski, LB (2nd)
1991 Curtis Walker, LB (1st)
Mike Warfield, QB (2nd)
Jeff Park, WR (2nd)
Brian Ray, OL (2nd)
Marty Tallent, DL (2nd)
Greg Melton, LB (2nd)
Chad Polk, DB (2nd)
Archie Irby, DB (2nd)
Aaron Kanner, P (2nd)
1992 Brian Ray, OL (1st)
Curtis McKoy, RB (1st)
Curtis Walker, LB (1st)
Jeff Park, WR (2nd)
Hazel Richardson, LB (2nd)
1993 Ken Avent, QB (1st)
Brian Ray, OL (1st)
Jeff Park, WR (2nd)
Andre Marshall, RB (2nd)
Mike Drumwright, DL (2nd)
1994 Jason Norton, PK (1st)
Jason Norton, P (1st)
Scott Wood, OL (2nd)
1995 Scott Wood, OL (1st)
TO Wilson, RB (1st)
DJ Summers, WR (2nd)
Greg Melton, LB (2nd)
Devane Harvey, DB (2nd)
1996 Kevin Brown, QB (1st)
Jeff Cochrane, TE (1st)
Luke Puccinelli, OL (1st)
Greg Payne, PK (1st)
Maurice Miller, DL (1st)
Ronnie Harrington, LB (1st)
Nolan Peterson, DB (1st)
John Williams, DB (1st)
DJ Summers, WR (2nd)
JR Gibson, WR (2nd)
Mark Brady, OL (2nd)
Michael Robinson, DL (2nd)
Walter Moyer, DL (2nd)
1997 Maurice Miller, DL (1st)
Michael Robinson, DL (1st)
Ronnie Harrington, LB (1st)
Nolan Peterson, DB (1st)
Greg Payne, P (1st)
JR Gibson, WR (2nd)
Jeff Cochrane, TE (2nd)
Brian Hinson, OL (2nd)
Greg Payne, PK (2nd)
1998 Brian Hinson, OL (1st)
Michael Robinson, DL (1st)
Ronnie Harrington, LB (1st)
Matt Gross, PK (2nd)
Brian Drumwright, DL (2nd)
Rodney Hope, DB (2nd)
Darrell Erby, DB (2nd)
1999 Brian Hinson, OL (1st)
Kevin McKenzie, RB (1st)
DeVonte Peterson, DL (1st)
Shawn McBride, LB (1st)
Darrell Erby, DL (1st)
Don Moore, OL (2nd)
Radell Lockhart, DL (2nd)
Steve McKnight, LB (2nd)
2000 Don Moore, OL (1st)
Radell Lockhart, DL (1st)
DeVonte Peterson, DL (1st)
Shawn Sanders, LB (1st)
Ryan Norman, DB (1st)
Dyran Peake, DB (1st)
Donnie Vernon, LS (1st)
Ryan Millwood, WR (2nd)
Mitch Ellis, QB (2nd)
Kevin McKenzie, RB (2nd)
Scott Faw, OL (2nd)
Shawn McBride, LB (2nd)
Matt Gross, PK (2nd)
2001 Nick Means, WR (1st)
Cole Beane, OL (1st)
Matt Gross, PK (1st)
Richard Scott, DL (1st)
Shawn McBride, LB (1st)
Shawn Sanders, LB (1st)
Corey Reese, DB (1st)
Mark Sintich, TE (2nd)
Todd McComb, LB (2nd)
Darris Morris, LB (2nd)
Ryan Norman, DB (2nd)
2002 Nick Means, WR (1st)
Cedric Squirewell, WR (1st)
Rodney Wallace, RB (1st)
Daniel Lynch, OL (1st)
Allan Rohrbaugh, PK (1st)
Khanis Hubbard, DL (1st)
Todd McComb, LB (1st)
Jamel Jackson, DB (1st)
Luke Samples, QB (2nd)
Joe Nixon, OL (2nd)
Richard Scott, DL (2nd)
Danny Jenkins, P (2nd)
2003 Luke Samples, QB (1st)
Corey Ready, WR (1st)
Rodney Wallace, RB (1st)
Joe Nixon, OL (1st)
Cole Beane, OL (1st)
Khanis Hubbard, DL (1st)
SaMario Houston, LB (1st)
Jamel Jackson, DB (1st)
Mario Crowe, RB (2nd)
John Vernon, TE (2nd)
Daniel Lynch, OL (2nd)
Reggie Tucker, DL (2nd)
2004 Daniel Lynch, OL (1st)
Kolby Fisher, DL (1st)
SaMario Houston, LB (1st)
Luke Samples, QB (2nd)
Corey Ready, WR (2nd)
Mario Crowe, RB (2nd)
Rodney Wallace, RB (2nd)
John Vernon, TE (2nd)
Derrick Milligan, LS (2nd)
Marcus Huntley, DL (2nd)
2005 Corey Ready, WR (1st)
Kory Fisher, RB (1st)
Shane Timmons, TE (1st)
Will Reedy, OL (1st)
Rush Rollins, PK (1st)
Ron Ellington, DL (1st)
Lester Sconyers, LB (1st)
Mario Crowe, RB (2nd)
Marcus Huntley, DL (2nd)
2006 Ron Ellington, DL (1st)
Charles Morman, DB (1st)
Brent Johnson, WR (2nd)
Jamelle Cuthbertson, RB (2nd)
Shane Timmons, TE (2nd)
Will Reedy, OL (2nd)
Lance Johnson, RS (2nd)
Marcus Huntley, DL (2nd)
Lester Sconyers, LB (2nd)
2007 Brad Roach, QB (1st)
Kory Fisher, RB (1st)
Brent Johnson, WR (1st)
Terence Crosby, OL (1st)
Ron Ellington, DL (1st)
George Bell, RB (2nd)
Shane Timmons, TE (2nd)
Hunter Carnes, OL (2nd)
Travis Landrum, RS (2nd)
Melquan Fair, DL (2nd)
Charles McAfee, LB (2nd)
Joe Brown, LB (2nd)
Jasmon Carpenter, DB (2nd)
2008 Jamelle Cuthbertson, RB (1st)
Reggie Hubbard, DL (1st)
Terence Crosby, OL (1st)
Melquan Fair, DL (1st)
Charles McAfee, LB (1st)
Chad Case, LS (2nd)
Brandon Sutton, DL (2nd)
Jasmon Carpenter, DB (2nd)
2009 Terence Crosby, OL (1st)
Melquan Fair, DL (1st)
Brandon Bunn, WR (2nd)
Brandon Sutton, DL (2nd)
Cory Johnson, LB (2nd)
2010 Julian Hartsell, DL (1st)
Jumal Rolle, DB (1st)
LJ McCray, RS (1st)
Brandon Bunn, WR (2nd)
Josh Wright, RB (2nd)
Zane Gibson, OL (2nd)
LJ Davis, LS (2nd)
Damein Lee, DL (2nd)
Lakeem Perry, LB (2nd)
2011 Lakeem Perry, LB (1st)
Jumal Rolle, DB (1st)
Josh Wright, RB (2nd)
DJ Davis, LS (2nd)
CJ Barksdale, DL (2nd)
2012 LJ McCray, RS (1st)
Nate Charest, WR (2nd)
Ethan Winn, OL (2nd)
LJ Davis, LS (2nd)
Jacob Hanes, DL (2nd)
Damein Lee, DL (2nd)
2013 LJ McCray, DB (1st)
LJ McCray, RS (1st)
Nate Charest, WR (2nd)
Taylor Fender, OL (2nd)
Jonathan Jean, DL (2nd)
Jason Taylor, LB (2nd)
2014 Taylor Fender, OL (1st)
Jason Taylor, LB (1st)
Carlos Tarrats, WR (2nd)
Kegan Funderburk, DL (2nd)
Mark McDaniel, DB (2nd)
Caleb Berry, P (2nd)
2015 CJ Barksdale, DL (1st)
Kyle Kitchens, LB (1st)
Lewis McCormick, OL (1st)
Case Woodard, DB (1st)
Johnathan Jean, DL (2nd)
Jamal Lackey, LB (2nd)
Cary Littlejohn, RB (2nd)
Mark McDaniel, DB (2nd)
2016 CJ Barksdale, DL (1st)
Steven Bartlett, LS (1st)
Trey Evans, LB (1st)
Kyle Kitchens, LB (1st)
Quinzavious Sands, OL (1st)
Case Woodard, DB (1st)
Jamal Lackey, LB (2nd)
Brennan Lambert, PK (2nd)
Sam Mobley, WR (2nd)
TJ Olsen, OL (2nd)
Cris Page, DB (2nd)
2017 Lee Brackman, K (1st)
Trey Evans, LB (1st)
Kyle Kitchens, LB (1st)
Sam Mobley, WR (1st)
Patrick O’Brien, QB (1st)
Cris Page, DB (1st)
Quinzavious Sands, OL (1st)
Brandon Floyd, OL (2nd)
Jordan Hemingway, DL (2nd)
Eamon Smart, RB (2nd)
Omar Staley, DL (2nd)
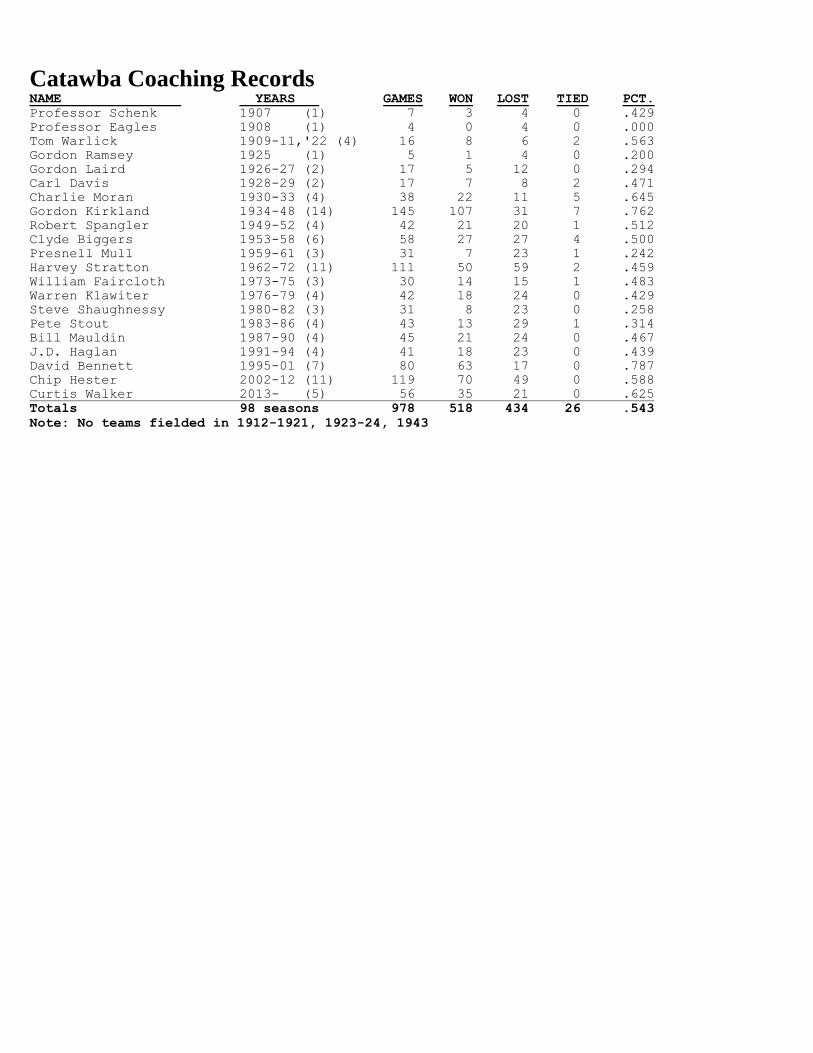
Catawba Coaching Records NAME YEARS GAMES WON LOST TIED PCT.
Professor Schenk 1907 (1) 7 3 4 0 .429
Professor Eagles 1908 (1) 4 0 4 0 .000
Tom Warlick 1909-11,'22 (4) 16 8 6 2 .563
Gordon Ramsey 1925 (1) 5 1 4 0 .200
Gordon Laird 1926-27 (2) 17 5 12 0 .294
Carl Davis 1928-29 (2) 17 7 8 2 .471
Charlie Moran 1930-33 (4) 38 22 11 5 .645
Gordon Kirkland 1934-48 (14) 145 107 31 7 .762
Robert Spangler 1949-52 (4) 42 21 20 1 .512
Clyde Biggers 1953-58 (6) 58 27 27 4 .500
Presnell Mull 1959-61 (3) 31 7 23 1 .242
Harvey Stratton 1962-72 (11) 111 50 59 2 .459
William Faircloth 1973-75 (3) 30 14 15 1 .483
Warren Klawiter 1976-79 (4) 42 18 24 0 .429
Steve Shaughnessy 1980-82 (3) 31 8 23 0 .258
Pete Stout 1983-86 (4) 43 13 29 1 .314
Bill Mauldin 1987-90 (4) 45 21 24 0 .467
J.D. Haglan 1991-94 (4) 41 18 23 0 .439
David Bennett 1995-01 (7) 80 63 17 0 .787
Chip Hester 2002-12 (11) 119 70 49 0 .588
Curtis Walker 2013- (5) 56 35 21 0 .625
Totals 98 seasons 978 518 434 26 .543
Note: No teams fielded in 1912-1921, 1923-24, 1943
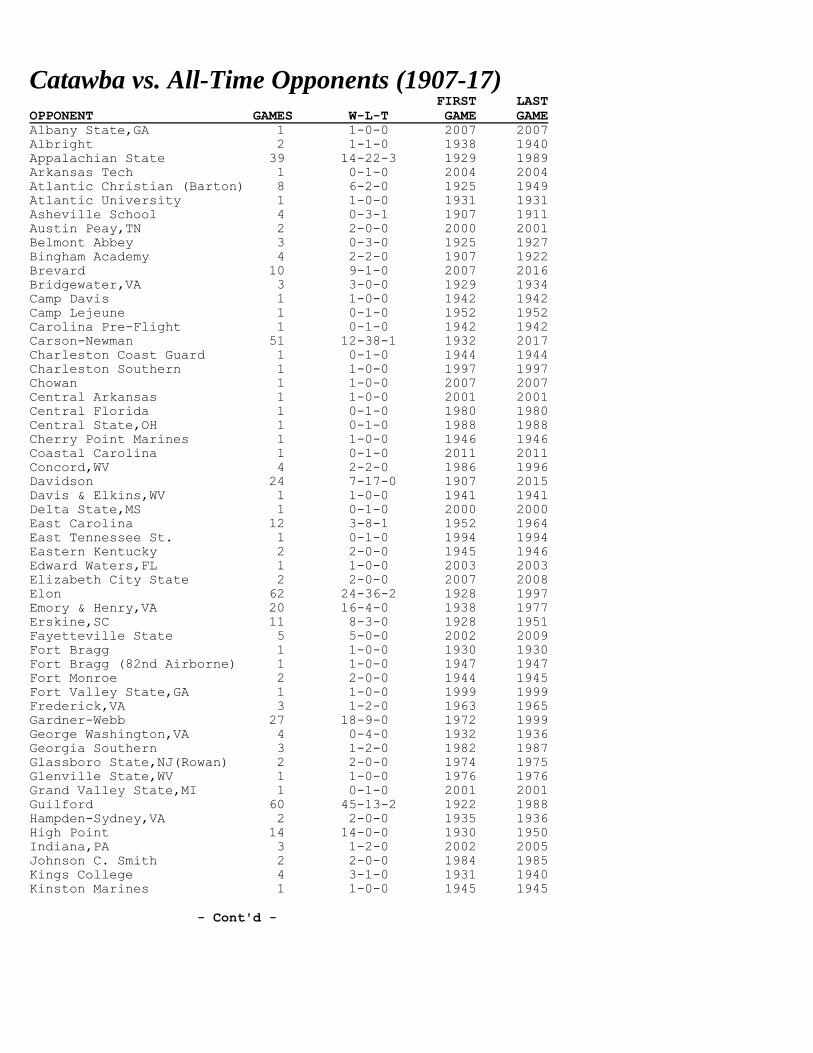
Catawba vs. All-Time Opponents (1907-17) FIRST LAST
OPPONENT GAMES W-L-T GAME GAME
Albany State,GA 1 1-0-0 2007 2007
Albright 2 1-1-0 1938 1940
Appalachian State 39 14-22-3 1929 1989
Arkansas Tech 1 0-1-0 2004 2004
Atlantic Christian (Barton) 8 6-2-0 1925 1949
Atlantic University 1 1-0-0 1931 1931
Asheville School 4 0-3-1 1907 1911
Austin Peay,TN 2 2-0-0 2000 2001
Belmont Abbey 3 0-3-0 1925 1927
Bingham Academy 4 2-2-0 1907 1922
Brevard 10 9-1-0 2007 2016
Bridgewater,VA 3 3-0-0 1929 1934
Camp Davis 1 1-0-0 1942 1942
Camp Lejeune 1 0-1-0 1952 1952
Carolina Pre-Flight 1 0-1-0 1942 1942
Carson-Newman 51 12-38-1 1932 2017
Charleston Coast Guard 1 0-1-0 1944 1944
Charleston Southern 1 1-0-0 1997 1997
Chowan 1 1-0-0 2007 2007
Central Arkansas 1 1-0-0 2001 2001
Central Florida 1 0-1-0 1980 1980
Central State,OH 1 0-1-0 1988 1988
Cherry Point Marines 1 1-0-0 1946 1946
Coastal Carolina 1 0-1-0 2011 2011
Concord,WV 4 2-2-0 1986 1996
Davidson 24 7-17-0 1907 2015
Davis & Elkins,WV 1 1-0-0 1941 1941
Delta State,MS 1 0-1-0 2000 2000
East Carolina 12 3-8-1 1952 1964
East Tennessee St. 1 0-1-0 1994 1994
Eastern Kentucky 2 2-0-0 1945 1946
Edward Waters,FL 1 1-0-0 2003 2003
Elizabeth City State 2 2-0-0 2007 2008
Elon 62 24-36-2 1928 1997
Emory & Henry,VA 20 16-4-0 1938 1977
Erskine,SC 11 8-3-0 1928 1951
Fayetteville State 5 5-0-0 2002 2009
Fort Bragg 1 1-0-0 1930 1930
Fort Bragg (82nd Airborne) 1 1-0-0 1947 1947
Fort Monroe 2 2-0-0 1944 1945
Fort Valley State,GA 1 1-0-0 1999 1999
Frederick,VA 3 1-2-0 1963 1965
Gardner-Webb 27 18-9-0 1972 1999
George Washington,VA 4 0-4-0 1932 1936
Georgia Southern 3 1-2-0 1982 1987
Glassboro State,NJ(Rowan) 2 2-0-0 1974 1975
Glenville State,WV 1 1-0-0 1976 1976
Grand Valley State,MI 1 0-1-0 2001 2001
Guilford 60 45-13-2 1922 1988
Hampden-Sydney,VA 2 2-0-0 1935 1936
High Point 14 14-0-0 1930 1950
Indiana,PA 3 1-2-0 2002 2005
Johnson C. Smith 2 2-0-0 1984 1985
Kings College 4 3-1-0 1931 1940
Kinston Marines 1 1-0-0 1945 1945
- Cont'd -
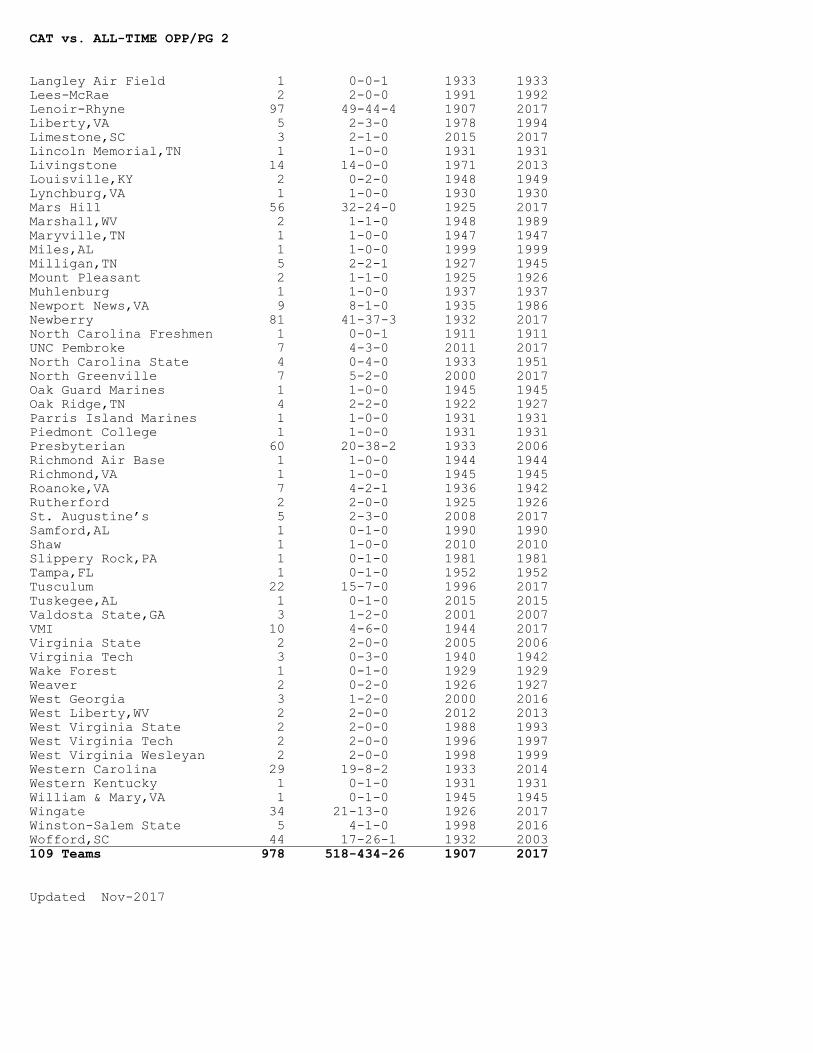
CAT vs. ALL-TIME OPP/PG 2
Langley Air Field 1 0-0-1 1933 1933
Lees-McRae 2 2-0-0 1991 1992
Lenoir-Rhyne 97 49-44-4 1907 2017
Liberty,VA 5 2-3-0 1978 1994
Limestone,SC 3 2-1-0 2015 2017
Lincoln Memorial,TN 1 1-0-0 1931 1931
Livingstone 14 14-0-0 1971 2013
Louisville,KY 2 0-2-0 1948 1949
Lynchburg,VA 1 1-0-0 1930 1930
Mars Hill 56 32-24-0 1925 2017
Marshall,WV 2 1-1-0 1948 1989
Maryville,TN 1 1-0-0 1947 1947
Miles,AL 1 1-0-0 1999 1999
Milligan,TN 5 2-2-1 1927 1945
Mount Pleasant 2 1-1-0 1925 1926
Muhlenburg 1 1-0-0 1937 1937
Newport News,VA 9 8-1-0 1935 1986
Newberry 81 41-37-3 1932 2017
North Carolina Freshmen 1 0-0-1 1911 1911
UNC Pembroke 7 4-3-0 2011 2017
North Carolina State 4 0-4-0 1933 1951
North Greenville 7 5-2-0 2000 2017
Oak Guard Marines 1 1-0-0 1945 1945
Oak Ridge,TN 4 2-2-0 1922 1927
Parris Island Marines 1 1-0-0 1931 1931
Piedmont College 1 1-0-0 1931 1931
Presbyterian 60 20-38-2 1933 2006
Richmond Air Base 1 1-0-0 1944 1944
Richmond,VA 1 1-0-0 1945 1945
Roanoke,VA 7 4-2-1 1936 1942
Rutherford 2 2-0-0 1925 1926
St. Augustine’s 5 2-3-0 2008 2017
Samford,AL 1 0-1-0 1990 1990
Shaw 1 1-0-0 2010 2010
Slippery Rock,PA 1 0-1-0 1981 1981
Tampa,FL 1 0-1-0 1952 1952
Tusculum 22 15-7-0 1996 2017
Tuskegee,AL 1 0-1-0 2015 2015
Valdosta State,GA 3 1-2-0 2001 2007
VMI 10 4-6-0 1944 2017
Virginia State 2 2-0-0 2005 2006
Virginia Tech 3 0-3-0 1940 1942
Wake Forest 1 0-1-0 1929 1929
Weaver 2 0-2-0 1926 1927
West Georgia 3 1-2-0 2000 2016
West Liberty,WV 2 2-0-0 2012 2013
West Virginia State 2 2-0-0 1988 1993
West Virginia Tech 2 2-0-0 1996 1997
West Virginia Wesleyan 2 2-0-0 1998 1999
Western Carolina 29 19-8-2 1933 2014
Western Kentucky 1 0-1-0 1931 1931
William & Mary,VA 1 0-1-0 1945 1945
Wingate 34 21-13-0 1926 2017
Winston-Salem State 5 4-1-0 1998 2016
Wofford,SC 44 17-26-1 1932 2003
109 Teams 978 518-434-26 1907 2017
Updated Nov-2017
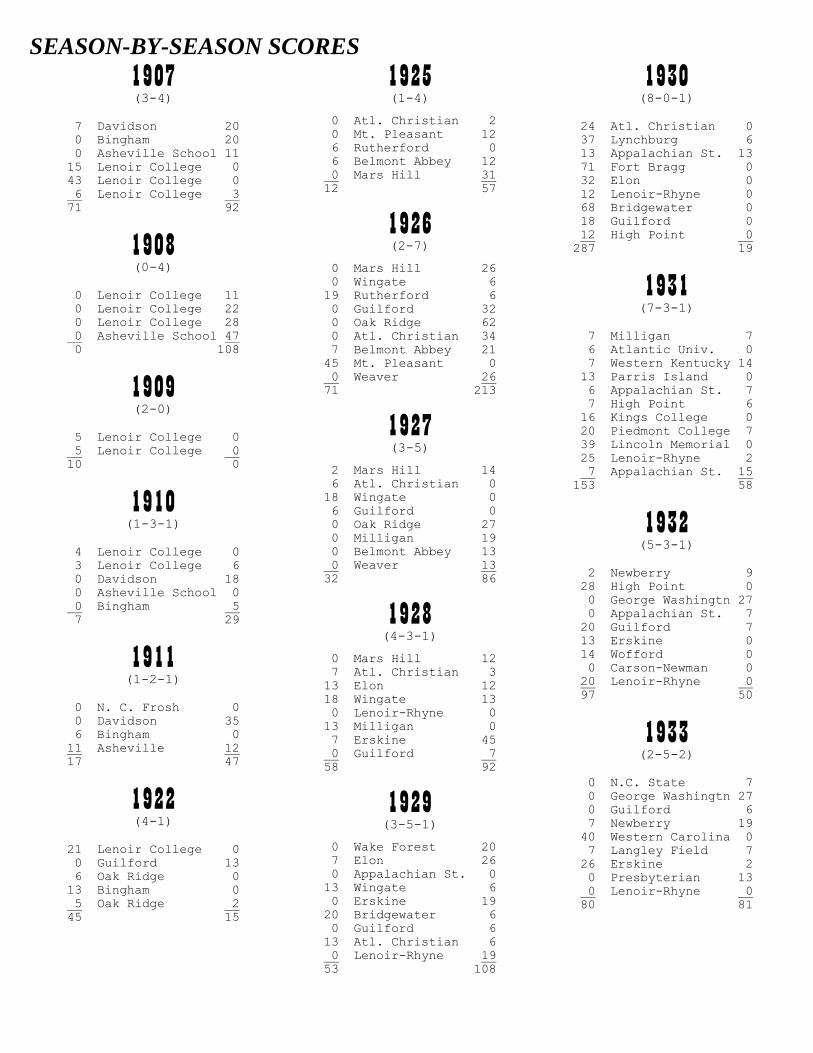
SEASON-BY-SEASON SCORES
1907 (3-4)
7 Davidson 20
0 Bingham 20
0 Asheville School 11
15 Lenoir College 0
43 Lenoir College 0
6 Lenoir College 3
71 92
1908 (0-4)
0 Lenoir College 11
0 Lenoir College 22
0 Lenoir College 28
0 Asheville School 47
0 108
1909 (2-0)
5 Lenoir College 0
5 Lenoir College 0
10 0
1910 (1-3-1)
4 Lenoir College 0
3 Lenoir College 6
0 Davidson 18
0 Asheville School 0
0 Bingham 5
7 29
1911 (1-2-1)
0 N. C. Frosh 0
0 Davidson 35
6 Bingham 0
11 Asheville 12
17 47
1922 (4-1)
21 Lenoir College 0
0 Guilford 13
6 Oak Ridge 0
13 Bingham 0
5 Oak Ridge 2
45 15
1925 (1-4)
0 Atl. Christian 2
0 Mt. Pleasant 12
6 Rutherford 0
6 Belmont Abbey 12
0 Mars Hill 31
12 57
1926 (2-7)
0 Mars Hill 26
0 Wingate 6
19 Rutherford 6
0 Guilford 32
0 Oak Ridge 62
0 Atl. Christian 34
7 Belmont Abbey 21
45 Mt. Pleasant 0
0 Weaver 26
71 213
1927 (3-5)
2 Mars Hill 14
6 Atl. Christian 0
18 Wingate 0
6 Guilford 0
0 Oak Ridge 27
0 Milligan 19
0 Belmont Abbey 13
0 Weaver 13
32 86
1928 (4-3-1)
0 Mars Hill 12
7 Atl. Christian 3
13 Elon 12
18 Wingate 13
0 Lenoir-Rhyne 0
13 Milligan 0
7 Erskine 45
0 Guilford 7
58 92
1929 (3-5-1)
0 Wake Forest 20
7 Elon 26
0 Appalachian St. 0
13 Wingate 6
0 Erskine 19
20 Bridgewater 6
0 Guilford 6
13 Atl. Christian 6
0 Lenoir-Rhyne 19
53 108
1930 (8-0-1)
24 Atl. Christian 0
37 Lynchburg 6
13 Appalachian St. 13
71 Fort Bragg 0
32 Elon 0
12 Lenoir-Rhyne 0
68 Bridgewater 0
18 Guilford 0
12 High Point 0
287 19
1931 (7-3-1)
7 Milligan 7
6 Atlantic Univ. 0
7 Western Kentucky 14
13 Parris Island 0
6 Appalachian St. 7
7 High Point 6
16 Kings College 0
20 Piedmont College 7
39 Lincoln Memorial 0
25 Lenoir-Rhyne 2
7 Appalachian St. 15
153 58
1932 (5-3-1)
2 Newberry 9
28 High Point 0
0 George Washingtn 27
0 Appalachian St. 7
20 Guilford 7
13 Erskine 0
14 Wofford 0
0 Carson-Newman 0
20 Lenoir-Rhyne 0
97 50
1933 (2-5-2)
0 N.C. State 7
0 George Washingtn 27
0 Guilford 6
7 Newberry 19
40 Western Carolina 0
7 Langley Field 7
26 Erskine 2
0 Presbyterian 13
0 Lenoir-Rhyne 0
80 81
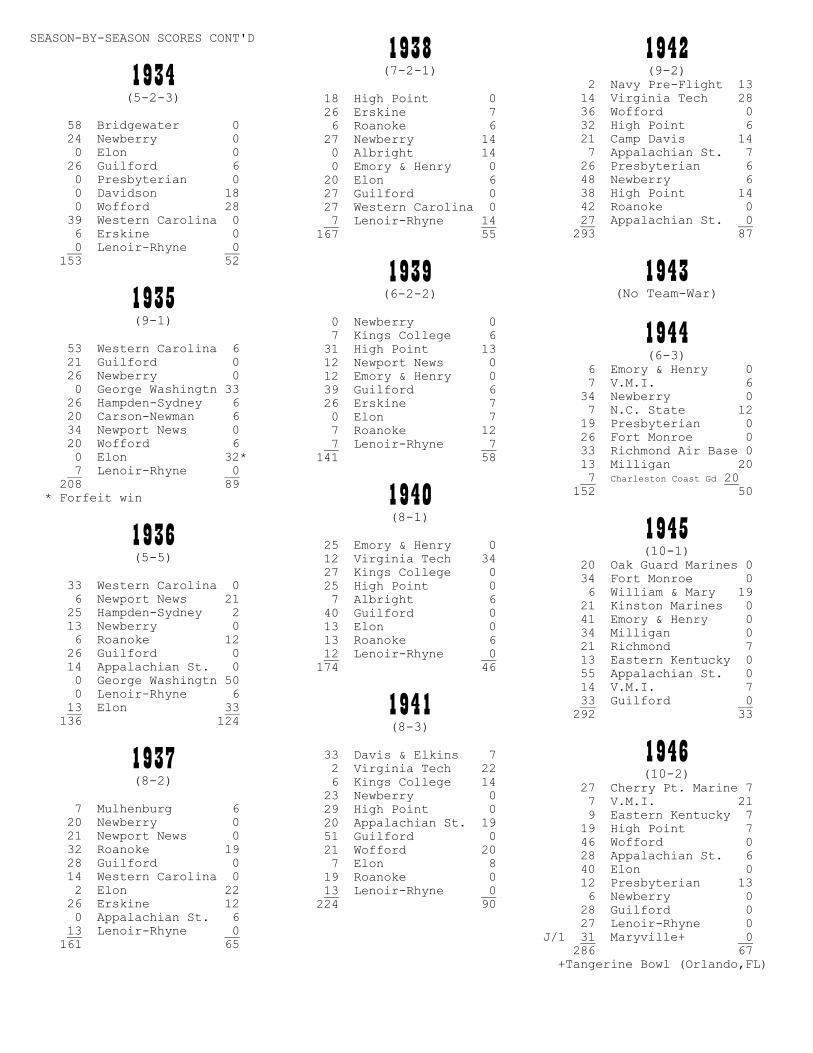
SEASON-BY-SEASON SCORES CONT'D
1934 (5-2-3)
58 Bridgewater 0
24 Newberry 0
0 Elon 0
26 Guilford 6
0 Presbyterian 0
0 Davidson 18
0 Wofford 28
39 Western Carolina 0
6 Erskine 0
0 Lenoir-Rhyne 0
153 52
1935 (9-1)
53 Western Carolina 6
21 Guilford 0
26 Newberry 0
0 George Washingtn 33
26 Hampden-Sydney 6
20 Carson-Newman 6
34 Newport News 0
20 Wofford 6
0 Elon 32*
7 Lenoir-Rhyne 0
208 89
* Forfeit win
1936 (5-5)
33 Western Carolina 0
6 Newport News 21
25 Hampden-Sydney 2
13 Newberry 0
6 Roanoke 12
26 Guilford 0
14 Appalachian St. 0
0 George Washingtn 50
0 Lenoir-Rhyne 6
13 Elon 33
136 124
1937 (8-2)
7 Mulhenburg 6
20 Newberry 0
21 Newport News 0
32 Roanoke 19
28 Guilford 0
14 Western Carolina 0
2 Elon 22
26 Erskine 12
0 Appalachian St. 6
13 Lenoir-Rhyne 0
161 65
1938 (7-2-1)
18 High Point 0
26 Erskine 7
6 Roanoke 6
27 Newberry 14
0 Albright 14
0 Emory & Henry 0
20 Elon 6
27 Guilford 0
27 Western Carolina 0
7 Lenoir-Rhyne 14
167 55
1939 (6-2-2)
0 Newberry 0
7 Kings College 6
31 High Point 13
12 Newport News 0
12 Emory & Henry 0
39 Guilford 6
26 Erskine 7
0 Elon 7
7 Roanoke 12
7 Lenoir-Rhyne 7
141 58
1940 (8-1)
25 Emory & Henry 0
12 Virginia Tech 34
27 Kings College 0
25 High Point 0
7 Albright 6
40 Guilford 0
13 Elon 0
13 Roanoke 6
12 Lenoir-Rhyne 0
174 46
1941 (8-3)
33 Davis & Elkins 7
2 Virginia Tech 22
6 Kings College 14
23 Newberry 0
29 High Point 0
20 Appalachian St. 19
51 Guilford 0
21 Wofford 20
7 Elon 8
19 Roanoke 0
13 Lenoir-Rhyne 0
224 90
1942 (9-2)
2 Navy Pre-Flight 13
14 Virginia Tech 28
36 Wofford 0
32 High Point 6
21 Camp Davis 14
7 Appalachian St. 7
26 Presbyterian 6
48 Newberry 6
38 High Point 14
42 Roanoke 0
27 Appalachian St. 0
293 87
1943
(No Team-War)
1944 (6-3)
6 Emory & Henry 0
7 V.M.I. 6
34 Newberry 0
7 N.C. State 12
19 Presbyterian 0
26 Fort Monroe 0
33 Richmond Air Base 0
13 Milligan 20
7 Charleston Coast Gd 20
152 50
1945 (10-1)
20 Oak Guard Marines 0
34 Fort Monroe 0
6 William & Mary 19
21 Kinston Marines 0
41 Emory & Henry 0
34 Milligan 0
21 Richmond 7
13 Eastern Kentucky 0
55 Appalachian St. 0
14 V.M.I. 7
33 Guilford 0
292 33
1946 (10-2)
27 Cherry Pt. Marine 7
7 V.M.I. 21
9 Eastern Kentucky 7
19 High Point 7
46 Wofford 0
28 Appalachian St. 6
40 Elon 0
12 Presbyterian 13
6 Newberry 0
28 Guilford 0
27 Lenoir-Rhyne 0
J/1 31 Maryville+ 0
286 67
+Tangerine Bowl (Orlando,FL)
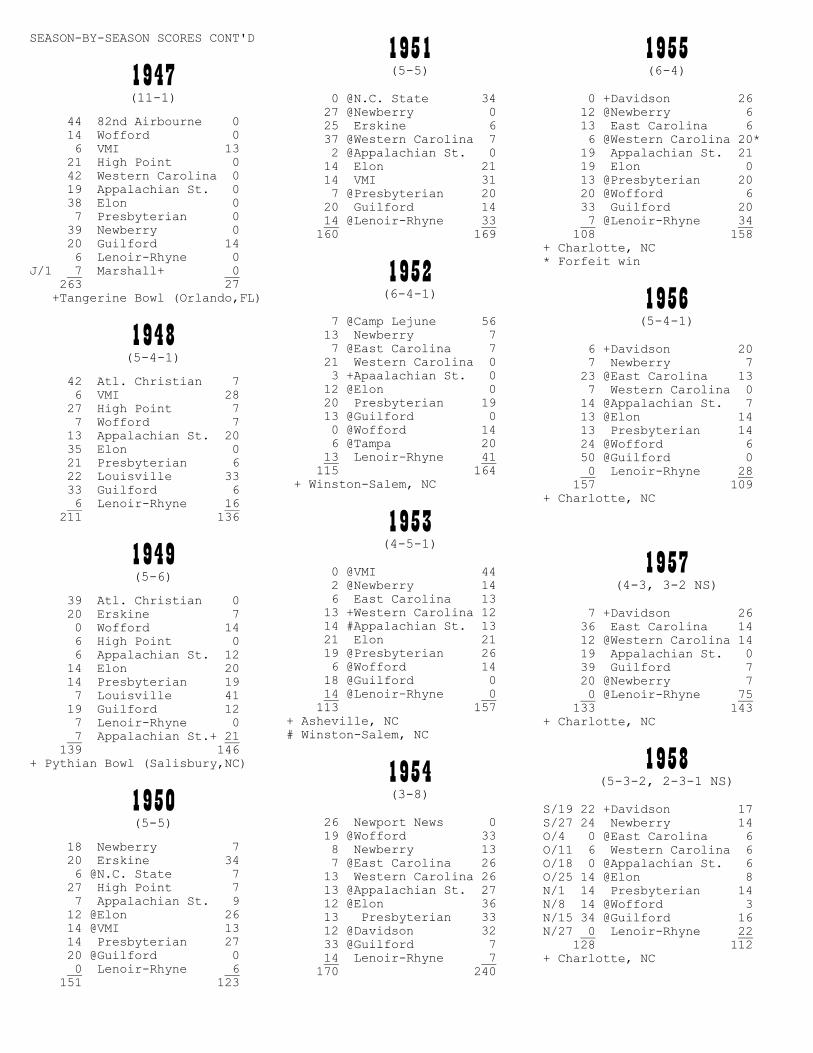
SEASON-BY-SEASON SCORES CONT'D
1947 (11-1)
44 82nd Airbourne 0
14 Wofford 0
6 VMI 13
21 High Point 0
42 Western Carolina 0
19 Appalachian St. 0
38 Elon 0
7 Presbyterian 0
39 Newberry 0
20 Guilford 14
6 Lenoir-Rhyne 0
J/1 7 Marshall+ 0
263 27
+Tangerine Bowl (Orlando,FL)
1948 (5-4-1)
42 Atl. Christian 7
6 VMI 28
27 High Point 7
7 Wofford 7
13 Appalachian St. 20
35 Elon 0
21 Presbyterian 6
22 Louisville 33
33 Guilford 6
6 Lenoir-Rhyne 16
211 136
1949 (5-6)
39 Atl. Christian 0
20 Erskine 7
0 Wofford 14
6 High Point 0
6 Appalachian St. 12
14 Elon 20
14 Presbyterian 19
7 Louisville 41
19 Guilford 12
7 Lenoir-Rhyne 0
7 Appalachian St.+ 21
139 146
+ Pythian Bowl (Salisbury,NC)
1950 (5-5)
18 Newberry 7
20 Erskine 34
6 @N.C. State 7
27 High Point 7
7 Appalachian St. 9
12 @Elon 26
14 @VMI 13
14 Presbyterian 27
20 @Guilford 0
0 Lenoir-Rhyne 6
151 123
1951 (5-5)
0 @N.C. State 34
27 @Newberry 0
25 Erskine 6
37 @Western Carolina 7
2 @Appalachian St. 0
14 Elon 21
14 VMI 31
7 @Presbyterian 20
20 Guilford 14
14 @Lenoir-Rhyne 33
160 169
1952 (6-4-1)
7 @Camp Lejune 56
13 Newberry 7
7 @East Carolina 7
21 Western Carolina 0
3 +Apaalachian St. 0
12 @Elon 0
20 Presbyterian 19
13 @Guilford 0
0 @Wofford 14
6 @Tampa 20
13 Lenoir-Rhyne 41
115 164
+ Winston-Salem, NC
1953 (4-5-1)
0 @VMI 44
2 @Newberry 14
6 East Carolina 13
13 +Western Carolina 12
14 #Appalachian St. 13
21 Elon 21
19 @Presbyterian 26
6 @Wofford 14
18 @Guilford 0
14 @Lenoir-Rhyne 0
113 157
+ Asheville, NC
# Winston-Salem, NC
1954 (3-8)
26 Newport News 0
19 @Wofford 33
8 Newberry 13
7 @East Carolina 26
13 Western Carolina 26
13 @Appalachian St. 27
12 @Elon 36
13 Presbyterian 33
12 @Davidson 32
33 @Guilford 7
14 Lenoir-Rhyne 7
170 240
1955 (6-4)
0 +Davidson 26
12 @Newberry 6
13 East Carolina 6
6 @Western Carolina 20*
19 Appalachian St. 21
19 Elon 0
13 @Presbyterian 20
20 @Wofford 6
33 Guilford 20
7 @Lenoir-Rhyne 34
108 158
+ Charlotte, NC
* Forfeit win
1956 (5-4-1)
6 +Davidson 20
7 Newberry 7
23 @East Carolina 13
7 Western Carolina 0
14 @Appalachian St. 7
13 @Elon 14
13 Presbyterian 14
24 @Wofford 6
50 @Guilford 0
0 Lenoir-Rhyne 28
157 109
+ Charlotte, NC
1957 (4-3, 3-2 NS)
7 +Davidson 26
36 East Carolina 14
12 @Western Carolina 14
19 Appalachian St. 0
39 Guilford 7
20 @Newberry 7
0 @Lenoir-Rhyne 75
133 143
+ Charlotte, NC
1958 (5-3-2, 2-3-1 NS)
S/19 22 +Davidson 17
S/27 24 Newberry 14
O/4 0 @East Carolina 6
O/11 6 Western Carolina 6
O/18 0 @Appalachian St. 6
O/25 14 @Elon 8
N/1 14 Presbyterian 14
N/8 14 @Wofford 3
N/15 34 @Guilford 16
N/27 0 Lenoir-Rhyne 22
128 112
+ Charlotte, NC
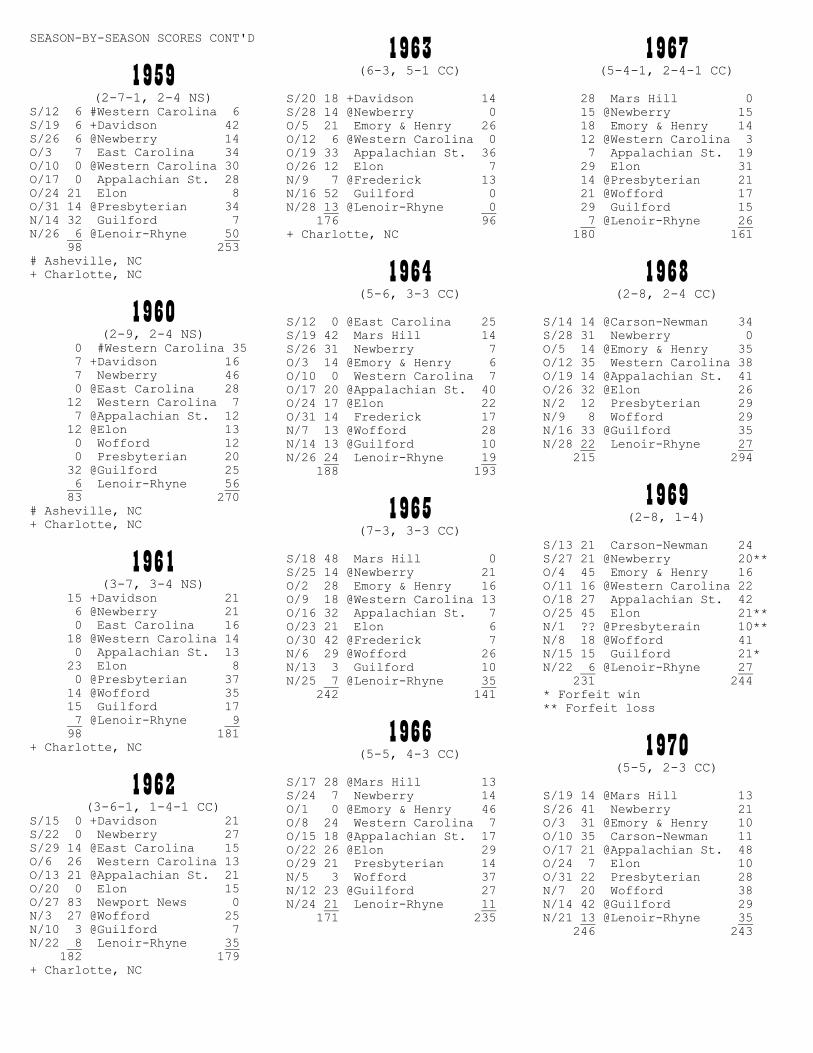
SEASON-BY-SEASON SCORES CONT'D
1959 (2-7-1, 2-4 NS)
S/12 6 #Western Carolina 6
S/19 6 +Davidson 42
S/26 6 @Newberry 14
O/3 7 East Carolina 34
O/10 0 @Western Carolina 30
O/17 0 Appalachian St. 28
O/24 21 Elon 8
O/31 14 @Presbyterian 34
N/14 32 Guilford 7
N/26 6 @Lenoir-Rhyne 50
98 253
# Asheville, NC
+ Charlotte, NC
1960 (2-9, 2-4 NS)
0 #Western Carolina 35
7 +Davidson 16
7 Newberry 46
0 @East Carolina 28
12 Western Carolina 7
7 @Appalachian St. 12
12 @Elon 13
0 Wofford 12
0 Presbyterian 20
32 @Guilford 25
6 Lenoir-Rhyne 56
83 270
# Asheville, NC
+ Charlotte, NC
1961 (3-7, 3-4 NS)
15 +Davidson 21
6 @Newberry 21
0 East Carolina 16
18 @Western Carolina 14
0 Appalachian St. 13
23 Elon 8
0 @Presbyterian 37
14 @Wofford 35
15 Guilford 17
7 @Lenoir-Rhyne 9
98 181
+ Charlotte, NC
1962 (3-6-1, 1-4-1 CC)
S/15 0 +Davidson 21
S/22 0 Newberry 27
S/29 14 @East Carolina 15
O/6 26 Western Carolina 13
O/13 21 @Appalachian St. 21
O/20 0 Elon 15
O/27 83 Newport News 0
N/3 27 @Wofford 25
N/10 3 @Guilford 7
N/22 8 Lenoir-Rhyne 35
182 179
+ Charlotte, NC
1963 (6-3, 5-1 CC)
S/20 18 +Davidson 14
S/28 14 @Newberry 0
O/5 21 Emory & Henry 26
O/12 6 @Western Carolina 0
O/19 33 Appalachian St. 36
O/26 12 Elon 7
N/9 7 @Frederick 13
N/16 52 Guilford 0
N/28 13 @Lenoir-Rhyne 0
176 96
+ Charlotte, NC
1964 (5-6, 3-3 CC)
S/12 0 @East Carolina 25
S/19 42 Mars Hill 14
S/26 31 Newberry 7
O/3 14 @Emory & Henry 6
O/10 0 Western Carolina 7
O/17 20 @Appalachian St. 40
O/24 17 @Elon 22
O/31 14 Frederick 17
N/7 13 @Wofford 28
N/14 13 @Guilford 10
N/26 24 Lenoir-Rhyne 19
188 193
1965 (7-3, 3-3 CC)
S/18 48 Mars Hill 0
S/25 14 @Newberry 21
O/2 28 Emory & Henry 16
O/9 18 @Western Carolina 13
O/16 32 Appalachian St. 7
O/23 21 Elon 6
O/30 42 @Frederick 7
N/6 29 @Wofford 26
N/13 3 Guilford 10
N/25 7 @Lenoir-Rhyne 35
242 141
1966 (5-5, 4-3 CC)
S/17 28 @Mars Hill 13
S/24 7 Newberry 14
O/1 0 @Emory & Henry 46
O/8 24 Western Carolina 7
O/15 18 @Appalachian St. 17
O/22 26 @Elon 29
O/29 21 Presbyterian 14
N/5 3 Wofford 37
N/12 23 @Guilford 27
N/24 21 Lenoir-Rhyne 11
171 235
1967 (5-4-1, 2-4-1 CC)
28 Mars Hill 0
15 @Newberry 15
18 Emory & Henry 14
12 @Western Carolina 3
7 Appalachian St. 19
29 Elon 31
14 @Presbyterian 21
21 @Wofford 17
29 Guilford 15
7 @Lenoir-Rhyne 26
180 161
1968 (2-8, 2-4 CC)
S/14 14 @Carson-Newman 34
S/28 31 Newberry 0
O/5 14 @Emory & Henry 35
O/12 35 Western Carolina 38
O/19 14 @Appalachian St. 41
O/26 32 @Elon 26
N/2 12 Presbyterian 29
N/9 8 Wofford 29
N/16 33 @Guilford 35
N/28 22 Lenoir-Rhyne 27
215 294
1969 (2-8, 1-4)
S/13 21 Carson-Newman 24
S/27 21 @Newberry 20**
O/4 45 Emory & Henry 16
O/11 16 @Western Carolina 22
O/18 27 Appalachian St. 42
O/25 45 Elon 21**
N/1 ?? @Presbyterain 10**
N/8 18 @Wofford 41
N/15 15 Guilford 21*
N/22 6 @Lenoir-Rhyne 27
231 244
* Forfeit win
** Forfeit loss
1970 (5-5, 2-3 CC)
S/19 14 @Mars Hill 13
S/26 41 Newberry 21
O/3 31 @Emory & Henry 10
O/10 35 Carson-Newman 11
O/17 21 @Appalachian St. 48
O/24 7 Elon 10
O/31 22 Presbyterian 28
N/7 20 Wofford 38
N/14 42 @Guilford 29
N/21 13 @Lenoir-Rhyne 35
246 243
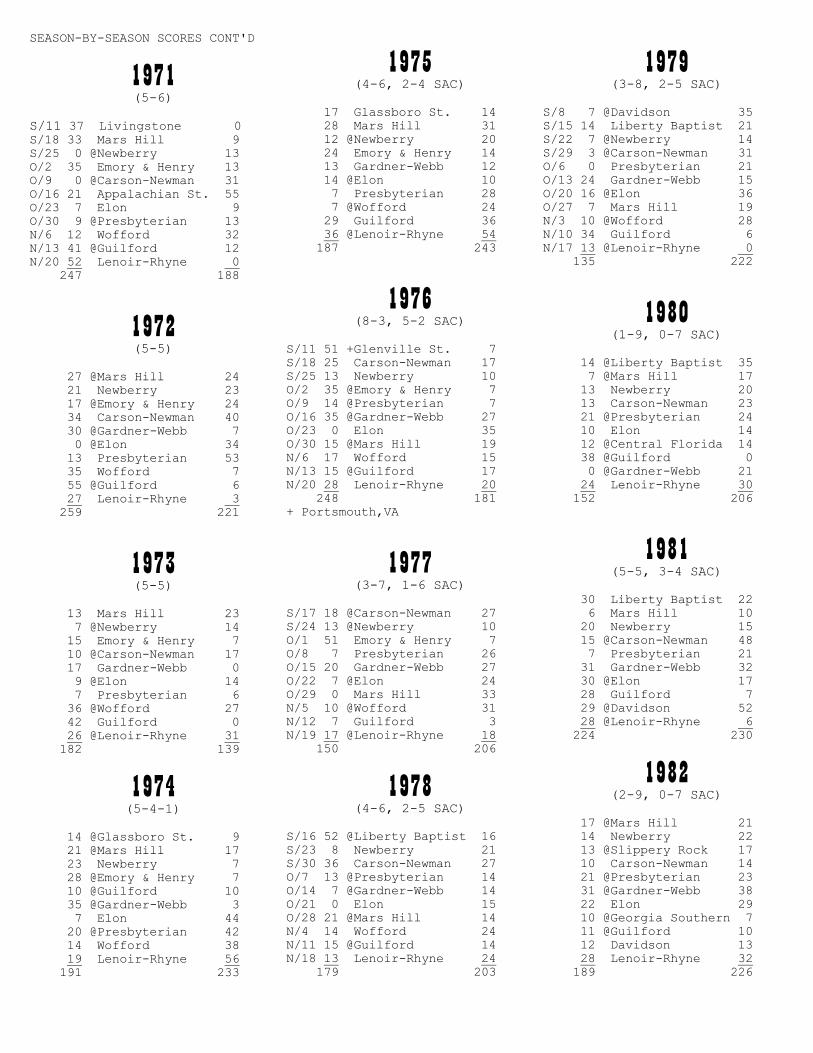
SEASON-BY-SEASON SCORES CONT'D
1971 (5-6)
S/11 37 Livingstone 0
S/18 33 Mars Hill 9
S/25 0 @Newberry 13
O/2 35 Emory & Henry 13
O/9 0 @Carson-Newman 31
O/16 21 Appalachian St. 55
O/23 7 Elon 9
O/30 9 @Presbyterian 13
N/6 12 Wofford 32
N/13 41 @Guilford 12
N/20 52 Lenoir-Rhyne 0
247 188
1972 (5-5)
27 @Mars Hill 24
21 Newberry 23
17 @Emory & Henry 24
34 Carson-Newman 40
30 @Gardner-Webb 7
0 @Elon 34
13 Presbyterian 53
35 Wofford 7
55 @Guilford 6
27 Lenoir-Rhyne 3
259 221
1973 (5-5)
13 Mars Hill 23
7 @Newberry 14
15 Emory & Henry 7
10 @Carson-Newman 17
17 Gardner-Webb 0
9 @Elon 14
7 Presbyterian 6
36 @Wofford 27
42 Guilford 0
26 @Lenoir-Rhyne 31
182 139
1974 (5-4-1)
14 @Glassboro St. 9
21 @Mars Hill 17
23 Newberry 7
28 @Emory & Henry 7
10 @Guilford 10
35 @Gardner-Webb 3
7 Elon 44
20 @Presbyterian 42
14 Wofford 38
19 Lenoir-Rhyne 56
191 233
1975 (4-6, 2-4 SAC)
17 Glassboro St. 14
28 Mars Hill 31
12 @Newberry 20
24 Emory & Henry 14
13 Gardner-Webb 12
14 @Elon 10
7 Presbyterian 28
7 @Wofford 24
29 Guilford 36
36 @Lenoir-Rhyne 54
187 243
1976 (8-3, 5-2 SAC)
S/11 51 +Glenville St. 7
S/18 25 Carson-Newman 17
S/25 13 Newberry 10
O/2 35 @Emory & Henry 7
O/9 14 @Presbyterian 7
O/16 35 @Gardner-Webb 27
O/23 0 Elon 35
O/30 15 @Mars Hill 19
N/6 17 Wofford 15
N/13 15 @Guilford 17
N/20 28 Lenoir-Rhyne 20
248 181
+ Portsmouth,VA
1977 (3-7, 1-6 SAC)
S/17 18 @Carson-Newman 27
S/24 13 @Newberry 10
O/1 51 Emory & Henry 7
O/8 7 Presbyterian 26
O/15 20 Gardner-Webb 27
O/22 7 @Elon 24
O/29 0 Mars Hill 33
N/5 10 @Wofford 31
N/12 7 Guilford 3
N/19 17 @Lenoir-Rhyne 18
150 206
1978 (4-6, 2-5 SAC)
S/16 52 @Liberty Baptist 16
S/23 8 Newberry 21
S/30 36 Carson-Newman 27
O/7 13 @Presbyterian 14
O/14 7 @Gardner-Webb 14
O/21 0 Elon 15
O/28 21 @Mars Hill 14
N/4 14 Wofford 24
N/11 15 @Guilford 14
N/18 13 Lenoir-Rhyne 24
179 203
1979 (3-8, 2-5 SAC)
S/8 7 @Davidson 35
S/15 14 Liberty Baptist 21
S/22 7 @Newberry 14
S/29 3 @Carson-Newman 31
O/6 0 Presbyterian 21
O/13 24 Gardner-Webb 15
O/20 16 @Elon 36
O/27 7 Mars Hill 19
N/3 10 @Wofford 28
N/10 34 Guilford 6
N/17 13 @Lenoir-Rhyne 0
135 222
1980 (1-9, 0-7 SAC)
14 @Liberty Baptist 35
7 @Mars Hill 17
13 Newberry 20
13 Carson-Newman 23
21 @Presbyterian 24
10 Elon 14
12 @Central Florida 14
38 @Guilford 0
0 @Gardner-Webb 21
24 Lenoir-Rhyne 30
152 206
1981 (5-5, 3-4 SAC)
30 Liberty Baptist 22
6 Mars Hill 10
20 Newberry 15
15 @Carson-Newman 48
7 Presbyterian 21
31 Gardner-Webb 32
30 @Elon 17
28 Guilford 7
29 @Davidson 52
28 @Lenoir-Rhyne 6
224 230
1982 (2-9, 0-7 SAC)
17 @Mars Hill 21
14 Newberry 22
13 @Slippery Rock 17
10 Carson-Newman 14
21 @Presbyterian 23
31 @Gardner-Webb 38
22 Elon 29
10 @Georgia Southern 7
11 @Guilford 10
12 Davidson 13
28 Lenoir-Rhyne 32
189 226
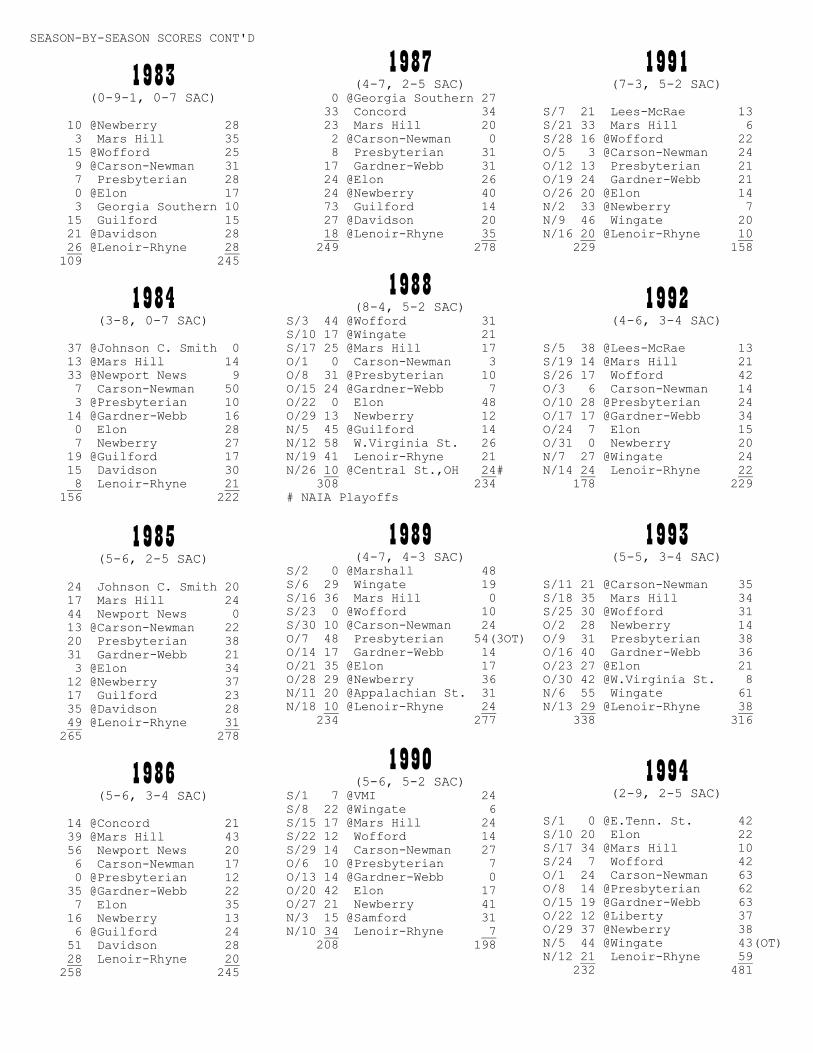
SEASON-BY-SEASON SCORES CONT'D
1983 (0-9-1, 0-7 SAC)
10 @Newberry 28
3 Mars Hill 35
15 @Wofford 25
9 @Carson-Newman 31
7 Presbyterian 28
0 @Elon 17
3 Georgia Southern 10
15 Guilford 15
21 @Davidson 28
26 @Lenoir-Rhyne 28
109 245
1984 (3-8, 0-7 SAC)
37 @Johnson C. Smith 0
13 @Mars Hill 14
33 @Newport News 9
7 Carson-Newman 50
3 @Presbyterian 10
14 @Gardner-Webb 16
0 Elon 28
7 Newberry 27
19 @Guilford 17
15 Davidson 30
8 Lenoir-Rhyne 21
156 222
1985 (5-6, 2-5 SAC)
24 Johnson C. Smith 20
17 Mars Hill 24
44 Newport News 0
13 @Carson-Newman 22
20 Presbyterian 38
31 Gardner-Webb 21
3 @Elon 34
12 @Newberry 37
17 Guilford 23
35 @Davidson 28
49 @Lenoir-Rhyne 31
265 278
1986 (5-6, 3-4 SAC)
14 @Concord 21
39 @Mars Hill 43
56 Newport News 20
6 Carson-Newman 17
0 @Presbyterian 12
35 @Gardner-Webb 22
7 Elon 35
16 Newberry 13
6 @Guilford 24
51 Davidson 28
28 Lenoir-Rhyne 20
258 245
1987 (4-7, 2-5 SAC)
0 @Georgia Southern 27
33 Concord 34
23 Mars Hill 20
2 @Carson-Newman 0
8 Presbyterian 31
17 Gardner-Webb 31
24 @Elon 26
24 @Newberry 40
73 Guilford 14
27 @Davidson 20
18 @Lenoir-Rhyne 35
249 278
1988 (8-4, 5-2 SAC)
S/3 44 @Wofford 31
S/10 17 @Wingate 21
S/17 25 @Mars Hill 17
O/1 0 Carson-Newman 3
O/8 31 @Presbyterian 10
O/15 24 @Gardner-Webb 7
O/22 0 Elon 48
O/29 13 Newberry 12
N/5 45 @Guilford 14
N/12 58 W.Virginia St. 26
N/19 41 Lenoir-Rhyne 21
N/26 10 @Central St.,OH 24#
308 234
# NAIA Playoffs
1989 (4-7, 4-3 SAC)
S/2 0 @Marshall 48
S/6 29 Wingate 19
S/16 36 Mars Hill 0
S/23 0 @Wofford 10
S/30 10 @Carson-Newman 24
O/7 48 Presbyterian 54(3OT)
O/14 17 Gardner-Webb 14
O/21 35 @Elon 17
O/28 29 @Newberry 36
N/11 20 @Appalachian St. 31
N/18 10 @Lenoir-Rhyne 24
234 277
1990 (5-6, 5-2 SAC)
S/1 7 @VMI 24
S/8 22 @Wingate 6
S/15 17 @Mars Hill 24
S/22 12 Wofford 14
S/29 14 Carson-Newman 27
O/6 10 @Presbyterian 7
O/13 14 @Gardner-Webb 0
O/20 42 Elon 17
O/27 21 Newberry 41
N/3 15 @Samford 31
N/10 34 Lenoir-Rhyne 7
208 198
1991 (7-3, 5-2 SAC)
S/7 21 Lees-McRae 13
S/21 33 Mars Hill 6
S/28 16 @Wofford 22
O/5 3 @Carson-Newman 24
O/12 13 Presbyterian 21
O/19 24 Gardner-Webb 21
O/26 20 @Elon 14
N/2 33 @Newberry 7
N/9 46 Wingate 20
N/16 20 @Lenoir-Rhyne 10
229 158
1992 (4-6, 3-4 SAC)
S/5 38 @Lees-McRae 13
S/19 14 @Mars Hill 21
S/26 17 Wofford 42
O/3 6 Carson-Newman 14
O/10 28 @Presbyterian 24
O/17 17 @Gardner-Webb 34
O/24 7 Elon 15
O/31 0 Newberry 20
N/7 27 @Wingate 24
N/14 24 Lenoir-Rhyne 22
178 229
1993 (5-5, 3-4 SAC)
S/11 21 @Carson-Newman 35
S/18 35 Mars Hill 34
S/25 30 @Wofford 31
O/2 28 Newberry 14
O/9 31 Presbyterian 38
O/16 40 Gardner-Webb 36
O/23 27 @Elon 21
O/30 42 @W.Virginia St. 8
N/6 55 Wingate 61
N/13 29 @Lenoir-Rhyne 38
338 316
1994 (2-9, 2-5 SAC)
S/1 0 @E.Tenn. St. 42
S/10 20 Elon 22
S/17 34 @Mars Hill 10
S/24 7 Wofford 42
O/1 24 Carson-Newman 63
O/8 14 @Presbyterian 62
O/15 19 @Gardner-Webb 63
O/22 12 @Liberty 37
O/29 37 @Newberry 38
N/5 44 @Wingate 43(OT)
N/12 21 Lenoir-Rhyne 59
232 481
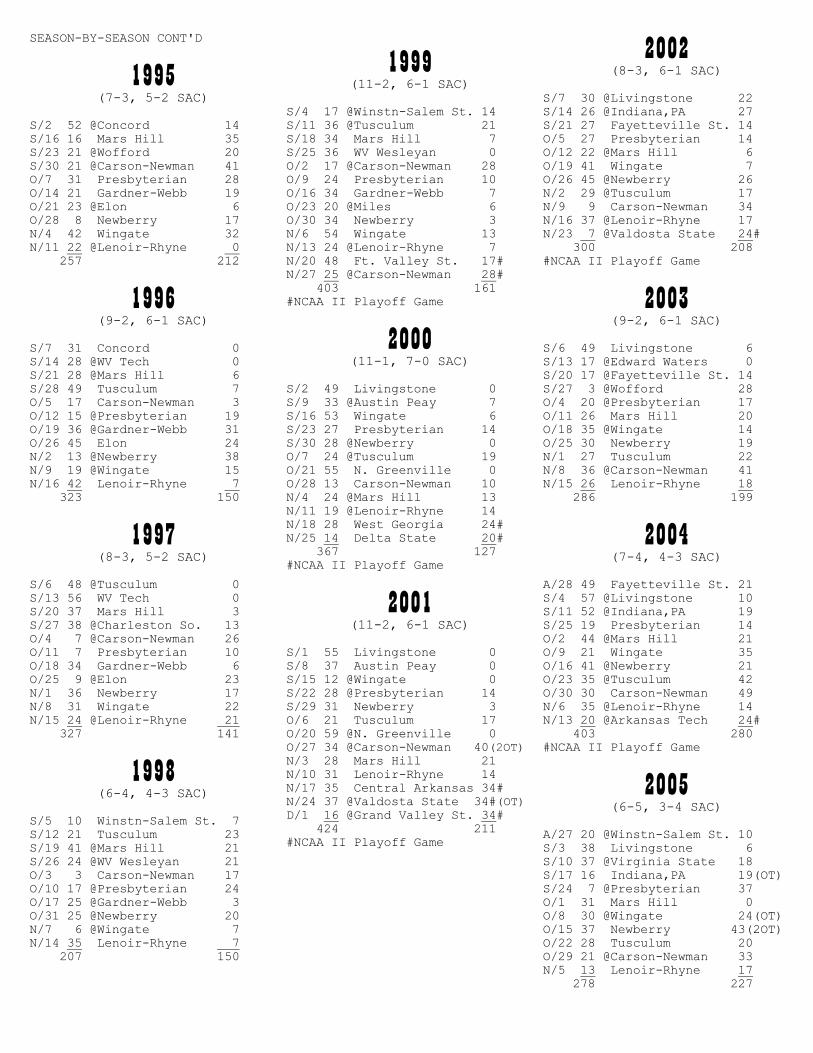
SEASON-BY-SEASON CONT'D
1995 (7-3, 5-2 SAC)
S/2 52 @Concord 14
S/16 16 Mars Hill 35
S/23 21 @Wofford 20
S/30 21 @Carson-Newman 41
O/7 31 Presbyterian 28
O/14 21 Gardner-Webb 19
O/21 23 @Elon 6
O/28 8 Newberry 17
N/4 42 Wingate 32
N/11 22 @Lenoir-Rhyne 0
257 212
1996 (9-2, 6-1 SAC)
S/7 31 Concord 0
S/14 28 @WV Tech 0
S/21 28 @Mars Hill 6
S/28 49 Tusculum 7
O/5 17 Carson-Newman 3
O/12 15 @Presbyterian 19
O/19 36 @Gardner-Webb 31
O/26 45 Elon 24
N/2 13 @Newberry 38
N/9 19 @Wingate 15
N/16 42 Lenoir-Rhyne 7
323 150
1997 (8-3, 5-2 SAC)
S/6 48 @Tusculum 0
S/13 56 WV Tech 0
S/20 37 Mars Hill 3
S/27 38 @Charleston So. 13
O/4 7 @Carson-Newman 26
O/11 7 Presbyterian 10
O/18 34 Gardner-Webb 6
O/25 9 @Elon 23
N/1 36 Newberry 17
N/8 31 Wingate 22
N/15 24 @Lenoir-Rhyne 21
327 141
1998 (6-4, 4-3 SAC)
S/5 10 Winstn-Salem St. 7
S/12 21 Tusculum 23
S/19 41 @Mars Hill 21
S/26 24 @WV Wesleyan 21
O/3 3 Carson-Newman 17
O/10 17 @Presbyterian 24
O/17 25 @Gardner-Webb 3
O/31 25 @Newberry 20
N/7 6 @Wingate 7
N/14 35 Lenoir-Rhyne 7
207 150
1999 (11-2, 6-1 SAC)
S/4 17 @Winstn-Salem St. 14
S/11 36 @Tusculum 21
S/18 34 Mars Hill 7
S/25 36 WV Wesleyan 0
O/2 17 @Carson-Newman 28
O/9 24 Presbyterian 10
O/16 34 Gardner-Webb 7
O/23 20 @Miles 6
O/30 34 Newberry 3
N/6 54 Wingate 13
N/13 24 @Lenoir-Rhyne 7
N/20 48 Ft. Valley St. 17#
N/27 25 @Carson-Newman 28#
403 161
#NCAA II Playoff Game
2000 (11-1, 7-0 SAC)
S/2 49 Livingstone 0
S/9 33 @Austin Peay 7
S/16 53 Wingate 6
S/23 27 Presbyterian 14
S/30 28 @Newberry 0
O/7 24 @Tusculum 19
O/21 55 N. Greenville 0
O/28 13 Carson-Newman 10
N/4 24 @Mars Hill 13
N/11 19 @Lenoir-Rhyne 14
N/18 28 West Georgia 24#
N/25 14 Delta State 20#
367 127
#NCAA II Playoff Game
2001 (11-2, 6-1 SAC)
S/1 55 Livingstone 0
S/8 37 Austin Peay 0
S/15 12 @Wingate 0
S/22 28 @Presbyterian 14
S/29 31 Newberry 3
O/6 21 Tusculum 17
O/20 59 @N. Greenville 0
O/27 34 @Carson-Newman 40(2OT)
N/3 28 Mars Hill 21
N/10 31 Lenoir-Rhyne 14
N/17 35 Central Arkansas 34#
N/24 37 @Valdosta State 34#(OT)
D/1 16 @Grand Valley St. 34#
424 211
#NCAA II Playoff Game
2002 (8-3, 6-1 SAC)
S/7 30 @Livingstone 22
S/14 26 @Indiana,PA 27
S/21 27 Fayetteville St. 14
O/5 27 Presbyterian 14
O/12 22 @Mars Hill 6
O/19 41 Wingate 7
O/26 45 @Newberry 26
N/2 29 @Tusculum 17
N/9 9 Carson-Newman 34
N/16 37 @Lenoir-Rhyne 17
N/23 7 @Valdosta State 24#
300 208
#NCAA II Playoff Game
2003 (9-2, 6-1 SAC)
S/6 49 Livingstone 6
S/13 17 @Edward Waters 0
S/20 17 @Fayetteville St. 14
S/27 3 @Wofford 28
O/4 20 @Presbyterian 17
O/11 26 Mars Hill 20
O/18 35 @Wingate 14
O/25 30 Newberry 19
N/1 27 Tusculum 22
N/8 36 @Carson-Newman 41
N/15 26 Lenoir-Rhyne 18
286 199
2004 (7-4, 4-3 SAC)
A/28 49 Fayetteville St. 21
S/4 57 @Livingstone 10
S/11 52 @Indiana,PA 19
S/25 19 Presbyterian 14
O/2 44 @Mars Hill 21
O/9 21 Wingate 35
O/16 41 @Newberry 21
O/23 35 @Tusculum 42
O/30 30 Carson-Newman 49
N/6 35 @Lenoir-Rhyne 14
N/13 20 @Arkansas Tech 24#
403 280
#NCAA II Playoff Game
2005 (6-5, 3-4 SAC)
A/27 20 @Winstn-Salem St. 10
S/3 38 Livingstone 6
S/10 37 @Virginia State 18
S/17 16 Indiana,PA 19(OT)
S/24 7 @Presbyterian 37
O/1 31 Mars Hill 0
O/8 30 @Wingate 24(OT)
O/15 37 Newberry 43(2OT)
O/22 28 Tusculum 20
O/29 21 @Carson-Newman 33
N/5 13 Lenoir-Rhyne 17
278 227
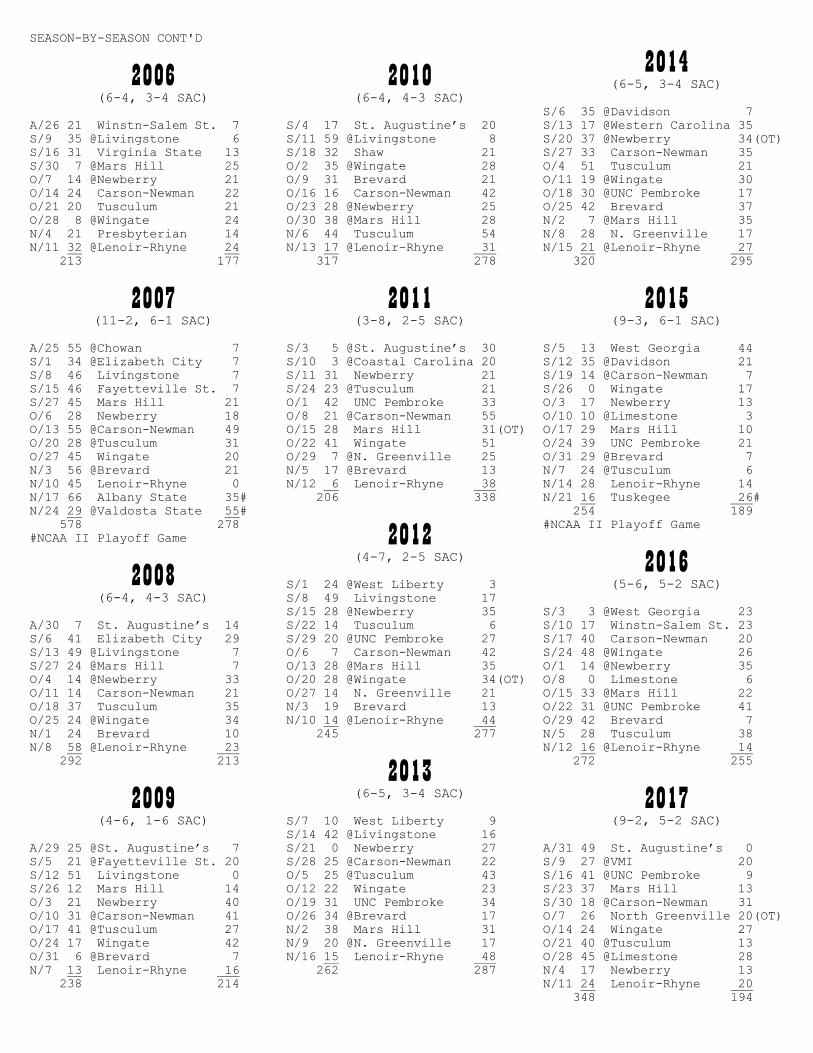
SEASON-BY-SEASON CONT'D
2006 (6-4, 3-4 SAC)
A/26 21 Winstn-Salem St. 7
S/9 35 @Livingstone 6
S/16 31 Virginia State 13
S/30 7 @Mars Hill 25
O/7 14 @Newberry 21
O/14 24 Carson-Newman 22
O/21 20 Tusculum 21
O/28 8 @Wingate 24
N/4 21 Presbyterian 14
N/11 32 @Lenoir-Rhyne 24
213 177
2007 (11-2, 6-1 SAC)
A/25 55 @Chowan 7
S/1 34 @Elizabeth City 7
S/8 46 Livingstone 7
S/15 46 Fayetteville St. 7
S/27 45 Mars Hill 21
O/6 28 Newberry 18
O/13 55 @Carson-Newman 49
O/20 28 @Tusculum 31
O/27 45 Wingate 20
N/3 56 @Brevard 21
N/10 45 Lenoir-Rhyne 0
N/17 66 Albany State 35#
N/24 29 @Valdosta State 55#
578 278
#NCAA II Playoff Game
2008 (6-4, 4-3 SAC)
A/30 7 St. Augustine’s 14
S/6 41 Elizabeth City 29
S/13 49 @Livingstone 7
S/27 24 @Mars Hill 7
O/4 14 @Newberry 33
O/11 14 Carson-Newman 21
O/18 37 Tusculum 35
O/25 24 @Wingate 34
N/1 24 Brevard 10
N/8 58 @Lenoir-Rhyne 23
292 213
2009 (4-6, 1-6 SAC)
A/29 25 @St. Augustine’s 7
S/5 21 @Fayetteville St. 20
S/12 51 Livingstone 0
S/26 12 Mars Hill 14
O/3 21 Newberry 40
O/10 31 @Carson-Newman 41
O/17 41 @Tusculum 27
O/24 17 Wingate 42
O/31 6 @Brevard 7
N/7 13 Lenoir-Rhyne 16
238 214
2010 (6-4, 4-3 SAC)
S/4 17 St. Augustine’s 20
S/11 59 @Livingstone 8
S/18 32 Shaw 21
O/2 35 @Wingate 28
O/9 31 Brevard 21
O/16 16 Carson-Newman 42
O/23 28 @Newberry 25
O/30 38 @Mars Hill 28
N/6 44 Tusculum 54
N/13 17 @Lenoir-Rhyne 31
317 278
2011 (3-8, 2-5 SAC)
S/3 5 @St. Augustine’s 30
S/10 3 @Coastal Carolina 20
S/11 31 Newberry 21
S/24 23 @Tusculum 21
O/1 42 UNC Pembroke 33
O/8 21 @Carson-Newman 55
O/15 28 Mars Hill 31(OT)
O/22 41 Wingate 51
O/29 7 @N. Greenville 25
N/5 17 @Brevard 13
N/12 6 Lenoir-Rhyne 38
206 338
2012 (4-7, 2-5 SAC)
S/1 24 @West Liberty 3
S/8 49 Livingstone 17
S/15 28 @Newberry 35
S/22 14 Tusculum 6
S/29 20 @UNC Pembroke 27
O/6 7 Carson-Newman 42
O/13 28 @Mars Hill 35
O/20 28 @Wingate 34(OT)
O/27 14 N. Greenville 21
N/3 19 Brevard 13
N/10 14 @Lenoir-Rhyne 44
245 277
2013 (6-5, 3-4 SAC)
S/7 10 West Liberty 9
S/14 42 @Livingstone 16
S/21 0 Newberry 27
S/28 25 @Carson-Newman 22
O/5 25 @Tusculum 43
O/12 22 Wingate 23
O/19 31 UNC Pembroke 34
O/26 34 @Brevard 17
N/2 38 Mars Hill 31
N/9 20 @N. Greenville 17
N/16 15 Lenoir-Rhyne 48
262 287
2014 (6-5, 3-4 SAC)
S/6 35 @Davidson 7
S/13 17 @Western Carolina 35
S/20 37 @Newberry 34(OT)
S/27 33 Carson-Newman 35
O/4 51 Tusculum 21
O/11 19 @Wingate 30
O/18 30 @UNC Pembroke 17
O/25 42 Brevard 37
N/2 7 @Mars Hill 35
N/8 28 N. Greenville 17
N/15 21 @Lenoir-Rhyne 27
320 295
2015 (9-3, 6-1 SAC)
S/5 13 West Georgia 44
S/12 35 @Davidson 21
S/19 14 @Carson-Newman 7
S/26 0 Wingate 17
O/3 17 Newberry 13
O/10 10 @Limestone 3
O/17 29 Mars Hill 10
O/24 39 UNC Pembroke 21
O/31 29 @Brevard 7
N/7 24 @Tusculum 6
N/14 28 Lenoir-Rhyne 14
N/21 16 Tuskegee 26#
254 189
#NCAA II Playoff Game
2016 (5-6, 5-2 SAC)
S/3 3 @West Georgia 23
S/10 17 Winstn-Salem St. 23
S/17 40 Carson-Newman 20
S/24 48 @Wingate 26
O/1 14 @Newberry 35
O/8 0 Limestone 6
O/15 33 @Mars Hill 22
O/22 31 @UNC Pembroke 41
O/29 42 Brevard 7
N/5 28 Tusculum 38
N/12 16 @Lenoir-Rhyne 14
272 255
2017 (9-2, 5-2 SAC)
A/31 49 St. Augustine’s 0
S/9 27 @VMI 20
S/16 41 @UNC Pembroke 9
S/23 37 Mars Hill 13
S/30 18 @Carson-Newman 31
O/7 26 North Greenville 20(OT)
O/14 24 Wingate 27
O/21 40 @Tusculum 13
O/28 45 @Limestone 28
N/4 17 Newberry 13
N/11 24 Lenoir-Rhyne 20
348 194
Related Documents