Universidade de Aveiro 2008 Departamento de Economia, Gestão e Engenharia Industrial CATARINA ISABEL PEREIRA FERREIRA DA SILVA Plano Pull com fornecedores Pull Planning with suppliers

Welcome message from author
This document is posted to help you gain knowledge. Please leave a comment to let me know what you think about it! Share it to your friends and learn new things together.
Transcript

Universidade de Aveiro 2008
Departamento de Economia, Gestão e Engenharia Industrial
CATARINA ISABEL PEREIRA FERREIRA DA SILVA
Plano Pull com fornecedores Pull Planning with suppliers

Universidade de Aveiro 2008
Departamento de Economia, Gestão e Engenharia Industrial
CATARINA ISABEL PEREIRA FERREIRA DA SILVA
Plano Pull com fornecedores Pull Planning with suppliers
Projecto apresentado à Universidade de Aveiro para cumprimento dosrequisitos necessários à obtenção do grau de Mestre em Engenharia e Gestão Industrial, realizada sob a orientação científica do Dr. José António deVasconcelos Ferreira, Professor Auxiliar do Departamento de Economia, Gestão e Engenharia Industrial da Universidade de Aveiro

o júri
presidente Prof. Doutor Luís Miguel Domingues Fernandes Ferreira professor auxiliar convidado da Universidade de Aveiro
Prof. Doutora Maria Henriqueta Dourado Eusébio Sampaio da Nóvoa Professora auxiliar da Faculdade de Engenharia da Universidade do Porto
Prof. Doutor José António de Vasconcelos Ferreira professor auxiliar da Universidade de Aveiro

agradecimentos
Gostaria de agradecer ao meu orientador, Prof. Dr. José de VasconcelosFerreira, bem como, a todos os colegas da Bosch que contribuíram para odesenvolvimento desta dissertação. Por último, deixo um agradecimento especial à minha família e amigos.

palavras-chave
Pull, Lean Manufacturing, TPS: Toyota Production System, Pull Planning,Supplier, VSM: Value Steam Method, Inventory coverage.
resumo
Pretende-se com este trabalho, Pull Planning nos fornecedores, abordar oconceito Pull e os princípios Lean directamente no fornecedor, para detectarproblemas e definir acções correctivas. O Objectivo é preparar o fornecedorpara a implementação de um sistema de pedidos em pull, permitindo melhoriasao nível da redução de inventário.

keywords
Pull, Lean Manufacturing, TPS: Toyota Production System, Pull Planning,Supplier, VSM: Value Steam Method, Inventory coverage.
abstract
The purpose of this work, Pull Planning with suppliers, is to approach the Pulllconcept and the Lean principles directly to the supplier, in order to detectproblems and define corrective actions. The target is preparing the supplier toimplement a pull planning system, allowing improvements in inventorycoverage reduction.

"Necessity is the mother of invention" Victor Hugo, 1852


Index of Contents
1. INTRODUCTION 1
1.1. The scope 1
1.2. The subject 1
1.3. Report organization 2
2. THEORETICAL FRAMING 3
2.1. Historical framing 3
2.2. Lean Tools – Pull System 5
2.3. Dealing with Suppliers 12
3. CASE STUDY 17
3.1. Bosch Vision 17
3.2. Source strategies 19
3.3. The objective 20
4. METHODOLOGY 21
5. DISCUSSION RESULTS 25
5.1. Methodology balance 25
5.2. Results of the workshop with the supplier 25
5.3. Running the implementation actions 35
5.4. Final Results 45
6. CONCLUSION 51
6.1. The expectations 51
6.2. Main Conclusions 52
REFERENCES 55
i

ii
APPENDIX I
Index of Figures
Figure 1: TPS House. ............................................................................................. 5
Figure 2: Kanban approach. ................................................................................. 10
Figure 3: Heijunka Box and Kanban card (www.leaninstituut.nl, 2008). ............ 11
Figure 4: Schedule map ........................................................................................ 22
Figure 5: Takt Time formula compared to tachometer. ........................................ 27
Figure 6: VSM – Steps 2 & 3 ............................................................................... 28
Figure 7: Cycle Time (CT) ................................................................................... 29
Figure 8: Process Time ......................................................................................... 29
Figure 9: VSM with process boxes fulfilled. ....................................................... 30
Figure 10: Throughput Time ................................................................................ 31
Figure 11: VSM with the Throughput and process time defined ......................... 32
Figure 12: VSM identifying the lean violations ................................................... 33
Figure 13: KP Box ................................................................................................ 41
Figure 14: External Milk Run............................................................................... 44
Figure 15: Pull Planning Flow .............................................................................. 45
Figure 16: Bosch Profit ........................................................................................ 47
Figure 17: MSL and Stock value of COS part numbers ....................................... 48

Index of Tables
Table 1: Schedule plan definition. ........................................................................ 21
Table 2: Supplier and customer information. ....................................................... 27
Table 3: 12 violations and the corresponding corrective actions ......................... 34
Table 4: Implementation Plan ............................................................................... 35
Table 5: Part number daily consumption and several lead-times. ........................ 37
Table 6: Part numbers consumption of two weeks. .............................................. 38
Table 7: Pull planning scenario ............................................................................ 39
Table 8: Minimum batch size proposals ............................................................... 40
Table 9: New pull planning scenario respecting the batch size ............................ 41
Table 10: Definition of minimum quantity per KP box ....................................... 42
Table 11: Bosch’s economical study. ................................................................... 46
iii

List of acronyms and abbreviations
BPS – Bosch Production System
CI – Continuous Improvement
CIP - Continuous Improvement Processes
COS – Case Study Supplier
COT – Change Over Time
CT – Cycle Time
EMR – External Milk-Run
FIFO – First-In First-Out
FPS – Ford Production System
FTE – Full Time Equivalence
JIT – Just In Time
JIS – Just in Sequence
LOG – Logistics
LT – Lead Time
MR- Milk-Run
MRP- Material Requirements Planning
MSL – Maximum Stock Level
OEE – Overall Equipment Effectiveness
PPM – Parts Per Million
SAP – System Analysis and Program Development
TPM – Total Preventive Maintenance
TPS – Toyota Production System
TT – Takt Time
VSD – Value Stream Design
VSM – Value Stream Method and Mapping
iv

Glossary
A3 Report: Toyota has a policy that all reports, no matter how important, should be
presented on a single side of A3 paper. The idea being that ‘less is more’, meaning there is no
value in individuals crafting large documents and others reading them if the information can be
contained in something far smaller. The rest of the document is considered waste.
ABC Analysis: Analysis of a range of items that have different levels of significance and
should be handled or controlled differently. It is a form of Pareto analysis in which the items (such
as activities, customers, documents, inventory items, sales territories) are grouped into three
categories (A, B, and C) in order of their estimated importance. 'A' items are very important, 'B'
items are important, 'C' items are marginally important.
Cycle Time: this is time required to complete a cycle of an operation. The cycle times of
interest are usually: the time taken to develop and release a new product, the time taken to make a
user story production ready; and the time taken to get a release of an application into a live
environment. Measuring and monitoring cycle times are key to driving the elimination of waste.
Five S’s: these are 5 terms that all begin with the letter ‘S’ that are intended to make your
work environment suitable for Lean. Japanese is origin, they are, with rough English translations
also starting with ‘S’ in brackets, Seiri (Sort), Seiton (Set in order), Seiso (Shine), Seiketso
(Standardize) and Shitsuke (Sustain).
Heijunka: creating a ‘level-scheduling’ system to cope with short-term variations while
planning for long-term demand
Jidoka (Automation): machines are given ‘human intelligence’ and are capable of
detecting and preventing defects. Machines stop automatically when defects are found, asking for
help. This concept was pioneered by Sakichi Toyoda with his automated looms.
v

Kaizen: literally translates to ‘continuous improvement’ in English. A business philosophy
of reducing continuous costs, reduce quality problems, and delivery times through rapid, team-
based improvement activity.
Kanban: translates to ‘card’ in English. These are used to create ‘pull’ systems by acting
as replenishment triggers to upstream process steps. It often uses a standard container with a card
attached that is pulled when the container is moved by the using work center. After removal the
card is used by the feeder work center as authorization for more production.
Milk-Run: The combination of shipments from multiple vendors in close geographic
proximity into one shipment received by the customer, normally done for a defined route on a
recurring basis.
Muda: translates to English as ‘waste’ and is defined as any activity that consumes
resources but adds no value.
Mura: a traditional Japanese term for unevenness and is often also translated as
inconsistency. An example is a variation in the pacing of an operation that involves the person
performing it to hurry to finish an operation and then wait.
Muri: Exertion, overworking (a person or machine), unreasonableness.
Pacemaker: a process point within the value stream that sets the pace for the entire stream
and maintains takt time.
Supermarket: a small storage area that often appears at the boundary of push and pull
systems that allows the amount of stock to be visually regulated, often using calculated minimum
and maximum levels. In a supermarket, a fixed amount of raw material, work in process, or
finished material is kept as a buffer to schedule variability or an incapable process. A supermarket
is typically located at the end of a production line (or the entrance of a U-shaped flow line).
vi

vii
Takt Time: the heartbeat of a lean system, this is used to set the rate of production to meet
the rate of customer demand. It is the available production time divided by the rate of customer
demand. If the customer wants 6 new online products released every 6 months then the takt time is
one month. If customer demand is 20 story points per iteration and the team operates for 10 days
within an iteration, then the takt time is 0.5 days.
Value: a capability provided to a customer at the right time at an appropriate price that is
defined by the customer.
Value-Add: a value-add process step is one that transforms or modifies the product in
such a way that a unit of value is added from the perspective of the customer.
Value Stream: the set of activities required to analyze, design and build a product from
concept to launch.
Value Stream Mapping: a tool used to identify all of the process steps within a value
stream for a given product. The value stream map can be used to identify process improvement
opportunities, for example by documenting instances where the time taken for value-add activities
can be reduced, non-value-add process steps can be minimized and waste can be eliminated.
WIP (Work In Progress): any work that is not completed but that has already incurred a capital cost to the organization.


Introduction
1. Introduction
1.1. The scope
The University of Aveiro, and more specifically, the Economics, Management and
Engineering Department, provided the Bologna Master in Industrial Management and
Engineering. In cooperation with this Master, Bosch Termotecnologia SA contributed to achieve
the practical studies.
The main purpose of this project is to develop a report based on scientific knowledge applied
to the business world. Through this point the student will apply scientific knowledge in a practical
case, showing the skills on research, analytical points, critical spirit and reasoning, of which the
climax will be reflected on the practical solving of a case.
With this work I intend to develop my own capacities in scientific investigation, and at the
same time apply them in industrial business. To accomplish the latter, this study will be focused
on subjects that surround the daily operations of which the main scope is working with suppliers
to get what the company needs to be productive and profitable. For that, the target of this thesis
will be the implementation of Pull Planning with suppliers to get the best results for the company
as quickly as possible.
1.2. The subject
A company that works in pull system should consequently extend it to the suppliers. Why is
this important? Assuming that a pull system is one of the great lean principles and that the
manufacturing system leads the company into producing what the customer wants, it’s very
important that the company’s suppliers work with the same standards and in the same scope. The
bridge between the company as customer and the supplier will be the way of ordering incoming
parts and raw materials. If a company works in a pull system delivering the final product to the
1-72

Pull Planning with suppliers
client just when it wants, then it must receive the material from its own suppliers when it needs it.
Thus, the importance of having the suppliers working according to pull plans is the right way to
walk through continuous improvement and adopting the lean principles in the value stream.
1.3. Report organization
As a starting point, the introductory chapter of this report is like a brief guide to the
following chapters’ development.
The second chapter is a literature review that includes a historical framing of pull and lean
systems followed by scientific and technologic analysis. It’s possible to acquire useful
information/knowledge for the core chapter comprehension, the case study, but also give us the
supplier relevance and how can we deal with them. Why should the pull aspects be implemented
by suppliers?
The third chapter is the case study where the core business and main target points of Bosch
Termotecnologia SA, from now on just called Bosch, will be described. The several efforts done
to accomplish the pull planning of suppliers will be focused, and the relationship with principal
suppliers too. Finally, the challenge that I’m proposing to have the pull planning working in one
of Bosch’s suppliers will be identified in this chapter.
Chapter four is the methodology part of this work where a schedule will represent the
evolution of practical steps that will lead to the fifth chapter, results discussion. Here I am going
step-by-step to show how to move in supplier house and how the pull system can be extended to
the supplier. A set of tools is used to obtain results and improvements and the main ones will be
explained. Some advantages and benefits are mentioned and a detailed analysis as a discussion of
results will be made throughout the fourth chapter.
Finally, the conclusion chapter is where I will verify if the main targets were or were not
reached, and if they really brought what I expected. This chapter also includes some points to
continue improving business with suppliers.
2 -72

Theoretical framing
2. Theoretical framing
2.1. Historical framing
Is it right saying that everything that leads to pull systems starts with the Toyota Production
System?
If you want to understand the Toyota Production System (TPS), it is important to appreciate
just how difficult it was to develop and manufacture the "perfect loom" (first branch of Toyota’s
business).
In 1945, Kiichiro Toyoda had challenged his company to "catch up with America".
Unfortunately, Toyota was quite far from that because it couldn’t adopt America’s production
model – mass production. America was producing thousand of similar parts (mass production) to
gain economies of scale. In Japan, Toyota just simply couldn’t have the same production model
for many reasons: scarce material resources, poor orders and unstable demand. Economies of
scale weren’t available for Toyota! Thus, rose the idea to have material/parts used on assembly
just before the assembly line. Parts should be made just before they are needed was Kiichiro
Toyoda's vision, or as we now call Just-in-Time, (Magee, 2008).
Taiichi Ohno was a machine shop manager who embraced Toyoda's vision and decided to
develop this challenge, thus giving the origin to the Toyota Production System. He flew to
America and studied Ford's production system and realized that they were still working in mass
production. Although Ohno learned an essential methodology in America, namely, the way of
American supermarkets handled inventory. From the idea of a supermarket to years of
experimentation, Ohno gradually developed the Toyota Production System, a process that he
considered never-ending.
Until the oil crisis of 1973 the Toyota Production System was ignored as companies were
growing swiftly and the sales were increasing. When the economy slowdown was triggered by the
oil crisis, Toyota emerged from this crisis quickly. Toyota was used to producing just what was
needed and had learned to optimize the processes. Other Japanese companies started to study the
3-72

Pull Planning with suppliers
TPS model and many of its features were adopted. Within a decade America and Europe began to
see serious competition from Japan.
The great basis of TPS is the total elimination of waste and two pillars support it:
• Just-in-time
• Automation with a human touch (automation) (Womack, 1991)
It is important to note that the concept of Just-in-Time was completely against the
conventional wisdom of that time. Although the resistance to Ohno's efforts was tremendous, he
succeeded and Just-in-Time is today regarded as a maxim. The JIT flow means the elimination of
general inventory, especially the stock in process. In other words, the right parts needed in
assembly would reach the assembly line at the time they are needed and only in the amount
needed, (Womack, 1991). The point is making everything in small batches with minimum
inventory levels. In order to do this it’s necessary to have flexibility on the machines (low
changeover) and perfect flow between the processes of the entire value stream. With automation,
also called Jidoka (glossary), it’s possible to detect anything that goes wrong on the machine and
consequently shut it down automatically. Having this kind of automation, Toyota could instantly
detect errors in production without using special operators to observe it. Another advantage was
zero inspection since the system was designed to be mistake-proof. So any mistake couldn’t reach
any further. On figure1 it’s possible to have an overview of the TPS model.
In 1990 the book “The Machine That Changed the World” brought a new concept for what
was previously called Just-in-Time or the Toyota Production System. Toyota's approach to
manufacturing would become known as Lean Production. And from then on this concept began
to gain power. Many companies attempted to adopt Lean Production, but it proved remarkably
difficult. Lean thinking has moved from manufacturing to other operational areas with diverse
scopes. Lean principles have also been extended to the supply chain, from product to supplier
development.
Lean manufacturing is today taken as a set of standards of efficiency and effectiveness. In
fact, using lean principles in manufacturing can bring a significant competitive advantage that can
be unbelievably difficult to copy.
4 -72

Theoretical framing
Toyota
Production System
Just
In
Time
Autono-mation
(Jidoka)
¥ LeanPrinciples
¥ 5S;
¥ TPM;
¥ 7 Wastes
Heijunka
Figure 1: TPS House.
2.2. Lean Tools – Pull System
When pull is mentioned there is another concept that is associated with it, i.e. the lean
process. Lean is used to describe a narrow set of tools, often restricted to production activities
rather than a higher-level way of thinking about value stream. The very first point of lean is that it
is a way of thinking, a philosophy. This type of thinking always starts with the desires of the
customers. As already stated in this report, the lean manufacturing was introduced by Toyota
Production System and it has been introduced to many big companies over the years. The concept
target is to reach a lean production or, in another words, to produce only what the customer needs.
For that, in general lines lean production:
• Stands for associates that think, decide and act in teams;
• Stands for efficiency increase by standardization and continuous improvement;
• Is a philosophy that leads to low waste processes in the company;
• Stands for delivery service, quality orientation and cost reduction;
• Looks at processes inside the company and out, including, the supply chain;
• Applies pull principles, especially by means of Just-in-Time delivery.
5-72

Pull Planning with suppliers
Lean manufacturing has several principles developed by TPS and by applying these
principles we can discover the problems/deviations, describe them, and figure out all root causes.
After that, we will be capable to gather, rate and select ideas to eliminate the root causes and
experiment with ideas and measures, which will be judged by their effectiveness. In case of
insufficient effectiveness we must go back and find out other rout causes and new measures until
effectiveness is achieved. In the end, it’s possible to implement improved procedures as the new
standard. With this circle the continuous improvement is always possible and the waste in the
systems can always be eliminated (Ohno, 1988).
Therefore, the first step of any lean thought process is to be crystal clear as to what the
customer really wants (Jones, 2003). To achieve this objective it is necessary to work in some
main processes and, generally, it’s a combination of results between different processes, for
instance, product development, order delivery, and price-cost relationships. If we gather these
processes with the following characteristics, then we are working according to lean philosophy:
• Valuable: the customer is willing to pay.
• Capable: reach good results every time.
• Available: operate whenever needed.
• Adequate: have the capacity to produce in continuous flow.
• Flexible: a range of products can be produced without batching and delays.
All these characteristics can only work together when they are linked by:
• Flow: this allows the good or service to proceed immediately from one step to the next
without stopping.
• Pull: to allow the downstream step to obtain just what it needs from the next upstream
step whenever continuous flow is interrupted.
• Levelling: to smooth the operation of the process while still addressing the needs of the
customer.
The actions above provide lean processes, however, they don’t happen accidentally. People
are needed and they are a crucial factor. To proceed in the lean thinking way it is necessary to
make someone responsible for each value stream, (www.lean.org, 2008). Only in this way we can
6 -72

Theoretical framing
create value for the customer and we are using the so-called deployment strategy. This strategy
frequently leads to improvement cycles for each process, embodying value stream maps many
times demonstrated by A3 analysis. A3 analysis is a very powerful tool used as the basis of many
projects.
We can define value as what is recognized by the customer and the value stream as the
process or the string of steps in which value is added by the company. The value stream stretches
all the way back through the suppliers and all the way forward to the customers,
(www.worthsolutions.com, 2008).
Approaching the subject of this report with lean thinking means that we should let the
customer “pull” the value. If the customer doesn’t want anything, why are we wasting resources
guessing what they might want? A good way to demonstrate the pull system is by observing how
a supermarket works, just like Ohno did. For example, a customer pulls a Super Bock tin from a
shelf that can be replenished from the warehouse in the back. The warehouse is replenished from a
regional distribution center and that center is replenished from the Unicer distributor.
In other words, when an order is received, the pull should trigger a specific shipping date to
satisfy the customer and then drive a production schedule to replenish the stock. This is working
backwards, starting the process according to the schedule and keeping the components and
assemblies moving down the value stream without delay.
The pull system is a simple visual method of automating stock replenishment of finished
goods, intermediate components and raw material. The aim of such a system is to achieve 100%
delivery performance in both quantity and timing. And for that reason the performance of
suppliers is critically important!
There are three basic types of pull systems in production: the consumption control or
supermarket; synchronous production (just in sequence); and a mixed pull system with elements
of the previous two combined. In trivial lines here are those definitions (www.sme.org, 2008).
Supermarket Pull System
The most basic and widespread type is known as a fill-up or replenishment pull. In a
supermarket pull system each process is a store, or a “supermarket”, that holds a specific amount
of each product it produces. Each process simply produces to replenish what is withdrawn from its
supermarket. In a Lean system we normally want to schedule production at one process. This
7-72

Pull Planning with suppliers
process is called the pacemaker and is normally towards the end of the line or, sometimes, at the
final assembly. The basic idea is that we schedule production at this pacemaker allowing it to then
“pull” material to it. With consumption control, the pacemaker is decoupled from the upstream
process by supermarkets. A key rule for selecting the pacemaker is that all processes after it must
“flow” to the customer. In a supermarket pull system the use of supermarkets prevents
overproduction of items by specifying the maximum number to hold.
Sequential Pull System
In a sequential pull system the right quantity is produced and delivered in the right order of
sequence and at the right time. JIS (just in sequence) can be used when there are too many part
numbers to hold inventory of each supermarket. In a sequential system, the scheduling department
must set the right mix and quantity of products to be produced. The pacemaker process on this
kind of system will set the production sequence.
Mixed Supermarket and Sequential Pull System
The supermarket and sequential pull system may be used together in a mixed system. A
mixed system can be appropriate when the 80/20 rules apply. The rule is based on the small
percentage (approximately 20%) of part numbers and the majority (approximately 80%) of daily
production volume. Often an analysis is performed to segment part numbers by volume, e.g. ABC
analysis (glossary). Such a mixed system can be applied selectively and the benefits of each one
are obtained, even in environments where the demand is complex and varied. With this system we
can easily produce “make-to-order” and “make-to-stock”.
In these three cases the important technical elements for systems to succeed are:
• Following the product in small batches and high frequency.
• Pacing the processes to Takt Time (glossary) to stop overproduction.
• Signalling replenishment via a Kanban (glossary) signal.
• Levelling (glossary) of production mix and quantity over time.
These four techniques are employed with the pull system and they lead to the true benefits of
this system.
8 -72

Theoretical framing
When a schedule/order is triggered with a pull system (supermarket or JIS), visual signals
are immediately used to indicate the need to withdraw a fixed quantity from stock or to produce a
fixed quantity. Having the minimum quantity or safety stock level to buffer any variation on the
process is the first step to setting a pull system. The second step is to calculate the replenishment
and/or the lead time for the product or component. Thirdly, fix the batch size that will determinate
the manufacturing stock level and the manufacturing lead time, (Liker, 2003). Finally, apply the
5S principles (Sort out, Sort in order, Shine, Standardize and Sustain) to visualize all of these
levels. 5S is a preventive tool of lean production that works to reduce the waste (less searching,
fewer mistakes and accidents, better use of space, etc.) and as a precursor to other tools (visual
inventory replenishment, standardized work, TPM (Total Preventive Maintenance), etc.).
Another element that is very important in the pull principle is the kanban. The kanban card is
used as a demand signal which immediately propagates through the supply chain. Taiichi Ohno
states that in order to be effective, kanban must strictly follow some rules of use:
• Process is triggered by consumption at the customer (fetch principle);
• Production only takes place if there is a kanban card in the quantity ordered and in the
sequence stipulated for kanban cards;
• Delivery is made only with kanban cards;
• No defective parts or parts without a kanban card are passed on;
• The number of kanban cards may not be changed arbitrarily;
• The number of kanban cards must be regularly checked.
A simple example of the kanban system implementation might be a "three-bin system"
for the supplied parts. One box on the factory shop floor, another box in the factory
supermarket, and one more box at the supplier’s supermarket. The bins/boxes usually have a
removable card that contains the product details and other relevant information – the kanban
card. When the box on the factory shop floor is empty, the box and kanban card are returned to
the factory supermarket. The factory supermarket then replaces the box on the factory shop
floor with a full box, which also contains a kanban card. The factory supermarket then contacts
the supplier supermarket and returns the empty box with its kanban card. Finally, the supplier
9-72

Pull Planning with suppliers
10 -72
delivers to the factory a full box and completes the final step of the system. Thus the process
will never run out of product and could be described as a loop, providing the exact amount of
inventory required. This scenario is reflected in figure 2. The kanban states how many parts
should be created and by when they must be available. The secret to have a “good” kanban
system depends on how many kanban cards are calculated for each product. To determine the
correct number of cards and the frequency of kanban withdrawals requires some analysis. The
Kanban formula is different from company to company. Most factories that use kanban have a
coloured board system – Heijunka Box, (glossary). In a few words, the Heijunka box is a box
with cells representing a specified duration. Each cell has a kanban card and all production
orders are set into the cells, according to scheduling. Figure 3.
Figure 2: Kanban approach.
QuickTime™ and a decompressor
are needed to see this picture.
QuickTime™ and a decompressor
are needed to see this picture.
1
1. The customer givesthe replanishmentorder of parts, whenthem start to beproduced.
1
1
4. The production of consumptionparts start through productionkanban.
Min.Max.
1
2. The transport kanban isreturned to the supplier
1
1
3. The request parts bytransport kanbam aretaken from thesupermarket.
5. The parts (type and quantity) requestedare forwarder until the customer gatherwith transport kanban.
1

Theoretical framing
The kanban formula is very helpful for the supermarkets to buffer the order fluctuations.
To achieve the flow described above it is necessary to have a good flow of material (like the
boxes) at the appropriate times or else the loop can’t run as planned. To achieve this, it’s
imperative to have internally a cyclical milk run (glossary) to give the material flow and
externally a milk run for incoming material, both working with as high a delivery frequency as
possible.
Figure 3: Heijunka Box and Kanban card (www.leaninstituut.nl, 2008).
Therefore, working with a pull system and extending it to the suppliers means that we are
helping them to improve and also bringing to the company:
• Cost reductions – stable ramp-ups, low investments and inventory reductions.
• Quality improvements – zero defects and mastered processes with low support costs.
• Delivery services – flexibility for fluctuation of quantity and product changes, and 100%
on-time delivery service.
11-72

Pull Planning with suppliers
2.3. Dealing with Suppliers
When lean production practices are implemented on the shop floor they have to be extended
to suppliers. The reason is that lean manufacturing does not work well with mass production, in
other words, a factory governed by pull systems doesn’t achieve the maximum potential if its
suppliers are producing enormous quantities for stock and sending the material not according to
pull schedules. Besides, if a supplier is working with mass production standards it won’t easily
accomplish waste reductions and, consequently, won’t have attractive figures for the company.
Toyota understood this sooner than other big companies and helped its suppliers to adopt the
TPS principles (www.informit.com, 2008). One of the TPS principles is “Respect your extended
network of partners and suppliers by challenging them and helping them to improve” (Womack,
1991) and this is what Toyota did. Toyota taught and still teaches their suppliers the Toyota way.
However, the suppliers must prove their commitment and reach the target: high performance
standards for quality, costs and delivery. So, the suppliers must learn how to work across company
boundaries to achieve the best interests for both companies. The interests must be aligned with the
best interests of the entire supply chain.
This concept is very important to a company once the suppliers become a part of the
extended family that grows and learns with the company. It’s necessary to understand this
importance and to start with new suppliers cautiously. Firstly, giving to them small orders and
after they prove honesty and commitment to high performance on quality levels, cost and
deliveries, it seems wise to increase the orders. However, not all suppliers can improve by
themselves. Supplier development program is considered a tool and technique that includes a
series of great targets and challenges to help them improve and develop respect among their peers
and other customers.
Supplier development programs have expanded from a quality focus to include more
technologically sophisticated issues. The real goal is to have companies working together in joint
cost-saving programs, cross-company brainstorming of problems, just-in-time inventory systems,
concurrent engineering, and other related concepts. Eventually, more responsibility is passed to
12 -72

Theoretical framing
the supplier. Partnering with the supplier creates an alliance in which all key suppliers and the
customer are working for the best total cost instead of the price for the supplier and customer
separately. To accomplish these terms, the company should send teams to their suppliers to help
them improve costs and efficiencies. On the other hand suppliers should do the same for their
customers. Customers and suppliers will work together to reduce defects, downtime, cycle time,
lead time, warehousing and obsolescence, etc.
One of the most important approaches is to have the suppliers work according to the
company production. A pull production system forces the suppliers, especially those which have
the largest volume of business or those who need help, to improve and from that obtain better
results for both companies. As previously mentioned, the lean manufacturing concept doesn’t
match well with mass production. So, to implement lean principles on suppliers we need to go
deep into suppliers’ processes and understand how can they work like us. Thus, the best way to
develop the supplier is to apply the Value Stream Method (mapping and design). The VSM is a
Lean process-mapping method for understanding the sequence of activities and information flows
used to produce a product or deliver a service. It’s a charting method that uses symbols, metrics,
and arrows to help visualize processes and track performance. This method helps to determine
which steps add value to the process and which do not. The VSM identifies, demonstrates and
decreases the waste in the process and is the starting point to help management, engineers,
suppliers and customers recognize waste and identify its causes (www.valuebased
management.net, 2008). It must be clearly stated that this process cannot be started in just one big
step. The company needs to do a selection from all suppliers to manage the integration of this
process into the supplier. To do this selection it is suggested to begin with a range selection that
will cross some supplier’s characteristics, like delivery frequencies, place distance, transport
routes and part numbers volume. Basically, a study of supplier characteristics and conditions that
will establish targets oriented toward each single supplier. Later, these targets will define clusters
of suppliers. This will be very useful to carry on all processed. By using the Value Stream Method
we are using a tool to graphically map and design material information flows in production and
logistics systems. To do that, the main procedure occurs at the supplier’s plant, starting at the
loading dock and ending at the receiving dock, combined with interviews as well as identification
of non-value-added activities, deviations of target concepts and lean principles. To proceed like
13-72

Pull Planning with suppliers
this it’s necessary to gather supplier data, such as production data, inventory levels, cycle times,
delivery frequencies, stock in supply chain (in warehouse and in process), quality data, etc. Once
we have a team working at the supplier’s plant the very next step is mapping how the actual
production and logistics system will work. Consequently, waste becomes transparent and
violations of lean principles and deviations from target concepts are identified. To understand how
the plant currently works is necessary:
• Follow the flow from dock to dock;
• Always go in the opposite direction of the material stream (e.g. from dispatch to
incoming goods);
• Draw material and information streams with standardized symbols (VSD and lean
symbols);
• Record actual process data (not standard times, but the instantaneous time!);
• For new products it helps to analyze a similar value stream;
• Drawing of the actual state forms the basis for the next step (Target State).
Therefore, after the drawing and comprehension of the current status we need to move
forward with the drawing of the target state. That means drafting an improved customer-oriented
value stream. Besides, for the implementation of lean principles there are seven steps to consider:
• Take customer cycle into account;
• Introduce continuous flow;
• Introduce supermarket pull systems where the continuous flow is not possible;
• Only plan one point (pacemaker process);
• Small lot production and reconciliation with pacemaker process;
• Decide whether to produce directly to dispatch or via supermarket;
• Stock issue linked to cycle in the pacemaker process.
Another element to be regarded in the pull system that isn’t a manufacturing one, but fits
perfectly in the pull definition is the External Milk Run (EMR). A Milk Run (MR) is a cycle
method of providing materials to production at the consumption location, (Ohno, 1988):
• At the right time;
14 -72

Theoretical framing
15-72
• In the right quantity and quality;
• At the right place.
The MR not only provides materials as finished goods/empties, it also, relays information
between processes. Two possible ways of milk run have been defined, internal and external. The
external milk run can be another challenge once can be included in the same route that several
suppliers have even better results. The EMR can be delineated by company, if the latter has
sufficient know-how in this issue, or by a Logistics Service Supplier (LSP). The LSP can manage
supermarkets, inventories, clients and channels. In this case, the idea is to have flexibility, speed
and efficiency in the deliveries from a set of suppliers with a high frequency.
Working with the philosophy of lean production we are producing only what the customer
requires. Dealing with suppliers applying a pull plan, on a day-to-day basis, receiving the material
“just-in-time” and just what it needs to produce is so crucial for the company. And thus, an
understanding of the information flow between both sides is important too. Working with a
supplier to open its horizons, helping it to catch up to the customer rhythm and implementing an
order pull planning is my objective at the end of this report.


Case Study
3. Case Study
3.1. Bosch Vision
Once BOSCH Termotecnologia SA embraces the case study, I would like to give it a little
introduction. Bosch is a Group Bosch company with a production plant in Aveiro, Portugal.
Throughout all of Group Bosch, Bosch is a part of Thermotecnology division and produces water
heaters, boilers, solar collectors and absorbers. It is considered the competence center for water
heating technologies and retains the development of all Group Bosch brands of water heaters for
the entire world. It is the leader the European market and operates in 60 countries throughout the
world, from USA to Africa and China. Bosch has a range of 1,000 to 1,200 employees, of which
approximately 250 employees make up the specialist list of staff. Bosch has a production capacity
of 1,500,000 water heaters and 100,000 boilers annually, having productive cells and lines
dedicated to them and working in two shifts. Since some products are seasonal, in the rush period
Bosch works with three shifts. The solar area has been growing since 2007 and is one of the main
investment areas of Bosch. The total sales volume is nearly 200 millions of euros per year.
The suppliers are mainly Portuguese (approximately 70%), and the others parts of Europe
(Spain, Italy, Germany, etc.) and Asia (primarily China).
In 2007 Bosch received the “Best Company in the Sector” award by Exame magazine.
Bosch is formed by a dense and varied group of departments such as R&D, Quality,
Purchasing, Logistics and Production. Beyond these principal departments Bosch founded a
department dedicated just to lean manufacturing, which is the basis of the Bosch Production
System – BPS. Like Toyota with TPS or Ford with FPS, the lean production system was
introduced in Group Bosch in 2002 and is called Bosch Production System.
The lean production in Bosch has eight principles:
• Pull System: only produce based on real customer demand.
• Process Orientation: design, control and improve procedures and holistic processes.
17-72

Pull Planning with suppliers
• Perfect Quality: avoid failures through preventive action to deliver perfect quality to the
customer.
• Flexibility: flexibility regarding volumes, product variations and product generations.
• Standardization: realization of “Best in Class” standards.
• Waste Elimination and Continuous Improvement: there’s nothing that can’t be improved
any further.
• Transparency: business processes and manufacturing procedures are self-explanatory.
Deviations become immediately visible.
• Associate Involvement and Empowerment: clear assignment of responsibility and
competence to the process level.
From 2002 to 2007 Bosch reduced the total inventory coverage from 42 days to 23 days
(45% reduction); zero-mileage-defects (ppm) from 40 to 15 (62% reduction) and productivity
from 6.0% to 12,5% (a 48% increase).
The company vision for 2010, in terms of BPS strategy, is to be a world-class company, for
which the main strategic points are:
• Pull System from the customer to the supplier.
• Emphasis on Continuous Improvement (CI).
• Continuous associate development.
• Integrate BPS suppliers’ development.
To reach these points there are many projects associated. All of these projects are
distinguished in three areas: supplier, production and customer. In other words, source, make and
delivery. These are the principal areas in which we can divide the core business. Therefore, some
of these projects are:
Source:
• Quality Improvement
• BPS in the supplier
• Milk Run with local suppliers
• Pull planning with majority part of suppliers
• Inventory coverage reduction
18-72

Case Study
Make:
• Lean Line Design for all assembly lines
• Point CIP
• TPM and 5S
Delivery:
• Pull system – customer consumption
• Levelling of customer demands
• Stock transparency
3.2. Source strategies
Making part of source strategy projects are two points that are the triggers of pull planning
with suppliers: pull planning with suppliers (BPS principle) and inventory coverage reduction. As
a result, many projects were defined to implement these measures with suppliers. Bosch has been
working closely with the suppliers and has currently several teams working with key suppliers.
Unfortunately, not all suppliers can be selected for these kind of measures, at least until now.
Firstly, Bosch is working with suppliers in which is has the most trust and those in which
improvements are expected to be significant. Bosch always pays attention to the cost-quality-
delivery relationship when it is doing a contract with a supplier. Due to the complexity of Bosch’s
final products, the suppliers are divided into material types, from copper and cardboard box as raw
material suppliers, to turnery or electronic suppliers. Through this differentiation the key suppliers
aren’t selected by the material type, but are being taken into consideration for many other
characteristics, like the part number (material) cost per piece, the volume consumed per day, and
the potential damage of these parts in case of rupture. Having this selection, Bosch selected teams
from key areas like Purchasing, Logistics and BPS to interact directly with suppliers and help
them improve. The source strategies projects in bold on the previous page are interlinked
whenever these supplier development teams are working with suppliers. The scope is detecting in
the key suppliers their weaknesses according to BPS principles and showing them where they can
19-72

Pull Planning with suppliers
20-72
intervene to become better. Showing that and explaining how both could work in pull scheduling,
ordering in higher frequency and deliver, but in fewer quantities, will certainly have impacts on
inventory reduction projects. Despite the differentiation between source projects, they are quite
interconnected.
3.3. The objective
The aim of this work is to gather suppliers, analyse their characteristics and decide in which
way the pull planning should be implemented as soon as possible. The challenge that I’m
proposing is to apply the pull planning with the one of the largest Spanish suppliers. The supplier
will be called COS supplier and the scope is the implementation of pull planning system based on
daily deliveries. Besides, Bosch expects to achieve inventory coverage reduction. Adding to this,
there will be given the opportunity to the supplier to know its weaknesses, to be provided with
tools and/or advices to increase the productivity and value of its company.

Methodology
4. Methodology
When I first introduced the theme of this thesis I intended to follow a certain timetable that I
had estimated to accomplish along the journey.
On the timetable below, table 1, there’s a description of all relevant steps done to implement
the source project identified in the previous chapter. On figure 4 there is the schedule map
overview.
Table 1: Schedule plan definition.
Looking to the steps description we can figure out that there are some steps that are more
important and decisive than others. For example, step 1 is the very first point and the first one that
can compromise the entire plan. Supplier selection is essential, once the company has decided to
start with suppliers that could bring more profit in a short term. From the range of eleven suppliers
21-72

Pull Planning with suppliers
that I’m responsible for, I decided to start with one. In this case, the decision was not so complex,
due to the discrepancy between the suppliers’ data. From all of them, this one is the supplier that
had voluminous quantities and which volume represented in stock coverage of more than 120,000
euros per month. Another decision point was the distance factor. Suppliers that have distance time
greater than eight hours can’t have daily deliveries. It’s spatially impossible! Although this doesn’t
mean that we can’t have daily deliveries with those suppliers.
After having the key supplier selected there was the need to introduce the pull planning
concept to the supplier and organize a three-day workshop to focus on the supplier’s figures. This
is in fact the most important step from table 1. From the workshop outcome will emerge the
supplier problems, the corrective actions and the implementation schedule that will limit the entire
project. From then on, the work becomes more visible and the results begin to appear.
N¼. Nov-07 Dec-07 Jan-08 Feb-08 Mar-08 Apr-08 May-08 Jun-08 08-Jul Aug-08 Sep-08 Oct-08 ...
1
2
3
4
5
6
7
8
9
10
11
12
13
14
15
Figure 4: Schedule map
The next chapter, Discussion Results, demonstrates the major part of the table 1 steps. Once
the supplier selection was done, this stage won’t appear, only the supplier information. The
workshop at supplier’s plant is the most evidenced, because both teams will be together, building
22-72

Methodology
23-72
the supplier’s Value Stream Mapping, discussing the problems and deciding the actions that should
be implemented.
Some BPS principles were discussed with the supplier and planned to be implemented.
Corrective actions, as already said were defined and those that Bosch’s team mainly managed will
have from now on a special headline.


Discussion Results
5. Discussion Results
5.1. Methodology balance
Following the schedule of figure 4 in some points, especially the agreement points, took
much more time than was foreseen. Some disagreement on parts price were on the list, but were
handled by the purchasing department, even as one of the last agreed points.
Another delay is about the thesis theme. The main reason for that was the uncertainty will to
define the central subject. Deciding a way to gather the Pull system information and at the same
time all the ideas of JIT and lean principles was very difficult for me. Finally, working in Bosch’s
projects, specifically on the described one, I have realized that talking about pull planning with the
suppliers would express the fusion between:
• A pull system extended to the whole supply chain, and
• A way to have the incoming material just when it is needed (JIT).
5.2. Results of the workshop with the supplier
Despite the real case study in one Bosch supplier, for confidential reasons some figures,
details and names won’t be written down. After the supplier’s selection follows the workshop’s
main entities:
• Supplier – COS supplier
• Customer – Bosch
• Place – COS plant, Spain
• Subject – Value Stream Method workshop
25-72

Pull Planning with suppliers
Since we will work directly at the supplier’s plant it is very important to draw the current
state of its value stream. In this way, the following steps will guide and lead us through the
supplier value stream until we understand the full COS scenario and its problems. Through
Value Stream Mapping you will have the opportunity to:
• Align COS business to Bosch demands;
• Reduce COS lead times;
• Increase COS value adding time;
• Reduce cost for both companies.
5.2.1. Step One – Record Customer information
Should we start a pull system analysis with all part numbers?
The answer is no. To draw the Value Stream we need to focus on a small range of part
numbers, but that range should be represented for the whole supply chain. These parts should
cross as many processes as possible to give us the maximum information as possible and should
have an important weight in supplier production. COS supplier has more than 180 active part
numbers, and the part number choice was based on the quantity average ordered from Bosch to
COS, number of processes that the part number enters, and the determination of Takt Time. The
first selection was made and three part numbers were chosen. From that range should be elected
only a part to be used on the VSM.
First part selection:
• 8-703-404-212
• 8-708-502-036
• 8-700-305-178
Thus, with these parts we needed to settle the volume, delivery frequency, quality data and
all the information that we can get – table 2.
26-72

Discussion Results
Table 2: Supplier and customer information.
With this information we have the potential part number for the VSM. Finally, to choose
one it will be necessary to calculate the Takt Time.
5.2.2. Steps Two and Tree – Plant tour to identify and map the main processes and Draw material flow
The idea is to go backward from the customer order (Bosch) process until the sub-supplier
raw material delivery, and record clearly the identification of processes. All the material flow and
the existence of inventory between processes, eventual scrap, working machines, operators per
shift and all that we can consider relevant for the actual status should also be identified. Before we
put down the draw structure, the first point to start the calculation of Takt Time (TT) for the above
part number selection. The TT is used to synchronize supplier and customer rhythm and describes
the frequency demand from the customer. The formula is described in figure 5.
Pieces/Day
MinMax
Customer Takt Time = Working secs per year
Demand per year
Figure 5: Takt Time formula compared to tachometer.
TT(#212) = 208x16x3600 = 13.5 secs/pc 888,100
TT(#036) = 27.7 secs/pc
TT(#178) = 107.6 secs/pc
27-72

Pull Planning with suppliers
The working seconds per year were determined considering two shifts per day with eight
hours each covering 208 days. Having the value for the previous three part numbers we can
choose the part number that will be used on the VSM. The chosen part number will be the one
with lowest Takt Time value, since it represents the shortest order frequency that COS needs to
deliver the material to its customer (Bosch). After that, it’s necessary to walk in the field,
checking the stream processes and describing them just like a picture. On figure 7 it’s possible to
see the first draft of the VSM from COS. At the same time that we are doing this analysis we can
move to the drawing of the material flow (structure) – step three. At this step we are
complementing the scenario at the customer’s plant. We identified several processes at production
(step 2) and now we need to link them. These process links can be push, pull, FIFO, etc. As we
can see in figure 6 the material flow between the processes is already defined. The processes are
almost in push flow ( ) and only one, the order preparation step, is in pull flow ( ). In
another sense, just as Bosch makes the order, COS acts in a way to prepare the material. All
manufacturing processes are made without having taken those orders into account.
Part number: #212Demand: 888 100 pc/yCustomer takt time: 13,5ÔÔCurrent quality: 126 ppm
!
Sub-supplier
Boschplant
! ! !!
high baywarehouse
!Cross dock
high baywarehouse
CustomerInformation
TurningOperation
COS
!
SauringOperation
CleaningOperation
! !
OrderPreparation
1 x week
1 x weekPackagingOperation
Figure 6: VSM – Steps 2 & 3
28-72
Discussion Results
5.2.3. Steps Four and Five – Determine and fill in data and key figures regarding the material flow and plant tour to identify and map the main process
To add this step we need to calculate some data for each process (cycle time, process time,
set-up time, lot size, stocks, Work-In-Process (WIP) stock, Overall Equipment Effectiveness
(OEE), working hours/shift models, scraps/rework, Change Over Time (COT). Following is
some of the most important:
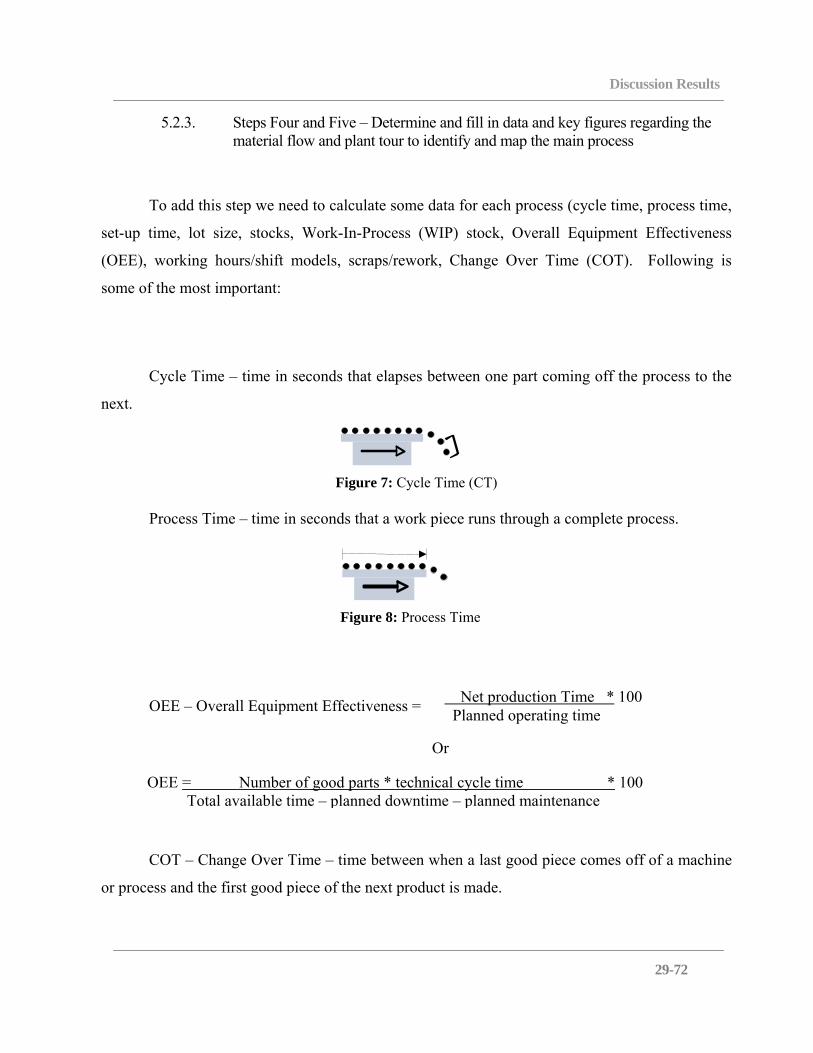
Cycle Time – time in seconds that elapses between one part coming off the process to the
next.
Figure 7: Cycle Time (CT)
Process Time – time in seconds that a work piece runs through a complete process.
Figure 8: Process Time
Net production Time *OEE – Overall Equipment Effectiveness = 100 Planned operating time
Or
OEE = Number of good parts * technical cycle time * 100 Total available time – planned downtime – planned maintenance
COT – Change Over Time – time between when a last good piece comes off of a machine
or process and the first good piece of the next product is made.
29-72

Pull Planning with suppliers
Set-up Time - total time required to change settings and tooling from one production run to
another. Minimizing set-up time is a key factor in reducing lot sizes and thus lead times.
Lot Size – quantity defined to produce items to order or to stock.
WIP - material that has been partially processed but not yet transformed into its final state
and not normally usable as is.
With the calculus above we can fulfill the data field of Process Box – step 5 and complete
more data on VSM, figure 9. Some values, like, COT or OEE were provided by COS production
department.
Figure 9: VSM with process boxes fulfilled.
With this step completed we can start looking at the value stream with a global vision. We
can find all the stock, since warehouse to stock in process, between the processes. The cycle
times of each process and number of parts or operators per process is also identified.
30-72

Discussion Results
5.2.4. Step Six – Calculate the throughput times and value information flow
The Throughput Time, figure 10, is the time to run a work piece all the way through the
value stream. In theory it can be considered as the rate at which a system generates money.
Figure 10: Throughput Time
To have a calculated example, the throughput time for the starting point at a sub-supplier
is:
Throughput Time = TT x QTstock = 13.5secs/pcs x 33,000 pcs = 445,500 secs
= 445,500sec = 7.7 days 16 h x 3600 secs
So, 7.7 days is needed to convert the stock into “money”, i.e., into final product ready to
be sold. The sum of throughput time will give us the production lead time for the part number in
our analysis. Basically, it will be the time that it takes the part number for move all the way
through a process or value stream. The sum of all process times will demonstrate the value added
time. This is the time that actually adds value to the part number’s journey. As we can see in
figure 11, under each process is the lead time for that process (throughput time) and the associated
process time.
Analyzing the VSM of figure 11 we can see that the supplier has 54 days to produce a
complete piece of part number #212. Although it only needs 15.68 seconds to produce a entire
piece of part number #212, everything else is waste!
31-72

Pull Planning with suppliers
Figure 11: VSM with the Throughput and process time defined
5.2.5. Step Seven – Calculate highlight and describe violation of lean principles and deviations from target concepts.
At this step we will assess the VSM with the purpose of finding all the violations that we
detected on throughout the value stream and then for each we will try to find the idea or action for
future improvements. So, first, we identify the problems and then we trace the improving actions
and create an implementation plan for them. In the future, these actions could also be measured
and new improvement actions can replace them.
32-72

Discussion Results
Figure 12: VSM identifying the lean violations
We call these red flashes Kaizen-Flashes and in COS value stream mapping we detected
twelve of them. For each problem identified the correspondent corrective action was determined
and, in the end, it was decided to implement them. In the table 3 it’s possible to see the twelve
main problems that are contrary to BPS principles and the correspondent corrective actions. All of
these points were properly discussed amongst the entire team. And using Bosch knowledge from
previous experiences and COS experience in its manufacturing processes, the corrective actions
were settled in common agreement.
33-72

Pull Planning with suppliers
Table 3: 12 violations and the corresponding corrective actions
Start with daily deliveries
Improve dispatch process
Reduce the intermediates stock
Economical study for set-up time reduction
Change to standard boxes
Problems
Increase the orders per week with sub-supplier
Reduce the minimum batch size
1 Long change over time (COT = 15h)
Actions
Stabilize and decrease the COT
Pull System
Production plan based on customer consumption (supermarkets dimensioning)
5S implementation
Implementation of one communications corner (customers; quality complains; overall efficiency)
6 Waste (movements in cleaning area)
2
3
4
5
Push System
Production planning based on forecast
Minimum orders with sub supplier
Large batch size
7 Communication strategy
8 Low packaging operation
9 High coverage (54 days)
12 Low delivery frequency
10 Hight set-up
11 Transportation MUDAS
As a customer, Bosch will mainly intervene in those actions that are essentially depending
on it. Shown it bold on table 3 there are the actions that Bosch will lead and thus will be those that
I will focus on.
How can we treat the selected actions? What is the plan?
The first step is deciding an implementation plan with time limits. This plan will help us to
follow the actions, checking the status and controlling them. Below, in table 4, there’s the
implementation plan, defined in months. Once again, this implementation plan has only the
actions that Bosch team has responsibilities for (partial or total). The other actions will be done by
the COS team and for that reason will not be identified here as results.
34-72

Discussion Results
Table 4: Implementation Plan
The M0 is the first month (February) of implementations and was considered to be the
same month as the VSM workshop. The target is having all the action implemented sixth months
after the project initiation. The workshop took place in February 4th to 6th and the results should
begin to appear until the end of first semester, to have quite significant improvements until the end
of current year.
Despite the implementation action steps, the numbers of table 4 don’t correspond to the
number of problems/actions of table 3, rather they are sorted by the same order, following the
same sequence.
5.3. Running the implementation actions
After the workshop to assure the evolution and completion of corrective actions, very
useful follow-up meetings were held. Looking to the table 4, the point that stands out immediately
35-72

Pull Planning with suppliers
is the transition from weekly deliveries to daily deliveries. In fact, this is the highlight and the
greatest point from the implementation actions.
Starting with the implementation action number 1 is necessary to revise and redefine the
minimum batch size for COS part numbers.
Which kind of parts numbers should be in a Pull system plan?
At the beginning and once the supplier will be in the ramp-up phase, a percentage of errors
can be expected to occur. To avoid critical issues, some preventive actions can be done. A part
number selection could be a good preventive action until we completely trust in the supplier’s new
system. This selection can be done based on parts with regular consumption (weekly basis). This
means parts don’t suffer big fluctuations week by week and the daily orders will be quite regular.
So, if a range of a part number has insignificant variations among the weeks, approximately 20%
to 30% of variation, they will fit perfectly in the pull system with the supplier in the ramp-up
phase. Over time, we can always the number the number of parts on the pull list. That is just a
question of SAP parameters definition.
Thus, Bosch selects these part numbers based on historical consumption and six weeks
forecast. This list has in fact almost all of the parts that we order from COS. Part of this selection
can be seen in the appendix. There is a table with some parts and the respective consumption
pattern. Only a small amount will be ordered under the old conditions, i.e., weekly. Nevertheless,
the improvement will be general.
The next step will be the definition of a minimum quantity per batch size. This is a very
important step because this quantity definition will be the minimum quantity that Bosch will order
and consequently it will restrict the order to those quantities even when the needed quantity is
less. We can start to propose these quantities or wait for the COS proposal. Bosch received from
COS a list with all parts that were selected for “pull” – daily deliveries, and was analysing for
each one if those quantities were reasonable or not for our needs.
How can we do it? To answer this question I will need to bring up one subject that is the
pacemaker of consumption replenishment that will define what we will order from the supplier.
This subject is the Maximum Stock Level definition. And what is that MSL?
36-72

Discussion Results
MSL = (Total Lead Time + Safety Stock) * Daily consumption
Total Lead Time = LTplan_freq. + LTsup. + LTtransp. + LTrecep. + LTcontrol
Daily consumption = Higher value from Cweek or Cweek+1 / Nº workdays
LTplan_freq.: planning frequency;
LTsup.: supplier process;
LTtransp.: transport;
LTrecep.: reception;
LTcontrol: quality control.
The MSL is a formula that reflects the stock quantity that Bosch should order for a part
number. That quantity is calculated according to the total lead time of a process (from the supplier
to the customer) plus safety stock (if necessary), multiplied by the daily consumption. Looking at
this in a practical way I’ll use the part number #212 the VSM example.
Table 5: Part number daily consumption and several lead-times.
The daily consumption is an average of the weekly consumption. In the table 5 we can see
the current week consumption (Week 0) and the following week consumption (Week 1).
37-72

Pull Planning with suppliers
Considering the highest consumption from both weeks and dividing those quantities by five
working days, we will find the daily consumption.
Table 6: Part numbers consumption of two weeks.
Why do we pick the highest week consumption? We should choose that amount because if
we will consider the lower one we could encounter stock rupture, especially if we have a
consumption peak day.
Having this explained we can finally define the MSL value for these part numbers:
MSL #212 = (1+1+2+1+1+0) x 2823 = 16 938 units
So, where will the Maximum Stock Level be used? The MSL will be used as a parameter
in the SAP system to automatically generate the daily orders to COS. Setting the SAP parameters
is one of the actions that must be done for the introduction of daily orders and daily deliveries
based on consumption (pull). Each part number created and allocated to one contract (supplier
contract) has a master datasheet that defines the part number characteristics, like an ID. That
master data is accessible through a SAP transaction called Material Master. There we can
introduce and define some part number characteristics. One is the MRP (Material Requirements
Planning) type where we can define if the part is in pull or not. Therefore, the list of part numbers
that we want to integrate as pull (based on real consumption) will be defined in that way on the
Material Master. Doing this requires that we introduce the value of MSL into the SAP system.
This value will be the part number stock quantity target. Every time that the stock quantity of one
part is under this value an order will be triggered.
Table 7 demonstrates how pull planning works. We have the working days, the stock at the
warehouse on the first day, and all the needs for this week. I would like to point out that this
38-72

Discussion Results
scenario cannot be considered as static, but dynamic. Lets approach it with just two days of fixed
needs. For example, on Monday I know that my real need is 2,800 units and for the following two
days, Tuesday is 2,600 and Wednesday 2,900. Only on Tuesday will we know for sure that the
quantity needed for Thursday will be 3,000 units, and so on. We have three weeks represented and
the MSL is automatically recalculated each week, being adjusted to the current needs. This is a
settled point since there are weekly fluctuations.
Table 7: Pull planning scenario
Thus, assuming that we have the MSL quantity of 16,938 units for the Week 1 and in rows
1 through 15 we have the daily consumption, how will the pull plan flow? Firstly, what the SAP
system will do is to check every day if the warehouse stock is under the MSL quantity. Analyzing
again the example of table 7, on Monday (row 1) we start with 16,938 units in stock and during
the day we consume 2,800 units of part #212. So, in the first day no order will be triggered since
the stock is equal to the MSL. However, in the following day, Tuesday, the stock is 14,138 units
because we used 2,800 units of day before. The SAP system will compare both values again (MSL
and potential stock) and because the quantities are different, an order will be triggered. This order
will be the difference between MSL and the potential stock that is exactly the quantity of the day
39-72

Pull Planning with suppliers
before consumption. On the third day, Wednesday, we will have the same situation, having only
the information that the potential stock will be the supermarket stock plus the transit stock
(previous day’s order of 2,800 units). On Thursday, the reasoning is the same and finally on
Friday, the first order of 2,800 units will arrive at the warehouse. The MSL and potential stock are
again compared and a new order will be triggered once again. On Monday of Week 2, the MSL is
adjusted and the order planning will take that into account. As we can see on rows 6 and 12, the
order won’t be exactly the previous day before. This is a result of the MSL change. Following the
warehouse stock we will figure out that they suffer a tendency to a stock level and this level is
almost close to 5,500 units at Bosch’s warehouse.
However, this scenario has a “but”. The reasoning above has been considering unit orders
and not orders based on batch size quantities. And it’s now that the definition of batch size should
enter and the implementation action number 1.1 (agreement of the minimum lot size) is settled.
Table 8: Minimum batch size proposals
Fortunately, after a discussion of which batch size proposals both companies should
accept, it was decided to consider the major part of batch size proposed by Bosch. There was a
small percentage (8%) of part numbers whose batch size was kept equal to the COS proposal. So,
if we take a step back to the consumption scenario of part #212 in table 7, the quantity ordered
should be a multiple of the batch as demonstrated in table 9.
40-72

Discussion Results
Table 9: New pull planning scenario respecting the batch size
Once again it’s explicit that there is a trend in the stock. The stock remains in a range level
that permits stock reduction coverage. The MSL is dynamic and responds to rise and fall of
consumption needs. And that’s why it’s such a powerful tool.
The next step is the implementation of action number 3 that considers the reusable boxes
(standard boxes from Bosch). There are different types of reusable boxes, but for transportation
purposes and pallet dimensions the KP type (30x40x12 cm) was selected, figure 13.
Figure 13: KP Box
To define the quantity per box it is essential to know how many bags (1bag = 1 batch size)
could fit into the KP box without exceeding the limit of 15 kilograms. This weight restriction is
due to handling reasons, since it is very hard for an operator to manage the handling movements
above this weight. A list with maximum quantity of units per box was sent to the COS supplier
and was accepted. A KP box could have only one bag with batch size or in maximum it could
have more than that, but always staying below the weight limit. In table 10 we have the maximum
41-72

Pull Planning with suppliers
quantity per box. Thus, at the most one KP box could bring two bags of the batch size (500 units).
For example, if the Bosch order is 500 units of part #212, COS just needs to send one bag in KP
box. However, if Bosch orders 3,000 units, COS should send three KP boxes with 1,000 units
inside each one.
Table 10: Definition of minimum quantity per KP box
Having defined the maximum quantity per KP box, it is necessary to define the total
number of boxes needed for the rotation flow. To calculate the daily coverage of boxes the same
reasoning is followed. Next there’s the calculation of the lead time and the average quantity used
per day.
Total Lead Time = LTplan_freq. + LTsup. + LTtransp. + LTrecep. + LTcontrol
However, the LTplan_freq., LTrecep. and LTcontrol should be equal to zero days. So, the
Total LT = 0 + 2 + 4 + 0 = 6 days. For safety stock we will consider an extra 3 days. To box
coverage we will need 9 days. The determination of total coverage will be based on the daily
consumption. For example, the daily consumption of part #212 is 2,833 units. Considering the
batch size, the quantity will be 3,000 units per day. Thus, the coverage will be:
Coverage #212 = 9 days x 3 box/day = 18 boxes available for this reference.
Total parts coverage = Σ Coverage of each part number
To have these boxes available there are costs involved. This kind of box can be expensive,
but on the other hand, Bosch could reduce the price of part numbers if COS doesn’t have the
packing costs. This point was one of the ones took more time to get an agreement between the
COS and Bosch purchasing departments. Another benefit is the fact that with KP boxes, the
material won’t need to be re-packed. Receiving the parts like this, the warehouse doesn’t have the
42-72

Discussion Results
extra work of transferring the material from the supplier’s packaging into Bosch standard boxes
(including KP boxes) and will save handling time. The material also flows directly to the
production floor in these boxes creating a normalized supply.
Finally, with those steps defined (batch size, SAP parameters, maximum quantity per box
and tools to implement them) it’s possible to plan daily transport definitions. Until now, we have
assumed working on a daily basis with COS, but without having this flow yet defined.
When daily transport is mentioned, we can easily think that daily transport will mean a
cost increase. And up to a certain point that’s true, increasing from a weekly delivery to a daily
delivery will increase the transportation costs. Therefore, how can Bosch use that daily
transportation flow as a profitable point? The answer is to combine more suppliers together with
daily deliveries. It must be clear that, when Bosch thought in this approach with COS supplier,
other local Spanish suppliers were in the same position and this kind of analysis was made with
them too. As already mentioned previously, Bosch has more teams working with other key
suppliers. Thus, having daily deliveries, which at the beginning could seem to require an extra
cost, is in fact, seen as the best way to reduce costs, especially the inventory coverage cost. Big
inventory coverage is one of the principal wastes that many companies have and is not very
simple to eliminate. Having as many suppliers as possible working in pull systems, delivering the
proper quantities in the minimum time, contributes considerably to the reduction of inventory
coverage. The reduction of inventory coverage is one of the main targets for Bosch and is
measured every month as a key indicator.
To have a daily transportation, which Bosch calls the External Milk Run, it’s necessary to
define routes. To do that, Bosch opted to contract a trustful forwarder that has been working with
Bosch as the responsible for the daily deliveries to Bosch. In Spain, in the Basque Country, there’s
a cross-dock at Vitoria town, where every day a truck passes in a number of Basque suppliers
loading the material ordered on the day before and every day from cross-dock to Aveiro a truck
leaves with that material. The route works in both directions since it has to transport the reusable
boxes (Aveiro-Vitoria) and the incoming material (Vitoria-Aveiro). It is important to say that the
material and transport responsible for Bosch is in charge only from the cross-dock. Even though
43-72

Pull Planning with suppliers
the forwarder is the same, the path between the cross-dock and the supplier and vice-versa is from
the supplier’s charge. So, Bosch calls this daily route transportation the Spain External Milk-Run,
since the distance is less than eight hours. Besides this Milk-Run route, Bosch has four other
implemented daily routes in Portugal. In all of them, the suppliers are working at the same level,
figure 14.
Supplier 1
BOSCH
Supplier 2Supplier 3
Supplier 4
Supplier 5Supplier 6
Supplier 7
Route 1
Route n
Figure 14: External Milk Run
With daily deliveries Bosch started to measure the service level that COS provides. The
idea is to have a deliveries accomplishment control and an assessment tool to measure it. Every
week the material planner uses an SAP transaction that allows him to calculate the
accomplishment of the daily schedule. This tool is a great help to analyze if the supplier is doing a
good job to reach the project target.
Doing a consolidation of the previous implemented points, the pull planning flow
represented in figure 15 shows the interaction between the key value stream elements. The
44-72

Discussion Results
45-72
Supplier 1
Supplier 2
Supplier 3
Supplier 4
Monthlycapacity plan
SalesForecast
ÒPull PlanningÓSAP
Warehouse
Supermarket
Consumption
Consumption
scenario includes the pull daily plan to suppliers as SAP orders, the main target of the source
project, and shows how the information flows around Bosch’s value stream.
Figure 15: Pull Planning Flow
Explaining figure 15 we have the suppliers in Pull Planning receive every month, a six
months forecast based on sales forecast and with the SAP system the plans are sent every day as a
response to the previous day’s consumption. The suppliers that are still working on a weekly or
monthly basis will have order made according to weekly or monthly consumption.
5.4. Final Results
To review the pull activities in a supply chain is necessary to help the supplier figure out
its deficiencies and enable it to adopt a pull system and BPS principles. This means that the
implementation of a pull system with suppliers can guarantee the material availability always as
necessary, not only without increasing inventory, but actually decreasing it.

Pull Planning with suppliers
5.4.1. In Customer - Bosch
Mentioning an economical study, with the introduction of pull planning with COS
supplier, Bosch has the following savings and costs:
Savings:
• Supplier costs per piece;
• Supermarket handling;
• Inventory stock.
Costs:
• Reusable boxes;
• Daily transport.
To provide a general idea of the values involved, an analysis follows in table 11 and figure
16:
Table 11: Bosch’s economical study.
46-72

Discussion Results
Figure 16: Bosch Profit
In fact, Bosch has spent 10,900 euros to have the reusable boxes implemented. The main
cost is the returning of these boxes to the supplier. However, the price reduction per part due to
stock reduction is enough for Bosch to realize a payback on its investment in one year. The profit
formula in figure 16, considers the rate of 0,08 to convert the saved money as money available to
invest.
Another figure that is interesting to be reported is the stock evolution of COS material
since the beginning of this project.
Looking to figure 17, we can see that from the beginning of daily deliveries in March, and
with a pull planning considering the maximum stock level to order, the stock has been decreasing
since then. At the beginning the stock level was about 120,000 euros and now it is in less than
50,000 euros.
47-72

Pull Planning with suppliers
Figure 17: MSL and Stock value of COS part numbers
However, I can consider that the main targets were accomplished. Following-up this
evolution and the results at the supplier, it’s possible to improve the results even more and to start
new projects.
5.4.2. In Supplier - COS
The supplier COS gained visibility to its problems in their supply chain and understood
what is possible to do to be a more competitive supplier. The Value Stream Mapping process
served as a leverage to trigger a series of continuous improvements inside their business.
Sometimes some outside help is needed to clear the ideas and decide on the right actions to bring
improvements and consequently greater profit. Bosch helped COS to understand that and to
determine the best way for it to design the future value stream. Kaizen (glossary) experts held that
the problems defined during the VSM and together with COS are integrating a pull system in COS
production floor. Another important issue that lets the supplier buffer the customer’s fluctuating
orders is the establishment of supermarkets. The supermarket’s existence guarantees the
48-72

Discussion Results
49-72
availability of material that is needed to accomplish the customer’s demand. And this element of
the process works also according to the replenishment levels, which will be determined in
function of several delivery terms involved in the supply process.
Unfortunately the results that COS obtained weren’t as good as the Bosch results, as COS
is still applying the same pull planning strategy in their suppliers and is still working on the pull
system implementation of pull and levelling. COS knows how far it has to go to implement lean
principles, confirm them, and act with them. Even though COS is growing as a Bosch supplier,
increasing the range of part numbers helps to build trust and establish a long-lasting partnership.


Conclusion
6. Conclusion
6.1. The expectations
When I started to do this thesis I had in mind some expectations that I was hoping to
accomplish. One of them was related to my personal enrichment, extending to scientific
development and research, whose scope was to add value to my career boundaries. Now, after
almost a year of work, I can assertively say that a lot of subjects that at first were a little confused
are now understood.
The second expectation is perfectly connected to the subject of this paper: to discover the
direct main benefits of having pull planning with suppliers. During the daily work with COS I’ve
realized that the improvements were significant and COS is increasing the performance month by
month. Right now, COS has approximately a 97% service level rating and the inventory target for
this year is close to being accomplished.
Along the way that I was reading, writing and understanding the lean principles, tools and
supply chain, I arrived to some general conclusions how one is always working always towards
continuous improvement, waste elimination and particularly employee satisfaction. Working in a
lean environment like this, we absolutely can show a better performance and do not waste time
with the same issues that can be solved first. These days, efficiency means cost reduction. In fact,
by applying the lean principles we are reducing waste and therefore costs. A pull system working
throughout the supply chain contributes for this assumption. And when we look directly to the pull
planning with a supplier, as the case study, the most remarkable points are:
• Reduction of delivery time (JIT concept);
• Reduction of stocks (inventory coverage)
• Increase of flexibility due to the batch size reduction;
• Transport optimization (load and frequency).
51-72

Pull Planning with suppliers
During my research many books, Internet sites and articles were read and sometimes, I
must confess, I was quite lost with of the varied information. Sorting that information out was
definitely the hardest part of the job. At some moments I was trending toward extending the
subject instead of narrowing it. Facing this problem, the connection between the lean philosophy
to pull planning with suppliers was easiest and the case study was crucial to show that. The fact
that I’m working in Bosch helps in a significant way for me to comprehend and experience the
main theme. It is also imperative to say that it was my decision to specify from all actions what
could be done at the COS supplier plant, those that seemed to be more interesting and
enlightening for my thesis subject.
6.2. Main Conclusions
I can conclude from my work that applying the pull system throughout the entire supply
chain (Total Pull) is the only way to gain the maximum potential of pull system advantages:
• Inventory reduction;
• Time reduction on doing delivery plans (SAP automatic plan);
• Reduction of transport types (transport standardization);
• Material rotation;
• Less dependence on software control;
• Processes orientation and standard processes with suppliers (more than one process with
suppliers will increase the waste);
• Transparent material and information flow between supplier and customer;
• Flexibility on ordered quantities;
• Time reduction on handling of material;
• Supplier competitive material price;
• Higher customer and supplier service level.
52-72

Conclusion
53-72
The pull planning must be extended to all of the company as much as possible. Even the
suppliers that do not have the same conditions as COS, for example suppliers with very long lead
times, can be integrated into pull planning. Even if it means going forward step-by-step, supplier
after supplier. We can always have long lead times with suppliers due to geographical distances,
but we can always decrease that lead time and delivery frequency as JIT concept, if we adopt new
systems, like for instance consignment stock.
Therefore, the implementation of pull plans with suppliers is just a step in the continuous
journey of today’s industry, but without it some other essential principles and methods couldn’t
produce the desired effect.
Even the pull planning can be improved! There are other ways and more advanced ways of
pull planning: more than one delivery per day, vendor management inventory (VMI), ship-to-line,
etc. Concluding, we can always improve!
The next steps with COS will be the reduction of total lead time to 5 days and the
reduction of some batch sizes.


References
References
Books
CHOPRA, Sunil and MEINDL, Peter; Supply Chaon Management, Strategy, Planning and
Operation; Prentice Hall; 2001;
COOPER, Martha C. and Lisa; M. Ellran; Characteristics of Supply Chain Management and
Implication for Purchasing and Logistics Strategy; The international journal of Logistics
Management, Vol. 4; 1993;
JONES, Daniel, WOMACK, James; Lean Thinking: Banish Waste and Create Wealth in
Your Company, Simon & Schuster Ltd, 2003.
LIKER, Jeffrey K.; The Toyota Way – 14 Management Principles from the World’s Greatest
Manufacturer, McGraw-Hill; 2003;
MAGEE, David; How Toyota Became #1: Leadership Lessons from the World’s Greatest
Car Company, Portofolio, 2008;
OHNO, Taiichi; Toyota Production System: Beyonf Large-scale Production, Taylor &
Francis Inc, 1988;
WOMACK, P., JONES, James, T., Daniel, ROOS, Daniel; The Machine That Changed the
World: The Story of Lean Production, HarperCollins Publishers Inc, 1991;
The Burton Group (2001), “The benefits of Lean manufacturing”;
Talach, Chad; Integrated Lean Logistics; Transfreight Lean Logistics;
55-72

Pull Planning with suppliers
Internet sites
http://www.sme.org/cgi-bin/get-newsletter.pl?LEAN&20051011&1;(Janury2008)
http://www.lean.org/Library/BatchProcessesByArtSmalley.pdf;(January2008)
http://www.worthsolutions.com/leanblog(February2008)
http://www.1000ventures.com/business_guide/supply_chain_mgmt.html;(February2008)
http://www.informit.com/articles/article.aspx?p=664147&seqNum=6;(March2008)
http://www.springerlink.com/content/x8q43554t522238h/;(March2008)
http://esd.mit.edu/WPS/ESD%20Internal%20Symposium%20Docs/ESD-WP-2003-01.04-
ESD%20Internal%20Symposium.pdf;(April2008)
http://www.leaninstituut.nl/publications/1106/The_Heijunka_Box.pdf(April2008)
http://www.iswonline.com/ArticleLanding/tabid/67/Default.aspx?tid=1&ContentID=6723;(
April2008)
http://www.valuebasedmanagement.net/methods_value_stream_mapping.html(May2008)
http://www.omnex.com/consulting/supply_chain.html(September2008)
56-72

Appendix
Value Stream Method symbols
customeror supplier
Transports(material flow)
stockwithout definedmin/max values
process step(with value creation)
information flow
supermarketwith defined min/max values
withdrawingof material
buffer withfirst-in Ğ first-outrealization and defined min/max
electronic dataexchange
ãgo and seeÒproduction control
data processingsystem
Processstep
ct:É
FIFO
!
Kanban-collectionbox/point

COS Value Stream Mapping

COS Value Stream Mapping – Kaizen Flashes

Part Number Pull Selection
Part Number Anual Consumption Daily Consumption Week Consumption Week 0 Week 1 Week 2 Week 3 Week 4 Week5 Week 5 Pull part Batch Size Max. Qt/box8700306094 85580 389 1945 1702 1602 1594 1631 1562 1758 1402 OK 1000 10008703406107 50000 227 1136 118 107 172 204 198 123 154 OK 250 5008700305178 111350 506 2531 2361 1932 1806 2757 2522 2872 3011 OK 500 10008700306221 427 2 10 0 10 0 0 0 0 0 NOK 50 2008700306222 483850 2199 10997 10986 9233 10476 10371 12078 7986 11417 OK 2500 50008708202115 1170000 5318 26591 20392 28632 26543 10646 48134 14646 28343 OK 5000 50008700500064 7000 32 159 50 51 278 75 60 48 11 OK 100 5008703406184 35500 161 807 837 741 863 949 864 725 768 OK 250 2508708501316 43250 197 983 771 811 1009 939 836 1072 981 OK 500 5008708202124 2806030 12755 63773 57772 55974 55244 68683 57550 56684 60174 OK 5000 50008703404222 300 1 7 0 0 1 0 0 0 0 NOK 10 1008708502071 318322 1447 7235 7534 6598 6174 4840 6023 6773 6944 OK 1500 30008700305117 536 2 12 0 0 0 0 0 0 0 NOK 50 5008700306092 25750 117 585 1303 696 379 406 953 136 150 OK 250 2508703305349 19900 90 452 665 680 635 665 410 10 415 OK 50 2008713407004 520 2 12 12 12 12 12 12 12 24 OK 10 1008708202116 1146250 5210 26051 18049 26379 31314 20566 26248 24242 28128 OK 5000 50008703404212 888100 4037 20184 14115 12876 19196 22609 22989 21645 19403 OK 2000 40008708202167 85000 386 1932 0 56 40 18 8 11888 8 NOK 256 5128708502036 43200 196 982 1210 854 801 878 913 1093 858 OK 500 10008703305350 18603 85 423 663 665 410 365 415 205 340 OK 50 1008708501315 143990 655 3273 3385 3802 3232 4336 2976 3618 3542 OK 500 10008708501095 7500 34 170 136 101 163 189 184 271 124 OK 50 1008708501235 3750 17 85 98 111 129 70 46 48 55 OK 50 1008708502046 91470 416 2079 1821 2256 1930 2344 1457 1831 1902 OK 500 10008700305118 411500 1870 9352 8445 8659 9548 8210 9359 10052 9078 OK 1500 30008708202181 35800 163 814 12 12 24 12 5000 12 24 NOK 100 500
Consumption


Related Documents