MICHAEL LIEBREICH SUMMIT KEYNOTE, 5 APRIL 2011 1 / / / / / / / / / / / / / / / / / / / / / / / / / / / / / / / / Michael Liebreich CEO, Bloomberg New Energy Finance Catalysing Investment in Low-Carbon, Climate Resilient Growth OECD Workshop, Paris 7 November 2011

Welcome message from author
This document is posted to help you gain knowledge. Please leave a comment to let me know what you think about it! Share it to your friends and learn new things together.
Transcript

MICHAEL LIEBREICH SUMMIT KEYNOTE, 5 APRIL 2011 1 / / / / / / / / / / / / / / / / / / / / / / / / / / / / / / / /
Michael Liebreich
CEO, Bloomberg New Energy Finance
Catalysing Investment in Low-Carbon, Climate Resilient Growth
OECD Workshop, Paris
7 November 2011

2 / / / /
AGENDA
2. Clean energy sectoral trends
1. Investment activity
3. Near-term issues
4. Thoughts on solutions

3 / / / /
$52bn
$76bn
$113bn
$151bn
$180bn $186bn
$243bn
48%
48%
34%
19%
4%
30%
2004 2005 2006 2007 2008 2009 2010
GLOBAL TOTAL NEW INVESTMENT IN CLEAN ENERGY
2004–10 ($BN)
Source: Bloomberg New Energy Finance
Note: Includes corporate and government R&D, and small distributed capacity. Adjusted for re-
invested equity. Does not include proceeds from acquisition transactions

4 / / / /
CLEAN VS FOSSIL-BASED GENERATING CAPACITY
INVESTMENT, 2004–10 ($BN)
Source: IEA, EIA, Bloomberg New Energy Finance
Note: Investment for new build – fossil fuel calculated from EIA & IEA numbers, clean energy
taken from Bloomberg New Energy Finance totals. Clean energy capacity includes small
distributed capacity.
Fossil fuel
Clean energy
0
50
100
150
200
250
2004 2005 2006 2007 2008 2009 2010
5 / / / /
Source: Bloomberg New Energy Finance
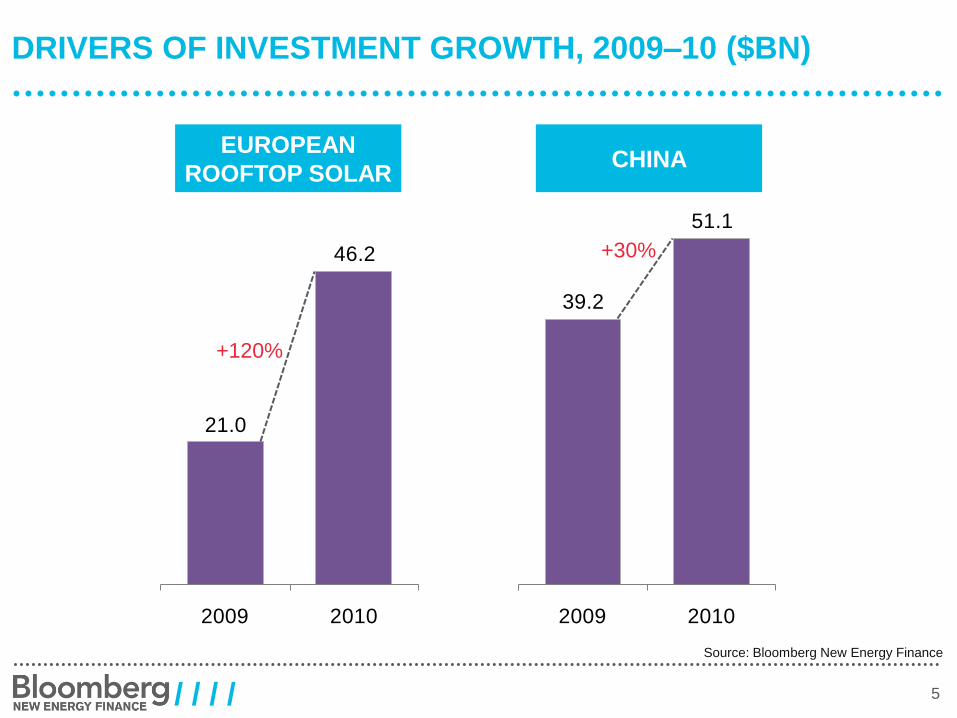
DRIVERS OF INVESTMENT GROWTH, 2009–10 ($BN)
CHINA EUROPEAN
ROOFTOP SOLAR
39.2
51.1
2009 2010
21.0
46.2
2009 2010
+120%
+30%

6 / / / /
0.0
0%
20.3
10%
74.5
38% 68
35%
21.4
11%
9.7
5%
2008 2009 2010 2011e 2012e 2013e
GLOBAL CLEAN ENERGY STIMULUS SPENDING BY YEAR,
2011–2013 ($BN)
Source: Bloomberg New Energy Finance Note: 2011–13 according to Bloomberg New Energy Finance expectations
Global total = $193.9bn

7 / / / /
6.5 5.8 5.57.3
8.6
12.510.6
14.916.0
20.619.8
29.1
23.925.9
29.8
44.0
28.6
40.9
37.035.6
21.4
36.935.1
35.732.3
31.7
39.2
51.5
36.9
41.7
45.4
Q1 04
Q2 04
Q3 04
Q4 04
Q1 05
Q2 05
Q3 05
Q4 05
Q1 06
Q2 06
Q3 06
Q4 06
Q1 07
Q2 07
Q3 07
Q4 07
Q1 08
Q2 08
Q3 08
Q4 08
Q1 09
Q2 09
Q3 09
Q4 09
Q1 10
Q2 10
Q3 10
Q4 10
Q1 11
Q2 11
Q3 11
Four quarter running average
NEW FINANCIAL INVESTMENT IN CLEAN ENERGY Q1 2004–Q3 2011 ($BN)
Source: Bloomberg New Energy Finance
Note: Excludes corporate and government R&D, and small distributed capacity. Not
adjusted for re-invested equity

8 / / / /
1.5 1.6 1.2
2.32.9
3.93.3
5.1
6.67.6
8.8
11.3
10.1 8.8
11.4
14.1
12.3
16.3
12.211.9
4.9
11.1
8.1
10.810.3
10.7 9.7
17.4
9.3
15.6
18.9
Q1 04
Q2 04
Q3 04
Q4 04
Q1 05
Q2 05
Q3 05
Q4 05
Q1 06
Q2 06
Q3 06
Q4 06
Q1 07
Q2 07
Q3 07
Q4 07
Q1 08
Q2 08
Q3 08
Q4 08
Q1 09
Q2 09
Q3 09
Q4 09
Q1 10
Q2 10
Q3 10
Q4 10
Q1 11
Q2 11
Q3 11
Four quarter running average
NEW FINANCIAL INVESTMENT IN CLEAN ENERGY IN AMER Q1 2004–Q3 2011 ($BN)
Source: Bloomberg New Energy Finance
Note: Excludes corporate and government R&D, and small distributed capacity. Not
adjusted for re-invested equity

9 / / / /
3.0 3.32.3
3.5 3.4
6.2
5.05.6 5.4
9.3
5.8
12.5
8.6
10.3
11.0
23.2
9.3
14.815.8
15.1
6.8
17.2
12.8
10.410.0
8.6
11.5
15.5
9.29.9 9.5
Q1 04
Q2 04
Q3 04
Q4 04
Q1 05
Q2 05
Q3 05
Q4 05
Q1 06
Q2 06
Q3 06
Q4 06
Q1 07
Q2 07
Q3 07
Q4 07
Q1 08
Q2 08
Q3 08
Q4 08
Q1 09
Q2 09
Q3 09
Q4 09
Q1 10
Q2 10
Q3 10
Q4 10
Q1 11
Q2 11
Q3 11
Four quarter running average
NEW FINANCIAL INVESTMENT IN CLEAN ENERGY IN EMEA Q1 2004–Q3 2011 ($BN)
Source: Bloomberg New Energy Finance
Note: Excludes corporate and government R&D, and small distributed capacity. Not
adjusted for re-invested equity

10 / / / /
2.1
0.9
2.01.5
2.3 2.4 2.3
4.2 4.1 3.7
5.1 5.4 5.2
6.87.4
6.7 7.0
9.89.0
8.5
9.78.6
14.3 14.5
12.012.4
18.018.6
18.4
16.2
16.9
Q1 04
Q2 04
Q3 04
Q4 04
Q1 05
Q2 05
Q3 05
Q4 05
Q1 06
Q2 06
Q3 06
Q4 06
Q1 07
Q2 07
Q3 07
Q4 07
Q1 08
Q2 08
Q3 08
Q4 08
Q1 09
Q2 09
Q3 09
Q4 09
Q1 10
Q2 10
Q3 10
Q4 10
Q1 11
Q2 11
Q3 11
Four quarter running average
NEW FINANCIAL INVESTMENT IN CLEAN ENERGY IN ASOC Q1 2004–Q3 2011 ($BN)
Source: Bloomberg New Energy Finance
Note: Excludes corporate and government R&D, and small distributed capacity. Not
adjusted for re-invested equity

11 / / / /
ASSET FINANCE FOR NEW BUILD CLEAN ENERGY –
TOP 15 COUNTRIES, 2010 ($BN)
Source: Bloomberg New Energy Finance Note: Total values include estimates for undisclosed deals
1.4
1.5
1.8
2.2
2.2
2.3
2.4
3.2
4.4
4.6
4.8
6.2
6.9
20.7
47.3
0.0 5.0 10.0 15.0 20.0 25.0 30.0 35.0 40.0 45.0 50.0
Poland
Pakistan
Portugal
Australia
United Kingdom
Mexico
Belgium
India
Canada
Spain
Italy
Germany
Brazil
United States
China
ASOC
AMER
EMEA

12 / / / /
AGENDA
2. Clean energy sectoral trends
1. Investment activity
3. Near-term issues
4. Thoughts on solutions

13 / / / /
LEVELISED COST OF ENERGY Q3 2011 ($/MWH)
Source: Bloomberg New Energy Finance
Carbon forecasts from the BNEF European Carbon Model with a 2020 horizon $74/tCO2. Coal and nat gas prices
from the US Department of Energy EIA Annual Energy Outlook 2011. % change represents change in mid from
Q2 2011.
0 50 100 150 200 250 300 350 400 450 500
Natural Gas CCGT
Landfill Gas
Coal Fired
Wind - Onshore
Municipal Solid Waste
Geothermal - Flash Plant
Biomass - Incineration
Biomass - Anaerobic Digestion
PV - c-Si Tracking
Biomass - Gasification
Geothermal - Binary Plant
PV - Thin Film
STEG - Tower & Heliostat w/storage
PV - c-Si
STEG - LFR
STEG - Tower & Heliostat
Wind - Offshore
STEG - Parabolic Trough + Storage
STEG - Parabolic Trough
Marine - Wave
Marine - Tidal
LCOE BNEF 2011 EU-ETS EUA Forecast Q3 2011 Central Scenario Q2 2011 Central Scenario
+5%
+1%
+5%
+1%
-2%
+1%
-1%
+6%
+1%
-4%
-2%
-3%
-9%
+6%
+1%
-9%
-1%
-1%
-3%
799 +23%
740 +8%

14 / / / /
THE PV MODULE EXPERIENCE CURVE, 1976–2011 ($/W)
Source: Paul Maycock,
Bloomberg New Energy Finance, FSLR filings
Notes: Inflation adjustment using US PPI, R2 of c-Si regression = 0.94, R2 of FSLR regression =
0.98
MW (log)
0.1
1
10
100
1 10 100 1,000 10,000 100,000 1,000,000
historic prices experience curve Chinese c-Si module prices
Thin-film experience curve First Solar thin-film module cost
1976
1985
2003
2011
2006
2011
2010

15 / / / /
Source: Bloomberg New Energy Finance
UK
$/kWh average residential power price
RESIDENTIAL PV PRICE PARITY
Note: LCOE based on 6% weighted average cost of capital, 0.7%/year module degradation, 1%
capex as O&M annually. $3.5/W capex assumed for 2011, $2/W for 2015.
More sun
CA CA
0.00
0.10
0.20
0.30
0.40
0.50
0.60
0.70
800 1,000 1,200 1,400 1,600
kWh/kW/year
2011
LCOE
Germany
Italy
Denmark
PortugalTurkey
Hawai
Spain
France
Netherlands
United Kingdom Czech Republic
Japan
CaliforniaSwitzerland
China South Africa
South Korea
United States
2015
LCOE
50GW

16 / / / /
'CHINA' AND 'INTERNATIONAL' SPOT PRICE OF SOLAR-
GRADE SILICON, MAY 2009 – 24 OCTOBER 2011 ($/KG)
Source: Bloomberg New Energy Finance Solar Spot Price
Index
Note: For longer-term spot prices, see Appendix. Starting 11 July 2011 the Index is
conducted weekly and the dates in chart represent first day of the week
0
10
20
30
40
50
60
70
80
90M
ay
Ju
nJu
lA
ug
Se
pO
ct
No
vD
ec
Ja
nF
eb
Ma
rA
pr
Ma
yJu
nJu
lA
ug
Se
pO
ct
No
vD
ec
Ja
nF
eb
Ma
rA
pr
Ma
yJu
n0
4 J
ul
11
Ju
l 1
8 J
ul
25
Ju
l 0
1 A
ug
0
8 A
ug
1
5 A
ug
2
2 A
ug
2
9 A
ug
0
5 S
ep
1
2 S
ep
1
9 S
ep
2
6 S
ep
0
3 O
ct
10
Oct
17
Oct
24
Oct
2009 2010 2011
"China price" "International price"

17 / / / /
SPOT PRICES OF WAFERS AND CELLS, MAY 2009-17
OCTOBER 2011 ($/W)
Source: Bloomberg New Energy Finance Solar Spot Price
Index
Note: See methodology about conversion. Starting 11 July 2011 the Index is conducted
weekly. The dates in chart represent first day of the week for which the price applies.
0.0
0.2
0.4
0.6
0.8
1.0
1.2
1.4
1.6M
ay
Ju
nJu
lA
ug
Se
pO
ct
No
vD
ec
Ja
nF
eb
Ma
rA
pr
Ma
yJu
nJu
lA
ug
Se
pO
ct
No
vD
ec
Ja
nF
eb
Ma
rA
pr
Ma
yJu
n0
4 J
ul
11
Ju
l 1
8 J
ul
25
Ju
l 0
1 A
ug
0
8 A
ug
1
5 A
ug
2
2 A
ug
2
9 A
ug
0
5 S
ep
1
2 S
ep
1
9 S
ep
2
6 S
ep
0
3 O
ct
10
Oct
17
Oct
24
Oct
2009 2010 2011
5" mono wafers 6" multi wafers 6" mono wafers Mono cells Multi cells

18 / / / /
UTILITY-SCALE PV SYSTEM PRICE FORECAST, 2010-2020
(2010 $/W)
Source: Bloomberg New Energy Finance
1.72
1.35
1.060.95 0.90
0.810.73 0.66 0.59 0.53 0.48
0.30
0.30
0.270.24 0.22
0.210.19
0.17 0.16 0.15 0.14
0.50
0.50
0.470.45
0.440.42
0.400.39
0.370.36
0.34
0.41
0.41
0.390.37
0.360.34
0.330.32
0.310.29
0.28
0.18
0.18
0.170.17
0.160.16
0.150.15
0.150.14
0.14
$3.12/W
$2.74/W
$2.36/W$2.19/W
$2.08/W$2.00/W
$1.81/W$1.68/W
$1.57/W$1.47/W
$1.38/W
2010 2011 2012 2013 2014 2015 2016 2017 2018 2019 2020
Module Inverter Balance of plant Engineering, procurement & construction Other

19 / / / /
ASSET FINANCE FOR LARGE-SCALE SOLAR PROJECTS,
2007-Q3 2011
Source: Bloomberg New Energy Finance
Note: Based on individual deals tracked, with a „buffer‟; subject to change, usually
upwards, as more deals are discovered
$1.6bn$1.9bn
$3.6bn
$4.6bn$3.8bn
$5.2bn
$6.6bn$6.4bn
$2.2bn
$5.8bn
$4bn
$4.2bn
$4.3bn
$4.8bn
$6.6bn
$10.3bn
$4.9bn
$14.1bn
$19.5bn
Q1
'07
Q2
'07
Q3
'07
Q4
'07
Q1
'08
Q2
'08
Q3
'08
Q4
'08
Q1
'09
Q2
'09
Q3
'09
Q4
'09
Q1
'10
Q2
'10
Q3
'10
Q4
'10
Q1
'11
Q2
'11
Q3
'11
PV >1MW Solar Thermal Electricity Generation

20 / / / /
ONSHORE WIND TURBINE PRICE DATA, 1984–2011
(EUR M/MW)
Source: Bloomberg New Energy Finance, ExTool
Note: Plotted against cumulative global installed capacity. All prices are real EUR. Each marker represents one year
for the corresponding series. ExTool data is for Denmark and Germany. BNEF Rest of World (RoW) is BNEF Wind
Turbine Price Index, excluding Asian turbine contracts. BNEF China is domestic turbine contracts.
ExTool BNEF RoW
BNEF China
0.25
0.50
1.00
2.00
100 1,000 10,000 100,000 1,000,000MW
1984 1990 2000 2011
6%
14%

21 / / / /
LEVELIZED COSTS: BEST NEW WIND VS NEW COAL
($/MWh)
• New coal must cover cost of capital
• New coal requires advanced
pollution control
• Wind turbines back to 2005 prices,
but now perform much better
• Wind bankability has driven down
cost of capital
• Coal suffers from carbon price risk
Perception:
Reality:
Source: Bloomberg New Energy Finance
30
120
Coal
Wind
68
65
Coal
Wind

22 / / / /
Electric vehicles - past

23 / / / /
ELECTRIC VEHICLES - PRESENT

24 / / / /
LITHIUM-ION BATTERY PACK COST, TRACTION BATTERY
PRODUCTION, 2010–30
Source: Bloomberg New Energy Finance Note: Total pack cost includes the battery management system
Total pack cost ($/kWh) Annual production (GWh)
0
200
400
600
800
1,000
1,200
2010 2012 2014 2016 2018 2020 2022 2024 2026 2028 2030
0
50
100
150
200
250
300
350
Total capacity of batteries manufactured per year (GWh) Total cost of pack ($/kWh)

25 / / / /
73,714 508 124 45
GLOBAL EV CAPACITY, 2011 (‘000 VEHICLES)
Source: OICA, L‟Argus, Bloomberg New Energy Finance * Figures from 2010
Global auto & light commercial
vehicle production*
2011 EV battery
production
capacity
2011 EV
production
capacity
2011 EV
sales
forecast

26 / / / /
500+ SMART GRID PROJECTS WORLDWIDE
CANADA
Smart meters and
automation in
Ontario and BC
USA
Over 200 projects;
$4.5bn stimulus for
smart grids
EU
80% smart
metering by 2020;
Over 100 projects
BRAZIL
Proposed smart
metering mandate;
large-scale pilots
CHINA
High voltage “Strong Smart Grid”;
48m smart meters by 2010.
SOUTH KOREA
Jeju Island pilot;
Nationwide smart grid by
2030 SINGAPORE
Smart metering
pilot 2011–12
AUSTRALIA
Smart metering in
Victoria; Newcastle
Smart Grid, Smart City
project
UK
100% smart metering
by 2019; GBP 500m
for Low Carbon
Networks
JAPAN
Multiple pilots

27 / / / /
Worldwide computer and storage power, 1980 - 2010
Source: Seagate; PhysOrg.com; Computer Industry Almanac; Bloomberg New Energy Finance
0.0001
0.001
0.01
0.1
1
10
100
1000
10000
100000
1000000
1980 1985 1990 1995 2000 2005 2010
Worwide total computing power
Worldwide computer storage volume
96%
CAGR
81%
CAGR

28 / / / /
Case study: mobile telephony
US telecoms revenue split ($bn) US fixed line vs mobile prices ($/min)
Source: Federal Communications Commission; Bloomberg New Energy Finance
Source: Federal Communications Commission; Bloomberg New Energy Finance
0
50
100
150
200
250
300
1997 1998 1999 2000 2001 2002 2003 2004 2005 2006 2007
Mobile Fixed line
0
0.05
0.1
0.15
0.2
0.25
0.3
0.35
0.4
0.45
0.5
1993 1994 1995 1996 1997 1998 1999 2000 2001 2002 2003 2004 2005 2006 2007
Mobile Fixed line

29 / / / /
AGENDA
2. Clean energy sectoral trends
1. Investment activity
3. Near-term issues
4. Thoughts on solutions

30 / / / /
EUROPE – FINANCIAL CRISIS
Source: AP

31 / / / /
GREECE SENIOR 5-YEAR USD DENOMINATED CDS
Bloomberg Terminal

32 / / / /
CDS SPREADS - PORTUGAL

33 / / / /
SPAIN SENIOR 5-YEAR USD DENOMINATED CDS
Bloomberg Terminal

34 / / / /
ITALY SENIOR 5-YEAR USD DENOMINATED CDS
Bloomberg Terminal

35 / / / /
FRANCE SENIOR 5-YEAR USD DENOMINATED CDS
Bloomberg Terminal Bloomberg Terminal

36 / / / /
US – CLIMATE SCEPTICISM

37 / / / /
0.0
0%
20.3
10%
74.5
38% 68
35%
21.4
11%
9.7
5%
2008 2009 2010 2011e 2012e 2013e
GLOBAL CLEAN ENERGY STIMULUS SPENDING BY YEAR,
2011–2013 ($BN)
Source: Bloomberg New Energy Finance Note: 2011–13 according to Bloomberg New Energy Finance expectations
Spent = $94.8bn, 49% Unspent = $31.1bn, 16%
Global total = $193.9bn

38 / / / /
MARGINAL COST OF GAS-LEVERED PRODUCERS AND
HENRY HUB PRICE FORECAST ($/MMBTU)
Source: Bloomberg New Energy Finance Note: Basket comprises 17 E&P companies with an
average 85% gas/liquids production ratio and combined 2010 output of 4,250Bcf. „DD&A‟ is
depletion, depreciation and amortisation; „G&A‟ is general and administrative expenses.
5.85
6.50 7.00
0
1
2
3
4
5
6
7
8
9
10
20
00
20
01
20
02
20
03
20
04
20
05
20
06
20
07
20
08
20
09
20
10
20
11
E
20
15
E
20
20
E
20
30
E
DD&A Lease operating expense
Production taxes G&A
Interest expense Price

39 / / / /
NET COSTS OF FEED-IN TARIFFS (EUR BN)
Source: Bloomberg New Energy Finance
-
2
4
6
8
10
12
14
2005 2007 2009 2011 2013 2015 2017 2019 2021 2023 2025 2027 2029Germany Czech Republic Italy Spain France Greece Ontario

40 / / / /
0
50
100
150
200
250
300
350
400
450
500
Jan-03 Jan-04 Jan-05 Jan-06 Jan-07 Jan-08 Jan-09 Jan-10 Jan-11
NEX CLEAN ENERGY INDEX 2003 – 30 SEPTEMBER 2011
Note: Values as of 30 Sep 2011; AMEX Oil, NASDAQ and S&P 500 rebased to 100 on 01 Jan 2003 Source: Bloomberg New Energy Finance
NEX AMEX Oil
S&P 500
NASDAQ

41 / / / /
CHINA POWER CAPACITY ADDITIONS BY TECHNOLOGY, 2001-11E (GW)
Source: China Electricity Council, Bloomberg New Energy Finance
0
20
40
60
80
100
120
2001 2002 2003 2004 2005 2006 2007 2008 2009 2010 2011e
Solar
Biomass &
WtE
Wind
Hydro
Nuclear
Natural Gas
Coal

42 / / / /
WORLD’S LARGEST BANKS BY TOTAL BALANCE SHEET
($ BN)
Note: as at 16 September 2011
13,459
10,810
10,460
10,337
2,455
2,265
2,118
1,998
1,914
1,906
1,594
1,490
1,454
1,317
1,258
1,218
1,132
1,032
992
930
206
173
161
Ind and Comm Bank of ChinaChina Construction Bank
Bank of ChinaAgricultural Bank of China
HSBC
Bank of AmericaJP Morgan Chase
BNP ParibasCitigroup
Deutsche BankCrédit Agricole
BarclaysRBSUBS
Wells FargoSantander
Société GénéraleCredit Suisse
Lloyds Banking groupUniCredit
Mitsubishi UFJ
SunTrust BanksMizuho Financial Group
Source: Bloomberg

43 / / / /
AGENDA
2. Clean energy sectoral trends
1. Investment activity
3. Near-term issues
4. Thoughts on solutions

44 / / / /
Accelerating the shift to clean energy
1. Level playing field
• Remove subsidies
• Neutralise externalities
• Improve risk transparency
• Remove barriers to innovation
• Accelerated retirement
• Utility regulation
• Trade barriers
• Standards
• Financial regulation (risk, solvency
vs liquidity)
2. Smart support
• Importance of price discovery
• TLC = transparent, limited, carefully applied
• Focus on R&D or cost reduction
• Avoid “green jobs” fallacy
• Education & Skills
• Public procurement
• Climate finance
• APPROPRIATE use of PPP
• Communications / Leadership

/ / / / / / / / / / / / / / / / / / / / / / / / / / / /
Subscription-based news, data
and analysis to support your
decisions in clean energy, power
and water and the carbon markets
MARKETS Renewable Energy
Carbon Markets
Energy Smart Technologies
Renewable Energy Certificates
Carbon Capture & Storage
Power
Water
Nuclear
SERVICES Insight: research, analysis & forecasting
Industry Intelligence: data & analytics
News & Briefing: daily, weekly & monthly
Applied Research: custom research & data mining
Knowledge Services: Summit, Leadership Forums, Executive Briefings &
workshops
MICHAEL LIEBREICH TWITTER: @MLIEBREICH
Related Documents