CASL MPO- Hydrogen Ms. Jennifer Jarvis (PhD Thesis, Defense 5/12/15) Ron Ballinger

Welcome message from author
This document is posted to help you gain knowledge. Please leave a comment to let me know what you think about it! Share it to your friends and learn new things together.
Transcript

CASL MPO- HydrogenMs. Jennifer Jarvis (PhD Thesis, Defense 5/12/15)
Ron Ballinger
Overview
• Introduction
• Water Chemistry: Dose rates and local chemistry
• Electrochemistry:
• Atomistic Simulations
• Conclusions
• Potential Future Work

The Coolant/Cladding/CRUD System
Coolant
CoolantWater at 15.5 MPa, 569-620 K0-2000 ppm B, 0-3.4 ppm LipHT = 6.9-7.42.23-4.46 ppm H2Porous CRUD Deposit
Solid: Ni,Fe,O , 50% by volume Coolant enriched in B, Li boiling
Porous Oxide LayerCracks and PoresInterconnected porosity near surface (still primarily solid!)10-30 nm at surface, 1-3 nmPrimarily Monoclinic
Dense “Barrier” Oxide Layer~ 1 µm thickMonoclinic, Tetragonal ZrO2
Suboxides
Metal Zircaloy-4 MatrixOverall composition Zr,(0.07-0.113)Cr, (0.18-0.24) Fe, (1.2-1.7) Sn
Second Phase Particles~20-200 nm diameter, depending on manufacturingDelayed oxidationMetallic: Zr(Fe,Cr)2 laves phase Oxidized: May Contain ZrO2, Cr2O3, Fe2O3, Fe3O4, (Crx,Fex-1)2O3

Corrosion and the “Hydrogen Split”
𝐻2𝑂 → 𝑂𝑎𝑑2− + 2𝐻𝑎𝑑
+
2𝐻𝑎𝑑+ + 2𝑒− → 𝐻2𝐻𝑎𝑑
+ → 𝐻𝑎𝑏+𝑂𝑎𝑑
2− → 𝑂𝑎𝑏2−
𝑍𝑟+4 + 2𝑂2− → 𝑍𝑟𝑂2 𝑍𝑟 → 𝑍𝑟+4 + 4𝑒−
O2- H+
e-
Bulk Coolant
Near-Surface Coolant
Metal
Oxide
Two pathways for hydrogen:• Recombination + Desorption• Absorption
Rather than consider hydrogen pickup from the absorption perspective: we can consider it in terms of recombination, i.e. How much hydrogen produced by corrosion is not absorbed by the cladding?

Objectives of Work
• Develop a radiolysis model for water chemistry in a PWR• Including the effects of CRUD
• Use water chemistry results to provide supporting information to CASL research activities:• Water chemistry (concentrations) for CRUD chemistry models• Chemical Potentials in the coolant- to support corrosion modeling at the atomic level• Corrosion potentials, redox potentials
• Better Understanding of the hydrogen split and the role of the oxidized second phase particles• Do the precipitates act as a window for hydrogen? (Probably Not)• Can the oxidized precipitates serve as recombination sites? [Cr2O3 (maybe), Fe2O3 (Not
so Much)]• Metallic SPPs (Not studied here but general consensus-yes)

Water Chemistry and Radiolysis Modeling
• Radiolysis is the breakdown of water molecules under irradiation
• Non-equilibrium chemistry
• From a corrosion perspective we are interested in: H2, O2, and H2O2 (also pH)
• Water chemistry calculations performed with RADICAL code:• Steady state, 1-D• Chemistry in a loop under irradiation• Radiolysis effects• Chemical Reactions• Mass transfer between liquid and vapor (for BWRs)• ECP models n, α, β-, γ
H2O
e-
HO
H+
OH
H
HO2
H2O2
H2

RADICAL and Water Chemistry Modeling
EPRI empirical
correlation(BWR)
Calculate Concentrations based on mass balance
pH routine: calculate pH based on B and Li
addition
Mixed Potential Model: 304SS*(BWR+ PWR)
MPM : Alloy 600
(PWR)
MPM : Alloy 690
(PWR)
ECP Profile
Input :TH profile (mass flux ,temperature, or power profile)
Geometry (flow areas, hydraulic diameters)Component/Loop Mapping
Reaction sets G-values Dose Profile Initial Concentrations
D.D. Macdonald et al., Electrochemistry of Water-Cooled Nuclear Reactors (2006)H.S. Kim, A Study for Modeling Electrochemistry in Light Water Reactors (2007) C.C. Lin et al, Corrosion. Vol. 52, No. 8, pp. 618-625 (1996)
Concentration Profiles
* New Mixed Potential Model Developed for 304SS

The PWR Radiolysis Model
• 4 Loop PWR at 15.5 MPa
• 193 fuel assemblies, 3587 MWth
• Hot Leg Temperature: 599 K
• Cold Leg Temperature 569 K
• Models the entire primary loop
• Single channel analysis within the core- isolated individual fuel pins
AveCore: 30%
CRUD
2x pin
Hot Pin
Bypass
Upper Plenum
Lower Plenum
1x pin
CRUD: Top 1/3 of active fuel
Active Fuel
Core Plate
Coolant Chemistry in PWR
0 2 4 6 8 10 12 14 16 18 200
200
400
600
800
1000
1200
1400
1600
1800
Cycle Burnup, MWd/kgU
Bo
ron
Co
nce
ntr
atio
n, p
pm
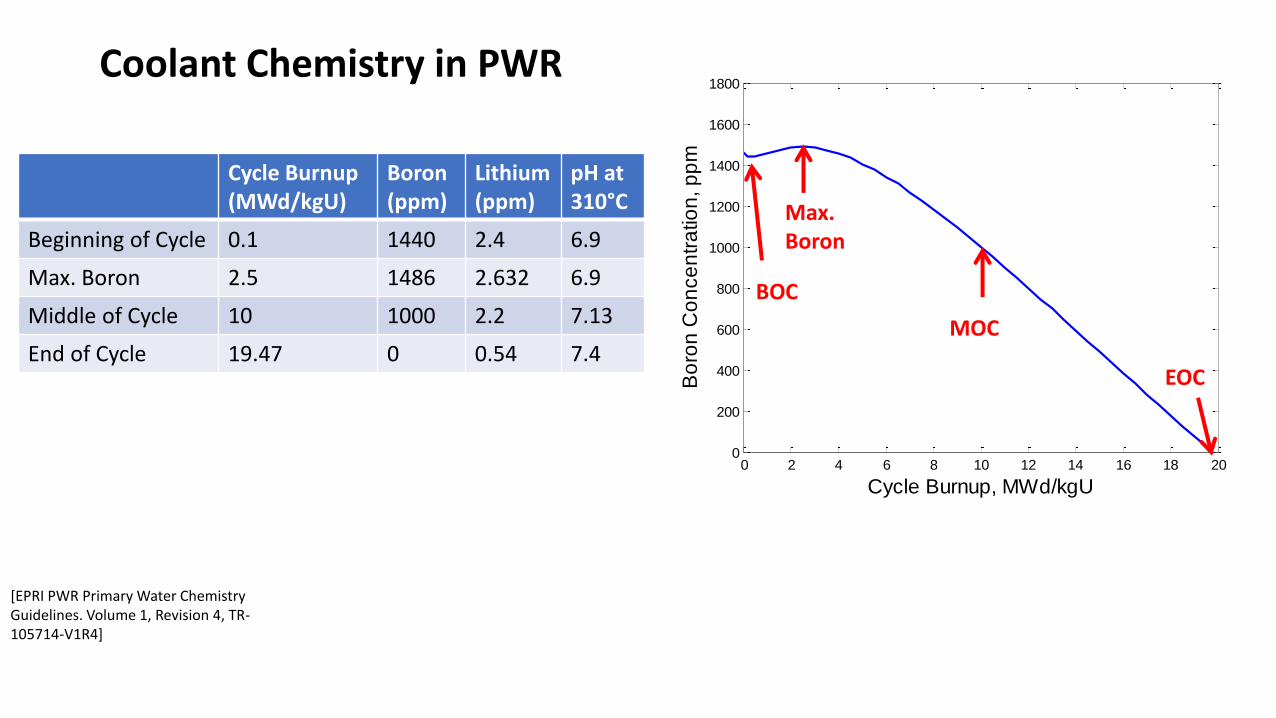
Cycle Burnup (MWd/kgU)
Boron (ppm)
Lithium(ppm)
pH at 310°C
Beginning of Cycle 0.1 1440 2.4 6.9
Max. Boron 2.5 1486 2.632 6.9
Middle of Cycle 10 1000 2.2 7.13
End of Cycle 19.47 0 0.54 7.4
BOC
Max. Boron
MOC
EOC
[EPRI PWR Primary Water Chemistry Guidelines. Volume 1, Revision 4, TR-105714-V1R4]

Coolant Dose Rates: Estimated using MCNP for fuel with and without CRUD
• A database of dose-to-LHGR ratios
• Interpolate for:• Boron in the coolant
• Coolant density
• Fuel burnup
• Scale by LHGR
UO2
Fuel: composition
changes with burnup
Coolant0-2000 ppm B0.588-0.737 g/cc
Clad
Gap
CRUD12.5-75 µm thick50% by volume solid CRUD0.05 void fraction in coolantEnriched in boron
Dose Rate = f (burnup, boron, density)LHGR

Coolant Dose Rates with CRUD can be quantified with a dose enhancement factor
• Dose enhancement factors are independent of bulk boron, burnup, and coolant density
• Dose to confined coolant depends on fraction of energy deposited to the coolant in the CRUD volume (solid CRUD + coolant)
9.5% gamma dose to coolant (MCNP heating tally)
77-81% fast neutron dose (MCNP heating tally)
25% alpha dose (stopping power estimate)
Bulk Coolant Confined Coolant
Gamma 1.21 1.21
Fast Neutron 1.21-1.23 1.31-1.32
Alpha 1.21 function of boron
𝑑𝑜𝑠𝑒 𝑒𝑛ℎ𝑎𝑛𝑐𝑚𝑒𝑛𝑡 𝑓𝑎𝑐𝑡𝑜𝑟 =𝑑𝑜𝑠𝑒 𝑤𝑖𝑡ℎ 𝐶𝑅𝑈𝐷 𝐵𝑢𝑙𝑘 𝐵𝑜𝑟𝑜𝑛, 𝐵𝑢𝑟𝑛𝑢𝑝, 𝜌𝐻2𝑂, 𝐶𝑅𝑈𝐷 𝑡ℎ𝑖𝑐𝑘𝑛𝑒𝑠𝑠 + 𝑏𝑜𝑟𝑜𝑛
𝑐𝑙𝑒𝑎𝑛 𝑓𝑢𝑒𝑙 𝑑𝑜𝑠𝑒 𝐵𝑢𝑙𝑘 𝐵𝑜𝑟𝑜𝑛, 𝐵𝑢𝑟𝑛𝑢𝑝, 𝜌𝐻2𝑂
Dose enhancement factors for fuel with CRUD

Alpha dose rates to confined coolant in CRUD vary linearly with boron enrichment
0
2
4
6
8
10
12
14
0 2 4 6 8 10 12
αd
ose
co
nfi
ned
co
ola
nt
αd
ose
in c
lean
co
re
CRUD to Bulk Coolant Boron ratio
increasing CRUD thickness
The solid CRUD reduces the alpha dose deposited to the confined coolant:For low boron enrichment in the CRUD (less than 3x bulk), dose rates are smaller than in the adjacent coolant
A relatively small change in the energy division between solid CRUD and confined coolant has a significant impact on alpha dose rates

Calculated dose rates are in good agreement with literature
Plant Gamma Dose [Rad/s]
Fast NeutronDose [Rad/s]
Boron Concentration
[ppm]
Alpha Dose [Rad/s]
Ringhals 1 1.45E+05 4.85E+05 800 3.13E+05
Tsuruga-2 2 1.50E+05 5.00E+05 - -
Model: PWR-ECP 3
2.86E+05 5.14E+05 840 3.17E+04
Model: RADICAL (average dose in
average core)
5.47E+05 3.26E+05 1000 6.17E+04
[1] Christensen, Nucl. Tech. Vol 109. No 3. pg. 373-382 (1995)[2] Takiguchi et al., J Nucl. Sci. and Tech. Vol. 41, No. 5 pg 601-609 (2004)[3]Urquidi-Macdonald et al., J Nucl. Matl. Vol 362, No. 1 pg 1-13 (2007)
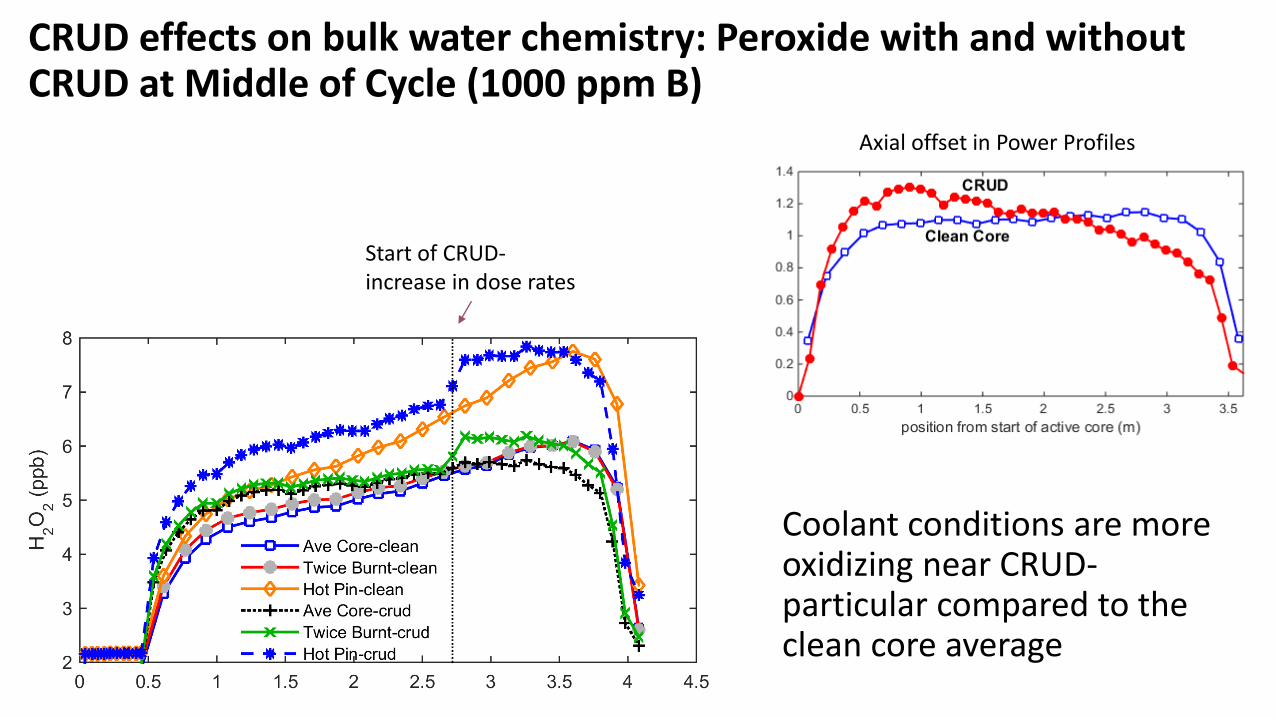
CRUD effects on bulk water chemistry: Peroxide with and without CRUD at Middle of Cycle (1000 ppm B)
Coolant conditions are more oxidizing near CRUD-particular compared to the clean core average
Axial offset in Power Profiles
Start of CRUD-increase in dose rates

Corrosion Potential at MOC with CRUD
ECP Increase due to CRUD layer
Start of Active Core
CRUD Effects
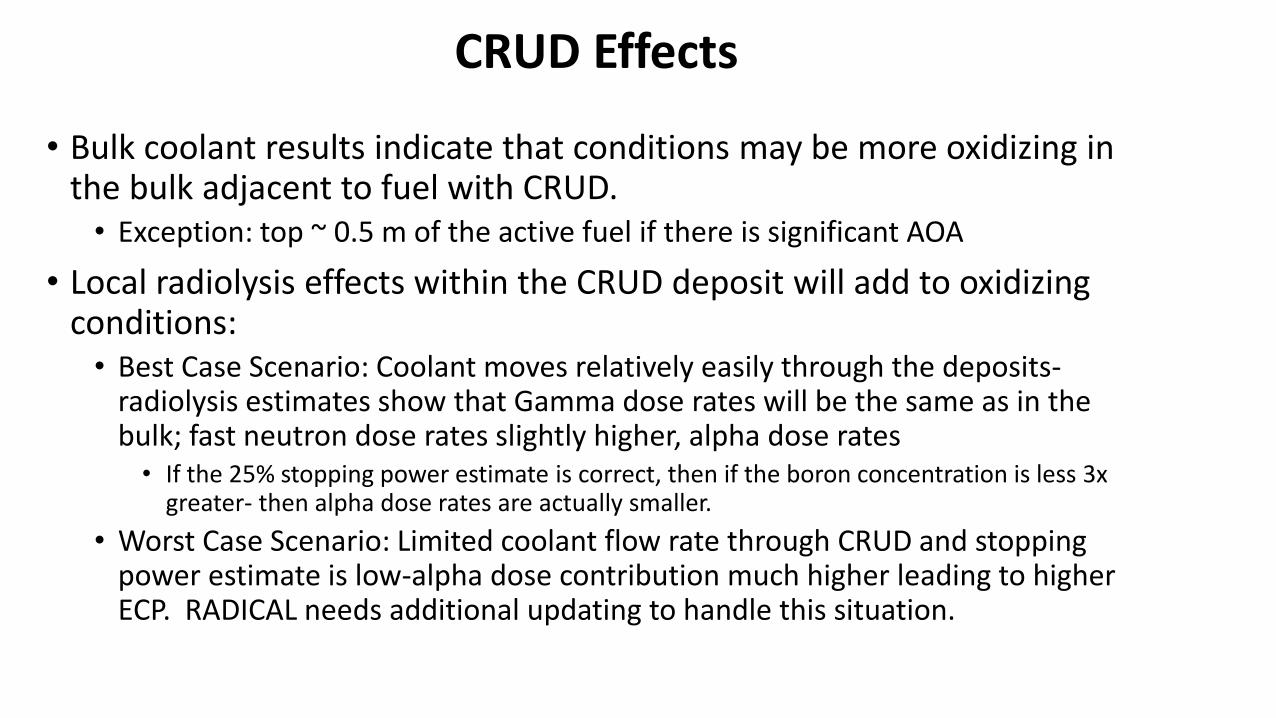
• Bulk coolant results indicate that conditions may be more oxidizing in the bulk adjacent to fuel with CRUD. • Exception: top ~ 0.5 m of the active fuel if there is significant AOA
• Local radiolysis effects within the CRUD deposit will add to oxidizing conditions:• Best Case Scenario: Coolant moves relatively easily through the deposits-
radiolysis estimates show that Gamma dose rates will be the same as in the bulk; fast neutron dose rates slightly higher, alpha dose rates• If the 25% stopping power estimate is correct, then if the boron concentration is less 3x
greater- then alpha dose rates are actually smaller.
• Worst Case Scenario: Limited coolant flow rate through CRUD and stopping power estimate is low-alpha dose contribution much higher leading to higher ECP. RADICAL needs additional updating to handle this situation.
Link Between Water Chemistry and Electrochemical Effects
•Chemical Potentials • Provide estimates of phase stability• Can be used to estimate defect concentrations in the
oxide
• Electrochemical Energy levels:• Determine electron transfer behavior

The hydrogen chemical potential in PWR coolant can be estimated from temperature and H2 concentration
2.23 ppm H2 (25 scc H2/kg H2O) (low end of EPRI recommendation)
4.46 ppm H2 (50 scc H2/kg H2O) (high end of EPRI recommendation)
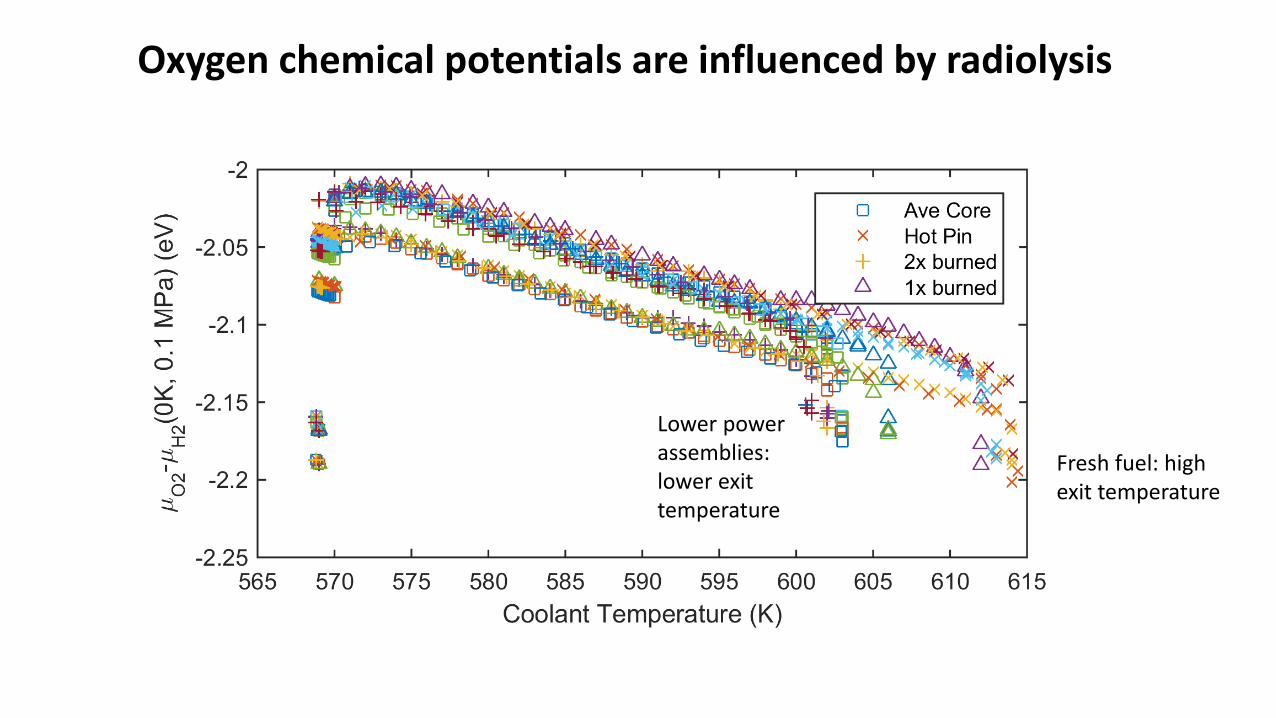
Oxygen chemical potentials are influenced by radiolysis
Lower power assemblies: lower exit temperature
Fresh fuel: high exit temperature

The energy level comparison: electron transfer can only occur when energy levels in the electrode and solution align
Franck Condon splitting of H+/H energy,treated by Marcus theory
Energy levels given by Gaussian distribution
Eoredox: Redox Energy, calculated from water
chemistry + Nernst Equation
EF
Valence Band
Conduction Band
EV
EC
E (eV)
H+ (unoccupied states)
H (occupied states)
Jc
Oxide Coolant
λ
Oxide band positions:Obtain from literature
Band edges change with pH
λ
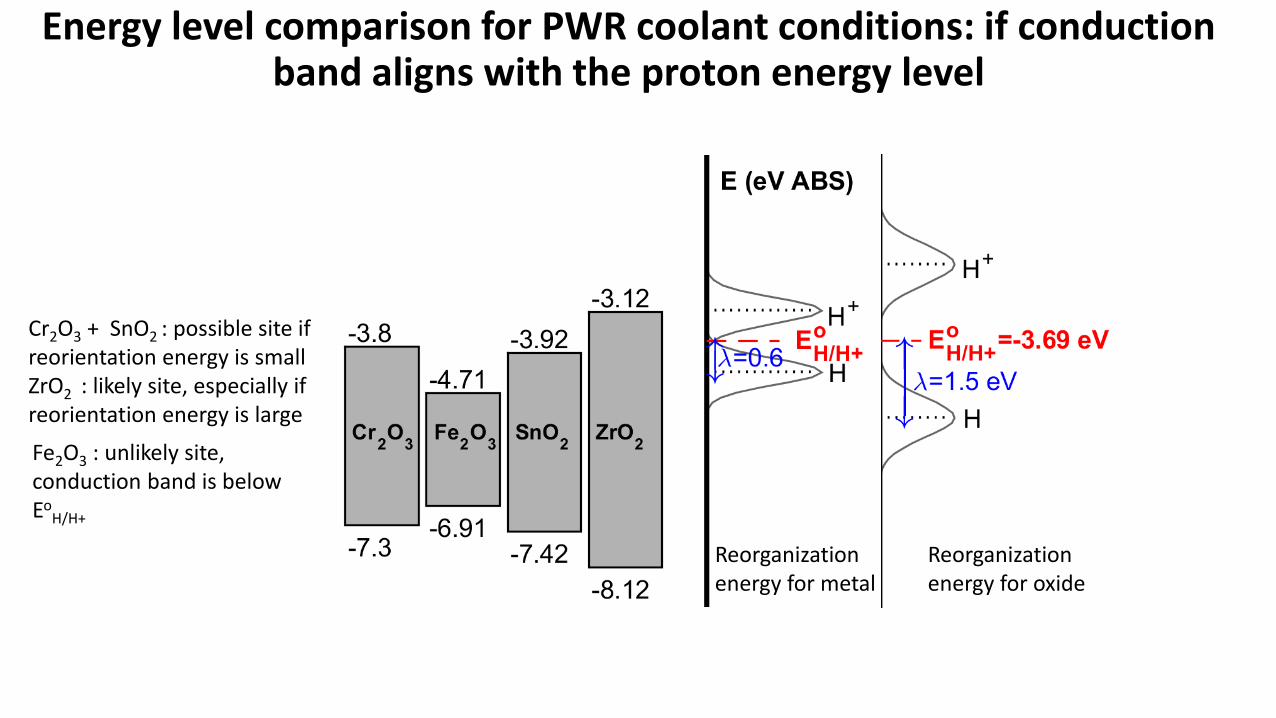
Energy level comparison for PWR coolant conditions: if conduction band aligns with the proton energy level
Reorganization energy for oxide
Reorganization energy for metal
Cr2O3 + SnO2 : possible site if reorientation energy is small ZrO2 : likely site, especially if reorientation energy is large
Fe2O3 : unlikely site, conduction band is below Eo
H/H+

Density Functional Theory Studies

Goal : Understand hydrogen interactions at the oxide/coolant interface
Specifically consider the role of oxidized precipitates:
Fe2O3 and Cr2O3 are two of the compounds found in the Oxidized Zr(Fe,Cr)2 SPPs in Zircaloy-4
Can the precipitates serve as a site for hydrogen evolution recombination?
Are the precipitates likely “easy” entry pathways for hydrogen?

Cr2O3 and Fe2O3
• Corundum structure (space group 𝑅3𝑐, group 167)
• Crystal Structure:• Primitive unit cell: Rhombohedral (10
atoms)• Hexagonal cell (30 atoms)• 2 internal lattice parameters
• Antiferromagnetic, different spin ordering
• Wide gap semiconductors/insulators • Cr2O3 band gap: 3.4 eV• Fe2O3 band gap: 2.2 eV
The rhombohedral cell (left) and hexagonal cell
(right) of Cr2O3. Oxygen atoms are shown in red, and
Cr in blue. The (1,1,1) direction in the rhombohedral
cell aligns with the (0001) direction in the hexagonal
cell
Density Functional Theory
• Electronic Structure calculation- (quantum)
• Born-Oppenheimer Approximation: nuclei move much slower than electrons, we can treat the electrons as acting in a field of fixed nuclei and neglect the KE of nuclei.
• Hohenberg and Kohn Theorems• The ground state energy from Schrodinger’s equation is a unique functional of
the electron density• Variational Principle: The energy computed from a “guessed” wavefunction is
an upper bound to the true ground state energy => We can find the ground state by minimizing the energy
• Kohn-Sham Equations

Calculation Details• VASP 5.2.12
• Surface calculations: • Valence electrons modeled: 3p64s13d5 for Cr, 4s13d7 for Fe, and 2s22p4 for O• (1x1) hexagonal surface model• 3x3x1 gamma centered k-point grid• 6 stoichiometric units in the surface model- bottom 2 fixed• 15 A vacuum layer• Dipole corrections applied to energies
• Projector Augmented Wave (PAW) Perdew-Burke-Ernzerhof (PBE) pseudopotentials
• Spin Dependence : both Cr2O3 and Fe2O3 are antiferromagnetic
• Simplified rotationally invariant DFT+U method of Duderev et al.
• Plane wave cutoff energy of 520 eV
• Ionic Force convergence of 0.01 eV/A
• Electronic Convergence criteria 1E-4 eV
• Gaussian Smearing with σ=0.05 eV
• Bader charge analysis performed with the Henkelman group’s code
• Climbing Image Nudged Elastic Band (CI-NEB) calculations performed with Henkelman group’s code
• VESTA was used for visualization

DFT Modeling Path
Short distance
Short distance
Long distance
Bulk Calculations:benchmark properties,Select appropriate method: (spin dependent PAW PBE + U corrections)
Surface energy calculations:Benchmark surface relaxations against available data , Determine likely surface termination in PWR core
Adsorption calculations:Determine sites, energies, use results for recombination and incorporation
Hydrogen adsorption on (0001) Fe2O3 and Cr2O3
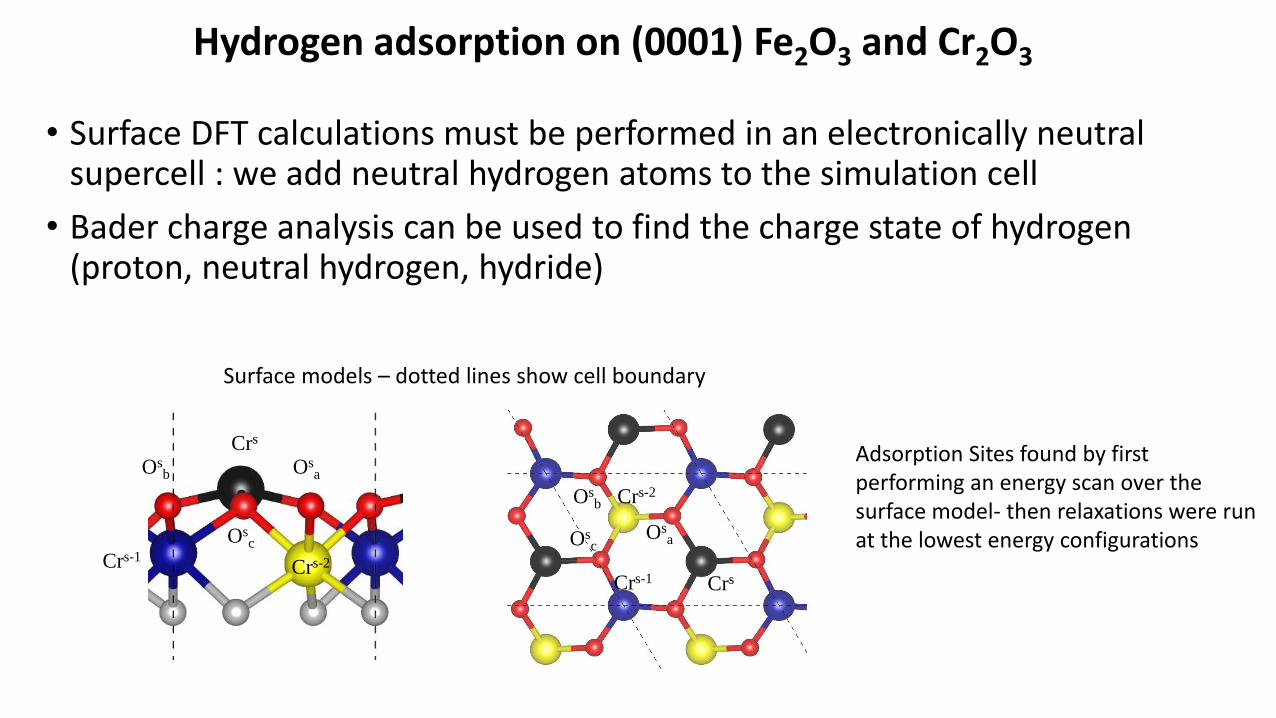
• Surface DFT calculations must be performed in an electronically neutral supercell : we add neutral hydrogen atoms to the simulation cell
• Bader charge analysis can be used to find the charge state of hydrogen (proton, neutral hydrogen, hydride)
Crs-1
Crs-2
Crs
OsaOs
c
Osb
Crs
Crs-2Crs-1
OsaOs
b
Osc
Adsorption Sites found by first performing an energy scan over the surface model- then relaxations were run at the lowest energy configurations
Surface models – dotted lines show cell boundary

Hydrogen can adsorbs as either a proton or hydride on Fe2O3 and Cr2O3 : the sites are the same for both
Adsorbed Proton:
Bader charge: +0.6eO-H Bond length ~ 1 A
Proton adsorbs to one of three equivalent surface oxygen ion sites
Adsorbed Hydride: Bader charge: -0.44 eCr-H Bond length ~ 1.7 A
Hydride adsorbs to the top most surface metal ion
Proton
Hydride
Smaller Red atoms: oxygenLarge atoms (blue, black, yellow): Chromium

Hydrogen Adsorption Energies
Case
(coverage + adsorption sites)
Cr2O3
(eV/atom)
Fe2O3
(eV/atom)
1 ML: Os -0.219 -0.927
2 ML: Os , Os 0.137 -0.698
2 ML: Os , Ms 0.038
3 ML: Os , Os , Ms -0.017
3 ML: Os , Os , Os -0.607
𝐸𝑎𝑑𝑠 = 𝐸𝑠𝑙𝑎𝑏+ 𝑎𝑑𝑠𝑜𝑟𝑏𝑒𝑑 𝐻 𝑎𝑡𝑜𝑚𝑠 − 𝐸𝑐𝑙𝑒𝑎𝑛 𝑠𝑙𝑎𝑏 −𝒩𝐻
2𝐸𝐻2
Adsorption energies relative to H2 energy1 ML = 1 H atom per cell. Negative energy is exothermic
On Cr2O3, the 2nd hydrogen prefers to adsorb to Cr- as a metal hydride. Adsorption at 2 ML is not stable with respect to the H2 energy
Hydrogen adsorption energies are more negative for Fe2O3

The first step of the hydrogen recombination pathway is proton reduction + hydride formation: Shown Fe2O3
0 eV
2.21 eV
1.05 eV1.16 eV
Starting configuration:2 adsorbed protons One proton is transferred from an
oxygen ion to the surface Fe atom
Charge is transferred between surface and this hydrogen
Initial Charge: +0.59Final Charge: -0.34
Intermediate state:Proton + hydride
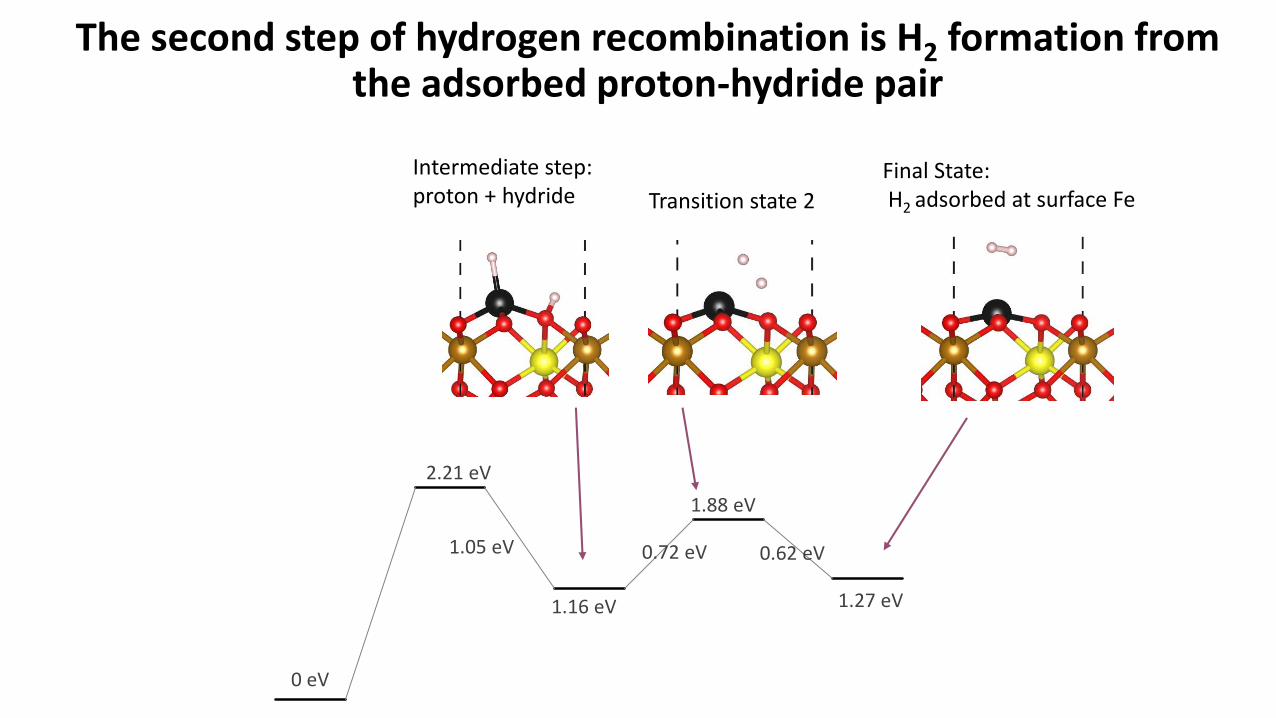
The second step of hydrogen recombination is H2 formation fromthe adsorbed proton-hydride pair
0 eV
2.21 eV
1.05 eV
1.16 eV
0.72 eV
1.88 eV
0.62 eV
1.27 eV
Intermediate step: proton + hydride Transition state 2
Final State:H2 adsorbed at surface Fe

Hydrogen Recombination on Cr2O3
• At 2 ML coverage- the lowest energy configuration is the H+ H- pair
• Small energy barrier : 0.28 eV
• Final State is H2 adsorbed between surface O and Cr ions
• Recombination is exothermic at this coverage
(hydrogen adsorption at 2 ML coverage was not favorable) 0.40 eV
-0.11 eV
0 eV
0.28 eV
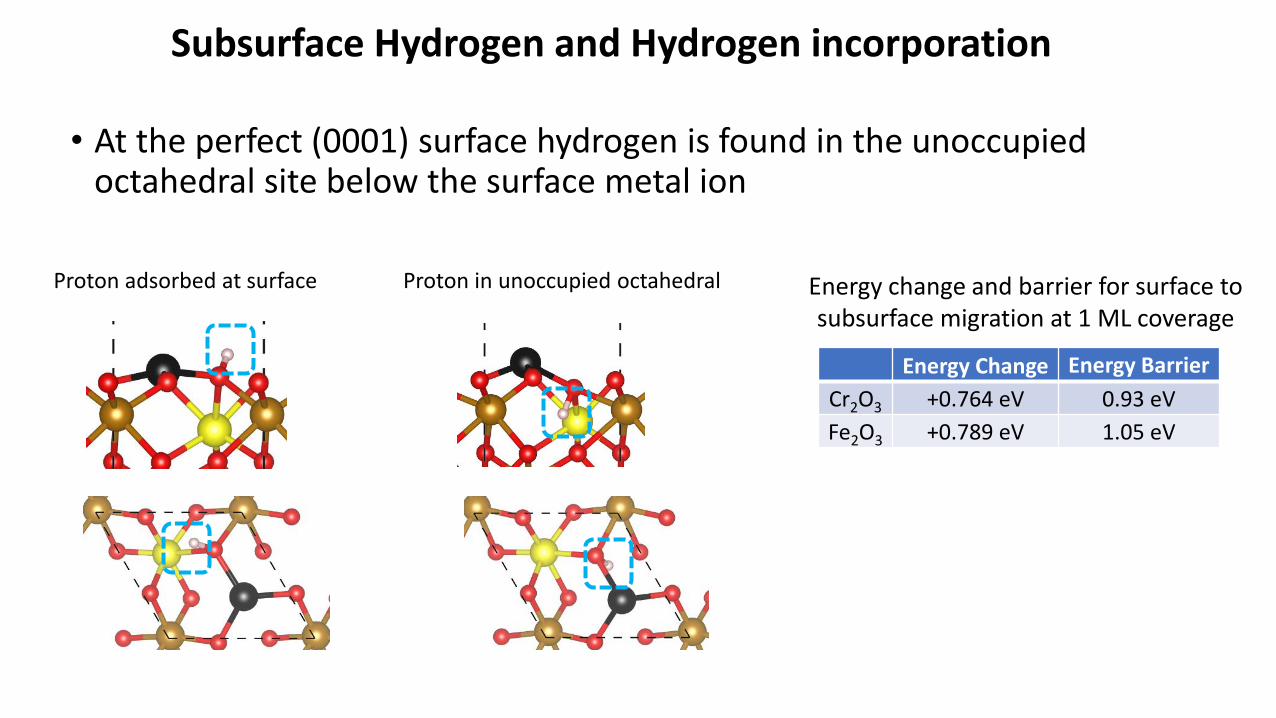
Subsurface Hydrogen and Hydrogen incorporation
• At the perfect (0001) surface hydrogen is found in the unoccupied octahedral site below the surface metal ion
Energy Change Energy Barrier
Cr2O3 +0.764 eV 0.93 eV
Fe2O3 +0.789 eV 1.05 eV
Energy change and barrier for surface to subsurface migration at 1 ML coverage
Proton adsorbed at surface Proton in unoccupied octahedral

Coolant
Oxide
Recombination or Adsorption?
Adsorbed Protons at surface
Had+
Subsurface Migration
Had+ → Hsub
+
Proton Reduction
Had+ → Had
-
H2 formation
Had+ Had
- → H2 ads
Inward Diffusion
Desorption
Stability determined by chemical potentials
DFT results: energy barrier ~ 1 eV
DFT results: Low energy barrier~0.3-0.7 eV
Energy barrier related to Fermi level in surface- DFT results had a high energy
barrier for Fe2O3
- Marcus theory predicts that Fe2O3 is not a site for reduction
DFT results: H2 very weakly bound to surface < 0.1 eV
Water chemistry results:Chemical potential is ~ -0.9 eV

Coolant
Oxide
Recombination or Adsorption?
Adsorbed Protons at surface
Had+
Subsurface Migration
Had+ → Hsub
+
Proton Reduction
Had+ → Had
-
H2 formation
Had+ Had
- → H2 ads
Inward Diffusion
Desorption
Stability determined by chemical potentials
DFT results: energy barrier ~ 1 eV
DFT results: Low energy barrier~0.3-0.7 eV
Barrier related to fermilevel in surfaceHigh energy barrier for Fe2O3
DFT results: H2 very weakly bound to surface < 0.1 eV
Water chemistry results:Chemical potential is ~ -0.9 eV
Likely that proton reduction is the limiting step for the hydrogen recombination stepFe2O3 seems to be an unlikely site for proton reduction (according to Marcus theory)
Cr2O3 may be involved in hydrogen recombination
The (0001) surface of Cr2O3 or Fe2O3 provides some protection against hydrogen ingress:Hydrogen is more stable above the surface than below it.

Summary
• Developed a detailed radiolysis model for PWRs that can be used to study steady state coolant chemistry in the core under a variety of conditions• Realistic coolant chemistry, axial power profiles, dose rates
• Created a database of dose rate profiles for PWRs
• Estimated dose rates to confined coolant in CRUD
• Based on DFT calculations, identified Cr2O3 as a possible site for hydrogen evolution, identified Fe2O3 as an unlikely site
• Water Chemistry results: Support CRUD chemistry modeling
• Chemical Potential calculations support CASL corrosion work

Potential Future Work
• Radiolysis Modeling• Add capability to model more appropriate flow conditions in porosity in CRUD
• RADICAL has capability for 2 phase flow (originally written for BWR).
• Directly to Moose?
• Do better job at estimation of alpha energy partitioning.
• DFT (Hydrogen Modeling)• Rationalize/Combine SPP and ZrO2 Results
• Build Dynamic Model for Evolution of SPPs/Oxide During Irradiation
• Take Shot at 1st Generation Hydrogen Split Model (In the End-Stick with Empirical Correlation)

Thank You!

extras- supporting information

Work function (energy to move an electron from a vacuum to the electrode)-changes with hydrogen adsorption as follows:- decreases when hydrogen adsorbs as a proton ( the Fermi energy increases)- increases when hydrogen adsorbs as a hydride
Case
(coverage + adsorption sites)
Cr2O3 Fe2O3
Adsorption energy
(eV/atom)
Work Function
(eV)
Adsorption energy
(eV/atom)
Work Function
(eV)
Clean Surface - 5.42 - 5.32
1 ML: Os -0.219 4.33 -0.927 4.86
2 ML: Os , Os 0.137 3.29 -0.698 4.85
2 ML: Os , Ms 0.038 5.84 6.62
3 ML: Os , Os , Ms -0.017 5.15
3 ML: Os , Os , Os -0.607 4.85
Bottom line: Calculated adsorption energies include these potential changes. To arrive at H+ /H- energies, we’d need to extrapolate to get the energy when the potential change is zero.

Radiolysis results- with CRUD at MOC

Reorganization Energy ()
In a one-electron transfer reaction
A + D A. - + D.+
Reorganization energy is the energy required for
all structural adjustments (in the reactants and in the surrounding solvent molecules)
which are needed in order that A and D assume the configuration required for the transfer of the electron.
Related Documents