BI Levels : • Reporting • Data Mining • Knowledge Management • Expert Systems • Quality & accurate data sources • ERP Database + Others sources (Budgets, Bank Statements, & etc) • Processes data by: – Filtering & Sorting – Slice & Dice – Consolidate – Drill Down – Grouping & Simple Calculations • produces forma tted summaries of data “Getting the right information to the right people at the right time” Our 3 BI formats are : B5 , A4 & Listings BI Depends on : Always KISS K eep I t Simple Sir Toopid

Welcome message from author
This document is posted to help you gain knowledge. Please leave a comment to let me know what you think about it! Share it to your friends and learn new things together.
Transcript

8/9/2019 Cashflow&MiscKPI
http://slidepdf.com/reader/full/cashflowmisckpi 1/26
BI Levels :• Reporting
• Data Mining
•Knowledge Management
• Expert Systems
• Quality & accurate data sources
• ERP Database + Others sources (Budgets,
Bank Statements, & etc)• Processes data by:
– Filtering & Sorting
– Slice & Dice
– Consolidate
– Drill Down
– Grouping & Simple Calculations
• produces formatted summaries of data
“Getting the right information to theright people at the right time”
Our 3 BI formats are : B5 , A4 & Listings
BI Depends on :
Always
KISSK eep I t Simple Sir Toopid

8/9/2019 Cashflow&MiscKPI
http://slidepdf.com/reader/full/cashflowmisckpi 2/26
2
LIMIT TOO MUCH INFORMATION!
“Paralysis by Analysis!”
For info clarity, remember our target for B5 of :
3 LINES !
Try to build in :
Management by exception!

8/9/2019 Cashflow&MiscKPI
http://slidepdf.com/reader/full/cashflowmisckpi 3/26
3
CASH
FLOW

8/9/2019 Cashflow&MiscKPI
http://slidepdf.com/reader/full/cashflowmisckpi 4/26
4
Also important for flows
• Salaries & contributions (plus trend for bonuses/incentives reflective of expected payout)
• Budget sales & collection (trading)
• Billing & payments (contract)
• Capex & large ticket expenses (eg exhibitions)
• Payment of taxes (corporate & GST)

8/9/2019 Cashflow&MiscKPI
http://slidepdf.com/reader/full/cashflowmisckpi 5/26
5

8/9/2019 Cashflow&MiscKPI
http://slidepdf.com/reader/full/cashflowmisckpi 6/26
6

8/9/2019 Cashflow&MiscKPI
http://slidepdf.com/reader/full/cashflowmisckpi 7/26
7

8/9/2019 Cashflow&MiscKPI
http://slidepdf.com/reader/full/cashflowmisckpi 8/26
8
SAMPLE Dashboards & General KPIs

8/9/2019 Cashflow&MiscKPI
http://slidepdf.com/reader/full/cashflowmisckpi 9/26
9

8/9/2019 Cashflow&MiscKPI
http://slidepdf.com/reader/full/cashflowmisckpi 10/26
10

8/9/2019 Cashflow&MiscKPI
http://slidepdf.com/reader/full/cashflowmisckpi 11/26
11

8/9/2019 Cashflow&MiscKPI
http://slidepdf.com/reader/full/cashflowmisckpi 12/26
12

8/9/2019 Cashflow&MiscKPI
http://slidepdf.com/reader/full/cashflowmisckpi 13/26
13

8/9/2019 Cashflow&MiscKPI
http://slidepdf.com/reader/full/cashflowmisckpi 14/26
14

8/9/2019 Cashflow&MiscKPI
http://slidepdf.com/reader/full/cashflowmisckpi 15/26
15

8/9/2019 Cashflow&MiscKPI
http://slidepdf.com/reader/full/cashflowmisckpi 16/26
16

8/9/2019 Cashflow&MiscKPI
http://slidepdf.com/reader/full/cashflowmisckpi 17/26
17

8/9/2019 Cashflow&MiscKPI
http://slidepdf.com/reader/full/cashflowmisckpi 18/26
18

8/9/2019 Cashflow&MiscKPI
http://slidepdf.com/reader/full/cashflowmisckpi 19/26
19

8/9/2019 Cashflow&MiscKPI
http://slidepdf.com/reader/full/cashflowmisckpi 20/26
20

8/9/2019 Cashflow&MiscKPI
http://slidepdf.com/reader/full/cashflowmisckpi 21/26
21

8/9/2019 Cashflow&MiscKPI
http://slidepdf.com/reader/full/cashflowmisckpi 22/26
22
Business Analysis KPIs

8/9/2019 Cashflow&MiscKPI
http://slidepdf.com/reader/full/cashflowmisckpi 23/26
Business Analysis KPIs
Below are representative KPIs to measure the effectiveness of business analysis for projects.
% of rework attributable to requirements – Rework is a serious problem on most projects, representing about 40% of total
project cost. According to industry studies, about 70% of this rework is related to ambiguous, inaccurate, or missing
requirements.
% of projects with prioritized requirements – Prioritizing requirements is critical to ensure that project teams first focus on
items that deliver high value to the business.
% of requirements fully implemented – This is part of requirements traceability; requirements must be traced throughdesign, test, and deployment.
% of approved requirements not implemented- A test of the likelihood of user satisfaction with the final result.
Developer Requirements Satisfaction Index- Developers should be surveyed to determine their satisfactions with
requirements. This actually should be presented as a series of requirements questions concerning quality such as
Clear
AccurateComplete
Testable
Feasible
Testable
Project Stakeholder Satisfaction Index – Project stakeholders should be interviewed to determine if they felt their needs
were met and their overall satisfaction with the requirements. This might be done with a series of questions such as:
Do the requirements address the business needs?Were the requirements gold plated by BAs or developers?
Were stakeholders adequately involved in the requirements process?
QA Requirements Satisfaction index – QA should be surveyed to ensure that the requirements were testable.
% of Requirements Tested – One good measure to determine if the requirements were testable and implemented is to
determine what % of the requirements were actually tested.
Number of missing requirements – Missing or incomplete requirements is always a major problem for projects. This KPI
tracks the number of requirements that were added after the baseline was approved.User Satisfaction Index – Are the users satisfied with the delivered solution? 23
Project Value KPIs
8/9/2019 Cashflow&MiscKPI
http://slidepdf.com/reader/full/cashflowmisckpi 24/26
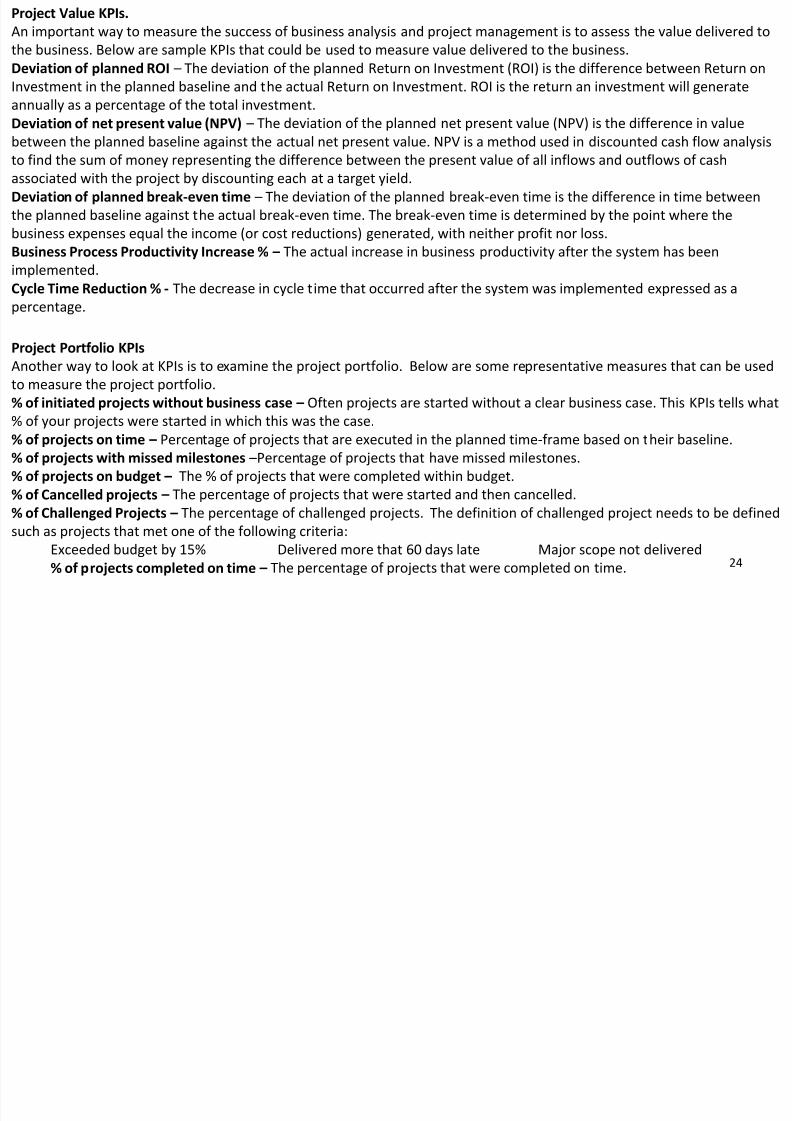
Project Value KPIs.
An important way to measure the success of business analysis and project management is to assess the value delivered to
the business. Below are sample KPIs that could be used to measure value delivered to the business.
Deviation of planned ROI – The deviation of the planned Return on Investment (ROI) is the difference between Return on
Investment in the planned baseline and the actual Return on Investment. ROI is the return an investment will generate
annually as a percentage of the total investment.
Deviation of net present value (NPV) – The deviation of the planned net present value (NPV) is the difference in value
between the planned baseline against the actual net present value. NPV is a method used in discounted cash flow analysisto find the sum of money representing the difference between the present value of all inflows and outflows of cash
associated with the project by discounting each at a target yield.
Deviation of planned break-even time – The deviation of the planned break-even time is the difference in time between
the planned baseline against the actual break-even time. The break-even time is determined by the point where the
business expenses equal the income (or cost reductions) generated, with neither profit nor loss.
Business Process Productivity Increase % – The actual increase in business productivity after the system has been
implemented.
Cycle Time Reduction % - The decrease in cycle time that occurred after the system was implemented expressed as a
percentage.
Project Portfolio KPIs
Another way to look at KPIs is to examine the project portfolio. Below are some representative measures that can be used
to measure the project portfolio.
% of initiated projects without business case – Often projects are started without a clear business case. This KPIs tells what
% of your projects were started in which this was the case.% of projects on time – Percentage of projects that are executed in the planned time-frame based on their baseline.
% of projects with missed milestones –Percentage of projects that have missed milestones.
% of projects on budget – The % of projects that were completed within budget.
% of Cancelled projects – The percentage of projects that were started and then cancelled.
% of Challenged Projects – The percentage of challenged projects. The definition of challenged project needs to be defined
such as projects that met one of the following criteria:
Exceeded budget by 15% Delivered more that 60 days late Major scope not delivered% of projects completed on time – The percentage of projects that were completed on time. 24
Project Management KPIs

8/9/2019 Cashflow&MiscKPI
http://slidepdf.com/reader/full/cashflowmisckpi 25/26
Project Management KPIs
The KPIs below can be used to measure the effectiveness of project management.
Deviation of planned budget - The deviation of the planned budget (cost) is the difference in total costs between the
planned baseline as compared against the actual budget.
Cost of managing processes – Periodic costs of managing processes, usually based on the number of Full Time Equivalent
personnel (FTEs) involved in management functions or processes.
Deviation of planned hours of work- The deviation of the planned work is the difference in work hours between the
planned baseline as compared against the actual statement of work.Deviation of planned time schedule for project/program - The deviation of the planned time schedule is the difference in
time between the planned baseline against the actual schedule.
% of FTE actually working on project that were not initially assigned – Percentage of FTEs actually working on project that
were not initially assigned.
% of milestones missed – Percentage of milestones as recorded in all projects/programs that have been missed.
% of overdue project tasks – Percentage of overdue project tasks.
Budgeted Cost of Work Scheduled (BCWS) – The budgets of the activities that are planned or scheduled to be completed.
Another term for BCWP is “”planned value.”
Number of milestones missed – Number of milestones of project missed.
Actual Cost of Work Performed (ACWP) – The sum of actual costs of activities that are completed.
Budgeted Cost of Work Performed (BCWP) or Earned Value – The planned or scheduled cost of activities that are
completed. Another term for BCWP is “earned value.”
Cost Performance Index (CPI) – Earned Value divided by the actual cost (BCWP/ACWP).
Cost Schedule Index (CSI) – Cost Performance Index times Schedule Performance Index (CPI x SPI). CSI measures the
likelihood of recovery for project that is late and/or over budget.Cost Variance (CV) Earned Value minus the actual cost (BCWP-ACWP).
Estimate at Completion (EAC) – The actual cost of work performed (ACWP) plus the estimate to complete (ETC) for all of the
remaining work.
Schedule Performance Index (SPI) – Earned Value divided by the planned value (BCWP/BCWS).
Schedule Variance (SV) – Earned Value minus the planned budget for the completed work (BCWP-BCWS).
25

8/9/2019 Cashflow&MiscKPI
http://slidepdf.com/reader/full/cashflowmisckpi 26/26
Qualified leads per year / month / week
Conversion rate
Cost per lead
Number of website visitors
Returning vs. new visitors
Homepage bounce rate
It’s widely recognised and understood
Everybody measures temperature the same way
Very easy to collect and record
Indicator of the health of the person
Provides historical data for analysis
Provides information for diagnostics – a highd i i i
26
Related Documents