Dragon Sourcing Your Tailored Approach to Emerging Markets www.dragonsourcing.com Study on Potential Sourcing Destinations of PE-PU Bags- Sanitized Version

Welcome message from author
This document is posted to help you gain knowledge. Please leave a comment to let me know what you think about it! Share it to your friends and learn new things together.
Transcript
Dragon SourcingYour Tailored Approach to Emerging Markets
www.dragonsourcing.com
Study on Potential Sourcing Destinations of PE-PU
Bags- Sanitized Version

Table of Contents
2
1) Executive Summary – Polyester Resin production
2) Executive Summary – Exports
3) Executive Summary – Labour wages
4) Executive summary – Import & Export duty
5) Executive Summary- Attractiveness of country in terms of polyester availability
6) Country Profiles :
I. China
II. Colombia
III. Indonesia
IV. Mexico
V. Myanmar
VI. Turkey
VII. Vietnam
HS Codes & Abbreviations
3
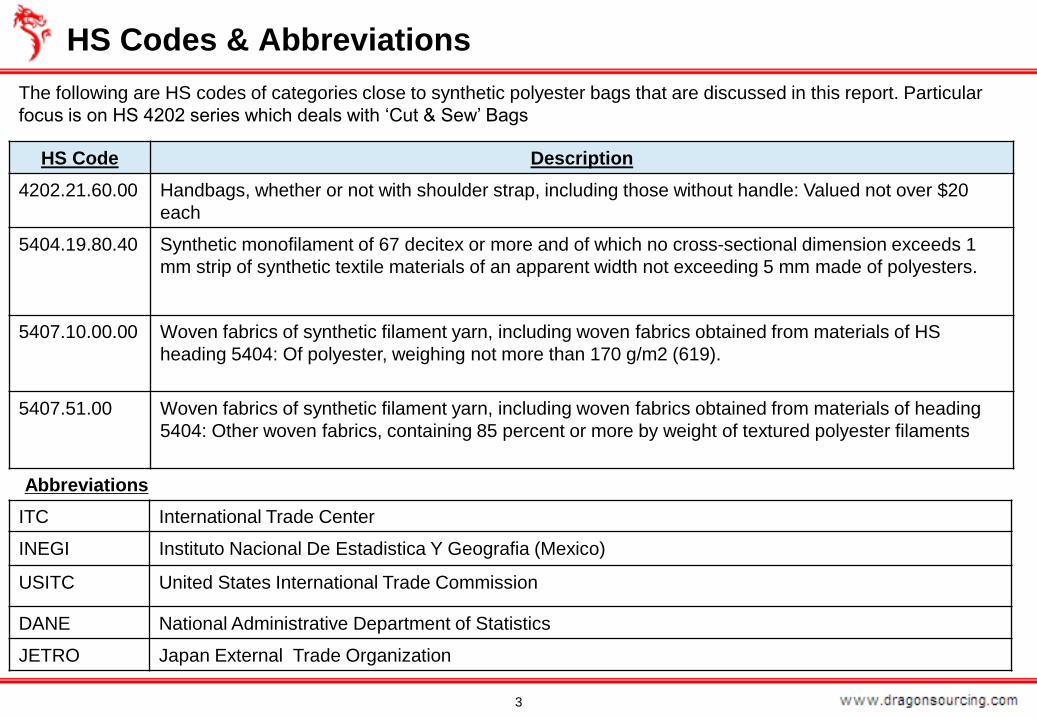
HS Code Description
4202.21.60.00 Handbags, whether or not with shoulder strap, including those without handle: Valued not over $20
each
5404.19.80.40 Synthetic monofilament of 67 decitex or more and of which no cross-sectional dimension exceeds 1
mm strip of synthetic textile materials of an apparent width not exceeding 5 mm made of polyesters.
5407.10.00.00 Woven fabrics of synthetic filament yarn, including woven fabrics obtained from materials of HS
heading 5404: Of polyester, weighing not more than 170 g/m2 (619).
5407.51.00 Woven fabrics of synthetic filament yarn, including woven fabrics obtained from materials of heading
5404: Other woven fabrics, containing 85 percent or more by weight of textured polyester filaments
ITC International Trade Center
INEGI Instituto Nacional De Estadistica Y Geografia (Mexico)
USITC United States International Trade Commission
DANE National Administrative Department of Statistics
JETRO Japan External Trade Organization
Abbreviations
The following are HS codes of categories close to synthetic polyester bags that are discussed in this report. Particular
focus is on HS 4202 series which deals with ‘Cut & Sew’ Bags

Executive Summary – Polyester Resin Production
4
World Polyester Resin Production in 2012 (Thousand Tons)
Mexico
Colombia
Indonesia
Turkey
Vietnam
Inland China
China (excludingInland)
ROW
2008 2009 2010 2011 2012
China-Polyester resin production in thousand tons
-
500
1,000
1,500
2,000
2,500
3,000
3,500
4,000
Mexico Colombia Indonesia Turkey Vietnam InlandChina
Myanmar
Polyester resin production in thousand tons

Executive Summary - Exports
5
CHINA
COLOMBIA, INDONESIA, MEXICO, MYANMAR, TURKEY & VIETNAM
$-
$5,000,000
$10,000,000
$15,000,000
$20,000,000
$25,000,000
$30,000,000
2008 2009 2010 2011 2012
Export Value (USD Thousand) ofHS Code 4202
$-
$50,000
$100,000
$150,000
2008 2009 2010 2011 2012
Export Value (USD Thousand) ofHS Code 5404
$-
$2,000,000
$4,000,000
$6,000,000
$8,000,000
$10,000,000
$12,000,000
2008 2009 2010 2011 2012
Export Value (USD Thousand) ofHS Code 5407
$-
$200,000
$400,000
$600,000
$800,000
$1,000,000
$1,200,000
$1,400,000
$1,600,000
$1,800,000
2008 2009 2010 2011 2012
Export Value (USD Thousand) ofHS Code 4202
Mexico Colombia Indonesia
Turkey Vietnam Myanmar
$-
$5,000
$10,000
$15,000
$20,000
$25,000
2008 2009 2010 2011 2012
Export Value (USD Thousand) ofHS Code 5404
Mexico Colombia Indonesia
Turkey Vietnam Myanmar
$-
$100,000
$200,000
$300,000
$400,000
$500,000
$600,000
$700,000
$800,000
$900,000
$1,000,000
2008 2009 2010 2011 2012
Export Value (USD Thousand) ofHS Code 5407
Mexico Colombia Indonesia
Turkey Vietnam Myanmar
Source: ITC

Executive Summary – Labour wages -1
6
© 2013 Dragon Sourcing. All rights reserved.
$-
$100
$200
$300
$400
$500
$600
$700
$800
$900
$1,000
Mexico Colombia Indonesia Turkey Vietnam China Myanmar
Monthly Labour wages in USD in year 2012
Average Manufacturing wage Minimum wage
Source: Ministry of Labour & Social Security of all countries
Executive Summary – Labour wages -2
7
© 2013 Dragon Sourcing. All rights reserved.
$-
$100
$200
$300
$400
$500
$600
$700
$800
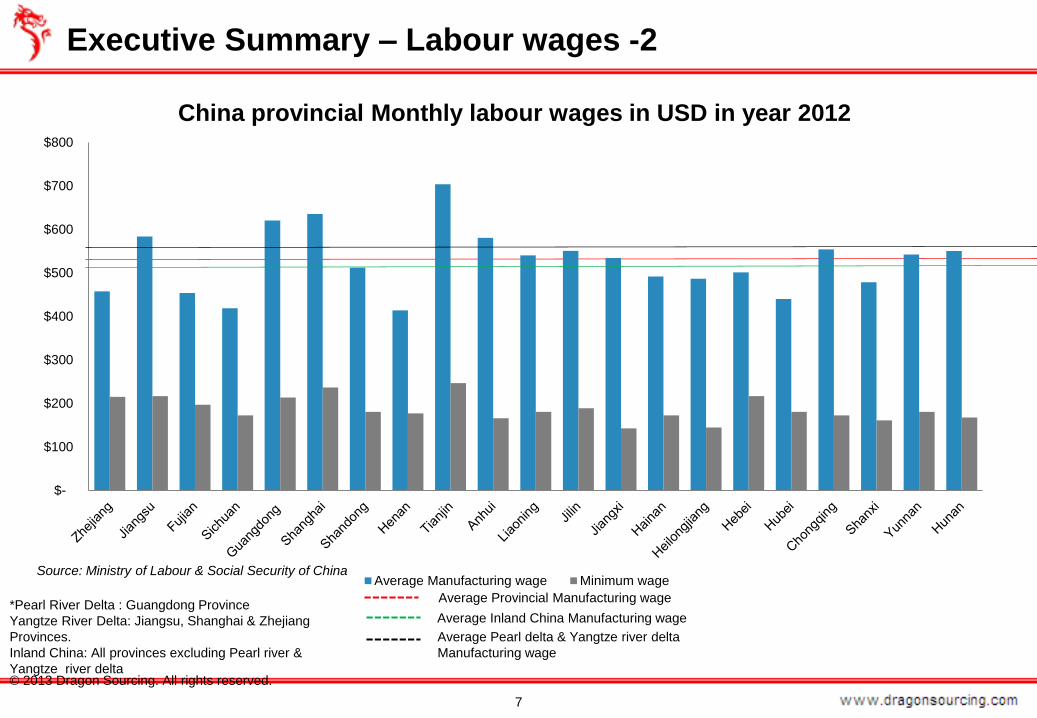
China provincial Monthly labour wages in USD in year 2012
Average Manufacturing wage Minimum wage
Average Provincial Manufacturing wage
Average Inland China Manufacturing wage
Average Pearl delta & Yangtze river delta
Manufacturing wage
*Pearl River Delta : Guangdong Province
Yangtze River Delta: Jiangsu, Shanghai & Zhejiang
Provinces.
Inland China: All provinces excluding Pearl river &
Yangtze river delta
Source: Ministry of Labour & Social Security of China

Executive Summary – Import & Export duty
8
© 2013 Dragon Sourcing. All rights reserved.
CountryImport Duty into USHS 4202.21.60.00
Import Duty into USHS 5404.19.80.40
Import Duty into USHS 5407.10.00.00
Import Duty into US 5407.51.00
Export Duty for Other HS 42 Series
Export Duty for Other HS 54 Series
China 10% 6.9% 13.6% 14.9% 0% 0%
Vietnam 10% 6.9% 13.6% 14.9% 0% 0%
Indonesia 10% 6.9% 13.6% 14.9% 0% 0%
Mexico 0% 0% 0% 0% 0% 0%
Turkey 10% 6.9% 13.6% 14.9% 0% 0%
Colombia 0% 0% 0% 0% 0% 0%
Myanmar 10% 6.9% 13.6% 14.9% 0% 0%
Source : Ministry of Trade & Commerce of all countries
United States International Trade Commission
European Commission Taxation & Customs Union
Sourcing Attractiveness of ‘Cut & Sew Bags’- Summary
9
© 2013 Dragon Sourcing. All rights reserved.
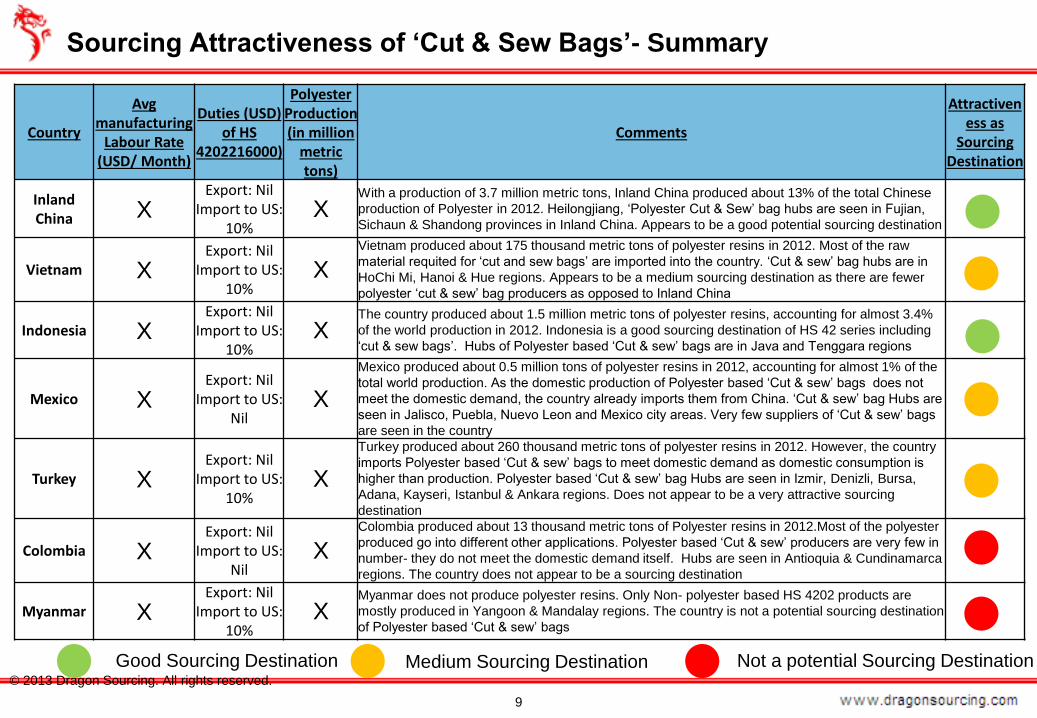
Country
Avgmanufacturing
Labour Rate (USD/ Month)
Duties (USD) of HS
4202216000)
Polyester Production (in million
metric tons)
Comments
Attractiveness as
Sourcing Destination
Inland China X
Export: NilImport to US:
10%X
With a production of 3.7 million metric tons, Inland China produced about 13% of the total Chinese
production of Polyester in 2012. Heilongjiang, ‘Polyester Cut & Sew’ bag hubs are seen in Fujian,
Sichaun & Shandong provinces in Inland China. Appears to be a good potential sourcing destination
Vietnam XExport: Nil
Import to US: 10%
XVietnam produced about 175 thousand metric tons of polyester resins in 2012. Most of the raw
material requited for ‘cut and sew bags’ are imported into the country. ‘Cut & sew’ bag hubs are in
HoChi Mi, Hanoi & Hue regions. Appears to be a medium sourcing destination as there are fewer
polyester ‘cut & sew’ bag producers as opposed to Inland China
Indonesia XExport: Nil
Import to US: 10%
XThe country produced about 1.5 million metric tons of polyester resins, accounting for almost 3.4%
of the world production in 2012. Indonesia is a good sourcing destination of HS 42 series including
‘cut & sew bags’. Hubs of Polyester based ‘Cut & sew’ bags are in Java and Tenggara regions
Mexico XExport: Nil
Import to US: Nil
X
Mexico produced about 0.5 million tons of polyester resins in 2012, accounting for almost 1% of the
total world production. As the domestic production of Polyester based ‘Cut & sew’ bags does not
meet the domestic demand, the country already imports them from China. ‘Cut & sew’ bag Hubs are
seen in Jalisco, Puebla, Nuevo Leon and Mexico city areas. Very few suppliers of ‘Cut & sew’ bags
are seen in the country
Turkey XExport: Nil
Import to US: 10%
X
Turkey produced about 260 thousand metric tons of polyester resins in 2012. However, the country
imports Polyester based ‘Cut & sew’ bags to meet domestic demand as domestic consumption is
higher than production. Polyester based ‘Cut & sew’ bag Hubs are seen in Izmir, Denizli, Bursa,
Adana, Kayseri, Istanbul & Ankara regions. Does not appear to be a very attractive sourcing
destination
Colombia XExport: Nil
Import to US: Nil
XColombia produced about 13 thousand metric tons of Polyester resins in 2012.Most of the polyester
produced go into different other applications. Polyester based ‘Cut & sew’ producers are very few in
number- they do not meet the domestic demand itself. Hubs are seen in Antioquia & Cundinamarca
regions. The country does not appear to be a sourcing destination
Myanmar XExport: Nil
Import to US: 10%
XMyanmar does not produce polyester resins. Only Non- polyester based HS 4202 products are
mostly produced in Yangoon & Mandalay regions. The country is not a potential sourcing destination
of Polyester based ‘Cut & sew’ bags
Good Sourcing Destination Medium Sourcing Destination Not a potential Sourcing Destination

Country Profiles
10
© 2013 Dragon Sourcing. All rights reserved.
China – Market Trends
11
© 2013 Dragon Sourcing. All rights reserved.
HS CodeExport duty from
China
Import duty into
USA
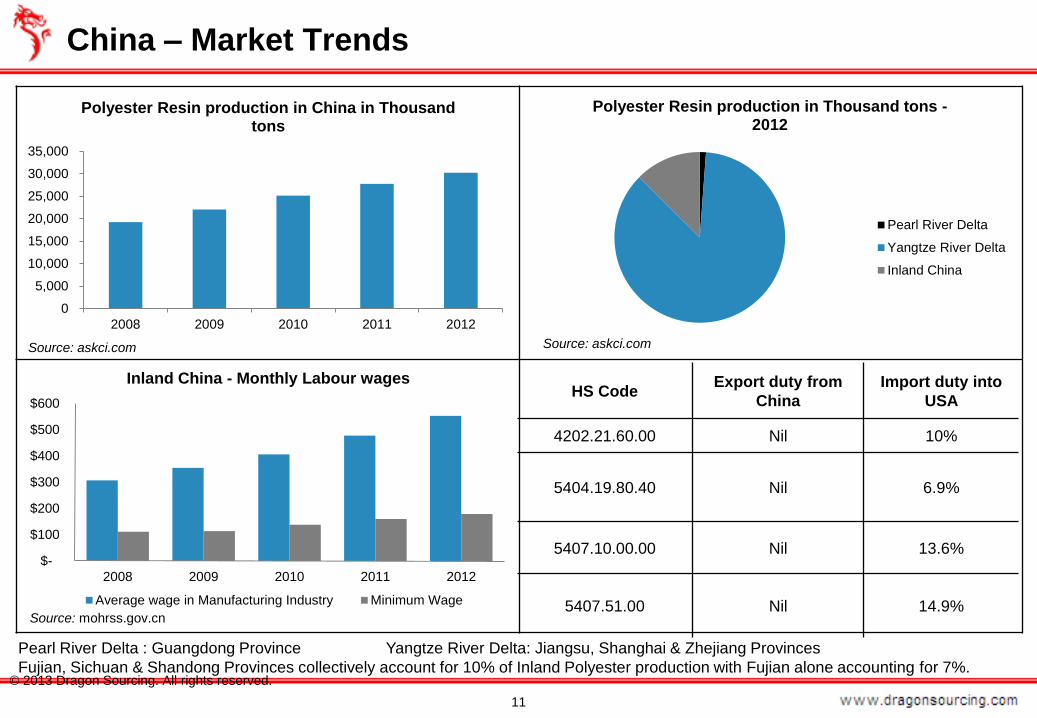
4202.21.60.00 Nil 10%
5404.19.80.40 Nil 6.9%
5407.10.00.00 Nil 13.6%
5407.51.00 Nil 14.9%
0
5,000
10,000
15,000
20,000
25,000
30,000
35,000
2008 2009 2010 2011 2012
Polyester Resin production in China in Thousand tons
Polyester Resin production in Thousand tons -2012
Pearl River Delta
Yangtze River Delta
Inland China
Pearl River Delta : Guangdong Province Yangtze River Delta: Jiangsu, Shanghai & Zhejiang Provinces
Fujian, Sichuan & Shandong Provinces collectively account for 10% of Inland Polyester production with Fujian alone accounting for 7%.
$-
$100
$200
$300
$400
$500
$600
2008 2009 2010 2011 2012
Inland China - Monthly Labour wages
Average wage in Manufacturing Industry Minimum Wage
Source: askci.com
Source: mohrss.gov.cn
Source: askci.com

Polyester production by provinces - 1
12
© 2013 Dragon Sourcing. All rights reserved.
0 5,000 10,000 15,000 20,000
Zhejiang
Jiangsu
Fujian
Polyester resin production in the Top 3 provinces (Thousand tons)
2012
2011
2010
2009
- 100 200 300 400 500 600
Sichuan
Guangdong
Shandong
Shanghai
Henan
Tianjin
Anhui
Liaoning
Jilin
Jiangxi
Hainan
Heilongjiang
Hebei
Hubei
Chongqing
Shanxi
Yunnan
Hunan
Xinjiang
Beijing
Polyester resin production in remaining 20 provinces (Thousand tons)
2012
2011
2010
2009
Source: askci.com
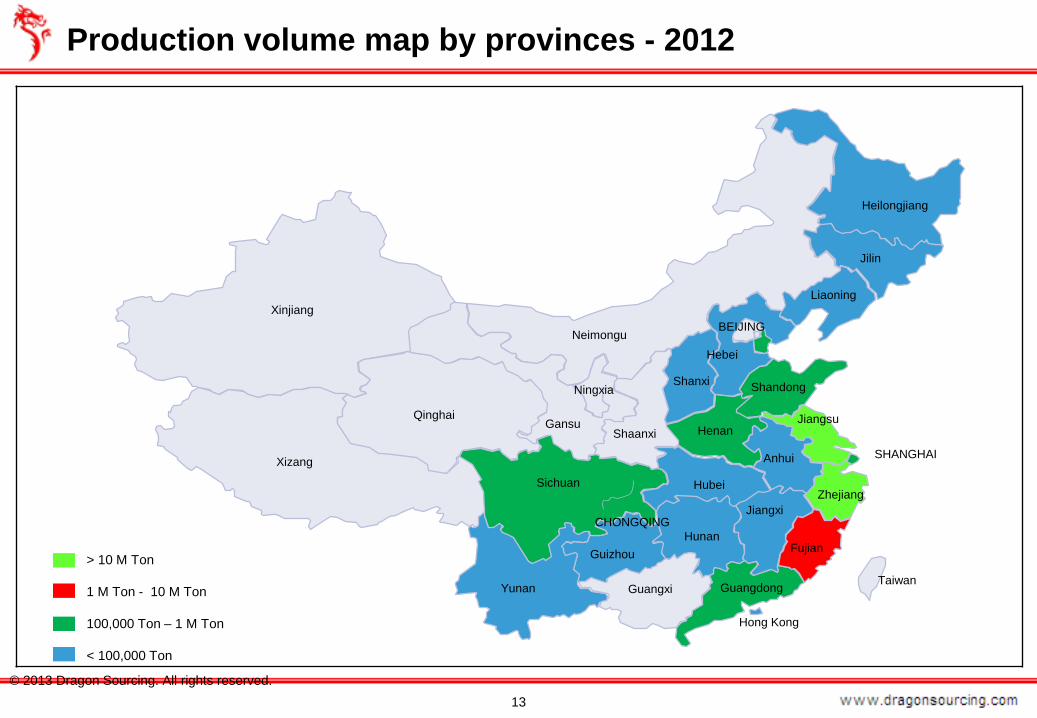
Production volume map by provinces - 2012
13
© 2013 Dragon Sourcing. All rights reserved.
Xinjiang
Gansu
Jiangxi
Zhejiang
BEIJING
Jiangsu
Guangxi
Hunan
Hubei
Qinghai
Ningxia
Shaanxi
Anhui
Fujian
Neimongu
ShanxiShandong
Xizang
Sichuan
Yunan
Guizhou
Henan
Jilin
Liaoning
Hebei
Guangdong
Gansu
SHANGHAI
Hong Kong
Taiwan
Heilongjiang
CHONGQING
Sichuan
> 10 M Ton
1 M Ton - 10 M Ton
100,000 Ton – 1 M Ton
< 100,000 Ton

14
© 2013 Dragon Sourcing. All rights reserved.
Xinjiang
Gansu
Jiangxi
Zhejiang
BEIJING
Jiangsu
Guangxi
Hunan
Hubei
Qinghai
Ningxia
Shaanxi
Anhui
Fujian
Neimongu
ShanxiShandong
Xizang
Sichuan
Yunan
Guizhou
Henan
Jilin
Liaoning
Hebei
Guangdong
Gansu
SHANGHAI
Hong Kong
Taiwan
Heilongjiang
CHONGQING
Sichuan
China- Supplier hubs for HS 4202

China – HS 4202- Exports & Imports
15
© 2013 Dragon Sourcing. All rights reserved.
$-
$5,000,000
$10,000,000
$15,000,000
$20,000,000
$25,000,000
$30,000,000
2008 2009 2010 2011 2012
Export & Import by Value (USD thousands) ofHS Code 4202
Export
Import
United States of America
27%
Japan7%
Germany6%Hong
Kong5%
United Kingdom
4%
Rest of world51%
HS 42- Export market of China 2011
Source: ITC
United Arab
Emirates6%
Pakistan5%
Vietnam5%Brazil
5%
South Korea4%
Rest of world75%
HS 54 - Export market of China 2011
• China appears to be good sourcing destination of Polyester resins
and Cut & Sew bags. However, non delta river provinces contribute
to only 1% of the total production of Polyester resin
• There appears to be significant government regulation when it
comes to the export of polyester products from China

China – HS 5404 & 5407- Exports & Imports
16
© 2013 Dragon Sourcing. All rights reserved.
$-
$20,000
$40,000
$60,000
$80,000
$100,000
$120,000
$140,000
$160,000
2008 2009 2010 2011 2012
Export & Import by Value (USD thousands) ofHS Code 5404
Export
Import
$-
$2,000,000
$4,000,000
$6,000,000
$8,000,000
$10,000,000
$12,000,000
2008 2009 2010 2011 2012
Export & Import by Value (USD thousands) ofHS Code 5407
Export
Import
Source: International Trade Center
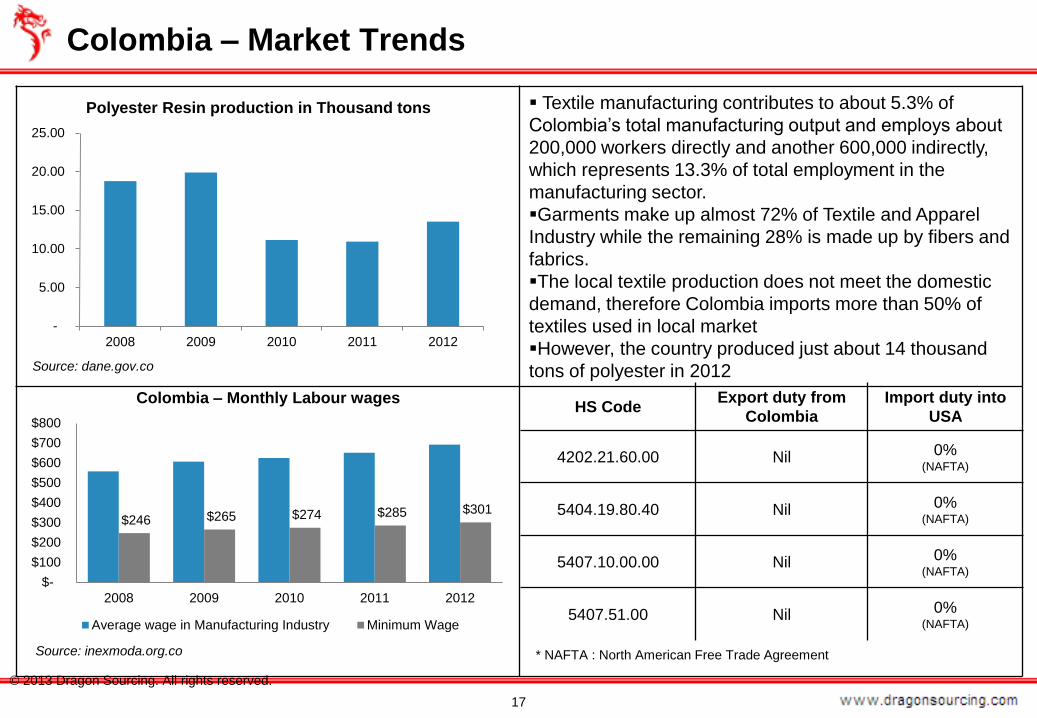
Textile manufacturing contributes to about 5.3% of
Colombia’s total manufacturing output and employs about
200,000 workers directly and another 600,000 indirectly,
which represents 13.3% of total employment in the
manufacturing sector.
Garments make up almost 72% of Textile and Apparel
Industry while the remaining 28% is made up by fibers and
fabrics.
The local textile production does not meet the domestic
demand, therefore Colombia imports more than 50% of
textiles used in local market
However, the country produced just about 14 thousand
tons of polyester in 2012
Colombia – Market Trends
17
© 2013 Dragon Sourcing. All rights reserved.
HS CodeExport duty from
Colombia
Import duty into
USA
4202.21.60.00 Nil 0% (NAFTA)
5404.19.80.40 Nil 0% (NAFTA)
5407.10.00.00 Nil 0% (NAFTA)
5407.51.00 Nil 0% (NAFTA)
* NAFTA : North American Free Trade Agreement
$246 $265 $274 $285 $301
$-
$100
$200
$300
$400
$500
$600
$700
$800
2008 2009 2010 2011 2012
Colombia – Monthly Labour wages
Average wage in Manufacturing Industry Minimum Wage
-
5.00
10.00
15.00
20.00
25.00
2008 2009 2010 2011 2012
Polyester Resin production in Thousand tons
Source: dane.gov.co
Source: inexmoda.org.co
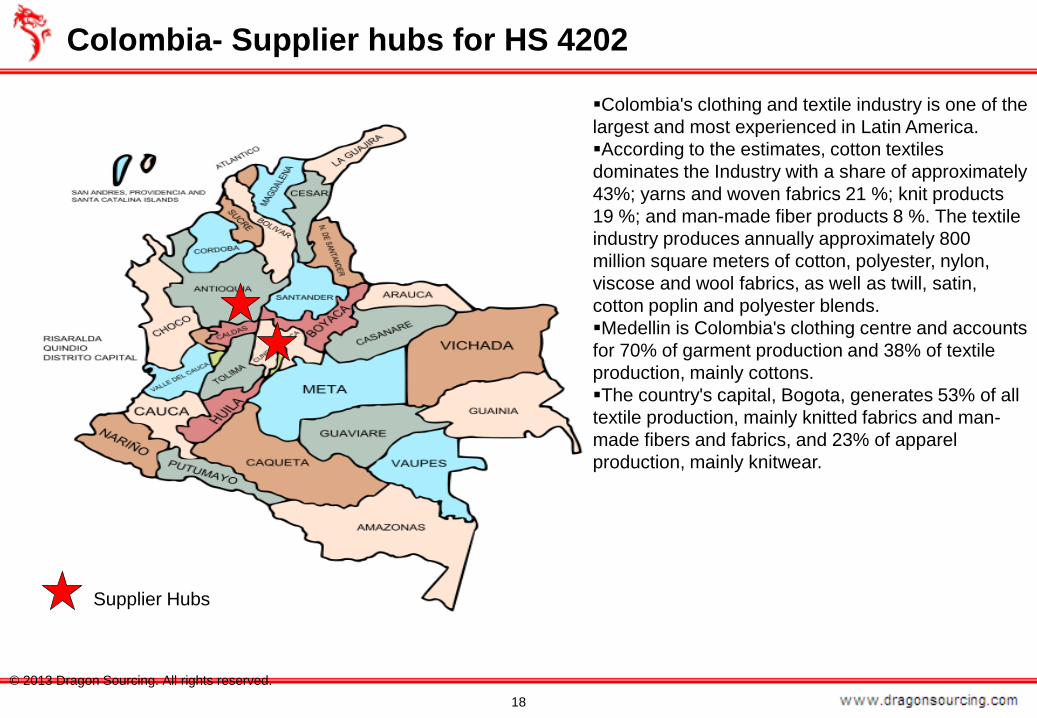
Colombia- Supplier hubs for HS 4202
18
© 2013 Dragon Sourcing. All rights reserved.
Colombia's clothing and textile industry is one of the
largest and most experienced in Latin America.
According to the estimates, cotton textiles
dominates the Industry with a share of approximately
43%; yarns and woven fabrics 21 %; knit products
19 %; and man-made fiber products 8 %. The textile
industry produces annually approximately 800
million square meters of cotton, polyester, nylon,
viscose and wool fabrics, as well as twill, satin,
cotton poplin and polyester blends.
Medellin is Colombia's clothing centre and accounts
for 70% of garment production and 38% of textile
production, mainly cottons.
The country's capital, Bogota, generates 53% of all
textile production, mainly knitted fabrics and man-
made fibers and fabrics, and 23% of apparel
production, mainly knitwear.
Supplier Hubs
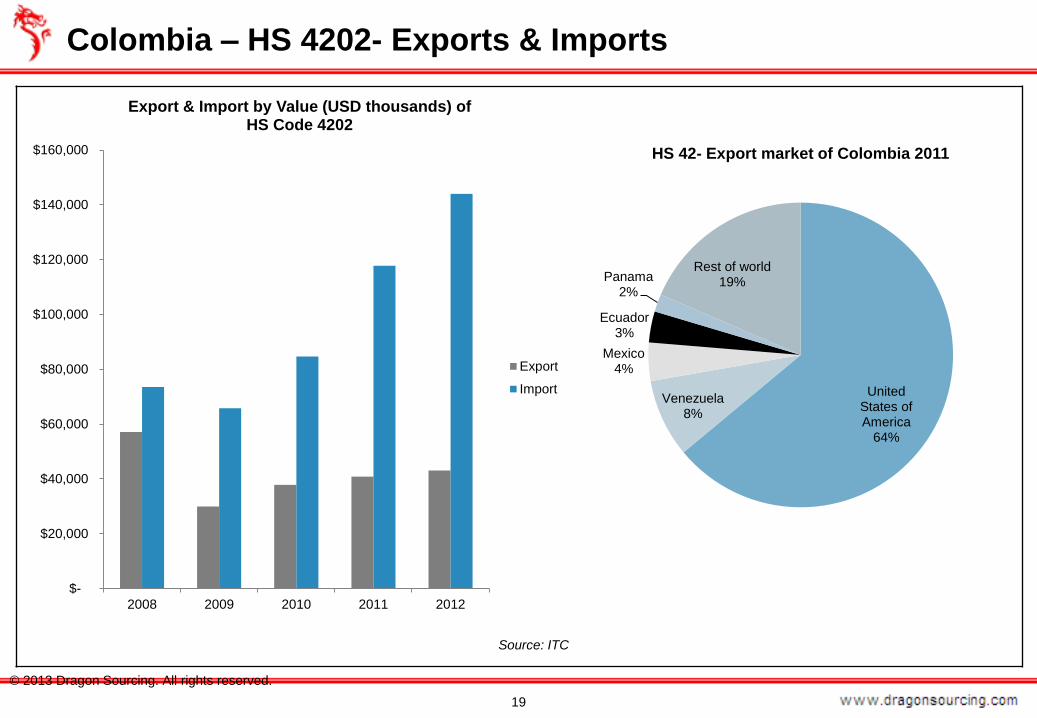
Colombia – HS 4202- Exports & Imports
19
© 2013 Dragon Sourcing. All rights reserved.
$-
$20,000
$40,000
$60,000
$80,000
$100,000
$120,000
$140,000
$160,000
2008 2009 2010 2011 2012
Export & Import by Value (USD thousands) ofHS Code 4202
Export
Import United States of America
64%
Venezuela8%
Mexico4%
Ecuador3%
Panama2%
Rest of world19%
HS 42- Export market of Colombia 2011
Source: ITC
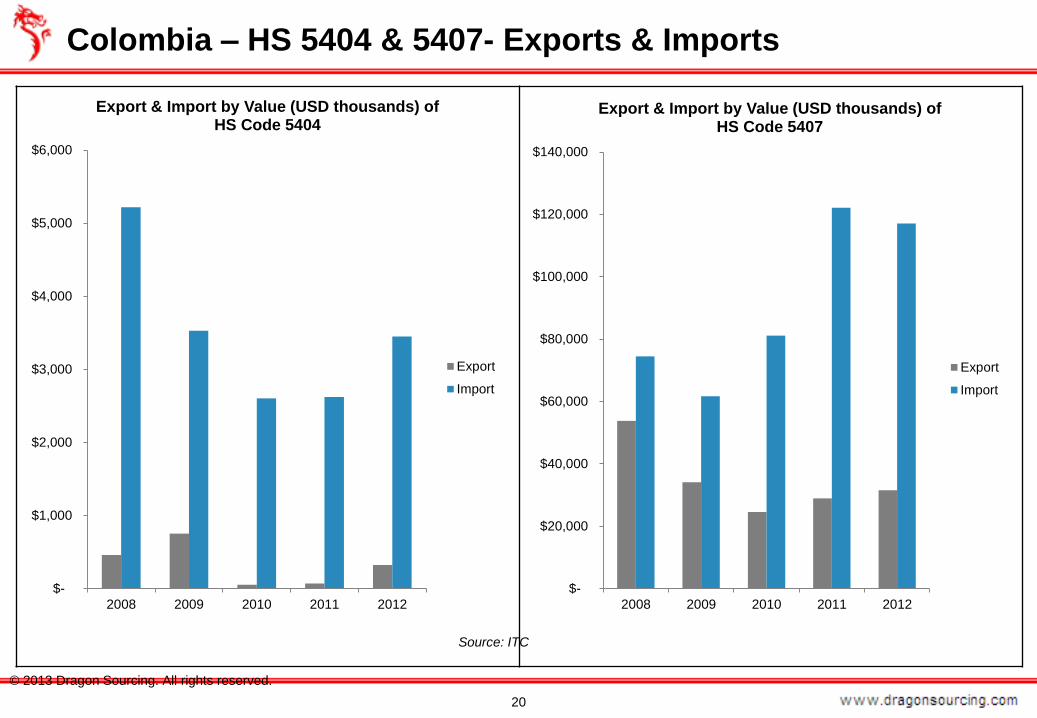
Colombia – HS 5404 & 5407- Exports & Imports
20
© 2013 Dragon Sourcing. All rights reserved.
$-
$1,000
$2,000
$3,000
$4,000
$5,000
$6,000
2008 2009 2010 2011 2012
Export & Import by Value (USD thousands) ofHS Code 5404
Export
Import
$-
$20,000
$40,000
$60,000
$80,000
$100,000
$120,000
$140,000
2008 2009 2010 2011 2012
Export & Import by Value (USD thousands) ofHS Code 5407
Export
Import
Source: ITC

Colombia – HS 54- Export Markets
21
© 2013 Dragon Sourcing. All rights reserved.
Peru29%
Ecuador20%
Venezuela13%
Chile6%
Mexico6%
Rest of world26%
HS 54 - Export market of Colombia 2011
Source: ITC

Indonesia is a reasonably large producer of synthetic fibers in Asia.
The country produced about 1.5 million tons of polyester, accounting
for 3.4% of the world production in 2012
The country has 18 companies producing synthetic fiber with total
capacity of 588,000 tons of polyester staple fiber, 833,000 tons of
polyester filament yarn, and 32,000 tons of nylon filament yarn per
year.
These factories are located in West Java, Central Java and East
Java.
Big business players in synthetic fiber industry include Polysindo,
Indorama, GT Petrochem (Polychem), and TIFICO. Polysindo is the
largest with an annual capacity to produce 350,000 tons of PFY and
PSF, followed by Indorama with a capacity of 318,000 tons,
Polychem with a capacity of 169,000 tons and TIFICO with a
capacity of 138,000 tons a year.
Indonesia – Market Trends
22
© 2013 Dragon Sourcing. All rights reserved.
HS CodeExport duty from
Indonesia
Import duty into
USA
4202.21.60.00 Nil 10%
5404.19.80.40 Nil 6.9%
5407.10.00.00 Nil 13.6%
5407.51.00 Nil 14.9%
$-
$100
$200
$300
$400
$500
$600
2008 2009 2010 2011 2012
Indonesia – Monthly Labour Wages
Average wage in Manufacturing Industry Minimum Wage
Source: JETRO
Source: yarnsandfibers.com
-
200
400
600
800
1,000
1,200
1,400
1,600
1,800
2008 2009 2010 2011 2012
Polyester Resin production in Thousand tons

Indonesia- Supplier hubs for HS 4202
23
© 2013 Dragon Sourcing. All rights reserved.
Riau
Islands
Aceh
North
Sumatra
Riau
West
Sumatra Jambi
Bengkulu
South
Sumatra
Bangka-
Belitung
Lampung
West
Kalimantan
Banten
Jakarta
West
Java
Yogyakarta
Central
Java East
Java
Bali
Central
Kalimantan
East
Kalimantan
South
Kalimantan
West Nusa
Tenggara
East Nusa
Tenggara
South
Sulawesi
Southeast
Sulawesi
West
Sulawesi
Central
Sulawesi
North
SulawesiGorontalo
Maluku
North
Maluku
West
Papua
Papua
Supplier Hubs
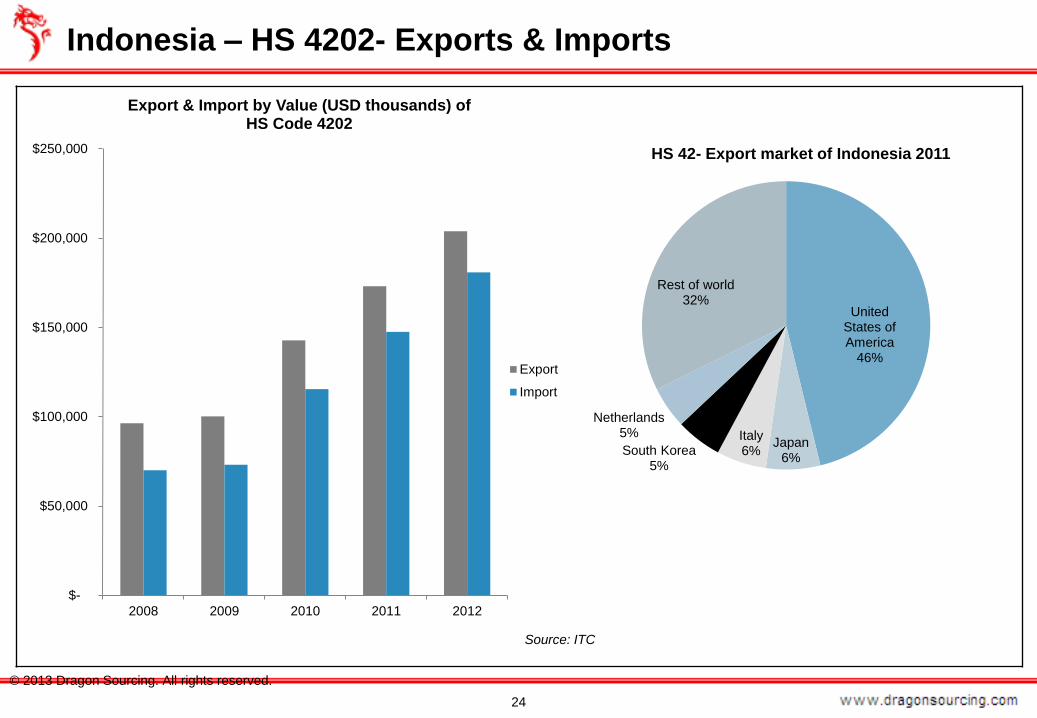
Indonesia – HS 4202- Exports & Imports
24
© 2013 Dragon Sourcing. All rights reserved.
$-
$50,000
$100,000
$150,000
$200,000
$250,000
2008 2009 2010 2011 2012
Export & Import by Value (USD thousands) ofHS Code 4202
Export
Import
United States of America
46%
Japan6%
Italy6%South Korea
5%
Netherlands5%
Rest of world32%
HS 42- Export market of Indonesia 2011
Source: ITC

Indonesia – HS 5404 & 5407- Exports & Imports
25
© 2013 Dragon Sourcing. All rights reserved.
$-
$5,000
$10,000
$15,000
$20,000
$25,000
$30,000
$35,000
2008 2009 2010 2011 2012
Export & Import by Value (USD thousands) ofHS Code 5404
Export
Import
$-
$100,000
$200,000
$300,000
$400,000
$500,000
$600,000
$700,000
$800,000
$900,000
2008 2009 2010 2011 2012
Export & Import by Value (USD thousands) ofHS Code 5407
Export
Import
Source: ITC

Indonesia – HS 54- Export Markets
26
© 2013 Dragon Sourcing. All rights reserved.
Turkey21% United Arab
Emirates11%
Japan7%
Saudi Arabia6%
Thailand5%
Rest of world50%
HS 54- Export market of Indonesia 2011
Source: ITC

The Mexican textile industry accounts for about 6% of the country’s
total manufacturing GDP. These sectors account for nearly 20% of
all manufacturing employment in Mexico and are concentrated in the
central and north eastern parts of the country.
Its geographical location and extended network of Free Trade
Agreements (FTAs) make it a strategic hub from which to export to
major markets in North and South America, the EU, EFTA and
beyond.
The country produced about 542 thousand tons of polyester resins
in 2012, accounting for close to 2% of the total world production
Mexico – Market Trends
27
© 2013 Dragon Sourcing. All rights reserved.
HS CodeExport duty from
Mexico
Import duty into
USA
4202.21.60.00 Nil 0% (NAFTA)
5404.19.80.40 Nil 0% (NAFTA)
5407.10.00.00 Nil 0% (NAFTA)
5407.51.00 Nil 0% (NAFTA)
* NAFTA : North American Free Trade Agreement
$-
$100
$200
$300
$400
$500
$600
$700
2008 2009 2010 2011 2012
Mexico - Monthly Labour Wages
Average wage in Manufacturing Industry Minimum Wage
440
460
480
500
520
540
560
580
600
2008 2009 2010 2011 2012
Polyester Resin production in Thousand tons
Source: inegi.org.mx
Source: inegi.org.mx

Mexico- Supplier hubs for HS 4202
28
© 2013 Dragon Sourcing. All rights reserved.
Supplier Hubs

Mexico – HS 4202- Exports & Imports
29
© 2013 Dragon Sourcing. All rights reserved.
$-
$100,000
$200,000
$300,000
$400,000
$500,000
$600,000
2008 2009 2010 2011 2012
Export & Import by Value (USD thousands) ofHS Code 4202
Export
Import
United States of America
91%
France1%
United Kingdom
1%
Guatemala1%
Rest of world6%
HS 42- Export market of Mexico 2011
Source: ITC
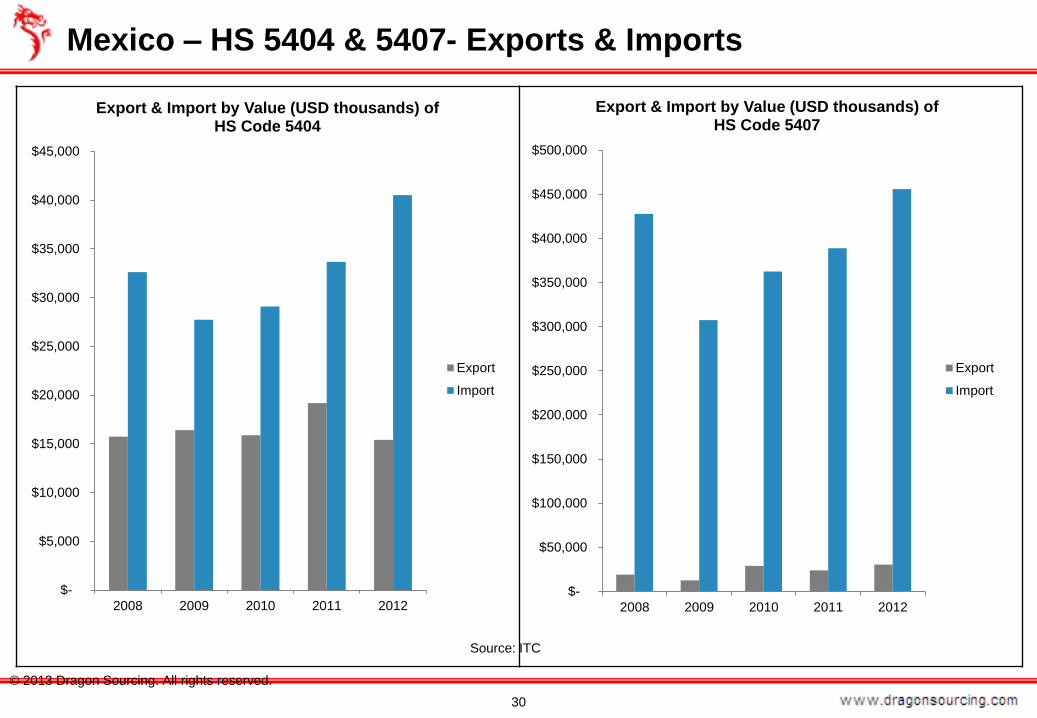
Mexico – HS 5404 & 5407- Exports & Imports
30
© 2013 Dragon Sourcing. All rights reserved.
$-
$5,000
$10,000
$15,000
$20,000
$25,000
$30,000
$35,000
$40,000
$45,000
2008 2009 2010 2011 2012
Export & Import by Value (USD thousands) ofHS Code 5404
Export
Import
$-
$50,000
$100,000
$150,000
$200,000
$250,000
$300,000
$350,000
$400,000
$450,000
$500,000
2008 2009 2010 2011 2012
Export & Import by Value (USD thousands) ofHS Code 5407
Export
Import
Source: ITC
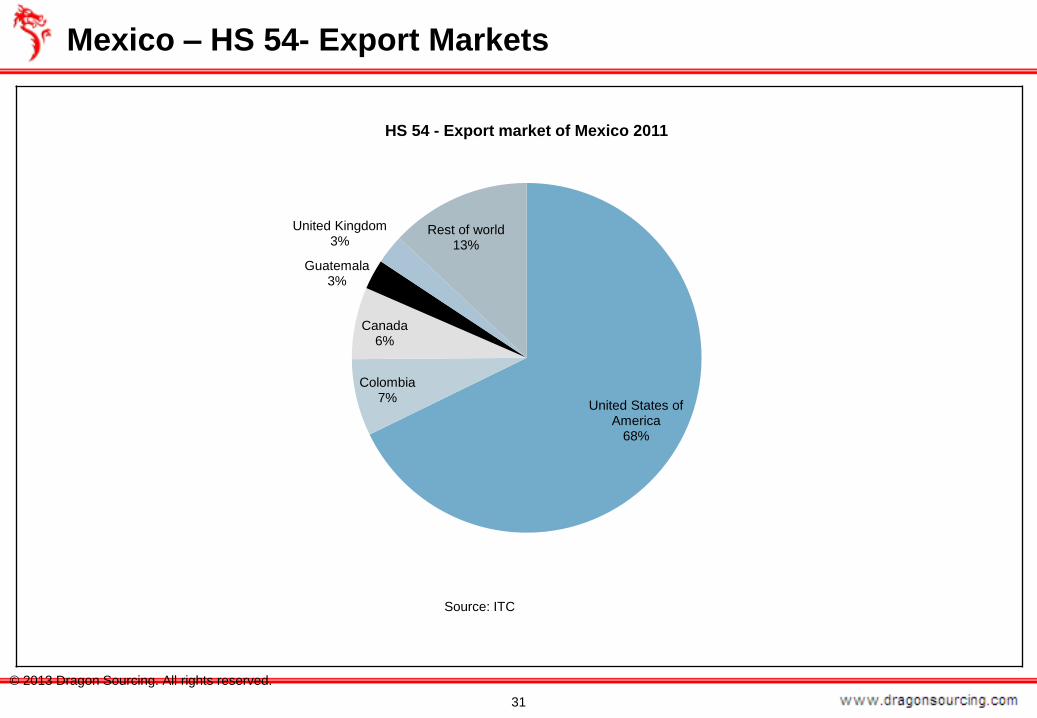
Mexico – HS 54- Export Markets
31
© 2013 Dragon Sourcing. All rights reserved.
United States of America
68%
Colombia7%
Canada6%
Guatemala3%
United Kingdom3%
Rest of world13%
HS 54 - Export market of Mexico 2011
Source: ITC
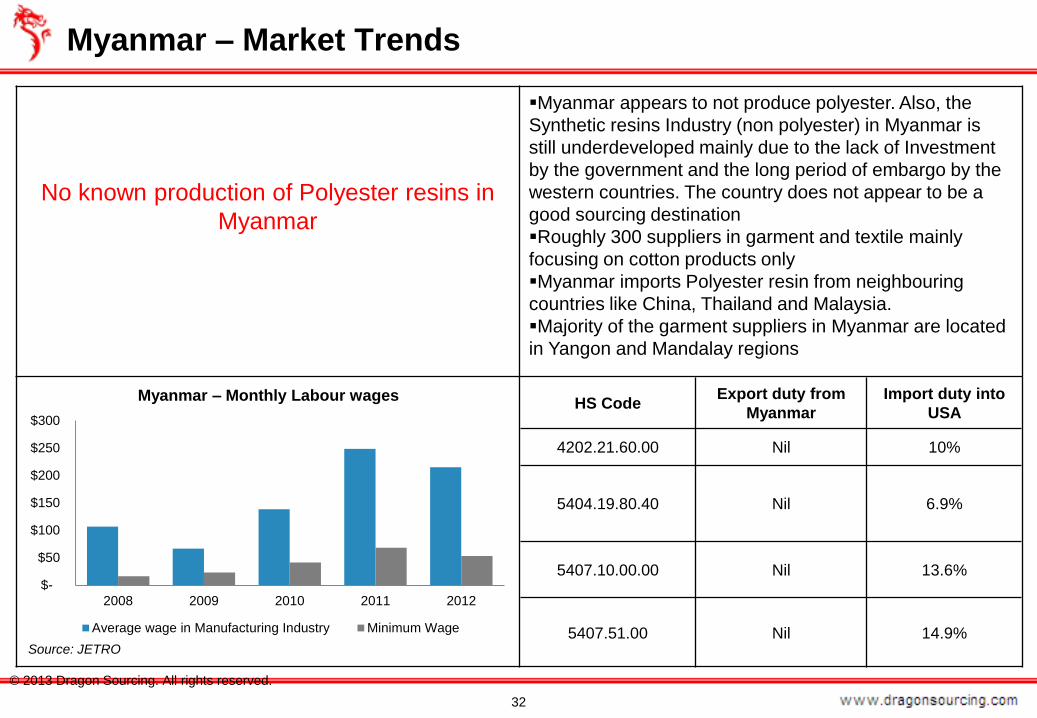
No known production of Polyester resins in
Myanmar
Myanmar appears to not produce polyester. Also, the
Synthetic resins Industry (non polyester) in Myanmar is
still underdeveloped mainly due to the lack of Investment
by the government and the long period of embargo by the
western countries. The country does not appear to be a
good sourcing destination
Roughly 300 suppliers in garment and textile mainly
focusing on cotton products only
Myanmar imports Polyester resin from neighbouring
countries like China, Thailand and Malaysia.
Majority of the garment suppliers in Myanmar are located
in Yangon and Mandalay regions
Myanmar – Market Trends
32
© 2013 Dragon Sourcing. All rights reserved.
HS CodeExport duty from
Myanmar
Import duty into
USA
4202.21.60.00 Nil 10%
5404.19.80.40 Nil 6.9%
5407.10.00.00 Nil 13.6%
5407.51.00 Nil 14.9%
$-
$50
$100
$150
$200
$250
$300
2008 2009 2010 2011 2012
Myanmar – Monthly Labour wages
Average wage in Manufacturing Industry Minimum Wage
Source: JETRO
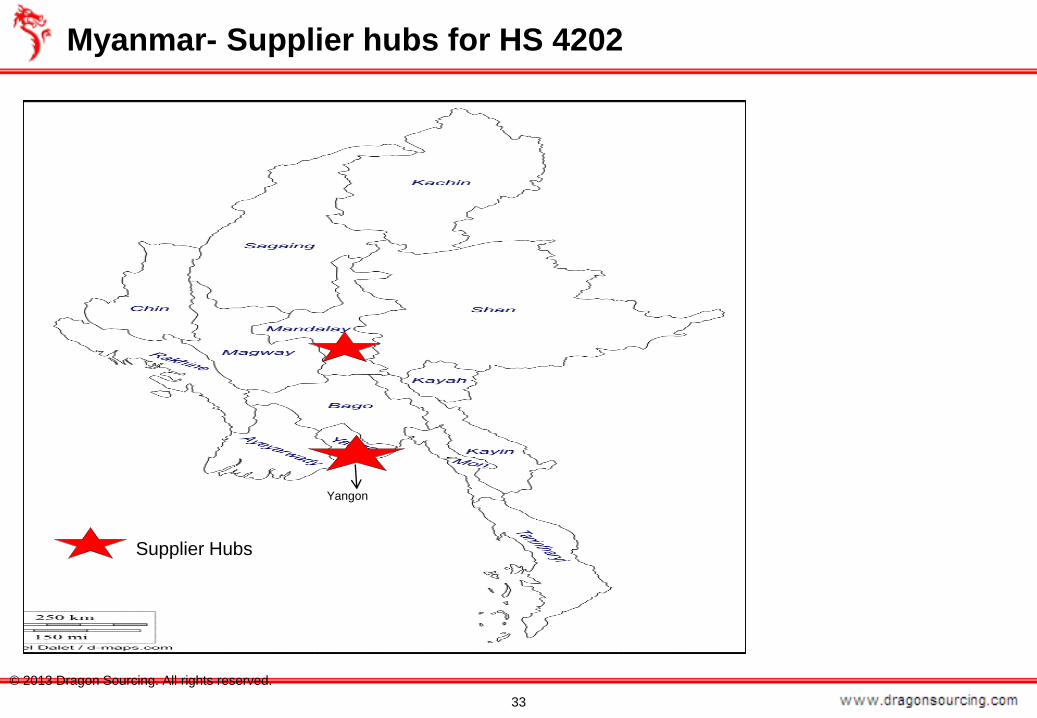
Myanmar- Supplier hubs for HS 4202
33
© 2013 Dragon Sourcing. All rights reserved.
Yangon
Supplier Hubs
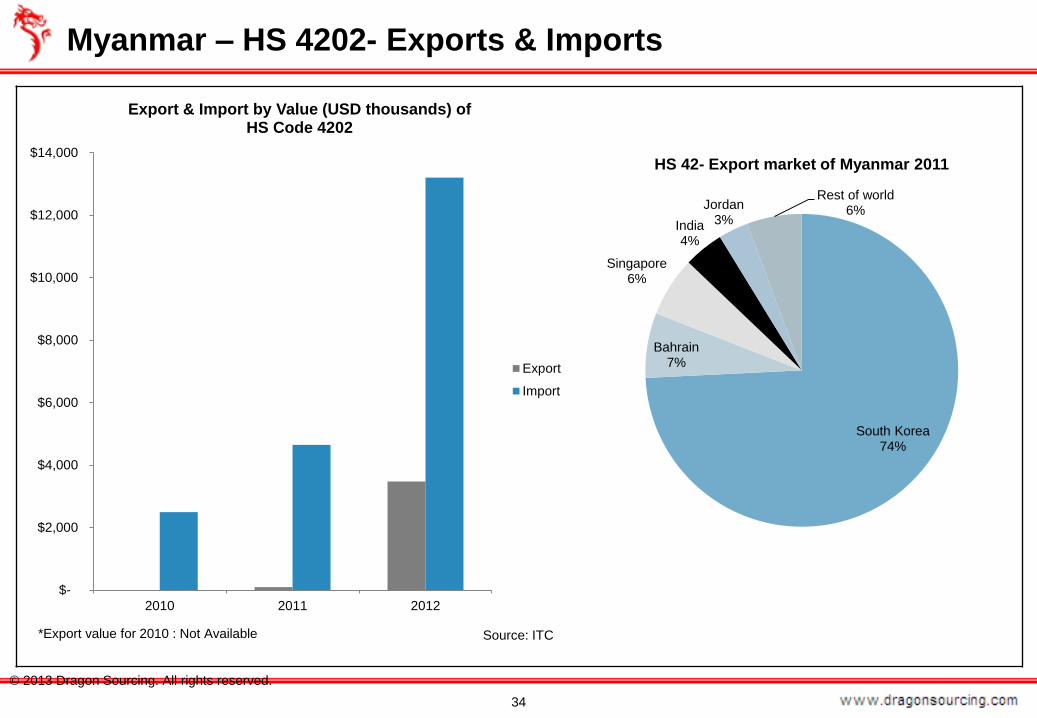
Myanmar – HS 4202- Exports & Imports
34
© 2013 Dragon Sourcing. All rights reserved.
$-
$2,000
$4,000
$6,000
$8,000
$10,000
$12,000
$14,000
2010 2011 2012
Export & Import by Value (USD thousands) ofHS Code 4202
Export
Import
South Korea74%
Bahrain7%
Singapore6%
India4%
Jordan3%
Rest of world6%
HS 42- Export market of Myanmar 2011
*Export value for 2010 : Not Available Source: ITC
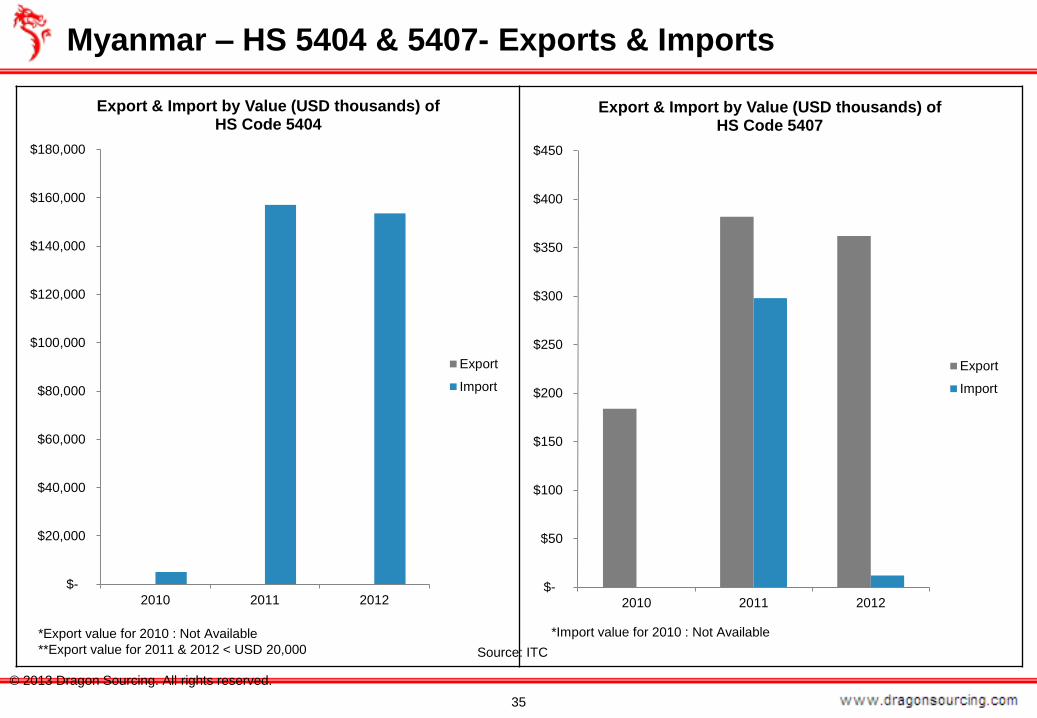
Myanmar – HS 5404 & 5407- Exports & Imports
35
© 2013 Dragon Sourcing. All rights reserved.
$-
$20,000
$40,000
$60,000
$80,000
$100,000
$120,000
$140,000
$160,000
$180,000
2010 2011 2012
Export & Import by Value (USD thousands) ofHS Code 5404
Export
Import
*Export value for 2010 : Not Available
**Export value for 2011 & 2012 < USD 20,000
$-
$50
$100
$150
$200
$250
$300
$350
$400
$450
2010 2011 2012
Export & Import by Value (USD thousands) ofHS Code 5407
Export
Import
*Import value for 2010 : Not Available
Source: ITC
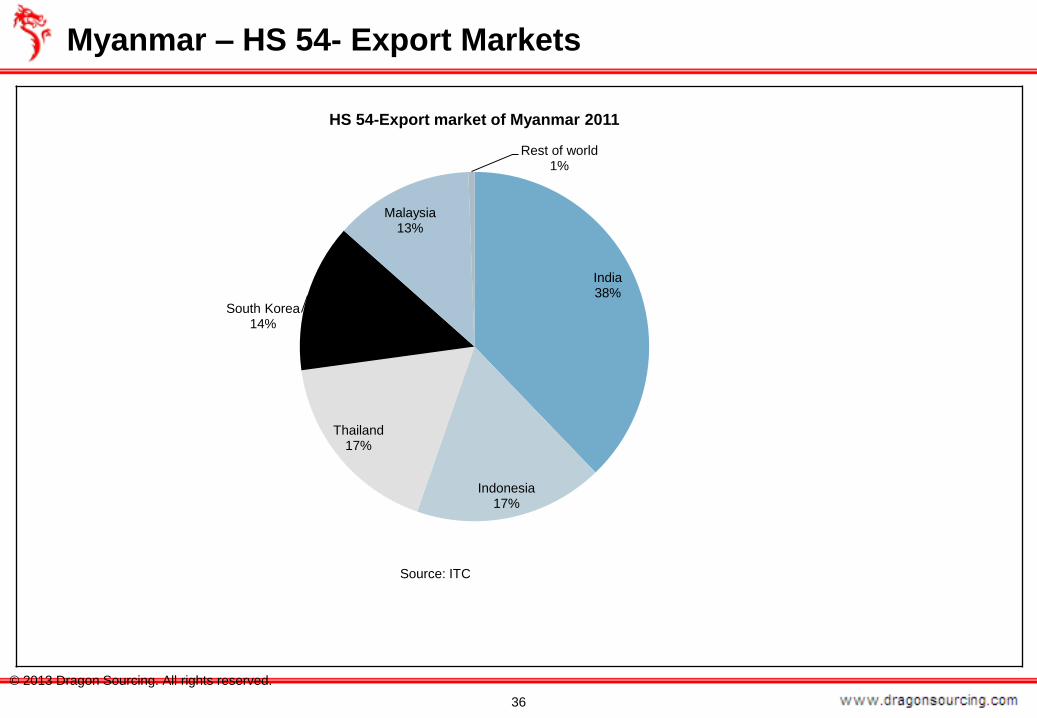
Myanmar – HS 54- Export Markets
36
© 2013 Dragon Sourcing. All rights reserved.
India38%
Indonesia17%
Thailand17%
South Korea14%
Malaysia13%
Rest of world1%
HS 54-Export market of Myanmar 2011
Source: ITC
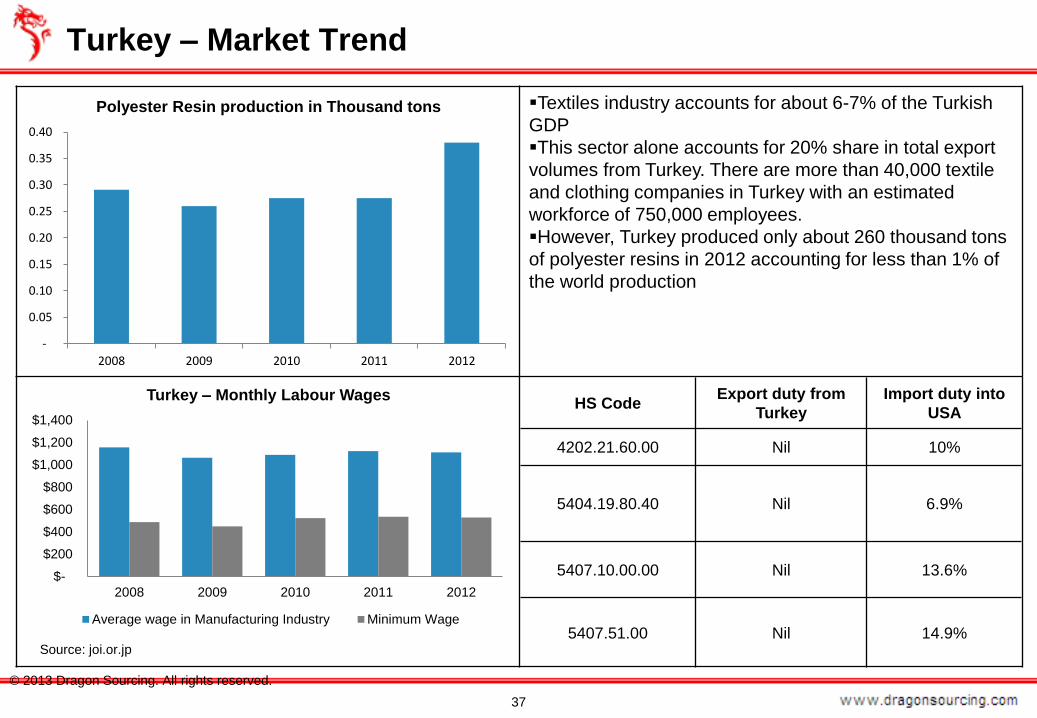
Textiles industry accounts for about 6-7% of the Turkish
GDP
This sector alone accounts for 20% share in total export
volumes from Turkey. There are more than 40,000 textile
and clothing companies in Turkey with an estimated
workforce of 750,000 employees.
However, Turkey produced only about 260 thousand tons
of polyester resins in 2012 accounting for less than 1% of
the world production
Turkey – Market Trend
37
© 2013 Dragon Sourcing. All rights reserved.
HS CodeExport duty from
Turkey
Import duty into
USA
4202.21.60.00 Nil 10%
5404.19.80.40 Nil 6.9%
5407.10.00.00 Nil 13.6%
5407.51.00 Nil 14.9%
$-
$200
$400
$600
$800
$1,000
$1,200
$1,400
2008 2009 2010 2011 2012
Turkey – Monthly Labour Wages
Average wage in Manufacturing Industry Minimum Wage
Source: joi.or.jp
-
0.05
0.10
0.15
0.20
0.25
0.30
0.35
0.40
2008 2009 2010 2011 2012
Polyester Resin production in Thousand tons
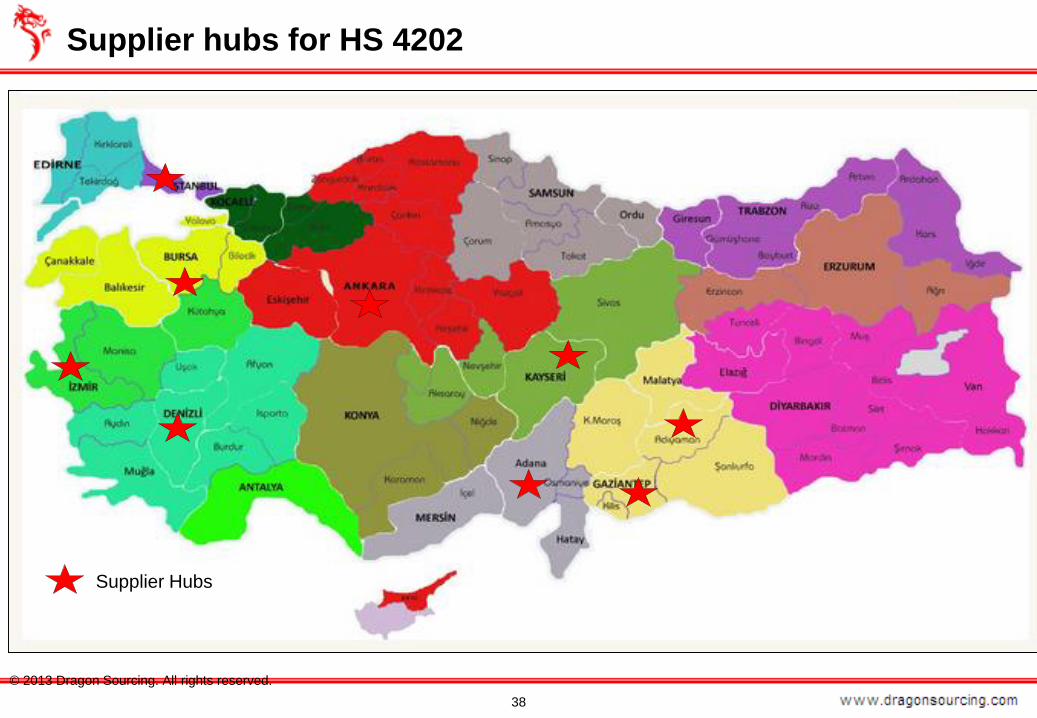
Supplier hubs for HS 4202
38
© 2013 Dragon Sourcing. All rights reserved.
Supplier Hubs
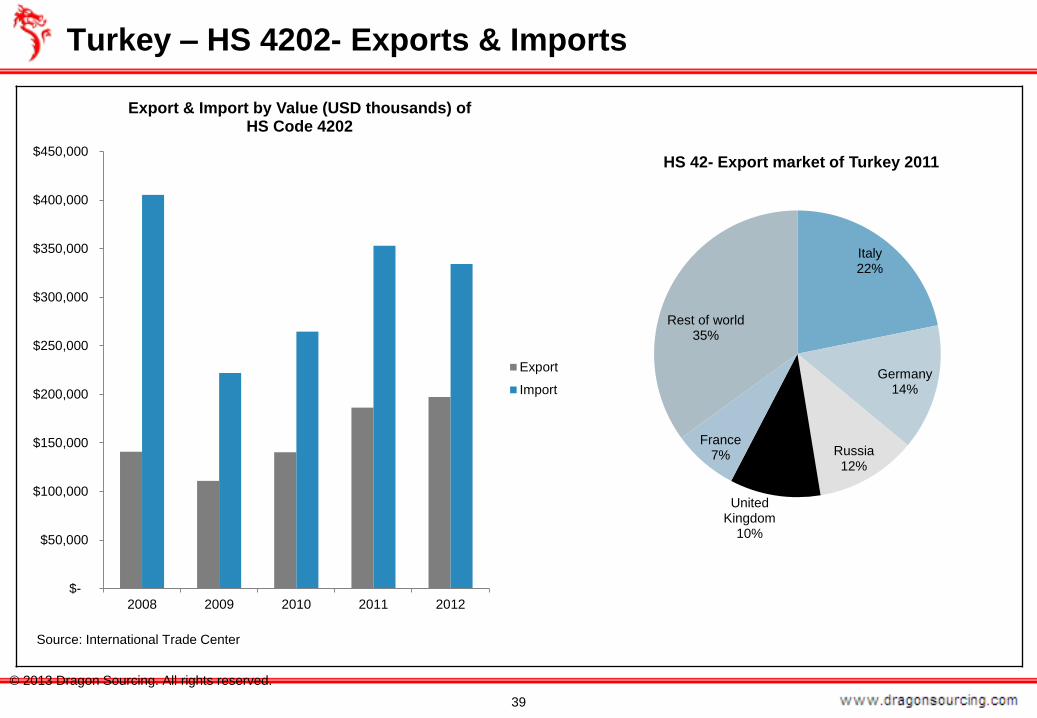
Turkey – HS 4202- Exports & Imports
39
© 2013 Dragon Sourcing. All rights reserved.
$-
$50,000
$100,000
$150,000
$200,000
$250,000
$300,000
$350,000
$400,000
$450,000
2008 2009 2010 2011 2012
Export & Import by Value (USD thousands) ofHS Code 4202
Export
Import
Italy22%
Germany14%
Russia12%
United Kingdom
10%
France7%
Rest of world35%
HS 42- Export market of Turkey 2011
Source: International Trade Center

Turkey – HS 5404 & 5407- Exports & Imports
40
© 2013 Dragon Sourcing. All rights reserved.
$-
$5,000
$10,000
$15,000
$20,000
$25,000
$30,000
$35,000
$40,000
2008 2009 2010 2011 2012
Export & Import by Value (USD thousands) ofHS Code 5404
Export
Import
$-
$100,000
$200,000
$300,000
$400,000
$500,000
$600,000
$700,000
$800,000
$900,000
$1,000,000
2008 2009 2010 2011 2012
Export & Import by Value (USD thousands) ofHS Code 5407
Export
Import
Source: ITC
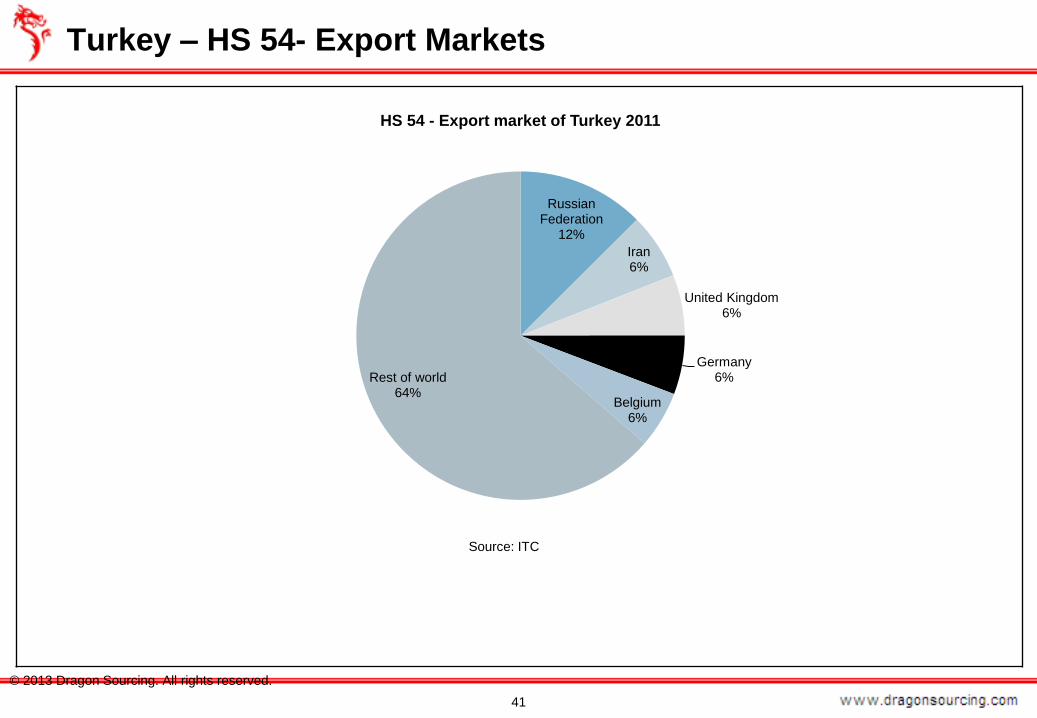
Turkey – HS 54- Export Markets
41
© 2013 Dragon Sourcing. All rights reserved.
Russian Federation
12%
Iran6%
United Kingdom6%
Germany6%
Belgium6%
Rest of world64%
HS 54 - Export market of Turkey 2011
Source: ITC

Vietnam’s polyester industry appears to be nascent, but
growing. The country produced about 175 thousand tons
of polyester resin in 2012, accounting for less than 0.5% of
the total world production of polyester
Vietnam – Market Trends
42
© 2013 Dragon Sourcing. All rights reserved.
HS CodeExport duty from
Vietnam
Import duty into
USA
4202.21.60.00 Nil 10%
5404.19.80.40 Nil 6.9%
5407.10.00.00 Nil 13.6%
5407.51.00 Nil 14.9%
$-
$50
$100
$150
$200
$250
$300
$350
$400
2008 2009 2010 2011 2012
Vietnam – Monthly Labour Wages
Average wage in Manufacturing Industry Minimum Wage
Source: JETRO
0.16
0.16
0.16
0.17
0.17
0.17
0.17
0.17
0.18
2008 2009 2010 2011 2012
Polyester Resin production in Thousand tons

Supplier hubs for HS 42
43
© 2013 Dragon Sourcing. All rights reserved.
1. Lai Chau
2. Lao Cai
3. Ha Giang
4. Son La
5. Yen Bai
6. Tuyen Quang
7. Bac Can
8. Cao Bang
9. Lang Son
10. Thai Nguyen
11. Vinh Yen
12. Viet Tri
13. Ha Dong
14. Ha Noi
15. Hung Yen
16. Bac Ninh
17. Bac Giang
18. Hai Duong
19. Ha Lang
20. Hoa Binh
21. Ha Nam
22. Hai Phong
23. Thai Binh
24. Nam Dinh
25. Ninh Binh
26. Thanh Hoa
27. Vinh
28. Ha Tinh
29. Dong Hoi
30. Dong Ha
31. Hue
32. Da Nang
33. Tam Ky
34. Kon Tum
35. Quang Ngai
36. Ply Cu
37. Quy Nhon
38. Tuy Hoa
39. Buon Ma Thuot
40. Nha Trang
41. Da Lat
42. Phan Rang-Thap Cham
43. Phan Thiet
44. Dong Xoal
45. Dong Nai
46. Tay Ninh
47. Binh Duong
48. Tan an
49. Ho Chi Minh Saigon)
50. Vung Tau
51. Long Xuyen
52. Cao Lanh
53. My Tho
54. Ben Tre
55. Rach Gia
56. Can Tho
57. Vinh Long
58. Tra Vinh
59. Soc Trang
60. Bac Lieu
61. Ca Mau
12
3
4
56
8
910
1112
21
25
13
14
17
7
47
48
53
61
5756
1516 18
19
2022
2324
26
27
28
29
30
3132
33
34
35
3637
38
39
40
41 42
43
44
45
46
49
5051 52
5455
60
5958

Vietnam – HS 4202- Exports & Imports
44
© 2013 Dragon Sourcing. All rights reserved.
United States of America
27%
Japan12%
Germany10%
France7%
Belgium7%
Rest of world37%
HS 42- Export market of Vietnam 2011
$-
$200,000
$400,000
$600,000
$800,000
$1,000,000
$1,200,000
$1,400,000
$1,600,000
$1,800,000
2008 2009 2010 2011 2012
Export & Import by Value (USD thousands) ofHS Code 4202
Export
Import
Source: ITC
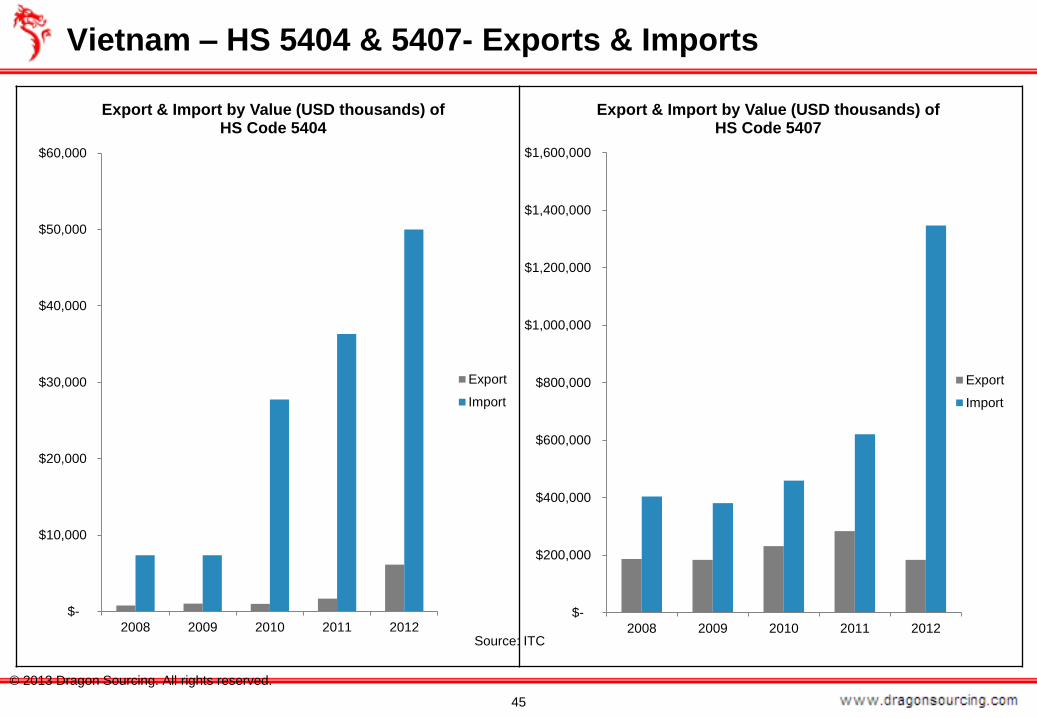
Vietnam – HS 5404 & 5407- Exports & Imports
45
© 2013 Dragon Sourcing. All rights reserved.
$-
$10,000
$20,000
$30,000
$40,000
$50,000
$60,000
2008 2009 2010 2011 2012
Export & Import by Value (USD thousands) ofHS Code 5404
Export
Import
$-
$200,000
$400,000
$600,000
$800,000
$1,000,000
$1,200,000
$1,400,000
$1,600,000
2008 2009 2010 2011 2012
Export & Import by Value (USD thousands) ofHS Code 5407
Export
Import
Source: ITC

Vietnam – HS 54 – Export Markets
46
© 2013 Dragon Sourcing. All rights reserved.
Turkey29%
China14%
Thailand12%Taipei Chinese
8%
Indonesia6%
Rest of world31%
HS 54 - Export market of Vietnam 2011
Source: ITC
Related Documents