1 Business Systems - Operations Management Session 6 Capacity Planning & Control 1 Business Systems Business Systems – Operations Management Operations Management Facilitator: Facilitator: Dr. Jonathan Farrell Dr. Jonathan Farrell Session 6 Capacity Planning & Control 2 This Evening This Evening’ s Program s Program • Capacity Planning & Control Capacity Planning & Control – Aggregate Planning Aggregate Planning – Capacity versus Demand Capacity versus Demand – The Planning Process The Planning Process – Managing Capacity & Demand Managing Capacity & Demand • Case Study Case Study – Holly Farm (pp 352 Holly Farm (pp 352- 354) 354) • Exercises Exercises – Capacity Management (refer to the Folder of Capacity Management (refer to the Folder of Readings) Readings)

Welcome message from author
This document is posted to help you gain knowledge. Please leave a comment to let me know what you think about it! Share it to your friends and learn new things together.
Transcript
1
Business Systems - Operations ManagementSession 6 Capacity Planning & Control
1
Business Systems Business Systems ––Operations ManagementOperations Management
Facilitator:Facilitator:Dr. Jonathan FarrellDr. Jonathan Farrell
Session 6 Capacity Planning & Control
2
This EveningThis Evening’’s Programs Program
•• Capacity Planning & ControlCapacity Planning & Control–– Aggregate PlanningAggregate Planning–– Capacity versus DemandCapacity versus Demand–– The Planning ProcessThe Planning Process–– Managing Capacity & Demand Managing Capacity & Demand
•• Case Study Case Study –– Holly Farm (pp 352Holly Farm (pp 352--354)354)•• Exercises Exercises –– Capacity Management (refer to the Folder of Capacity Management (refer to the Folder of
Readings) Readings)
2
Business Systems - Operations ManagementSession 6 Capacity Planning & Control
3
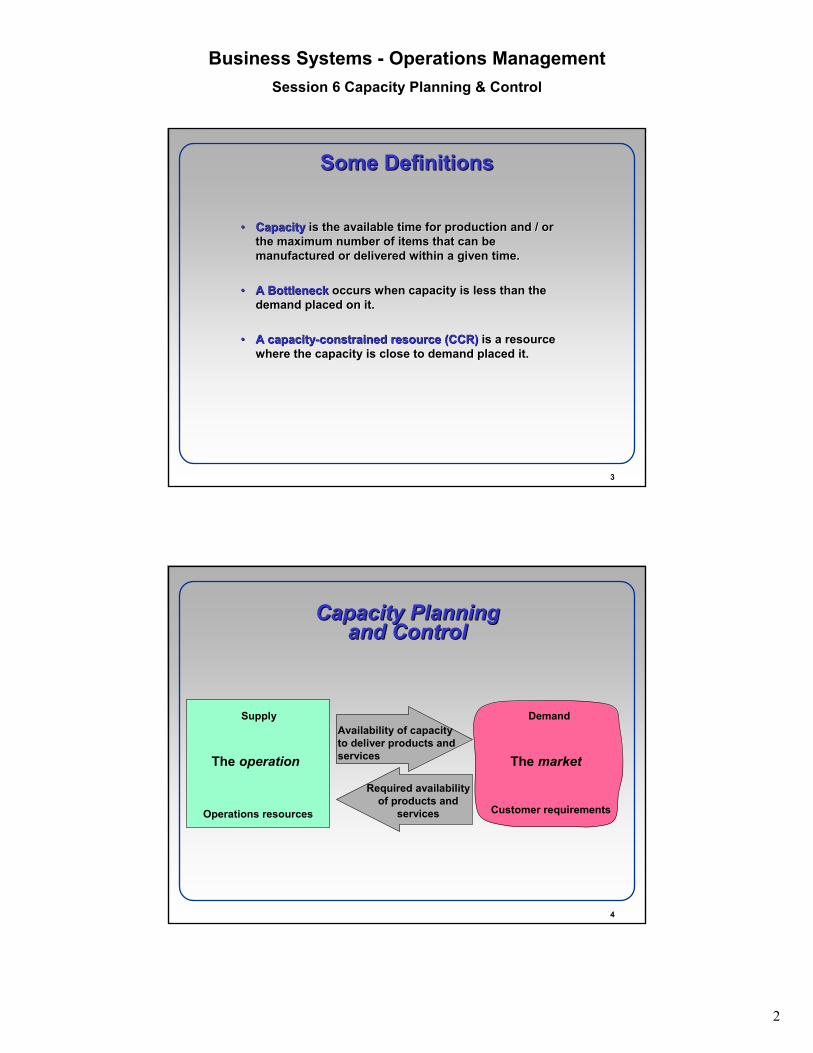
Some DefinitionsSome Definitions
•• CapacityCapacity is the available time for production and / or is the available time for production and / or the maximum number of items that can be the maximum number of items that can be manufactured or delivered within a given time.manufactured or delivered within a given time.
•• A A BottleneckBottleneck occurs whenoccurs when capacity is less than the capacity is less than the demand placed on demand placed on itit..
•• A capacityA capacity--constrained resource (CCR)constrained resource (CCR) is a resource is a resource where the capacity is close towhere the capacity is close to demand placed demand placed itit. .
4
Operations resources Customer requirements
DemandSupplyAvailability of capacity to deliver products and servicesThe operation The market
Capacity Planning Capacity Planning and Controland Control
Required availability of products and
services
3
Business Systems - Operations ManagementSession 6 Capacity Planning & Control
5
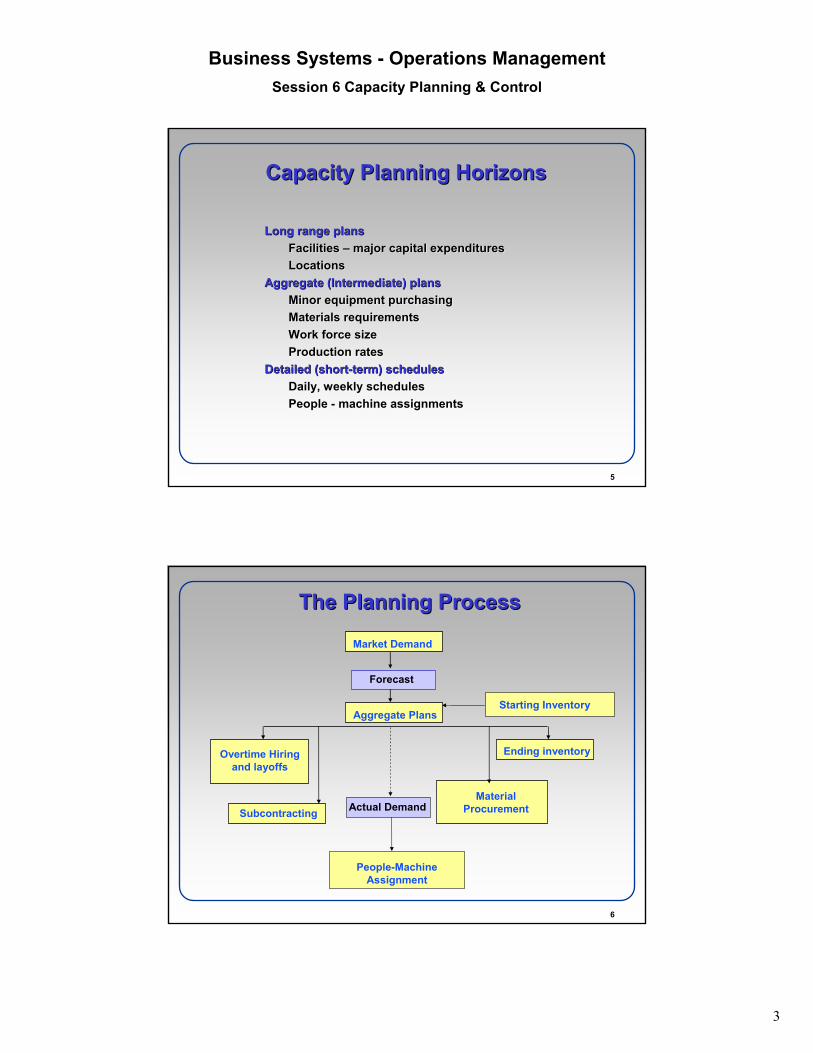
Capacity Planning HorizonsCapacity Planning Horizons
Long range plansLong range plansFacilities Facilities –– major capital expendituresmajor capital expendituresLocationsLocations
Aggregate (Intermediate) plansAggregate (Intermediate) plansMinor equipment purchasingMinor equipment purchasingMaterials requirementsMaterials requirementsWork force sizeWork force sizeProduction ratesProduction rates
Detailed (shortDetailed (short--term) schedulesterm) schedulesDaily, weekly schedulesDaily, weekly schedulesPeople People -- machine assignmentsmachine assignments
6
Material Procurement
Overtime Hiring and layoffs
Subcontracting
Ending inventory
Market Demand
Forecast
Aggregate PlansStarting Inventory
Actual Demand
People-Machine Assignment
The Planning ProcessThe Planning Process
4
Business Systems - Operations ManagementSession 6 Capacity Planning & Control
7
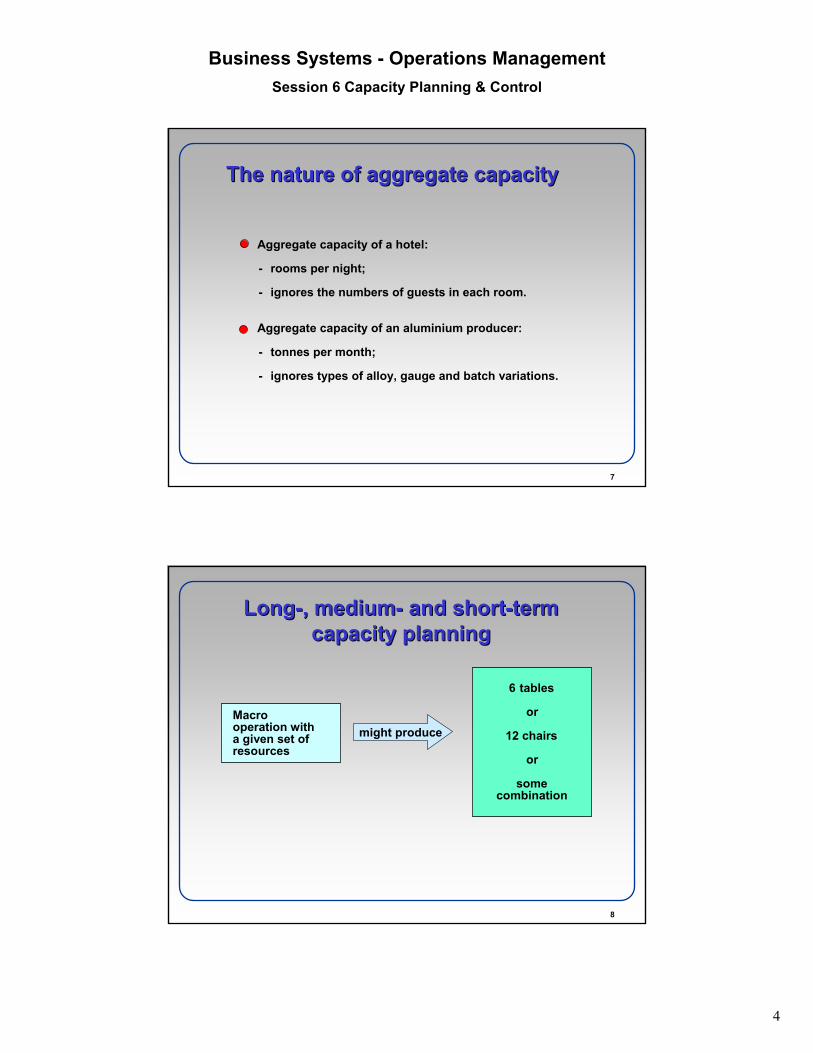
The nature of aggregate capacityThe nature of aggregate capacity
Aggregate capacity of a hotel:
- rooms per night;
- ignores the numbers of guests in each room.
Aggregate capacity of an aluminium producer:
- tonnes per month;
- ignores types of alloy, gauge and batch variations.
8
LongLong--, medium, medium-- and shortand short--term term capacity planningcapacity planning
Macrooperation witha given set of resources
might produce
6 tables
or
12 chairs
or
some combination
5
Business Systems - Operations ManagementSession 6 Capacity Planning & Control
9
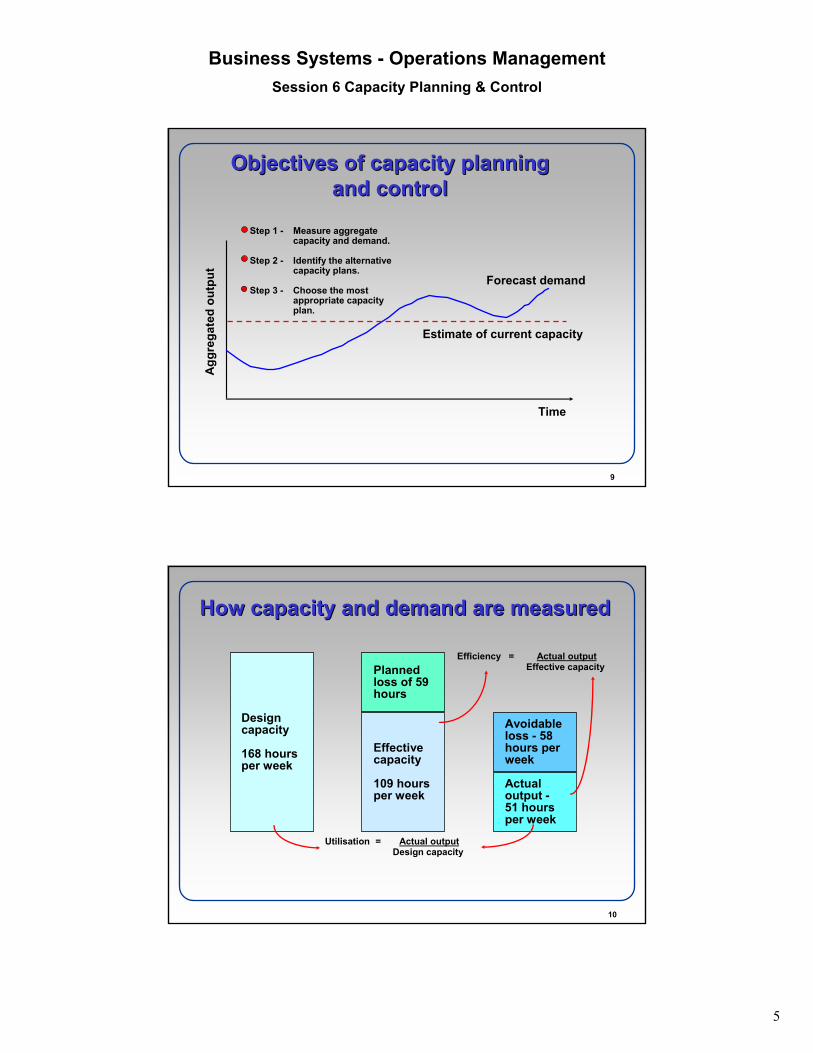
Objectives of capacity planning Objectives of capacity planning and controland control
Step 1 - Measure aggregate capacity and demand.
Step 2 - Identify the alternative capacity plans.
Step 3 - Choose the most appropriate capacity plan.
Time
Estimate of current capacity
Forecast demand
Agg
rega
ted
outp
ut
10
How capacity and demand are measuredHow capacity and demand are measured
Design capacity
168 hours per week
Effectivecapacity
109 hours per week
Planned loss of 59 hours
Actual output -51 hours per week
Avoidable loss - 58 hours per week
Actual outputEffective capacity
Efficiency =
Actual outputDesign capacity
Utilisation =
6
Business Systems - Operations ManagementSession 6 Capacity Planning & Control
11
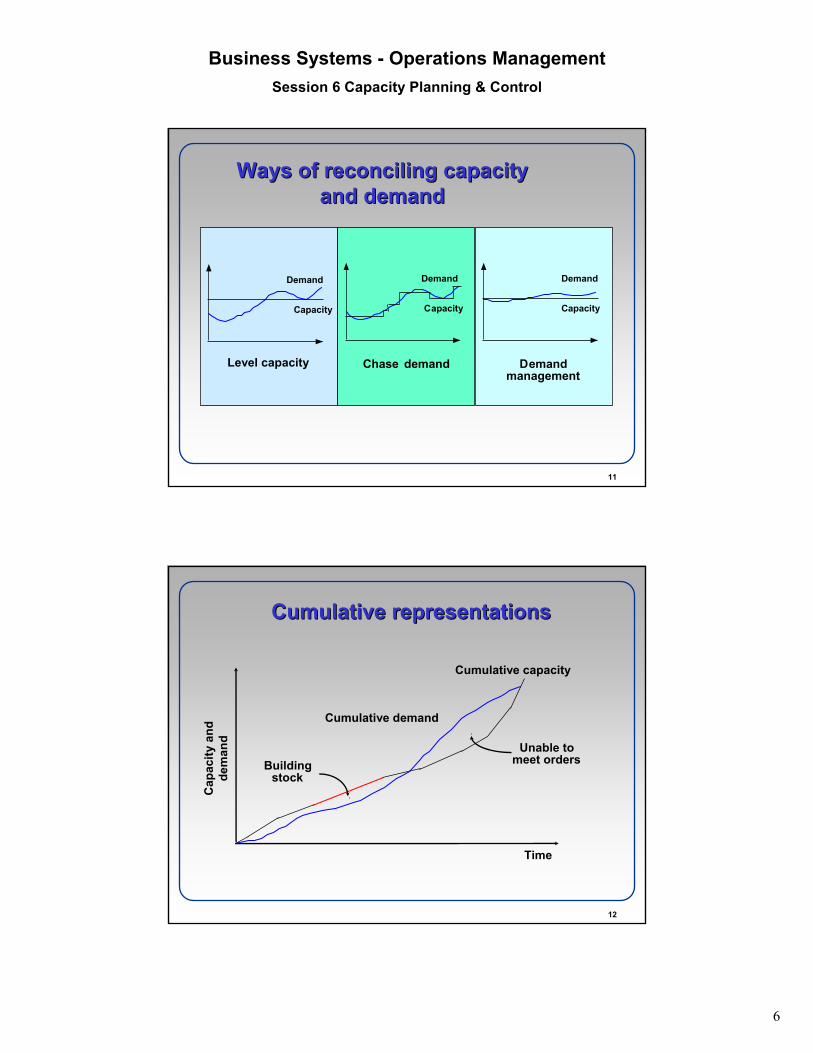
Ways of reconcilingWays of reconciling capacity capacity and demandand demand
Level capacity
Capacity
Demand
Chase demand
Demand
Capacity
Demand management
Demand
Capacity
12
Cumulative representationsCumulative representations
Cumulative demand
Cumulative capacity
Time
Buildingstock
Unable to meet orders
Cap
acity
and
dem
and
7
Business Systems - Operations ManagementSession 6 Capacity Planning & Control
13
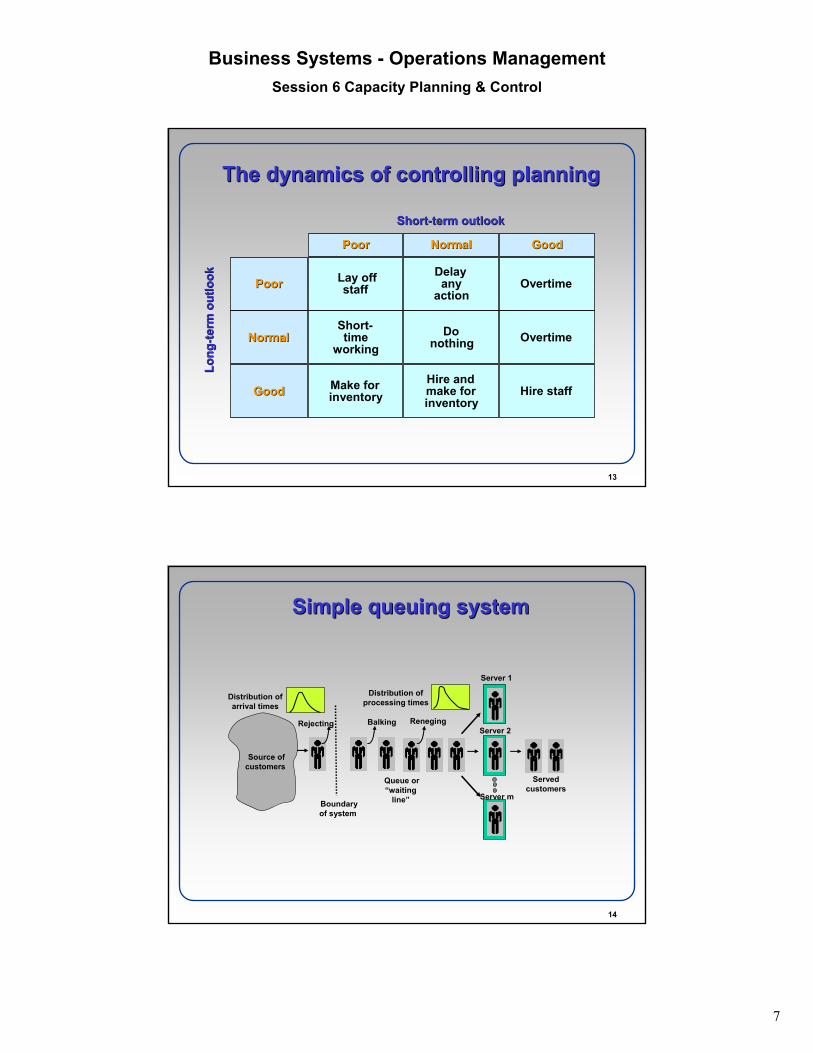
The dynamics of controlling planningThe dynamics of controlling planning
ShortShort--term outlookterm outlook
NormalNormal GoodGoodPoorPoor
NormalNormal
GoodGood
PoorPoor
Short-time
working
Make for inventory
Lay off staff
Do nothing
Hire and make for inventory
Delay any
action
Overtime
Hire staff
Overtime
Long
Long
-- term
out
look
term
out
look
14
Rejecting Balking
Source of customers
Boundary of system
Queue or “waiting
line”
Server 1
Served customers
RenegingServer 2
Server m
Distribution of arrival times
Distribution of processing times
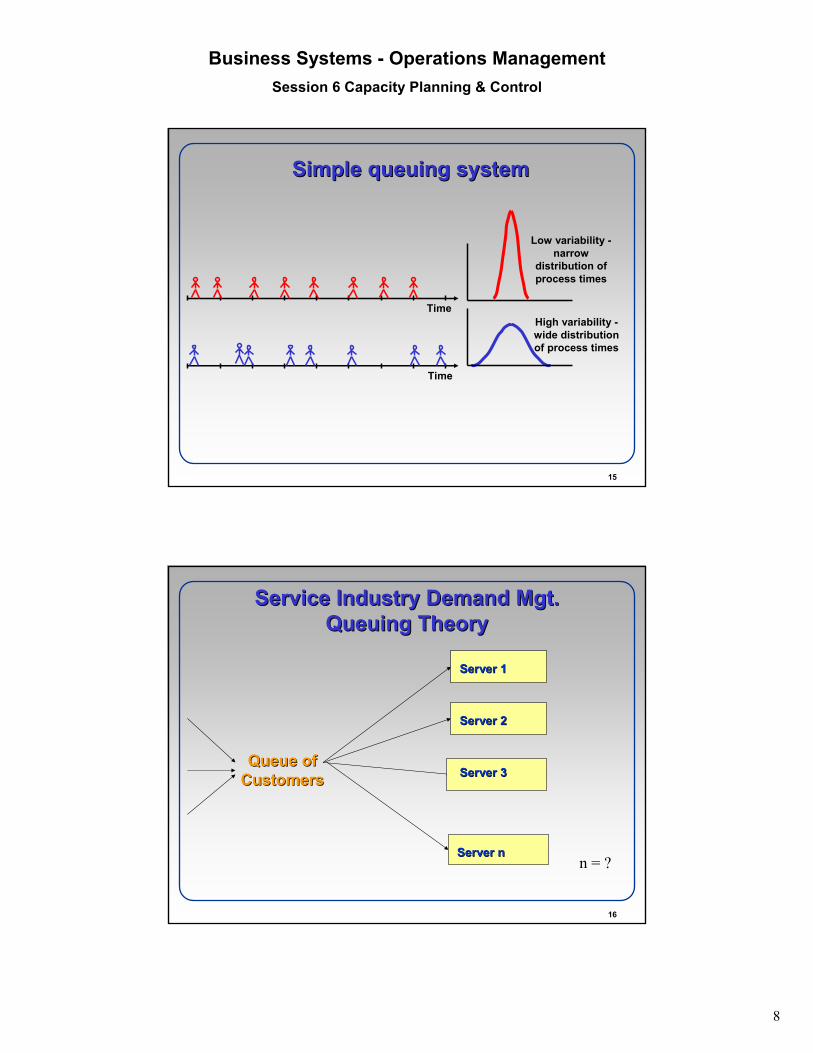
Simple queuing systemSimple queuing system
8
Business Systems - Operations ManagementSession 6 Capacity Planning & Control
15
Time
Time
Low variability -narrow
distribution of process times
High variability -wide distribution of process times
Simple queuing systemSimple queuing system
16
Service Industry Demand Mgt.Service Industry Demand Mgt.Queuing TheoryQueuing Theory
Queue of Queue of CustomersCustomers
Server 1Server 1
Server nServer n
Server 2Server 2
Server 3Server 3
n = ?
9
Business Systems - Operations ManagementSession 6 Capacity Planning & Control
17
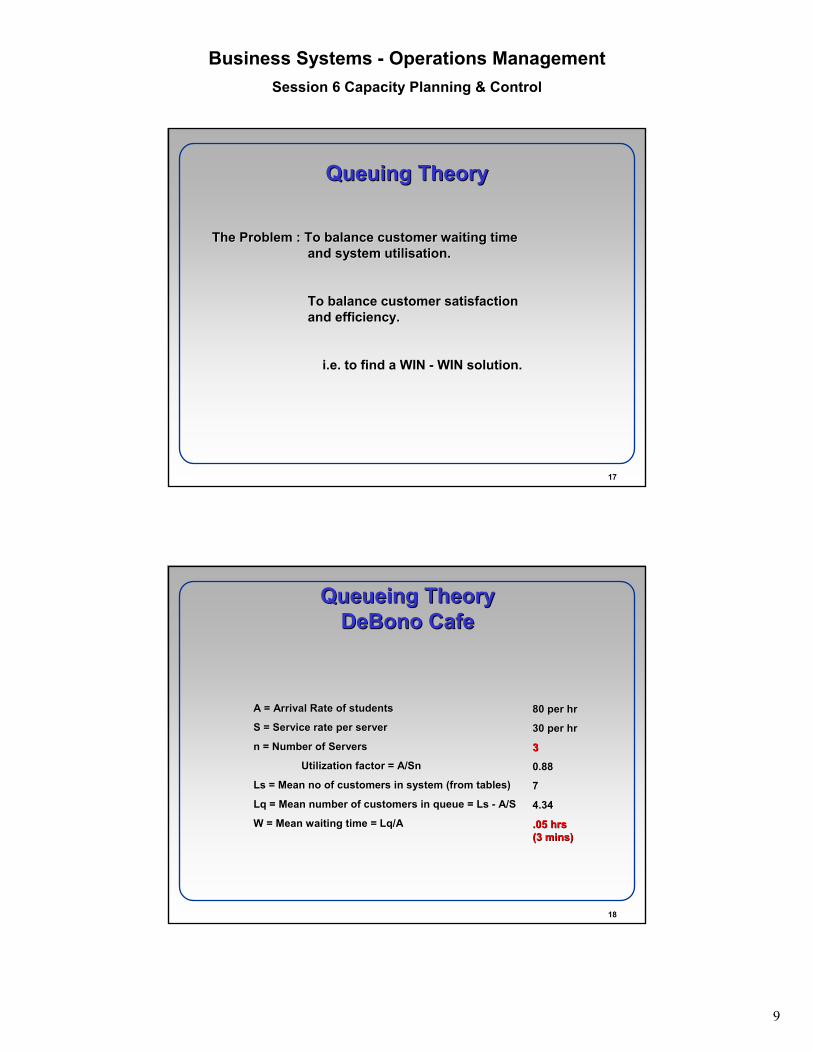
Queuing TheoryQueuing Theory
The Problem : To balance customer waiting time The Problem : To balance customer waiting time and system utilisation.and system utilisation.
To balance customer satisfaction To balance customer satisfaction and efficiency.and efficiency.
i.e. to find a WIN i.e. to find a WIN -- WIN solution.WIN solution.
18
QueueingQueueing TheoryTheoryDeBonoDeBono CafeCafe
A = Arrival Rate of studentsA = Arrival Rate of students
S = Service rate per serverS = Service rate per server
n = Number of Serversn = Number of Servers
Utilization factor = A/Utilization factor = A/SnSn
Ls = Mean no of customers in system (from tables)Ls = Mean no of customers in system (from tables)
LqLq = Mean number of customers in queue = Ls = Mean number of customers in queue = Ls -- A/SA/S
W = Mean waiting time = W = Mean waiting time = LqLq/A /A
80 per hr80 per hr
30 per hr 30 per hr
33
0.880.88
77
4.344.34
.05 hrs .05 hrs (3 mins)(3 mins)
10
Business Systems - Operations ManagementSession 6 Capacity Planning & Control
19
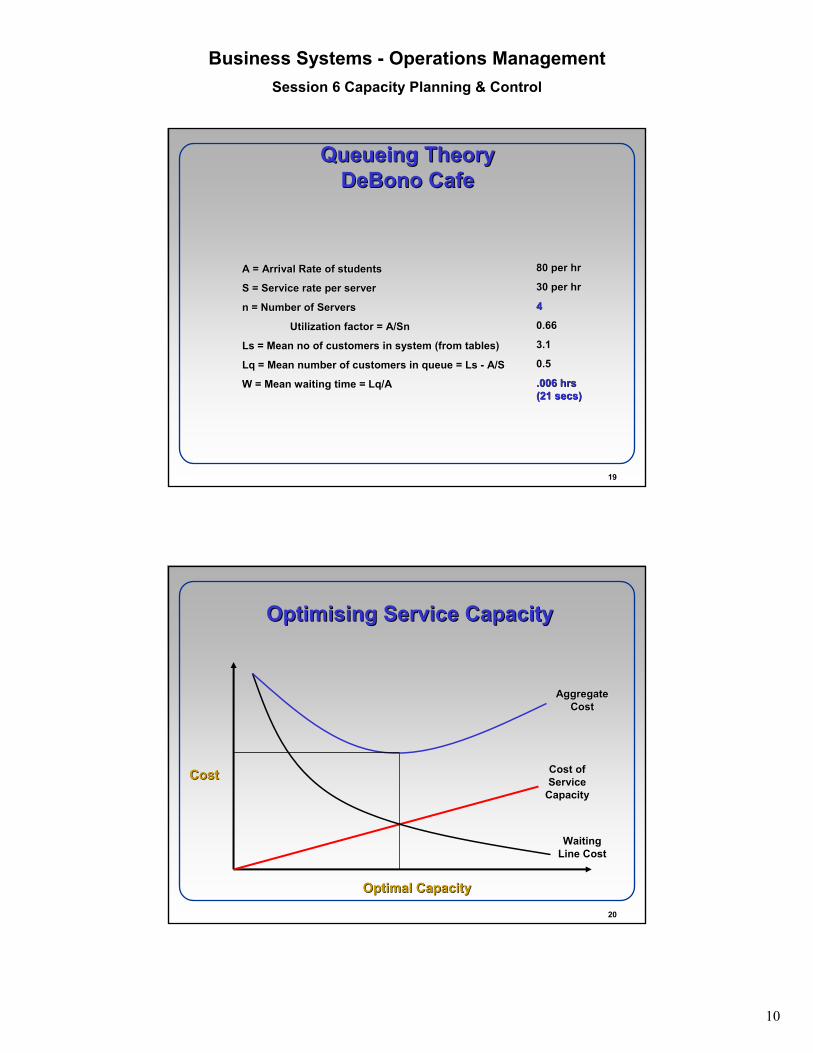
QueueingQueueing TheoryTheoryDeBonoDeBono CafeCafe
A = Arrival Rate of studentsA = Arrival Rate of students
S = Service rate per serverS = Service rate per server
n = Number of Serversn = Number of Servers
Utilization factor = A/Utilization factor = A/SnSn
Ls = Mean no of customers in system (from tables)Ls = Mean no of customers in system (from tables)
LqLq = Mean number of customers in queue = Ls = Mean number of customers in queue = Ls -- A/SA/S
W = Mean waiting time = W = Mean waiting time = LqLq/A /A
80 per hr80 per hr
30 per hr 30 per hr
44
0.660.66
3.13.1
0.50.5
.006 hrs.006 hrs(21 secs)(21 secs)
20
Optimising Service CapacityOptimising Service Capacity
CostCost
Optimal CapacityOptimal Capacity
Cost of Cost of Service Service
CapacityCapacity
Waiting Waiting Line CostLine Cost
Aggregate Aggregate CostCost
11
Business Systems - Operations ManagementSession 6 Capacity Planning & Control
21
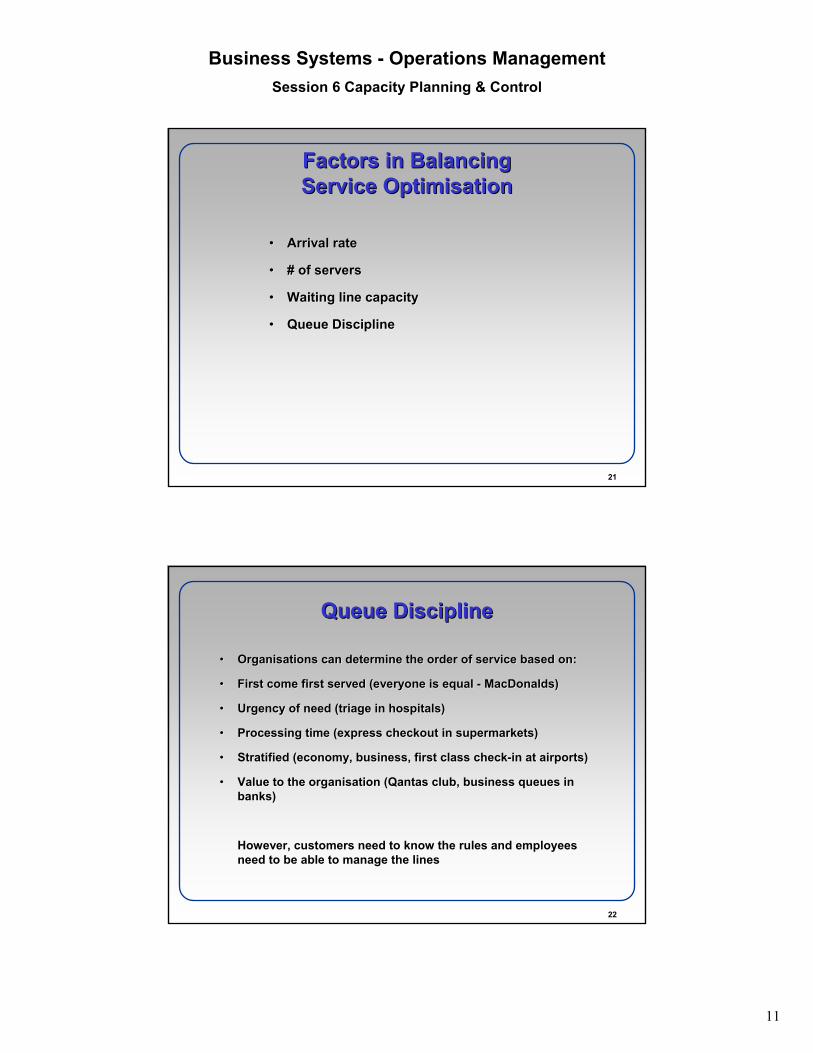
Factors in BalancingFactors in BalancingService OptimisationService Optimisation
•• Arrival rateArrival rate
•• # of servers# of servers
•• Waiting line capacityWaiting line capacity
•• Queue DisciplineQueue Discipline
22
Queue DisciplineQueue Discipline
•• Organisations can determine the order of service based on:Organisations can determine the order of service based on:
•• First come first served (everyone is equal First come first served (everyone is equal -- MacDonaldsMacDonalds))
•• Urgency of need (triage in hospitals)Urgency of need (triage in hospitals)
•• Processing time (express checkout in supermarkets)Processing time (express checkout in supermarkets)
•• Stratified (economy, business, first class checkStratified (economy, business, first class check--in at airports)in at airports)
•• Value to the organisation (Qantas club, business queues in Value to the organisation (Qantas club, business queues in banks)banks)
However, customers need to know the rules and employees However, customers need to know the rules and employees need to be able to manage the linesneed to be able to manage the lines
12
Business Systems - Operations ManagementSession 6 Capacity Planning & Control
23
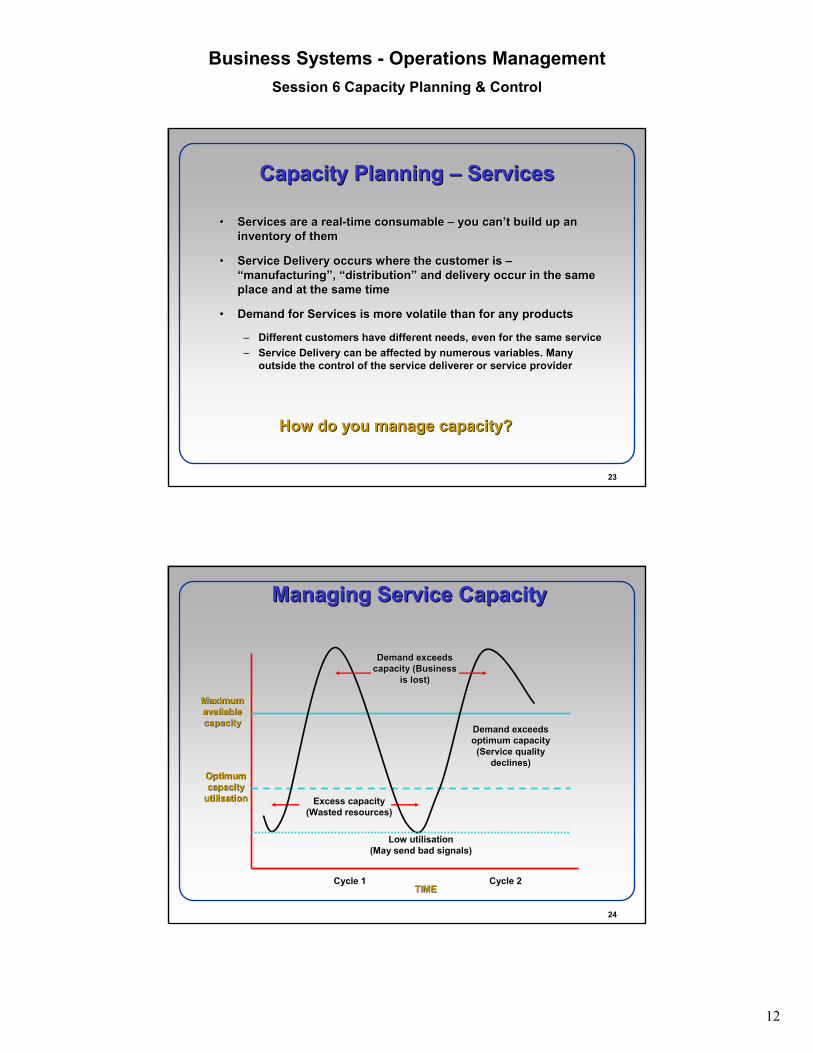
Capacity Planning Capacity Planning –– ServicesServices
•• Services are a realServices are a real--time consumable time consumable –– you canyou can’’t build up an t build up an inventory of theminventory of them
•• Service Delivery occurs where the customer is Service Delivery occurs where the customer is ––““manufacturingmanufacturing””, , ““distributiondistribution”” and delivery occur in the same and delivery occur in the same place and at the same timeplace and at the same time
•• Demand for Services is more volatile than for any productsDemand for Services is more volatile than for any products
–– Different customers have different needs, even for the same servDifferent customers have different needs, even for the same serviceice–– Service Delivery can be affected by numerous variables. Many Service Delivery can be affected by numerous variables. Many
outside the control of the service deliverer or service provideroutside the control of the service deliverer or service provider
How do you manage capacity?How do you manage capacity?
24
Managing Service CapacityManaging Service Capacity
Maximum Maximum availableavailablecapacity capacity
Optimum Optimum capacitycapacity
utilisationutilisation
Cycle 1 Cycle 1 Cycle 2 Cycle 2 TIME TIME
Demand exceeds Demand exceeds capacity (Business capacity (Business
is lost) is lost)
Demand exceeds Demand exceeds optimum capacity optimum capacity (Service quality (Service quality
declines) declines)
Excess capacityExcess capacity(Wasted resources) (Wasted resources)
Low Low utilisationutilisation(May send bad signals) (May send bad signals)
13
Business Systems - Operations ManagementSession 6 Capacity Planning & Control
25
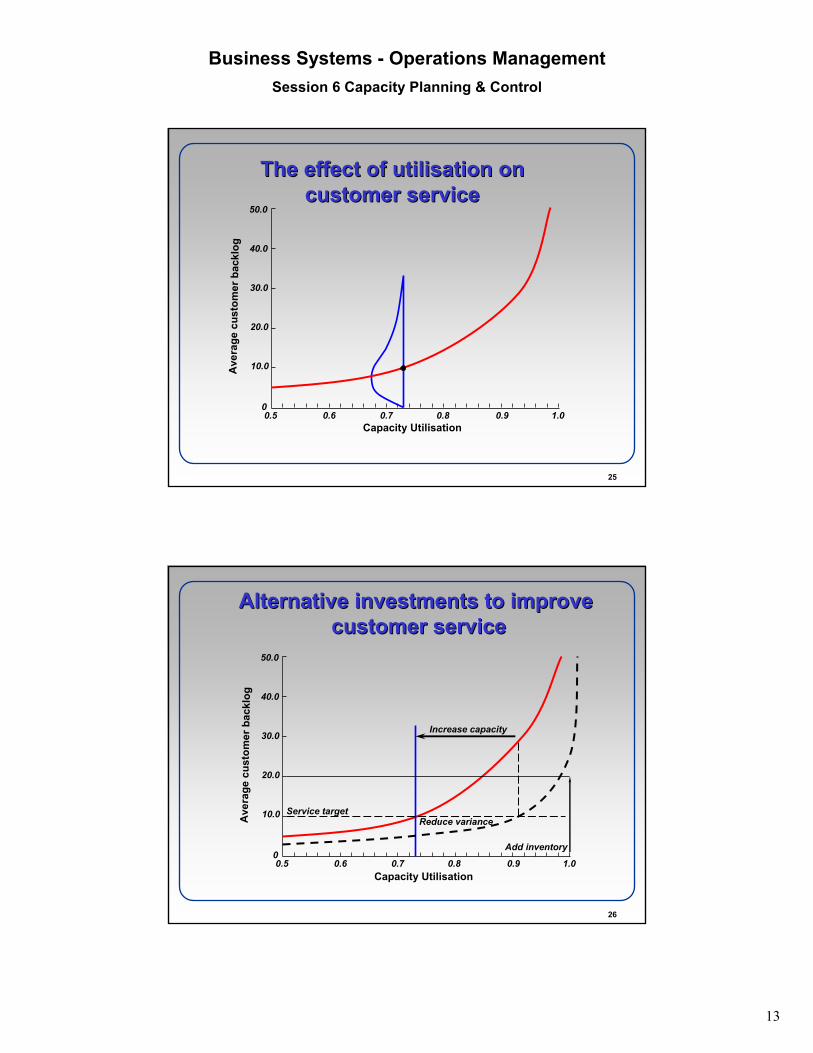
The effect of utilisation on The effect of utilisation on customer servicecustomer service
50.0
40.0
30.0
20.0
10.0
00.5 0.6 0.7 0.8 0.9 1.0
Ave
rag e
cu s
tom
er b
a ckl
og
Capacity Utilisation
26
50.0
40.0
30.0
20.0
10.0
00.5 0.6 0.7 0.8 0.9 1.0
Ave
rag e
cu s
tom
er b
a ckl
og
Capacity Utilisation
Service targetReduce variance
Add inventory
Increase capacity
Alternative investments to improve Alternative investments to improve customer servicecustomer service
14
Business Systems - Operations ManagementSession 6 Capacity Planning & Control
27
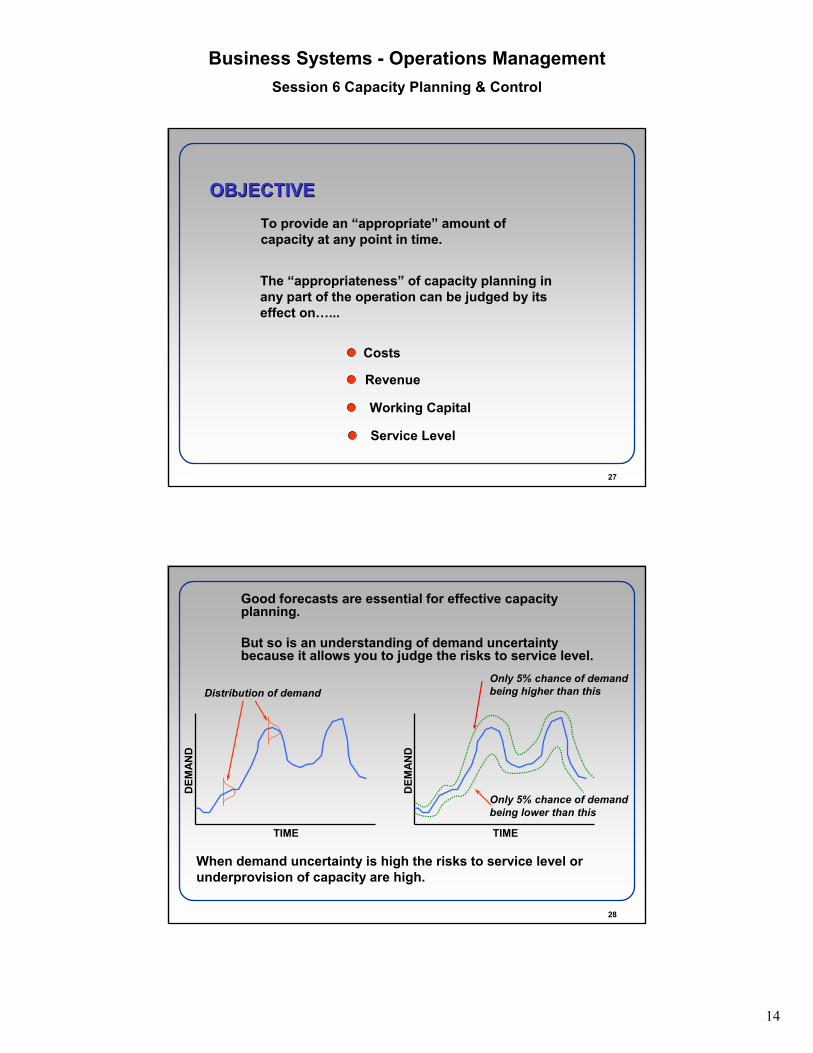
OBJECTIVEOBJECTIVETo provide an “appropriate” amount of capacity at any point in time.
The “appropriateness” of capacity planning in any part of the operation can be judged by its effect on…...
Costs
Revenue
Working Capital
Service Level
28
Good forecasts are essential for effective capacity planning.
But so is an understanding of demand uncertainty because it allows you to judge the risks to service level.
When demand uncertainty is high the risks to service level or underprovision of capacity are high.
DEM
AND
TIME
Distribution of demand
DEM
AND
TIME
Only 5% chance of demand being higher than this
Only 5% chance of demand being lower than this
15
Business Systems - Operations ManagementSession 6 Capacity Planning & Control
29
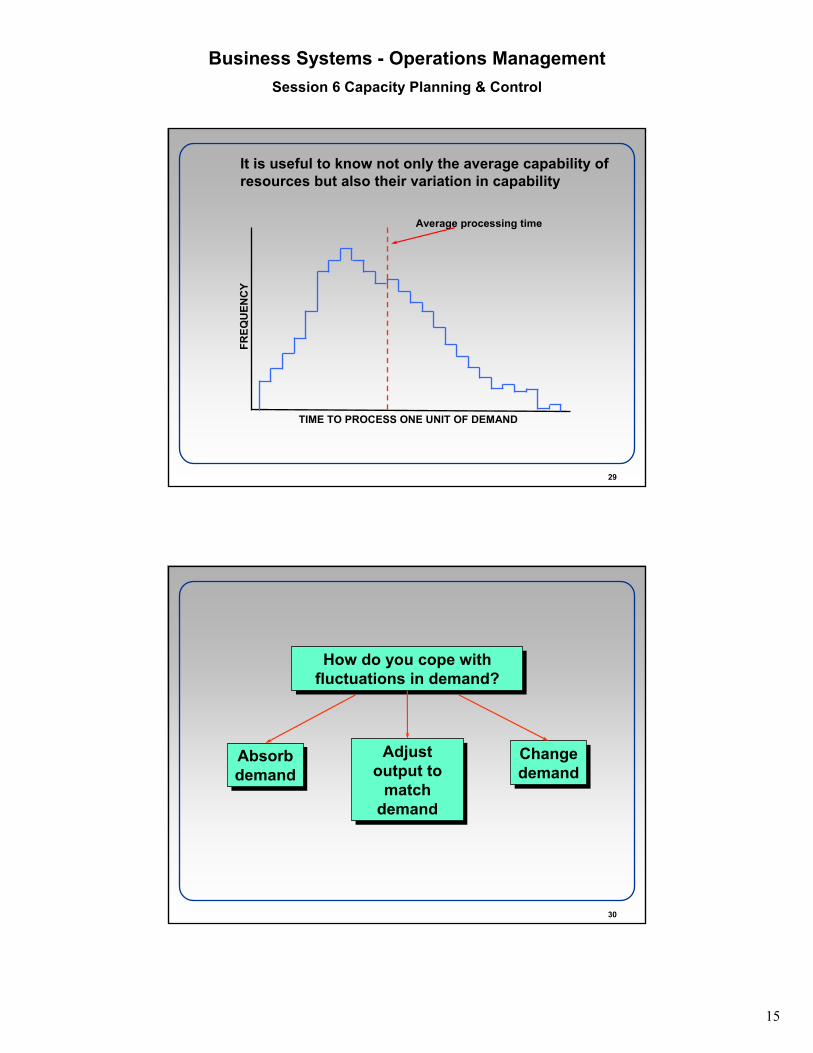
It is useful to know not only the average capability of resources but also their variation in capability
FREQ
UEN
CY
TIME TO PROCESS ONE UNIT OF DEMAND
Average processing time
30
How do you cope with fluctuations in demand?How do you cope with
fluctuations in demand?
Absorb demandAbsorb demand
Adjust output to
match demand
Adjust output to
match demand
Change demandChange demand

16
Business Systems - Operations ManagementSession 6 Capacity Planning & Control
31
Absorb demandAbsorb demand
Keep output level
Keep output level
Make to
stock
Make to
stock
Make customer
wait
Make customer
wait
Part finished,Finished Goods, orCustomer Inventory
QueuesBacklogs
Have excess
capacity
Have excess
capacity
32
Adjust output to match demand
Adjust output to match demand
Hire FireTemporary
LabourLay off
OvertimeSubcontract
Short time3rd party work
17
Business Systems - Operations ManagementSession 6 Capacity Planning & Control
33
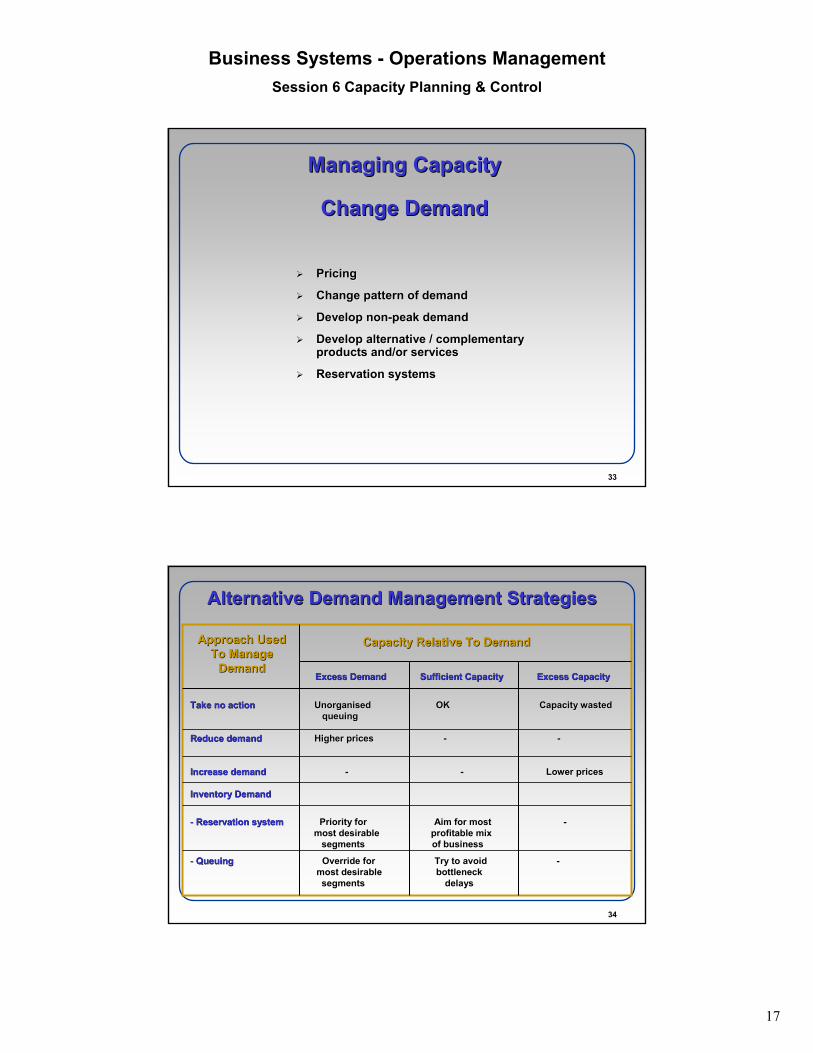
Managing CapacityManaging Capacity
Change DemandChange Demand
¾¾ PricingPricing
¾¾ Change pattern of demandChange pattern of demand
¾¾ Develop nonDevelop non--peak demandpeak demand
¾¾ Develop alternative / complementary Develop alternative / complementary products and/or servicesproducts and/or services
¾¾ Reservation systemsReservation systems
34
Take no action Take no action Unorganised Unorganised OKOK Capacity wastedCapacity wastedqueuingqueuing
Reduce demandReduce demand Higher pricesHigher prices -- --
Increase demandIncrease demand -- -- Lower pricesLower prices
Inventory DemandInventory Demand
-- Reservation systemReservation system Priority for Aim for most Priority for Aim for most --most desirable most desirable profitable mixprofitable mix
segments segments of businessof business
-- Queuing Queuing Override for Try to avoid Override for Try to avoid --most desirable most desirable bottleneckbottlenecksegments segments delaysdelays
Excess Demand Sufficient Capacity ExcessExcess Demand Sufficient Capacity Excess CapacityCapacity
Capacity Relative To DemandCapacity Relative To DemandApproach Used Approach Used To Manage To Manage
DemandDemand
Alternative Demand Management StrategiesAlternative Demand Management Strategies
18
Business Systems - Operations ManagementSession 6 Capacity Planning & Control
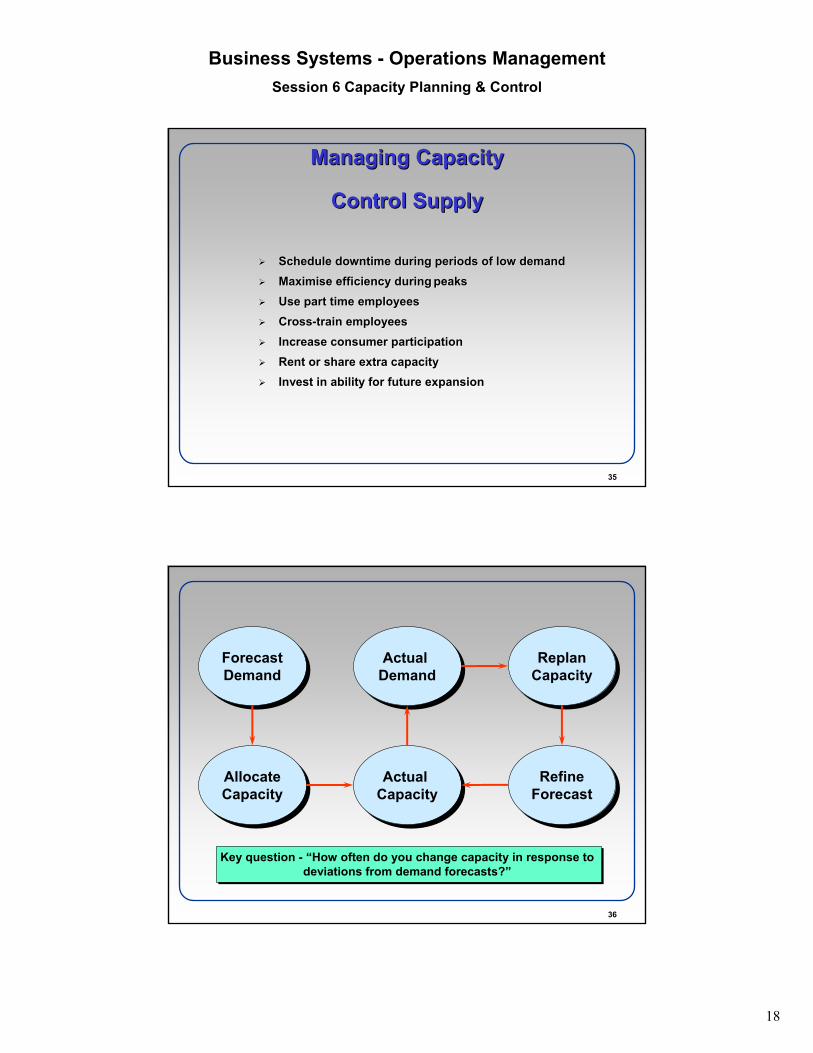
35
Managing CapacityManaging Capacity
Control SupplyControl Supply
¾¾ Schedule downtime during periods of low demandSchedule downtime during periods of low demand¾¾ Maximise efficiency duringMaximise efficiency during peaks peaks ¾¾ Use part time employeesUse part time employees¾¾ CrossCross--train employeestrain employees¾¾ Increase consumer participationIncrease consumer participation¾¾ Rent or sRent or share hare extra extra capacitycapacity¾¾ Invest in ability for future expansionInvest in ability for future expansion
36
Actual DemandActual
DemandForecastDemand
ForecastDemand
ReplanCapacityReplan
Capacity
Actual CapacityActual
CapacityAllocateCapacityAllocateCapacity
RefineForecastRefine
Forecast
Key question - “How often do you change capacity in response to deviations from demand forecasts?”
19
Business Systems - Operations ManagementSession 6 Capacity Planning & Control
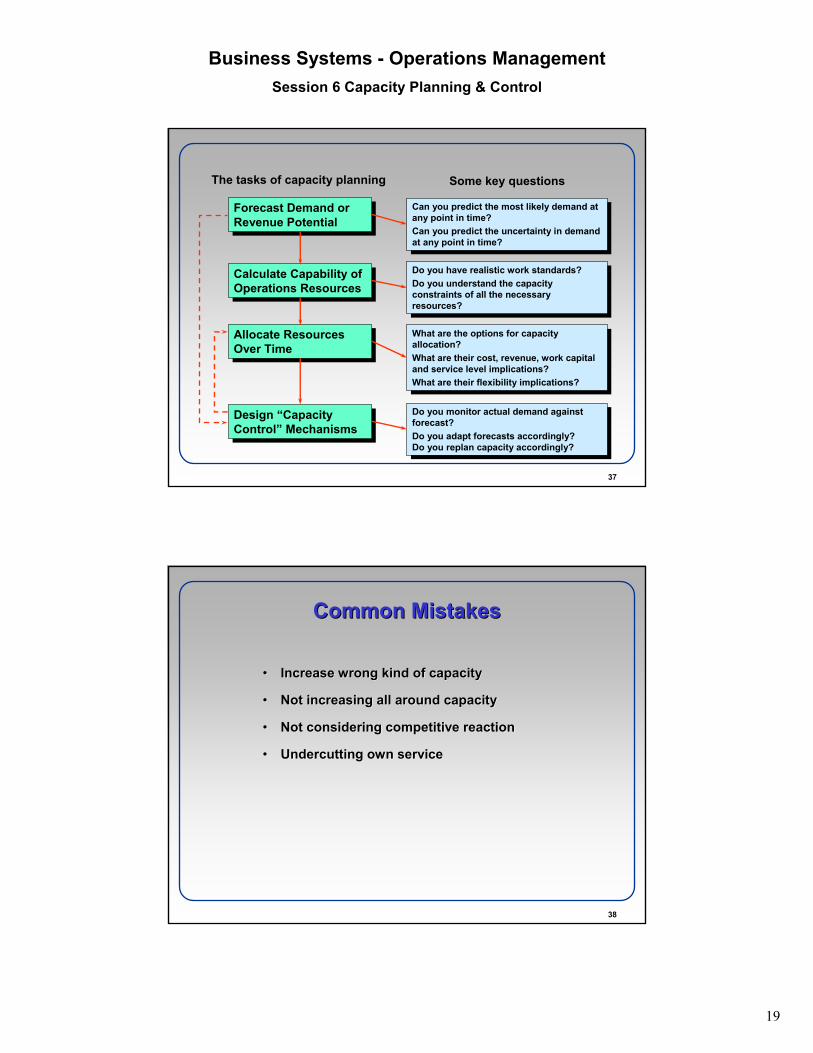
37
The tasks of capacity planning Some key questions
Calculate Capability of Operations Resources
Calculate Capability of Operations Resources
Allocate Resources Over Time
Allocate Resources Over Time
Design “Capacity Control” Mechanisms
Design “Capacity Control” Mechanisms
Forecast Demand or Revenue Potential
Forecast Demand or Revenue Potential
Can you predict the most likely demand at any point in time?Can you predict the uncertainty in demand at any point in time?
Can you predict the most likely demand at any point in time?Can you predict the uncertainty in demand at any point in time?
Do you have realistic work standards?Do you understand the capacity constraints of all the necessary resources?
Do you have realistic work standards?Do you understand the capacity constraints of all the necessary resources?
What are the options for capacity allocation?What are their cost, revenue, work capital and service level implications?What are their flexibility implications?
What are the options for capacity allocation?What are their cost, revenue, work capital and service level implications?What are their flexibility implications?
Do you monitor actual demand against forecast?Do you adapt forecasts accordingly?Do you replan capacity accordingly?
Do you monitor actual demand against forecast?Do you adapt forecasts accordingly?Do you replan capacity accordingly?
38
•• Increase wrong kind of capacityIncrease wrong kind of capacity
•• Not increasing all around capacityNot increasing all around capacity
•• Not considering competitive reactionNot considering competitive reaction
•• Undercutting own serviceUndercutting own service
Common MistakesCommon Mistakes
20
Business Systems - Operations ManagementSession 6 Capacity Planning & Control
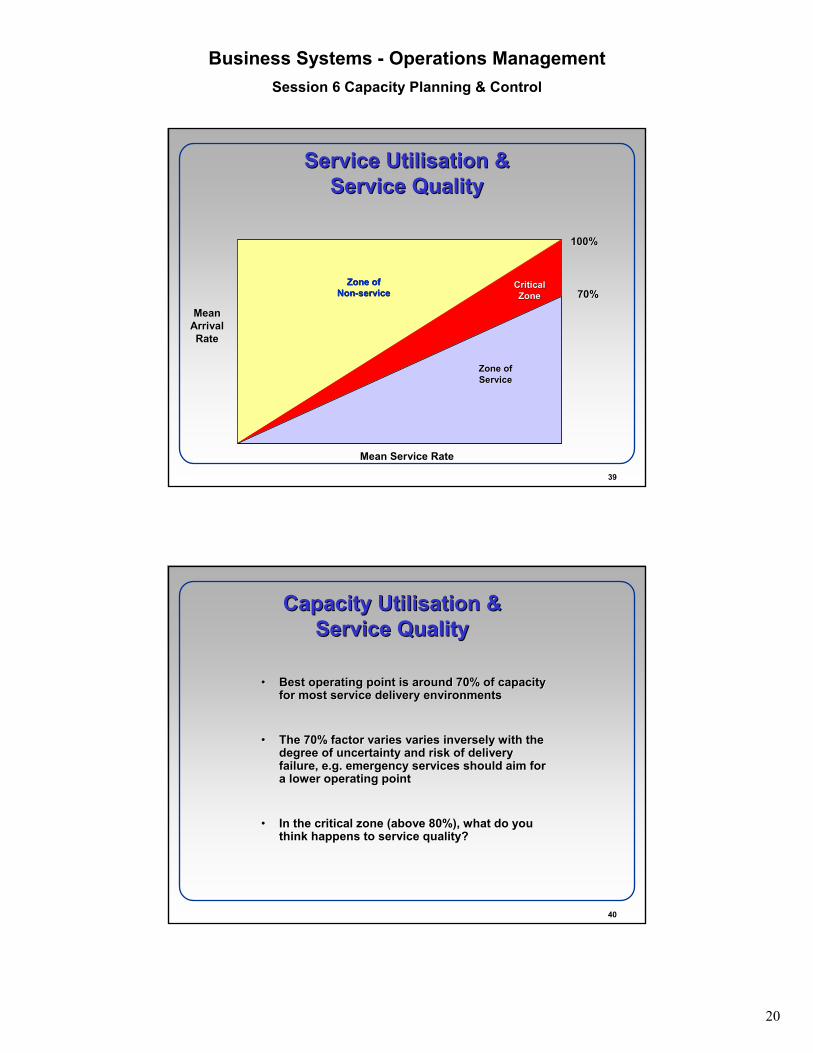
39
Service Utilisation & Service Utilisation & Service QualityService Quality
Mean Mean Arrival Arrival RateRate
Mean Service RateMean Service Rate
Zone of Zone of ServiceService
Zone of Zone of NonNon--serviceservice
Critical Critical ZoneZone
100%100%
70%70%
40
Capacity Utilisation & Capacity Utilisation & Service QualityService Quality
•• Best operating point is around 70% of capacity Best operating point is around 70% of capacity for most service delivery environmentsfor most service delivery environments
•• The 70% factor varies varies inversely with the The 70% factor varies varies inversely with the degree of uncertainty and risk of delivery degree of uncertainty and risk of delivery failure, e.g. emergency services should aim for failure, e.g. emergency services should aim for a lower operating pointa lower operating point
•• In the critical zone (above 80%), what do you In the critical zone (above 80%), what do you think happens to service quality? think happens to service quality?
21
Business Systems - Operations ManagementSession 6 Capacity Planning & Control
41
In Summary . . .In Summary . . .
•• Manage Capacity or Manage Demand?Manage Capacity or Manage Demand?
•• What does the organisation want to achieve?What does the organisation want to achieve?
•• Most organisations have a mix of bothMost organisations have a mix of both
42
Exercise Exercise –– Capacity ManagementCapacity Management
22
Business Systems - Operations ManagementSession 6 Capacity Planning & Control
43
Case Study Case Study –– Holly FarmHolly Farm
1.1. Evaluate Gillian's proposal to increase the number of farm Evaluate Gillian's proposal to increase the number of farm visitors in 2008 by 50 per cent.visitors in 2008 by 50 per cent.–– What are the main capacity constraints within these businesses?What are the main capacity constraints within these businesses?–– Should she promote coach company visits, even if this involves Should she promote coach company visits, even if this involves
offering a discount on the admission charges?offering a discount on the admission charges?–– Should she pursue increasing visitors by car, or school parties?Should she pursue increasing visitors by car, or school parties?–– In what other ways is Gillian able to manage capacity?In what other ways is Gillian able to manage capacity?–– What other information would help Gillian to take these What other information would help Gillian to take these
decisions?decisions?2.2. What factors should Gillian consider when deciding to What factors should Gillian consider when deciding to
increase the number of increase the number of flavoursflavours from four to 10?from four to 10?
NoteNote: For any calculations, assume that each month consists of four : For any calculations, assume that each month consists of four weeks including weeks including holidays (statutory holidays should be ignored for the purpose oholidays (statutory holidays should be ignored for the purpose of this analysis).f this analysis).
Related Documents