Google Confidential and Proprietary Understanding the complete marketing ROI on personal computer sales for Carrefour Carrefour Online-to-Store study 1

Case study for measuring internet ROI for in-store sales
Aug 20, 2015
Welcome message from author
This document is posted to help you gain knowledge. Please leave a comment to let me know what you think about it! Share it to your friends and learn new things together.
Transcript

Google Confidential and Proprietary
Understanding the complete marketing ROI on personal
computer sales for Carrefour
Carrefour Online-to-Store study
1

125% of Carrefour in-store PC sales are driven by marketing
- Among those, online advertising accounts for 43%
2Over 10% of in-store sales are driven by website traffic
- During peak periods, website traffic drives 25% of in-store sales
3Each € invested in online advertising delivers €7.85 in sales
- Online advertising is the most cost-effective advertising driver, with an ROI twice as high as the
average for all marketing drivers
Executive Summary
2

3
Research Objectives & Scope
Objectives
• Understand the drivers of business outcomes and analyse the impact of Carrefour’s media
investment onto personal computers sales (desktops, laptops & netbooks).
• Identify the optimal personal computers marketing mix allocation to generate greater sales from the
same level of investment
Scope
• As part of this study, the personal computers category (desktops, laptops & netbooks) was analysed
across both the online and in store channels at the national level.
• 97,8% of the computer sales take place in-store, and 2,2% online.
• This study quantified the drivers of three key business outcomes: sales units, website traffic and
query volume (GQV).
• The data time period of this analysis spanned from July 2008 to June 2010 (104 weeks).
*GQV reflects the number of queries that have been done for a particular term, relative to the total
number of queries done on Google over time.

4
Situation Analysis – 1/2
• Carrefour’s personal computers sales units have
grown almost 16% over the period of this study
(July 2008 – June 2010).
• Over the analysis period, average price trends
declined across all products and channels.
In value, in store PC sales grew by 2% and online
sales by 10%
• Online search interest for the term ‘Carrefour’
has slightly declined, however total site traffic to
www.carrefour.fr has doubled over the time period
of this study.
Personal Computer Sales
Carrefour Query Volume & Website Traffic0
6/0
7/2
00
8
06
/08
/20
08
06
/09
/20
08
06
/10
/20
08
06
/11
/20
08
06
/12
/20
08
06
/01
/20
09
06
/02
/20
09
06
/03
/20
09
06
/04
/20
09
06
/05
/20
09
06
/06
/20
09
06
/07
/20
09
06
/08
/20
09
06
/09
/20
09
06
/10
/20
09
06
/11
/20
09
06
/12
/20
09
06
/01
/20
10
06
/02
/20
10
06
/03
/20
10
06
/04
/20
10
06
/05
/20
10
06
/06
/20
10
Website Traffic Trends
Website Traffic
+106%
5
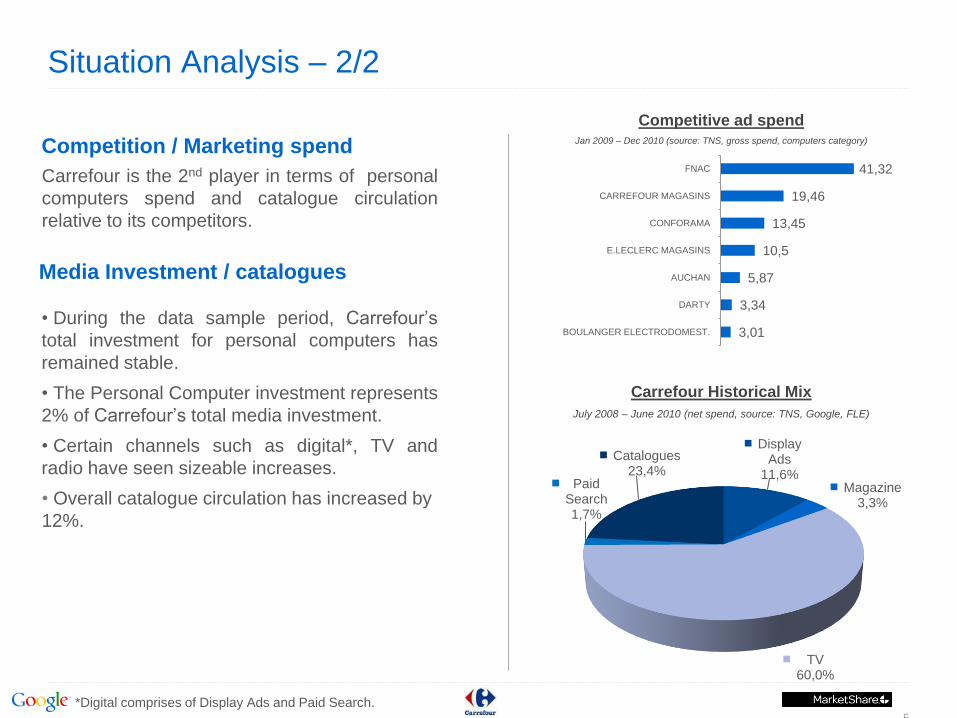
Situation Analysis – 2/2
Carrefour is the 2nd player in terms of personal
computers spend and catalogue circulation
relative to its competitors.
• During the data sample period, Carrefour’s
total investment for personal computers has
remained stable.
• The Personal Computer investment represents
2% of Carrefour’s total media investment.
• Certain channels such as digital*, TV and
radio have seen sizeable increases.
• Overall catalogue circulation has increased by
12%.
Competition / Marketing spend
*Digital comprises of Display Ads and Paid Search.
Media Investment / catalogues
Display Ads
11,6%Magazine
3,3%
TV60,0%
Paid Search1,7%
Catalogues 23,4%
Carrefour Historical Mix
July 2008 – June 2010 (net spend, source: TNS, Google, FLE)
41,32
19,46
13,45
10,5
5,87
3,34
3,01
FNAC
CARREFOUR MAGASINS
CONFORAMA
E.LECLERC MAGASINS
AUCHAN
DARTY
BOULANGER ELECTRODOMEST.
Competitive ad spendJan 2009 – Dec 2010 (source: TNS, gross spend, computers category)

Regression AnalysisThe “Best Fit” Process is repeated, simultaneously, for all drivers
Two Driver Example
Sales (Y) = α (base sales) * X1 (TV Investment) (TV lift factor) * X2 (Paid Search Investment) (Paid Search Lift Factor)
100
102
104
106
108
110
112
114
5 25 45 65 85 105
Sa
les
TV Investment
100
102
104
106
108
110
112
5 25 45 65 85 105
Sa
les
Paid Search Investment
Paid Search Lift Factor = .03
TV Lift Factor = .06
Example
6
• Applied MarketShare’s rigorous, market-tested econometric approach on a data set of
thousands of data points across spend, sales, competitive and macro elements
Methodology & Analytical Approach
Paid Search Lift Factor = 0.06
TV Lift Factor = 0.03
TV InvestmentPaid Search Investment
Sales (Y) = α (base sales) * X1 (Paid Search Investment) (Paid Search Lift Factor) * X2 (TV Investment) (TV Lift
Factor)

7
SeasonalityCompetitive
Media
Competitive Paid Search
Competitive Catalogues
Website Traffic
Google Query
Volume
Paid SearchOnline
Display
Offline Media
Non Personal Computer
Advertising
Catalogues
Pricing
Economic Factors
Holidays
CarrefourPC Sales
Methodology & Analytical Approach
MarketShare evaluated all drivers of Carrefour’s personal computers sales. We built
predictive dynamic models that accurately estimate Carrefour sales.

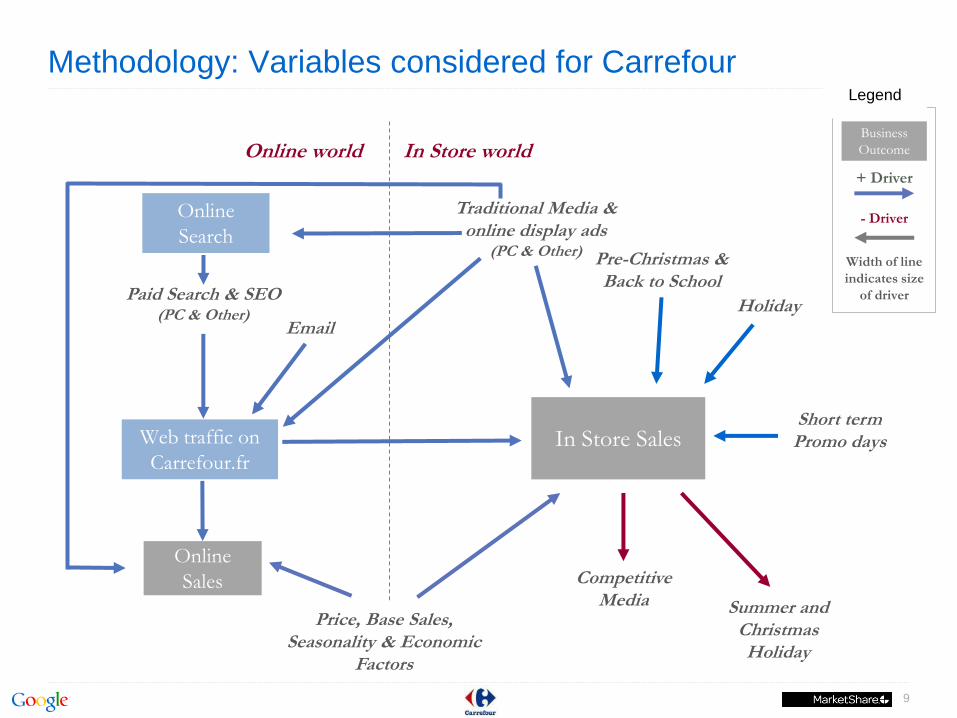
Methodology: Variables considered for Carrefour
9
In Store Sales
Online
Sales
Summer and Christmas Holiday
Holiday
Competitive Media
Traditional Media &online display ads
(PC & Other)
Web traffic on
Carrefour.fr
Paid Search & SEO(PC & Other)
Online
Search
Online world In Store worldBusiness
Outcome
+ Driver
- Driver
Legend
Price, Base Sales, Seasonality & Economic
Factors
Short term Promo days
Width of line
indicates size
of driver
Pre-Christmas & Back to School

MarketShare Confidential and Proprietary 10
Project Results: In-store SalesWhat are the key drivers of in-store personal computers sales?

juil.-0
8
ao
ût-0
8
sept.-0
8
oct.-0
8
nov.-0
8
déc.-0
8
janv.-0
9
févr.-0
9
mars
-09
avr.-0
9
ma
i-09
juin
-09
juil.-0
9
ao
ût-0
9
sept.-0
9
oct.-0
9
nov.-0
9
déc.-0
9
janv.-1
0
févr.-1
0
mars
-10
avr.-1
0
ma
i-10
juin
-10
Sales Units
Drivers of In Store Sales
11
10% of in store sales comes as a result of Carrefour’s web traffic.
Catalogues
8.1%
Display
Ads
0.7%
Promo Libre
1.1%
Magazine*
2.7%Price
11.6%
Seasonality
& Holidays
5.9%
TV
0.8%
Radio*
1.3%
* Non Personal Computer Advertising – Halo effect
Base sales: 57.6%
** Media Investment during limited periods of time
10% of in store conversions driven by
web traffic on carrefour.fr

0
500
1 000
1 500
2 000
2 500
3 000
06
/07
/20
08
27
/07
/20
08
17
/08
/20
08
07
/09
/20
08
28
/09
/20
08
19
/10
/20
08
09
/11
/20
08
30
/11
/20
08
21
/12
/20
08
11
/01
/20
09
01
/02
/20
09
22
/02
/20
09
15
/03
/20
09
05
/04
/20
09
26
/04
/20
09
17
/05
/20
09
07
/06
/20
09
28
/06
/20
09
19
/07
/20
09
09
/08
/20
09
30
/08
/20
09
20
/09
/20
09
11
/10
/20
09
01
/11
/20
09
22
/11
/20
09
13
/12
/20
09
03
/01
/20
10
24
/01
/20
10
14
/02
/20
10
07
/03
/20
10
28
/03
/20
10
18
/04
/20
10
09
/05
/20
10
30
/05
/20
10
20
/06
/20
10
Website Traffic (Visits)Sales Units
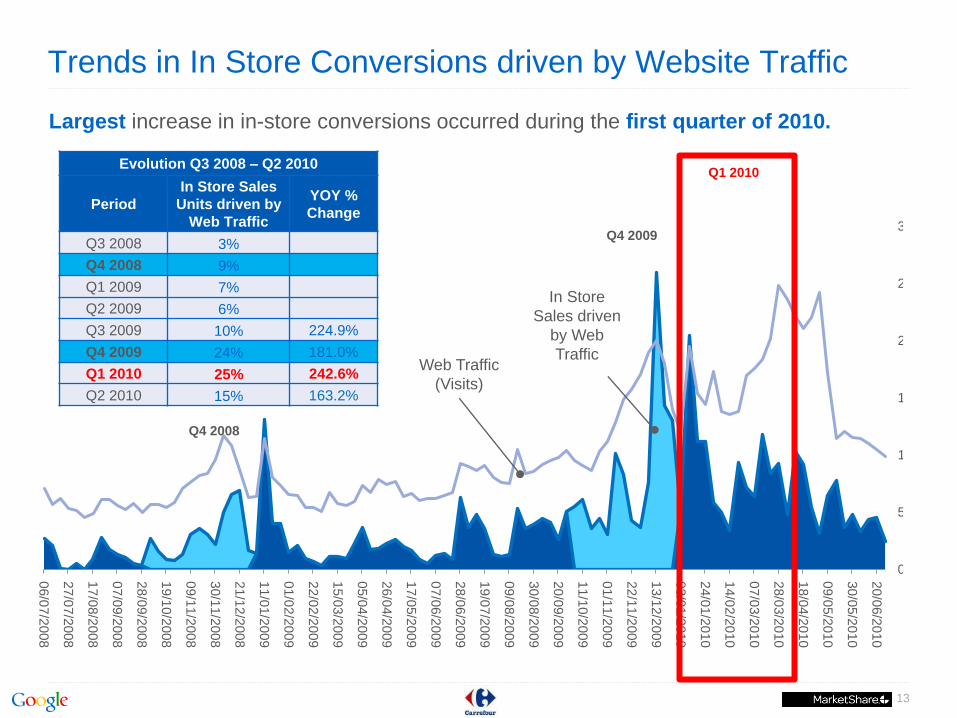
Trends in In Store Conversions driven by Website Traffic
13
Largest increase in in-store conversions occurred during the first quarter of 2010.
In Store
Sales driven
by Web
TrafficWeb Traffic
(Visits)
Evolution Q3 2008 – Q2 2010
Period
In Store Sales
Units driven by
Web Traffic
YOY %
Change
Q3 2008 3%
Q4 2008 9%
Q1 2009 7%
Q2 2009 6%
Q3 2009 10% 224.9%
Q4 2009 24% 181.0%
Q1 2010 25% 242.6%
Q2 2010 15% 163.2%
Q1 2010
Q4 2008
Q4 2009

MarketShare Confidential and Proprietary 14
Project Results: Online SalesWhat are the key drivers of online personal computers sales?
What are the personal computers media effects on website traffic?

10,4%
9,5%
14,8%
12,3%
5,1%4,4%
2,6%2,0% 1,4% 0,5%
Display
Ads*
Non PC: 1.3%
PC: 0.1%
15
37.0%
57% of Carrefour sales
are non marketing drivers
43% of Carrefour sales are
influenced by Marketing
Paid Search and Magazine are responsible for driving 25% of revenue – nearly 50% of all sales driven by marketing
Paid Search and Magazineare the biggest drivers of online marketing sales.
Base
Sales
Price Seasonality
& Holidays
Paid
Search*
Non PC: 14.6%
PC: 0.2%
Magazines*
Non PC: 11.9%
PC: 0.3%
Print* Catalogues TV*
Non PC: 1.4%
PC: 1.1%
Understanding the Drivers of Online Personal Computers Sales
Radio* OOH*
* Non Personal Computer Advertising – Halo effect

MarketShare Confidential and Proprietary 16
Project Results: ROI of media spendWhat is the ROI on Carrefour Marketing?

Carrefour Personal Computers – Return on Investment
17
The ROI of each media is based upon the
media investment and return .
Digital marketing is the most cost efficient media in the mix.
2,46 € 5,37 € 7,85 €0
1
2
3
4
5
6
7
8
9
TV Magazine Online
Avg.
ROI:
€3.52

MarketShare Confidential and Proprietary 18
AppendixBackground info

Methodology: Model Fit
0
5 000
10 000
15 000
20 000
25 000
30 000
Sales Units
Actual Fitted
Model Average
Prediction Error = 4%
19

About MarketShare Partners
20
World-Class Marketing Science + Real-World Industry Expertise
• Strategic analytics firm deploying industry’s most advanced analytic
models for marketing effectiveness, ROI and allocation
• Reputation of being the most innovative firm in the category, with
focus on advanced math, thought leadership and action
• Significant experience with new media, including search, social
networks and display
• Heavy emphasis on application of analytics to make better decisions
going forward
• An independently owned company delivering 100% objectivity in
assessing marketing effectiveness.
All data analysis and econometric modelling was conducted by
Related Documents