CASE STUDY: COMPANY VALUATION OF PT GROUP Inês Alexandra Tomás de Matos Project submitted as partial requirement for the conferral of Master in Finance Supervisor: Prof. Pedro Manuel de Sousa Leite Inácio, ISCTE Business School, Finance Department April 2014

Welcome message from author
This document is posted to help you gain knowledge. Please leave a comment to let me know what you think about it! Share it to your friends and learn new things together.
Transcript
CASE STUDY: COMPANY VALUATION OF PT GROUP
Inês Alexandra Tomás de Matos
Project submitted as partial requirement for the conferral of
Master in Finance
Supervisor:
Prof. Pedro Manuel de Sousa Leite Inácio, ISCTE Business School, Finance Department
April 2014
Case Study: Company Valuation Of PT Group 2014
i
Abstract
Portugal is currently living in an Economic Crisis, which led to financial aid and control
by the commonly called “Troika” (European Union, European Central Bank and
International Monetary Fund). Therefore, it is interesting to see how companies and the
Stock Exchange in general are being affected by the country’s economic problems.
Furthermore, this is a special period in the History to analyse companies and compare
how they are currently valuated in the market, to their fair value.
As so, this case study concerns a Portuguese company quoted on Euronext and New
York Stock Exchange (NYSE), PT Group.
After the announcement of a merger between Oi (Brazilian company in the
telecommunication sector) and PT, it is even more crucial to analyse the value of this
company and understand how the markets reacted to it.
In this study, PT’s valuation and its fair value was found to be close to the price quoted
on the market. As so, the recommendation is for the investors to hold.
Keywords: Dividend Discounted Model, Multiples, Cash Flows;
Jel Classifications: G30; G34;
Case Study: Company Valuation Of PT Group 2014
ii
Resumo
Portugal está neste momento a viver uma Crise Económica, o que levou à ajuda
financeira e controlo pela comumente chamada “Troika” (União Europeia, Banco
Central Europeu e Fundo Monetário Internacional). Assim sendo, é interessante ver
como as empresas e a Bolsa de Valores em geral são afetados pelos problemas
económicos do país.
Acresce a isso o facto de este ser um período especial na História para analisar empresas
e comparar como estão avaliadas no mercado, com o seu valor justo.
Assim, este projeto tem como objeto de estudo uma empresa Portuguesa cotada no
Euronext e no New York Stock Exchange (NYSE), o Grupo PT.
Após o anúncio da fusão entre a Oi (empresa Brasileira do sector das telecomunicações)
e a PT, é ainda mais importante analisar o valor desta empresa e perceber como os
mercados reagiram a esse anúncio.
Segundo este estudo, a avaliação da PT e o seu justo valor estão perto do preço cotado
no mercado. Assim sendo, a recomendação é que os investidores a mantenham em
carteira (“hold”).
Palavras-Chave: Dividend Discounted Model, Múltiplos, Cash Flows;
Jel Classifications: G30; G34;
Case Study: Company Valuation Of PT Group 2014
iii
Acknowledgements
This project would not be possible to be made without the help of some people. First of
all, and more important of all, I would like to thank my parents, for all the support and
motivation, as well as my sister and grandmother, who always stood there for me. I
would also like to thank my colleagues from BNP Paribas Securities Services, who
always helped me on work and off work, and my other friends, who also always
understood why I could not be with them as often as before. On work, I also have to
thank my Team Leader, Carlos Amaral, for the support and the understanding. At last
but not least, I would like to thank my supervisor Professor Pedro Leite Inácio, for all
the orientation and advice.
Case Study: Company Valuation Of PT Group 2014
1
General Index
Abstract .............................................................................................................................. i
Resumo ............................................................................................................................. ii
Acknowledgements ......................................................................................................... iii
General Index ................................................................................................................... 1
Tables Index ..................................................................................................................... 3
Figures Index .................................................................................................................... 4
1. Introduction ............................................................................................................... 5
2. Telecommunications sector in Portugal .................................................................... 6
2.1 History of the Sector ............................................................................................... 6
2.2 PT Group ................................................................................................................. 8
2.2.1 PT Group History ............................................................................................. 8
2.2.2 PT Group in the sector ..................................................................................... 9
2.2.3 Shareholders Ownership ................................................................................ 11
2.2.4 International Business .................................................................................... 12
2.2.5 Other players .................................................................................................. 13
2.3 Future of the sector ............................................................................................... 14
3. Literature Review .................................................................................................... 16
3.1 Discounted Cash Flow Valuation ......................................................................... 16
3.2 Relative Valuation (Multiples) ............................................................................. 18
3.3 Contingent claim (Real Options) .......................................................................... 19
3.4 Dividend Discounted Model ................................................................................. 20
3.5 Economic Value Added (EVA®) .......................................................................... 20
4. Data and Methodology ............................................................................................ 22
5. Company Valuation................................................................................................. 23
5.1 Financial Overview ............................................................................................... 23
5.2 Valuation of PT Group ......................................................................................... 24
5.2.1 Growth ............................................................................................................ 24
5.2.2 Cost of Equity, Cost of Debt and Weighted Cost of Capital ......................... 25
5.2.3 Dividend Discounted Model .......................................................................... 29
5.2.4 Discounted Cash Flows .................................................................................. 31
5.2.5 Economic Value Added (EVA)...................................................................... 32
5.2.6 Relative Valuation – Multiples ...................................................................... 33
5.2.7 Comparison between methods ....................................................................... 35
5.2.8 Sensitivity Analysis ........................................................................................ 35
Case Study: Company Valuation Of PT Group 2014
2
6. Future of PT ............................................................................................................ 37
7. Conclusion ............................................................................................................... 39
8. Bibliographic References ........................................................................................ 40
Appendix ........................................................................................................................ 44
A. Income Statement ............................................................................................ 44
B. Other relevant data ........................................................................................... 45
C. Balance Sheet ................................................................................................... 45
D. Income Statement Analysis ............................................................................. 46
E. Balance Sheet Analysis ....................................................................................... 47
F. General Growth Analysis .................................................................................... 48
G. Revenue Growth Analysis ............................................................................... 48
H. Operating Profibility Analysis ......................................................................... 48
I. Operating or Business Risk Analysis .................................................................. 49
J. Profitability Analysis (Return on Assets) ............................................................ 49
K. Profitability Analysis (Return on Net Assets) ................................................. 50
L. Return on Equity Analysis (Spread Model - Total Assets) ................................. 51
M. Return on Equity Analysis (Spread Model – Total Funding) .......................... 52
N. Return on Equity Analysis (Factor Model) ...................................................... 52
O. Minority Interest and Dividend Policy Effect .................................................. 53
P. Group ROE Measures .......................................................................................... 53
Q. Financial Risk and Total Risk Analysis ........................................................... 54
R. Balance Sheet Analysis (Ratios) ...................................................................... 54
S. Activity Ratios ..................................................................................................... 55
T. Other ratios .......................................................................................................... 55
U. Average Closing Prices and Returns ............................................................... 56
V. Risk Free rate ................................................................................................... 56
W. Regression results ............................................................................................ 57
X. Beta and other risk measures ........................................................................... 57
Y. Weighted Average Cost of Capital .................................................................. 58
Z. Forecasting of 2014 to 2018 ................................................................................ 58
AA. Expected Dividends Valuation ........................................................................ 59
BB. Discounted Cash Flow for the Firm ................................................................. 59
CC. Discount Cash Flow for Equity ....................................................................... 60
DD. MVA and EVA ................................................................................................ 61
EE. Multiples Valuation ......................................................................................... 61
Case Study: Company Valuation Of PT Group 2014
3
Tables Index
Table 1 – Shareholders Ownership ................................................................................. 12
Table 2 – Key Figures on Financial Overview ............................................................... 23
Table 3 – Growth rates ................................................................................................... 25
Table 4 – Beta ................................................................................................................. 27
Table 5 – Cost of Equity ................................................................................................. 28
Table 6 – Cost of Debt .................................................................................................... 28
Table 8 – Dividend Payout Ratio ................................................................................... 30
Table 9 – Dividend Estimation ....................................................................................... 30
Table10 – Share Price with Dividend Discounted Model .............................................. 30
Table 11 – Free Cash Flow to the Firm .......................................................................... 31
Table 12 – Share Price with Discounted Cash Flows (FCFF) ........................................ 31
Table 13 – Free Cash Flow for Equity ........................................................................... 32
Table 14 – Share Price with Discounted Cash Flows (FCFE) ....................................... 32
Table 15 – MVA and EVA ............................................................................................. 33
Table 16 – EVA spread .................................................................................................. 33
Table 17 - Multiples ....................................................................................................... 34
Table 18 – Comparison between models ........................................................................ 35
Table 19 – Growth Rate and WACC Sensitivity Analysis ............................................. 36
Case Study: Company Valuation Of PT Group 2014
4
Figures Index
Figure 1 – Main Products of Meo ................................................................................... 10
Figure 2 – Market Share on Combined Services ............................................................ 11
Figure 3 – International Presence of PT ......................................................................... 13
Figure 4 – Stock Price of PT .......................................................................................... 37
Case Study: Company Valuation Of PT Group 2014
5
1. Introduction
The main objective of this case study is to determine the fair value of the PT Group and
compare it to the stock value in the market. Based on different valuation methods (that
are exposed in more detail on the Literature Review), it will be possible to advise
investors whether they should buy, sell or hold.
PT Group was chosen as the centre of this study for different reasons:
Availability of data: It was essential to choose a company quoted on the Stock
Exchange, due to the fact that these companies share their financial statements
not only with investors but also the general public. On the other hand, being a
Portuguese company means that it may be easier to get in touch with;
Portugal’s economic and social crisis: PT is from a country going through a
rough Economic and Social period and it is interesting to investigate whether
this has an impact on the company’s stock price or not;
The oncoming merger with Oi: On the beginning of October, 2013, it was
confirmed by Zeinal Bava, chief executive of PT Group, the merger with the
Braazilian Oi, a telecommunications company that PT already had a
participation in. According to the official notice on PT’s website, this merger is
said to be concluded in the first semester of 2014.
This case study is of interest to investors, as previously stated, and portfolio managers
but also the company’s managers, to understand if the company is under valuated or
over valuated.
Case Study: Company Valuation Of PT Group 2014
6
2. Telecommunications sector in Portugal
The Telecommunications sector in Portugal exists since the 18th century. So far, many
things have changed. First of all, the monopoly of State Companies does no longer
exist. Also, unlike when it started, nowadays companies are focused on giving a
combined solution and as so, a player in this sector can offer the services of mobile
telephones, landline telephones, television, and internet, among others.
In this sector, PT Group is one of the most important players, not only for its History
but also in terms of revenue and market share.
2.1 History of the Sector
The History of the Telecommunications sector in Portugal is essentially the History of
the PT Group as well, especially until certain point in time.
After Alexander Graham Bell invented the telephone back in 1876, everywhere around
the Globe, countries started to implement this new technology.
In Portugal, it was on 1877 that the first experiences started. However, only on 1882,
the Edison Gower Bell Telephone Company of Europe established on Lisbon and
Oporto, and they were granted the concession of the telephone service.
This concession was then granted to The Anglo Portuguese Telephone Company (APT)
until 1968. In this year, a national entity was created, called Empresa Pública Telefones
de Lisboa e Porto (TLP), and became the one handling the telecommunications in
Lisbon and Oporto. In the other parts of Portugal, it was Correios, Telégrafos e
Telefones (CTT) that had the concession.
In 1922, Marconi’s Wireless Telegraphy Company was granted the concession of Radio
Telegraphy and Wireless Telephony and in 1925 Companhia Portuguesa Rádio
Marconi was created and assumed the responsibilities of its ancestor.
Case Study: Company Valuation Of PT Group 2014
7
CTT became a national entity on 1970. However, it was only on 1992 that CTT became
fully dedicated to the Mailing business. At the same time, the telecommunications part
of the business was then explored by Telecom Portugal S.A., a national entity as well,
created with that purpose.
At this point, Portugal had 3 players in the Telecommunications sector: TLP, in Lisbon
and Oporto; Telecom Portugal, on the remaining parts of the country, plus Europe and
the Mediterranean Area; and Marconi, for intercontinental affairs.
In 1991, Telecomunicações Móveis Nacionais (TMN) was created by TLP and Telecom
Portugal for mobile telecommunications. Also in the same year, Teledifusora de
Portugal (TDP) was created to manage the infrastructures of Telediffusion.
Portugal Telecom, S.A. was created through the merger of Telecom Portugal, TLP and
TDP, and became the only national player in the Telecommunication Sector.
In 1992, the market was introduced to the only competition Portugal Telecom had for a
while: Telecel – Comunicações Pessoais, S.A. This company (nowadays Vodafone
Portugal) was created to operate in the Mobile Telecommunications sector and,
therefore, TMN was no longer the only player in that sector.
However, not only TMN would get competition. Later, in 1998, new regulation led to
the liberalization of the Telecommunicated sector. That is, since that date, it was
possible to have more players competing in the sector.
At this time, other companies were created such as Oni (the first one), Jazztel, as
landline Telecommunications provider, and Sonae Com (through the brand Optimus), as
mobile telecommunications provider.
Portugal Telecom started to be quoted on the Stock Exchange and as so, became a non-
national company in 1995, with the State selling their stake of the company throughout
the following 5 years.
Case Study: Company Valuation Of PT Group 2014
8
2.2 PT Group
In this section, PT Group will be reviewed, namely the History, the role in the sector,
the Ownership and the International Presence.
2.2.1 PT Group History
As it was pointed out previously, the History of the Sector in Portugal and the History
of PT Group are one and the same until PT Group stopped being fully owned by the
State.
However, it is important to mention that even though the State stopped controlling the
company, there were still 500 Golden Shares. These shares gave the possibility to the
State to veto any decision or takeover.
In 2007, Sonae, a Portuguese group, tried to acquire PT, however the attempt was not
successful. PT board of directors rejected the bid.
Nevertheless, and as a consequence of this takeover attempt, PT Group spun off PT
Multimédia, a media company, that nowadays does business under the brand ZON.
There was part of this company Tv Cabo and Cinemas Lusomundo.
At the same time, the State was suffering pressure from the European Commission to
give up on the Golden Shares, which happened on 2011.
Since 2003, PT Group owned 50% of Vivo, a Brazilian mobile company, while
Telefónica owned the other half. However, in 2010, Telefónica bought PT’s shares,
even though the State used the Golden shares to veto the sell on a first attempt.
PT then proceeded to continuing investing in Brazil, this time by acquiring a stake in
Oi, a landline telephone company.
Case Study: Company Valuation Of PT Group 2014
9
On 2007, PT Group created the brand Meo. This brand provided triple-play
subscription, that is, television network, internet service and landline telephone service.
Meo was essentially created to continue providing television services that were
previously provided by PT Multimédia.
With the creation of the product line M4O, PT Group started to provide to the clients an
integrated subscription, including mobile phone service via TMN. This product line
(quadruple play or multiple play) was innovator since no other market player was
offering it at the time.
TMN, the company within the PT Group dedicated to mobile service, ceased to exist in
2014 and the services are now provided by PT under the brand Meo.
2.2.2 PT Group in the sector
As it was mentioned along the History of the Sector chapter, Portugal Telecom (and its
ancestors) was for a long time the only player in the sector and still nowadays one of the
most notorious and well-known companies operating in Portugal.
PT Group has around 100 companies, including the participations, both in Portugal and
abroad. However, in this project, there will be a focus on the most important companies
in the group.
PT Comunicações provides the services of fixed phone, internet, cable television and
mobile phones.
PT Data Center is in the business of cloud solutions, or, in other words, storage of data
of companies and technological services. The biggest physical infrastructure is located
in Covilhã and it is one of the largest data centers in the world.
PT Inovação e Sistemas is a company whose focus is on finding innovative solutions
and providing support to systems, not only in the group but also to other companies.
Case Study: Company Valuation Of PT Group 2014
10
PT Pro is a transversal company that supports companies within the group with
management of budgets, human resources, facilities and documents.
PT Pay manages the service Meo Wallet, which enables the client to pay for services or
products through the mobile phones, televisions and computers.
PT Contact is a company directed mainly to marketing services and sales.
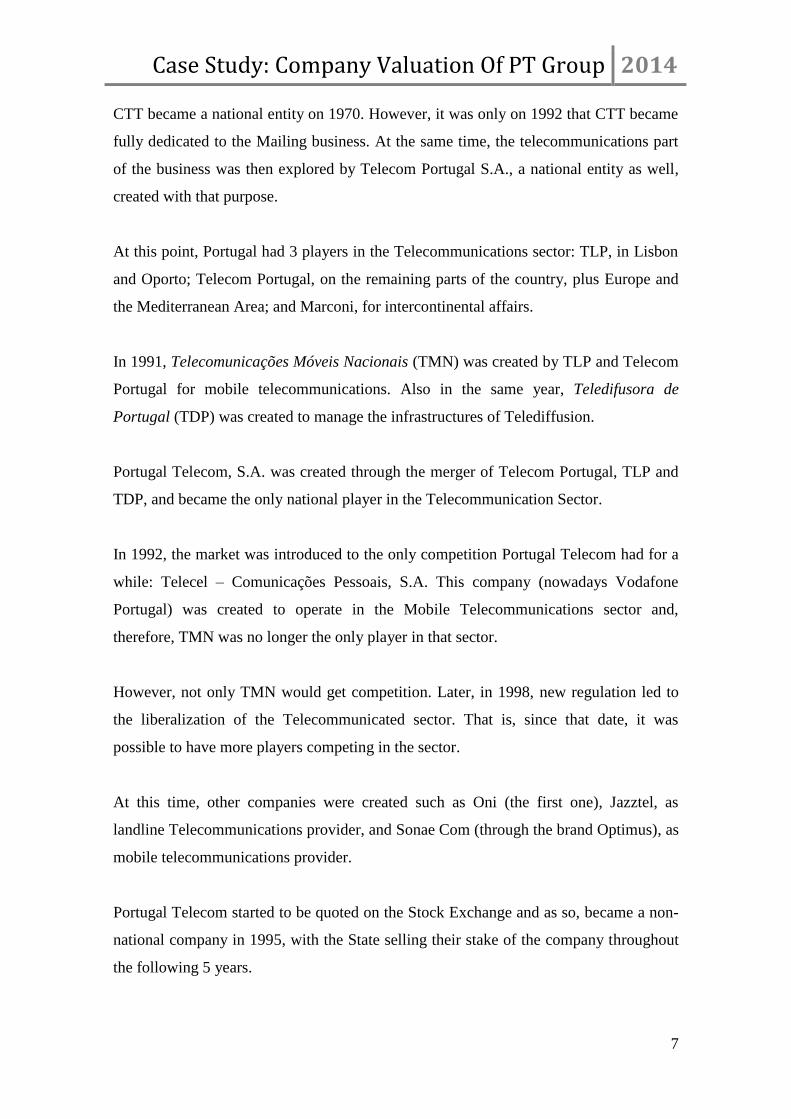
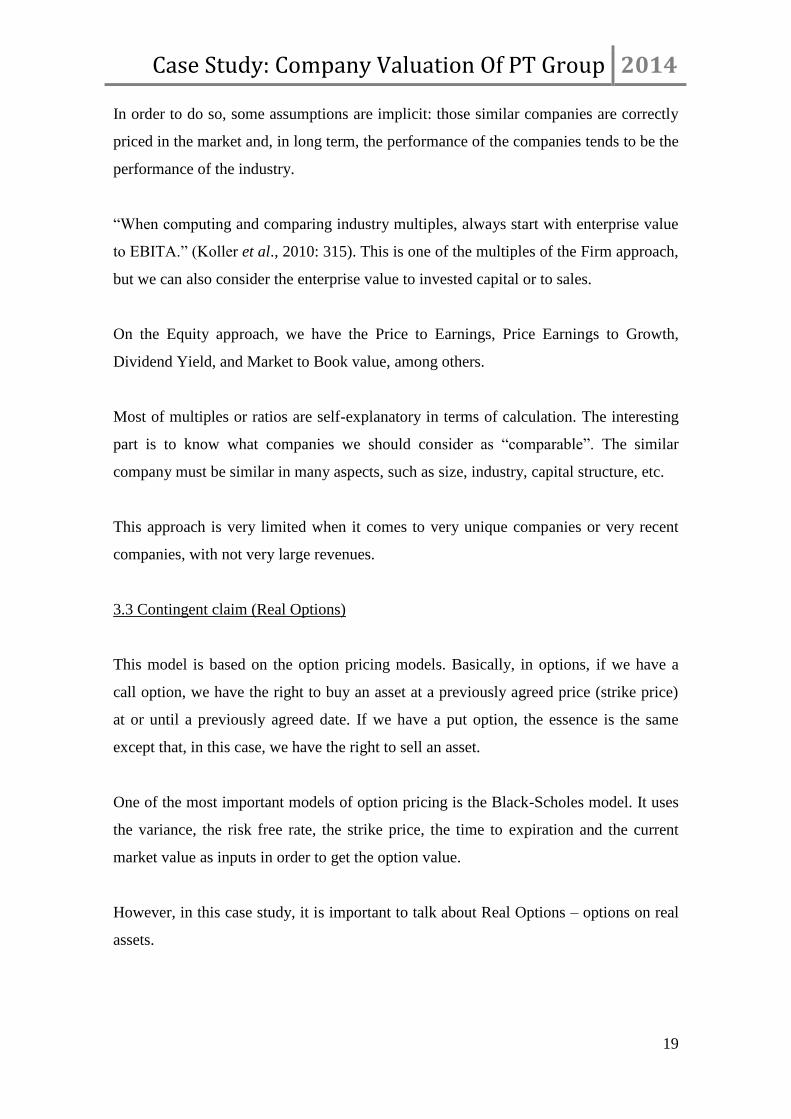
As it was possible to understand, PT Group offers a wide range of products and
services. On the consumer product line, these products are all offered under the brand
Meo.
Figure 1 – Main Products of Meo
Source: Adapted from Meo.com
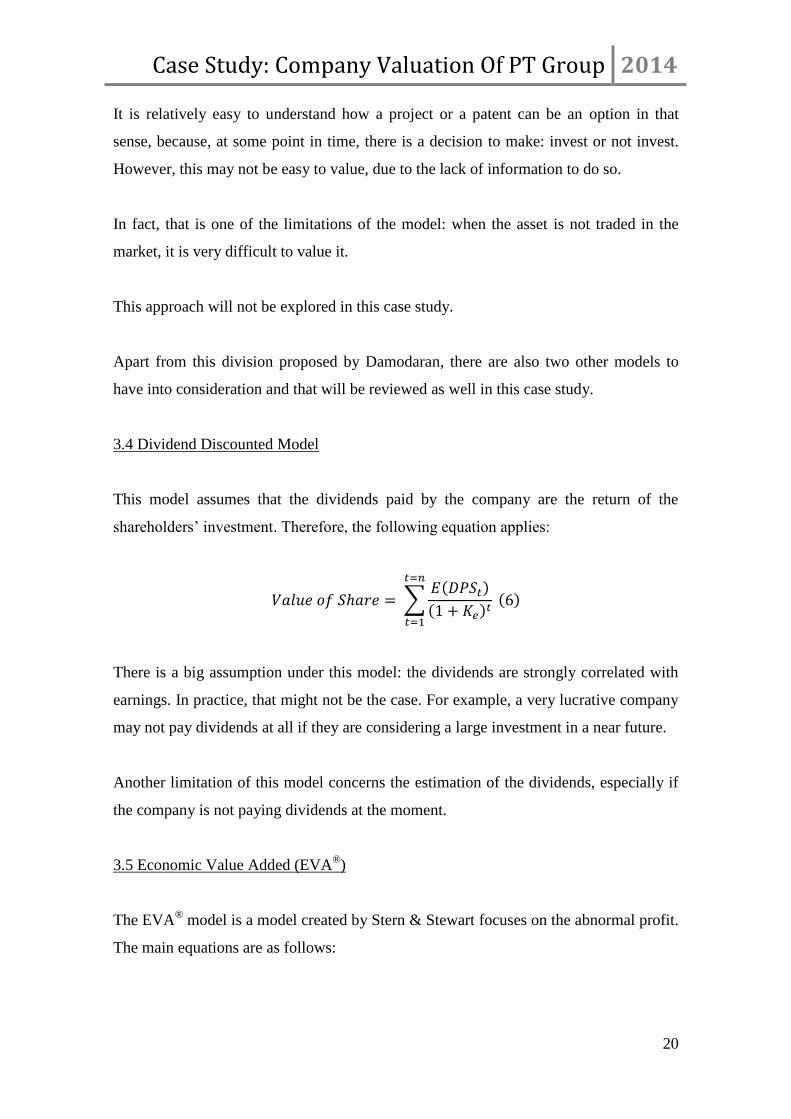
In terms of Market Share, it is also interesting to perceive the situation of PT Group in
the sector.
Meo
Fixed Phone
Mobile Phone
Packages
Dual Play
Triple Play
Multiple Play (M4O)
Meo Cloud
Meo Music
Meo Shows
Meo Sudoeste
Meo Arena
Meo Wallet
...
Case Study: Company Valuation Of PT Group 2014
11
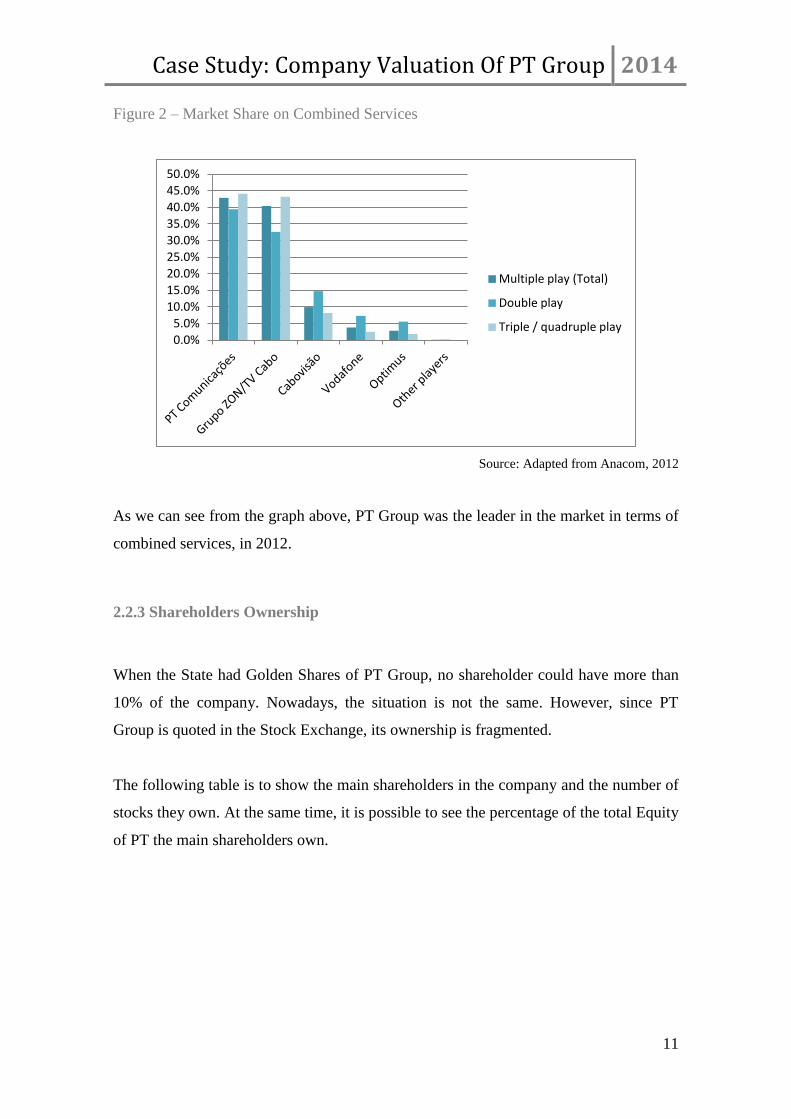
Figure 2 – Market Share on Combined Services
Source: Adapted from Anacom, 2012
As we can see from the graph above, PT Group was the leader in the market in terms of
combined services, in 2012.
2.2.3 Shareholders Ownership
When the State had Golden Shares of PT Group, no shareholder could have more than
10% of the company. Nowadays, the situation is not the same. However, since PT
Group is quoted in the Stock Exchange, its ownership is fragmented.
The following table is to show the main shareholders in the company and the number of
stocks they own. At the same time, it is possible to see the percentage of the total Equity
of PT the main shareholders own.
0.0%
5.0%
10.0%
15.0%
20.0%
25.0%
30.0%
35.0%
40.0%
45.0%
50.0%
Multiple play (Total)
Double play
Triple / quadruple play
Case Study: Company Valuation Of PT Group 2014
12
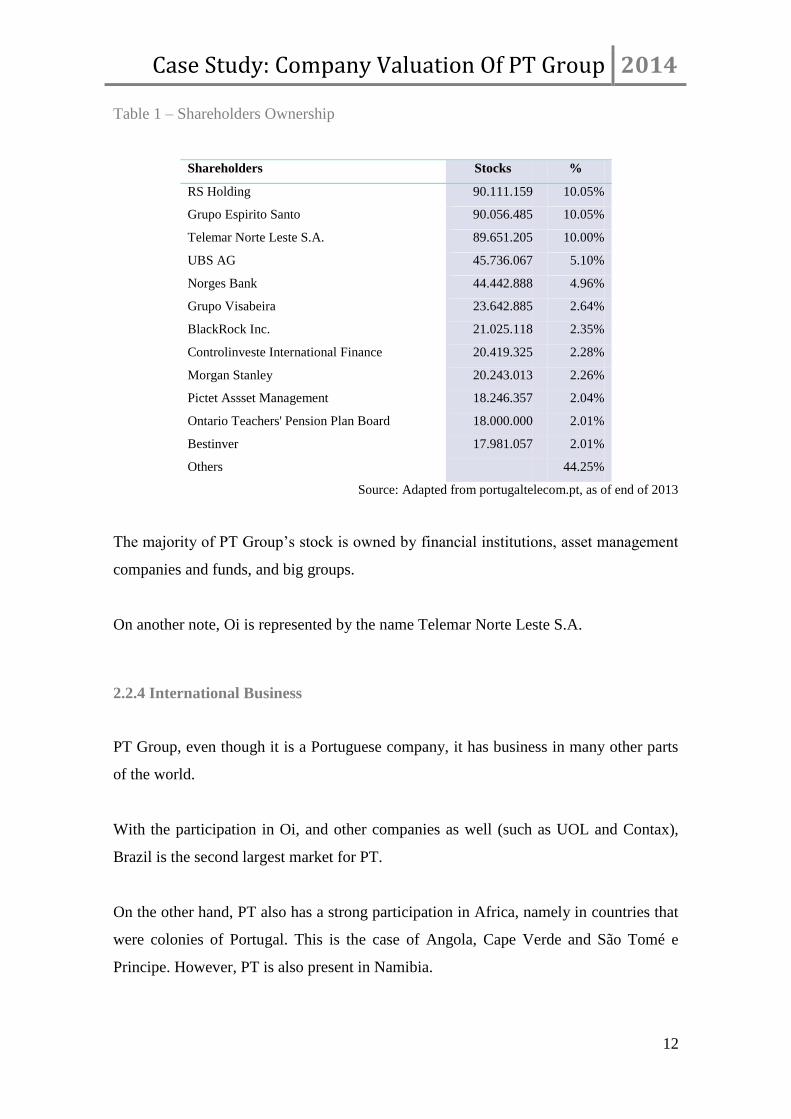
Table 1 – Shareholders Ownership
Shareholders Stocks %
RS Holding 90.111.159 10.05%
Grupo Espirito Santo 90.056.485 10.05%
Telemar Norte Leste S.A. 89.651.205 10.00%
UBS AG 45.736.067 5.10%
Norges Bank 44.442.888 4.96%
Grupo Visabeira 23.642.885 2.64%
BlackRock Inc. 21.025.118 2.35%
Controlinveste International Finance 20.419.325 2.28%
Morgan Stanley 20.243.013 2.26%
Pictet Assset Management 18.246.357 2.04%
Ontario Teachers' Pension Plan Board 18.000.000 2.01%
Bestinver 17.981.057 2.01%
Others 44.25%
Source: Adapted from portugaltelecom.pt, as of end of 2013
The majority of PT Group’s stock is owned by financial institutions, asset management
companies and funds, and big groups.
On another note, Oi is represented by the name Telemar Norte Leste S.A.
2.2.4 International Business
PT Group, even though it is a Portuguese company, it has business in many other parts
of the world.
With the participation in Oi, and other companies as well (such as UOL and Contax),
Brazil is the second largest market for PT.
On the other hand, PT also has a strong participation in Africa, namely in countries that
were colonies of Portugal. This is the case of Angola, Cape Verde and São Tomé e
Principe. However, PT is also present in Namibia.
Case Study: Company Valuation Of PT Group 2014
13
In Asia, PT has a participation in East Timor, again in an ex-colony of Portugal.
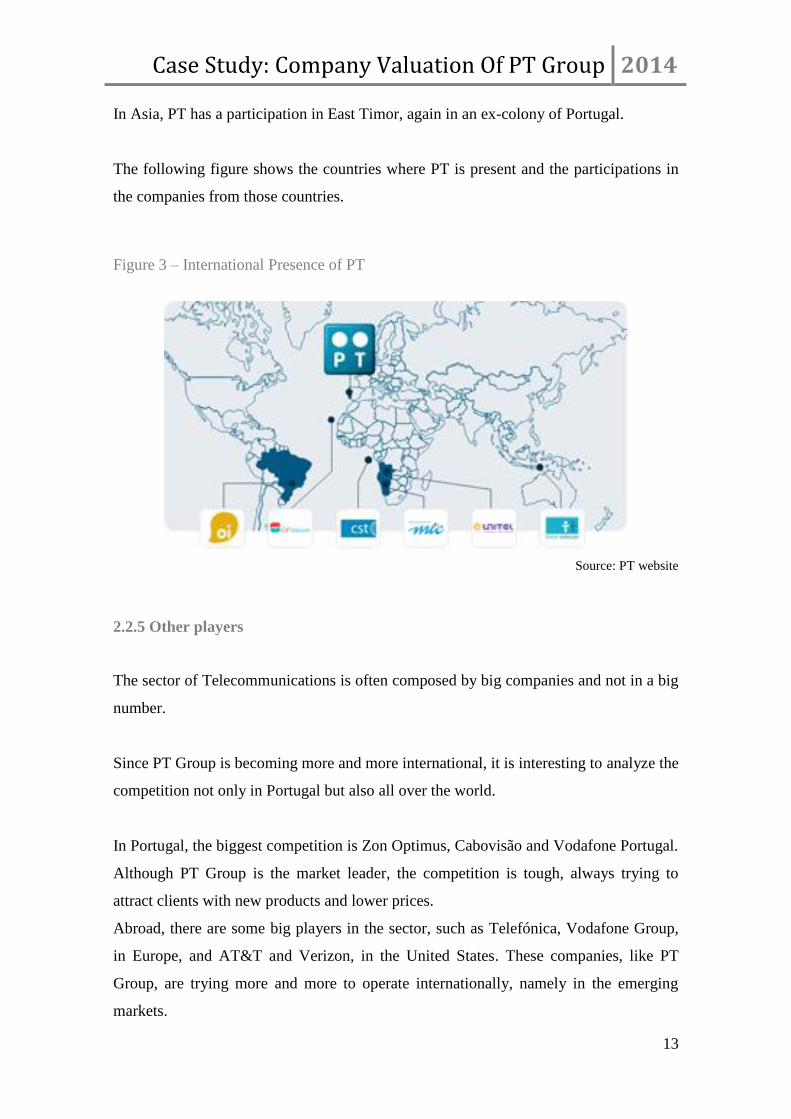
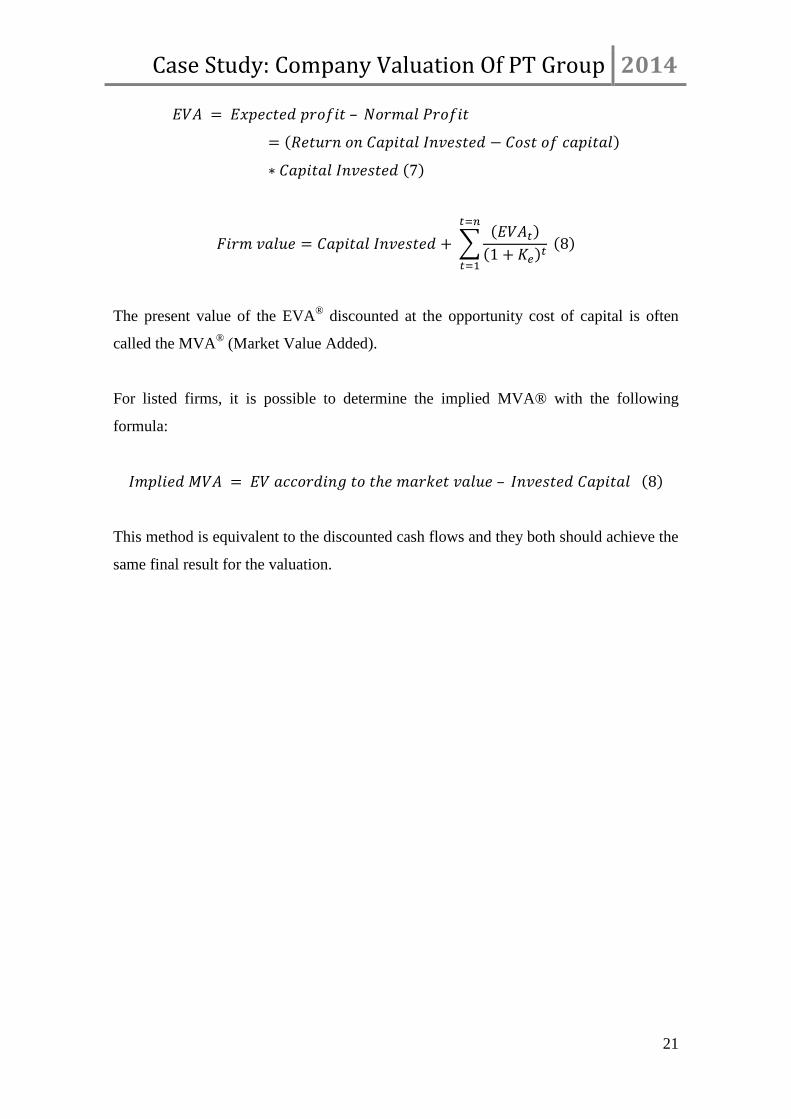
The following figure shows the countries where PT is present and the participations in
the companies from those countries.
Figure 3 – International Presence of PT
Source: PT website
2.2.5 Other players
The sector of Telecommunications is often composed by big companies and not in a big
number.
Since PT Group is becoming more and more international, it is interesting to analyze the
competition not only in Portugal but also all over the world.
In Portugal, the biggest competition is Zon Optimus, Cabovisão and Vodafone Portugal.
Although PT Group is the market leader, the competition is tough, always trying to
attract clients with new products and lower prices.
Abroad, there are some big players in the sector, such as Telefónica, Vodafone Group,
in Europe, and AT&T and Verizon, in the United States. These companies, like PT
Group, are trying more and more to operate internationally, namely in the emerging
markets.
Case Study: Company Valuation Of PT Group 2014
14
2.3 Future of the sector
As in many other sectors, technology has had a strong impact in the telecommunications
sector.
Nowadays, people are increasingly using internet as the main platform to communicate
with others. Simultaneously, internet is becoming to be very wide spread and it is
possible to access it from almost everywhere in the world.
At the same time, devices are improving as well. Mobile phones have been upgraded to
the so-called Smart Phones that can access internet via Wi-Fi or Mobile Broad Band
Internet Access (3G and 4G technologies).
Applications such as Skype and Whatsapp use internet instead of traditional
telecommunications infrastructures and are replacing the usual phone calls and text
messages. They are essentially free to the user, apart from the internet subscription
service, which can be also replaced by a free Wi-Fi Hotspot.
On the other hand, people are also using more and more social networks as a tool to
communicate, since, again through different devices, they can access Facebook and
Twitter, for example, almost everywhere.
This can also be applied to television services. There are applications that allow people
to see a show or a movie in other devices other than the usual one, a television.
As a consequence, people are looking to be always connected. They do not want to
worry about not having internet if they leave home, for example. The answer for that is
already in place with the combined solutions.
Another factor that will influence the telecommunications sector, namely in Europe,
will be the so-called Euro tariff. With this law, people will be able to call any place in
European Union without being charged the usual roaming fee.
Case Study: Company Valuation Of PT Group 2014
15
As so, telecommunications companies will continue to find innovative solutions and
improve velocity and quality of services.
Potentially they will evade from their usual business and focus on the data business.
That is, their core business will more and more be storage of data and cloud services.
Another reason for this is the increasingly search for outsourcing solutions from
companies, that prefer to do what they do best (their core business) and leave the rest
for others.
All in all, the companies in this sector will have to adapt to the changes that will occur
in order to fulfill their clients’ needs.
Case Study: Company Valuation Of PT Group 2014
16
3. Literature Review
In this chapter it is going to be reviewed some of the most notorious authors on the topic
of Corporate Valuation, as well as some of the most popular and tested methods of
valuations.
First of all, it is important to understand what value is. Value is not the price in the
market; value is how much an asset is worth. That is, it is not the price you pay; it is the
price you are willing to pay. Value is seen as a measure of performance (Brealey, R. et
al., 2011:3) and, in essence, valuation is just to analyse the performance of the company
at this moment and as expected for the future.
According to Damodaran (2002), valuation is not objective, it is not a science. Even
though the models used in valuation are quantitative and, ultimately, give a number, a
result for the valuation, the inputs are often based on assumptions and are subjective. A
valuation can never be seen as a certainty.
Furthermore, the value of the company is not static over time. The company as a whole
can be affected by its surroundings, such as economic or social changes, which can
modify the sales figures or the stock risk, for example. On the other hand, if there is
new information available that is crucial and it was not known before, the value can
change. Damodaran (2002) goes as far as saying “a valuation done on a firm ages
quickly”.
For the author, there are three approaches to valuation, which will be looked over next.
3.1 Discounted Cash Flow Valuation
“Companies create value by investing capital to generate future cash flow at rates of
return that exceed their cost of capital” (Koller et al., 2010: 17). On another words, the
value of a company today should be the present value of future cash flows.
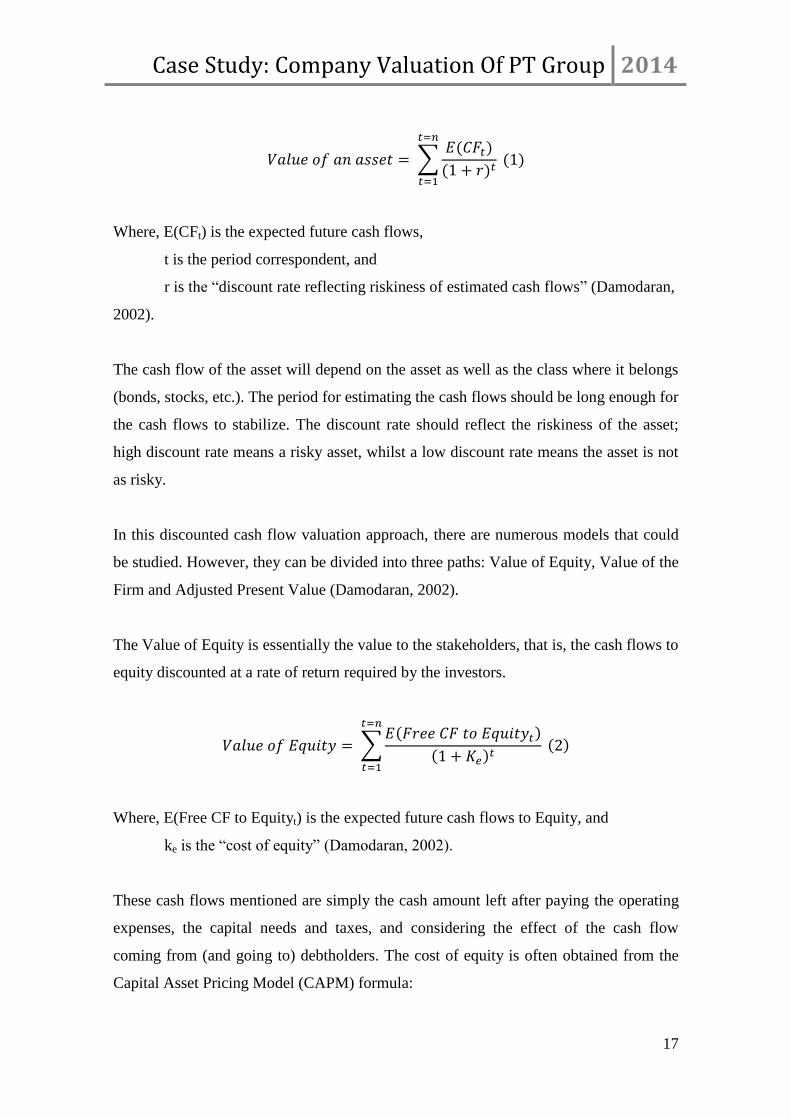
This is the basic equation for the value of an asset:
Case Study: Company Valuation Of PT Group 2014
17
Where, E(CFt) is the expected future cash flows,
t is the period correspondent, and
r is the “discount rate reflecting riskiness of estimated cash flows” (Damodaran,
2002).
The cash flow of the asset will depend on the asset as well as the class where it belongs
(bonds, stocks, etc.). The period for estimating the cash flows should be long enough for
the cash flows to stabilize. The discount rate should reflect the riskiness of the asset;
high discount rate means a risky asset, whilst a low discount rate means the asset is not
as risky.
In this discounted cash flow valuation approach, there are numerous models that could
be studied. However, they can be divided into three paths: Value of Equity, Value of the
Firm and Adjusted Present Value (Damodaran, 2002).
The Value of Equity is essentially the value to the stakeholders, that is, the cash flows to
equity discounted at a rate of return required by the investors.
Where, E(Free CF to Equityt) is the expected future cash flows to Equity, and
ke is the “cost of equity” (Damodaran, 2002).
These cash flows mentioned are simply the cash amount left after paying the operating
expenses, the capital needs and taxes, and considering the effect of the cash flow
coming from (and going to) debtholders. The cost of equity is often obtained from the
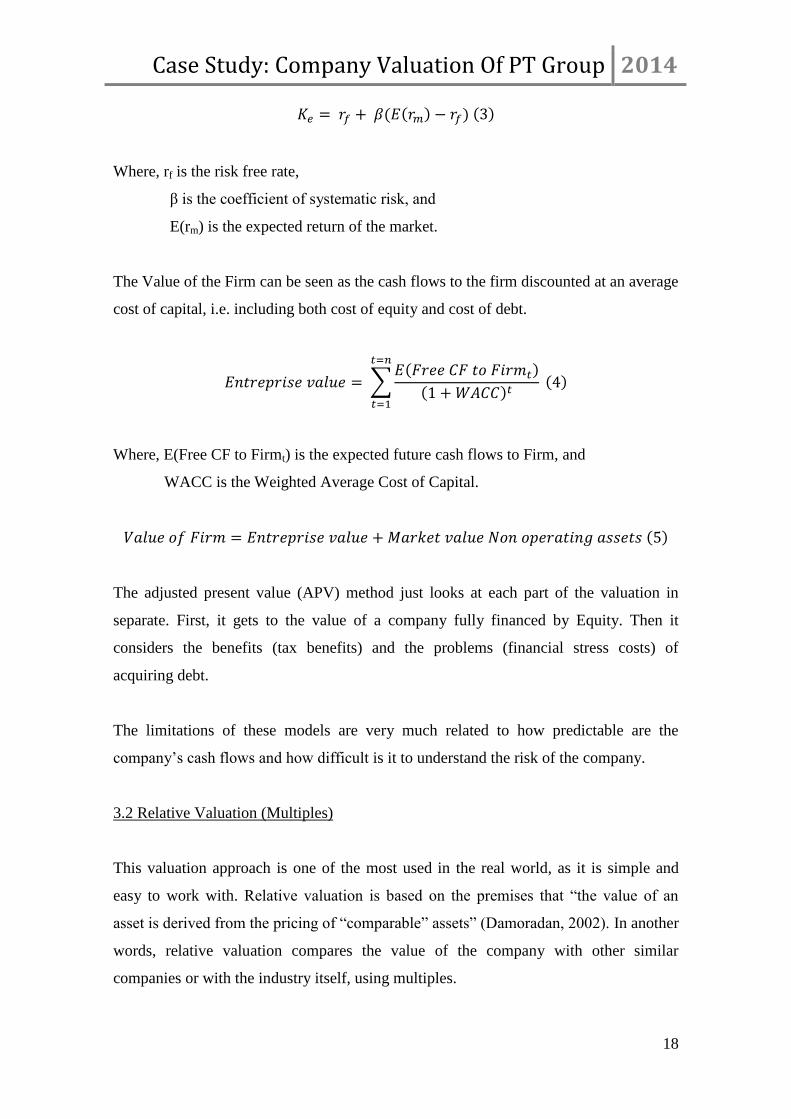
Capital Asset Pricing Model (CAPM) formula:
Case Study: Company Valuation Of PT Group 2014
18
Where, rf is the risk free rate,
β is the coefficient of systematic risk, and
E(rm) is the expected return of the market.
The Value of the Firm can be seen as the cash flows to the firm discounted at an average
cost of capital, i.e. including both cost of equity and cost of debt.
Where, E(Free CF to Firmt) is the expected future cash flows to Firm, and
WACC is the Weighted Average Cost of Capital.
The adjusted present value (APV) method just looks at each part of the valuation in
separate. First, it gets to the value of a company fully financed by Equity. Then it
considers the benefits (tax benefits) and the problems (financial stress costs) of
acquiring debt.
The limitations of these models are very much related to how predictable are the
company’s cash flows and how difficult is it to understand the risk of the company.
3.2 Relative Valuation (Multiples)
This valuation approach is one of the most used in the real world, as it is simple and
easy to work with. Relative valuation is based on the premises that “the value of an
asset is derived from the pricing of “comparable” assets” (Damoradan, 2002). In another
words, relative valuation compares the value of the company with other similar
companies or with the industry itself, using multiples.
Case Study: Company Valuation Of PT Group 2014
19
In order to do so, some assumptions are implicit: those similar companies are correctly
priced in the market and, in long term, the performance of the companies tends to be the
performance of the industry.
“When computing and comparing industry multiples, always start with enterprise value
to EBITA.” (Koller et al., 2010: 315). This is one of the multiples of the Firm approach,
but we can also consider the enterprise value to invested capital or to sales.
On the Equity approach, we have the Price to Earnings, Price Earnings to Growth,
Dividend Yield, and Market to Book value, among others.
Most of multiples or ratios are self-explanatory in terms of calculation. The interesting
part is to know what companies we should consider as “comparable”. The similar
company must be similar in many aspects, such as size, industry, capital structure, etc.
This approach is very limited when it comes to very unique companies or very recent
companies, with not very large revenues.
3.3 Contingent claim (Real Options)
This model is based on the option pricing models. Basically, in options, if we have a
call option, we have the right to buy an asset at a previously agreed price (strike price)
at or until a previously agreed date. If we have a put option, the essence is the same
except that, in this case, we have the right to sell an asset.
One of the most important models of option pricing is the Black-Scholes model. It uses
the variance, the risk free rate, the strike price, the time to expiration and the current
market value as inputs in order to get the option value.
However, in this case study, it is important to talk about Real Options – options on real
assets.
Case Study: Company Valuation Of PT Group 2014
20
It is relatively easy to understand how a project or a patent can be an option in that
sense, because, at some point in time, there is a decision to make: invest or not invest.
However, this may not be easy to value, due to the lack of information to do so.
In fact, that is one of the limitations of the model: when the asset is not traded in the
market, it is very difficult to value it.
This approach will not be explored in this case study.
Apart from this division proposed by Damodaran, there are also two other models to
have into consideration and that will be reviewed as well in this case study.
3.4 Dividend Discounted Model
This model assumes that the dividends paid by the company are the return of the
shareholders’ investment. Therefore, the following equation applies:
There is a big assumption under this model: the dividends are strongly correlated with
earnings. In practice, that might not be the case. For example, a very lucrative company
may not pay dividends at all if they are considering a large investment in a near future.
Another limitation of this model concerns the estimation of the dividends, especially if
the company is not paying dividends at the moment.
3.5 Economic Value Added (EVA®
)
The EVA® model is a model created by Stern & Stewart focuses on the abnormal profit.
The main equations are as follows:
Case Study: Company Valuation Of PT Group 2014
21
The present value of the EVA® discounted at the opportunity cost of capital is often
called the MVA® (Market Value Added).
For listed firms, it is possible to determine the implied MVA® with the following
formula:
This method is equivalent to the discounted cash flows and they both should achieve the
same final result for the valuation.
Case Study: Company Valuation Of PT Group 2014
22
4. Data and Methodology
The financial data, specifically the financial statements of the PT Group, was collected
directly from its website and Bloomberg. In order to get the most accurate possible
valuation of the company, the data period will be from 2011 to 2013 and the frequency
will be yearly.
The choice of the data period needed to reflect a not very long period because PT is
often creating new services and products (typical in a very innovating-driven sector
such as the telecommunications one) and also periodically acquiring new participations
in other companies. Another reason was due to the fact that only in 2011, PT acquired
the stake of 25.5% (nowadays, after restructuration, 23.26%) in Oi.
Other financial data concerning the company and its competitors was collected from
Bloomberg. The competitors’ website was also used as an information source.
The economic factors, interest rates and risk factors were found in INE (Instituto
Nacional de Estatistica, i.e., Statistics of Portugal), IMF (International Monetary Fund),
Damodaran’s website, among others.
Analysts’ reports were used as a comparison tool or a benchmark, to have an idea on
what to expect of this valuation.
All these sources are clearly cited when used.
For this purpose, the methodology to be used is the one described in “Literature
Review”, with the right adaptations, except the Contingent Claim approach.
Case Study: Company Valuation Of PT Group 2014
23
5. Company Valuation
In the first part of this chapter, PT Group will be analysed in terms of its financial
health. In the second part, the valuation itself will take place.
5.1 Financial Overview
Apart from valuating a company, it is also interesting to analyse how PT Group stands
today. As so, a summary will be presented with the Key Figures.
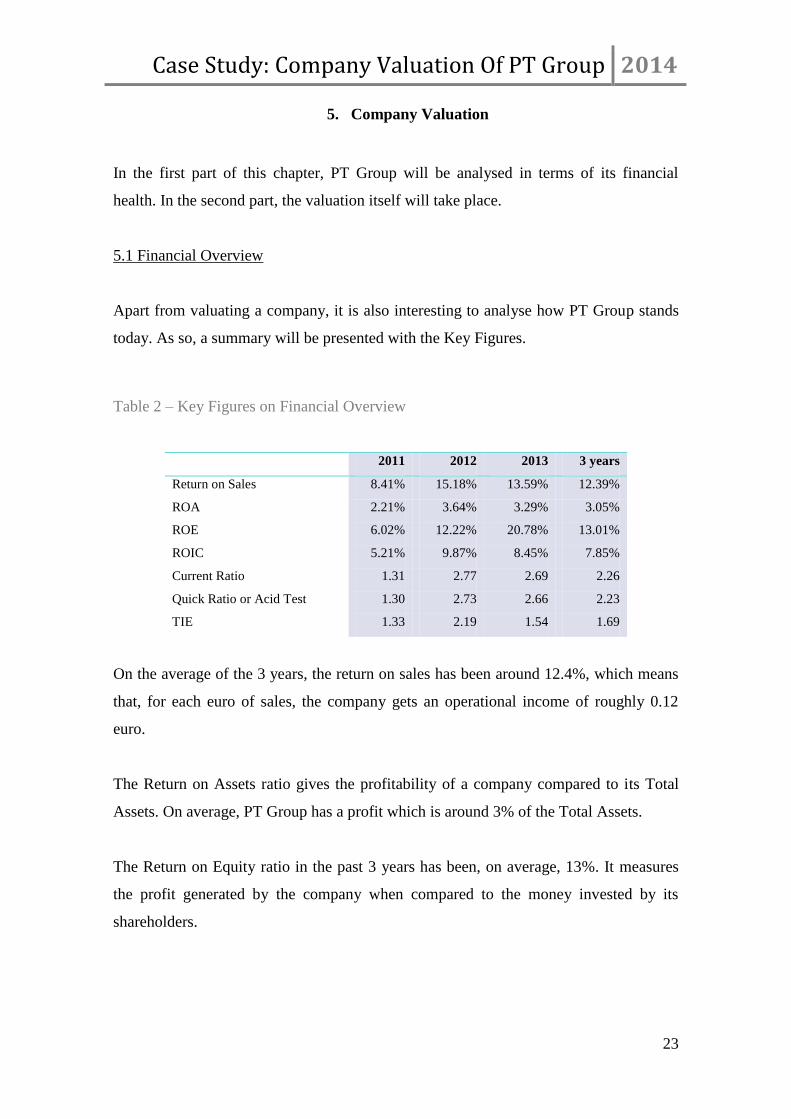
Table 2 – Key Figures on Financial Overview
2011 2012 2013 3 years
Return on Sales 8.41% 15.18% 13.59% 12.39%
ROA 2.21% 3.64% 3.29% 3.05%
ROE 6.02% 12.22% 20.78% 13.01%
ROIC 5.21% 9.87% 8.45% 7.85%
Current Ratio 1.31 2.77 2.69 2.26
Quick Ratio or Acid Test 1.30 2.73 2.66 2.23
TIE 1.33 2.19 1.54 1.69
On the average of the 3 years, the return on sales has been around 12.4%, which means
that, for each euro of sales, the company gets an operational income of roughly 0.12
euro.
The Return on Assets ratio gives the profitability of a company compared to its Total
Assets. On average, PT Group has a profit which is around 3% of the Total Assets.
The Return on Equity ratio in the past 3 years has been, on average, 13%. It measures
the profit generated by the company when compared to the money invested by its
shareholders.
Case Study: Company Valuation Of PT Group 2014
24
The Return on Invested Capital ratio is another profitability ratio that gives the profit
generated by the company when compared to the Total Capital Invested. In the past 3
years, the ratio has been roughly 8%.
The current ratio is a liquidity ratio that gives the capacity of the company to reimburse
the short term liabilities. The essence of the quick ratio is the same as the current ratio,
however it does not take in account the inventories in the current assets as they cannot
be considered liquid assets. Both ratios are around 2, meanings that the company short
term liquidity seems assured.
The Times Interest Earned ratio is a ratio that measures the ability of a company to pay
the interest and basically meet the obligations. The TIE has been really low for the past
3 years. This can be problematic and can lead the company to not fulfil its obligations
towards debtholders.
5.2 Valuation of PT Group
This is the core part of this case study: to get to a value of the share according to its past
performance and forecasting of the future. It is also essential to compare this valuation
against the share price quoted in the market and see if PT Group is under-valuated or
over-valuated.
For this purpose, the Share Market Price considered for this valuation was the closing
price of the last day of 2013.
Consequently, the aim is to answer to the question: should an investor buy, hold or sell
their position on PT Group?
5.2.1 Growth
In order to estimate the future cash flows of a company, the growth rate is the key
element.
Case Study: Company Valuation Of PT Group 2014
25
In the case of PT Group, this growth rate should represent a stable pace since the
company is already in the maturity stage of the life cycle.
Based on the last 3 years, there are the following growth rates for several indicators:
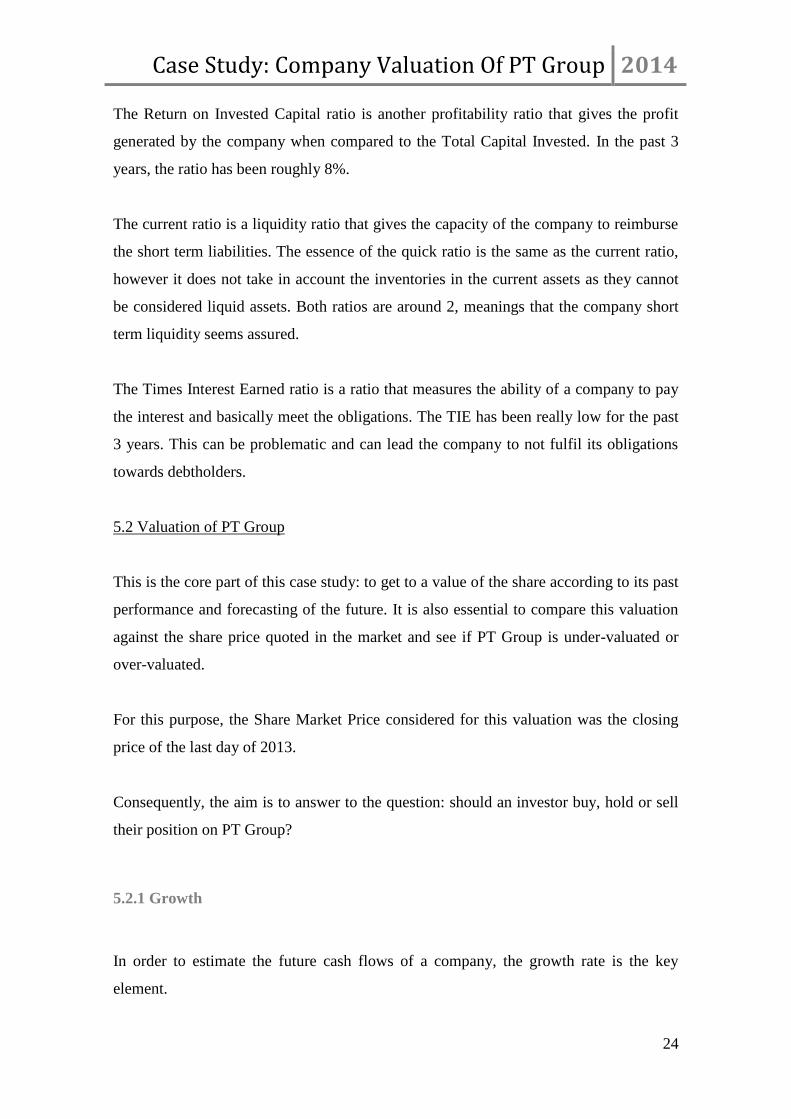
Table 3 – Growth rates
g 2013/2011
Total Operating revenues 3%
EBITDA 22%
Net operating Income (NOI) = Operating Profit = EBIT 21%
Group Net Income 42%
Earnings per Share (EPS) 32%
Dividends per Share (DPS) -61%
Total Assets 7%
Total Equity (including Minority Interests) -23%
Total Liabilities 18%
The growth rate chosen and that will be applied for the forecast of the continuity value
was the Total Operating Revenues growth rate. The assumption is that the company will
invest proportionally to the increase in sales.
5.2.2 Cost of Equity, Cost of Debt and Weighted Cost of Capital
One of the most fundamental parts of any valuation is the discount rate to be applied. As
it was explained before, there are several discount rates to be used on valuation,
depending on the method to be used.
Nevertheless, in this section there will be an estimate of the rates that will be used and
the assumptions behind them.
Case Study: Company Valuation Of PT Group 2014
26
Cost of Equity
The cost of Equity is basically the cost of Capital provided by the shareholders. As it
was mentioned before, the cost of equity is often calculated based on the CAPM model.
Hence, in order to obtain this discount rate, it is crucial to estimate the risk free rate, the
market premium and the beta of PT Group.
Risk free rate
For an investment to be risk free, certain conditions have to be met: there has to be no
default risk and no reinvestment risk (Damodaran, 2008). As so, the risk free rate should
be the rate of a security issued by an entity with no default risk (usually a Government).
At the same time, this security should have in account the period of the investment that
we are trying to valuate, without reinvestment until its maturity.
Consequently, it is not possible to use Portuguese Government Bonds as the risk free
asset, because they are not seen in the market as having no default risk (the rating of
Portugal is currently Ba3 for Moody’s, BB+ for Fitch and BB for Standard & Poor’s).
At the same time, since the valuation takes in account a very large period of forecasting
(ultimately forever, with its continuity value), the asset whose rate is considered risk
free needs to have a long maturity.
Therefore, for this purpose, the German Government 10-year bond was the security
chosen. However, since PT Group operates mainly from Portugal, it is important to
consider the country risk inherent.
Market Premium
The market premium can be defined has the return of the market over the risk free rate.
In order to obtain this market premium, it is necessary to define the market, get the
historical prices and estimate its return against the risk free.
Case Study: Company Valuation Of PT Group 2014
27
In this case, the market is well represented by the PSI-20 index, which is composed of
the 20 biggest Portuguese companies quoted in the Stock Exchange. PT Group is
present in PSI-20.
Based on the Prices from 2011 to 2013, the average return of the PSI-20 over the risk
free was roughly -0.04%. This unusual negative premium is very likely due to the
unusual country risk premium included in the Portuguese risk “free” rate.
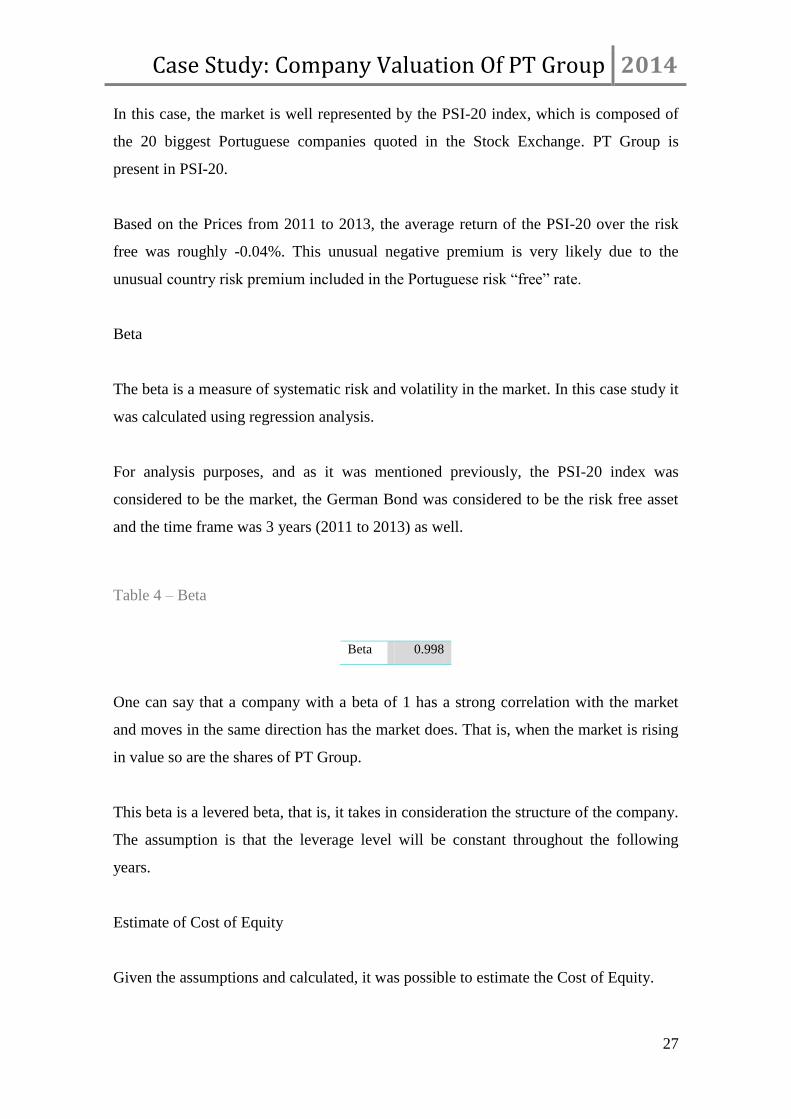
Beta
The beta is a measure of systematic risk and volatility in the market. In this case study it
was calculated using regression analysis.
For analysis purposes, and as it was mentioned previously, the PSI-20 index was
considered to be the market, the German Bond was considered to be the risk free asset
and the time frame was 3 years (2011 to 2013) as well.
Table 4 – Beta
Beta 0.998
One can say that a company with a beta of 1 has a strong correlation with the market
and moves in the same direction has the market does. That is, when the market is rising
in value so are the shares of PT Group.
This beta is a levered beta, that is, it takes in consideration the structure of the company.
The assumption is that the leverage level will be constant throughout the following
years.
Estimate of Cost of Equity
Given the assumptions and calculated, it was possible to estimate the Cost of Equity.
Case Study: Company Valuation Of PT Group 2014
28
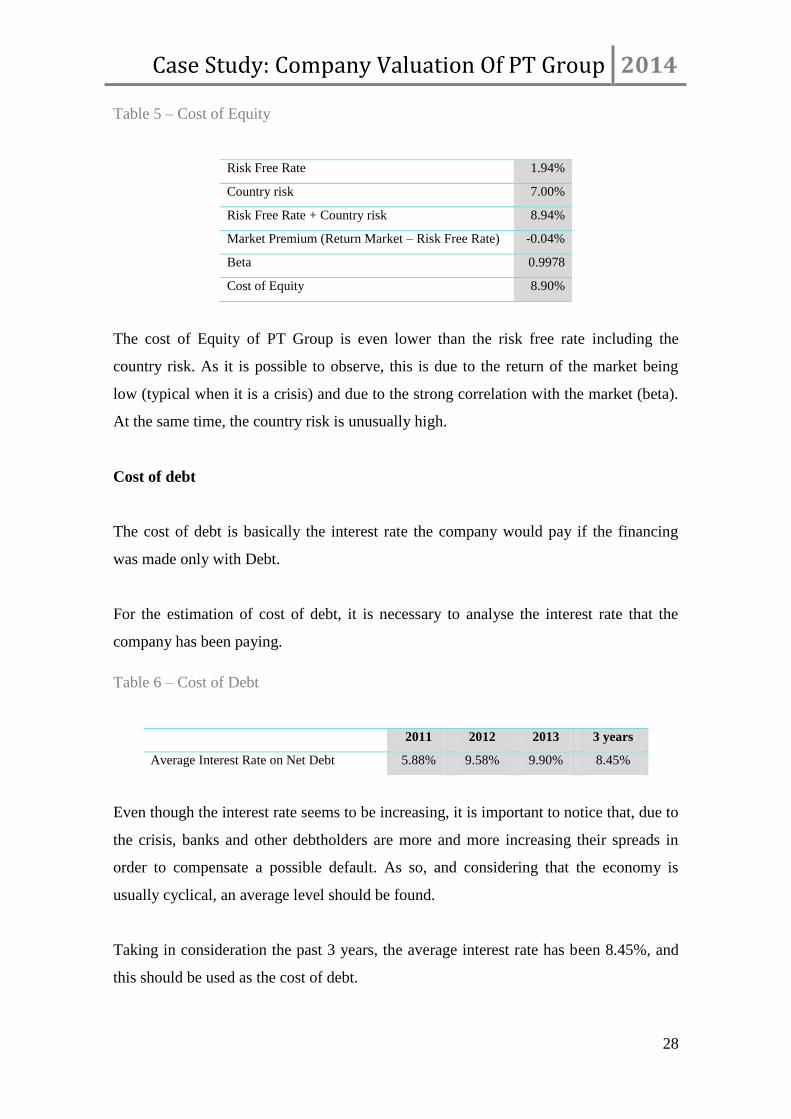
Table 5 – Cost of Equity
Risk Free Rate 1.94%
Country risk 7.00%
Risk Free Rate + Country risk 8.94%
Market Premium (Return Market – Risk Free Rate) -0.04%
Beta 0.9978
Cost of Equity 8.90%
The cost of Equity of PT Group is even lower than the risk free rate including the
country risk. As it is possible to observe, this is due to the return of the market being
low (typical when it is a crisis) and due to the strong correlation with the market (beta).
At the same time, the country risk is unusually high.
Cost of debt
The cost of debt is basically the interest rate the company would pay if the financing
was made only with Debt.
For the estimation of cost of debt, it is necessary to analyse the interest rate that the
company has been paying.
Table 6 – Cost of Debt
2011 2012 2013 3 years
Average Interest Rate on Net Debt 5.88% 9.58% 9.90% 8.45%
Even though the interest rate seems to be increasing, it is important to notice that, due to
the crisis, banks and other debtholders are more and more increasing their spreads in
order to compensate a possible default. As so, and considering that the economy is
usually cyclical, an average level should be found.
Taking in consideration the past 3 years, the average interest rate has been 8.45%, and
this should be used as the cost of debt.
Case Study: Company Valuation Of PT Group 2014
29
Weighted Average Cost of Capital
The Weighted Average Cost of Capital is a discount rate that takes in consideration the
Leverage Level of the company.
Where E is Equity
D is Debt
Re is cost of Equity
Rd is cost of Debts
t is the tax rate
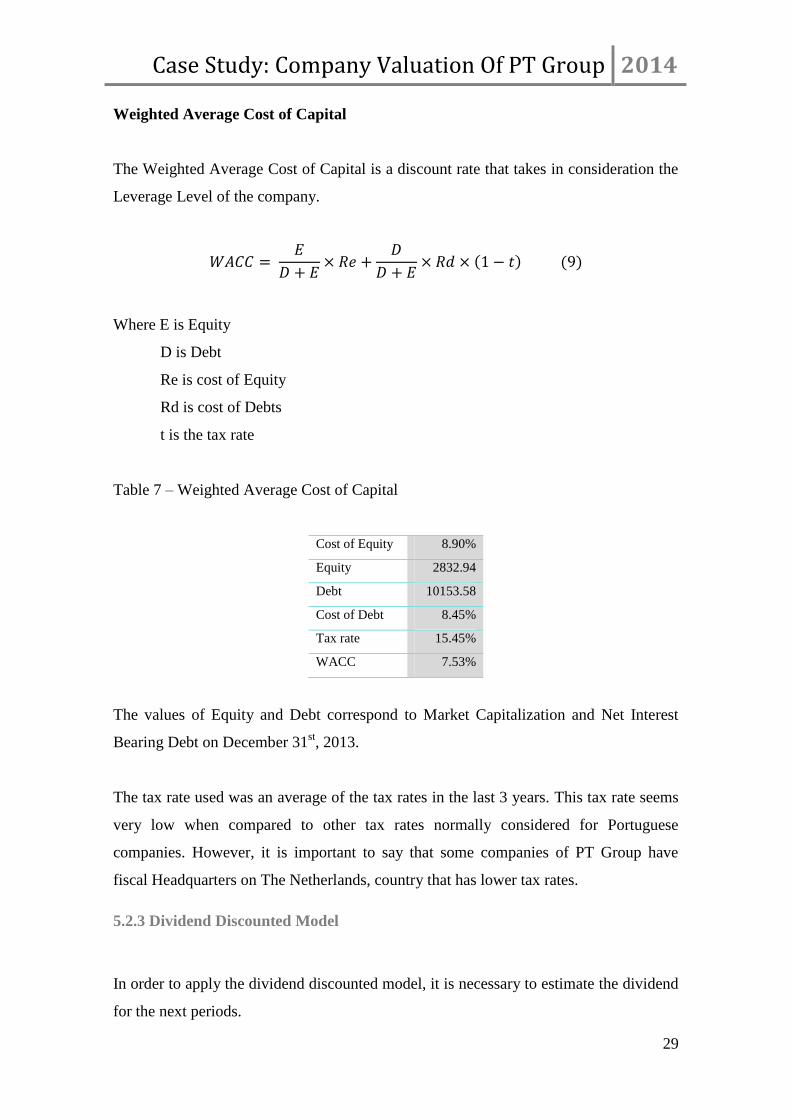
Table 7 – Weighted Average Cost of Capital
Cost of Equity 8.90%
Equity 2832.94
Debt 10153.58
Cost of Debt 8.45%
Tax rate 15.45%
WACC 7.53%
The values of Equity and Debt correspond to Market Capitalization and Net Interest
Bearing Debt on December 31st, 2013.
The tax rate used was an average of the tax rates in the last 3 years. This tax rate seems
very low when compared to other tax rates normally considered for Portuguese
companies. However, it is important to say that some companies of PT Group have
fiscal Headquarters on The Netherlands, country that has lower tax rates.
5.2.3 Dividend Discounted Model
In order to apply the dividend discounted model, it is necessary to estimate the dividend
for the next periods.
Case Study: Company Valuation Of PT Group 2014
30
Table 8 – Dividend Payout Ratio
2011 2012 2013
Dividend Pay Out 308.48% 123.06% 88.03%
As we can see in the table above, the dividend payout ratio has not been stable and in
the first 2 years was indeed very high, due to extraordinary dividends. And that is the
reason the dividend payout ratio was considered to be the 2013 value instead of an
average of the 3 years.
In the table below, it is possible to see the estimation of the dividends for the following
years.
Table 9 – Dividend Estimation
Historical Planning Continuing
Expected Dividends Valuation 2013 2014 2015 2016 2017 2018
DPS = Dividends per Share 0.17 0.17 0.17 0.17 0.17
Since the net income is not expected to increase exponentially, the dividends are also
expected to be around the same throughout the period in study.
Calculating the present value, using the cost of equity and a perpetual growth rate of
2.55%, of the future dividends it is possible to estimate the value of the Share for the PT
Group.
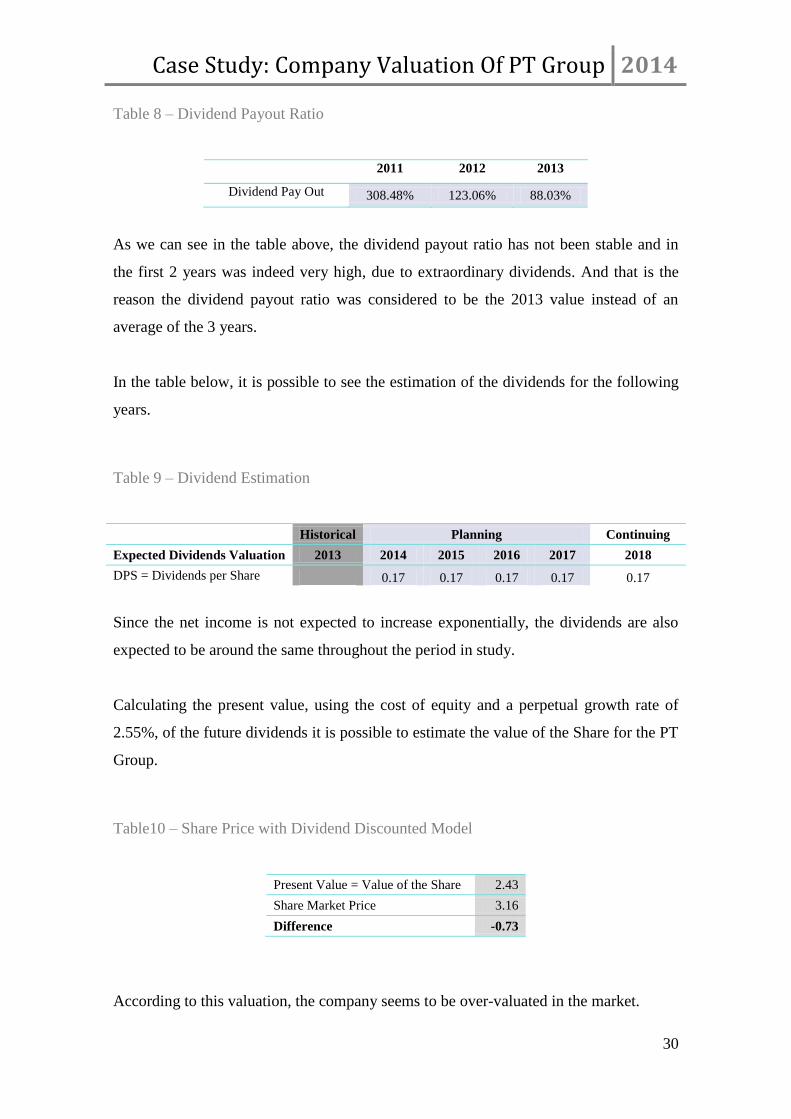
Table10 – Share Price with Dividend Discounted Model
Present Value = Value of the Share 2.43
Share Market Price 3.16
Difference -0.73
According to this valuation, the company seems to be over-valuated in the market.
Case Study: Company Valuation Of PT Group 2014
31
5.2.4 Discounted Cash Flows
In the discounted cash flows model, there are 2 approaches: Free Cash Flow to the Firm
and Free Cash Flow to the Equity.
Starting with the first approach, the first important thing to do is to estimate the Free
Cash Flow to the Firm.
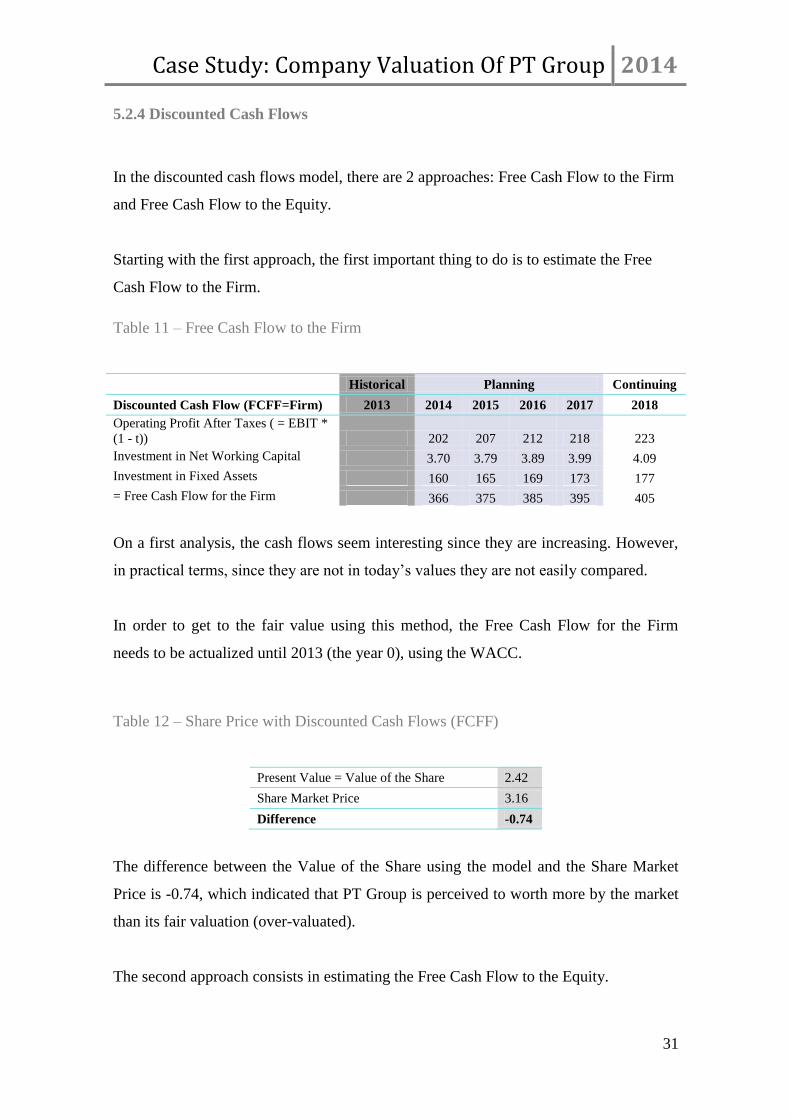
Table 11 – Free Cash Flow to the Firm
Historical Planning Continuing
Discounted Cash Flow (FCFF=Firm) 2013 2014 2015 2016 2017 2018
Operating Profit After Taxes ( = EBIT *
(1 - t)) 202 207 212 218 223
Investment in Net Working Capital 3.70 3.79 3.89 3.99 4.09
Investment in Fixed Assets 160 165 169 173 177
= Free Cash Flow for the Firm 366 375 385 395 405
On a first analysis, the cash flows seem interesting since they are increasing. However,
in practical terms, since they are not in today’s values they are not easily compared.
In order to get to the fair value using this method, the Free Cash Flow for the Firm
needs to be actualized until 2013 (the year 0), using the WACC.
Table 12 – Share Price with Discounted Cash Flows (FCFF)
Present Value = Value of the Share 2.42
Share Market Price 3.16
Difference -0.74
The difference between the Value of the Share using the model and the Share Market
Price is -0.74, which indicated that PT Group is perceived to worth more by the market
than its fair valuation (over-valuated).
The second approach consists in estimating the Free Cash Flow to the Equity.
Case Study: Company Valuation Of PT Group 2014
32
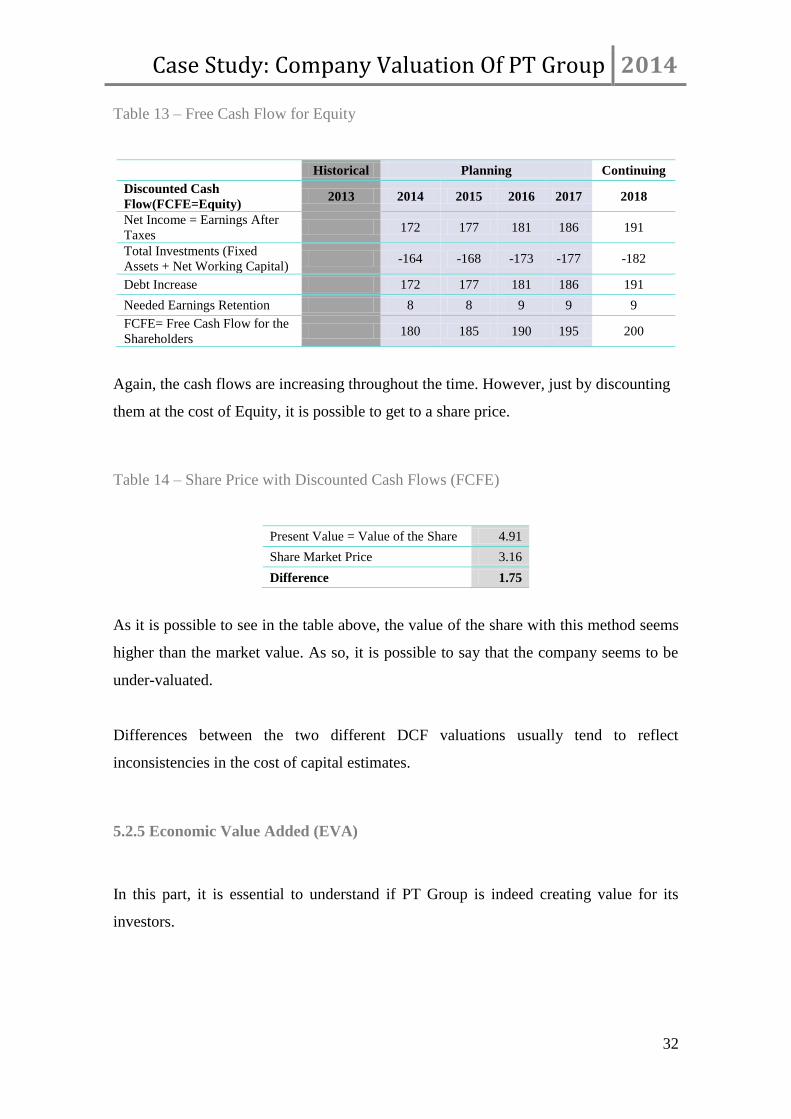
Table 13 – Free Cash Flow for Equity
Historical Planning Continuing
Discounted Cash
Flow(FCFE=Equity) 2013 2014 2015 2016 2017 2018
Net Income = Earnings After
Taxes 172 177 181 186 191
Total Investments (Fixed
Assets + Net Working Capital) -164 -168 -173 -177 -182
Debt Increase 172 177 181 186 191
Needed Earnings Retention 8 8 9 9 9
FCFE= Free Cash Flow for the
Shareholders 180 185 190 195 200
Again, the cash flows are increasing throughout the time. However, just by discounting
them at the cost of Equity, it is possible to get to a share price.
Table 14 – Share Price with Discounted Cash Flows (FCFE)
Present Value = Value of the Share 4.91
Share Market Price 3.16
Difference 1.75
As it is possible to see in the table above, the value of the share with this method seems
higher than the market value. As so, it is possible to say that the company seems to be
under-valuated.
Differences between the two different DCF valuations usually tend to reflect
inconsistencies in the cost of capital estimates.
5.2.5 Economic Value Added (EVA)
In this part, it is essential to understand if PT Group is indeed creating value for its
investors.
Case Study: Company Valuation Of PT Group 2014
33
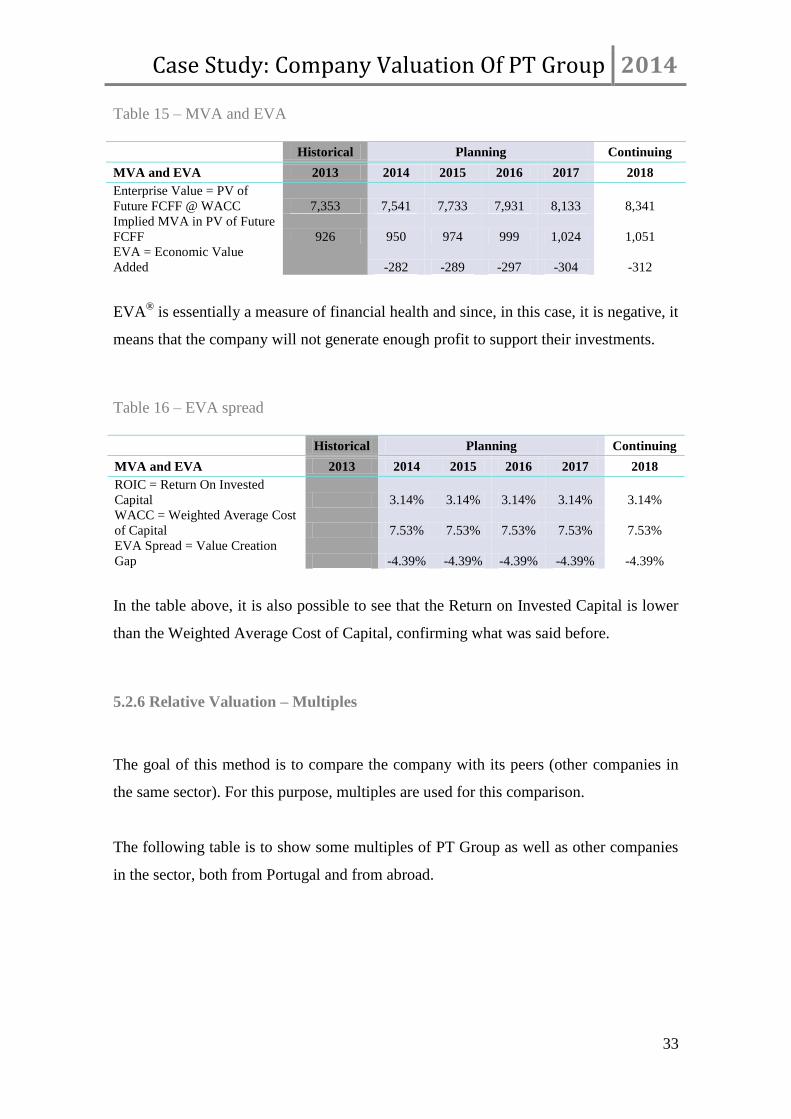
Table 15 – MVA and EVA
Historical Planning Continuing
MVA and EVA 2013 2014 2015 2016 2017 2018
Enterprise Value = PV of
Future FCFF @ WACC 7,353 7,541 7,733 7,931 8,133 8,341
Implied MVA in PV of Future
FCFF 926 950 974 999 1,024 1,051
EVA = Economic Value
Added
-282 -289 -297 -304 -312
EVA®
is essentially a measure of financial health and since, in this case, it is negative, it
means that the company will not generate enough profit to support their investments.
Table 16 – EVA spread
Historical Planning Continuing
MVA and EVA 2013 2014 2015 2016 2017 2018
ROIC = Return On Invested
Capital 3.14% 3.14% 3.14% 3.14% 3.14%
WACC = Weighted Average Cost
of Capital 7.53% 7.53% 7.53% 7.53% 7.53%
EVA Spread = Value Creation
Gap -4.39% -4.39% -4.39% -4.39% -4.39%
In the table above, it is also possible to see that the Return on Invested Capital is lower
than the Weighted Average Cost of Capital, confirming what was said before.
5.2.6 Relative Valuation – Multiples
The goal of this method is to compare the company with its peers (other companies in
the same sector). For this purpose, multiples are used for this comparison.
The following table is to show some multiples of PT Group as well as other companies
in the sector, both from Portugal and from abroad.
Case Study: Company Valuation Of PT Group 2014
34
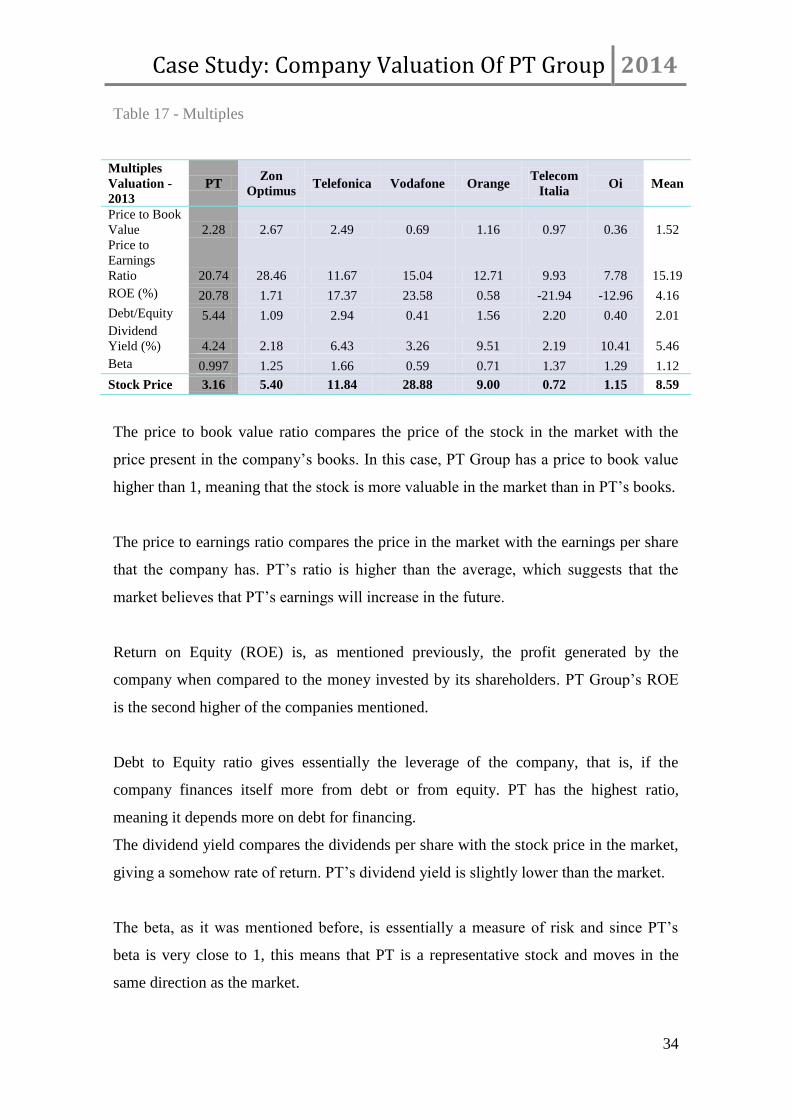
Table 17 - Multiples
Multiples
Valuation -
2013
PT Zon
Optimus Telefonica Vodafone Orange
Telecom
Italia Oi Mean
Price to Book
Value 2.28 2.67 2.49 0.69 1.16 0.97 0.36 1.52
Price to
Earnings
Ratio 20.74 28.46 11.67 15.04 12.71 9.93 7.78 15.19
ROE (%) 20.78 1.71 17.37 23.58 0.58 -21.94 -12.96 4.16
Debt/Equity 5.44 1.09 2.94 0.41 1.56 2.20 0.40 2.01
Dividend
Yield (%) 4.24 2.18 6.43 3.26 9.51 2.19 10.41 5.46
Beta 0.997 1.25 1.66 0.59 0.71 1.37 1.29 1.12
Stock Price 3.16 5.40 11.84 28.88 9.00 0.72 1.15 8.59
The price to book value ratio compares the price of the stock in the market with the
price present in the company’s books. In this case, PT Group has a price to book value
higher than 1, meaning that the stock is more valuable in the market than in PT’s books.
The price to earnings ratio compares the price in the market with the earnings per share
that the company has. PT’s ratio is higher than the average, which suggests that the
market believes that PT’s earnings will increase in the future.
Return on Equity (ROE) is, as mentioned previously, the profit generated by the
company when compared to the money invested by its shareholders. PT Group’s ROE
is the second higher of the companies mentioned.
Debt to Equity ratio gives essentially the leverage of the company, that is, if the
company finances itself more from debt or from equity. PT has the highest ratio,
meaning it depends more on debt for financing.
The dividend yield compares the dividends per share with the stock price in the market,
giving a somehow rate of return. PT’s dividend yield is slightly lower than the market.
The beta, as it was mentioned before, is essentially a measure of risk and since PT’s
beta is very close to 1, this means that PT is a representative stock and moves in the
same direction as the market.
Case Study: Company Valuation Of PT Group 2014
35
Since it seems that the group has a better financial health, considering these multiples,
than the average of its peers but the stock price is below average, one can say that the
stock appears to be under-valuated.
However, this is very simplistic because it doesn’t take in account the dimensions of the
companies in the markets and if they can really be compared.
5.2.7 Comparison between methods
So far, it has been analyzed the share price according to each model. However, it is also
interesting to compare the models and the different conclusions.
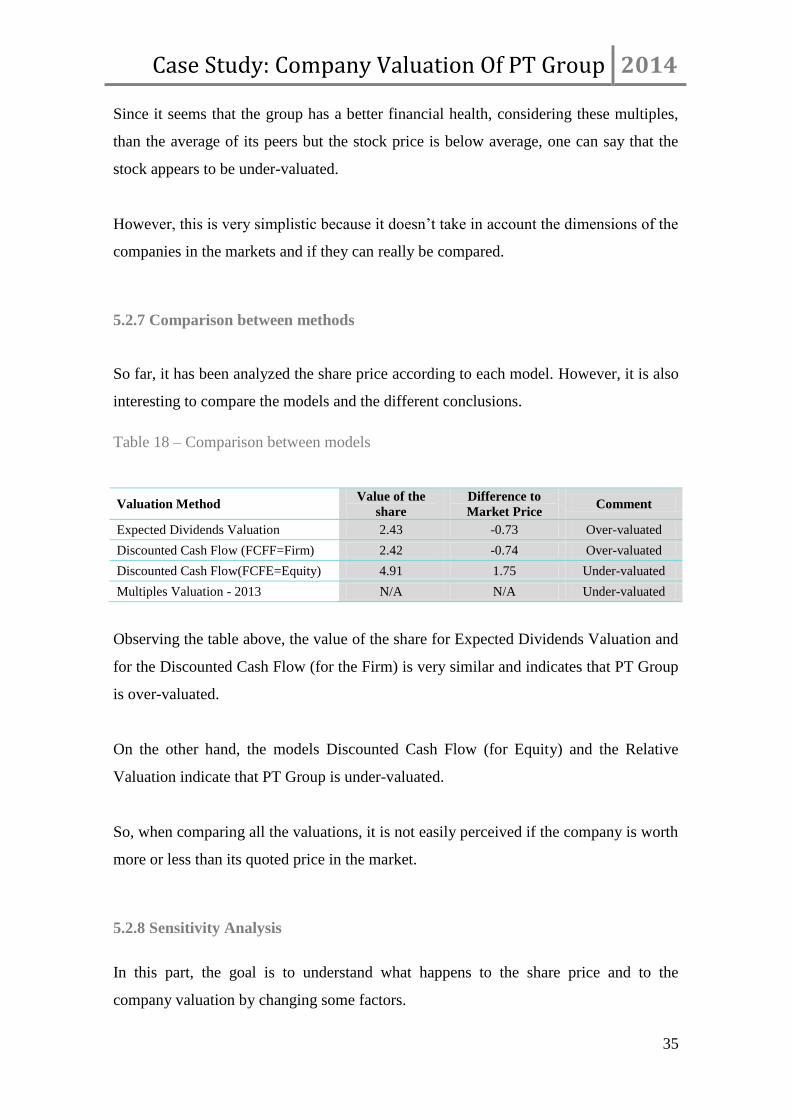
Table 18 – Comparison between models
Valuation Method Value of the
share
Difference to
Market Price Comment
Expected Dividends Valuation 2.43 -0.73 Over-valuated
Discounted Cash Flow (FCFF=Firm) 2.42 -0.74 Over-valuated
Discounted Cash Flow(FCFE=Equity) 4.91 1.75 Under-valuated
Multiples Valuation - 2013 N/A N/A Under-valuated
Observing the table above, the value of the share for Expected Dividends Valuation and
for the Discounted Cash Flow (for the Firm) is very similar and indicates that PT Group
is over-valuated.
On the other hand, the models Discounted Cash Flow (for Equity) and the Relative
Valuation indicate that PT Group is under-valuated.
So, when comparing all the valuations, it is not easily perceived if the company is worth
more or less than its quoted price in the market.
5.2.8 Sensitivity Analysis
In this part, the goal is to understand what happens to the share price and to the
company valuation by changing some factors.
Case Study: Company Valuation Of PT Group 2014
36
A big part of the valuation is the discount rate used, as well as the perpetual growth rate.
This sensitivity analysis focus on that and what happens to the share price (on the
Discounted Cash Flows model) if there is a change in WACC and the growth rate.
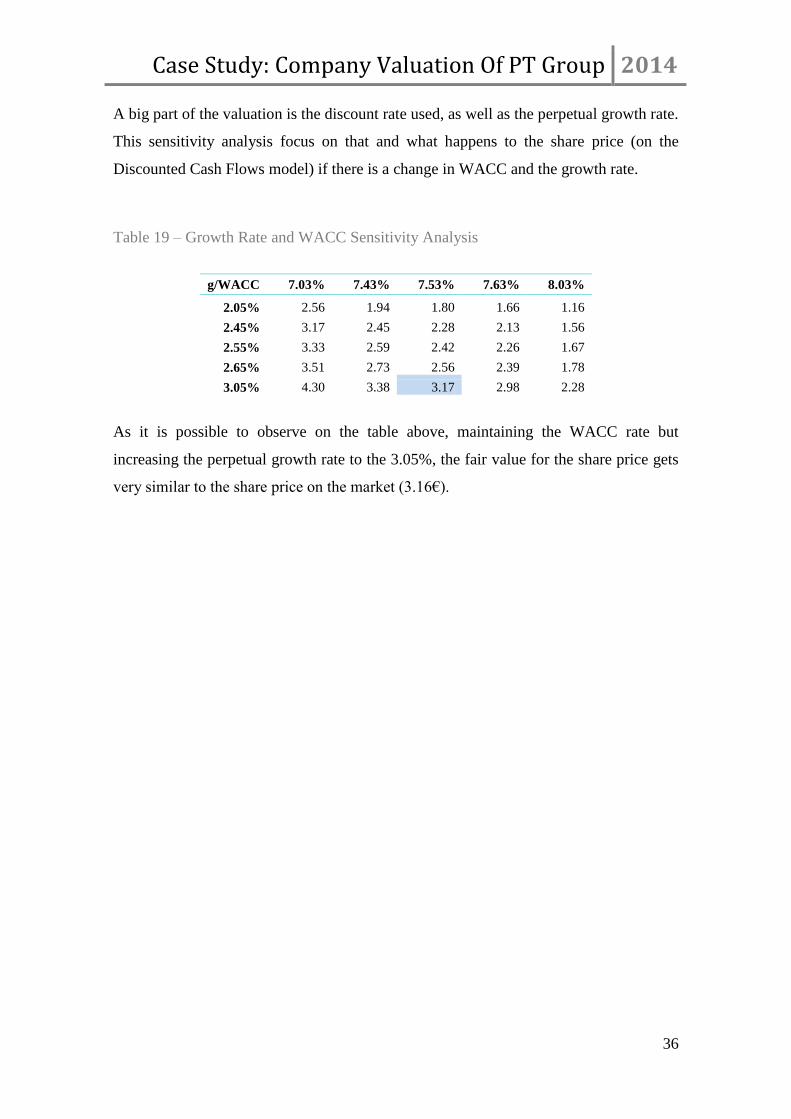
Table 19 – Growth Rate and WACC Sensitivity Analysis
g/WACC 7.03% 7.43% 7.53% 7.63% 8.03%
2.05% 2.56 1.94 1.80 1.66 1.16
2.45% 3.17 2.45 2.28 2.13 1.56
2.55% 3.33 2.59 2.42 2.26 1.67
2.65% 3.51 2.73 2.56 2.39 1.78
3.05% 4.30 3.38 3.17 2.98 2.28
As it is possible to observe on the table above, maintaining the WACC rate but
increasing the perpetual growth rate to the 3.05%, the fair value for the share price gets
very similar to the share price on the market (3.16€).
Case Study: Company Valuation Of PT Group 2014
37
6. Future of PT
As it was mentioned along this case study, PT Group will merge with Oi in this year of
2014, if everything goes accordingly to the plan. This means essentially that this might
have been the last chance to valuate PT has an independent entity and not part of the
Telemar Group.
Due to this merger, a new company called CorpCo will be created and it will be
composed by Oi and PT, with PT’s shareholders to become CorpCo’s shareholders
(payment in stock). The number of stock each shareholder of PT will receive of this new
company is yet unknown, since it depends on Oi’s increase of capital.
CorpCo will have its Headquarters in Brazil and it will be quoted in Euronext, New
York Stock Exchange and Bovespa (São Paulo).
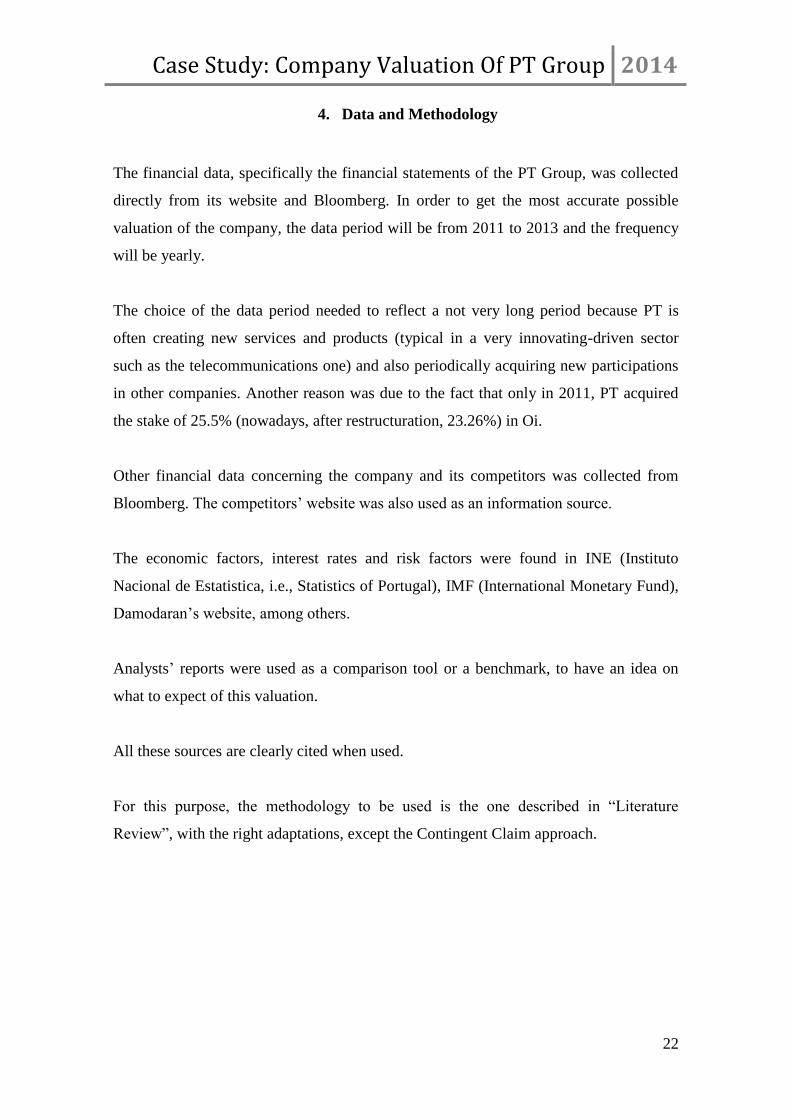
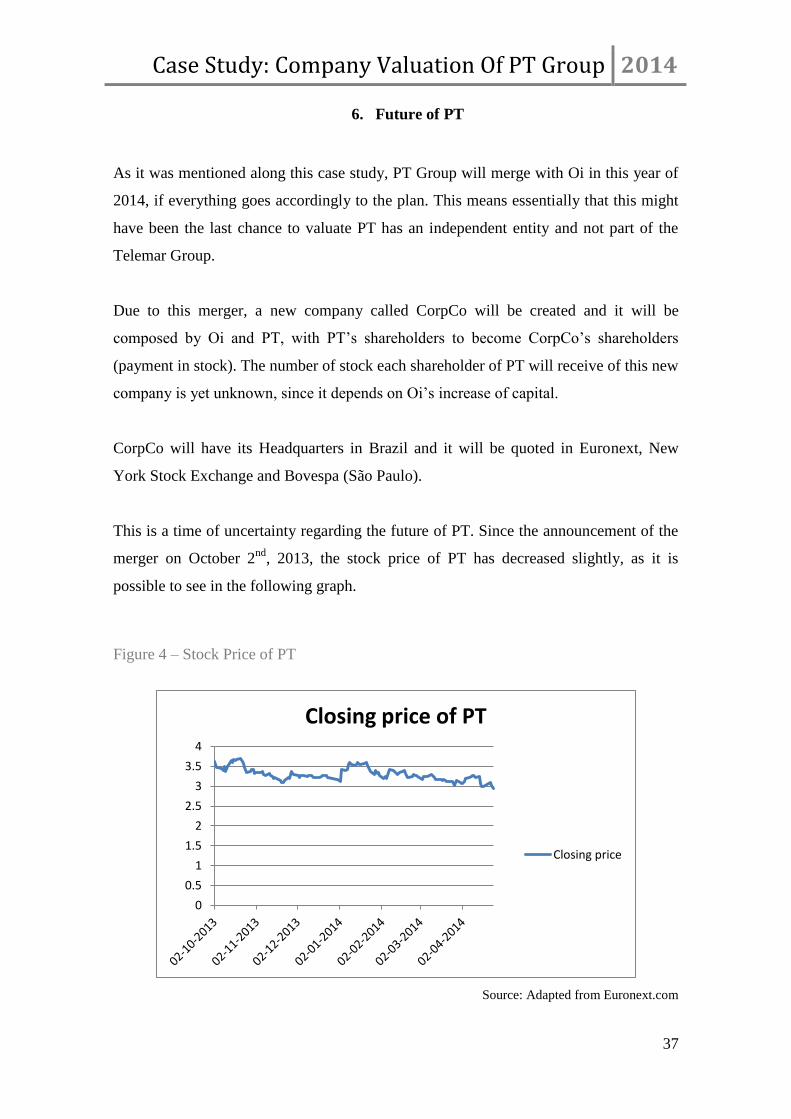
This is a time of uncertainty regarding the future of PT. Since the announcement of the
merger on October 2nd
, 2013, the stock price of PT has decreased slightly, as it is
possible to see in the following graph.
Figure 4 – Stock Price of PT
Source: Adapted from Euronext.com
0
0.5
1
1.5
2
2.5
3
3.5
4
Closing price of PT
Closing price
Case Study: Company Valuation Of PT Group 2014
38
All in all, the markets are also unsure about the future of PT and this alliance with Oi.
However, since the decrease in the stock price is not very large, the investors seem to be
expectant, waiting to see what happens.
Case Study: Company Valuation Of PT Group 2014
39
7. Conclusion
The goal of this case study was to valuate PT Group and compare the valuation against
its quoted price, in order to advise investors on whether they should buy, sell or hold.
Since the different methods of valuation gave different results, but always near the price
quoted on the stock market, one can say that the company seems to be correctly priced.
Even though some models showed a slight over-valuation in the market, the stock price
has been decreasing since the end of 2013, converging more to the fair price.
As so, the recommendation is to hold. Taking in consideration the slight over-valuation
mentioned, selling could also be seen as an option, since the fair value appears to be
lower than the market price. However, as it was mentioned, the price at the moment is
lower than the price used for the comparison and as so, the stock may not be perceived
as over-valuated any longer.
The limitations of this study are essentially the limitations of the models used and
mainly of the assumptions according to which they were built. It is important to take in
consideration that the forecasted values may vary, especially in a period like this for this
company. On the other hand, the models used are static, that is, they take a picture of
the company at a given moment, without granting that in the next period it will be the
same. Also, according to EVA analysis, the company seems to be destroying value;
however it is very likely that the management will try to reverse the situation in a
nearby future.
For future studies, it will be important to analyze not the group as a whole, but each
company individually and truly understand which companies are influencing the value
of the group in a positive way and those that are not.
On the other hand, it can also be interesting to investigate the different markets where
the company operates and analyze the different risks of the different countries and
currencies. That would help to understand better what actions are needed in order to
ensure value creation in the future.
Case Study: Company Valuation Of PT Group 2014
40
8. Bibliographic References
Books and Published Articles
Brealey, R. A., Myers, S. C. & Allen, F. 2011. Principles of Corporate Finance (10th
edition). New York: McGraw-Hill/Irwin.
Damodaran, A. 2002. Investment Valuation: Tools and Techniques for Determining
the Value of Any Asset (2nd edition). New York: Wiley.
Damodaran, A. 2008. What is a risk free rate? A search for the basic building block.
Koller, T., Goedhart, M., & Wessels, D. 2010. Valuation: Measuring and Managing
the Value of Companies (5th
edition). New York: Wiley.
Internet References
Bolsa de Madrid – Telefónica Quotes
http://www.bolsamadrid.es/ing/aspx/Empresas/InfHistorica.aspx?ISIN=ES0178430E18
&ClvEmis=78430
Data Centre Covilhã, 2013
http://www.telecom.pt/InternetResource/PTSite/PT/Canais/Media/DestaquesHP/Destaq
ues_2013/83dias_DataCenterCovilha.htm
Euronext – Orange Quotes
https://europeanequities.nyx.com/en/products/equities/FR0000133308-XPAR/quotes
Euronext – Portugal Telecom Quotes
https://europeanequities.nyx.com/pt-pt/products/equities/PTPTC0AM0009-XLIS/quotes
Euronext – PSI-20 Quotes
https://indices.nyx.com/pt-pt/products/indices/PTING0200002-XLIS
Case Study: Company Valuation Of PT Group 2014
41
Euronext – Zon Optimus Quotes
https://europeanequities.nyx.com/en/products/equities/PTZON0AM0006-XLIS/quotes
European Union will end Roaming fees, 2013
http://www.telegraph.co.uk/finance/newsbysector/mediatechnologyandtelecoms/teleco
ms/10119159/EU-to-end-mobile-roaming-charges-next-year.html
Investing.com – 10 year German Bond Yield
http://www.investing.com/rates-bonds/germany-10-year-bond-yield
Investopedia – Price to book ratio
http://www.investopedia.com/terms/p/price-to-bookratio.asp
Jornal de Negócios – Terms of fusion with Oi
http://www.jornaldenegocios.pt/empresas/fusoes___aquisicoes/fusao_pt_oi/detalhe/pt_d
ivulga_termos_de_troca_na_fusao_com_a_oi.html
Financial Times – Oi Overview
http://markets.ft.com/research/Markets/Tearsheets/Summary?s=OIBR:NYQ
Financial Times – Orange Overview
http://markets.ft.com/research/Markets/Tearsheets/Summary?s=ORA:PAR
Financial Times – Telecom Italia Overview
http://markets.ft.com/research/Markets/Tearsheets/Summary?s=TME:MIL
Financial Times – Telefónica Overview
http://markets.ft.com/research/Markets/Tearsheets/Summary?s=TELEFONICA:BUD
Financial Times – Vodafone Overview
http://markets.ft.com/research/Markets/Tearsheets/Summary?s=VOD:LSE
Case Study: Company Valuation Of PT Group 2014
42
Financial Times – Zon Optimus Overview
http://markets.ft.com/research/Markets/Tearsheets/Summary?s=ZONOP:LIS
Meo’s website
http://meo.pt/
Portugal’s Rating
http://countryeconomy.com/ratings/portugal
PT Website for Investors
http://www.portugaltelecom.pt/InternetResource/PTSite/UK/Canais/Investidores/
Reuters – Oi Overview
http://www.reuters.com/finance/stocks/overview?symbol=OIBR.N
Reuters – Orange Overview
http://www.reuters.com/finance/stocks/overview?symbol=ORAN.PA
Reuters – Telecom Italia Overview
http://www.reuters.com/finance/stocks/overview?symbol=TLIT.MI
Reuters – Telefónica Overview
http://www.reuters.com/finance/stocks/overview?symbol=TEF.N
Reuters – Vodafone Overview
http://www.reuters.com/finance/stocks/overview?symbol=VOD.L
Reuters – Zon Optimus Overview
http://www.reuters.com/finance/stocks/overview?symbol=ZONNF.PK
Telecommunications sector in Portugal, Anacom, 2012,
http://www.anacom.pt/render.jsp?contentId=1168316
Case Study: Company Valuation Of PT Group 2014
43
Visão – PT Oi will have the headquarters on Brazil
http://visao.sapo.pt/ptoi-vai-ter-sede-fiscal-no-brasil-mas-pagara-impostos-em-
portugal=f751585
Wikipedia – Beta definition
http://en.wikipedia.org/wiki/Beta_%28finance%29
Wikipedia – Meo
http://pt.wikipedia.org/wiki/Meo
Wikipedia – Portugal Telecom
http://en.wikipedia.org/wiki/Portugal_Telecom
Yahoo Finance – Oi Quotes
http://finance.yahoo.com/q/hp?s=OIBR+Historical+Prices
Yahoo Finance – Telecom Italia Quotes
https://uk.finance.yahoo.com/q/hp?s=TIT.MI&d=3&e=6&f=2014&g=d&a=0&b=3&c=
2000&z=66&y=66
Yahoo Finance – Vodafone Quotes
http://finance.yahoo.com/q/hp?s=VOD+Historical+Prices
Other sources
Bloomberg Terminal
Case Study: Company Valuation Of PT Group 2014
44
Appendix
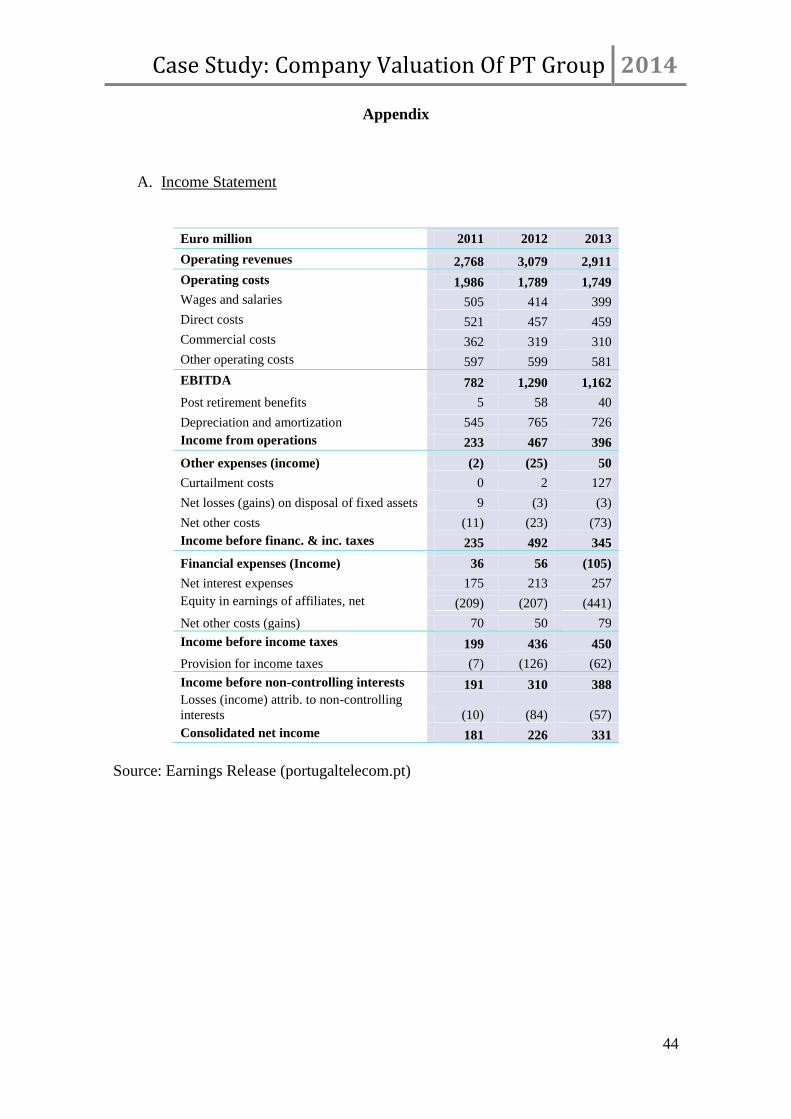
A. Income Statement
Euro million 2011 2012 2013
Operating revenues 2,768 3,079 2,911
Operating costs 1,986 1,789 1,749
Wages and salaries 505 414 399
Direct costs 521 457 459
Commercial costs 362 319 310
Other operating costs 597 599 581
EBITDA 782 1,290 1,162
Post retirement benefits 5 58 40
Depreciation and amortization 545 765 726
Income from operations 233 467 396
Other expenses (income) (2) (25) 50
Curtailment costs 0 2 127
Net losses (gains) on disposal of fixed assets 9 (3) (3)
Net other costs (11) (23) (73)
Income before financ. & inc. taxes 235 492 345
Financial expenses (Income) 36 56 (105)
Net interest expenses 175 213 257
Equity in earnings of affiliates, net (209) (207) (441)
Net other costs (gains) 70 50 79
Income before income taxes 199 436 450
Provision for income taxes (7) (126) (62)
Income before non-controlling interests 191 310 388
Losses (income) attrib. to non-controlling
interests (10) (84) (57)
Consolidated net income 181 226 331
Source: Earnings Release (portugaltelecom.pt)
Case Study: Company Valuation Of PT Group 2014
45
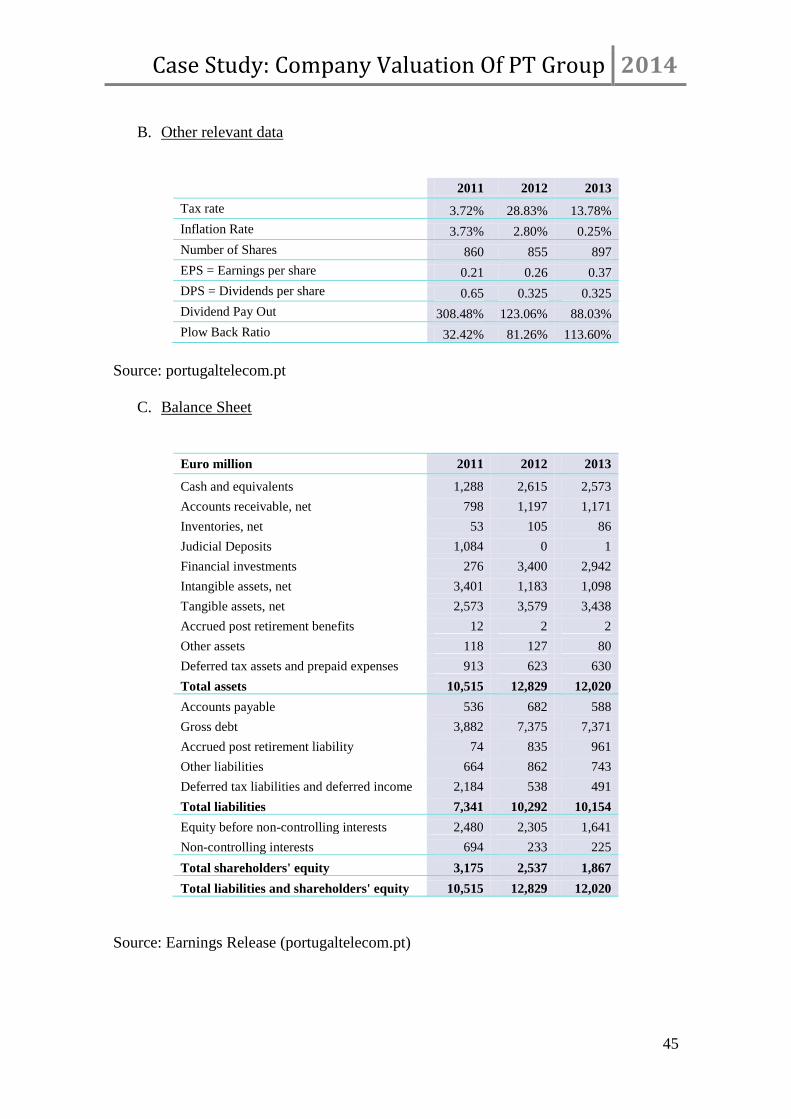
B. Other relevant data
2011 2012 2013
Tax rate 3.72% 28.83% 13.78%
Inflation Rate 3.73% 2.80% 0.25%
Number of Shares 860 855 897
EPS = Earnings per share 0.21 0.26 0.37
DPS = Dividends per share 0.65 0.325 0.325
Dividend Pay Out 308.48% 123.06% 88.03%
Plow Back Ratio 32.42% 81.26% 113.60%
Source: portugaltelecom.pt
C. Balance Sheet
Euro million 2011 2012 2013
Cash and equivalents 1,288 2,615 2,573
Accounts receivable, net 798 1,197 1,171
Inventories, net 53 105 86
Judicial Deposits 1,084 0 1
Financial investments 276 3,400 2,942
Intangible assets, net 3,401 1,183 1,098
Tangible assets, net 2,573 3,579 3,438
Accrued post retirement benefits 12 2 2
Other assets 118 127 80
Deferred tax assets and prepaid expenses 913 623 630
Total assets 10,515 12,829 12,020
Accounts payable 536 682 588
Gross debt 3,882 7,375 7,371
Accrued post retirement liability 74 835 961
Other liabilities 664 862 743
Deferred tax liabilities and deferred income 2,184 538 491
Total liabilities 7,341 10,292 10,154
Equity before non-controlling interests 2,480 2,305 1,641
Non-controlling interests 694 233 225
Total shareholders' equity 3,175 2,537 1,867
Total liabilities and shareholders' equity 10,515 12,829 12,020
Source: Earnings Release (portugaltelecom.pt)
Case Study: Company Valuation Of PT Group 2014
46
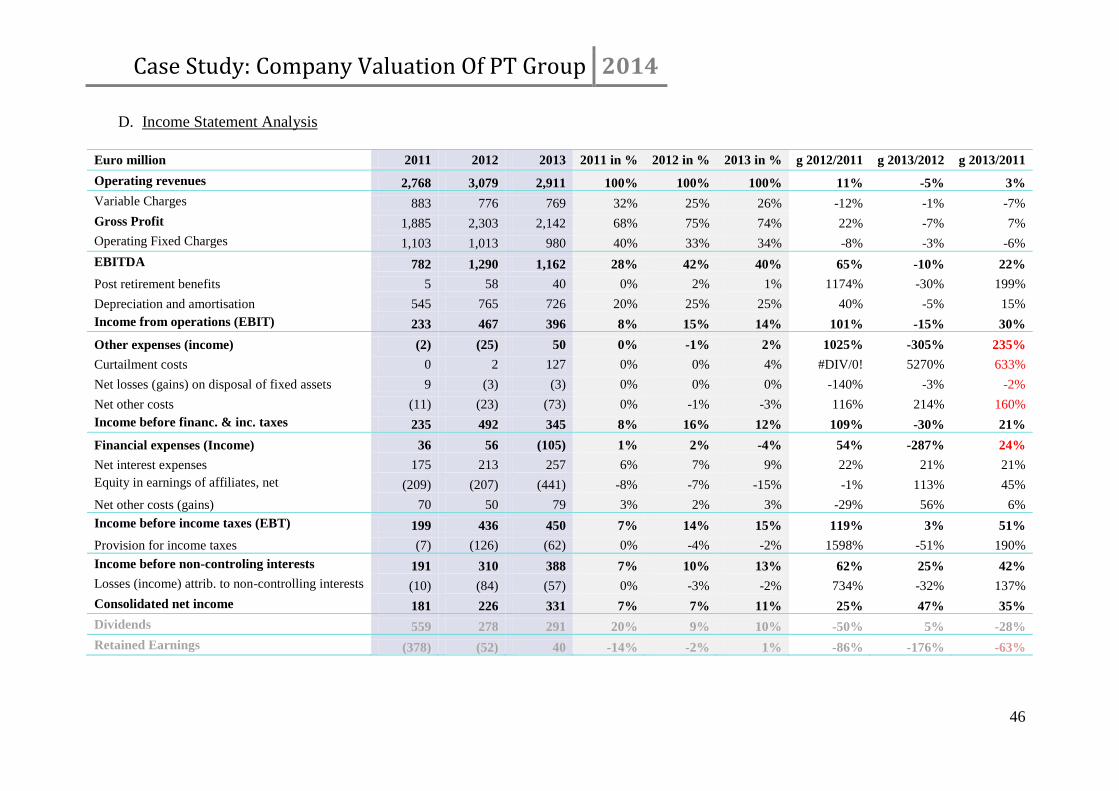
D. Income Statement Analysis
Euro million 2011 2012 2013 2011 in % 2012 in % 2013 in % g 2012/2011 g 2013/2012 g 2013/2011
Operating revenues 2,768 3,079 2,911 100% 100% 100% 11% -5% 3%
Variable Charges 883 776 769 32% 25% 26% -12% -1% -7%
Gross Profit 1,885 2,303 2,142 68% 75% 74% 22% -7% 7%
Operating Fixed Charges 1,103 1,013 980 40% 33% 34% -8% -3% -6%
EBITDA 782 1,290 1,162 28% 42% 40% 65% -10% 22%
Post retirement benefits 5 58 40 0% 2% 1% 1174% -30% 199%
Depreciation and amortisation 545 765 726 20% 25% 25% 40% -5% 15%
Income from operations (EBIT) 233 467 396 8% 15% 14% 101% -15% 30%
Other expenses (income) (2) (25) 50 0% -1% 2% 1025% -305% 235%
Curtailment costs 0 2 127 0% 0% 4% #DIV/0! 5270% 633%
Net losses (gains) on disposal of fixed assets 9 (3) (3) 0% 0% 0% -140% -3% -2%
Net other costs (11) (23) (73) 0% -1% -3% 116% 214% 160%
Income before financ. & inc. taxes 235 492 345 8% 16% 12% 109% -30% 21%
Financial expenses (Income) 36 56 (105) 1% 2% -4% 54% -287% 24%
Net interest expenses 175 213 257 6% 7% 9% 22% 21% 21%
Equity in earnings of affiliates, net (209) (207) (441) -8% -7% -15% -1% 113% 45%
Net other costs (gains) 70 50 79 3% 2% 3% -29% 56% 6%
Income before income taxes (EBT) 199 436 450 7% 14% 15% 119% 3% 51%
Provision for income taxes (7) (126) (62) 0% -4% -2% 1598% -51% 190%
Income before non-controling interests 191 310 388 7% 10% 13% 62% 25% 42%
Losses (income) attrib. to non-controlling interests (10) (84) (57) 0% -3% -2% 734% -32% 137%
Consolidated net income 181 226 331 7% 7% 11% 25% 47% 35%
Dividends 559 278 291 20% 9% 10% -50% 5% -28%
Retained Earnings (378) (52) 40 -14% -2% 1% -86% -176% -63%
Case Study: Company Valuation Of PT Group 2014
47
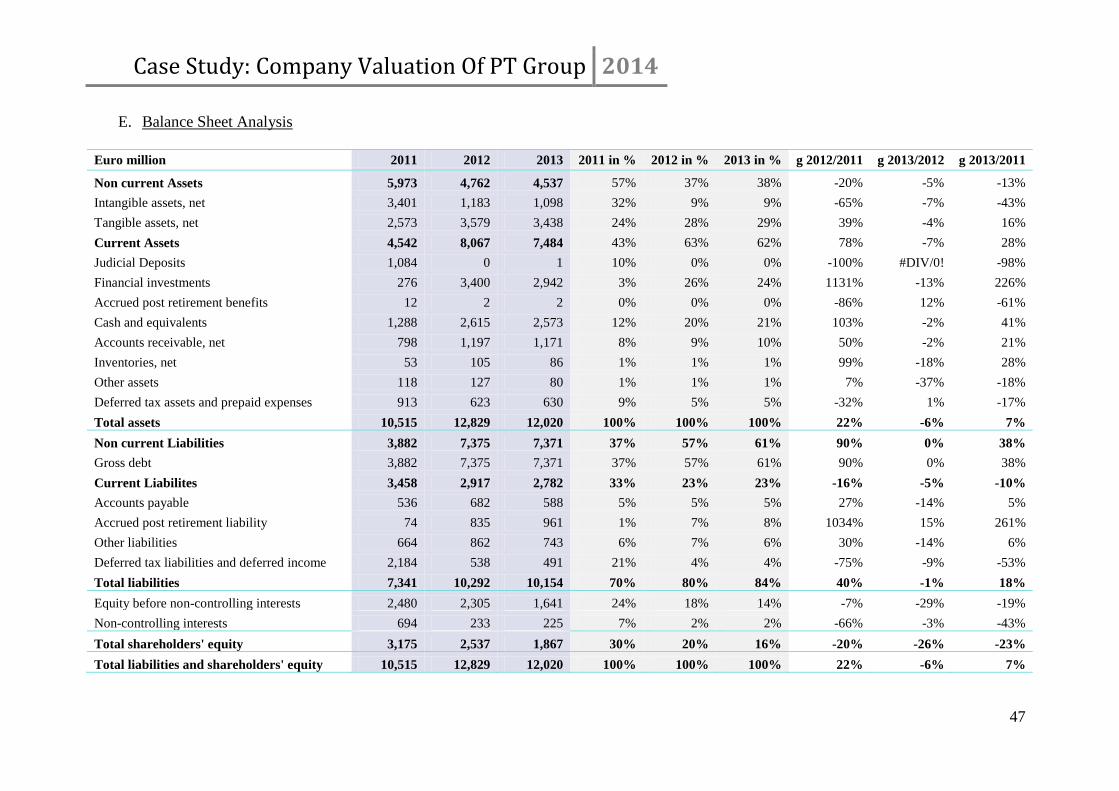
E. Balance Sheet Analysis
Euro million 2011 2012 2013 2011 in % 2012 in % 2013 in % g 2012/2011 g 2013/2012 g 2013/2011
Non current Assets 5,973 4,762 4,537 57% 37% 38% -20% -5% -13%
Intangible assets, net 3,401 1,183 1,098 32% 9% 9% -65% -7% -43%
Tangible assets, net 2,573 3,579 3,438 24% 28% 29% 39% -4% 16%
Current Assets 4,542 8,067 7,484 43% 63% 62% 78% -7% 28%
Judicial Deposits 1,084 0 1 10% 0% 0% -100% #DIV/0! -98%
Financial investments 276 3,400 2,942 3% 26% 24% 1131% -13% 226%
Accrued post retirement benefits 12 2 2 0% 0% 0% -86% 12% -61%
Cash and equivalents 1,288 2,615 2,573 12% 20% 21% 103% -2% 41%
Accounts receivable, net 798 1,197 1,171 8% 9% 10% 50% -2% 21%
Inventories, net 53 105 86 1% 1% 1% 99% -18% 28%
Other assets 118 127 80 1% 1% 1% 7% -37% -18%
Deferred tax assets and prepaid expenses 913 623 630 9% 5% 5% -32% 1% -17%
Total assets 10,515 12,829 12,020 100% 100% 100% 22% -6% 7%
Non current Liabilities 3,882 7,375 7,371 37% 57% 61% 90% 0% 38%
Gross debt 3,882 7,375 7,371 37% 57% 61% 90% 0% 38%
Current Liabilites 3,458 2,917 2,782 33% 23% 23% -16% -5% -10%
Accounts payable 536 682 588 5% 5% 5% 27% -14% 5%
Accrued post retirement liability 74 835 961 1% 7% 8% 1034% 15% 261%
Other liabilities 664 862 743 6% 7% 6% 30% -14% 6%
Deferred tax liabilities and deferred income 2,184 538 491 21% 4% 4% -75% -9% -53%
Total liabilities 7,341 10,292 10,154 70% 80% 84% 40% -1% 18%
Equity before non-controlling interests 2,480 2,305 1,641 24% 18% 14% -7% -29% -19%
Non-controlling interests 694 233 225 7% 2% 2% -66% -3% -43%
Total shareholders' equity 3,175 2,537 1,867 30% 20% 16% -20% -26% -23%
Total liabilities and shareholders' equity 10,515 12,829 12,020 100% 100% 100% 22% -6% 7%
Case Study: Company Valuation Of PT Group 2014
48
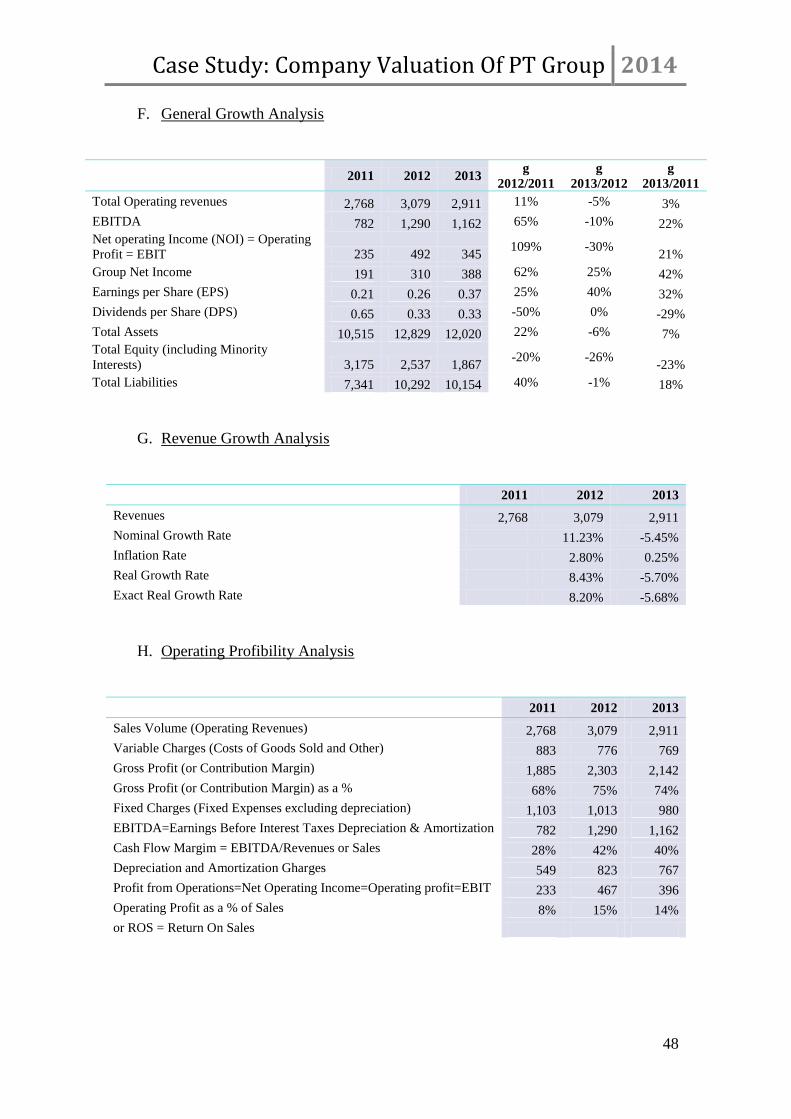
F. General Growth Analysis
2011 2012 2013 g
2012/2011
g
2013/2012
g
2013/2011
Total Operating revenues 2,768 3,079 2,911 11% -5% 3%
EBITDA 782 1,290 1,162 65% -10% 22%
Net operating Income (NOI) = Operating
Profit = EBIT 235 492 345 109% -30%
21%
Group Net Income 191 310 388 62% 25% 42%
Earnings per Share (EPS) 0.21 0.26 0.37 25% 40% 32%
Dividends per Share (DPS) 0.65 0.33 0.33 -50% 0% -29%
Total Assets 10,515 12,829 12,020 22% -6% 7%
Total Equity (including Minority
Interests) 3,175 2,537 1,867 -20% -26%
-23%
Total Liabilities 7,341 10,292 10,154 40% -1% 18%
G. Revenue Growth Analysis
2011 2012 2013
Revenues 2,768 3,079 2,911
Nominal Growth Rate 11.23% -5.45%
Inflation Rate 2.80% 0.25%
Real Growth Rate 8.43% -5.70%
Exact Real Growth Rate 8.20% -5.68%
H. Operating Profibility Analysis
2011 2012 2013
Sales Volume (Operating Revenues) 2,768 3,079 2,911
Variable Charges (Costs of Goods Sold and Other) 883 776 769
Gross Profit (or Contribution Margin) 1,885 2,303 2,142
Gross Profit (or Contribution Margin) as a % 68% 75% 74%
Fixed Charges (Fixed Expenses excluding depreciation) 1,103 1,013 980
EBITDA=Earnings Before Interest Taxes Depreciation & Amortization 782 1,290 1,162
Cash Flow Margim = EBITDA/Revenues or Sales 28% 42% 40%
Depreciation and Amortization Gharges 549 823 767
Profit from Operations=Net Operating Income=Operating profit=EBIT 233 467 396
Operating Profit as a % of Sales 8% 15% 14%
or ROS = Return On Sales
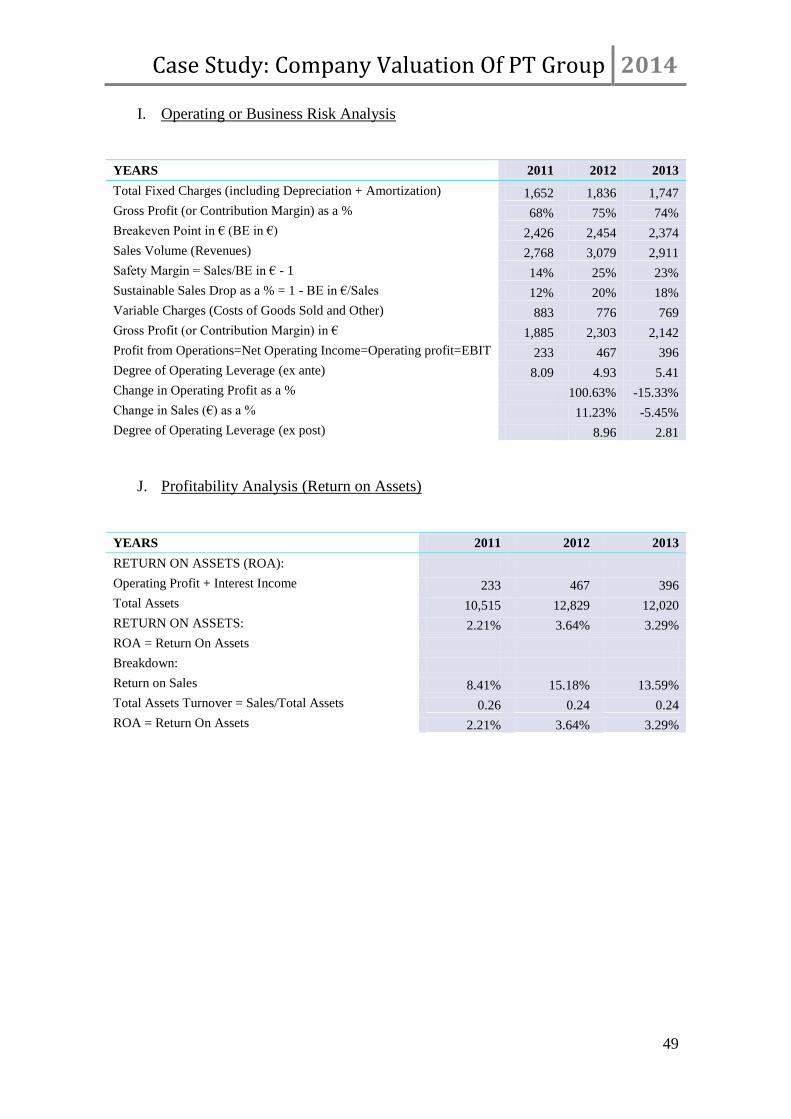
Case Study: Company Valuation Of PT Group 2014
49
I. Operating or Business Risk Analysis
YEARS 2011 2012 2013
Total Fixed Charges (including Depreciation + Amortization) 1,652 1,836 1,747
Gross Profit (or Contribution Margin) as a % 68% 75% 74%
Breakeven Point in € (BE in €) 2,426 2,454 2,374
Sales Volume (Revenues) 2,768 3,079 2,911
Safety Margin = Sales/BE in € - 1 14% 25% 23%
Sustainable Sales Drop as a % = 1 - BE in €/Sales 12% 20% 18%
Variable Charges (Costs of Goods Sold and Other) 883 776 769
Gross Profit (or Contribution Margin) in € 1,885 2,303 2,142
Profit from Operations=Net Operating Income=Operating profit=EBIT 233 467 396
Degree of Operating Leverage (ex ante) 8.09 4.93 5.41
Change in Operating Profit as a % 100.63% -15.33%
Change in Sales (€) as a % 11.23% -5.45%
Degree of Operating Leverage (ex post) 8.96 2.81
J. Profitability Analysis (Return on Assets)
YEARS 2011 2012 2013
RETURN ON ASSETS (ROA):
Operating Profit + Interest Income 233 467 396
Total Assets 10,515 12,829 12,020
RETURN ON ASSETS: 2.21% 3.64% 3.29%
ROA = Return On Assets
Breakdown:
Return on Sales 8.41% 15.18% 13.59%
Total Assets Turnover = Sales/Total Assets 0.26 0.24 0.24
ROA = Return On Assets 2.21% 3.64% 3.29%
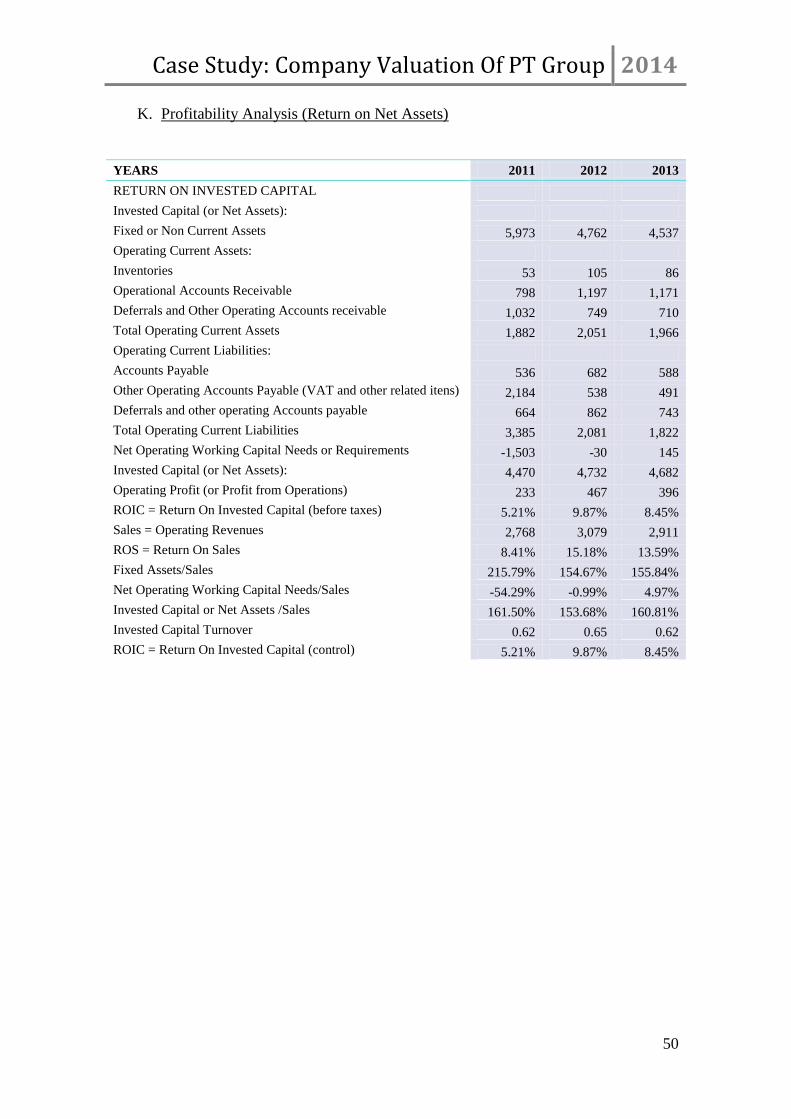
Case Study: Company Valuation Of PT Group 2014
50
K. Profitability Analysis (Return on Net Assets)
YEARS 2011 2012 2013
RETURN ON INVESTED CAPITAL
Invested Capital (or Net Assets):
Fixed or Non Current Assets 5,973 4,762 4,537
Operating Current Assets:
Inventories 53 105 86
Operational Accounts Receivable 798 1,197 1,171
Deferrals and Other Operating Accounts receivable 1,032 749 710
Total Operating Current Assets 1,882 2,051 1,966
Operating Current Liabilities:
Accounts Payable 536 682 588
Other Operating Accounts Payable (VAT and other related itens) 2,184 538 491
Deferrals and other operating Accounts payable 664 862 743
Total Operating Current Liabilities 3,385 2,081 1,822
Net Operating Working Capital Needs or Requirements -1,503 -30 145
Invested Capital (or Net Assets): 4,470 4,732 4,682
Operating Profit (or Profit from Operations) 233 467 396
ROIC = Return On Invested Capital (before taxes) 5.21% 9.87% 8.45%
Sales = Operating Revenues 2,768 3,079 2,911
ROS = Return On Sales 8.41% 15.18% 13.59%
Fixed Assets/Sales 215.79% 154.67% 155.84%
Net Operating Working Capital Needs/Sales -54.29% -0.99% 4.97%
Invested Capital or Net Assets /Sales 161.50% 153.68% 160.81%
Invested Capital Turnover 0.62 0.65 0.62
ROIC = Return On Invested Capital (control) 5.21% 9.87% 8.45%
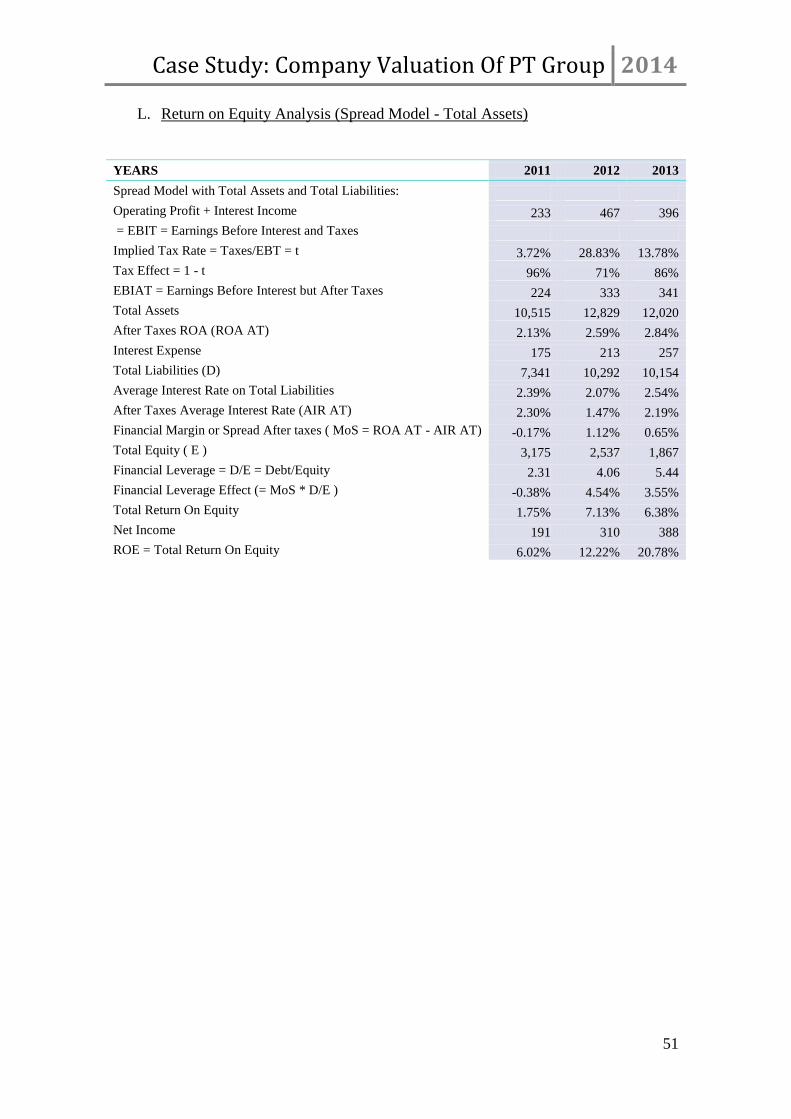
Case Study: Company Valuation Of PT Group 2014
51
L. Return on Equity Analysis (Spread Model - Total Assets)
YEARS 2011 2012 2013
Spread Model with Total Assets and Total Liabilities:
Operating Profit + Interest Income 233 467 396
= EBIT = Earnings Before Interest and Taxes
Implied Tax Rate = Taxes/EBT = t 3.72% 28.83% 13.78%
Tax Effect = 1 - t 96% 71% 86%
EBIAT = Earnings Before Interest but After Taxes 224 333 341
Total Assets 10,515 12,829 12,020
After Taxes ROA (ROA AT) 2.13% 2.59% 2.84%
Interest Expense 175 213 257
Total Liabilities (D) 7,341 10,292 10,154
Average Interest Rate on Total Liabilities 2.39% 2.07% 2.54%
After Taxes Average Interest Rate (AIR AT) 2.30% 1.47% 2.19%
Financial Margin or Spread After taxes ( MoS = ROA AT - AIR AT) -0.17% 1.12% 0.65%
Total Equity ( E ) 3,175 2,537 1,867
Financial Leverage = D/E = Debt/Equity 2.31 4.06 5.44
Financial Leverage Effect (= MoS * D/E ) -0.38% 4.54% 3.55%
Total Return On Equity 1.75% 7.13% 6.38%
Net Income 191 310 388
ROE = Total Return On Equity 6.02% 12.22% 20.78%
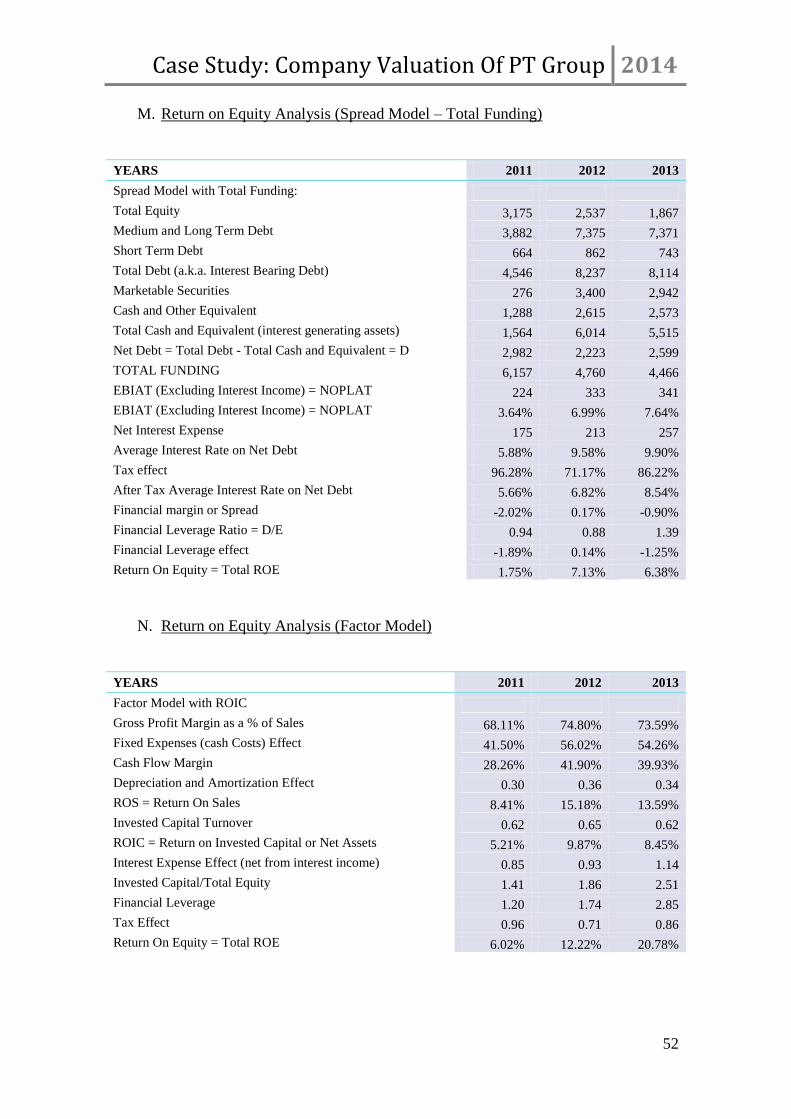
Case Study: Company Valuation Of PT Group 2014
52
M. Return on Equity Analysis (Spread Model – Total Funding)
YEARS 2011 2012 2013
Spread Model with Total Funding:
Total Equity 3,175 2,537 1,867
Medium and Long Term Debt 3,882 7,375 7,371
Short Term Debt 664 862 743
Total Debt (a.k.a. Interest Bearing Debt) 4,546 8,237 8,114
Marketable Securities 276 3,400 2,942
Cash and Other Equivalent 1,288 2,615 2,573
Total Cash and Equivalent (interest generating assets) 1,564 6,014 5,515
Net Debt = Total Debt - Total Cash and Equivalent = D 2,982 2,223 2,599
TOTAL FUNDING 6,157 4,760 4,466
EBIAT (Excluding Interest Income) = NOPLAT 224 333 341
EBIAT (Excluding Interest Income) = NOPLAT 3.64% 6.99% 7.64%
Net Interest Expense 175 213 257
Average Interest Rate on Net Debt 5.88% 9.58% 9.90%
Tax effect 96.28% 71.17% 86.22%
After Tax Average Interest Rate on Net Debt 5.66% 6.82% 8.54%
Financial margin or Spread -2.02% 0.17% -0.90%
Financial Leverage Ratio = D/E 0.94 0.88 1.39
Financial Leverage effect -1.89% 0.14% -1.25%
Return On Equity = Total ROE 1.75% 7.13% 6.38%
N. Return on Equity Analysis (Factor Model)
YEARS 2011 2012 2013
Factor Model with ROIC
Gross Profit Margin as a % of Sales 68.11% 74.80% 73.59%
Fixed Expenses (cash Costs) Effect 41.50% 56.02% 54.26%
Cash Flow Margin 28.26% 41.90% 39.93%
Depreciation and Amortization Effect 0.30 0.36 0.34
ROS = Return On Sales 8.41% 15.18% 13.59%
Invested Capital Turnover 0.62 0.65 0.62
ROIC = Return on Invested Capital or Net Assets 5.21% 9.87% 8.45%
Interest Expense Effect (net from interest income) 0.85 0.93 1.14
Invested Capital/Total Equity 1.41 1.86 2.51
Financial Leverage 1.20 1.74 2.85
Tax Effect 0.96 0.71 0.86
Return On Equity = Total ROE 6.02% 12.22% 20.78%
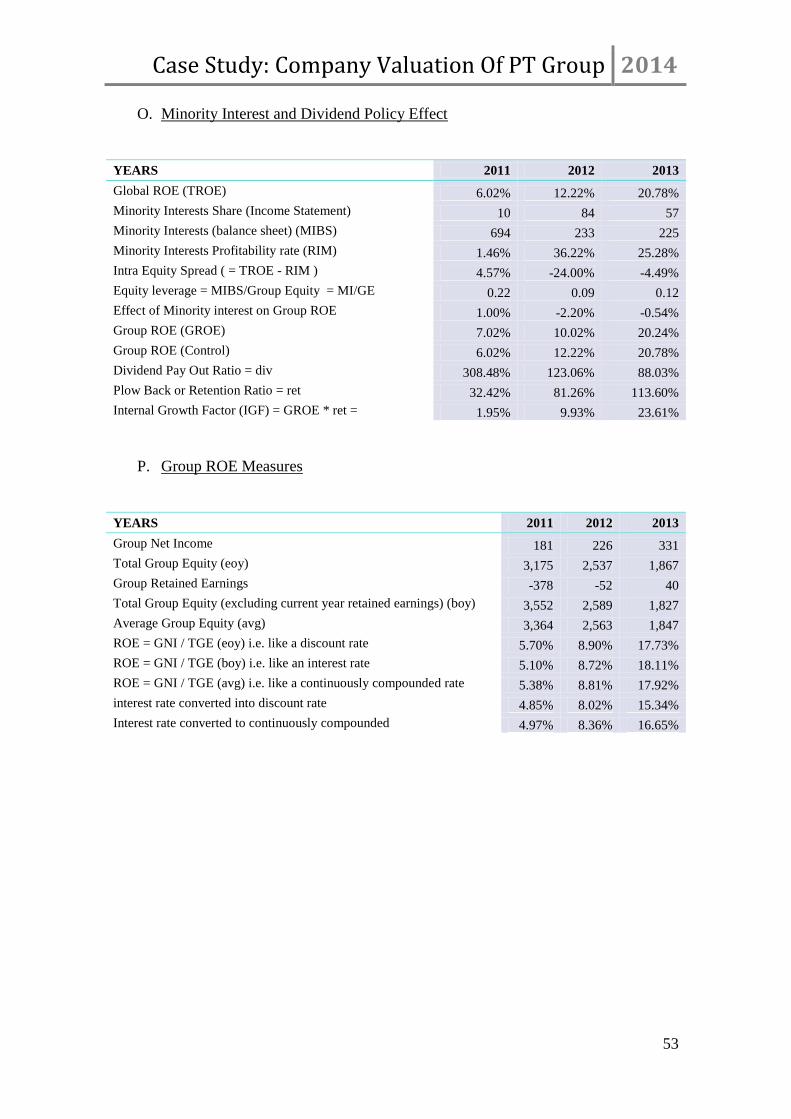
Case Study: Company Valuation Of PT Group 2014
53
O. Minority Interest and Dividend Policy Effect
YEARS 2011 2012 2013
Global ROE (TROE) 6.02% 12.22% 20.78%
Minority Interests Share (Income Statement) 10 84 57
Minority Interests (balance sheet) (MIBS) 694 233 225
Minority Interests Profitability rate (RIM) 1.46% 36.22% 25.28%
Intra Equity Spread ( = TROE - RIM ) 4.57% -24.00% -4.49%
Equity leverage = MIBS/Group Equity = MI/GE 0.22 0.09 0.12
Effect of Minority interest on Group ROE 1.00% -2.20% -0.54%
Group ROE (GROE) 7.02% 10.02% 20.24%
Group ROE (Control) 6.02% 12.22% 20.78%
Dividend Pay Out Ratio = div 308.48% 123.06% 88.03%
Plow Back or Retention Ratio = ret 32.42% 81.26% 113.60%
Internal Growth Factor (IGF) = GROE * ret = 1.95% 9.93% 23.61%
P. Group ROE Measures
YEARS 2011 2012 2013
Group Net Income 181 226 331
Total Group Equity (eoy) 3,175 2,537 1,867
Group Retained Earnings -378 -52 40
Total Group Equity (excluding current year retained earnings) (boy) 3,552 2,589 1,827
Average Group Equity (avg) 3,364 2,563 1,847
ROE = GNI / TGE (eoy) i.e. like a discount rate 5.70% 8.90% 17.73%
ROE = GNI / TGE (boy) i.e. like an interest rate 5.10% 8.72% 18.11%
ROE = GNI / TGE (avg) i.e. like a continuously compounded rate 5.38% 8.81% 17.92%
interest rate converted into discount rate 4.85% 8.02% 15.34%
Interest rate converted to continuously compounded 4.97% 8.36% 16.65%
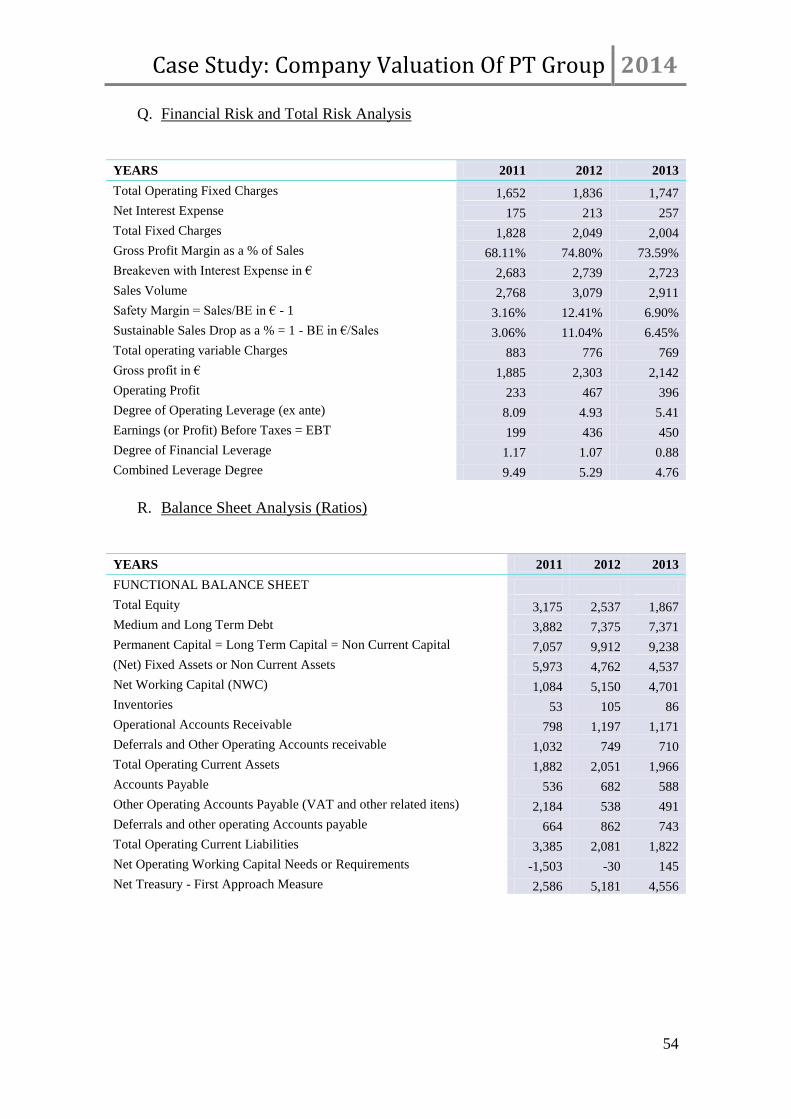
Case Study: Company Valuation Of PT Group 2014
54
Q. Financial Risk and Total Risk Analysis
YEARS 2011 2012 2013
Total Operating Fixed Charges 1,652 1,836 1,747
Net Interest Expense 175 213 257
Total Fixed Charges 1,828 2,049 2,004
Gross Profit Margin as a % of Sales 68.11% 74.80% 73.59%
Breakeven with Interest Expense in € 2,683 2,739 2,723
Sales Volume 2,768 3,079 2,911
Safety Margin = Sales/BE in € - 1 3.16% 12.41% 6.90%
Sustainable Sales Drop as a % = 1 - BE in €/Sales 3.06% 11.04% 6.45%
Total operating variable Charges 883 776 769
Gross profit in € 1,885 2,303 2,142
Operating Profit 233 467 396
Degree of Operating Leverage (ex ante) 8.09 4.93 5.41
Earnings (or Profit) Before Taxes = EBT 199 436 450
Degree of Financial Leverage 1.17 1.07 0.88
Combined Leverage Degree 9.49 5.29 4.76
R. Balance Sheet Analysis (Ratios)
YEARS 2011 2012 2013
FUNCTIONAL BALANCE SHEET
Total Equity 3,175 2,537 1,867
Medium and Long Term Debt 3,882 7,375 7,371
Permanent Capital = Long Term Capital = Non Current Capital 7,057 9,912 9,238
(Net) Fixed Assets or Non Current Assets 5,973 4,762 4,537
Net Working Capital (NWC) 1,084 5,150 4,701
Inventories 53 105 86
Operational Accounts Receivable 798 1,197 1,171
Deferrals and Other Operating Accounts receivable 1,032 749 710
Total Operating Current Assets 1,882 2,051 1,966
Accounts Payable 536 682 588
Other Operating Accounts Payable (VAT and other related itens) 2,184 538 491
Deferrals and other operating Accounts payable 664 862 743
Total Operating Current Liabilities 3,385 2,081 1,822
Net Operating Working Capital Needs or Requirements -1,503 -30 145
Net Treasury - First Approach Measure 2,586 5,181 4,556
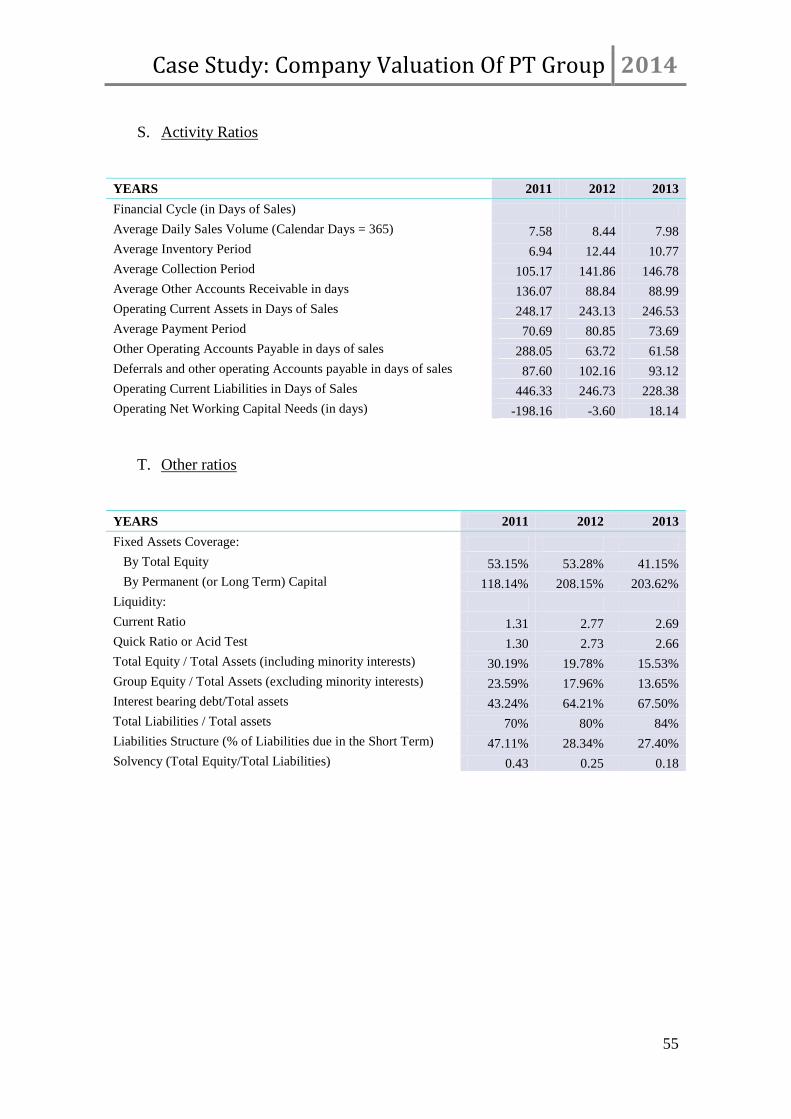
Case Study: Company Valuation Of PT Group 2014
55
S. Activity Ratios
YEARS 2011 2012 2013
Financial Cycle (in Days of Sales)
Average Daily Sales Volume (Calendar Days = 365) 7.58 8.44 7.98
Average Inventory Period 6.94 12.44 10.77
Average Collection Period 105.17 141.86 146.78
Average Other Accounts Receivable in days 136.07 88.84 88.99
Operating Current Assets in Days of Sales 248.17 243.13 246.53
Average Payment Period 70.69 80.85 73.69
Other Operating Accounts Payable in days of sales 288.05 63.72 61.58
Deferrals and other operating Accounts payable in days of sales 87.60 102.16 93.12
Operating Current Liabilities in Days of Sales 446.33 246.73 228.38
Operating Net Working Capital Needs (in days) -198.16 -3.60 18.14
T. Other ratios
YEARS 2011 2012 2013
Fixed Assets Coverage:
By Total Equity 53.15% 53.28% 41.15%
By Permanent (or Long Term) Capital 118.14% 208.15% 203.62%
Liquidity:
Current Ratio 1.31 2.77 2.69
Quick Ratio or Acid Test 1.30 2.73 2.66
Total Equity / Total Assets (including minority interests) 30.19% 19.78% 15.53%
Group Equity / Total Assets (excluding minority interests) 23.59% 17.96% 13.65%
Interest bearing debt/Total assets 43.24% 64.21% 67.50%
Total Liabilities / Total assets 70% 80% 84%
Liabilities Structure (% of Liabilities due in the Short Term) 47.11% 28.34% 27.40%
Solvency (Total Equity/Total Liabilities) 0.43 0.25 0.18
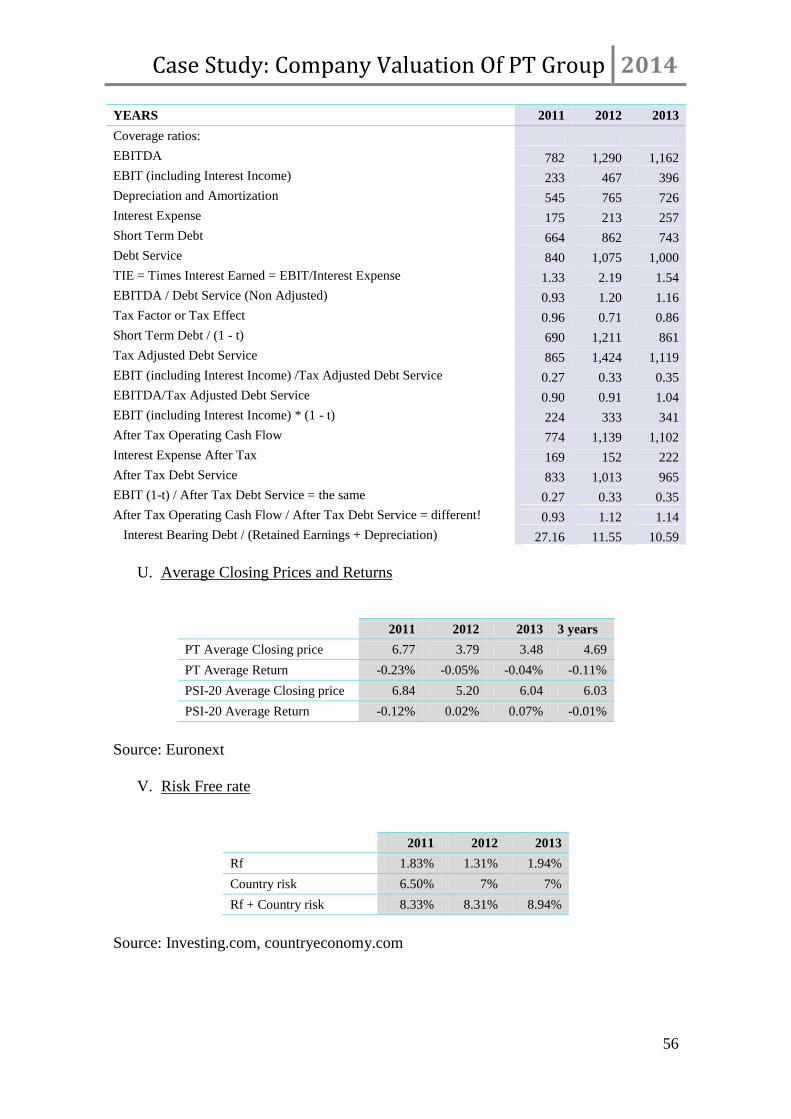
Case Study: Company Valuation Of PT Group 2014
56
YEARS 2011 2012 2013
Coverage ratios:
EBITDA 782 1,290 1,162
EBIT (including Interest Income) 233 467 396
Depreciation and Amortization 545 765 726
Interest Expense 175 213 257
Short Term Debt 664 862 743
Debt Service 840 1,075 1,000
TIE = Times Interest Earned = EBIT/Interest Expense 1.33 2.19 1.54
EBITDA / Debt Service (Non Adjusted) 0.93 1.20 1.16
Tax Factor or Tax Effect 0.96 0.71 0.86
Short Term Debt / (1 - t) 690 1,211 861
Tax Adjusted Debt Service 865 1,424 1,119
EBIT (including Interest Income) /Tax Adjusted Debt Service 0.27 0.33 0.35
EBITDA/Tax Adjusted Debt Service 0.90 0.91 1.04
EBIT (including Interest Income) * (1 - t) 224 333 341
After Tax Operating Cash Flow 774 1,139 1,102
Interest Expense After Tax 169 152 222
After Tax Debt Service 833 1,013 965
EBIT (1-t) / After Tax Debt Service = the same 0.27 0.33 0.35
After Tax Operating Cash Flow / After Tax Debt Service = different! 0.93 1.12 1.14
Interest Bearing Debt / (Retained Earnings + Depreciation) 27.16 11.55 10.59
U. Average Closing Prices and Returns
2011 2012 2013 3 years
PT Average Closing price 6.77 3.79 3.48 4.69
PT Average Return -0.23% -0.05% -0.04% -0.11%
PSI-20 Average Closing price 6.84 5.20 6.04 6.03
PSI-20 Average Return -0.12% 0.02% 0.07% -0.01%
Source: Euronext
V. Risk Free rate
2011 2012 2013
Rf 1.83% 1.31% 1.94%
Country risk 6.50% 7% 7%
Rf + Country risk 8.33% 8.31% 8.94%
Source: Investing.com, countryeconomy.com
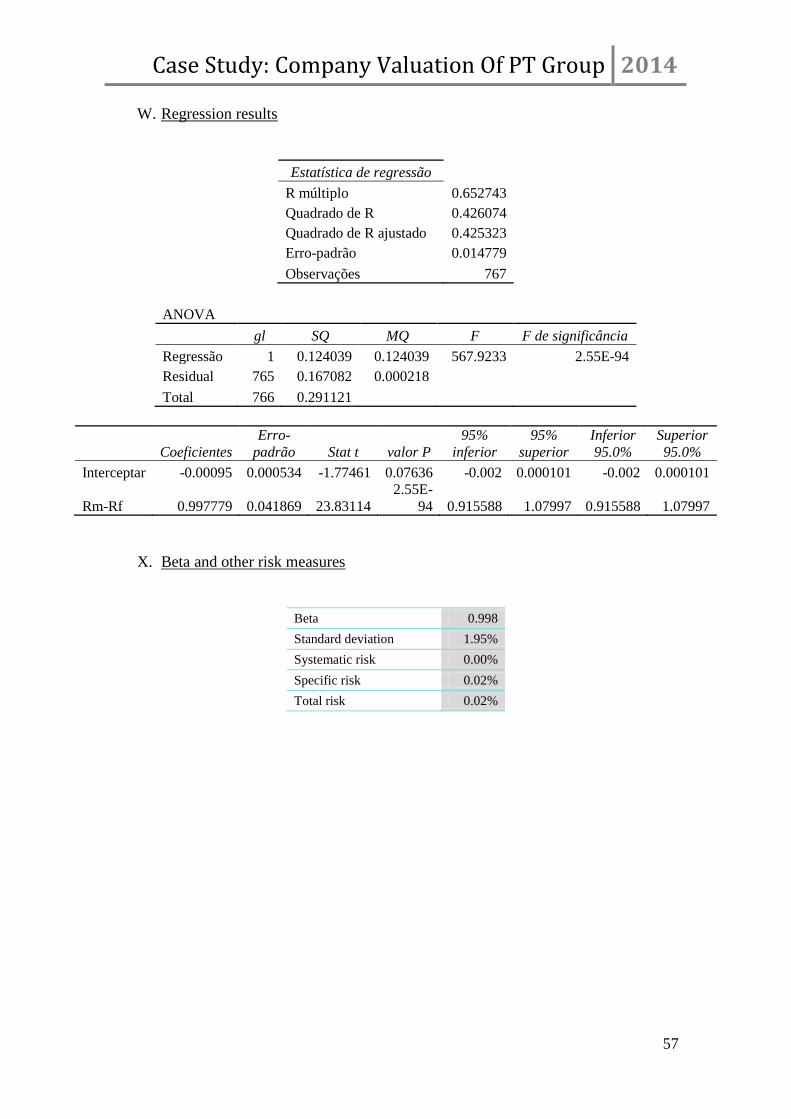
Case Study: Company Valuation Of PT Group 2014
57
W. Regression results
Estatística de regressão
R múltiplo 0.652743
Quadrado de R 0.426074
Quadrado de R ajustado 0.425323
Erro-padrão 0.014779
Observações 767
ANOVA
gl SQ MQ F F de significância
Regressão 1 0.124039 0.124039 567.9233 2.55E-94
Residual 765 0.167082 0.000218
Total 766 0.291121
Coeficientes
Erro-
padrão Stat t valor P
95%
inferior
95%
superior
Inferior
95.0%
Superior
95.0%
Interceptar -0.00095 0.000534 -1.77461 0.07636 -0.002 0.000101 -0.002 0.000101
Rm-Rf 0.997779 0.041869 23.83114
2.55E-
94 0.915588 1.07997 0.915588 1.07997
X. Beta and other risk measures
Beta 0.998
Standard deviation 1.95%
Systematic risk 0.00%
Specific risk 0.02%
Total risk 0.02%
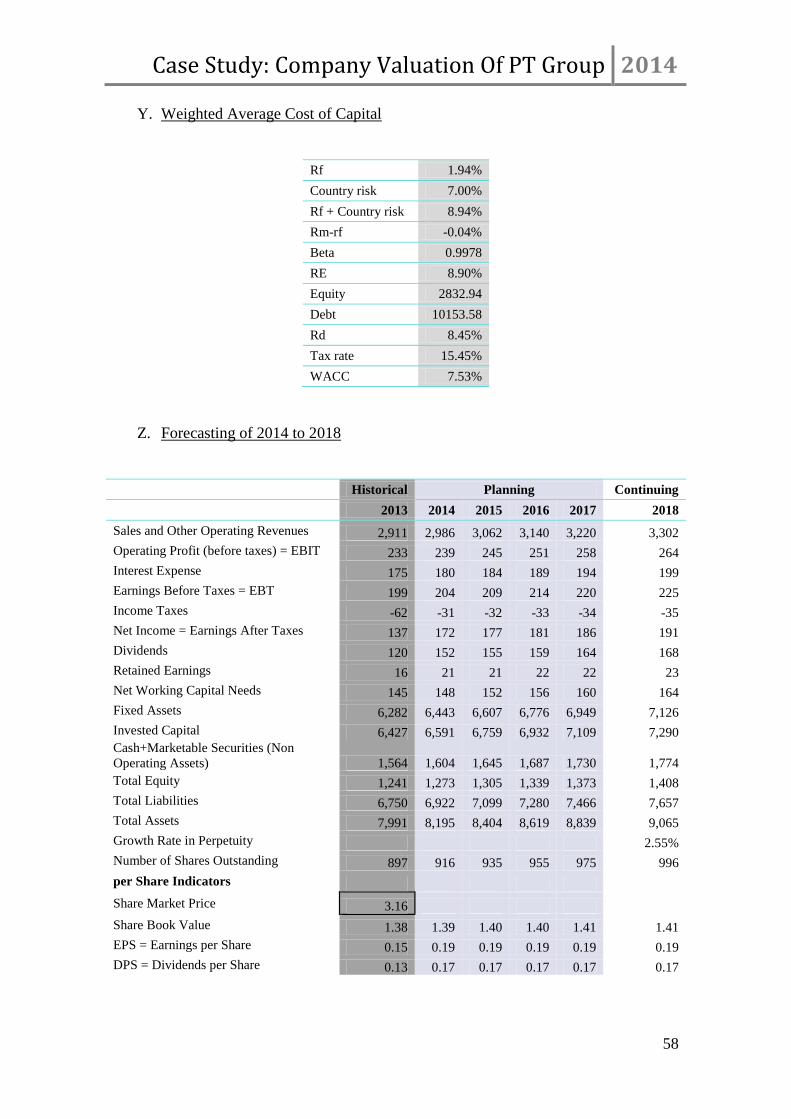
Case Study: Company Valuation Of PT Group 2014
58
Y. Weighted Average Cost of Capital
Rf 1.94%
Country risk 7.00%
Rf + Country risk 8.94%
Rm-rf -0.04%
Beta 0.9978
RE 8.90%
Equity 2832.94
Debt 10153.58
Rd 8.45%
Tax rate 15.45%
WACC 7.53%
Z. Forecasting of 2014 to 2018
Historical Planning Continuing
2013 2014 2015 2016 2017 2018
Sales and Other Operating Revenues 2,911 2,986 3,062 3,140 3,220 3,302
Operating Profit (before taxes) = EBIT 233 239 245 251 258 264
Interest Expense 175 180 184 189 194 199
Earnings Before Taxes = EBT 199 204 209 214 220 225
Income Taxes -62 -31 -32 -33 -34 -35
Net Income = Earnings After Taxes 137 172 177 181 186 191
Dividends 120 152 155 159 164 168
Retained Earnings 16 21 21 22 22 23
Net Working Capital Needs 145 148 152 156 160 164
Fixed Assets 6,282 6,443 6,607 6,776 6,949 7,126
Invested Capital 6,427 6,591 6,759 6,932 7,109 7,290
Cash+Marketable Securities (Non
Operating Assets) 1,564 1,604 1,645 1,687 1,730 1,774
Total Equity 1,241 1,273 1,305 1,339 1,373 1,408
Total Liabilities 6,750 6,922 7,099 7,280 7,466 7,657
Total Assets 7,991 8,195 8,404 8,619 8,839 9,065
Growth Rate in Perpetuity 2.55%
Number of Shares Outstanding 897 916 935 955 975 996
per Share Indicators
Share Market Price 3.16
Share Book Value 1.38 1.39 1.40 1.40 1.41 1.41
EPS = Earnings per Share 0.15 0.19 0.19 0.19 0.19 0.19
DPS = Dividends per Share 0.13 0.17 0.17 0.17 0.17 0.17
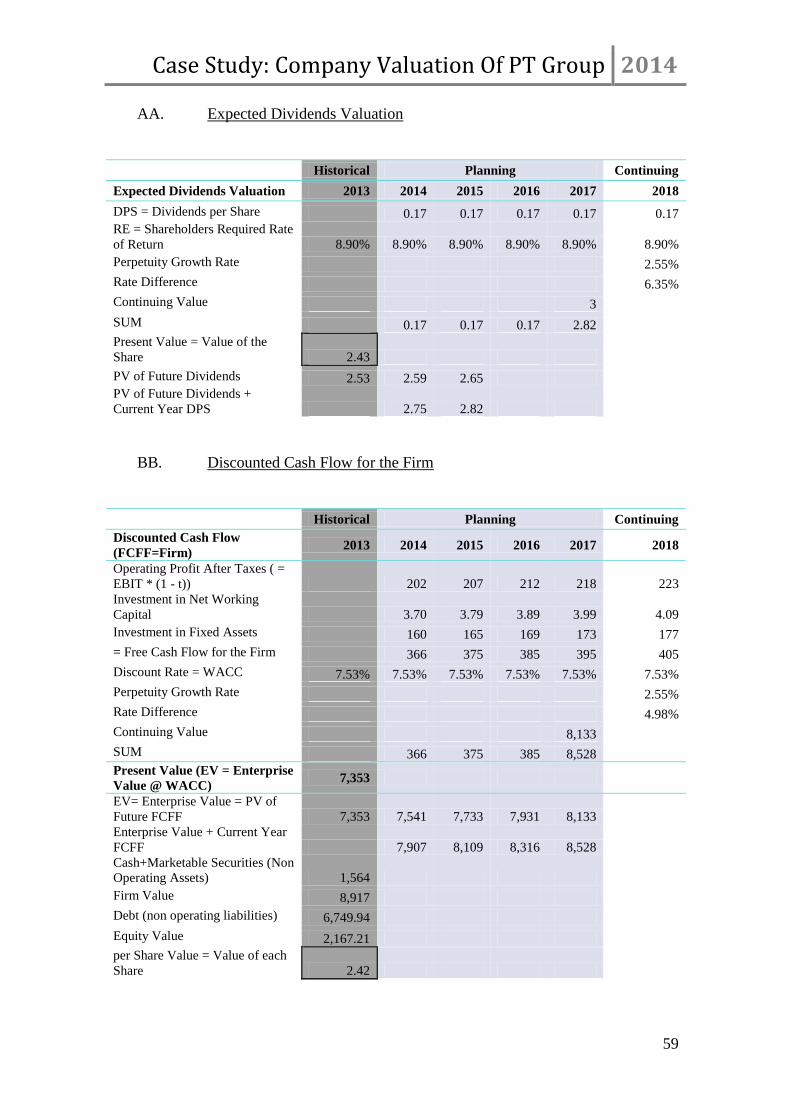
Case Study: Company Valuation Of PT Group 2014
59
AA. Expected Dividends Valuation
Historical Planning Continuing
Expected Dividends Valuation 2013 2014 2015 2016 2017 2018
DPS = Dividends per Share 0.17 0.17 0.17 0.17 0.17
RE = Shareholders Required Rate
of Return 8.90% 8.90% 8.90% 8.90% 8.90% 8.90%
Perpetuity Growth Rate 2.55%
Rate Difference 6.35%
Continuing Value 3
SUM 0.17 0.17 0.17 2.82
Present Value = Value of the
Share 2.43
PV of Future Dividends 2.53 2.59 2.65
PV of Future Dividends +
Current Year DPS 2.75 2.82
BB. Discounted Cash Flow for the Firm
Historical Planning Continuing
Discounted Cash Flow
(FCFF=Firm) 2013 2014 2015 2016 2017 2018
Operating Profit After Taxes ( =
EBIT * (1 - t)) 202 207 212 218 223
Investment in Net Working
Capital 3.70 3.79 3.89 3.99 4.09
Investment in Fixed Assets 160 165 169 173 177
= Free Cash Flow for the Firm 366 375 385 395 405
Discount Rate = WACC 7.53% 7.53% 7.53% 7.53% 7.53% 7.53%
Perpetuity Growth Rate 2.55%
Rate Difference 4.98%
Continuing Value 8,133
SUM 366 375 385 8,528
Present Value (EV = Enterprise
Value @ WACC) 7,353
EV= Enterprise Value = PV of
Future FCFF 7,353 7,541 7,733 7,931 8,133
Enterprise Value + Current Year
FCFF 7,907 8,109 8,316 8,528
Cash+Marketable Securities (Non
Operating Assets) 1,564
Firm Value 8,917
Debt (non operating liabilities) 6,749.94
Equity Value 2,167.21
per Share Value = Value of each
Share 2.42
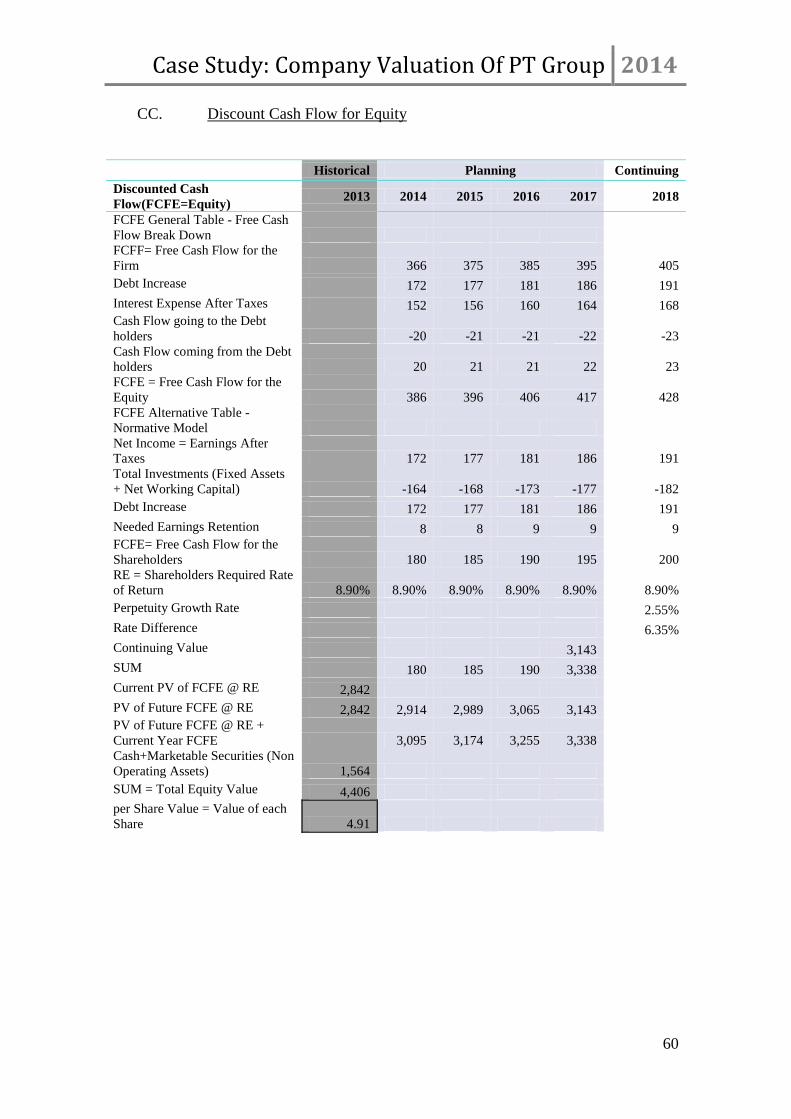
Case Study: Company Valuation Of PT Group 2014
60
CC. Discount Cash Flow for Equity
Historical Planning Continuing
Discounted Cash
Flow(FCFE=Equity) 2013 2014 2015 2016 2017 2018
FCFE General Table - Free Cash
Flow Break Down
FCFF= Free Cash Flow for the
Firm 366 375 385 395 405
Debt Increase 172 177 181 186 191
Interest Expense After Taxes 152 156 160 164 168
Cash Flow going to the Debt
holders -20 -21 -21 -22 -23
Cash Flow coming from the Debt
holders 20 21 21 22 23
FCFE = Free Cash Flow for the
Equity 386 396 406 417 428
FCFE Alternative Table -
Normative Model
Net Income = Earnings After
Taxes 172 177 181 186 191
Total Investments (Fixed Assets
+ Net Working Capital) -164 -168 -173 -177 -182
Debt Increase 172 177 181 186 191
Needed Earnings Retention 8 8 9 9 9
FCFE= Free Cash Flow for the
Shareholders 180 185 190 195 200
RE = Shareholders Required Rate
of Return 8.90% 8.90% 8.90% 8.90% 8.90% 8.90%
Perpetuity Growth Rate 2.55%
Rate Difference 6.35%
Continuing Value 3,143
SUM 180 185 190 3,338
Current PV of FCFE @ RE 2,842
PV of Future FCFE @ RE 2,842 2,914 2,989 3,065 3,143
PV of Future FCFE @ RE +
Current Year FCFE 3,095 3,174 3,255 3,338
Cash+Marketable Securities (Non
Operating Assets) 1,564
SUM = Total Equity Value 4,406
per Share Value = Value of each
Share 4.91
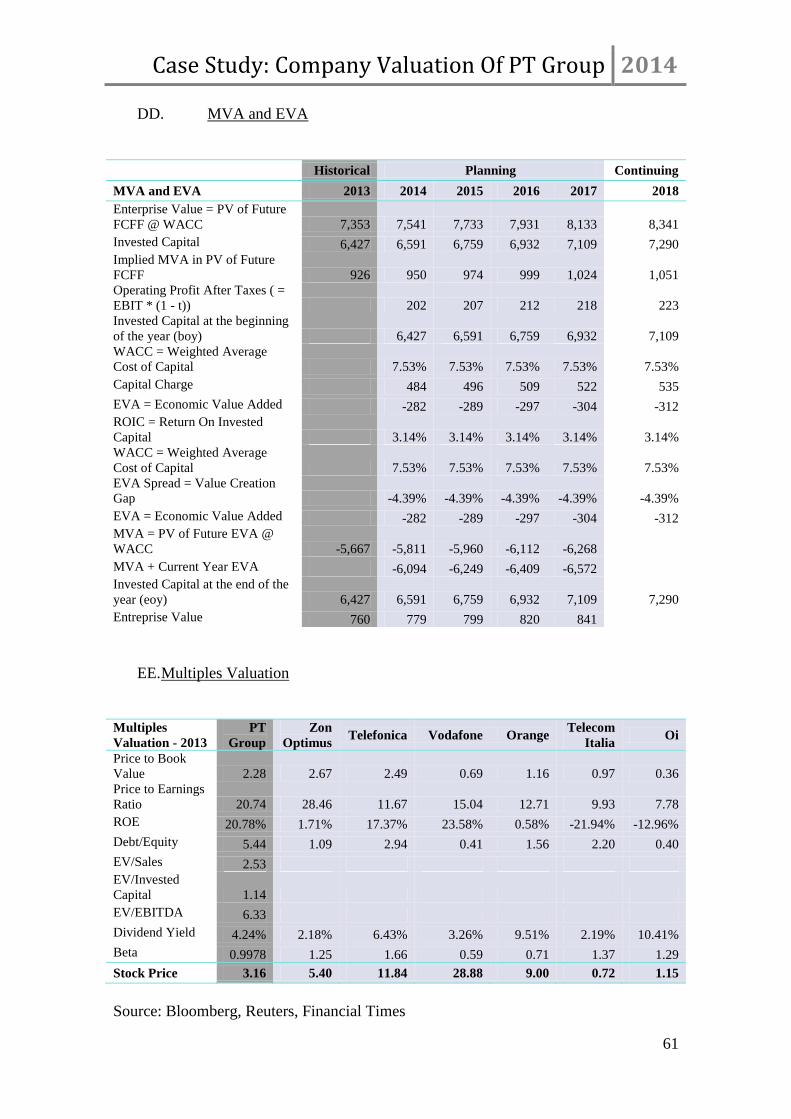
Case Study: Company Valuation Of PT Group 2014
61
DD. MVA and EVA
Historical Planning Continuing
MVA and EVA 2013 2014 2015 2016 2017 2018
Enterprise Value = PV of Future
FCFF @ WACC 7,353 7,541 7,733 7,931 8,133 8,341
Invested Capital 6,427 6,591 6,759 6,932 7,109 7,290
Implied MVA in PV of Future
FCFF 926 950 974 999 1,024 1,051
Operating Profit After Taxes ( =
EBIT * (1 - t)) 202 207 212 218 223
Invested Capital at the beginning
of the year (boy) 6,427 6,591 6,759 6,932 7,109
WACC = Weighted Average
Cost of Capital 7.53% 7.53% 7.53% 7.53% 7.53%
Capital Charge 484 496 509 522 535
EVA = Economic Value Added -282 -289 -297 -304 -312
ROIC = Return On Invested
Capital 3.14% 3.14% 3.14% 3.14% 3.14%
WACC = Weighted Average
Cost of Capital 7.53% 7.53% 7.53% 7.53% 7.53%
EVA Spread = Value Creation
Gap -4.39% -4.39% -4.39% -4.39% -4.39%
EVA = Economic Value Added -282 -289 -297 -304 -312
MVA = PV of Future EVA @
WACC -5,667 -5,811 -5,960 -6,112 -6,268
MVA + Current Year EVA -6,094 -6,249 -6,409 -6,572
Invested Capital at the end of the
year (eoy) 6,427 6,591 6,759 6,932 7,109 7,290
Entreprise Value 760 779 799 820 841
EE. Multiples Valuation
Multiples
Valuation - 2013
PT
Group
Zon
Optimus Telefonica Vodafone Orange
Telecom
Italia Oi
Price to Book
Value 2.28 2.67 2.49 0.69 1.16 0.97 0.36
Price to Earnings
Ratio 20.74 28.46 11.67 15.04 12.71 9.93 7.78
ROE 20.78% 1.71% 17.37% 23.58% 0.58% -21.94% -12.96%
Debt/Equity 5.44 1.09 2.94 0.41 1.56 2.20 0.40
EV/Sales 2.53
EV/Invested
Capital 1.14
EV/EBITDA 6.33
Dividend Yield 4.24% 2.18% 6.43% 3.26% 9.51% 2.19% 10.41%
Beta 0.9978 1.25 1.66 0.59 0.71 1.37 1.29
Stock Price 3.16 5.40 11.84 28.88 9.00 0.72 1.15
Source: Bloomberg, Reuters, Financial Times
Related Documents