The variation of reflection coefficients with source-to-receiver spacing in mul- tioffset seismic data is known to contain information about the lithology and pore-fluid content of subsurface rocks. However, such analysis is particularly challenging for thin, high-impedance reservoirs. In such instances, a key com- ponent of AVO analysis is a methodol- ogy for response calibration so that fluid properties can be interpreted vertically and laterally away from a borehole with a high degree of confidence. The use of AVO as a direct hydro- carbon indicator in clastic rocks is based on differences in the response of the compressional-wave (P-wave) velocity ( V P ) and the shear-wave (S-wave) velocity (V S ) of a reservoir rock with the introduction of gas into the pore spaces. P-waves are sensitive to changes in pore fluids. The introduction of only a small amount of gas into the pore spaces of a rock can greatly reduce the P-wave velocity. In contrast, the S-wave velocity is only weakly dependent on pore fluid content. Thus, the introduc- tion of hydrocarbons decreases the V P /V S ratio. This decrease, upon the introduction of gas into the pore space, changes the relative amplitudes of the reflections from the top and the base of the reservoir as a function of the angle of incidence. For thin beds (i.e., less than one-fourth wavelength) interfer- ence between reflections from the top and base of a reservoir may obscure the AVO response. The objective of this study is to determine if AVO analysis can be used to identify and delineate thin, high- impedance gas sands. The study area lies on the shelf of the northern Arkoma Basin in McIntosh County, Oklahoma, U.S. (Figure 1). The target reservoir is the Pennsylvanian Atoka Sand. Figure 2 shows the general stratigraphic col- umn of the Oklahoma portion of the Arkoma basin. The Arkoma basin is an arcuate foreland trough stretching some 250 miles across southeast Oklahoma into central Arkansas. From Late Cambrian to Early Pennsylvanian (basal Atokan) time, the area now occupied by the basin was part of an Atlantic-type mar- gin (shallow shelf) marking the south- ern edge of the Paleo-North American continent. A basic transgressive sequence, with significant interruptions, pro- gressed from basal sands (Reagant) to a thick carbonate serious (Arbuckle group), to a mixture of carbonate, sand, and shale (Simpson, Viola, Sylvan, Hunton), and finally, to an episode of mainly shale deposition (Woodford, Caney). The entire sequence ends in a brief period (Latest Chesterian-basal Atokan) of shallow water sand and limestone sedimentation (Cromwell, Union Valley, Wapanucka, Spiro), which presumably reflects regression associated with the earliest stage of foreland basin formation. Subsequent subsidence during the Early-Mid Pennsylvanian was extremely rapid. In direct response to the major Ouachita collisional event, a thick “fly- sch” wedge (Atokan, lower Desmoines- ian in the southern basin area) resulted, and then, with progressive shoaling of 988 THE LEADING EDGE OCTOBER 2003 Case study: AVO analysis in a high-impedance Atoka Sandstone (Pennsylvanian), North Arkoma Basin, McIntosh County, Oklahoma MOHAMED A. EISSA, Tanta University, Egypt, and University of Oklahoma, Norman, U.S. JOHN P. CASTAGNA, University of Oklahoma, Norman, U.S. Figure 1. Location map for the study area.

Welcome message from author
This document is posted to help you gain knowledge. Please leave a comment to let me know what you think about it! Share it to your friends and learn new things together.
Transcript
The variation of reflection coefficientswith source-to-receiver spacing in mul-tioffset seismic data is known to containinformation about the lithology andpore-fluid content of subsurface rocks.However, such analysis is particularlychallenging for thin, high-impedancereservoirs. In such instances, a key com-ponent of AVO analysis is a methodol-ogy for response calibration so that fluidproperties can be interpreted verticallyand laterally away from a borehole witha high degree of confidence.
The use of AVO as a direct hydro-carbon indicator in clastic rocks is basedon differences in the response of thecompressional-wave (P-wave) velocity(VP) and the shear-wave (S-wave)velocity (VS) of a reservoir rock with theintroduction of gas into the pore spaces.P-waves are sensitive to changes inpore fluids. The introduction of only asmall amount of gas into the porespaces of a rock can greatly reduce theP-wave velocity. In contrast, the S-wavevelocity is only weakly dependent onpore fluid content. Thus, the introduc-tion of hydrocarbons decreases theVP/VS ratio. This decrease, upon theintroduction of gas into the pore space,changes the relative amplitudes of thereflections from the top and the base ofthe reservoir as a function of the angleof incidence. For thin beds (i.e., lessthan one-fourth wavelength) interfer-ence between reflections from the topand base of a reservoir may obscurethe AVO response.
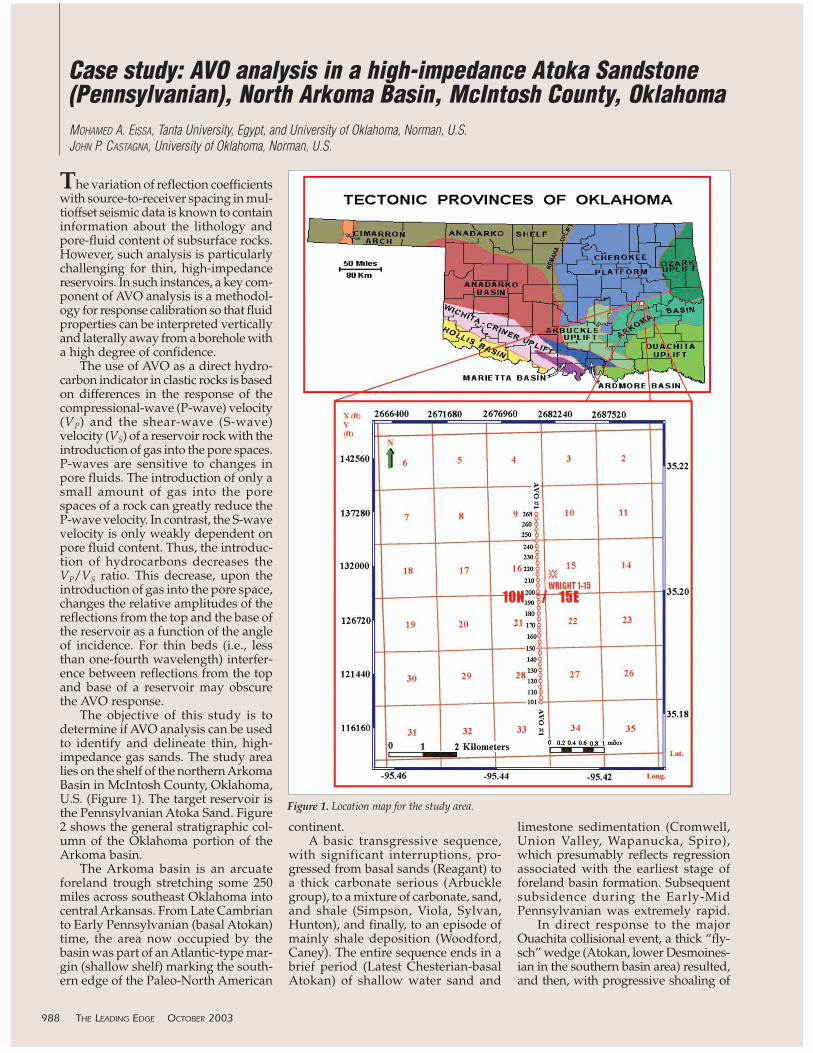
The objective of this study is todetermine if AVO analysis can be usedto identify and delineate thin, high-impedance gas sands. The study arealies on the shelf of the northern ArkomaBasin in McIntosh County, Oklahoma,U.S. (Figure 1). The target reservoir isthe Pennsylvanian Atoka Sand. Figure2 shows the general stratigraphic col-umn of the Oklahoma portion of theArkoma basin.
The Arkoma basin is an arcuateforeland trough stretching some 250miles across southeast Oklahoma intocentral Arkansas. From Late Cambrianto Early Pennsylvanian (basal Atokan)time, the area now occupied by thebasin was part of an Atlantic-type mar-gin (shallow shelf) marking the south-ern edge of the Paleo-North American
continent.A basic transgressive sequence,
with significant interruptions, pro-gressed from basal sands (Reagant) toa thick carbonate serious (Arbucklegroup), to a mixture of carbonate, sand,and shale (Simpson, Viola, Sylvan,Hunton), and finally, to an episode ofmainly shale deposition (Woodford,Caney). The entire sequence ends in abrief period (Latest Chesterian-basalAtokan) of shallow water sand and
limestone sedimentation (Cromwell,Union Valley, Wapanucka, Spiro),which presumably reflects regressionassociated with the earliest stage offoreland basin formation. Subsequentsubsidence during the Early-MidPennsylvanian was extremely rapid.
In direct response to the majorOuachita collisional event, a thick “fly-sch” wedge (Atokan, lower Desmoines-ian in the southern basin area) resulted,and then, with progressive shoaling of
988 THE LEADING EDGE OCTOBER 2003
Case study: AVO analysis in a high-impedance Atoka Sandstone(Pennsylvanian), North Arkoma Basin, McIntosh County, OklahomaMOHAMED A. EISSA, Tanta University, Egypt, and University of Oklahoma, Norman, U.S.JOHN P. CASTAGNA, University of Oklahoma, Norman, U.S.
Figure 1. Location map for the study area.
the basin, the southward progradationof major delta complexes (Hartshorne,Savanna, Boggy formations) and accom-panying coal swamps occurred.
In southeastern Oklahoma, totalbasin fill varies from around 5000 ft
near the northern shelf edge to 20 000ft or more near the Choctaw thrust, thefirst major fault of the frontal Ouachitasystem with continuous surface expres-sion. Atokan sediments, representingthe main stage of foreland basin subsi-
dence, increase rapidly in thicknessfrom few hundred feet on the flanks ofthe Ozark Uplift to over 10 000 ft in thevicinity of the Choctaw, a distance ofsome 25-30 miles.
Many folds and faults in theArkoma basin were produced by hor-izontal compressive forces related tothe Ouachita oregony. The compres-sive forces were directed north andnorthwest and decreased in intensityaway from the Ouachita Mountainsregion. Nonetheless, anticlines and syn-clines are tightly folded and terminatedby the thrust faults near the southernmargin of the basin. Gas produced fromthe structures is typically dry, beingapproximately 95% methane.
Well and seismic data. Well logs fromWright 1-15 (Figure 3) were availablefor this study. These included thegamma ray, deep and shallow resistiv-ity, and porosity logs (neutron, density,
990 THE LEADING EDGE OCTOBER 2003
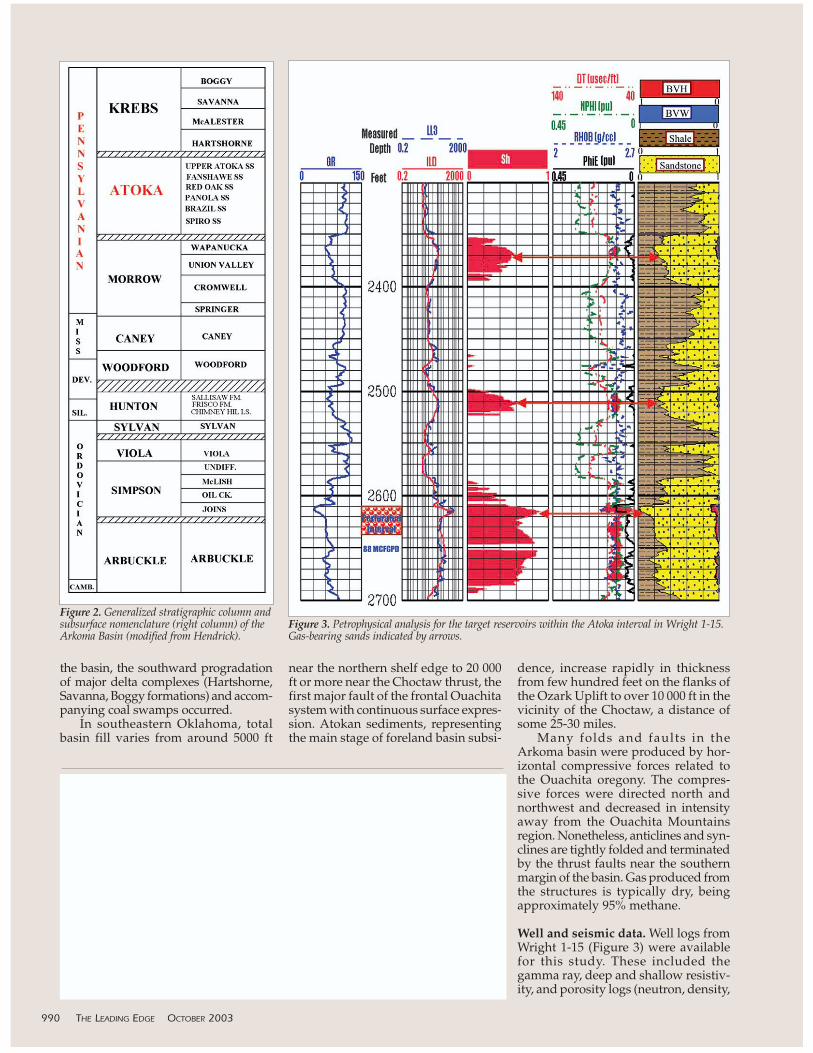
Figure 2. Generalized stratigraphic column andsubsurface nomenclature (right column) of theArkoma Basin (modified from Hendrick).
Figure 3. Petrophysical analysis for the target reservoirs within the Atoka interval in Wright 1-15.Gas-bearing sands indicated by arrows.

and sonic). The target reservoir is flu-vial Pennsylvanian Lower Atokan sandat depths of 2585-2695 ft. The perfo-rated interval (2610-2638 ft) showedinitial production of 88 000 ft3 of gas perday (MCFGPD). Petrophysical analysisindicates that the target reservoir con-sists of sand and shaly sand with mostproduction coming from the thin cleansand body at 2611-2618 ft whichexhibits an average porosity of 10%(Figure 3). The neutron-density cross-plot shows that the pay interval logresponses exhibit gas effects (Figure 4).Other sand bodies at 2350 ft (45 ft thick)and 2495 ft (30 ft thick) also show gas.
A 2D seismic survey was takenalong a north-south 3.5-mile line about1300 ft from Wright 1-15. The acquisi-tion used a dynamite source (1 lb pershot) with a source depth of 5 ft and asource interval of 110 ft. Record lengthwas 2 s and the sample rate was 2 ms.The geophone group interval was 110ft and the geophone layout was 12 over110 ft . The processing sequenceincluded exponential gain correction,relative amplitude scaling, elevationand drift correction, surface consistentdeconvolution, CDP sort, velocityanalysis, NMO correction, automaticresidual static, zero-phase spectralamplitude balancing, trim statics, fx
OCTOBER 2003 THE LEADING EDGE 991
Figure 5. Real data (a) before applying Radon filter, (b) after applying Radon filter, and (c) thesubtracted-noise model.
Figure 4. Neutron-density crossplot, showing lithology, porosity, and gas effect for the Atoka inter-val in Wright 1-15. NPHI = porosity derived from compensated neutron log; RHOB = bulk densityderived from formation density log.
Figure 6. Extracted wavelet used in synthetic modeling.

deconvolution, and prestack migration.Special processing for AVO
included parabolic Radon filtering(Hampson-Russell invest procedure,10-80 Hz and time shifts from +80 to -80 ms were passed) of supergathersconsisting of 10 summed CDP gathers.Figure 5 shows real-data gathers beforeand after Radon filtering, and the sub-tracted-noise model.
Seismic modeling and analysis.
Primaries-only, ray-trace synthetic seis-mograms using sonic and density logsfrom Wright 1-15 were generated, usingthe extracted wavelet at the well(Figure 6). Synthetic gathers wereNMO-corrected and calculated at thesame offset as the real data (0-3800 ft)with no correction for spreading, trans-mission loss, attenuation, or geophone-array response. S-wave velocity wasestimated using the mudrock equationfor brine-saturated rocks. Figure 7, the
brine model, displays an amplitudedecrease with increasing offset at thetarget horizon. In the gas model,Poisson’s ratio for the target reservoirswas changed to 0.1 in two ways: gasmodel 1 changed VS and kept VP fixedas measured (Figure 8) and gas model2 changed VP and kept VS fixed (Figure9). The top and the base of the 110-ftsand package are distinctly recognizedin the synthetics. In the brine model,target reservoirs show no AVO anom-
992 THE LEADING EDGE OCTOBER 2003
Figure 7. AVO brine synthetic-seismogram model of Wright 1-15.
Figure 8. AVO gas synthetic-seismogram model 1 for Wright 1-15, allowing VS to change in the gas interval.

aly. In gas model 1 (Figure 8), however,the top of the main reservoir (at 480 mstwo-way time or TWT) shows a strongpeak in the near-offset traces whichdecrease its amplitude with increase ofoffset and leads to a change in polarity(at about 2000 ft) and an increase of thetrough amplitude in the far-offsettraces.
The base of the reservoir isexpressed in a trough at 497 ms TWT
in the near offset, which has AVObehavior that is the reverse of the top.Notice similar AVO anomalies for sandbodies at 430 ms and 470 ms. The nearand far offsets of the real data are moresimilar to the AVO response of gasmodel 2 (Figure 9). This suggests thatthe sonic logs are measuring P-wavevelocities that are higher than those towhich the seismic data are responding.The AVO response of the real data
exhibit typical AVO behavior for classI sands with a polarity reversal with off-set according to the Rutherford andWilliams (1989) classification. Near-stack and far-stack sections (Figure 10)exhibit clearly anomalous AVOresponses between CDPs 214 and 223at 480 ms TWT.
AVO inversion. The AVO inversionprocess aims to establish a quantitative
994 THE LEADING EDGE OCTOBER 2003
Figure 9. AVO gas synthetic-seismogram model 2 for Wright 1-15, allowing VP to change in the gas interval.
Figure 10. (a) Near-offset stack and (b) far-offset stack, showing the AVO anomaly for the target reservoir.
a b
model which is consistent with the realseismic record and relate to the truegeology. The big concern with AVOinversion is nonuniqueness, in whichmany models match the real data.
We applied a model-based AVOinversion technique. It was performedusing an iterative and general linearinversion (GLI) algorithm that allowsfixed constraints. It is one-dimensionalmodeling that requires a starting modelwith a known number of layers for VP,VS, density, and thickness. Then anaccurate forward model can be estab-lished using ray tracing and theZoeppritz equations. This generalizedlinear inversion uses initial assump-tions of the answers and proceeds torefine that answer through a series ofsteps until the best fit between the syn-thetic and the real data is achieved.
AVO inversion was performedusing the brine model, gas model 1,and gas model 2 as starting models.The maximum amounts the invertedparameters were allowed to changewere: VP, 5000 ft/s; density, 1.0 g/cm3;layer thickness, 100 ft; VS, 5000 ft/s.The model consists of 63 layers.
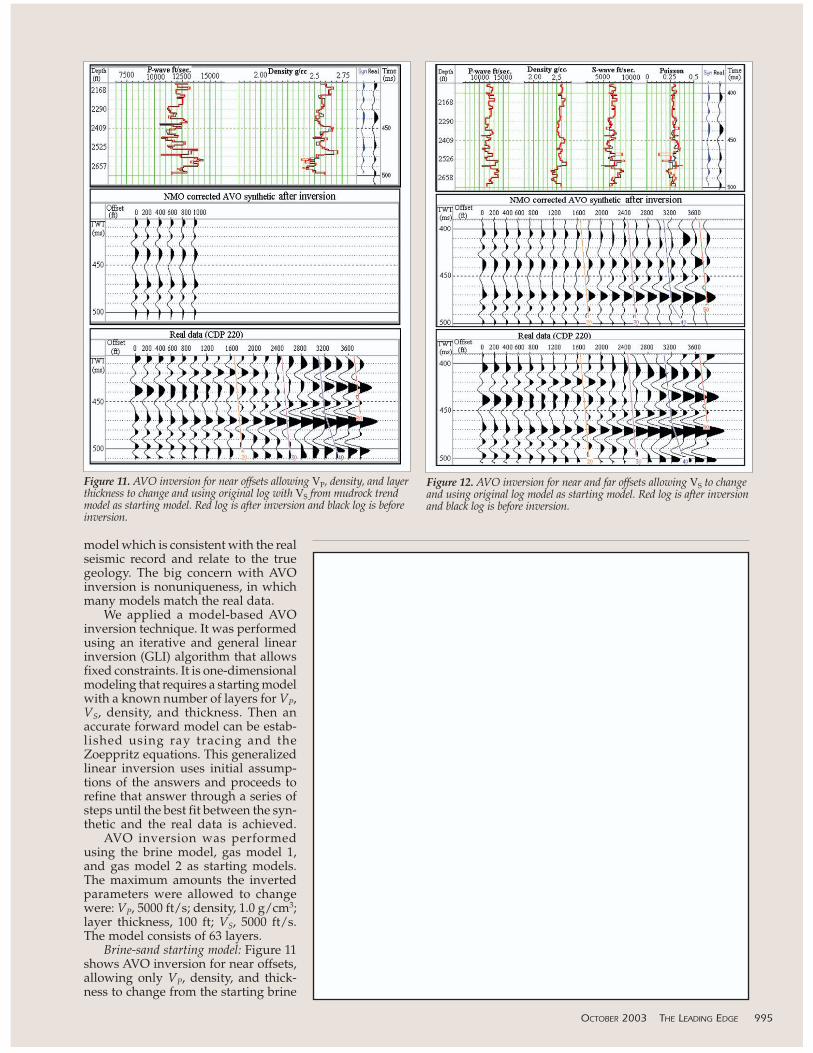
Brine-sand starting model: Figure 11shows AVO inversion for near offsets,allowing only VP, density, and thick-ness to change from the starting brine
OCTOBER 2003 THE LEADING EDGE 995
Figure 11. AVO inversion for near offsets allowing VP, density, and layerthickness to change and using original log with VS from mudrock trendmodel as starting model. Red log is after inversion and black log is beforeinversion.
Figure 12. AVO inversion for near and far offsets allowing VS to changeand using original log model as starting model. Red log is after inversionand black log is before inversion.
996 THE LEADING EDGE OCTOBER 2003
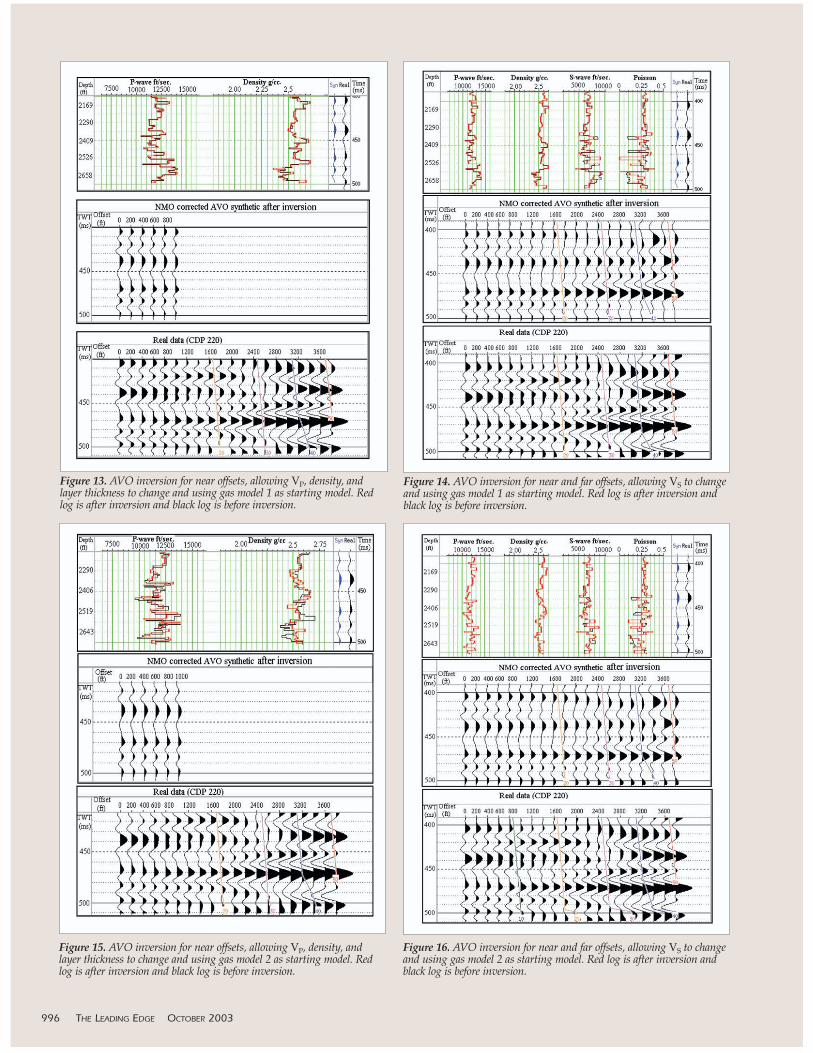
Figure 13. AVO inversion for near offsets, allowing VP, density, andlayer thickness to change and using gas model 1 as starting model. Redlog is after inversion and black log is before inversion.
Figure 14. AVO inversion for near and far offsets, allowing VS to changeand using gas model 1 as starting model. Red log is after inversion andblack log is before inversion.
Figure 15. AVO inversion for near offsets, allowing VP, density, andlayer thickness to change and using gas model 2 as starting model. Redlog is after inversion and black log is before inversion.
Figure 16. AVO inversion for near and far offsets, allowing VS to changeand using gas model 2 as starting model. Red log is after inversion andblack log is before inversion.
model which employed the originalwell-log data. The VP and density val-ues after inversion (red curves) showonly minor changes. Figure 12 showsthe AVO inversion for all offsets, allow-ing only VS to change and using thenear-trace inversion results with VS pre-dicted from trend curves as the start-ing model. Note that VS, after inversion(red curve), has slightly decreased inthe lower part of the main gas intervalsat 485-495 ms TWT. An abnormalincrease of VS is observed at 463 msTWT (2495 ft), which indicates abnor-mal decrease in Poisson’s ratio curve(0.12), presumably caused by the pres-ence of gas. The Poisson’s ratio curveslightly increases at the bottom of themain gas interval and exhibits a majordecrease at 463 ms TWT (2495 ft).
Gas-sand starting model 1: AVOinversion was also performed usinggas model 1 as the starting model(Figure 13). VP and density reflect onlyminor changes after inversion for nearoffsets. These were used as the startingmodel for the full gather, allowing onlyVS to change (Figure 14). VS in the lowerpart of the main gas interval wasdecreased. No significant changes wereevident in the top of the main reservoir.Note an abrupt increase of VS at 463 msTWT (2495 ft). Poisson’s ratio increasesfor the bottom part of the main gasinterval. A major decrease in Poisson’sratio occurs at 463 ms TWT (2495 ft).An inverted Poisson ratio curve indi-cates no gas at 440 ms TWT (2350 ft)and 457 ms TWT (2460 ft).
Gas-sand starting model 2: First, afterallowing VP, density, and layer thick-ness to change (Figure 15), the invertedVP and density were shifted 9 ftupward, with an increase in the lowerpart of the main reservoir. Figure 16shows the AVO inversion for the fullgathers, using the near-trace inversionresults as the starting model and allow-ing only VS to change. Inverted VSdecreases in the lower part of the maingas intervals. Poisson’s ratio increasesat the base of the main reservoir anddoes not change at the top of the mainreservoir. A Poisson’s ratio drop to 0.1at 463 ms TWT (2495 ft) indicates gas.Poisson’s ratio indicates no gas in theother two intervals at 440 TWT (2350ft) and 457 ms TWT (2460 ft).
Both gas models confirm the pres-ence of gas at the top of the main reser-voir at 480 ms TWT (2590 ft). Anothergas interval was detected by the inver-sion at 463 ms TWT (2495 ft). A gasinterval at 440 ms TWT (2350 ft) wasnot apparent after the inversion.
Conclusion. A lower Atoka(Pennsylvanian) high-impedance sandpackage has been shown to exhibit aclass I AVO anomaly with a phasereversal. This suggests that AVO analy-sis may be a useful tool for detectingand delineating high impedance gassands in the northern Arkoma Basin.AVO inversion indicates the presenceof gas in this lower Atoka sand.
Suggested reading. “AVO inversion, the-ory and practice” by Hampson (TLE,1991). “A model-based analysis of AVOin Sacramento Valley” by Hong et al.
(Offset-Dependent Reflectivity—Theory andPractice of AVO Analysis, SEG, 1993).“Vitrinite reflectance and deep Arbucklematuration at Wilburton Field, LatimerCounty, Oklahoma” by Hendrick (inOklahoma Geological Survey Circular 93,1992). TLE
Acknowledgment: The authors thank JerryWilson, manager of Pathfinder LLC, for pro-viding data and financial support.
Corresponding author: [email protected]
OCTOBER 2003 THE LEADING EDGE 997
Related Documents


![[Castagna J.P.] AVO Course Notes, Part 3. Poor AVO](https://static.cupdf.com/doc/110x72/563db964550346aa9a9ce6c7/castagna-jp-avo-course-notes-part-3-poor-avo.jpg)


