Case Study 3 For 16/05/2006

Welcome message from author
This document is posted to help you gain knowledge. Please leave a comment to let me know what you think about it! Share it to your friends and learn new things together.
Transcript

Case Study 3
For
16/05/2006

People Taking Part Case Study 3
Setting the scene for the review, who was involved.
The following Board & Managers were involved in this Review:
BOARD
J JonesP ScottD BrownM WilliamsG BatternM HarrisG Dee
MANAGERS
R DavisP HollieD FrancisA CrossD Owen
OTHERS
The review also includes data from: Staff Suppliers Customers

The Future Case Study 3
The results from the BIR process need to be considered in the context of where the organisation wants to go.
The vision of the company according to the:
BOARD To provide an improved service to our customers & to train & develop the staff who work for the organisation.
Caring for carers & looking after the frail & elderly in their own homes.
To be able to finance offer every carer in the city & short break service.
Carers in the city have access to respite when they need it.
A city where everyone can access a short break or domiciliary services in their homes when needed. To relieve carers.
MANAGERS To relieve carers.
To provide a service to clients
© RapidBI 2006 All rights reserved 2

SWOT Case Study 3
The SWOT gives us an insight to where the key responders are coming from and what their thoughts are on key issues.
People completing this review described the following: B = Board, M = Managers, O = Others
STRENGTHS High quality of service to customers, (B)
on-going staff development & good management/director team. (B)
Well-trained staff & competent management. (B)
Strong working board of directors. (B)
Have provided our service since the early 1980's. (B)
Knowledge of business. (B)
(B)
Manager. (B)
Good management team. (B)
Well trained certificated staff have provided a service to carers over 2 decades. (B)
Committed staff. (M)
Track record. (M)
WEAKNESSES Difficulty in finding staff, need to deal with changing legislation & shortage of new people for management team. (B)
Coping with applications for staff but not able to offer regular work as social work is not core funded. (B)
Not good at promoting ourselves due to the way we are funded. Most of our staff are 50 year young. Not clear where our service fits. (B)
Ageing staff profile. Premises - Low profile. (B)
Lack of core funding. Unable to guarantee hours to staff. Difficulty in recruiting staff. (B)
Staff (M)
Skills of the Board (M)
OPPORTUNITIES Opportunity to offer service to more customers, to develop new services/offerings & to train staff to take a wider range of work. (B)
Business plan in place. (B)
Looking for new work from other sources. (B)
Be clear about the service we offer. (B)
Opportunities to re-promote our service. (B)
© RapidBI 2006 All rights reserved 3

SWOT Case Study 3
The SWOT gives us an insight to where the key responders are coming from and what their thoughts are on key issues.
People completing this review described the following: B = Board, M = Managers, O = Others
OPPORTUNITIES Work in partnerships & networking. (B)
Contracts with Local authorities. Project Funding. (B)
Partnerships with others. (B)
Widen our marketing. Extend business consult to this end. (B)
Backing from management Board. (M)
Partnering with other agencies (M)
THREATS Other organisations offering similar services, work force ageing - lack of replacements & changes to legislation - more bureaucracy. (B)
Local authority take the clients first. No core funding. (B)
Staff cannot be guaranteed hours. (B)
Social Work. (B)
Private organisations. Some voluntary providers who offer like service. (B)
Competition. National re-organisation. (B)
Manager leaves. (B)
Difficulty in retaining staff. Increasing difficulty in fundraising. (B)
Local authority (M)
lack of funding (M)
Staff shortages (M)
© RapidBI 2006 All rights reserved 4

Performance to Date Case Study 3
This shows how key people think the organisation has been performing recently.
When completing this section of the review, participants were asked to rate the performance of the organisation and give a reason for the score. The reasons given are presented here.
B = Board, M = Managers, O = Others
FINANCE Good financial position. (B)
Good level of financial control & reporting. (B)
Statement given out at every monthly meeting. (B)
Have to be accountable to our funders. (B)
Previous track record. (B)
Work needs to be increased on call-off contract. (B)
Maintaining viability. (B)
Budgets tight (B)
Funding from local government (B)
Break/? principles ensuring sufficient funds for contingency (B)
MARKETING Lack of funding. (B)
Lack of expertise. (B)
Are known to many areas. (B)
Will endeavour to accommodate help asap. (B)
Have no information available. (B)
Current low profile. Need to strengthen relationships with social work departments. (B)
Employed business consultant to assist this process. (B)
Good publicity material (B)
Brochures (B)
OPERATIONS Dedicated staff. (B)
Good procedures & controls. (B)
Can produce staff quickly. (B)
Have Quality Assurance in place. (B)
Operates a quality system (B)
Operational procedures & processes well embedded. (B)
Policies & procedures in place. Business plan. (B)
© RapidBI 2006 All rights reserved 5

Performance to Date Case Study 3
This shows how key people think the organisation has been performing recently.
When completing this section of the review, participants were asked to rate the performance of the organisation and give a reason for the score. The reasons given are presented here.
B = Board, M = Managers, O = Others
OPERATIONS Quality Assurance system in place. (B)
PEOPLE Well trained staff. (B)
Good quality control. (B)
Have good staff. (B)
Have got policy in place etc. (B)
How we are funded. (B)
Staff used effectively. (B)
Manager could do with more time away from operations. (B)
Turnover a care co-ordinator appointment. (B)
Experienced trained staff - Continuous professional development. (B)
© RapidBI 2006 All rights reserved 6

Potential for the Future Case Study 3
This shows how key people think the organisation has been preparing itself for what is to come - investment in infrastructure.
When completing this section of the review, participants were asked to rate the performance of the organisation and give a reason for the score. The reasons given are presented here.
B = Board, M = Managers, O = Others
RESOURCES Limited budget. (B)
Lack of suitable resources locally. (B)
Have computers & IT on hand. (B)
Have computer in place & updated. (B)
Good management of resources over the past 10 years. (B)
Need to improve cash flow turnover marketing. (B)
Effective accountant. (B)
Invested in IT. (B)
SECTOR EXPERTISE Years of experience in the market. (B)
Good communication with similar organisations. (B)
Knows what is expected & can deliver where it is needed. (B)
Do not promote ourselves as when we do this we get more requests for our service with no monies to follow. (B)
Track record in caring for carers. (B)
Knowledge of area. (B)
Could expand scope turnover more innovation. (B)
Local knowledge. (B)
Remaining in the field over 20 year period. (B)
CONTROLS Good internal quality control procedures. (B)
Good management/board. (B)
Now have qualified accountant to assist in financial expertise. Quality management system in operation. (B)
Have Quality Assurance system in place. (B)
Quality system in place. Reporting processes good. One of the strongest areas. (B)
Quality Assurance (B)
Staff appraisals. (B)
Client satisfaction surveys. (B)
When completing this section of the review, participants were asked to rate the performance of the organisation and give a reason for the score. The reasons given are presented here.
B = Board, M = Managers, O = Others
IDEAS & INNOVATION Lack of resources. (B)
Limited budget. (B)
Business plan in operation. Discussions on how to improve are held regularly. (B)
Need help to carry these out. (B)
Have not taken advantage of changing policies. (B)
Tend not to think "how" something "can" be done. (B)
Lack of business skills. (B)
Time & lack of ability to employ more management staff. (B)
LEADERSHIP Well motivated management/board. Strong desire to deliver a quality service. (B)
Chairman & co-ordinator are always ready to help. (B)
Needs some improvement. (B)
Could be improved by motivation focus point it "can" be done! (B)
Very loyal staff. (B)
Manager communicates very effectively with board & staff. (B)
BENCHMARKING Reasonably good in comparison to similar organisations elsewhere in in the country. (B)
Part of a wider network that allows us to measure our performance. (B)
Our branch is ahead of others in that we have completed our quality management system & stand by it. (B)
Have been approved since early 1980's. (B)
Have not tended to look outside the company - very insular. (B)
Need to strengthen relationships with others. (B)
Good relationships with other local organisations networking. (B)
© RapidBI 2006 All rights reserved 7

Business Performance & Potential, Board
Case Study 3
This shows the extent of clarity & understanding between key personnel on important issues
The Board of Case Study 3 were asked to consider a number of areas of the organisation and rate them 1-10.
The graph below shows the range of scores given along with the average score for each are.
You should consider the comments supplied at the time when reading this.
The shorter the vertical bar the more consensus the team has. Where the bar is longer than 2, there may be a misunderstanding or lack of communication in this area.
Any average under 6 suggests significant room for improvement.
© RapidBI 2006 All rights reserved 8
Fin
ance
Mar
ketin
g
Ope
ratio
ns
Peo
ple
Sal
es
Ben
chm
arki
ng
Con
trol
s
Sec
tor
Exp
ertis
e
Idea
s an
d In
nova
tion
Lead
ersh
ip
Res
ourc
es
0 0
1 1
2 2
3 3
4 4
5 5
6 6
7 7
8 8
9 9
10 10

Finance Case Study 3
This shows how people in the organisation view financial factors.
Capital Investment
Cash Control
Costing
Financial Control
Financial Information
Financial Knowledge
Financial Resources
Financial Strength
Financial Success
Forecasting & Budgeting
Funding
Risk Management
Managers
Board
© RapidBI 2006 All rights reserved 9

Marketing Case Study 3
This shows how people in the organisation view marketing factors.
Customer Service
Design
Evaluation of Marketing
Market Communications
Market Knowledge
Market Research
Marketing Integration
Marketing Planning
Marketing Strategy
Positioning
Product Development
Sales
Managers
Board
© RapidBI 2006 All rights reserved 10

Operations Case Study 3
This shows how people in the organisation view operational factors.
Equipment/Plant
External Networking
Franchise-ability
People
Performance Feedback
Productivity
Quality Systems
Response Time
Scheduling & Planning
Service Delivery
Supplier Development
Supply Chain/Material Mgmt.
Use of Technology
Managers
Board
© RapidBI 2006 All rights reserved 11

Management Processes Case Study 3
This shows how people in the organisation view the strategic management processes.
Business Communications
Business Planning Process
IT Systems
Management Controls
Performance Management
Managers
Board
© RapidBI 2006 All rights reserved 12

Management Style Case Study 3
This shows how people in the organisation view the style of management.
Change Management
Coaching
Creativity
Empowerment
Involvement
Leadership
Openness
Passion/Energy
Recognition
Risk-taking
Teamwork
Managers
Board
© RapidBI 2006 All rights reserved 13

Management Values Case Study 3
This shows how people in the organisation view the values the organisation demonstrates.
Care for Environment
Community Relations
Customer Focus
Learning Organisation
Quality Ethos
Respect for People
Supplier Relations
Managers
Board
© RapidBI 2006 All rights reserved 14

People Case Study 3
This shows how people in the organisation view people management factors.
Health & Safety
HR Policies
HR Procedures
Induction
Job Clarity
Job Skills
Recruitment
Shared Direction
Staff Reviews
Training Action & Evaluation
Training Planning
Managers
Board
© RapidBI 2006 All rights reserved 15

Management Skills Case Study 3
This shows how people in the organisation view the management skills of senior management.
Business Planning
Financial
Information Technology
Leadership
Legal Responsibilities
Marketing
Networking
Operational Management
Passion & Ownership
People Development
Project Management
Managers
Board
© RapidBI 2006 All rights reserved 16
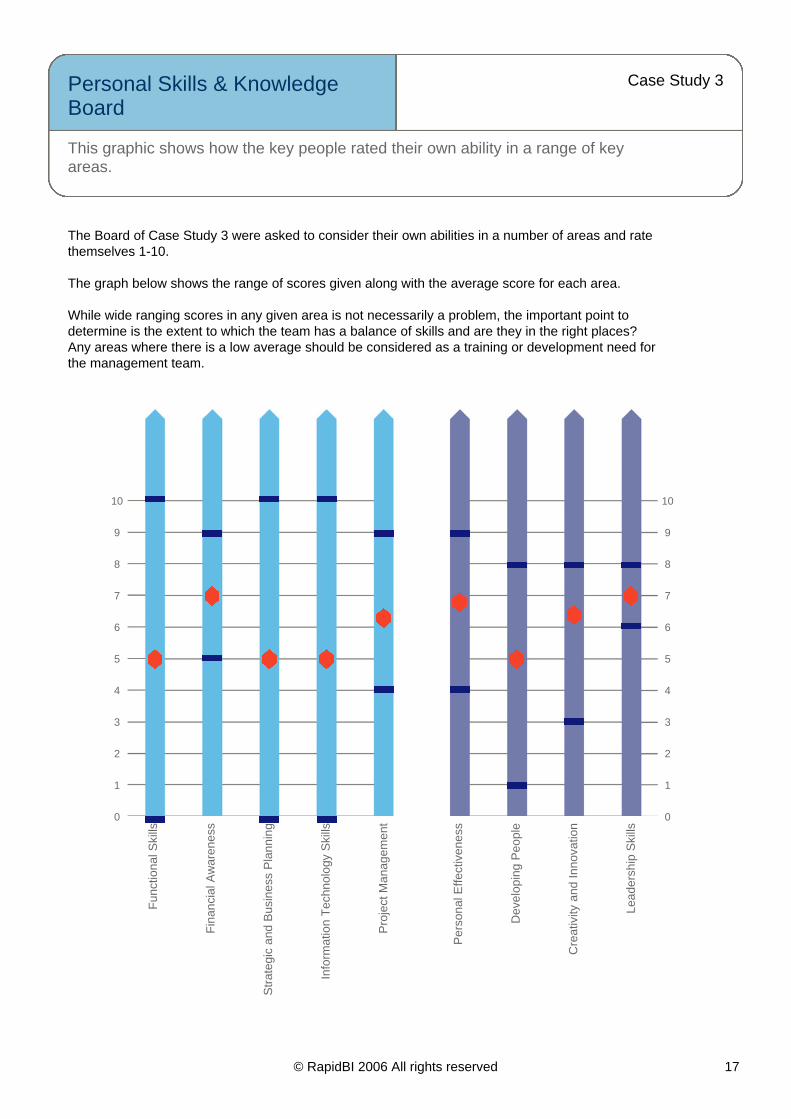
Personal Skills & Knowledge Board
Case Study 3
This graphic shows how the key people rated their own ability in a range of key areas.
The Board of Case Study 3 were asked to consider their own abilities in a number of areas and rate themselves 1-10.
The graph below shows the range of scores given along with the average score for each area.
While wide ranging scores in any given area is not necessarily a problem, the important point to determine is the extent to which the team has a balance of skills and are they in the right places? Any areas where there is a low average should be considered as a training or development need for the management team.
© RapidBI 2006 All rights reserved 17
Fun
ctio
nal S
kills
Fin
anci
al A
war
enes
s
Str
ateg
ic a
nd B
usin
ess
Pla
nnin
g
Info
rmat
ion
Tec
hnol
ogy
Ski
lls
Pro
ject
Man
agem
ent
Per
sona
l Effe
ctiv
enes
s
Dev
elop
ing
Peo
ple
Cre
ativ
ity a
nd In
nova
tion
Lead
ersh
ip S
kills
0 0
1 1
2 2
3 3
4 4
5 5
6 6
7 7
8 8
9 9
10 10
Related Documents