CASE Network Studies and Analyses 399 - Agriculture Income Assessment for the Purpose of Social Assistance: the Case of Ukraine
Aug 21, 2015
Welcome message from author
This document is posted to help you gain knowledge. Please leave a comment to let me know what you think about it! Share it to your friends and learn new things together.
Transcript

CASE Network Studies & Analyses No.399 - Agriculture income assessment for the purpose…
1
Materials published here have a working paper character. They can be subject to further
publication. The views and opinions expressed here reflect the author(s) point of view and
not necessarily those of CASE Network.
Prepared for the project: “Social reform in a country with a high role of unobservable
incomes: improving social assistance mechanisms in Ukraine”.
The project is co-financed by the 2009 Polish aid programme of the Ministry of Foreign
Affairs of the Republic of Poland.
Copy-edited by Paulina Szyrmer Keywords: subsistence and semi-subsistence farming; hard to verify income; farm
household income; income (agro-income) imputation; means testing methods
Jel codes: O18, E26, C13, Q12, I38
© CASE – Center for Social and Economic Research, Warsaw, 2009
Graphic Design: Agnieszka Natalia Bury
EAN 9788371785061
Publisher:
CASE-Center for Social and Economic Research on behalf of CASE Network
12 Sienkiewicza, 00-010 Warsaw, Poland
tel.: (48 22) 622 66 27, 828 61 33, fax: (48 22) 828 60 69
e-mail: [email protected]
http://www.case-research.eu
CASE Network Studies & Analyses No.399 - Agriculture income assessment for the purpose…
2
The CASE Network is a group of economic and social research centers in Poland,
Kyrgyzstan, Ukraine, Georgia, Moldova, and Belarus. Organizations in the network regularly
conduct joint research and advisory projects. The research covers a wide spectrum of
economic and social issues, including economic effects of the European integration process,
economic relations between the EU and CIS, monetary policy and euro-accession,
innovation and competitiveness, and labour markets and social policy. The network aims to
increase the range and quality of economic research and information available to policy-
makers and civil society, and takes an active role in on-going debates on how to meet the
economic challenges facing the EU, post-transition countries and the global economy.
The CASE Network consists of:
• CASE – Center for Social and Economic Research, Warsaw, est. 1991,
www.case-research.eu
• CASE – Center for Social and Economic Research – Kyrgyzstan, est. 1998,
www.case.elcat.kg
• Center for Social and Economic Research - CASE Ukraine, est. 1999,
www.case-ukraine.kiev.ua
• CASE –Transcaucasus Center for Social and Economic Research, est. 2000,
www.case-transcaucasus.org.ge
• Foundation for Social and Economic Research CASE Moldova, est. 2003,
www.case.com.md
• CASE Belarus - Center for Social and Economic Research Belarus, est. 2007.
CASE Network Studies & Analyses No.399 - Agriculture income assessment for the purpose…
3
CONTENTS
INTRODUCTION......................................................................................................................7 CHAPTER 1. DATA SOURCES AND METHODS .................................................................9
1.1. Data sources ...........................................................................................................9 1.2. Methodology .........................................................................................................11
CHAPTER 2. MEANS TESTING METHODS – BACKGROUND .........................................13 2.1. Methods of targeting social assistance..............................................................13 2.2. Targeting outcomes: an overview.......................................................................17 2.3. Targeting by proxy means testing: international experience...........................20
CHAPTER 3. CURRENT SYSTEM OF AGRICULTURE INCOME ASSESSMENT IN UKRAINE ............................................................................................................22
3.1. Description of the system....................................................................................26 3.2. Diagnosis of improprieties ..................................................................................27
CHAPTER 4. REVIEW OF INTERNATIONAL PRACTISE ..................................................29 4.1. Moldova .................................................................................................................31 4.2. Kazakhstan............................................................................................................32 4.3. Kyrgyzstan ............................................................................................................34 4.4. Russia....................................................................................................................35 4.5. Poland....................................................................................................................36
CHAPTER 5. CONCLUSIONS .............................................................................................39 5.1. Targeting by proxy means testing in Ukraine – advantages and prerequisites
...............................................................................................................................39 5.2. Agriculture income assessment – an analysis of the usefulness of other
countries’ practices for Ukraine .........................................................................41 CHAPTER 6. RECOMMENDATIONS FOR UKRAINE ........................................................44
6.1. General suggestions ............................................................................................45 6.2. Detailed recommendations..................................................................................46
6.2.1. Long-term solutions .....................................................................................46 6.2.2. Short-term solutions ....................................................................................48 6.2.3. Minimum solutions .......................................................................................48
REFERENCES.......................................................................................................................50 LIST OF TABLES ..................................................................................................................54 LIST OF FIGURES.................................................................................................................54

CASE Network Studies & Analyses No.399 - Agriculture income assessment for the purpose…
4
Annex A. Distribution of Targeting Methods by Region, Country Income Level, and Program Type.....................................................................................................55
Annex B. Selected aspects of current methods of social assistance targeting in Ukraine................................................................................................................56
Annex C. Review of agriculture income assessment practices in 5 countries compared to Ukraine. ........................................................................................58
Annex D. Recommended methodologies for estimating agriculture income normatives..........................................................................................................61

CASE Network Studies & Analyses No.399 - Agriculture income assessment for the purpose…
5
Dmytro Boyarchuk has been an executive director of CASE Ukraine since October 2006.
His main areas of interest are labor economics, social policy and fiscal sector. He obtained
his Master Degree in 2003 at EERC Master's Program in Economics at the National
University of "Kyiv-Mohyla Academy".
Liudmyla Kotusenko has been working as a consultant at CASE Ukraine since February
2009. Her main areas of interest are social policy, incomes, consumption, labor market and
agriculture. Liudmyla holds an MA degree in Environmental Sciences from the University of
Kyiv-Mohyla Academy.
Katarzyna Piętka-Kosińska has been an economist at CASE in Warsaw since 1994. She
specialises in macroeconomic forecasting, an analysis of social policy issues, sectoral
studies. She has been cooperating with the Polish government, advising the Ukrainian
government, cooperating with the World Bank. Katarzyna holds MA degree in Economics
from Warsaw University (Economic Department).
Roman Semko has been working as an econometrician at CASE Ukraine since August
2009. He concentrates on economic and social modeling. Mr. Semko received his MA from
the National University of Kyiv-Mohyla Academy and Kyiv School of Economics.
Irina Sinitsina, Ph.D., is a leading researcher at the Institute of Economics, Russian
Academy of Sciences (Moscow, Russia) and CASE's permanent representative in Russia, as
well as a member of the Board of Directors of CASE - Transcaucasus in Tbilisi, Georgia. She
specializes in the analysis of social policy, including social security systems, social services,
labour market, income and employment policies in Russia, Poland, Georgia, Ukraine and
other FSU and CEE countries. She has also carried out extensive comparative
macroeconomic studies of the economies in transition in these countries. Irina has
participated in many international advisory projects on fiscal and social policy in Georgia and
Ukraine. Since 1992, she has advised Russian ministries, governmental agencies, and the
Central Bank of the Russian Federation on various social and employment policy issues
CASE Network Studies & Analyses No.399 - Agriculture income assessment for the purpose…
6
Abstract Ukraine belongs to the group of countries which are known for the widespread phenomenon
of subsistence and semi-subsistence farming. Individual farmers are not obliged to produce
financial reports and their incomes belong to the category of unobservable incomes. When
checking the eligibility for social assistance the level of their incomes needs to be estimated.
In a country, where poverty rate is quite high, the coverage of the poor with financial aid is
relatively low and public finances under constant control, the importance of a fair and justified
methodology for income imputation is particularly strong. In this situation, an outdated and
unfair current system of agriculture income estimation in Ukraine calls for immediate
changes. This paper presents recommendations for the Ukrainian government in the area of
agriculture income imputation, where several methods of estimating farm income were
proposed (including the one based on Household Budget Survey). The recommendations
were preceded with the analysis of five countries’ practices in this area: Kazakhstan,
Kyrgyzstan, Moldova, Russia, and Poland. A review of different means testing methods,
including direct means testing and proxy means testing, served as an introduction to the
topic.

CASE Network Studies & Analyses No.399 - Agriculture income assessment for the purpose…
7
INTRODUCTION
According to the World Bank classification,1 Ukraine is a lower-middle income country
characterized by high income concentration2. The poverty rate remains stable at 27%.3 At the
same time, poverty targeting continues to be rather weak. The recipients of the two main
schemes of cash social assistance (support for low-income families and housing subsidies)
each account for only 2.3% of the population. The eligibility for social assistance is quite
tightfisted, in response to the strict fiscal measures Ukraine has faced since the beginning of
independent macroeconomic policy. Budgetary restrictions and the domination of pensions in
the welfare system, as in many post socialist economies, has left few resources for targeted
social assistance. In addition, the high share of informal incomes does not support the
enlargement of the social assistance coverage.
Ukraine belongs to the group of countries which are known for the widespread phenomenon
of subsistence and semi-subsistence farming. Almost 60% of Ukrainians have landplots at
their disposal and use the land for harvesting (either for sales or for private consumption).
The popularity of agro-activity among individuals stems mainly from the low incomes of
Ukrainians rather than cultural specifics (as is often believed).
This report presents the main results of the research conducted within the project “Social
reform in a country with high role of unobservable incomes: improving social assistance
mechanisms in Ukraine” realised by the Center for Social and Economic Research CASE-
Ukraine and its mother-organisation CASE – Center for Social and Economic Research
located in Warsaw and co-financed by the 2009 aid program of the Ministry of Foreign Affairs
of the Republic of Poland. The aim of the project was to diagnose the system of means
testing in Ukraine and provide the Ukrainian government with recommendations concerning
the necessary and feasible changes. During the first stage of the project, an overview of
different methods of testing the eligibility for social assistance was undertaken (presented in
Chapter 2), including methods of unverified means testing and proxy means testing aimed at
estimating income from sources not covered by official registries. Further research
concentrated on the Ukrainian system of estimating the income from agriculture of individual
farmers (Chapter 3). We found the system to be outdated, inconsistent and inappropriate to
the real needs of impoverished groups of farmers. A review of international experiences on
1 6,400 USD PPP per capita in 2009, ranked 128th in 2009 CIA ranking, compared with e.g. Poland: 17,800 USD PPP per capita, ranked 69th. out of 228 countries 2 Gini at 29.73 in 2006 acc. to Boyarchuk et al. (2008) 3 at the poverty line of guaranteed minimum; the latest available data by the Ministry of Labour and Social Policy.
CASE Network Studies & Analyses No.399 - Agriculture income assessment for the purpose…
8
agriculture income assessment (presented in Chapter 4) provided examples of five countries’
practices. The analysis of the usefulness of different solutions for Ukraine is presented in
Chapter 5. Finally, based on the diagnosis of the Ukrainian system and a review of
international practices, we have formulated recommendations for the Ukrainian government
in the area of estimating the income from agriculture for individual farmers. The general
recommendations are followed by detailed suggestions in three variants: long-term changes,
that would require the development of a comprehensive database on individual farms, short-
term solutions, that is until the problem with data scarcity is solved, and short-term,
immediate changes that describe the minimum adjustments which need to be made to the
system in order to unify it, thus ensuring fairly equal access to social assistance and
responding to the widespread situation of impossible land usage (Chapter 6).
Presently, the responsibility for formulating methods of agricultural income estimation is
diluted and has been ceded to local governments. The Ministry of Labour and Social Policy
has practically no control over the system nor does it have complete knowledge of its
elements. The formulation of these recommendations has been met with great interest on the
part of MLSP officials with the hope that it will enhance the reform of the farming income
assessment.

CASE Network Studies & Analyses No.399 - Agriculture income assessment for the purpose…
9
Dmytro Boyarchuk, Katarzyna Piętka-Kosińska
CHAPTER 1. DATA SOURCES AND METHODS 1.1. Data sources
The quality of information available about any phenomenon gives an answer to the question
about what is really happening behind the numbers that can be observed and analyzed. For
the purpose of income imputation for farm-operating households, this statement is especially
topical given that imputed income affects the wellbeing of subsistence and semi-subsistence
farm households which by definition live in poverty, if they do not have alternative incomes.
The information used for describing the agriculture system in Ukraine as well as in the
countries selected for the review was drawn from publications of the central statistical offices
(Statistical Yearbooks, Statistical Yearbooks of Agriculture) as well as the FAO (Food and
Agriculture Organization).
The description of the system of farming income estimation was based on the official
documents of the selected countries, including legal acts and decrees of relevant ministries.
In the process of preparing normatives for the farming income assessment, we studied
databases covering the incomes and costs of agro-enterprises as well as those of individual
farmers.
Data on agriculture in developed countries and the CIS region
The main source of information about agriculture performance is the database on agro-
enterprises activities. In European countries this information is collected through farm
accounts surveys. However these datasets do not cover individual farms as they are not
obliged to produce financial reports. In some countries like Denmark, the Netherlands and
United Kingdom, accountancy in agriculture is universal. At the same time in other EU
members, the percentage of farms with accountancy was much lower – 1% of all farms in
Greece (2000) and 5% in Austria (2000). The sampling for the survey covers mainly large
“commercial” agro-producers (in 2000 only 31% of agro-producers kept accountancy) which
means that this datasource is only able to offer a realistic representation of big farms.
A similar approach is exercised in the CIS region (especially when discussing Russia and
Ukraine), however, in the CIS region this ‘survey’ is conducted in the form of obligatory
reporting. All legal entities (large and medium agro-companies) report on their performance
(sown area, productivity, livestock etc.) on a monthly basis. The collected data on large and
medium agro-companies is usually used as a basis for the extrapolation of performance on

CASE Network Studies & Analyses No.399 - Agriculture income assessment for the purpose…
10
small agro-companies (which report on a yearly basis) and farm households. The collected,
highly detailed information about livestock, land usage and the harvesting of farm
households does not offer full answers about income flows. We have tried to use the
aggregated data on Ukrainian agro enterprises4 to develop normatives for individual farm
income estimation (mentioned in Annex D), however, due to the obvious differences between
the functioning of subsistence farms and agro enterprises, the outcomes have been far from
satisfactory.
Some literature indicates that tax records could also provide information on incomes.
However, this source can not be used for CIS countries because, on the one hand tax
information is confidential and its distribution is strictly prohibited, on the other hand, the
shadow economy is much bigger than in developed countries. Most importantly, however,
the incomes of small farms in the CIS region are not subject to taxation.
Another datasource referring to the agricultural activity of individual farmers is the household
budget survey (HBS) which is available in both developed and transition countries. There are
questions in the questionnaire that refer not only to incomes from selling agriculture products
(on the income side) but also to using them for household purposes or purchases of
agriculture inputs (on the expenditure side). However, the information is too general to
estimate net incomes from agricultural activities very precisely. European countries are
covered by the EU-SILC survey that concentrates mainly on the income side. This is not
surprising as semi-subsistence or subsistence farms are not a phenomenon in those
countries, where farmers account for only a small share of the population (3.2% of EU15
population in 2007).
In order to cover farmers with a more representative survey, European countries developed
FADN (Farm Accountancy Data Network), which was formally initiated in the mid-60s.
Collected data allowed for the calculating of the average Standard Gross Margin (SGM) for
each type of selected agriculture activity; SGM is defined as a surplus of the 3-year average
value of production over the 3-year average direct costs. The SGM indicators, often
differentiated across regions, are applied to the size of land used for each kind of production
of a given farmer. The positive aspect is that SGM indicators reflect the real (micro) situation
of surveyed farms (unlike normatives calculated based on the macro data). The Ukrainian
Statistical Office undertakes a representative survey among farmsteads covering nearly 29
thousand cases (called "Sample survey for households in rural areas"), however, the
4 Published in several sources: yearly Statistical Bulletin "Harvesting Agricultural Crops, Fruit, Berries and Grapes in Region of Ukraine in 2008", Statistical Bulletin "Sale of Agricultural Produce by Enterprises in 2008," Statistical Bulletin "Major economic indicators of agriculture production in agriculture enterprises in 2008", Statistical Bulletin "Animal Husbandry in Ukraine".
CASE Network Studies & Analyses No.399 - Agriculture income assessment for the purpose…
11
information on farming income is only partial and the information on costs is lacking so the
survey does not allow for providing estimates of net income in such farms.
Among the four types of databases described (agro-enterprise statistics, tax records, HBS,
FADN), HBS remains the most valuable database in CIS countries for studying and
analyzing the phenomenon of subsistence farming, including in the context of income
imputation. In contrast to developed countries, HBS in CIS countries offers a good sample of
farm-operating households (57.6% in Ukrainian HBS 2008). Ukrainian HBS for 2008 served
as a source of data for developing normatives for income estimation of farming households in
the variant of short-term solutions (presented in Annex D).
1.2. Methodology We can distinguish two stages of research undertaken within the project. The first stage
concentrated on studying targeting methods for the purpose of social assistance and
reviewing international experience in terms of estimating incomes of individual farmers. This
stage also included researching the current system of agricultural income estimation in
Ukraine and diagnosing problems related to the number of poor covered under the social
assistance policy and how the policy is carried out. The activities in the second stage of the
project were devoted to formulating recommendations for the Ukrainian government in the
area of better farming income estimation, including the development of techniques for setting
the income normatives.
The review of literature on targeting methods, especially in the area of modern schemes, was
largely based on the most recently available case studies of new methods implemented by
different countries. There is very little literature on international practices in estimating
farming income. The analysis relied on the scarce materials available, including
governmental (central and local) documents (mainly in Russia, Moldova, Kyrgizstan,
Kazakhstan, Poland, Australia, and the United Kingdom), news services (e.g. Euroasia) or
legal networks (such as bestpravo in Russia). The diagnosis of the current system of farming
income estimation required, among other things, approaching local welfare offices in order to
get information on the normatives being used in their oblasts (and rayons, if applicable)
because a unified system of regional normatives does not exist. This part of the research
was supported by field research in 2 welfare offices (in the rayon of Koriukivka in
Chernigivska oblast of Ukraine and Bashtanka in Mykolayivska oblast) as well as
consultations with the Ministry of Labour and Social Policy, Department of Social Assistance.
CASE Network Studies & Analyses No.399 - Agriculture income assessment for the purpose…
12
In the process of developing recommendations, two methods of calculating normatives for
farming income estimation were formulated and tested. The first method used 2008 data
from agriculture enterprises on yields, sowing areas, average annual gains of the live weight
of different types of livestock and average milk yields, the selling prices of agricultural
products, and the costs of crop and livestock production (adjusted for labour costs) in order
to calculate the average net income (defined as sales revenues minus costs of production) in
2008 from crop production on 1 ha of land and the average net income from raising livestock
(cows, other cattles, pigs and poultry). The normatives were differentiated across regions
(oblasts). The weak point of this method is that it uses data for agro enterprises that operate
in quite a different economic reality than farming households. The recommendations at the
end of this document address this issue.
The second method of calculating normatives used data from HBS 2008. Based on
information about the revenues and costs of crop production of each farming household, as
well as agro products used for own consumption, the average net income per 1 hectare of
land (defined as sales revenues plus consumption of own production minus costs of
production) was calculated. The income from animal production per head of a given animal
kind/poultry is based on a regression analysis employing regression without a constant for all
households having livestock. The estimated coefficient represents the relationship between
net income from the production of any livestock kind (defined as sales revenues plus
consumption of own livestock production minus costs of livestock production). The number of
heads of a given livestock kind is a regressed coefficient. The coefficients for both crop and
livestock production have been set for cities and rural areas separately in order to account
for the factor of distance to the markets. The results of the second method seem to reflect
the reality on the ground much better than the first method. The drawback of this
methodology is the fact that it relies on datasets that are not precise enough nor highly
representative of farming households because HBS is not constructed to closely reflect the
agro activities of the surveyed population.
CASE Network Studies & Analyses No.399 - Agriculture income assessment for the purpose…
13
Irina Sinitsina
CHAPTER 2. MEANS TESTING METHODS – BACKGROUND
2.1. Methods of targeting social assistance
The existing literature on social benefits targeting is extensive. It is, however, mostly
represented by descriptions of individual programs as well as comparative analyses covering
a single region (e.g., Grosh 1994 and Lindert, Skoufias and Shapiro 2006 for Latin America
and the Caribbean; Castañeda and Lindert 2005 for the United States and Latin America;
Braithwaite, Grootaert, and Milanovic 2000 and Grosh et al. 2008 for Eastern Europe and
Central Asia) or method (Bigman and FoFack 2000 on geographic targeting, Henninger and
Snel 2002 on poverty mapping, Conning and Kevane 2001 on community-based targeting,
and Subbarao 2003 on self-targeting) or intervention (Rawlings, Sherburne-Benz, and van
Domelen 2003 on social funds). Works providing a general overview of experiences and
addressing lessons learned with methods used to target interventions are very scarce and
started to appear only recently (e.g. Coady, Grosh and Hoddinott 2004, Grosh et al. 2008,
Fiszbein and Schady 2009).
Targeting is a relevant subsidy factor for improving the allocation of resources so that they
can be more beneficial to the target group (Wodon & Angel-Urdinola, 2008). Targeting can
increase the benefits that the poor can realize within a given budget (maximizing impact) or
can achieve a given impact at the lowest budgetary cost (minimizing cost). Targeting is an
attractive option for many kinds of poverty reduction programs. Grosh et al. (2008) have
demonstrated that the theoretical gain from targeting can appear to be large. In practice,
however, the full theoretical gain is not realized, because targeting is never completely
accurate and always associated with costs. These costs include administrative costs borne
by the program, transaction and social costs borne by program applicants, incentive costs
that may affect the overall benefit to society, and political costs that may affect support for
the program.
As opposed to the universalist approach (in which all citizens of a nation receive the same
state-provided benefits), targeting proposes that state-provided benefits differ depending on
individual circumstances. In reality, the distinction between the two approaches is not
absolute. Even the European welfare states that have gone the furthest in terms of universal
provision of child allowances, education, and health insurance and have extensive minimum
wage laws, labour market activation and the like, have last resort needs-based programs that
CASE Network Studies & Analyses No.399 - Agriculture income assessment for the purpose…
14
are tightly targeted. Thus even though they may choose wider or narrower ranges of
programs to target or different mixes of programs, all countries use targeting in their social
assistance programs to some extent (Grosh et al. 2008).
In a recent World Bank review of ‘conditional cash transfers’ (CCT)5 across the globe,
Fiszbein and Schady (2009) found that almost all CCT programs established to date have
tried to target their benefits rather narrowly to the poor.6 At the same time, while targeting has
obvious benefits in terms of combating poverty, a comprehensive World Bank study
concludes that targeting is neither a panacea nor an impossible feat; rather it is a useful but
always limited tool (Coady, Grosh and Hoddinott 2004).
Numerous methods have been employed for directing resources to a particular group. The
vast literature on targeting problems suggests the following menu of options of the methods
used so far: individual/household assessment (means-testing and/or proxy-means testing,
community-based); categorical (geographic or demographic); self-selection.
− Individual/household assessment:
(1) The means testing method is usually regarded as the ‘gold standard’ of targeting. Income
and assets are measured directly, and individuals or families below a certain threshold
are eligible for benefits. As a rule, the information collected is verified against
independent sources. It has three main variants: (1) third-party verification of income, (2)
documents to verify income or related welfare indicators provided by the applicant, and/or
(3) a simple interview aimed at collecting information. However, simple means tests with
no independent verification of income (or no verification at all) are not uncommon (Grosh
et al. 2008). Means testing is widely used in the US, the OECD, FSU and some Latin
American countries. Means testing can be extremely accurate. However, the main
problem with this method (leaving aside the problem of whose income to count and what
types of income should be included) is that it is very administratively demanding,
especially when combined with meaningful attempts at verification, requiring accurate
records on income, home visits, etc. In countries with no agriculture income reporting, an
additional effort is associated with estimating and applying indicators on land size or
livestock to get the proxy for agriculture income. On the other hand, this method does not
allow for the consideration of non-formal income. This method may also induce work
disincentives when earnings exceed threshold limits. Means testing is regarded as the
5 Conditional cash transfers are programs that transfer cash, generally to poor households, on the condition that those households make prespecified investments in the human capital of their children. 6 Of the approximately 40 CCT programs reviewed in the World Bank report, to date, only Bolivia’s Juancito Pinto program is targeted broadly to all first-graders in public schools.
CASE Network Studies & Analyses No.399 - Agriculture income assessment for the purpose…
15
most appropriate where declared income is verifiable or where some forms of self-
selection limit non-target groups in applying for benefits, where administrative capacity is
high, and/or where benefit levels are large enough to justify the costs of administering a
means test.
(2) Proxy means testing (PMT) is a synthetic measure correlated with income calculated as a
“score” for each household based on easily observable characteristics. The indicators
used to calculate this score and their weights are derived from statistical analyses of data
from detailed household surveys (Coady, Grosh & Hoddinott 2004). Eligibility is
determined by comparing the score against a predetermined cutoff. This method is
becoming increasingly popular in Latin America, Armenia, Russia, Turkey, Indonesia and
other countries (Subbarao 2009). It is also administratively demanding and needs
representative household surveys. On the other hand, the indicators used tend to be
static and focus on the long-term poor (not transient poor). PMT is most appropriate
when a country has a relatively high administrative capacity, when programs mean to
address chronic poverty in stable situations, and when they are used to target a single
program with large benefits. (see more in Chapter 2.3)
(3) Community-based targeting exploits an existing local actor (teacher, nurse, religious
leader), or a group of community members or leaders, whose principal functions in the
community are not related to the transfer program, or a newly established civic committee
which determines eligibility for benefits. The advantage of community-based targeting is
that it relies on local information on individual circumstances, which may be more
accurate and less costly to collect than using other methods. In addition, it can permit
local definitions of needs and welfare; in addition, targeting decisions may be based on a
wide range of factors beyond poverty. This method may be relatively cheaper as it
transfers the costs of identifying beneficiaries from intervention to community (although
this can also be seen as a limitation). On the other hand, this method of targeting may
generate conflict within a community or capture by local elites may become possible.
Also such a system may continue or exacerbate any existing patterns of social exclusion.
While generally providing less accurate targeting in terms of household income compared
to other methods, communities tend to use a different concept of poverty: the results of
community-based methods are more dependent on how individual community members
rank each other and on their self-assessments of their own status. When local definitions
of welfare are used, it may create the risk of more difficult and ambiguous evaluations.
However, for the same reason, community-based methods generally result in higher
levels of satisfaction with beneficiary lists and the targeting process (Alatas et al. 2009).
The most appropriate circumstances for applying this method exist where local
CASE Network Studies & Analyses No.399 - Agriculture income assessment for the purpose…
16
communities are clearly defined and cohesive and where programs to be implemented
propose to include a small portion of the population. It can also be useful in situations
where temporary or low benefit programs cannot support an administrative structure of
their own.
− Categorical targeting:
Under categorical targeting, receipt of a benefit or service is based on belonging to a
particular category or group based on location of residence (geographic targeting), age
and/or sex (demographic targeting), disability, unemployment status, or ethnicity. This
method is also referred to as statistical targeting, or group targeting.
(1) Under geographic targeting, benefits or services are provided to those located in a
particular region. Few programs target exclusively on the basis of geography, but
many programs use geographic targeting in conjunction with other targeting methods
(often PMT), especially when programs are not fully funded (such as Colombia’s
Familias en Acción program or the Oportunidades program in Mexico). The
geographic method produces noticeably better results if poverty is regionally
concentrated (Ghana, Kenya) (Subbarao 2009). In such cases poverty maps are
usually used to focus the program in only some areas of the country or to allocate
spaces in the program among subnational jurisdictions. The efficiency of the method
increases with reducing the size of the geographic units, which is usually achieved by
increasing the accuracy of poverty maps, a concern that is diminishing in importance
as small area estimation techniques improve and are more widely applied. The
advantage of geographic targeting is that it is administratively simple, and it is more
appropriately used in countries with limited administrative capacity, where living
standards across regions vary significantly (see more in Bigman and FoFack (2000)).
It helps if the delivery of the intervention uses a fixed site such as a school, clinic, or
ration shop. This method is unlikely to create stigma effects or labour disincentives
although it can be politically controversial.
(2) Child allowances and social pensions are the most common types of demographic
targeting. Apart from being fairly simple in administration, this method carries the
appeal of universality, and is thus often politically popular. It does not stigmatize
beneficiaries. The major limitation of categorical targeting is that age/sex may be only
weakly correlated with poverty (Grosh et al. 2008). Thus the targeting may not always
reach the poorest, as target categories do not necessarily contain many poor. Current
research suggests that the observed correlations are sensitive to assumptions made
about household scale economies and adult equivalences. This method is most
CASE Network Studies & Analyses No.399 - Agriculture income assessment for the purpose…
17
appropriate where registration of vital statistics or other demographic characteristics
is extensive as well as where a low-cost targeting method is required.
− Self-selection targeting:
In self-selection targeting, benefits or services are technically open to everyone, but
designed so that only the poor will choose it, or the level of benefits is expected to be higher
amongst the poor. There is no external targeting mechanism other than free choice. One of
the most common applications of self-targeting in social assistance is the use of low wages
in public works programs to induce participation only by the poor. It is rather unlikely to
induce labour disincentives. The administrative costs of such targeting are quite low,
although administering public works programs is not simple (Grosh et al. 2008). On the other
hand, the limitation of this method is its imposition of costs, which can be substantial, onto
the recipients, which lowers the net value of the benefit. Also, the stigma of recipients under
this method may be considerable. The other common application of self-targeting is the use
of in-kind benefits with ‘inferior’ characteristics clearly separating the poor from the non-poor
(e.g., low quality wheat or rice). Universal staple food subsidies can also be viewed as a form
of self-selection since these foods are more heavily consumed by the poor than by the
nonpoor (Coady, Grosh & Hoddinott 2004). 7 This method may be especially useful in
situations where individuals are rapidly moving in and out of poverty.
2.2. Targeting outcomes: an overview
In their comprehensive study of targeting mechanisms, based on information for 122
antipoverty interventions drawn from 48 countries, Coady, Grosh and Hoddinott (2004) found
out that although cash transfer programs account for a large proportion (40 percent) of
interventions, the other intervention types are also well represented (Annex A, Table A-1). In
some regions, a particular intervention type dominates: e.g. cash transfers are prevalent in
Eastern Europe and FSU, universal food subsidies prevail in the Middle East and North
Africa, and near-cash transfers8 in South and South-East Asia. By contrast, there is a wider
mix of reported interventions in other regions. Most of the cash transfer programs occur in
Latin America, the Caribbean and Eastern Europe/FSU. Most of the near-cash transfer
programs occur in South Asia, most of the universal food subsidies in the Middle East, and
7 For more details on public works, reviews, design, features, and experiences pertaining to self-targeting through wage selection see Subbarao (2003) and Alderman’s (2002) papers on food subsidies. The paper reviews self-selection through the choice of commodities. 8 Near cash transfers include food stamps, coupons, or vouchers that may be used by households to purchase food at authorized retail locations, or the right to purchase a limited quantity of food at a subsidized price.

CASE Network Studies & Analyses No.399 - Agriculture income assessment for the purpose…
18
most of the social funds9 in Latin America. Dividing the sample by per capita GDP levels, we
find that cash transfer programs are more likely to be found in less poor countries and near-
cash transfers in the poorest countries. Most social assistance programs tend to use different
combinations of targeting mechanisms. Across the 2004 sample, 253 occurrences of
different targeting methods could be observed, so that each intervention in the sample used
just over two different targeting methods on average.
In a recent World Bank review of CCT programs, Fiszbein and Schady (2009) estimated that
almost two thirds of countries used geographic targeting; about two thirds used household
targeting, mostly via proxy means testing; and many countries used both. Moreover, many
programs used community-based targeting or community vetting of eligibility lists to increase
transparency.
There are some marked differences in the area of distribution of targeting methods by region,
e.g. according to Coady et al. (2004), most of the interventions using categorical targeting
(especially by age) are concentrated in Latin America, Asia and Eastern Europe/FSU. There
are also broad differences across income levels. Generally, poorer countries tend to rely
more on self-selection methods and categorical targeting, whereas forms of individual
assessment are relatively more common in less poor countries. The important exception to
these general patterns is categorical targeting by age, which is used relatively less frequently
in poor countries.
At the same time, targeting performance across countries varies greatly. While median
performance in the 2004 sample was good, in approximately 25 percent of cases targeting
was regressive, meaning that a random allocation of resources would have provided a
greater share of benefits to the poor. Coady et al. (2004) provided a weak ranking of
outcomes achieved by different targeting mechanisms, assessing which methods delivered
the best results in relation to errors of inclusion. The ranking demonstrated that these
differences could be partly explained by variations in country characteristics:
• Countries with better capacity for program implementation, as measured by GDP per
capita, do better at directing benefits towards poorer members of the population.
• Countries where governments are more likely to be held accountable for their
behaviour appear to implement interventions with improved targeting performance.
9 Social funds are multi-sectoral programs that provide financing (usually grants) for small-scale public investments targeted at meeting the needs of the poor and vulnerable communities and at contributing to social capital and development at the local level (Grosh et al. 2008).
CASE Network Studies & Analyses No.399 - Agriculture income assessment for the purpose…
19
• Countries where inequality is more pronounced and presumably differences in
economic well-being are easier to identify also demonstrate better targeting
outcomes.
Thus, targeting performance generally improves along with countries’ income level (the proxy
for implementation capacity), the extent to which the government is held accountable for its
actions, and the degree of inequality.
Differences in targeting performance also reflect the choice of targeting method.
Interventions that use means testing, geographic targeting, and self-selection based on a
work requirement are all associated with a relatively high share of benefits going to the
bottom two quintiles. Proxy means testing10, community-based selection of individuals, and
demographic targeting to children show good results on average but with considerable
variation. Demographic targeting to the elderly, community bidding, and self-selection based
on consumption demonstrated limited potential for good targeting. However, Coady et al.
(2004) estimated that in the sample of programs they looked at, only 20 percent was due to
differences across methods; the remaining 80 percent of the variability in targeting
performance was due to differences within targeting methods.
Thus, international experience evidently demonstrates that there is no clearly preferable
method for all types of programs or all country contexts. In reviewing a menu of targeting
options, policy makers should be mindful of two important considerations. First, individual
targeting methods are not mutually exclusive and can be used in different combinations and
sequences. A child allowance (categorical targeting) may be means- (or proxy means-)
tested (individual assessment). Subsidized coarse grain (self-targeting) may be available for
sale only in food shops in poor neighbourhoods (geographic targeting). In fact, experience
shows that using more targeting methods generally produced better targeting. Second,
country context could explain some, but by no means all, of the variability in targeting
performance. Unobserved factors explained many of the differences in targeting success.
Improvements in the design and implementation of targeting methods thus have great
potential. Grosh et al. (2008) estimated that if programs with poor targeting success were
brought up to the median level of success, the share of program benefits going to the poor
would increase by 10 percentage points.
10 When Coady et al. (2004) undertook their study, outcome data were only available for a few of the new proxy means tests. Since then data have become available for several more programs, all of which are quite well targeted. If these measurements had been part of the original study, proxy means tests would likely have joined the ranks of the methods that reliably produce progressive results (Grosh et al. 2008).

CASE Network Studies & Analyses No.399 - Agriculture income assessment for the purpose…
20
Most of the available literature confirms that implementation matters tremendously to
outcomes. Two important crosscutting themes emerge from literature on the subject:
• increased creativity, diligence, and/or administrative budget are usually able to
reduce errors of exclusion (that is exclusion of the poor) in the majority of the
targeting programs. Targeting incidence (errors of inclusion, that is, including the non-
eligible) outcomes are, however, more dependent on the choice of targeting
mechanisms compared to targeting performance in terms of coverage;
• improved administration — streamlined procedures, better manuals, more training,
more attention to quality control, adequate staff and equipment — often appear to be
justified. In a significant number of cases, there appear to be unexploited economies
of scale because a single program is small and/or because structures could be but
are not shared over several programs (Coady et al. 2004).
2.3. Targeting by proxy means testing: international experience
The term "proxy means test" (PMT) is used to describe a situation where information on
household or individual characteristics correlated with welfare levels is used in a formal
algorithm to proxy household income, welfare or need. Given the administrative difficulties
associated with sophisticated means tests and the inaccuracy of simple means tests, the
idea of using other household characteristics as proxies for income is appealing (Grosh and
Baker 1995). PMTs use fairly easy-to-observe household characteristics, such as the
location and quality of the household’s dwelling, ownership of durable goods, demographic
structure, education and possibly the occupations of its adult members, as well as some
other indicators (state of health, disability, etc., or potential indicators belonging to certain
poverty dimensions), to proxy a means test, thus avoiding the problems involved in relying on
reported income. PMT is used in order to overcome the difficulties associated with collecting
and verifying detailed information on household income or consumption levels in many
developing countries (Coady et al. 2004). The results of PMT application demonstrate that
household characteristics can reliably serve as reasonable proxies for information on income
in assessing eligibility for social programs.
The first step in designing a proxy means test is to select a few variables that are well
correlated with poverty and have three characteristics: their number is small enough to
enable application of the proxy means test to a significant share of the program applicants,
they are easy to measure or observe, it is difficult for the household to manipulate them. The
CASE Network Studies & Analyses No.399 - Agriculture income assessment for the purpose…
21
number of variables used varies from about ten to as high as forty, but usually is in the order
of two dozen. The variables used are typically drawn from the data sets of detailed
household surveys of a given country. PMTs use household characteristics in order to
calculate a score that indicates the household’s economic welfare. This score is used to
determine eligibility for the receipt of program benefits and possibly also the level of benefits.
Once the variables have been chosen, statistical methods are used to associate a weight
with each variable. The indicators used to calculate the score and their weights are derived
from a statistical analysis (usually a regression analysis or principal components analysis) of
data from detailed household surveys. The total income or consumption of the household is
regressed on the selected variables. Eligibility is determined by comparing the household’s
score against a predetermined cut-off (threshold). Often these regressions are run separately
by region so that variable weights differ across regions. A well-instituted proxy means test
should guarantee “horizontal” equity, i.e. that the same or similar households (at least in
terms of the variables chosen) will receive the same treatment.
PMTs have several advantages that make it a promising and feasible alternative to unverified
means testing (UMT) and verified means testing (VMT) for household targeting systems
(Castañeda and Lindert 2005; Coady et al. 2004):
• Targeting Accuracy: targeting outcomes of PMT are nearly as accurate as VMT and, in
some cases, are more accurate than UMT.
• Cost Efficiency: the financial costs of administering PMT are far cheaper than VMT and in
line with those for UMT: it requires less information than true means testing, and yet it is
objective.
• Political Appeal: The use of multi-dimensional indices to determine eligibility for programs
can be more politically appealing than the more narrow reliance on incomes since, in
many developing and middle-income countries, public opinion commonly holds that
poverty is multi-dimensional and spans more than just “income.”
• Transparency: The use of multiple observable variables for PMT is more transparent and
verifiable than reliance on self-reported income, as in UMT. Moreover, because it does
not actually measure income, PMT may discourage work effort less than a means test
would.
• Administrative Feasibility: administrative requirements are more manageable for
developing countries, particularly middle-income countries, than those for true means
testing.

CASE Network Studies & Analyses No.399 - Agriculture income assessment for the purpose…
22
PMT is a relatively new tool in the targeting toolbox. Chile was the first country to use this
approach when it introduced its Ficha CAS (unified household registry system) program in
1980. Since then, the tool has been monitored and its implementation and use refined over
the years (Larrañaga 2003; Clert and Wodon 2000). The approach has spread elsewhere in
Latin America, however PMT systems are in the early stages of design or implementation in
many countries of the globe. Armenia has used a proxy means test since 1994 for
humanitarian assistance and cash transfers (World Bank 1999, 2003); Indonesia has used
one as well for targeting its subsidized rice rations (Sumarto et al. 2003). Turkey introduced
such a system in 2002 as part of a response to its financial crisis (Ayala 2003), and other
countries have done some piloting without fully setting the PMT systems up – e.g., Russia11,
Egypt (Ahmed and Bouis 2002), Philippines (Reyes 2006), Sri Lanka (Narayan and Yoshida
2002), Cabo Verde (Wodon and Angel-Urdinola 2008) and Uganda (Houssou et al. 2007).
Liudmyla Kotusenko, Katarzyna Piętka-Kosińska
CHAPTER 3. CURRENT SYSTEM OF AGRICULTURE INCOME ASSESSMENT IN UKRAINE Definition of income for the purpose of social assistance
In Ukraine, social assistance benefits are means-tested. Under the law, the right to the
following benefits is determined based on aggregate family income:
‐ Benefits to low-income families;
‐ Subsidies to compensate for costs of housing and utility services and purchase of
liquefied gas, solid and liquid furnace fuel (so-called housing subsidies);
‐ Child benefits to single mothers and nursing aid for children under the age of three;
‐ Care aid (monthly monetary aid to a low-income individual cohabiting with a disabled
person of 1st or 2nd psychiatric disability group who was deemed a person requiring
permanent outside care by a medical consultation commission of a health care
institution).
11 In Russia, pilot programs for social support of poor households were introduced in 1997-98 in the Komi republic, Voronezh and Volgograd oblasts. PMT systems were used in several regions in the Volgograd oblast and in the city of Volgograd (Mintrud Rossii 2001).

CASE Network Studies & Analyses No.399 - Agriculture income assessment for the purpose…
23
The Methodology for calculating the total income of a family12 defines the total income of a
family taken into account when social assistance eligibility is checked; it includes monetary
components and monetary equivalent of in-kind inflows, with some exemptions (see Table B-
1 in Annex B). The monetary equivalent of incomes in kind is based on average (market)
consumer prices in a relevant region. Incomes are presented in gross value. Given the flat
PIT rate in Ukraine (at 15%), this should not cause any unequal treatment of different income
sources.
The level of the majority of incomes can be verified with official documents, which are also
available from tax authorities. At the same time, farming, which is the source of income of the
majority of social assistance claimants,13 is not covered by any register, except for farmers
who are legal entities. Small farmers or land plot users are not obliged to undertake book
keeping so both monetary and in kind incomes from that activity need to be estimated.
Society to be potentially affected by individual farming income estimation
In Ukraine, 32% of the society lives in rural areas and 18% of all workers are involved in
agriculture both officially and unofficially, as well as in private farming (own computations
based on official data for 2008). However, farmsteads refer to an even larger share of
population: according to HBS for 2008, 57% of the population lives on farmsteads that make
use of their land. Farmsteads are almost equally spread between rural and urban areas (54%
and 46% respectively). The income from farmsteads greater than 0.06 hectare is subject to
estimation for the purpose of social assistance. According to HBS, 75% of all farmsteads, or
around 43% of the total population, have land plots that exceed this area in use or
ownership. At the same time, there is a cap on the amount of land which enables one to seek
financial support: owners of land plots greater than 0.6 ha are not eligible for social
assistance.
The agricultural sector accounts for nearly 8% GDP of Ukraine. Farmsteads produce more
than half of total agricultural production, though their role has been steadily decreasing in
recent years. However, the productivity of farmsteads is very low. According to our
calculations based on the official data, farmsteads' net incomes from agricultural activity
amounted to about 5.4% of total disposable incomes of the Ukrainian population in 2008.
According to the numbers from HBS, the pure farming income remains at around 18% of
12 „Approved by the order dated November 15, 2001 of the Ministry of Labor and Social Policy, Ministry of Economy and European Integration, Ministry of Finance, State Statistics Committee, and State Committee on Youth, Sport and Tourism of Ukraine, № 486/202/524/455/3370 13 According to HBS (2007) 80% of beneficiaries have a land plot.

CASE Network Studies & Analyses No.399 - Agriculture income assessment for the purpose…
24
total incomes of farmsteads14. Taking into account the great number of those employed in
the agricultural sector, the productivity of private farms is extremely low. Farmsteads are
mainly family-based workplaces, which means they are characterized by huge hidden
unemployment.
The structure of farmstead land area is varied15 – 50% of rural farmsteads have plots of up to
0.5 ha, over 28% have plots between 0.5 ha and 1.0 ha, and 18% have plots between 1 ha
and 5 ha; only 3.4% of farmsteads have plots greater than 5 ha16. At the same time, yields
are relatively low17. Although, productivity in agriculture generally increases along with the
level of land consolidation, in Ukraine low productivity is not directly associated with the
broken up structure of the land. First of all, in situations where land turnover is practically
impossible, many owners of relatively bigger land plots lack the machinery and resources to
work on their land. Moreover, the crops produced on small plots, such as vegetables and
potatoes, are more profitable compared to grain crops and sunflower produced on bigger
plots. According to HBS, in Ukraine, land productivity is negatively correlated with land size.
An important part of the land owned by farmsteads is payi, i.e. land granted during the land
privatization to previous collective farm workers who accounted for 15% of the total Ukrainian
population. A majority of payi owners (63%) signed lease agreements which, due to
structural and operational reasons, are a source of a very low income, though it differs
significantly depending on the region (on average UAH 139.3/ha per year, according to 2007
data).
Table 1. Agricultural Production in 2008 (in 2005 prices)
Total in Ukraine Businesses (incl. farming economies) Private farms
Mln. UAH
Structure %
Mln. UAH
Structure% Mln. UAH Structur
e %
Share of
private farms
% Total agricultural production 103,977.9 100.0 47,865.4 100.0 56,112.5 100.0 54.0
Plant growing 64,899.1 62.4 32,136.1 67.1 32,763.0 58.4 50.5Cereals 22,397.0 21.5 17,546.4 36.7 4,850.6 8.6 21.7Industrial crops 12,226.1 11,8 107,18.6 22.4 1,507.5 2.7 12.3Potatoes, vegetables, gourds and melons
23,808.5 22.9 1941.1 4.1 21,867.4 39.0 91.8
14 According to HBS (2008) incomes of farmsteads account for 52.5% of total income of the society, and pure farming income stayed at 17.8% of it. 15 Only rural area structure available. 16 For comparison, in Poland where productivity of individual farming is considered to be very low, the land is more consolidated: 30% below 1 ha, 40% 1-5 ha, 30% above 5 ha. 17 Compared with Poland, it is lower by 10% in the case of wheat, nearly 40% in the case of sugar beets, and more than 30% in the case of potatoes.

CASE Network Studies & Analyses No.399 - Agriculture income assessment for the purpose…
25
Total in Ukraine Businesses (incl. farming economies) Private farms
Mln. UAH
Structure %
Mln. UAH
Structure% Mln. UAH Structur
e %
Share of
private farms
% Fruits, small fruits, grapes 3,753.5 3.6 881.9 1.8 2,871.6 5.1 76.5
Forage crops 1,988.3 1.9 616.2 1.3 1,372.1 2.4 69.0Other 725.7 0.7 431.9 0.8 293.8 0.6 40.5
Livestock farming 39,078.8 37.6 15,729.3 32.9 23,349.5 41.6 59.7Meat 20,459.8 19.7 10,683.0 22.3 9,776.8 17.4 47.8Milk 12,470.0 12,0 2,179.9 4.6 10,290.1 18.4 82.5Eggs 4,565.7 4.4 2,585.8 5.4 1,979.9 3.5 43.4Wool 17.1 0.0 4.0 0.0 13.1 0.0 76.6Other 1,566.2 1.5 276.6 0.6 1,289.6 2.3 82.3Source: State Statistics Committee According to the State Statistics Committee data, only 11% of farmstead production in
monetary terms is related to grain and industrial crops, however, 62% of farmstead land is
used for that purpose. Using the remaining 38% of their land, farmsteads receive income
mainly from the production of potatoes and vegetables (39% of output value), milk (18%) and
meat (17%); the remaining 14% comes from the production of fruit, eggs, fodder crops and
other. It is worth noting that the yields for the main crops in farmsteads are only slightly lower
compared to the national average: grain crops by 8%, sugar beet and sunflower seed by 12-
15%, potatoes by 1%, vegetables by 3% lower18. However, in the case of fruit and berries as
well as grapes, yields are far above the national average (by 34% and 78% respectively).
Table 2. Major crop yields, centers/ha
2004 2006 2008
Total Private farms Total Private
farms Total Private farms
Grains 28.3 29.4 24.1 25.6 34.7 31.9 Wheat 31.7 31.1 25.3 25.8 36.7 33.5
Corn 38.6 40.6 37.4 36.0 47.1 39.3 Sugar beet 238.3 227.4 284.7 229.9 354.7 300.0 Sunflower seed 8.9 9.2 13.6 13.3 15.2 13.4 Potatoes 133.4 133.3 133.2 132.8 138.7 137.9 Vegetables 148.7 150.1 171.4 171.6 173.9 169.1 Fruit and berries 58.1 103.8 45.0 69.7 65.0 87.1 Grapes 45.2 133.0 39.7 118.3 58.6 104.2 Source: State Statistics Committee Farmsteads own mainly poultry. On average, each farmstead has 12 poultry heads. Other
kinds of livestock are much less frequent: on average, every group of 10 households will own
6 heads of cattle other than cows, 4 cows, and 6 pigs or hogs. The ownership of livestock in
18 The small difference in potato and vegetable yields is conditional to the fact that private farms produce more than 90 percent of potatoes and vegetables.

CASE Network Studies & Analyses No.399 - Agriculture income assessment for the purpose…
26
smaller farmsteads (up to 0.5 ha) is even more modest: 3 cattle other than cows, 2 cows,
and 3 pigs or hogs per 10 households, and 9 birds in every household on average. Nearly
70% of all farmsteads do not keep pigs/hogs at all; 65% do not have any cows and 64% any
other cattle. Such a situation is, again, the result of the large number of very small
farmsteads.
Table 3. Livestock and poultry, thous. of heads (as of 1 Jan, 2009) Total Private
farms Share of private farms, in %
Cattle, incl.: 5,079.0 3,358.9 66.1 Cows 2,856.3 2,232.0 78.1 Bulls 2,222.7 1,126.9 50.7
Swine 6,526.0 3,795.1 58.2 Sheep and goats, incl. 1,726.9 1,426.8 82.6
Sheep 1,095.7 797.6 72.8 Poultry 177,555.9 89,582.2 50.5 Source: State Statistics Committee At the same time, farmsteads own 83% of sheep and goats and 78% of cows in the country.
Farmsteads own a relatively smaller share of hogs, other cattle and poultry: 58%, 51% and
50% respectively (see Table 3).
The analysis of this data suggests that subsistence farming dominates among farmsteads,
with a concentration of activities around growing potatoes and vegetables as well as poultry
or other livestock (if any) for own purposes.
According to HBS, in 2008 in Ukraine 1.6% of all farmsteads were receiving benefits for low-
income families and 4.3% were receiving subsidies for housing, utilities and fuel. The
seemingly low percentage of households owning land and receiving SA benefits compared to
the wide potential eligibility may reflect on the one hand, low levels of the threshold, and on
the other hand, some data obstacles19. At the same time, however, households owning land
are the main receivers of financial aid: they account for 80% of all beneficiaries of low-
income support; it is 55% in the case of housing and utility subsidies.
3.1. Description of the system
The current system of estimating homestead income is very much regionalized. The income
standards developed in 1998 were differentiated across administrative units (oblasts) and 4
types of land usage (see Table B-2 in Annex B): 19 Families are the recipients of social assistance, however, there is no information in the HBS data set that would allow for distinguishing families within households. Moreover, HBS underestimates the total number of both kinds of benefits by nearly 50%.
CASE Network Studies & Analyses No.399 - Agriculture income assessment for the purpose…
27
• farmstead land and land plots for plant growing purposes;
‐ urban
‐ rural
• land plots for haying purposes;
• land plots for livestock grazing purposes.
In 1999, the standards for payi were set, and were additionally differentiated across rayons.
They have been applied to payi that are not rented or are rented with no rental agreement
signed. If local authorities peg the income from payi to the land monetary value, it is subject
to indexation for consumer price changes if CPI exceeds 10% per year.
Also, a unified one-off indexation to initial normatives for the other four types of land was
enforced. Two years later the Government delegated setting the normatives to oblasts
without defining any rules to ensure a basic unifying mechanism between different regions.
This unconditional delegation of decisions led to the complete lack of coordination of the
indexation process. Authorities of different oblasts introduced one-off indexations of
normatives in different years; some of them have not changed the normatives since 2000.
Moreover, some oblasts have differentiated all of the standards further across rayons20, or
set them at different levels for farmsteads and land used for gardening. In some oblasts, the
standards for the land used for haying or grazing purposes were differentiated across
brackets of milk prices for the oblast, as it was initially supposed; in others the same
standards were used no matter how the milk prices changed.
The system of financing social assistance is highly centralised. The responsibility for social
assistance payments to those entitled to them lies with local administrations; however,
relevant funds are received in full in the form of targeted subventions from the central budget.
Subventions are generally distributed based on requests from local administrations. In this
regard, the existing practice of the local government setting land income normatives has led
to a separation of benefit entitlement oversight from the source of this assistance financing.
3.2. Diagnosis of improprieties
The policy of uncoordinated changes in agriculture income estimation methodology has led
to a situation in which:
• People in farmsteads using the same category of land across different regions are
facing different eligibility criteria for social assistance due to the uncoordinated
20 Rayons are the next administrative units after oblasts.

CASE Network Studies & Analyses No.399 - Agriculture income assessment for the purpose…
28
process of land income normatives setting. As a result, they are not equally treated
by the state without transparent justification. Moreover, the Ministry of Labour and
Social Policy has limited control over social assistance policy: it defines the level of
benefits, however it does not have any control over the income eligibility criteria for
farmstead families;
• The methodology of setting the normatives is not linked to the changing reality (the
level of gross income from farming, costs of farming). As a result, the access to SA
benefits may be unfair in some regions and detached from reality;
• The income from lands for haying and grazing purposes is calculated only if there is
such a plot in use or ownership of the claimant and when it can be documented.
Otherwise, it is almost impossible to calculate income from cows and other cattle;
• There is inconsistency between normatives of income from land and maximum land
size allowing families to qualify for benefits to low-income families. A family having a
plot greater than 0.6 ha is not eligible for social assistance even though its imputed
income from land is lower than the income threshold allowed for applying for the
benefit21. As farmsteads usually own or have in usage more than 0.6 ha, they cannot
apply for the benefit. The exception is made for families comprised of only children
and persons aged 65 and above, or disabled persons in the 1st or 2nd disability
group, or families with disabled children and families otherwise entitled to apply to the
commission for aid (i.e. multi children families or families with members that are
disabled or suffer a long-time illness.)
The above defects and inconsistencies of the system (in our opinion) require the introduction
of a farmstead income estimation methodology corresponding to the reality on the ground
and a mechanism of updating the methodology to the changing environment. Also, the
required role of MLSP in shaping and conducting social assistance policy in the area of
social assistance towards farmsteads should be re-formulated.
21 For example, available standards for farmstead land in Kharkiv oblast in 2008 were set at UAH110/ha for urban areas and at UAH60 for rural areas. Such standards meant that a single able-bodied person would be eligible for SA provided his/her land plot was not greater than 1.2 ha (1.2 ha would bring the income that is equal to the current threshold for such a person to UAH133); a 2+2 family, consisting of 2 able-bodied parents and 2 children aged 0-16, would be eligible for social assistance provided their land plot was not greater than 5.8 ha (nearly 1.5 ha per head). In rural areas, a single able-bodied person would be eligible for SA if the plot was not greater than 2.2 ha, and 2+2 family – if the plot was not greater than 2.7 ha per head. If income standards were similar in other oblasts, the vast majority of at least rural farming households would be eligible for SA (taking into account that nearly 80% of rural farmsteads do not exceed 1 ha).

CASE Network Studies & Analyses No.399 - Agriculture income assessment for the purpose…
29
Dmytro Boyarchuk
CHAPTER 4. REVIEW OF INTERNATIONAL PRACTISE Farming in developed countries is a type of the economic activity highly dominated by
monetary transactions and requires regular financial reporting. Income assessment by
authorities is not needed. Subsistence or semi-subsistence farming where small farmsteads
undertake agricultural activity and, due to historical reasons or only a limited market
presence, are not required to register their transactions, is typical for post-socialist countries.
An example could be Poland or the CIS countries, where farmers account for a large portion
of the society22. For the purpose of the project we have analysed several countries:
Kazakhstan, Kyrgyzstan, Moldova, Russia, Poland, Great Britain, and Australia; we have
concentrated our analysis on the first 5 countries.
The table C-1 in Annex C presents an overview of methodologies of individual farming
income assessments in the 5 selected countries compared to the one applied in Ukraine. All
countries use normatives for crop production as income per 1 hectare of land used for that
purpose; only in Ukraine in some oblasts is the income from hayfields/pastures expressed as
income per 1 cow. In all countries except for Ukraine the normatives are calculated by central
statistical offices (CSO). In all countries except for Ukraine, CSOs exclusively use data on
yields, prices and costs of production of crops to set the normatives. In Ukraine, the original
normatives that were set at the end of the previous decade, had been – in addition – based
on closeness to market outlets; for pastures they were based on milk productivity and costs
of production as well as milk sales prices, and for payi in some oblasts – on the monetary
land value. All countries differentiate the normatives across different factors; the most
frequent being administrative regions and land types. The livestock normatives expressed as
income per head of animal are set only in Kyrgyzstan, Kazakhstan and Russia; in Moldova
they are expressed as income per 1 ha of farm land. Only in Russia, Moldova and Poland is
the procedure of updating normatives regulated by law.
In the CIS region, subsistence and semi-subsistence farming is quite a widespread
phenomenon. Many households from former Soviet countries keep homestead land plots
and use them to support a solid part of their living from those plots. As a rule, the output from
semi-subsistence agro activity is used for personal consumption and only a small share of
22 According to HBS for 2007, 25% of the total population receives any income from individual farming, for 24% of them (or 6% of total population) it is the main source of income in their households.
CASE Network Studies & Analyses No.399 - Agriculture income assessment for the purpose…
30
produced products is placed on the market. A large portion of semi-subsistence farm income
is therefore in-kind and CIS countries try to consider this income when determining the
eligibility of a household for social assistance.
In general, all five countries use the same basic approach for estimating normatives for the
potential capacity of income generation from landplots per one area unit. In all countries
these normatives are based on the numbers from national statistical agencies for crop yields,
prices and costs of production. Though the basic approach is similar, each country has its
own peculiarities. In particular, Moldova and Poland incorporate information about the quality
of the land plot of an applicant which is not the case in other countries. Kazakhstan, for
instance, relies widely on local authorities, which are responsible for estimating imputed
income for every type of crop that an applicant is harvesting in his or her landplot.
The imputation of income from livestock breeding is approached in a different way in every
country. Russia and Kyrgyzstan estimate the potential income from every head of available
livestock in nominal terms. In Moldova, separate land productivity normatives for applicants
with livestock in ownership are applied. And for instance, applicants in Kyrgyzstan have to
report verbally on the income from livestock at their disposal. Poland does not generate
separate normatives for livestock production: the overall normative includes income from
producing both crops and livestock.
In addition to the distinction between estimating different types of agro-incomes, the
methodologies differ in terms of the approach to the procedures of imputation. The most
interesting experience is observed in Kazakhstan where applicants have to submit to welfare
offices a card with detailed information about landplots and livestock at their disposal. The
card should be verified and approved by local authorities which is assumed to improve the
quality of submitted information. This experience demonstrates how the decentralization of
the income assessment process can make possible the collection of very detailed (e.g. an
area for every type of crops) and presumably reliable information about farm activities of an
applicant.
A more detailed description of the five countries’ practices has been provided in points 4.1-
4.5.
CASE Network Studies & Analyses No.399 - Agriculture income assessment for the purpose…
31
4.1. Moldova23
Agro-sector description
In Moldova agriculture has been traditionally regarded as the cornerstone of the national
economy: agricultural output accounts for 15% of GDP. It constitutes the most important
sector of the national economy, using over 30% of the country’s labour force. More than 70%
of the country’s total agro-output is produced by subsistence and semi-subsistence farms.
Moldova is well known for grape production which accounts for more than 19% of total agro-
output (2007). Harvesting comprises close to 58% of the sector output (2007) and the rest
comes from animal husbandry.
Land is predominantly private – 73.5% of the land area was in private ownership in 2008.
Close to 50% of agricultural land (2007) belongs to subsistence and semi-subsistence farms.
Agro-income imputation
In Moldova, nominal income normatives are used for imputing household income from agro-
activities. Similarly to the Ukrainian practice, in Moldova the normatives are estimated per
one hectare of land used for cropping. The National Statistics Agency is responsible for
calculating the normatives which are based on crop yields, prices and costs of production.
Normatives are estimated at the level of geographic zones. In Moldova, three geographic
zones were defined – Northern, Central and Southern, which are compiled of administrative
units.
An important characteristic of the Moldovan approach to calculating imputed agro-income is
incorporating the yield class information. Each yield class has a rating number (based on
points). Normatives for income imputation differentiate across geographic zones where an
average yield class for a zone is applied. In each case a geographic zone normative is
adjusted for the yield class of an applicant’s land according to the land quality rating.
23 based on National Bureau of Statistics of Republic of Moldova (www.statistica.md; The Land Policy and Farm Efficiency: the Lessons of Moldova by Dragos Cimpoies and Zvi Lerman, Discussion paper # 4.08; The Hebrew University of Jerusalem (http://departments.agri.huji.ac.il/economics/)

CASE Network Studies & Analyses No.399 - Agriculture income assessment for the purpose…
32
Zone normatives incorporate the information about types of crops. At first the normatives (net
income per hectare) for each type of crop are calculated. The zone normative is an average
of crop normatives weighted according to the sowing area structure in a given geographic
zone. Last year statistics are used for the calculation of weights.
The zone normatives may be differentiated further. In Moldova we observe an interesting
practice of applying coefficients for landplots with greenhouses. It is important to note that
the methodology differentiates coefficients for heated greenhouses and common
greenhouses.
The methodology considers a difference between farm-operating households and semi-
subsistence farming. Two types of normatives in this dimension are calculated.
Livestock-breeding income, although also estimated per one hectare, differs from that
estimated for cropping. For those social assistance applicants who have livestock in their
household, the ‘crop plus livestock normatives’ are applied; for the remaining applicants, the
‘crop normatives’ are applied. The methodology for calculating livestock production per
hectare is not available. The Agriculture Ministry is estimating the norms according to an
internal algorithm. Similarly to ‘crop normatives’, the ‘crop plus livestock normatives’
differentiate across geographic zones and are adjusted for quality of land within each
geographic zone. Additionally, ‘crop plus livestock normatives’ are also calculated separately
for farm-operating households and for semi-subsistence farms.
The normatives are revised on a yearly basis (only last year’s statistics are considered).
4.2. Kazakhstan24
Agro-sector description
Kazakhstan is rich in land resources; more than 74% of the country's territory is suitable for
agricultural production; however, only 11.1% of total land area is made up of arable land. The
agro-sector represents about 9-10% of GDP and employs over 22.2% of the labour force.
Households produce close to 30% of total agro-output.
24 based on information available at The Agency of Statistics and of the Republic of Kazakhstan (www.stat.kz); Food and Agriculture Organization (www.fao.org)

CASE Network Studies & Analyses No.399 - Agriculture income assessment for the purpose…
33
Kazakhstan is a major producer of wheat (71.4% of agro-production in 2008). Cotton is the
most important industrial crop grown on the irrigated soils of southern Kazakhstan.
Stockbreeding is the traditional and dominant agricultural sector. No less than three quarters
of all agricultural land is used for grazing. Sheep breeding is predominant, while cattle
breeding and the rearing of pigs, horses and camels is also well developed. Animal
husbandry accounts for about 40% of the production value of agriculture in Kazakhstan.
Primary meat products include beef, veal, chicken, horse, lamb, pork and rabbit.
Agro-income imputation
In Kazakhstan, crop normatives are estimated per one hectare and local authorities are
responsible for their calculations. Similarly to Moldova, the normatives are estimated based
on data about crop yields, prices and costs of production. The National Statistics Office
provides only partial information for estimations (yields and costs of production) while local
authorities are in charge of defining average prices for agro-products.
The methodology differentiates yields and costs of production across six climatic zones for
each type of crop. The final normatives are estimated at the administrative level by local
authorities after combining zone yields and production costs with local prices.
Having normatives for each type of crop, local authorities request information about the sown
area under every specific type of crop. Based on the information provided, they calculate
total income from the harvesting activity of an applicant.
In contrast to Moldova, normatives for livestock are estimated per one head of livestock,
based on the information about the productivity of the livestock head, production costs and
sales prices of animal products. Data on productivity and production costs is provided by the
National Statistics Office for six climatic zones and sales prices are defined by local
authorities based on data from local offices of the National Statistics Agency. Normatives are
calculated for every type of livestock in each climatic zone.
In addition to crop and livestock normatives, income from the sales of flowers, breeding and
fur animals as well as bee-farming is also included into agro-income in Kazakhstan. Social
assistance applicants should declare this type of income in their application forms.
Local authorities play an important role in the imputation of agro-income of social assistance
applicants. An applicant should submit a card to the welfare office which should be filled in

CASE Network Studies & Analyses No.399 - Agriculture income assessment for the purpose…
34
and verified by a representative of the local authority. The card contains detailed information
about the land area owned by an applicant, the types of crop and sown area under each
crop, and the livestock owned by the applicant. Local authorities certify the provided
information and estimate the imputed income of an applicant from agro-activity.
4.3. Kyrgyzstan25
Agro-sector description
Kyrgyzstan has about 1.4 million hectares of arable land, which is only about 7 percent of the
nation's total area. More than 70 percent of the arable area depends on irrigation. The agro-
sector employs 32.1% of the labour force and produces 39.4% of GDP. Grains are the main
crops in Kyrgyzstan (25.8% of agro-production in 2008).
An estimated 62 percent of the population lives in rural areas. Household farms have 8.5% of
arable lands under their ownership and produce about 35% of total agro-production. Only
6.2% of total land is in private ownership.
Agro-income imputation
Kyrgystan’s normatives are also based on the estimation of nominal income per one hectare.
Available regulations do not describe the methodology of the normatives calculation but it is
mentioned that the normatives depend on the quality of land, vary between regions, and
differentiate between irrigated and non-irrigated land.
In addition, the Kyrgyz methodology differentiates between the normatives for incomes of
farm-operating households and incomes from homestead land plots. As a rule, homestead
land plots are used fully for personal consumption and normatives for those land plots are
substantially lower compared to farm-operating households.
Nominal income from livestock-breeding is calculated based on a verbal declaration by a
social assistance applicant on the livestock output in their household and current sales
prices.
Other types of agro-income (in-kind or monetized) should be reported verbally by applicants
at welfare offices.
25 based on information available at National Statistics Committee of Kyrgyz Republic (www.stat.kg); Food and Agriculture Organization (www.fao.org)

CASE Network Studies & Analyses No.399 - Agriculture income assessment for the purpose…
35
The information about the landplot which an applicant submits to the welfare office should
be verified by local authorities. An applicant should provide a certified document signed by
local authorities which proves the size of the landplot at his or her disposal and the land
quality.
4.4. Russia26
Agro-sector description
The share of Russia's agriculture in GDP remains within the range of 6-7%. Employment in
the sector accounts for 13-15% of the total number of employed. Russia is thus much less
agrarian than the other analysed former Soviet republics. Moreover, Russia uses only a
small share of its land surface for agro-production (7.5%).
Subsistence and semi-subsistence farms comprise a relatively small role in terms of land
area usage. Individual farms possess close to 20% of agricultural land. At the same time, the
share of subsistence farm production in gross agricultural output is about 43.4% (2008).
Russian subsistence farms specialize mainly in vegetable and animal products output. In
2008, households produced 83.7% of total potato output and delivered 51.7% of total milk
production.
Agro-income imputation
The richest experience in normatives estimations that we have observed is in the Russian
Federation. Effectively, every federal unit of the Russian Federation independently defines
normatives for farm income imputation. In addition, the methodology on normatives
derivation itself varies between federal units.
Normatives for cropping in federal units of Russian Federation are estimated per one hectare
by the local offices of the National Statistics Agency. For calculations, a standard approach is
applied using an average yield, average production costs and market prices.
The normatives are estimated at the level of administrative units; however, for some
federations, information about climatic zones is also incorporated into the normatives (agro-
26 based on information available at Federal State Statistics Service (www.gks.ru); Food and Agriculture Organization (www.fao.org); http://www.rosreestr.ru/upload/www/files/zemlya/rf_formsobs.PNG
CASE Network Studies & Analyses No.399 - Agriculture income assessment for the purpose…
36
income for unfavourable climates is not considered). Some administrative regions construct
their normatives using also information about land types (for instance, in Altayskiy Kray and
Chita oblast the methodology differentiates for orchard area, planting potato and vegetables).
Additionally some federal units apply the capability of applicants and their age as a criterion
for considering agro-incomes or not. The logic is very simple: incapable and/or elderly
people are very unlikely to participate in agro-activities. As a consequence, agro-income is
not imputed for families with disabled or elderly people.
Income from livestock breeding in Russia is estimated per every head of livestock. The
livestock normatives are based on productivity (meat output per head, milk yield per head)
and average prices collected by federal units of the statistics office. Imputation is applied for
every type of animal or poultry.
Similarly to Kazakhstan, some federal units also request local authorities (heads of the
village councils) to certify information provided by an applicant to the social assistance office
(Altayskiy Kray, for instance).
Normatives for farm income imputation are revised on a yearly basis (in some cases twice a
year according to current prices, for instance, North Ossetia, Alania republic and Samara
oblasts).
In Russia we can observe a variety of thresholds for farm income imputation. Many federal
units apply a threshold for land area (in hectares) or livestock (in number of heads) which is
not considered for income imputation. For instance, if the threshold equals to 0.1 ha and 10
rabbits, a farm household with 1 ha and 19 rabbits will be imputed for income from the
land/livestock above the minimum (that is from 0.9 ha and 9 rabbits). Thresholds vary
between regions.
4.5. Poland
Agro-sector description27
Poland is a country that is less grounded in agriculture and forestry than the analysed CIS
countries. Agriculture contributes close to 4.0 percent of GDP and provides employment to
15% of the labour force. Arable land accounts for 45% of Poland's territory; 75% of this area
belongs to individual farms. Individual farms are relatively small: 6.4 ha on average. 27 Based on „Statistical Yearbook of Agriculture and Rural Areas”, Central Statistical Office 2008.
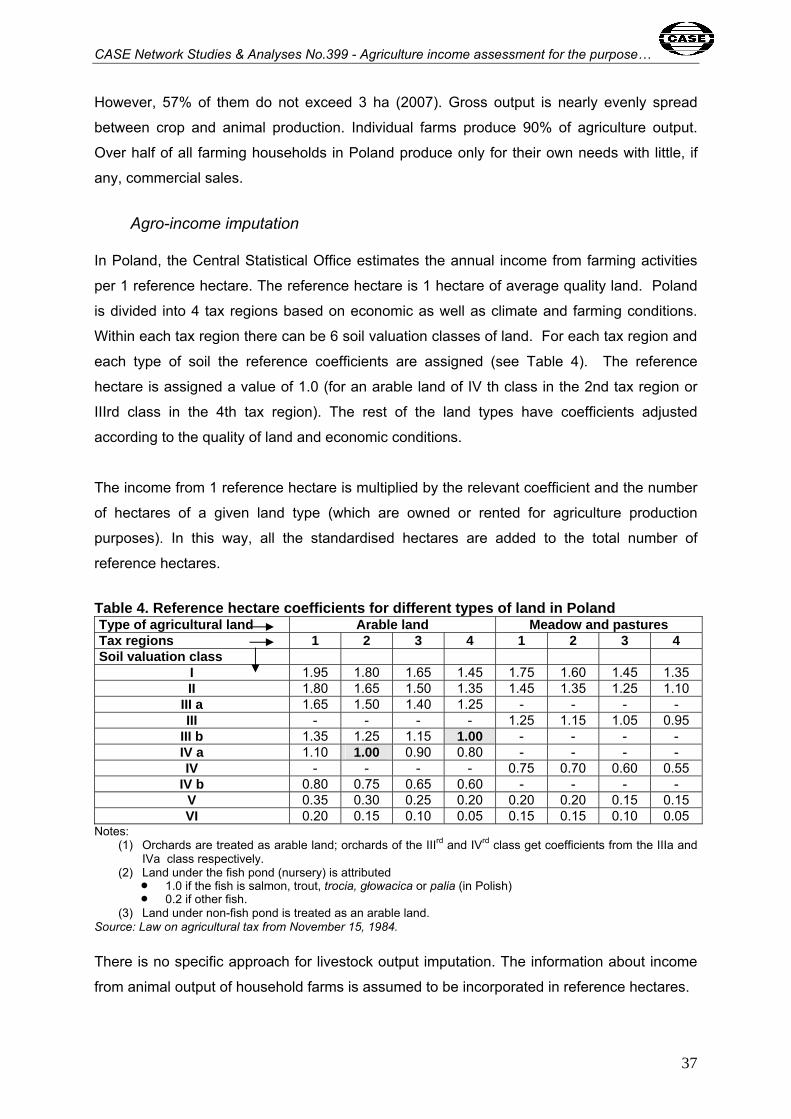
CASE Network Studies & Analyses No.399 - Agriculture income assessment for the purpose…
37
However, 57% of them do not exceed 3 ha (2007). Gross output is nearly evenly spread
between crop and animal production. Individual farms produce 90% of agriculture output.
Over half of all farming households in Poland produce only for their own needs with little, if
any, commercial sales.
Agro-income imputation
In Poland, the Central Statistical Office estimates the annual income from farming activities
per 1 reference hectare. The reference hectare is 1 hectare of average quality land. Poland
is divided into 4 tax regions based on economic as well as climate and farming conditions.
Within each tax region there can be 6 soil valuation classes of land. For each tax region and
each type of soil the reference coefficients are assigned (see Table 4). The reference
hectare is assigned a value of 1.0 (for an arable land of IV th class in the 2nd tax region or
IIIrd class in the 4th tax region). The rest of the land types have coefficients adjusted
according to the quality of land and economic conditions.
The income from 1 reference hectare is multiplied by the relevant coefficient and the number
of hectares of a given land type (which are owned or rented for agriculture production
purposes). In this way, all the standardised hectares are added to the total number of
reference hectares.
Table 4. Reference hectare coefficients for different types of land in Poland Type of agricultural land Arable land Meadow and pastures Tax regions 1 2 3 4 1 2 3 4 Soil valuation class
I 1.95 1.80 1.65 1.45 1.75 1.60 1.45 1.35 II 1.80 1.65 1.50 1.35 1.45 1.35 1.25 1.10
III a 1.65 1.50 1.40 1.25 - - - - III - - - - 1.25 1.15 1.05 0.95
III b 1.35 1.25 1.15 1.00 - - - - IV a 1.10 1.00 0.90 0.80 - - - - IV - - - - 0.75 0.70 0.60 0.55
IV b 0.80 0.75 0.65 0.60 - - - - V 0.35 0.30 0.25 0.20 0.20 0.20 0.15 0.15 VI 0.20 0.15 0.10 0.05 0.15 0.15 0.10 0.05
Notes: (1) Orchards are treated as arable land; orchards of the IIIrd and IVrd class get coefficients from the IIIa and
IVa class respectively. (2) Land under the fish pond (nursery) is attributed
• 1.0 if the fish is salmon, trout, trocia, głowacica or palia (in Polish) • 0.2 if other fish.
(3) Land under non-fish pond is treated as an arable land. Source: Law on agricultural tax from November 15, 1984. There is no specific approach for livestock output imputation. The information about income
from animal output of household farms is assumed to be incorporated in reference hectares.
CASE Network Studies & Analyses No.399 - Agriculture income assessment for the purpose…
38
The agro-income imputation approach depends on the purpose of the estimates. Four
different purposes of income imputation are defined: (i) taxation; (ii) unemployment benefits;
(iii) means-tested family benefits; and (iv) means-tested social assistance. For the first three
purposes, the National Statistics Office calculates income normatives from reference hectare
based on data about yields, production costs and sales prices. The imputed income is
estimated by multiplying the size of the land plot and reference hectare income normative
and is adjusted for the reference hectare coefficients. The value of reference hectare for
social assistance needs results from applying the minimum consumption basket approach as
described in the section below.
An applicant for social assistance has to provide only information about the size of the
landplot at his/her disposal when submitting the document to the welfare office. The
authorities randomly verify information provided by the applicants.
The normatives are revised every year for all imputation purposes except for social
assistance. Social assistance normatives are revised every three years or even less
frequently.
Minimum basket of goods and services approach
In Poland, many years ago the interested parties worked out a consensus about comparing
costs of living in rural and urban areas. They agreed that the level of consumption of a single
person living in a big city and receiving a minimum pension and the level of consumption of a
single person living in the country side and having a 2- hectare-farmstead are similar. Such a
consensus reflected the fact that in the area of food and housing costs, which are crucial for
social assistance, costs of living in a city (costs of housing, retail costs of food) are much
higher than costs of living in the country side (due to ownership of a house and (partly)
utilities, consuming self-produced food or at most purchased at producer prices). So the
income threshold for social assistance, derived from the minimum basket of goods and
services, is equivalent to the (threshold) income of farmers (monetary as well as in-kind) from
2 hectares. In other words, a family with up to 2 ha per person is eligible for social
assistance. If a farmstead gets other incomes and all of them need to be added up, then
each hectare is estimated to provide ½ of the farming income threshold. Taking into account
that the income threshold for a 1-person household in an urban area is higher than the

CASE Network Studies & Analyses No.399 - Agriculture income assessment for the purpose…
39
income threshold per person in a bigger family, some adjustments are made to use this
differentiation in calculating threshold income for farmers28.
In fact the estimated income from 1 hectare for the purpose of family benefits, based on the
agro-income imputation, is smaller than the one for the purpose of social assistance. Such
differences reflect different levels of social interventions of the state in different social
situations. Social assistance is the ‘last resort’ state help and citizens should make use of all
their resources in the first place (subsistence production of farmers as well as zero housing
costs being taken into account here).
CHAPTER 5. CONCLUSIONS Irina Sinitsina
5.1. Targeting by proxy means testing in Ukraine – advantages and prerequisites
We tried to outline the lessons from international experience for targeting cash transfer
programs in Ukraine generally, and for integrating proxy means testing (PMT) into agro
income assessment in Ukraine in particular, from three specific perspectives: the advantages
of PMT application for the Ukrainian safety nets, the existing prerequisites for using PMT in
Ukraine, and the role that PMT could play in targeting social assistance to the poorest rural
population in the country.
Clearly, the use of PMT targeting has several advantages which make it a preferential
targeting method in designing national safety nets in Ukraine. These advantages could be
summarized as follows:
• PMT ensures a high degree of transparency and targeting accuracy.
• PMT is a more open and less costly system from the administrative viewpoint
compared to true means testing.
• Targeting by PMT is particularly effective when:
- There is a high degree of informality; 28 Based on data on social assistance recipients, the Polish MLSP calculated that among the recipients in the country side, half of them are 1-person households and half of them are more than 1-person households. They calculated that the average threshold income from 2 hectares would be the average from the threshold for a 1-person household and the threshold for more than 1-person household in the urban area. Such proportions between SA recipients have been assumed for all the following years and the threshold for farmers has only been indexed (not recalculated). The indexation is to take place every 3 years on the basis of increases in costs of living of people in the first quintile.

CASE Network Studies & Analyses No.399 - Agriculture income assessment for the purpose…
40
- Income and/or acquisition of income in cash form is seasonal; employment is
sporadic in the agriculture/informal sector;
- The targeted group is large and a majority are chronically poor.
• PMT targeting is particularly appropriate for the systems that allow for continuous
payments of cash benefits.
• PMTs can be used for a multitude of specific social safety nets: various cash
transfers, subsidized food rations, health insurance, workfare, scholarships for
vocational training, and housing and utility subsidies.
• PMTs can be used for verification and/or assessment of income data supplied by the
beneficiary and for forecasting the level of the household’s well-being.
• As the PMT method is based on the concept of the “multi-dimensionality” of poverty, it
could be more acceptable politically (compared to VMT) and more transparent.
• The PMT method could be easily adapted to virtually any country conditions; there is
no need to copy foreign experience; on the contrary, national/geographic specifics
(culture, infrastructure development, etc.) could be easily accounted for in designing
the system.
• PMT’s openness and transparency are important politically, since they allow for
regular reporting of the respective governance level and facilitate reactions to
criticism from mass media.
• The method could be efficiently used in both centralized and de-centralized systems,
which is in line with the conditions prevalent in Ukraine. At the same time,
centralization ensures greater transparency, as centralized management contributes
to the consolidation of national databases.
Ukraine meets all of the requirements for the successful application of PMT and possesses
many of the prerequisites necessary for using PMT targeting effectively:
• International experience suggests that targeting by PMT consistently demonstrates
better outcomes in middle-income countries compared with poorer ones. Targeting
performance generally improves with the country’s income levels (the proxy for
implementation capacity), the extent to which the government is held accountable for
its actions, and the degree of inequality. Countries where differences in economic
well-being are easier to identify also demonstrate better targeting outcomes. Ukraine
meets all of these criteria.
• Ukraine has a considerable informal labour market associated with underdeveloped
information and verification systems which prevent a precise verification of income
and welfare characteristics of benefit recipients.
CASE Network Studies & Analyses No.399 - Agriculture income assessment for the purpose…
41
• PMT can serve as a reliable substitute for measuring the agricultural income of
households in Ukraine for the purposes of social benefits targeting. Also, Ukrainians
who depend on agriculture for their survival can be considered chronically poor.
• Ukraine possesses a reasonably high administrative capacity to ensure an efficient
organization of PMTs, their effective verification, reporting and control, as well as the
capacity to organize a consolidated nation-wide database to avoid duplication and to
track beneficiaries.
• Ukraine has a solid household survey database on consumption/income (Ukrainian
Longitudinal Monitoring Survey, ULMS) which can serve as a basis to determine the
indicators used in PMTs and their weights.
• There is a large body of computer trained staff who can carry out the registrations
and ensure effective database management. There are also moderate to high levels
of IT development and computer networks throughout the country.
In designing the PMT system for Ukraine, one should keep in mind that the simultaneous
involvement of other appropriate targeting methods (e.g. geographic, or self-selection, or
categorical based on age, etc.) within the same program contributes to more efficient
targeting and minimizes leakages, improves coverage rates and minimizes errors of
exclusion.
Katarzyna Piętka-Kosińska
5.2. Agriculture income assessment – an analysis of the usefulness of other countries’ practices for Ukraine
Returning to the issue of means testing methods, a detailed discussion of the usefulness of
farming income assessment practices in the five analysed countries (“pros” and “cons”)
preceded the formulation of recommendations for Ukraine. There are several aspects of the
system that need to be defined:
− the unit for which the net income is defined (e.g. 1 hectare of land in the case of
crops, 1 head of livestock),
− the list of factors affecting the level of normatives,
− the level of normative disaggregating (e.g. separate normatives for all types of crops
versus 1 normative for all crops together)
− the dimension and the level of normative differentiation (e.g. across climatic zones)
− the role of local authorities in the process of means testing
− the responsibility for calculating normatives and revision rules
CASE Network Studies & Analyses No.399 - Agriculture income assessment for the purpose…
42
Examples of good practices were discussed within the Ukrainian context. The most important
conclusions from this discussion are presented below.
• Taking into account the following factors: many households owning land do not own
livestock; farmsteads provide 60% of total livestock production in the country; livestock
production accounts for over 40% of total farmstead production; and livestock availability
at small farmsteads is very uneven, it is justified to develop separate normatives for crop
and livestock production similarly to all of the analysed countries except for Poland and
Kyrgyzstan. Although in Ukraine many farmsteads use the outputs of agro production for
their own purposes or offer them in barter transactions, it is important from the social
assistance perspective to estimate this in-kind income (as food is the main component of
the consumer basket of poor people).
• Ukrainian land plots are very small, so we find it inadequate to disaggregate normatives
across types of crop. Moreover, if normatives were differentiated across quality of land
(as we recommend), then setting and using normatives for each type of crop would seem
useless: the quality of land narrows the list of possible crop production so the land quality
indirectly defines the type of produced crops. However, taking into account the strong
differences in the composition of crop production across the country, the Moldovan idea
of setting the climatic zone normative as the weighted average of normatives for each
type of crop with weights of each crop sowing area could serve well in Ukraine too, as a
(temporary) alternative to differentiating normatives across land quality.
A similar approach can be used in the case of livestock (that is, a universal normative per
head of livestock as a weighted average of normatives for each type of livestock bred in a
given zone). It would include the error of equal treatment of different kinds of livestock
(much more differentiated in terms of income generation than crops). So, a minor
disaggregating of livestock (though less than in Russia or Kazakhstan) may be
reasonable.
• Differentiating crop normatives by climatic zones (there are 5 zones in Ukraine29) could
be a valuable element of simplifying the estimation of output and costs of production
which are currently based on administrative units (oblasts). Although, climatic zone
29 Depending on natural, economic and historical conditions, the following zones of agricultural specialization have formed on the territory of Ukraine: Polissya (Woodlands), Lisostep (Forest Steppe), Step (Steppe), mountainous regions of the Ukrainian Carpathian Mountains, and foothill and mountainous regions of the Crimea. The woodland agricultural zone includes Volyn, Rivne, Zhytomyr, Kyiv, Chernihiv, and Sumy Oblasts. The forest steppe zone includes L’viv, Chernivtsi, Ivano-Frankivsk, Ternopyl, Khmelnytsk, Vinnytsia, Cherkasy, Poltava, and Kharkiv Oblasts. The steppe zone covers all the southern oblasts. The foothill and mountainous areas of the Ukrainian Carpathian Mountains extend to cover parts of L’viv, Ivano-Frankivsk, Chernivtsi Oblasts as well as Transcarpathian Oblast. The foothill and mountainous areas of the Crimea cover the southern part of the peninsula.
CASE Network Studies & Analyses No.399 - Agriculture income assessment for the purpose…
43
differentiation would provide too strong of a generalization if not followed by further
normatives differentiation accounting for strong differences in land quality within climatic
zones or distance to markets in the situation of low mobility of farmers.
• Differences in prices of livestock (due to the limited mobility of farmsteads) and
differences in some fodder costs across regions call for the need to differentiate the
normatives regionally, as seen in Kazakhstan or Russia. According to agro experts, the
regional differentiation for livestock in Ukraine should be less fragmented however than
for crop production and related rather only to climatic zones.
• In Ukraine, the options of selling agricultural products rise strongly as distance to market
outlets lessens. Based on the material received from the Ministry of Economy, apparently
the distance to market outlets was taken into account when setting the initial normatives
in 1998. Although the analysed countries use yields, prices of agro products and costs of
production as the only factors affecting the normative level, in Ukraine it may be
reasonable to account for distance to the markets as well (e.g. through differentiating
normatives for rural and urban areas).
• Differentiating normatives across land quality was adopted in all countries except
Kazakhstan. Land quality is a key factor of crop production productivity. Different quality
land plots can exist within very small sub-regions. Although a system of land quality
classification exists in Ukraine, access to such information by the average land owner is
currently very poor. Probably only after free land trading is allowed will the process of
clarifying the quality of land plots and increasing awareness of it by their owners take
place. Differentiating normatives across land classes would require defining separate
yields and costs of the main kinds of crop production for each type of land, at least in the
initial year; in the next period, land of average quality could serve as a reference and the
costs and the yields for each other quality of land could be defined through the ratio
between each non-average and the average type of land set in the initial year.
• Setting normatives for other types of activities (such as sales of flowers, breeding, sales
of fur animals, income from bee-farming in Kazakhstan) seems unjustified because the
role of such activities in Ukraine is minimal.
• In light of the high level of SA system abuse (high error of inclusion according to HBS),
confirmation of data provided by an applicant seems required, as practiced in
Kazakhstan, Kyrgyzstan, and Russia. A partial solution could be an occasional
verification. An important source of information in Ukraine could be the twice-yearly
review of livestock in farmsteads by Rural Councils.
• The regular revision of normatives should be regulated by law as it is at least in Moldova,
Russia and Poland. The regular update of normatives that follows changing economic
CASE Network Studies & Analyses No.399 - Agriculture income assessment for the purpose…
44
environment would encourage a regular update of the eligibility criteria for social
assistance beneficiaries, and would also make farming income estimations more realistic
at the advantage of the social assistance budget.
• The initial normatives in Ukraine were created by a consortium of several ministries
(including the Ministry of Labour and Social Policy). In the analysed countries, central
statistical offices are responsible for calculating normatives. This seems to be a logical
consequence of collecting all the used data by those institutions. However, if access to
social assistance was to take into account the different costs of living in rural and urban
areas (as in the minimum basket approach in Poland, see p. 4.5), then the role of MLSP
could be important.
Dmytro Boyarchuk, Liudmyla Kotusenko, Katarzyna Piętka-Kosińska, Roman Semko
CHAPTER 6. RECOMMENDATIONS FOR UKRAINE
Our general recommendation is to apply a well-justified, unified and realistic methodology for
calculating the normatives for farmstead income assessment as well as unified rules for
regular updates of the normatives.
We have divided the recommendations into 3 groups: (1) long-term solutions, (2) short-term
solutions, (3) minimum solutions. The (1) long-term solutions assume access to regular
comprehensive data on farmstead activities (incomes and costs of farming). The (2) short-
term solutions include temporarily recommended changes, that would allow for the unification
and adjustment of the system before the necessary database is developed. The (3) minimum
solutions assume absolute minimum adjustments if the status quo has to remain (update of
the initial normatives, unification of the system and adjusting it to the reality). The detailed
recommendations in the long-term and short-term scenarios are preceded by general
suggestions.
CASE-Ukraine, in cooperation with MLSP and under the supervision of the Ukrainian office
of the World Bank, is working on the development of a Proxy Means Testing model that
could serve as an alternative method of assessing the incomes of social assistance
claimants. Our recommendations refer strictly to the means testing method.

CASE Network Studies & Analyses No.399 - Agriculture income assessment for the purpose…
45
6.1. General suggestions
1. We recommend defining the normatives for crop production only as income per hectare
and the normatives for livestock production as income per head of livestock.
2. Taking into account that a popular way of using payi is to rent them without a lease
agreement30, we consider linking this income to the monetary land value as a reasonable
proxy of the willingness of a renter (enterprise/farmer) to pay rent (instead of setting
normatives per ha). We would recommend unifying this methodology throughout Ukraine.
However we would like to stress here the need for systemic changes in agriculture that
would allow for free land trading to enhance land consolidation, and an increase in the
productivity of this sector.
3. Following our recommendation to set normatives for livestock production, we consider
estimating income from hayfields and pastures unnecessary.
4. We recommend differentiating normatives for livestock production across the main types
of livestock because there are strong differences between net income per head for each
type of livestock. We advise the consideration of developing normatives only for the most
popular types of livestock: cows, cattle, hogs and poultry.
5. Taking into account the low mobility of rural farmsteads and underdeveloped trade
networks for small agricultural producers, the aspect of distance to market outlets should
remain a reason for setting higher normatives for urban areas than in rural areas.
6. We support maintaining the rule that the land size of 0.06 ha belongs to the area under a
house and the income is not generated by such a land plot. However, we recommend
that this land size taken out of the total used land area is unified across all oblasts in
Ukraine since there is no justification for assuming housing areas change across regions.
7. We recommend that the 0.6 ha cap on land size, which plays the role of an additional
social assistance threshold, is lifted for at least 2 reasons. Firstly, farmsteads in many
regions, especially those that are products of former collective farm privatisations, have
no equipment to undertake farming activity. So, even if their land is greater than 0.6 ha,
they are not capable of generating any income above the income threshold. Secondly,
the recommended scrutiny methodology of calculating the normatives will exercise
means-testing effectively enough and the 0.6 ha cap on land size is not necessary
anymore.
8. We recommend giving the claimant the option of declaring no activity on the land. As
mentioned above, there are owners of privatized land that are not capable of undertaking
30 63.2% payi owners signed lease agreements; the remaining 36.8% is either used by the payi themselves (which is rare according to the agro-experts) or renting it without a formal agreement.

CASE Network Studies & Analyses No.399 - Agriculture income assessment for the purpose…
46
agricultural activity due to the lack of equipment and resources to rent it. Moreover, there
are payi land plots that have not been marked out. Access to such plots by their owners
is practically nonexistent. Estimating income from such plots would be illusory and unfair.
However, such an option is justified only until the land can be freely sold. Otherwise it
would provide negative motivation to undertake activity on the land and to seek welfare
benefits.
9. We suggest following the best practices exercised in some CIS countries and impose
upon local authorities the responsibility to confirm the information provided by an
applicant to SA, especially in respect to the declared zero activity on the land. This can
be either obligatory or undertaken occasionally at random.
10. Indexation of normatives with CPI inflation (regional CPI inflation – if possible and
justified) should be regulated by the law.
11. The Polish practice of estimating income of homesteads based on a minimum basket of
goods and services, for the purpose of social assistance, should be considered as an
option for Ukraine.
6.2. Detailed recommendations
6.2.1. Long-term solutions In addition to the general suggestions we recommend the following long-term solutions:
12. We recommend using the climate zone division of Ukraine’s territory and land quality as
differentiating factors for farmstead income normatives for crop production. Based on
expert opinions, such a rule of differentiating normatives reflects the most the natural
conditions for agriculture activities.
13. The income estimation is to be based, among other things, on yields of different crop
types. We recommend that the applied yields are the averages of the last 3 years to
avoid weather-cycle fluctuations of normatives from year to year.
14. We do not recommend differentiating crop normatives by type of crop because we
recommend differentiating the normatives across the quality of land. The quality of land
narrows the list of possible crop production so the land quality indirectly defines the type
of produced crops. However, the shares of crops’ sowing area within a given sub-region
should serve as weights for setting a weighted average of net income from crop
production.
15. For livestock production, we suggest to differentiate normatives only across climate
zones as the capability of letting animals out is the main differentiating factor of livestock
CASE Network Studies & Analyses No.399 - Agriculture income assessment for the purpose…
47
productivity and, according to agro-experts, the price differences (of livestock and inputs)
are only up to 10-15% across the regions.
16. We recommend adding a “proximity-to-markets” premium to the normatives for the urban
areas and villages which are less than 10 km from the nearest town.
Long-term solutions assume basing the normatives on comprehensive data on farmstead
activities that would provide information about farmstead incomes from crop and livestock
production as well as the costs of each type of activity per unit of production, representative
for climate zones and land quality types. The State Statistics Committee undertakes a yearly
representative survey among farmsteads covering nearly 29 thousand cases. During the
annual survey, general data on households, availability of land plots, structures of its use and
plant acreages for various crops, availability of livestock and poultry, economic infrastructure,
and machinery and equipment is collected. During the monthly survey, data on yields and
acreage of agricultural plants, changes in the number of livestock and poultry, fodder
expenditures, livestock product produce and distribution of products of own produce (prices,
quantities) is collected. The information collected during monthly surveys on farming income
is only partial and the information on costs is lacking so the survey does not allow for
providing estimates of net income in such farms.
17. We recommend that the survey is representative for each climatic zone and each land
class. We recommend expanding this survey to also cover urban households. We
recommend extending the survey for questions that would cover:
o income elements:
agricultural products produced for own consumption (income in kind);
o costs elements:
purchases of inputs for different types of agro production,
usage of own agro-products as inputs for different types of agro-
production; and
o improvement of statistical weights.
We would like to draw attention to the survey of farmsteads launched in all European
Union countries: FADN (Farm Accountancy Data Network) – a European system of
collecting accounting data from the representative number of farms (see more in Chapter
1).
18. After the condition of having a comprehensive database on farmstead incomes and costs
is fulfilled, we recommend using it in the process of calculating the normatives.
CASE Network Studies & Analyses No.399 - Agriculture income assessment for the purpose…
48
19. We recommend enhancing the process of land quality identification. It would be
necessary not only for the purpose of differentiating normatives across land quality but
also for preparing the ground for land turnover.
6.2.2. Short-term solutions
The outdated normatives that are currently in use and the inconsistency of the entire system
calls for rapid steps towards orderliness and a system that responds to the reality on the
ground.
Before the comprehensive database on farmstead incomes and costs is available and the
information on land classes easily accessible and known by the land owners, we propose to
rely on the available sources of data and set proxy normatives (the best available).
The first approach assumed using income and costs of agro enterprises. The results turned
out to be inconsistent with the reality of farmsteads. The second approach used the incomes
and costs of agro activities by households having any plots of land, based on levels declared
in HBS (Method (2) in Annex D). In respect to the short-term solutions, we recommend the
following rules for normatives (on top of the general suggestions).
20. Before the comprehensive database with data on revenues and production costs of
farmsteads is compiled, we propose to use the HBS data set as it most likely reflects the
reality in which farmsteads operate to a greater extent than data from agro enterprises.
An alternative (not exercised in this project) could be the income/costs data for the group
of smallest agro-enterprises.
21. In terms of differentiating the normatives (for both crop and livestock production) we
recommend sticking to the oblast level since this is the only regional differentiating factor
possible based on HBS.
22. The differences in the access to markets should be expressed through setting separate
normatives for urban and rural areas.
6.2.3. Minimum solutions
The current system of farming income estimation in Ukraine has proven to be inconsistent
and outdated. An absolute minimum reform should unify the system, assure fairly equal
CASE Network Studies & Analyses No.399 - Agriculture income assessment for the purpose…
49
access to social assistance and respond to the frequent situation of impossible land usage
(the case of payi). We recommend that the minimum adjustment includes the following:
23. Indexation of normatives developed in 1998 for oblast cumulative CPI index between
2009 and the last indexation in 2000; a mechanism of regular indexation should be
defined.
24. Lifting the 0.6 ha cap on the land plot size,
25. Taking into account that the area of the land plot excluded from calculating income from
land is 0.06 in some regions and may reach 0.25 ha in others, we propose unifying the
plot size excluded from the income estimation at the level of 0.06 ha in all the regions.
CASE Network Studies & Analyses No.399 - Agriculture income assessment for the purpose…
50
REFERENCES Ahmed, A.U., and H.E. Bouis (2002). “Weighing what’s practical: proxy means tests for
targeting food subsidies in Egypt”. Food Policy 27 (5-6), 519-540.
Alatas, V., A. Banerjee, R. Hanna, B. Olken, J. Tobias (2009). “How to Target the Poor:
Evidence from a Field Experiment in Indonesia”. First Draft,
http://ipl.econ.duke.edu/bread/papers/0909conf/Hanna.pdf
Alderman, Harold (2002). “Subsidies as a Social Safety Net: Effectiveness and Challenges.”
Social Protection Discussion Paper 0224. Washington, DC: World Bank.
Atkinson, A.B. (1996). “On Targeting Social Security: Theory and Western Experience with
Family Benefits.” In Public Spending and the Poor: Theory and Evidence, ed. Dominique van
de Walle and Kimberly Nead, 25–68. Baltimore, MD: Johns Hopkins University Press.
Ayala Consulting (2002). “Final Report: Workshop on Conditional Cash Transfers Programs’
Operational Experience.” Paper presented at workshop in Puebla, Mexico, April 29–May 1.
Bigman, D., and H. FoFack (2000). “Combining Census and Survey Data to Study Spatial
Dimensions of Poverty: A Case Study of Ecuador.” In Geographical Targeting for Poverty
Alleviation. Washington, D.C.: World Bank.
Boyarchuk D., V.Herasimovich and I.Orlova (2008), Approaches to reforming services
privileges In Ukraine, CASE 2008.
Braithwaite, J., C. Grootaert, and B. Milanovic (2000). Poverty and Social Assistance in
Transition Countries. New York: St. Martin’s Press.
Castañeda, T. (2005). “Targeting Social Spending To The Poor With Proxy–Means Testing:
Colombia’s SISBEN System.” Social Protection Discussion Paper Series 0529, World Bank,
Washington, D.C.
Castañeda, T., and K. Lindert, with B. de la Brière, L. Fernandez, C. Hubert, O. Larrañaga,
M. Orozco, and R. Viquez (2005). “Designing and Implementing Household Targeting
Systems: Lessons from Latin American and the United States.” Social Protection Discussion
Paper 0526. Washington, DC: World Bank.
Central Statistical Office of Poland (2008), Statistical Yearbook of Agriculture and Rural
Areas, Warsaw 2008.
CASE Network Studies & Analyses No.399 - Agriculture income assessment for the purpose…
51
Dragos C. and Z. Lerman, The Land Policy and Farm Efficiency: the Lessons of Moldova,
Discussion paper # 4.08, The Hebrew University of Jerusalem
Clert, C., and Q. Wodon (2001). “The Targeting of Government Programs in Chile”. In
Gacitua-Mario, E., and Q. Woton, eds., Measurement and Meaning: Combining Quantitative
and Qualitative Methods for the Analysis of Poverty and Social Exclusion in Latin America.
World Bank Technical Paper 518, Washington, D.C.
Coady D., Grosh M., Hoddinott J. (2004).Targeting of transfers in developing countries:
review of lessons and experience. Washington, DC: The World Bank (World Bank Regional
and Sectoral Studies)
Coady, D. (2001). “Evaluating the Distributional Power of PROGRESA’s Cash transfers in
Mexico.” Food Consumption and Nutrition Division Discussion Paper 117, International Food
Policy Research Institute, Washington, D.C.
Coady, D., R. Perez, and H. Vera-Llamas (2000). “Cost-Effectiveness Analysis of the
Education Component of PROGRESA.” In: D. Coady, ed., The Application of Social Cost-
Benefit Analysis to the Evaluation of PROGRESA. Final report submitted to PROGRESA.
International Food Policy Research Institute, Washington D.C.
Conning, Jonathon, and M. Kevane (2001). “Community Based Targeting Mechanisms for
Social Safety Nets.” Social Protection Discussion Paper 0102. Washington, DC: World Bank.
Coudouel, A., A. Dani, and S. Paternostro, eds. (2006). Poverty and Social Impact Analysis
of Reforms: Lessons and Examples from Implementation. Washington, D.C.: The World
Bank.
Fiszbein, A. and N. Schady (2009). Conditional Cash Transfers: Reducing Present and
Future Poverty. A World Bank Policy Research Report. Washington, DC: The World Bank.
Gomart, E. (1998). “Poor Beneficiary Assessment.” World Bank Human Development Unit,
Country Department III. Europe and Central Asia, Washington, D.C.
Grosh, M. (1994). Administering Targeted Social Programs in Latin America: From Platitudes
to Practice, Washington, DC: World Bank.
Grosh M. E., and Judy L. Baker (1995). “Proxy Means Tests for Targeting Social Programs.
Simulations and Speculation”. Living Standards Measurement Study, Working Paper No.
118, July Washington, DC: World Bank.
Grosh, M., C. del Ninno, E. Tesliuc, and A. Ouerghi (2008). For Protection and Promotion:
The Design and Implementation of Effective Safety Nets. Washington, DC: World Bank.
Grosh, M., and E. Glinskaya (1998). “Proxy Means Testing and Social Assistance in

CASE Network Studies & Analyses No.399 - Agriculture income assessment for the purpose…
52
Armenia. World Bank Development Unit, Country Department III., Europe and CentralAsia.
Washington, D.C.
Henninger, Norbert, and Mathilde Snel (2002). “Where Are the Poor? Experiences with the
Development and Use of Poverty Maps”. Washington, DC and Arendal, Norway: World
Resources Institute, United Nations Environment Programme, and GRID-Arendal.
Hernanz, Virginia, F. Malherbet, and M. Pellizzari (2004). “Take-Up of Welfare Benefits in
OECD Countries: A Review of the Evidence.” Social, Employment and Migration Working
Paper 17, OECD Directorate for Employment, Labour and Social Affairs, Paris.
Holzmann, R., D.A. Robalino, and N. Takayama, eds. (2009). Closing the Coverage Gap:
The Role of Social Pensions and Other Retirement Income Transfers. Washington, DC: The
World Bank.
Houssou, N.S.I., M. Zeller, G. Alcaraz, J. Johannsen, and S. Schwarze (2007). “Proxy Means
Tests for Targeting the Poorest Households: Applications to Uganda”. Paper presented at
workshop “Utilisation of diversity in land use systems: Sustainable and organic approaches
to meet human needs”, Tropentag, October 9-11, Witzenhausen.
Johannsen, Julia (2006). “Operational poverty targeting in Peru – Proxy means testing with
non income indicators”. UNDP International Poverty Centre. Working paper No. 30, October.
Larrañaga, Osvaldo (2003). “Focalización de programas Sociales en Chile: el Sistema CAS”
Social Protection Center, Latin America and Caribbean Region, World Bank, Washington
D.C.
Lindert, Kathy (2005). “Implementing Means-Tested Welfare Systems in the United States.”
Social Protection Discussion Paper 0532. Washington, DC: World Bank.
Lindert, Kathy, Emmanuel Skoufias, and Joseph Shapiro (2006). “Redistributing Income to
the Poor and the Rich: Public Transfers in Latin America and the Caribbean.” Social
Protection Discussion Paper 605. Washington, DC: World Bank.
Mintrud Rossii (2001). Departament dohodov naseleniya i urovnya jizni, Ministerstvo truda I
social'nogo razvitiya Rossiiskoi Federacii. "Ob opyte raboty organov vlasti sub'ektov RF po
usileniyu adresnosti social'noi podderjki maloimuschego naseleniya",
http://www.nasledie.ru/fin/6_7/6_7_1/article.php?art=19
Narayan, Ambar, and Nobuo Yoshida (2002). “Proxy Means Test for Targeting Welfare
Benefits in Sri Lanka”. South Asia Poverty Reduction & Economic Management; World Bank,
Washington DC.

CASE Network Studies & Analyses No.399 - Agriculture income assessment for the purpose…
53
Rawlings, L., L. Sherburne-Benz, and J. Van Domelen (2003). Evaluating Social Funds: A
Cross-Country Analysis of Community Investments. Washington, D.C.: World Bank.
Reyes, Celia M. (2006). ”Alternative Means Testing Options Using CBMS” Philippine Institute
for Development Studies, Discussion Paper Series No. 2006-22, Manila.
Sancho, A. (1992). “La Ficha Cas Como Instrumento de Focalización del Gasto Social en el
Nivel Local.” In: Margaret Grosh, ed., Platitudes to Practice: Targeting Social Programs in
Latin America. Vol. II, Case Studies III, Latin America and the Caribbean Technical
Department, World Bank Regional Study Program, Report 21. Washington D.C.
Skoufias, E., B. Davis, and S. de la Vega (2001). “Targeting and the Poor in Mexico: An
Evaluation of the Selection of Households into PROGRESA.” World Development 29(10):
1769–84.
Struyk, Raymond, Ekaterina Petrova, and Tatiana Lykova (2006). “Targeting Housing
Allowances in Russia.” European Journal of Housing Policy 6 (2): 191–220.
Subbarao, Kalanidhi (2003). “Systemic Shocks and Social Protection: The Role and
Effectiveness of Public Works.” Social Protection Discussion Paper 0302. Washington, DC:
World Bank.
Subbarao, Kalanidhi (2009). “Targeting Social Safety Nets: Methods and Evidence”.
Presentation at Social Protection Workshop, July 6-7, Phnom Penh, Cambodia.
Sumarto, S., A. Suryahadi, and L. Pritchett (2003). “Safety Nets or Safety Ropes? Dynamic
Benefit Incidence of Two Crisis Programs in Indonesia ” World Development 31 (7), July:
1257-1277.
Wodon, Q., and D. Angel-Urdinola (2008). “Assessing the Targeting Performance of Social
Programs: Cape Verde”, in: B. Dodson-Moreno and Q. Wodon, eds. Public Finance for
Poverty Reduction: Concepts and Case Studies from Africa and Latin America. Washington,
DC: The World Bank., 2008.
World Bank (1999). “Improving Social Assistance in Armenia.” Human Development Unit,
Country Department III, Europe and Central Asia Region, World Bank Report No. 19385-AM.
Washington, D.C.
World Bank (2003). “Armenia: Public Expenditure Review”. World Bank Report 24434-AM.
Poverty Reduction and Economic management Unit, Europe and Central Asia Region.
Washington, D.C.
CASE Network Studies & Analyses No.399 - Agriculture income assessment for the purpose…
54
LIST OF TABLES Table 1. Agricultural Production in 2008 (in 2005 prices) Table 2. Major crop yields, centers/ha Table 3. Livestock and poultry, thous. heads (as of 1 Jan, 2009) Table 4. Reference hectare coefficients for different types of land in Poland Table A-1. Distribution of Targeting Methods by Region, Country Income Level, and
Program Type Table B-1. Sources of income included in total income defined for the purpose of
social assistance eligibility Table B-2. Land income normatives as of 1999 Table C-1. Review of agriculture income assessment practices in 5 countries
compared to Ukraine. Table D-1: Structure of income from crop production, based on HBS (UAH/ha/month)
LIST OF FIGURES Chart D-1. Standard Net Incomes from crop production by oblasts for 2008 (UAH / 1 ha
/ month) – urban areas Chart D-2. Standard Net Incomes from crop production by oblasts for 2008 (UAH / 1 ha
/ month) – rural areas
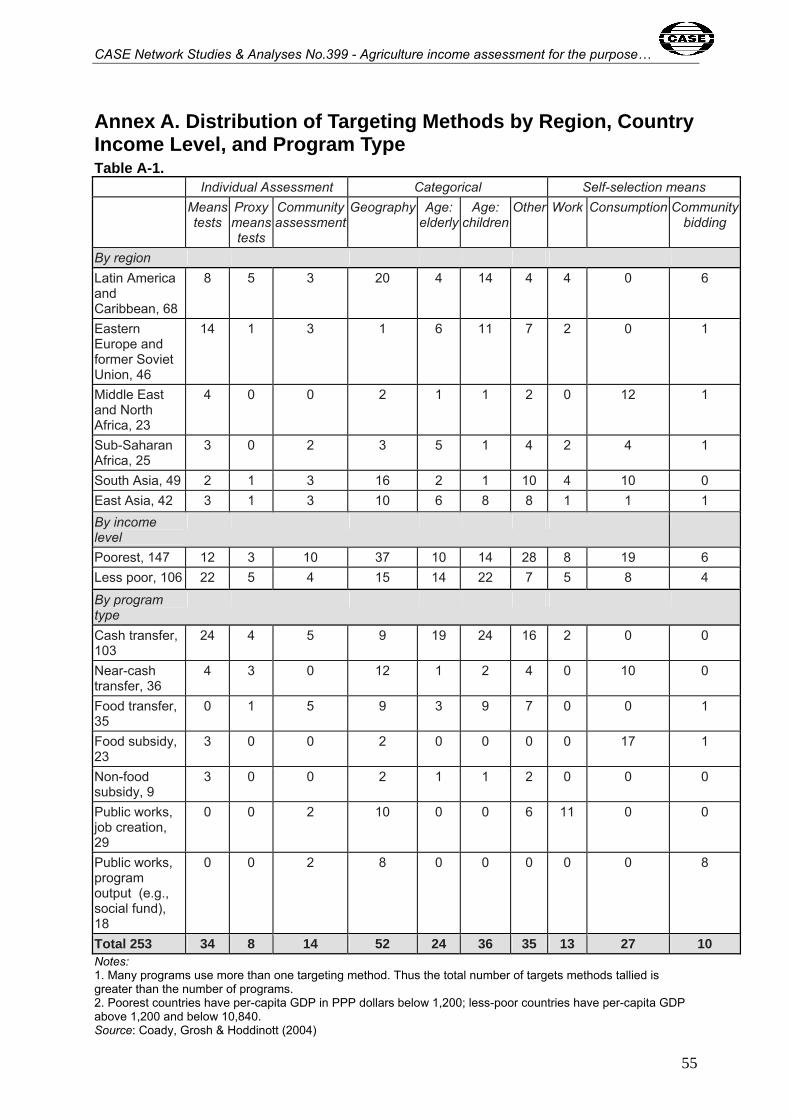
CASE Network Studies & Analyses No.399 - Agriculture income assessment for the purpose…
55
Annex A. Distribution of Targeting Methods by Region, Country Income Level, and Program Type Table A-1. Individual Assessment Categorical Self-selection means Means
tests Proxy means tests
Community assessment
Geography Age: elderly
Age: children
Other Work Consumption Community bidding
By region Latin America and Caribbean, 68
8 5 3 20 4 14 4 4 0 6
Eastern Europe and former Soviet Union, 46
14 1 3 1 6 11 7 2 0 1
Middle East and North Africa, 23
4 0 0 2 1 1 2 0 12 1
Sub-Saharan Africa, 25
3 0 2 3 5 1 4 2 4 1
South Asia, 49 2 1 3 16 2 1 10 4 10 0 East Asia, 42 3 1 3 10 6 8 8 1 1 1 By income level
Poorest, 147 12 3 10 37 10 14 28 8 19 6 Less poor, 106 22 5 4 15 14 22 7 5 8 4
By program type
Cash transfer, 103
24 4 5 9 19 24 16 2 0 0
Near-cash transfer, 36
4 3 0 12 1 2 4 0 10 0
Food transfer, 35
0 1 5 9 3 9 7 0 0 1
Food subsidy, 23
3 0 0 2 0 0 0 0 17 1
Non-food subsidy, 9
3 0 0 2 1 1 2 0 0 0
Public works, job creation, 29
0 0 2 10 0 0 6 11 0 0
Public works, program output (e.g., social fund), 18
0 0 2 8 0 0 0 0 0 8
Total 253 34 8 14 52 24 36 35 13 27 10 Notes: 1. Many programs use more than one targeting method. Thus the total number of targets methods tallied is greater than the number of programs. 2. Poorest countries have per-capita GDP in PPP dollars below 1,200; less-poor countries have per-capita GDP above 1,200 and below 10,840. Source: Coady, Grosh & Hoddinott (2004)

CASE Network Studies & Analyses No.399 - Agriculture income assessment for the purpose…
56
Annex B. Selected aspects of current methods of social assistance targeting in Ukraine. Table B-1. Sources of income included in total income defined for the purpose of
social assistance eligibility Monetary Income
Included Excluded gross wages, lump-sum payable at child-birth other cash payments of a regular nature, funeral benefits incomes from entrepreneurship and other professional activities,
one-time allowances granted by executive authorities or local governments or other institutions
all types of remuneration for free-lance jobs, voluntary health insurance paid by employers stipends, pensions, benefits incomes of conscripts assistance for education granted by enterprises, institutions or organisations,
income from land plots is use or ownership of old-age, disabled persons or multi-small-children families31
compensatory payments, one-off benefit to women decorated with Mother Hero Honorary Degree32
alimony, assistance from civic and charitable associations temporary disability benefits, unemployment benefits, payments to Chornobyl victims, rental income, non-work related accident insurance, compensation for wage arrears incomes from land plots for individual farming, provided the land is bigger than 0.06 ha, land plots allocated for gardening, haying, grazing and income from land shares (Ukr. payi)
other incomes that are subject to taxation (including house sale or receiving assets as a gift if not granted by a spouse, parents or a child)
Non-monetary Income Included Excluded
in-kind remuneration state meal benefits granted by schools privileges for housing and utility services housing subsidies assistance from non-governmental and charitable
organizations Source: „Approved by the order dated November 15, 2001 of the Ministry of Labour and Social Policy, Ministry of
Economy and European Integration, Ministry of Finance, State Statistics Committee, and State Committee on Youth, Sport and Tourism of Ukraine, № 486/202/524/455/3370
31 It is assumed that such individuals cannot effectively use the land plots so they cannot get any income out of it 32 mothers of 10 children

CASE Network Studies & Analyses No.399 - Agriculture income assessment for the purpose…
57
Table B-2. Land income normatives as of 1999 Land for crop production,
monthly Rural areas Urban areas
Haymaking*, monthly
Grazing lands*, monthly
AR of Crimea 0.48 0.91 0.61 0.34 Vinnytsia 0.28 0.48 1.05 0.53 Volun 0.18 0.29 1.07 0.77 Dnipropetrovsk 0.31 0.58 1.33 1.07 Donetsk 0.29 0.52 1.21 0.77 Zhytomyr 0.22 0.37 1.39 0.86 Transcarpathian 0.30 0.50 3.16 1.99 Zaporizhzhya 0.21 0.40 1.26 0.67 Ivano-Frankivsk 0.17 0.28 1.34 0.9 Kyiv 0.35 0.71 3.12 1.34 Kirovohrad 0.19 0.32 1.35 0.79 Luhasnk 0.19 0.36 1.05 0.47 L’viv 0.20 0.37 1.46 1.69 Mykolayiv 0.26 0.43 1.34 1.14 Odesa 0.19 0.36 0.74 0.41 Poltava 0.20 0.33 1.35 0.56 Rivne 0.17 0.28 1.21 0.56 Sumy 0.19 0.32 1.42 0.56 Ternopyl 0.16 0.26 1.78 0.71 Kharkiv 0.23 0.42 1.16 0.54 Kherson 0.18 0.31 0.45 0.3 Khmelnytsk 0.18 0.30 1.26 0.64 Cherkasy 0.27 0.44 1.71 0.32 Chernivtsi 0.21 0.35 1.22 0.49 Chernihiv 0.23 0.39 1.25 0.22 City of Kyiv — 0.71 — — City of Sevastopol — 0.91 — —
Notes: * for plots used for haymaking and cattle grazing, income standards have been calculated per milk price on the level of UAH 0.3/kg Source: State Statistics Committee

CASE Network Studies & Analyses No.399 - Agriculture income assessment for the purpose…
58
Annex C. Review of agriculture income assessment practices in 5 countries compared to Ukraine. Table C-1.
Kazakhstan Kyrgyzstan Moldova Russia Poland Ukraine
1. Type of information on income estimates from crop production
normatives per 1 ha normatives per 1 ha normatives per 1 ha normatives per 1 ha normatives per 1 ha normatives per 1 ha; in some regions normatives for pastures and hayfields expressed as normatives per 1 cow.
2. Source for normatives Local authorities (CSO provides information about crops yield and cost of production)
N/A CSO CSO CSO Originally in 1998 Ministry of Economy, Agriculture, Labour and Social Policy and Finance; later - local administration
3. Data used for setting the crop normatives
crops yield, prices and costs of production
N/A crops yield, prices and costs of production
crops yield, prices and costs of production
crops yield, prices and costs of production
costs of production, sales prices, closeness to market outlets; for pastures: milk productivity, costs and prices for milk; in some oblasts for payi rented without lease agreement - monetary land value
4. Differentiation of crop normatives
- climate/economic zones
(1a) across 6 climatic zones (for yield and cost of production)
Not applicable across geographical zones
(3) some federal units do not consider income for unfavourable climate zones
(1) across 4 climate/economic conditions' zones
Not applicable
- administrative units (1b) prices are defined by regional authorities based on information from local offices of National statistics agency
(1) across regions geographical zones are compiled based on administrative units
(1) across federal units Not applicable (1) across regions (oblasts); for payi as well as for regular land in some oblasts - also across rayons; in some oblasts farmstead normatives across rural and urban areas
- quality of land Not applicable (2) across quality of land (yield classes) within each region
(3) across quality of land (yield classes) within each geographical zone: zone normative (assumed for an average land quality) is adjusted for the quality of land of an applicant
(2) across types of land (2) across 8 types of land quality (6 in case of pastures); effectively 23 normatives altogether; 17 in case of pastures
Not applicable
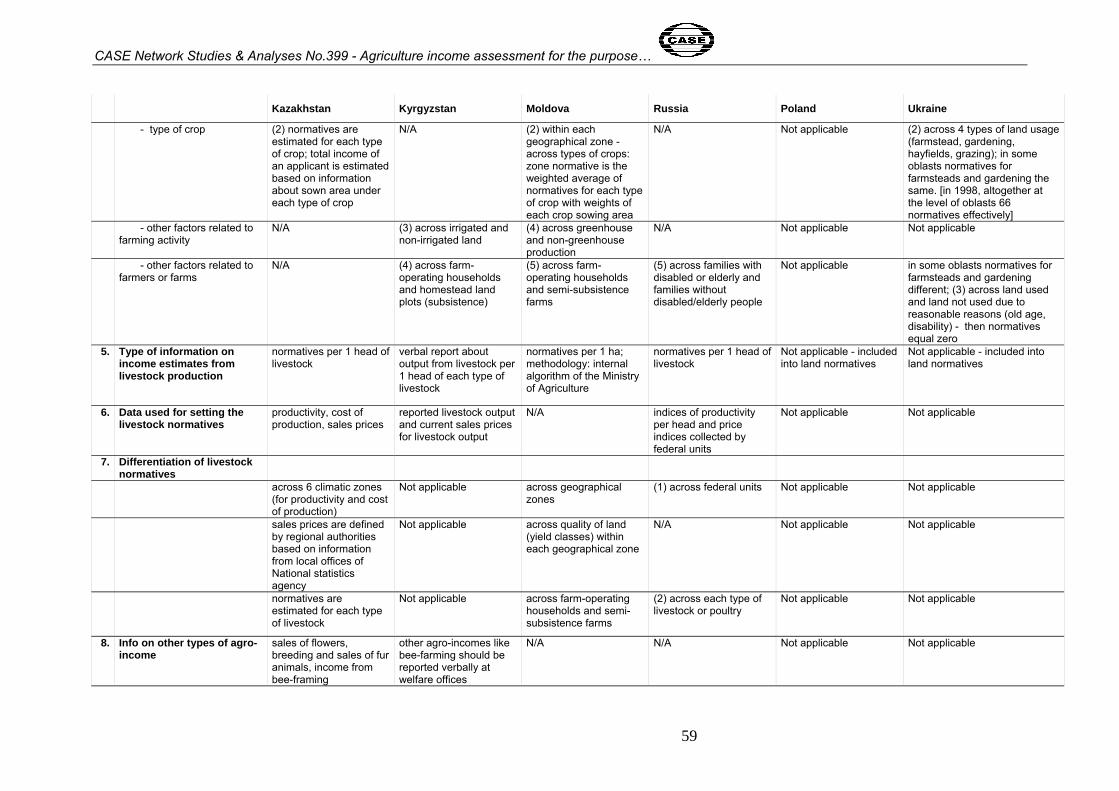
CASE Network Studies & Analyses No.399 - Agriculture income assessment for the purpose…
59
Kazakhstan Kyrgyzstan Moldova Russia Poland Ukraine
- type of crop (2) normatives are estimated for each type of crop; total income of an applicant is estimated based on information about sown area under each type of crop
N/A (2) within each geographical zone - across types of crops: zone normative is the weighted average of normatives for each type of crop with weights of each crop sowing area
N/A Not applicable (2) across 4 types of land usage (farmstead, gardening, hayfields, grazing); in some oblasts normatives for farmsteads and gardening the same. [in 1998, altogether at the level of oblasts 66 normatives effectively]
- other factors related to farming activity
N/A (3) across irrigated and non-irrigated land
(4) across greenhouse and non-greenhouse production
N/A Not applicable Not applicable
- other factors related to farmers or farms
N/A (4) across farm-operating households and homestead land plots (subsistence)
(5) across farm-operating households and semi-subsistence farms
(5) across families with disabled or elderly and families without disabled/elderly people
Not applicable in some oblasts normatives for farmsteads and gardening different; (3) across land used and land not used due to reasonable reasons (old age, disability) - then normatives equal zero
5. Type of information on income estimates from livestock production
normatives per 1 head of livestock
verbal report about output from livestock per 1 head of each type of livestock
normatives per 1 ha; methodology: internal algorithm of the Ministry of Agriculture
normatives per 1 head of livestock
Not applicable - included into land normatives
Not applicable - included into land normatives
6. Data used for setting the livestock normatives
productivity, cost of production, sales prices
reported livestock output and current sales prices for livestock output
N/A indices of productivity per head and price indices collected by federal units
Not applicable Not applicable
7. Differentiation of livestock normatives
across 6 climatic zones (for productivity and cost of production)
Not applicable across geographical zones
(1) across federal units Not applicable Not applicable
sales prices are defined by regional authorities based on information from local offices of National statistics agency
Not applicable across quality of land (yield classes) within each geographical zone
N/A Not applicable Not applicable
normatives are estimated for each type of livestock
Not applicable across farm-operating households and semi-subsistence farms
(2) across each type of livestock or poultry
Not applicable Not applicable
8. Info on other types of agro-income
sales of flowers, breeding and sales of fur animals, income from bee-framing
other agro-incomes like bee-farming should be reported verbally at welfare offices
N/A N/A Not applicable Not applicable
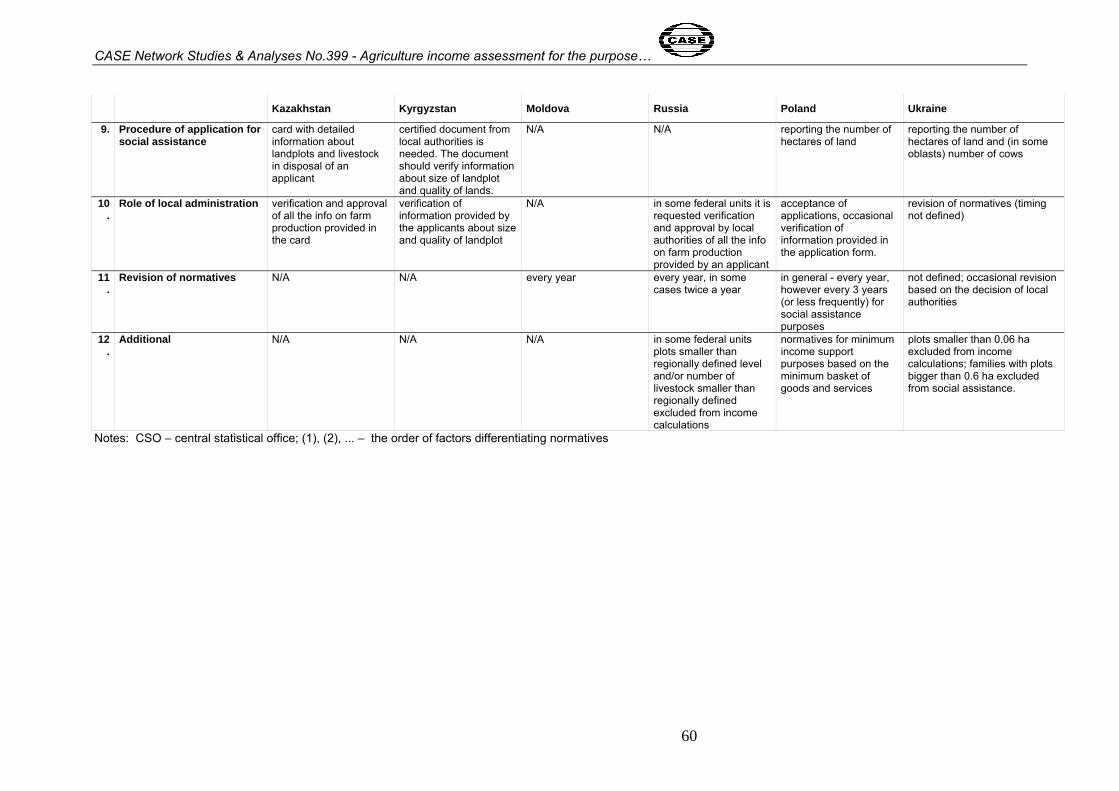
CASE Network Studies & Analyses No.399 - Agriculture income assessment for the purpose…
60
Kazakhstan Kyrgyzstan Moldova Russia Poland Ukraine
9. Procedure of application for social assistance
card with detailed information about landplots and livestock in disposal of an applicant
certified document from local authorities is needed. The document should verify information about size of landplot and quality of lands.
N/A N/A reporting the number of hectares of land
reporting the number of hectares of land and (in some oblasts) number of cows
10.
Role of local administration verification and approval of all the info on farm production provided in the card
verification of information provided by the applicants about size and quality of landplot
N/A in some federal units it is requested verification and approval by local authorities of all the info on farm production provided by an applicant
acceptance of applications, occasional verification of information provided in the application form.
revision of normatives (timing not defined)
11.
Revision of normatives N/A N/A every year every year, in some cases twice a year
in general - every year, however every 3 years (or less frequently) for social assistance purposes
not defined; occasional revision based on the decision of local authorities
12.
Additional N/A N/A N/A in some federal units plots smaller than regionally defined level and/or number of livestock smaller than regionally defined excluded from income calculations
normatives for minimum income support purposes based on the minimum basket of goods and services
plots smaller than 0.06 ha excluded from income calculations; families with plots bigger than 0.6 ha excluded from social assistance.
Notes: CSO – central statistical office; (1), (2), ... – the order of factors differentiating normatives

CASE Network Studies & Analyses No.399 - Agriculture income assessment for the purpose…
61
Roman Semko
Annex D. Recommended methodologies for estimating agriculture income normatives Following our recommendation of expressing the income from crop production as average
income per 1 ha and the income from livestock production as an average income per head
for the main types of livestock, we proposed two methods of estimating those normatives.
Method (1), where calculation of normatives was based on the Statistical Reporting Data by
agricultural enterprises, appeared to have some obstacles associated with a rather weak
reflection of the reality of farmsteads in agriculture enterprise statistics. The results of the
second method, based on HBS data set, are more realistic.
Method (2). Calculating normatives based on Household Budget Survey
Data Components of income from crop production include: income from selling plant products,
cost of consumed foodstuffs taken from own farmstead (bread and baked products; oil and
vegetable fat; fruit; vegetables including potato, other root vegetable, and mushrooms;
mineral water, soft drinks and juice).
Components of plant growing costs include: goods needed for plant growing, services
needed for plant growing, animal insurance, land tax, land rental and other costs incurred by
a farmstead.
Components of income from livestock production include: income from selling animals,
income from selling animal products, cost of consumed livestock products taken from own
farmstead (meat, fish, milk, cheese, eggs, butter, margarine, jam and honey).
Components of livestock breeding costs include: goods needed for animal production; feeds
and food products for feeding animals, poultry, and bees; services needed for animal
production; purchase of animals.
Table D-1: Structure of income from crop production, based on HBS (UAH/ha/month) Average value per hectare per household
(UAH / hectare) Income components All farmsteads Urban
farmsteads Rural
farmsteads Income from selling plant products 135 202 108 Bread and baked products 2 1 3 Oil and vegetable fat 0 0 0 Fruit 101 267 34 Vegetables including potato and other root vegetable; mushrooms 1087 2660 455
Mineral water, soft drinks and juice 53 134 21 Total 1379 3264 622 Source: own calculations based on HBS 2008

CASE Network Studies & Analyses No.399 - Agriculture income assessment for the purpose…
62
An average farmstead income from growing crops on 1 ha of land is more than 5 times
higher in towns than in rural areas due to much higher prices. The main income comes from
consuming own vegetables, especially potatoes that is income in-kind (81% of total income
in case of urban areas and 73% in case of rural areas). The numbers may be distorted
slightly by self-stocking of some products; at the same time, the total costs do not include
expenses for goods and services needed for self-stocking. The average costs per hectare
are UAH 342 in cities and UAH 87 in villages; expenses for purchasing necessary goods and
services account for over 95 percent of total costs incurred by farmsteads in both areas.
Algorithm for calculating the Standard Net Income (normative) from plant growing
1. The net income from 1 hectare of agricultural land shall be defined as the difference
between the household's income from plant growing and the costs incurred and adjusted
for the effective area of the agriculture land (i.e. after deducting 0.06 ha which is free of
income estimation).
, (1)
, (2)
where:
is the household's net standard income from 1 ha of the land (UAH);
is the household's income from plant growing (UAH);
is the costs of plant growing incurred by the household (UAH);
is the effective area of the agriculture land (ha);
is the total area of agriculture land owned by the household (ha).
2. The total standard net income from 1 hectare of agricultural land in oblast is equal to
the average weighted value of net incomes (applying household statistical weights):
, (3)
where:
is the oblast;
is the net standard income from 1 ha of land in oblast (UAH);
is the net standard income from 1 ha of land of household j in oblast (UAH);
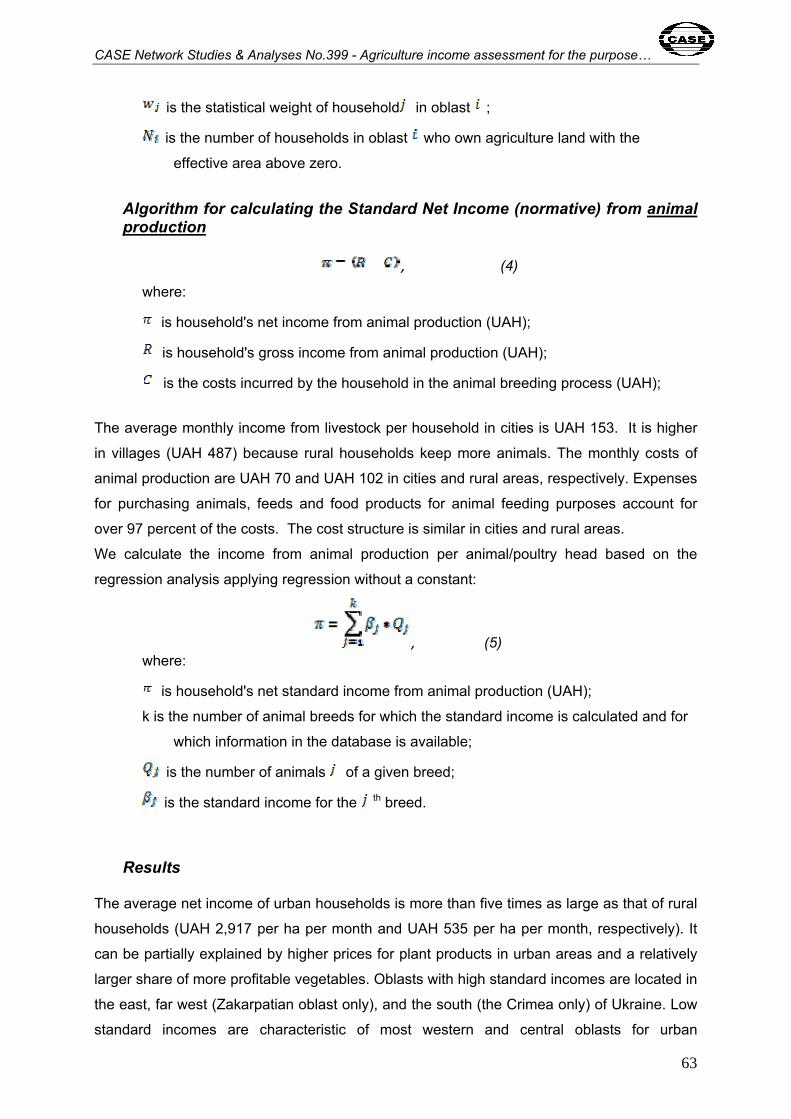
CASE Network Studies & Analyses No.399 - Agriculture income assessment for the purpose…
63
is the statistical weight of household in oblast ;
is the number of households in oblast who own agriculture land with the
effective area above zero.
Algorithm for calculating the Standard Net Income (normative) from animal production
, (4)
where:
is household's net income from animal production (UAH);
is household's gross income from animal production (UAH);
is the costs incurred by the household in the animal breeding process (UAH);
The average monthly income from livestock per household in cities is UAH 153. It is higher
in villages (UAH 487) because rural households keep more animals. The monthly costs of
animal production are UAH 70 and UAH 102 in cities and rural areas, respectively. Expenses
for purchasing animals, feeds and food products for animal feeding purposes account for
over 97 percent of the costs. The cost structure is similar in cities and rural areas.
We calculate the income from animal production per animal/poultry head based on the
regression analysis applying regression without a constant:
, (5) where:
is household's net standard income from animal production (UAH);
k is the number of animal breeds for which the standard income is calculated and for
which information in the database is available;
is the number of animals of a given breed;
is the standard income for the th breed.
Results
The average net income of urban households is more than five times as large as that of rural
households (UAH 2,917 per ha per month and UAH 535 per ha per month, respectively). It
can be partially explained by higher prices for plant products in urban areas and a relatively
larger share of more profitable vegetables. Oblasts with high standard incomes are located in
the east, far west (Zakarpatian oblast only), and the south (the Crimea only) of Ukraine. Low
standard incomes are characteristic of most western and central oblasts for urban

CASE Network Studies & Analyses No.399 - Agriculture income assessment for the purpose…
64
households, and western, central, and southern oblasts for rural households. Standard
incomes in northern oblasts are characterized by average values.
The monthly income per cow in rural areas is UAH 387; it is slightly smaller in cities (UAH
372). The normatives for the remaining livestock in urban and rural areas differ significantly.
The income from one cattle other than cow or one pig is nearly 10 times smaller.
In general, the net income normatives calculated based on HBS data are more realistic than
numbers received under Method (1), in terms of their average value (much higher if based on
HBS) and differentiation across the regions.
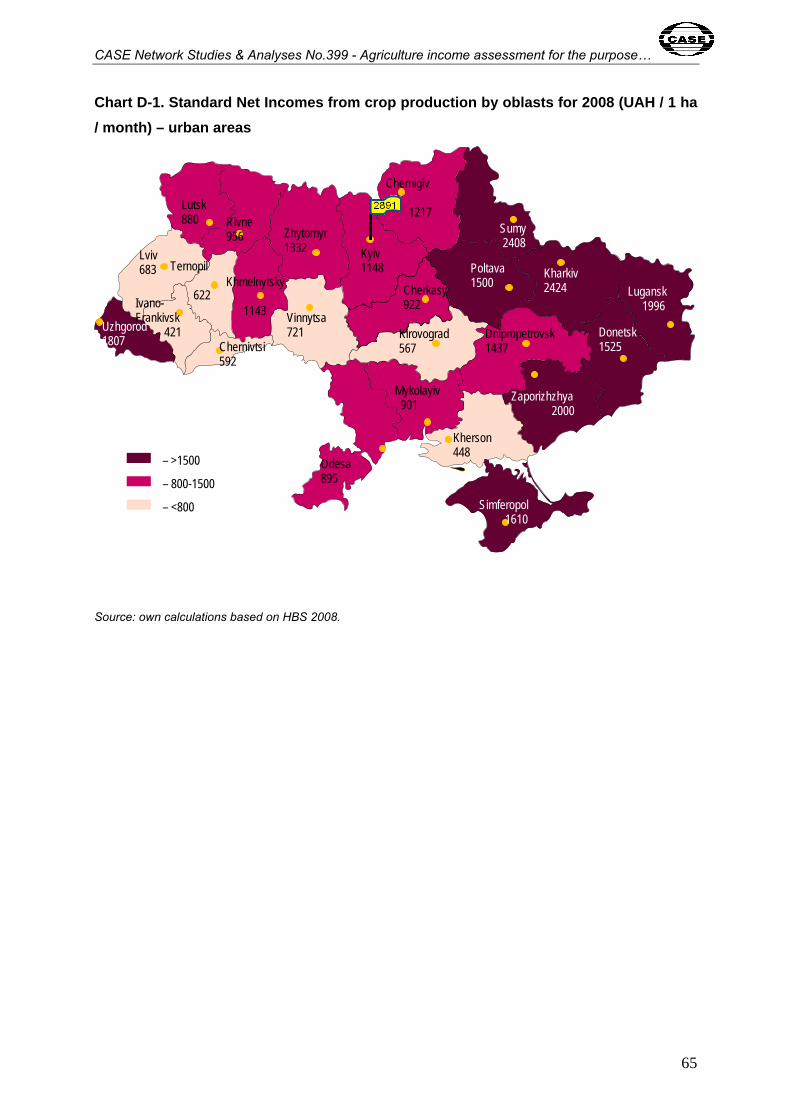
CASE Network Studies & Analyses No.399 - Agriculture income assessment for the purpose…
65
Chart D-1. Standard Net Incomes from crop production by oblasts for 2008 (UAH / 1 ha / month) – urban areas
Source: own calculations based on HBS 2008.
Lviv 683
Lutsk 880
Rivne 956
Ternopil 622 Ivano-
Frankivsk 421 Uzhgorod
1807 Chernivtsi
592
Vinnytsa 721
Zhytomyr 1332
Chernigiv 1217
Sumy 2408
Kharkiv 2424
Poltava 1500 Cherkasy
922
Kirovograd 567
Odesa 895
Kherson 448
Mykolayiv 901 Zaporizhzhya
2000
Dnipropetrovsk 1437
Lugansk 1996
Donetsk 1525
Simferopol 1610
Kyiv 1148 Khmelnytsky
1143
– >1500
– 800-1500
– <800

CASE Network Studies & Analyses No.399 - Agriculture income assessment for the purpose…
66
Chart D-2. Standard Net Incomes from crop production by oblasts for 2008 (UAH / 1 ha / month) – rural areas
Source: own calculations based on HBS 2008.
Lviv 535
Lutsk 467
Rivne 404
Ternopil 256 Ivano-
Frankivsk 296 Uzhgorod
1260 Chernivtsi
256
Vinnytsa 387
Zhytomyr 274
Chernigiv 389
Sumy 278
Kharkiv 671
Poltava 634 Cherkasy
572
Kirovograd 189
Odesa 512
Kherson 279
Mykolayiv 215
Zaporizhzhya 1050
Dnipropetrovsk 589
Lugansk 1009
Donetsk 858
Simferopol 1519
Kyiv 475 Khmelnytsky
239
– >600
– 300-600
– <300
Related Documents