Study into changes in case mix for adult hospital admission in a medical specialties’ in Colchester 1991 and 1995: Using Severity of Disease Measurement. by Gregory A. Benn-Ohikuare Department of Public Health and Epidemiology The University of Birmingham Medical School Dissertation Submitted to the Faculty of Medicine of the University of Birmingham for part of the Master in Public Health and Epidemiology; (M.P.H)

Welcome message from author
This document is posted to help you gain knowledge. Please leave a comment to let me know what you think about it! Share it to your friends and learn new things together.
Transcript
Study into changes in case mix for adult hospitaladmission in a medical specialties’ in Colchester 1991 and 1995:Using Severity of Disease Measurement.
b y
Gregory A. Benn-Ohikuare
Department of Public Health andEpidemiology The University ofBirmingham Medical School
Dissertation Submitted to the Faculty of Medicine of the University of Birmingham for part of the
Master in Public Health and Epidemiology; (M.P.H)

June 1997
33
CONTENTS
ABSTRACT ..................................3
BACKGROUND AND INTRODUCTION ................7LITERATURE REVIEW ..........................15
Case Mix and Measurement of case mix severity ...............................15What are the variables that goes into case mix ....................................16What are the benefits of case mix 17What are the different measures of case mix........................................17What causes variation in case mix .....25What are case mix limitations 26 Studies conducted on case mix and theirimplications 27
Study which looked at how case mix could be analysed using different types ofmeasurement methodology .........27 Study which examines case mix variationsusing disease andseverity ofillnessmeasurementtechniques 29 Study which examines case mix differencesbetween teaching and non-teachinghospitals 30
SUMMARY OF THE LITERATURE, HYPOTHESIS AND PUBLICHEALTH IMPORTANCEMETHOD 35
Patients and Method ...................35Selection of study cases and Data collection 35
Sampling Methods 36How the pilot study was conducted 38
Variables that measures the severity of disease
at admission ...................42 Measurement of case mix severity of
patients illness .................43
RESULT ..................................... 44The distribution of patients admission by genderin 1991/92 and 1995/96 44The distribution of patients sample cases by year ................................46The distribution of patient case notes for analyses ...............................47Case note analyses findings ...........47
DISCUSSION ..................................52Main Findings 52The implications of the results 52The limitation of the study ...........54 Explanation of the result by evaluating therole ofchance, bias, and confounding in the study ........................................55Criticism of laboratory investigation effect on study.. 60Comparison with previous study .........61
CONCLUSION 64Implication to Public Health ..........65Lessons learnt 67Recommendation for future work .........68
BIBLIOGRAPHY ...............................69
APPENDIX ...................................71Appendix 1 ............................71Definition of sickness at admission variables 71Appendix 2 ............................73Statistical calculation formula used ...73Appendix 3 ............................ 77
The ten individual diagnostic categoriesused in the study derived from one primaryorgan system .....................77
Appendix 4 .......................... 78 Characteristics of severity measurement
system 78Appendix 5 ........................... 79
Data scoring form 79Appendix 6 ........................... 83Data recording form ..................83Appendix? ............................ 87Method applied for the calculation of the

mean difference for APACHE II score andcomponent parts………………………………………… . …… .87Appendix 8............................. 89
Documents, letters and Excel Spreadsheets...................... 89
3
ABSTRACT
Objectives
1. To analyse the Severity of illness in 1991 and 1995.
2. To compare the differences between 1991 and 1995.3. To compare differences between 1991 and 1995
with previous study in 1985 and 1990.
4. To describe the trend in severity of illness over 10year period 1985 and 1995.
Design
Retrospective cross-sectional case note study of admissions to a medical speciality in Colchester General Hospital in 1991 and 1995.
Setting
Emergency admissions to an acute medical bed in Colchester General Hospital in 1991 and 1995.
4
Subject
2500 admissions of patients suffering from acute chest disease, who are 65 years old or more, whose admission and discharge diagnosis was recorded strictly as pneumonia; asthma; or bronchitis.
1991: Pneumonia, asthma and bronchitis : ICD 9 codes 480 to 4961995: Pneumonia : ICD 10 codes J18.0 to J18.9
Bronchitis : ICD 10 codes 120.0 to J20.9Asthma : ICD 10 codes J45.0 to J45.0
Method
Case mix severity was measured using Acute Physiology and Chronic Health Evaluation (APACHE11). 3
Results
The findings from the result was that mean APACHE II score rose from 15.63 (SE 0.54) in 1991 to 16.33 , standard error (SE 0.54) in 1995. The difference in the distribution of APACHE II scores by Two-Sample t-Test was found to be statistically not significant (P<0.10).

The mean age difference in 1995 was 1.27 higher thanin 1991. This was found to be statisticallysignificant (P<0.01).
The mean difference of the acute physiology score was 0.61 higher in 1995 than in 1991. This was found to bestatistically not significant (P<0.10) .
The mean difference of the History of Chronic status scorewas 0.11 higher in 1995 than in 1991. This was found to benot significant by the Two-Sample t-Test (P<0.10)
Discussion
The main finding from this study was that case mix severity of illness at admission, using APACHE II score, was slightly higher in 1995 than in 1991 and the mean difference was statistically not significant (P<0.10). However, when this is compared to previous study in 1985 and 1990 result, differences found in the mean APACHE score was much higher in 1985 and 1990 than in 1991 and 1995.
In view of the fact that the age category of the patientsinvestigated in this study were elderly, the cause of themean difference in the overall APACHE II score could be associated with several factors such as gender
differences, age, varying hospitals admission policy, increase threshold in admission, patient presenting illness too late and or increase in the incidence of severe illness in the community.
However, it is difficult to link any of the above causal suggestions to my result without setting out the design of the study in such a way to incorporate these attributes for measurement.
6
Whatever the reason, my study has provided a reasonable follow-up investigation to support the continuing concernsfrom the GPs (General Practitioners) and the hospital Physicians that admission of patients into acute medical bed is becoming difficult, emergency is going up and case mix is in the increase. However, the increase in the case mix has to be weighted against the fact that, the observeddifference in the mean APACHE 11 score was found to be statistically not significant (p<0.10).
Conclusion
Despite the increase in the APACHE II score in the measurement of case mix severity of illness at admission for acute respiratory condition, the difference in the score was statistically not significant (P< 0.10) . This meant that one cannot reject the hypothesis that there isno difference between 1991 and 1995.

7
BACKGROUND & INTRODUCTION
Population change :
Essex Rivers Health care (NHS) Trust catchment area of which Colchester is one includes Tendring and part of Braintree. Colchester is the fourth largest district inEssex. The mid-1993 population estimate for the Boroughstands at 149,100 representing 9.6% of the county's population. Only Southend-on-Sea, Basildon and Chelmsford are larger (10.7%, and 10.0% of the county'spopulation resceptively).
Between 1992 and 1993, the population grew by 500. Although this is a comparatively small increase, over theperiod 1991 to 1993 as a whole Colchester was nevertheless the second fastest growing district in Essex, with 3,200 more people than in 1991, an increase of 22%.The Borough is one of only a handful of district in the South East region whose population grew at more than double the regional rate between 1991 and 1993 (0.8%).59.4% of the increase in population 1991 - 1993, or1,900 people, was due to migration (more people moving into the Borough to live than moving out). This is the third highest gain due to migration in Essex after Southend-on-Sea and Tendring (5,200 and 3,200 people respectively).

There are now almost 11,000 more people in Colchester than there were in 1981, an increase of 7.8%. Only Chelmsford and Tendring have experience bigger population increase than this (16,000 and 14,000 peoplerespectively) 1.

"4' kJ
t iStratford S Mary ...`b
ESSEX.emot CU 0,•Je
J . : . • N b , "
96 4,440497-\ 98 0 99 go 01 02-
:03U i u m a l l o 1 , -• • • • : — .
Da Lethorpg
tiqxted.3A-Srtins l,--- •9e''nu ns
44, ' (Flotry:7—'--------t1 Fcw..;.„Work h ouse.`f 8
..-i--Frti . •
....2.1 • i a.
Pond Ha •-2N•e,
eweet· ' 0
Parney Heath Lamb
11-lospt
Stour Fm
2
2 0- - z"p • ; 6 - 0 4 - - , -
Ayi, . . 1 1 A r g a g'12.thir-vall jp .....* 1
BIasecenwoodiFR2
§ MP • 111,.
E
Tye Fm
Cleavelantl
A7•FiP41
____ . ast DOEll air/ . lie," _ •,.. Y•riOr". .
'131,- • '=•---" -W-6· -Went Hawse Fm r.L. "
ArdHeaS•rrsa s
Foun -in Fm
Etrkoritesh--Fm
Vi4iesse
9 6stwood Park
O p
J .
ArdLeilah-

8
Population Structure
The 20-24 years age group is the largest in the Borough, at 13,100 persons in 1993. This is followed bythe 25-29 years age group, at 12,500. Over one-sixth ofthe Borough's population falls into these two age groups (17.2%).
There are 37,700 children and young people aged under 20in the Borough, over a quarter of the population (25.3%). Over a fifth are aged 30-44 (31,600, 21.3%), a further 29,400 (19.7%) are aged between 45 and personable age, and 25,100 (16.8%) are pensioners over the age of 65 years.
Although the numbers of men and women are quite evenly balanced in the population asa whole, this differs with age. Up to age 44, there are more men than women in the population, particularly amongst 20-29 years old. However, this changes from age 45, with women making up 53.8% of the population overall.The population of women continues to rise through the older age groups.
Colchester's population is 'ageing'. In 1981, the 15-19 years group was the largest at 12,100 persons, and in all, almost a third of the population were aged under 20(29.9%, 41,300 persons). Since then the numbers of
children and teenagers have fallen by 3,600 (8.7%), witha larger fall of 21.5% in the numbers of 15-19 years old. This has been accompanied by significant increases in the older age groups. 1

l1 /,
North Essex Health Authority Geographical location

2 North Essex Health Authority
1...n n,,,I m hr,„"
t
4. 0..
•
m-s s• • ,
k I L.,. ke.snev
\
lirets 61
etnp.;.ai
f
StPcscr s rt.spPraxnrkl HcK9n.L1
19.11.n.c 411asp,u/
Prm.0,-,AL....AIM:if 11..
•••
St NS-irgarri r 1-(040.4.4
Location of Hospitals within North Essex
W a r
9
PopulatiYear
138,3001981
145,900
1991
14910199
156,0002001 (esimated)
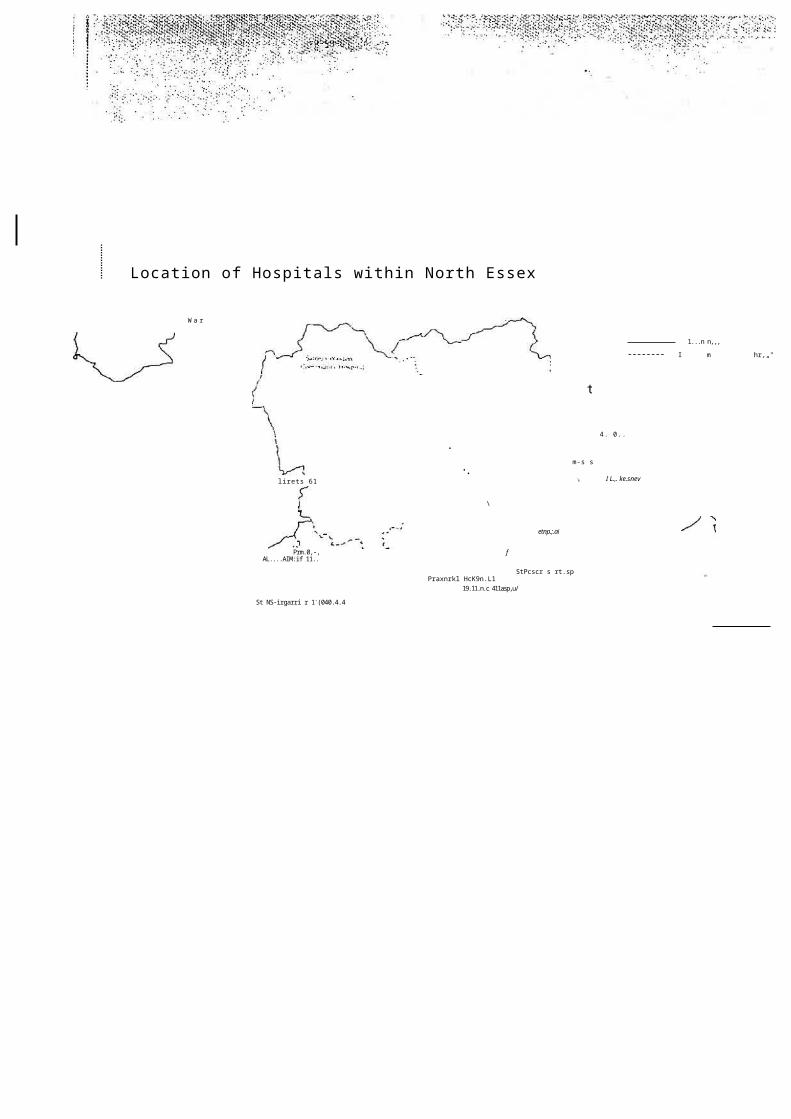
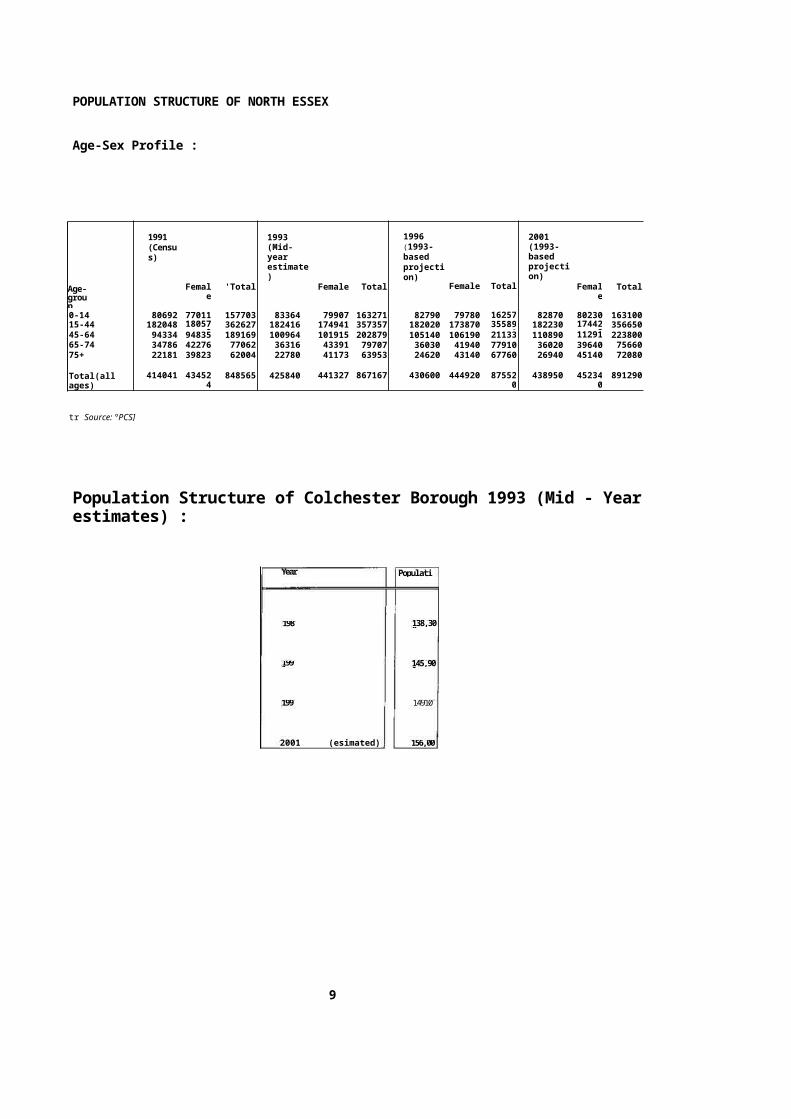
POPULATION STRUCTURE OF NORTH ESSEX
Age-Sex Profile :
Age-group
1991 (Census)
Female
'Total
1993 (Mid-year estimate)
Female Total
1996 (1993-based projection)
Female Total
2001 (1993-based projection)
Female
Total
0-14 80692 77011 157703 83364 79907 163271 82790 79780 162570
82870 80230 16310015-44 182048 18057
9362627 182416 174941 357357 182020 173870 35589
0182230 17442
0356650
45-64 94334 94835 189169 100964 101915 202879 105140 106190 211330
110890 112910
22380065-74 34786 42276 77062 36316 43391 79707 36030 41940 77910 36020 39640 7566075+ 22181 39823 62004 22780 41173 63953 24620 43140 67760 26940 45140 72080
Total(all ages)
414041 434524
848565 425840 441327 867167 430600 444920 875520
438950 452340
891290
tr Source: °PCS]
Population Structure of Colchester Borough 1993 (Mid - Yearestimates) :
10
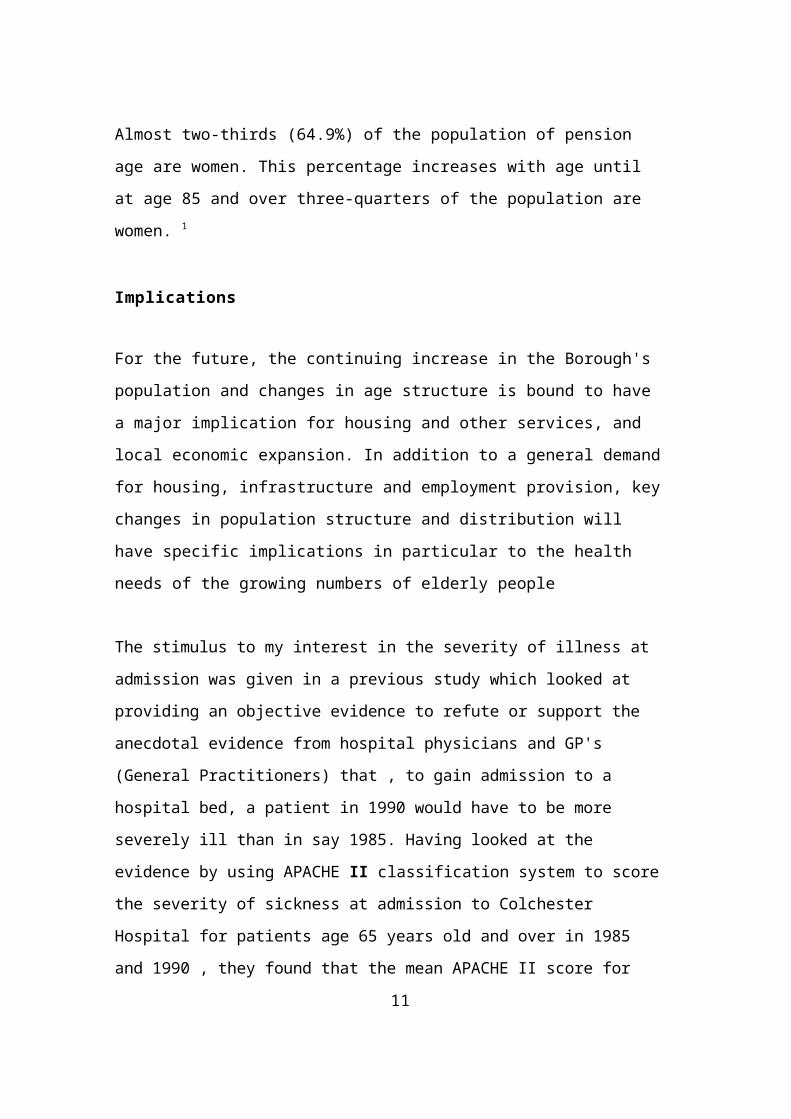
Elderly Population
There are 25,100 people of pension-able age (women from
age 60, men from age 65) in the Borough, with over a third of these aged 75 and over (9,700 people). This
figure is 2,500 higher than in 1981, an increase of 11.1%.
The size of the pension population is increasing faster than the size of the population as a whole. Between 1981 and 1993, the total population increased by 7.9%, 3.2 percentage points lower than the increase in the pensioner population. Between 1992 and 1993, there was anincrease of 200 (0.8%) in the population of pension age, almost three times the increase in the population as a whole (0.3%).
There are marked differences within this broad age group.There has been little change in the 65-69 years age group, while the 80 and over age groups have increased consistently both over the longer period and more recently. Between 1981 and 1993, the 80-84 years age group increased by 39.1%, whiles the 85 and over group increased even more dramatically by 60.0%. The increase in the 85 and over group was the largest percentage increase in the Borough between 1981 and 1993.
Between 1981 and 1993, the size of the total population aged 75 and over increased by 27.6% (2,100 people). Thisis a higher percentage increase than that experienced byEngland and Wales as a whole since 1981 (22.7%).
Since 1991, the 80-84 and 85 and over age groups have increased by 6.7% and 9.1% respectively. The 75-79 yearsgroup, although increasing by 7.9% over the longer period, has fallen back recently, decreasing in size by 8.9% between 1991 and 1993.
11
Almost two-thirds (64.9%) of the population of pension age are women. This percentage increases with age until at age 85 and over three-quarters of the population are women. 1
Implications
For the future, the continuing increase in the Borough's population and changes in age structure is bound to have a major implication for housing and other services, and local economic expansion. In addition to a general demandfor housing, infrastructure and employment provision, keychanges in population structure and distribution will have specific implications in particular to the health needs of the growing numbers of elderly people
The stimulus to my interest in the severity of illness at admission was given in a previous study which looked at providing an objective evidence to refute or support the anecdotal evidence from hospital physicians and GP's (General Practitioners) that , to gain admission to a hospital bed, a patient in 1990 would have to be more severely ill than in say 1985. Having looked at the evidence by using APACHE II classification system to scorethe severity of sickness at admission to Colchester Hospital for patients age 65 years old and over in 1985 and 1990 , they found that the mean APACHE II score for

1990 was statistically significantly higher than in 1985. 2
12
Although, they found that there was a statistical significance between the mean difference between 1985 and 1990, they concluded that this result does not confirm that there is a link between the level of severity of sickness at admission and the difficulty in gaining admission into hospital beds in 1985 or in 1990 but that, they have been able to provide an objective data for the concerns raised by the GP's and hospital admission Physicians.
My interest, therefore, is to conduct a follow-up study tolook at whether there is a continuing anecdotal evidence of case mix severity of illness at admission in ColchesterHospital in 1991 and 1995 and also whether the APACHE 11 score methodology could be used to provide the evidence.
Measuring how sick a patient is at the time of hospitaladmission is a prerequisite for such studies. In this study report, I present the result of measuring the severity of illness at admission for three illnesses: pneumonia, asthma, and bronchitis, using APACHE II score classification system.
13
My choice of conditions for this problem has been based onthe previous study conducted by Irwin D, et al (1993), which stated their rationale for the choice of those conditions as follows “the effect of a squeeze on medical beds could be to increase the threshold for a decision to admit. For some conditions (e.g. Coma or haematemesis ) there is little option but to admit, for other conditions particularly chest problems the GP and admitting doctor have to make a judgment about whether the patient is ill enough to need inpatient care, and these judgment will be affected by the number of beds in the hospital". 2
The other stimulus was due to the perception held by the hospital physicians that emergency admissions is onthe increase, and that admission of acute patients intomedical bed is becoming difficult and case mix is on the increase and that there is the possibilities, that GP's (General Practitioners) are sending patients frequently to hospital for admission. If this is the case, the threshold for admission into acute medical beds for severely ill patients will be low.
14
Against this back drop, I was intrigued by the APACHE II system, although designed to stratify and predict severity of illness in intensive care unit (ICU) patientsin terms of their likelihood of death. 3 It has been foundto perform well in other 34 diseases categories in a study which included 5815 patients in 13 hospitals in U.S.A. The APACHE II system makes use of laboratory, physiologic, chronic health data, age and the Glasgow Coma scale. The more abnormal the values, the more weightascribed to the abnormality. The APACHE II system has been shown to predict reliably ICU mortality. Thus, it isa physiologic severity measure that was appropriately validated using a physiologic end point death for ICU patients ' 4
Therefore, the aim of my retrospective cross-sectional case note study is to examine the Null hypothesis that there is no difference between 1991 and 1995 in the severity of illness at admission of patient with acute chest conditions into Colchester General Hospital by using APACHE H classification scoring system .
15
LITERATURE REVIEW
Case Mix and Measurement of Case
Mix Severity
What is Case Mix :There are various definitions of case mix and different types of ways of measuring case mix complexity. Case mix is sometimes defined as thevector of illness characteristics and consequentcare requirements of a single patient or group of patients seeking treatment. Concepts such as diagnostics and severity, type of indicated treatment, socio-economic status, physical dependence and age may all be regarded as part of
case mix. 5
Case mix systems are assumed to be entirely exogenous, that is they measure patient characteristics that are independent of the place of treatment.
But in practice, this assumption is not always justified. Recorded diagnostic data give an incomplete picture of the need for care and we usually have to assume treatmentrequirements from actual treatment given. Where 'actual treatment differs from' appropriate treatment measured case mix
will differ from true case mix. When the definition of case mix is based on primary diagnosis, primary diagnosis is recorded using coding schemes. These coding schemes provide a classification of conditions of morbidity and mortality for statistical reporting purposes as well as information retrieval.
16
Other definitions of Case mix is that they are a means of constructing and applying classificationscheme which comprises subgroups of patients possessing similar clinical attributes and outpututilisation patterns. 6
What are the variables that goes into Case mix:
The variables that goes into case mix falls
into two broad groups: indirect or proxy variables and direct patient-related
variables.
Indirect or proxy variables includes such things as hospital bed size, assets per bed, number of facilities, services offered in terms of hours of nursing care, medications and laboratory tests, other hospital characteristics such as surgical complexity and extent of surgery performed.
This involves relating the demographic, diagnosticand therapeutic characteristics of patients to theoutput they are provided so that cases are differentiated by only those variables related to the conditions of the patient (e.g., age, primary diagnosis) and treatment process (e.g., operations) that affect their utilisation of the hospital's facilities. 7
Direct case mix variables is typically based on diagnostic classifications of hospitalised patients.
17
What are the benefits of Case mix:
The partitioning of patients into groups on economic grounds, for certain applications in patient care monitoring, budgeting, cost control reimbursement andplanning is seen as a benefit. Whilst partitioning into groups based on diagnosis or ranges of diagnosesalone, has benefits in terms of uniform reporting of descriptive statistics about a population. It is not sufficient for defining cases with respect to output utilization only. Other variables such as surgical procedures and age of patient in conjunction with diagnosis are necessary to describe adequately sets of patients with similar utilisation patterns of inpatient facilities. 6
What are the different measures of Case mix :
There are several different methods used for quantifying case mix. They fall into two major sections. Firstly, there are methods which are based on diagnosis classification system. Secondly, there are methods which are single dimensional measures.
Diagnosis Classification Systems:
These provides alternative methods of defining and classifying the

multiple types of cases treated by the hospital. Theyare created by aweighted aggregation of individual cases. Their importance is based on the fact that diagnosis is a hypothesis regarding the nature of the patient's illness, which contains four elements: aetiology, location, manifestation, and severity
18
In view of the fact that diagnosis is such a focal point in the physician's interaction with the patient, diagnosis classification system provides the means of establishing the relevant technology ofcare and, hence, the types and levels of resources required to treat the illness. For this reason, diagnosis classification system was developed to measure hospital output in such a way that it is used to group patients according to similarities anddifferences in their diseases.
The diagnosis classification systems used for measuring case mix are ICD's (International Classification of Disease) currently up to
version 10; Disease staging; Diagnostic Related Groups (DRG's); Hospital Resources Group (HRG's); OPCS 4 Procedure Codes; Read codes; Patient Management Categories (PMC); and Patient Severity index (PSI). 8
ICD's (International Classification System): Many versions of the International Classification of Disease (ICD) have been produced over the past years. The most recent version of the classification system is the ICD-10, which was published in 1993.

ICD-9-CM, which was a modification of ICD-9 version (1977); was published in 1978 and stayed in existence until 1993, when it was replaced by ICD-10.
19
ICD-9-CM has similar characteristics in most areas to other previously published ICD's. It was produced for clinical modification. However, it hasmore codes and more precision than those needed only for statistical groupings and trend analysis. It was a classification system for disease, injuries, impairments, symptoms and causes of death, It was developed to classify morbidity and mortality information for statistical purposes and to index hospital records by disease and operation for quality assessment purposes. Therefore ICD-9-CMis better suited to the purpose of case mix measurement than previous nosological systems.
ICD-9-CM contains 17 broad classifications that represent aetiology, timing, and location of disease, as well as symptoms, signs, and ill-defined conditions. Each of these classifications is broken down into specific clinical entities, plus residual groups. The scheme includes 10,171 categories. Although, ICD-9-CM classification system is extremely finely divided and its specificity offers a great deal of flexibility, there are problems with it in terms of inconsistentcoding criteria. Other problems associated with theapplication of ICD-9-CM to case mix measurement is that it includes both symptoms and diagnoses which are in-fact different in terms of clinical

characterisation of the patient and should not be considered.
20
The implication of this is that successful treatmentof a symptom does not distinguish between symptomatic relief and cure of the underlying cause of the symptom. Whereas, on the other hand, successful treatment of a disease, implies a greatercontribution to the patient's welfare than just symptomatic relief. The fact is that, a case mix measurement scheme which is not sensitive to the distinction between symptoms and disease would not discriminate between two hospitals differing in diagnostic acumen. 8
Disease Staging system:
The purpose of disease staging is to provide a more completespecification of the patient's illness so that any application requiring a case mix measure will not confound differences in the patient's condition withdifferences in the therapeutic response.
Staging refers to the measurement of the severity of the patient’s condition at any given point Information on severity is important because it relates to the patient's prognosis (the expected outcome of illness episode) as well as to his use of medical resources, admission to the hospital, length of stay and the use of ancillary
services. Disease staging system has been found to be well suited to application for large scale case mix measurement purposes, and can provide a more detail clinical assessment of the type of cases being treated in the hospital. 8
21
Diagnostic Related Group (DRGs) System :
Diagnostic Related Group (DRGs) was developed to relate the demographic, diagnostic, and therapeuticcharacteristics of patients to the output they are provided so that patients are differentiated by only those variables related to the condition of the patient (e.g., age, primary diagnosis) and treatment process (e.g., operations) that affect the utilisation of hospital facilities. The developers of DRG's reject patient groups defined on the basis of primary diagnosis alone because they felt that such groups do not show sufficientlyhomogeneous utilisation patterns.
One of the most important draw-back to DRG's is that the system did not define "clinical meaningfulness". Rather, clinical meaningfulness and the appropriate degree of variance reduction were judged by the physician consultants, which meant that another group of physicians might define DRG's differently.
22
Patient Management Categories (PMC) system:
Patient Management Categories (PMC) was designed to address three problems. (1) inconsistencies in the classification and coding of disease arising out of dependence on the International Classification of Disease and its variation; (2) inadequate attention to the diversity of appropriate types of h hospital stays with diagnostic categories; and (3) lack of prior clinical input in defining appropriate management of homogenous groups of hospitalised patients. 8
Patient Severity Index system :
The purpose of the Patient Severity Index (PSI) system is to measure the severity of the patient's illness, so that the performance of the physicians with respect to prescribing appropriate length of stay could be improved.
The PSI is based on clinical data contained in themedical record and has seven component : (1) stageof disease, from pre-clinical to life-threatening;(2) severity of complications ; (3) concurrent interacting conditions which are likely to affect the hospital course of the illness; (4) level of nursing care required; (5) performance of
procedures outside of the operating room, from non-invasive diagnostic procedures to emergency life-sustaining procedures performed in the emergency room; (6) rate of response to therapy; and (7) completeness of response to therapy. 8
23
Single Dimensional Measures :
Single dimensional measures consist of the following Scalar case-mix index, Information theory index and the Acute Physiology Chronic Health Evaluation (APACHE) II. 8
Scalar case-mix index :
Scalar case-mix index is characterised by three components: a diagnostic classification scheme for grouping the patients treated by the hospital, a weighting scheme for valuing the manygroups relative to a single characteristic. 8
Information Theory index :
The purpose of the information theory case mix is to describe the inequality of the distribution of the mix of cases either within the hospital system, or within the hospital itself. 8
24
Acute Physiology Chronic Health Evaluation (APACHE) II :
APACHE II is a severity of disease classification system. APACHE II uses a point score based upon initial value of 12 routine physiologic measurements, age, and pervious health status to provide a general measure of severity of disease. APACHE II scoring index can be used to evaluate the use of hospital resources and compare the efficacy of intensive care in different hospitals or overtime.
APACHE H system provides weightings for 34 potential physiologicmeasures, the sum of which yields an acute physiology score (APS).
This weighting system is based on a scale of 0 to 4, as illustrated by the following weights assigned to variations in serum pH. 9
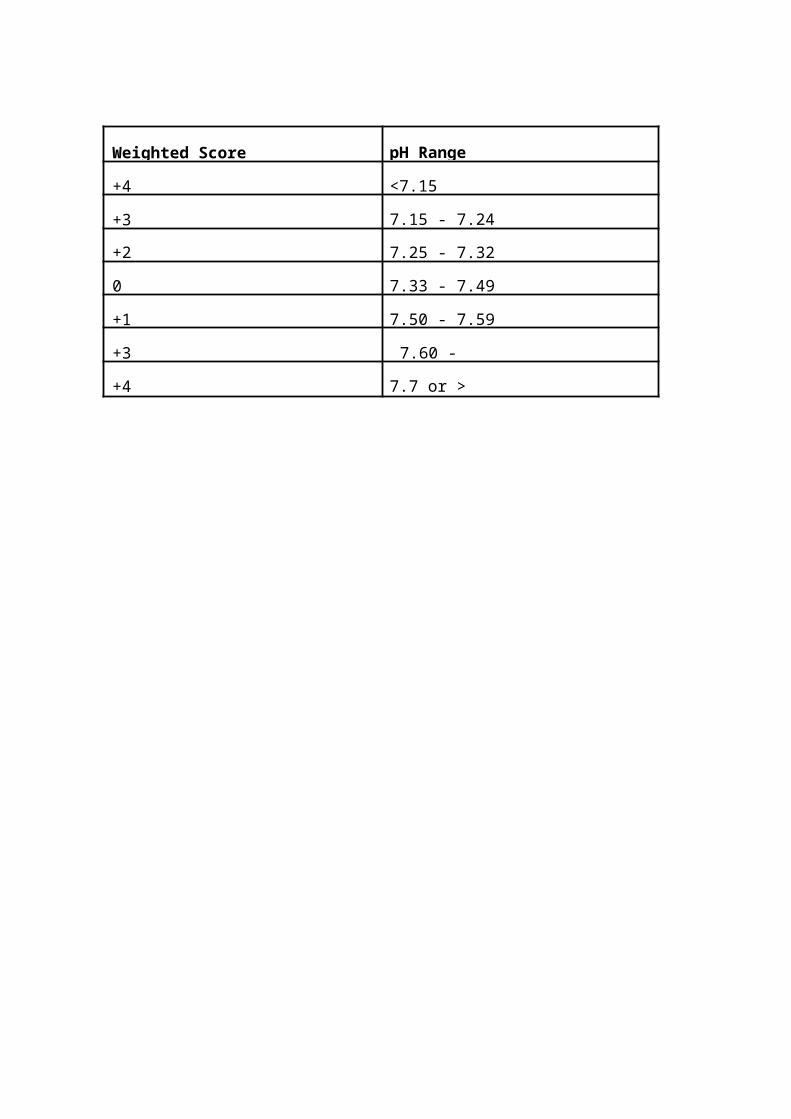
Weighted Score pH Range
+4 <7.15
+3 7.15 - 7.24
+2 7.25 - 7.32
0 7.33 - 7.49
+1 7.50 - 7.59
+3 7.60 -
+4 7.7 or >
25
The APS is determined from the most deranged (worst) physiologic value, e.g., the lowest BP (blood pressure) or the highest respiratory rate, during the initial 24 hr's after ICU admission. The 24hrs time period ensures that all pertinent physiological values are available, and clinical judgement ensures that each value is legitimate.
APACHE II is said to be reliable and useful meansof classifying ICU patient's and for comparing the success of different treatment programs. 9
What causes variation in Case Mix :
Several factors have been found to contribute to the variation in case mix in hospitals. Factors that may influence cross sectional hospital case mix complexity and variations include the extent to which illnesses are diagnosed and treated, whether treatment occurs in hospitals or in other health care settings, and modes of hospital treatment ( e.g., surgical versus non-surgical). In addition, the distribution of cases among hospitals may be influenced by inter-community patient border-crossing and by the extent and types of competing hospital and other health care providers within communities. 7
26
Other factors identified which causes variation in case mix are listed as follows: resource need; hospitals with an approved residency program ;hospitals with medical school affiliation ; hospitals who aremembers of the council of teaching hospitals; hospitals with funded research ; hospitals who areprivately owned ; occupancy proportion ; outpatient visits per admission ; proportions of patients covered by health care insurance ; proportion of patients by hospital medical specialities; health district per capital income ;number of short term beds per 1000 population in district general hospital ; and the proportion of general practitioners in the health district area.7
What are Case mix limitations :
The limitation of case mix is centered aroundseveral factors. Firstly, case mix measurement is dependent on the adequate classifications,which allows homogeneous case mix grouping of patients. The ability to obtain homogeneous case mix groups of patients is dependent on several factors, some of which are reliant on patient’s characteristics and also some of which
relies on hospital characteristics. The ability to bring all this various dependent variables together successfully is difficult.
Case mix are measured using different methods and these different methods have been developed to answer some of the questions been asked by the developers of these methods.
27
In certain situations, where some of the measurement methods try to answer all the questions affecting patients both from clinical point of view and economic point of view, they have not been successful in maintaining credible coding system.
Other limitations of case mix are concerned with availability ofinformation. Information on patient diagnostic characteristics isroutinely collected but not consistent from hospitalto hospital. Also when research on case mix is basedon hospital data, these data's are usually based on small samples.
The disparity in the inter-ratter reliability among case mix measurement methodologies is a major limiting factor.
Studies conducted on Case Mix and their Implications:
Study which looked at how case mix could be analysed using different types of measurement methodology :
Case mix complexity measurements are essential to determine health care efficiency and
effectiveness. Measures of patient care processes and outcomes must be adjusted for case mix before valid comparison can be made and since a key variable for hospital classification is case mix, methodologies which measures case mix must be robust enough to be able to effectively quantify case mix differences and complexity.
28
Horn SD et al (1979) conducted a study which looked at how case mixcomplexity could be analysed using information theory and diagnostic related grouping. 10
Their approach was based on information theoreticapproach which defines information theory measures of case mix complexity using the following variables : the number of hospitals in the district area, the number of cases of diagnostic types in all hospitals in the state orarea, the number of cases of all types in all state or area hospital.
They found that in general , Information theory approach using Diagnostic Related Group's gave a good picture of the complexity of the diagnosis. However, the methodology was unable to show the disparity between certain characteristics of patients and hospital but noticed that Information theory approach do have advantages such as its computational ability and sensitivity to some hospital characteristics.
The implication of this information theory approach to case mixmeasurement is the inconsistency and specificity of the method in capturing the required case mix
variables across all patients and hospital characteristics.
29
Study which examines Case Mix variations using disease and severity of illness measurement techniques :
Rowan KM et al (1993) conducted a study which looked at the extent of variation in case mix ofadult admissions to general intensive care
units in Britain and Ireland and the impact of suchvariation on outcome using APACHE 11 method to evaluate the history of chronic conditions; surgical status; diagnosis; and severity of illness.11
The study was a prospective cohort study of consecutive admissions to intensive care units. Their outcome measures were death or survival at discharge before and after adjustment of case mix. The case mix were collected under six main headingsnamely: socio-demographic factors (age, sex, race);a history of chronic conditions; surgical status; diagnosis; other active problems; and severity of illness (acute physiological state). They found that mortality in hospital increased significantly with increasing age, mortality in hospital was the same for both male and female, mortality in hospital was similar between race, mortality in hospital was significantly lower for surgical patients than for non-surgical patients. Patients who had emergency surgery had significantly
higher mortality in hospital than had patients who underwent elective surgery. Finally, they found that mortality in hospital increased highly significantly with increasing acute physiology and APACHE II scores. However, they noted that the collection of data on case mix needs to be standardised and differences in case mix adjusted for when comparing outcome between different intensive care units.
30
The implication of this study is that APACHE H system is a good method to show case mix variationacross different units, hospitals or places where patients are cared for. Also, case mix data need to be standardised and case mix need to be adjusted when comparing different health care institutions.
Study which examines Case Mix differences between teaching and Non-teaching hospitals
Goldfard MG et al (1987), conducted a study which isolates case mix attributes to given patient populations from that attributed to hospital treatment standards using Disease Staging and diagnosis related groups (DRG) measurement technique. 12 The data they collected were on diagnosis, procedures, length of stay, and dischargestatus of their sample population. They found that in the mortality - weighted case mix indices, there are no significant differences between non-medical schools based (non-MBS) teaching hospitals and non-teaching hospitals, regardless of whether the classification system is based on DGRs or Disease Staging. The medical school based (MSB) hospitals, however, do have a significantly more serious case

mix than do both non-teaching and non-MSB teaching hospital when the weighting systems is DRGs.
31
When the classification system used is Disease Staging, MSB or university hospitals are significantly different from non-teaching hospitals,but from other teaching hospitals. The result changewhen the weight in the case mix definition includes measures of resources use such as length of stay, cost weights and probabilities of admitting case types that were candidate for surgery are analysed and the classification system is DRGs, hospitals with any teaching program (that is, one or more approved residency programs) have significantly higher case mix values than do non-teaching hospitals.
If however, the classification system is changed from DRGs to Disease Staging, there are no statistically significant differences in case mix weighted either by length of stay-or by cost among any of the hospital categories. They also found that on average the presence of at least one approval residency program is sufficient to generate a significantly more surgery prone case mix than for strictly non-teaching hospitals. Theyfound that the presence of one or more teaching programs raises the length of stay, holding the case mix constant, by more than a day whether illness is measured by DRGs or by Disease Staging.The presence of more intensive commitment to

teaching ( as measured in medical school) does notraise the case mix adjusted relative value scores significantly. Non-medical school hospitals somewhat reports higher case mix adjusted death rates than do non-teaching hospitals under DRGs, but not under Disease Staging.
33
The implication of this study is that when case mix variability are to be measured and resource variables are to be assessed, Disease staging method is not as good as DRG's in identifying case mix differences between institutions with different status.
The other implication of this study is identifying that, hospital status do have impacton case mix variability
SUMMARY OF THE LITERATURE, HYPOTHESIS AND PUBLIC HEALTH IMPORTANCE
In Summary, there is some direct evidence that severity scales are useful in evaluating diagnostic efficiency of physicians, refining measures of prognostic, therapeutic effectiveness, and utilisation of health care services, designing clinical trials, and developing systems for controlling resources based on the diagnosis of their patient's conditions. In the area of health care evaluation, severity scales enables more accurate measurement of health status before, during, and after medical intervention and comparisons among physicians, hospitals, and health insurance programs as to the type of patients being treated 12.
34
My review of the literature suggest that case mix measurement canrelate to different aspects of hospital behaviour. As the proportions of a hospital's patients are combined by differing weighting schemes and classification systems, the concept of the case mixmeasure changes. For example, if mortality rates for specific diseases over all hospitals are used as weights, the severity of hospital's case mix in terms of likelihood of death is measured. Consequently, this makes it difficult to find a single classification system which can measure all the variables that underpins case mix satisfactory and completely between patients and across institutions where patients are cared for.
One question of interest that can be addressed with the measurement of patients case mix severity which will be of health importance from the Public Health perspective is who are the patients who tend to havemore severe cases of a particular disease ?. Also important to Public Health using this method in evaluating case mix complexity is highlighting the appropriateness of the hospital system in meeting the demands of patients who presents themselves for hospitalisation.

Furthermore, what is also important to Public health when case mix complexity of patients are measured, is that it provides the sort of information required for the development of Public health policy ; enhances administrative arrangements between health care providers and Public health departments and provides the necessary impetus for further research and development.
METHOD
Patients and Method:
My study was carried out in a 355 bed district generalhospital in the town of Colchester, County of Essex. Nearly 40,000 patients are admitted to the hospital each year of which between nearly 2500 patients suffering from acute infection are admitted each year (5% of the total admission).
Selection of Study Cases and Data Collection:
A listing was obtained from the hospital activity database of all admissions to Colchester General Hospital between 1st April to 31st March 1991/92 and1995/96, where the admission is the first admission in that year.
Inclusion criteria :
The case definition was an emergency admission in 1991and 1995 to Colchester General Hospital for an acute chest problem, where the primary diagnosis at admission and discharge are the same.
In 1991/92, Pneumonia, asthma, and bronchitis are ICD 9 codes 480 to 497 and in 1995/96, Pneumonia is ICD10 codes J18.0 to 118.9; Bronchitis is ICD10 codes J20.0 to J20.9; and Asthma is ICD10 codes 145.0 to 145.9.
Patients must be 65 year of age or more.
36
Exclusion criteria :
From the listing, patients were excluded (a) if they had been admitted for administrative reasons (that is, they were not admitted as emergency and acute patients) ; (b) if their primary reason for admission was acute chest problem but their discharge diagnosis was something different ; (c) if they were admitted in the first instances to other medical institutions such as Community hospitals or Day Care centers in the county and then latertransferred to Colchester General Hospital ; (d) if they were under 65 year old; (e) if their primary reason for admission was some other medical problems ( for example fracture neck of femur) and the secondary diagnosis was acute chest problem (for example pneumonia, asthma and bronchitis) and then discharged on their secondary diagnosis.
Sampling method:
The selection criteria I used had been obtained from previous study on the same subject conducted by Irwin D, et al (1993) but had to be improved so that I can obtain a more homogenous patient group.From the hospital listing of patients name, admission number, age, date of first admission, date of discharge,length of stay and 1CD (International Classification of
Disease) codes; I obtained a systematic random sample of106 patient admissions in
1991/92 and 1995/96.
37
How Systematic random sample was obtained :
The Systematic random sampling method was obtained by firstly, examining that the list from which the source population is taken from is not arranged in any sort of periodic order. Secondly, a total of 942 patients from the study population which satisfies the age study criteria of 65 year old or over were listed. The total of942 was divided by 106 which had been calculated from thepilot study as the number of patients required for the main study. This gave a value of 8 as the required numberto maintain a systematic gap between the numbers of the sampling number. Thirdly, the starting point for the first sample was determined at random between one and eight. After the first number had been obtained, the second and subsequent sample numbers were obtained by adding the eight to each new sample number such that if 2 was the first number, the second, third, fourth, fifth and so on number would be 2, 10, 18, 26, 34 and so on until the total number of patients amounting to one hundred and six patients is obtained.
The selection was actually performed by a staff member of the Medical Record Manager on my behalf.A pilot study was conducted in order to establish the standard deviation (SD) to obtain the required sample size for the main study.
38
How the Pilot Study was Conducted:
From the hospital listing which had the list of all patients who were admitted as emergency to the acute medical bed in 1991 and 1995, as their first admission ,whose diagnosis at admission and discharge were strictlypneumonia, asthma or brochitis, I extracted a listing of2,500 patient's.
From this listing, I obtained a second listing of all patients age 65 years old or more because this was one ofthe main criteria of the study design. The total number of patients who met these criteria for both years was 942(408 in 1991 and 534 in 1995).
In order to be able to estimate the SD from the source population and also to calculate the required sample sizewhich will allow me to detect a difference in the population for 1991 and 1995, if it exist, I did the following :
From the patient population of 942 (408 in 1991 and 534 in 1995) who satisfied the study criteria of age (65 years of age or more), I took a sample of 10% of 408 from 1991 and 10% of 534 from 1995 at random, using a systematic random sampling approach. This amounted to 94patients overall for years, 1991 and 1995.
From the overall 94 patients, 76.5% (72 out of 94) were excluded because they did not meet the study criteria of diagnosis at admission and discharge which must strictly be pneumonia, asthma or bronchitis. Overall, only 22 out of 94 patients, (12 out of 41(29.3%) in 1991) and (10 outof 53 (18.9%) in 1995 met the study criteria.
The acute physiologic data, the age data and history of chronic status data were extracted from the medical record case notes of the patients. These data's were scored using APACHE II scoring method.
The mean APACHE II score was 14.53 for 1991 and 15.01 in
1995, standard deviation for the APACHE II score was calculated as 4.73 for 1991 and 4.75 for 1995.
How the Sample Size was obtained:
Firstly, I calculated the standard deviation of the source population from the pilot study.
The difference I wanted to be able to detect, if it exists was obtained from the previous study conducted by Irwin A et al (1993) on the Severity of Sickness at admission to hospital in Colchester in 1985 and 1990.2 In which they found a statistical significance difference in the mean APACHE II score between 1985 and 1990. The mean difference that they found was 2.1 higher in 1990 than in 1985. I
therefore, decided to design my study to detect as a minimum difference of 2.1 mean, if it exists, as my base.
I then used a formula for the required sample size (N) when the primary statistical test significance will be an unpaired t- or z-test and the comparison of interest is a comparison of two group means.
The formula used is as follows:
n (Sample size in each group) = 2 [ Z¢ + zB ^2 * sDA2 DA2
where; ZO = 1.96 (2 -sided type 1 error of 5% )ZB = 1.28 (type 2 error of 10% - B isalways one- sided) SD = Is the standard deviation of the source population, which was estimated from the pilot study as 4.73 for 1991 and 4.75 for 1995. To be conservative, I have used the 4.73 SD for 1991.
D = Is the smallest difference I wanted to be able toIdentify, if it exists. The difference, I decided to use in my study was obtained from the previous study, which found that the mean difference of APACHE II score between 1998 and 1990 was 2.1higher in 1990 than in 1985.
Sample size calculation
By putting the above values into the formula, the samplesize for the study was obtained as follows:
2* [1.96 + 1.28]A2 * 4.73'1/42 divided by 2.1A2 = 106
40
Data Collection :
For the collection of data, I constructed my own data abstraction and recording form as advised in the study conducted by Knaus WA et al (1985).9 My data abstraction and recording form is shown in appendix six.
The Medical record files for all patients who met the study criteria were retrieved by Mrs Jane Morgan (Medical Record Manager), the Medical Record staffs andby Mrs Anita Bryan (Secretary to the Clinical Audit department).
The examination, extraction, recording and review of case notes were performed by me over a period of seven
days. Of the seven days, I used two days to conduct the Pilot study and five days to conduct the main study.
All medical record files were retrieved from three different hospital locations within the borough, at EssexRivers Health care Trust Hospital, Colchester General Hospital and Severalls Medical Record Storage Department.Most of the medical record files were retrieved ready before my arrival for the extraction of data. However, I helped to retrieve some of the patient’s medical record files in some cases.
The extraction of data was performed for each year systematically. The files for 1991/92patient’s were examined first before 1995/96.
41
Within each patient medical record file, I extracted the data for the acute physiologic status from their laboratory investigation result card which were in most cases attached to the front cover of their medical recordfile or sometimes embedded in the file. All recorded laboratory data related to the investigation result givenat the first date of admission or in some cases second orthird day results.
The date of birth for the age data were mostly extracted from the Hospital database listings and cross checked with the date of birth in the medical record file.
The history of chronic health status data were extracted from the physician notes made at the day of admission or two days after in some cases and cross checked with Nursing notes taken during the period of hospitalisation.
Each data extracted were immediately recorded for each patient onto the recording form prepared for the study. Ialways extracted the first available data. If the patienthad missing data on day one, I accepted data from day two, because day two values may represent the admission status of patients who were admitted late at night.
42
When all the data's were extracted completely for allpatients in the study sample for both years, each patients data recording forms were scored on to a scoring form prepared for the study.
All patient data scores for each year were entered on a computer spreadsheet using Excel spreadsheet software application programme. Each spreadsheet were saved separately in the computer.
Variable that Measures the Severity of Disease at admission :
I obtained the variable that measures severity of disease at admission, using a previously published studyby Knaus WA et al (1985) which looked into the APACHE II: A Severity of disease classification System,10 usingthe variables (acute physiologic status, age status, andhistory of chronic health status) to determine the validity and reliability of using methodology in the classification of disease severity at admission.
The instrument I used (The APACHE II: A Severity of disease classification System) had been validated in U.S.A, using 14,000 plus patients to measure severity ofillness of medicare patients for prospective payment system. 9
43
Measurement of Case Mix Severity of Patients illness :
APACHE H Method :
The precise definitions for the variables used in the APACHE If classification system and its modifications in Britain and Ireland are listed in appendix one. I obtained the modified definitions from a study conducted by Rowan, KM et al (1993). 11
For each patient up to two possible values ( highest and lowest) were recorded for each of the 12 physiological variables constituting the acute physiologic score. All values were extracted and recorded as raw data.
Missing physiological values were assumed to be normal andassigned zero points. The acute physiology score was calculated as the sum of the points for the 12 variables. The APACHE IT score was calculated as the sum of the acutephysiology score plus the points for age and history of chronic conditions as shown in appendix two. 11
Ten individual categories for use in this study were derived from one primary organ systems as shown in appendix three.11 Patients were assigned to one of thesecategories according to the principal reason for admission.
44
Result
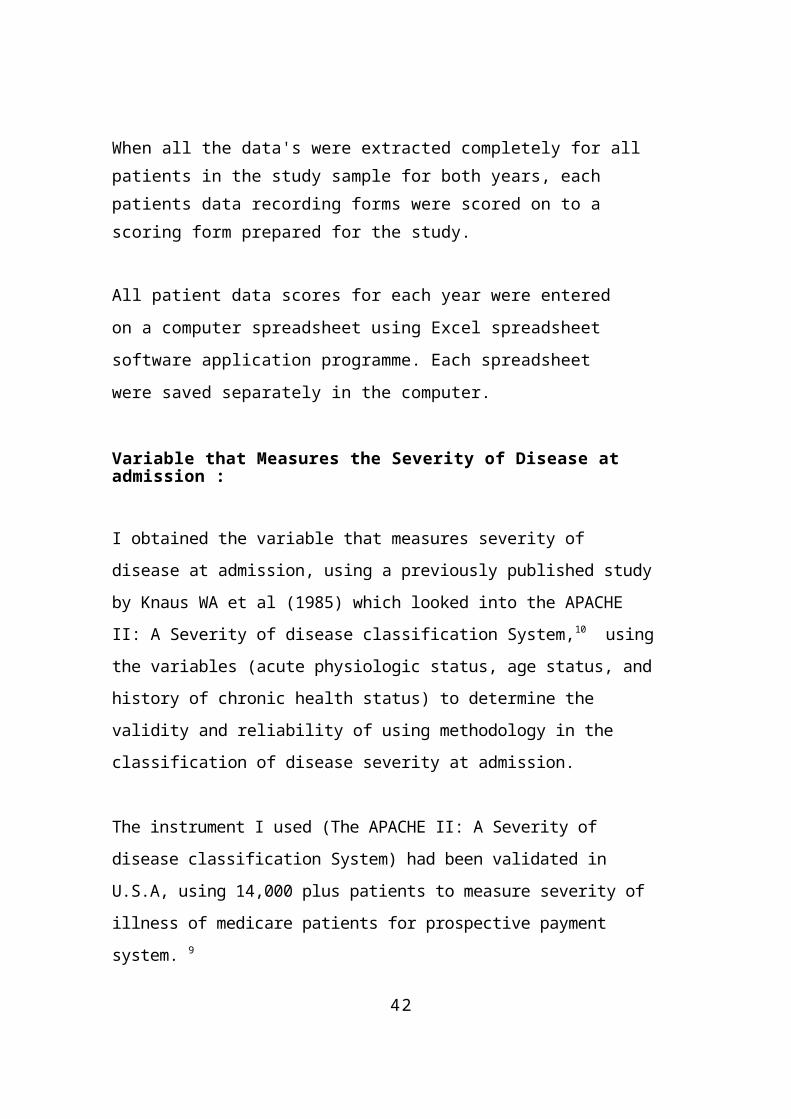
The Distribution of Patient Admission by gender 1991/92 & 1995/96
The distribution of patient admissions between 1991 and 1995 by gender are as follows: Of the 2500 patients admitted for acute medical problems, in 1991/92 and 1995/96, overall only 942 (37.7%) were 65 years old and over. Of this,408 (43.3%) in 1991 and 534 (56.7%) in 1995.
Males were 198 (48%) and females were 210 (51.5%) in 1991, whereas 216 (40.4%) were male and 318 (59.5%) were female in 1995.
Of the 942 admitted for acute medical condition,only 212 (22.5%) were admitted into the sample population; 53 (50%) were male, 52 (50%) were female in 1991/92 and 58 (54.7%) were male and 48 (45.3%) were female in 1995/96.
Amongst the 212 patients admitted into the sample study population, only 89 (42%) met the study criteria of which 21 (48.8%) were male and22 (51.2%) were female in 1991 and 22 (47.8%) were male, 24 (52.1%) were female in 1995.
DescriptionAge Grou
Total number of admission in study Population
65-74>75
65-74>75
65-74>75
TOTAL
Number of admission in sample populationTOTAL
Number of admission who met the study criteriaTOTAL
1991/92
MaleNo %
FemaleNo %
Total No %
8520.8 77 18.9
162 39.711327.7 133 32,
6246 60.3
198 485 210 51.5
408 100
2826.4 22 20. 50 47.22523.6 31 29.
256 52.8
53 50 52 50 106 100
920.9 9 20. LB 41.91227.9 13 30.
325 58.1
2148.8 22 51.2
43 100
1995196
MaleNo %
FemaleNo %
TotalNo %
30 5.6 115 21.5 145 27.2186 34.
8203 38 389 72,
8216 40. 318 59.5 5,34 100
19 17. 8 7.6 27 25.539 36.
840 37.7 79 74.5
58 54.7
48 45.3 106 100
6 13. 3 6.5 9 19.616 34.
721 45.6 37 80.4
22 47. 24 52.1 46 100
Female & Male
1995/96 Female &
Male 1995/96
Female & Male -
1991/92 Female &
Male - 1991/92
4 5
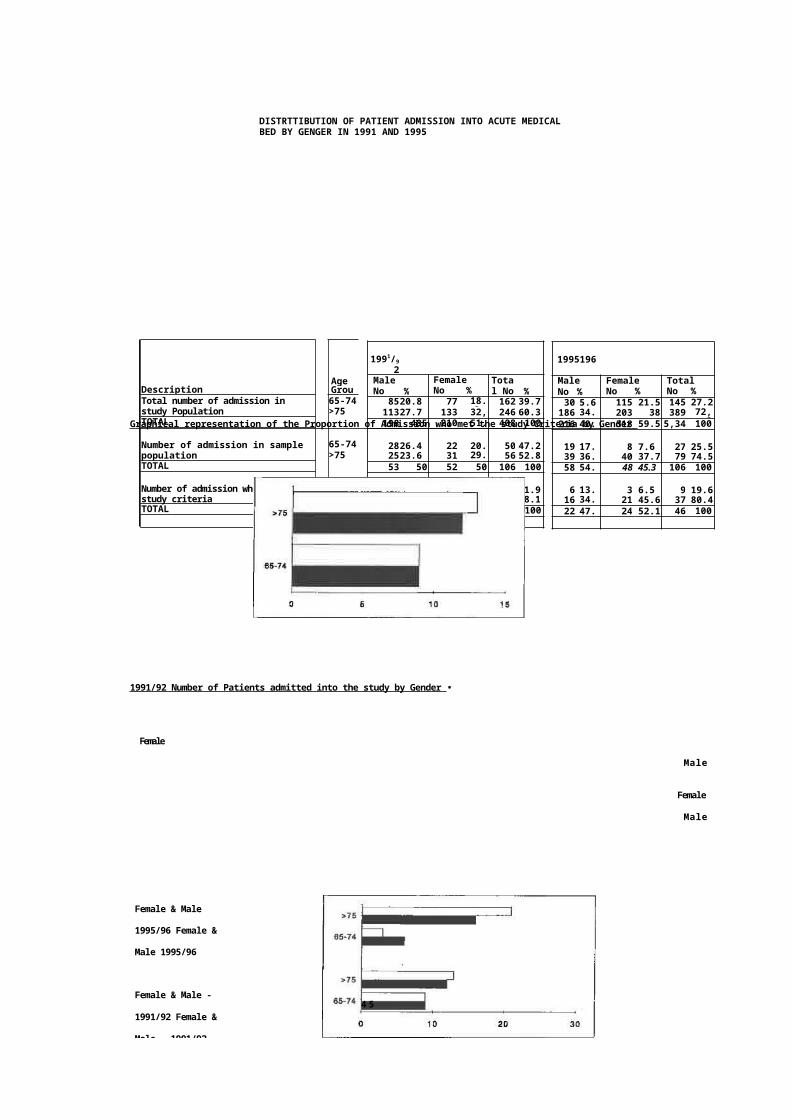
DISTRTTIBUTION OF PATIENT ADMISSION INTO ACUTE MEDICAL BED BY GENGER IN 1991 AND 1995
Graphical representation of the Proportion of Admission who met the study Criteria by Gender
1991/92 Number of Patients admitted into the study by Gender •
Female
Male
Female
Male
Female
Male
Female
Male
1995196 Number of Patients admittedintothe study by Gender
*75
65-74
0 0 20 30
1991/92 and1995/96 Number of Patients admitted intothe.study by Gender
Study StudyDefinition DefinitionMet Not Met
No % No %63 59.4 43 40.660 56.6 46 43.4
123 58.0 89 42.0
TotalNo %106 50.0106 50.0
212 100.0
Year1991/921995/96
TOTAL
Study Definition I ]Not Met
Study Definit
10 20 40 60 80
1995/
96
1991/
92
1995/9
46
DISTRIBUTION OF SAMPLE CASES BY YEAR
GRAPHICAL REPRESENTATION OF THE DISTRIBUTION SAMPLE CASES BY YEAR,
47
The Distribution of Patient case notes for analyses
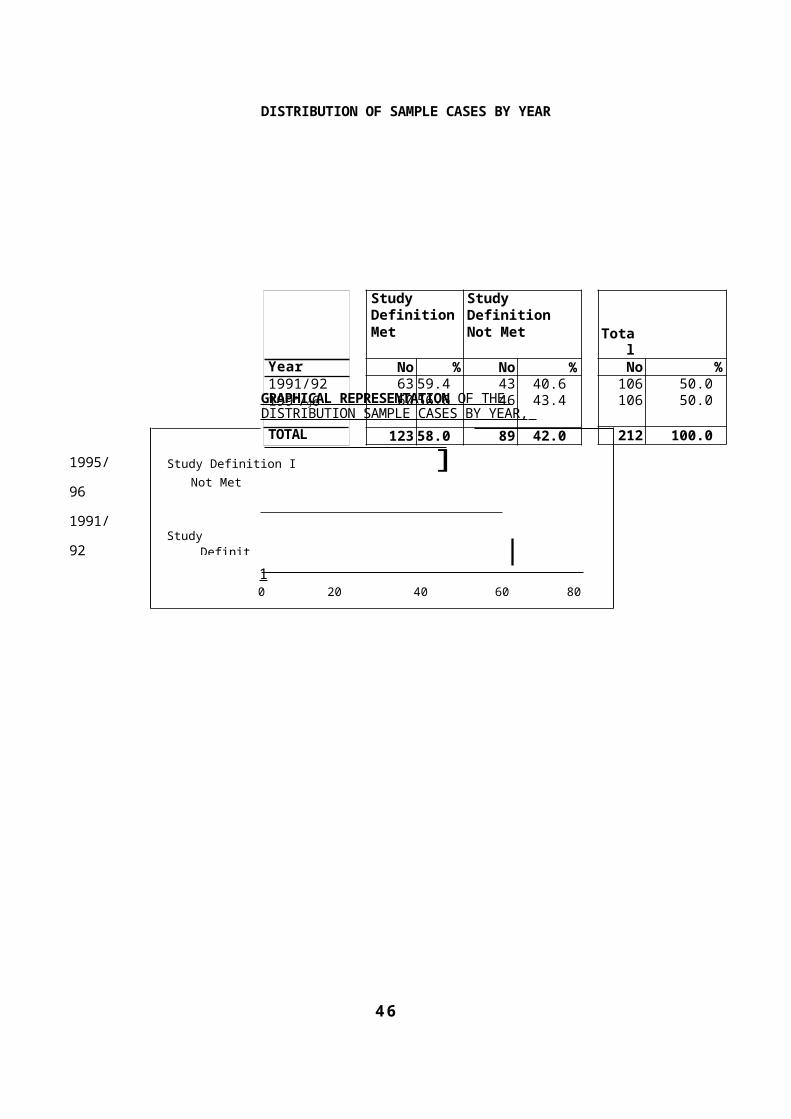
When the case notes were analysed, 59 %, and53% (63 out of 106 for 1991/92 and 60 out of106 in 1995) did not meet the studydefinition.
The main reason for the exclusion were admission and discharge diagnosis differences for 27 in 1991 and 29 in 1995; for non-emergency admissions, there were 10 in 1991 and8 in 1995. For those who met the case definition, there were 43 in 1991 and 46 in 1995.
Case Note analyses findings
The APACHE Score Analysis :
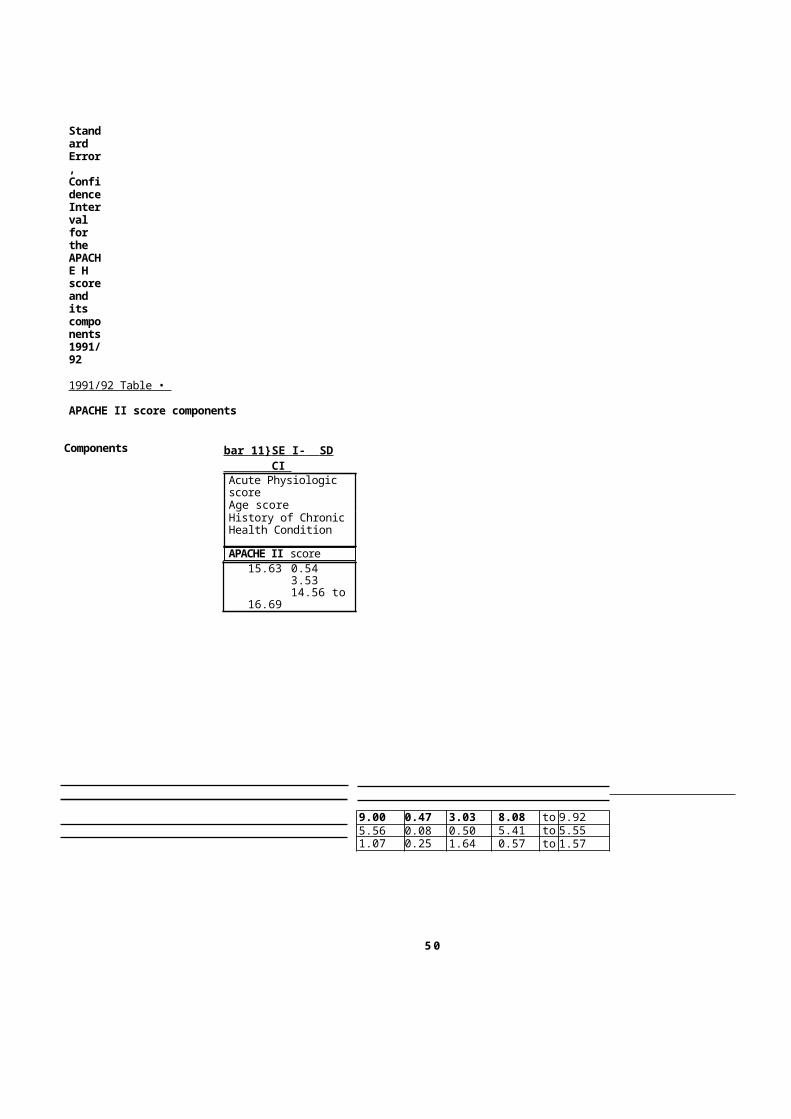
The mean APACHE II score was 15.63 , standarderror (SE) 0.54, standard deviation (SD) 3.53,and the confidence interval (CI) was 14.56 to16.69 in 1991/92. Whereas, in 1995/96, the meanAPACHE II score was 16.33, (SE) 0.54, (SD) 3.65,and the (CI) was 15.26 to 17.39
The mean difference for the APACHE II score between 1991/92 and 1995/96, using the Two-Sample t-Test was found to be statistically notsignificant (P<0.10). Which means that, despite, the observed difference between 1991/92 and 1995/96, the Null hypothesis cannotbe rejected.
48
The Mean Age at Admission Analysis :
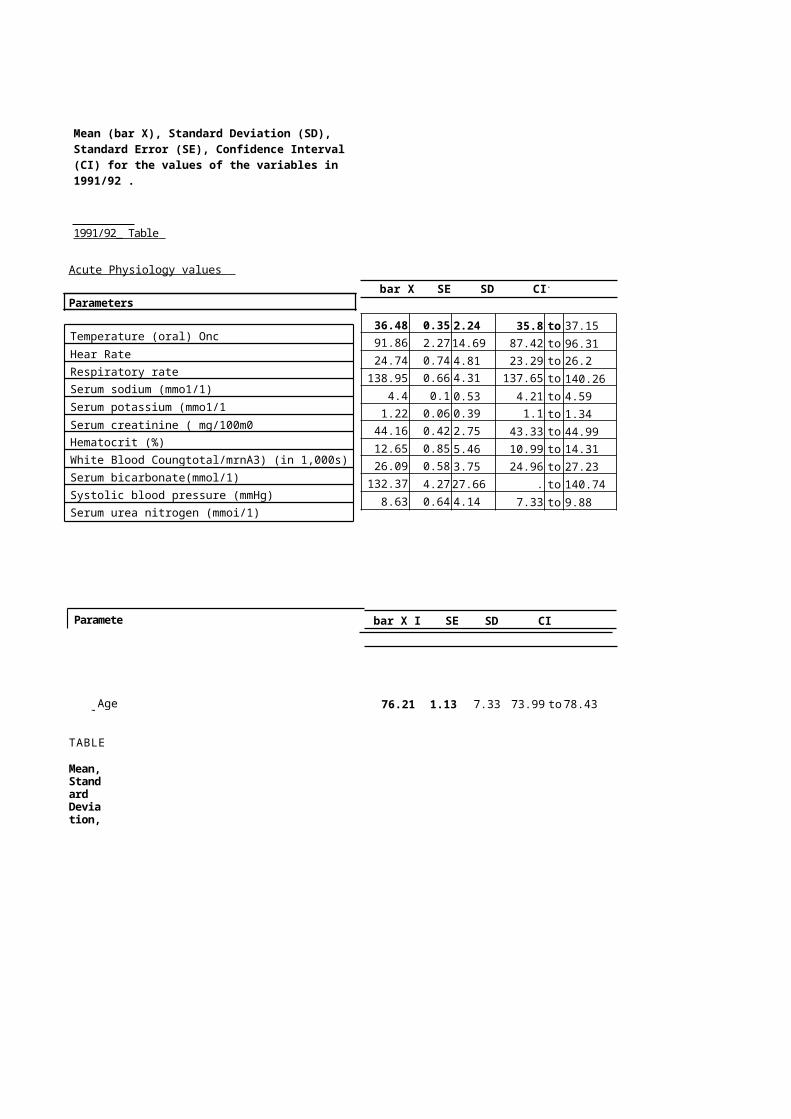
The mean age at admission was 76.21, (SE) 1.13, (SD) 7.33 (CI) 73.99 to 78.43 in 1991/92 and in 1995/96 the mean age was 80.48, (SE) 1.22, (SD) 8.16, (CI) 78.09 to 82.86.
The statistical significance of the mean difference in age between 1991/92 and 1995/96, using the Two-Sample t-Test was P<0.01 This shows that the age difference was statistically significant.
The Acute Physiology Score Analysis :
The acute physiology element of the score showsa mean of 9.0, (SE) 0.47, (SD) 3.03, (CI) 8.08 to 9.91 in 1991/92, whereas in 1995/96, the mean was 9.61, (SE) 0.46 , (SD) 3.09, (CI) 8.71to 10.51.
The mean difference of the score between 1991/92and 1995/96, using the Two-Sample t-Test was found to be statistically not significant (P<0.10) .
49
The History of Chronic Status Analysis :
The history of chronic condition element of thescore shows a mean of 1.07, (SE) 0.25, (SD) 1.64, (CI) 0.57 to 1.57 in 1991/92 but in 1995/96, the mean was 0.96, (SE) 0.24, (SD) 1.60, (CI) 0.49 to 1.43.
The mean difference between the score for 1991/92and 1995/96, using the Two-Sample t-Test was found to be statistically not significant (P<0.10)
Within the acute physiologic element of APACHE H score, Serum Albumin were recorded frequentlyin 1991 but were hardly recorded in 1995. The very low recording of Serum Albumin in 1995 made me to exclude the data item from the finalanalysis of the physiology score component.
All the statistical analysis calculation were done using Excell Spreadsheet Software as shown in appendix two and seven.
bar X SE SD CI.
36.48 0.35 2.24 35.8 to 37.1591.86 2.2714.69 87.42 to 96.3124.74 0.74 4.81 23.29 to 26.2138.95 0.66 4.31 137.65 to 140.26
4.4 0.1 0.53 4.21 to 4.591.22 0.06 0.39 1.1 to 1.34
44.16 0.42 2.75 43.33 to 44.9912.65 0.85 5.46 10.99 to 14.3126.09 0.58 3.75 24.96 to 27.23132.37 4.2727.66 .
124.01to 140.74
8.63 0.64 4.14 7.33 to 9.88
Parameters
bar X I SE SD CI
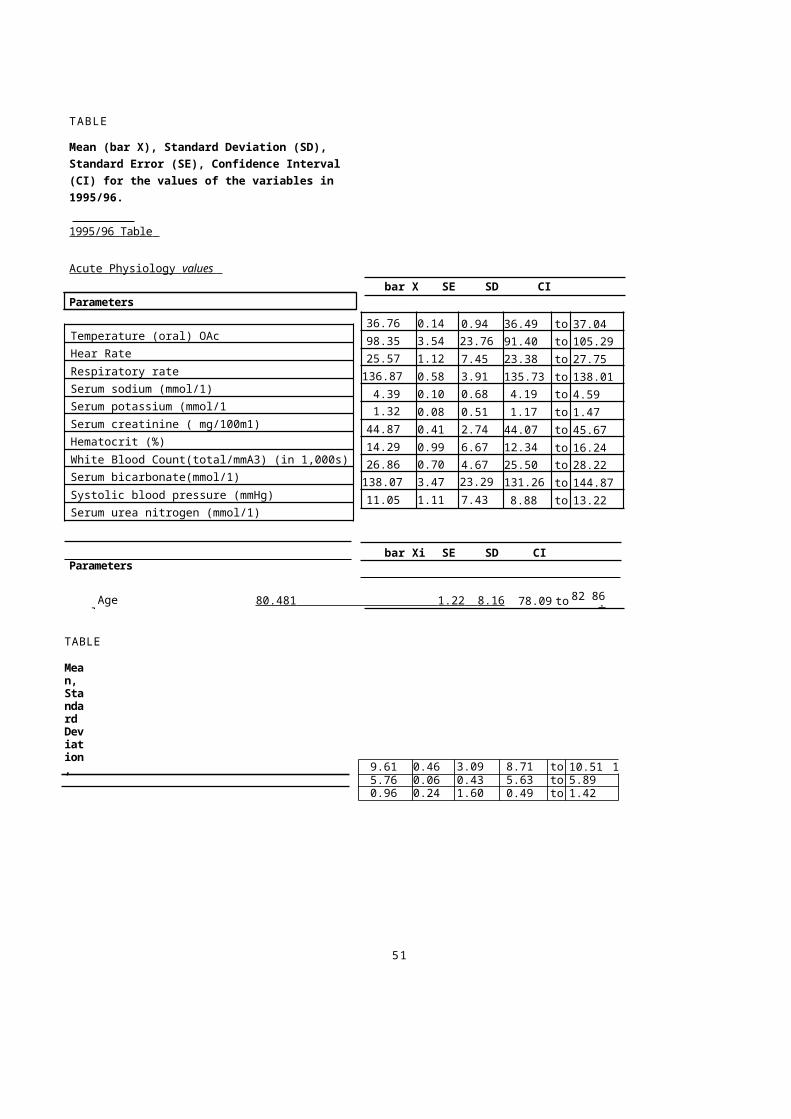
Mean (bar X), Standard Deviation (SD), Standard Error (SE), Confidence Interval (CI) for the values of the variables in 1991/92 .
1991/92_ Table
Acute Physiology values
Parameters
Temperature (oral) OncHear RateRespiratory rateSerum sodium (mmo1/1)Serum potassium (mmo1/1Serum creatinine ( mg/100m0Hematocrit (%)White Blood Coungtotal/mrnA3) (in 1,000s)Serum bicarbonate(mmol/1)Systolic blood pressure (mmHg)Serum urea nitrogen (mmoi/1)
Agevalues
76.21 1.13 7.33 73.99 to78.43
TABLE
Mean,Standard Deviation,
9.00 0.47 3.03 8.08 to 9.925.56 0.08 0.50 5.41 to 5.551.07 0.25 1.64 0.57 to 1.57
5 0
Standard Error, ConfidenceInterval for the APACHE H scoreand its components1991/92
1991/92 Table •
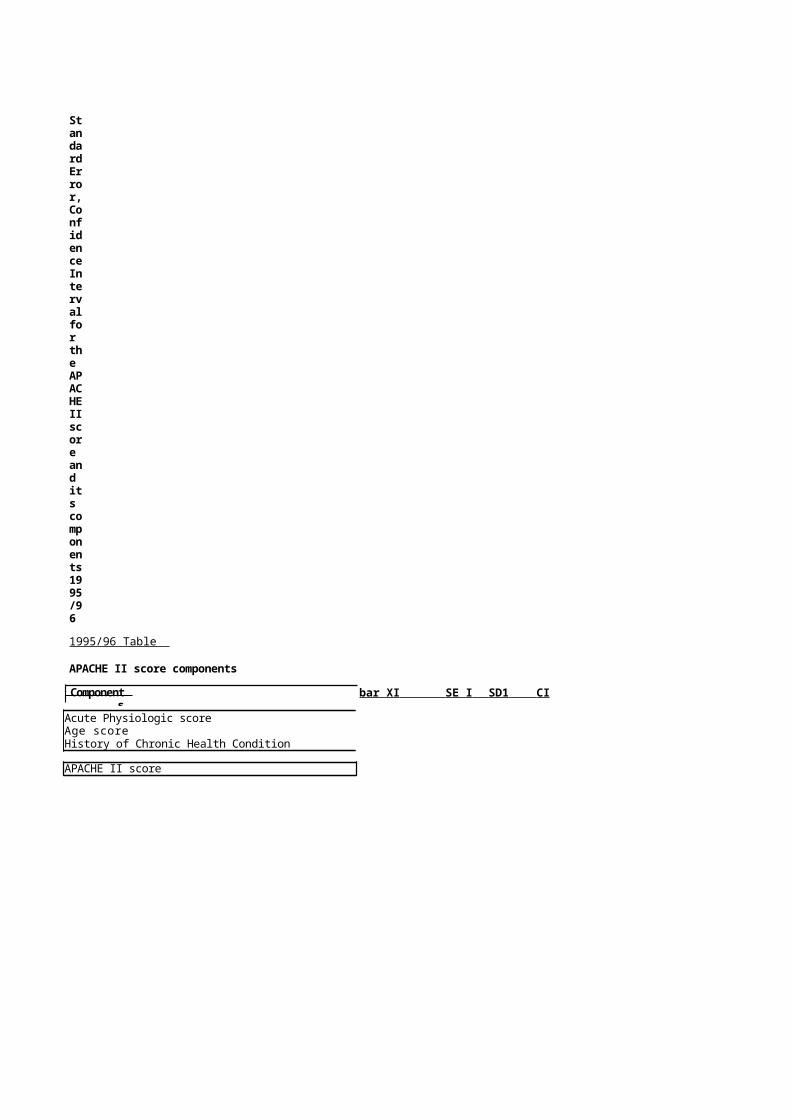
APACHE II score components
Components bar 11} SE I- SD CI Acute Physiologic scoreAge scoreHistory of Chronic Health Condition
APACHE II score15.63 0.54
3.5314.56 to
16.69
bar X SE SD CI
36.76 0.14 0.94 36.49 to 37.0498.35 3.54 23.76 91.40 to 105.2925.57 1.12 7.45 23.38 to 27.75136.87 0.58 3.91 135.73 to 138.014.39 0.10 0.68 4.19 to 4.591.32 0.08 0.51 1.17 to 1.47
44.87 0.41 2.74 44.07 to 45.6714.29 0.99 6.67 12.34 to 16.2426.86 0.70 4.67 25.50 to 28.22138.07 3.47 23.29 131.26 to 144.8711.05 1.11 7.43 8.88 to 13.22
bar Xi SE SD CI
Agevalues
80.481 1.22 8.16 78.09 to 82 86.
9.61 0.46 3.09 8.71 to 10.51 15.76 0.06 0.43 5.63 to 5.890.96 0.24 1.60 0.49 to 1.42
51
TABLE
Mean (bar X), Standard Deviation (SD), Standard Error (SE), Confidence Interval (CI) for the values of the variables in 1995/96.
1995/96 Table
Acute Physiology values
Parameters
Temperature (oral) OAcHear RateRespiratory rateSerum sodium (mmol/1)Serum potassium (mmol/1Serum creatinine ( mg/100m1)Hematocrit (%)White Blood Count(total/mmA3) (in 1,000s)Serum bicarbonate(mmol/1)Systolic blood pressure (mmHg)Serum urea nitrogen (mmol/1)
Parameters
TABLE
Mean, Standard Deviation,
StandardError,ConfidenceIntervalfor the APACHEIIscore and its components1995/96
1995/96 Table
APACHE II score components
Components
bar XI SE I SD1 CI
Acute Physiologic scoreAge scoreHistory of Chronic Health Condition
APACHE II score

16.33 0.54 3.65 15.26 to 17.39
52
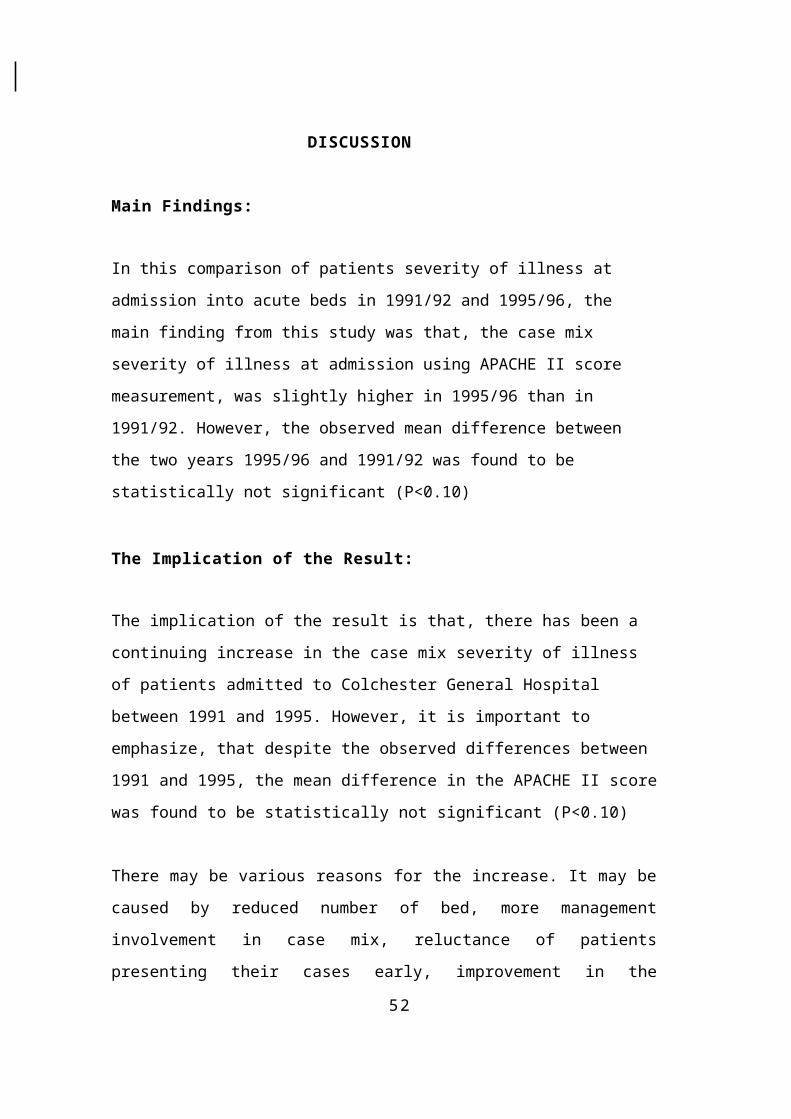
DISCUSSION
Main Findings:
In this comparison of patients severity of illness at admission into acute beds in 1991/92 and 1995/96, the main finding from this study was that, the case mix severity of illness at admission using APACHE II score measurement, was slightly higher in 1995/96 than in 1991/92. However, the observed mean difference between the two years 1995/96 and 1991/92 was found to be statistically not significant (P<0.10)
The Implication of the Result:
The implication of the result is that, there has been a continuing increase in the case mix severity of illness of patients admitted to Colchester General Hospital between 1991 and 1995. However, it is important to emphasize, that despite the observed differences between 1991 and 1995, the mean difference in the APACHE II scorewas found to be statistically not significant (P<0.10)
There may be various reasons for the increase. It may becaused by reduced number of bed, more managementinvolvement in case mix, reluctance of patientspresenting their cases early, improvement in the
recording of medical information, and or increase in theage of patients presenting themselves for admission.
It may be true that the threshold for the decision to admit has actually gone up as explained in the previousstudy conducted by Irwin et al (1993) on the same issue, in which they tried to put objective evidence against the concerns raised by GP's and hospital admission doctors.
53
The implication of the possibility of the rise in the threshold to admit acute patient to medical beds is that,it is by nature possible, that the kind of patient group that has been investigated in this study and which may have been exposed to this sort of admission difficulties,would respond to such hospital behaviour cowardly, and thereby presenting their ill health late to the hospital.
Other likely reasons for the increase in the case mix severity of illness at admission as observed in this studycould be due to effect of change management. When organizations are going through a change circle, the recipients of the services are likely to experience some change themselves. For example, could the recent introduction of internal market into the National Health Service (NHS) which brought about a change in the hospitalstatus of most health care providers such as Colchester General Hospital be a factor in the changes to the hospital system such as admission policy.
It is difficult to ignore the fact that the introduction of the internal market into health care provision brought with the need for hospitals to respond to the demand and raised expectation of patients, or the inability of the hospitals to respond to patients demand due to over demandor increased frequency of the demand and lack of the capacity to code with the demand , and the added pressure on the hospital system in trying to meet National

directives, Policy changes both local and National are bound to have direct impact on patients attitude, health belief and be behaviour.
After all, in my literature review, there was evidence shown by some of the studies that a change in hospital status, and a change in resource need of hospitals do have impact on patient's case mix severity.
Or could the increase be due to some unknown factors inthe community causing an increase in patient case mix severity at admission.
The Limitations of the Study:
The limitation of the study could be associated with the fact that the study was a retrospective study, which limits the scope of the other variables that could have been investigated in order to mitre at a wider more robust result. A prospective study would have given me the opportunity to redress these information constraints.
It also follows that because the study was a retrospectivestudy, the integrity of the data collected had to be dependent on what has already been collected. Which meant
that, in a situation where some data were not re-coded consistently among patients would not have arisen if the study was a prospective study. One such example observed in my study was the recording of Serum Albumin, which was recorded consistently in 1991/92 and hardly recorded in 1995/96. This may have had an impact on the outcome of theresult obtained for the acute physiology score.
55
Explanation of the result by evaluating the role of chance, bias, and Confounding:
Could the Result be due to Chance :Despite the fact that the study showed that the APACHE H score was statistically not significant.(P<0.10).It is unlikely that the result obtained from my study wasdue to chance in view of the fact that the sampling was done by a different observer; the methodology and approach for the collection of the samples were consistently applied throughout the groups in the study. Although, I started with a larger sample but ended up with a rather smaller sample after the imposition of the study criteria, this in my view, could not have by itselfbe a cause for the likelihood of chance to be an explanation.
Could the Result be due to Bias:
Firstly, more than half of the initial random sample of cases obtained from the hospital activity listing failed to meet the case criteria. This obviously raises two questions: was the study sample biased? and could the sample have been drawn more efficiently or was the study inclusion criteria too strict? thereby, limiting potentialpatients who could have been included in the study.
Sampling Efficiency :
Taking efficiency first, it is worth noting that the commonest reason for exclusion was a discrepancy between discharge diagnosis (recorded on the hospital activity database) and admission diagnosis (the study criteria). The listing included many patients who died of pneumonia as a complication of their initial reason for admission. It might have been possible to use secondary diagnosis to screen out some admissions in this category, but I was determined to keep the study criteria tight irrespective of the implication this might have on the final sample size. Also, I was unsure how sensitive and specific such ascreening procedure would be to the study aims and objective.
Another common reason for exclusion was that the hospitaldatabase listing contains patients who were admitted intoother health institutions such as Community hospitals in the first instance and then later transferred to the general hospital.
57
Selection Bias in the Study
Selection bias could not have been a problem in my studybecause, the criteria for the selection of the study population was defined before the hospital database listing was produced. The criteria's were also the same for both years. The selection of the samples was conducted by a different observer and a systematic random method was used to collect the samples and was applied the same way.
Although, in principle, selection bias is said to be a particular problem in a retrospective study, like my study, due to both exposure and outcome occurring at the same time. But in my study, the period of exposure and the outcome is unknown which consequently reduces or eliminates the possibility of a selection bias.
Information Bias in the study
I noticed that the standard of completeness and accuracy of admission and discharge coding in Colchester hospital is very high: over 98% of admission and discharge notes were medically coded and neatly typed by the administrators. Although, accuracy has not been formally studied, the very fact that the admission and discharge notes were neatly typed and signed by a medical officer, gives validity, reliability and credibility to the

coding process and the information inherent in the notes.Therefore medical coding was found to be no problem to the study.
58
Investigation bias :
Although this study is not a blind study, it was not possible to make data abstraction blind either as to thehypothesis, or as to the year (1991 or 1995) of the case.There may be little room for observation error in the abstraction of case notes in the recording of pulse rate or systolic blood pressure, some of these data items are buried deep in the files in 1991 than 1995 and in certainsituations the admitting doctor's notes differ slightly from the Nursing notes (which were sometimes used as a secondary source of information). However, according to APACHE II rule, the most abnormal reading by a doctor or Nurse is to be taken.
Despite all these, it is difficult to assess the likelihood or extent of investigation bias, but it would have been a practical impossibility to organise a blind study.
Could the Result be due to Confounding:
Age was found to be the only factor within the APACHE II score that had a mean difference that is statistically significant after APACHE II score itself. Other variable which made up of APACHE H score ( such as acute physiology, and history of chronic status ) was not significant.
59
Therefore, could age be a confounder in this study. It is very difficult to conclude that this is the case without testing the nature and strength of the relation between age and APACHE H score. However, it is my view that age isprobably not a confounder. If it is the effect of age as aconfounder should have been adjusted for in the design stage of the study or in the analysis stage of the study.
Gender could be a probably confounder in this study because the proportion of men and women in the study population in 1991 is different from that of 1995.
It is my view that, it is possible that gender and age been an independent risk factor for the case mix severityof illness at admission. Therefore, there is a probability that an association between age, gender and APACHE II score exist.
However, it was difficult for me to control the effect of age and gender at the design stage by using randomisation,restriction, or stratification methods because age was oneof the component part of the case mix variables being measured using APACHE II classification system.
60
Criticism of Laboratory investigation :
One of the other problems which I consider to have an impact on APACHE II score was the inconsistencies in the laboratory investigation for these group of patients. The need to standardise laboratory investigation for patients of a particular grouping would have an enhanced validity on the use and outcome of APACHE II classification system as a measurement instrument. In this study about 95% of Serum Albumin was investigated in 1991/92 whereas only about 2% was investigated in 1995/96. The conservative approach of excluding Serum Albumin score from both 1991/92 and 1995/96 samples still showed an increased score, although with a probability of 5% that this was dueto chance. While the probability of human error cannot be excluded, I feel that the consistencies of the other result make this unlikely.APACHE H score assumes that if results are not recordedit is regarded as being normal. 14 The fact that APACHE II score was specially developed to measure particularly ICU patients makes the assumption in the application to other illnesses a bit suspicious
61
Comparison with Previous Studies:
When the result of my study is compared with previous study in 1985 and 1990, the mean APACHE II score was much higher in 1985 and 1990 than in 1990 and 1995 as shown in the table below.
The Possible reasons for the higher mean APACHE II score in 1985/90 than in 1991/95
Firstly, The study in 1985/90 could have produced a higher APACHE II score due to the fact that , the investigators did not calculated the sample size used. Their sample size figure was based on an arbitrary figurewhich may a cause for a possible effect of chance.
Other possible explanation may be due to the fact that the study criteria I have imposed in my study is more stricter than the previous study. In the previous study, they have allowed patients admitted in other health care institutions into their study, whilst, my study was strictly based only on patients who were admitted into Colchester General Hospital.
Other possible explanation is that case note file anddata contained in the file's which were extracted forthe purpose of the study, were much more carefully written in 1991/95 than in 1985/1990
62
Why should it be different:
There are various possible reasons why the results obtained in 1985/90 is higher than in 1991/95. Firstly, the study design efficient of the studies is likely to bea possible consideration. The hospital characteristics (such admission policy), the patient’s characteristics (such as patients presenting their illness late, the resource implications which were at the height of the agenda in 1985/90 but has probably receded in 1991/95 arepossible explanation.
What are the implications:
The implications for having a reduced APACHE H score as evidence of case mix severity of illness at admission isthat, although my study had shown a continuing increase in the APACHE II score, some of the assumptions of the causes of the increase in APACHE II score, made in the study in 1985/90 has probably been reduced. Or could it have been that the factors which have been used in the studies for both period, needed to be expanded to include other variable which may have a direct impact onthe outcome of future investigations.
Definitely, a future investigation on this issue should be conducted prospectively to allow for the opportunity

of better design criteria to be imposed and more variable used in the study.
63
1985I
1990 1991 1995APACHE II Components
bar (SE) bar (SE) bar (SE) bar (SE)
Acute Physiology 6.0 (0.46 8.2 (0.52 9.0 (0.47 9.6 (0.46Age score 77.7 78.1 (1.11 76.2 (1.13 80.5 (1.22APACHE II score 11.6 (0.47
)13.7 (0.57
)15.6 (0.54 16.3 (1.54
)
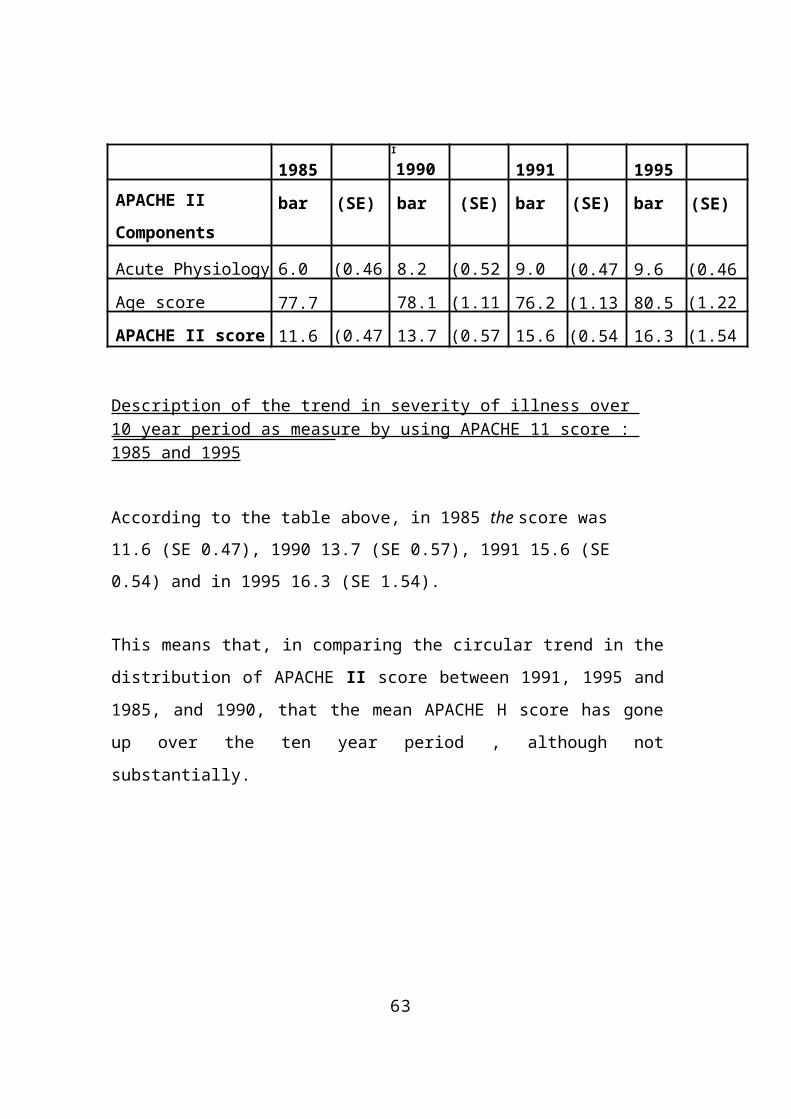
Description of the trend in severity of illness over 10 year period as measure by using APACHE 11 score : 1985 and 1995
According to the table above, in 1985 the score was 11.6 (SE 0.47), 1990 13.7 (SE 0.57), 1991 15.6 (SE 0.54) and in 1995 16.3 (SE 1.54).
This means that, in comparing the circular trend in thedistribution of APACHE II score between 1991, 1995 and1985, and 1990, that the mean APACHE H score has goneup over the ten year period , although notsubstantially.
CONCLUSION
Despite the reason given in the previous studies which led to an investigation into the severity of sickness atadmission at Colchester hospital five years ago by usingthe APACHE II score. My follow-up study in 1991 and 1995did not confirm any substantial increase in the case mixseverity of illness at admission as measured by APACHE II score but has confirmed that there is statistically no significance in the difference in the APACHE II scoreover the two years.
Also like the previous study, my study does not confirm that admission was too easy in 1991 nor too difficult in 1995, or whether the change observed in APACHE II score is an indication of a change in the case mix severity of illness, nor whether the change is due to a reduction in the hospital resources, increase in the population of people of Colchester or an increase incidence of severityof illness in the community.
Whatever the reason, my study has provided a reasonable objective follow-up data on this subject and has achieved its aims and objective.
It confirms clinical perception that they are seeing increasingly severely ill patients in hospital and therefore, if the intensity of severity did hold, factors in terms of staffing will need to be considered.However, it also, probably disapproves the perception that, severity in emergency admission is due to lowered threshold of GP's sending patient's for admission more frequently,
65
Implications to Public Health
One question that can be addressed with the measurement of patient case mix severity which will be of health importance from public health perspective are who are thepatient who tend to have more severe cases of a particular disease ? or how often do people get a particular severe case and where do this people come from.
In other to answer these questions a fully rigorous epidemiological investigation should be under taken. However, it seems possible that such large investigation will require a great deal of time and resources and in view of resource constraints facing the health services, the justification of such an investigation has to be backed up with the appropriate cost and benefit implication.
According to Charlson PP, et al (1991), stratifying patients on the basis of specificcharacteristics determined at the time of admission will be useful in studies of patientoutcomes and resource utilisation, that illness severitystudies of patients in which mortality, morbidity and functional status are being measured as outcomes must take appropriate risk adjustments based on illness severity. In addition, studies of health care delivery, resource utilisation and the organisation and

measurement of health care systems also require accuratemeasures of case mix.15
66
Other implications that could affect the practice of public health functions is the need for the public healthdirectorates to keep track of how the hospital system is performing for his or her residents, particularly at a time of resource constraints both in terms of finance, human resources, and structures and to be able to predictthe effect of changing patterns of practice and health service organisation, and factors important in influencing trends in work load. Clearly, if this factorswere to be achieved, there is a need for information thatallows say comparison of costs and prices, but still takes into account differences in patient populations andtherapies administered, that is, differences in case mix.
Planning for patient care is one of the most demanding and important obligations ofhealth care providers today. Planners such as the publichealth administrators and practitioners need valid and reliable tools to determine patient need and to allocateresources. Identifying levels of resource requirements for patient care is an application of classification theory, which is concerned with arranging patients into groups to presumed "similar" relationships.
The problem with using case mix severity measurement isthat there are several instruments and methodologies developed to measure illness severity based on information extracted from medical record and
these measures were developed for differing reasons, and therefore vary considerably in the domains they measure. Therefore, caution must be taken in the use ofthe instruments: The characteristics of severity measurement systems are shown in appendix 4

67
Lessons Learnt
The investigation of this type which involves the use of patients hospital case notes needed to be planned well in advance, with the full co-operation of all parties who makeuse of the files, control, and manages the custody of the notes including (Hospital Physicians, Nurses, Administrators and Secretaries). My experienced was that having left the decision of my final study topic too late, I was fortunate to be able to get the necessary approval just in time mainly with the goodwill of all people
concerned.
I learnt about how medical records are organised and about system of retrieval of medical files
I have also been able to put into practice some of the skills of project management. This meant that at the later stage of my project, I was able to control the whole project with very little concern. This has made meto appreciate that in future if I was to do another study, I would institute a much more rigorous application of project management.
68
Recommendation for future work
In view of my study being a follow-up of a previous studyconducted on the same subject, I am confident that the instrument of measurement used in this study could be used in future studies to investigate issues relating to severity of illness measurement.
However, it is my view that the design methodology for future work in this area of study could be conducted from a prospective perspective in order to determine theutilisation of hospital services from any of the case mix focus (economy, physiology, functional and psychology).
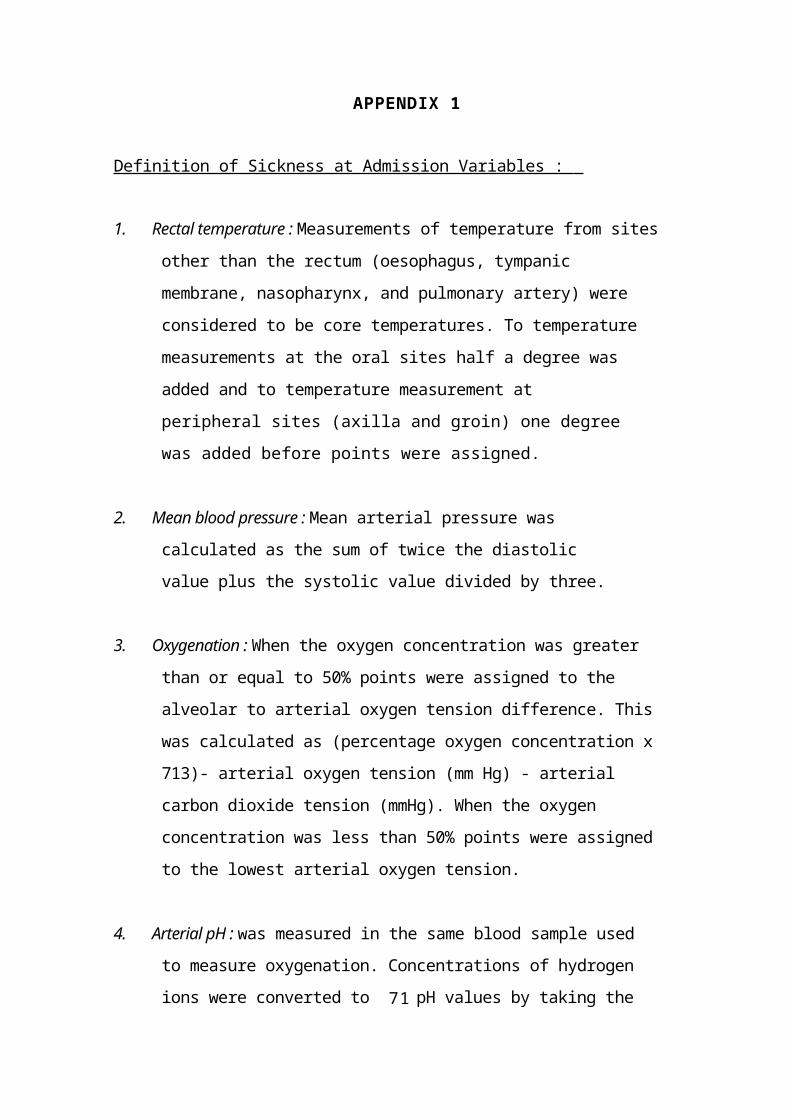
71
APPENDIX 1
Definition of Sickness at Admission Variables :
1. Rectal temperature : Measurements of temperature from sitesother than the rectum (oesophagus, tympanic membrane, nasopharynx, and pulmonary artery) were considered to be core temperatures. To temperature measurements at the oral sites half a degree was added and to temperature measurement atperipheral sites (axilla and groin) one degree was added before points were assigned.
2. Mean blood pressure : Mean arterial pressure was calculated as the sum of twice the diastolic value plus the systolic value divided by three.
3. Oxygenation : When the oxygen concentration was greater than or equal to 50% points were assigned to the alveolar to arterial oxygen tension difference. Thiswas calculated as (percentage oxygen concentration x713)- arterial oxygen tension (mm Hg) - arterial carbon dioxide tension (mmHg). When the oxygen concentration was less than 50% points were assignedto the lowest arterial oxygen tension.
4. Arterial pH : was measured in the same blood sample used to measure oxygenation. Concentrations of hydrogen ions were converted to pH values by taking the

negative logarithm of the concentration of hydrogenions.
72
5. Serum Creatinine : Measurements in tuno1/1 were converted to mg/100 ml by dividing by 88.4. Points for serum creatinine value of greater than 1.4 mg/100 during the previous 24-48 hours associated with oliguria. Oliguria was defined as a urine output of less than 135m1 over eight consecutive hours that was not caused by absence or obstruction of a urinary catheter or by incontinence.
6. Haematocrit :When haemotocrit values not availablepoints were assigned to the haemoglobinconcentration multiplied by three.
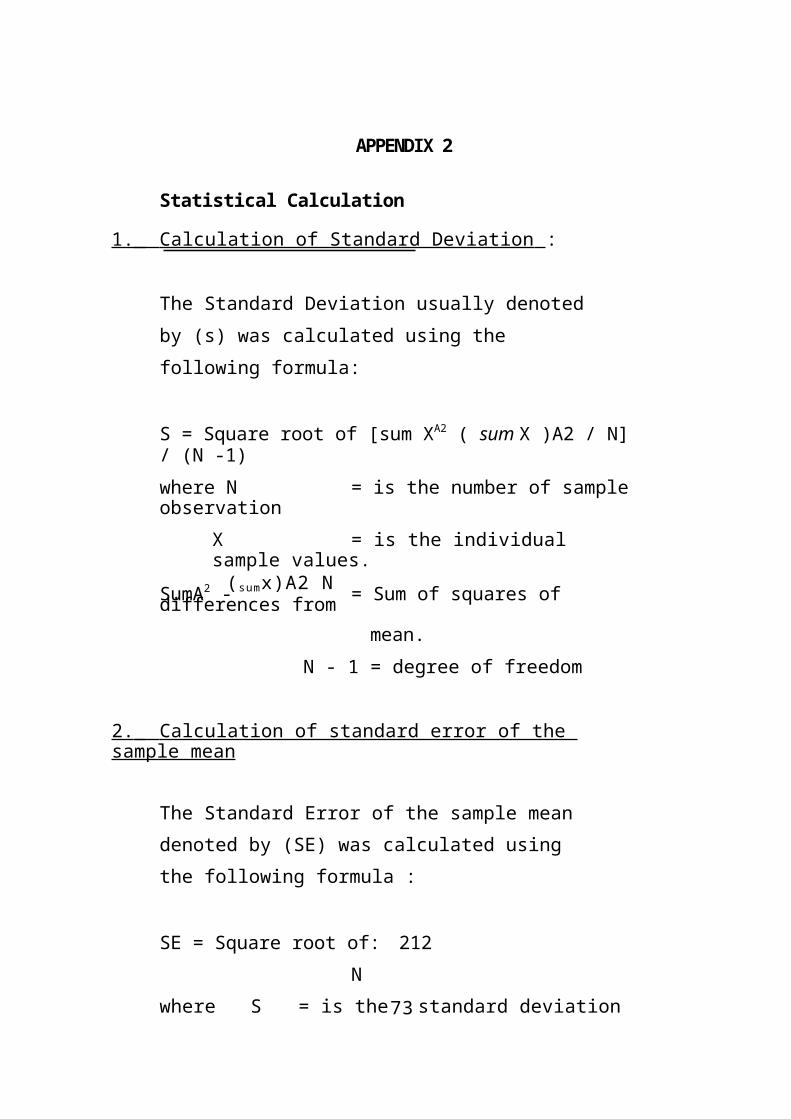
73
APPENDIX 2
Statistical Calculation
1. Calculation of Standard Deviation :
The Standard Deviation usually denoted by (s) was calculated using the following formula:
S = Square root of [sum XA2 ( sum X )A2 / N]/ (N -1)where N = is the number of sampleobservation
X = is the individual sample values.(sumx)A2 NSumA2 - = Sum of squares of differences from
mean.N - 1 = degree of freedom
2. Calculation of standard error of the sample mean
The Standard Error of the sample mean denoted by (SE) was calculated using the following formula :
SE = Square root of: 212N
where S = is the standard deviation

N = is the number of sample observation
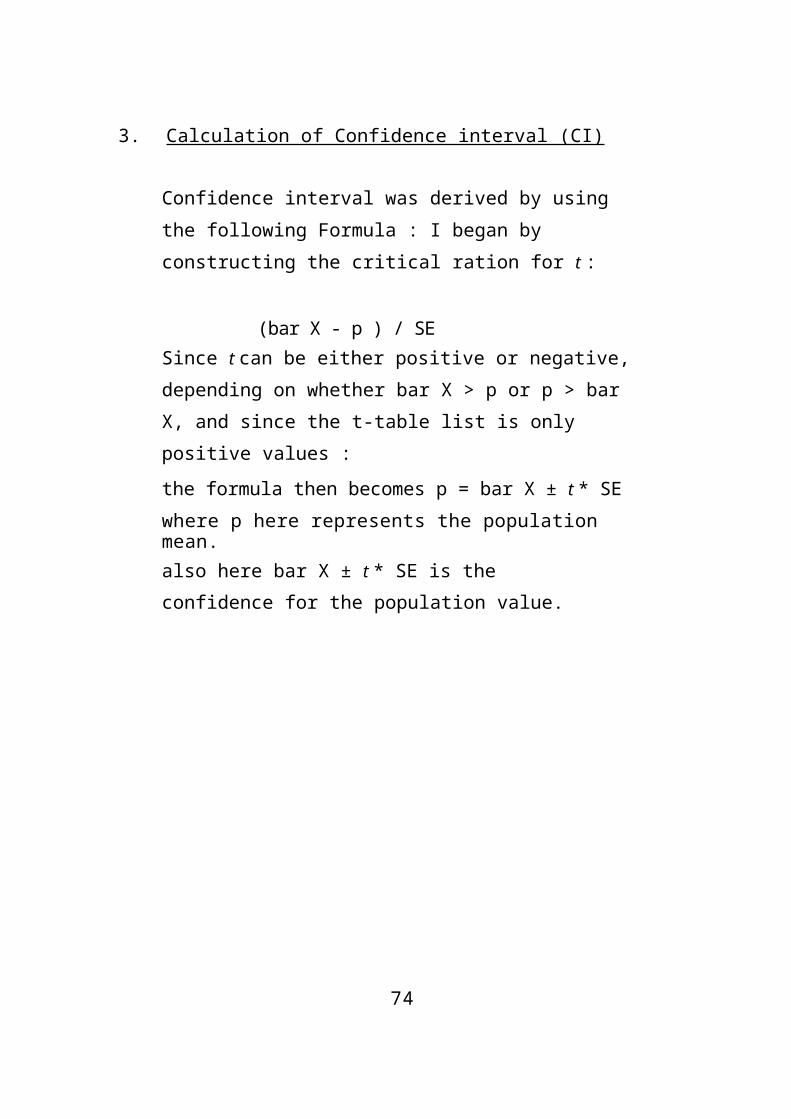
3. Calculation of Confidence interval (CI)
74
Confidence interval was derived by using the following Formula : I began by constructing the critical ration for t :
(bar X - p ) / SESince t can be either positive or negative,depending on whether bar X > p or p > bar X, and since the t-table list is only positive values :the formula then becomes p = bar X ± t * SEwhere p here represents the population mean.also here bar X ± t * SE is the confidence for the population value.
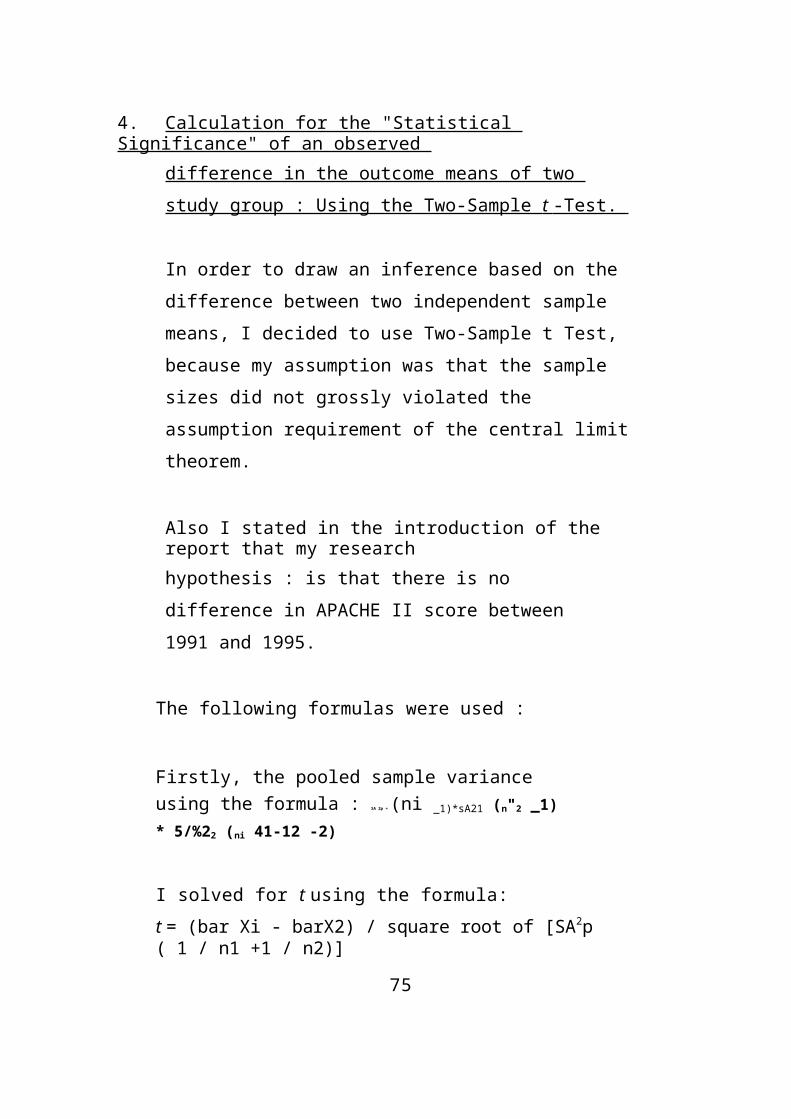
75
4. Calculation for the "Statistical Significance" of an observed
difference in the outcome means of two study group : Using the Two-Sample t -Test.
In order to draw an inference based on the difference between two independent sample means, I decided to use Two-Sample t Test, because my assumption was that the sample sizes did not grossly violated the assumption requirement of the central limittheorem.
Also I stated in the introduction of the report that my researchhypothesis : is that there is no difference in APACHE II score between 1991 and 1995.
The following formulas were used :
Firstly, the pooled sample variance using the formula : SA 2p = (ni _1)*sA21 (n"2 _1)* 5/%22 (ni 41-12 -2)
I solved for t using the formula:t = (bar Xi - barX2) / square root of [SA2p ( 1 / n1 +1 / n2)]
After obtaining the value of t, then thisvalue is looked up in the t - table for a two-sided P-value at the required degrees offreedom.
76
The interpretation of the p-value will be shown with an inequality sign (P< value) or (P> value) due to the fact that, the calculation is done using t-table which does not and cannot give the exact p-value. If a statistical package such as SPSS , SAS, or Epi-Info was used for the calculation of the t -test, then, the p-value would have been given as P=value.
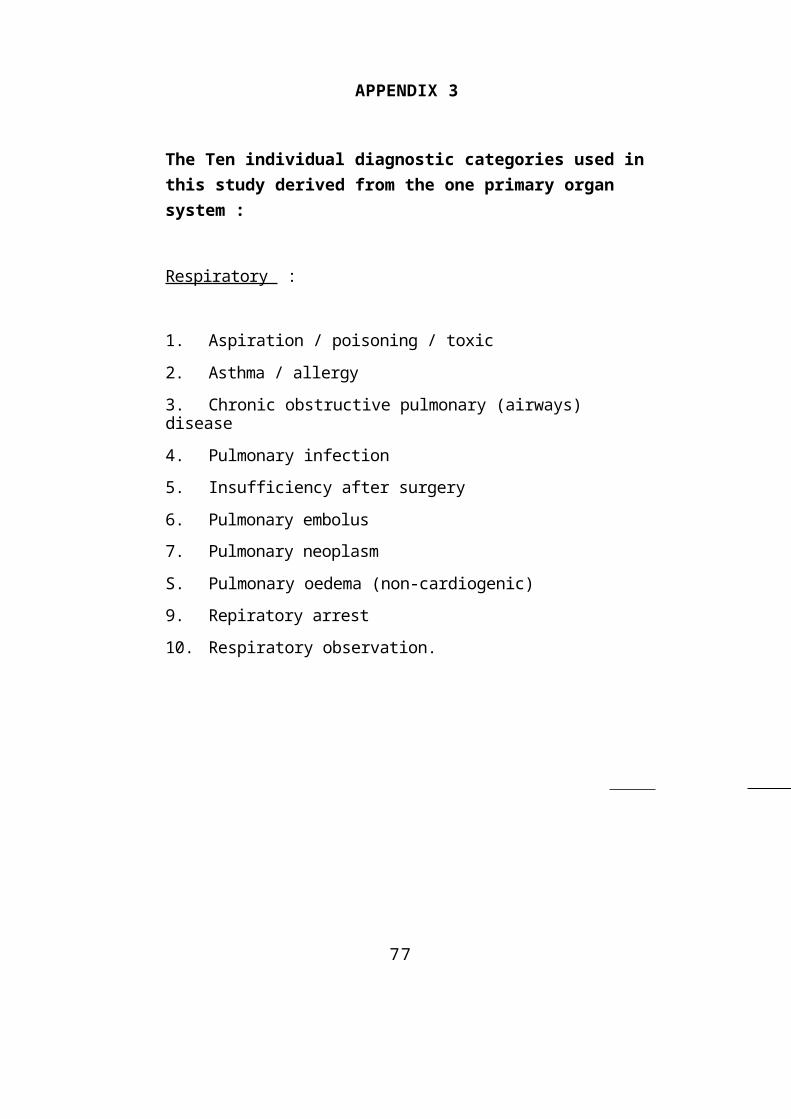
77
APPENDIX 3
The Ten individual diagnostic categories used inthis study derived from the one primary organ system :
Respiratory :
1. Aspiration / poisoning / toxic2. Asthma / allergy3. Chronic obstructive pulmonary (airways) disease4. Pulmonary infection5. Insufficiency after surgery6. Pulmonary embolus7. Pulmonary neoplasmS. Pulmonary oedema (non-cardiogenic)9. Repiratory arrest10. Respiratory observation.
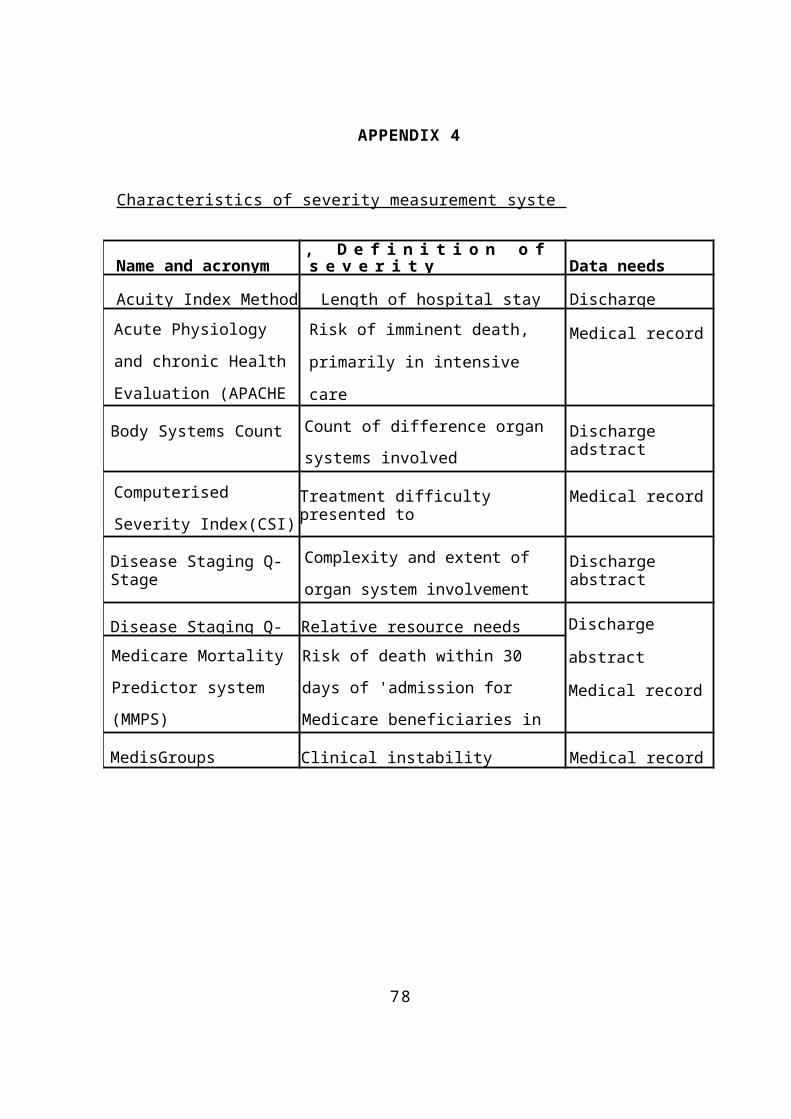
78
APPENDIX 4
Characteristics of severity measurement syste
Name and acronym, D e f i n i t i o n o f s e v e r i t y Data needs
Acuity Index Method Length of hospital stay Discharge Acute Physiology and chronic Health Evaluation (APACHE
Risk of imminent death,
primarily in intensive
care
Medical record
Body Systems Count Count of difference organ systems involved
Discharge adstract
Computerised Severity Index(CSI)
Treatment difficulty presented to
Medical record
Disease Staging Q-Stage
Complexity and extent of organ system involvement
Discharge abstract
Disease Staging Q- Relative resource needs Discharge
abstract
Medical record
Medicare Mortality Predictor system (MMPS)
Risk of death within 30 days of 'admission for Medicare beneficiaries in four conditionMedisGroups Clinical instability Medical record
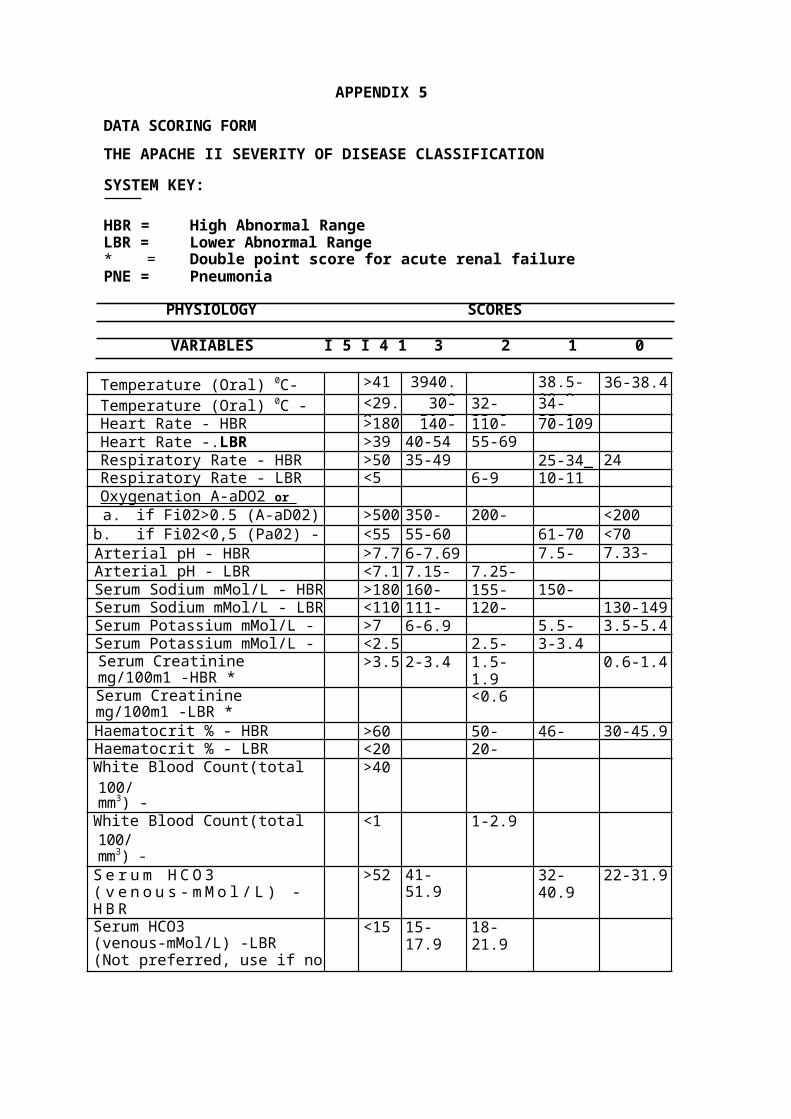
APPENDIX 5
DATA SCORING FORMTHE APACHE II SEVERITY OF DISEASE CLASSIFICATION
SYSTEM KEY:
HBR = High Abnormal RangeLBR = Lower Abnormal Range* = Double point score for acute renal failurePNE = Pneumonia
PHYSIOLOGY SCORES
VARIABLES I 5 I 4 1 3 2 1 0
Temperature (Oral) 0C- HBR
>41 3940.9
38.5-38.9
36-38.4Temperature (Oral) 0C - <29.
930-31.9
32-33.9
34-25.9Heart Rate - HBR >180 140- 110- 70-109
Heart Rate -.LBR >39 40-54 55-69Respiratory Rate - HBR >50 35-49 25-34_ 24Respiratory Rate - LBR <5 6-9 10-11Oxygenation A-aDO2 or Pa02 •a. if Fi02>0.5 (A-aD02)- HBR
>500 350-499
200-349
<200b. if Fi02<0,5 (Pa02) -LBR
<55 55-60 61-70 <70Arterial pH - HBR >7.7 6-7.69 7.5-
7.597.33-7.49Arterial pH - LBR <7.1 7.15- 7.25-
Serum Sodium mMol/L - HBR >180 160- 155- 150-Serum Sodium mMol/L - LBR <110 111- 120- 130-149Serum Potassium mMol/L - >7 6-6.9 5.5- 3.5-5.4Serum Potassium mMol/L - LBR
<2.5 2.5- 3-3.4Serum Creatinine mg/100m1 -HBR *
>3.5 2-3.4 1.5-1.9
0.6-1.4
Serum Creatinine mg/100m1 -LBR *
<0.6
Haematocrit % - HBR >60 50- 46- 30-45.9Haematocrit % - LBR <20 20-White Blood Count(total100/mm3) -HBR
>40
White Blood Count(total100/mm3) -LBR
<1 1-2.9
S e r u m H C O 3 ( v e n o u s - m M o l / L ) -H B R
>52 41-51.9
32-40.9
22-31.9
Serum HCO3 (venous-mMol/L) -LBR(Not preferred, use if noABGs)
<15 15-17.9
18-21.9
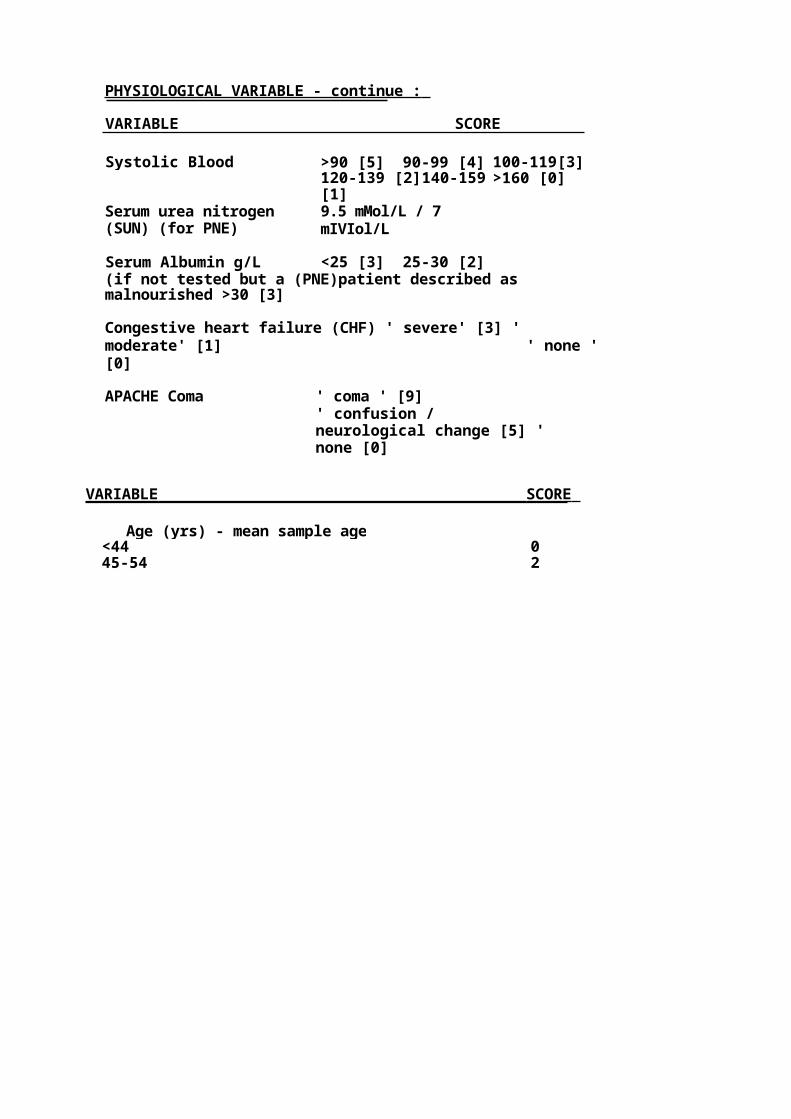
PHYSIOLOGICAL VARIABLE - continue :
VARIABLE SCORE
Systolic Blood >90 [5] 90-99 [4] 100-119[3]120-139 [2]140-159[1]
>160 [0]
Serum urea nitrogen(SUN) (for PNE)
9.5 mMol/L / 7 mIVIol/L
Serum Albumin g/L <25 [3] 25-30 [2](if not tested but a (PNE)patient described as malnourished >30 [3]
Congestive heart failure (CHF) ' severe' [3] ' moderate' [1] ' none '[0]
APACHE Coma ' coma ' [9]' confusion / neurological change [5] 'none [0]
VARIABLE SCORE
Age (yrs) - mean sample age<44 045-54 2

55-64 365-74 5> 75 6
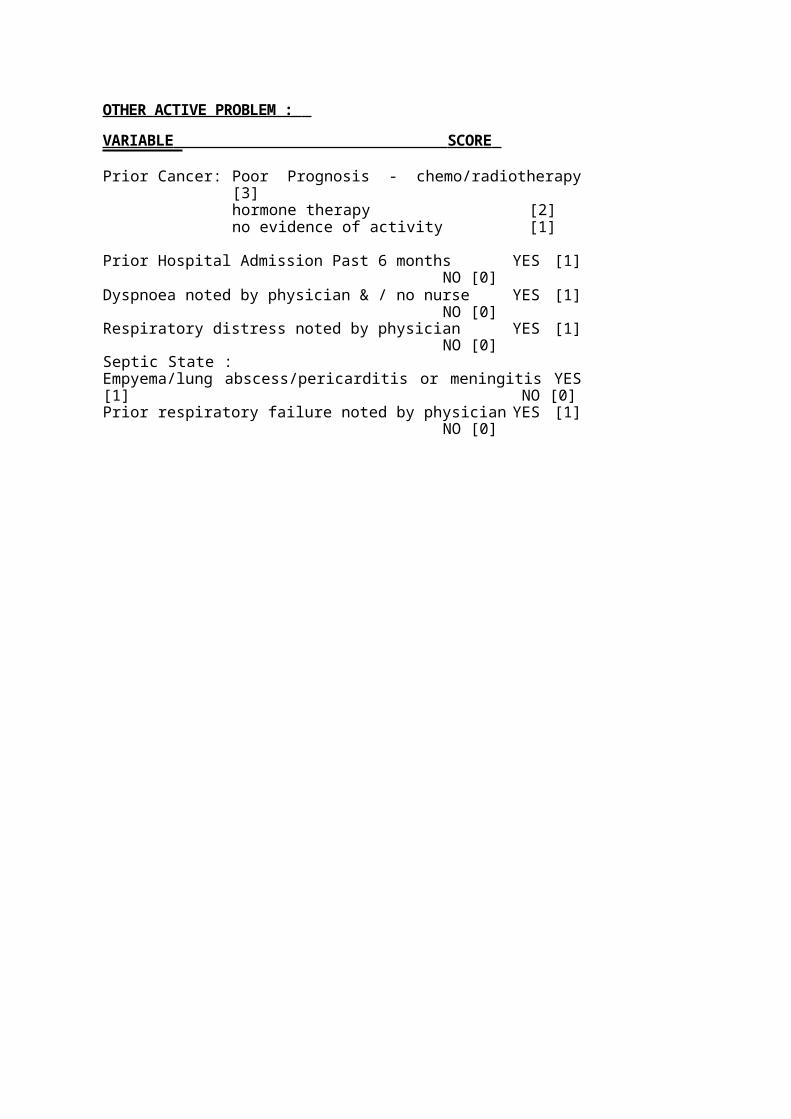
OTHER ACTIVE PROBLEM : VARIABLE SCORE
Prior Cancer: Poor Prognosis - chemo/radiotherapy[3]hormone therapy [2]no evidence of activity [1]
Prior Hospital Admission Past 6 months YES [1]NO [0]
Dyspnoea noted by physician & / no nurse YES [1]NO [0]
Respiratory distress noted by physician YES [1]NO [0]
Septic State :Empyema/lung abscess/pericarditis or meningitis YES[1] NO [0]Prior respiratory failure noted by physician YES [1]
NO [0]
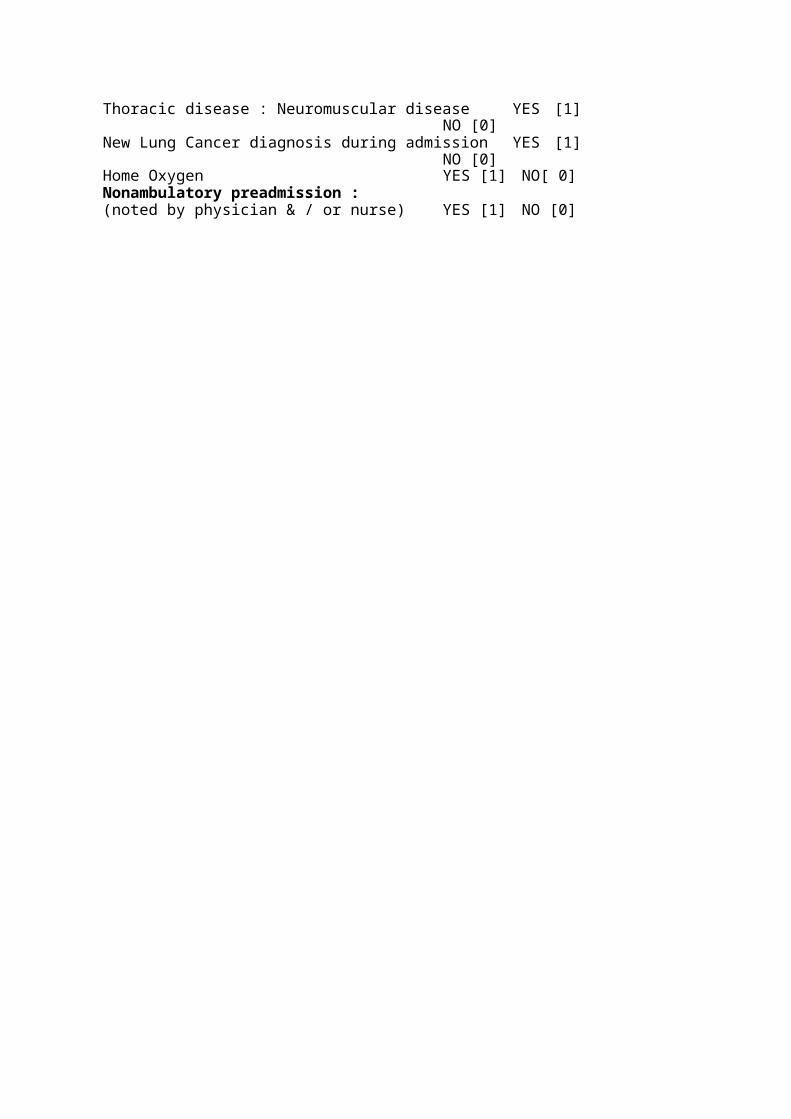
Thoracic disease : Neuromuscular disease YES [1]NO [0]
New Lung Cancer diagnosis during admission YES [1]NO [0]
Home Oxygen YES [1] NO[ 0]Nonambulatory preadmission :(noted by physician & / or nurse) YES [1] NO [0]
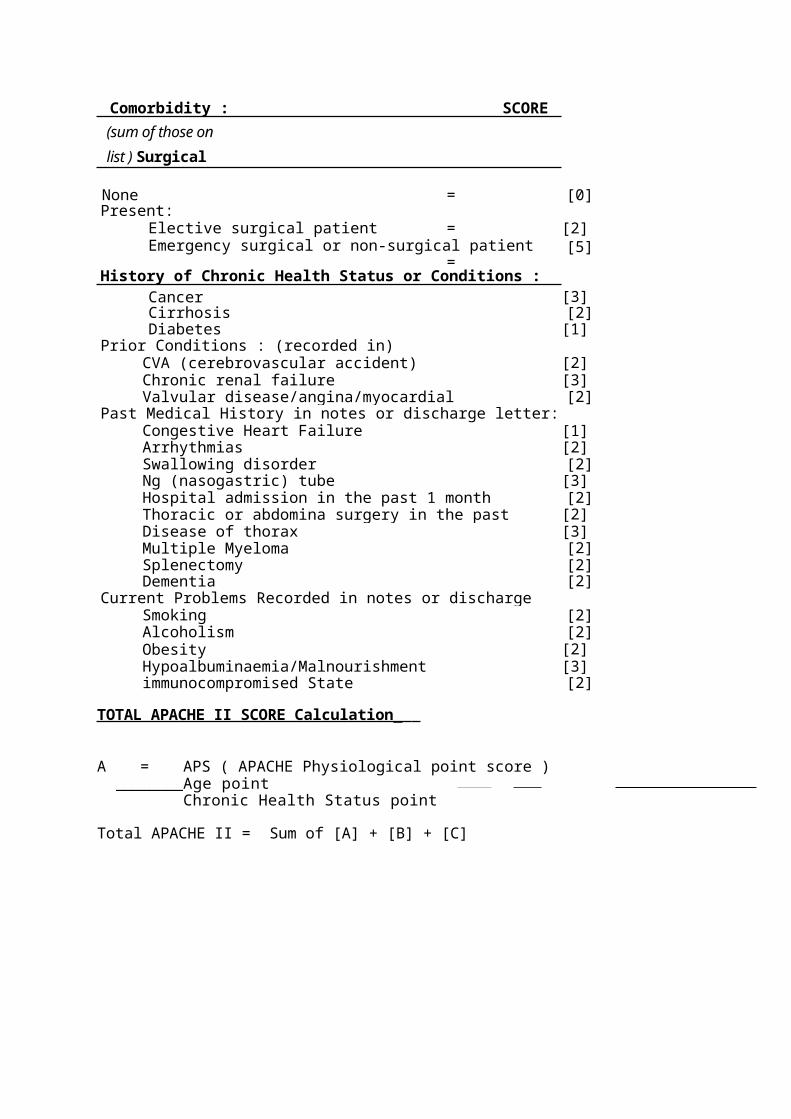
Comorbidity : SCORE(sum of those on list ) Surgical
None = [0]Present:
Elective surgical patient = [2]Emergency surgical or non-surgical patient
=[5]
History of Chronic Health Status or Conditions :Cancer [3]Cirrhosis [2]Diabetes [1]
Prior Conditions : (recorded in)CVA (cerebrovascular accident) [2]Chronic renal failure [3]Valvular disease/angina/myocardial [2]
Past Medical History in notes or discharge letter:Congestive Heart Failure [1]Arrhythmias [2]Swallowing disorder [2]Ng (nasogastric) tube [3]Hospital admission in the past 1 month [2]Thoracic or abdomina surgery in the past month
[2]Disease of thorax [3]Multiple Myeloma [2]Splenectomy [2]Dementia [2]
Current Problems Recorded in notes or discharge letter :Smoking [2]
Alcoholism [2]Obesity [2]Hypoalbuminaemia/Malnourishment [3]immunocompromised State [2]
TOTAL APACHE II SCORE Calculation_
A = APS ( APACHE Physiological point score )________Age point
Chronic Health Status point
Total APACHE II = Sum of [A] + [B] + [C]
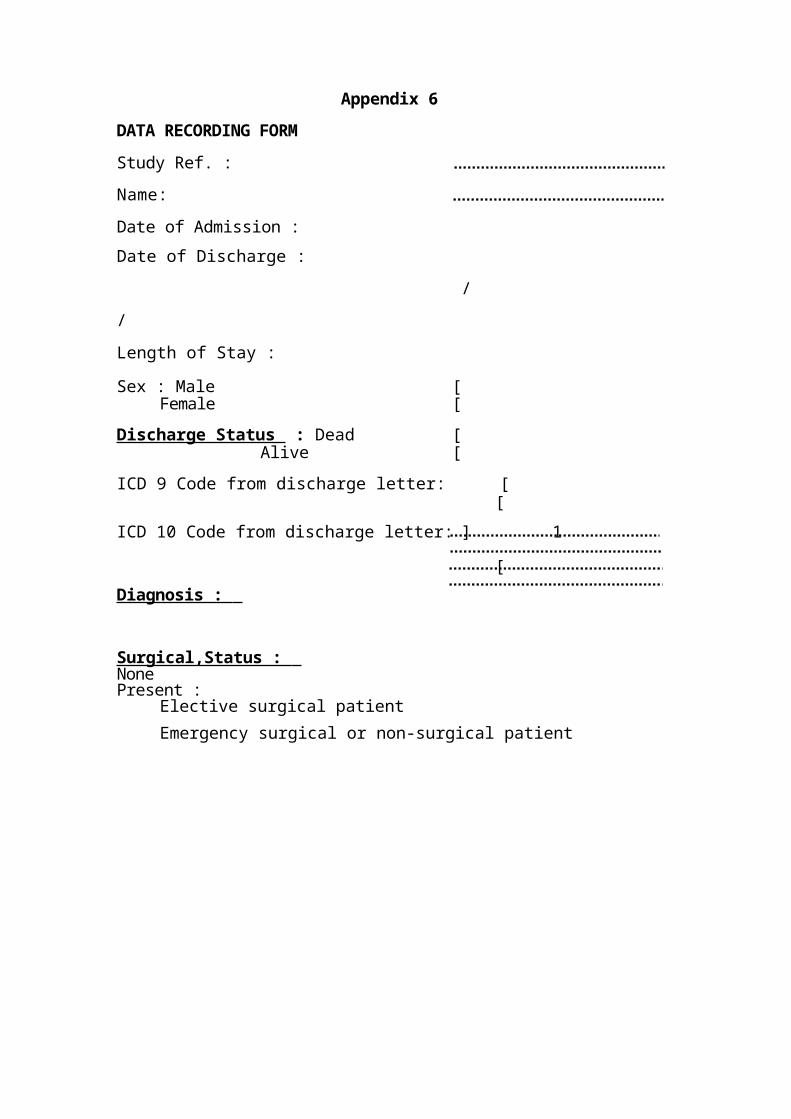
Appendix 6DATA RECORDING FORMStudy Ref. :Name:Date of Admission :Date of Discharge :
/ / Length of Stay :
Sex : Male [Female [
Discharge Status : Dead [Alive [
ICD 9 Code from discharge letter: [[
ICD 10 Code from discharge letter: ] 1
[Diagnosis :
Surgical,Status : NonePresent :
Elective surgical patientEmergency surgical or non-surgical patient
Temperature - oral (AC) : Heart rate :Respiratory rate :Oxygenation :
If Fi02 > or = 0.5 , then
84
Serum Albuming/L Arterial pH :
Serum Sodium mMol / L : 1Serum Potassium mMol / L : ]Serum Creatinine mg / 100m1 : (doublefor ARF)Haematocrit % :White Blood Cell Count total 1000 / mm A 3 :
[ Serum HCO3 (only if no ABGs)Systolic BP mmHg :
] Age :
Serum Urea Nitrogen mMol / L :If no test, was patient described as malnourished ?
YES [ ; NOH History of Chronic Health Condition :
CHF by Chest X - ray :severe ; moderate / mild [ ; none [
APACHE Coma :coma [ ; confusion / neurological changes [ ; none [
Prior Cancer :poor prognosis - chemotherapy/radiotherapy
YES [ ; NOHhormone therapy YES H ; NO [no evidence of activity YES H ; NO [ 1
Prior Hospital Admission Past 6 Months ? YES [ J ; NO []Dyspnoea noted by physician / nurse ? YES [ ; NO HRespiratory Distress noted by physician ? YES [ J ; NO [
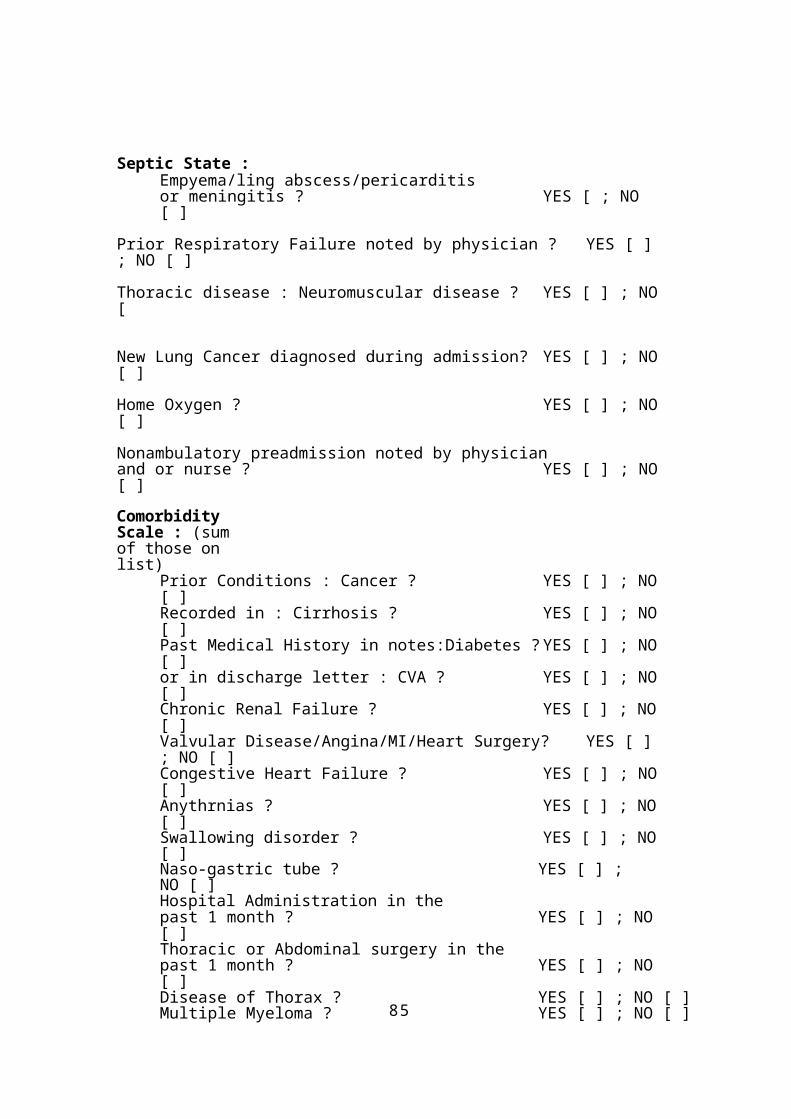
85
Septic State :Empyema/ling abscess/pericarditisor meningitis ? YES [ ; NO [ ]
Prior Respiratory Failure noted by physician ? YES [ ]; NO [ ]Thoracic disease : Neuromuscular disease ? YES [ ] ; NO[
New Lung Cancer diagnosed during admission? YES [ ] ; NO[ ]Home Oxygen ? YES [ ] ; NO[ ]
Nonambulatory preadmission noted by physicianand or nurse ? YES [ ] ; NO[ ]Comorbidity Scale : (sum of those on list)
Prior Conditions : Cancer ? YES [ ] ; NO[ ]Recorded in : Cirrhosis ? YES [ ] ; NO[ ]Past Medical History in notes:Diabetes ?YES [ ] ; NO[ ]or in discharge letter : CVA ? YES [ ] ; NO[ ]Chronic Renal Failure ? YES [ ] ; NO[ ]Valvular Disease/Angina/MI/Heart Surgery? YES [ ]; NO [ ]Congestive Heart Failure ? YES [ ] ; NO[ ]Anythrnias ? YES [ ] ; NO[ ]Swallowing disorder ? YES [ ] ; NO[ ]Naso-gastric tube ? YES [ ] ; NO [ ] Hospital Administration in thepast 1 month ? YES [ ] ; NO[ ] Thoracic or Abdominal surgery in thepast 1 month ? YES [ ] ; NO[ ]Disease of Thorax ? YES [ ] ; NO [ ]Multiple Myeloma ? YES [ ] ; NO [ ]
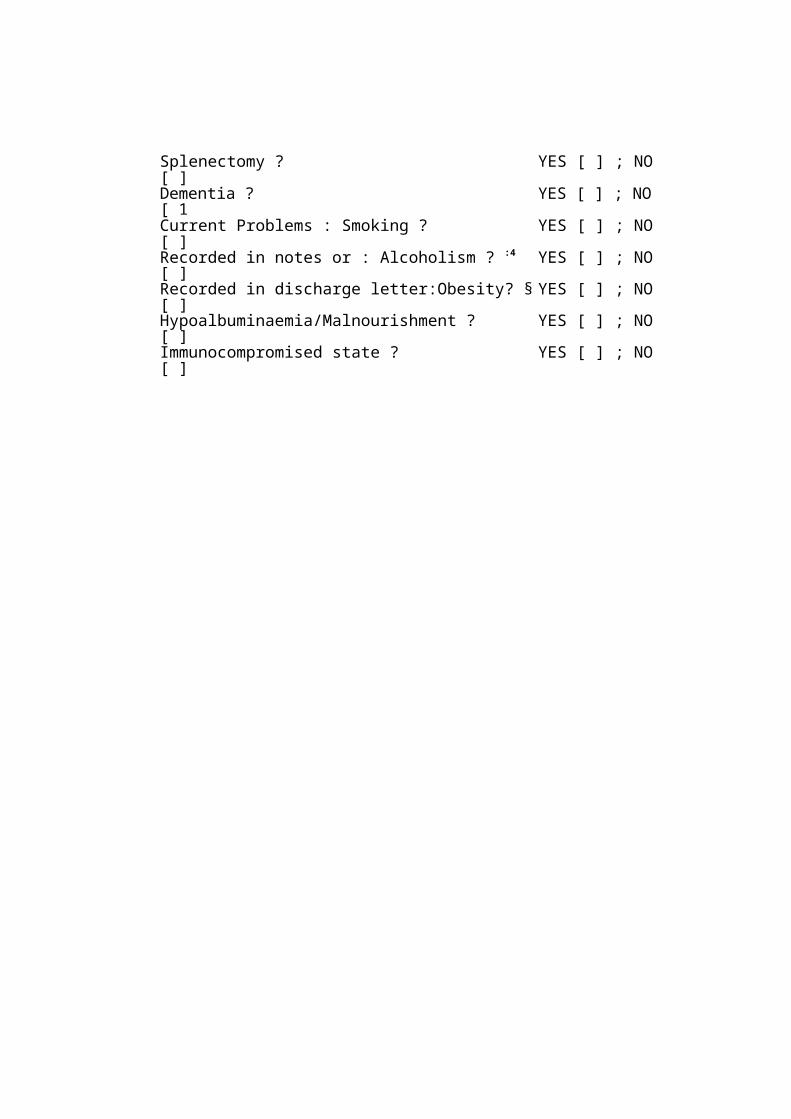
Splenectomy ? YES [ ] ; NO[ ]Dementia ? YES [ ] ; NO[ 1Current Problems : Smoking ? YES [ ] ; NO[ ]Recorded in notes or : Alcoholism ? :4 YES [ ] ; NO[ ]Recorded in discharge letter:Obesity? § YES [ ] ; NO[ ]Hypoalbuminaemia/Malnourishment ? YES [ ] ; NO[ ]Immunocompromised state ? YES [ ] ; NO[ ]
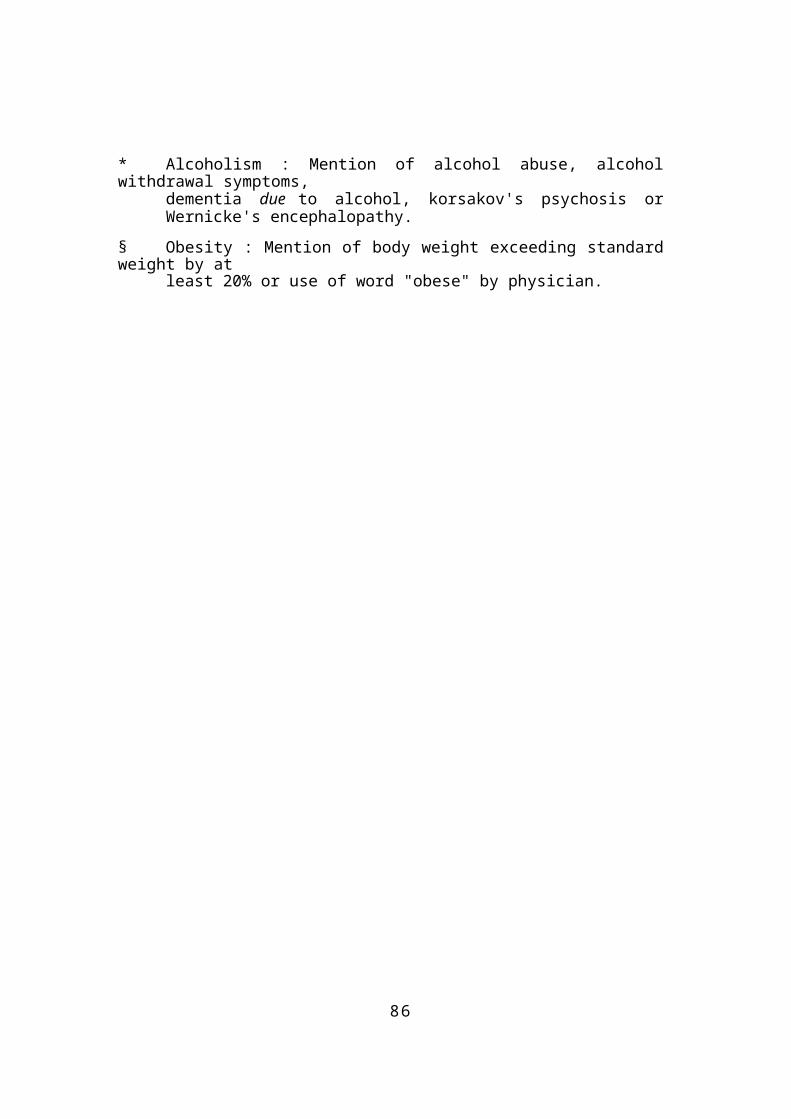
86
* Alcoholism : Mention of alcohol abuse, alcoholwithdrawal symptoms,
dementia due to alcohol, korsakov's psychosis orWernicke's encephalopathy.
§ Obesity : Mention of body weight exceeding standardweight by at
least 20% or use of word "obese" by physician.

APPENDIX 7
Method Applied for the Calculation of the Mean Difference for APA

CHE II score and it's Component parts ( acute physiology score, Age

and History of Chronic Health Conditons between the years 1991/92

and 1995/96.
The method employed the formula for calculating the d

ifference between two independent sample mean: using the Two-Samp

le t-Test method.
Formula used :
Pooled variance (SA2p) = (n1-1)SDA21 +(n2 - 1)SDA22 divided byn1 +n2 - 2
where :(n1-1) is
the number ofobservation in thefirst group minus
one = (dt) degree of freedomSDA21 is the standard deviation of the first group value squared. (n2-1) is the number of observation inthe second group minus
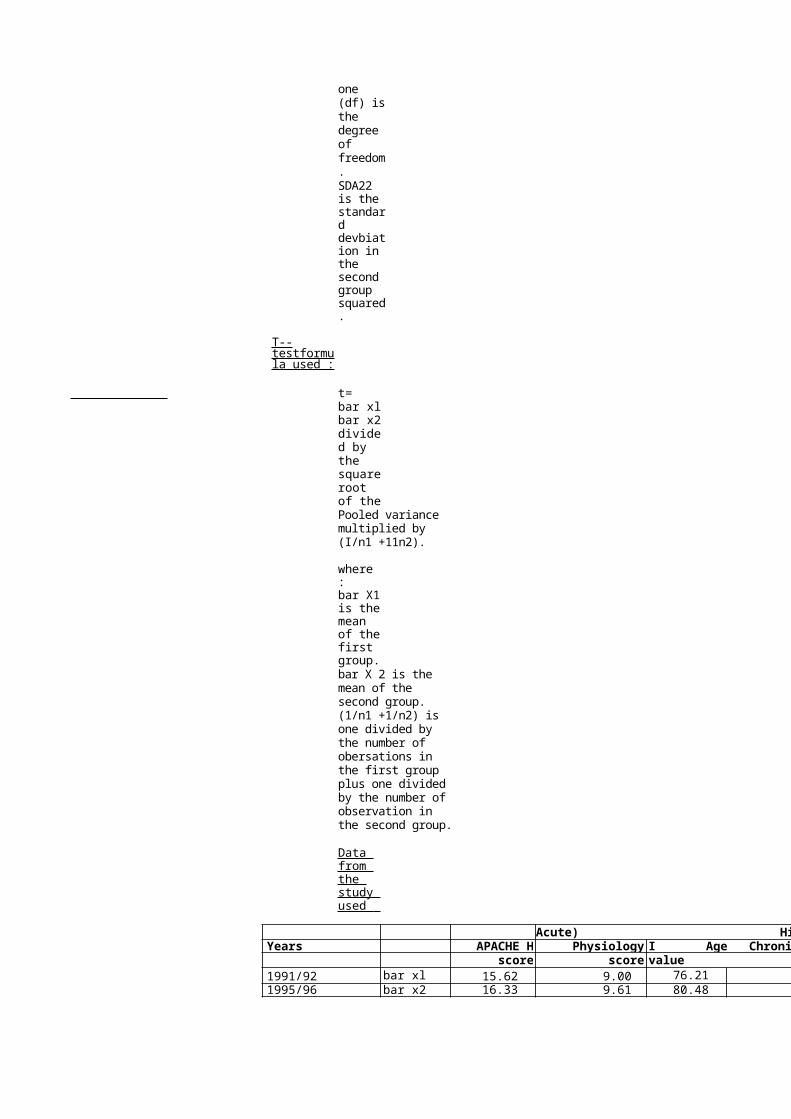
one (df) isthe degree of freedom.SDA22 is the standard devbiation in the second group squared.
T--testformula used :
t=bar xlbar x2divided by the squareroot of thePooled variance multiplied by (I/n1 +11n2).
where :bar X1is themean of thefirst group.bar X 2 is the mean of the second group. (1/n1 +1/n2) is one divided by the number of obersations in the first group plus one divided by the number of observation in the second group.
Data from the study used
Acute) History ofYears APACHE H Physiology I Age Chronic status
score score value1991/92 bar xl 15.62 9.00 76.211995/96 bar x2 16.33 9.61 80.48
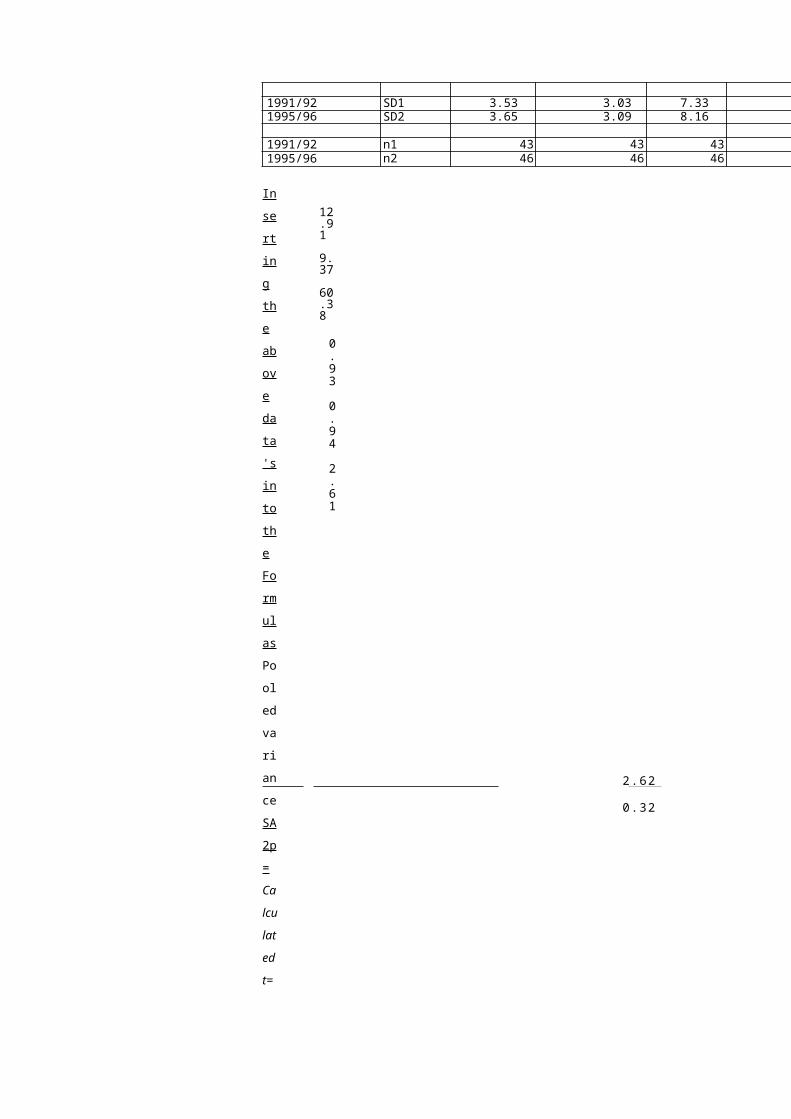
2.62
0.32
1991/92 SD1 3.53 3.03 7.331995/96 SD2 3.65 3.09 8.16
1991/92 n1 43 43 431995/96 n2 46 46 46
Insertingtheabovedata'sintotheFormulasPooledvarianceSA2p=Ca
lcu
lat
ed
t=
12.919.3760.38
0.93
0.94
2.61
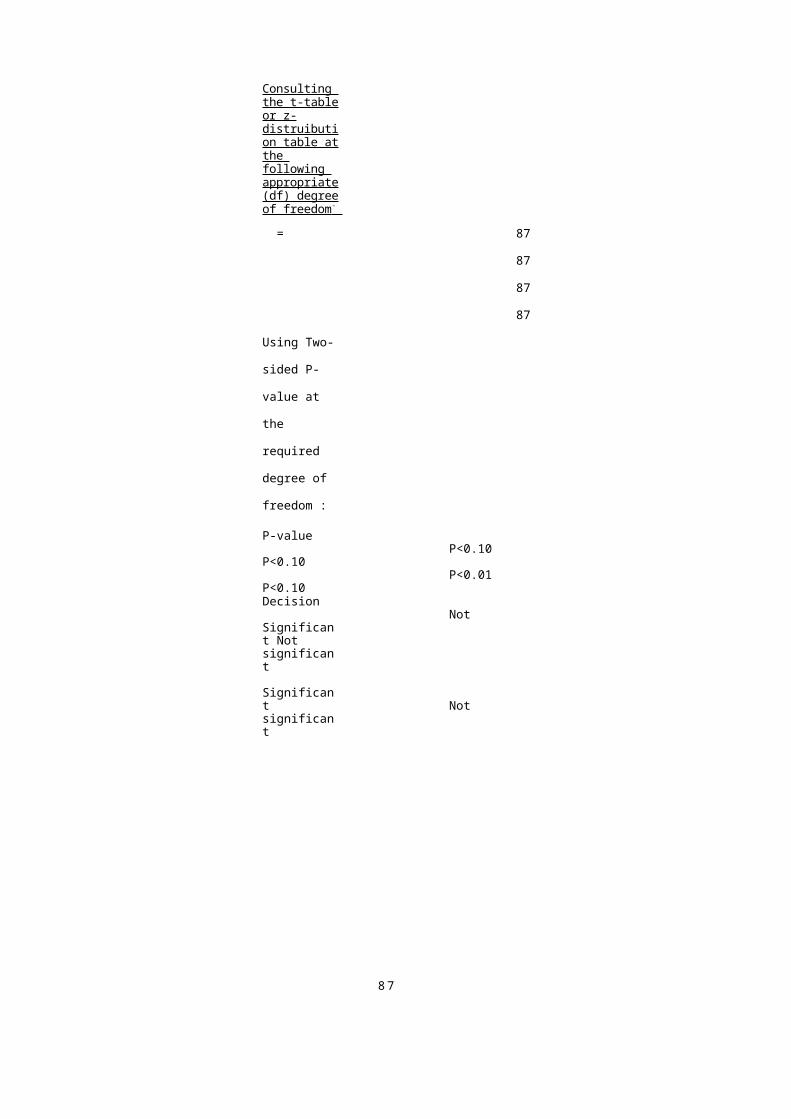
87
Consulting the t-tableor z-distruibution table atthe following appropriate(df) degreeof freedom -
= 87
87
87
87
Using Two-
sided P-
value at
the
required
degree of
freedom :
P-valueP<0.10
P<0.10P<0.01
P<0.10Decision
Not Significant Not significant
Significant Not significant
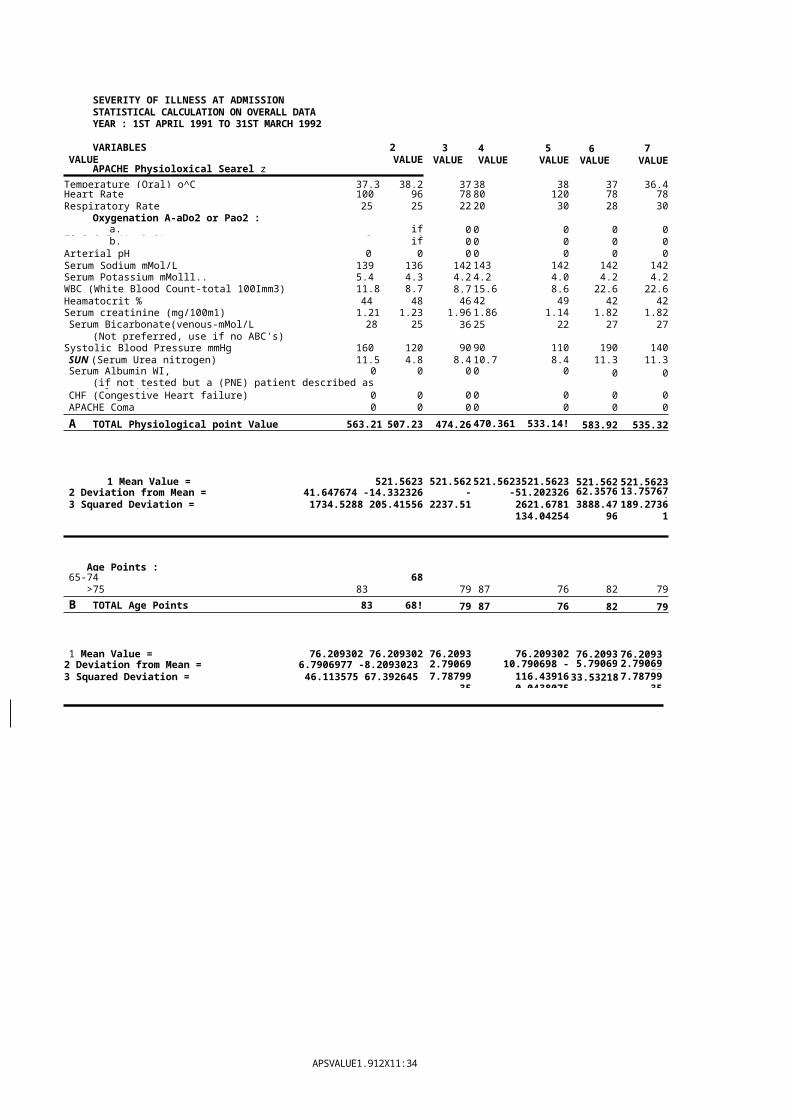
APSVALUE1.912X11:34 am27/8/97
SEVERITY OF ILLNESS AT ADMISSIONSTATISTICAL CALCULATION ON OVERALL DATA YEAR : 1ST APRIL 1991 TO 31ST MARCH 1992
VARIABLES 2VALUE VALUE
APACHE Physioloxical Searel z
3 VALUE
4 5VALUE VALUE
6 VALUE
7VALUE
Temperature (Oral) o^C 37.3 38.2 37 38 38 37 36.4Heart Rate 100 96 78 80 120 78 78Respiratory Rate 25 25 22 20 30 28 30
Oxygenation A-aDo2 or Pao2 :a. if
Fio2>0.5 (A-aDo2) 0 00 0 0 0 0
b. ifFic2<0.5 (Pao2) 0 0
0 0 0 0 0Arterial pH 0 0 0 0 0 0 0Serum Sodium mMol/L 139 136 142 143 142 142 142Serum Potassium mMolll.. 5.4 4.3 4.2 4.2 4.0 4.2 4.2WBC (White Blood Count-total 100Imm3) 11.8 8.7 8.7 15.6 8.6 22.6 22.6Heamatocrit % 44 48 46 42 49 42 42Serum creatinine (mg/100m1) 1.21 1.23 1.96 1.86 1.14 1.82 1.82Serum Bicarbonate(venous-mMol/L 28 25 36 25 22 27 27
(Not preferred, use if no ABC's)Systolic Blood Pressure mmHg 160 120 90 90 110 190 140SUN (Serum Urea nitrogen) 11.5 4.8 8.4 10.7 8.4 11.3 11.3Serum Albumin WI, 0 0
(if not tested but a (PNE) patient described as malnourished > 30)
0 0 0 0 0
CHF (Congestive Heart failure) 0 0 0 0 0 0 0APACHE Coma 0 0 0 0 0 0 0A TOTAL Physiological point Value 563.21 507.23 474.26 470.361 533.14! 583.92 535.32
1 Mean Value = 521.5623 521.562 521.5623521.5623 521.562 521.56232 Deviation from Mean = 41.647674 -14.332326 -
47.3023-51.20232611.577674
62.357674
13.7576743 Squared Deviation = 1734.5288 205.41556 2237.51 2621.6781
134.042543888.47
96189.2736
1
Age Points :65-74 68
>75 83 79 87 76 82 79B TOTAL Age Points 83 68! 79 87 76 82 79
1 Mean Value = 76.209302 76.209302 76.2093 76.209302 76.2093 76.20932 Deviation from Mean = 6.7906977 -8.2093023 2.79069
7710.790698 -0.2093023
5.7906977
2.79069773 Squared Deviation = 46.113575 67.392645 7.78799
35116.439160.0438075
33.53218 7.7879935
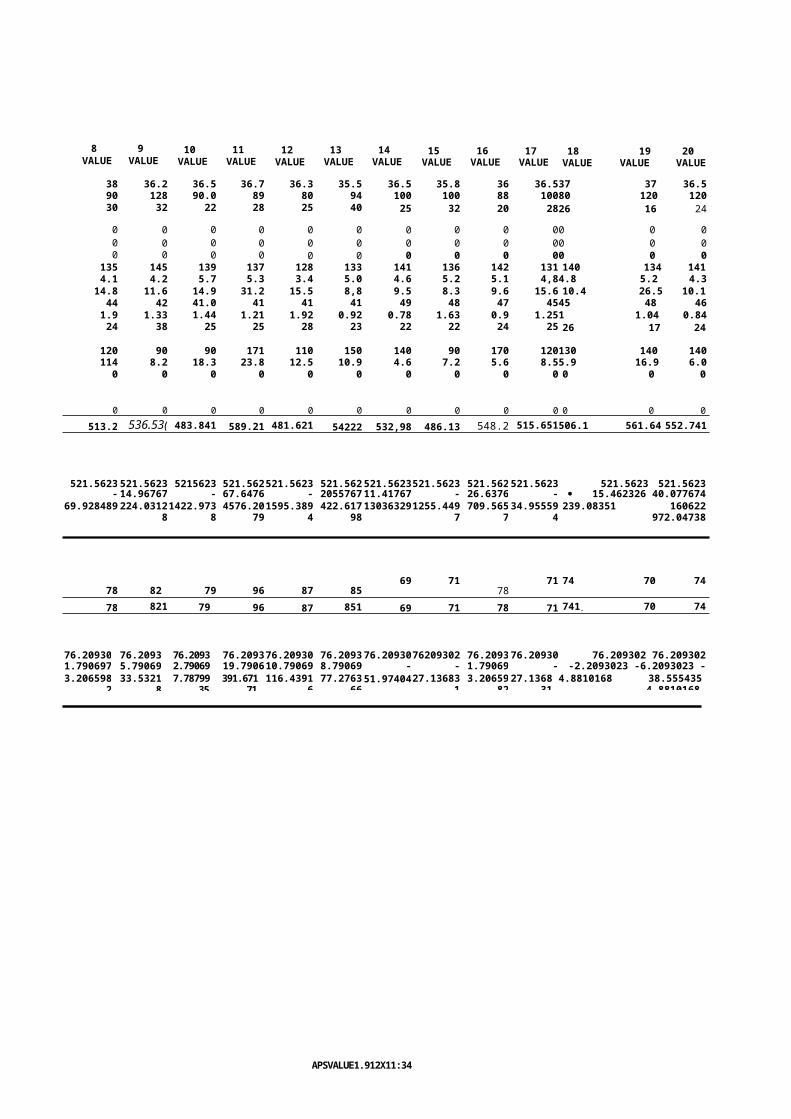
APSVALUE1.912X11:34 am2716197
8 VALUE
9 VALUE
10 VALUE
11 VALUE
12 VALUE
13 VALUE
14 VALUE
15 VALUE
16 VALUE
17 VALUE
18 19 20VALUE VALUE VALUE
38 36.2 36.5 36.7 36.3 35.5 36.5 35.8 36 36.537 37 36.590 128 90.0 89 80 94 100 100 88 10080 120 12030 32 22 28 25 40 25 32 20 2826 16 24
0 0 0 0 0 0 0 0 0 00 0 00 0 0 0 0 0 0 0 0 00 0 00 0 0 0 0 0 0 0 0 00 0 0
135 145 139 137 128 133 141 136 142 131 140 134 1414.1 4.2 5.7 5.3 3.4 5.0 4.6 5.2 5.1 4,84.8 5.2 4.314.8 11.6 14.9 31.2 15.5 8,8 9.5 8.3 9.6 15.6 10.4 26.5 10.144 42 41.0 41 41 41 49 48 47 4545 48 461.9 1.33 1.44 1.21 1.92 0.92 0.78 1.63 0.9 1.251 1.04 0.8424 38 25 25 28 23 22 22 24 25 26 17 24
120 90 90 171 110 150 140 90 170 120130 140 140114 8.2 18.3 23.8 12.5 10.9 4.6 7.2 5.6 8.55.9 16.9 6.00 0 0 0 0 0 0 0 0 0 0 0 0
0 0 0 0 0 0 0 0 0 0 0 0 0513.2 536.53( 483.841 589.21 481.621 54222 532,98 486.13 548.2 515.651506.1 561.64 552.741
521.5623 521.5623 5215623 521.562521.5623 521.562521.5623521.5623 521.562521.5623 521.5623 521.5623-
8.36232.514.96767
4-
37.7223267.6476
74-
39.942322055767
411.41767
4-
35.4323226.6376
74-
5.912325· 15.462326 40.077674
31.17767469.928489 224.031281422.973
84576.20
791595.389
4422.617
98130363291255.449
7709.565
734.95559
4239.08351 160622
972.04738
69 71 71 74 70 7478 82 79 96 87 85 7878 821 79 96 87 851 69 71 78 71 741. 70 74
76.20930 76.2093 76.2093 76.209376.20930 76.209376.2093076209302 76.209376.20930 76.209302 76.2093021.790697
75.79069
772.79069
7719.7906
9810.79069
88.79069
77-
7.209302-
5.2093021.79069
77-
5.209302-2.2093023 -6.2093023 -
2.20930233.2065982
33.53218
7.7879935
391.67171
116.43916
77.276366
51.9740427.136831
3.2065982
27.136831
4.8810168 38.5554354.8810168
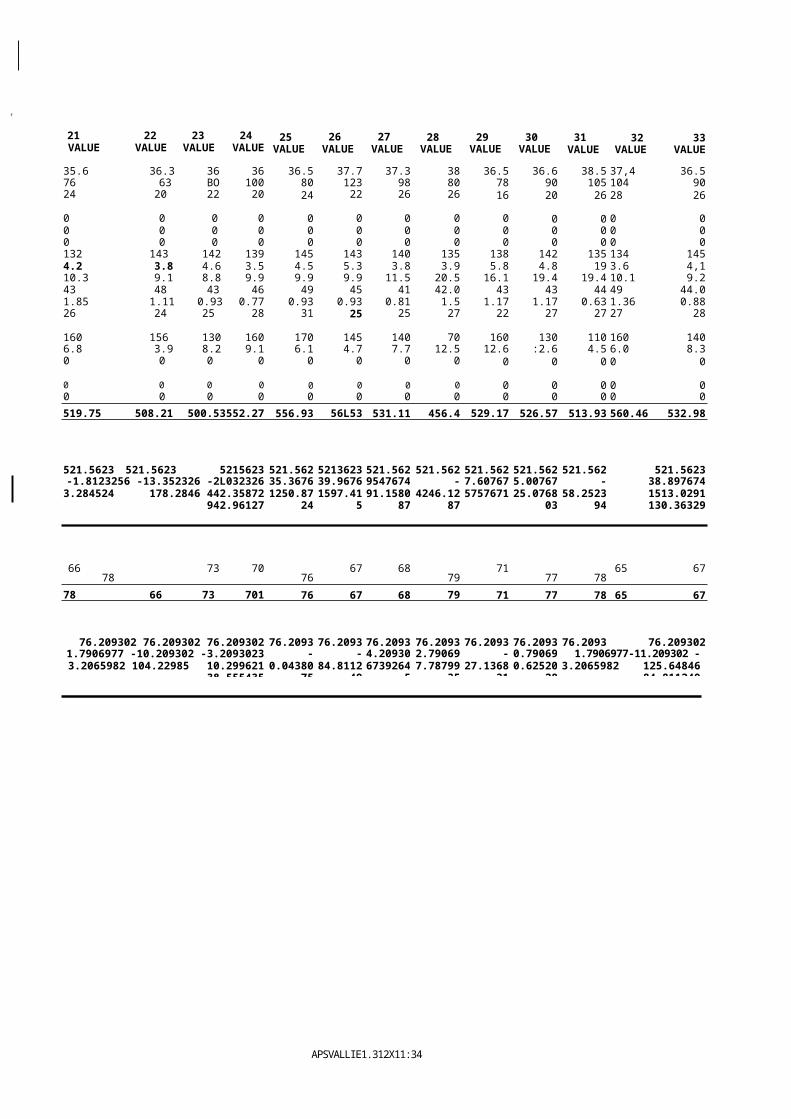
f
APSVALLIE1.312X11:34 am27/6/97
21 22 23 24VALUE VALUE VALUE VALUE
25 VALUE
26 VALUE
27 VALUE
28 VALUE
29 VALUE
30 VALUE
31 VALUE
32 33VALUE VALUE
35.6 36.3 36 36 36.5 37.7 37.3 38 36.5 36.6 38.5 37,4 36.576 63 BO 100 80 123 98 80 78 90 105 104 9024 20 22 20 24 22 26 26 16 20 26 28 26
0 0 0 0 0 0 0 0 0 0 0 0 00 0 0 0 0 0 0 0 0 0 0 0 00 0 0 0 0 0 0 0 0 0 0 0 0132 143 142 139 145 143 140 135 138 142 135 134 1454.2 3.8 4.6 3.5 4.5 5.3 3.8 3.9 5.8 4.8 19 3.6 4,110.3 9.1 8.8 9.9 9.9 9.9 11.5 20.5 16.1 19.4 19.4 10.1 9.243 48 43 46 49 45 41 42.0 43 43 44 49 44.01.85 1.11 0.93 0.77 0.93 0.93 0.81 1.5 1.17 1.17 0.63 1.36 0.8826 24 25 28 31 25 25 27 22 27 27 27 28
160 156 130 160 170 145 140 70 160 130 110 160 1406.8 3.9 8.2 9.1 6.1 4.7 7.7 12.5 12.6 :2.6 4.5 6.0 8.30 0 0 0 0 0 0 0 0 0 0 0 0
0 0 0 0 0 0 0 0 0 0 0 0 00 0 0 0 0 0 0 0 0 0 0 0 0519.75 508.21 500.53552.27 556.93 56L53 531.11 456.4 529.17 526.57 513.93 560.46 532.98
521.5623 521.5623 5215623 521.562 5213623 521.562 521.562 521.562 521.562 521.562 521.5623-1.8123256 -13.352326 -2L032326
30.70767435.3676
7439.9676
749547674
4-
65.162327.60767
445.00767
44-
7.63232538.89767411.4176743.284524 178.2846 442.35872
942.961271250.87
241597.41
591.1580
874246.12
875757671 25.0768
0358.2523
941513.0291130.36329
66 73 70 67 68 71 65 6778 76 79 77 78
78 66 73 701 76 67 68 79 71 77 78 65 67
76.209302 76.209302 76.209302 76.2093 76.2093 76.2093 76.2093 76.2093 76.2093 76.2093 76.2093021.7906977 -10.209302 -3.2093023
-6.2093023-
0.20930-
9.2093024.20930
232.79069
77-
5.2093020.79069
771.7906977-11.209302 -
9.20930233.2065982 104.22985 10.29962138.555435
0.0438075
84.811249
673926457.78799
3527.1368
310.62520
283.2065982 125.64846
84.811249
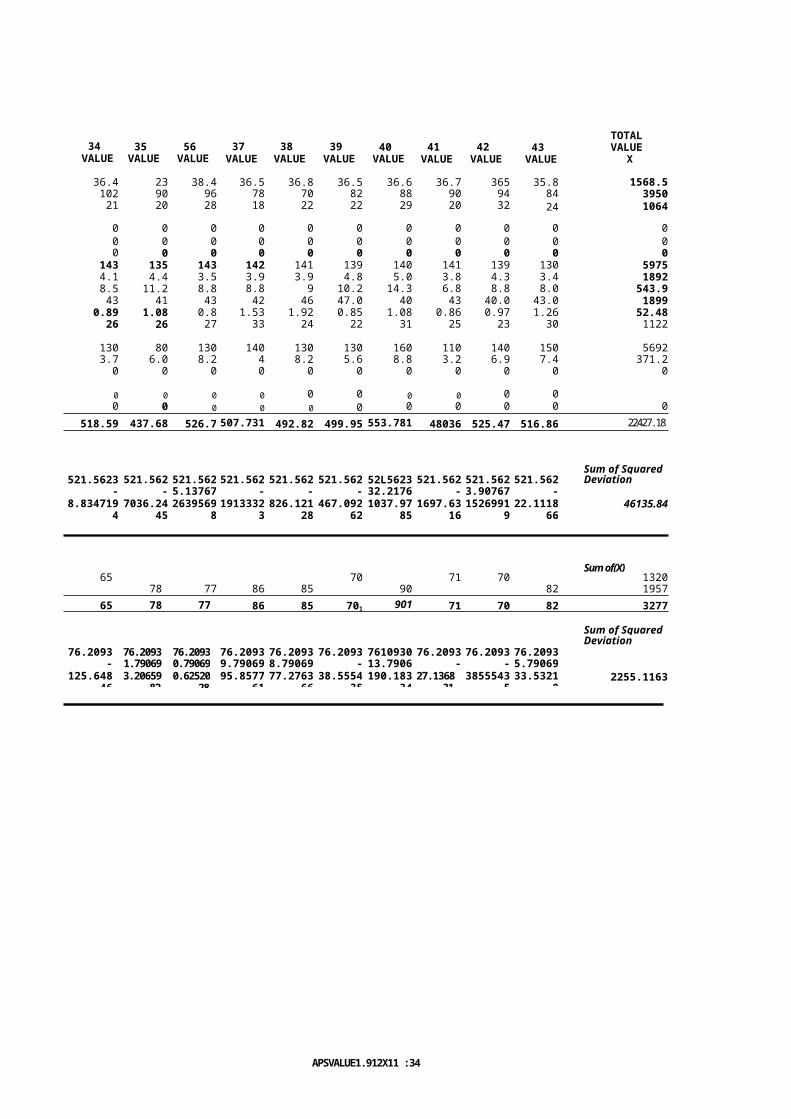
APSVALUE1.912X11 :34 tu'n27/6/97
34 VALUE
35 VALUE
56 VALUE
37 VALUE
38 VALUE
39 VALUE
40 VALUE
41 VALUE
42 VALUE
43 VALUE
TOTAL VALUE
X
36.4 23 38.4 36.5 36.8 36.5 36.6 36.7 365 35.8 1568.5102 90 96 78 70 82 88 90 94 84 395021 20 28 18 22 22 29 20 32 24 1064
0 0 0 0 0 0 0 0 0 0 00 0 0 0 0 0 0 0 0 0 00 0 0 0 0 0 0 0 0 0 0
143 135 143 142 141 139 140 141 139 130 59754.1 4.4 3.5 3.9 3.9 4.8 5.0 3.8 4.3 3.4 18928.5 11.2 8.8 8.8 9 10.2 14.3 6.8 8.8 8.0 543.943 41 43 42 46 47.0 40 43 40.0 43.0 1899
0.89 1.08 0.8 1.53 1.92 0.85 1.08 0.86 0.97 1.26 52.4826 26 27 33 24 22 31 25 23 30 1122
130 80 130 140 130 130 160 110 140 150 56923.7 6.0 8.2 4 8.2 5.6 8.8 3.2 6.9 7.4 371.20 0 0 0 0 0 0 0 0 0 0
0 0 0 0 0 0 0 0 0 00 0 0 0 0 0 0 0 0 0 0
518.59 437.68 526.7 507.731 492.82 499.95 553.781 48036 525.47 516.86 22427.18]
Sum of Squared521.5623 521.562
3521.562
3521.562
3521.562
3521.562
352L5623 521.562
3521.562
3521.562
3Deviation
-2.972325
-83.8823
5.1376744
-13.83232
-28.74232
-21.6123
32.217674
-41.2023
3.9076744
-4.7023258.834719
47036.24
452639569
81913332
3826.121
28467.092
621037.97
851697.63
161526991
922.1118
6646135.84
Sum of(X)65 70 71 70 1320
78 77 86 85 90 82 195765 78 77 86 85 701 901 71 70 82 3277
Sum of SquaredDeviation
76.209302
76.209302
76.209302
76.209302
76.209302
76.209302
7610930276.2093
0276.2093
0276.2093
02-1120930
1.7906977
0.7906977
9.7906977
8.7906977
-6209302
13.790698
-5.20930
-0.209302
5.7906977125.648
463.20659
820.62520
2895.8577
6177.2763
6638.5554
35190.183
3427.1368
313855543
533.5321
82255.1163
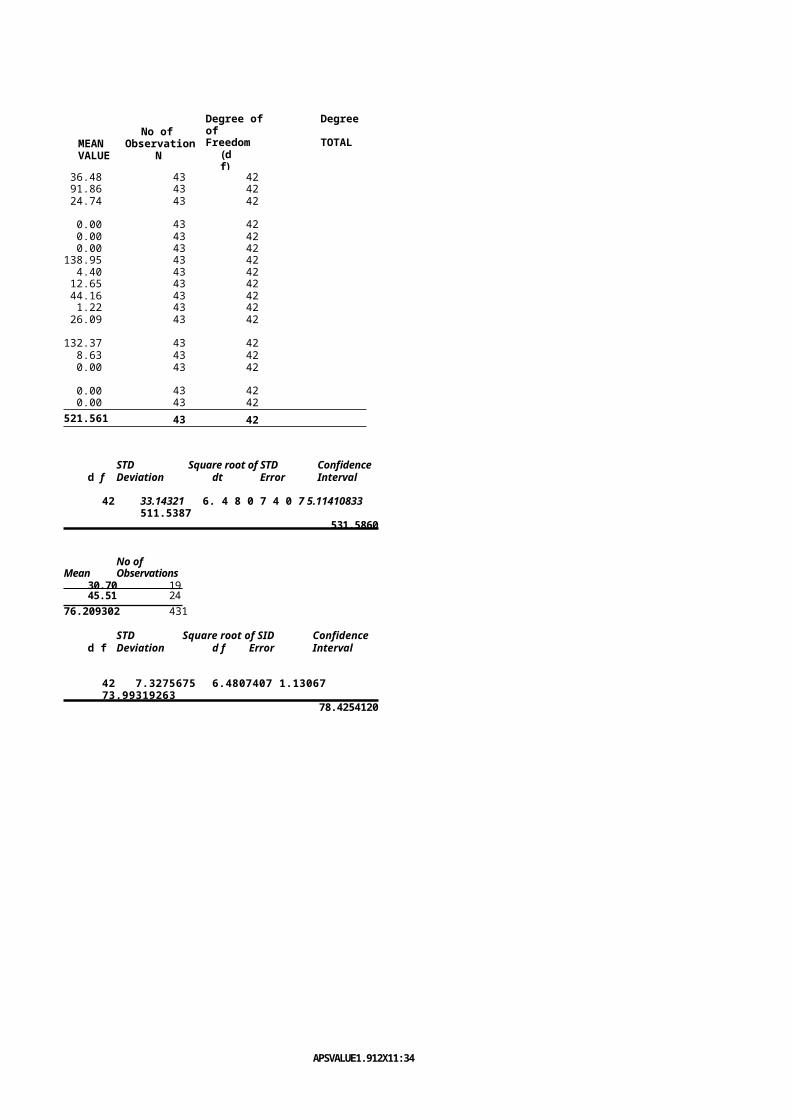
APSVALUE1.912X11:34 am2716197
MEAN VALUE
No of Observation
N
Degree of Degree ofFreedom TOTAL
(df)
36.48 43 4291.86 43 4224.74 43 42
0.00 43 420.00 43 420.00 43 42
138.95 43 424.40 43 4212.65 43 4244.16 43 421.22 43 4226.09 43 42
132.37 43 428.63 43 420.00 43 42
0.00 43 420.00 43 42
521.561 43 42
STD Square root of STD Confidenced f Deviation dt Error Interval
42 33.14321 6. 4 8 0 7 4 0 7 5.11410833511.5387
531.5860
No ofMean Observations
30.70 1945.51 24
76.209302 431
STD Square root of SID Confidenced f Deviation d f Error Interval
42 7.3275675 6.4807407 1.13067 73.99319263
78.4254120
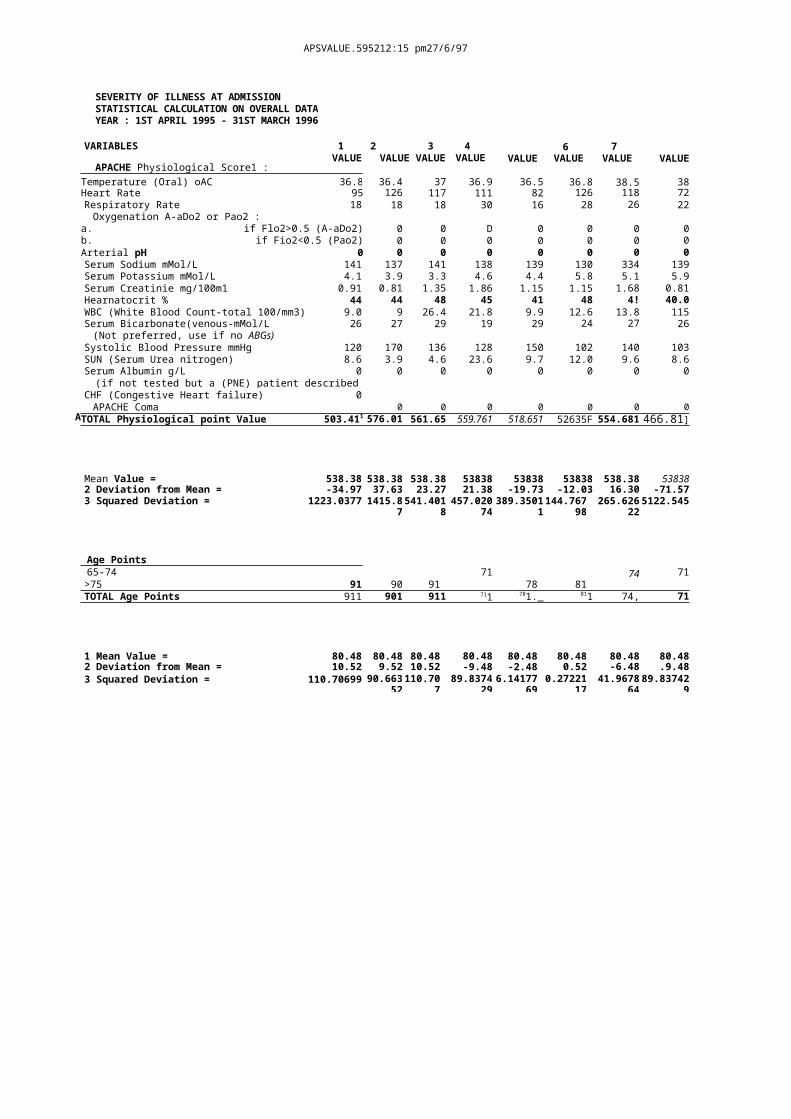
A
APSVALUE.595212:15 pm27/6/97
SEVERITY OF ILLNESS AT ADMISSIONSTATISTICAL CALCULATION ON OVERALL DATA YEAR : 1ST APRIL 1995 - 31ST MARCH 1996
VARIABLES 1VALUE
APACHE Physiological Score1 :
2 3VALUE VALUE
4 VALUE VALUE
6 VALUE
7 VALUE VALUE
Temperature (Oral) oAC 36.8 36.4 37 36.9 36.5 36.8 38.5 38Heart Rate 95 126 117 111 82 126 118 72Respiratory Rate 18 18 18 30 16 28 26 22Oxygenation A-aDo2 or Pao2 :
a. if Flo2>0.5 (A-aDo2)0
0 0 D 0 0 0 0b. if Fio2<0.5 (Pao2)
00 0 0 0 0 0 0
Arterial pH 0 0 0 0 0 0 0 0Serum Sodium mMol/L 141 137 141 138 139 130 334 139Serum Potassium mMol/L 4.1 3.9 3.3 4.6 4.4 5.8 5.1 5.9Serum Creatinie mg/100m1 0.91 0.81 1.35 1.86 1.15 1.15 1.68 0.81Hearnatocrit % 44 44 48 45 41 48 4! 40.0WBC (White Blood Count-total 100/mm3) 9.0 9 26.4 21.8 9.9 12.6 13.8 115Serum Bicarbonate(venous-mMol/L 26 27 29 19 29 24 27 26(Not preferred, use if no ABGs)
Systolic Blood Pressure mmHg 120 170 136 128 150 102 140 103SUN (Serum Urea nitrogen) 8.6 3.9 4.6 23.6 9.7 12.0 9.6 8.6Serum Albumin g/L 0(if not tested but a (PNE) patient describedas malnourished > 30)
0 0 0 0 0 0 0
CHF (Congestive Heart failure) 0APACHE Coma 0 0 0 0 0 0 0
TOTAL Physiological point Value 503.411 576.011
561.65 559.761 518.651 52635F 554.681 466.81]
Mean Value = 538.38 538.38 538.38 53838 53838 53838 538.38 538382 Deviation from Mean = -34.97 37.63 23.27 21.38 -19.73 -12.03 16.30 -71.573 Squared Deviation = 1223.0377 1415.8
7541.401
8457.020
74389.3501
1144.767
98265.626
225122.545
Age Points65-74 71 74 71>75 91 90 91 78 81TOTAL Age Points 911 901 911 711 781._ 811 74, 71
1 Mean Value = 80.48 80.48 80.48 80.48 80.48 80.48 80.48 80.482 Deviation from Mean = 10.52 9.52 10.52 -9.48 -2.48 0.52 -6.48 .9.483 Squared Deviation = 110.70699 90.663
52110.70
789.8374
296.14177
690.27221
1741.9678
6489.83742
9
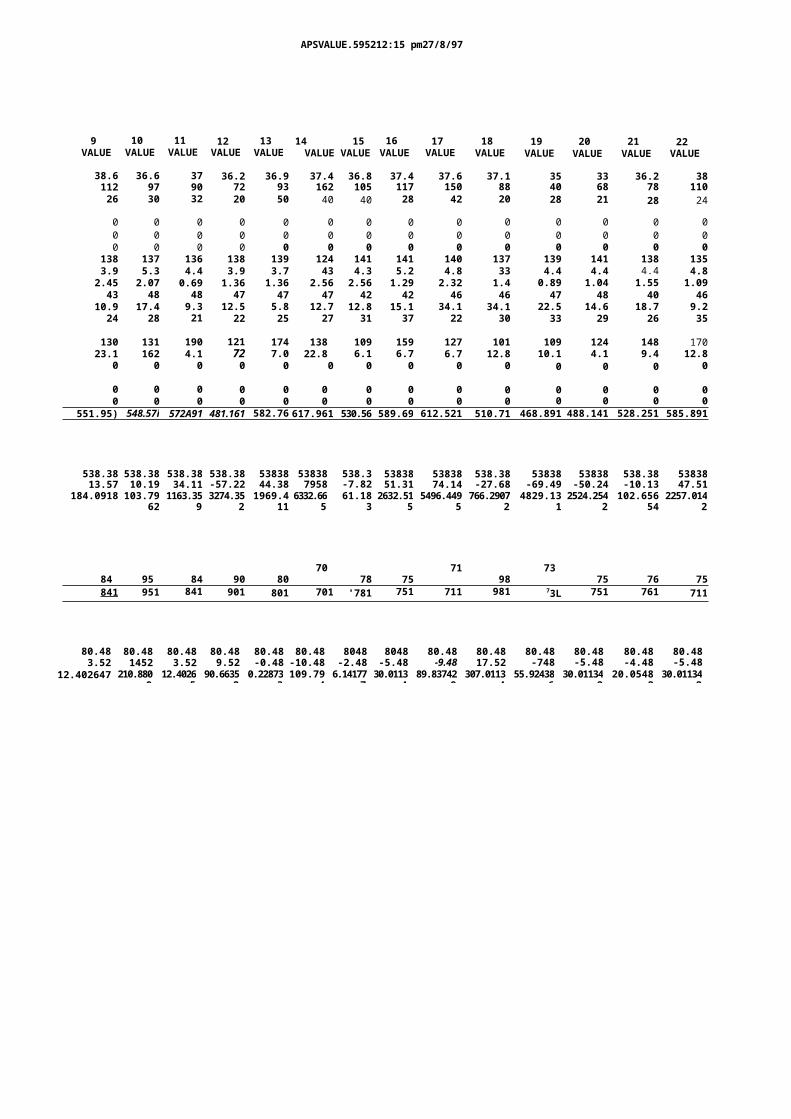
APSVALUE.595212:15 pm27/8/97
9 VALUE
10 VALUE
11 VALUE
12 VALUE
13 VALUE
14 15VALUE VALUE
16 VALUE
17 VALUE
18 VALUE
19 VALUE
20 VALUE
21 VALUE
22 VALUE
38.6 36.6 37 36.2 36.9 37.4 36.8 37.4 37.6 37.1 35 33 36.2 38112 97 90 72 93 162 105 117 150 88 40 68 78 11026 30 32 20 50 40 40 28 42 20 28 21 28 24
0 0 0 0 0 0 0 0 0 0 0 0 0 00 0 0 0 0 0 0 0 0 0 0 0 0 00 0 0 0 0 0 0 0 0 0 0 0 0 0
138 137 136 138 139 124 141 141 140 137 139 141 138 1353.9 5.3 4.4 3.9 3.7 43 4.3 5.2 4.8 33 4.4 4.4 4.4 4.82.45 2.07 0.69 1.36 1.36 2.56 2.56 1.29 2.32 1.4 0.89 1.04 1.55 1.0943 48 48 47 47 47 42 42 46 46 47 48 40 46
10.9 17.4 9.3 12.5 5.8 12.7 12.8 15.1 34.1 34.1 22.5 14.6 18.7 9.224 28 21 22 25 27 31 37 22 30 33 29 26 35
130 131 190 121 174 138 109 159 127 101 109 124 148 17023.1 162 4.1 72 7.0 22.8 6.1 6.7 6.7 12.8 10.1 4.1 9.4 12.8
0 0 0 0 0 0 0 0 0 0 0 0 0 0
0 0 0 0 0 0 0 0 0 0 0 0 0 00 0 0 0 0 0 0 0 0 0 0 0 0 0
551.95) 548.57i 572A91 481.161 582.761617.961 530.56 589.69 612.521 510.71 468.891 488.141 528.251 585.891
538.38 538.38 538.38 538.38 53838 53838 538.3 53838 53838 538.38 53838 53838 538.38 5383813.57 10.19 34.11 -57.22 44.38 7958 -7.82 51.31 74.14 -27.68 -69.49 -50.24 -10.13 47.51
184.0918 103.7962
1163.359
3274.352
1969.411
6332.665
61.1832632.51
55496.449
5766.2907
24829.13
12524.254
2102.656
542257.014
2
70 71 7384 95 84 90 80 78 75 98 75 76 75841 951 841 901 801 701 '781 751 711 981 73L 751 761 711
80.48 80.48 80.48 80.48 80.48 80.48 8048 8048 80.48 80.48 80.48 80.48 80.48 80.483.52 1452 3.52 9.52 -0.48 -10.48 -2.48 -5.48 -9.48 17.52 -748 -5.48 -4.48 -5.48
12.402647 210.8809
12.40265
90.66352
0.228733
109.794
6.141777
30.01134
89.837429
307.01134
55.924386
30.011342
20.05482
30.011342
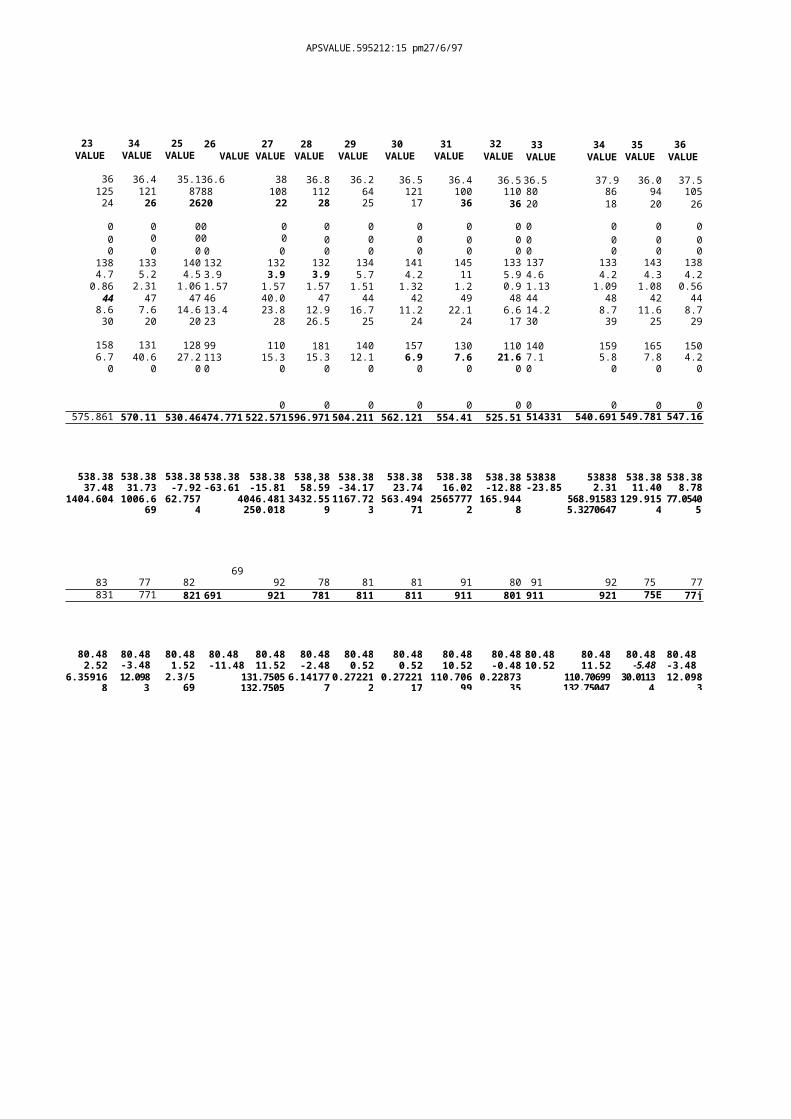
APSVALUE.595212:15 pm27/6/97
23 VALUE
34 VALUE
25 VALUE
26 27VALUE VALUE
28 VALUE
29 VALUE
30 VALUE
31 VALUE
32 VALUE
33 34VALUE VALUE
35 VALUE
36 VALUE
36 36.4 35.136.6 38 36.8 36.2 36.5 36.4 36.5 36.5 37.9 36.0 37.5125 121 8788 108 112 64 121 100 110 80 86 94 10524 26 2620 22 28 25 17 36 36 20 18 20 26
0 0 00 0 0 0 0 0 0 0 0 0 00 0 00 0 0 0 0 0 0 0 0 0 00 0 0 0 0 0 0 0 0 0 0 0 0 0
138 133 140 132 132 132 134 141 145 133 137 133 143 1384.7 5.2 4.5 3.9 3.9 3.9 5.7 4.2 11 5.9 4.6 4.2 4.3 4.20.86 2.31 1.06 1.57 1.57 1.57 1.51 1.32 1.2 0.9 1.13 1.09 1.08 0.56
44 47 47 46 40.0 47 44 42 49 48 44 48 42 448.6 7.6 14.6 13.4 23.8 12.9 16.7 11.2 22.1 6.6 14.2 8.7 11.6 8.730 20 20 23 28 26.5 25 24 24 17 30 39 25 29
158 131 128 99 110 181 140 157 130 110 140 159 165 1506.7 40.6 27.2 113 15.3 15.3 12.1 6.9 7.6 21.6 7.1 5.8 7.8 4.20 0 0 0 0 0 0 0 0 0 0 0 0 0
0 0 0 0 0 0 0 0 0 0575.861 570.11 530.46474.771 522.571596.971 504.211 562.121 554.41 525.51 514331 540.691 549.781 547.16
538.38 538.38 538.38 538.38 538.38 538,38 538.38 538.38 538.38 538.38 53838 53838 538.38 538.3837.48 31.73 -7.92 -63.61 -15.81 58.59 -34.17 23.74 16.02 -12.88 -23.85 2.31 11.40 8.78
1404.604 1006.669
62.7574
4046.481250.018
3432.5591167.72
3563.494
712565777
2165.944
8568.915835.3270647
129.915477.0540
5
6983 77 82 92 78 81 81 91 80 91 92 75 77831 771 821 691 921 781 811 811 911 801 911 921 75E 77j
80.48 80.48 80.48 80.48 80.48 80.48 80.48 80.48 80.48 80.48 80.48 80.48 80.48 80.482.52 -3.48 1.52 -11.48 11.52 -2.48 0.52 0.52 10.52 -0.48 10.52 11.52 -5.48 -3.48
6.359168
12.0983
2.3/569
131.7505132.7505
6.1417770.27221
20.27221
17110.706
990.22873
35110.70699132.75047
30.01134
12.0983
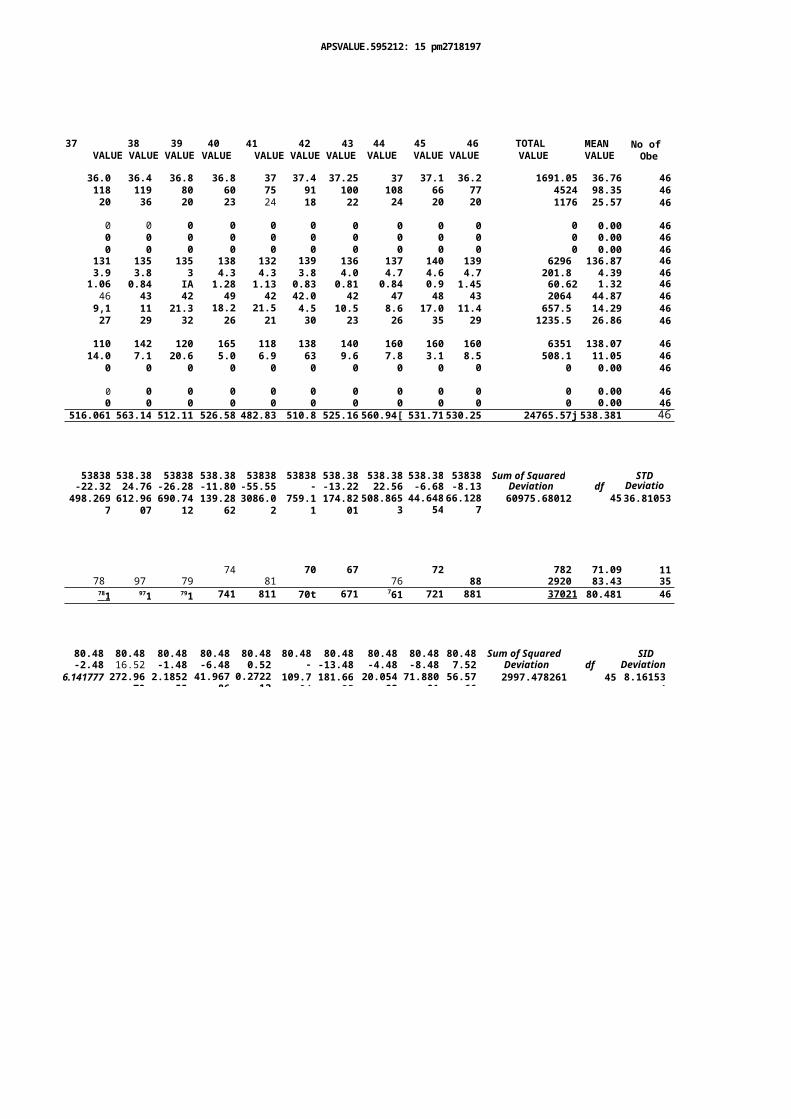
APSVALUE.595212: 15 pm2718197
37 38 39VALUE VALUE VALUE
40 VALUE
41 42 43VALUE VALUE VALUE
44 VALUE
45 46VALUE VALUE
TOTAL VALUE
MEAN VALUE
No of Obe
36.0 36.4 36.8 36.8 37 37.4 37.25 37 37.1 36.2 1691.05 36.76 46118 119 80 60 75 91 100 108 66 77 4524 98.35 4620 36 20 23 24 18 22 24 20 20 1176 25.57 46
0 0 0 0 0 0 0 0 0 0 0 0.00 460 0 0 0 0 0 0 0 0 0 0 0.00 460 0 0 0 0 0 0 0 0 0 0 0.00 46
131 135 135 138 132 139 136 137 140 139 6296 136.87 463.9 3.8 3 4.3 4.3 3.8 4.0 4.7 4.6 4.7 201.8 4.39 461.06 0.84 IA 1.28 1.13 0.83 0.81 0.84 0.9 1.45 60.62 1.32 4646 43 42 49 42 42.0 42 47 48 43 2064 44.87 469,1 11 21.3 18.2 21.5 4.5 10.5 8.6 17.0 11.4 657.5 14.29 4627 29 32 26 21 30 23 26 35 29 1235.5 26.86 46
110 142 120 165 118 138 140 160 160 160 6351 138.07 4614.0 7.1 20.6 5.0 6.9 63 9.6 7.8 3.1 8.5 508.1 11.05 46
0 0 0 0 0 0 0 0 0 0 0 0.00 46
0 0 0 0 0 0 0 0 0 0 0 0.00 460 0 0 0 0 0 0 0 0 0 0 0.00 46
516.061 563.14 512.11 526.58 482.83 510.8 525.16 560.94[ 531.71530.25 24765.57j 538.381 46
53838 538.38 53838 538.38 53838 53838 538.38 538.38 538.38 53838 Sum of Squared STD-22.32 24.76 -26.28 -11.80 -55.55 -
27.55-13.22 22.56 -6.68 -8.13 Deviation df Deviatio
n498.2697612.96
07690.74
12139.28
623086.0
2759.1
1174.82
01508.865
344.648
5466.128
760975.68012 4536.81053
74 70 67 72 782 71.09 1178 97 79 81 76 88 2920 83.43 3578 1 971 791 741 811 70t 671 761 721 881 37021 80.481 46
80.48 80.48 80.48 80.48 80.48 80.48 80.48 80.48 80.48 80.48 Sum of Squared SID-2.48 16.52 -1.48 -6.48 0.52 -
10.48-13.48 -4.48 -8.48 7.52 Deviation df Deviation
6.141777 272.9679
2.185255
41.96786
0.272212
109.794
181.6635
20.05482
71.88091
56.5766
2997.478261 45 8.161534
APSVALUE.595212:15 pm27/8/97
Square root of SWConfidence
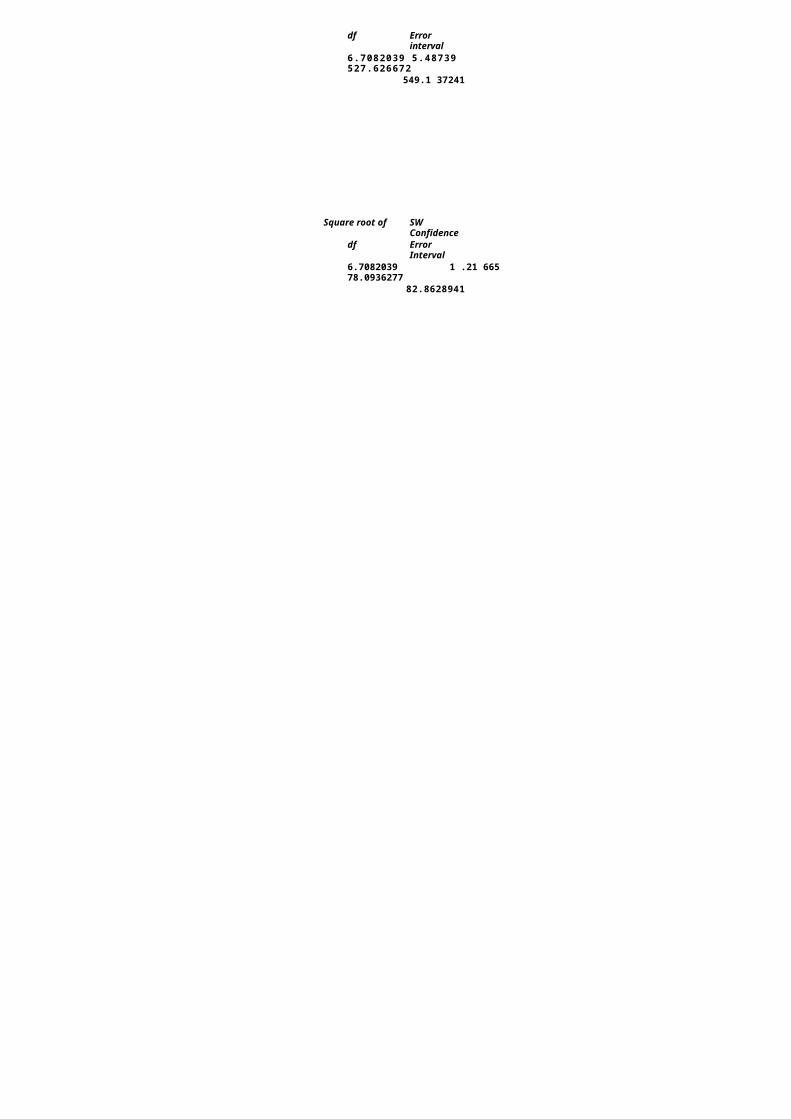
df Errorinterval
6.7082039 5.48739 527.626672
549.1 37241
Square root of SWConfidence
df ErrorInterval
6.7082039 1 .21 665 78.0936277
82.8628941
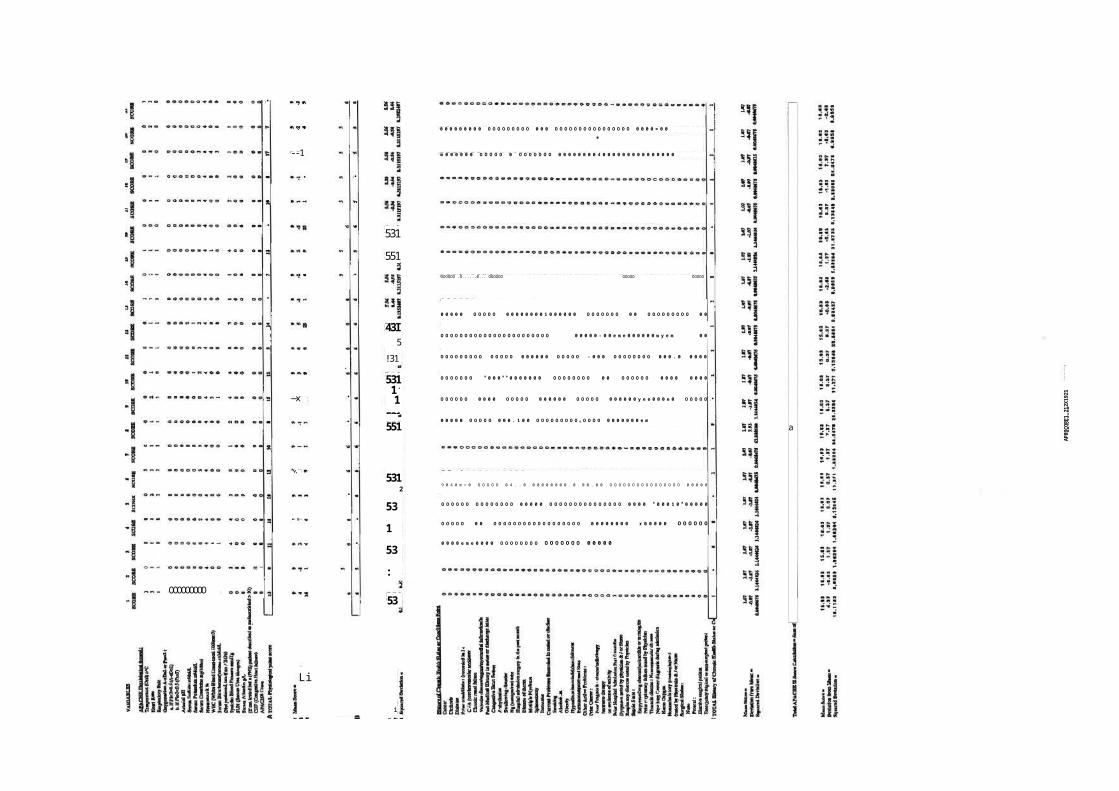
•
•
•
00
0v,
551
5312
531 53: 53
•
0 0 0 0 0 O O O O O 0 0 0 0 0 0 0 0 1 0 0 0 0 0 0 O O O O O O O 0 0 O O O O O O O O O 0 0
O O O O O O O O O O O O O O O O O O O O O O O 0 0 0 0 0 - 0 0 e m e 0 0 0 0 0 0 w y e m 0 0
O O O O O O O O O O O O O O 0 0 0 0 0 0 O O O O O - 0 0 0 O O O O O O O O 0 0 0 . 0 0 0 0 0
O O O O O O O 0 0 0 0 0 0 0 0 0 0 0 0 0 O O O O O O O O 0 0 O O O O O O 0 0 0 0 0 0 0 0
O O O O O O 0 0 0 0 O O O O O 0 0 0 0 0 0 O O O O O 0 0 0 0 0 0 y e e 0 0 0 e 0 O O O O O
0 0 0 0 0 O O O O O 0 0 0 . 1 0 0 O O O O O O O O O O O O O O 0 0 0 0 0 0 0 e m
•9 0 4 0 m = 0 O O O O O 0 4 . . 0 . 0 0 0 0 0 0 0 0 . 0 . 0 0 . 0 0 O O O O O O O O O O O O O O O O 0 0 0 0 0
O O O O O O O O O O O O O O 0 0 0 0 0 O O O O O O O O O O O O O O O 0 0 0 0 0 0 0 0 1 0 0 0 0 0 0 0
O O O O O 0 0 O O O O O O O O O O O O O O O O O O 0 0 0 0 0 0 0 0 r 0 0 0 0 0 O O O O O O
0 0 0 0 e m e 0 0 0 0 O O O O O O O O O O O O O O O 0 0 0 0 0
a
AP89CORE1.212X1921
prn27/111117
--1
•
5311.
1531
531
Li
i
0 0 0 0 0 0 0 0 0 O O O O O O O O O 0 0 0 O O O O O O O O O O O O O O O O 0 0 0 0 = 0 0
m 0 0 0 0 0 0 O O O O O 0 O O O O O O O 0 0 0 0 0 0 0 0 4 0 0 0 0 0 0 0 0 0 0 0 0 0 0 0
OOOOOO .O......0... OOOOOO OOOOO OOOOO
•
· N
—x
•
•
•
•
•
•
•
•
OOOOOOOOO
531551
43I5
!31
511 551551144 955515
11
11
· 00
0 •
•
•
•
51]
431
5 3 1
E l l
531
5 1 ]
531
5511a
5 3 ]5
511
555155155555555515512155551551555111551555
0 0 . 0 . 0 . 0 1 4 O O O O O O 0 0 0 0 0 e n e e e 0 0 0 9 0 n e l n p r . “
OOOOOOOOOOOOOO OeCeeem00. OOOOOOO Oee OOOOO OeCOO
OOOOOOOOOOO oecopoemeoecoeoee eo. OOOOOO
o.emocoaeceeeoceocce0eoc ecooa m.o.-
oacceeceoe. OOOOOO oeeecoe eeno-cocceeneooceo0e
OOOOO nee eeeeeceoem eneeoe OOOOOOOOOOOOOOO
eciao OOOOO OOOOOOOO eceeeemoo OOOOOOO co OOOOOOO
O O O O O O o O O O O O O o e o c e o f t e m e o e c e o O O O O O O O O O O O O O O O O
o c e c o O O O O O e c e c e e e e e O O O O O O O O O O O O O O O O O O O O o e c o e
4 1 0 0 . O O O O O O O O O O O O O e e 0 0 0 e e 0 0 0 0 - 0 0 0 . 0 e 0 0 e 0 • 0 0 e 0 0
m e g O e e O O O O O O o e e e e e e e m o o e c e c o m e m o c e e o l e e e o c c o e
0 0 0 e u e e e O O O O O 0 = 0 0 0 0 0 0 O O O O O O O O O O O O O O 0 O O O O O O O O
0000 OOOOOOO C OOOOOOOO OOOOOOO ...10000veeee0000=e
010pee0 OOOOOOO occeoemenceceoceece000mem000ce
oeec OOOOOOO eeeemeece OOOOOO oc-c OOOOO oemeomeo0
..............................................................-0+0 OOOOOOO eeeco
ee000000=e0 OOOOOOO 00000 OOOOOOOOOOOO 00e OOOOOO 0 OOOOOOO
00.0000000eee000 OOOOOOOOOO peee0000000 0 OOOOOO 0 OOOOOO 0000ee000000eeep
OOOOOOOOOOOOOO COed OOOOOOOO 000000 OOOOOO e OOOOOOOOOOOOOO 00000
44
•
•
•
R51
551351 RIE5551251
N51 R5I 551 551 R51 551
551551
I
I
I
I
I
I
I
I
I
I
I
I
I
I
I
I
I
I
I
APISCORE.19.;12.11
pmg7f69,
9 5
a s
Odree-10V00 0 e
e a
OOOOOOOOO ee
OOOOO .ece oe
m o o d e e r o o m o o
0 - 0 e p o o e e 0 o r . n e e c o
o p e c o m a . 0 e e e
00emeove- no
e o c e o e e e e m e e e e
e e e p e c r e e m e o c c
c o o O O O O O O m o e
o c 0 0 0 e a e o a c e o e
o e c e O O O O O v a c 0 0
O O O O O O O O O m e e m a
o c O O O O O O O n e e 0 0
O O O O O O O O O e o e
n e e
- - O O O O O O O O e
en. OOOOOO ace e
e o c e o e v o o a c e
o O O O O O a c e c e
O O O O O O O O O m e .
e m . . 0 0 . 0 0 4 . e o a c e 0
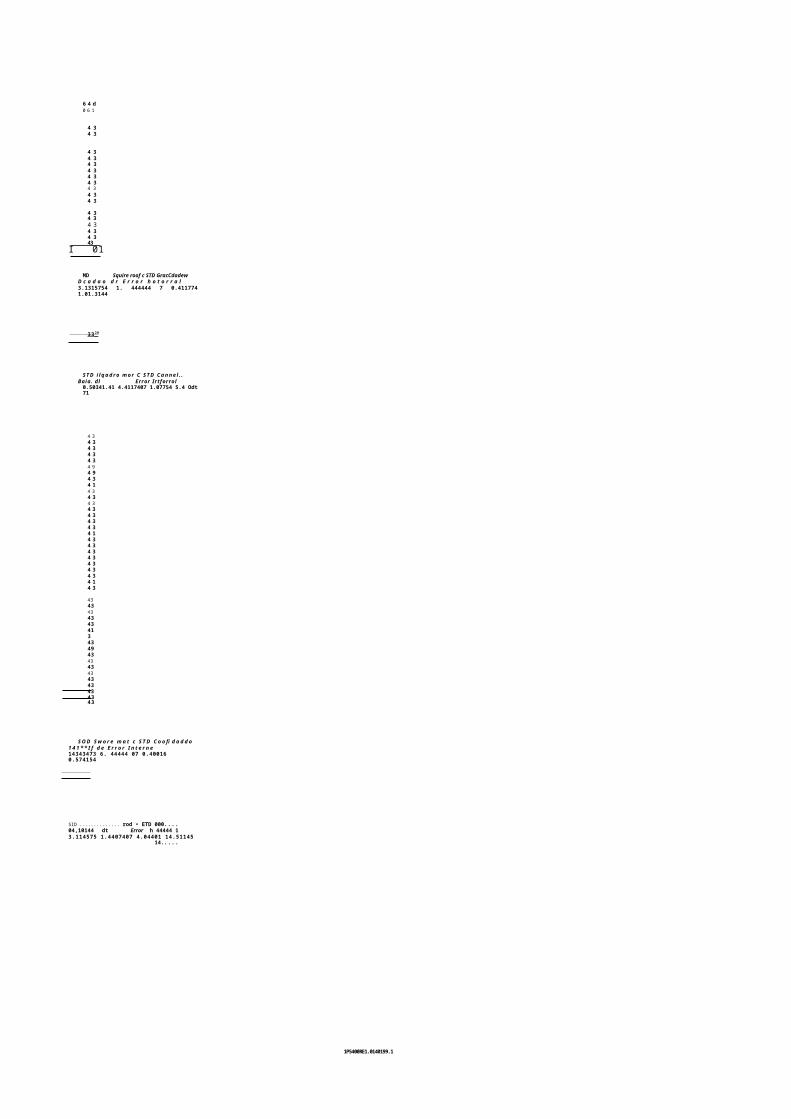
1P5400RE1.0140199.1 p4017.5547
6 4 d0 6 1
4 34 3
4 34 34 34 34 34 34 34 34 3
4 34 34 34 34 343
I 01
MD Squire roof c STD GracCdadewD c a d a o d r E r r o r h o t o r r a l3.1315754 1. 444444 7 0.4117741.01.3144
33 20
S T D i lq a d r o m o r C S T D C a n n e l . .Baia. dl Error Irtforrol0.50341.41 4.4117407 1.07754 5.4 Odt71
4 34 34 34 34 34 94 94 34 14 34 34 34 34 34 34 34 14 34 34 34 34 34 34 34 14 3
43 4343 4343413 43494343 4343 4343434343
S O D S w o r e m a t c S T D C o o fi d a d d o 1 4 1 * * I f d e E r r o r I n t e r n e14343473 6. 44444 07 0.40016 0.574154
SID .............. rod • ETD 000....04,10144 dt Error h 44444 13.114575 1.4407407 4.04401 14.51145
14.....
f d
'48
O
4
f E am$
0 0 0 0 0 0 0 0 0 0 0 0 0 0 0 0 0 0 0 0 0 0 0 0 0 0 0 0 0 0 0 0 0 0 0 0 0 0 0 0 0 0 0 0 0 3 1 1 0 0 0 0 0 0 0 0 0 0 0 0 0 0 0 0 0 0 0 0 0 0 0 0 0 0 0 0 - . 0 0 0 0 0 0 0 0 0 0 0 0 0 0 0 1 3 1
6 0 0 0 0 0 0 0 0 0 0 0 0 0 0 0 0 0 0 0 0 0 0 0 0 0 0 0 0 0 0 0 0 0 0 0 0 0 0 0 0 0 0
0 0 0 0 0 0 0 0 0 0 0 0 0 0 0 0 0 0 0 0 0 0 0 0 0 0 0 0 0 0 0 0 0 0 0 0 0 0 0 0 0 0
000000,40000000000000N0000000000000000000000 311
000.0000m0001.000000000000000-.00000000000000 Al0000000000000000000000000000000000000000000 1110 0 0 0 0 0 0 0 0 0 0 0 0 0 0 0 0 0 0 0 0 0 0 0 0 0 0 0 0 0 0 0 , . 0 0 0 0 0 0 0 0 0 0 0 . 4
0 0 0 0 0 0 0 0 0 0 0 0 0 0 0 0 0 0 0 0 0 0 0 0 0 0 0 0 0 0 0 0 0 0 0 0 0 0 0 0 0 0 0 0
0 0 0 0 0 0 0 0 0 0 0 0 0 0 0 0 0 0 0 0 0 0 0 0 0 0 0 0 0 0 0 0 0 0 0 0 0 0 0 0 0 0 0
0 0 0 0 0 0 0 0 0 0 0 0 0 0 0 0 0 0 0 0 0 0 0 0 0 0 0 0 0 0 0 0 0 0 0 0 0 0 0 0 0 0 0 0 11 10 0 0 0 0 0 0 0 0 0 0 0 0 0 0 0 0 0 0 0 0 0 0 0 0 0 0 0 0 0 0 0 0 0 0 0 0 0 0 0 0 0 0 0
0 0 0 = 0 0 0 0 0 0 . 0 0 0 0 0 0 0 0 0 0 1 0 0 0 0 0 0 0 0 . . 0 0 0 0 0 0 4 0 0 0 0 0 0 0 0
ti
ti
E.,
In
titi
A
Oor,
0..0
0.0
0-o
0 . - , 0
0 N -
O N O
O N 0
0 - . 0
0 0 0 N o m . 0 0
0 0 0 0 0 0 . 0 0
0 0 0 0 0 0 . 0 0
0 0 0 0 0 0 . 0 0
0 0 0 0 0 M . + =
0 0 0 0 0 m . 0 0
0 0 1 0 0 0 0 . 0 0
0 0 0 0 0 N N . 0
o 0 0 0 0 0 0 . 0 0
0 0 0 0 0 0 . 0 0
0 0 0 0 0 N . N N
0 0 0 0 0 0 0 1 0
0 0 0 0 0 0 . 0 0
0 0 0 0 0 0 0 0 0
N 0 0
0 0 0
0 0 0
0 0 0
N o 0
N O 0
0 0 0
- 0 0
M 0 0
- . 0 0
0 0 0
N O o
0 0 0
N o o
0 0
0 0
0 0
0 0
0 0
0 0
0 0
0 0
0 0
O p
0 0
0 0
0 0 0
O m F
•
,7453,1
2V4i
331
ani
331
31113.0.1
55g9
55!;L9.
141
515i
35135g
511 !II131
3115
35115
1515
o 0 0 0 0 0 . 4 0 0 - , 0 0 0 0 0
0 0 4 0 0 0 0 . 0 - . 0 . 0 0 0 0 0 0 0 0
0 - 0 0 . 0 0 0 - - r c i o N C . = 0 0 M
0 o 0 0 0 0 0 0. 0 0 00.
, - . 0 0 0 0 M
0 0 0 0 0 0 4 0 0 0 0 0 0 0 0 a
0 . . 9 0 0 0 o 0 N . N o 4 . 1 0 0 0 0 =
0 0 0 0 0 4 4 . 0 0 a O 0 0 o z
0 0 0 0 0 0 . 0 0 0 4 0 0 0 0 5 .
0 0 . . 0 0 0 0 0 , 1 0 O N . . . C I O 0 0 7 .
oh.. 000000.00 00
00 0 000 000.0 000 00 h
0000o n. r o 000
. . h 1 0 0 9 0 0 0 0 . 0 0 0 0 0 0 0 0
0 0 0 0 0 1 0 . 0 4 • - • m o C 0 0
0 • - . 0 0 0 0 0 - . 0 0 N O m o o 0 0
o m m 0 0 0 0 0 M . N 0 c i 0 - 0 C .
0 RI 000 0 0 0
0 0 0 0 o n - . . 0 0 m 0 0 0 0
0 0 0 0 0 0 0 0 0 0 0 0 0 0 0 0 0 0 0 0 e 4 0 0 0 0 0 0 0 0 0 0 0 0 0 0 0 0 0 0 0 0 0 0 0
0 0 0 0 0 0 0 0 0 0 0 0 0 0 0 0 0 0 0 1 0 0 0 0 0 0 0 0 0 - . 0 0 0 0 0 0 0 0 0 0 0 0 0 0 0
0 0 0 0 0 0 0 e 0 0 0 0 0 0 0 0 0 0 0 0 0 0 0 0 0 0 0 0 0 0 0 0 0 0 0 0 0 0 0 0 0 0 9 0
. 0 0 9 0 0 0 0 0 o 0 0 0 0 0 0 0 0 0 0 0 0 0 0 0 0 0 0 0 0 0 0 o 0 0 0 0 0 0 0 0 0 0 0
c o o 0 0 0 0 0 0 0 0 0 c o o 0 0 0 0 0 0 0 0 0 0 0 0 0 0 0 0 0 o c z 0 0 0 0 0 0 0 0 0
m o o 0 0 0 0 0 0 e 0 0 0 0 0 0 0 0 0 0 0 0 0 0 0 0 0 0 0 0 0 0 0 0 0 0 0 0 0 0 0 0 0 0 0 0 0
o n 0 0 0 0 0 0 0 0 0 0 0 0 0 0 0 0 0 0 0 0 0 0 0 0 0 0 0 0 0 0 0 0 0 0 0 0 0 0 0 0 o o e
o o n 0 0 0 0 0 . . 9 0 0 0 0 0 0 0 0 0 0 0 0 0 0 . 0 0 0 o 0 0 0 0 0 0 0 0 0 0 a 0 0 0 0 0 0
0 0 O . c 0 0 - . 0 0 . 0 C 0 0 0 0 0 0 , 4 0 0 0 . 0 0 0 a 0 0 0 0 c . 0 0 0 0 0 0 0 0 0 9 0
0 0 0 0 0 0 0 0 0 0 0 0 0 0 0 0 0 0 0 0 9 m 0 0 0 0 0 . - . 0 0 - . 0 0 0 0 0 0 0 0 0 0 0 0 0 c s
0 0 0 0 0 0 0 0 0 0 0 0 0 0 0 0 9 0 0 0 0 0 0 0 0 0 0 0 0 0 0 0 0 0 0 0 0 0 0 0 0 0 0
0 0 0 0 0 0 0 0 0 0 0 0 0 0 0 0 0 0 0 0 0 0 0 0 0 0 0 0 0 0 0 0 0 0 0 0 0 0 0 0 0 0 0 0
0 0 0 0 o 0 0 0 0 0 0 9 0 0 0 0 0 0 0 0 0 0 . 0 0 0 0 0 0 0 0 o o o 0 0 0 0 0 9 0 0
0 0 0 0 0 0 0 0 0 0 9 0 0 0 0 0 0 0 0 0 0 0 0 0 0 0 0 0 - . 0 9 0 0 0 0 0 0 0 0 0 0 0 0 0
0 0 9 0 0 0 0 0 0 0 0 0 0 . 0 0 0 0 0 0 0 0 0 0 9 0 0 0 0 0 0 0 0 0 0 0 p a 0 4 , 0
0 0 0 0 0 0 0 0 0 0 0 0 0 0 0 0 0 0 0 0 0 0 0 0 0 0 0 0 0 0 0 0 - . - 0 0 0 0 0 0 0 0 0 0 0 O o
0 0 0 0 0 0 0 0 0 0 0 0 0 0 0 0 9 0 0 0 0 0 0 0 0 0 0 0 0 0 0 0 0 0 0 0 0 0 0 0 0 0 0 0
0 0 0 0 0 0 0 0 0 0 0 0 0 0 0 0 0 0 0 0 0 0 0 0 0 0 0 0 0 0 0 0 0 0 0 0 0 0 0 0 0 0 0 0
0 0 0 0 0 0 0 0 0 0 4 0 0 0 0 0 . 0 . 0 0 0 . 0 0 0 0 0 0 0 0 0 0 0 0 0 0 0 0 0 0 0 0 0 0 0 0
as
is
rt
331
O
O
0.000.000.070.000.03
ROI0.130.000.02.3.00
0.040.000.00
MOO0.000.00
0000.000.040.000.130.070.00
COO000
0.000.01)0.020.260.070.070.000.020.020.000.000.000.400.000.000.030.000.000.00
441 1961
0-96 OM 0.06 936 0.96 0.93 8.06 6.9 0.96 236 MX 0.96 2.96 Soo of4196 456 1.04 .6.96 0.04 336 336 4.96 0.04 .0.96 0.04 0.04 4.96 Dertatiow eCir
33149338 03149333 1.038E1469 0.9149335 0.0018904 0.9149335 0.91493380.9149338 0.0018904 0.9149338 0.0616904 0.0018904 0.9149336 115.9130435 46
13I 11I 17 I Is I 171 181 121 I61 171 I 11I bs 751 I 16.331
16.33 1633 16.33 1633 16.33 1633 1633 16.33 14.33 16.33 16.33 1633 1633 Saw afipared3.33 -5.33 047 -133 0.67 0.67 4.33 ..ass -333 -533 -4.33 -233 .333 0434.4loo df
11362354 38367203 06041508 1.7585366 04541538 0.4541681 13.7151121 0.1063327 11.062854 26361233 111.7151/28 6.410660511.061854 593.1081857 45
I
STD Swarm root Of STDDoriodox 01 Env1.634064 8.7882089 0.230151
4 6 1
STD Swam root of STDDedraiou. c0 Error341E17241 8.7012021 4.1143472
gig&WW&&trngt&t&M&&&S
-t&I'&&&&
-MtZMMg
APSS000E.39621132 9o27/13107
34 35 36SCORE SCORE SCORE 37 soSCORE SCORE
39 SCORE
40 SCORE
41 43 43SCORE SCORE SCORE
44 4S 46 TOTALSCORE SCORE SCORE X
MEAN VALUE
No of Oho (N)
0 0 0 0 0 0 0.35 461 1 1 1 1 (1, 771 1.54 46
0 0 0 36 0.78 460 0 a 0 0 0.00 460 0 0 0 0.00 460 o o 0 11') WO 460 0 0 0 2 0.04 44
1 0 0 6 0.13 462 0 0 0 36 0.78 464 4 4 4 184 4.00 460 3 1 2 0 24 052 460 1 0 0 0 12 0.26 46
461 1 1 2 0 3 1 SI 1.54 46o 0 0 0 0 S 0 0 0 0.00 46o o o 0 0 0 0 0 0 000 460 00 0 0 0 0 a 0.00 46a a 0 0 o a 0 a 0.00 467 9 10 1I 7 10 6 01 7 I 4421 9.611 461
9.65 9.6 9.61 94 9.61 9.61 941 9.61 9.6 941 9.61 9.61 9.61 Sum elSoapered 377) Square root STD4.61 -4.6 461.0.61 0.39 139 -2.61 0.39 -2.61 -la -4.61 4.61 4.61 Doviodoo If Daiwa:a, d1 Error
6305293 21.2400750.3705104
0.37051040.1531191
19357278 4.10052113 0.1511191 6.805293
13.022694
21.240076 351179017 6.805293438.9565217
45 3.0874532
6.7082028 0.48036
5 5 5 5 ss soo I6 6 6 6 6 210 coo 356 6 6 .6 5 5 5 5 2661 0.761 461
376 5.76 5.766.76 5.76 5.76 5.76 5.76 5.76 5.76 5.74 5.76 5.76383 6713 Squeal ran ol STD614 0.24 0.240.24 0.24 0.24 4.76 024 4.76 -0.76 034 .0.76 0.24 &Morton Derkara
0,8972914 01671E40.8571134 aornou
085711E40.014713
340.378522
5 ammo WNW 0.67193, 36571114 8.5739225 8.00711346360565117
45 11421264 0.7009031 8.014251
Caraway. Interval
0.7088049610.6107883
C o n d o n e . I n f e r r e
5. 63 48 32 46 3 .8 88 87 88 7
C a r d e n a s l i t e r a l0,4.73.9921.42545358
C a r d o n a . i n t o w a l
1 5 . 2 5 0 8 5 0 9 1 7 . 3 9 1 2 8 3
AP67C0,91.393212132 pm2718197
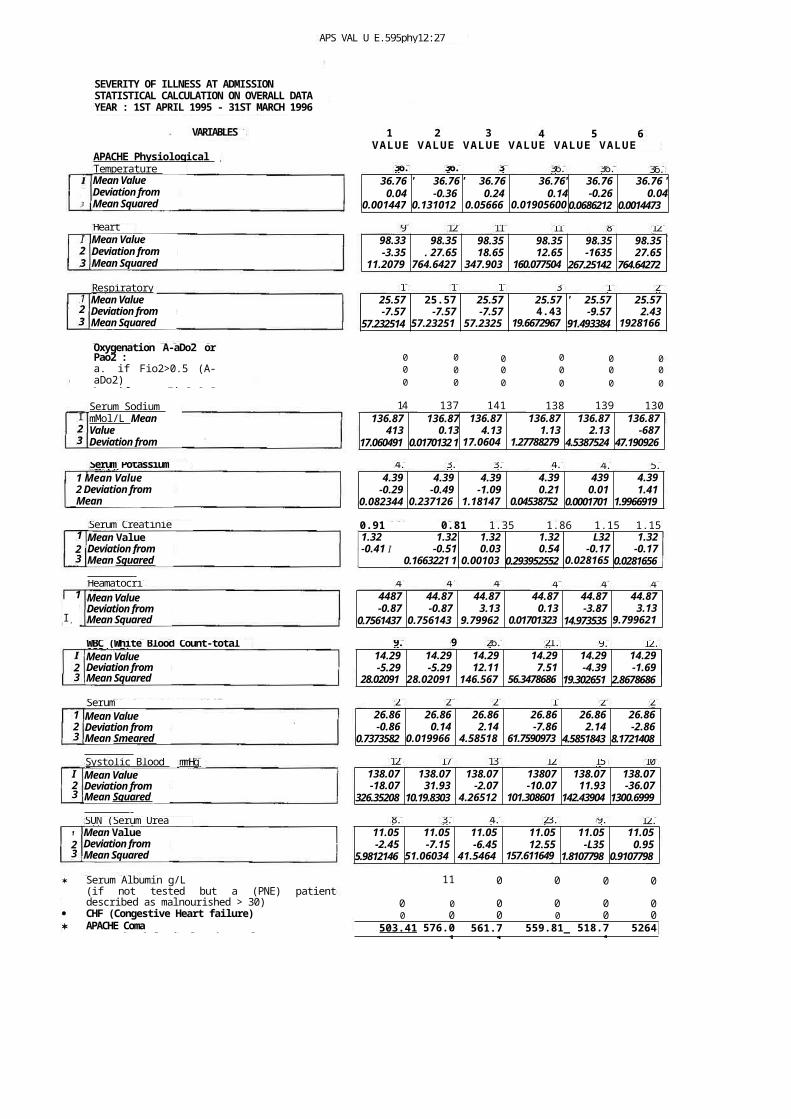
126Heart Rate 9 12 11 111 82
18 18 18 30 16 28
4.1 5.83.9 3.3 4.44.6Serum Potassium mMol/L
1
I,
32
44 44 48 45 41 48
26 292 19 2429
8.6 3.9 4.6 23.6 9.7 12.0
APS VAL U E.595phy12:27 pm27/8/97
SEVERITY OF ILLNESS AT ADMISSION STATISTICAL CALCULATION ON OVERALL DATA YEAR : 1ST APRIL 1995 - 31ST MARCH 1996
Mean Value Deviation from Mean Squared DeviationRespiratoryRate Mean Value Deviation from Mean Squared DeviationOxygenation A-aDo2 orPao2 :a. if Fio2>0.5 (A-aDo2)b. if Fio2<0.5Serum Sodium mMol/L Mean ValueDeviation from
98.33 98.35 98.35 98.35 98.35 98.35-3.35 . 27.65 18.65 12.65 -1635 27.65
11.20794
764.64272
347.9036
160.0775047
267.25142 764.64272
25.57 25.57 25.57 25.57 ' 25.57 25.57-7.57 -7.57 -7.57 4.43 -9.57 2.43
57.232514 57.232514
57.23251
19.66729679
91.493384 19281664
0 0 0 0 0 00 0 0 0 0 00 0 0 0 0 0
141
137 141 138 139 130136.87 136.87 136.87 136.87 136.87 136.87
413 0.13 4.13 1.13 2.13 -68717.060491 0.0170132 1 17.0604
91.27788279
84.5387524 47.190926
4487 44.87 44.87 44.87 44.87 44.87-0.87 -0.87 3.13 0.13 -3.87 3.13
0.7561437 0.7561437
9.799622
0.017013233
14.973535 9.7996219
Serum Bicarbonate(venous-
SUN (Serum Urea nitrogen)Mean Value Deviation from Mean Squared Deviation
* Serum Albumin g/L(if not tested but a (PNE) patientdescribed as malnourished > 30)
· CHF (Congestive Heart failure)* APACHE ComaA TOTAL Physiological point Value
1
23
1 2 3 4 5 6
36.8 36.4 37 36.9 36.5 36.8
VARIABLES
APACHE Physiological Score : Temperature Mean Value Deviation from Mean Squared Deviation
3
VALUE VALUE VALUE VALUE VALUE VALUE
36.76 ' 36.76 ' 36.76 36.76' 36.76 36.76 '0.04 -0.36 0.24 0.14 -0.26 0.04
0.0014473
0.1310125
0.056665
0.019056002
0.0686212 0.0014473
23
Mean Value Deviation from Mean Squared Deviation
9.0 9 26.4 21.8 9.9 12.6WBC (White Blood Count-total 100/mm3) 14.29 14.29 14.29 14.29 14.29 14.29-5.29 -5.29 12.11 7.51 -4.39 -1.69
28.020912
28.020912
146.5679
56.34786862
19.302651 2.8678686
120 170 136 128 150 102
123
Mean Value Deviation from Mean Smeared Deviation
mmHg Systolic Blood Pressure I
23
Mean Value Deviation from Mean Squared Deviation
26.86 26.86 26.86 26.86 26.86 26.86-0.86 0.14 2.14 -7.86 2.14 -2.86
0.7373582 0.0199669
4.585184
61.75909735
4.5851843 8.1721408
138.07 138.07 138.07 13807 138.07 138.07-18.07 31.93 -2.07 -10.07 11.93 -36.07
326.35208 10.19.8303 4.265123
101.3086011
142.43904 1300.6999
11.05 11.05 11.05 11.05 11.05 11.05-2.45 -7.15 -6.45 12.55 -L35 0.95
5.9812146 51.060345
41.54643
157.6116493
1.8107798 0.9107798
11 0 0 0 0
0 0 0 0 0 00 0 0 0 0 0
503.41 576.01
561.71
559.81_ 518.71
5264
I23
I23
123
1 Mean Value2 Deviation from Mean
Serum Creatinie mg/100m1Mean Value Deviation from Mean Squared Deviation Heamatocrit %
4.39 4.39 4.39 4.39 439 4.39-0.29 -0.49 -1.09 0.21 0.01 1.41
0.082344 0.2371267
1.181474
0.045387524
0.0001701 1.9966919
0.91 0.81 1.35 1.86 1.15 1.151.32 1.32 1.32 1.32 L32 1.32-0.41 I -0.51 0.03 0.54 -0.17 -0.17
0.1663221 10.2578873
0.001035
0.293952552 0.0281656
0.0281656
123
Mean Value Deviation from Mean Squared Deviation
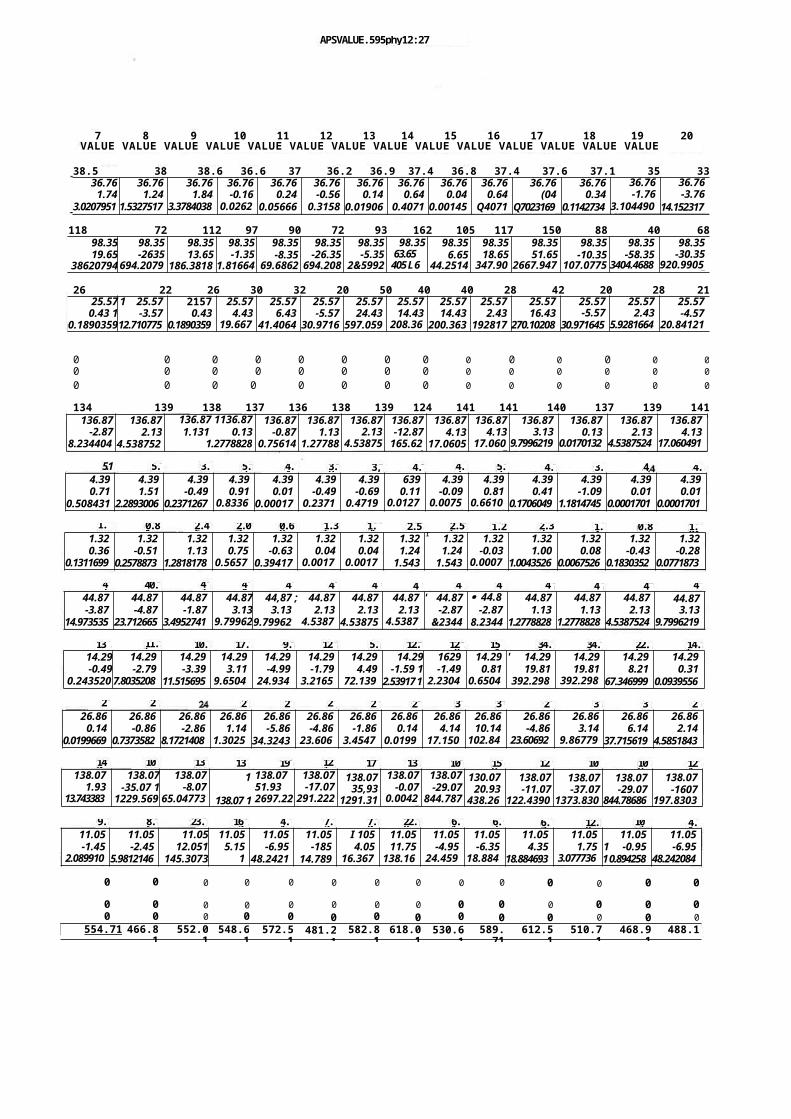
9. 23.8.6 16.2 7.24.1 7.0 22.8 6.1 6.7 6.7 12.8 10.1 4.1
140 103 130 131 190 121 174 138 109 159 127 101 109 124
13 11.5 10. 17.4 9.3 12.5 5.8 12.7 12.8 15.1 34.1 34.1 22.5 14.6
27 26 2822 2521 31 3727 3322 30 29
1.68 2.450.81 2.07 1.360.69 1.36 2.562.56 1.29 2.32 1.4 0.89 1.04
41 40.0 43 48 48 47 47 4742 42 46 46 47 48
5.1 5.9 3.9 5.3 4.4 3.9 3, 4. 4.3 5.2 4.8 3.3 4 4.4
APSVALUE.595phy12:27 pm27/8197
7 8 9 10 11 12 13 14 15 16 17 18 19 20VALUE VALUE VALUE VALUE VALUE VALUE VALUE VALUE VALUE VALUE VALUE VALUE VALUE VALUE
38.5 38 38.6 36.6 37 36.2 36.9 37.4 36.8 37.4 37.6 37.1 35 3336.76 36.76 36.76 36.76 36.76 36.76 36.76 36.76 36.76 36.76 36.76 36.76 36.76 36.76
1.74 1.24 1.84 -0.16 0.24 -0.56 0.14 0.64 0.04 0.64 (04 0.34 -1.76 -3.763.0207951 1.5327517 3.3784038 0.0262
30.05666 0.3158 0.01906 0.4071 0.00145 Q4071 Q7023169 0.1142734 3.104490
814.152317
118 72 112 97 90 72 93 162 105 117 150 88 40 6898.3519.65
38620794
98.35-2635
694.20794
98.3513.65
186.38185
98.35-1.35
1.81664
98.35-8.35
69.6862
98.35-26.35
694.208
98.35-5.35
2&5992
98.3563.65 405 L 6
98.356.65
44.2514
98.3518.65
347.904
98.3551.65
2667.9471
98.35-10.35
107.0775
98.35-58.35
3404.4688
98.35-30.35
920.99055
26 22 26 30 32 20 50 40 40 28 42 20 28 2125.57 1 25.57 2157 25.57 25.57 25.57 25.57 25.57 25.57 25.57 25.57 25.57 25.57 25.57
0.43 1 -3.57 0.43 4.43 6.43 -5.57 24.43 14.43 14.43 2.43 16.43 -5.57 2.43 -4.570.189035912.710775 0.1890359 19.667
341.4064 30.9716 597.059 208.36
3200.363 192817 270.10208 30.971645 5.9281664 20.84121
0 0 0 0 0 0 0 0 0 0 0 0 0 00 0 0 0 0 0 0 0 0 0 0 0 0 00 0 0 0 0 0 0 0 0 0 0 0 0 0
134 139 138 137 136 138 139 124 141 141 140 137 139 141136.87
-2.878.234404
5
136.872.13
4.5387524
136.87 1136.871.131 0.13
1.277882810.01701
136.87-0.87
0.75614
136.871.13
1.27788
136.872.13
4.53875
136.87-12.87
165.626
136.874.13
17.0605
136.874.13
17.0605
136.873.13
9.7996219
136.870.13
0.0170132
136.872.13
4.5387524
136.874.13
17.060491
4.39 4.39 4.39 4.39 4.39 4.39 4.39 639 4.39 4.39 4.39 4.39 4.39 4.390.71 1.51 -0.49 0.91 0.01 -0.49 -0.69 0.11 -0.09 0.81 0.41 -1.09 0.01 0.01
0.508431 2.2893006 0.2371267 0.83365
0.00017 0.23713
0.47191
0.01278
0.00756
0.66104
0.1706049 1.1814745 0.0001701 0.0001701
1.32 1.32 1.32 1.32 1.32 1.32 1.32 1.32 r 1.32 1.32 1.32 1.32 1.32 1.320.36 -0.51 1.13 0.75 -0.63 0.04 0.04 1.24 1.24 -0.03 1.00 0.08 -0.43 -0.28
0.1311699 0.2578873 1.2818178 0.56577
0.39417 0.00178
0.00178
1.543 1.543 0.00077
1.0043526 0.0067526 0.1830352 0.0771873
44.87 44.87 44.87 44.87 44,87 ; 44.87 44.87 44.87 ' 44.87 · 44.87
44.87 44.87 44.87 44.87-3.87 -4.87 -1.87 3.13 3.13 2.13 2.13 2.13 -2.87 -2.87 1.13 1.13 2.13 3.13
14.973535 23.712665 3.4952741 9.79962,9.79962 4.5387
54.53875 4.5387
5&2344 8.2344 1.2778828 1.2778828 4.5387524 9.7996219
14.29 14.29 14.29 14.29 14.29 14.29 14.29 14.29 1629 14.29 ' 14.29 14.29 14.29 14.29-0.49 -2.79 -3.39 3.11 -4.99 -1.79 4.49 -1.59 1 -1.49 0.81 19.81 19.81 8.21 0.31
0.2435208
7.8035208 11.515695 9.65048
24.9348
3.21656
72.1392
2.53917 1 2.23048
0.65048
392.2983
392.2983
67.346999 0.0939556
26.86 26.86 26.86 26.86 26.86 26.86 26.86 26.86 26.86 26.86 26.86 26.86 26.86 26.860.14 -0.86 -2.86 1.14 -5.86 -4.86 -1.86 0.14 4.14 10.14 -4.86 3.14 6.14 2.14
0.0199669 0.7373582 8.1721408 1.30258
34.3243 23.6069
3.45475
0.01997
17.1504
102.846
23.606923
9.867793
37.715619 4.5851843
138.071.93
13.7433837
138.07-35.07 1
1229.5695
138.07-8.07
65.047732
1
138.07 1
138.0751.932697.22
138.07-17.07
291.222
138.0735,93
1291.31
138.07-0.07
0.00425
138.07-29.07
844.787
130.0720.93
438.26
138.07-11.07
122.4390
138.07-37.07
1373.830
138.07-29.07
844.78686
138.07-1607
197.8303
11.05 11.05 11.05 11.05 11.05 11.05 I 105 11.05 11.05 11.05 11.05 11.05 11.05 11.05-1.45 -2.45 12.051 5.15 -6.95 -185 4.05 11.75 -4.95 -6.35 4.35 1.75 1 -0.95 -6.95
2.0899102
5.9812146 145.3073 126.5673
48.2421 14.789 16.3673
138.165
24.4595
18.8847
18.884693 3.0777363
1 0.894258 48.242084
0 0 0 0 0 0 0 0 0 0 0 0 0 0
0 0 0 0 0 0 0 0 0 0 0 0 0 00 0 0 0 0 0 0 0 0 0 0 0 0 0
554.71 466.81
552.01
548.61
572.51
481.21
582.81
618.01
530.61
589.71
612.51
510.71
468.91
488.1
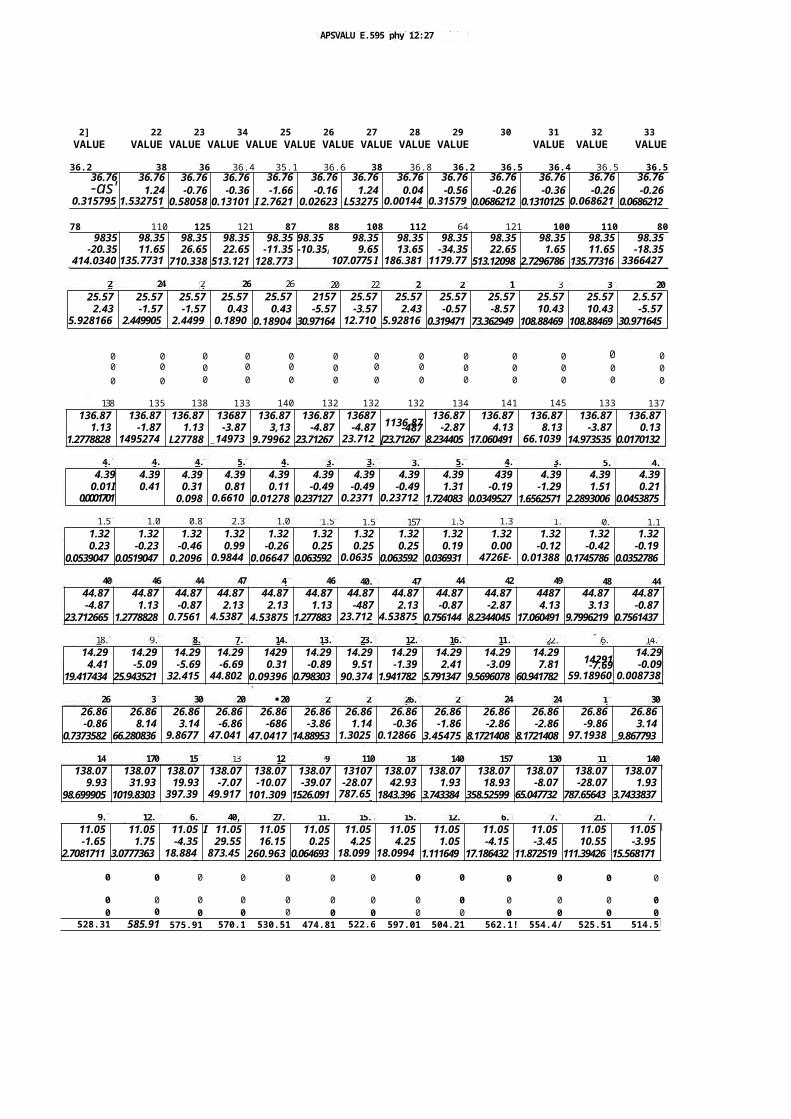
148
170 158
131 128
99 110 181 140 157 130 110 140
12. 6.9.4 40,6 27.2 11.3 15.3 15.3 12.1 6.9 7.6 21.6 7.1
26 35
30 20 ·20 23 28 26.5 25 24 24 17 30
40 46 44 47 47 46 40.0
47 44 42 49 48 44
9.18.7 8.6 14.6 11.27.6 13.4 23.8 12.9 16.7 6.622.1 14.2
4.8
4.4 4.7 4.5 4.25.2 3.9 5.73.9 3. 3.1 5. 4.
1.55 1.09
0.86 2.31 1.06 1.57 1.57
157 1.51 1.32 1.2 0.9
1.13
28 24 24 26 26 20 22 28
25 17
36 36 20
APSVALU E.595 phy 12:27 pm27/8/97
2] 22 23 34 25 26 27 28 29 30 31 32 33VALUE VALUE VALUE VALUE VALUE VALUE VALUE VALUE VALUE VALUE VALUE VALUE VALUE
36.2 38 36 36.4 35.1 36.6 38 36.8 36.2 36.5 36.4 36.5 36.536.76 36.76 36.76 36.76 36.76 36.76 36.76 36.76 36.76 36.76 36.76 36.76 36.76-as' 1.24 -0.76 -0.36 -1.66 -0.16 1.24 0.04 -0.56 -0.26 -0.36 -0.26 -0.26
0.3157951
1.5327517
0.58058 0.13101 I 2.7621 0.02623 L53275 0.001447
0.315795
0.0686212 0.1310125 0.0686212
0.0686212
78 110 125 121 87 88 108 112 64 121 100 110 809835 98.35 98.35 98.35 98.35 98.35 98.35 98.35 98.35 98.35 98.35 98.35 98.35
-20.35 11.65 26.65 22.65 -11.35 -10.35i 9.65 13.65 -34.35 22.65 1.65 11.65 -18.35414.0340
3135.7731
6710.338 513.121 128.773 107.0775 I
911645186.381
91179.77
3513.12098 2.7296786 135.77316 3366427
2
25.57 25.57 25.57 25.57 25.57 2157 25.57 25.57 25.57 25.57 25.57 25.57 2.5.572.43 -1.57 -1.57 0.43 0.43 -5.57 -3.57 2.43 -0.57 -8.57 10.43 10.43 -5.57
5.9281664
2.4499055
2.44991
0.18904
0.18904 30.97164 12.7108
5.928166
0.319471 73.362949 108.88469 108.88469 30.971645
0 0 0 0 0 0 0 0 0 0 0 0 00 0 0 0 0 0 0 0 0 0 0 0 00 0 0 0 0 0 0 0 0 0 0 0 0
138 135 138 133 140 132 132 132 134 141 145 133 137136.87 136.87 136.87 13687 136.87 136.87 13687 136.87 136.87 136.87 136.87 136.87
1.13 -1.87 1.13 -3.87 3,13 -4.87 -4.87 1136.87-487 -2.87 4.13 8.13 -3.87 0.131.2778828 1495274
1L27788 _14973
59.79962 23.71267 23.712
7[23.71267 8.234405 17.060491 66.1039
714.973535 0.0170132
4.39 4.39 4.39 4.39 4.39 4.39 4.39 4.39 4.39 439 4.39 4.39 4.390.01I 0.41 0.31 0.81 0.11 -0.49 -0.49 -0.49 1.31 -0.19 -1.29 1.51 0.21
0.0001701(0.1706049
0.098 0.66104
0.01278 0.237127 0.23713
0.237127
1.724083 0.0349527 1.6562571 2.2893006 0.0453875
1.32 1.32 1.32 1.32 1.32 1.32 1.32 1.32 1.32 1.32 1.32 1.32 1.320.23 -0.23 -0.46 0.99 -0.26 0.25 0.25 0.25 0.19 0.00 -0.12 -0.42 -0.19
0.0539047 0.0519047 0.2096 0.98441
0.06647 0.063592 0.06359
0.063592 0.036931 4726E-06
0.013883
0.1745786 0.0352786
44.87 44.87 44.87 44.87 44.87 44.87 44.87 44.87 44.87 44.87 4487 44.87 44.87-4.87 1.13 -0.87 2.13 2.13 1.13 -487 2.13 -0.87 -2.87 4.13 3.13 -0.87
23.712665 1.2778828 0.75614
4.53875
4.53875 1.277883 23.7127
4.538752
0.756144 8.2344045 17.060491 9.7996219 0.7561437
14.29 14.29 14.29 14.29 1429 14.29 14.29 14.29 14.29 14.29 14.29 14.294.41 -5.09 -5.69 -6.69 0.31 -0.89 9.51 -1.39 2.41 -3.09 7.81 14291-7.69 -0.09
19.417434 25.943521 32.4157
44.8027
0.09396 0.798303 90.374 1.941782 5.791347 9.5696078 60.941782 59.189608
0.0087382
26.86 26.86 26.86 26.86 26.86 26.86 26.86 26.86 26.86 26.86 26.86 26.86 26.86-0.86 8.14 3.14 -6.86 -686 -3.86 1.14 -0.36 -1.86 -2.86 -2.86 -9.86 3.14
0.7373582 66.280836 9.86779
47.0417
47.0417 14.88953 1.30258
0.128663
3.45475 8.1721408 8.1721408 97.19388
_9.867793
138.07 138.07 138.07 138.07 138.07 138.07 13107 138.07 138.07 138.07 138.07 138.07 138.079.93 31.93 19.93 -7.07 -10.07 -39.07 -28.07 42.93 1.93 18.93 -8.07 -28.07 1.93
98.699905 1019.8303 397.396
49.9173
101.309 1526.091 787.656
1843.396 3.743384 358.52599 65.047732 787.65643 3.7433837
11.05 11.05 11.05 I 11.05 11.05 11.05 11.05 11.05 11.05 11.05 11.05 11.05 11.05-1.65 1.75 -4.35 29.55 16.15 0.25 4.25 4.25 1.05 -4.15 -3.45 10.55 -3.95
2.7081711 3.0777363 18.8847
873.459
260.963 0.064693 18.0995
18.09948
1.111649 17.186432 11.872519 111.39426 15.568171
0 0 0 0 0 0 0 0 0 0 0 0 0
0 0 0 0 0 0 0 0 0 0 0 0 00 0 0 0 0 0 0 0 0 0 0 0 0
528.31 585.91 575.91 570.11
530.51 474.81 522.61
597.01 504.21 562.1! 554.4/ 525.51 514.5
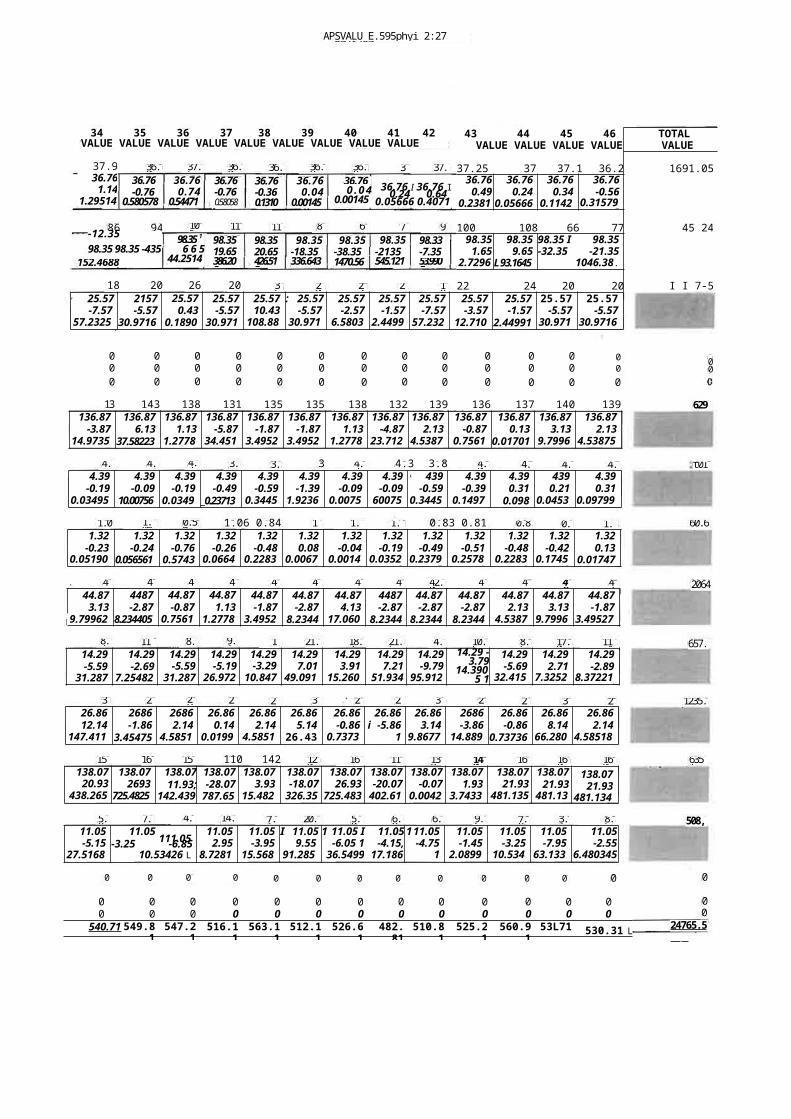
39 25 29 27 2932 26 21 30 23 26 35 29
159 16 15 110 142 120 165 118 138 140 160 160 160
5.8 7.8 4.2 14.0 7.1 20.6 5.0 6.9 6.3 9.6 7.8 3.1 8.5
0 0 0 0 0 0 0 0 0 0 0 0 0
APSVALU E.595phyi 2:27 pm27/6/97
37 37.4
118 11980 75 91
60
1836 23 242018 20 26 20
43 44 45 46VALUE VALUE VALUE VALUE
TOTAL VALUE
37.25 37 37.1 36.2 1691.0536.76 36.76 36.76 36.76
0.49 0.24 0.34 -0.560.2381
90.05666 0.1142
70.31579
5100 108 66 77 45 24
98.35 98.35 98.35 I 98.351.65 9.65 -32.35 -21.35
2.72968
L 93.1645 1046.38.455.7297
22 24 20 20 I I 7-5r 25.57 2157 25.57 25.57 25.57 : 25.57 25.57 25.57 25.57 25.57 25.57 25.57 25.57
-7.57 -5.57 0.43 -5.57 10.43 -5.57 -2.57 -1.57 -7.57 -3.57 -1.57 -5.57 -5.5757.2325
130.9716
40.1890
430.971
6108.88
530.971
66.5803
42.4499
157.232
512.710
82.44991 30.971
630.9716
4
34 35 36 37 38 39 40 41 42VALUE VALUE VALUE VALUE VALUE VALUE VALUE VALUE VALUE
37.936.76
1.141.29514
3
36.036.76-0.76
0.580578
36.836.760 . 0 4
0.0014536.76 I 36.76 I0.24 0.640.05666 0.4071
36.760.74
0.54471
36.76-0.760.58058
36.76-0.360.13101
36.760.04
0.00145
86 94-12.35 98.35 98.35 -435
152.4688
10598.35 1
6 6 544.2514
98.3519.65386.208
98.3520.65426.512
98.35-18.35336.643
98.35-38.351470.56
98.35-2135545.121
98.33-7.3553.9905
37.5 36.0 36.436.8
0 0 0 0 0 0 0 0 0 0 0 0 00 0 0 0 0 0 0 0 0 0 0 0 00 0 0 0 0 0 0 0 0 0 0 0 0
13 143 138 131 135 135 138 132 139 136 137 140 139136.87 136.87 136.87 136.87 136.87 136.87 136.87 136.87 136.87 136.87 136.87 136.87 136.87
-3.87 6.13 1.13 -5.87 -1.87 -1.87 1.13 -4.87 2.13 -0.87 0.13 3.13 2.1314.9735
337.58223 1.2778
834.451
83.4952
73.4952
71.2778
823.712
74.5387
50.7561
40.01701 9.7996
24.53875
24.2 4.3 4.2 3.9 3.8
3 4.3 4.3 3.8 4.0 4.7 4.6 4.7
1.09 1.08 0.56 1.06 0.84 1. 1.28 1.13 0.83 0.81 0.84 0.9 1.45
48 4 4 46 43 4 49 42 42.0 42 47 48 43
8.7 11.6 8.79.1 11 21.3 18.2 21.5 4.5 10.5 8.6 17.0 11.4
4.39 4.39 4.39 4.39 4.39 4.39 4.39 4.39 I. 439 4.39 4.39 439 4.39-0.19 -0.09 -0.19 -0.49 -0.59 -1.39 -0.09 -0.09 -0.59 -0.39 0.31 0.21 0.31
0.034953
10.007561
0.03495
_0.23713 0.34452
1.92365
0.00756
600756
0.34452
0.14974
0.098 0.04539
0.097996
1.32 1.32 1.32 1.32 1.32 1.32 1.32 1.32 1.32 1.32 1.32 1.32 1.32-0.23 -0.24 -0.76 -0.26 -0.48 0.08 -0.04 -0.19 -0.49 -0.51 -0.48 -0.42 0.13
0.051905
0.056561 0.5743 0.06647
0.22832
0.00675
0.00143
0.03528
0.23797
0.25789
0.22832
0.17458
0.01747
44.87 4487 44.87 44.87 44.87 44.87 44.87 4487 44.87 44.87 44.87 44.87 44.873.13 -2.87 -0.87 1.13 -1.87 -2.87 4.13 -2.87 -2.87 -2.87 2.13 3.13 -1.87
9.799622
8.234405 0.75614
1.27788
3.49527
8.2344 17.0605
8.2344 8.2344 8.2344 4.53875
9.79962
3.495274
14.29-5.59
31.287
14.29-2.69
7.254825
14.29-5.59
31.287
14.29-5.19
26.9722
14.29-3.29
10.847
14.297.01
49.0913
14.293.91
15.2609
14.297.21
51.934
14.29-9.79
95.9122
14.29 -3.79
14.3905 1
14.29-5.69
32.4157
14.292.71
7.32526
14.29-2.89
8.372216
26.86 2686 2686 26.86 26.86 26.86 26.86 26.86 26.86 2686 26.86 26.86 26.8612.14 -1.86 2.14 0.14 2.14 5.14 -0.86 i -5.86 3.14 -3.86 -0.86 8.14 2.14
147.4113
3.45475 4.58518
0.01997
4.58518
26.433
0.73736
134.3243
9.86779
14.8895
0.73736 66.2808
4.585184
138.0720.93
438.2651
138.072693
725.4825
138.0711.93;
142.4391
138.07-28.07
787.656
138.073.93
15.4825
138.07 -18.07326.35
2
138.0726.93
725.483
138.07-20.07
402.613
138.07-0.07
0.00425
138.071.93
3.74338
138.0721.93
481.135
138.0721.93
481.135
138.0721.93
481.134
11.05 11.05 11.05 11.05 I 11.05 1 11.05 I 11.05 111.05 11.05 11.05 11.05 11.05-5.15 111.05-3.25 -6.85 2.95 -3.95 9.55 -6.05 1 -4.15, -4.75 -1.45 -3.25 -7.95 -2.55
27.51687
10.53426 L46.863
8.72817
15.5682
91.2856
36.54991
17.1864
122.5212
2.08991
10.5343
63.1334
6.480345,
0 0 0 0 0 0 0 0 0 0 0 0 00 0 0 0 0 0 0 0 0 0 0 0 0
540.71 549.81
547.21
516.11
563.11
512.11
526.61
482.81
510.81
525.21
560.91
53L71 530.31 L
00
629
t01.8
60.62
2064.
657.5
1235.5
6351
508,1
0
00
24765.57!
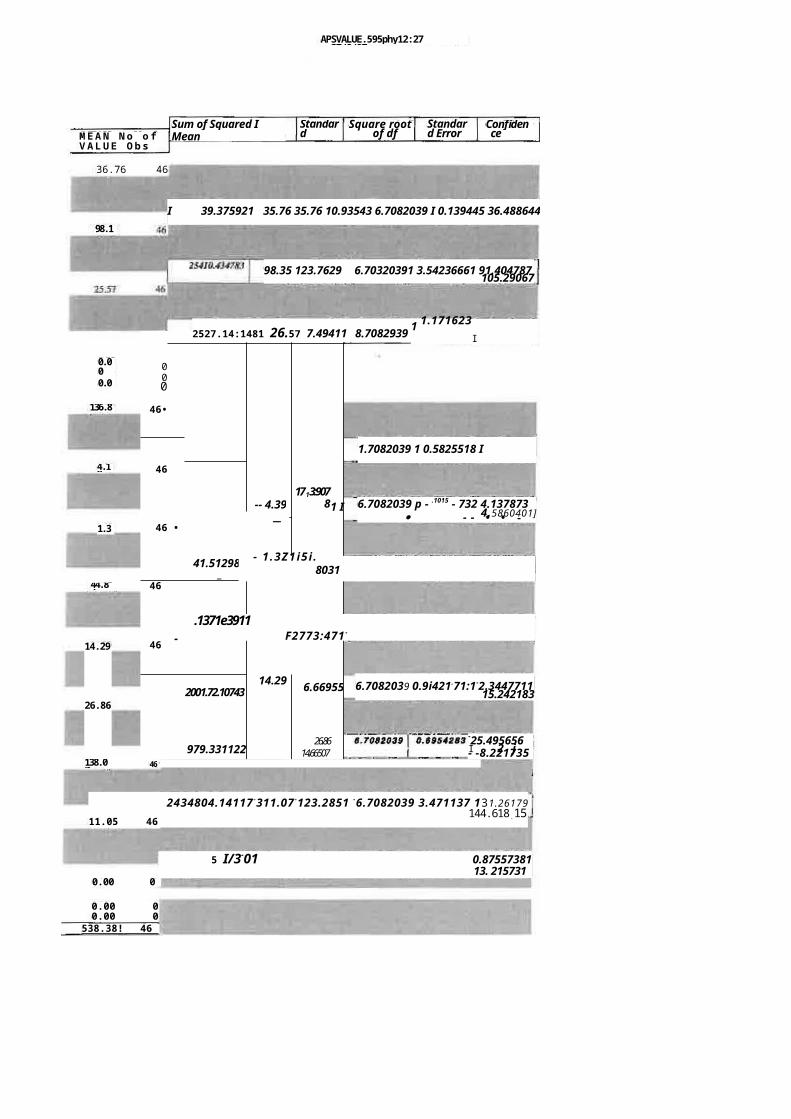
5 I/3-01 0.875573811 . 3 13. 215731
0.00 0
APSVALUE.595phy12:27 pm27/8/97
M E A N N o o fV A L U E O b s
Sum of Squared I Mean
Standard Deviatio
Square rootof df
Standard Error
Confidence interval
36.76 46
I 39.375921 35.76 35.76 10.93543 6.7082039 I 0.139445 36.488644198.1
5
98.35 123.7629 6.70320391 3.54236661 91.404787105.29067
000
46•
-- 4.391713:907
81 I
46
_ -46 •
41.512983_
46
46 -
2001.72.10743
1
14.29 6.66955
979.331122
T
26.8614.66507
2434804.14117 -311.07 -123.2851 -6.7082039 3.471137 131.26179144.618.1511.05 46
0.00 00.00 0
538.38! 46
2527.14:1481 26.57 7.49411 8.70829391.1716231
I
-25.495656I 2 j- -8.22173546.
.1371e3911F2773;471 -
- 1 .3Z1i5 i .8031_ _
0.000.00
136.87
4.19
1.32
44.87
14.29
26.86
138.07
1.7082039 1 0.5825518 I 135.72776i
6.7082039 p - .1015 - 732 4.1378734.5860401]· - - • • -
6.7082039 0.9i421.71:1-2.344771115.242183
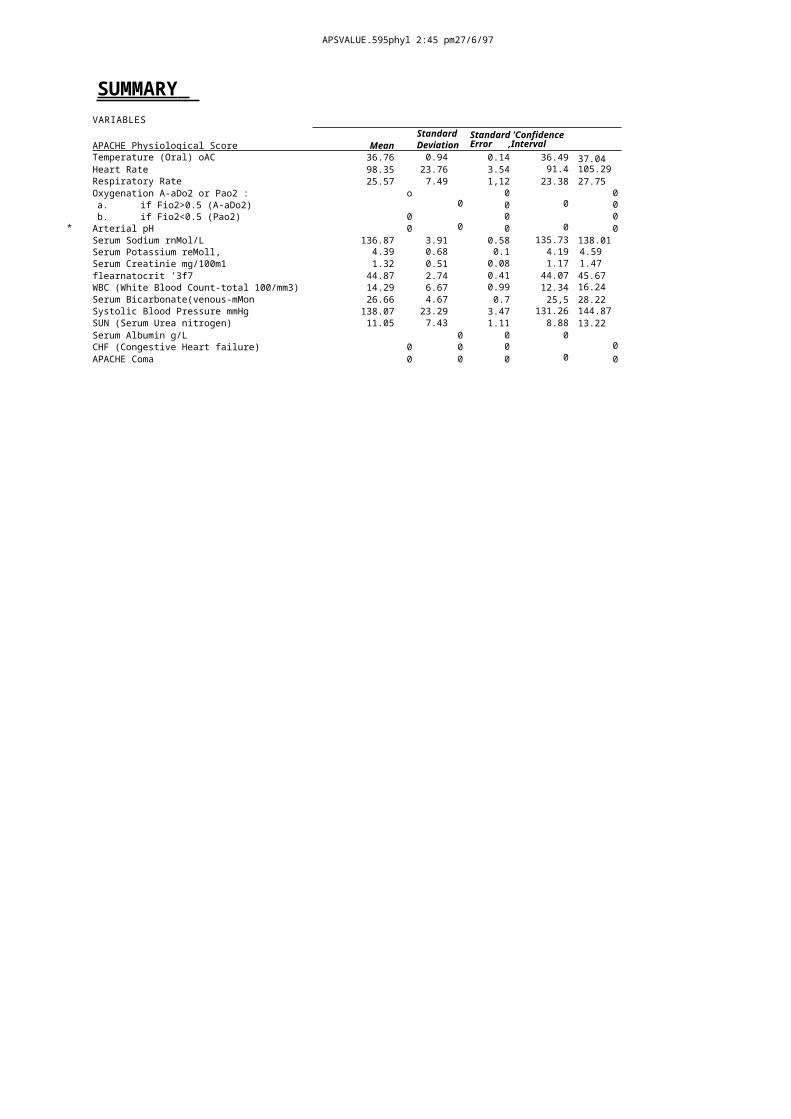
*
APSVALUE.595phyl 2:45 pm27/6/97
SUMMARY VARIABLES
APACHE Physiological Score MeanStandard Deviation
Standard 'ConfidenceError ,Interval
Temperature (Oral) oAC 36.76 0.94 0.14 36.49 37.04Heart Rate 98.35 23.76 3.54 91.4 105.29Respiratory Rate 25.57 7.49 1,12 23.38 27.75Oxygenation A-aDo2 or Pao2 : o 0 0a. if Fio2>0.5 (A-aDo2) 0 0 0 0b. if Fio2<0.5 (Pao2) 0 0 0Arterial pH 0 0 0 0 0Serum Sodium rnMol/L 136.87 3.91 0.58 135.73 138.01Serum Potassium reMoll, 4.39 0.68 0.1 4.19 4.59Serum Creatinie mg/100m1 1.32 0.51 0.08 1.17 1.47flearnatocrit '3f7 44.87 2.74 0.41 44.07 45.67WBC (White Blood Count-total 100/mm3) 14.29 6.67 0.99 12.34 16.24Serum Bicarbonate(venous-mMon 26.66 4.67 0.7 25,5 28.22Systolic Blood Pressure mmHg 138.07 23.29 3.47 131.26 144.87SUN (Serum Urea nitrogen) 11.05 7.43 1.11 8.88 13.22Serum Albumin g/L 0 0 0CHF (Congestive Heart failure) 0 0 0 0APACHE Coma 0 0 0 0 0
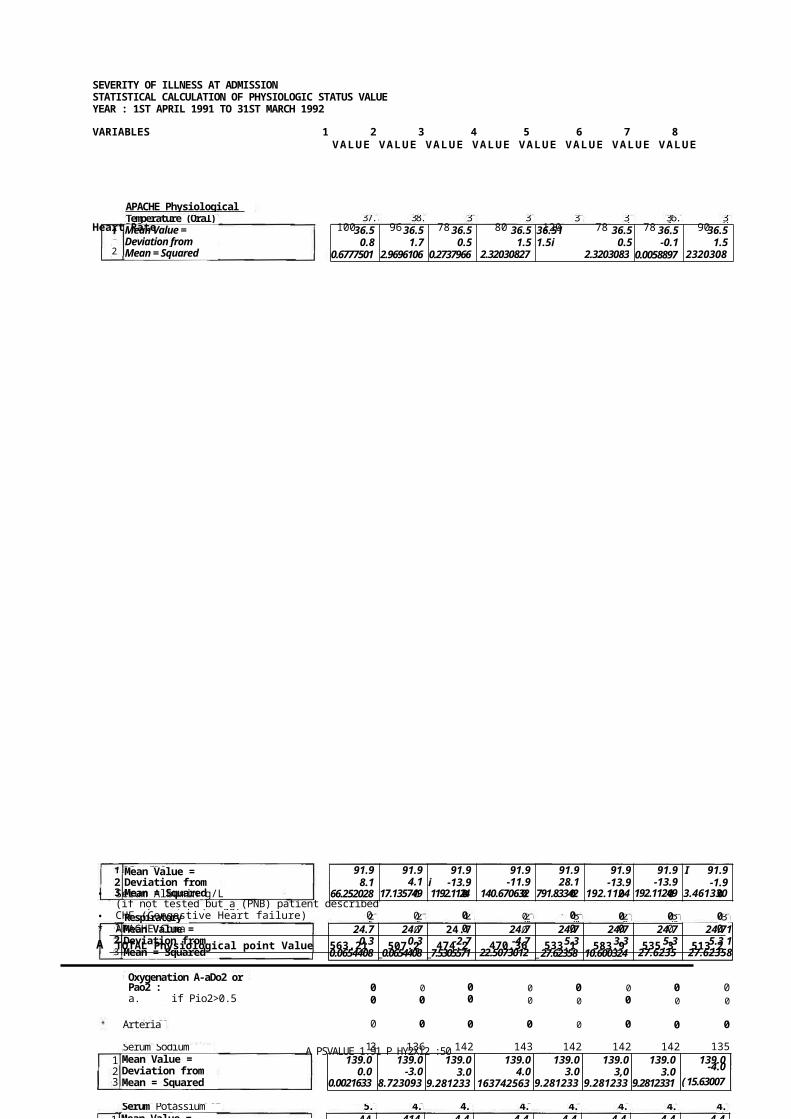
37.3 38.2 37 38 38 37 36.4 38APACHE Physiological Score] tTemperature (Oral)DACMean Value = Deviation from Mean = Squared Deviation =
2
36.5 36.5 36.5 36.5 36.51 36.5 36.5 36.50.8 1.7 0.5 1.5 1.5i 0.5 -0.1 1.5
0.6777501 2.9696106 0.2737966 2.320308275
2.320308310.2737966
0.0058897 23203083
25 25 22 20 30 28 30 30
Mean Value = Deviation from Mean = Squared Deviation =Respiratory RateMean Value = Deviation from Mean = Squared Deviation =Oxygenation A-aDo2 orPao2 :a. if Pio2>0.5 (A-aDo2)Arterial pHSerum Sodium mMol/LMean Value = Deviation from Mean = Squared Deviation =
123
23
123
91.98.1
66.252028
91.94.1
17.135749
91.9i -13.91192.1124
9
91.9-11.9
140.6706328
91.928.1
791.83342
91.9-13.9
192.11249
91.9-13.9
192.11249
I 91.9-1.9
3.4613304
24.7 24.7 24.7 24.7 24.7 24.7 24.7 24.710.3 0.3 -2.7 -4.7 5.3 3.3 5.3 5.3 1
0.0654408 _0.0654408 _7.5305571 22.50730124
_ 27.62358 10.600324 27.62358
27.62358I
0 0 0 0 0 0 0 00 0 0 0 0 0 0 0
0 0 0 0 0 0 0 0
139
136 142 143 142 142 142 135139.0
0.00.0021633
139.0-3.0
8.7230936
139.03.0
9.2812331
139.04.0
1637425635
139.03.0
9.2812331
139.03,0
9.2812331
139.03.0
9.2812331
139.0-4.0( 15.63007
5.4 4.3 4.2 4.2 4.0 4.2 4.2 4.1Serum Potassium mMol/LMean Value = 1 44 414 4.4 4.4 4.4 4.4 4.4 4.4
A PSVALUE 1.91 P HY2X12 :50 pm2716/97
SEVERITY OF ILLNESS AT ADMISSIONSTATISTICAL CALCULATION OF PHYSIOLOGIC STATUS VALUE YEAR : 1ST APRIL 1991 TO 31ST MARCH 1992
VARIABLES 1 2 3 4 5 6 7 8VALUE VALUE VALUE VALUE VALUE VALUE VALUE VALUE
Heart Rate 100 96 78 80 120 78 78 90
• Serum Albumin g/L 0 0 0 0 0 0 0(if not tested but a (PNB) patient describedas malnouriahed > 30)• CHF (Congestive Heart failure) 0 0 0 0 0 0 0 0
* APACHE Coma 0 0 0 0 0 0 0A TOTAL Physiological point Value 563.21 507.2
3474.2
6470.36 533.1
4583.9
2535.3
2513.2
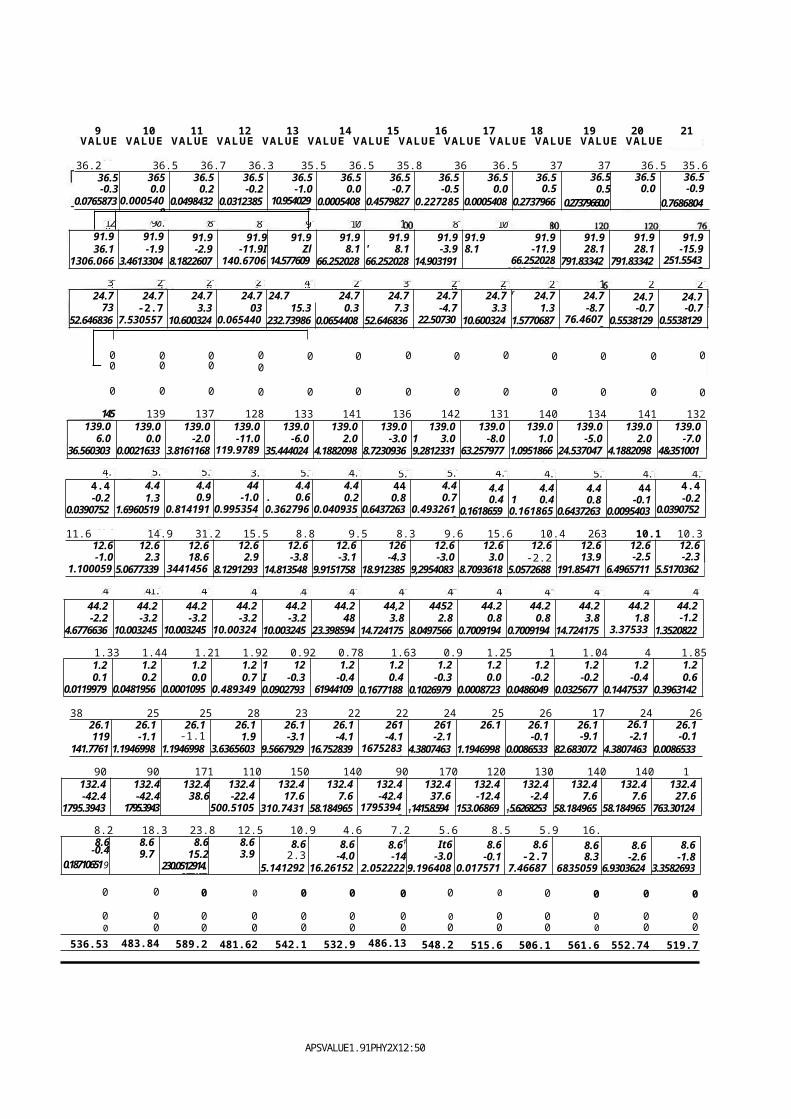
Mean Value = 1 44 414 4.4 4.4 4.4 4.4 4.4 4.4
4.2 5.7 5.3 3.4 5.0 4.6 5.25.1 4.8
4.8 5.2 4.3 4.2
42 41.0 41 4 4 49 4548 47 4345 48 46
128 90.0 89 80 100 194 88 100
32 22 28 25
44.2 44.2 44.2 44.2 44.2 44.2 44,2 4452 44.2 44.2 44.2 44.2 44.2-2.2 -3.2 -3.2 -3.2 -3.2 48 3.8 2.8 0.8 0.8 3.8 1.8 -1.2
4.6776636 10.003245 10.003245 10.003245
10.003245 23.398594 14.724175 8.0497566 0.7009194 0.7009194 14.724175 3.375338
1.3520822
1.33 1.44 1.21 1.92 0.92 0.78 1.63 0.9 1.25 1 1.04 4 1.851.2 1.2 1.2 1.2 1 12 1.2 1.2 1.2 1.2 1.2 1.2 1.2 1.20.1 0.2 0.0 0.7 I -0.3 -0.4 0.4 -0.3 0.0 -0.2 -0.2 -0.4 0.6
0.0119979 0.0481956 0.0001095 0.4893491
0.0902793 619441095
0.1677188 0.1026979 0.0008723 0.0486049 0.0325677 0.1447537 0.3963142
38 25 25 28 23 22 22 24 25 26 17 24 2626.1 26.1 26.1 26.1 26.1 26.1 261 261 26.1 26.1 26.1 26.1 26.1119 -1.1 -1.1 1.9 -3.1 -4.1 -4.1 -2.1 -0.1 -9.1 -2.1 -0.1
141.7761 1.1946998 1.1946998 3.6365603 9.5667929 16.752839 16752839
4.3807463 1.1946998 0.0086533 82.683072 4.3807463 0.0086533
90 90 171 110 150 140 90 170 120 130 140 140 1132.4 132.4 132.4 132.4 132.4 132.4 132.4 132.4 132.4 132.4 132.4 132.4 132.4-42.4 -42.4 38.6 -22.4 17.6 7.6 -42.4 37.6 -12.4 -2.4 7.6 7.6 27.6
1795.3943 1795.394311492.1152
500.51055
310.7431 58.184965 17953943
11415.8.594 153.06869 15.6268253 58.184965 58.184965 763.30124
8.2 18.3 23.8 12.5 10.9 4.6 7.2 5.6 8.5 5.9 16.8.6-0.4
0.1871065193.459432
8.69.7
8.615.2
230.0512914.957107
8.63.9
8.62.3
5.141292
8.6-4.0
16.26152
8.61
-142.052222
It6-3.0
9.196408
8.6-0.1
0.017571
8.6-2.7
7.46687
8.68.3
6835059
8.6-2.6
6.9303624
8.6-1.8
3.3582693
0 0 0 0 0 0 0 0 0 0 0 0 0
0 0 0 0 0 0 0 0 0 0 0 0 00 0 0 0 0 0 0 0 0 0 0 0 0
536.53 483.841
589.21
481.62 542.1 532.9 486.131
548.2 515.6 506.1 561.6 552.74 519.7
40 25 32 20 28 26 1 24 24
9 10 11 12 13 14 15 16 17 18 19 20 21VALUE VALUE VALUE VALUE VALUE VALUE VALUE VALUE VALUE VALUE VALUE VALUE VALUE
36.2 36.5 36.7 36.3 35.5 36.5 35.8 36 36.5 37 37 36.5 35.636.5 365 36.5 36.5 36.5 36.5 36.5 36.5 36.5 36.5 36.5 36.5 36.5-0.3 0.0 0.2 -0.2 -1.0 0.0 -0.7 -0.5 0.0 0.5 0.5 0.0 -0.9
0.0765873 0.0005408
0.0498432 0.0312385 10.9540292
0.0005408 0.4579827 0.227285 0.0005408 0.2737966 0.27379660.0005408
0.7686804
91.9 91.9 91.9 91.9 91.9 91.9 91.9 91.9 91.9 91.9 91.9 91.9 91.936.1 -1.9 -2.9 -11.9I Zl 8.1 ' 8.1 -3.9 8.1 -11.9 28.1 28.1 -15.9
1306.066 3.4613304 8.1822607 140.67063
14.5776095
66.252028 66.252028 14.903191 66.2520281140.67063
791.83342 791.83342 251.55435
24.7 24.7 24.7 24.7 24.7 24.7 24.7 24.7 24.7 r 24.7 24.7 24.7 24.773 -2.7 3.3 03 15.3 0.3 7.3 -4.7 3.3 1.3 -8.7 -0.7 -0.7
52.646836 7.5305571
10.600324 0.0654408
232.73986 0.0654408 52.646836 22.507301
10.600324 1.5770687 76.46079
0.5538129 0.5538129
0 0 0 0 0 0 0 0 0 0 0 0 00 0 0 0
0 0 0 0 0 0 0 0 0 0 0 0 0145 139 137 128 133 141 136 142 131 140 134 141 132
139.0 139.0 139.0 139.0 139.0 139.0 139.0 139.0 139.0 139.0 139.0 139.0 139.06.0 0.0 -2.0 -11.0 -6.0 2.0 -3.0 1 3.0 -8.0 1.0 -5.0 2.0 -7.0
36.560303 0.0021633 3.8161168 119.97891
35.444024 4.1882098 8.7230936 9.2812331 63.257977 1.0951866 24.537047 4.1882098 4&351001
4.4-0.2
0.0390752
4.41.3
1.6960519
4.40.9
0.8141915
44-1.0
0.9953542
4.4. 0.60.362796
1
4.40.2
0.0409356
440.8
0.6437263
4.40.7
0.4932612
4.40.4
0.1618659
4.41 0.40.161865
4.40.8
0.6437263
44-0.1
0.0095403
4.4-0.2
0.0390752
11.6 14.9 31.2 15.5 8.8 9.5 8.3 9.6 15.6 10.4 263 10.1 10.312.6 12.6 12.6 12.6 12.6 12.6 126 12.6 12.6 12.6 12.6 12.6 12.6-1.0 2.3 18.6 2.9 -3.8 -3.1 -4.3 -3.0 3.0 -2.2 13.9 -2.5 -2.3
1.1000595
5.0677339 34414564
8.1291293 14.813548 9.9151758 18.912385 9,2954083 8.7093618 5.0572688 191.85471 6.4965711 5.5170362
APSVALUE1.91PHY2X12:50 pm27/6/97
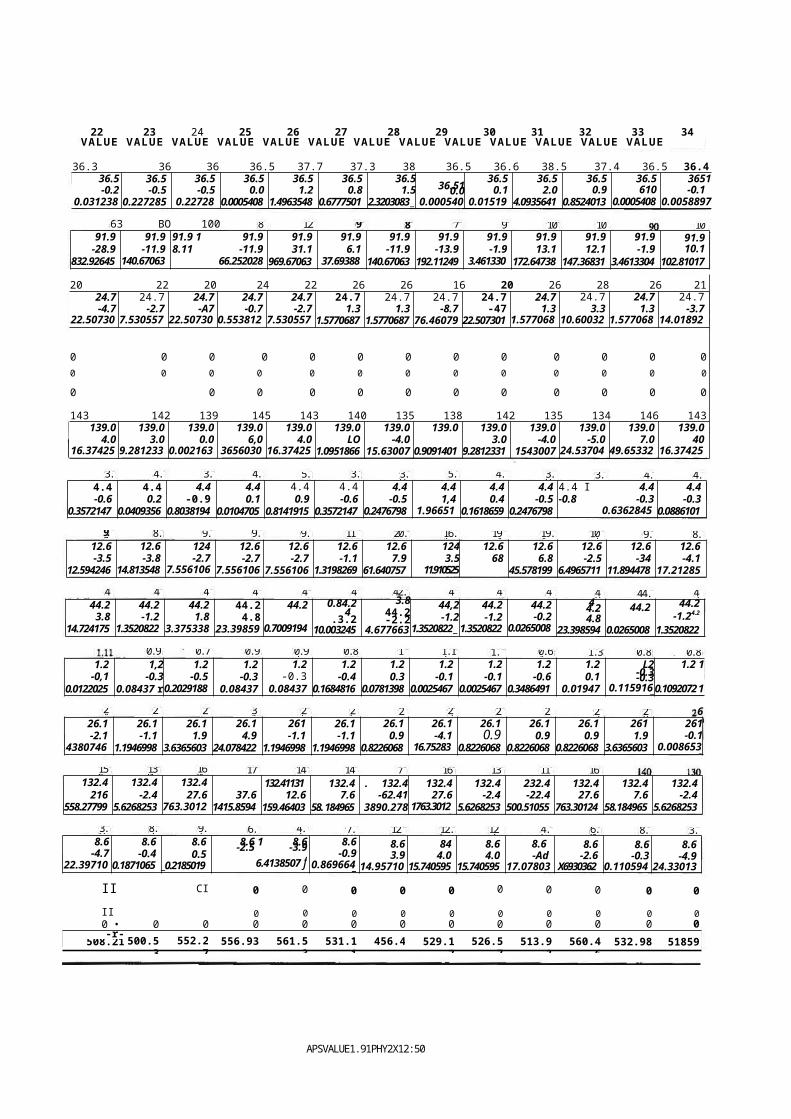
156 130 160 170 145 140 70 160 130 110 160
8.2 9.13.9 6.1 4.7 7.7 12.612.5 12.6 4.5 6.0 8.3 3.7
0.93 0.77 0.93 0.93 0.81 1. 1.17 1.17 0.63 1.36 0.88 0.89
24 25 28 31 25 2 22 2 225 27 628
48 43 46 49 45 41 42.0 43 43 44 49 44.043
9.1 8.8 9.9 9.9 9.9 11.5 20.5 16.1 19.4 19.4 10.1 9. 8.
3.8 4.6 3.5 4.5 5.3 3.8 3.9 5.8 4.8 3.9 3.6 4.1 4.1
63 BO 100 80 123 98 80 78 90 105 104 102
22 23 24 25 26 27 28 29 30 31 32 33 34VALUE VALUE VALUE VALUE VALUE VALUE VALUE VALUE VALUE VALUE VALUE VALUE VALUE
36.3 36 36 36.5 37.7 37.3 38 36.5 36.6 38.5 37.4 36.5 36.436.5 36.5 36.5 36.5 36.5 36.5 36.5 36.5 36.5 36.5 36.5 3651-0.2 -0.5 -0.5 0.0 1.2 0.8 1.5 36.510.0 0.1 2.0 0.9 610 -0.1
0.0312385
0.227285 0.227285
0.0005408 1.4963548 0.6777501 2.3203083 _ 0.0005408
0.015192
4.0935641 0.8524013 0.0005408 0.0058897
91.9 91.9 91.9 1 91.9 91.9 91.9 91.9 91.9 91.9 91.9 91.9 91.9 91.9-28.9 -11.9 8.11 -11.9 31.1 6.1 -11.9 -13.9 -1.9 13.1 12.1 -1.9 10.1
832.92645 140.67063 66.2520281140.67063
969.67063 37.693889
140.67063 192.11249 3.4613304
172.64738 147.36831 3.4613304 102.81017
20 22 20 24 22 26 26 16 20 26 28 26 2124.7 24.7 24.7 24.7 24.7 24.7 24.7 24.7 24.7 24.7 24.7 24.7 24.7-4.7 -2.7 -A7 -0.7 -2.7 1.3 1.3 -8.7 -47 1.3 3.3 1.3 -3.7
22.507301
7.5305571
22.507301
0.5538129
7.5305571
1.5770687 1.5770687 76.46079 22.507301 1.5770687
10.600324
1.5770687
14.018929
0 0 0 0 0 0 0 0 0 0 0 0 00 0 0 0 0 0 0 0 0 0 0 0 0
0 0 0 0 0 0 0 0 0 0 0 0
143 142 139 145 143 140 135 138 142 135 134 146 143139.0 139.0 139.0 139.0 139.0 139.0 139.0 139.0 139.0 139.0 139.0 139.0 139.0
4.0 3.0 0.0 6,0 4.0 LO -4.0 3.0 -4.0 -5.0 7.0 4016.37425
69.281233
10.002163
33656030
316.37425
61.0951866 15.63007 0.9091401 9.2812331 1543007 24.53704
749.65332
616.37425
6
4.4 4.4 4.4 4.4 4.4 4.4 4.4 4.4 4.4 4.4 4.4 I 4.4 4.4-0.6 0.2 -0.9 0.1 0.9 -0.6 -0.5 1,4 0.4 -0.5 -0.8 -0.3 -0.3
0.3572147 0.0409356 0.8038194 0.0104705 0.8141915 0.3572147 0.2476798 1.966517
0.1618659 0.2476798 0.63628450.0886101
0.0886101
12.6 12.6 124 12.6 12.6 12.6 12.6 124 12.6 12.6 12.6 12.6 12.6-3.5 -3.8 -2.7 -2.7 -2.7 -1.1 7.9 3.5 68 6.8 -2.5 -34 -4.1
12.594246 14.813548 7.556106 7.556106 7.556106 1.3198269 61.640757 11.910525_45.578199
45.578199 6.4965711 11.894478 17.21285
44.23.8
14.724175
44.2-1.2
1.3520822
44.21.8
3.375338
44.24.8
23.398594
44.2
0.7009194
0.84.2 4.3.2
10.003245
3.844.2-2.2
4.6776636
44,2-1.2
1.3520822 _
44.2-1.2
1.3520822
44.2-0.2
0.0265008
44.24.8
23.398594
44.2
0.0265008
44.2-1.24.2
1.3520822
1.2 1,2 1.2 1.2 1.2 1.2 1.2 1.2 1.2 1.2 1.2 L2 1.2 1-0,1 -0.3 -0.5 -0.3 -0.3 -0.4 0.3 -0.1 -0.1 -0.6 0.1 -0.3-0.3
0.0122025 0.08437 r0.2029188 0.08437 0.08437 0.1684816 0.0781398 0.0025467 0.0025467 0.3486491 0.01947 0.1159165
0.1092072 1
26.1 26.1 26.1 26.1 261 26.1 26.1 26.1 26.1 26.1 26.1 261 261-2.1 -1.1 1.9 4.9 -1.1 -1.1 0.9 -4.1 0.9 0.9 0.9 1.9 -0.1
43807463
1.1946998 3.6365603 24.078422 1.1946998 1.1946998 0.8226068 16.752839
0.8226068 0.8226068 0.8226068 3.6365603 0.0086533
132.4 132.4 132.4 132.411314
132.4 . 132.4 132.4 132.4 232.4 132.4 132.4 132.4216 -2.4 27.6 37.6 12.6 7.6 -62.41 27.6 -2.4 -22.4 27.6 7.6 -2.4
558.27799 5.6268253 763.30124
1415.8594 159.46403 58. 184965 3890.278 1763.30124
5.6268253 500.51055 763.30124 58.184965 5.6268253
8.6-4.7
22.397107
8.6-0.4
0.1871065
8.60.5
_0.2185019
8.6 1 8.6-2.5 -3.96.4138507 f
15.465014
8.6-0.9
0.8696647
8.63.9
14.957107
844.0
15.740595
8.64.0
15.740595
8.6 -Ad
17.078037
8.6-2.6
X69303624
8.6-0.3
0.1105949
8.6-4.9
24.33013
II CI 0 0 0 0 0 0 0 0 0 0II 0 0 0 0 0 0 0 0 0 00 • 0 0 0 0 0 0 0 0 0 0 0 0-r-508.21 500.5
3552.2
7556.93 561.5
3531.1
1456.4 529.1
7526.5
7513.9
3560.4
6532.98
,51859
APSVALUE1.91PHY2X12:50 pm27/8197
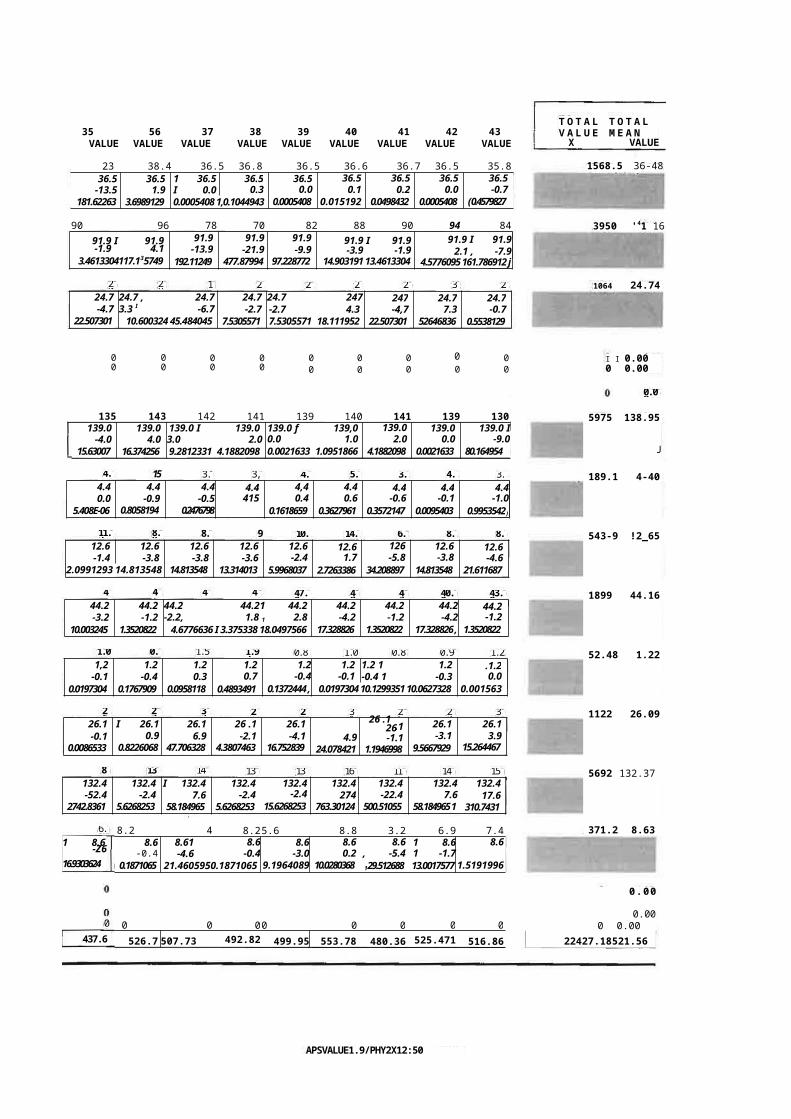
1.08 0.8 1.53 1.92 0.85 1.08 0.86 0.97 1.26
26 27 33 2 2 31 25 23 3
80 130 140 130 130 160 110 140 150
11.2 8.8 8.8 9 10.2 14.3 6.8 8.8 8.0
41 43 42 46 47.0 40 43 40.0 43.0
4.4 15 3.9 3,9 4.8 5.0 3.8 4.3 3.4
20 28 18 22 22 29 20 32 24
35 56 37 38 39 40 41 42 43VALUE VALUE VALUE VALUE VALUE VALUE VALUE VALUE VALUE
23 38.4 36.5 36.8 36.5 36.6 36.7 36.5 35.836.5 36.5 1 36.5 36.5 36.5 36.5 36.5 36.5 36.5
-13.5 1.9 I 0.0 0.3 0.0 0.1 0.2 0.0 -0.7181.62263 3.6989129 0.0005408 1,0.1044943 0.0005408 0.015192 0.0498432 0.0005408 ( 0.4579827
90 96 78 70 82 88 90 94 8491.9 I 91.9-1.9 4.1
3.4613304117.135749
91.9-13.9
192.11249
91.9-21.9
477.87994
91.9-9.9
97.228772
91.9 I 91.9-3.9 -1.9
14.903191 13.4613304
91.9 I 91.92.1 , -7.9
4.5776095 161.786912 j
24.7 24.7 , 24.7 24.7 24.7 247 247 24.7 24.7-4.7 3.3 I -6.7 -2.7 -2.7 4.3 -4,7 7.3 -0.7
22.507301 10.600324 45.484045 7.5305571 7.5305571 18.111952 22.507301 52646836 0.5538129
0 0 0 0 0 0 0 0 00 0 0 0 0 0 0 0 0
135 143 142 141 139 140 141 139 130139.0 139.0 139.0 I 139.0 139.0 f 139,0 139.0 139.0 139.0 I
-4.0 4.0 3.0 2.0 0.0 1.0 2.0 0.0 -9.015.63007 16.374256 9.2812331 4.1882098 0.0021633 1.0951866 4.1882098 0.0021633 80.164954
4.4 4.4 4.4 4.4 4,4 4.4 4.4 4.4 4.40.0 -0.9 -0.5 415 0.4 0.6 -0.6 -0.1 -1.0
5.408E-06 0.8058194 0.247679810.2476798
0.1618659 0.3627961 0.3572147 0.0095403 0.9953542)
12.6 12.6 12.6 12.6 12.6 12.6 126 12.6 12.6-1.4 -3.8 -3.8 -3.6 -2.4 1.7 -5.8 -3.8 -4.6
2.0991293 14.813548 14.813548 13.314013 5.9968037 2.7263386 34.208897 14.813548 21.611687
44.2 44.2 44.2 44.21 44.2 44.2 44.2 44.2 44.2-3.2 -1.2 -2.2, 1.8 1 2.8 -4.2 -1.2 -4.2 -1.2
10.003245 1.3520822 4.6776636 I 3.375338 18.0497566 17.328826 1.3520822 17.328826 , 1.3520822
1,2 1.2 1.2 1.2 1.2 1.2 1.2 1 1.2 .1.2-0.1 -0.4 0.3 0.7 -0.4 -0.1 -0.4 1 -0.3 0.0
0.0197304 0.1767909 0.0958118 0.4893491 0.1372444 , 0.0197304 10.1299351 10.0627328 0.001563
26.1-0.1
0.0086533
I 26.10.9
0.8226068
26.16.9
47.706328
26 .1-2.1
4.3807463
26.1-4.1
16.7528394.9
24.078421
26 .1 .126
-1.11.1946998
26.1-3.1
9.5667929
26.13.9
15.264467
132.4-52.4
2742.8361
132.4-2.4
5.6268253
I 132.47.6
58.184965
132.4-2.4
5.6268253
132.4-2.4
15.6268253
132.4274
763.30124
132.4-22.4
500.51055
132.47.6
58.184965 1
132.417.6
310.7431
8.2 4 8.25.6 8.8 3.2 6.9 7.48.6 8.61 8.6 8.6 8.6 8.6 1 8.6 8.6
-0.4 -4.6 -0.4 -3.0 0.2 , -5.4 1 -1.70.1871065 21.4605950.1871065 9.1964089 10.0280368 129.512688 13.0017577 1.5191996
0 0 00 0 0 0 0526.7 507.73 492.82
1499.95 553.78 480.36 525.471 516.86
3950 '41 16
1064 24.74
APSVALUE1.9/PHY2X12:50 pm27/6197
0.00
0.000 0.00
22427.18521.56
1568.5 36-48
I I 0.000 0.00
0.005975 138.95
J
189.1 4-40
543-9 !2_65
1899 44.16
52.48 1.22
1122 26.09
5692 132.37
371.2 8.636.0
0437.68(
T O T A L T O T A L V A L U E M E A NX VALUE
1 8.6-Z616.9303624
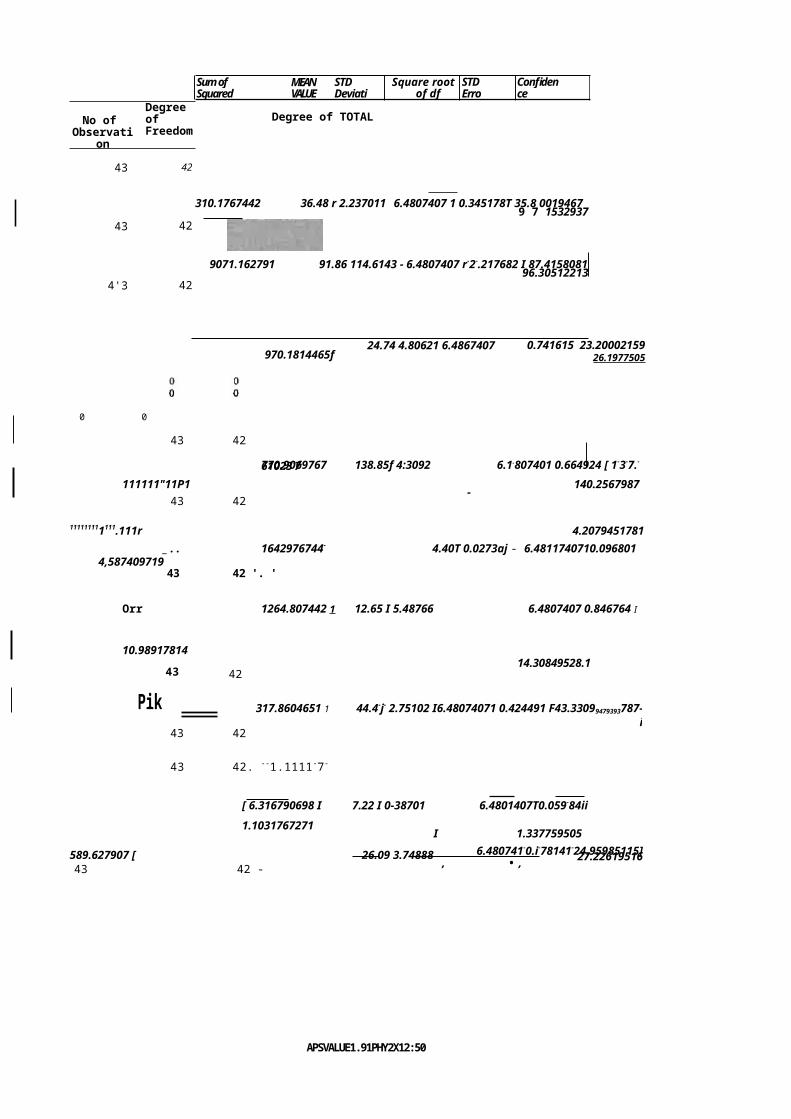
No of Observati
on
Degree of Freedom
43 42
43 42
4'3 42
Degree of TOTAL
310.1767442 36.48 r 2.237011 6.4807407 1 0.345178T 35.8 00194679 7 1532937
9071.162791 91.86 114.6143 - 6.4807407 r-2-.217682 I 87.415808196.30512213
970.1814465f24.74 4.80621 6.4867407 0.741615 23.20002159
26.1977505
0 0
43 42
770.9069767 138.85f 4:3092 6.1.807401 0.664924 [ 1-3-7.-61023-7.
111111"11P1 140.2567987- 43 42
111111111111.111r 4.2079451781_ . . 1642976744- 4.40T 0.0273aj - 6.4811740710.096801
4,58740971943 42 '. '
Orr 1264.807442 1 12.65 I 5.48766 6.4807407 0.846764 I
10.9891781414.30849528.143
Pik42
317.8604651 1 44.4-j- 2.75102 I6.48074071 0.424491 F43.33099479393787-i
43 42
43 42. --1.1111-7-
[ 6.316790698 I 7.22 I 0-38701 6.4801407T0.059-84ii 1.1031767271 I 1.337759505
589.627907 [ 26.09 3.7488843 42 -
6.480741-0.i-78141-24.95985115]27.22619516, • ,
STD Error
MEAN VALUE
Square rootof df
STD Deviation
Sum of Squared DeWation
Confidence Interval
APSVALUE1.91PHY2X12:50 pm27/8/97
00 0
43 42
32140.04651
43 42132.37 1 27.6630i 6.4807407-1 4.268493 ! 124.0058469140.7383391- -
1 719.07441860
8.63 FO.13773 6.4807407 0.6384667.3811652
9.883951079 IU
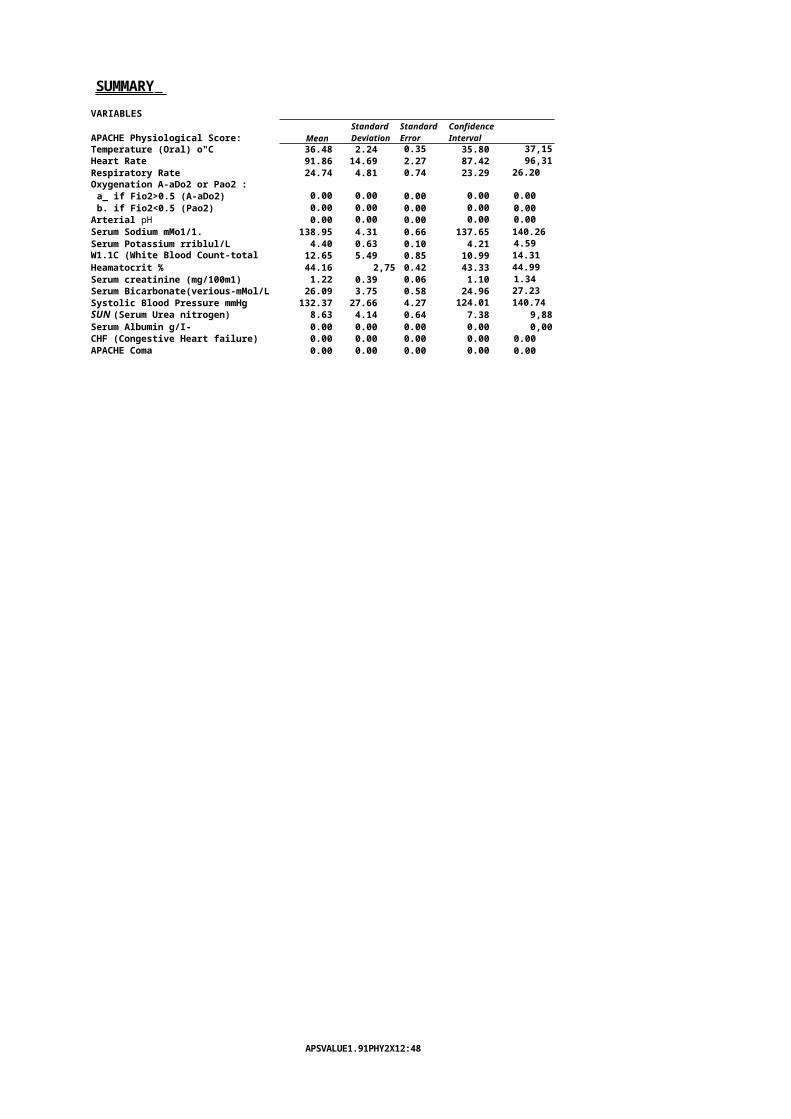
SUMMARY VARIABLES
APACHE Physiological Score: MeanStandard Deviation
Standard Error
Confidence Interval
Temperature (Oral) o"C 36.48 2.24 0.35 35.80 37,15Heart Rate 91.86 14.69 2.27 87.42 96,31Respiratory Rate 24.74 4.81 0.74 23.29 26.20Oxygenation A-aDo2 or Pao2 :a_ if Fio2>0.5 (A-aDo2) 0.00 0.00 0.00 0.00 0.00b. if Fio2<0.5 (Pao2) 0.00 0.00 0.00 0.00 0.00
Arterial pH 0.00 0.00 0.00 0.00 0.00Serum Sodium mMo1/1. 138.95 4.31 0.66 137.65 140.26Serum Potassium rriblul/L 4.40 0.63 0.10 4.21 4.59W1.1C (White Blood Count-total 100/mm3)
12.65 5.49 0.85 10.99 14.31Heamatocrit % 44.16 2,75 0.42 43.33 44.99Serum creatinine (mg/100m1) 1.22 0.39 0.06 1.10 1.34Serum Bicarbonate(verious-mMol/L 26.09 3.75 0.58 24.96 27.23Systolic Blood Pressure mmHg 132.37 27.66 4.27 124.01 140.74SUN (Serum Urea nitrogen) 8.63 4.14 0.64 7.38 9,88Serum Albumin g/I- 0.00 0.00 0.00 0.00 0,00CHF (Congestive Heart failure) 0.00 0.00 0.00 0.00 0.00APACHE Coma 0.00 0.00 0.00 0.00 0.00
APSVALUE1.91PHY2X12:48 pm27/6/97
North Essex
HealthAuthorityusievavadiNsossiiskietar 73%Am. Ittl
Turner Road, Colchester, EsseTelephone 01206 851257
Our ref: SJ/SADate: 1st November, 1996
Mr. G. A. Benn-ohikuare, MSc, DipHE, MHSM, MIAPTalltrees10 Hastings Place,BrightlingseaColchesterEssex C07 OAP
Dear Mr. Benn-ohikuare,
Georkey Carroll has passed on to lila yourhiril regarding our wish to do your dissertation in North Essex. We would be delighted to assist you in your project and as you suggest, thereare various opportunities which we could explore further. Perhapswe should arrange to meet each other when we could discuss the various options that are available to you. Please ring my secretary Sandy on 01206 851257 ext. 234 to make an appointment at your convenience.
Yours sincerely,
Dr. Sushi! athannaConsultant in Public Health Medicine and Clinical Policy.
Chairman: Alec `-z' :on Head Office: C eleplione 01376 5165 I 5 F.: "..5.3Y. 6

Chief Exectnive: Mid Essex Office: I 37..i ,I e515 iWest Essex Off cc: ; CH2',1. I DR, l clepherie 01271 .11 (,309
n _North East Essex Office: 111itl. r Raid, C:olcho,iQr, C.0,15'JF( I riephole 01206 951257 01.
Date 20th March 1997Our reference PED/pmg/EthicsYour reference
Department Medical Personnel, Postgraduate Medical Centre
Direct Line: 01206 832147Fax No: 01206 851231
Mr Gregory A Benn-Ohikuare2 Sparrow HouseStation RoadBrightlingseaCOLCHESTEREssexCO7 ODT
Dear Mr Benn-Ohijuare
APPROVAL FOR ACCESS TO THE MEDICAL RECORDS OF PATIENTS TO FACILITATE PROPOSED STUDY INTO CHANGES IN CASE MIX FOR ACUTE HOSPITAL ADMISSION IN A MEDICAL SPECIALTY IN COLCHESTER 1991 AND1995
Thank you for your letter. We do need to know the number of the sample size. Your letter also quotes that you will be looking specifically on anecdotal evidence from hospital physicians and consultants in the Public Health Department but you do not state whether these are local Essex Rivers Healthcare Trust consultants.
would be grateful if you could forward to me this information.
Yours sincerely
Dr P E DixonChairmanResearch Ethics Committee
Essex Rivers HealthcareColchester Gener.:1 Hospital, Turner Road, Colchester, Es..ex. C04 5..IL Telephone 01206 853535 Facsimile 01206 832324
gill A . N A T I O N A L H E A L T H S E R V I C E T R U S I Essex Rivers
WAS 674 R

Chief Executive: Nigel Often. MS. FRCS. MIHSM. Chairman: Professor Mike Salmon

NORTH ESSEX HEALTH AUTHORITY
CONFIDENTIALITY FORM
I agree to observe the strictest
confidence with regard to any
information relating to the treatment,
diagnosis and medical history of
patients and any other confidential
information relating either to the
work of the authority or its
employees, that I may have access to,
or accidentally gain knowledge of, in
the course of my duties. I also agree
that I will not make use of any such
information for any purposes
whatsoever outside the
responsibilities of my work.
I understand that a breach of these
rules could lead to serious
disciplinary action being taken
against me.
PLEASE NOTENurses, Midwives and Health Visitors
must be familiar with the guidance
contained in the UKCC Advisory Paper on
CONFIDENTIALITY an elaboration of
Clause 9 of the Second Edition of the
UKCC's Code of Professional Conduct for
the Nurse, Midwife and Health Visitor -
April 1987.
N.B. Two forms to be signed, one to
be retained by the Employee and
one by the Employer.
AvoYeDcriu0 3 1 1 7 7
SignedDate
Related Documents