ASHG EDUCATIONAL SESSION Observational Study Designs Moyses Szklo, MD, MPH, DrPH The Johns Hopkins Bloomberg School of Public Health NOTHING TO DISCLOSE

Welcome message from author
This document is posted to help you gain knowledge. Please leave a comment to let me know what you think about it! Share it to your friends and learn new things together.
Transcript

ASHG EDUCATIONAL SESSION
Observational Study Designs
Moyses Szklo, MD, MPH, DrPHThe Johns Hopkins Bloomberg School of Public Health
NOTHING TO DISCLOSE
• By definition, an observational study is one in which the investigator does not control “assignment” of the potential risk factor of interest (e.g., smoking, cytomegalovirus)
• Good company: Geology, Astrophysics, Ecology, etc.
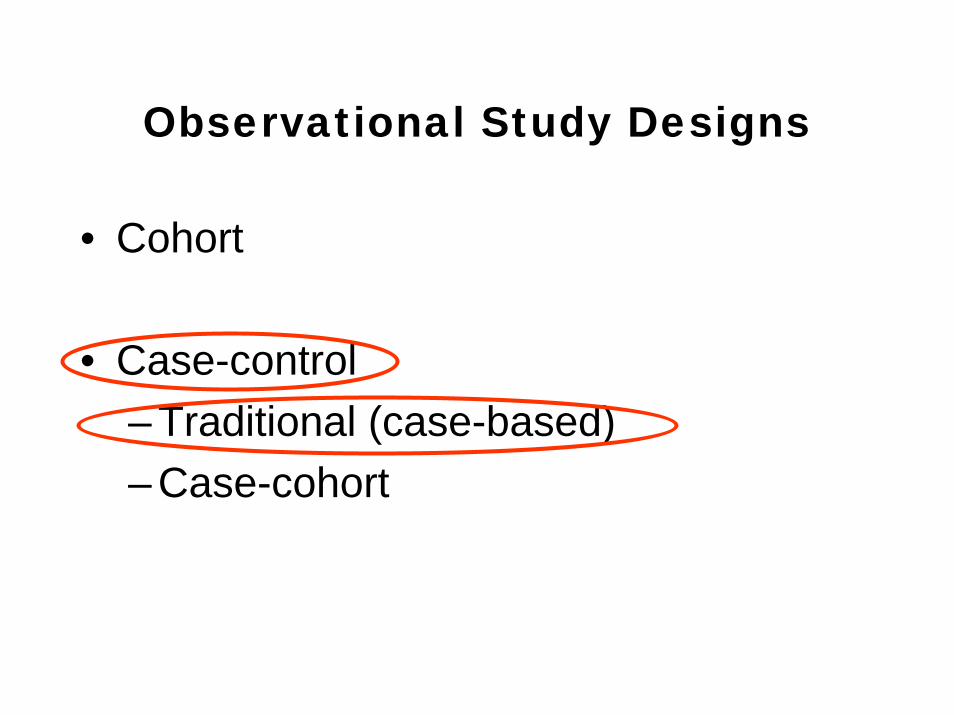
Observational Study Designs

Observational Study Designs
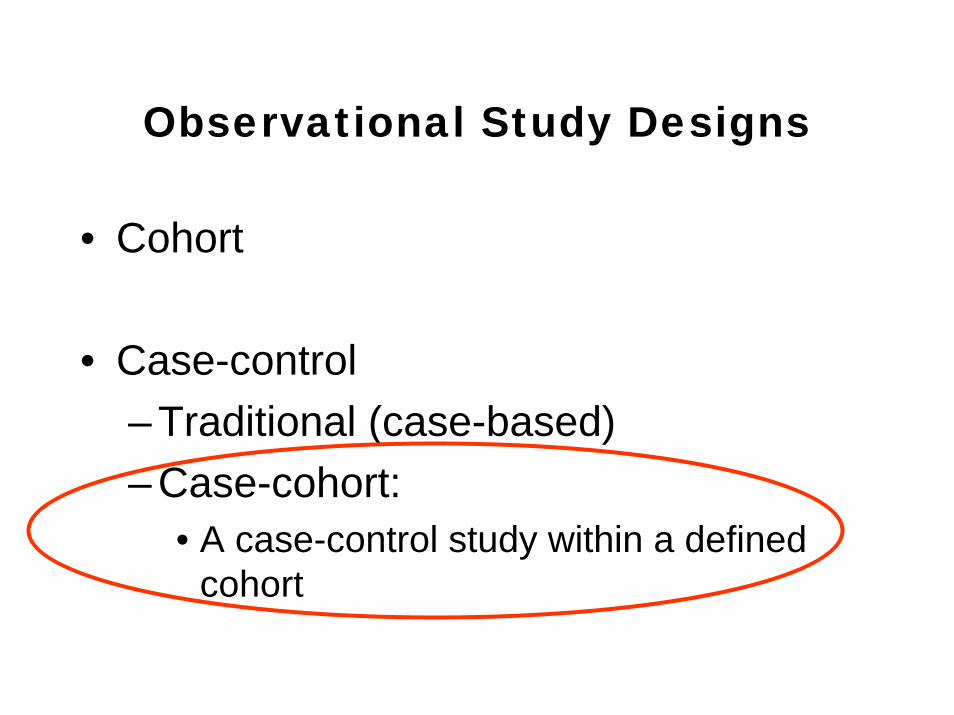
• Cohort
• Case-control– Traditional (case-based) – Case-cohort
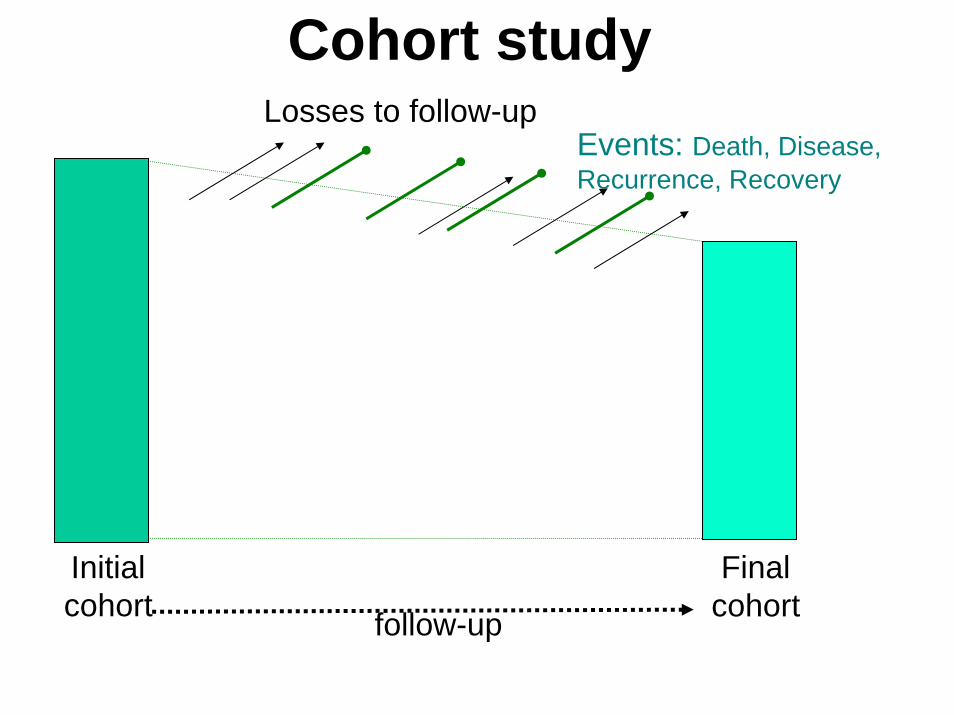
follow-up
Initialcohort
Finalcohort
Events: Death, Disease, Recurrence, Recovery
Losses to follow-up
Cohort study

First, classify cohort by presence of exposure to the suspected risk factor:
2400
1200
Total Non-eventEvent
2376
1140
24
60
Then, follow subjects upto see who developsevent:
Exposure*
Positive
Negative
(*Example: smoking during pregnancy)
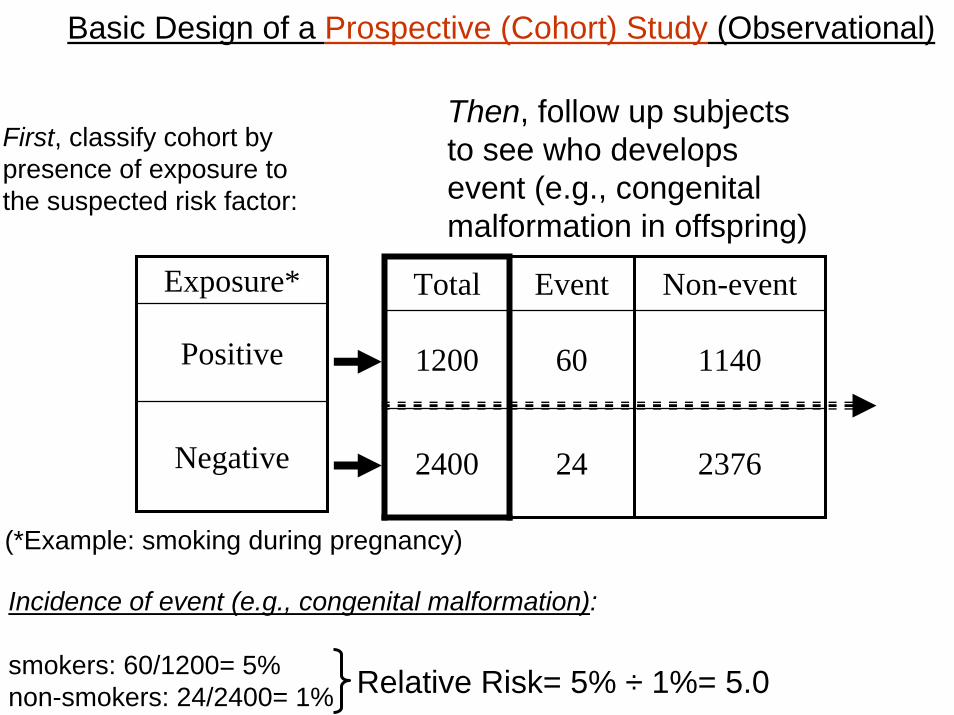
Basic Design of a Prospective (Cohort) Study (Observational)

Basic Design of a Prospective (Cohort) Study (Observational)
2400
1200
Total Non-eventEvent
2376
1140
24
60
Exposure*
Positive
Negative
First, classify cohort by presence of exposure to the suspected risk factor:
(*Example: smoking during pregnancy)

Basic Design of a Prospective (Cohort) Study (Observational)
2400
1200
Total Non-eventEvent
2376
1140
24
60
Then, follow up subjectsto see who developsevent (e.g., congenital malformation in offspring)
Exposure*
Positive
Negative
First, classify cohort by presence of exposure to the suspected risk factor:
(*Example: smoking during pregnancy)
Basic Design of a Prospective (Cohort) Study (Observational)
2400
1200
Total Non-eventEvent
2376
1140
24
60
Then, follow up subjectsto see who developsevent (e.g., congenital malformation in offspring)
Exposure*
Positive
Negative
Incidence of event (e.g., congenital malformation):
smokers: 60/1200= 5%non-smokers: 24/2400= 1%
First, classify cohort by presence of exposure to the suspected risk factor:
Relative Risk= 5% ÷ 1%= 5.0
(*Example: smoking during pregnancy)
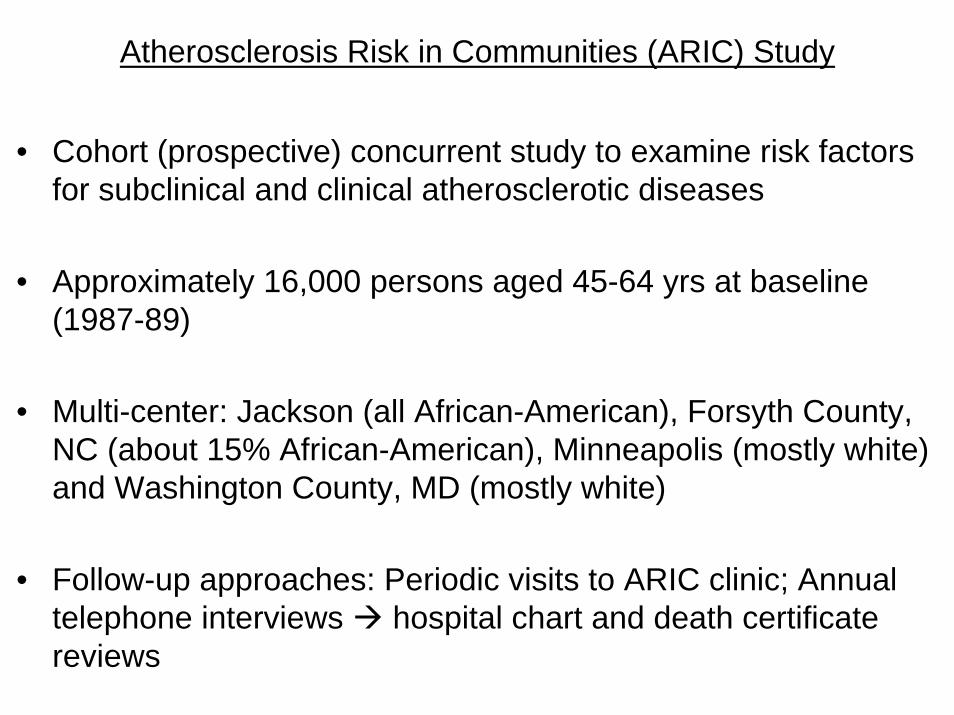
Atherosclerosis Risk in Communities (ARIC) Study
• Cohort (prospective) concurrent study to examine risk factors for subclinical and clinical atherosclerotic diseases
• Approximately 16,000 persons aged 45-64 yrs at baseline (1987-89)
• Multi-center: Jackson (all African-American), Forsyth County, NC (about 15% African-American), Minneapolis (mostly white) and Washington County, MD (mostly white)
• Follow-up approaches: Periodic visits to ARIC clinic; Annual telephone interviews hospital chart and death certificate reviews
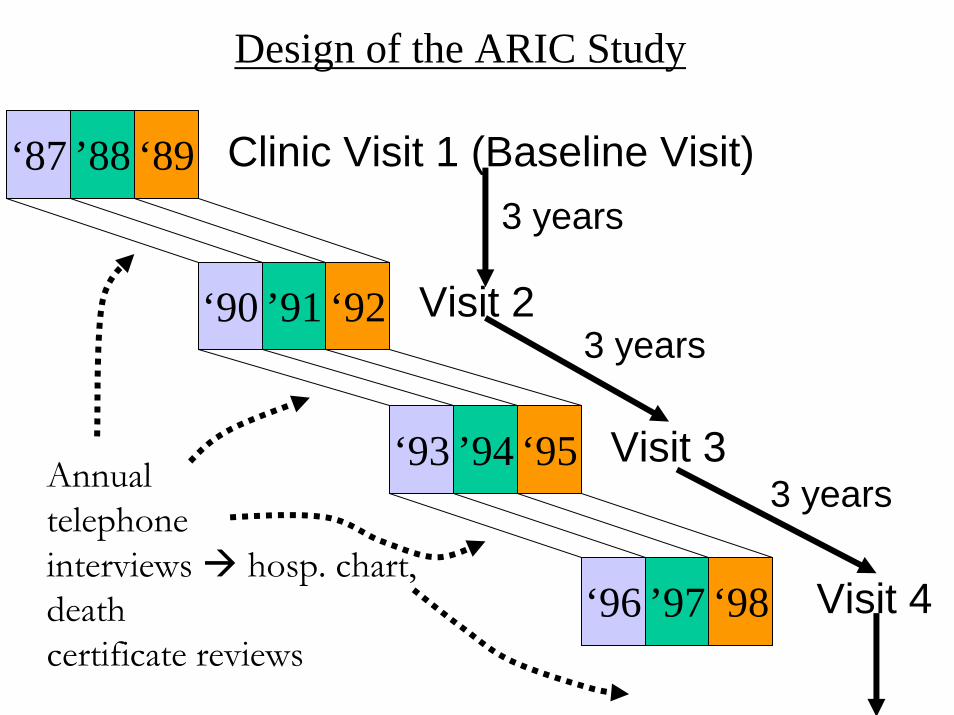
Design of the ARIC Study
‘87 ’88 ‘89 Clinic Visit 1 (Baseline Visit)
‘90 ’91 ‘92
‘93 ’94 ‘95
‘96 ’97 ‘98
Visit 2
3 years
Visit 3
3 years
Visit 4
3 yearsAnnual telephoneinterviews hosp. chart, deathcertificate reviews
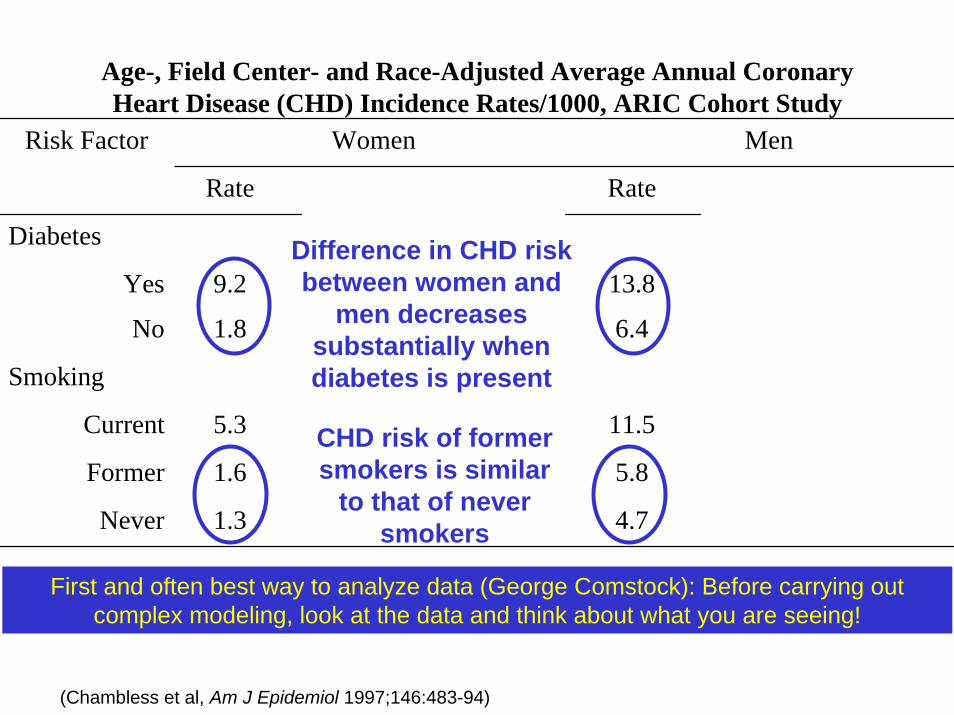
Women Men
Rate RR ARexp/1000 Rate
7.4
Ref.
4.0
0.3
Ref.
RR ARexp/1000
7.4
Ref.
6.8
1.1
Ref.
2.2
1.0
2.4
1.2
1.0
Diabetes
Yes 9.2 5.1 13.8
No 1.8 1.0 6.4
Smoking
Current 5.3 4.1 11.5
Former 1.6 1.2 5.8
Never 1.3 1.0 4.7
Risk Factor
(Chambless et al, Am J Epidemiol 1997;146:483-94)
Age-, Field Center- and Race-Adjusted Average Annual Coronary Heart Disease (CHD) Incidence Rates/1000, ARIC Cohort Study
First and often best way to analyze data (George Comstock): Before carrying out complex modeling, look at the data and think about what you are seeing!
Difference in CHD risk between women and
men decreases substantially when diabetes is present
CHD risk of former smokers is similar
to that of never smokers
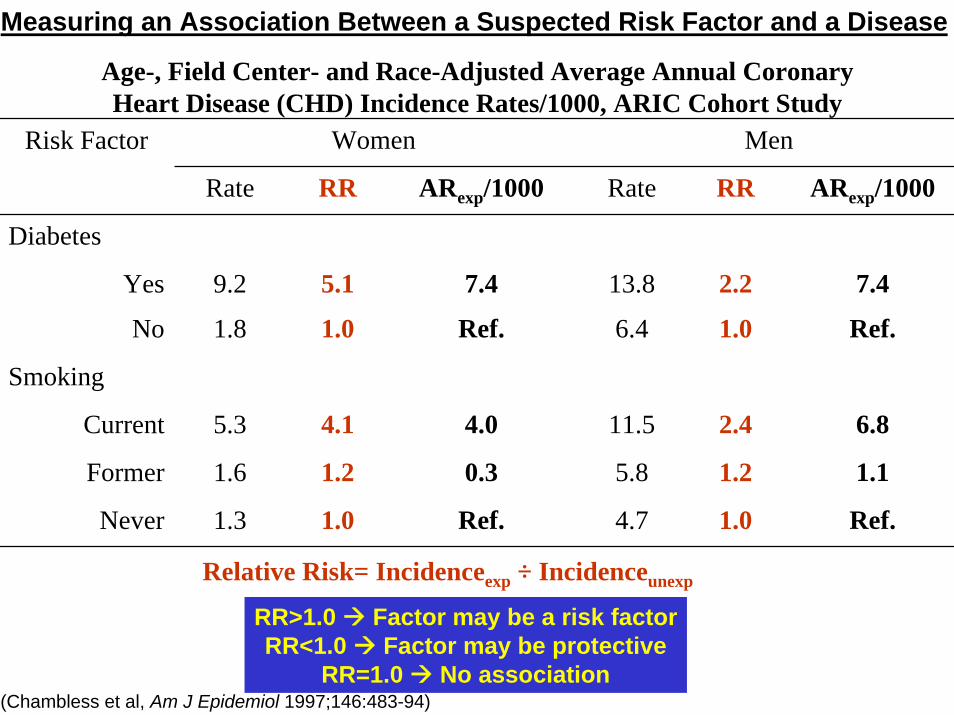
Women Men
Rate RR ARexp/1000 Rate RR ARexp/1000
7.4
Ref.
6.8
1.1
Ref.
7.4
Ref.
4.0
0.3
Ref.
Diabetes
Yes 9.2 5.1 13.8 2.2
No 1.8 1.0 6.4 1.0
Smoking
Current 5.3 4.1 11.5 2.4
Former 1.6 1.2 5.8 1.2
Never 1.3 1.0 4.7 1.0
Risk Factor
(Chambless et al, Am J Epidemiol 1997;146:483-94)
RR>1.0 Factor may be a risk factorRR<1.0 Factor may be protective
RR=1.0 No association
Relative Risk= Incidenceexp ÷ Incidenceunexp
Age-, Field Center- and Race-Adjusted Average Annual Coronary Heart Disease (CHD) Incidence Rates/1000, ARIC Cohort Study
Measuring an Association Between a Suspected Risk Factor and a Disease
Observational Study Designs
• Cohort
• Case-control– Traditional (case-based) – Case-cohort
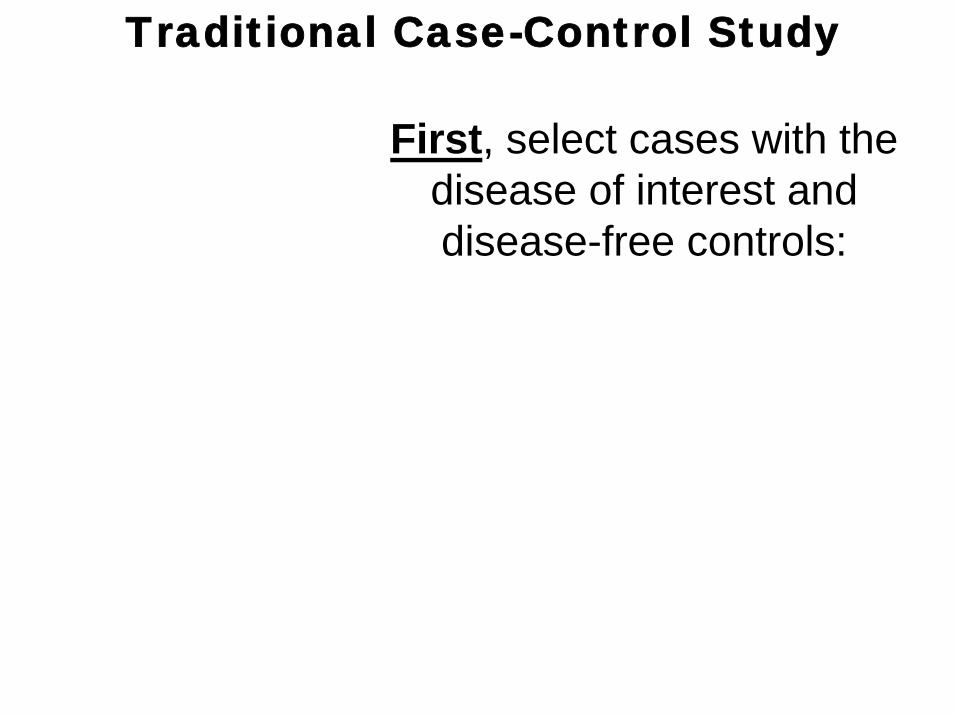
First, select cases with the disease of interest and disease-free controls:
Traditional Case-Control Study
Cases ControlsExposed a bUnexposed c dTotal a + c b + d
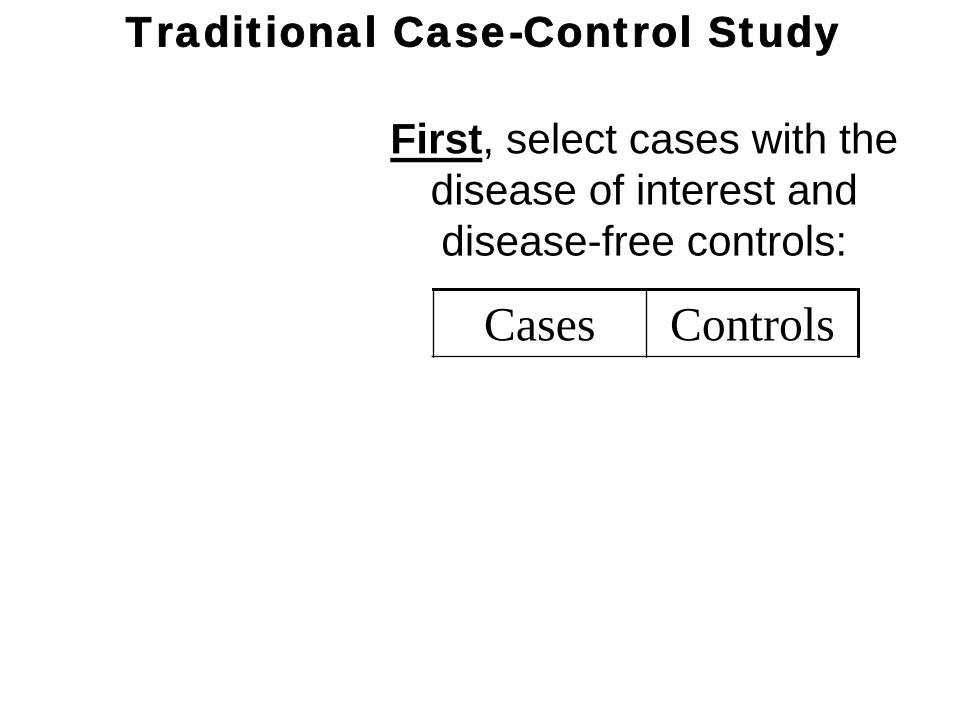
First, select cases with the disease of interest and disease-free controls:
Traditional Case-Control Study
Cases ControlsExposed a bUnexposed c dTotal a + c b + d
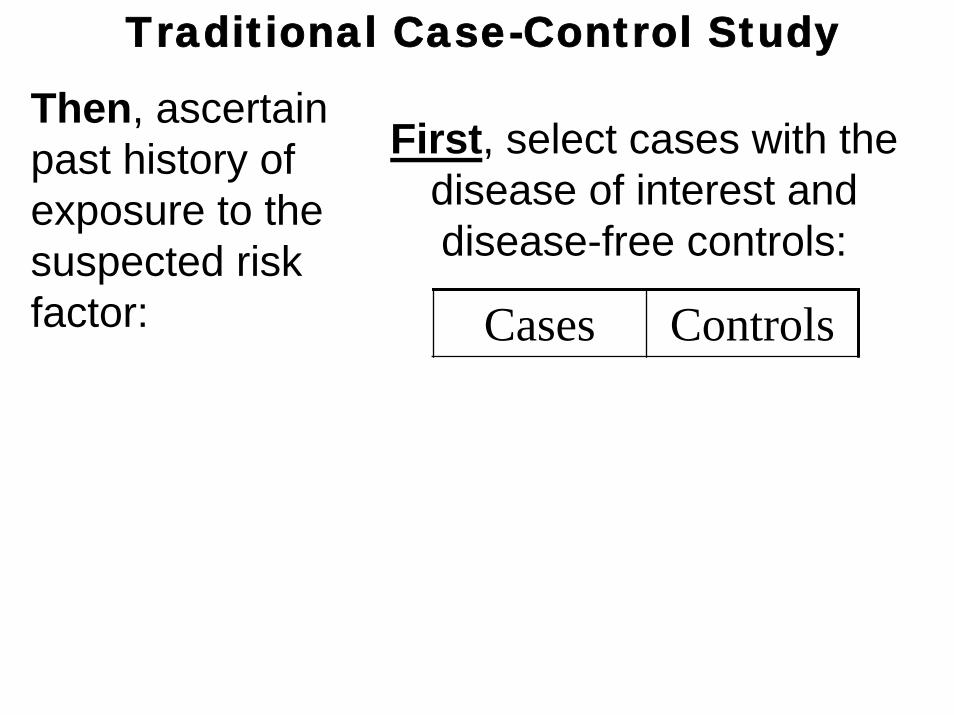
First, select cases with the disease of interest and disease-free controls:
Traditional Case-Control Study
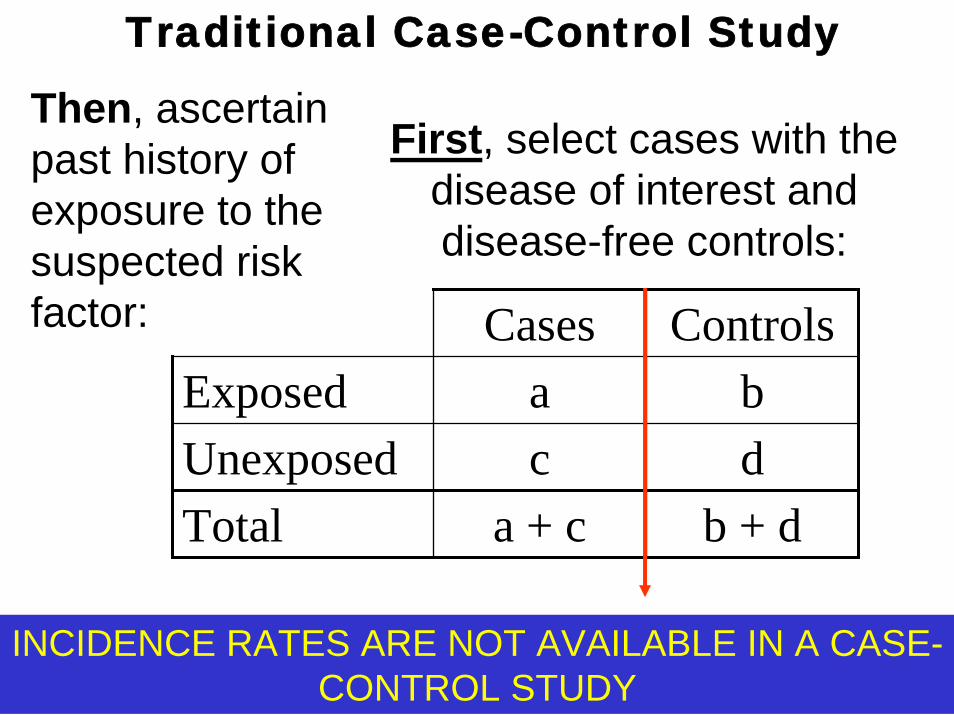
Then, ascertain past history of exposure to the suspected risk factor:
Cases ControlsExposed a bUnexposed c dTotal a + c b + d
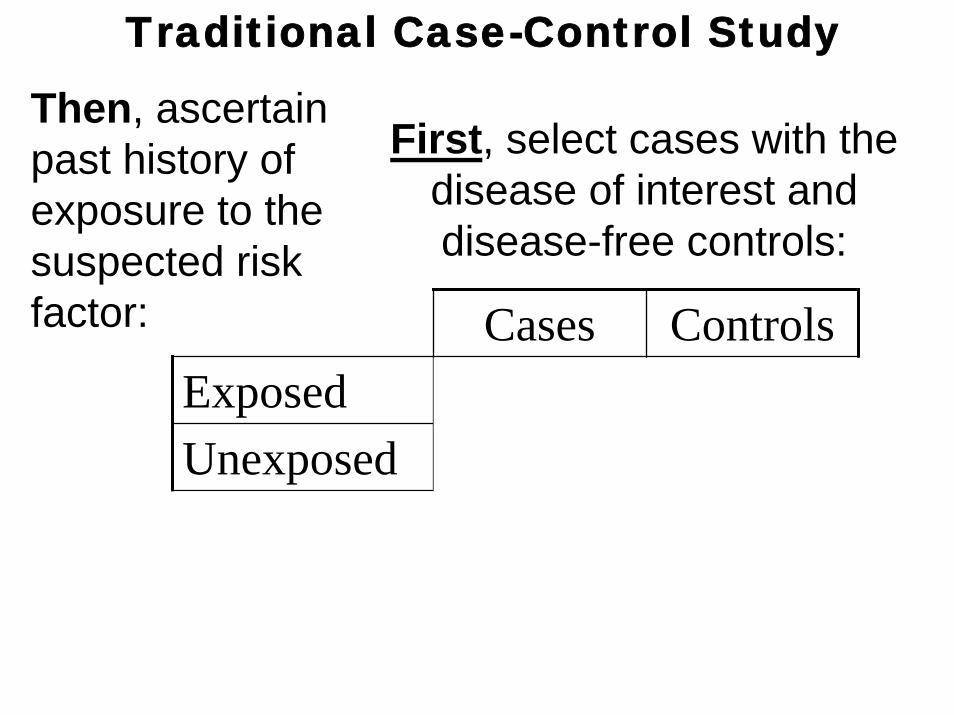
First, select cases with the disease of interest and disease-free controls:
Traditional Case-Control Study
Then, ascertain past history of exposure to the suspected risk factor:
Cases ControlsExposed a bUnexposed c dTotal a + c b + d
First, select cases with the disease of interest and disease-free controls:
Then, ascertain past history of exposure to the suspected risk factor:
Traditional Case-Control Study
INCIDENCE RATES ARE NOT AVAILABLE IN A CASE-CONTROL STUDY

Design Known variable at study’s outset
Unknown variable the study wishes
to ascertainCohort Presence of exposure to
a suspected genetic or environmental risk factor
Incidence of the event (disease)
Case-control Case-control status Past exposure to suspected risk factor

For the traditional case-control study, the most important concept is that sampling of subjects for inclusion occurs
at the end of a potential causal process
Design Known variable at study’s outset
Unknown variable the study wishes
to ascertainCohort Presence of exposure to
a suspected genetic or environmental risk factor
Incidence of the event (disease)
Case-control Case-control status Past exposure to suspected risk factor
Risk factor Disease
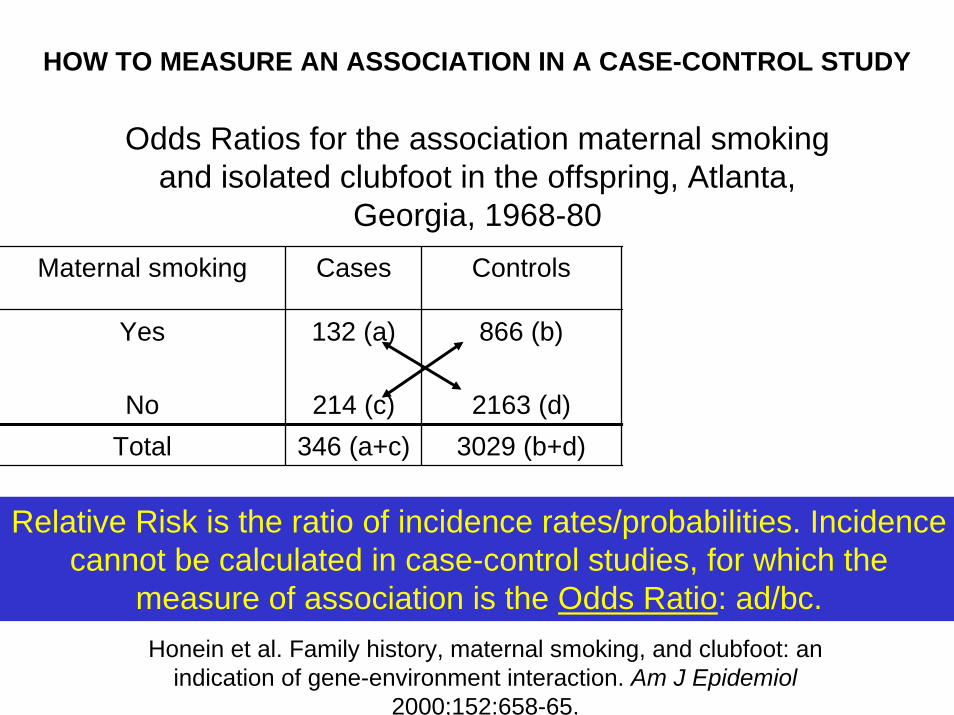
Maternal smoking Cases Controls OR
Yes 132 (a) 866 (b) (132 × 2163) ÷ 866 ×2163= 1.54
Total 346 (a+c) 3029 (b+d) 3375No 214 (c) 2163 (d)
Honein et al. Family history, maternal smoking, and clubfoot: an indication of gene-environment interaction. Am J Epidemiol
2000;152:658-65.
Odds Ratios for the association maternal smoking and isolated clubfoot in the offspring, Atlanta,
Georgia, 1968-80
Relative Risk is the ratio of incidence rates/probabilities. Incidence cannot be calculated in case-control studies, for which the
measure of association is the Odds Ratio: ad/bc.
HOW TO MEASURE AN ASSOCIATION IN A CASE-CONTROL STUDY
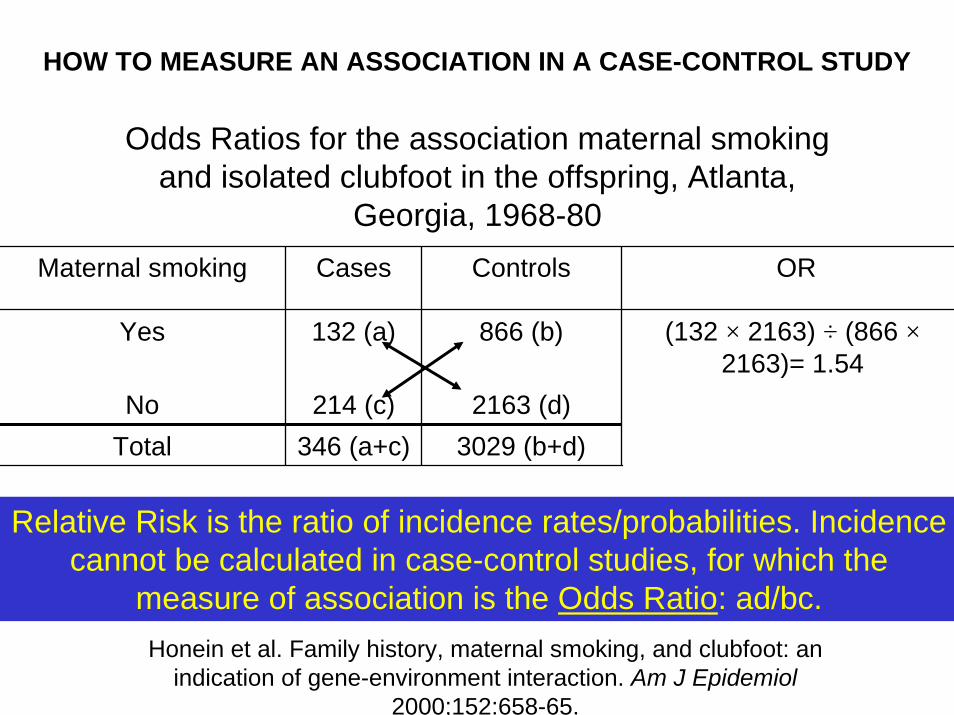
Maternal smoking Cases Controls OR
Yes 132 (a) 866 (b) (132 × 2163) ÷ (866 ×2163)= 1.54
Total 346 (a+c) 3029 (b+d) 3375No 214 (c) 2163 (d)
Honein et al. Family history, maternal smoking, and clubfoot: an indication of gene-environment interaction. Am J Epidemiol
2000;152:658-65.
Odds Ratios for the association maternal smoking and isolated clubfoot in the offspring, Atlanta,
Georgia, 1968-80
Relative Risk is the ratio of incidence rates/probabilities. Incidence cannot be calculated in case-control studies, for which the
measure of association is the Odds Ratio: ad/bc.
HOW TO MEASURE AN ASSOCIATION IN A CASE-CONTROL STUDY
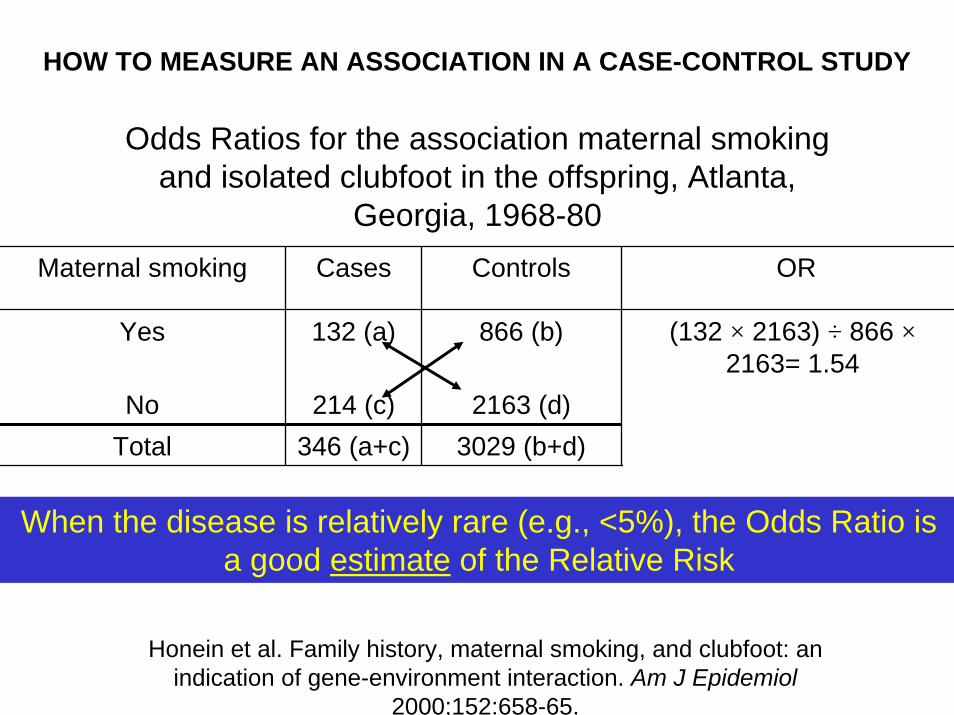
Maternal smoking Cases Controls OR
Yes 132 (a) 866 (b) (132 × 2163) ÷ 866 ×2163= 1.54
Total 346 (a+c) 3029 (b+d) 3375No 214 (c) 2163 (d)
Honein et al. Family history, maternal smoking, and clubfoot: an indication of gene-environment interaction. Am J Epidemiol
2000;152:658-65.
Odds Ratios for the association maternal smoking and isolated clubfoot in the offspring, Atlanta,
Georgia, 1968-80
When the disease is relatively rare (e.g., <5%), the Odds Ratio is a good estimate of the Relative Risk
HOW TO MEASURE AN ASSOCIATION IN A CASE-CONTROL STUDY
Observational Study Designs
• Cohort
• Case-control– Traditional (case-based) – Case-cohort:
• A case-control study within a defined cohort
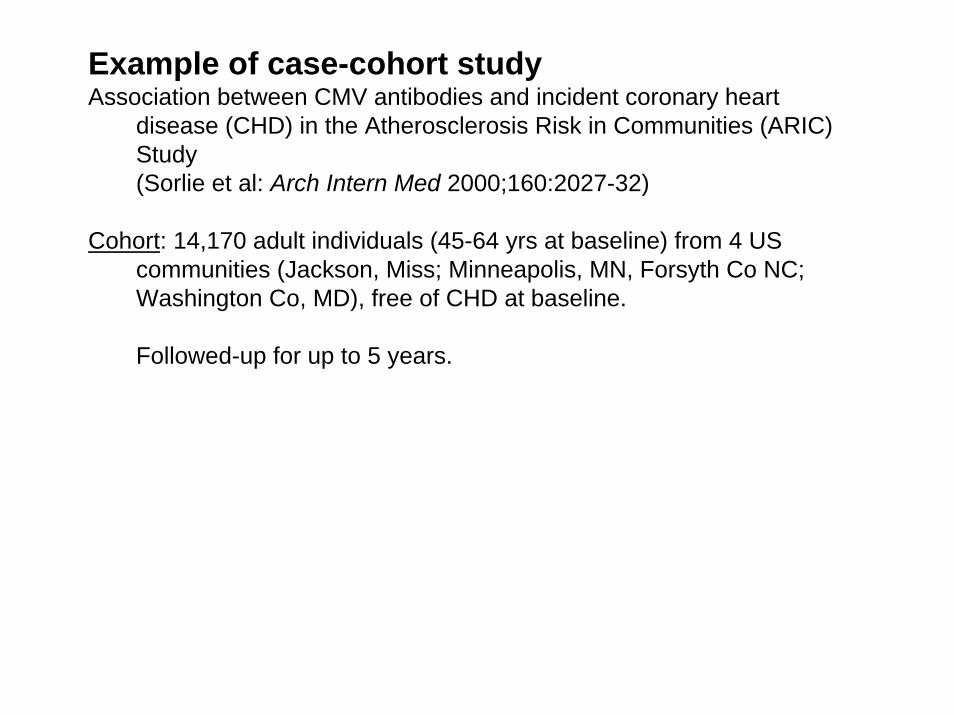
Example of case-cohort studyAssociation between CMV antibodies and incident coronary heart
disease (CHD) in the Atherosclerosis Risk in Communities (ARIC) Study (Sorlie et al: Arch Intern Med 2000;160:2027-32)
Cohort: 14,170 adult individuals (45-64 yrs at baseline) from 4 US communities (Jackson, Miss; Minneapolis, MN, Forsyth Co NC; Washington Co, MD), free of CHD at baseline.
Followed-up for up to 5 years.
• Cases: 221 incident CHD cases• Controls: Random sample from baseline cohort, n=515 (included 10
subsequent cases).
“The population with the highest antibody levels of CMV (approximately the upper 20%) showed an increased relative risk (RR) of CHD of 1.76 (95% confidence interval, 1.00-3.11), adjusting for age, sex, and race.”
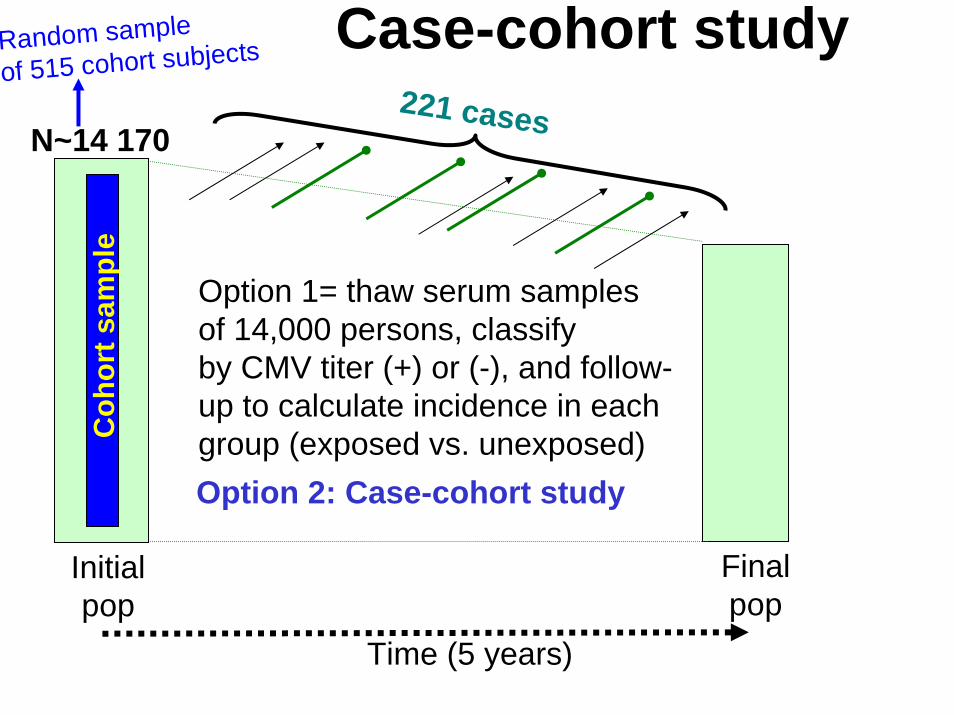
Time (5 years)
Finalpop
Initialpop
Case-cohort study
N~14 170221 cases
Option 1= thaw serum samplesof 14,000 persons, classifyby CMV titer (+) or (-), and follow-up to calculate incidence in eachgroup (exposed vs. unexposed)Option 2: Case-cohort study
Random sample
of 515 cohort subjects
Coh
ort s
ampl
e
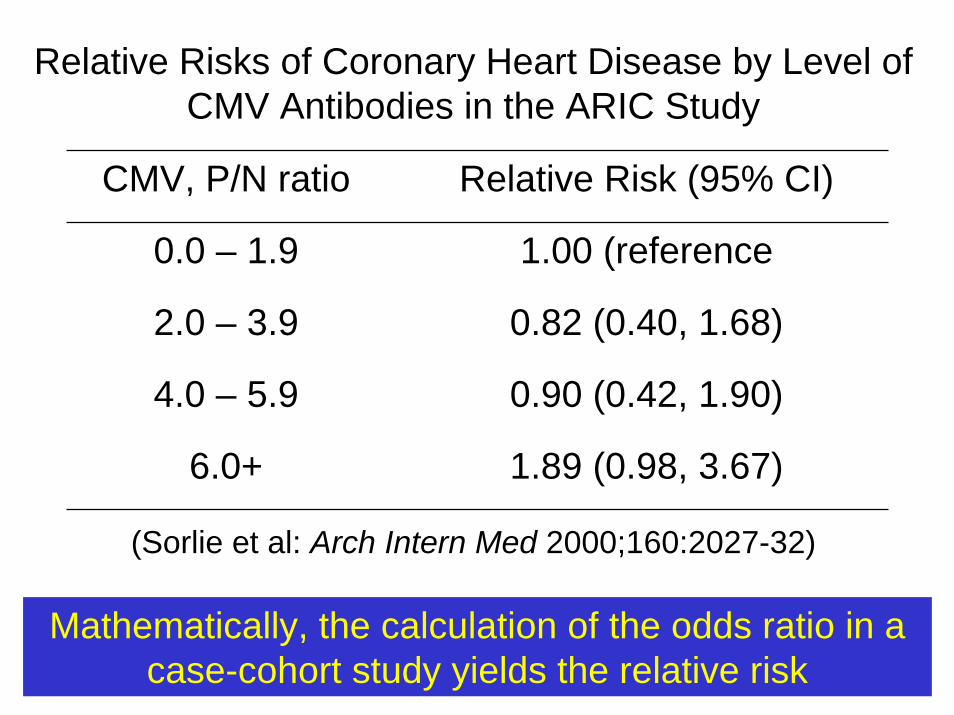
Relative Risks of Coronary Heart Disease by Level of CMV Antibodies in the ARIC Study
CMV, P/N ratio Relative Risk (95% CI)
0.0 – 1.9 1.00 (reference
2.0 – 3.9 0.82 (0.40, 1.68)
4.0 – 5.9 0.90 (0.42, 1.90)
6.0+ 1.89 (0.98, 3.67)
(Sorlie et al: Arch Intern Med 2000;160:2027-32)
Mathematically, the calculation of the odds ratio in a case-cohort study yields the relative risk
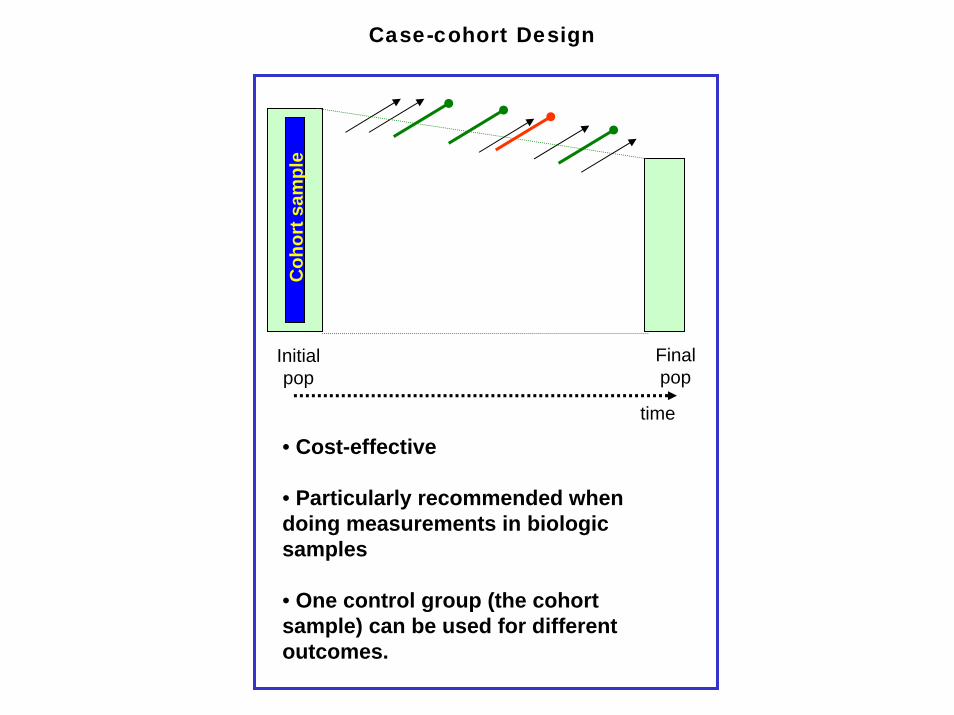
Finalpop
Initialpop
• Cost-effective
• Particularly recommended when doing measurements in biologic samples
• One control group (the cohort sample) can be used for different outcomes.
Case-cohort Design
Coh
ort s
ampl
e
time
Family history of clubfoot
Maternal smoking
Cases Controls Stratified ORs
Yes Yes 14 7 3.64
1.45No 11 20
No Yes 118 859No 203 2,143
Honein et al. Family history, maternal smoking, and clubfoot: an indication of gene-environment interaction. Am J Epidemiol
2000;152:658-65.
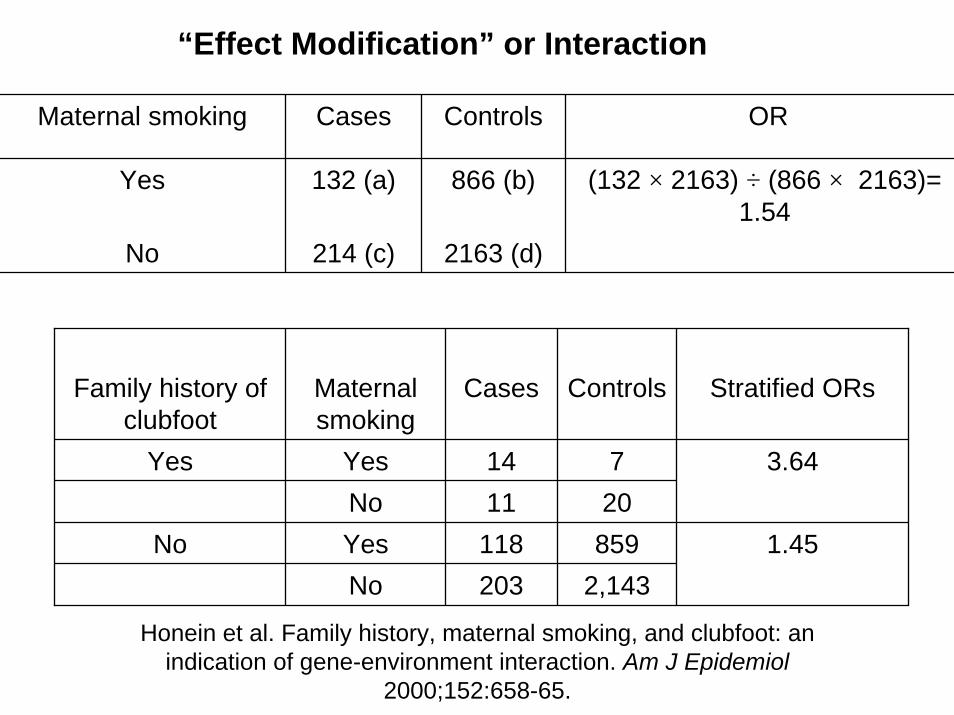
“Effect Modification” or Interaction
Maternal smoking Cases Controls OR
Yes 132 (a) 866 (b) (132 × 2163) ÷ (866 × 2163)= 1.54
No 214 (c) 2163 (d)

Family history of clubfoot
Maternal smoking
Cases Controls Stratified ORs
Yes Yes 14 7 3.64No 11 20
1.45No Yes 118 859No 203 2,143
Honein et al. Family history, maternal smoking, and clubfoot: an indication of gene-environment interaction. Am J Epidemiol
2000;152:658-65.
“Effect Modification” or Interaction
Maternal smoking Cases Controls OR
Yes 132 (a) 866 (b) (132 × 2163) ÷ (866 × 2163)= 1.54
No 214 (c) 2163 (d)

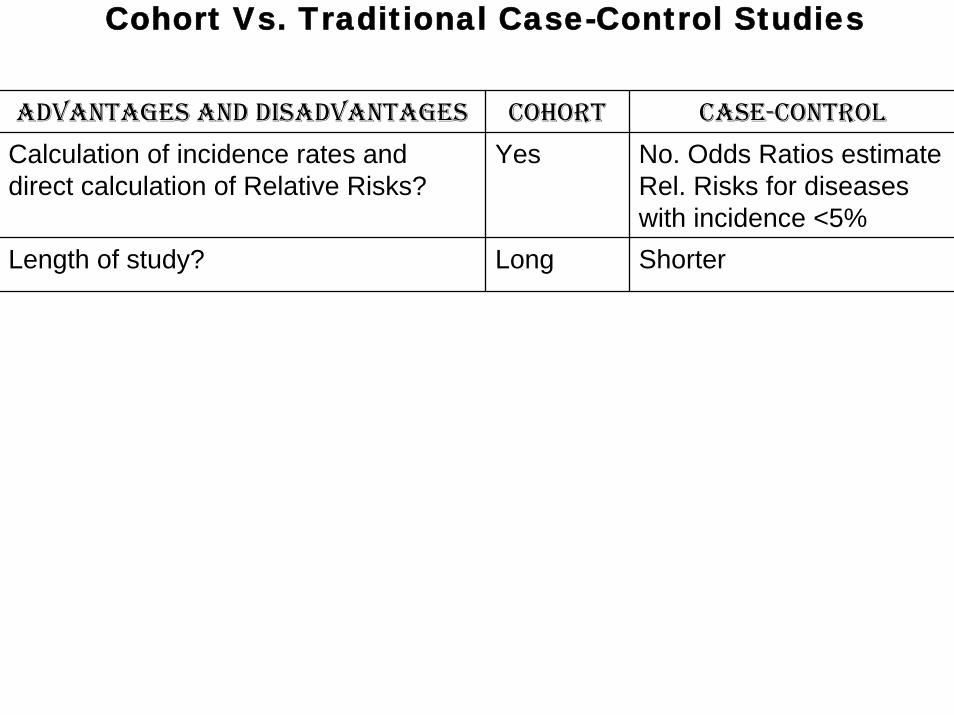
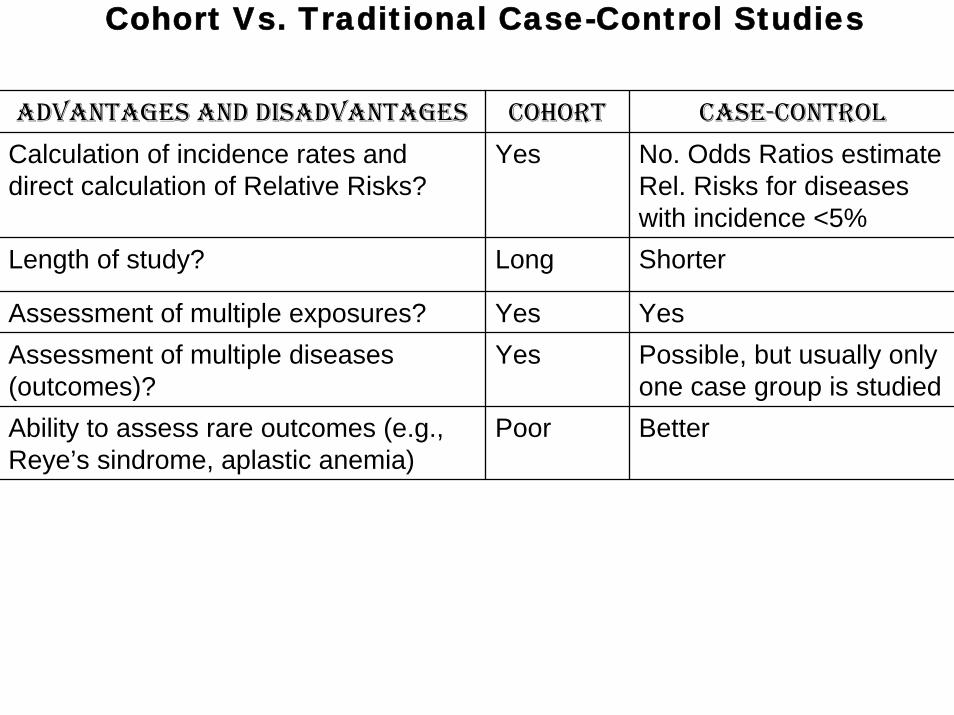
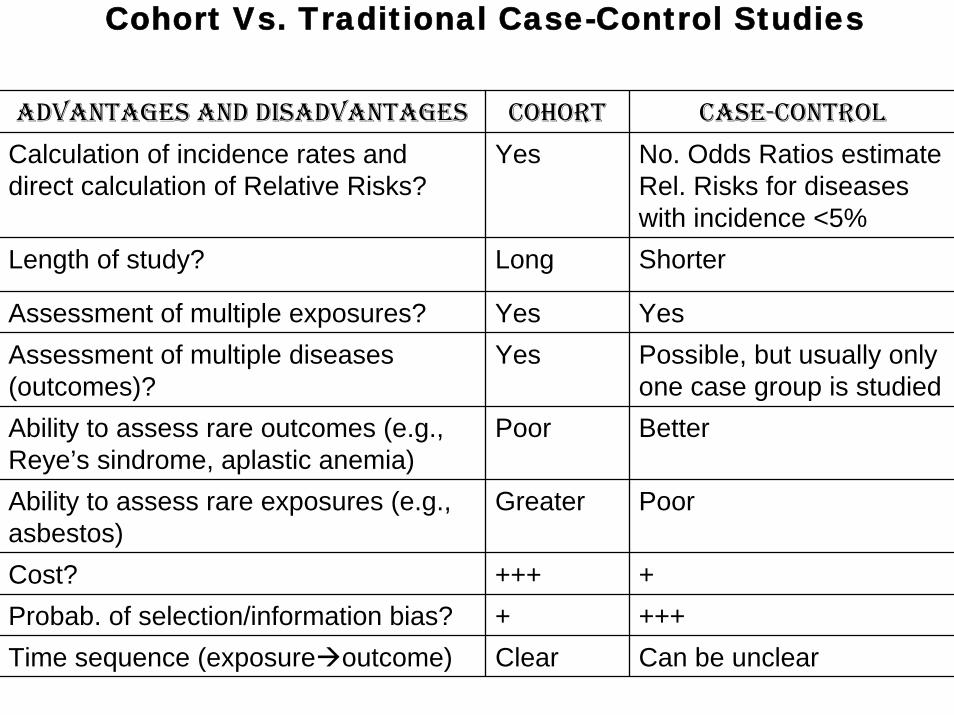
ADVANTAGES AND DISADVANTAGES COHORT CASE-CONTROL
Calculation of incidence rates and direct calculation of Relative Risks?
Yes No. Odds Ratios estimate Rel. Risks for diseases with incidence <5%
Cohort Vs. Traditional Case-Control Studies
ADVANTAGES AND DISADVANTAGES COHORT CASE-CONTROL
Calculation of incidence rates and direct calculation of Relative Risks?
Yes No. Odds Ratios estimate Rel. Risks for diseases with incidence <5%ShorterLength of study? Long
Cohort Vs. Traditional Case-Control Studies
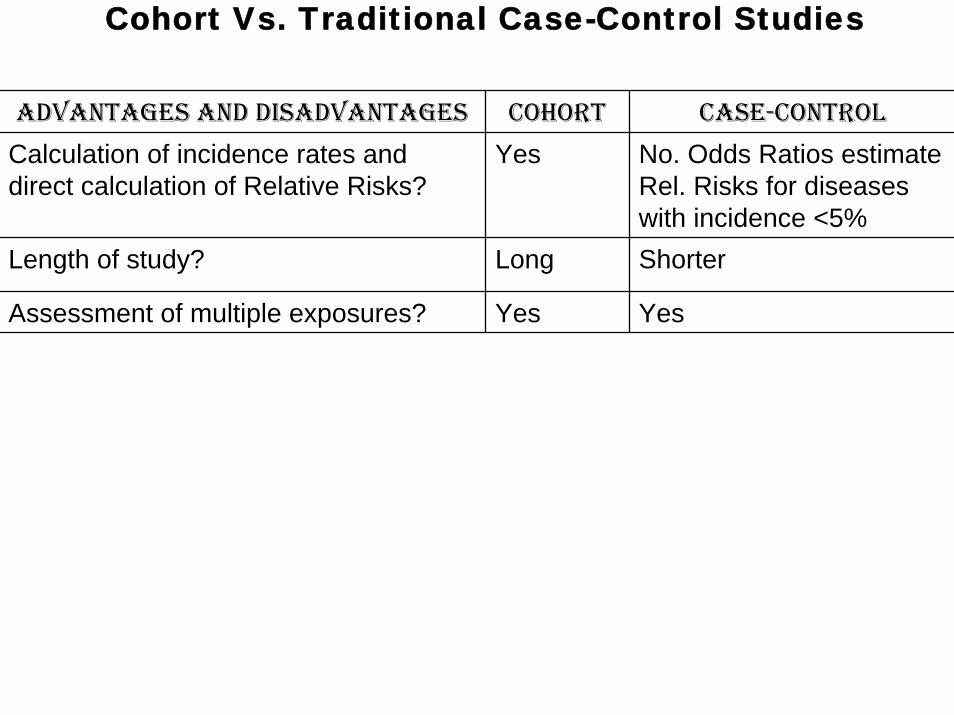
ADVANTAGES AND DISADVANTAGES COHORT CASE-CONTROL
Calculation of incidence rates and direct calculation of Relative Risks?
Yes No. Odds Ratios estimate Rel. Risks for diseases with incidence <5%Shorter
Assessment of multiple exposures? Yes Yes
Length of study? Long
Cohort Vs. Traditional Case-Control Studies

ADVANTAGES AND DISADVANTAGES COHORT CASE-CONTROL
Calculation of incidence rates and direct calculation of Relative Risks?
Yes No. Odds Ratios estimate Rel. Risks for diseases with incidence <5%Shorter
Assessment of multiple exposures? Yes YesPossible, but usually only one case group is studied
Length of study? Long
Assessment of multiple diseases (outcomes)?
Yes
Cohort Vs. Traditional Case-Control Studies
ADVANTAGES AND DISADVANTAGES COHORT CASE-CONTROL
Calculation of incidence rates and direct calculation of Relative Risks?
Yes No. Odds Ratios estimate Rel. Risks for diseases with incidence <5%Shorter
Assessment of multiple exposures? Yes YesPossible, but usually only one case group is studied
Ability to assess rare outcomes (e.g., Reye’s sindrome, aplastic anemia)
Poor Better
Length of study? Long
Assessment of multiple diseases (outcomes)?
Yes
Cohort Vs. Traditional Case-Control Studies
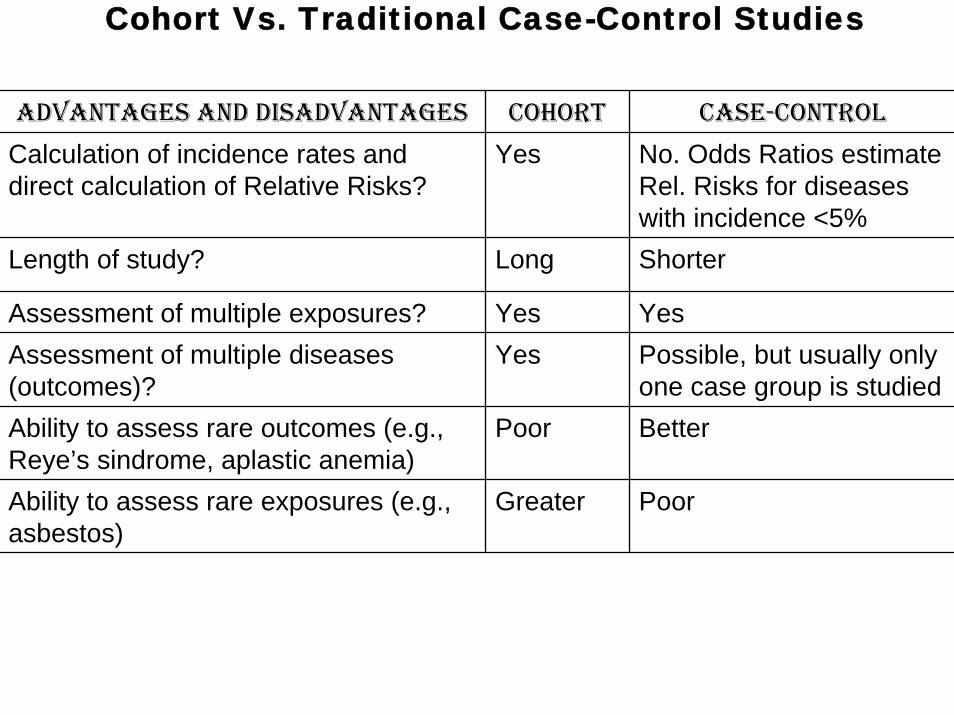
ADVANTAGES AND DISADVANTAGES COHORT CASE-CONTROL
Calculation of incidence rates and direct calculation of Relative Risks?
Yes No. Odds Ratios estimate Rel. Risks for diseases with incidence <5%Shorter
Assessment of multiple exposures? Yes YesPossible, but usually only one case group is studied
Ability to assess rare outcomes (e.g., Reye’s sindrome, aplastic anemia)
Poor Better
Ability to assess rare exposures (e.g., asbestos)
Greater Poor
Length of study? Long
Assessment of multiple diseases (outcomes)?
Yes
Cohort Vs. Traditional Case-Control Studies
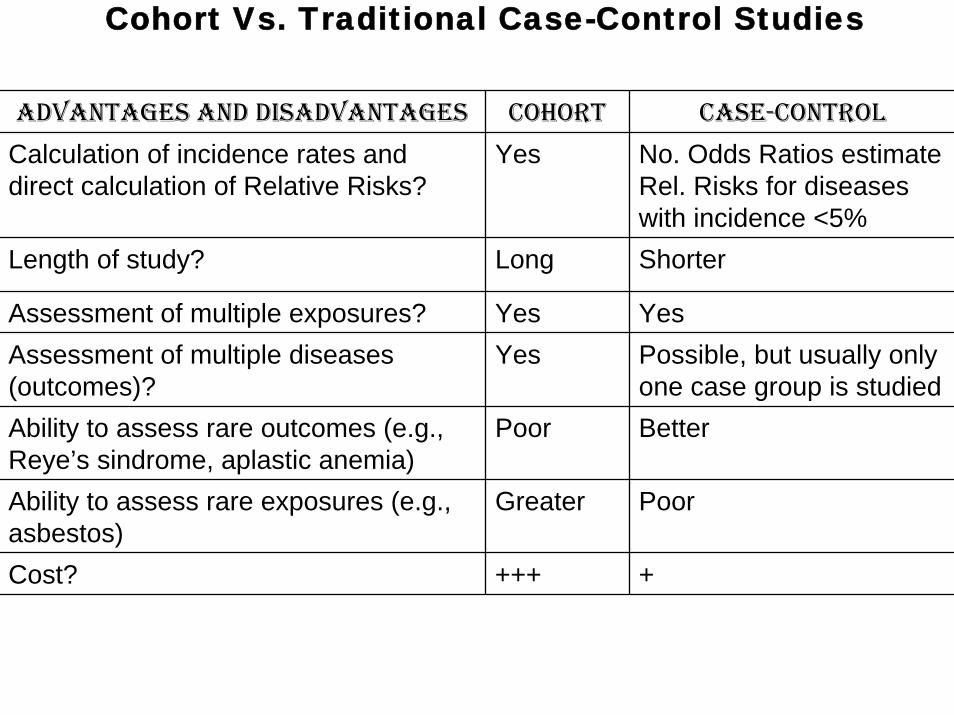
ADVANTAGES AND DISADVANTAGES COHORT CASE-CONTROL
Calculation of incidence rates and direct calculation of Relative Risks?
Yes No. Odds Ratios estimate Rel. Risks for diseases with incidence <5%Shorter
Assessment of multiple exposures? Yes YesPossible, but usually only one case group is studied
Ability to assess rare outcomes (e.g., Reye’s sindrome, aplastic anemia)
Poor Better
Ability to assess rare exposures (e.g., asbestos)
Greater Poor
+
Length of study? Long
Assessment of multiple diseases (outcomes)?
Yes
Cost? +++
Cohort Vs. Traditional Case-Control Studies
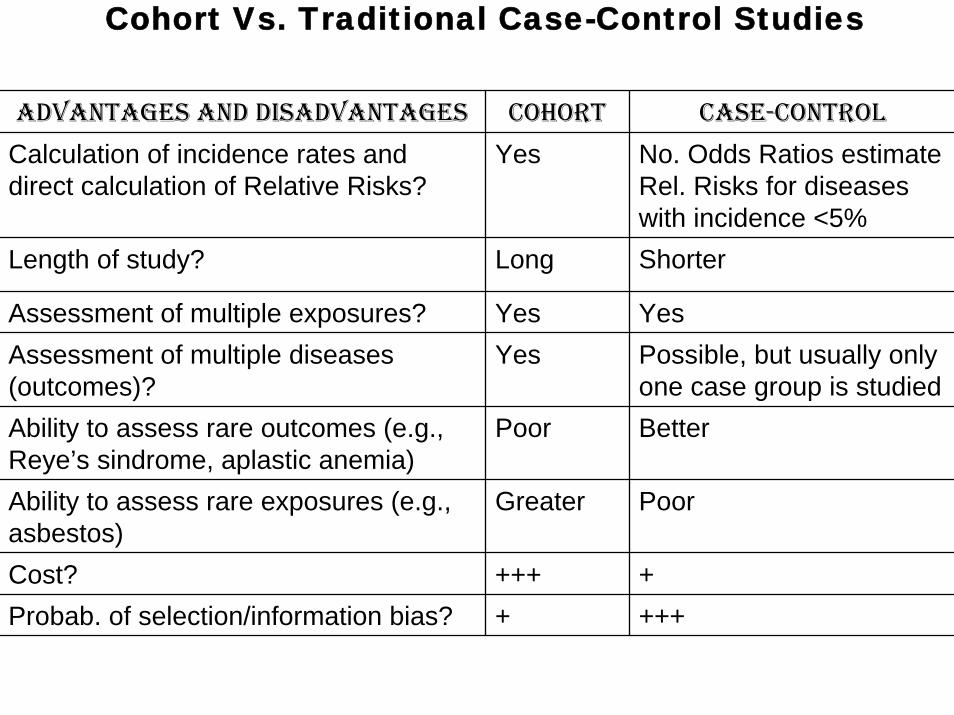
ADVANTAGES AND DISADVANTAGES COHORT CASE-CONTROL
Calculation of incidence rates and direct calculation of Relative Risks?
Yes No. Odds Ratios estimate Rel. Risks for diseases with incidence <5%Shorter
Assessment of multiple exposures? Yes YesPossible, but usually only one case group is studied
Ability to assess rare outcomes (e.g., Reye’s sindrome, aplastic anemia)
Poor Better
Ability to assess rare exposures (e.g., asbestos)
Greater Poor
++++
Length of study? Long
Assessment of multiple diseases (outcomes)?
Yes
Cost? +++Probab. of selection/information bias? +
Cohort Vs. Traditional Case-Control Studies
ADVANTAGES AND DISADVANTAGES COHORT CASE-CONTROL
Calculation of incidence rates and direct calculation of Relative Risks?
Yes No. Odds Ratios estimate Rel. Risks for diseases with incidence <5%Shorter
Assessment of multiple exposures? Yes YesPossible, but usually only one case group is studied
Ability to assess rare outcomes (e.g., Reye’s sindrome, aplastic anemia)
Poor Better
Ability to assess rare exposures (e.g., asbestos)
Greater Poor
Time sequence (exposure outcome) Clear Can be unclear
++++
Length of study? Long
Assessment of multiple diseases (outcomes)?
Yes
Cost? +++Probab. of selection/information bias? +
Cohort Vs. Traditional Case-Control Studies
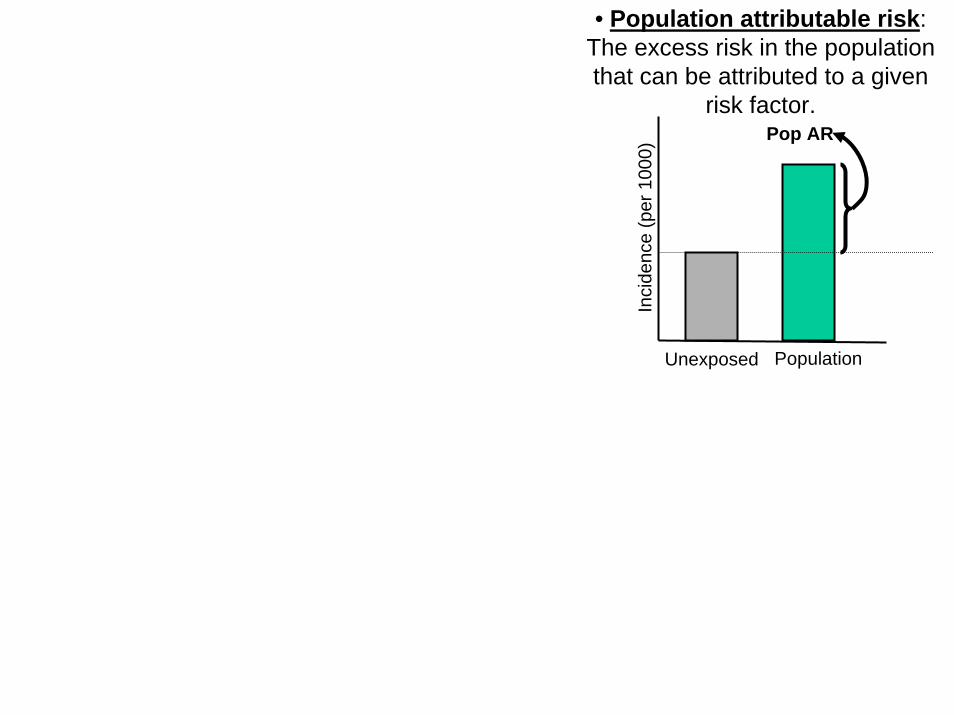
• Population attributable risk: The excess risk in the population that can be attributed to a given
risk factor.
Inci
denc
e (p
er 1
000)
Unexposed
Pop AR
Population
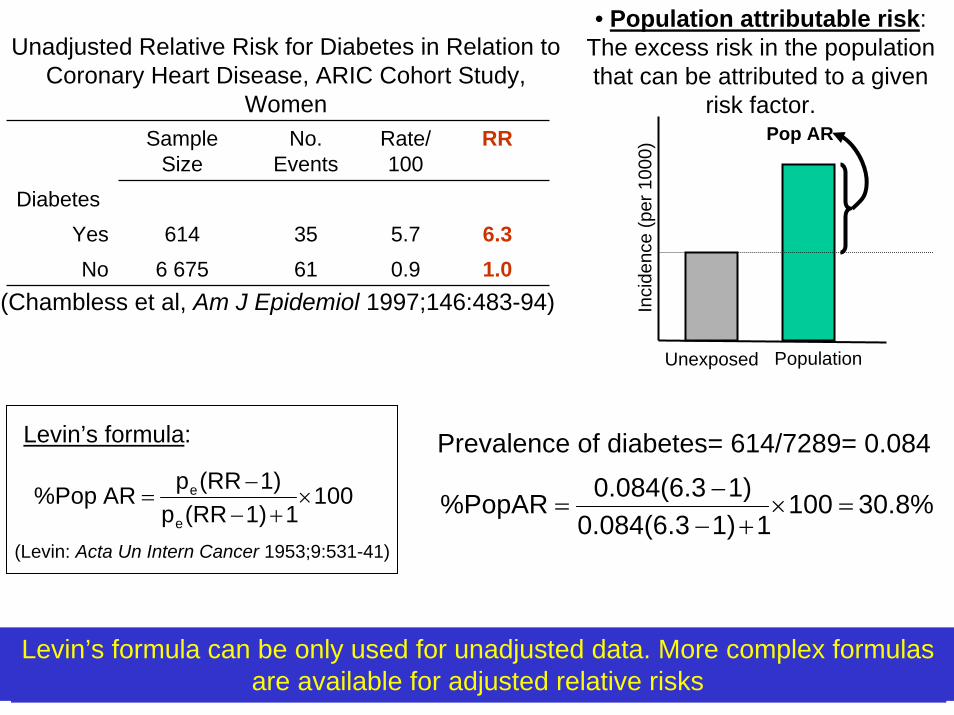
Sample Size
No. Events
Rate/100
5.70.9
3561
RR
DiabetesYes 614 6.3No 6 675 1.0
(Chambless et al, Am J Epidemiol 1997;146:483-94)
Unadjusted Relative Risk for Diabetes in Relation to Coronary Heart Disease, ARIC Cohort Study,
Women
Prevalence of diabetes= 614/7289= 0.084
30.8%10011)0.084(6.3
1)0.084(6.3%PopAR =×+−
−=
The %PopAR should be calculated only when there is reasonable certainty that the association is causal
10011)(RRp
1)(RRp AR%Pope
e ×+−
−=
(Levin: Acta Un Intern Cancer 1953;9:531-41)
Levin’s formula:
Levin’s formula can be only used for unadjusted data. More complex formulas are available for adjusted relative risks
• Population attributable risk: The excess risk in the population that can be attributed to a given
risk factor.
Inci
denc
e (p
er 1
000)
Unexposed
Pop AR
Population
Related Documents