UNIVERSITY OF CALIFORNIA COOPERATIVE EXTENSION 2015 SAMPLE COSTS TO PRODUCE SILAGE CORN CONSERVATION TILLAGE IN THE NORTHERN SAN JOAQUIN VALLEY Prepared by: Jeff Mitchell Cropping Systems Specialist in Cooperative Extension, Kearney Agricultural Research and Extension Center, Parlier, CA. Karen Klonsky Specialist in Cooperative Extension, Department of Agricultural and Resource Economics, UC Davis Don Stewart Staff Research Associate, Department of Agriculture and Resource Economics, UC Davis.

Welcome message from author
This document is posted to help you gain knowledge. Please leave a comment to let me know what you think about it! Share it to your friends and learn new things together.
Transcript

UNIVERSITY OF CALIFORNIA COOPERATIVE EXTENSION
2015
SAMPLE COSTS TO PRODUCE
SILAGE CORN CONSERVATION TILLAGE
IN THE
NORTHERN SAN JOAQUIN VALLEY Prepared by: Jeff Mitchell Cropping Systems Specialist in Cooperative Extension, Kearney Agricultural Research and
Extension Center, Parlier, CA. Karen Klonsky Specialist in Cooperative Extension, Department of Agricultural and Resource Economics, UC Davis Don Stewart Staff Research Associate, Department of Agriculture and Resource Economics, UC Davis.

2015 Silage Corn-Conservation Tillage Northern San Joaquin Valley UC Cooperative Extension 2
UNIVERSITY OF CALIFORNIA COOPERATIVE EXTENSION
SAMPLE COSTS TO PRODUCE SILAGE CORN CONSERVATION TILLAGE PRACTICES
San Joaquin Valley – North 2015
STUDY CONTENTS
INTRODUCTION 2 ASSUMPTIONS 3 Conservation Tillage Practices 3 Cultural Practices and Material Inputs 3 Labor, Equipment and Interest 5 Cash Overhead 6 Non-Cash Overhead 6 REFERENCES 8 Table 1. COSTS PER ACRE to PRODUCE SILAGE CORN 9 Table 2. COSTS and RETURNS PER ACRE to PRODUCE SILAGE CORN 10 Table 3. MONTHLY CASH COSTS PER ACRE to PRODUCE SILAGE CORN 12 Table 4. RANGING ANALYSIS 13 Table 5. WHOLE FARM ANNUAL EQUIPMENT, INVESTMENT and OVERHEAD COSTS 14 Table 6. HOURLY EQUIPMENT COSTS 14 Table 7. OPERATIONS WITH EQUIPMENT and MATERIALS 15
INTRODUCTION
Sample costs to produce double cropped silage corn using conservation tillage practices in the northern San Joaquin Valley are shown in this study. The study is intended as a guide only, and can be used to make production decisions, determine potential returns, prepare budgets and evaluate production loans. Practices described are based on the production practices considered typical for this crop and region, but will not apply to every farm situation. Sample costs for labor, materials, equipment and custom services are based on current figures. “Your Costs” columns in Tables 1 and 2 are provided for entering your farm costs. The hypothetical farm operations, production practices, overhead, and calculations are described under the assumptions. For additional information or an explanation of the calculations used in the study call the Department of Agricultural and Resource Economics, University of California, Davis, California, (530) 752- 4651 or [email protected]. Sample Cost of Production Studies for many commodities are available and can be requested through the Department of Agricultural and Resource Economics, UC Davis. Current studies can be downloaded from the department website http://coststudies.ucdavis.edu. Archived studies are also available on the website.
The University of California does not discriminate in any of its policies, procedures or practices. The University is an affirmative action/equal opportunity employer.

2015 Silage Corn-Conservation Tillage Northern San Joaquin Valley UC Cooperative Extension 3
ASSUMPTIONS
The following assumptions refer to Tables 1 to 7 and pertain to sample costs to produce double cropped silage corn in the northern San Joaquin Valley. Practices described represent conservation tillage production practices and materials considered typical of a well-managed farm in the region. The costs, materials, and practices shown in this study will not apply to all situations. Conservation tillage cultural practices vary by grower and the differences can be significant. The study is intended as a guide only. The use of trade names and conservation tillage cultural practices in this report does not constitute an endorsement or recommendation by the University of California nor is any criticism implied by omission of other similar products or cultural practices. Farm. The hypothetical farm consists of 300 non-contiguous acres of which 150 acres are rented and 150 owned by the grower. Of the 150 acres of rented land, 145 acre are double cropped with a winter forage crop followed by corn silage. The remaining 5 acres are roads and field edges. The grower-owned 150 acres includes 10 acres occupied by buildings and homestead, and 140 acres planted to other crops.
CONSERVATION TILLAGE SYSTEMS
Conservation tillage systems can be an important part of a sustainable agricultural system, in that they can be used to decrease soil erosion losses ordinarily associated with typical conventional agricultural practices. It is important to remember that anything that is done to decrease erosion losses also decreases the need to add as much fertilizer and water to soils, given that top soil generally contains the most organic matter. Conservation tillage also, ideally, decreases water pollution (via decreasing soil erosion) and saves fossil fuel energy and thus decreases CO2 emissions, compared to conventional tillage systems. Because soil organic matter tends to increase under conservation tillage, as compared to conventional plowing, the soils are also more effective at storing carbon. Conservation tillage systems include a variety of techniques, including "no-till" "minimum till" "ridge till" "chisel plow" and "mulch till." The Soil Conservation Service (now called the Natural Resources Service) refers to these systems as "residue management." Conservation tillage is basically any system of cultivating that reduces soil or water loss when compared to conventional moldboard plowing, which turns over the soil completely. Most definitions specify that at least 30% of the crop residue must remain on the soil surface at the time of planting. It is designed to conserve soil, water, energy (as originally conceived), and protect water quality (again, as originally conceived).
CULTURAL PRACTICES AND MATERIAL INPUTS
Land Preparation. For this study, most of the field operations are performed by a custom operator. In the fall of the previous calendar year, the field is leveled before planting of a winter cereal forage crop such as barley, oats, triticale or wheat. Every four years the field is custom laser leveled and is charged at 25% laser leveled and the remaining 75% of the field is leveled with a tri-plane. Borders are pulled at 50-foot intervals the length of the field which are aligned with the irrigation valves at the head of the field to allow border/flood irrigation. For this study these operating costs, (50%) are split between the winter forage and corn silage crops. Winter cereal forage crops are harvested from March through April depending on the type of forage and when the crop reaches the growth stage for maximum nutrient values. The borders are left in place or reworked if needed, the rest of the field is not worked. Composted manure is hauled and spread. The field is then pre-

2015 Silage Corn-Conservation Tillage Northern San Joaquin Valley UC Cooperative Extension 4
irrigated. In May, once the soil has reached the correct moisture, a strip tillage cultivator is run the length of the field to prepare strips for planting. In this study an 8-row, cultivator prepares 10 inch wide strips spaced 30 inches apart on center. Planting. Corn is usually planted from March - May in rows 30 or 38 inches apart, on the flat or on beds. For this study, the Roundup Ready seed is planted flat, into moisture, in May at 33,000 seeds per acre on 30-inch spacing with a strip-till planter. Starter fertilizer and herbicides are applied at planting. Fertilization. Composted manure from the dairy is spread over the entire field at 3 tons per acre, (1.5% N) before planting. Starter fertilizer 10-34-0 at 200 pounds per acre is applied beneath the seed at planting. Three applications of nitrogen as UAN-32 each at 50 pounds per acre are applied with three irrigations, one in June and two in July, for a total of 150 pounds of nitrogen. The PCA/CCA monitors the fertilizer applications. Nitrogen for the crop is 20 lbs. from the starter, 150 lbs. from the UAN-32 and 90 lbs. from compost, totaling 260 lbs. per acre. Irrigation. The cost of irrigation water is volatile and varies significantly by location within each county. This cost can be critical in deciding whether to plant corn or another crop that is more profitable. For this study the grower uses surface water at an average cost of $3.58 per acre inch, ($43 per acre foot). A pre-irrigation of 8-acre inches is applied in April. The amount of water applied pre-plant will vary depending on soil type and remaining moisture from previous crop. From June to September, seven irrigations totaling 36 acre-inches (3.0 acre-feet) of water are applied. Three of the irrigations, one in June and two in July include nitrogen fertilizer injected into the water. The actual water requirement will vary each year based on soil, climatic, and plant physiological factors. Total irrigation labor costs are a separate line item. Pest Management. The pesticides, rates, and application practices mentioned in this cost study are listed on the UC IPM website at www.ipm.ucdavis.edu. Pesticides mentioned in this study are not recommendations, but those commonly used in the region. For information and pesticide use permits, contact the local county Agricultural Commissioner’s office. For information on other pesticides available, pest identification, monitoring, and management, visit the UC IPM website or contact your UC farm advisor. Pest control costs can vary considerably each year depending upon local conditions and pest populations in any given year. Adjuvants or surfactants may be recommended for use with many pesticides for effective control. Adjuvants and the added costs are not included in this study. Pest Control Adviser/Certified Crop Advisor (PCA/CCA). Written recommendations are required for many pesticides and are available from licensed pest control advisers. In addition the PCA or an independent consultant will monitor the field for agronomic problems including irrigation and nutrition. Growers may hire private PCA’s or receive the service as part of a service agreement with an agricultural chemical or fertilizer company. Weeds. Weed pressure is light to moderate. Glyphosate- Roundup WeatherMax, and diglycolamine-Clarity, are tank mixed and applied post emergence by the grower with a tractor and 20’ spray boom with drop nozzles in June for broad spectrum control of grasses, broadleaf weeds and annual morning glory. The field is also mechanically cultivated-furrowed out once in late May.
Insects/Worms. Several insect and spider mite pests attack corn. Spider mites are assumed to reach economic threshold levels requiring treatment. Spiromesifen-Oberon 2EC is applied by the grower with a tractor and a 20’ spray boom over the top of the plants in early June. Worms can be a problem at planting with stand establishment following a forage crop. There is ample biomass on top of the ground for habitat. An insecticide, bifenthrin-Capture 2EC is strip sprayed at planting to combat these pests.

2015 Silage Corn-Conservation Tillage Northern San Joaquin Valley UC Cooperative Extension 5
Harvest. In September the corn is harvested and hauled to the storage pit by a custom operator. The custom rate for harvesting and hauling is $10.35 per ton. Additional per ton charges of $2.40 are incurred for hauls greater than one mile, which is included. If the dairy wants the silage put into an Agbag, $7.65 per ton is added to the harvesting costs. Normally, non-dairy growers sell the crop standing and the buyer or dairy pays the harvesting costs. If the grower harvests corn using their own equipment, harvest expense (custom harvest costs) are subtracted from harvest costs in Tables 1, 2, and 3. The cash cost for operating grower owned equipment is then added to the harvest costs and the cost of owning harvest equipment added to Non-Cash Overhead. Yields. The crop is assumed to yield 32 tons per acre at 70% moisture. Individual yields can range from 24 to 38 tons per acre in this region. Returns. Based on the 2013 market, a price of $48 per ton is used to calculate returns. Tables 4 shows a range of grower gross and net returns over a range of prices and yields. Pickup/ATV. The pickup is used for farm labor transport, retrieving parts. The ATV is used for irrigation and pest monitoring. Each has its own line item and are not assigned to any specific operation, both are for farm use only.
Labor, Equipment and Interest Labor. Basic wages are $14.00 and $12.00 per hour for machine operators and non-machine workers (irrigators and manual laborers), respectively. Adding 38% for the employer’s share of federal and state payroll taxes, insurance and other benefits raises the total labor costs to $19.32 per hour for machine operators and $16.56 per hour for non-machine laborers. The labor for operations involving machinery is 20% higher than the field operation time to account for equipment set up, road travel, maintenance, and repair. Equipment Operating Costs. Equipment costs are composed of three parts: non-cash overhead, cash overhead, and operating costs. The non-cash overhead is discussed below. The cash overhead consists of property taxes and insurance on the equipment at the rates given below. The operating costs consist of repairs, fuel, and lubrication. Fuel, Lube & Repairs. The fuel, lube, and repair cost per acre for each operation in Table 1 is determined by multiplying the total hourly operating cost in Table 6 for each piece of equipment used for the selected operation by the hours per acre. Tractor time is 10% higher than implement time for a given operation to account for setup and travel time. Repair costs are based on purchase price, annual hours of use, total hours of life, and repair coefficients formulated by the ASAE. Fuel and lubrication costs are also determined by ASAE equations based on maximum Power-Take-Off horsepower, and fuel type. Prices for on-farm delivery of diesel and unleaded gasoline are $3.17 and $3.41 per gallon, respectively. These prices reflect market price during first week of June, 2015. GPS Guidance Systems. GPS/GIS tractor-mounted guidance and precision agriculture systems are a necessity for strip tillage systems. The custom operator uses GPS guidance systems on his equipment. Usage of these systems can reflect a significant cost savings. Interest Rates. Interest on operating capital is based on cash operating costs and is calculated monthly until harvest at a nominal rate of 5.75% per year. A nominal interest rate is the typical market cost of borrowed funds. The interest rate of 4.25% is used to calculate capital recovery. The rate will vary depending upon size of loan and other lending agency conditions, but is a suggested rate by a farm lending agency in January 2015.

2015 Silage Corn-Conservation Tillage Northern San Joaquin Valley UC Cooperative Extension 6
CASH OVERHEAD
Cash overhead consists of various cash expenses paid out during the year that are assigned to the whole farm, not to a particular operation. Property Taxes. Counties charge a base property tax rate of 1% on the assessed value of the property. In some counties special assessment districts exist and charge additional taxes on property including equipment, buildings, and improvements. For this study, county taxes are calculated as 1% of the average value of the property. Insurance. Insurance for farm investments varies depending on the assets included and the amount of coverage. Property insurance provides coverage for property loss and is charged at 0.829% of the average value of the assets over their useful life. Liability insurance covers accidents on the farm and costs $933 for the entire farm. Land Rent. The cash rent for the land is $300 per acre or $310 per production acre (145 acres) for a single crop. For double-cropped land with winter forage, one-half of the rent is allocated to the corn silage and one- half to the winter forage. The land rented includes developed wells and irrigation system. Land rent appears as a Cash Overhead cost. Field Supervisors Salary. Supervisors’ salaries include insurance, payroll taxes and benefits. One third of one supervisor’s time is allocated to silage corn at $36 per acre. Office Expenses. Costs are estimated at $40 per acre for the ranch and are not based on any specific information, except that there is a cost involved for bookkeeping, payroll, tax preparation, and telephone. Miscellaneous Costs (Training). Included expenses are employee safety training as well as pesticide use and regulatory continuing education training, employee bonuses, additional materials and applications for unique fields or special conditions. These costs are estimated at $20 per acre. Investment Repairs. Annual repairs on investments or capital recovery items that require maintenance are calculated as 2% of the purchase price. Repairs are not calculated for land and establishment costs.
NON-CASH OVERHEAD
Non-cash overhead is calculated as the capital recovery cost for equipment and other farm investments. Capital Recovery Costs. Capital recovery cost is the annual depreciation and interest costs for a capital investment and is the amount of money required each year to recover the difference between the purchase price and salvage value (unrecovered capital). The capital recovery costs are equivalent to the annual payment on a loan for the investment with the down payment equal to the discounted salvage value. This is a more complex method of calculating ownership costs than straight-line depreciation and opportunity costs, but more accurately represents the annual costs of ownership because it takes the time value of money into account (Boehlje and Eidman). The formula for the calculation of the annual capital recovery costs is; [(Purchase Price – Salvage Value) x Capital Recovery Factor] + (Salvage Value x Interest Rate) Salvage Value. Salvage value is the estimated value of an investment at the end of its useful life. For farm machinery the value is a percentage of the new cost of the investment (Boehlje and Eidman). The value is

2015 Silage Corn-Conservation Tillage Northern San Joaquin Valley UC Cooperative Extension 7
calculated from equations developed by ASAE based on equipment type and years of life. The life in years is estimated by dividing the wear out life, as given by ASAE, by the annual hours of use in the operation. For other investments including irrigation systems, buildings, and miscellaneous equipment, the value at the end of its useful life is zero. The salvage value for land is the purchase price because land does not depreciate. Capital Recovery Factor. Capital recovery factor is the amortization factor or annual payment whose present value at compound interest is 1. The amortization factor is a table value that corresponds to the interest rate and equipment life.
Crop Insurance. Crop insurance for silage corn is available and is based on the grower’s average yields. The farmer can select the level of coverage from 50 to 75% of average yield and costs will vary depending upon coverage level. No crop insurance is specified in this study. Fuel Tanks. Two 5,000-gallon fuel tanks using electric pumps are used to hold diesel and gasoline. The tanks are setup in a cement containment pad that meets federal, state, and county regulations. Irrigation System. The fields are irrigated using a border/flood irrigation system. Surface water is delivered from the Irrigation District and distributed by way of canals to the growers irrigation system of underground mainlines and surface level valves. The land owner is responsible for the main pump, (if needed) and delivery of water to the grower’s irrigation system. Irrigation operations, equipment to perform these operations and water costs are listed in tables 1, 2 and 3. Land. Land values for row crop land in the region range from $22,500 per acre to $32,500 per acre. Prices are affected by location, soil type, and water availability. In this study the silage corn is grown on rented land (see Land Rent). Shop Building. The shop building is 3,000 square foot metal building on a cement slab. Shop Tools. Includes shop equipment/tools and other tools used on the farm and does not recognize any specific inventory.
Risk. Risks associated with silage corn production are not assigned a production cost. While this study makes an effort to model a production system based on typical, real world practices, it cannot fully represent financial, agronomic and market risks which affect the profitability and economic viability of corn production. Because of the risk involved, growers should consider all of the agronomic and economic risks before committing resources to corn production. Crop insurance may be a viable option that each grower should review to determine if it is appropriate for their situation. Table Values. Due to rounding, the totals may be slightly different from the sum of the components.

2015 Silage Corn-Conservation Tillage Northern San Joaquin Valley UC Cooperative Extension 8
REFERENCES American Society of Agricultural Engineers. 2013. American Society of Agricultural Engineers Standards Yearbook. Russell H. Hahn and Evelyn E. Rosentreter (eds.) St. Joseph, Missouri. 41st edition. American Society of Farm Managers and Rural Appraisers. 2015. Trends in Agricultural Land & Lease Values. California Chapter of the American Society of Farms Managers and Rural Appraisers. Woodbridge, CA. www.calasfmra.com
Boehlje, Michael D., and Vernon R. Eidman. 1984. Farm Management. John Wiley and Sons. New York, New York. California Department of Insurance, Rate Regulation Branch. http://www.insurance.ca.gov/0500-about-us/ California State Automobile Association. 2015. Gas Price Averages, June, 2015. AAA Press Room, San Francisco, CA. http://www.csaa.com/portal/site/CSAA/menuitem.5313747aa611bd4e320cfad592278a0c/?vgnextoid=8d642ce6cda97010VgnVCM1000002872a8c0RCRD.
Oregon State University, Conservation Tillage Systems. http://people.oregonstate.edu/~muirp/constill.htm Jeff Mitchell, Anil Shrestha, Marsha Campbell-Mathews, “Strip-Tillage in California’s Central Valley”. http://anrcatalog.ucdavis.edu, publication 8361. CDFA-California County Agricultural Commissioners, California Annual Agricultural Crop Reports. 2013. California Department of Food and Agricultural, Sacramento, CA. http://www.nass.usda.gov/ca/bul/agcom/indexcac.htm.
University of California Statewide Integrated Pest Management Program. UC Pest Management Guidelines, Corn. University of California, Davis, CA. http://www.ipm.ucdavis.edu/index.html
USDA Economics, Statistics and Market Information System (ESMIS) Agriculture and Rural Economics Division, ERS. USDA. Washington, DC. http://usda.mannlib.cornell.edu/MannUsda/homepage.do

2015 Silage Corn-Conservation Tillage Northern San Joaquin Valley UC Cooperative Extension 9
UC COOPERATIVE EXTENSION TABLE 1. COSTS PER ACRE TO PRODUCE SILAGE CORN CONSERVATION TILLAGE
SAN JOAQUIN VALLEY-2015
Operation Cash and Labor Costs per Acre
Operation Time
(Hrs/A) Labor
Cost Fuel Lube
&Repairs Material
Cost Custom/
Rent Total Cost
Your Cost
Pre-Plant: Laser Plane-Custom 25% of Acres (50% of cost ) 0.00 0 0 0 0 15 15 Tri-Plane 75% of Acres (50% of cost) 0.00 0 0 0 0 12 12
Ridge/Shape Borders (50% of cost) 0.00 0 0 0 0 6 6 Haul/Spread Compost (1.5% N) 0.00 0 0 0 0 129 129 Pre-Irrigate 0.00 0 0 0 29 0 29 Strip-Tillage Cultivation 0.00 0 0 0 0 18 18
TOTAL PRE-PLANT COSTS 0.00 0 0 0 29 180 209
Cultural : Plant/Fertilize/Herbicide 0.00 0 0 0 178 22 200 Cultivate/Furrow Out 0.00 0 0 0 0 14 14 Weeds-Post Emergence 0.13 3 2 1 25 0 31 Pests-Mites Oberon 2SC 0.13 3 2 1 29 0 34 Irrigate 7X 0.00 0 0 0 129 0 129 Fertilize-UAN32 0.00 0 0 0 126 0 126 Irrigation Labor 0.00 124 0 0 0 0 124 Pickup Truck-Farm Use 0.27 6 2 1 0 0 9 ATV-Farm Use 0.20 5 1 0 0 0 6
TOTAL CULTURAL COSTS 0.72 141 7 2 487 36 673
Harvest: Harvest-Chop/Haul-Silage 0.00 0 0 0 0 331 331
TOTAL HARVEST COSTS 0.00 0 0 0 0 331 331
Interest on Operating Capital at 5.75% 20
TOTAL OPERATING COSTS/ACRE 1 141 7 2 516 547 1,232
CASH OVERHEAD: Liability Insurance 3 Miscellaneous Costs (Training) 20 Land Rent-Silage Corn (50% of Cost)) 155 Office Expenses 40 Supervisor Salary 36 Property Taxes 2 Property Insurance 0 Investment Repairs 6 TOTAL CASH OVERHEAD COSTS/ACRE 262 TOTAL CASH COSTS/ACRE 1,494 NON-CASH OVERHEAD: Per Producing
Acre Annual Cost
Capital Recovery
Fuel Storage Tanks (2) 73 6 6 Shop Building 3,000 Sqft 200 13 13 Shop Tools 50 4 4 Closed Mixing System 17 2 2 Equipment 37 4 4
TOTAL NON-CASH OVERHEAD COSTS 377 28 28 TOTAL COSTS/ACRE 1,523

2015 Silage Corn-Conservation Tillage Northern San Joaquin Valley UC Cooperative Extension 10
UC COOPERATIVE EXTENSION TABLE 2. COSTS AND RETURNS PER ACRE TO PRODUCE SILAGE CORN CONSERVATION TILLAGE
SAN JOAQUIN VALLEY-2015 Quantity/
Acre
Unit Price or
Cost/Unit Value or
Cost/Acre Your Cost
GROSS RETURNS Silage Corn 32 Ton 48.00 1,536 TOTAL GROSS RETURNS 32 Ton 1,536
OPERATING COSTS Fertilizer: 236
10-34-0 200.00 Lb 0.55 110 UAN32 150.00 Lb N 0.84 126
Insecticide: 32 Capture 2EC 2.13 FlOz 1.59 3 Oberon 2SC 6.00 floz 4.78 29
Herbicide: 25 Roundup WeatherMax 2.00 Pint 5.21 10 Clarity 1.00 Pint 14.88 15
Seed: 65 Corn Seed Roundup-ready 33.00 Thou 1.96 65
Custom: 547 Laser Plane 0.13 Acre 120.00 15 Tri-Plane 1.00 Acre 12.00 12 Ridge/Shape Borders 1.00 Acre 5.95 6 Haul/Spread Compost 3.00 Ton 43.00 129 Ridge/Strip-Tillage 1.00 Acre 18.00 18 Plant Corn/Strip-Till 1.00 Acre 22.00 22 Cultivate 1.00 Acre 14.00 14 Chop/Haul-Silage 32.00 Ton 10.35 331
Irrigation: 158 Water Corn Silage 44.00 AcIn 3.58 158
Labor 141 Equipment Operator Labor 0.86 hrs 19.32 17 Irrigation Labor 7.50 hrs 16.56 124
Machinery 9 Fuel-Gas 0.72 gal 3.41 2 Fuel-Diesel 1.30 gal 3.17 4 Lube 1 Machinery Repair 1
Interest on Operating Capital @ 5.75% 20 TOTAL OPERATING COSTS/ACRE 1,232 TOTAL OPERATING COSTS/TON 39 NET RETURNS ABOVE OPERATING COSTS 304
CASH OVERHEAD COSTS Liability Insurance
3
Miscellaneous Costs (Training) 20 Land Rent-Silage Corn (50%) 155 Office Expenses 40 Supervisor Salary 36 Property Taxes 2 Property Insurance 0 Investment Repairs 6 TOTAL CASH OVERHEAD COSTS/ACRE 262
TOTAL CASH OVERHEAD COSTS/TON 8
TOTAL CASH COSTS/ACRE 1,494
TOTAL CASH COSTS/TON 47
NET RETURNS ABOVE CASH COSTS 42
NON-CASH OVERHEAD COSTS (Capital Recovery) Fuel Storage Tanks (2)
6
Shop Building 3,000 Sqft 13 Shop Tools 4 Closed Mixing System 2 Equipment 4 TOTAL NON-CASH OVERHEAD COSTS/ACRE 28
TOTAL NON-CASH OVERHEAD COSTS/TON 1
TOTAL COST/ACRE 1,523
TOTAL COST/TON 48
NET RETURNS ABOVE TOTAL COST 13

2015 Silage Corn-Conservation Tillage Northern San Joaquin Valley UC Cooperative Extension 11
UC COOPERATIVE EXTENSION
TABLE 3. MONTHLY COSTS PER ACRE TO PRODUCE SILAGE CORN CONSERVATION TILLAGE SAN JOAQUIN VALLEY-2015
OCT 14
NOV 14
DEC 14
JAN 15
FEB 15
MAR 15
APR 15
MAY 15
JUN 15
JUL 15
AUG 15
SEP 15
Total
Pre-Plant: Laser Plane-Custom 25% of Ac (50% of cost)
15
15
Tri-Plane 75% of Ac (50% of cost) 12 12 Ridge/Shape Borders (50% of cost) 6 6 Haul/Spread Compost (1.5% N) 129 129 Pre-Irrigate 29 29 Strip-Tillage Cultivator 18 18
TOTAL PRE-PLANT COSTS 33 158 18 209
Cultural : Plant/Fertilize/Herbicide
200
200
Cultivate/Furrow Out 14 14 Weeds-Post Emergence 31 31 Pests-Mites Oberon 2SC 34 34 Irrigate 7X 43 43 29 14 129 Fertilize-UAN32 42 84 126 Irrigation Labor 124 124 Pickup Truck-Farm Use 1 1 1 1 1 1 1 1 1 1 1 1 9 ATV-Farm Use 0 0 0 0 0 0 0 0 0 0 0 0 6
TOTAL CULTURAL COSTS 1 1 1 1 1 1 1 215 152 128 30 140 673
Harvest: Harvest-Chop/Haul-Silage
331
331
TOTAL HARVEST COSTS 0 0 0 0 0 0 0 0 0 0 0 331 331
Interest on Operating Capital @ 5.75% 0 0 0 0 0 0 1 2 3 3 4 6 20
TOTAL OPERATING COSTS/ACRE 34 1 1 1 1 1 160 235 154 132 33 477 1,232
CASH OVERHEAD Liability Insurance
3
3
Miscellaneous Costs (Training) 20 20 Land Rent-Silage Corn (50% of Cost) 155 155 Office Expenses 40 40 Supervisor Salary 36 36 Property Taxes 1 1 2 Property Insurance 0 0 0 Investment Repairs 0 0 0 0 0 0 0 0 0 0 0 0 6
TOTAL CASH OVERHEAD COSTS 0 0 0 1 0 0 0 0 0 1 0 255 262 TOTAL CASH COSTS/ACRE 35 2 2 3 2 2 160 236 155 133 34 731 1,494

2015 Silage Corn-Conservation Tillage Northern San Joaquin Valley UC Cooperative Extension 12
UC COOPERATIVE EXTENSION TABLE 4. RANGING ANALYSIS - SILAGE CORN CONSERVATION TILLAGE
SAN JOAQUIN VALLEY-2015 COSTS PER ACRE AND PER TON AT VARYING YIELDS TO PRODUCE SILAGE CORN CONSERVATION TILLAGE
YIELD (Ton)
17.00
22.00
27.00
32.00
37.00
42.00
47.00
OPERATING COSTS/ACRE: Pre-Plant
209
209
209
209
209
209
209
Cultural 673 673 673 673 673 673 673 Harvest 176 228 279 331 383 435 486 Interest on Operating Capital @ 5.75% 19 19 19 20 20 20 20
TOTAL OPERATING COSTS/ACRE 1,076 1,128 1,180 1,232 1,284 1,336 1,388 TOTAL OPERATING COSTS/TON 63.31 51.29 43.72 38.51 34.71 31.82 29.54
CASH OVERHEAD COSTS/ACRE 262 262 262 262 262 262 262 TOTAL CASH COSTS/ACRE 1,338 1,390 1,442 1,494 1,546 1,598 1,650 TOTAL CASH COSTS/TON 78.72 63.19 53.41 46.69 41.79 38.05 35.11
NON-CASH OVERHEAD COSTS/ACRE 28 28 28 28 28 28 28 TOTAL COSTS/ACRE 1,367 1,419 1,471 1,523 1,575 1,627 1,679 TOTAL COSTS/TON 80.00 64.00 54.00 48.00 43.00 39.00 36.00
Net Return per Acre above Operating Costs for Silage Corn Conservation Tillage
PRICE ($/ton)
YIELD (Tons/acre)
Silage Corn
17.00
22.00
27.00
32.00
37.00
42.00
47.00
18.00
-770
-732
-694
-656
-618
-580
-542 28.00 -600 -512 -424 -336 -248 -160 -72 38.00 -430 -292 -154 -16 122 260 398 48.00 -260 -72 116 304 492 680 868 58.00 -90 148 386 624 862 1,100 1,338 68.00 80 368 656 944 1,232 1,520 1,808 78.00 250 588 926 1,264 1,602 1,940 2,278
Net Return per Acre above Cash Costs for Silage Corn Conservation Tillage
PRICE ($/ton)
YIELD (Tons/acre)
Silage Corn
17.00
22.00
27.00
32.00
37.00
42.00
47.00
18.00
-1,032
-994
-956
-918
-880
-842
-804 28.00 -862 -774 -686 -598 -510 -422 -334 38.00 -692 -554 -416 -278 -140 -2 136 48.00 -522 -334 -146 42 230 418 606 58.00 -352 -114 124 362 600 838 1,076 68.00 -182 106 394 682 970 1,258 1,546 78.00 -12 326 664 1,002 1,340 1,678 2,016
Net Return per Acre above Total Costs for Silage Corn Conservation Tillage
PRICE ($/ton)
YIELD (Tons/acre)
Silage Corn
17.00
22.00
27.00
32.00
37.00
42.00
47.00
18.00
-1,061
-1,023
-985
-947
-909
-871
-833 28.00 -891 -803 -715 -627 -539 -451 -363 38.00 -721 -583 -445 -307 -169 -31 107 48.00 -551 -363 -175 13 201 389 577 58.00 -381 -143 95 333 571 809 1,047 68.00 -211 77 365 653 941 1,229 1,517 78.00 -41 297 635 973 1,311 1,649 1,987

2015 Silage Corn-Conservation Tillage Northern San Joaquin Valley UC Cooperative Extension 13
UC COOPERATIVE EXTENSION TABLE 5. WHOLE FARM ANNUAL EQUIPMENT, INVESTMENT, AND BUSINESS OVERHEAD COSTS
SAN JOAQUIN VALLEY-2015
ANNUAL EQUIPMENT COSTS
Cash Overhead
Yr
Description
Price
Yrs Life
Salvage Value
Capital Recovery
Insur- ance
Taxes
Total
15 300 Gallon Saddle Tank (Pair) 1,660 4 652 314 1 12 326 15 Spray Boom - 20' 3,600 5 1,173 612 2 24 638 15 Pickup 1/2 Ton 28,000 5 12,549 4,140 17 203 4,360 15 ATV-4WD 8,500 10 1,503 967 4 50 1,021 15 95 HP4WD Tractor 93,000 15 18,105 7,954 46 556 8,556
TOTAL 134,760 - 33,982 13,987 70 844 14,901
60% of New Cost* 80,856 - 20,389 8,392 42 506 8,940 *Used to reflect a mix of new and used equipment
ANNUAL INVESTMENT COSTS
Cash Overhead Description
Price
Yrs Life
Salvage Value
Capital Recovery
Insur- ance
Taxes
Repairs
Total
INVESTMENT Fuel Storage Tanks (2) 21,950 20 250 1,716 9 111 130 1,967 Shop Building 3,000 sqft 60,000 30 0 3,793 25 300 1,200 5,317 Shop Tools 15,000 20 1,500 1,132 7 83 300 1,521 Closed Mixing System 5,074 10 507 608 2 28 101 740
TOTAL INVESTMENT 102,024 - 2,257 7,249 43 521 1,731 9,545
ANNUAL BUSINESS OVERHEAD COSTS
Units/ Price/ Total Description Farm Unit Unit Cost
Liability Insurance 300 Farm 3.11 933 Miscellaneous Costs (Training) 150 Acre 20.00 3,000 Land Rent-Silage Corn (50%) 145 Acre 155.00 22,475 Office Expenses 150 Acre 40.00 6,000 Supervisor Salary 150 Acre 36 5,400
UC COOPERATIVE EXTENSION TABLE 6. HOURLY EQUIPMENT COSTS
SAN JOAQUIN VALLEY-2015
Silage Corn Conservation Tillage Total Cash Overhead Operating
Yr
Description
Hours Used
Hours Used
Capital Recovery
Insur- ance
Taxes
Lube& Repairs
Fuel
Total Oper.
Total Costs/Hr.
15 300 Gallon Saddle Tank (Pair) 37 500 0.38 0.00 0.01 0.03 0.00 0.03 0.42 15 Spray Boom - 20' 37 300 1.22 0.00 0.05 0.99 0.00 0.99 2.26 15 Pickup 1/2 Ton 39 400 6.21 0.03 0.30 3.05 6.39 9.44 15.98 15 ATV-4WD 32 150 3.87 0.02 0.20 0.63 3.41 4.04 8.12 15 95 HP4WD Tractor 40 1000 4.77 0.03 0.33 4.44 14.79 19.23 24.36
2015 Silage Corn-Conservation Tillage Northern San Joaquin Valley UC Cooperative Extension 14
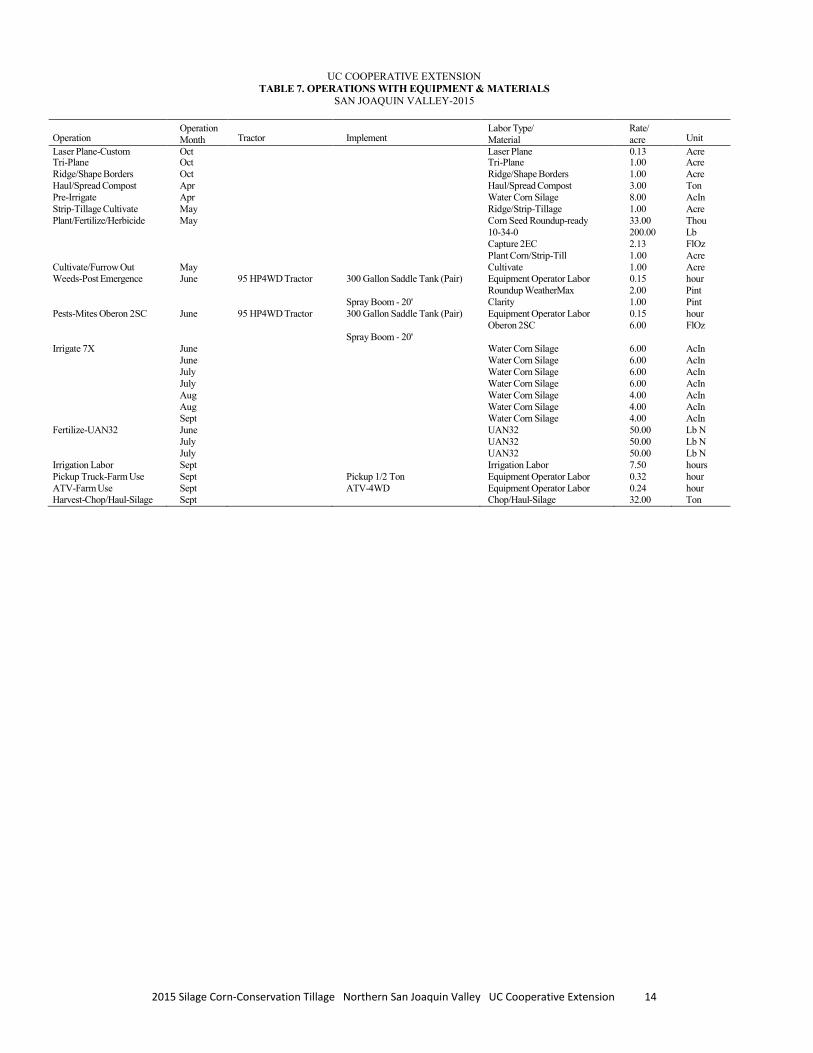
UC COOPERATIVE EXTENSION TABLE 7. OPERATIONS WITH EQUIPMENT & MATERIALS
SAN JOAQUIN VALLEY-2015
Operation
Operation Month
Tractor
Implement
Labor Type/ Material
Rate/ acre
Unit
Laser Plane-Custom Oct Laser Plane 0.13 Acre Tri-Plane Oct Tri-Plane 1.00 Acre Ridge/Shape Borders Oct Ridge/Shape Borders 1.00 Acre Haul/Spread Compost Apr Haul/Spread Compost 3.00 Ton Pre-Irrigate Apr Water Corn Silage 8.00 AcIn Strip-Tillage Cultivate May Ridge/Strip-Tillage 1.00 Acre Plant/Fertilize/Herbicide May Corn Seed Roundup-ready 33.00 Thou
10-34-0 200.00 Lb Capture 2EC 2.13 FlOz Plant Corn/Strip-Till 1.00 Acre Cultivate/Furrow Out May Cultivate 1.00 Acre Weeds-Post Emergence June 95 HP4WD Tractor 300 Gallon Saddle Tank (Pair) Equipment Operator Labor 0.15 hour
Roundup WeatherMax 2.00 Pint Spray Boom - 20' Clarity 1.00 Pint Pests-Mites Oberon 2SC June 95 HP4WD Tractor 300 Gallon Saddle Tank (Pair) Equipment Operator Labor 0.15 hour
Oberon 2SC 6.00 FlOz Spray Boom - 20' Irrigate 7X June Water Corn Silage 6.00 AcIn
June Water Corn Silage 6.00 AcIn July Water Corn Silage 6.00 AcIn July Water Corn Silage 6.00 AcIn Aug Water Corn Silage 4.00 AcIn Aug Water Corn Silage 4.00 AcIn Sept Water Corn Silage 4.00 AcIn Fertilize-UAN32 June UAN32 50.00 Lb N
July UAN32 50.00 Lb N July UAN32 50.00 Lb N Irrigation Labor Sept Irrigation Labor 7.50 hours Pickup Truck-Farm Use Sept Pickup 1/2 Ton Equipment Operator Labor 0.32 hour ATV-Farm Use Sept ATV-4WD Equipment Operator Labor 0.24 hour Harvest-Chop/Haul-Silage Sept Chop/Haul-Silage 32.00 Ton
Related Documents