Cascadia GPS Analysis Teacher Information and Answer Key Page 1 Cascadia GPS Analysis: Teacher Information Technology is amazing. The Global Positioning System, known as GPS, has been around for many years, and its applications are many. In a nutshell, GPS can be used to locate where you are on the Earth within a few meters, and people are most familiar with GPS units in cars to help with directions, or for recreation, like hiking. A specific type of GPS called differential GPS, or dGPS, is extremely precise and can be used to show tectonic plate movement of millimeters! Basically, there are 24 GPS satellites cruising 12,000 miles above the Earth moving at about 7500 kilometers per hour. That’s almost 2 kilometers per second – yes, 2 kilometers every second. The satellites send out radio wave signals in all directions. Receivers can tell how long it takes for the radio waves to reach them, and using some math, computers can calculate the distance between the receiver and the satellite. Computers can then translate small changes to large changes by looking at larger intervals of time. dGPS is so much more accurate because it uses some very sophisticated computing to take out errors due to the atmosphere and inaccurate clocks, for example. The picture on the student handout shows a GPS Monument. Inside the dome is the GPS antenna that receives the radio waves and sends the signal to an attached receiver. The resulting positional data are then sent via Internet to UNAVCO for further processing. Scientists can then use long-term positional data to interpret plate motions and plate boundary interactions. NGSS STANDARD ALIGNMENT Disciplinary Core Ideas • Motion and Stability—Forces and Interactions: HS-PS2-1, MS-PS2-2 • Energy: MS-PS3-1, MS-PS3-2, HS-PS3-2, MS-PS3-5 • Waves and Their Applications in Technologies for Information Transfer: HS-PS4-2, MS-PS4-3, HS-PS4-5 • Earth’s Systems: 5-ESS2-1, HS-ESS2-1, MS-ESS2-2, HS-ESS2-2, MS-ESS2-3, HS-ESS2-3 • Earth and Human Activity: HS-ESS3-1, MS-ESS3-2 Science and Engineering Practices Crosscutting Concepts 4. Analyzing and Interpreting Data 5. Using Mathematics and Computational Thinking 6. Constructing Explanations and Designing Solutions 2. Cause and Effect 4. Systems and System Models 7. Stability and Change LESSON PLAN This is a multi-day lesson, and could take 2 – 3 lessons (hour long) to complete. IRIS Education and Outreach has a two-part video to demonstrate all parts of this activity: http://www.iris.edu/hq/inclass/video/gps_monitors_deformation_in_subduction_zone_part_1_intro http://www.iris.edu/hq/inclass/video/gps_monitors_deformation_in_subduction_zone_part_2_using_real_data

Welcome message from author
This document is posted to help you gain knowledge. Please leave a comment to let me know what you think about it! Share it to your friends and learn new things together.
Transcript
CascadiaGPSAnalysisTeacherInformationandAnswerKey Page1
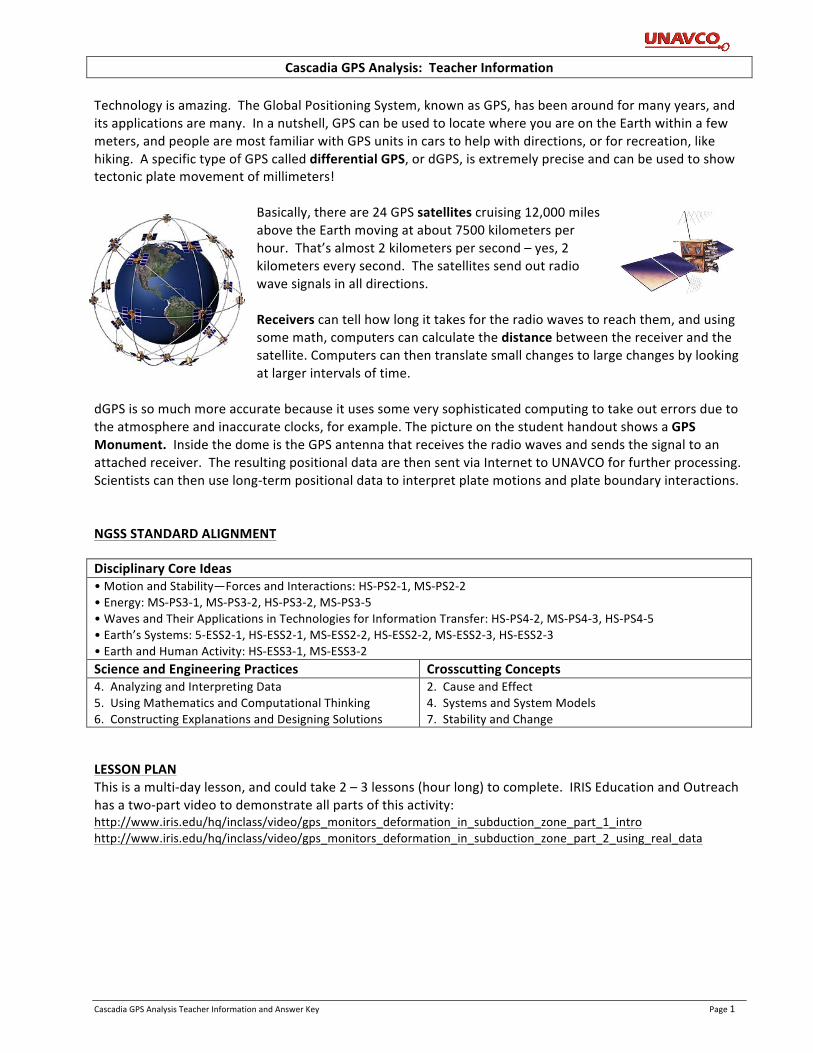
CascadiaGPSAnalysis:TeacherInformationTechnologyisamazing.TheGlobalPositioningSystem,knownasGPS,hasbeenaroundformanyyears,anditsapplicationsaremany.Inanutshell,GPScanbeusedtolocatewhereyouareontheEarthwithinafewmeters,andpeoplearemostfamiliarwithGPSunitsincarstohelpwithdirections,orforrecreation,likehiking.AspecifictypeofGPScalleddifferentialGPS,ordGPS,isextremelypreciseandcanbeusedtoshowtectonicplatemovementofmillimeters!
Basically,thereare24GPSsatellitescruising12,000milesabovetheEarthmovingatabout7500kilometersperhour.That’salmost2kilometerspersecond–yes,2kilometerseverysecond.Thesatellitessendoutradiowavesignalsinalldirections.Receiverscantellhowlongittakesfortheradiowavestoreachthem,andusingsomemath,computerscancalculatethedistancebetweenthereceiverandthesatellite.Computerscanthentranslatesmallchangestolargechangesbylookingatlargerintervalsoftime.
dGPSissomuchmoreaccuratebecauseitusessomeverysophisticatedcomputingtotakeouterrorsduetotheatmosphereandinaccurateclocks,forexample.ThepictureonthestudenthandoutshowsaGPSMonument.InsidethedomeistheGPSantennathatreceivestheradiowavesandsendsthesignaltoanattachedreceiver.TheresultingpositionaldataarethensentviaInternettoUNAVCOforfurtherprocessing.Scientistscanthenuselong-termpositionaldatatointerpretplatemotionsandplateboundaryinteractions.NGSSSTANDARDALIGNMENTDisciplinaryCoreIdeas•MotionandStability—ForcesandInteractions:HS-PS2-1,MS-PS2-2•Energy:MS-PS3-1,MS-PS3-2,HS-PS3-2,MS-PS3-5•WavesandTheirApplicationsinTechnologiesforInformationTransfer:HS-PS4-2,MS-PS4-3,HS-PS4-5•Earth’sSystems:5-ESS2-1,HS-ESS2-1,MS-ESS2-2,HS-ESS2-2,MS-ESS2-3,HS-ESS2-3•EarthandHumanActivity:HS-ESS3-1,MS-ESS3-2ScienceandEngineeringPractices CrosscuttingConcepts4.AnalyzingandInterpretingData5.UsingMathematicsandComputationalThinking6.ConstructingExplanationsandDesigningSolutions
2.CauseandEffect4.SystemsandSystemModels7.StabilityandChange
LESSONPLANThisisamulti-daylesson,andcouldtake2–3lessons(hourlong)tocomplete.IRISEducationandOutreachhasatwo-partvideotodemonstrateallpartsofthisactivity:http://www.iris.edu/hq/inclass/video/gps_monitors_deformation_in_subduction_zone_part_1_introhttp://www.iris.edu/hq/inclass/video/gps_monitors_deformation_in_subduction_zone_part_2_using_real_data
CascadiaGPSAnalysisTeacherInformationandAnswerKey Page2
Introduction:Havestudentsstandupandtrytoonlymoveamillimeter.Witheverymovement,sayit’stoomuch.ThiswillimpressuponthemtheaccuracyofthedGPSsystem.Thesatellitesystemcandetectmovementsofpartsofcontinentsmovingmillimeters.
PARTI:BuildingaGPS‘Monument’
Materials:• Sharptoothpicksworkbest.• Gumdropscanbefoundatlargerstoreswithbulkcandy.Canalsousethesmaller‘spicedrops’available
atmoststores,butit’stoughertogettoothpicksin.• Onlysmallamountsofmodelingclayarenecessary.• Transparenciescanbecutintoquartersheets.Youcanevenusesmallerpiecesifnecessary.Cuttingone
sheetinto6thshouldbelargeenough.Procedure:1. Buildingthemonumentshouldtakeafewminutes,andit’sthehook.Studentswillusethegumdrop
modelforPartII(ifdoingPinpointingLocationportioningroups),andalsotomodelstationmovementinPartIV.
2. Havestudentsplacegumdropmonumentinmiddleoftransparencysheet.Clayrepresentstheconcretethat‘glues’themonumenttoEarth’ssurfacerocklayersbeneaththesoil.
3. Studentscanalsodrawandcoloronthetransparencysheettorepresentrocklayers.Thekeyisthatstudentsunderstandthatit’scrustalrock,notjustthemonumentorsoil,thatmoves.
4. Ifdoingtheactivityovertwodays,havestudentswritetheirnameonapieceofscrappaperandplacegumdropmonumentontoptosavefornextday.
PARTII:PinpointingLocation
Therearethreemethodstodothedemonstration,whichvaryinscale.OptionOne–SmallerScaleSupplies:• 3ringstands(withoutrings)• 3‘satellites’toplaceattopofringstands.BubbleYumgumhasashapesimilartoGPSsatellitesandisan
attentiongrabber.Youcouldalsoprintsmallpicturesofsatellitestotapetotopofringstands.• Stringsof3differentlengthstapedtotopsofringstands–allmustbeatleastaslongasheightofring
stands• GumdropmonumentfromPartIDemonstrationProcedure:1. Premarklocationsofringstandssothatall3stringsmeetinonelocationontablesurface.Youwillhave
tosetthisupandcutthestringsbeforehand.2. ExplainthatsatellitesareflyingaboveEarth’ssurfaceatsamealtitudeandringstandsrepresentthat
height.

CascadiaGPSAnalysisTeacherInformationandAnswerKey Page3
3. Explainrelationshipbetweengumdropmonument(builtinPartI)andsatellite–they‘talk’toeachotherandestablishthedistancebetweenthem.
4. Thestringrepresentsthedistancebetweenthesatelliteandmonument.5. Haveastudentcomeandmoveonestring(heldtautly)inalldirectionstoindicatethatthedistanceis
known,butthedirectionisn’t.Aspherearoundthetopoftheringstandisestablishedwithradiusequalingthedistancefromthesatellite.
6. Haveanotherstudentmovea2ndstringaroundandnotewherestringsintersect–thereisacircleofpossibleplacesthishappens.Emphasizeagainthattheonlyknownentityisthedistancebetweenthemonumentandsatellite.
7. Haveathirdstudentmovethe3rdstringtoshowwhereall3stringsintersect.Thereshouldbetwoplaces–oneonEarth’ssurfaceandoneinspace–whereall3stringsintersect.Notethatcomputerscanautomaticallydetectthattheoneinspaceisnon-sensical.
8. Placethegumdropatthepointwhere3stringsintersect.9. Remindstudentsthatthesemeasurementsaretakingplacewhilesatellitesaremovingat2
kilometers/second!10. HavestudentscompletePartIIquestionsonworksheet.Note:activitycanbedoneingroupsfollowingsamedirections.
OptionTwo–LargerScaleSupplies:• 3longlengthsoftwine(constructiontwineworksfine)thatwillreachfromhighuponthewallstoa
centralpointsomewhereintheroom.• Tapetoholduptwineonwall.• 3‘satellites’toplaceattopofringstands.BubbleYumgumstillwillwork.Youcouldalsoprintlarger
picturesofsatellitestotapeonthewalls.• GumdropmonumentfromPartI,oralargerversionofaGPSmonument.DemonstrationProcedure:11. Tapeendsofstringsonwallssothatall3stringsmeetinonelocationsomewhereonthefloorofthe
room.Youwillhavetosetthisupandcutthestringsbeforehand.12. Coilupthelongstringsandtapethemuponthewallsoyoucaneasilypullthemdownandhandtoa
student.13. Followsameprocedureasaboveforlocatingthethreeplaceswhereall3strings(distances)meet.
OptionThree–LargestScaleDemonstrationProcedure:14. PresentdemonstrationjustaswithOptionTwoabove,onlyusemuchlongerstringandusethegymor
outdoorbasketballhoops.
Hereisavideoyoucouldalsouse:
https://www.youtube.com/watch?v=IoRQiNFzT0k

CascadiaGPSAnalysisTeacherInformationandAnswerKey Page4
PARTIII:MeasuringCascadiaGPS/TectonicMovement
Procedure:
1. Reviewmetricsystem(millimeter,centimeter,meter,kilometer).2. Reviewcardinaldirections.3. TherearehundredsofdGPSstationsinoperation.4. Instructstudentshowto‘read’aTSP.UseexamplefromPacificBeachasexampletodoaswhole
class.5. Verticalisnotusedbecauseitismoredifficulttodetermineachangeinaltitude.Imagineasatellite
overheadlookingforside-to-sidemotion,andthentryingtodetermineverticalmotion.Itwouldbemuchmoredifficulttoseetheup/downmotion.
6. Witharuler,drawalineofbestfittoshowtrendofTSP.Trytodrawthelinesothatthereareanequalnumberofpointsaboveandbelowtheline.Usingaclearrulerworksbest.
7. Usingy-axismmscale,determineoverallchangeinpositioningiventimeperiod.8. Calculateannualmovementbydividingoverallchangeinpositionbytotaltimeperiod.
DetailonInterpretingTimeSeriesPlots(TSP)
a) AllplotshaveaY-axiswith‘zero’andpositivenumbersabovethelineandnegativenumbersbelowtheline.Numberlesstickmarksontherightmirrorthemeasurements.
b) The‘North’plotshowsNorthandSouthmovement–anythingmovinginthe‘positive’(up)directionismovingNorth,andanythingmovinginthe‘negative’oroppositedirectionismovingSouth.
c) ThesameistrueforEast/West–movementinapositivedirectionismovementtotheEast,andanythingmovinginthenegativedirectionismovingWest.
d) Mosttimeseriesdonotincludegridlines,soit’shelpfultousearulerorstraightedge(aclearoneisbest)tocalculatehowmuchmovementthereis.
e) Thescaleontheaxeswillvaryandtheunitsmayvaryaswell.f) UsuallyN/SandE/Wmovementiseasiertoseeapatternwithcomparedtoheight.Butremember
thattherearealotoferrorsthatmustbecorrected,sothedatawon’talwaysbeperfect,orinaclearpattern.
g) Thedataintheexamplesareverylinear–usuallythey’realotmessier.h) Thetimescaleisshownbyyearsandtwelfthsofyears.i) Receiverscollectapositionalmeasurementeverysecond.That’s86,400measurementsaday.These
areaveragedtogetonepointforeachdaythatshowsuponatimeseries.j) Mostplotsnowstartrightat‘0’onthey-axis;whatisimportantisthechangeinposition.However,
sometimesyouwillneedtousethetrendlines,notthepoints,todeterminechangeinposition.k) ThemovementsthatdGPSreceiversshowareverysmall–millimetersorcentimetersatmost.But
justthinkhowmuchmovementthatwouldmeanoverthousandsofyears!Aneasyequivalenttorememberis1mm/yristhesameas1kilometer/1millionyears.
CascadiaGPSAnalysisTeacherInformationandAnswerKey Page5
AnswerstoStudentWorksheetareshownbelowonAnswerKey.
PARTIV:PlottingGPSStationMotionProcedure:1. Followproceduresonstudenthandout.Confusionmayariseaboutscaletranslationofcentimetersto
millimeters.Scaleusedonthegridiscentimeterstomakegraphingeasier.Actualmovementisinmillimetersbutthisisfartoohardtoseeat1:1scale.
2. VectorgraphshouldlookliketheexampleprovidedonAnswerKey.Colorsusedmayvary.3. TheGPSgumdropstationswillmovealongpathofvectors,mimickingthemovementofthetectonic
platewithGPSstationattached.Foraddedeffect,have3studentsputtheirgumdropmodelsonONEmap(page7ofthestudentworksheet)andthensimultaneouslyhavethemmovethegumdropstheappropriatedistancealongthevectorinthesametimeperiod.Althoughcramped,itshowstheshorteningeffectofthewesternmarginquitewell.PARTV:AnalysisofGPSStationMotionThebigpictureresultoftheactivityisthatcoastalstationsofOregonandWashingtonarebeingpushedtowardthenortheastatabout1/2ofthevelocityofJuandeFucaPlatemotionwithrespecttointeriorNorthAmerica.Urbancorridorstations(inWillametteValleyofOregonorPugetLowlandofWashington)arebeingpushedtowardthenortheastatabout1/4ofthevelocityofJuandeFucaPlatemotionwithrespecttointeriorNorthAmerica.StationseastoftheCascadesarenotmovingatallorarebarelymoving.TheclearimplicationisthatcoastalareasaremovingtowardseasternareasastheactivecontinentalmarginisbeingcompressedinSW–NEdirection.StrainisbuildingwithinthePacificNorthwestmarginoftheNorthAmericanPlateastheJuandeFucaPlatepushestheNorthAmericanPlatemargintowardthenortheast.ThisaccumulatingstrainwilleventuallybereleasedinthenextgreatearthquakeontheCascadiaSubductionZone.TheplateboundaryregionsoftheJuandeFucaandNorthAmericanplatesare“lockedandloading”.Furtherimplicationsofthe“lockedandloading”natureofthePacificNorthwestcontinentalmarginareelasticenergywillbestoredupoverlongintervalsoftimeandthensuddenlyreleasedinthenextgreatCascadiaearthquake.Forexample,overtheaverage500yearsrecurrencetimebetweengreatearthquakes,thecoastalstationswillmovenortheastabout7.5meters(25feet).Duringthenextgreatearthquake,thestoredenergyduetotheslowNEmovementwillsuddenlybesuddenlyreleasedasthecoastalareasreboundthesamedistancetowardsthesouthwest.Procedure:1. LeadstudentstoanswersfromobservationsofthePacificNorthwestvectormap.2. Discussbigpictureafterstudentsrealizethattheregionisbeingsqueezed.3. Afurtherdemonstrationistakingapieceofpaperorclothandholdingtherightsideofitstationary,
andthenpushingtheleftsidetowardstheright.Thepaper/clothwillbuckle.

CascadiaGPSAnalysisTeacherInformationandAnswerKey Page6
Name: CASCADIAGPSANALYSISToday’sDate:
PARTI:BuildingaGPS‘Monument’Materials: 4toothpicks,1gumdrop,modelingclay,ruler,1/4sheettransparencyProcedure: 1. Insert3toothpicksdiagonallyintothegumdrop.Thesewillactasthe
legs.2. Insertaslightlyshortertoothpickstickingstraightdownfromthemiddle
ofthegumdrop.Thetipofthistoothpickshouldbejustbarelyabovethesurface.Thiswillbethe‘placemarker’.
3. Putverysmallpiecesofclayonthebottomofthelegs(nottheplacemarker).TheclaywillactasacementtoholdtheGPSstationinplace.InrealitythelegsofaGPSstationarecementeddeepintothegroundsothatifthegroundmoves,sodoestheGPSstation.
4. PositiontheGPSMonumentontopofapieceofcleartransparency.PARTII:PinpointingLocation1. Whatdothetopsofthestringholdersonthewallsrepresent?2. Whatdoesthelengthofstringrepresent?3. HowmanysatellitesareneededtopinpointthelocationofaspotontheEarth?4. Whywouldn’toneortwosatelliteswork?Expainanddrawadiagramtoshowthis.5. Drawthesetupofthedemonstration inthespacetotheright.
Gumdrop
Toothpick
Clay
TEACHERANSWERKEY
Thetopsofthestringsrepresentwheresatellitesare–allareatthesameheightabovetheEarth.
Thelengthofstringrepresentsthedistancebetweenmonumentsandsatellites.
Atleast3satellitesareneededtopinpointthelocationofthemonumentonthesurface.Inrealitymorethan3areused.
Onesatellitewouldn’tworkbecausethestationcouldbeaninfinityofpointsaroundthatonesatellite.Twowouldn’tworkbecausethetwospheresaround2satellitesintersectataninfinityofpointsaroundthecirclewherethetwospheresintersect.

CascadiaGPSAnalysisTeacherInformationandAnswerKey Page7
PARTIII:MeasuringCascadiaGPS/TectonicMovementMaterials: Coloredpencil(fordrawingtrendlines),clearruler,calculator• HighprecisionGPSstationscollectdatain3partsshowninTimeSeriesPlots(TimeSeriesorTSP):
o North/Southmovementovertime(abbreviatedN/S)o East/Westmovementovertime(abbreviatedE/W)o Height(up/down)movementovertime(notshowninthisactivity)
• X-axismeasurestime.• EachdotontheTSPsistheaveragepositionofthestationforoneday.
PacificBeach,WashingtonGPSData–CoastalStation
Thefirstthingtodoisdrawa“trendline.”Positionaruler(clearworksbest)sothatthetrendlinerepresentstheaverageoftheplotsaboveandbelowtheline.Drawthelinesothatitcrossestheaxesonbothsides.Notetheexampleabove.DrawatrendlinefortheEastportionofthePacificBeachTSP.6. Whataretheunitsofmeasurementforthesetimeseries?Circlethebestchoice. a) centimetersandmonths b) metersandyears c) millimetersandyears d) centimetersandyears
19961998200020022004200620082010201220142016
TrendLine
CascadiaGPSAnalysisTeacherInformationandAnswerKey Page8
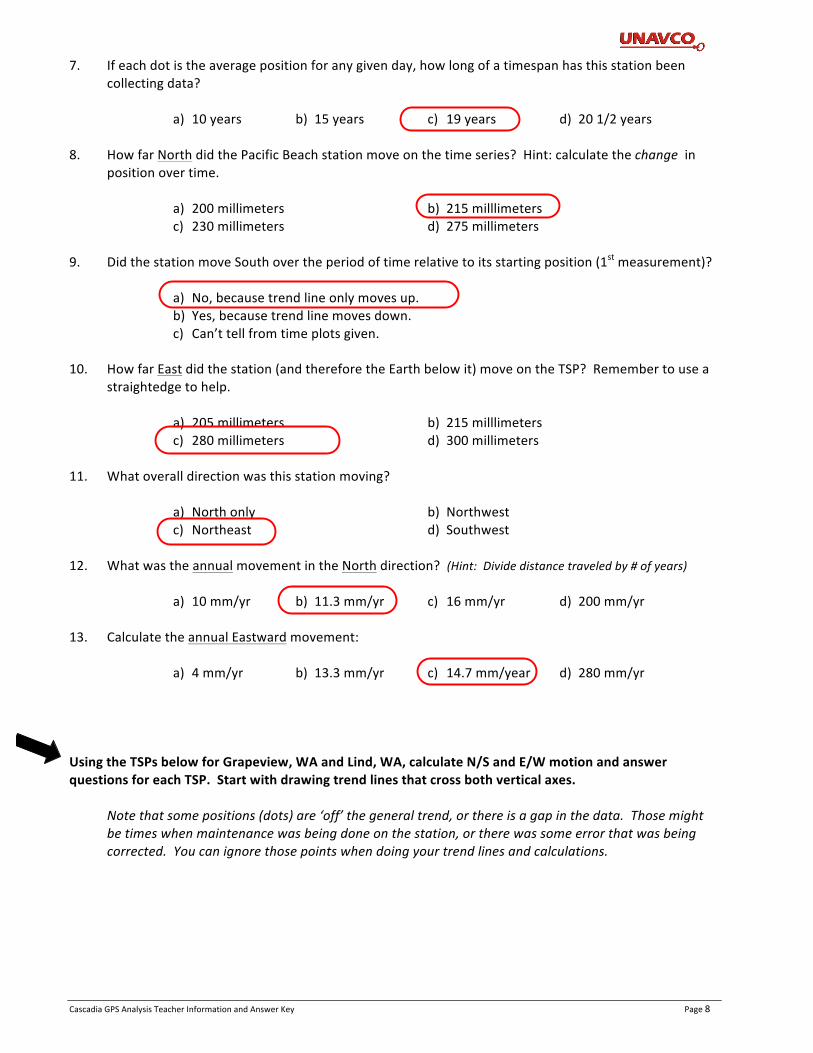
7. Ifeachdotistheaveragepositionforanygivenday,howlongofatimespanhasthisstationbeencollectingdata?
a) 10years b) 15years c) 19years d) 201/2years8. HowfarNorthdidthePacificBeachstationmoveonthetimeseries?Hint:calculatethechangein
positionovertime. a) 200millimeters b) 215milllimeters c) 230millimeters d) 275millimeters9. DidthestationmoveSouthovertheperiodoftimerelativetoitsstartingposition(1stmeasurement)? a) No,becausetrendlineonlymovesup. b) Yes,becausetrendlinemovesdown. c) Can’ttellfromtimeplotsgiven.10. HowfarEastdidthestation(andthereforetheEarthbelowit)moveontheTSP?Remembertousea
straightedgetohelp. a) 205millimeters b) 215milllimeters c) 280millimeters d) 300millimeters11. Whatoveralldirectionwasthisstationmoving? a) Northonly b) Northwest c) Northeast d) Southwest12. WhatwastheannualmovementintheNorthdirection?(Hint:Dividedistancetraveledby#ofyears) a) 10mm/yr b) 11.3mm/yr c) 16mm/yr d) 200mm/yr13. CalculatetheannualEastwardmovement: a) 4mm/yr b) 13.3mm/yr c) 14.7mm/year d) 280mm/yrUsingtheTSPsbelowforGrapeview,WAandLind,WA,calculateN/SandE/WmotionandanswerquestionsforeachTSP.Startwithdrawingtrendlinesthatcrossbothverticalaxes.
Notethatsomepositions(dots)are‘off’thegeneraltrend,orthereisagapinthedata.Thosemightbetimeswhenmaintenancewasbeingdoneonthestation,ortherewassomeerrorthatwasbeingcorrected.Youcanignorethosepointswhendoingyourtrendlinesandcalculations.

CascadiaGPSAnalysisTeacherInformationandAnswerKey Page9
Grapeview,WashingtonGPSData–UrbanCorridorStation
14. Accordingtothisdata,howlongofatimeperiodhasthisstationbeeninoperation?Notethateach
smalllineonX-axisisonemonth,or1/12thofayear.15. WasGrapeviewmovingNorthorSouth?Howdoyouknow?16. HowfarNorthorSouthdiditmovesincedatahasbeenrecorded?17. Overall,wasGrapeviewstationmovingEastorWest?Howdoyouknow?18. HowfarEastorWestdiditmoveoverthewholetimeperiodofdatacollection?19. Werethereanytimeswhenthestationwasn’tmovingNW?Ifso,when,andwhatdirection??20. CalculateannualmotionsinN/SandE/Wdirections.
2004200620082010201220142016
May2005–Sept2016isabout11.5years
GrapeviewwasmovingNorthduetotheupwarddirectionontheN/Splot.IntermittentlyismovedS(down).
Itmovedapproximately56mmNorth.
GrapeviewwasmovingEastduetotheupwarddirectionontheE/Wplot.IntermittentlyismovedW(down).
Itmovedapproximately67mmEast.
ItmovedSouthwestinearly2007,mid2010,mid2011,early2014,andearly2016.
AnnualmotionsareNorth4.9mm/year(56mm/11.5yr)andEast5.8mm/yr(67mm/11.5yr)
CascadiaGPSAnalysisTeacherInformationandAnswerKey Page10
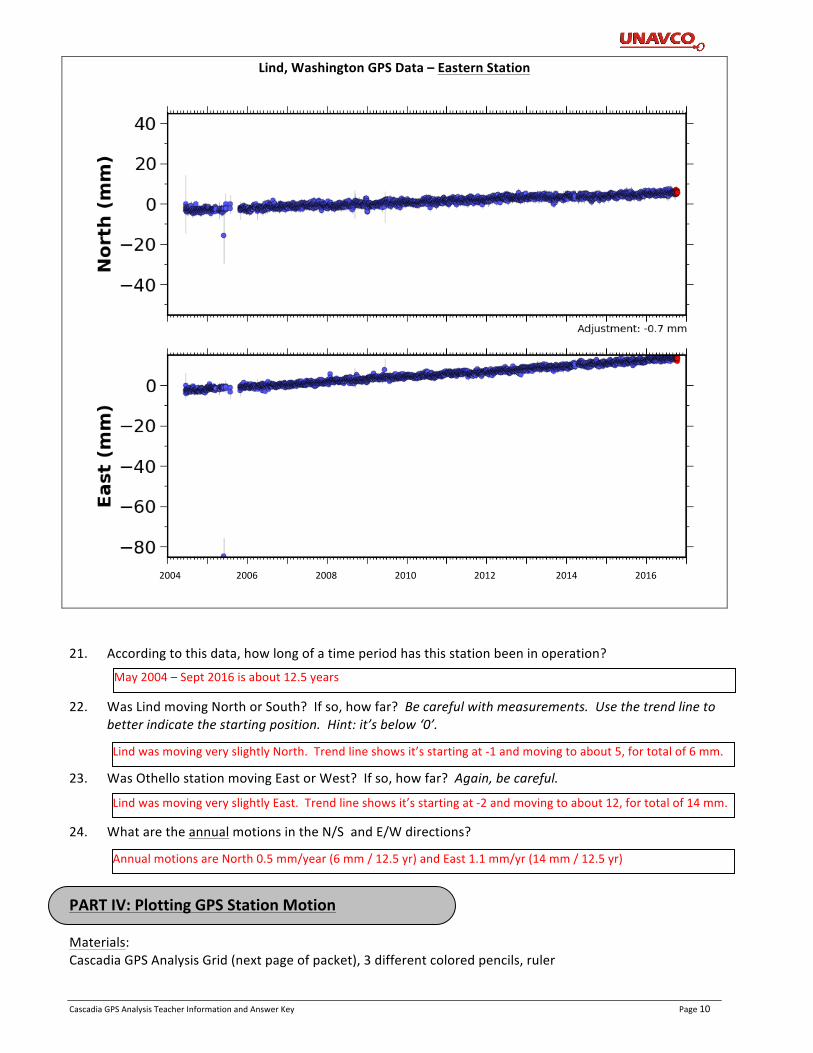
Lind,WashingtonGPSData–EasternStation
21. Accordingtothisdata,howlongofatimeperiodhasthisstationbeeninoperation?22. WasLindmovingNorthorSouth?Ifso,howfar?Becarefulwithmeasurements.Usethetrendlineto
betterindicatethestartingposition.Hint:it’sbelow‘0’.23. WasOthellostationmovingEastorWest?Ifso,howfar?Again,becareful.24. WhataretheannualmotionsintheN/SandE/Wdirections?PARTIV:PlottingGPSStationMotionMaterials: CascadiaGPSAnalysisGrid(nextpageofpacket),3differentcoloredpencils,ruler
2004200620082010201220142016
May2004–Sept2016isabout12.5years
LindwasmovingveryslightlyNorth.Trendlineshowsit’sstartingat-1andmovingtoabout5,fortotalof6mm.
LindwasmovingveryslightlyEast.Trendlineshowsit’sstartingat-2andmovingtoabout12,fortotalof14mm.
AnnualmotionsareNorth0.5mm/year(6mm/12.5yr)andEast1.1mm/yr(14mm/12.5yr)

CascadiaGPSAnalysisTeacherInformationandAnswerKey Page11
Procedure:1. Usingonecoloredpencil,startat(0,0)anddrawafaintarrowtoshowtheannualNorth
movementofthePacificBeachstation.
2. FromendpointoftheNortharrow,drawanarrowtoshowtheannualEastmotion.
3. Drawadiagonalarrowfrom(0,0)totheendpointoftheEastarrow.Thisfinalarrow(vector)showstheoverallannualdirectionandrateofmotionofthePacificBeachGPSstation.
4. Usingacentimeterruler,measurethelengthofthefinalvectorandlabelthevectorwithdistanceinmm/year.Note:Scaleongridiscentimeters,butactualmovementismillimeters–that’swhyyoulabel‘mm/year’.
5. Usingdifferentcolors,drawvectorsforGrapeviewandLindstations.
6. Completekeyindicatingcolorsofyour3GPSstationvectors.
KEY: Color StationLocation StationGroup(Coastal,UrbanCorridor,orEastern)
012345678910
11
12
13 TEACHERANSWERKEY
0123456789101112131415
EastwardVelocity(mm/year)
NorthwardVe
locity(m
m/year)
PacificBeach,WACoastal
Grapeview,WAUrbanCorridor
PacificBeach=18.5mm/yr
Grapeview=7.6mm/yr
Lind=1.6mm/yr
Lind,WAEastern
CascadiaGPSAnalysisTeacherInformationandAnswerKey Page12
Procedure(continued):7. Placegumdropstation(ontopoftransparency)at0,0andmovethetransparencysheetalongoneofthe
Northeastvectorstosimulatethemotionofthelandatthatpoint.
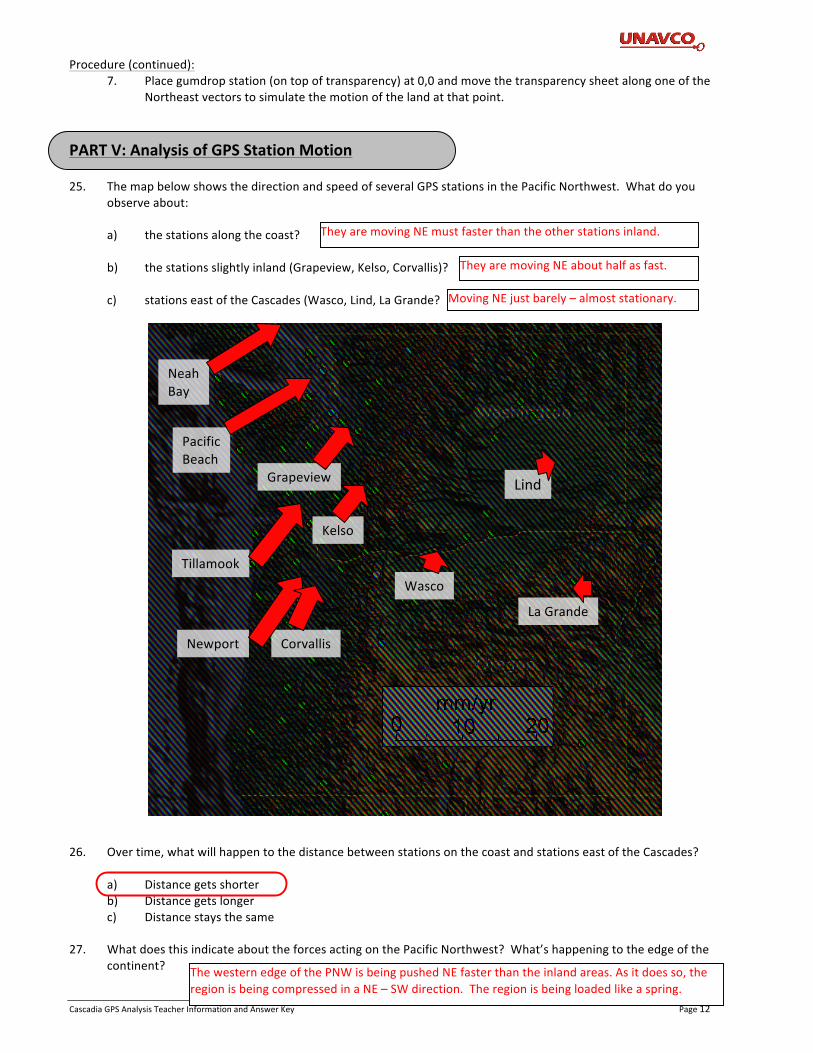
PARTV:AnalysisofGPSStationMotion25. ThemapbelowshowsthedirectionandspeedofseveralGPSstationsinthePacificNorthwest.Whatdoyou
observeabout: a) thestationsalongthecoast? b) thestationsslightlyinland(Grapeview,Kelso,Corvallis)? c) stationseastoftheCascades(Wasco,Lind,LaGrande?26. Overtime,whatwillhappentothedistancebetweenstationsonthecoastandstationseastoftheCascades? a) Distancegetsshorter b) Distancegetslonger c) Distancestaysthesame27. WhatdoesthisindicateabouttheforcesactingonthePacificNorthwest?What’shappeningtotheedgeofthe
continent?
Newport Corvallis
Tillamook
PacificBeach
NeahBay
Kelso
Grapeview Lind
LaGrande
Wasco
TheyaremovingNEmustfasterthantheotherstationsinland.
TheyaremovingNEabouthalfasfast.
MovingNEjustbarely–almoststationary.
ThewesternedgeofthePNWisbeingpushedNEfasterthantheinlandareas.Asitdoesso,theregionisbeingcompressedinaNE–SWdirection.Theregionisbeingloadedlikeaspring.
Related Documents