Study on Carrying Capacity to Develop Industrial Siting Guidelines in Bellary, Hospet & Sandur Region, Bellary District, Karnataka Final Report September. 2007 By nviirOlnmental Management & Policy Research Institute, Urban Eco-Park, 100 ft Ring Road, Peenya Industrial Area, 3rd Phase, Bangalore - 560058 Tel: 080-28377745, Fox: 080-28377744, Emol1 : [email protected] .. in, Website: httP//:empri,kor,niC.in, Study on Carrying Capacity to Develop Industrial Siting Guidelines in Bellary, Hospet & Sandur Region, Bellary District, Karnataka Final Report September. 2007 By c n\l'irll,nmental Management & Policy Research Institute, Urban Eco-Park, 100 ft Ring Road, Peenya Industrial Area, 3rd Phase, Bangalore - 560058 rei: 080-28377745, Fax: 080-28377744, Email: emprUXlngolore@yohoo.co ..ln. Website:httpl /: emprl .kor.n\c.ln.

Carrying Capacity of Mines in Bellary District EMPRI 2007 09 (2)
Dec 01, 2015
Welcome message from author
This document is posted to help you gain knowledge. Please leave a comment to let me know what you think about it! Share it to your friends and learn new things together.
Transcript

Study on Carrying Capacity to Develop Industrial Siting Guidelines in
Bellary, Hospet & Sandur Region, Bellary District, Karnataka
Final Report September. 2007
By
nviirOlnmental Management & Policy Research Institute, Urban Eco-Park, 100 ft Ring Road, Peenya Industrial Area, 3rd Phase,
Bangalore - 560058 Tel: 080-28377745, Fox: 080-28377744,
Emol1: [email protected] .. in, Website: httP//:empri,kor,niC.in,
Study on Carrying Capacity to Develop Industrial Siting Guidelines in
Bellary, Hospet & Sandur Region, Bellary District, Karnataka
Final Report September. 2007
By
cn\l'irll,nmental Management & Policy Research Institute, Urban Eco-Park, 100 ft Ring Road, Peenya Industrial Area, 3rd Phase,
Bangalore - 560058 rei: 080-28377745, Fax: 080-28377744,
Email: [email protected] . .ln. Website:httpl/: emprl.kor.n\c.ln.


Study on Carrying Capacity to Develop Industrial Siting Guidelines in
Bellary, Hospet & Sandur Region, Bellary District, Karnataka
Final Report September, 2007
By
Environmental Management & Policy Research Institute, Urban Eco-Park, 100 ft Ring Road, Peenya Industri al Area, 3rd Phase,
Bangalore - 560058 Tel: 080-28377745, Fax: 080-28377744,
Email: [email protected] .. ln. Webslte: Mp//: empri.kOr.n!c.in.
Study on Carrying Capacity to Develop Industrial Siting Guidelines in
Bellary, Hospet & Sandur Region, Bellary District, Karnataka
Final Report September, 2007
By
Environmental Management & Policy Research Institute, Urban Eco-Park, 100 ft Ring Road, Peenya Industrial Area, 3rd Phase,
Bangalore - 560058 Tel : 080-28377745, Fax: 080·28377744.
Email : [email protected] .. ln. Webslte : hMp//: empri.kOr.n!c.ln.

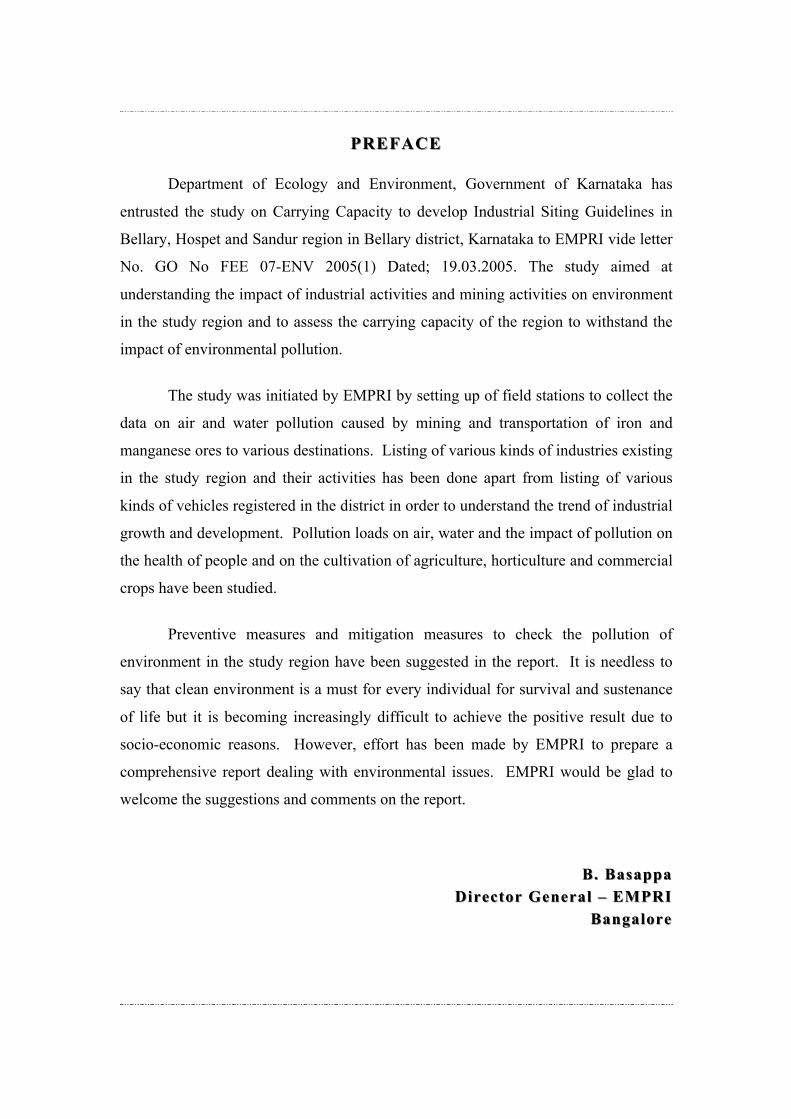
PREFACEPREFACE
Department of Ecology and Environment, Government of Karnataka has
entrusted the study on Carrying Capacity to develop Industrial Siting Guidelines in
Bellary, Hospet and Sandur region in Bellary district, Karnataka to EMPRI vide letter
No. GO No FEE 07-ENV 2005(1) Dated; 19.03.2005. The study aimed at
understanding the impact of industrial activities and mining activities on environment
in the study region and to assess the carrying capacity of the region to withstand the
impact of environmental pollution.
The study was initiated by EMPRI by setting up of field stations to collect the
data on air and water pollution caused by mining and transportation of iron and
manganese ores to various destinations. Listing of various kinds of industries existing
in the study region and their activities has been done apart from listing of various
kinds of vehicles registered in the district in order to understand the trend of industrial
growth and development. Pollution loads on air, water and the impact of pollution on
the health of people and on the cultivation of agriculture, horticulture and commercial
crops have been studied.
Preventive measures and mitigation measures to check the pollution of
environment in the study region have been suggested in the report. It is needless to
say that clean environment is a must for every individual for survival and sustenance
of life but it is becoming increasingly difficult to achieve the positive result due to
socio-economic reasons. However, effort has been made by EMPRI to prepare a
comprehensive report dealing with environmental issues. EMPRI would be glad to
welcome the suggestions and comments on the report.
B. BasappaB. Basappa Director General Director General –– EMPRI EMPRI
BangaloreBangalore

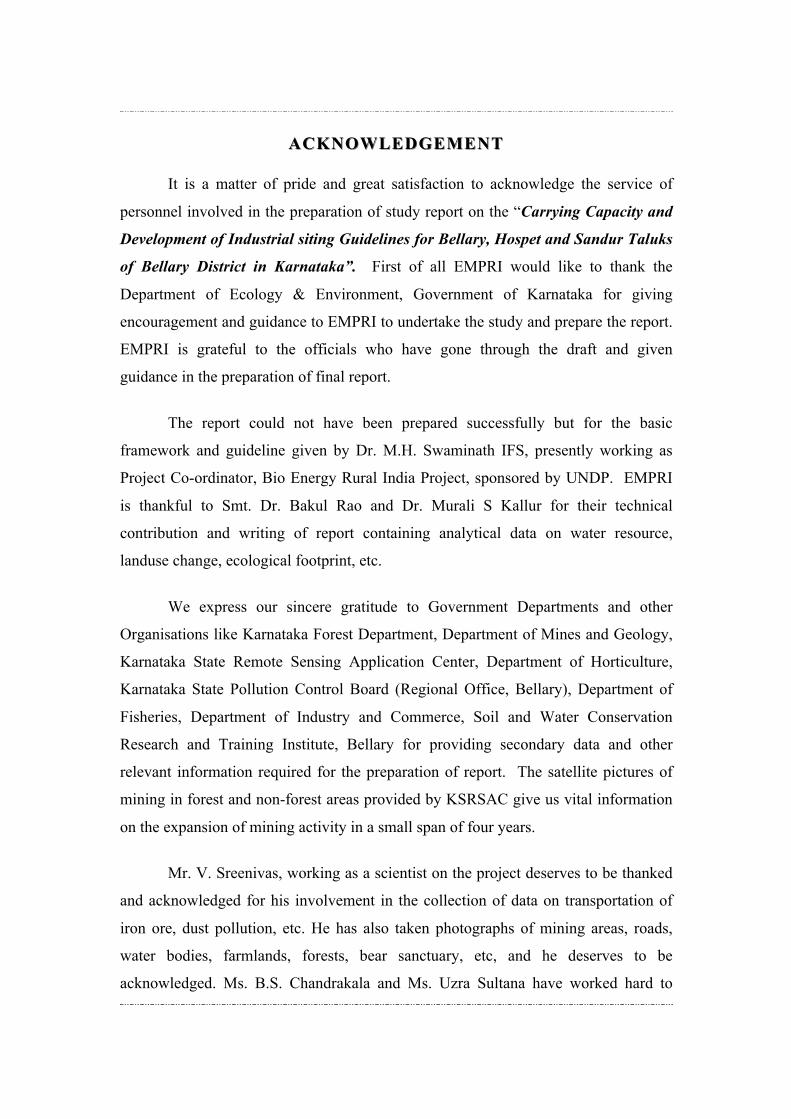
ACKNOWLEDGEMENTACKNOWLEDGEMENT
It is a matter of pride and great satisfaction to acknowledge the service of
personnel involved in the preparation of study report on the “Carrying Capacity and
Development of Industrial siting Guidelines for Bellary, Hospet and Sandur Taluks
of Bellary District in Karnataka”. First of all EMPRI would like to thank the
Department of Ecology & Environment, Government of Karnataka for giving
encouragement and guidance to EMPRI to undertake the study and prepare the report.
EMPRI is grateful to the officials who have gone through the draft and given
guidance in the preparation of final report.
The report could not have been prepared successfully but for the basic
framework and guideline given by Dr. M.H. Swaminath IFS, presently working as
Project Co-ordinator, Bio Energy Rural India Project, sponsored by UNDP. EMPRI
is thankful to Smt. Dr. Bakul Rao and Dr. Murali S Kallur for their technical
contribution and writing of report containing analytical data on water resource,
landuse change, ecological footprint, etc.
We express our sincere gratitude to Government Departments and other
Organisations like Karnataka Forest Department, Department of Mines and Geology,
Karnataka State Remote Sensing Application Center, Department of Horticulture,
Karnataka State Pollution Control Board (Regional Office, Bellary), Department of
Fisheries, Department of Industry and Commerce, Soil and Water Conservation
Research and Training Institute, Bellary for providing secondary data and other
relevant information required for the preparation of report. The satellite pictures of
mining in forest and non-forest areas provided by KSRSAC give us vital information
on the expansion of mining activity in a small span of four years.
Mr. V. Sreenivas, working as a scientist on the project deserves to be thanked
and acknowledged for his involvement in the collection of data on transportation of
iron ore, dust pollution, etc. He has also taken photographs of mining areas, roads,
water bodies, farmlands, forests, bear sanctuary, etc, and he deserves to be
acknowledged. Ms. B.S. Chandrakala and Ms. Uzra Sultana have worked hard to

prepare the tables, graphs, annexures and to design the printing of report in an
appealing and attractive manner. EMPRI is glad to appreciate their services and thank
them for their dedicated work. EMPRI is thankful to all the well-wishers including
officials and non-officials who have helped directly or indirectly in completing the
study and preparation of the project.
Mahesh. TMahesh. T General Manager General Manager –– EEMPRIMPRI
BangaloreBangalore
i
T A B L E O F C O N T E N TT A B L E O F C O N T E N T
CHAPTER-1 INTRODUCTION 1-4 1.1 Objectives & scope of study --- 2 1.2 The study area --- 3
CHAPTER-2 METHODOLOGY --- 5-11 2.1 Collection of data --- 5 2.2 Collection of secondary data --- 7 2.3 Collection of primary data --- 8 2.3.1 Ambient air --- 9 2.3.2 Water Quality --- 9 2.3.3 Soil Status --- 10 2.4 Evaluation of qualitative and quantitative impacts --- 10 2.5 Assessing changes in landuse / landcover --- 10 2.6 Identification Bio-diversity hotspots --- 10 2.7 Preparation of Environmental Management Plan (EMP) --- 11 2.8 Arriving at carrying capacity and develop industrial siting
guidelines --- 11
2.9 Feasibility of pumping from Almatti Reservoir --- 11
CHAPTER-3 PROJECT AREA --- 12-28 3.1 Background --- 12 3.2 Demography --- 12 3.3 Climate --- 12 3.4 Geology and soil --- 13 3.5 Mineral resources of Bellary district --- 17 3.5.1 Iron ore reserves --- 18 3.5.2 Manganese reserves --- 19 3.5.3 Ochres [Yellow oxides/Red oxides] --- 19 3.6 Water resources and watershed --- 19 3.7 Agriculture --- 23 3.8 Livestock --- 23 3.9 Forests --- 23 3.10 Wildlife --- 26 3.11 Pisciculture --- 26 3.12 Tourism --- 27 3.13 Human population and health --- 28
CHAPTER-4 LAND USE & LAND USE CHANGE --- 29-54 4.1 Land use change --- 29 4.1.1 Methodology --- 29 4.1.2 Data processing --- 29 4.2 Change analysis for the combined Bellary, Hospet and
Sandur region --- 30
4.2.1 Built-up --- 31 4.2.2 Cropland --- 31 4.2.3 Forest --- 31

ii
4.2.4 Mining --- 32 4.2.5 Water bodies --- 32 4.3 Talukwise land use/land cover change analysis in the study
region --- 36
4.3.1 Bellary Taluk --- 36 4.3.2 Hospet Taluk. --- 39 4.3.3 Sandur Taluk --- 42 4.4 Problems due to land use change --- 45 4.4.1 Unsustainable agricultural practices --- 45 4.4.2 Mining activity --- 45
CHAPTER-5 LAND DEGRADATION --- 55-69 5.1 Natural causes --- 55 5.2 Anthropogenic causes --- 57 5.2.1 Soil erosion --- 57 5.2.2 Fragmentation of landscape --- 63 5.2.3 Unsustainable agriculture practices --- 63 5.2.4 Salinity, alkalinity and acidity --- 65 5.2.5 Deforestation --- 65 5.2.6 Mining and Quarrying --- 66 5.3 Key findings on land degradation --- 69
CHAPTER-6 WATER DEMAND AND SUPPLY 70-85 6.1 Water resources --- 70 6.1.1 Rainfall --- 70 6.1.2 Surface water --- 71 6.1.3 Ground water --- 73 6.1.4 Availability of water --- 76 6.2 Demand for water --- 78 6.2.1 Domestic water requirement (Towns & Villages) --- 78 6.1.1 Livestock water requirement --- 78 6.1.2 Water requirement industries --- 79 6.1.3 Water requirement of Mining/Quarrying activity --- 81 6.1.4 Water requirement of agriculture sector --- 82 6.1.5 Utilization of water in study area --- 82
6.3 Demand and Supply projection of water
83
CHAPTER-7 QUALITY OF WATER AND ENVIRONMENT 86-90
CHAPTER-8 AGRICULTURE 91-104 8.1 Status --- 91 8.2 Land holding pattern --- 91 8.3 Crop area --- 92 8.4 Area under irrigation --- 92 8.5 Rainfed agriculture --- 93 8.6 Impact of agriculture on environment --- 94 8.7 Impact of mining on agriculture --- 98 8.7.1 Change in land use pattern and land degradation --- 99 8.7.2 Soil quality --- 101
iii
8.8 Restoration strategy --- 103 8.9 Conclusion --- 103
CHAPTER-9 FOREST 105-128 9.1 Background --- 105 9.2 Forest types --- 106 9.2.1 Southern tropical dry deciduous forests --- 106 9.2.2 Southern thorn scrub --- 108 9.3 Bio-diversity profile --- 112 9.3.1 Flora --- 112 9.3.2 Fauna --- 118 9.3.3 Bellary Working Plan 2004-Analysis of Forests --- 120 9.4 Change in Forest cover & forest use --- 121 9.4.1 Mining in forest area --- 123 9.5 Forest degradation --- 123 9.5.1 Degradation of habitat --- 124 9.5.2 Insufficient compensatory plantation --- 127 9.5.3 Loss of Bio-resources --- 127 9.5.4 Grazing --- 128 9.6 Conclusion --- 128
CHAPTER-10 INDUSTRIAL DEVELOPMENT AND
IMPACT ON ENVIRONMENT 129-143
10.1 Industrial area development --- 129 10.2 Distribution of industries in the district --- 130 10.2.1 Large scale industries --- 130 10.2.2 Tiny and SSI units --- 130 10.3 Distribution of industries in the study area --- 131 10.4 Industrial employment opportunity in Bellary district --- 133 10.5 Growth pattern --- 133 10.6 Industrial pollution sources --- 134 10.6.1 Air pollution --- 134 10.6.2 Water pollution --- 138 10.6.3 Waste Management --- 141
CHAPTER-11 STATUS OF ROADS 144-149 11.1 Background --- 144 11.2 Impact on roads --- 146 11.2.1 Dust Level on the road sides --- 147 11.2.2 Density of vehicles --- 148 11.2.3 Impacts of heavy vehicle movement on the roads --- 148
CHAPTER-12 HEALTH 150-155 12.1 Health scenario --- 150 12.2 Preventive safety and health measures --- 154 12.3 Bio-medical waste --- 155 CHAPTER-13 ENVIRONMENTAL IMPACT ANALYSIS
AND ENVIRONMENTAL MANAGEMENT PLAN
156-165
iv
CHAPTER-14 CARRYING CAPACITY AND ECOLOGICAL
FOOT PRINTS 166-180
14.1 Defining “Carrying Capacity” --- 166 14.2 Methodology adopted --- 166 14.3 Status in study area --- 167 14.3.1 Quality of life --- 167 14.3.2 Population --- 167 14.3.3 Income levels --- 167 14.3.4 Health status and pollution problems --- 167 14.3.5 Carrying capacityof human population --- 167 14.3.6 Primary productivity --- 168 14.3.7 Secondary productivity --- 173 14.4 Carrying capacity matrix --- 178
CHAPTER-15 FEASIBILITY OF PUMPING WATER FROM
ALAMATTI RESERVOIR 181-190
15.1 Background of Almatti Dam --- 181 15.2 NWDA report on the feasibility of diverting Almatti waters --- 183 15.3 Surface Water Balance Studies --- 187 15.4 The KWDT Award --- 187 15.5 Analysis of the NWDA Report --- 188 15.6 Further Studies --- 190 ANNEXURE (I-XXXV) --- I-LXXXIV ABBREVIATION --- LXXXV LIST OF REFERENCE LXXXVII

v
LL IST OF IST OF FF IGURESIGURES
FIGURE NO
TITLE PAGE NO
1.1 Iron ore deposit in Belagallu forest area, Bellary taluk 1 1.2 Open cast iron ore mining area in Vibhuthigudda, Bellary
taluk 1
1.3 Map of the study area 3 2.1 Satellite Image mining area in Sandur-2000 10 2.2 Mining in agriculture land –Bhujanganagar, Sandur 11 2.3 Almatti Dam 11 3.1 Lithological map of the study area 15 3.2 Soil map of the study area 16 3.3 Iron ore reef in Belagallu,Bellary 17 3.4 Quartz outcrop in Belagallu, Bellary 17 3.5 Yellow Ochre at Janikunte,Bellary 17 3.6 Watershed map of Bellary district 20 3.7 Hydrogeomorphology Map of the study area 21 3.8 Hydrogeomorphological map showing Dykes & Drainage
pattern of the study area 22
3.9 Sandur Forest 23 3.10 Forest Map of the study area 25 3.11 Daroji Bear Sanctuary 26 3.12 Pisciculture 27 3.13 Hertiage site in Hampi, Hospet 27 4.1 Land use pattern in the study area by KSRSAC-2004 33
4.2(A) Land cover map of the study area - 2000 34 4.2(B) Land cover map of the study area - 2004 35 4.3(A) Land use and land cover map of Bellary taluk - 2000 37 4.3(B) Land use and land cover map of Bellary Taluk - 2004 38
4.4 Land use change in Hospet Taluk - 2000-2004 39 4.5(A) Land use and land cover map of Hospet Taluk - 2000 40 4.5(B) Land use and land cover map of Hospet Taluka - 2004 41
4.6 Land use change in Sandur taluk - 2000-2004 42 4.7(A) Land use and land cover map of Sandur Taluk - 2000 43 4.7(B) Land use and land cover map of Sandur Taluk - 2004 44 4.8(A) Satellite imagery -2000 47 4.8(B) Satellite imagery -2004 47
4.9 Mining areas in Sandur Reserve Forest 48 4.10 Satellite images showing the concentration of mining in
forest area of Sandur taluk 48
4.11(A) Satellite image - 2000 49 4.11(B) Satellite image - 2004 49
vi
4.12(A) Part of Sandur, as viewed by IRS 1C/1D, LISS III Satellite on Dec 2000
51
4.12(B) Part of Sandur, as viewed by IRS 1C/1D, LISS III Satellite on Dec 2000
51
4.13 Mining waste dump along the hill slope 52 4.14 Dumping of mining waste along the hill slope 52 4.15 Mining dumpsites in the study area 53 4.16 Part of Sandur, as viewed by IRS 1C/1D, LISS III Satellite
on Dec 2004 54`
5.1 Mining and land degradation in Subbrayanahalli in Sandur 55 5.2 Infrastructure development for mining and land
degradation in Sandur 55
5.3 Potential Evatranspiration (PET) and water deficit pattern in Bellary district
56
5.4 Deposit of silt in streams and water bodies of mining area, Vysanakere, Hospet
57
5.5 Dust generation in Sandur mining areas 59 5.6 Sediment built up along the Tungabhadra River 60 5.7 Deposits of iron ore and mining waste in the valleys 61 5.8 Soil erosion potential map based on slope and soil type in
Bellary, Hospet and Sandur taluks 62
5.9 Drilling and dust generation 66 5.10 Drilling machine used for making blasting holes 66 5.11 Extraction of float iron ore in agriculture land, Sandur 67
5.12(A) Mining and mining waste dumps in agriculture land of Devagirihalli, Sandur taluk-2004
68
5.12(B) Agriculture land before commencement of mining activity in Devagirihalli, Sandur-2000
69
6.1 Precipitation and Evapotranspiration in Bellary district. 71 6.2 Vittalapura Tank in Bellary taluk 71 6.3 Tungabhadra Reservoir, Hospet 72 6.4 Hullikunta Tank, Sandur 72 6.5 Narihalla Reservoir, Sandur 72 6.6 Daroji Tank, Hospet 72 6.7 Water distribution diagram as per Average Annual Water
Resource of India 77
7.1 Inadequate drinking water facility in study area 86 7.2 Contamination of stream water by fine iron ore particles 86 7.3 Dried up borewell in the study area 89 8.1 Sunflower crop in Hospet 91 8.2 Maize crop in Sandur 94 8.3 Area under Fruit crops in Bellary, Hospet and Sandur
taluks 99
8.4 Area under Fruit crops in Sandur, Toranagalu & Chornur hoblies of Sandur taluk
99
8.5 Float iron ore extraction in agriculture land, Sandur 100

vii
8.6 Left over pits after extraction of iron ore in agaricultre land, Sandur
100
8.7 Mining in agricultural land, Bhujanganagar, Sandur 100 8.8 Mango crop affected by mining dust 101 8.9 Onion crop affected by mining dust 101
8.10 Decrease of mango production and value in Dharmpur Horticulture Farm, 1999-2005
101
8.11 Onion & Sunflower crops in Sandur 103 9.1 Mixed deciduous forest 106 9.2 Map showing forest cover in Bellary, Hospet and Sandur
Taluks 109
9.3 a Forest Density map of Sandur Taluk 110 9.3 b Forest density map of Hospet 111 9.3 c Forest density map of Bellary taluk 111 9.4 Mixed Forest in Sandur 112 9.5 Forest fire in Thimmappanaguddi, Sandur range 123 9.6 Degradation of forest due to mining activity 124 9.7 Fauna diversity in the study area 126 9.8 Santalum album (Sandalwood) 127
10.1 Jindal Steel factory in Toranagalu, Sandur 129 10.2 Benaka sponge iron company in Belgallu, Bellary taluk 130 10.3 Growth of industries in Bellary. 133 11.1 NH 63 Hospet-Bellary road damaged by ore transportation 145 11.2 Hospet-Sandur road damaged by ore transportation 146 11.3 Concrete road damaged by ore transportation, Sandur town 146 11.4 Open transportation of iron ore fines 147 11.5 Dust pollution caused by ore transportation 147 11.6 Wettingof road in Subbarayanahalli, Sandur 147 11.7 Chain of vehicles queued up for loading iron ore 148
viii
LL IST OF IST OF TT ABLESABLES
TABLE NO
TITLE PAGE NO
2.1 Source of secondary data 6 2.2 Parameters considered for analysis 9 3.1 Demographic information of Bellary, Sandur and Hospet taluks 12 3.2 Location of minerals deposits in Bellary district 18 3.3 Range wise Reserves of Iron Ore in million tons.t 18 3.4 Reserves of manganese ore in Karnataka (as on 1.4.1990) 19 3.5 Area covered by Agricultural and horticultural crops in the study area -
2005 23
3.6 Livestock population in the study area- 2002 23 3.7 Legal status of forest in the study area (in hectares) 24 3.8 Fish production (Metric Tons) 27 3.9 Particulars of Health facilities available in Bellary district 28 4.1 Particulars of satellite pictures 29 4.2 Land use/land cover change in the study area between 2000 & 2004 31 4.3 Land-use change analysis of Bellary taluk 36 4.4 Land-use change analysis in Hospet taluk 39 4.5 Land -use change analysis in Sandur taluk 42 4.6 Mining leases in the study area 46 4.7 Expansion of mining areas in forest during 2000 and 2004 46 5.1 Soil loss due to erosion, rain intensity and runoff in Bellary district 57 5.2 Estimated erosion potential of mining areas in different hill ranges 58 5.3 Estimated soil erosion potential in Bellary-Sandur-Hospet taluks 59 5.4 Rate of siltation of Tungabhadra dam from 1953-2004 60 5.5 Soil erosion potential in different soil types and different slopes in
Bellary-Hospet-Sandur region 62
5.6 Extent of land use types during the study period-as per satellite image 63 5.7 Area affected by salinity and alkalinity in Tungabhadra command area 65 5.8 Area under crops in Bellary, Hospet and Sandur Taluks 67 5.9 Diversion of agriculture land to mining and dumping of mining waste
in Devagirihalli 68
6.1 Rainfall (in mm) during 2004 in Bellary, Hospet and Sandur 70 6.2 List of tank in the study area 71 6.3 List of major irrigation tanks and reservoirs in the study area 73 6.4 List of watersheds in the study area 74 6.5 Taluka-wise details of groundwater recharge and exploitation 75 6.6 Groundwater level in various sampling spots in the study - 2004 75 6.7 Availability of water from various sources in the study area 76 6.8 Availability of water from various sources in the study area after
deducting evapo-transpiration and evaporation 77

ix
6.9 Requirement of water for the existing population 2001 at the rate of 55 LPCD and future projection
78
6.10 Requirement of water for livestock population - 2002 78 6.11 Requirement of water by Small scale & Tiny Industries existing in the
study area 79
6.12 Requirement of water by Medium & Large Industries existing in the study area
80
6.13 Requirement of water by the mining industry at the rate of 86845 m3/million tone-2004-05
81
6.14 Requirement of water for crops under different irrigation systems - 2004-05 in the study area
82
6.15 Demand of water by various sectors in the study area- 2004-05 82 6.16 Demand, Supply of water considering 2% increase in population and
1% increase in agriculture in Bellary taluk 83
6.17 Demand, Supply of water considering 2% increase in population and 1% increase in agriculture in Sandur taluk
83
6.18 Demand, Supply of water considering 2% increase in population and 1% increase in agriculture in Hospet taluk
84
7.1 Contamination of water by excess salts in 74 villages of the study area 87 7.2 Quality of water in Bellary taluk -2004-05 87 7.3 Quality of water in Bellary taluk -2005-06 88 7.4 Quality of water in Sandur taluk -2004-05 88 7.5 Quality of water in Sandur taluk -2005-06 88 7.6 Quality of water selected villages in Sandur Taluk -2005-06 89 8.1 Land holding pattern in Bellary district 92 8.2 Irrigation of land by different sources (ha) 93 8.3 Area under rain fed crops and irrigated crops in Bellary district - 2004-
05. 93
8.4 Comparison of yield in Bellary district and Karnataka state (in quintals /acre)
94
8.5 Consumption of chemical fertilizer in Bellary district 96 8.6 Livestock population in Bellary-Hospet-Sandur region 98 8.7 Area affected by salinity and alkalinity 98 8.8 Status of soil fertility in Bellary district -2005-06 102 8.9 Analysis of soil quality in Bellary district. 102 9.1 Rangewise distribution of forests in the study area 106 9.2 The detailed list of flora in Bellary region 113 9.3 Medicinal plant and other species available in Bellary region 116 9.4 Medicinal plant species identified in Sandur MPCA 116 9.5 Rare Endangered and Threatened Species recorded in Sandur MPCA 117 9.6 The list of fauna existing in Bellary region 118 9.7 Forest products collected in Bellary division. 121 9.8 Mining in forest area 123 9.9 Summary of Compensatory Plantation raised in Bellary Forest
Division from 1994 to 2006 127
x
10.1 Development of Industrial area by KIADB and KSSIDC in the study area
129
10.2 Category of industries in the study region 132 10.3 List of active mines in study area 132 10.4 Production of minerals in the study area- 2004-05 132 10.5 Classification of industries based on their air/water pollution potential 134 10.6 The Ambient air quality data of four different types of industries 134 10.7 Seasonal ambient air quality in JSVL from October 2002 to December
2002 136
10.8 Ambient Air Quality status of the surrounding area of JVSL Plant and JSW Steels Ltd
136
10.9 Ambient air quality analysis 137 10.10 Water Consumption of large red industries in the study area 138 10.11 Water pollution potentiality of Jeans Industry in the study area 139 10.12 List of industries which adopted air and water pollution control
measures 139
10.13: Results of the Industrial effluent of some major industries in the study area
140
10.14 Quantity of Hazardous waste generated annually in Bellary 142 10.15 Quantity of Hazardous Waste generated -2004 and 2005 142 10.16 Quantity of hazardous waste generated in Jindal Vijayanagara Steel
industry 143
10.17 Type and quantity of Industrial waste generated in the study area 143 11.1 Details of Roads in the study area - 2003-04 144 11.2 Motor vehicles registered in Bellary District (As on 31st December
2005) 145
11.3 Implications of bad roads on environment 149 12.1 Area and population in the study area as per 2001 census 150 12.2 Details of health care centers in the study area 151 12.3 Leprosy control programme 2003-04 151 12.4 TB control programme 2003-04 152 12.5 Number of patients identified and cured for malaria and cancer in the
study area 152
12.6 People with disability in rural and urban regions of Bellary District 153 12.7 Incidence of leprosy and tuberculosis in the study region and in
Bellary district 153
12.8 Some proposed safety and health issues 154 12.9 Status of bio-medical waste in Bellary, Hospet & Sandur taluks 155 13.1 Environmental Impact and Mitigation Options 157 14.1 Land use pattern in the study area 169 14.2 Satellite imagery showing land use pattern in Bellary, Hospet and
Sandur taluks- 2004. 169
14.3 Productivity of forest in the study region 170 14.4 Calculation of ecological footprint 172 14.5 Summary of Ecological Footprint in Bellary-Hospet-Sandur Region 172 14.6 Ecological footprint of different countries 173

xi
14.7 Productivity of land and optimum requirements of resources 174 14.8 Allocation and utilization of water in different river basins of
Karnataka 176
14.9 Requirement of water by different sectors 177 15.1 Principal levels and corresponding storages of Almatti reservoir 181 15.2 Sailent features of the upper krishna project stage I and stage II 182 15.3 Surface water balance 187 15.4 State-wise water allocation as per KWDT Award 187

Study on Carrying Capacity to develop Industrial Siting Guidelines in Bellary, Hospet and Sandur region
Environmental Management And Policy Research Institute 1
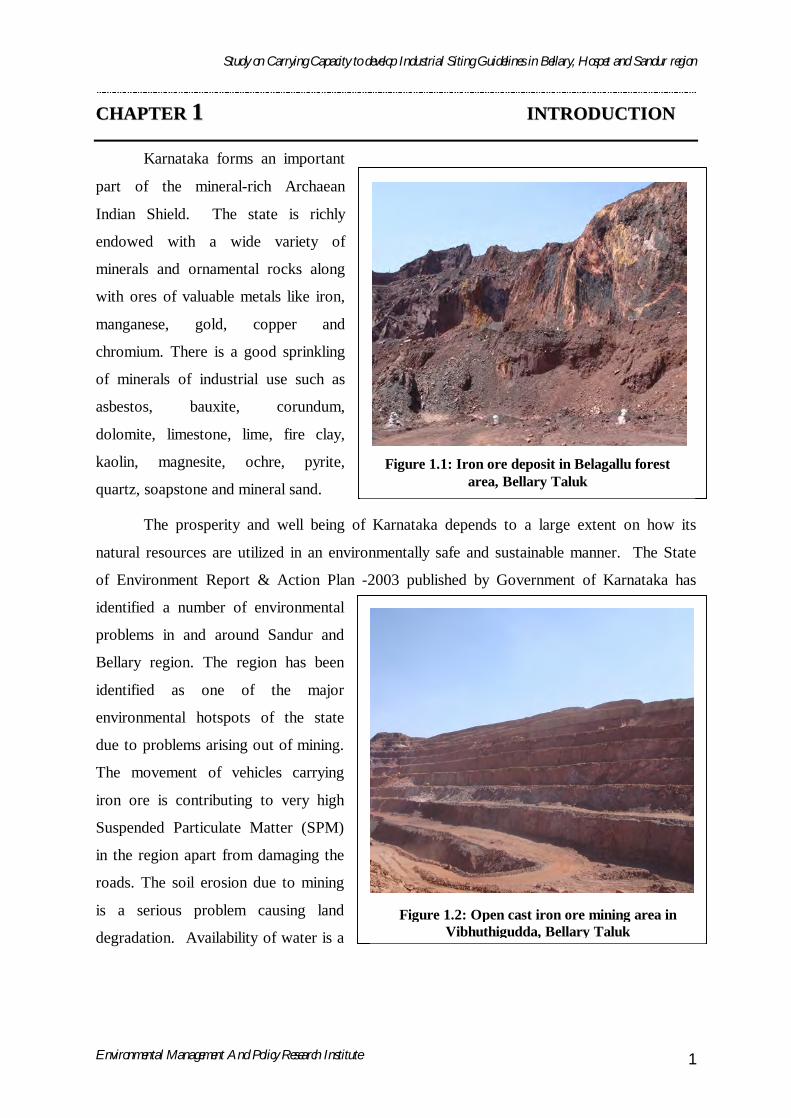
Figure 1.1: Iron ore deposit in Belagallu forest area, Bellary Taluk
Figure 1.2: Open cast iron ore mining area in Vibhuthigudda, Bellary Taluk
CCHHAAPPTTEERR 11 IINNTTRROODDUUCCTTIIOONN
Karnataka forms an important
part of the mineral-rich Archaean
Indian Shield. The state is richly
endowed with a wide variety of
minerals and ornamental rocks along
with ores of valuable metals like iron,
manganese, gold, copper and
chromium. There is a good sprinkling
of minerals of industrial use such as
asbestos, bauxite, corundum,
dolomite, limestone, lime, fire clay,
kaolin, magnesite, ochre, pyrite,
quartz, soapstone and mineral sand.
The prosperity and well being of Karnataka depends to a large extent on how its
natural resources are utilized in an environmentally safe and sustainable manner. The State
of Environment Report & Action Plan -2003 published by Government of Karnataka has
identified a number of environmental
problems in and around Sandur and
Bellary region. The region has been
identified as one of the major
environmental hotspots of the state
due to problems arising out of mining.
The movement of vehicles carrying
iron ore is contributing to very high
Suspended Particulate Matter (SPM)
in the region apart from damaging the
roads. The soil erosion due to mining
is a serious problem causing land
degradation. Availability of water is a

Study on Carrying Capacity to develop Industrial Siting Guidelines in Bellary, Hospet and Sandur region
Environmental Management And Policy Research Institute 2
serious problem in Bellary district as the area falls under semi-arid to arid zone. The rainfall
is scanty, the droughts are frequent and the over exploitation of groundwater as resulted in the
depletion of ground water table in the region.
In this background, the study of carrying capacity of Bellary-Sandur-Hospet taluks to
understand the sensitivity of ecosystem and to determine the type of various land use
activities that can be undertaken without damaging the environment and sustainability of
natural resources was initiated by Environmental Management & Policy Research Institute
(EMPRI) .The study is funded by the Department of Ecology and Environment, Government
of Karnataka vide letter dated. 13.03.2005 GO No FEE 07.ENV 2005(1).
1.1 Objectives and scope of study
In the background of environmental sensitivity prevailing in Bellary-Sandur-Hospet
region the study of carrying capacity is essential to understand the ecosystem of the region
and to determine the type of various land use activities that can be undertaken without
damaging the environment and sustainability of natural resources. Further, the feasibility
study on the industrial establishment in the region would be useful to regulate the industrial
growth without affecting the environment. The specific objectives of the present study are as
follows:
1. To develop the baseline data of environmental parameters (including dust pollution)
and to assess the current environmental status duly considering the industrial and
other land use activities.
2. To identify the critical ecosystems and bio-diversity hotspots in the region.
3. To develop the Industrial Siting Guidelines to the region from the point of
environmental safety and sustainability of natural resources.
4. To arrive at a feasibility report of pumping of water from Alamatti reservoir to the
study region for industrial needs.
5. To survey the impact of industries and mining activities on the health of nearby
villagers and workers in the mining area.
6. To determine the carrying capacity of Sandur, Hospet and Bellary taluks for
regulating industrial growth and development.
7. To study the damage caused to roads, culverts etc, by transportation of iron and
manganese ore.

Study on Carrying Capacity to develop Industrial Siting Guidelines in Bellary, Hospet and Sandur region
Environmental Management And Policy Research Institute 3
Figure 1.3: Map of the study area
8. To study the facilities available to safeguard the health of workers in the mining area,
their well being including health insurance coverage.
The scope of study is to arrive at the Carrying Capacity and to develop the industrial
siting guidelines for Sandur, Hospet and Bellary regions in Bellary district of Karnataka
State. It also includes assessment of the impact of mining and other interlinked industrial
activities on various environmental components like air, noise, water, land and social life of
people.
1.2 The study area
The study area located in the eastern part of Karnataka is well known for its rich iron
and manganese ore reserves. The minerals are being exploited on a large scale since 1907.
The entire region is hilly with varying elevation from 700 to 1100 m. Topographically the
study area is having rugged terrain covered with scanty vegetation.
The total area
of Bellary district is
8419 sq km of which
16.28% is forest.
The study area
involving 3 taluks is
approximately 3700
sq km with an area of
960 sq km as mineral
deposits. The iron
and manganese ores
are confined to 8
mountain ranges,
namely, Copper Mountain (Vibhuthigudda), Donimalai, Ettinahatti, Kumaraswamy,
Thimmappanagudi, Ramandurg (Ramgad), North Eastern Block (NEB) and Devagiri ranges.
Sandur basin is rich in iron ore followed by manganese ore. It is also known as
Sandur Schist Belt, which falls in Bellary-Sandur-Hospet sectors. Sandur Schist Belt is one
of the 5 Schist belts of Dharwar type formation. The Dharwar type Schist belt marks the
transition from Archaean to Proterozoic era belonging to the age group of 2900-2600 million
Study on Carrying Capacity to develop Industrial Siting Guidelines in Bellary, Hospet and Sandur region
Environmental Management And Policy Research Institute 4
years. In Sandur Schist Belt the iron and manganese deposits are concentrated along the
hilltop and ridges ranging between 600-1100m in altitude.

Study on Carrying Capacity to develop Industrial Siting Guidelines in Bellary, Hospet and Sandur region
Environmental Management And Policy Research Institute 5
CCHHAAPPTTEERR 22 MMEETTHHOODDOOLLOOGGYY
In order to achieve the objectives envisaged in the Govt. order an integrated approach
involving meteorological, remote sensing, hydro-geochemical, geological, ecological,
agricultural, biological and related scientific approaches have been adopted. The
methodology adopted for achieving the objectives is briefly discussed here.
1. Review of literature published by various government departments and other
authentic sources was carried out.
2. Collection of secondary data from various government departments and
organizations was carried out.
3. Collection of primary data on environmental parameters like air, water and
soil was carried out.
4. Assessment of landuse and landcover status and changes noticed between
2000 and 2004 in the study area by using satellite imageries was carried out.
5. Enumeration & evaluation of qualitative and quantitative impacts due to
mining, industrial activity, agriculture and municipalities on various
environmental components i.e., physical, chemical, biological, ecological,
geological, socio-economic, human health, etc., was carried out.
6. Identification of various ecosystems and bio-diversity hotspots was carried
out.
7. Estimation of Carrying Capacity to develop the industrial siting guidelines in
the study area was carried out.
8. Preparation of Environmental Management Plan (EMP) outlining the
measures for minimizing the environmental pollution and to improve the
environmental quality was formulated.
9. Feasibility of pumping water from Almatti reservoir to Bellary district was
assessed.
2.1 Collection of data
The list of data obtained from various Departments of Government and Institutions related to
the study area is give in Table 2.1 below
Study on Carrying Capacity to develop Industrial Siting Guidelines in Bellary, Hospet and Sandur region
Environmental Management And Policy Research Institute 6
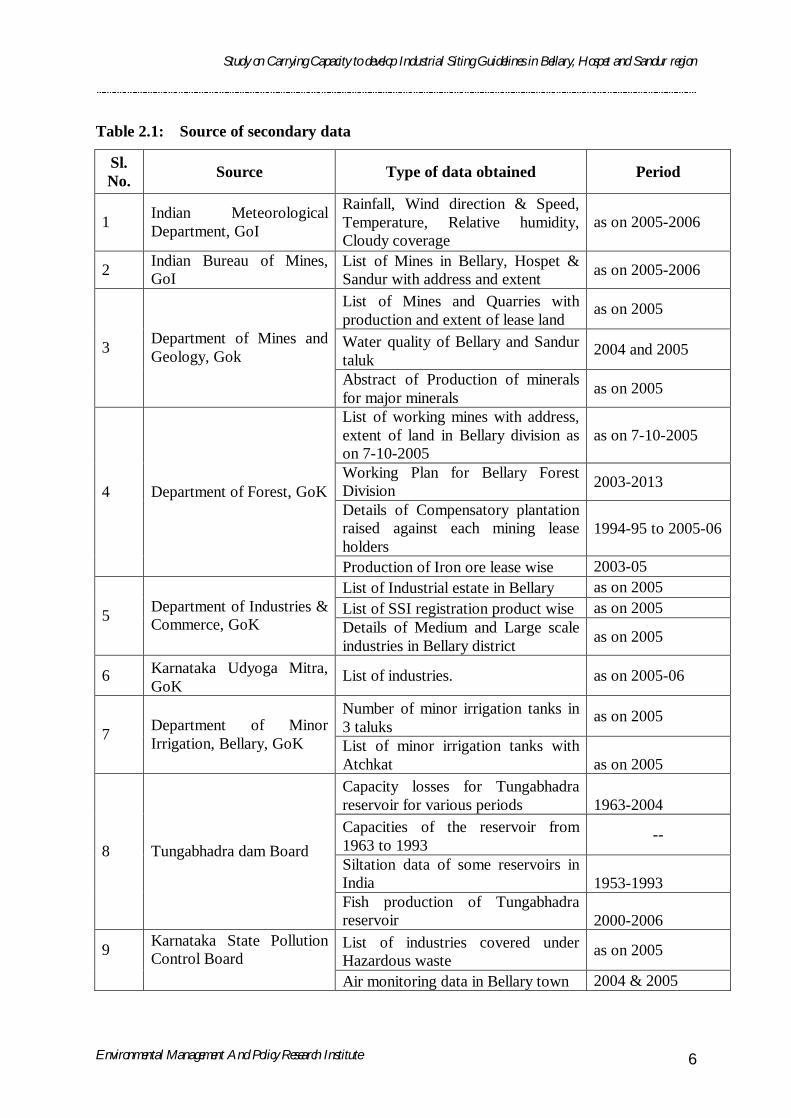
Table 2.1: Source of secondary data
Sl. No. Source Type of data obtained Period
1 Indian Meteorological Department, GoI
Rainfall, Wind direction & Speed, Temperature, Relative humidity, Cloudy coverage
as on 2005-2006
2 Indian Bureau of Mines, GoI
List of Mines in Bellary, Hospet & Sandur with address and extent as on 2005-2006
List of Mines and Quarries with production and extent of lease land
as on 2005
Water quality of Bellary and Sandur taluk
2004 and 2005 3 Department of Mines and Geology, Gok
Abstract of Production of minerals for major minerals as on 2005
List of working mines with address, extent of land in Bellary division as on 7-10-2005
as on 7-10-2005
Working Plan for Bellary Forest Division 2003-2013
Details of Compensatory plantation raised against each mining lease holders
1994-95 to 2005-06
4 Department of Forest, GoK
Production of Iron ore lease wise 2003-05 List of Industrial estate in Bellary as on 2005 List of SSI registration product wise as on 2005 5 Department of Industries &
Commerce, GoK Details of Medium and Large scale industries in Bellary district as on 2005
6 Karnataka Udyoga Mitra, GoK
List of industries. as on 2005-06
Number of minor irrigation tanks in 3 taluks
as on 2005 7 Department of Minor
Irrigation, Bellary, GoK List of minor irrigation tanks with Atchkat as on 2005 Capacity losses for Tungabhadra reservoir for various periods 1963-2004 Capacities of the reservoir from 1963 to 1993
--
Siltation data of some reservoirs in India 1953-1993
8 Tungabhadra dam Board
Fish production of Tungabhadra reservoir 2000-2006 List of industries covered under Hazardous waste
as on 2005 9 Karnataka State Pollution Control Board
Air monitoring data in Bellary town 2004 & 2005
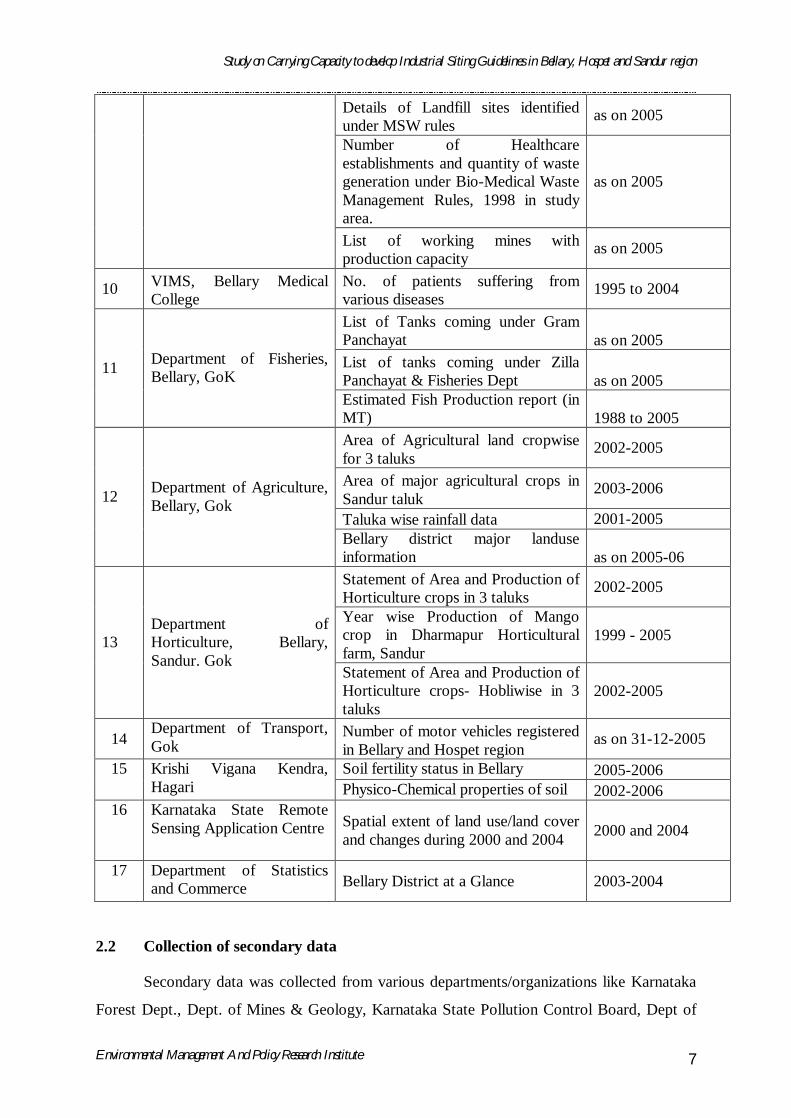
Study on Carrying Capacity to develop Industrial Siting Guidelines in Bellary, Hospet and Sandur region
Environmental Management And Policy Research Institute 7
Details of Landfill sites identified under MSW rules
as on 2005
Number of Healthcare establishments and quantity of waste generation under Bio-Medical Waste Management Rules, 1998 in study area.
as on 2005
List of working mines with production capacity
as on 2005
10 VIMS, Bellary Medical College
No. of patients suffering from various diseases
1995 to 2004
List of Tanks coming under Gram Panchayat as on 2005 List of tanks coming under Zilla Panchayat & Fisheries Dept as on 2005
11 Department of Fisheries, Bellary, GoK
Estimated Fish Production report (in MT) 1988 to 2005 Area of Agricultural land cropwise for 3 taluks
2002-2005
Area of major agricultural crops in Sandur taluk
2003-2006
Taluka wise rainfall data 2001-2005 12 Department of Agriculture,
Bellary, Gok
Bellary district major landuse information as on 2005-06 Statement of Area and Production of Horticulture crops in 3 taluks
2002-2005
Year wise Production of Mango crop in Dharmapur Horticultural farm, Sandur
1999 - 2005 13 Department of Horticulture, Bellary, Sandur. Gok
Statement of Area and Production of Horticulture crops- Hobliwise in 3 taluks
2002-2005
14 Department of Transport, Gok
Number of motor vehicles registered in Bellary and Hospet region
as on 31-12-2005
Soil fertility status in Bellary 2005-2006 15 Krishi Vigana Kendra, Hagari Physico-Chemical properties of soil 2002-2006
16 Karnataka State Remote Sensing Application Centre Spatial extent of land use/land cover
and changes during 2000 and 2004 2000 and 2004
17 Department of Statistics and Commerce Bellary District at a Glance 2003-2004
2.2 Collection of secondary data
Secondary data was collected from various departments/organizations like Karnataka
Forest Dept., Dept. of Mines & Geology, Karnataka State Pollution Control Board, Dept of
Study on Carrying Capacity to develop Industrial Siting Guidelines in Bellary, Hospet and Sandur region
Environmental Management And Policy Research Institute 8
Agriculture, Dept. of Horticulture, Central Soil and Water Conservation Research and
Training Institute, Dept. of Industries and Commerce, Dept. of Fisheries, District Health
Center, Dept. of Minor Irrigation, Regional Transport Department, Bellary Zilla Panchayat,
etc., The following data was procured from the concerned departments/centers/institutes:
1. Data on Ambient air quality of the study area was obtained from various sources
including the study carried out by NEERI, KSPCB.
2. Meteorological data such as maximum and minimum temperature, relative humidity,
wind direction, wind velocity and rainfall was collected from secondary sources.
3. Data on noise level in respect of mining and residential area was obtained from
NEERI report 2004.
4. Data and information from various departments / organizations of Government such
as Forest, Agriculture, Horticulture, Animal husbandry, Fisheries was collected to
know the biological environment condition. The status of existing fauna and flora of
different species in the study area was identified by conducting survey.
5. Data on demographic pattern, population density, literacy level, sex ratio, education
facilities, health & medical facilities, existing amenities & socio-economic status was
collected. The census data of 1991 & 2001 were referred to get a comprehensive
report.
6. The spatial information on landuse /landcover and their changes in various classes
like built-up area, forest, mining, cropping area, waste land, water bodies, etc., has
been prepared by KSRSAC by studying the satellite imageries of 2000 & 2004 for
EMPRI.
2.3 Collection of primary data
For the purpose of assessing the present environmental status of the study area, a
monitoring schedule was prepared to generate the primary baseline data on ambient air
quality, dust fall, quality of ground and surface water, soil quality, noise level and
meteorological parameters. The primary data on flora and fauna, socio-economic status, land
use pattern, agricultural and horticultural crops, geology, etc., was carried out through field
survey.
Study on Carrying Capacity to develop Industrial Siting Guidelines in Bellary, Hospet and Sandur region
Environmental Management And Policy Research Institute 9
2.3.1 Ambient air
The number of sampling stations for monitoring ambient air quality was identified
from the study area (i.e., mining areas, roads, drilling & screening areas, site of loading &
unloading of ore, industrial location and residential area) considering the prevailing
meteorological condition. The following air quality monitoring stations were selected.
1. Donimalai mining area in the forest
2. Sandur-Hospet road 3. Venkatagiri village road covering adjacent agriculture fields
4. Jogga village away from mining area as a control. The parameters were monitored on 24-hour average basis for determining the
Suspended Particulate Matter (SPM), Respirable Suspended Particulate Matter (RSPM),
Sulphur dioxide (SO2) and Oxides of Nitrogen (NOx). Monitoring of ambient air quality was
done by Richardson & Cruddas (1972) Ltd for one season (winter/summer) using Envirotech
High Volume sampler and Envirotech Respirable dust sampler, for EMPRI. The standard
methods followed are as listed below.
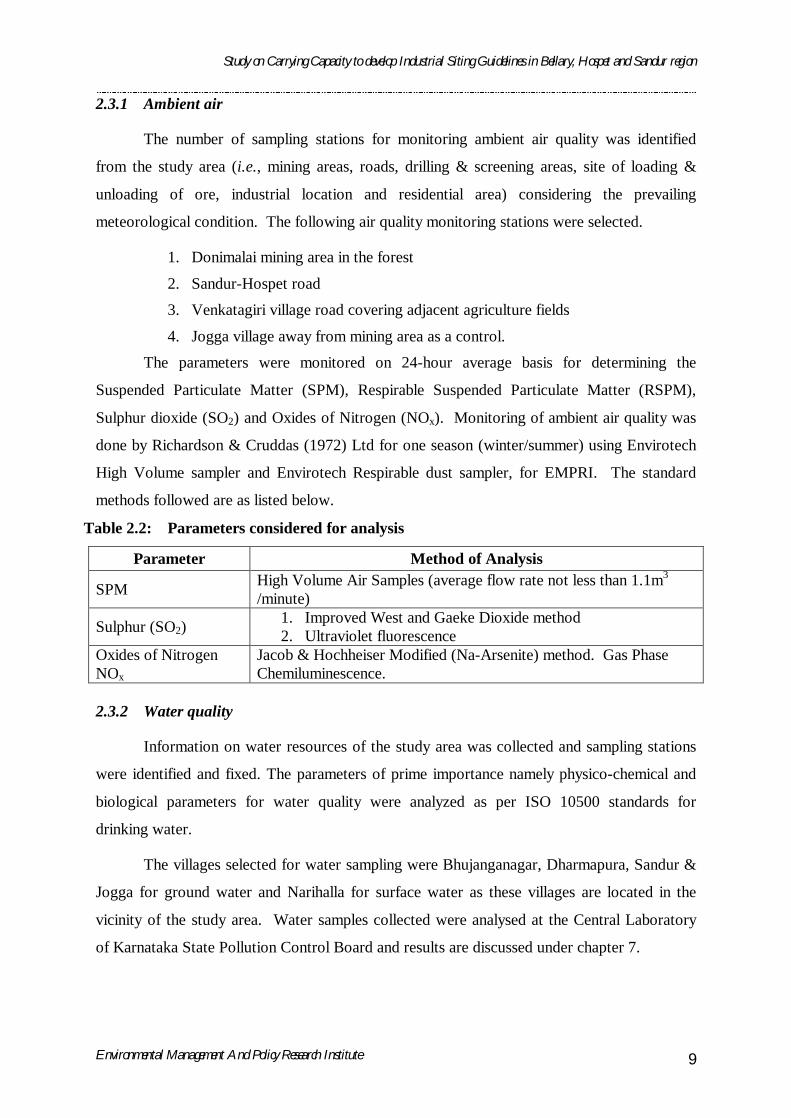
Table 2.2: Parameters considered for analysis
Parameter Method of Analysis
SPM High Volume Air Samples (average flow rate not less than 1.1m3
/minute)
Sulphur (SO2) 1. Improved West and Gaeke Dioxide method 2. Ultraviolet fluorescence
Oxides of Nitrogen NOx
Jacob & Hochheiser Modified (Na-Arsenite) method. Gas Phase Chemiluminescence.
2.3.2 Water quality
Information on water resources of the study area was collected and sampling stations
were identified and fixed. The parameters of prime importance namely physico-chemical and
biological parameters for water quality were analyzed as per ISO 10500 standards for
drinking water.
The villages selected for water sampling were Bhujanganagar, Dharmapura, Sandur &
Jogga for ground water and Narihalla for surface water as these villages are located in the
vicinity of the study area. Water samples collected were analysed at the Central Laboratory
of Karnataka State Pollution Control Board and results are discussed under chapter 7.

Study on Carrying Capacity to develop Industrial Siting Guidelines in Bellary, Hospet and Sandur region
Environmental Management And Policy Research Institute 10
Figure 2.1: Satellite Image of mining area in Sandur-2000
2.3.3 Soil status
Soil samples were collected from the locations representing agricultural, forest and
wastelands ecosystems. Analysis of samples was carried out to determine the fertility of soil
and cropping pattern, changes and production.
2.4 Evaluation of qualitative and quantitative impacts
With the collection of secondary and primary data, the sources, nature and magnitude
of pollution was identified and environmental impact was predicted to develop the
environmental management plan to maintain and enhance the quality of environment in the
study area. While determining the qualitative and quantitative impacts on environment the
use of standard methods like matrices and weightage approaches were taken into
consideration to rank, rate or scale the impacts.
2.5 Assessing changes in landuse / landcover
Since the area selected for study is
large in extent it was decided to use the
remote sensing technique for understanding
the environmental problems and also to
assess the landuse and landcover status and
changes occurring over a period of time.
The work was entrusted to Karnataka State
Remote Sensing Application Center. By
using the satellite images IRS-1C of LISS
III 2000 and 2004 procured from National
Remote Sensing Agency (NRSA),
Hyderabad, the landuse/landcover
classification was done based on the image
interpretation. The classes include built-up
area, forest land, area under mining and quarrying, agriculture, cropping pattern, waste land,
transportation network, water bodies and estimation of changes that have taken place between
2000 and 2004.
2.6 Identification of bio-diversity hotspots
Survey was carried out keeping in view the forest cover with scrub vegetation
overburden dumps, medicinal plants, wildlife species, species of birds, insects pests,
Study on Carrying Capacity to develop Industrial Siting Guidelines in Bellary, Hospet and Sandur region
Environmental Management And Policy Research Institute 11
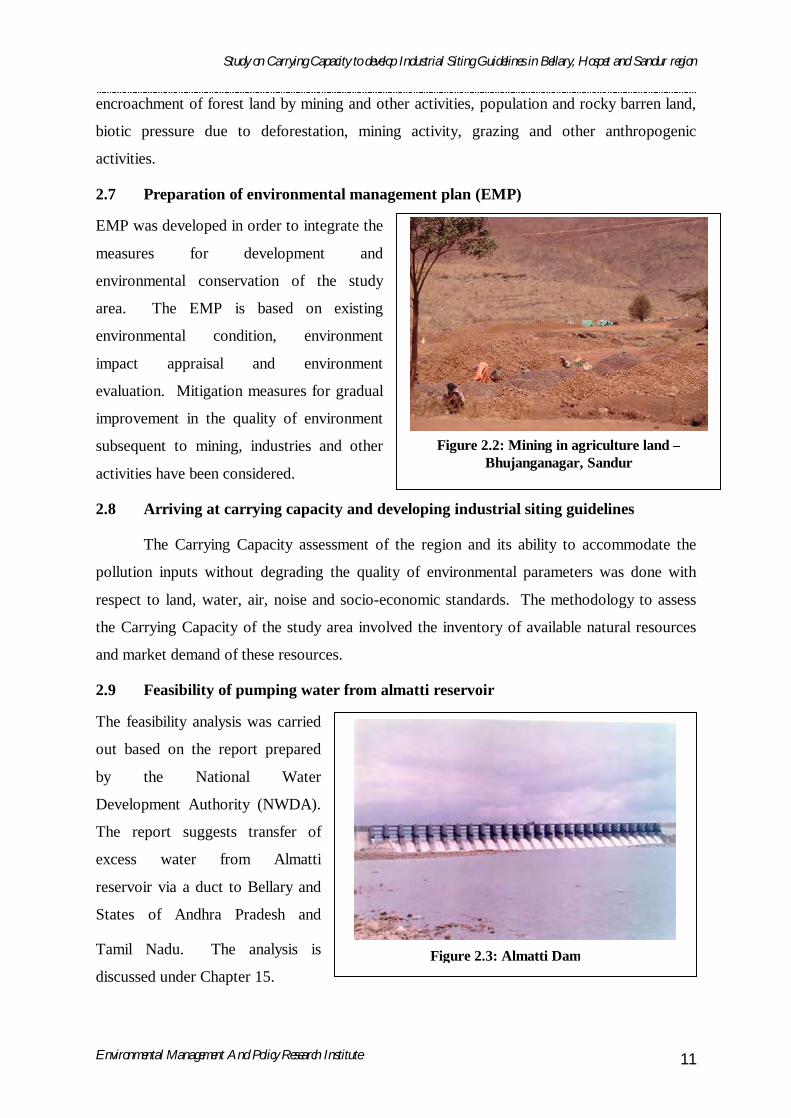
Figure 2.2: Mining in agriculture land –Bhujanganagar, Sandur
Figure 2.3: Almatti Dam
encroachment of forest land by mining and other activities, population and rocky barren land,
biotic pressure due to deforestation, mining activity, grazing and other anthropogenic
activities.
2.7 Preparation of environmental management plan (EMP)
EMP was developed in order to integrate the
measures for development and
environmental conservation of the study
area. The EMP is based on existing
environmental condition, environment
impact appraisal and environment
evaluation. Mitigation measures for gradual
improvement in the quality of environment
subsequent to mining, industries and other
activities have been considered.
2.8 Arriving at carrying capacity and developing industrial siting guidelines
The Carrying Capacity assessment of the region and its ability to accommodate the
pollution inputs without degrading the quality of environmental parameters was done with
respect to land, water, air, noise and socio-economic standards. The methodology to assess
the Carrying Capacity of the study area involved the inventory of available natural resources
and market demand of these resources.
2.9 Feasibility of pumping water from almatti reservoir
The feasibility analysis was carried
out based on the report prepared
by the National Water
Development Authority (NWDA).
The report suggests transfer of
excess water from Almatti
reservoir via a duct to Bellary and
States of Andhra Pradesh and
Tamil Nadu. The analysis is
discussed under Chapter 15.


Study on Carrying Capacity to develop Industrial Siting Guidelines in Bellary, Hospet and Sandur region
Environmental Management And Policy Research Institute 12
CCHHAAPPTTEERR 33 PPRROOJJEECCTT AARREEAA
3.1 Background
Bellary district is located in the eastern part of Karnataka State and has a geographical
area of 8,419 sq. kms. It is bounded by Raichur, Koppal and Gadag districts on the northern
side, Haveri district on the western side, Davanagere district on the southwestern side,
Chitradurga district on the southern side. It is bordered by Anantapur and Kurnool districts
of Andhra Pradesh on the eastern side. It lies between 750 42 to 770 10 E Longitude and 140
33 to 150 50 N Latitude. The total area of Bellary district is 8419 km2 of which 16.28% is
forest. The total study area is 3745.18 km2 with Hospet taluk having 904.17 km2, Bellary
taluk with 1688.59 km2 and Sandur taluk with 1152.42 km2.
3.2 Demography
Bellary district has seven taluks viz. Bellary, Hagaribommanahalli, Hospet,
Huvinahadagali, Kudligi, Sandur and Siraguppa. The demographic details of the study area
in comparison with Bellary district according to 2001 census are summarized below:
Table 3.1: Demographic information of Bellary, Sandur and Hospet taluks
Literacy Rate % Area Name
Geo
grap
hica
l A
rea
(Km
2 )
Tot
al n
umbe
r of
hou
seho
lds
Popu
latio
n
Sex
Rat
io (
per
1000
mal
e)
Male Female Total Gra
m
Panc
haya
ts*
Cen
sus V
illag
e
Den
sity
(/km
2 ) U
rban
po
pula
tion
%
Bellary Dist. 3745.18 368,360 2027140 970 69.20 45.30 57.40 189 524 238 34.9 Hospet 904.17 69,319 374949 977 71.60 50.00 60.91 40 68 401 59.1 Bellary 1688.59 113,747 625494 961 70.80 48.20 59.70 23 99 370 50.6 Sandur 1152.42 35,114 191166 945 65.50 40.40 53.30 21 76 152 17.9
*Note: The project area consists of 84 Gram Panchayats in the 3 talukas, source: District at a Glance, 2003-2004
Among the three talukas, Sandur taluk is having rural setup with low population
density and has lower literacy rate than the district average.
3.3 Climate
Bellary district is part of the northern maidan region with an extensive undulating
plateau receiving an annual rainfall ranging from 350mm to 650 mm with an average rainfall
of 574.9mm. Bellary district is having temperatures varying between 220 and 430C. It is
grouped under the northern dry zone as per agro-climatic classification of Karnataka. Bellary

Study on Carrying Capacity to develop Industrial Siting Guidelines in Bellary, Hospet and Sandur region
Environmental Management And Policy Research Institute 13
is further classified as agro-eco-sub-region-l having hot arid climate and length of growing
period of less than 90 days in a year. Major portion of the district is covered by red and black
soils. Hagari and Tungabhadra rivers drain the district. Of the major reservoirs, Tungabhadra
reservoir is located along the district border in Hospet and Hagaribommanahalli taluks.
Bellary region experiences hot and dry climate with the December mean maximum
temperature being 29.70C and the mean minimum temperature being 160C. The lowest
minimum temperature of 10.6 0C was recorded in the year 1891 and 1926.
Bellary, Hospet and Sandur talukas of Bellary district get an annual average rainfall of
439.8mm, 699 mm and 715.6 mm respectively. However, during the past 16 years all the
talukas have received deficit rainfall in seven out of ten years. The average rainfall in the
study area is 574 mm, which occurs from June to September during the Southwest monsoon.
October and November are the months of retreating monsoon. Sixty percent of the rainfall
occurs from June to September, about 24 % of rainfall occurs from October to November and
the remaining 16 % of rainfall occurs as sporadic rainfall.
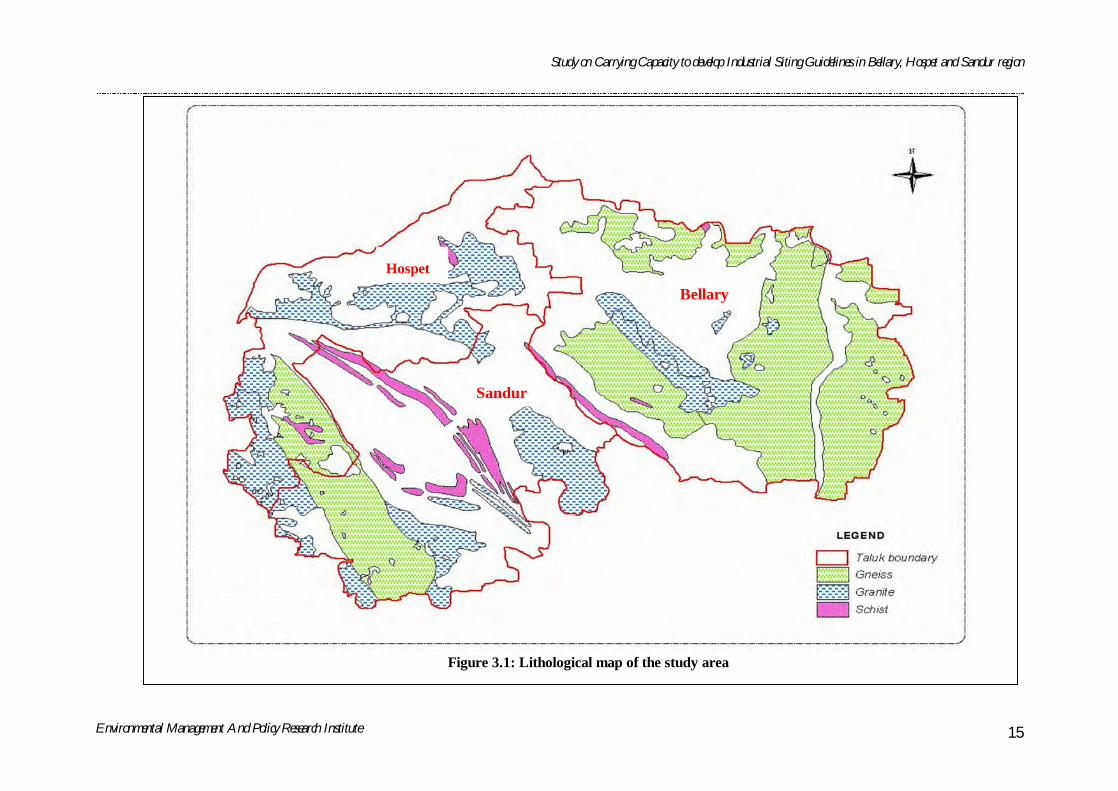
3.4 Geology and Soil
Rock formations of Bellary district mainly consist of gneiss and granite. The
fracture/fissure system developed along with joints and faults traversing the rocks facilitate
groundwater circulation and hold moderate quantity of water. The schistose rocks belonging
to Sandur Schist belt even with well-developed schistosity are relatively impermeable, poor
aquifers and yield very less quantity of water of poorer quality. Groundwater occurs in the
weathered and decomposed mantle and also under semi-confined conditions in the deeper
fractures.
In the study area of 3745.18 km2, around 960 km2 area is covered with various
mineral deposits distributed over 8 mountain ranges of Sandur Schist Belt, namely 1). Copper
Mountain Range, 2). Yettinahatti Range, 3). Thimmappanagudi Range, 4). NEB Range, 5).
Ramanadurga Range, 6). Donimalai Range, 7). Devadari Range, and 8). Kumaraswamy
Range. The “Sandur Schist Belt”, also called as ‘Sandur Basin’ is well known for its rich
accumulation of both Iron and Manganese ores.
Of the three basins in the state namely, Shimoga, Chitradurga and Sandur basins,
Sandur basin is the smallest. The age of Sandur schist belt is estimated to be between 3000
and 2600 million years. In Sandur Basin four formations have been distinguished namely,
Yeshwantapur, Deogiri, Donimalai and Nandihalli formations. The Yeshwantapur formation

Study on Carrying Capacity to develop Industrial Siting Guidelines in Bellary, Hospet and Sandur region
Environmental Management And Policy Research Institute 14
is largely composed of volcanic flows, the Deogiri formation by manganiferous greywacke-
argillite, and Donimalai formation by extensive development of banded haematite and
magnetite chert and jasper. The top most formation, the Nandihalli formation is made up of
meta basalts with interculated bands of greywacke and argillites. Lateralization has played an
important role in the concentration of iron and manganese in the profile, giving rise to rich
accumulation of iron and manganese ores for which this schist belt is famous. Recent studies
show that Vibhuti Gudda formation is the youngest followed by Taluru, Donimalai, Raman
Malai, Deogiri formation, while Yeshwantnagar formation is the oldest.
The soils in the study region are red sandy loam to black cotton soils. The black
cotton soil occurs over wide stretches of land in Bellary and Hoovinahadgali taluks. Red
sandy loam occurs in Hospet, Hoovinahadgali, Kudligi and Sandur taluks along the banks of
Tungabhadra and Hagari rivers. The reddish brown soil occurs due to decomposition of
rocks. Generally there is very little organic matter in the soil. Soils are shallow supporting
poor vegetation. The black soils of Tungabhadra project area are two to four feet deep, heavy
in texture with 45-55% clay and contain free calcium carbonate throughout the profile. There
is generally a zone of salt concentration in the soil profile at a depth of 45 to 90 cm, the
principal salt being gypsum. Below the gypsum occurs murram, which is practically
impermeable to water.
Study on Carrying Capacity to develop Industrial Siting Guidelines in Bellary, Hospet and Sandur region
Environmental Management And Policy Research Institute 15
Figure 3.1: Lithological map of the study area
Hospet
Sandur
Bellary

Study on Carrying Capacity to develop Industrial Siting Guidelines in Bellary, Hospet and Sandur region
Environmental Management And Policy Research Institute 16
Figure 3.2: Soil map of the study area
Bellary
Sandur
Hospet
Study on Carrying Capacity to develop Industrial Siting Guidelines in Bellary, Hospet and Sandur region
Environmental Management And Policy Research Institute 17
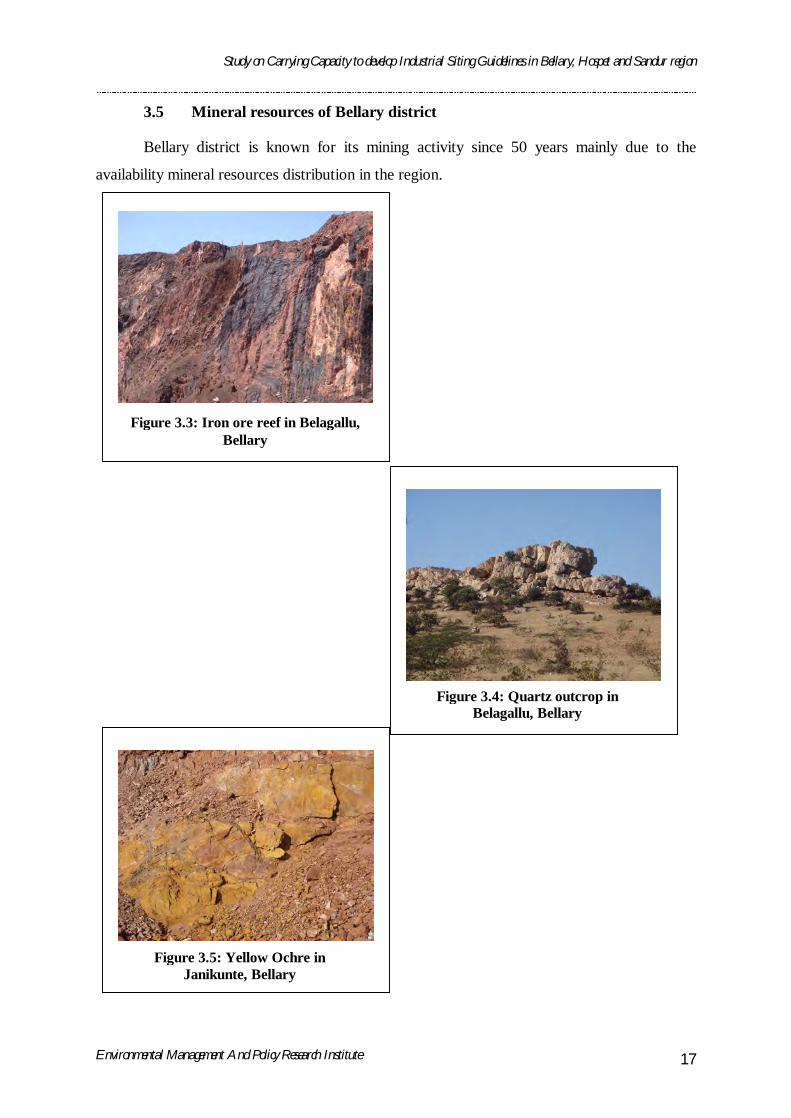
Figure 3.3: Iron ore reef in Belagallu, Bellary
Figure 3.4: Quartz outcrop in Belagallu, Bellary
Figure 3.5: Yellow Ochre in Janikunte, Bellary
3.5 Mineral resources of Bellary district
Bellary district is known for its mining activity since 50 years mainly due to the
availability mineral resources distribution in the region.

Study on Carrying Capacity to develop Industrial Siting Guidelines in Bellary, Hospet and Sandur region
Environmental Management And Policy Research Institute 18
Table 3.2: Location of minerals deposits in Bellary district.
Sl. No. Minerals Locations 1 Iron ore deposits Copper Mountain (Vibhutigudda) range, Ettinhatti range, Thimmappanagudi
range, NEB range, Ramandurg range, Donimalai range, Devadari range & Kumaraswamy range.
2 Manganese ore deposits
Devadari gudda, Thimmappanagudi, Ramandurg, Yeshwantanagar, Subbarayanahalli and Kammatharavu.
3 Yellow & Red oxides (Ochre’s)
Swamihalli, Haraginadoni, Janikunte, Belagal hill, Kammatharuvu, Ubbalgandi & Kanivehalli and Ramandurg range.
4 Quartz Kanchgar-Belgal in Siruguppa taluk; Haravanahalli, Hospet taluk; Sandur taluk. In the valley between Donimalai and Belgal range of hills. Occurrence also the villages limits of Lingadhalli, Ayyanahalli, Marutla and Ananthapur. Appalapura, Harapanahalli, D.Mallapura, Kolugallu, Yereyanahalli
5 Ornamental & Building stones
Dammur, Veniveerapuram, Kurgod, Sirwar, Halkundi Tekkalakota, Badanahatti, Yettina Budihal, Bandri, Anthapur, H.P. Halli, Belagal, Havinamadagu, Holalu, Honnahalli, Chicka anthapur, H.K.Halli, Kurgadu, Sanganakal, Kolagal, Vaddahatti, Munadurgi, Sidiginamola, Gollanaganahalli, Bellary, Somalapuram.
6 Moulding Sand G.Halli, M. Halli and along Tungabhadra river. 7 Magnesite Bellary - Hospet section. 8 Limestone Toranagallu, Ubbalgandi, Rajpur Metri, Devalapuram, Channapuram &
Malappanagudda. 9 Lead & Zinc Metri & Devalapura
10 Clays Kumaraswamy Range. 11 Copper Hala Kundi, Harappanahalli, Holalgundi (Copper Mountain)
The various mineral reserves available in the project area are summarized below.
3.5.1 Iron ore reserves
The range wise reserves of iron ore are given in the table below.
Table 3.3: Range wise reserves of iron ore in million tons
Sl. No. Range Total Reserves
(MT) Grade %
Fe 1 North Eastern Block 72.80 58-67 2 Ramgad 89.40 63-66 3 Thimmappanagudi 26.77 60-66 4 Donimalai 256.39 63-67 5 Ettinahatti 35.60 63-64 6 Devadari 25.60 64-67 7 Kumaraswamy 63.60 64-65 8 Copper Mountain 19.95 60-67 Total 590.11
Source: Report on Scientific Mining of High Grade Iron Ores for exports in Bellary Hospet Sectors, Karnataka,
NEERI (2005)

Study on Carrying Capacity to develop Industrial Siting Guidelines in Bellary, Hospet and Sandur region
Environmental Management And Policy Research Institute 19
3.5.2 Manganese reserves
The Indian Bureau of Mines has indicated the recoverable reserves of manganese ore
of all grades for the whole of India at 176.5 million tons with Karnataka having the largest
reserve of manganese ore at 64.5 million tons. The different categories of reserves for
Karnataka as per the Mineral Year Book, 1993 are indicated in Table 3.4. The Geological
Survey of India places the reserves in the district at 12.25 million tons.
Table 3.4: Reserves of manganese ore in karnataka (as on 1.4.1990)
Sl. No. Category Tones 1. Proved 2,262,000 2. Probable 10,427,000 3. Possible 51,858,000
Total 64,547,000 Source: Mineral Year Book, 1993
3.5.3 Ochres [Yellow oxides/Red oxides]
Large quantities of earthy red haematite are reported from the western slopes of
Ramanadurga range of Sandur taluk. Argillites of rich red colour occurs at Adargani, close to
Kumaraswamy temple, in Sandur taluk. Sandur taluk is considered as the only important
ochre producing center in Karnataka.
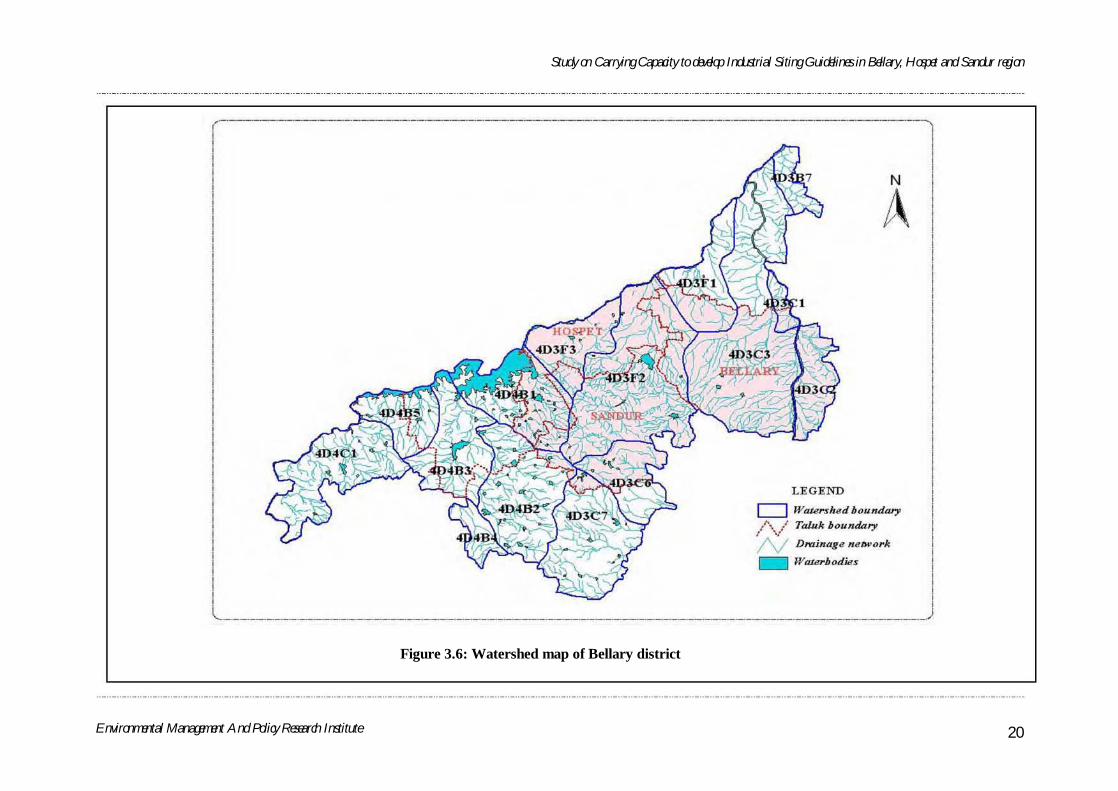
3.6 Water resources and watershed
Bellary district has scarce and scanty water resources due to semiarid climate and
rainfall deficit. Focus on the assessment of quality and quantity of water resources in
Bellary, Sandur and Hospet taluks has been made in this study. Data collected from various
departments like Dept. of Mine and Geology (DMG), Minor irrigation, Agriculture and
Fishery have been compiled to understand the water resources of the study area. The water
resources in the study area comprise of rivers, streams, canals, tanks and springs. The tanks
and reservoirs are rain fed and most of them are dry due to scanty of rainfall in these areas.
The major reservoirs in the study area are Tungabhadra reservoir in Hospet and
Narihalla reservoir in Sandur. Tungabhadra River flows in 5 taluks of Bellary district. Apart
from these two major reservoirs around 80 ponds and lakes are existing in the study area.
The study area consists of 10 watersheds. The watershed area with code number is shown in
the map.
Study on Carrying Capacity to develop Industrial Siting Guidelines in Bellary, Hospet and Sandur region
Environmental Management And Policy Research Institute 20
Figure 3.6: Watershed map of Bellary district
.--.-.----.--.-.-----.----.-.-.----.-.-.-.--.-.--.--.---·-·--·-----·-·-----l
N
A
LEGEND D IVtJ4!r-$hlul JIOI/."Jary
,'\ / Taluk bOI/."tkl". , " 1\1' Dmi"age " elH'ork
Wate,.booms
i _J
N
A
LEGEND D W4Unh.u/ JI(U"u/fH)'
,/\,./ TaJuk boundd",
IV Dl'tlinagi1 n elM'Orlt.
Wnurbodiss

Study on Carrying Capacity to develop Industrial Siting Guidelines in Bellary, Hospet and Sandur region
Environmental Management And Policy Research Institute 21
Figure 3.7: Hydrogeomorphology Map of the study area
Bellary
Sandur
Hospet

Study on Carrying Capacity to develop Industrial Siting Guidelines in Bellary, Hospet and Sandur region
Environmental Management And Policy Research Institute 22
Figure 3.8: Hydrogeomorphological Map showing Dykes & Drainage Pattern of the
Bellary
Sandur
Hospet

Study on Carrying Capacity to develop Industrial Siting Guidelines in Bellary, Hospet and Sandur region
Environmental Management And Policy Research Institute 23
Figure 3.9: Sandur Forest
3.7 Agriculture
Agriculture is the main activity of the district with 62% of total geographical area of
which 19% is irrigated by Tungabhadra reservoir. Major crops are jowar, maize, cotton,
sunflower, groundnut and sugarcane. The table given below shows the details of agricultural
and horticultural crops grown in the study area.
Table 3.5: Area covered by Agriculture and Horticulture crops in the study area -2005
Sl. No. Particulars Bellary Hospet Sandur Dist. Total
1 Total Geographical Area (ha) 1,69,027 93,374 94,359 8,13,196 2 Rain fed Area (ha) 72,729 17,885 34,423 3,39,455 3 Irrigated Area (ha) 61,076 19,961 4,168 1,56,466 4 Agricultural Crop area (ha) 1,33,805 37,846 38,591 4,95,921 5 Horticulture Crop Area (ha) 14,237 4,752 1,662 33,282
3.8 Livestock
Livestock farming is found to be one of the main occupations in the study area. The
details of livestock population are furnished in the following table.
Table 3.6: Livestock population in the study area - 2002
SL. Livestock Bellary Taluk
Hospet Taluk
Sandur Taluk
Total Dist.
1 Cattle 70510 37566 51380 368816 2 Buffaloes 49493 24737 15987 187419 3 Sheep 67954 45605 46470 396475 4 Goats 29311 26199 41295 222661 5 Dogs 16768 13530 8735 69614 6 Pigs 9652 3193 590 15368 Total livestock 244068 150926 164676 1261413 7 Poultry 1026725 254438 185254 2078055
3.9 Forests
Geographically, the landscape of
the regions comprising of Sandur, Hospet
and Bellary, which are part of Bellary
Forest division is varied and consists of
two distinct regions namely the Eastern
region and the Western region separated
by Sandur Hills, which cuts Bellary
district from northwest to southeast. The

Study on Carrying Capacity to develop Industrial Siting Guidelines in Bellary, Hospet and Sandur region
Environmental Management And Policy Research Institute 24
district has 16.28% of forest, which is classified as notified forest and unclassed forest.
Reserve forests are declared under the provisions of section 16, Madras Forest Act 1882 or
under section 17 of Karnataka Forest Act, 1963 and Forest Blocks are notified under section-
4 of the Madras Forest Act, 1882 or under Section 4 of the Karnataka Forest Act 1963 and
are categorized as notified Forests. The remaining forest blocks that are not legally notified
at present under any prevailing law are categorized as unclassed forests. There are no Village
Forests. An abstract of the forest with its distribution of each class is given in Table 3.7.
Table 3.7: Legal status of forest in the study area (in hectares)
Sl. No
Range Notified Reserve forests
Under Section 4*
Unclassed Forests
Total
1 Bellary 10, 598,89 255.25 3,743.26 14, 507.40 2 Hospet 19,568.63 552.27 1,601.52 21,722.42 3 Sandur - 30,561.95 924.15 31,486.10
*Notified forests under Section 4 of Karnataka Forest Act.

Study on Carrying Capacity to develop Industrial Siting Guidelines in Bellary, Hospet and Sandur region
Environmental Management And Policy Research Institute 25
Figure 3.10: Forest Map of the Study Area
Sandur
Bellary Hospet

Study on Carrying Capacity to develop Industrial Siting Guidelines in Bellary, Hospet and Sandur region
Environmental Management And Policy Research Institute 26
Figure 3.11: Daroji Bear Sanctuary
3.10 Wildlife
Though the forests are sparse and low in productivity, the Sandur and neighboring
forest areas are having substantial variety of wildlife. The mammalian wild life found in the
study region is typical of the thorn and scrub forests fauna. Spotted deer, sambhars, wild
boars, and jackals are found in the maidan parts of the district. Blackbucks occur in the open
forests and farmlands. Occasionally herds of wild sheep are seen in Sandur Forests. Sloth
Bears (Melursus) were once in plenty in the hill forests around Jarmali, Gudekota, and
Kampli hills. Hyenas and wolves are
seen in the western taluks. The
commonly occurring reptiles are the
monitor lizard and the Indian mugger,
rarely found in Tungabhadra River.
Among the poisonous snakes cobra and
viper are commonly seen all over the
district.
In Bilekallu reserve forest of
Hospet taluk the sloth bears are very
common due to rugged hilly terrain. Government of Karnataka has declared Bilekallu reserve
forest comprising of 5587.5 hectares as Daroji Bear sanctuary. The estimated bear
population as per forest officials is 45 as of February 2007. The sanctuary is also a home of
jackals, leopards, striped hyenas, peafowls, hares partridges, etc.
The most common birds found in the area are pigeons, partridges and green parrots.
The common pigeons seen are the blue rock pigeon and the green pigeon. Vultures, kites and
crows are the typical birds of prey. Peafowl are plentiful in the western taluks. The other
commonly sighted birds are bulbul, stork and cuckoo.
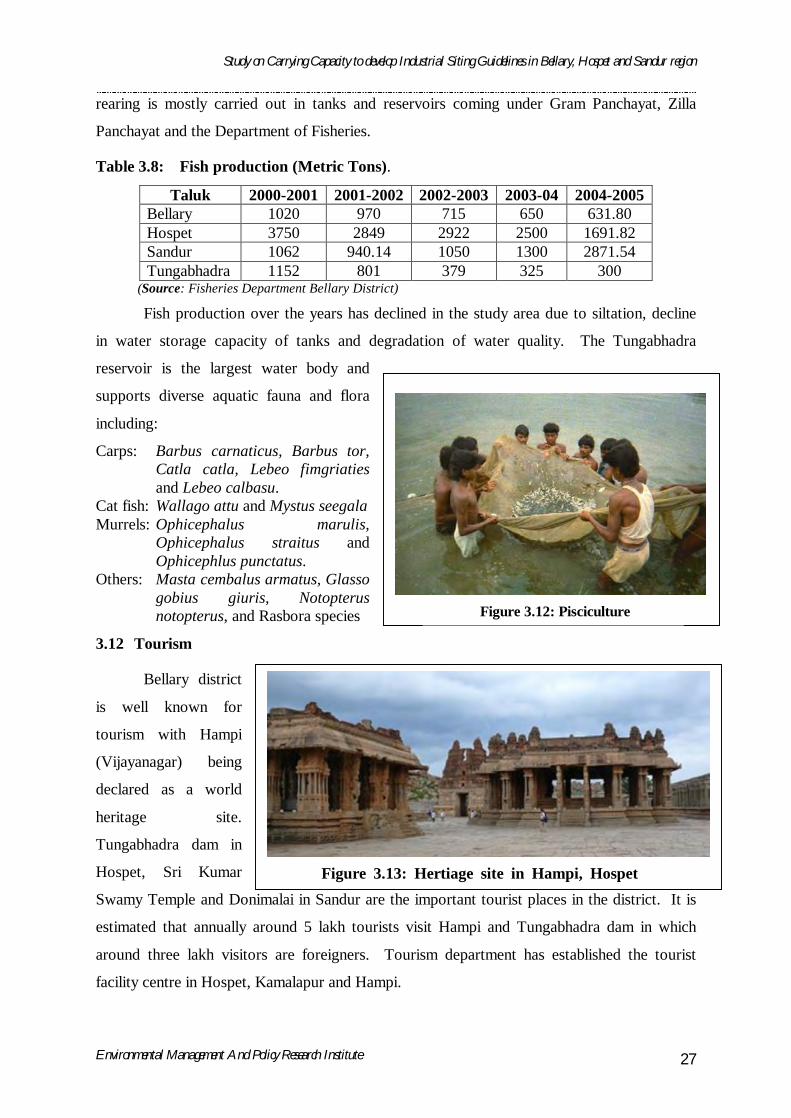
3.11 Pisciculture
Inland fisheries i.e., tanks, lakes, pond fishery and river fishery in the study area also
play a vital role in the economic status of the district having nearly 150 tanks including both
major and minor tanks with water spread area of 7951 hectares; 3 reservoirs with a water
spread area of 3990 hectares; 2 rivers with a length of 210 km and 340 km length of irrigation
canals. The important species of fish include Catla, Rohu, Mrigal, and common carp. Fish
Study on Carrying Capacity to develop Industrial Siting Guidelines in Bellary, Hospet and Sandur region
Environmental Management And Policy Research Institute 27
Figure 3.12: Pisciculture
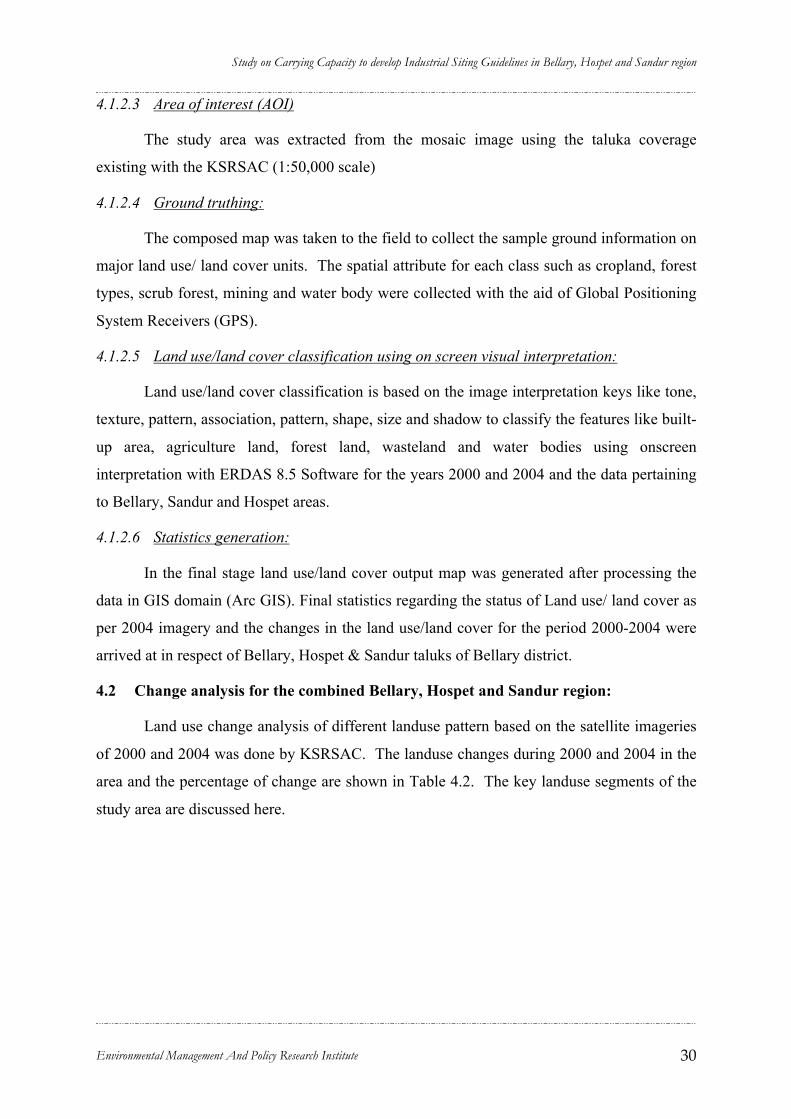
Figure 3.13: Hertiage site in Hampi, Hospettaluk
rearing is mostly carried out in tanks and reservoirs coming under Gram Panchayat, Zilla
Panchayat and the Department of Fisheries.
Table 3.8: Fish production (Metric Tons).
Taluk 2000-2001 2001-2002 2002-2003 2003-04 2004-2005 Bellary 1020 970 715 650 631.80 Hospet 3750 2849 2922 2500 1691.82 Sandur 1062 940.14 1050 1300 2871.54 Tungabhadra 1152 801 379 325 300
(Source: Fisheries Department Bellary District)
Fish production over the years has declined in the study area due to siltation, decline
in water storage capacity of tanks and degradation of water quality. The Tungabhadra
reservoir is the largest water body and
supports diverse aquatic fauna and flora
including:
Carps: Barbus carnaticus, Barbus tor, Catla catla, Lebeo fimgriaties and Lebeo calbasu.
Cat fish: Wallago attu and Mystus seegala Murrels: Ophicephalus marulis,
Ophicephalus straitus and Ophicephlus punctatus.
Others: Masta cembalus armatus, Glasso gobius giuris, Notopterus notopterus, and Rasbora species
3.12 Tourism
Bellary district
is well known for
tourism with Hampi
(Vijayanagar) being
declared as a world
heritage site.
Tungabhadra dam in
Hospet, Sri Kumar
Swamy Temple and Donimalai in Sandur are the important tourist places in the district. It is
estimated that annually around 5 lakh tourists visit Hampi and Tungabhadra dam in which
around three lakh visitors are foreigners. Tourism department has established the tourist
facility centre in Hospet, Kamalapur and Hampi.

Study on Carrying Capacity to develop Industrial Siting Guidelines in Bellary, Hospet and Sandur region
Environmental Management And Policy Research Institute 28
3.13 Human population and health
Population of Bellary district was over 20 lakhs and in the study area it was 11 lakhs,
according to 2001 census. Both Bellary and Hospet taluks are having the population density
higher than the district average. Sex ratio of Bellary district was found to be 969 females per
1000 males as per census of 2001. Medical centers and paramedical centers in the study
region revealed that hospitals, health centers and health units are inadequate. Estimate on the
number of hospitals per 10,000 persons there are 21 health care centers for every lakh persons
in Bellary Taluk, 12.3 centres in Hospet taluk and 22.5 centres in Sandur taluk. Over the
years, numbers of health centers have increased but the primary health units have decreased
(Table 3.9). Concomitant to increase in the number of hospitals, the number of persons per
bed has in fact increased instead of decreasing, indicating that steps are not taken to enhance
the health facilities that reach people in remote areas. Surprisingly, the number of health
workers including doctors, midwives and other attendants has also decreased over the years.
The number of doctors per lakh people in Bellary is 3.58, while in Sandur it is 0.92 and 1.5 in
Hospet. The number of doctors in Bellary district as a whole is 1.7/lakh of people indicating
the inadequacy of doctors in all the taluks.
Table 3.9: Particulars of Health facilities available in Bellary district.
Year
Family Welfare
Sub Centres
Primary Health Centres
Primary Health Units
Government Hospitals
Population/ bed
Health workers
1990-91 203 38 21 13 1077 - 1998-99 264 54 17 15 - 516 2003-04 264 55 17 15 1126 513


Study on Carrying Capacity to develop Industrial Siting Guidelines in Bellary, Hospet and Sandur region
Environmental Management And Policy Research Institute 29
CHAPTER CHAPTER 44 LAND USE & LAND USE LAND USE & LAND USE CHANGECHANGE
4.1 Land use change
The analysis of land use change of a particular region over the years reflects the
problems, causes and trends of the environmental status of land depending upon the intensity
and type of land use practices. In the present study land use change and land cover analysis
of Bellary, Hospet & Sandur was done in order to estimate the land use change in the region
between 2000 and 2004. The land use change study was done by using IRS-IC satellite
imageries with PAN data.
4.1.1 Methodology
The required set of satellite images (IRS -1C/1D LISS III and PAN) were procured
from National Remote Sensing Agency, Hyderabad. Their path/row, source and spatial
resolution are listed below.
Table 4.1: Particulars of satellite pictures
Satellite Sensor Product Path/Row Source Spatial Resolution (m)
Date of Pass
IRS-IC LISS III
Soft copy
98/62 NRSA 23.5 14th Dec 2000
IRS-IC LISS III
Soft copy
99/63 NRSA 23.5 17th Feb 2004
4.1.2 Data processing
4.1.2.1 Ancillary data
Survey of India toposheets on 1:50,000 scale were used for ancillary information. In
addition the geospatial database generated for Karnataka Forest Department was also used as
reference data.
4.1.2.2 Satellite data
The satellite images were transferred into the system and the images were subjected to
georeferencing on to a standard map projection system (polyconic). The registration was
performed using Ground Control Points (GCP’S) through geometric correction procedures
with the aid of ERDAS Imagine 8.5 software. These geometrically corrected images were
radiometrically corrected and images were arranged into a mosaic.
Study on Carrying Capacity to develop Industrial Siting Guidelines in Bellary, Hospet and Sandur region
Environmental Management And Policy Research Institute 30
4.1.2.3 Area of interest (AOI)
The study area was extracted from the mosaic image using the taluka coverage
existing with the KSRSAC (1:50,000 scale)
4.1.2.4 Ground truthing:
The composed map was taken to the field to collect the sample ground information on
major land use/ land cover units. The spatial attribute for each class such as cropland, forest
types, scrub forest, mining and water body were collected with the aid of Global Positioning
System Receivers (GPS).
4.1.2.5 Land use/land cover classification using on screen visual interpretation:
Land use/land cover classification is based on the image interpretation keys like tone,
texture, pattern, association, pattern, shape, size and shadow to classify the features like built-
up area, agriculture land, forest land, wasteland and water bodies using onscreen
interpretation with ERDAS 8.5 Software for the years 2000 and 2004 and the data pertaining
to Bellary, Sandur and Hospet areas.
4.1.2.6 Statistics generation:
In the final stage land use/land cover output map was generated after processing the
data in GIS domain (Arc GIS). Final statistics regarding the status of Land use/ land cover as
per 2004 imagery and the changes in the land use/land cover for the period 2000-2004 were
arrived at in respect of Bellary, Hospet & Sandur taluks of Bellary district.
4.2 Change analysis for the combined Bellary, Hospet and Sandur region:
Land use change analysis of different landuse pattern based on the satellite imageries
of 2000 and 2004 was done by KSRSAC. The landuse changes during 2000 and 2004 in the
area and the percentage of change are shown in Table 4.2. The key landuse segments of the
study area are discussed here.

Study on Carrying Capacity to develop Industrial Siting Guidelines in Bellary, Hospet and Sandur region
Environmental Management And Policy Research Institute 31
Table 4.2: Landuse/landcover change in the study area between 2000 & 2004
LAND USE / LAND COVER 2000 2004
Class Area in Hectare
% of Total Geographical
Area
Area in Hectare
% of Total Geographical
Area
Change in Area (ha)
Built-Up 9386.64 2.41 9391.82 2.42 5.18 Crop Land 242444.94 62.36 242412.24 62.35 -32.71 Forest 33251.9 8.55 33071.89 8.51 -180.01 Scrub Forest 68241.77 17.55 68042.24 17.5 -199.53 Barren Rocky 9882.46 2.54 9882.46 2.54 0 Mining Area 1201.12 0.31 1508.03 0.39 306.91 Mining Waste 64.8 0.02 156.28 0.04 91.48 Quarrying 223.11 0.06 223.11 0.06 0 Waste Land 7308.39 1.88 7308.4 1.88 0 Reservoirs & Tanks 8971.05 2.31 8979.74 2.31
8.69
Rivers & Streams 5107.24 1.31 5107.23 1.31
-0.01
Canals 2614.89 0.67 2614.89 0.67 0 River Island 103.48 0.03 103.48 0.03 0 TOTAL 388801.8 100.00 388801.8 100.00 0.00
4.2.1 Built-up area
From the analysis it can be seen that there is marginal increase of 5.18 ha in the built-
up area of Sandur-Bellary region in the last 4 years indicating stabilization of the built-up
area.
4.2.2 Cropland
Cropland has decreased by 32.71 ha which is marginal indicating stabilisation of crop
production area in the study region. However, the reduction is mainly due to diversion of
cropland to mining activity. The satellite imagery analysis however could not capture the
mining spots in agricultural land as the ore collection is through picking and sweeping of the
land.
4.2.3 Forest
The percentage of forest cover in the study region as per the satellite data from
KSRSAC is around 8%, which is low from state and national average. However, Sandur
taluk has around 31% of TGA which is fairly large as compared to state average. The
landuse change analysis through satellite imageries between 2000 & 2004 has indicated
significant change in forest cover in the last 5 years due to mining and other activities. As

Study on Carrying Capacity to develop Industrial Siting Guidelines in Bellary, Hospet and Sandur region
Environmental Management And Policy Research Institute 32
per landuse analysis in the last 4 years nearly 306.91 ha of forest land has been diverted to
mining activities in Sandur, Hospet and Bellary taluks with at least 1500 ha. of forest land
opened for mining activities. Further analysis of the diversion of forest area in the 3 taluks
(study area) has shown that the forest area is reduced from 8.55 to 8.51% of Total
Geographical Area with highest reduction in Sandur taluk (from 38.31 to 38.06%) where
mining lease is maximum. The loss of forest is maximum in Donimalai and Swamimalai
forests which are considered as biodiversity rich forest areas.
4.2.4 Mining
As per the landuse change analysis between 2000 and 2004, the mining operation has
increased tremendously during the last five years due to increase in demand for iron ore in the
international market. At present the total land area used for mining and quarrying is around
0.5% of Total Geographical Area in Bellary district. But in Sandur the bulk of mining is
done in nearly 15.5% of TGA indicating unsustainable land use change taking place in a very
sensitive ecosystem as Sandur is known to have very rich forests. The mining areas as seen
in 2004 satellite imageries of the study region show that around 1500 ha of land has been
opened for mining, 156 ha for dumping mining waste and 223 ha for quarrying. The total
land area which has been leased for mining is around 15000 ha which includes 3677 ha
reserve forest land and about 12000 ha of non forest area.
As per the Working Plan Records of 2004, Bellary division there is around 5500 ha of
forestland leased for mining activity. Nearly 1675 ha of old mines located in reserve forests
have been abandoned without rehabilitation. At present there are 50 mines located in the
forest area. These mining areas have been captured on the map using satellite imageries of
2000 and 2004.
4.2.5 Water bodies
The land use analysis from the satellite imageries has indicated that water bodies and
streams cover only 4.3% of Total Geographical Area, which is very low as compared to an
ideal landscape ecosystem. There is a very minute increase in the area occupied by water
bodies between 2000 and 2004 (with an additional 9.00 ha) which is a positive trend. The
increase in the area of water bodies may be due to increase of watershed activities.
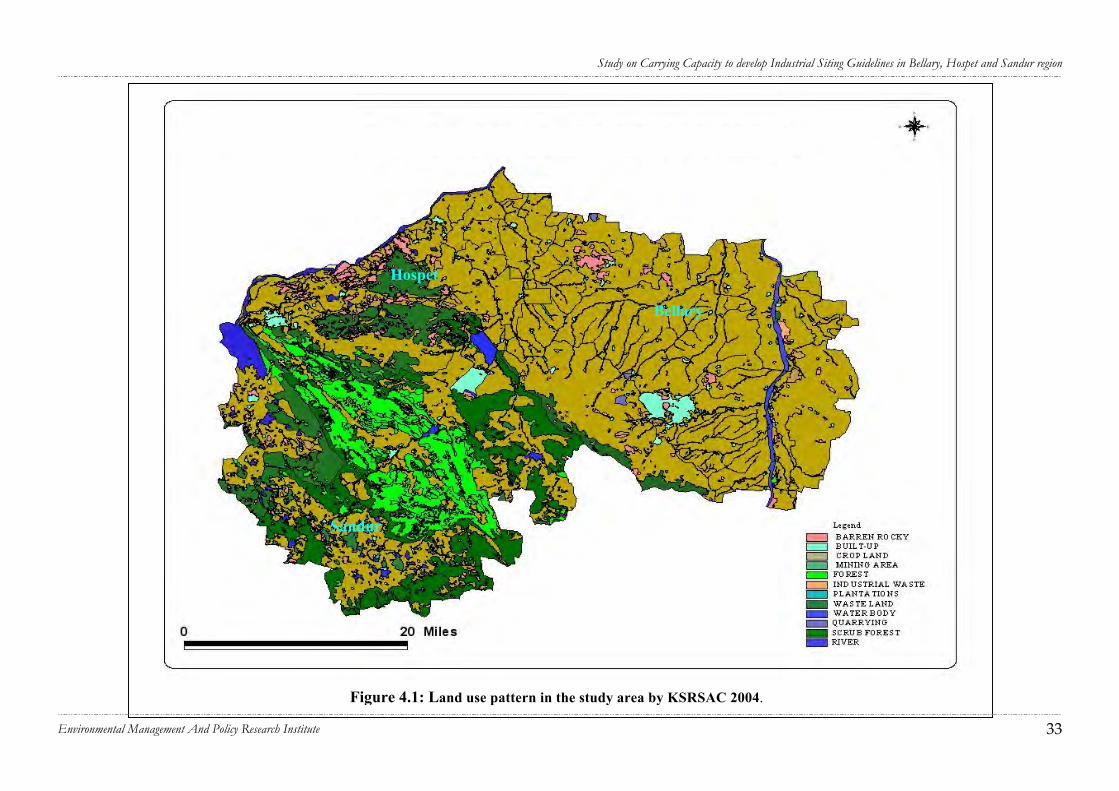
Study on Carrying Capacity to develop Industrial Siting Guidelines in Bellary, Hospet and Sandur region
Environmental Management And Policy Research Institute 33
Figure 4.1: Land use pattern in the study area by KSRSAC 2004.
Bellary
Hospet
Sandur

Study on Carrying Capacity to develop Industrial Siting Guidelines in Bellary, Hospet and Sandur region
Environmental Management And Policy Research Institute 34
Figure 4.2 (A): Land cover map of the study area - 2000
Bellary
Hospet
Sandur

Study on Carrying Capacity to develop Industrial Siting Guidelines in Bellary, Hospet and Sandur region
Environmental Management And Policy Research Institute 35
Figure 4.2 (B): Land cover map of the study area - 2004
Bellary
Hospet
Sandur
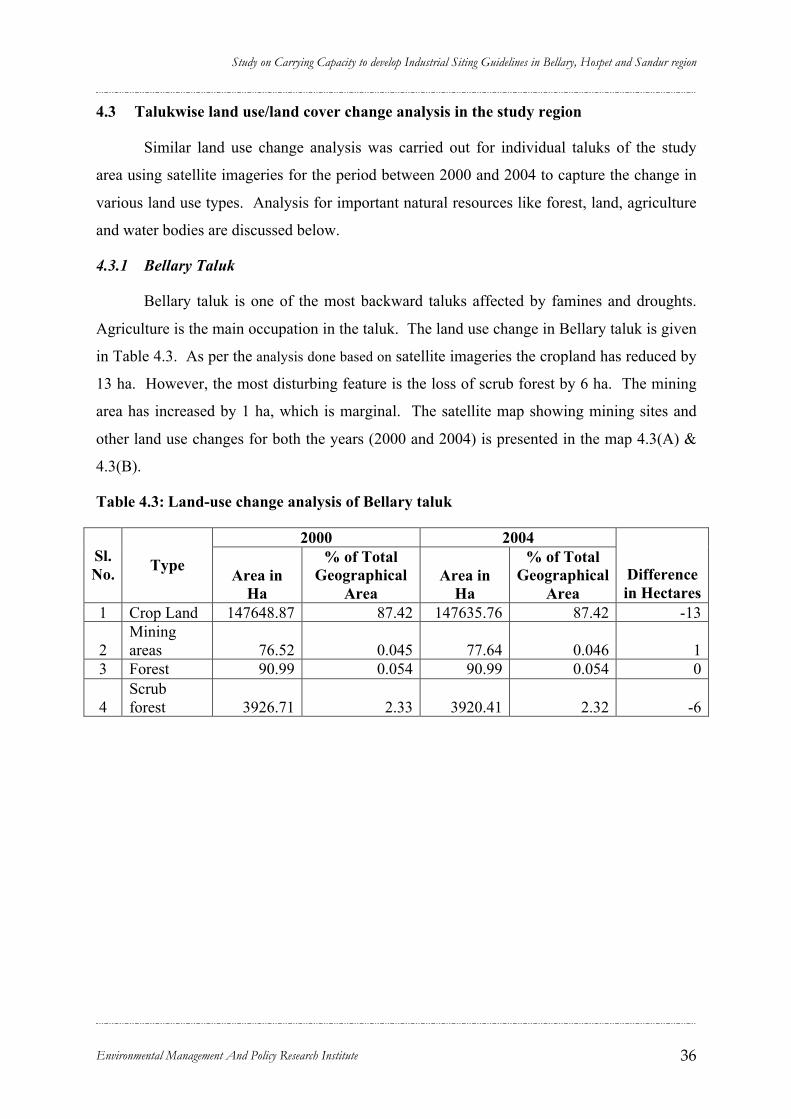
Study on Carrying Capacity to develop Industrial Siting Guidelines in Bellary, Hospet and Sandur region
Environmental Management And Policy Research Institute 36
4.3 Talukwise land use/land cover change analysis in the study region
Similar land use change analysis was carried out for individual taluks of the study
area using satellite imageries for the period between 2000 and 2004 to capture the change in
various land use types. Analysis for important natural resources like forest, land, agriculture
and water bodies are discussed below.
4.3.1 Bellary Taluk
Bellary taluk is one of the most backward taluks affected by famines and droughts.
Agriculture is the main occupation in the taluk. The land use change in Bellary taluk is given
in Table 4.3. As per the analysis done based on satellite imageries the cropland has reduced by
13 ha. However, the most disturbing feature is the loss of scrub forest by 6 ha. The mining
area has increased by 1 ha, which is marginal. The satellite map showing mining sites and
other land use changes for both the years (2000 and 2004) is presented in the map 4.3(A) &
4.3(B).
Table 4.3: Land-use change analysis of Bellary taluk
2000 2004 Sl. No. Type Area in
Ha
% of Total Geographical
Area Area in
Ha
% of Total Geographical
Area Difference in Hectares
1 Crop Land 147648.87 87.42 147635.76 87.42 -13
2 Mining areas 76.52 0.045 77.64 0.046 1
3 Forest 90.99 0.054 90.99 0.054 0
4 Scrub forest 3926.71 2.33 3920.41 2.32 -6

Study on Carrying Capacity to develop Industrial Siting Guidelines in Bellary, Hospet and Sandur region
Environmental Management And Policy Research Institute 37
Figure 4.3 (A): Land use and land cover map of Bellary Taluk - 2000
N
A
LEGEND c:::J "R A RR1<N RO r.KV
c::::J BUIL T -UP c=::J CANAL c::::::J C R OP LAND _ FOREST
:MINING [=:::J PLANTATIONS
RE SERVIO R & TANKS ~RIVER CJ SCRUB FOREST c:=J STREAM _ WASTELAND
•
..
.~ /J -..,
N
A
LE G END C.I "R A"RRl< N R O(;KY
c::=J BUll. T - U P
c:::=J CANAL c:::::::J C R OP LAND _ FORE ST
MINING [=:J PLANTATIONS
RE SERVIO R & TANKS = RIVER r=:J SCRUB F O RE ST c::::=I S TREAM _ WASTEL AND

Study on Carrying Capacity to develop Industrial Siting Guidelines in Bellary, Hospet and Sandur region
Environmental Management And Policy Research Institute 38
Figure 4.3 (B): Land use and land cover map of Bellary Taluk - 2004
----------------_._ .. _ .. _ .. _ .. _ .. _ .. _ .. _ .. _ .. _ .. _ .. _ .. _ .. _ .. _ .. - ._ .. _ .. _ .. _ .. _ .. _ .. _ .. _ .. _ .. _ .. _ .. _ .. _ .. _ .. _ .. _ .. _ .. _ .. _ .. _ .. _ .. _ .. _ .. _ .. _ .. _ .. _ .. _ .. _ .. _ .. _ .. _ .. _ .. _ .. _ .. _ .. _ .. _ .. _ .. _ .. _ .. _ .. _ .. _ .. _ .. _ .. _ .. _ .. _ .. _ .. _ .. _ .. _ .. _ .. _ .. _ .. _ .. _ .. _ .. _ .. _ .. _ .. _ .. _ .. _ .. _ .. _ .. _ .. _ ...
N
A
LE G E ND
c=J BARRE N R OC k'Y
D B UILT-U P
D C R O PLAND
_ CANAL
~FOREST _ II.<IINING
D P L ANT A TIONS
RIVER
SC R U B F O RE S T _ S TREAM / WATERBODY
WA STEL AND
---------------_._ .. _ .. _ .. _ .. _._ .. _ .. _ .. _ .. _ .. _ .. _ .. _ .. _ .. _ .. - ._ .. _ .. _ .. _ .. _ .. _ .. _ .. _ .. _ .. _ .. _ .. _ .. _ .. _ .. _ .. _ .. _ .. _ .. _ .. _ .. _ .. _ .. _ .. _ .. _ .. _ .. _ .. _._ .. _ .. _ .. _ .. _ .. _ .. _ .. _ .. _._ .. _ .. _ .. _ .. _ .. _ .. _ .. _ .. _ .. _ .. _ .. _ .. _ .. _ .. _ .. _ .. _ .. -.. _ .. _ .. _ .. _ .. _ .. _ .. _ .. _ .. _ .. _ .. _ .. _ .. _ .. _ ...
N
A
LEGEND
BARREN ROC},.'Y
BUILT-UF
CROPLAND
CANAL
FORE S T
MINING
PLANTATIONS
RIVER
SCRUB FOREST
STREAM I WATERBODY
WASTELAND
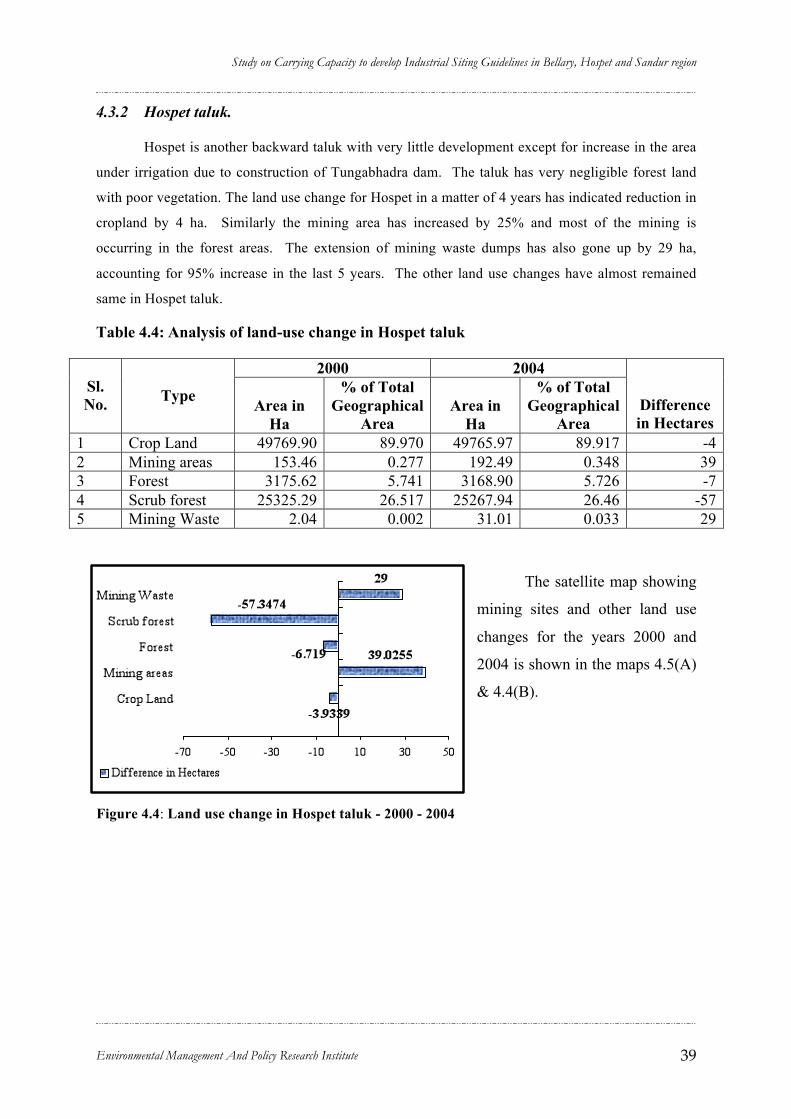
Study on Carrying Capacity to develop Industrial Siting Guidelines in Bellary, Hospet and Sandur region
Environmental Management And Policy Research Institute 39
4.3.2 Hospet taluk.
Hospet is another backward taluk with very little development except for increase in the area
under irrigation due to construction of Tungabhadra dam. The taluk has very negligible forest land
with poor vegetation. The land use change for Hospet in a matter of 4 years has indicated reduction in
cropland by 4 ha. Similarly the mining area has increased by 25% and most of the mining is
occurring in the forest areas. The extension of mining waste dumps has also gone up by 29 ha,
accounting for 95% increase in the last 5 years. The other land use changes have almost remained
same in Hospet taluk.
Table 4.4: Analysis of land-use change in Hospet taluk
2000 2004 Sl. No. Type Area in
Ha
% of Total Geographical
Area Area in
Ha
% of Total Geographical
Area Difference in Hectares
1 Crop Land 49769.90 89.970 49765.97 89.917 -4 2 Mining areas 153.46 0.277 192.49 0.348 39 3 Forest 3175.62 5.741 3168.90 5.726 -7 4 Scrub forest 25325.29 26.517 25267.94 26.46 -57 5 Mining Waste 2.04 0.002 31.01 0.033 29
The satellite map showing
mining sites and other land use
changes for the years 2000 and
2004 is shown in the maps 4.5(A)
& 4.4(B).
Figure 4.4: Land use change in Hospet taluk - 2000 - 2004

Study on Carrying Capacity to develop Industrial Siting Guidelines in Bellary, Hospet and Sandur region
Environmental Management And Policy Research Institute 40
Figure 4.5 (A): Land use and land cover map of Hospet Taluk - 2000
N
A
LE GEND
= BARRE N R OCK Y
= BUILT -U P
= CANAL
= CR O P LAND - F O RE S T MINING AREA
= SCR UB F ORE ST WASTE L AND
INDUSTRIAL WASTE _ P LANTATIONS
c::J] QUARRYING _ RE SERVIOR& TA NKS
~ RIVER I SL AND _ STREAM
N
A
LE GEND
BARRE N R OCI...'"Y BUI LT-U P CANAL CR O P L AND F ORE S T :MINING AREA SCR UB F OREST WASTELAND
INDUSTRIAL WASTE PLANTATIONS QUARRYIN G RE SERVIOR & TA NKS RIVER I SL AND STREAM

Study on Carrying Capacity to develop Industrial Siting Guidelines in Bellary, Hospet and Sandur region
Environmental Management And Policy Research Institute 41
Figure 4.5 (B): Land use and land cover map of Hospet Taluk - 2004
--_. __ . __ . __ . __ •..•..•..•..•..•..•..•..•..•..•..•..•..•..•..•..•..•..•..•..•..•..•..•..•..•..•..•..•..•..•..•..•..•..•..•..•..•..•..•..•..•..•..•..•..•..•..•..•..•..•..•..•..•..•..•..•..•..•..•..•..•..•..•..•..•..•..•..•..•..•..•..•..•..•..•..•..•..•..•..•..•..•..•..•..•...
N
A
LEGEND BARREN ROCKY BUILT-UP CANAL CROP LAND FOREST INDUSTRIAL WASTE MINING AREA PLANTATIONS SCRUB FORE ST STREAMIWATERBOD WASlE LAND
QUARRYING RIVER ISLAND
--_. __ . __ . __ . __ •..•..•..•..•..•..•..•..•..•..•..•..•..•..•..•..•..•..•..•..•..•..•..•..•..•..•..•..•..•..•..•..•..•..•..•..•..•..•..•..•..•..•..•..•..•..•..•..•..•..•..•..•..•..•..•..•..•..•..•..•..•..•..•..•..•..•..•..•..•..•..•..•..•..•..•..•..•..•..•..•..•..•..•..•..•...
N
A
LEGEND BARREN ROCKY BUILT-UP CANAL CROP LAND FOREST INDUSTRIAL WASTE MINING AREA PLANTATIONS SCRUB FOREST STREAMJWATERBOD WASlE LAND
QUARRYING RIVER ISLAND
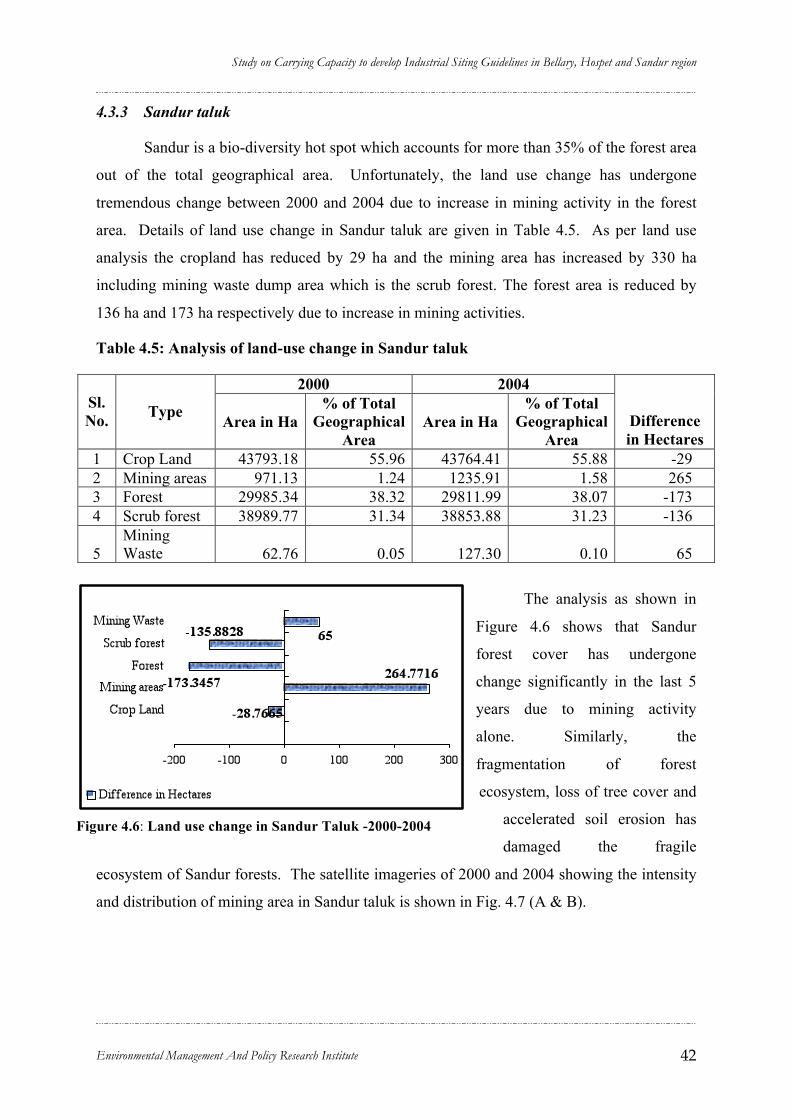
Study on Carrying Capacity to develop Industrial Siting Guidelines in Bellary, Hospet and Sandur region
Environmental Management And Policy Research Institute 42
4.3.3 Sandur taluk
Sandur is a bio-diversity hot spot which accounts for more than 35% of the forest area
out of the total geographical area. Unfortunately, the land use change has undergone
tremendous change between 2000 and 2004 due to increase in mining activity in the forest
area. Details of land use change in Sandur taluk are given in Table 4.5. As per land use
analysis the cropland has reduced by 29 ha and the mining area has increased by 330 ha
including mining waste dump area which is the scrub forest. The forest area is reduced by
136 ha and 173 ha respectively due to increase in mining activities.
Table 4.5: Analysis of land-use change in Sandur taluk
2000 2004 Sl. No. Type Area in Ha
% of Total Geographical
Area Area in Ha
% of Total Geographical
Area Difference in Hectares
1 Crop Land 43793.18 55.96 43764.41 55.88 -29 2 Mining areas 971.13 1.24 1235.91 1.58 265 3 Forest 29985.34 38.32 29811.99 38.07 -173 4 Scrub forest 38989.77 31.34 38853.88 31.23 -136
5 Mining Waste 62.76 0.05 127.30 0.10 65
The analysis as shown in
Figure 4.6 shows that Sandur
forest cover has undergone
change significantly in the last 5
years due to mining activity
alone. Similarly, the
fragmentation of forest
ecosystem, loss of tree cover and
accelerated soil erosion has
damaged the fragile
ecosystem of Sandur forests. The satellite imageries of 2000 and 2004 showing the intensity
and distribution of mining area in Sandur taluk is shown in Fig. 4.7 (A & B).
Figure 4.6: Land use change in Sandur Taluk -2000-2004
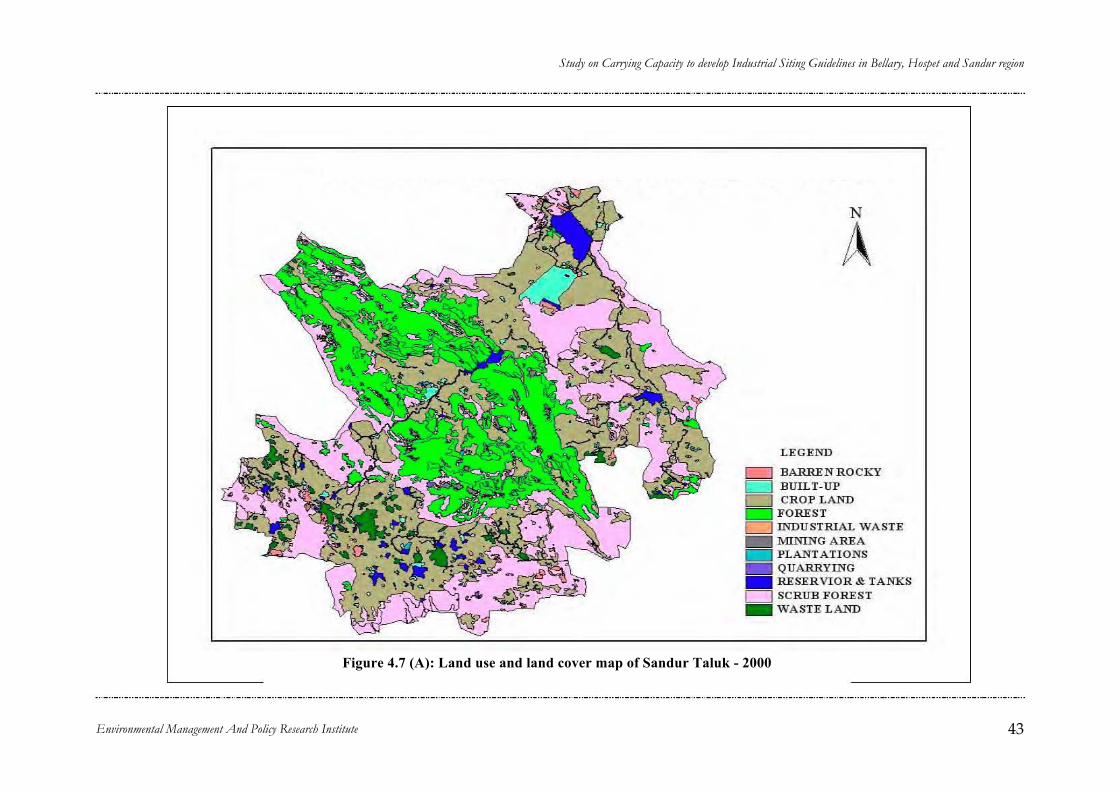
Study on Carrying Capacity to develop Industrial Siting Guidelines in Bellary, Hospet and Sandur region
Environmental Management And Policy Research Institute 43
Figure 4.7 (A): Land use and land cover map of Sandur Taluk - 2000
N
A
LE GEND
BARRE N R OCKY BUILT-UP CR O PLAND
FORE ST INDUSTRIAL WASTE MINING AREA PLANT A TI ONS QUARRYING RE SERVIOR& TANKS SCRUB F ORES T WASTELAND
N
A
LEGEND
BARRE N RO CKY BUILT-UP CROP LAND
FOREST INDUSTRIAL WASTE .MINING AREA PLANT A TI ONS QUARRYING RESERVIOR& TANKS SCRUB FOREST WASTELAND

Study on Carrying Capacity to develop Industrial Siting Guidelines in Bellary, Hospet and Sandur region
Environmental Management And Policy Research Institute 44
Figure 4.7 (B): Land use and land cover map of Sandur Taluk - 2004
---_ .. _ .. _ .. _ .. _ .. _ .. _ .. _ .. _ .. _ .. _ .. _ .. _ .. _ .. _ .. _ .. _ .. _ .. _ .. _ .. _ .. _ .. _ .. _ .. _ .. _ .. _ .. _ .. _ .. _ .. _ .. _ .. _ .. _ .. _ .. _ .. _ .. _ .. _ .. _ .. _ .. _ .. _ .. - ._ .. _ .. _ .. _ .. _ .. _ .. _ .. _ .. _ .. _ .. _ .. _ .. _ .. _ .. _ .. _ .. _ .. _ .. _ .. _ .. _ .. _ .. _ .. _ .. _ .. _ .. _ .. _ .. _ .. _ .. _ .. _ .. _ .. _ .. _ .. _ .. _ .. _ .. _ .. _ .. _ .. _ .. _ .. _ .. _ .. _ ...
N
A
LE GEND
BARREN R OC KY BUILT-UP t; J{U1" LAND
MINING AREA SCRUB F ORE ST
F ORE S T INDUSTRIAL WASTE P LANT ATIONS SCRUB F ORE ST WASTE L AND WATER B ODY QUARRYI NG SCR UB F ORES T
---_ .. _ .. _ .. _ .. _ .. _ .. _ .. _ .. _ .. _ .. _ .. _ .. _ .. _ .. _ .. _ .. _ .. _ .. _ .. _ .. _ .. _ .. _ .. _ .. _ .. _ .. _ .. _ .. _ .. _ .. _ .. _ .. _ .. _ .. _ .. _ .. _ .. _ .. _ .. _ .. _ .. _ .. _ .. - ._ .. _ .. _ .. _ .. _ .. _ .. _ .. _ .. _ .. _ .. _ .. _ .. _ .. _ .. _ .. _ .. _ .. _ .. _ .. _ .. _ .. _ .. _ .. _ .. _ .. _ .. _ .. _ .. _ .. _ .. _ .. _ .. _ .. _ .. _ .. _ .. _ .. _ .. _ .. _ .. _ .. _ .. _ .. _ .. _ .. _ ...
N
A
LE GE ND
BARREN R OC KY BUILT-UP {;1{OP L AND
lVlINING AREA SCRUB F ORE ST
F ORE S T INDUSTRIAL WASTE P L ANT ATIONS SCRUB F ORE ST WASTE L AND WATER B ODY QUARRYING SCR UB F ORES T
Study on Carrying Capacity to develop Industrial Siting Guidelines in Bellary, Hospet and Sandur region
Environmental Management And Policy Research Institute 45
4.4 Problems due to land use change:
The rapid land use change in the study area is causing numerous environmental
problems such as loss of forest cover, land degradation, soil erosion, siltation and
sedimentation of water bodies, etc., in the study area. The factors contributing to these
environmental problems in the last five years in Sandur and Bellary region are mainly due to
land use change as a result of mining activity, unsustainable agricultural practices and other
developmental works. Some of the environmental problems, causes and trends due to land
use change and their impact on land, water, air, and vegetation are discussed below.
4.4.1 Unsustainable agricultural practices:
The land use changes in the last twenty-years have taken place rapidly in the study
region. The activities in the study region were predominantly agriculture and livestock
farming with the supplementary cottage industry as a subsidiary occupation during lean
seasons. The hostile climate and poor rainfall had forced the local community to adopt
subsistence farming with very little inputs. However, after the construction of Tungabhadra
dam the availability of water and the area under irrigated crop production opportunities in
Bellary and Hospet taluk have improved. Currently, the gross area under agriculture crop is
around 61% of total geographical area except for Sandur taluk where the area under
agriculture is less than 50% TGA.
4.4.2 Mining Activity
The mining activity in Sandur and Bellary region is perhaps the biggest mining
operation in the State. Due to higher percentage of iron content (65%) in the ore the demand
for iron ore from Bellary region is very high. In the last 15 to 20 years there has been
relentless mining and quarrying work going on in the study area causing tremendous
environmental problems like loss of vegetation, soil erosion, land degradation, deterioration
of air quality, etc.
As the mining deposits are found in all the land use types, mining activity is
undertaken in all the land use types such as forest, agricultural land and wastelands. The
maximum area is leased for mining in reserved forest. As per the list furnished by the
Department of Mines and Geology and Karnataka Forest Department, the number of active
mines operating in the forest area coming under the study area is 71. The details of mining
leases and extent of mining area in forest and non-forest land is given in Table 4.6.

Study on Carrying Capacity to develop Industrial Siting Guidelines in Bellary, Hospet and Sandur region
Environmental Management And Policy Research Institute 46
Table 4.6: Mining leases in the study area
Forest and Non Forest Combined Forest Land
Taluk Number of mining lease
Area in hectares
Number of mining lease
Area in hectares
Quantity extracted in M tons
Bellary 5 475.78 4 97.10 733242 Sandur 51 13961.77 41 2933.07 26244723 Hospet 15 1389.19 5 647.58 4373754 Total 71 15826.74 50 3677.75 31351719
The land use change/cover analysis was done to spatially locate the active mines in
Bellary-Hospet- Sandur region (Map-II). From the map, it can be seen that 80% of mines are
located in the forest areas of Sandur and Hospet regions.
4.4.2.1 Opening of Forest Land
It is evident that in the last five years there is tremendous growth of mining activity in
Bellary-Hospet-Sandur region. From the land use change analysis it is clear that mining is
currently done in nearly 1200 ha. Figure 4.8 (A) shows the mining area in 2000 while figure
4.8 (B) shows increase of mining in the same area. The change in forest area (extent) and the
loss of forest in the study region is given in Table 4.7 below.
Table 4.7: Expansion of mining in forest area during 2000 and 2004
Taluks Mining in Forest (2000)
Mining in Forest (2004)
Difference in area (ha)
Bellary 90.9932 90.9932 0 Sandur 29985.3395 29811.9938 -173.346 Hospet 3175.6231 3168.9041 -6.719 Total 33251.96 33071.89 -180.065
From the satellite imageries of 2004, it is evident that mining in forest area especially
in the reserve forest is rampant (Figure 4.10). The satellite maps showing concentration of
mining areas in the middle of Swamimalai, Donimalai area are clear indication of heavy
mining activity. Swamimalai forests are known for many medicinal plants and endemic
species like Salvadora parsica, are affected by mining activity. In addition to these, the loss
of habitat of Sandal wood species is a real concern. According to Working plan report of
Bellary Forest Division, the Donimalai forest area which is rich in bio-diversity of many rare
and endangered species including sandal wood is getting damaged due to heavy mining
activity (Figure 4.9 & 4.10).

Study on Carrying Capacity to develop Industrial Siting Guidelines in Bellary, Hospet and Sandur region
Environmental Management And Policy Research Institute 47
Increase in the area covered by water body due to siltation
Increase in mining area
Figure 4.8 (B): Satellite imagery 2004
Mining area
Water body
Figure 4.8 (A): Satellite imagery 2000
EXP ANSION OF MINING AREA IN SANDUR

Study on Carrying Capacity to develop Industrial Siting Guidelines in Bellary, Hospet and Sandur region
Environmental Management And Policy Research Institute 48
Figure 4.9: Mining areas in Sandur Reserve Forest
Figure 4.10: Satellite image showing concentration of mining in forest area of Sandur taluk
Mining in Donimalai State Forest
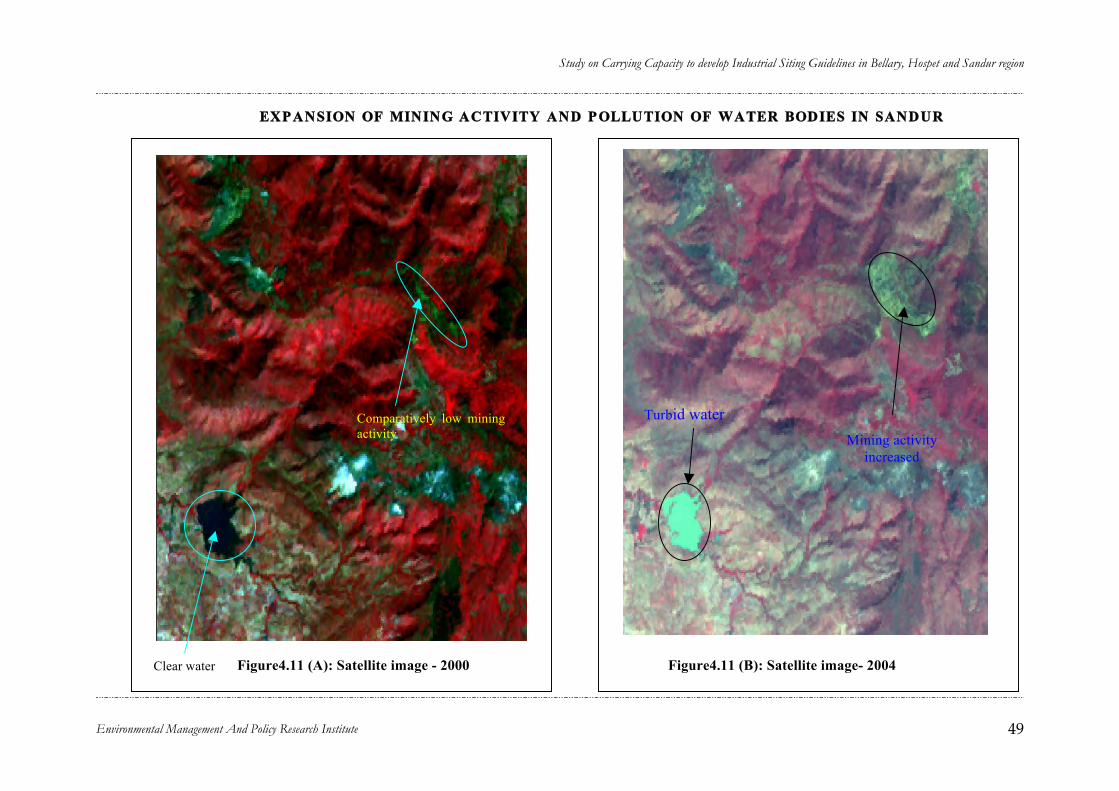
Study on Carrying Capacity to develop Industrial Siting Guidelines in Bellary, Hospet and Sandur region
Environmental Management And Policy Research Institute 49
EXP ANSION OF MINING ACTIVITY AND P OLLUTION OF WATER BODIES IN SANDUR
Comparatively low mining activity
Figure4.11 (A): Satellite image - 2000 Clear water Figure4.11 (B): Satellite image- 2004
Mining activity increased
Turbid water
Study on Carrying Capacity to develop Industrial Siting Guidelines in Bellary, Hospet and Sandur region
Environmental Management And Policy Research Institute 50
4.4.2.2 Land-use change from agriculture to mining
Mining is also occurring in the wastelands, private lands and agriculture lands in
varying proportions. Figure 4.9 (A & B) indicates the extent of mining in agriculture land.

Study on Carrying Capacity to develop Industrial Siting Guidelines in Bellary, Hospet and Sandur region
Environmental Management And Policy Research Institute 51
Figure 4.12 (A): Part of Sandur, as viewed by IRS 1C/1D, LISS III Satellite on Dec 2000
Figure 4.12 (B): Part of Sandur, as viewed by IRS 1C/1D, LISS III Satellite on Feb 2004
Crop land changed to mining
activity.
EXP ANSION OF MINING ACTIVITY IN AGRICULTURE LAND

Study on Carrying Capacity to develop Industrial Siting Guidelines in Bellary, Hospet and Sandur region
Environmental Management And Policy Research Institute 52
4.4.2.3 Mining dump and dust along roads
Figure 4.13 : Mining waste dump along the hill slope
Figure 4.14 : Dumping of mining waste along the hill slope
According to land use change analysis, the area under mining dump has increased
tremendously in the last 5 years. The dump sites can be seen in Figure 4.15 and the roads
covered by mining dust can be seen in Figure 4.16.
4.4.2.4 Area abandoned after mining:
There is a large extent of abandoned mines in the forest area which needs immediate
attention for rehabilitation. The extent of abandoned mines and unrehabilitated mines is
increasing over the years.

Study on Carrying Capacity to develop Industrial Siting Guidelines in Bellary, Hospet and Sandur region
Environmental Management And Policy Research Institute 53
Figure 4.15: Mining dumpsites in the study area
( ------------------ -- --- -- -- -- ---------------------------- -- ----- -- -- ----- ---------------------- -- ----- -- -- --------------------------- -- -- -, ,
N
A
~~HOSPE~ BELLARY
Le;e .. "
c:::::::J Taluk boundary
Miningsi~s
_ Mining ..... st.e sites c:::::::::J Reser= fu..,st boundary
(-~-~~----~-~~--~~~~--- ---.~-~------~-----~----~----~-~-- -- --~
I I
BELLARY
c::::::::J Taluk boundary
Miningsi~s
N
A
_ Mining"""ste siles ' c::::::::J Reserve fu..,st boundary !
~_~ __ ~~ ________ ~_~ ___ ~_~.~ ______ ~ ___ ______ ~.~_~ _____ ~ ________ ~~~ ______ -.J

Study on Carrying Capacity to develop Industrial Siting Guidelines in Bellary, Hospet and Sandur region
Environmental Management And Policy Research Institute 54
Mining dust all along the road
Mining dust deposited along and near the Road
Figure 4.16: Part of Sandur, As Viewed by IRS 1C/1D, LISS III Satellite on Dec 2004
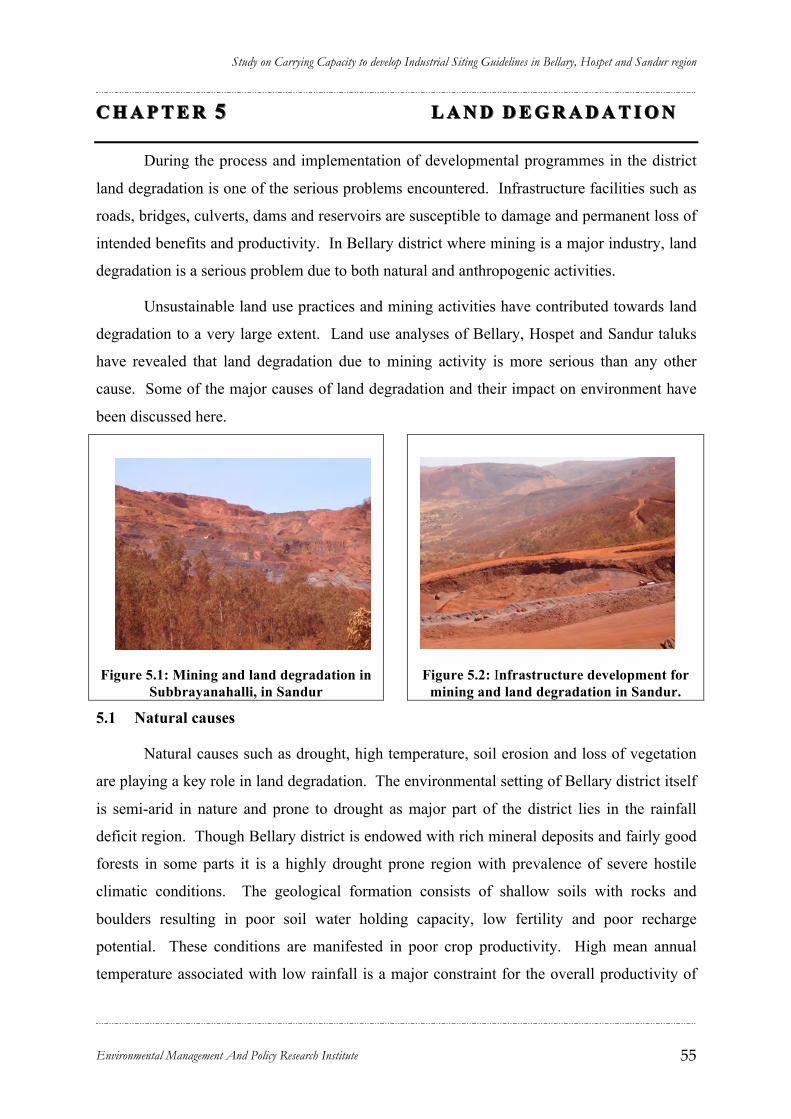
Study on Carrying Capacity to develop Industrial Siting Guidelines in Bellary, Hospet and Sandur region
Environmental Management And Policy Research Institute 55
C H A P T E RC H A P T E R 55 L A N DL A N D D E G R A D A T I O ND E G R A D A T I O N
During the process and implementation of developmental programmes in the district
land degradation is one of the serious problems encountered. Infrastructure facilities such as
roads, bridges, culverts, dams and reservoirs are susceptible to damage and permanent loss of
intended benefits and productivity. In Bellary district where mining is a major industry, land
degradation is a serious problem due to both natural and anthropogenic activities.
Unsustainable land use practices and mining activities have contributed towards land
degradation to a very large extent. Land use analyses of Bellary, Hospet and Sandur taluks
have revealed that land degradation due to mining activity is more serious than any other
cause. Some of the major causes of land degradation and their impact on environment have
been discussed here.
Figure 5.1: Mining and land degradation in Subbrayanahalli, in Sandur
Figure 5.2: Infrastructure development for mining and land degradation in Sandur.
5.1 Natural causes
Natural causes such as drought, high temperature, soil erosion and loss of vegetation
are playing a key role in land degradation. The environmental setting of Bellary district itself
is semi-arid in nature and prone to drought as major part of the district lies in the rainfall
deficit region. Though Bellary district is endowed with rich mineral deposits and fairly good
forests in some parts it is a highly drought prone region with prevalence of severe hostile
climatic conditions. The geological formation consists of shallow soils with rocks and
boulders resulting in poor soil water holding capacity, low fertility and poor recharge
potential. These conditions are manifested in poor crop productivity. High mean annual
temperature associated with low rainfall is a major constraint for the overall productivity of

Study on Carrying Capacity to develop Industrial Siting Guidelines in Bellary, Hospet and Sandur region
Environmental Management And Policy Research Institute 56
Figure 5.3: Potential Evapotranspiration (PET) and Water deficit pattern in Bellary district. Source: Adhikari et al 2003
crops and regional development failing to achieve optimal productivity in agriculture,
forestry and livestock sectors.
Low rainfall
associated with shallow soil,
unweathered rocks and
parent materials of the soil
makes the soil less
productive. Soils have a
tendency to break leaving
large cracks owing to the
baking sun during summer.
In this type of soil trees
show stunted growth and even grasses do not grow profusely, therefore the livestock
population face severe shortage of fodder in summer seasons. Water and soil conservation
practices associated with crop management may reduce the severe effects of drought and
famine. High rate of evapo-transpiration is unfavourable for soil formation. Soil tests show
that the potential evapo-transpiration is very high throughout the season and therefore the
district experiences water deficit in most part of the year.
Bellary district is known for its blistering summer and dry weather for major part of
the year with December, January, and February being cooler months recording mean
maximum temperature of 29.7º C. The period from March to May experiences higher
temperature going up to 44º C with a mean maximum temperature of 39º C. Very high
temperature during summer makes the land more arid and creates salt crust formation. At the
same time clay particles in the soil disintegrate to form smaller particles that could be easily
carried by wind resulting in wind erosion. The dry weather also favors gusty wind leading to
wind erosion. Gusty wind can take away even the larger soil particles.
Wind is another agent causing land degradation. Winds are light and moderate during
summer and high during rainy season. Thus, the edaphic or abiotic factors contribute
significantly to a host of interconnected chain reactions from soil formation to soil erosion
making the land unfit for cultivation and adversely affecting the growth of vegetation.
However, the rate of land degradation has been accelerated due to anthropogenic factors that
are directed at unsustainable resource use patterns.

Study on Carrying Capacity to develop Industrial Siting Guidelines in Bellary, Hospet and Sandur region
Environmental Management And Policy Research Institute 57
Figure 5.4: Deposit of silt in streams and water bodies of mining area, Vysanakere, Hospet
5.2 Anthropogenic causes
Anthropogenic causes such as unsustainable land use practices, excessive grazing,
mining and quarrying, unscientific tillage have contributed to degradation of land and soil.
5.2.1 Soil erosion
Soil erosion is increasing in the
study region over the last few years.
Soil erosion problem has assumed
greater significance and seriousness
recently in the study region. One of the
major reasons attributed to high rate of
soil loss is topography, soil structure and
current land use pattern in the region.
As already explained, geologically the
soil is very poor due to arid condition.
In addition, increase in the area under
cultivation and unsustainable cultivation practices have contributed to accelerated rate of
soil erosion. Furthermore, extensive mining activity has enhanced the rate of soil erosion.
According to Perspective Landuse Plan for Karnataka 2025 Bellary region falls in the
soil erosion category of 5-15 tons/ha/year. Studies conducted by the Central Soil and Water
Conservation Institute in Bellary has reported high rate of soil erosion in the region. As per
studies the rate of soil erosion over different return periods in Bellary district is given in
Table 5.1. Decrease in water storage capacity of Tungabhadra reservoir is a proof that soil
erosion has accelerated the rate of sedimentation in the dam over the years.
Table 5.1: Soil loss due to erosion, rain intensity and runoff in Bellary district.
Ret
urn
peri
od Y
ears
Ann
ual
rain
fall
Ann
ual
runo
ff (m
m)
Peak
rat
e ru
noff
Ann
ual s
oil
loss
(t/h
a/yr
)
Dai
ly
Rai
nfal
l
Dai
ly r
unof
f
Hou
rly
rain
fall
Max
imum
15
min
in
tens
ity
Max
imum
30
min
in
tens
ity
2 474 34 0.034 3 62 10.5 36 84 59 5 620 68 0.070 6 82 19.4 46 103 75 10 717 91 0.094 8 96 25.3 53 116 85 25 839 119 0.124 11 113 32.7 62 132 97 50 929 141 0.147 13 126 38.2 68 143 107
Source: Adhikari et al., 2003

Study on Carrying Capacity to develop Industrial Siting Guidelines in Bellary, Hospet and Sandur region
Environmental Management And Policy Research Institute 58
Soil erosion has been estimated for the region by many researchers (NEERI, 2004;
Adhikari and Rao 2003; Rao et al., 2000. Rao et al., 2003). A detailed analysis from hill
ranges of Bellary-Hospet-Sandur region (NEERI 2004) indicates that the erosion of soil is
very high. The area, soil erosion potential in each range and overall weighted average soil
loss is given in Table 5.2. The estimated soil erosion potential is 70.38 t/ha/year in these hill
ranges.
Table 5.2: Estimated soil erosion potential of mining areas in different hill ranges.
Sl. No.
Hill Range Erosion (t/ha/year)
Area (ha) Total Erosion (t/year)
1 Copper Mountain Range 123.18 2373.11 29,2319.7 2 Ramanadurg Range 93.29 1011.74 94,385.2 3 Ettinahalli 81.40 -- -- 4 Kumaraswamy range 75.56 6993.12 5,28,400.15 5 NEB and Timmapagudi Range 73.03 9065.0 6,62,016.95 6 Donimalai Range 39.42 67,33.98 2,65,453.5 7 Devadari range 45.65 -- -- Weighted Average 70.38 26,177.03 18,42,575.50
Source: REIA for Mining operations in Bellary-Hospet region, Karnataka-report, NEERI, 2004
In the present study, soil loss for the entire study area was estimated using universal
soil loss equation (USDA 1973) otherwise called as RKLSCP formula, for different taluks in
the region. The Universal Soil Loss Equation (USLE) is:
A= R x K x LS x C x P
Where A = Estimate of the Soil Loss Rate in tons/ha/year K = Soil erodibility factor R = Rainfall factor LS = Length/Slope factor C = Crop management factor P = Support practice factor Rainfall factor was calculated based on total rainfall in the region and maximum rainfall
intensity for 30 min. The rainfall intensity was derived from the equation of Adhikari et al.,
(2003). Furthermore, using ready reckoned supplied by USDA, based on the slope of the
region and soil type the soil erosion potential in different regions were calculated. The soil
erosion estimates are given in Table 5.3.
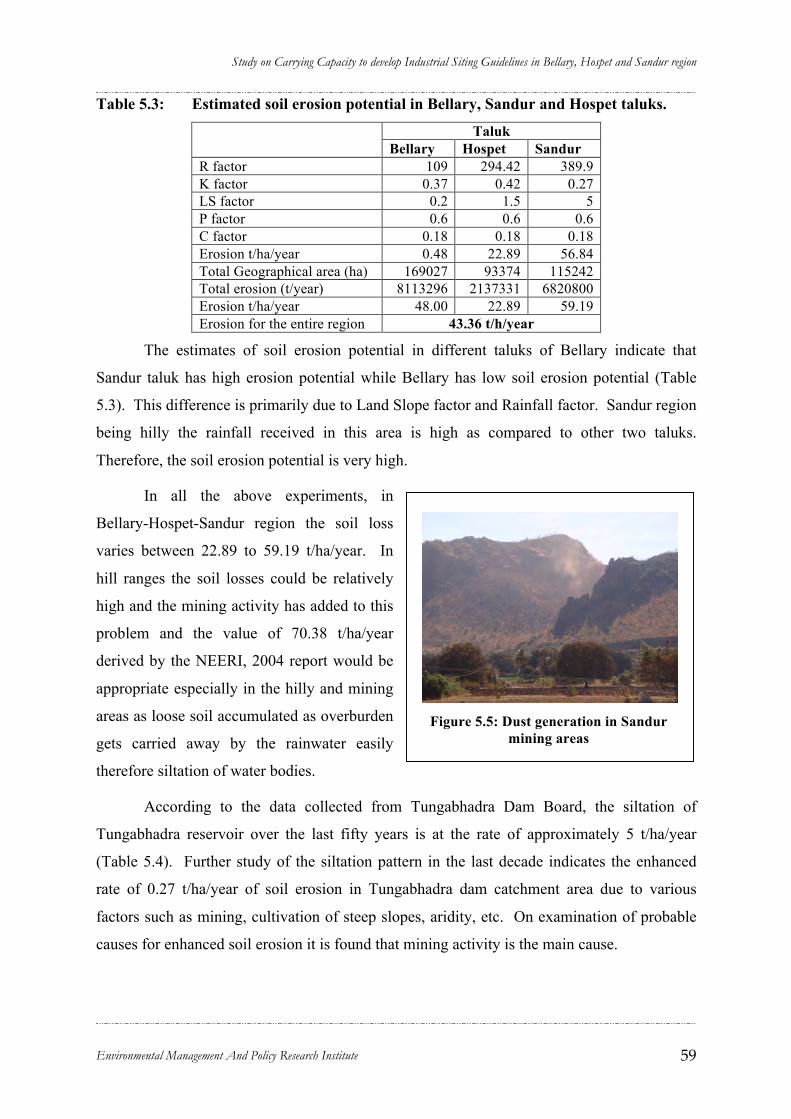
Study on Carrying Capacity to develop Industrial Siting Guidelines in Bellary, Hospet and Sandur region
Environmental Management And Policy Research Institute 59
Figure 5.5: Dust generation in Sandur mining areas
Table 5.3: Estimated soil erosion potential in Bellary, Sandur and Hospet taluks.
Taluk Bellary Hospet Sandur
R factor 109 294.42 389.9 K factor 0.37 0.42 0.27 LS factor 0.2 1.5 5 P factor 0.6 0.6 0.6 C factor 0.18 0.18 0.18 Erosion t/ha/year 0.48 22.89 56.84 Total Geographical area (ha) 169027 93374 115242 Total erosion (t/year) 8113296 2137331 6820800 Erosion t/ha/year 48.00 22.89 59.19 Erosion for the entire region 43.36 t/h/year
The estimates of soil erosion potential in different taluks of Bellary indicate that
Sandur taluk has high erosion potential while Bellary has low soil erosion potential (Table
5.3). This difference is primarily due to Land Slope factor and Rainfall factor. Sandur region
being hilly the rainfall received in this area is high as compared to other two taluks.
Therefore, the soil erosion potential is very high.
In all the above experiments, in
Bellary-Hospet-Sandur region the soil loss
varies between 22.89 to 59.19 t/ha/year. In
hill ranges the soil losses could be relatively
high and the mining activity has added to this
problem and the value of 70.38 t/ha/year
derived by the NEERI, 2004 report would be
appropriate especially in the hilly and mining
areas as loose soil accumulated as overburden
gets carried away by the rainwater easily
therefore siltation of water bodies.
According to the data collected from Tungabhadra Dam Board, the siltation of
Tungabhadra reservoir over the last fifty years is at the rate of approximately 5 t/ha/year
(Table 5.4). Further study of the siltation pattern in the last decade indicates the enhanced
rate of 0.27 t/ha/year of soil erosion in Tungabhadra dam catchment area due to various
factors such as mining, cultivation of steep slopes, aridity, etc. On examination of probable
causes for enhanced soil erosion it is found that mining activity is the main cause.
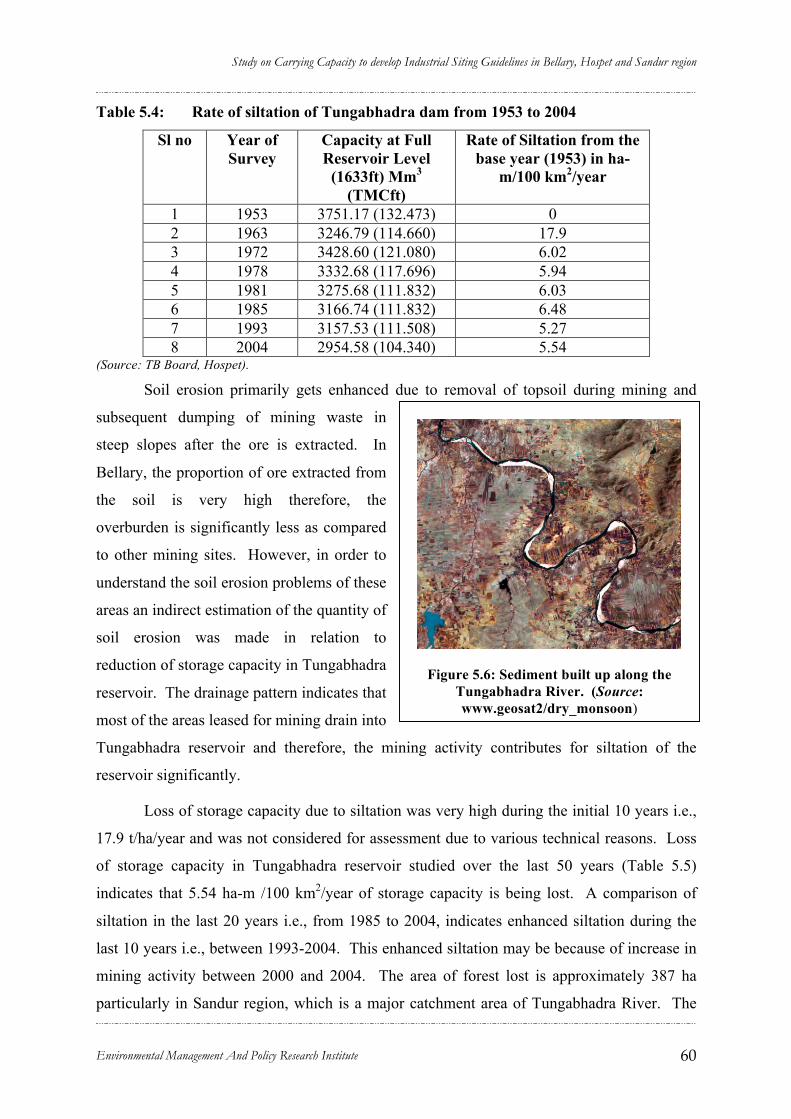
Study on Carrying Capacity to develop Industrial Siting Guidelines in Bellary, Hospet and Sandur region
Environmental Management And Policy Research Institute 60
Figure 5.6: Sediment built up along the Tungabhadra River. (Source: www.geosat2/dry_monsoon)
Table 5.4: Rate of siltation of Tungabhadra dam from 1953 to 2004
Sl no Year of Survey
Capacity at Full Reservoir Level
(1633ft) Mm3 (TMCft)
Rate of Siltation from the base year (1953) in ha-
m/100 km2/year
1 1953 3751.17 (132.473) 0 2 1963 3246.79 (114.660) 17.9 3 1972 3428.60 (121.080) 6.02 4 1978 3332.68 (117.696) 5.94 5 1981 3275.68 (111.832) 6.03 6 1985 3166.74 (111.832) 6.48 7 1993 3157.53 (111.508) 5.27 8 2004 2954.58 (104.340) 5.54
(Source: TB Board, Hospet).
Soil erosion primarily gets enhanced due to removal of topsoil during mining and
subsequent dumping of mining waste in
steep slopes after the ore is extracted. In
Bellary, the proportion of ore extracted from
the soil is very high therefore, the
overburden is significantly less as compared
to other mining sites. However, in order to
understand the soil erosion problems of these
areas an indirect estimation of the quantity of
soil erosion was made in relation to
reduction of storage capacity in Tungabhadra
reservoir. The drainage pattern indicates that
most of the areas leased for mining drain into
Tungabhadra reservoir and therefore, the mining activity contributes for siltation of the
reservoir significantly.
Loss of storage capacity due to siltation was very high during the initial 10 years i.e.,
17.9 t/ha/year and was not considered for assessment due to various technical reasons. Loss
of storage capacity in Tungabhadra reservoir studied over the last 50 years (Table 5.5)
indicates that 5.54 ha-m /100 km2/year of storage capacity is being lost. A comparison of
siltation in the last 20 years i.e., from 1985 to 2004, indicates enhanced siltation during the
last 10 years i.e., between 1993-2004. This enhanced siltation may be because of increase in
mining activity between 2000 and 2004. The area of forest lost is approximately 387 ha
particularly in Sandur region, which is a major catchment area of Tungabhadra River. The

Study on Carrying Capacity to develop Industrial Siting Guidelines in Bellary, Hospet and Sandur region
Environmental Management And Policy Research Institute 61
Figure 5.7: Deposits of iron-ore & mining waste in the valleys
siltation may have added to drastic reduction in the storage capacity. Between the years 1985
– 1993 the siltation rate in Tungabhadra reservoir was 5. 266 t/ha/year. Similarly siltation
was 5. 54 t/ha/year during the year 1993-2004. The net increase was 0.274 t/ha/year in the
last 11 years. This could be attributed to increase in mining activity and the resultant deposit
of overburden in the region. This additional siltation amounts to 7, 72, 049.8 tons of soil
accumulated from the mining areas. The additional soil deposit might have occurred from
the mining area of 1508 ha, thus the soil loss from the mining areas would amount to 511.96
t/ha. Table 5.5 indicating that from hilly regions of Bellary the erosion potential is 70
t/ha/year while considering mined areas alone would have higher potential as indicated here.
Considering the mining leases in forest area i.e., 5400 ha, the siltation in the dam is likely to
increase 3 times in the forthcoming years. Furthermore, the total area leased may further
enhance siltation of reservoir as the erosion potential from non-forest area may be much
higher than the forest area.
Looking at the productivity of iron and
manganese ore in Bellary-Hospet-Sandur
sector with an annual production of 30 million
tons of ore and a ratio of ore to overburden is
1:4.5 the amount of overburden is estimated
to be 135 million tons. Estimated siltation is
772049.8 tons and the proportion of
overburden found in the silt is 0.0057. With
the annual rainfall of 806 mm per annum in
Sandur region the soil loss potential is 56.84
t/ha/year under normal conditions. Under
mining conditions the erosion potential is 9
times more.
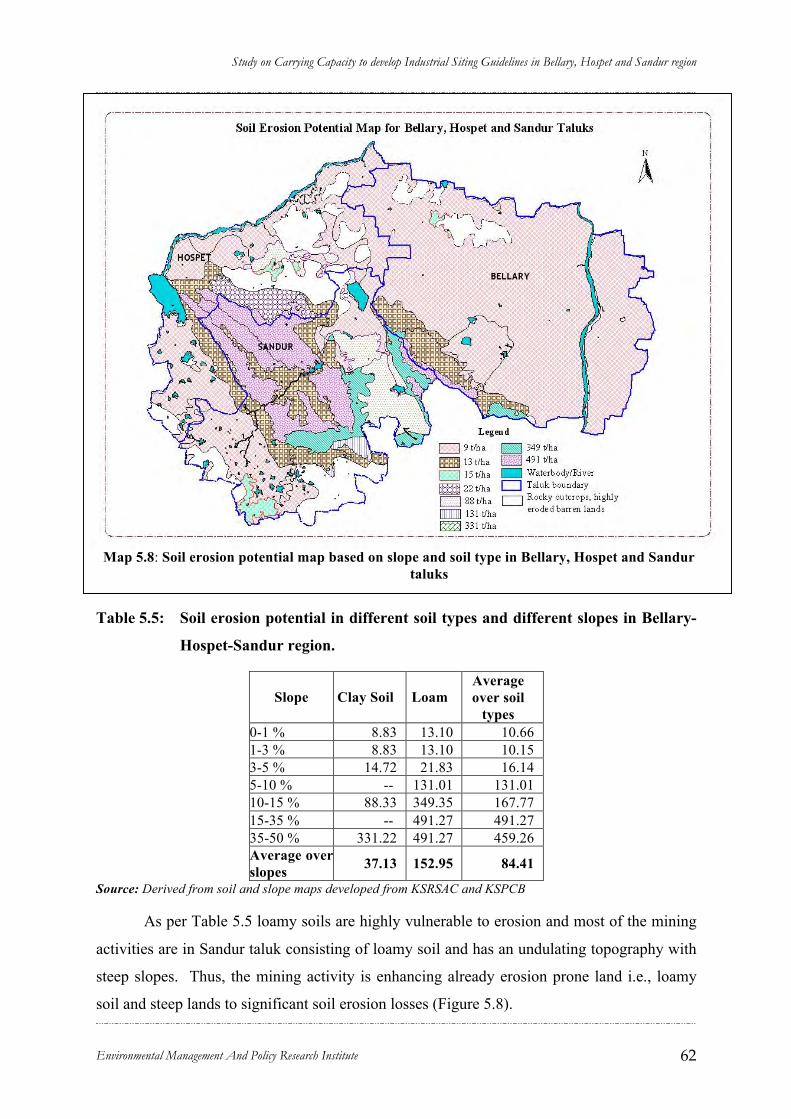
Study on Carrying Capacity to develop Industrial Siting Guidelines in Bellary, Hospet and Sandur region
Environmental Management And Policy Research Institute 62
Figure 5.7: Deposits of iron-ore & waste
Map 5.8: Soil erosion potential map based on slope and soil type in Bellary, Hospet and Sandur taluks
Table 5.5: Soil erosion potential in different soil types and different slopes in Bellary-
Hospet-Sandur region.
Slope Clay Soil Loam Average over soil
types 0-1 % 8.83 13.10 10.66 1-3 % 8.83 13.10 10.15 3-5 % 14.72 21.83 16.14 5-10 % -- 131.01 131.01 10-15 % 88.33 349.35 167.77 15-35 % -- 491.27 491.27 35-50 % 331.22 491.27 459.26 Average over slopes 37.13 152.95 84.41
Source: Derived from soil and slope maps developed from KSRSAC and KSPCB
As per Table 5.5 loamy soils are highly vulnerable to erosion and most of the mining
activities are in Sandur taluk consisting of loamy soil and has an undulating topography with
steep slopes. Thus, the mining activity is enhancing already erosion prone land i.e., loamy
soil and steep lands to significant soil erosion losses (Figure 5.8).

Study on Carrying Capacity to develop Industrial Siting Guidelines in Bellary, Hospet and Sandur region
Environmental Management And Policy Research Institute 63
5.2.2 Fragmentation of landscape
Mining of iron and manganese ore has immensely damaged the natural landscape of
the study area. There are 71 mines in the project area extracting annually 30 million tons of
ore by opening 1500 ha of forests (Table 5.6).
Table 5.6: Extent of land use types during the study period-as per satellite image.
Land use type Area (ha)
2000 Area (ha)
2004 Difference
(ha) Remarks
Forest 33251.96 33071.89 -180.06 Lost due to Mining Industrial Waste 64.80 158.32 93.52 Enhanced due to Mining Mining 1201.12 1506.03 304.91 Enhanced due to Mining Plantations 1232.99 1246.10 13.11 -- Scrub Forest 68241.77 68042.24 -199.53 Lost due to Mining Total 388801.86 388801.86 0.00 --
(Source: KSRSAC, 2006)
Fragmentation of landscape due to mining and subsequent overburden deposit on the
land is resulting in loss of contiguity of landscape. It is observed that agricultural lands are
also put to mining activity. Thus, the land suitable for agriculture when converted into
mining is going to hamper the productivity of land as the land becomes unfit for cultivation.
5.2.3 Unsustainable agricultural practices
Unsustainable land use practices have contributed immensely to land degradation.
Some of the causes and effects of unsustainable land use practices are discussed here:
Subsistence farming: Hospet and Sandur are hilly areas and are highly vulnerable for soil
erosion. Cultivation on the steep slopes and deep ploughing are some of the practices causing
land degradation. It has been prescribed that zero-tillage will substantially enhance soil
structure, organic matter accumulation and water holding capacity of agricultural land. In the
study area particularly in command area growing of commercial crops such as cotton, paddy,
groundnut and onion destroys soil structure thereby enhancing soil erosion. As per recent
observation the extent of area under commercial crops such as cotton, groundnut and onion is
increasing year by year. Groundnut and onion cultivation need breaking of soil structure
while harvesting. This activity enhances the potential of soil erosion as the fields are left
unused after harvest. Opened up soil after harvesting of crops and subsequent rainfall
enhances soil erosion.
Fertilizers and Pesticides: Extensive use of chemical fertilizers and pesticides are the main
causes of land degradation due to toxicity built-up in the soil. In Bellary region, high
Study on Carrying Capacity to develop Industrial Siting Guidelines in Bellary, Hospet and Sandur region
Environmental Management And Policy Research Institute 64
incidence of pesticide usage to control pests and diseases has been reported. Cotton is grown
in over 5 lakh ha in the region and therefore the use of fertilizers and pesticides is high.
Further, the proportion of high yielding crops to total cropped area is high (82%) and
therefore the usage of fertilizer is also high. The use of fertilizers in agricultural crops has
enhanced the nitrate concentration in the water and also in the soil.
Absence of trees in the farmland: Low density of trees in the farmland is also responsible
for land degradation. The trees acts as shelterbelts and reduce the evapo-transpiration besides
creating micro-climate favorable for soil structure. Absence of trees coupled with higher
evapo-transpiration causes breakdown of soil structure and reduces the organic content.
Bellary records the lowest tree density on farmland.
Cropping pattern: Crop rotation and mixture of crops in cultivation helps in the
maintenance of soil fertility in addition to enhancement of farm income. But, continuous
mono-cropping in command area has contributed to decline in fertility. Cultivation of paddy
and sugarcane throughout the year has rendered the soil less fertile. Organic carbon levels
have decreased to 0.3 or 0.4 % in agricultural lands in these areas due to lack of application
of organic manure and increased crop intensity. Further, enhancement of cultivation with
groundnut and onion crops has increased the potential of soil erosion. Lack of crop mixture
and crop rotation with cereals and legumes in command areas have made way for increase in
the application of fertilizers and therefore resulting in loss of organic matter and fertility of
soil.
Excessive grazing: The density of livestock, especially of goats and sheep, is one of the
major causes of land degradation. By and large, the population of livestock has increased
over the two census periods. Interestingly, the goat and sheep population has increased in
this period while the buffalo and cattle population has decreased perhaps due to paucity of
grazing land and farmers’ inability to feed the livestock. Successive xeric conditions have
made the farmers to go for sheep and goat rearing. Both sheep and goats are hardy species
that can live in xeric conditions.
Though the livestock population has increased considerably in the district the grazing
land available is only 5472 ha in the entire district. The per capita land available for grazing
is only 0.01 ha. Even assuming that cultivable wastelands, trees and groves are available for
grazing the per capita grazing area is only 0.06 ha. Therefore the cattle rely on forest land for
grazing. Enhanced goat and sheep population may not indicate good future for forests as the
Study on Carrying Capacity to develop Industrial Siting Guidelines in Bellary, Hospet and Sandur region
Environmental Management And Policy Research Institute 65
goats and sheep can thrive on the bark of various species of shrubs and trees in the forests.
Therefore, forest trees are damaged due to debarking. Goats and sheep even graze on the
seedlings and coppice shoots of stumps in the forest.
5.2.4 Salinity, alkalinity and acidity:
The excessive use of water in the command area for irrigation of crops is causing water
logging of cultivated areas leading to salinity and alkalinity. According to perspective land
use plan for Karnataka 2025, the Tungabhadra command area (TGB) is facing serious salinity
and alkalinity problems (Table 5.8). Excessive use of water, poor cropping pattern and
inadequate drainage are some of the causes of salinity and alkalinity.
Table 5.7: Area affected by salinity and alkalinity in Tungabhadra command area
Area affected (ha) Area treated (ha) Project Salinity Alkalinity Salinity Alkalinity
Tunga Bhadra Project 26018 6193 2575 0
Buildup of salinity, alkalinity and acidity is due to innate parent material in the region
as the Bellary-Hospet-Sandur region is having alkaline soil parent material. Moreover, the
Tungabhadra dam has enhanced the problem of salinity due to inundation of water in the
command area.
5.2.5 Deforestation
Deforestation is another major cause of land degradation. In the study region the forest cover
is very low (11% of total geographical area) and the canopy density is also very low. Most of
the land under forests consists of only scrub forest which indicates that the land is xeric in
nature. Xeric land coupled with shallow soils is prone to soil erosion. With increasing
population and urbanization, people have to depend more on forests for energy needs. Over
the years it is also noted that the goat and sheep population has increased in the region
indicating that forests are more vulnerable as a source of fodder to livestock. Thus the
compounding effect on loss of tree cover and forest is inevitable. The forest area excavated
for mining is depriving the biomass resources to the people. In the study region the rate of
deforestation is very high. Out of 31,000 ha of forestland nearly 5550 ha of forestland is
degraded due to mining and another 7000 ha of forest land has been granted for mining out of
which 600 ha is on mining lease.
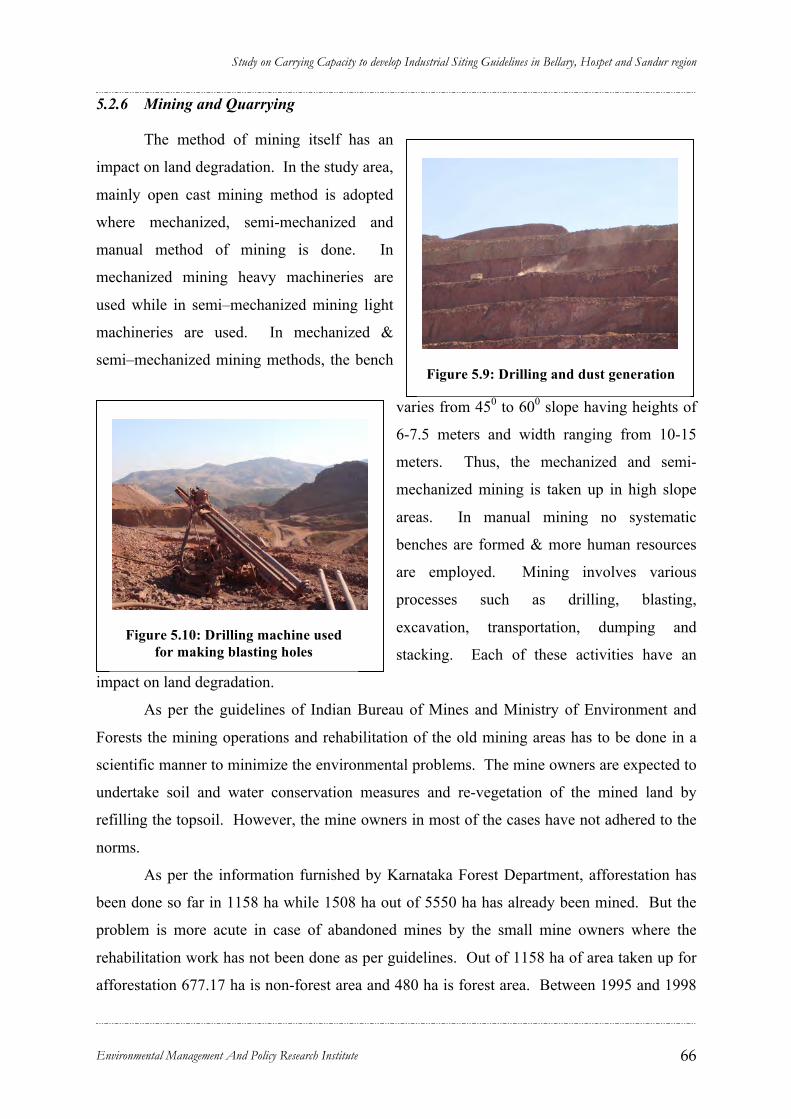
Study on Carrying Capacity to develop Industrial Siting Guidelines in Bellary, Hospet and Sandur region
Environmental Management And Policy Research Institute 66
Figure 5.9: Drilling and dust generation
due to drilling
Figure 5.10: Drilling machine used for making blasting holes
5.2.6 Mining and Quarrying
The method of mining itself has an
impact on land degradation. In the study area,
mainly open cast mining method is adopted
where mechanized, semi-mechanized and
manual method of mining is done. In
mechanized mining heavy machineries are
used while in semi–mechanized mining light
machineries are used. In mechanized &
semi–mechanized mining methods, the bench
varies from 450 to 600 slope having heights of
6-7.5 meters and width ranging from 10-15
meters. Thus, the mechanized and semi-
mechanized mining is taken up in high slope
areas. In manual mining no systematic
benches are formed & more human resources
are employed. Mining involves various
processes such as drilling, blasting,
excavation, transportation, dumping and
stacking. Each of these activities have an
impact on land degradation.
As per the guidelines of Indian Bureau of Mines and Ministry of Environment and
Forests the mining operations and rehabilitation of the old mining areas has to be done in a
scientific manner to minimize the environmental problems. The mine owners are expected to
undertake soil and water conservation measures and re-vegetation of the mined land by
refilling the topsoil. However, the mine owners in most of the cases have not adhered to the
norms.
As per the information furnished by Karnataka Forest Department, afforestation has
been done so far in 1158 ha while 1508 ha out of 5550 ha has already been mined. But the
problem is more acute in case of abandoned mines by the small mine owners where the
rehabilitation work has not been done as per guidelines. Out of 1158 ha of area taken up for
afforestation 677.17 ha is non-forest area and 480 ha is forest area. Between 1995 and 1998
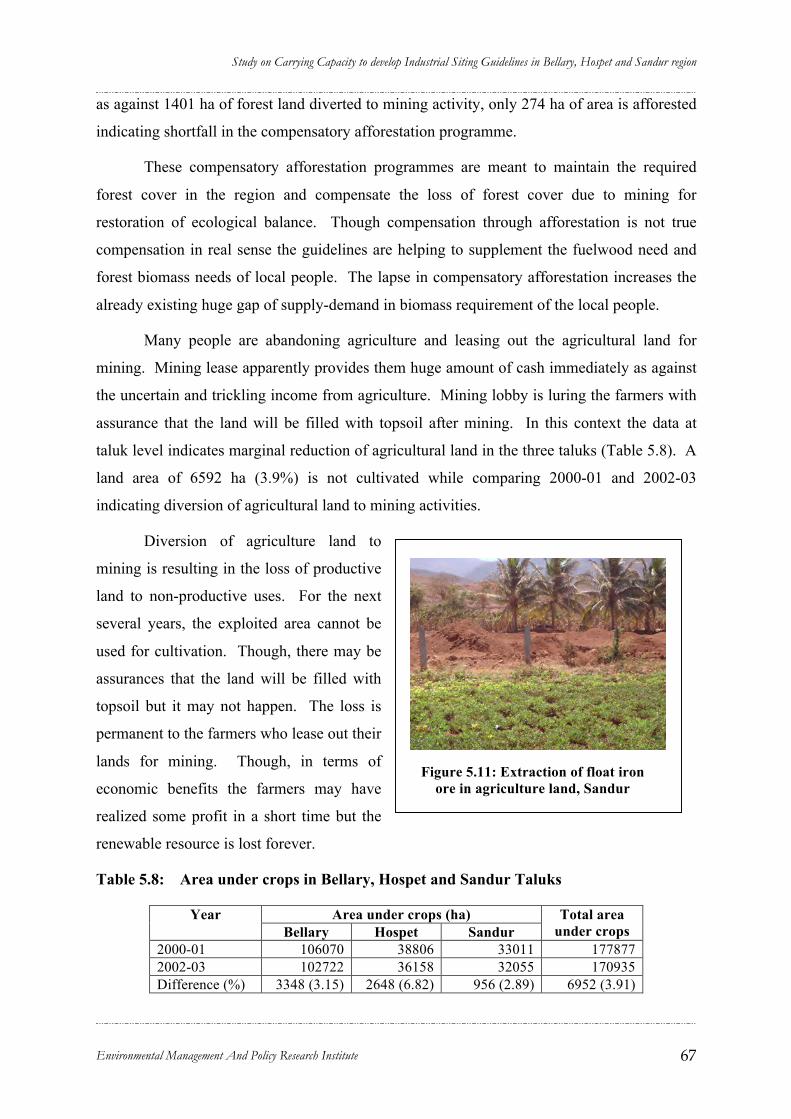
Study on Carrying Capacity to develop Industrial Siting Guidelines in Bellary, Hospet and Sandur region
Environmental Management And Policy Research Institute 67
Figure 5.11: Extraction of float iron ore in agriculture land, Sandur
as against 1401 ha of forest land diverted to mining activity, only 274 ha of area is afforested
indicating shortfall in the compensatory afforestation programme.
These compensatory afforestation programmes are meant to maintain the required
forest cover in the region and compensate the loss of forest cover due to mining for
restoration of ecological balance. Though compensation through afforestation is not true
compensation in real sense the guidelines are helping to supplement the fuelwood need and
forest biomass needs of local people. The lapse in compensatory afforestation increases the
already existing huge gap of supply-demand in biomass requirement of the local people.
Many people are abandoning agriculture and leasing out the agricultural land for
mining. Mining lease apparently provides them huge amount of cash immediately as against
the uncertain and trickling income from agriculture. Mining lobby is luring the farmers with
assurance that the land will be filled with topsoil after mining. In this context the data at
taluk level indicates marginal reduction of agricultural land in the three taluks (Table 5.8). A
land area of 6592 ha (3.9%) is not cultivated while comparing 2000-01 and 2002-03
indicating diversion of agricultural land to mining activities.
Diversion of agriculture land to
mining is resulting in the loss of productive
land to non-productive uses. For the next
several years, the exploited area cannot be
used for cultivation. Though, there may be
assurances that the land will be filled with
topsoil but it may not happen. The loss is
permanent to the farmers who lease out their
lands for mining. Though, in terms of
economic benefits the farmers may have
realized some profit in a short time but the
renewable resource is lost forever.
Table 5.8: Area under crops in Bellary, Hospet and Sandur Taluks
Area under crops (ha) Year Bellary Hospet Sandur
Total area under crops
2000-01 106070 38806 33011 177877 2002-03 102722 36158 32055 170935 Difference (%) 3348 (3.15) 2648 (6.82) 956 (2.89) 6952 (3.91)

Study on Carrying Capacity to develop Industrial Siting Guidelines in Bellary, Hospet and Sandur region
Environmental Management And Policy Research Institute 68
Figure 5.12 (A): Mining and mining waste dumps in agriculture land of Devagirihalli, Sandur Taluk. -2004
From the personal interviews and field visits to mining areas it was learnt that the
leasing of agriculture land was confined to villages where iron and manganese ore deposit is
rich. The villages where the cropland was diverted for mining are Bujanganagar, Laxmipura
and others. However, there are no records available from these villages either as primary
data from the village or from the remotely sensed maps. However, from the KSRSAC maps
(Table 5.9 and Figure 5.12 a & b) it was identified that around Devagirihalli village nearly 20
ha of cropland was diverted for mining and an additional 17 ha was used for dumping of
overburden.
Table 5.9: Diversion of agriculture land to mining and dumping of mining waste in
Devagirihalli
Land use type Year 2000 Year 2004 Difference Are under crop land (ha) 230.93 210.84 - 20.09 Area under mining (ha) -- 8.70 + 8.70 Area under mining/dumping (ha) -- 11.39 + 11.369 Total 230.93 230.93
Source: derived from KSRSAC 2005.

Study on Carrying Capacity to develop Industrial Siting Guidelines in Bellary, Hospet and Sandur region
Environmental Management And Policy Research Institute 69
Figure 5.12 (B): Agriculture land before commencement of mining activity in Devagirihalli, Sandur Taluk - 2000
5.3 Key findings on land degradation
Conversion of forest land and non-forest land is taking place at a large scale in
Bellary district. Over 180 ha of forest area coming under the control of forest department is
lost in the last 4 years. Similarly 199 ha of scrub forest under non-forest area is lost. The
area enhanced under mining is 304 ha. Thus, the land degradation is rampant in the study
area due to mining and related industrial activities. Land degradation due to soil erosion is
another major cause of concern in the study area as estimates in the region indicate high
erosion rates. In the hilly region the soil loss is to the extent of 70 tons/ha/year, while in the
plain area average erosion is nearly 23 tons/ha/year. Siltation of TB reservoir is an indication
of enhanced mining activity and flow of silt from the hilly regions. Further soil degradation
is also occurring due to salinity build up near reservoir areas. Fragmentation of agriculture
and forestlands are also responsible for enhanced land degradation as cohesive landscape is
being degraded into mosaics of different uses.

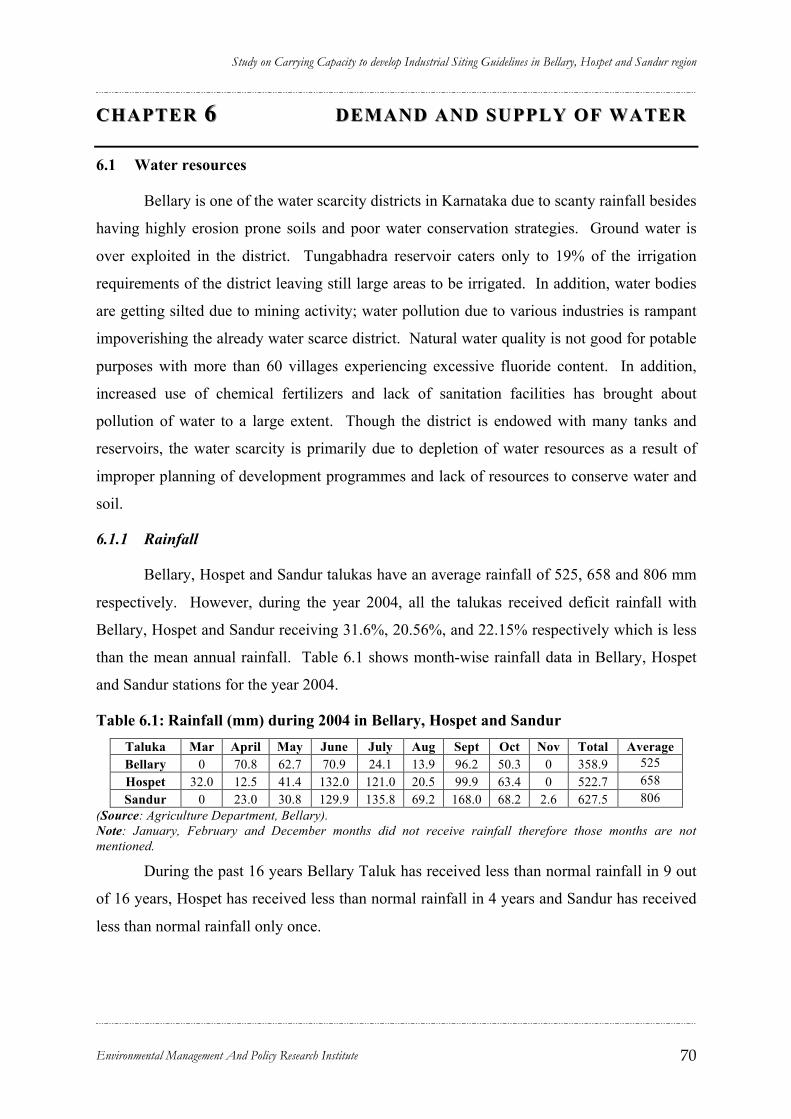
Study on Carrying Capacity to develop Industrial Siting Guidelines in Bellary, Hospet and Sandur region
Environmental Management And Policy Research Institute 70
CHAPTER CHAPTER 66 DEMAND AND SUPPLY OFDEMAND AND SUPPLY OF WATER WATER
6.1 Water resources
Bellary is one of the water scarcity districts in Karnataka due to scanty rainfall besides
having highly erosion prone soils and poor water conservation strategies. Ground water is
over exploited in the district. Tungabhadra reservoir caters only to 19% of the irrigation
requirements of the district leaving still large areas to be irrigated. In addition, water bodies
are getting silted due to mining activity; water pollution due to various industries is rampant
impoverishing the already water scarce district. Natural water quality is not good for potable
purposes with more than 60 villages experiencing excessive fluoride content. In addition,
increased use of chemical fertilizers and lack of sanitation facilities has brought about
pollution of water to a large extent. Though the district is endowed with many tanks and
reservoirs, the water scarcity is primarily due to depletion of water resources as a result of
improper planning of development programmes and lack of resources to conserve water and
soil.
6.1.1 Rainfall
Bellary, Hospet and Sandur talukas have an average rainfall of 525, 658 and 806 mm
respectively. However, during the year 2004, all the talukas received deficit rainfall with
Bellary, Hospet and Sandur receiving 31.6%, 20.56%, and 22.15% respectively which is less
than the mean annual rainfall. Table 6.1 shows month-wise rainfall data in Bellary, Hospet
and Sandur stations for the year 2004.
Table 6.1: Rainfall (mm) during 2004 in Bellary, Hospet and Sandur Taluka Mar April May June July Aug Sept Oct Nov Total Average Bellary 0 70.8 62.7 70.9 24.1 13.9 96.2 50.3 0 358.9 525 Hospet 32.0 12.5 41.4 132.0 121.0 20.5 99.9 63.4 0 522.7 658 Sandur 0 23.0 30.8 129.9 135.8 69.2 168.0 68.2 2.6 627.5 806
(Source: Agriculture Department, Bellary). Note: January, February and December months did not receive rainfall therefore those months are not mentioned.
During the past 16 years Bellary Taluk has received less than normal rainfall in 9 out
of 16 years, Hospet has received less than normal rainfall in 4 years and Sandur has received
less than normal rainfall only once.

Study on Carrying Capacity to develop Industrial Siting Guidelines in Bellary, Hospet and Sandur region
Environmental Management And Policy Research Institute 71
Figure 6.1: Precipitation and Evapotranspiration in Bellary district. Source: Paulman 2004
Figure 6.2: Vittalapura Tank in Bellary taluk
Higher mean annual temperature associated with low rainfall leads to high rate of
evapo-transpiration, which makes the environment highly unfavorable for living and for crop
cultivation. Potential evapo-transpiration is very high throughout the season and therefore
the district experiences water deficit in most part of the year. (Figure 6.1)
6.1.2 Surface water
The study area is endowed with many
tanks maintained by various agencies
including Gram Panchayats, Zilla Panchayat,
Fish Developers Association and Minor
Irrigation Department. In the study area
Bellary taluk has 1.14%, Hospet has 3.63%
while Sandur has 3.22% of total geographical
area under tanks. A summary of the total
extent of tank area under various agencies is
given in Table 6.2.
Table 6.2: List of tank in the study area
Region Total area (in ha) % Total Area Bellary
Gram Panchayat Tanks 46 Zilla Panchayat Tanks /Fish Developers Association 176 Minor Irrigation Tanks 1699 Subtotal 1921.00 1.14

Study on Carrying Capacity to develop Industrial Siting Guidelines in Bellary, Hospet and Sandur region
Environmental Management And Policy Research Institute 72
Hospet Gram Panchayat Tanks 642.67 Zilla Panchayat Tanks /Fish Developers Association 842.82 Minor Irrigation Tanks 1801 Subtotal 3286.49 3.63
Sandur Gram Panchayat Tanks 3253.69 Zilla Panchayat Tanks /Fish Developers Association 455.18 Subtotal 3708.87 3.22
Total 8916.36 2.38
Figure 6.3: Tungabhadra Reservoir, Hospet
Figure 6.4 : Hullikunta Tank, Sandur
Figure 6.5: Narihalla Reservoir, Sandur
Figure 6.6: Daroji Tank, Hospet
Apart from tanks in the study area there are two major irrigation reservoirs under the
Water Resources Department, namely Tungabhadra and Narihalla reservoirs. Tungabhadra
Study on Carrying Capacity to develop Industrial Siting Guidelines in Bellary, Hospet and Sandur region
Environmental Management And Policy Research Institute 73
reservoir is irrigation cum power generation project while Narihalla dam is only for
irrigation. The details of two reservoirs are given below in Table 6.3.
Table 6.3: List of major irrigation tanks and reservoirs in the study area.
1 Name of Reservoir Tungabhadra Narihalla 2 River Basin Krishna Krishna 3 Name of Stream/ sub-basin Tungabhadra Narihalla/Tungabhadra 5 Catchment area (Km2) 28180 427 6 Yield (TMCft ) 423 57.73 7 Storage TMCft Mcum
a. Gross 132.00 22.94 b. Live 116.84 20.87 c. Dead 2.30 2.07 8 Planned Utilization TMCft Mcum
a. Withdrawals by canals 119.50 20.46 b. Reservoir losses 12.50 5.00 c. Gross utilisation 132.00 25.46 9 Irrigable Area (Ha) 362795 1512
Tungabhadra reservoir with a drainage area of 28,180 km2 was designed for storing
133 TMC of water and was impounded for the first time in the year 1953. Capacity of the
reservoir at various levels was worked out based on the regular contour survey conducted in
the river basin upstream of the dam prior to the impounding of water in the reservoir.
According to this the Gross capacity of Tungabhadra Reservoir was taken as 133.0 TMC
(3766.1 Mm3) at an FRL of 1633 ft (497.738 M). On review of various hydrographic surveys
conducted from 1963 to 1993, for the last 40 years, the siltation rate works out to an average
of 0.52 TMC per year. A comparison of rates of siltation in other major reservoir in India
indicates that the situation in Tungabhadra is not alarming. However, the ground fact is that
due to siltation Tungabhadra Reservoir has lost 25 TMC of its useful storage. This has
contributed to reduction in the irrigation utilization from the reservoir to about 187 TMC in
recent years against 212 TMC of water allocated to the project by Krishna Water Dispute
Tribunal excluding evaporation losses.
6.1.3 Ground water
The study area consists of 10 watersheds with various degree of exploitation (see
Figure 3.6 for watershed map of Bellary District). While classifying the watersheds into
command and non-command, it is seen that all the command in watersheds were considered
safe stage of development. While four non-command watersheds are either semi-critical or
over-exploited. Details of ground water in the watersheds of the study area as well as the
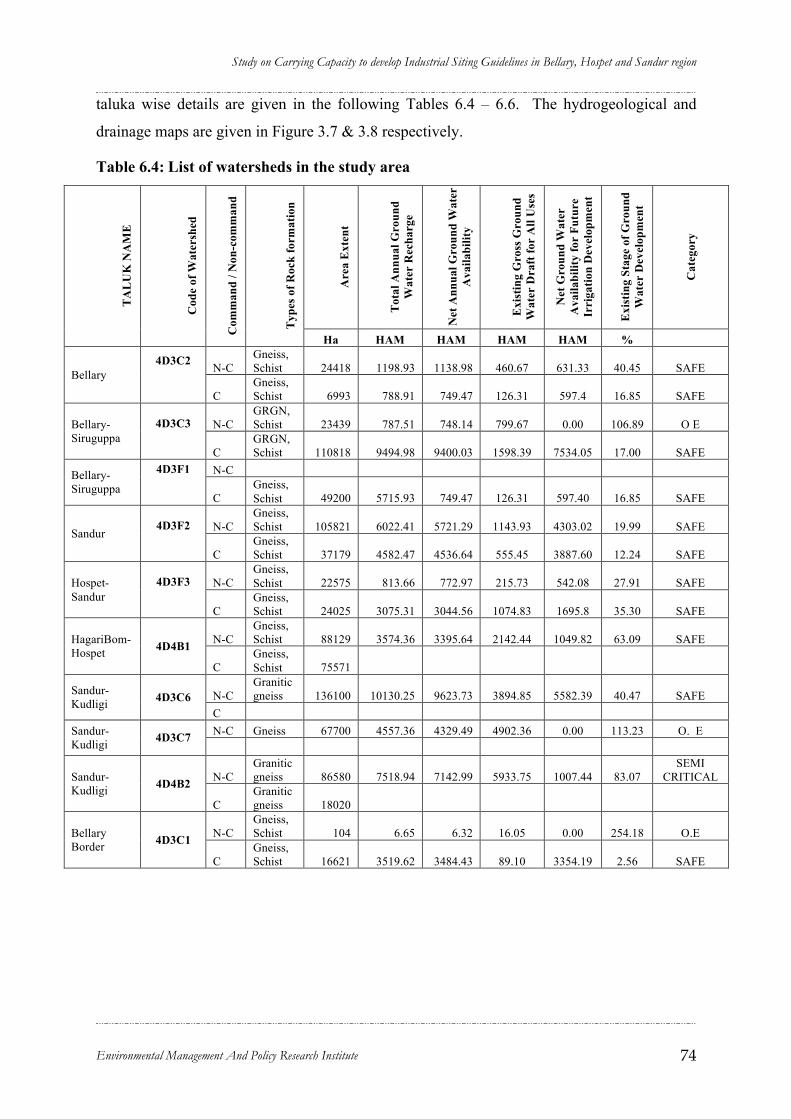
Study on Carrying Capacity to develop Industrial Siting Guidelines in Bellary, Hospet and Sandur region
Environmental Management And Policy Research Institute 74
taluka wise details are given in the following Tables 6.4 – 6.6. The hydrogeological and
drainage maps are given in Figure 3.7 & 3.8 respectively.
Table 6.4: List of watersheds in the study area
Are
a E
xten
t
Tot
al A
nnua
l Gro
und
Wat
er R
echa
rge
Net
Ann
ual G
roun
d W
ater
A
vaila
bilit
y
Exi
stin
g G
ross
Gro
und
Wat
er D
raft
for
All
Use
s
Net
Gro
und
Wat
er
Ava
ilabi
lity
for
Futu
re
Irri
gatio
n D
evel
opm
ent
Exi
stin
g St
age
of G
roun
d W
ater
Dev
elop
men
t
Cat
egor
y
TA
LU
K N
AM
E
Cod
e of
Wat
ersh
ed
Com
man
d / N
on-c
omm
and
Typ
es o
f Roc
k fo
rmat
ion
Ha HAM HAM HAM HAM %
N-C Gneiss, Schist 24418 1198.93 1138.98 460.67 631.33 40.45 SAFE Bellary
4D3C2
C
Gneiss, Schist 6993 788.91 749.47 126.31 597.4 16.85 SAFE
N-C GRGN, Schist 23439 787.51 748.14 799.67 0.00 106.89 O E Bellary-
Siruguppa 4D3C3
C GRGN, Schist 110818 9494.98 9400.03 1598.39 7534.05 17.00 SAFE
N-C Bellary-Siruguppa
4D3F1
C Gneiss, Schist 49200 5715.93 749.47 126.31 597.40 16.85 SAFE
N-C Gneiss, Schist 105821 6022.41 5721.29 1143.93 4303.02 19.99 SAFE Sandur
4D3F2
C Gneiss, Schist 37179 4582.47 4536.64 555.45 3887.60 12.24 SAFE
N-C Gneiss, Schist 22575 813.66 772.97 215.73 542.08 27.91 SAFE Hospet-
Sandur 4D3F3
C Gneiss, Schist 24025 3075.31 3044.56 1074.83 1695.8 35.30 SAFE
N-C Gneiss, Schist 88129 3574.36 3395.64 2142.44 1049.82 63.09 SAFE HagariBom-
Hospet 4D4B1
C Gneiss, Schist 75571
N-C Granitic gneiss 136100 10130.25 9623.73 3894.85 5582.39 40.47 SAFE Sandur-
Kudligi 4D3C6 C N-C Gneiss 67700 4557.36 4329.49 4902.36 0.00 113.23 O. E Sandur-
Kudligi 4D3C7
N-C Granitic gneiss 86580 7518.94 7142.99 5933.75 1007.44 83.07
SEMI CRITICAL Sandur-
Kudligi 4D4B2
C Granitic gneiss 18020
N-C Gneiss, Schist 104 6.65 6.32 16.05 0.00 254.18 O.E Bellary
Border 4D3C1
C Gneiss, Schist 16621 3519.62 3484.43 89.10 3354.19 2.56 SAFE
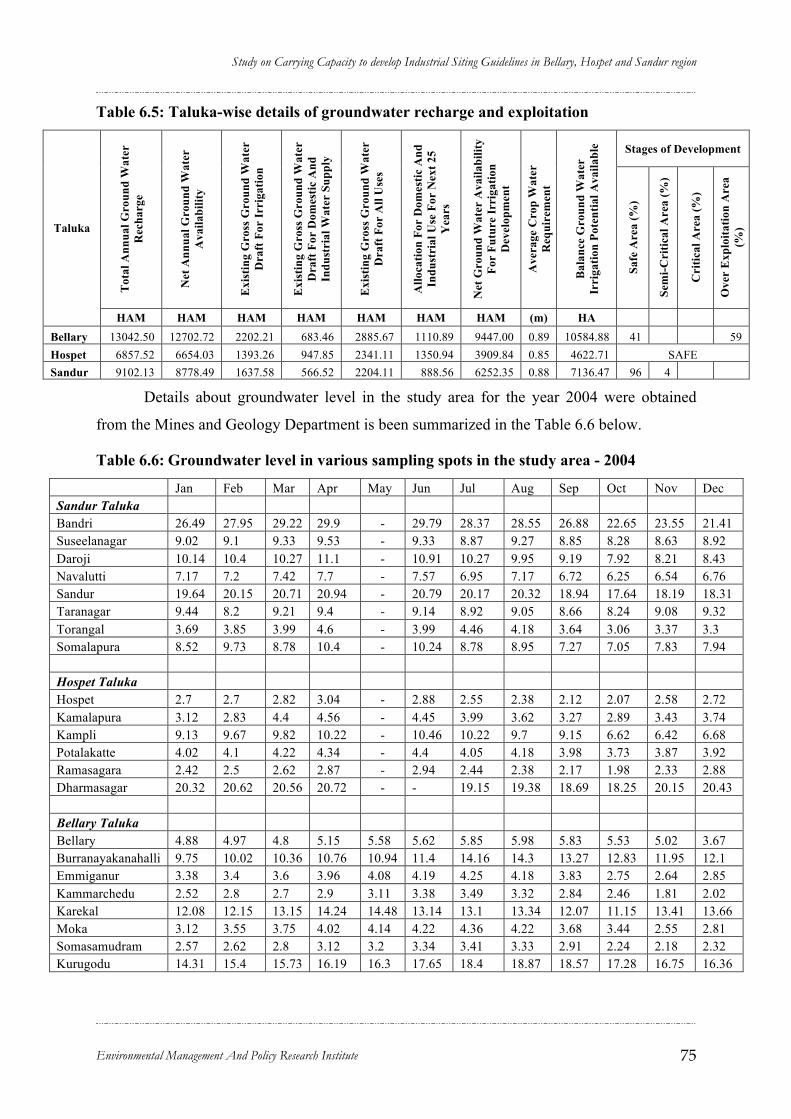
Study on Carrying Capacity to develop Industrial Siting Guidelines in Bellary, Hospet and Sandur region
Environmental Management And Policy Research Institute 75
Table 6.5: Taluka-wise details of groundwater recharge and exploitation
Stages of Development
Tot
al A
nnua
l Gro
und
Wat
er
Rec
harg
e
Net
Ann
ual G
roun
d W
ater
A
vaila
bilit
y
Exi
stin
g G
ross
Gro
und
Wat
er
Dra
ft F
or Ir
riga
tion
Exi
stin
g G
ross
Gro
und
Wat
er
Dra
ft F
or D
omes
tic A
nd
Indu
stri
al W
ater
Sup
ply
Exi
stin
g G
ross
Gro
und
Wat
er
Dra
ft F
or A
ll U
ses
Allo
catio
n Fo
r D
omes
tic A
nd
Indu
stri
al U
se F
or N
ext 2
5 Y
ears
Net
Gro
und
Wat
er A
vaila
bilit
y Fo
r Fu
ture
Irri
gatio
n D
evel
opm
ent
Ave
rage
Cro
p W
ater
R
equi
rem
ent
Bal
ance
Gro
und
Wat
er
Irri
gatio
n Po
tent
ial A
vaila
ble
Safe
Are
a (%
)
Sem
i-Cri
tical
Are
a (%
)
Cri
tical
Are
a (%
)
Ove
r E
xplo
itatio
n A
rea
(%) Taluka
HAM HAM HAM HAM HAM HAM HAM (m) HA Bellary 13042.50 12702.72 2202.21 683.46 2885.67 1110.89 9447.00 0.89 10584.88 41 59 Hospet 6857.52 6654.03 1393.26 947.85 2341.11 1350.94 3909.84 0.85 4622.71 SAFE Sandur 9102.13 8778.49 1637.58 566.52 2204.11 888.56 6252.35 0.88 7136.47 96 4
Details about groundwater level in the study area for the year 2004 were obtained
from the Mines and Geology Department is been summarized in the Table 6.6 below.
Table 6.6: Groundwater level in various sampling spots in the study area - 2004
Jan Feb Mar Apr May Jun Jul Aug Sep Oct Nov Dec Sandur Taluka Bandri 26.49 27.95 29.22 29.9 - 29.79 28.37 28.55 26.88 22.65 23.55 21.41 Suseelanagar 9.02 9.1 9.33 9.53 - 9.33 8.87 9.27 8.85 8.28 8.63 8.92 Daroji 10.14 10.4 10.27 11.1 - 10.91 10.27 9.95 9.19 7.92 8.21 8.43 Navalutti 7.17 7.2 7.42 7.7 - 7.57 6.95 7.17 6.72 6.25 6.54 6.76 Sandur 19.64 20.15 20.71 20.94 - 20.79 20.17 20.32 18.94 17.64 18.19 18.31 Taranagar 9.44 8.2 9.21 9.4 - 9.14 8.92 9.05 8.66 8.24 9.08 9.32 Torangal 3.69 3.85 3.99 4.6 - 3.99 4.46 4.18 3.64 3.06 3.37 3.3 Somalapura 8.52 9.73 8.78 10.4 - 10.24 8.78 8.95 7.27 7.05 7.83 7.94 Hospet Taluka Hospet 2.7 2.7 2.82 3.04 - 2.88 2.55 2.38 2.12 2.07 2.58 2.72 Kamalapura 3.12 2.83 4.4 4.56 - 4.45 3.99 3.62 3.27 2.89 3.43 3.74 Kampli 9.13 9.67 9.82 10.22 - 10.46 10.22 9.7 9.15 6.62 6.42 6.68 Potalakatte 4.02 4.1 4.22 4.34 - 4.4 4.05 4.18 3.98 3.73 3.87 3.92 Ramasagara 2.42 2.5 2.62 2.87 - 2.94 2.44 2.38 2.17 1.98 2.33 2.88 Dharmasagar 20.32 20.62 20.56 20.72 - - 19.15 19.38 18.69 18.25 20.15 20.43 Bellary Taluka Bellary 4.88 4.97 4.8 5.15 5.58 5.62 5.85 5.98 5.83 5.53 5.02 3.67 Burranayakanahalli 9.75 10.02 10.36 10.76 10.94 11.4 14.16 14.3 13.27 12.83 11.95 12.1 Emmiganur 3.38 3.4 3.6 3.96 4.08 4.19 4.25 4.18 3.83 2.75 2.64 2.85 Kammarchedu 2.52 2.8 2.7 2.9 3.11 3.38 3.49 3.32 2.84 2.46 1.81 2.02 Karekal 12.08 12.15 13.15 14.24 14.48 13.14 13.1 13.34 12.07 11.15 13.41 13.66 Moka 3.12 3.55 3.75 4.02 4.14 4.22 4.36 4.22 3.68 3.44 2.55 2.81 Somasamudram 2.57 2.62 2.8 3.12 3.2 3.34 3.41 3.33 2.91 2.24 2.18 2.32 Kurugodu 14.31 15.4 15.73 16.19 16.3 17.65 18.4 18.87 18.57 17.28 16.75 16.36
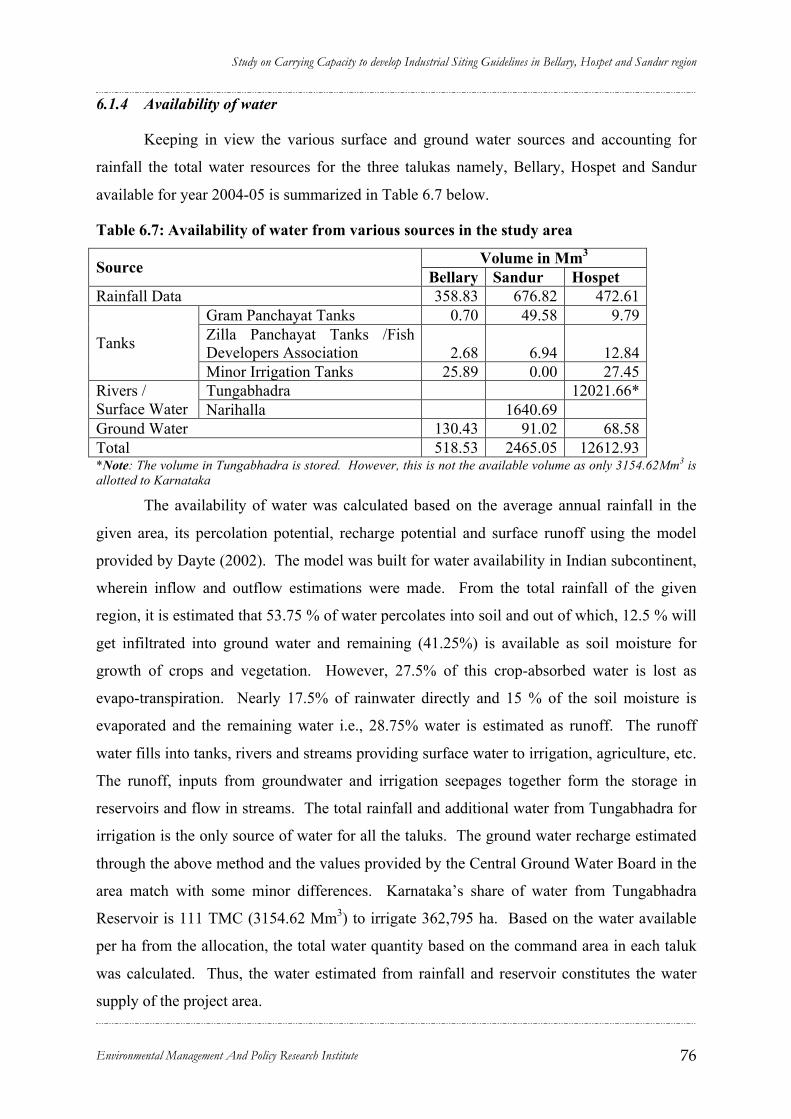
Study on Carrying Capacity to develop Industrial Siting Guidelines in Bellary, Hospet and Sandur region
Environmental Management And Policy Research Institute 76
6.1.4 Availability of water
Keeping in view the various surface and ground water sources and accounting for
rainfall the total water resources for the three talukas namely, Bellary, Hospet and Sandur
available for year 2004-05 is summarized in Table 6.7 below.
Table 6.7: Availability of water from various sources in the study area
Volume in Mm3 Source Bellary Sandur Hospet Rainfall Data 358.83 676.82 472.61
Gram Panchayat Tanks 0.70 49.58 9.79 Zilla Panchayat Tanks /Fish Developers Association 2.68 6.94 12.84 Tanks
Minor Irrigation Tanks 25.89 0.00 27.45 Tungabhadra 12021.66* Rivers /
Surface Water Narihalla 1640.69 Ground Water 130.43 91.02 68.58 Total 518.53 2465.05 12612.93 *Note: The volume in Tungabhadra is stored. However, this is not the available volume as only 3154.62Mm3 is allotted to Karnataka
The availability of water was calculated based on the average annual rainfall in the
given area, its percolation potential, recharge potential and surface runoff using the model
provided by Dayte (2002). The model was built for water availability in Indian subcontinent,
wherein inflow and outflow estimations were made. From the total rainfall of the given
region, it is estimated that 53.75 % of water percolates into soil and out of which, 12.5 % will
get infiltrated into ground water and remaining (41.25%) is available as soil moisture for
growth of crops and vegetation. However, 27.5% of this crop-absorbed water is lost as
evapo-transpiration. Nearly 17.5% of rainwater directly and 15 % of the soil moisture is
evaporated and the remaining water i.e., 28.75% water is estimated as runoff. The runoff
water fills into tanks, rivers and streams providing surface water to irrigation, agriculture, etc.
The runoff, inputs from groundwater and irrigation seepages together form the storage in
reservoirs and flow in streams. The total rainfall and additional water from Tungabhadra for
irrigation is the only source of water for all the taluks. The ground water recharge estimated
through the above method and the values provided by the Central Ground Water Board in the
area match with some minor differences. Karnataka’s share of water from Tungabhadra
Reservoir is 111 TMC (3154.62 Mm3) to irrigate 362,795 ha. Based on the water available
per ha from the allocation, the total water quantity based on the command area in each taluk
was calculated. Thus, the water estimated from rainfall and reservoir constitutes the water
supply of the project area.

Study on Carrying Capacity to develop Industrial Siting Guidelines in Bellary, Hospet and Sandur region
Environmental Management And Policy Research Institute 77
Fig 6.7: Water distribution diagram as per Average Annual Water Resources of India
Table 6.8: Availability of water from various sources in the study area after deducting
evapo-transpiration and evaporation
Supply (in Mm3) Sources Sub-sources Bellary Sandur Hospet Rainfall* Ground water recharge 103.16 194.59 135.88 Surface flow 43.96 82.91 57.89 Sub-total 143.53 270.73 189.04 Surface Water Tungabadra ** 1422.32 970.70 761.60 Total 1716.56 1525.69 1149.14
*Considering total rainfall in the area, percolation into soil and evapotranspiration from the area has been subtracted ** Water available to each taluk is based on the total available water from Tungabhadra to the state and proportionately distributed to based on command area in each taluk. This water from TB dam to the three taluks is additional water as the TB dam catchment is also outside the study area. Narihalla has not been included as most of the irrigated land is not in Sandur
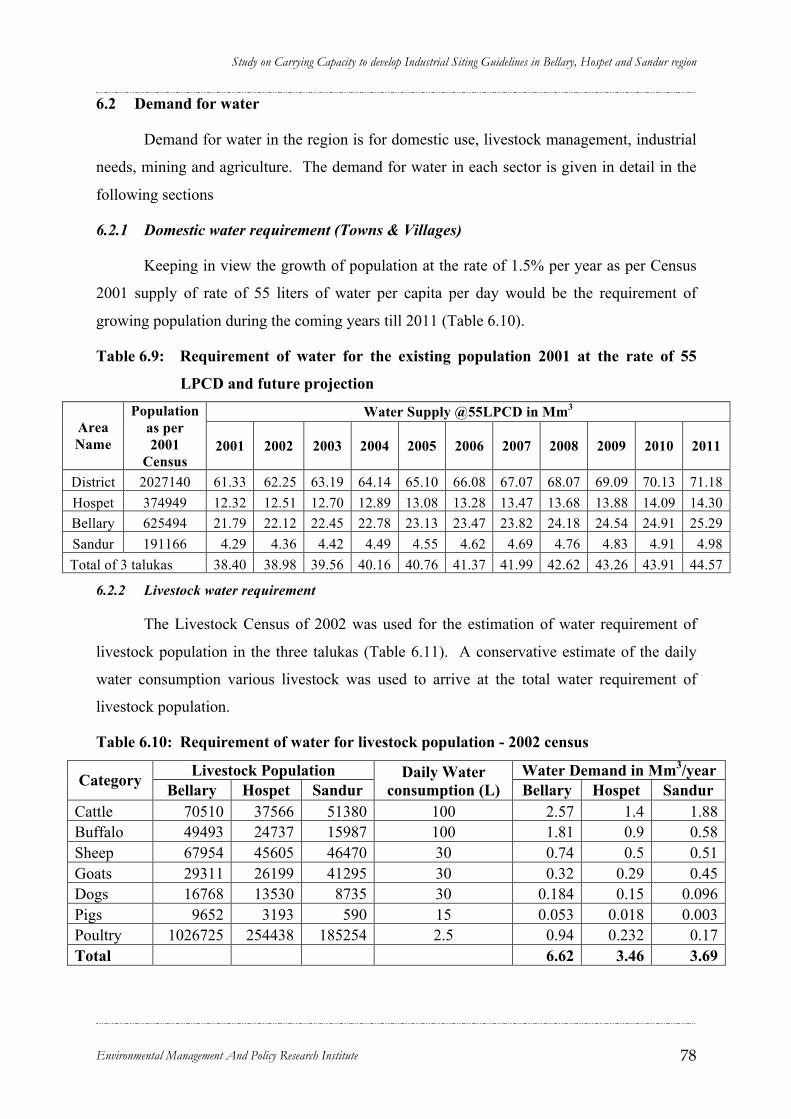
Study on Carrying Capacity to develop Industrial Siting Guidelines in Bellary, Hospet and Sandur region
Environmental Management And Policy Research Institute 78
6.2 Demand for water
Demand for water in the region is for domestic use, livestock management, industrial
needs, mining and agriculture. The demand for water in each sector is given in detail in the
following sections
6.2.1 Domestic water requirement (Towns & Villages)
Keeping in view the growth of population at the rate of 1.5% per year as per Census
2001 supply of rate of 55 liters of water per capita per day would be the requirement of
growing population during the coming years till 2011 (Table 6.10).
Table 6.9: Requirement of water for the existing population 2001 at the rate of 55
LPCD and future projection
Water Supply @55LPCD in Mm3 Area Name
Population as per 2001
Census 2001 2002 2003 2004 2005 2006 2007 2008 2009 2010 2011
District 2027140 61.33 62.25 63.19 64.14 65.10 66.08 67.07 68.07 69.09 70.13 71.18 Hospet 374949 12.32 12.51 12.70 12.89 13.08 13.28 13.47 13.68 13.88 14.09 14.30 Bellary 625494 21.79 22.12 22.45 22.78 23.13 23.47 23.82 24.18 24.54 24.91 25.29 Sandur 191166 4.29 4.36 4.42 4.49 4.55 4.62 4.69 4.76 4.83 4.91 4.98 Total of 3 talukas 38.40 38.98 39.56 40.16 40.76 41.37 41.99 42.62 43.26 43.91 44.57
6.2.2 Livestock water requirement
The Livestock Census of 2002 was used for the estimation of water requirement of
livestock population in the three talukas (Table 6.11). A conservative estimate of the daily
water consumption various livestock was used to arrive at the total water requirement of
livestock population.
Table 6.10: Requirement of water for livestock population - 2002 census
Livestock Population Water Demand in Mm3/year Category Bellary Hospet Sandur Daily Water
consumption (L) Bellary Hospet Sandur Cattle 70510 37566 51380 100 2.57 1.4 1.88 Buffalo 49493 24737 15987 100 1.81 0.9 0.58 Sheep 67954 45605 46470 30 0.74 0.5 0.51 Goats 29311 26199 41295 30 0.32 0.29 0.45 Dogs 16768 13530 8735 30 0.184 0.15 0.096 Pigs 9652 3193 590 15 0.053 0.018 0.003 Poultry 1026725 254438 185254 2.5 0.94 0.232 0.17 Total 6.62 3.46 3.69

Study on Carrying Capacity to develop Industrial Siting Guidelines in Bellary, Hospet and Sandur region
Environmental Management And Policy Research Institute 79
6.2.3 Water requirement industries
Various industries existing in the study area have been classified in to two categories
namely Small scale & Tiny Industries and Medium & Large Industries (Table 6.12 and 6.13)
for the purpose estimation of water requirement
Table 6.11: Requirement of water by Small scale & Tiny Industries existing in the
study area
Units / Taluk Water Consumption Rate m3/yr SSI/Tiny units
Products Hospet Bellary Sandur
Water Consumption Rate m3/day
/unit* Bellary Sandur Hospet
Food Beverages 900 1100 350 5 2007500 638750 1642500 Textiles 500 900 150 5 1642500 273750 912500 Wood 120 100 24 0.5 18250 4380 21900 Printing & Stationery 80 90 12 0.1 3285 438 2920 Leather & Leather Product 150 80 40 10 292000 146000 547500 Rubber & Plastic 20 50 0 5 91250 0 36500 Glass & Glass Chemicals 12 15 0 10 54750 0 43800 Chemicals 8 25 2 10 91250 7300 29200 Metal Products 19 31 120 10 113150 438000 69350 General Engineering works 445 400 104 1 146000 37960 162425 Electrical & Electronics 30 60 12 1 21900 4380 10950 Repairs & Servicing 298 90 80 1 32850 29200 108770 Ferros & Non Ferros 21 19 19 10 69350 69350 76650 Other services 148 300 45 0.5 54750 8212.5 27010 Miscellaneous 390 400 42 0.5 73000 7665 71175 Job works 300 129 50 0.5 23542.5 9125 54750 Total 3441 3789 1050 4735327.5 1674510.5 3817900
• Note: The Water Consumption Rate in red are assumed figures
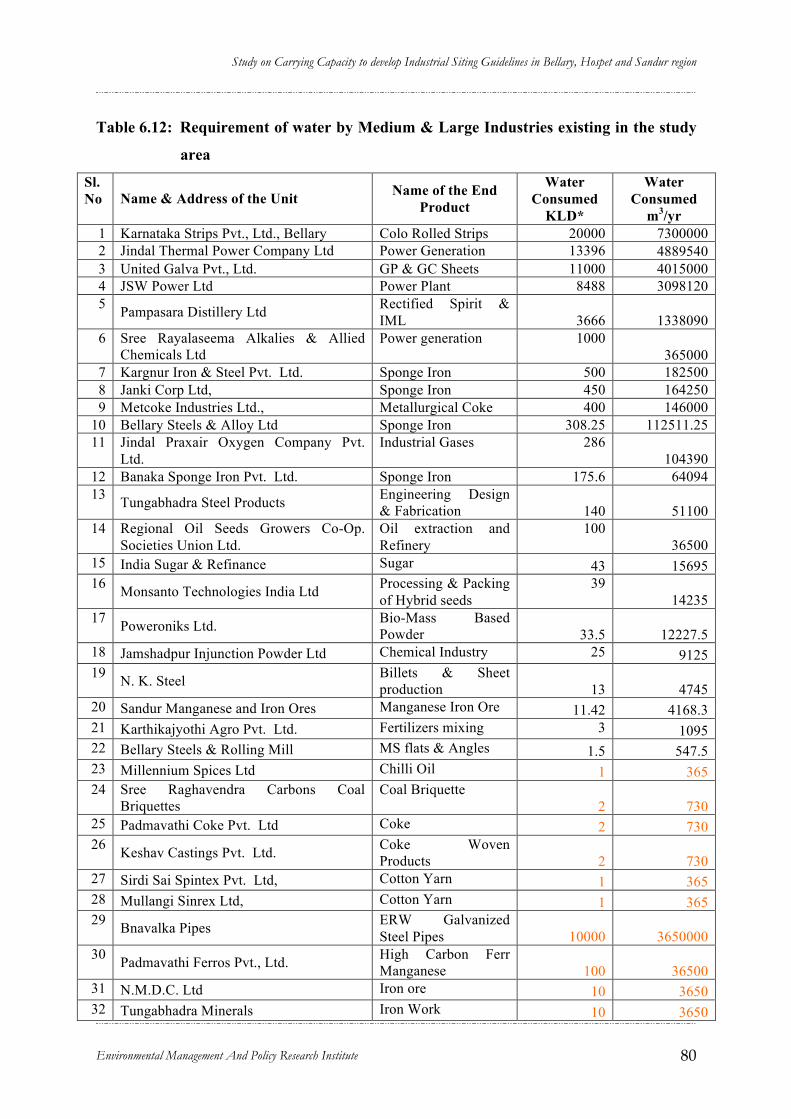
Study on Carrying Capacity to develop Industrial Siting Guidelines in Bellary, Hospet and Sandur region
Environmental Management And Policy Research Institute 80
Table 6.12: Requirement of water by Medium & Large Industries existing in the study
area
Sl.No Name & Address of the Unit Name of the End
Product
Water Consumed
KLD*
Water Consumed
m3/yr 1 Karnataka Strips Pvt., Ltd., Bellary Colo Rolled Strips 20000 7300000 2 Jindal Thermal Power Company Ltd Power Generation 13396 4889540 3 United Galva Pvt., Ltd. GP & GC Sheets 11000 4015000 4 JSW Power Ltd Power Plant 8488 3098120 5 Pampasara Distillery Ltd Rectified Spirit &
IML 3666 1338090 6 Sree Rayalaseema Alkalies & Allied
Chemicals Ltd Power generation 1000
365000 7 Kargnur Iron & Steel Pvt. Ltd. Sponge Iron 500 182500 8 Janki Corp Ltd, Sponge Iron 450 164250 9 Metcoke Industries Ltd., Metallurgical Coke 400 146000
10 Bellary Steels & Alloy Ltd Sponge Iron 308.25 112511.25 11 Jindal Praxair Oxygen Company Pvt.
Ltd. Industrial Gases 286
104390 12 Banaka Sponge Iron Pvt. Ltd. Sponge Iron 175.6 64094 13 Tungabhadra Steel Products Engineering Design
& Fabrication 140 51100 14 Regional Oil Seeds Growers Co-Op.
Societies Union Ltd. Oil extraction and Refinery
100 36500
15 India Sugar & Refinance Sugar 43 15695 16 Monsanto Technologies India Ltd Processing & Packing
of Hybrid seeds 39
14235 17 Poweroniks Ltd. Bio-Mass Based
Powder 33.5 12227.5 18 Jamshadpur Injunction Powder Ltd Chemical Industry 25 9125 19 N. K. Steel Billets & Sheet
production 13 4745 20 Sandur Manganese and Iron Ores Manganese Iron Ore 11.42 4168.3 21 Karthikajyothi Agro Pvt. Ltd. Fertilizers mixing 3 1095 22 Bellary Steels & Rolling Mill MS flats & Angles 1.5 547.5 23 Millennium Spices Ltd Chilli Oil 1 365 24 Sree Raghavendra Carbons Coal
Briquettes Coal Briquette
2 730 25 Padmavathi Coke Pvt. Ltd Coke 2 730 26 Keshav Castings Pvt. Ltd. Coke Woven
Products 2 730 27 Sirdi Sai Spintex Pvt. Ltd, Cotton Yarn 1 365 28 Mullangi Sinrex Ltd, Cotton Yarn 1 365 29 Bnavalka Pipes ERW Galvanized
Steel Pipes 10000 3650000 30 Padmavathi Ferros Pvt., Ltd. High Carbon Ferr
Manganese 100 36500 31 N.M.D.C. Ltd Iron ore 10 3650 32 Tungabhadra Minerals Iron Work 10 3650

Study on Carrying Capacity to develop Industrial Siting Guidelines in Bellary, Hospet and Sandur region
Environmental Management And Policy Research Institute 81
Sl.No Name & Address of the Unit Name of the End
Product
Water Consumed
KLD*
Water Consumed
m3/yr 33 BSAL (ISP) M. S. Steel 100 36500 34 Siddeswara Oils & Allied Products Pvt.
Ltd Oil
50 18250 35 KOF Ltd Oil, Oilcake 50 18250 36 SlS Power Industries Ltd. Power Generation 100 36500 37 Sharada Veg Oil Ltd Solvent Extraction 50 18250 38 Sigma Solid Strips Pvt. Ltd Sponge Iron 100 36500 39 Rangineni Steel Pvt. Ltd Sponge Iron 100 36500 40 Papuri Steels Ltd. Sponge Iron 100 36500 41 Minerals Sales Pvt. Ltd Sponge Iron 100 36500 42 K.R. Alloy Ltd. Sponge Iron 100 36500 43 Hothur Steels Sponge Iron 100 36500 44 Hindustan Calcined Metal Pvt. Ltd Sponge Iron 100 36500 45 H.K.T. Mining Pvt., Ltd. Sponge Iron 100 36500 46 Siruguppa Sugar & Chemicals Sugar 40 14600
Total 71398.27 26060368.55 Note: The Water Consumption Rate in red are assumed figures (Source: KSPCB, Bellary) 6.2.4 Water requirement of Mining/Quarrying activity
Data obtained from the dept of Mines & Geology for the year 2004-05 shows that
around 31 million tons of various minerals are extracted and the average water consumption
is around 86845 m3/million ton. The total water requirement of mining activity in the region
is around 2693105 m3, the details of which are given in Table 6.14.
Table 6.13: Requirement of water by the mining industry at the rate of 86845
m3/million ton- 2004-05
Sl.No Minerals
Production in Metric
tons
Total Water requirement in m3
(Production * 86845/1000000)
1 Iron Ore, I.O. Fines, Red-oxide 30,618,477.0 2,659,061.0
2 Manganese Ore 355969.0 30914.1 3 Quartz 34194.0 2969.6 4 Soap Stone 1845.0 160.2 Grand Total 31010485.0 2693104.9
* Note: The Water Consumption Rate is average figures obtained from 3 companies

Study on Carrying Capacity to develop Industrial Siting Guidelines in Bellary, Hospet and Sandur region
Environmental Management And Policy Research Institute 82
6.2.5 Water requirement of agriculture sector
Information obtained from the Department of Agriculture was used as the basis for
calculation of water requirement for production of agriculture crops in the agriculture sector.
(Table 6.15).
Table 6.14: Requirement of water for crops under different irrigation systems - 2004-05
in the study area.
Crop area in ha Water consumption in Mm3 Cultivation type Bellary Hospet Sandur
Water consumption m3/ha/crop Bellary Hospet Sandur
Irrigated 74,340 32,150 8,730 8000 594.72 257.2 69.84 Rainfed 86,500 19,020 38,750 2000 173.00 38.04 77.5 Total 160,84
0 51,170 47,480 -- 767.72 295.24 147.34
Source: Agriculture Department, Bellary
6.2.6 Utilization of water in study area
Keeping in view the availability of water from various sources for the three talukas
namely, Bellary, Hospet and Sandur, the water consumption pattern for the year 2004-05 is
given in table 6.16 below.
Table 6.15: Demand of water by various sectors in the study area - 2004-05
Demand in Mm3
Bellary Sandur Hospet Households Water Supply (Towns & Villages) 23.13 4.55 13.08 Livestock Water Supply 6.62 3.7 3.46 Medium & Large Industrial Water Supply 26.06 SSI & Tiny Industrial Water Supply 4.74 1.67 3.82 Mining / Quarrying Water Supply 2.7 Agriculture Water Supply 767.72 147.34 295.24 Total in Utilization 833.08 179.85 342.32 Total availability 1716.56 1525.69 1149.14 Difference (%) 883.48 1345.84 806.82
Use of water by various sectors indicates that agriculture sector is consuming nearly
89.3 % of water. Then comes the commercial use i.e., the use of water by industries and
mining activity. The third category in terms of volume of water consumed for drinking and
domestic use constituting only 3% of total use. Water used by livestock population
constitutes another 1%.

Study on Carrying Capacity to develop Industrial Siting Guidelines in Bellary, Hospet and Sandur region
Environmental Management And Policy Research Institute 83
6.3 Demand and Supply projection of water:
Based on secondary data the demand and supply of water in the study region has been
calculated. However, the historical experience in the study region has revealed that the
recurrence of drought and famines are quite frequent. But, due to construction of
Tungabhadra reservoir and Narihalla barrage the availability of water in the study region
have improved considerably.
The rainfall data analysis between 1990 and 2005 have shown large deviation from
the mean annual rainfall between 5% to 60% considering both excess rainfall and deficit
rainfall. Assuming minimum 10% deficit for each year the demand and supply of water has
been projected for the next 10 years (Table 6.16 to 6.18 for different taluks). The drinking
water supply is projected at 1.5% per annum and 1% for crops and zero percent for industrial
availability.
Table 6.16: Demand, Supply of water considering 2% increase in population and 1%
increase in agriculture in Bellary taluk
Sl no
Year Demand (Mm3)
Supply (Mm3)
Gross Potential Availability
(Mm3) 1 2007 833.08 1716.56 883.48 2 2008 841.21 1716.56 875.35 3 2009 849.44 1716.56 867.12 4 2010 857.75 1716.56 858.81 5 2011 866.15 1716.56 850.41 6 2012 874.64 1716.56 841.92 7 2013 883.22 1716.56 833.34 8 2014 891.89 1716.56 824.67 9 2015 900.66 1716.56 815.9 10 2016 909.51 1716.56 807.05
Table 6.17: Demand, Supply of water considering 2% increase in population and 1%
increase in agriculture in Sandur taluk
Sl no
Year Demand (Mm3)
Supply (Mm3)
Gross Potential
Availability (Mm3)
1 2007 179.85 1525.69 1345.84 2 2008 181.41 1525.69 1344.28 3 2009 183.00 1525.69 1342.69
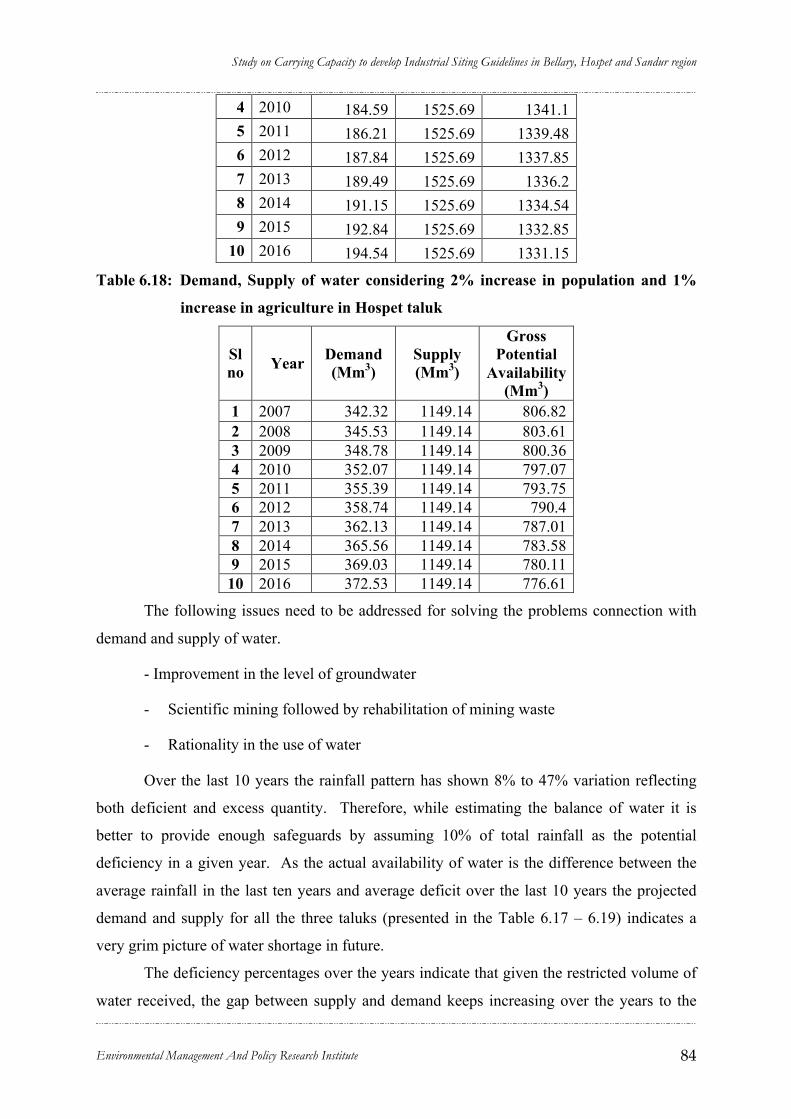
Study on Carrying Capacity to develop Industrial Siting Guidelines in Bellary, Hospet and Sandur region
Environmental Management And Policy Research Institute 84
4 2010 184.59 1525.69 1341.1 5 2011 186.21 1525.69 1339.48 6 2012 187.84 1525.69 1337.85 7 2013 189.49 1525.69 1336.2 8 2014 191.15 1525.69 1334.54 9 2015 192.84 1525.69 1332.85
10 2016 194.54 1525.69 1331.15
Table 6.18: Demand, Supply of water considering 2% increase in population and 1%
increase in agriculture in Hospet taluk
Sl no Year Demand
(Mm3) Supply (Mm3)
Gross Potential
Availability (Mm3)
1 2007 342.32 1149.14 806.82 2 2008 345.53 1149.14 803.61 3 2009 348.78 1149.14 800.36 4 2010 352.07 1149.14 797.07 5 2011 355.39 1149.14 793.75 6 2012 358.74 1149.14 790.4 7 2013 362.13 1149.14 787.01 8 2014 365.56 1149.14 783.58 9 2015 369.03 1149.14 780.11 10 2016 372.53 1149.14 776.61
The following issues need to be addressed for solving the problems connection with
demand and supply of water.
- Improvement in the level of groundwater
- Scientific mining followed by rehabilitation of mining waste
- Rationality in the use of water
Over the last 10 years the rainfall pattern has shown 8% to 47% variation reflecting
both deficient and excess quantity. Therefore, while estimating the balance of water it is
better to provide enough safeguards by assuming 10% of total rainfall as the potential
deficiency in a given year. As the actual availability of water is the difference between the
average rainfall in the last ten years and average deficit over the last 10 years the projected
demand and supply for all the three taluks (presented in the Table 6.17 – 6.19) indicates a
very grim picture of water shortage in future.
The deficiency percentages over the years indicate that given the restricted volume of
water received, the gap between supply and demand keeps increasing over the years to the

Study on Carrying Capacity to develop Industrial Siting Guidelines in Bellary, Hospet and Sandur region
Environmental Management And Policy Research Institute 85
Figure 6.7(A): Narihalla reservoir –Feb 2006.
Figure 6.7(B): Narihalla reservoir – Feb 2007.
tune of 21% in Bellary and 28% in Hospet. However, Sandur taluk having surplus water will
experience reduction in the quantum of water. In view of the high proportion of consumption
of water in agriculture sector there is need to improve efficiency in the used of water in this
sector. Water conservation measures in agriculture sector and reducing demand through
proper cropping pattern would not only enhance the productivity of crops in the region but
also reduces the consumptive use of water. Secondly, reduction in the area under crops
demanding huge quantity of water such as paddy and sugarcane would improve the water
supply in the region. New method of growing rice, such as “Madagascar method” reduces
water consumption considerably and helps provisioning of water for other crops or other
uses. Skipping summer crop where additional 200 mm of water is used for cultivation would
help in reducing the consumption of water in Bellary taluk alone to the tune of 118 Mm3.
There are several rainwater harvesting measures that could be taken up to enhance the soil
moisture conservation and reduction of soil erosion. In a nutshell it can be suggested that
agriculture in Bellary needs improvement and efficiency in the use of water. There is need
for developing an integrated water harvesting and resource use plan for efficient use of water
in agriculture, industry and other sectors.
Comparison of Narihalla reservoir in Feb 2006 and Feb 2007.

Study on Carrying Capacity to develop Industrial Siting Guidelines in Bellary, Hospet and Sandur region
Environmental Management And Policy Research Institute 86
Figure 7.1: Inadequate drinking water in study area
Figure 7.2: Contamination of stream water by iron ore particles
CHAPTER CHAPTER 77 QUALITY OF WATER ANDQUALITY OF WATER AND ENVIRONMENT ENVIRONMENT
Assessment of water quality is one of
the most important exercises required for
determination of the use of water for various
purposes. Water must be clean and safe for
drinking purpose. Keeping this in view, the
Government has prescribed stringent water
quality standards for various purposes. In
Bellary region, given the industrial
aggregation and mining, the water quality is
getting affected continuously and quickly.
Therefore, there is need for addressing the
water quality issues seriously. In this chapter, the water quality aspects of Bellary through
various studies have been already undertaken in the region and also the assessment made in
this study is discussed in detail.
Availability of clean and safe
drinking water is a major problem. More
than 55% of human habitations in Bellary
district are affected by excessive fluoride
(41.87%), brackishness (7.79%), excess
nitrate (3.25%) and excess iron (2.23%).
Presence of organic and inorganic
substances in higher concentration will
have adverse effects on human health. For
instance the presence of fluorine in water
leads to dental and skeletal fluorosis.
Similarly, consumption of brackish water leads to skin diseases. Organic and biological
contamination of water leads to water borne diseases such as Cholera, hepatitis, etc.
Therefore, it is essential to provide the safe and potable drinking water free from impurities in
order to reduce the incidence of diseases and deformities.
In a study conducted by the Department of Mines and Geology, Government of
Karnataka, the data reveals the following information (Table 7.1). The number of villages
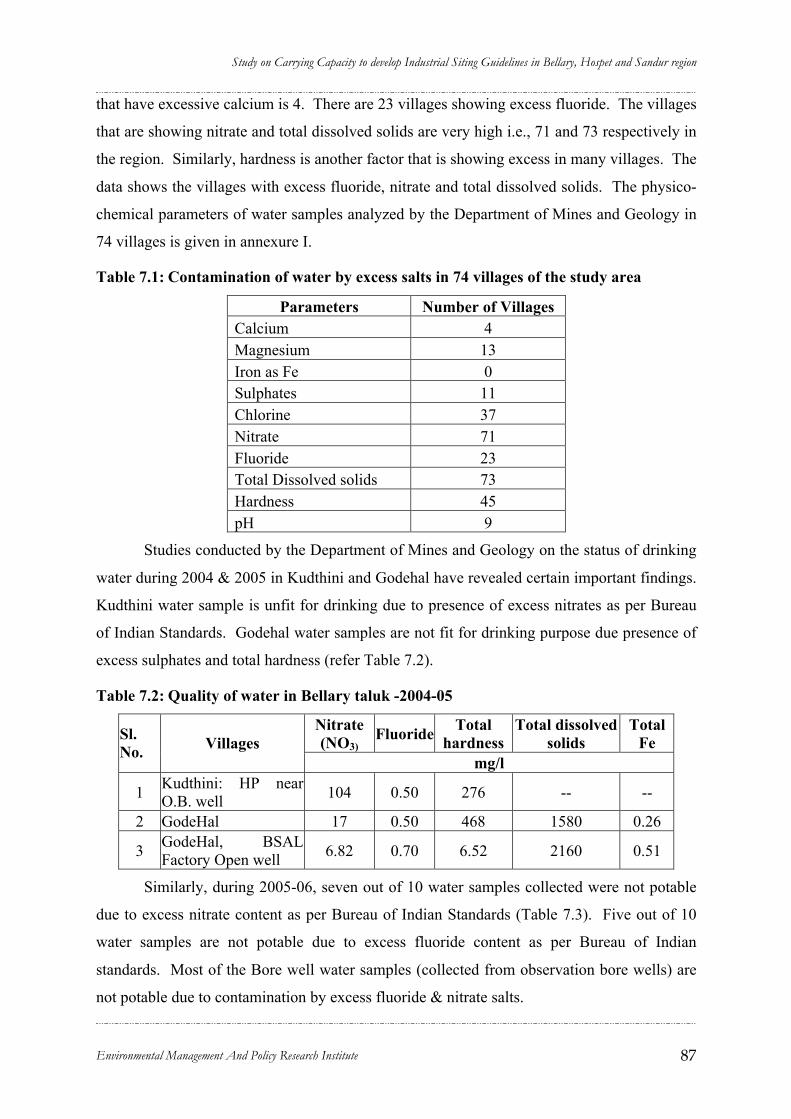
Study on Carrying Capacity to develop Industrial Siting Guidelines in Bellary, Hospet and Sandur region
Environmental Management And Policy Research Institute 87
that have excessive calcium is 4. There are 23 villages showing excess fluoride. The villages
that are showing nitrate and total dissolved solids are very high i.e., 71 and 73 respectively in
the region. Similarly, hardness is another factor that is showing excess in many villages. The
data shows the villages with excess fluoride, nitrate and total dissolved solids. The physico-
chemical parameters of water samples analyzed by the Department of Mines and Geology in
74 villages is given in annexure I.
Table 7.1: Contamination of water by excess salts in 74 villages of the study area
Parameters Number of Villages Calcium 4 Magnesium 13 Iron as Fe 0 Sulphates 11 Chlorine 37 Nitrate 71 Fluoride 23 Total Dissolved solids 73 Hardness 45 pH 9
Studies conducted by the Department of Mines and Geology on the status of drinking
water during 2004 & 2005 in Kudthini and Godehal have revealed certain important findings.
Kudthini water sample is unfit for drinking due to presence of excess nitrates as per Bureau
of Indian Standards. Godehal water samples are not fit for drinking purpose due presence of
excess sulphates and total hardness (refer Table 7.2).
Table 7.2: Quality of water in Bellary taluk -2004-05
Nitrate (NO3)
Fluoride Total hardness
Total dissolved solids
Total Fe Sl.
No. Villages mg/l
1 Kudthini: HP near O.B. well 104 0.50 276 -- --
2 GodeHal 17 0.50 468 1580 0.26
3 GodeHal, BSAL Factory Open well 6.82 0.70 6.52 2160 0.51
Similarly, during 2005-06, seven out of 10 water samples collected were not potable
due to excess nitrate content as per Bureau of Indian Standards (Table 7.3). Five out of 10
water samples are not potable due to excess fluoride content as per Bureau of Indian
standards. Most of the Bore well water samples (collected from observation bore wells) are
not potable due to contamination by excess fluoride & nitrate salts.
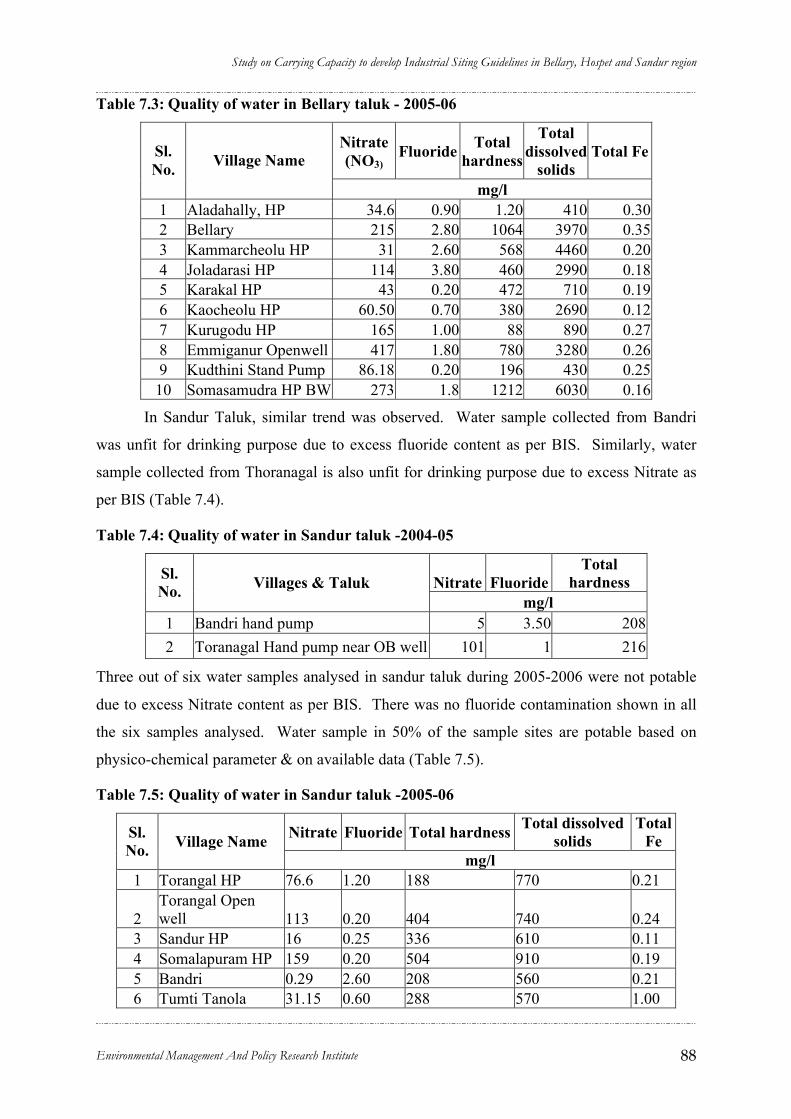
Study on Carrying Capacity to develop Industrial Siting Guidelines in Bellary, Hospet and Sandur region
Environmental Management And Policy Research Institute 88
Table 7.3: Quality of water in Bellary taluk - 2005-06
Nitrate (NO3)
Fluoride Total hardness
Total dissolved
solids Total Fe Sl.
No. Village Name
mg/l 1 Aladahally, HP 34.6 0.90 1.20 410 0.30 2 Bellary 215 2.80 1064 3970 0.35 3 Kammarcheolu HP 31 2.60 568 4460 0.20 4 Joladarasi HP 114 3.80 460 2990 0.18 5 Karakal HP 43 0.20 472 710 0.19 6 Kaocheolu HP 60.50 0.70 380 2690 0.12 7 Kurugodu HP 165 1.00 88 890 0.27 8 Emmiganur Openwell 417 1.80 780 3280 0.26 9 Kudthini Stand Pump 86.18 0.20 196 430 0.25 10 Somasamudra HP BW 273 1.8 1212 6030 0.16
In Sandur Taluk, similar trend was observed. Water sample collected from Bandri
was unfit for drinking purpose due to excess fluoride content as per BIS. Similarly, water
sample collected from Thoranagal is also unfit for drinking purpose due to excess Nitrate as
per BIS (Table 7.4).
Table 7.4: Quality of water in Sandur taluk -2004-05
Nitrate Fluoride Total
hardness Sl. No. Villages & Taluk
mg/l 1 Bandri hand pump 5 3.50 208 2 Toranagal Hand pump near OB well 101 1 216
Three out of six water samples analysed in sandur taluk during 2005-2006 were not potable
due to excess Nitrate content as per BIS. There was no fluoride contamination shown in all
the six samples analysed. Water sample in 50% of the sample sites are potable based on
physico-chemical parameter & on available data (Table 7.5).
Table 7.5: Quality of water in Sandur taluk -2005-06
Nitrate Fluoride Total hardness Total dissolved solids
Total Fe Sl.
No. Village Name mg/l
1 Torangal HP 76.6 1.20 188 770 0.21
2 Torangal Open well 113 0.20 404 740 0.24
3 Sandur HP 16 0.25 336 610 0.11 4 Somalapuram HP 159 0.20 504 910 0.19 5 Bandri 0.29 2.60 208 560 0.21 6 Tumti Tanola 31.15 0.60 288 570 1.00
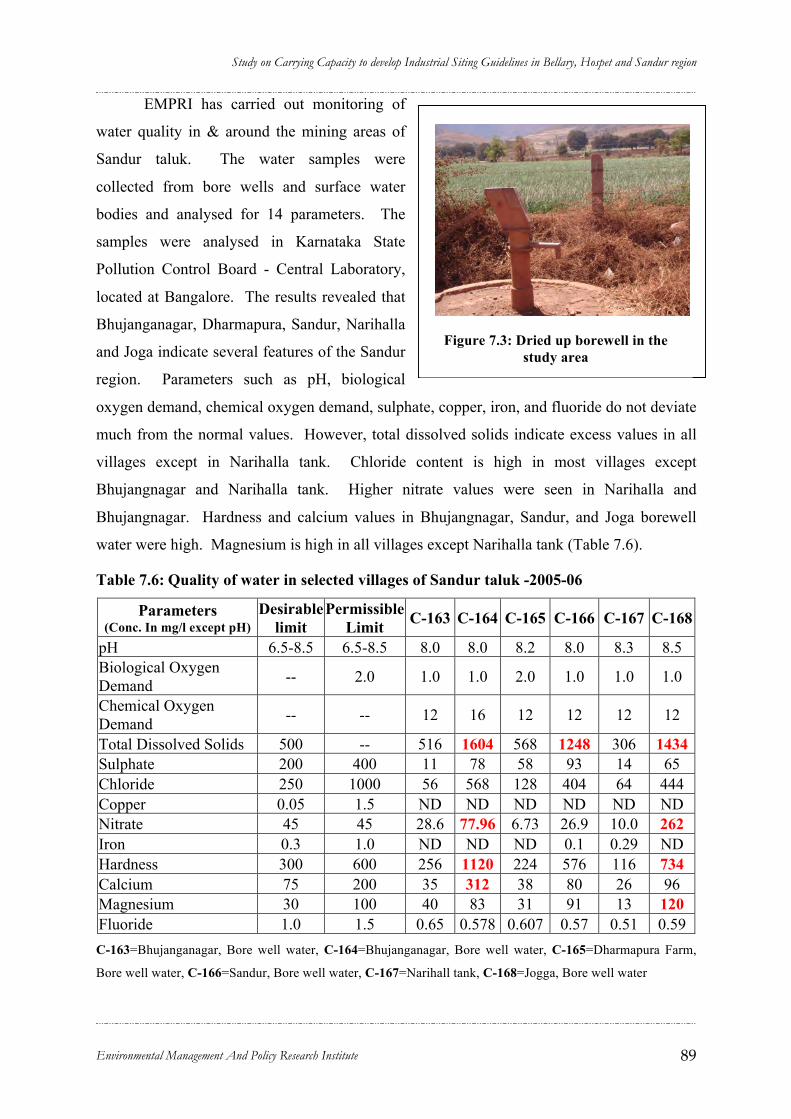
Study on Carrying Capacity to develop Industrial Siting Guidelines in Bellary, Hospet and Sandur region
Environmental Management And Policy Research Institute 89
Figure 7.3: Dried up borewell in the study area
EMPRI has carried out monitoring of
water quality in & around the mining areas of
Sandur taluk. The water samples were
collected from bore wells and surface water
bodies and analysed for 14 parameters. The
samples were analysed in Karnataka State
Pollution Control Board - Central Laboratory,
located at Bangalore. The results revealed that
Bhujanganagar, Dharmapura, Sandur, Narihalla
and Joga indicate several features of the Sandur
region. Parameters such as pH, biological
oxygen demand, chemical oxygen demand, sulphate, copper, iron, and fluoride do not deviate
much from the normal values. However, total dissolved solids indicate excess values in all
villages except in Narihalla tank. Chloride content is high in most villages except
Bhujangnagar and Narihalla tank. Higher nitrate values were seen in Narihalla and
Bhujangnagar. Hardness and calcium values in Bhujangnagar, Sandur, and Joga borewell
water were high. Magnesium is high in all villages except Narihalla tank (Table 7.6).
Table 7.6: Quality of water in selected villages of Sandur taluk -2005-06
Parameters (Conc. In mg/l except pH)
Desirable limit
Permissible Limit C-163 C-164 C-165 C-166 C-167 C-168
pH 6.5-8.5 6.5-8.5 8.0 8.0 8.2 8.0 8.3 8.5 Biological Oxygen Demand -- 2.0 1.0 1.0 2.0 1.0 1.0 1.0
Chemical Oxygen Demand -- -- 12 16 12 12 12 12
Total Dissolved Solids 500 -- 516 1604 568 1248 306 1434 Sulphate 200 400 11 78 58 93 14 65 Chloride 250 1000 56 568 128 404 64 444 Copper 0.05 1.5 ND ND ND ND ND ND Nitrate 45 45 28.6 77.96 6.73 26.9 10.0 262 Iron 0.3 1.0 ND ND ND 0.1 0.29 ND Hardness 300 600 256 1120 224 576 116 734 Calcium 75 200 35 312 38 80 26 96 Magnesium 30 100 40 83 31 91 13 120 Fluoride 1.0 1.5 0.65 0.578 0.607 0.57 0.51 0.59 C-163=Bhujanganagar, Bore well water, C-164=Bhujanganagar, Bore well water, C-165=Dharmapura Farm,
Bore well water, C-166=Sandur, Bore well water, C-167=Narihall tank, C-168=Jogga, Bore well water
Study on Carrying Capacity to develop Industrial Siting Guidelines in Bellary, Hospet and Sandur region
Environmental Management And Policy Research Institute 90
Finally, it is concluded that, drinking water in Bellary-Hospet-Sandur sector is not
complying with the BIS standards and found unsafe for potable purpose. It may be due to
disturbance in the soil and water regime coupled with anthropogenic activities and due to
hydro-geochemical characteristics. Further, it is observed in the study area that the
surroundings of most of the borewells were dirty as they were located near open drainages.
Improper sanitary conditions may also have added to contamination of water and non-
potability.

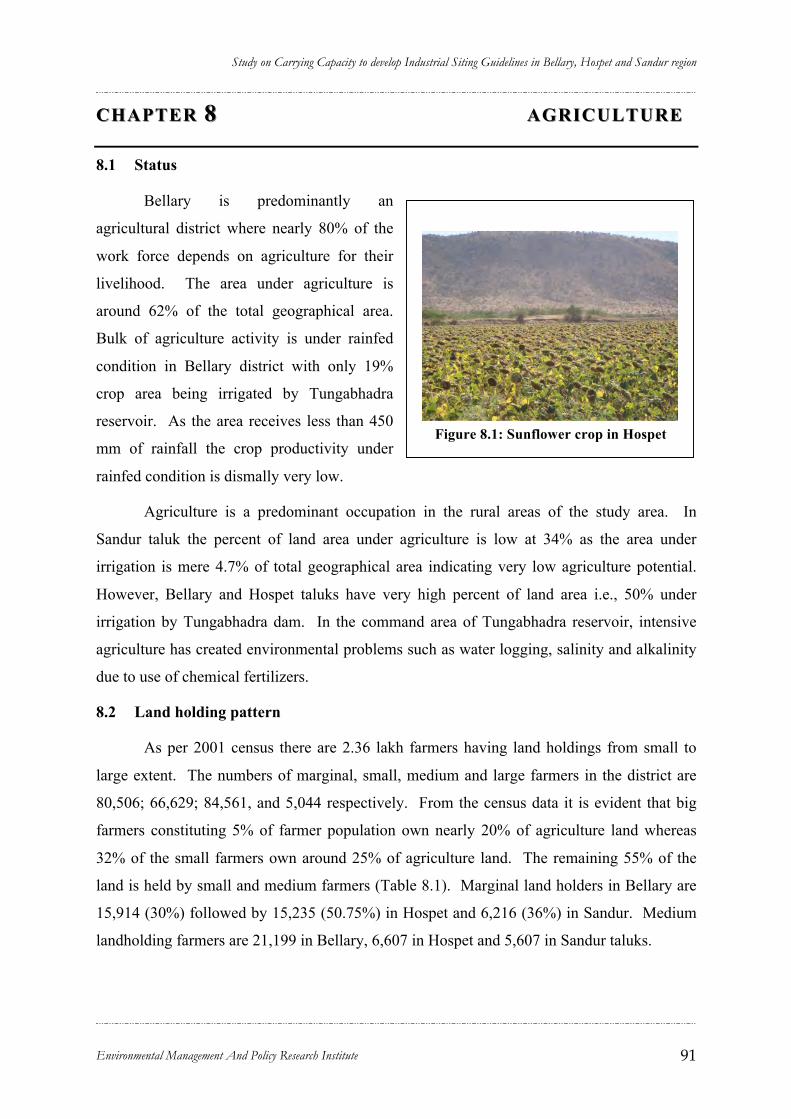
Study on Carrying Capacity to develop Industrial Siting Guidelines in Bellary, Hospet and Sandur region
Environmental Management And Policy Research Institute 91
Figure 8.1: Sunflower crop in Hospet
CHAPTER CHAPTER 88 AGRICULTUREAGRICULTURE
8.1 Status
Bellary is predominantly an
agricultural district where nearly 80% of the
work force depends on agriculture for their
livelihood. The area under agriculture is
around 62% of the total geographical area.
Bulk of agriculture activity is under rainfed
condition in Bellary district with only 19%
crop area being irrigated by Tungabhadra
reservoir. As the area receives less than 450
mm of rainfall the crop productivity under
rainfed condition is dismally very low.
Agriculture is a predominant occupation in the rural areas of the study area. In
Sandur taluk the percent of land area under agriculture is low at 34% as the area under
irrigation is mere 4.7% of total geographical area indicating very low agriculture potential.
However, Bellary and Hospet taluks have very high percent of land area i.e., 50% under
irrigation by Tungabhadra dam. In the command area of Tungabhadra reservoir, intensive
agriculture has created environmental problems such as water logging, salinity and alkalinity
due to use of chemical fertilizers.
8.2 Land holding pattern
As per 2001 census there are 2.36 lakh farmers having land holdings from small to
large extent. The numbers of marginal, small, medium and large farmers in the district are
80,506; 66,629; 84,561, and 5,044 respectively. From the census data it is evident that big
farmers constituting 5% of farmer population own nearly 20% of agriculture land whereas
32% of the small farmers own around 25% of agriculture land. The remaining 55% of the
land is held by small and medium farmers (Table 8.1). Marginal land holders in Bellary are
15,914 (30%) followed by 15,235 (50.75%) in Hospet and 6,216 (36%) in Sandur. Medium
landholding farmers are 21,199 in Bellary, 6,607 in Hospet and 5,607 in Sandur taluks.

Study on Carrying Capacity to develop Industrial Siting Guidelines in Bellary, Hospet and Sandur region
Environmental Management And Policy Research Institute 92
Table 8.1: Land holding pattern in Bellary district
Category Bellary Hospet Sandur District Families 15914 (30.15) 15235 (50.75) 6216 (36.03) 80506 (34.01) Marginal
(<1 ha) Area (ha) 9080 (6.4) 7699 (17.6) 3282 (9.34) 42213 (7.76) Families 13945 (26.45) 8057 (26.83) 5183 (30.04) 66629 (28.15) Small
(1-2 ha) Area (ha) 20788 (14.62) 11480 (26.22) 7531 (21.45) 97704 (17.98) Families 21199 (40.16) 6607 (22.08) 5607 (32.5) 84561 (35.7) Medium
(2-10 ha) Area (ha) 87142 (61.3) 22817 (52.1) 20738 (59.0) 331244 (60.9) Families 1720 (3.25) 121 (0.40) 248 (1.44) 5044 (2.13) Large
(>10 ha) Area (ha) 25162 (17.7) 1780 (4.07) 3577 (10.18) 72327 (13.3) Families 52778 30020 17254 236704 Total Area (ha) 142172 43776 35128 543488
Note: The figures in parenthesis represent %
The proportion of marginal farmers is large varying from 30% to 50% of the total
land holdings. The large farmers are less in Hospet (0.4%), followed by Sandur (1.44%) and
Bellary (3.25%). Marginal and small farmers in the district together form over 62% of the
farmers whereas they hold only 25.74% of the land under agriculture. On the other hand, the
large and medium farmers in the district constitute nearly 15% of the farming community
whereas they control nearly 47% of the land under agriculture indicating the land holding
distribution pattern in the district. The district has nearly 33,875 ha of uncultivated land
accounting for 4.16% of total geographical area. Further, the fallow land is 145,936 ha as
per 2003 - 04 records.
8.3 Crop area
The total gross area cultivated in the district is 4.75 lakh ha, as per the census data
provided in “District at a glance 2003-04” and the net sown area is 4.14 lakh ha. In the study
region the net area sown was 1.72 lakh ha, of which Bellary has 1 lakh ha, Hospet has 40,000
ha and Sandur has 32,000 ha. In the district, the total irrigated area is 156,466 ha while that
of rainfed area is 339,455 ha. Generally, two crops are grown under rainfed condition and
three crops are grown under irrigated condition.
8.4 Area under irrigation:
Irrigation from Tungabhadra Dam is available in only 4 taluks i.e., Bellary, Hospet,
Sandur and Siruguppa, of which Bellary takes a major share i.e., 60,550 ha. Hospet and
Siruguppa share 18,000 ha each (Table 8.2) and Sandur has an area of 2,213 ha of irrigation
under Tungabhadra command area. Sandur receives most of the irrigation from Narihalla
reservoir, about 800 ha. The reservoir in the district caters to nearly 19% of the total irrigated
Study on Carrying Capacity to develop Industrial Siting Guidelines in Bellary, Hospet and Sandur region
Environmental Management And Policy Research Institute 93
land of the district. Other sources of irrigation are bore well, open well, tank and other
sources (Table 8.2). The principal crops grown under irrigation are paddy, hybrid jowar and
sugarcane. Productivity of various crops under irrigated system indicates that the average
productivity is generally low as compared to state average except for paddy. Thus the
package of practices and management options adopted need to be improved under irrigated
condition.
Table 8.2: Irrigation of land by different sources (ha).
Taluk Canals Tanks Well Borewell Others Total Bellary 60550 2733 2435 2075 67793 Hospet 18008 900 1285 2035 3185 25408 Sandur 2213 2111 1704 4392 - 10420 District 98776 3011 9714 40087 19014 170602
Source: Bellary District at a glance 2003-04, Statistical office, Bellary
8.5 Rainfed agriculture
The area under rainfed agriculture is substantially higher than the area under irrigation
in Bellary district. Nearly 73.5% of the cereals grown are under rainfed condition. Similarly
89% of the oil seed crops are under rainfed condition. On the whole nearly 75% of the area
under crops is rainfed. Table 8.3 shows the cropwise area under rainfed or irrigation mode of
agriculture.
Table 8.3: Area under rain fed crops and irrigated crops in Bellary district - 2004-05.
Crop type Area under Rainfed crops
Area under irrigated crops
Total area cropped
Cereals 26,180 (73.5%) 8,822 (26.5%) 35,632 Pulses 3,135 (21.7%) 11,319 (88.3%) 14,454 Total food crop 44,085 (79.2%) 11,577 (28.8%) 55,662 Oilseeds 22,068 (89.6%) 2,527 (10.4%) 24,640 Commercial crops 38,129 (76.12%) 11,957 (23.88%) 50,086 Total crops 1,04,282 (79.98) 26,106 (10.02%) 1,30,388
Most cereals, pulses, oilseeds and commercial crops are still grown under rainfed
condition in Bellary district. As per the data obtained from the official website
(www.kar.nic.in/bellary) the productivity levels in the district are much higher under rainfed
condition as compared to state average (Table 8.4). Crops such as jowar, maize, bajra and
pulses grown under rainfed condition are showing higher average productivity in Bellary
district than the state average. Also, paddy grown under irrigated condition in Bellary district
shows higher average productivity than the state average. Data on productivity of crops under
irrigation in the study region is not available.

Study on Carrying Capacity to develop Industrial Siting Guidelines in Bellary, Hospet and Sandur region
Environmental Management And Policy Research Institute 94
Figure 8.2: Maize crop in Sandur
Table 8.4: Comparison of yield in Bellary district and Karnataka state (in
quintals/acre).
Sl. No. Crop State Average Bellary Average 1 Rice 24.39 27.77 2 Jowar 7.57 10.8 4 Maize 31.41 31.91 5 Bajra 6.44 7.25 8 Tur 4.53 6.3 9 Bengal gram 4.78 5 10 Horse gram 4.13 4.88 11 Black gram 4.13 4.3 12 Green gram 4.13 8.11 13 Cowpea 4.13 6 14 Field bean 4.13 5
Source: www.kar.nic.in/bellary Scarcity of water, limited irrigation facilities, higher proportion of marginal
landholding farmers indicates that farming is subsistence activity in nature and not a
commercial activity. Therefore, cash needs of the agricultural farmers are to be met through
other vocations other than agriculture. Apart from this agricultural laborers also constitute a
major force in the district deriving most of their income from agriculture labor.
8.6 Impact of agriculture on environment
Agriculture followed in the study area is an open system wherein fertility of soil is
reduced by producing crop plants while resources used in the system are marginal i.e., only
through chemical fertilizers. Application of farmyard manure and other organic manure is
almost non-existent. Such output of natural resources will deplete the fertility of soil in the
Study on Carrying Capacity to develop Industrial Siting Guidelines in Bellary, Hospet and Sandur region
Environmental Management And Policy Research Institute 95
forthcoming years and therefore there is need to build up the fertility of soil through soil and
water conservation measures. Some of the issues concerning the impact of current day
agriculture in Bellary on the environment are discussed here.
Crops such as sugarcane, paddy, cotton and tobacco require large quantity of
fertilizers and pesticides. Irrigation and application of fertilizers and pesticides leads to
transport of large quantity of fertilizer and pesticide residues to other areas contaminating
water bodies and river systems. The toxic traces of pesticides have detrimental effect on the
flora and fauna in the neighboring areas. In order to decrease such detrimental effects on the
soil the farmers and agriculture department must adopt organic method of cultivation.
Various methods of integrated pest management and soil and water management strategies
would enhance the productivity of crops apart from keeping the environment unpolluted.
As indicated earlier, most of the farmers follow rainfed agriculture system in Bellary
district. Unfortunately, the soil in the district is not very fertile and to enhance productivity
the farmers use large quantity of fertilizer. The intensity of cropping in the entire district is
1.14, while in the three taluks under study the intensity of cropping is 1.12. The productivity
of the district with respect to cereals and pulses is marginally higher than the state average
(Table 8.4). Therefore, it is critical that sustainability of agriculture needs to be focused.
Some of the causes and effects of unsustainable land use practices are discussed here.
• As discussed earlier, much of the area under agriculture is rainfed and in addition,
majority of farmers are marginal landholders. Therefore, the farmers are forced to
follow the subsistence farming. In addition to Hospet and Sandur taluks, the hilly
areas in the region and are highly vulnerable for soil erosion. Agriculture is practiced
on the steep slopes and excessive tillage on the unsuitable land is causing
environmental degradation in this region
• Due to uncertainty and inadequate rainfall, drought and famines are very common in
the district affecting agriculture development. However, in Bellary and Hospet taluks
due to irrigation the farmers are not facing the problem connected with the
productivity of crops.
• Fertility status of soil in the district is very low as indicated by low organic carbon
status. The soil capability map prepared for the study area using satellite imageries
has revealed the following facts.
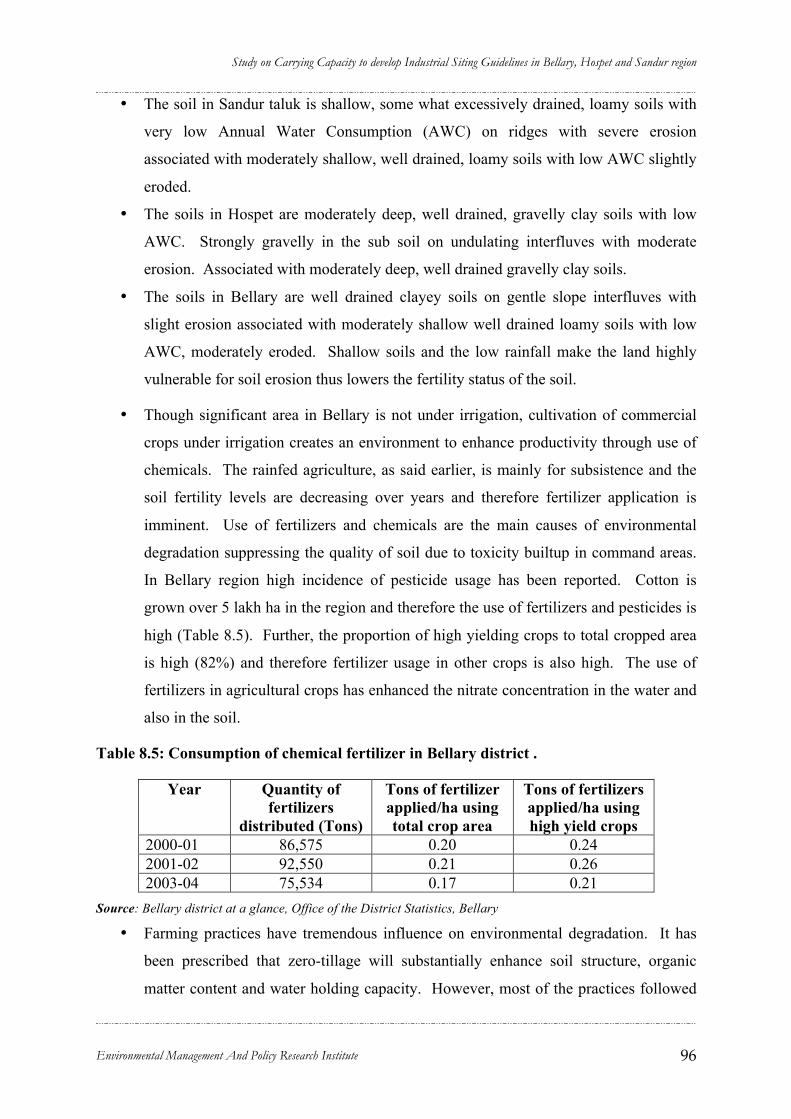
Study on Carrying Capacity to develop Industrial Siting Guidelines in Bellary, Hospet and Sandur region
Environmental Management And Policy Research Institute 96
• The soil in Sandur taluk is shallow, some what excessively drained, loamy soils with
very low Annual Water Consumption (AWC) on ridges with severe erosion
associated with moderately shallow, well drained, loamy soils with low AWC slightly
eroded.
• The soils in Hospet are moderately deep, well drained, gravelly clay soils with low
AWC. Strongly gravelly in the sub soil on undulating interfluves with moderate
erosion. Associated with moderately deep, well drained gravelly clay soils.
• The soils in Bellary are well drained clayey soils on gentle slope interfluves with
slight erosion associated with moderately shallow well drained loamy soils with low
AWC, moderately eroded. Shallow soils and the low rainfall make the land highly
vulnerable for soil erosion thus lowers the fertility status of the soil.
• Though significant area in Bellary is not under irrigation, cultivation of commercial
crops under irrigation creates an environment to enhance productivity through use of
chemicals. The rainfed agriculture, as said earlier, is mainly for subsistence and the
soil fertility levels are decreasing over years and therefore fertilizer application is
imminent. Use of fertilizers and chemicals are the main causes of environmental
degradation suppressing the quality of soil due to toxicity builtup in command areas.
In Bellary region high incidence of pesticide usage has been reported. Cotton is
grown over 5 lakh ha in the region and therefore the use of fertilizers and pesticides is
high (Table 8.5). Further, the proportion of high yielding crops to total cropped area
is high (82%) and therefore fertilizer usage in other crops is also high. The use of
fertilizers in agricultural crops has enhanced the nitrate concentration in the water and
also in the soil.
Table 8.5: Consumption of chemical fertilizer in Bellary district .
Year Quantity of fertilizers
distributed (Tons)
Tons of fertilizer applied/ha using total crop area
Tons of fertilizers applied/ha using high yield crops
2000-01 86,575 0.20 0.24 2001-02 92,550 0.21 0.26 2003-04 75,534 0.17 0.21
Source: Bellary district at a glance, Office of the District Statistics, Bellary
• Farming practices have tremendous influence on environmental degradation. It has
been prescribed that zero-tillage will substantially enhance soil structure, organic
matter content and water holding capacity. However, most of the practices followed
Study on Carrying Capacity to develop Industrial Siting Guidelines in Bellary, Hospet and Sandur region
Environmental Management And Policy Research Institute 97
here, particularly in command area and commercial crops such as cotton and paddy,
need cultural practices that destroy soil structure, enhance soil erosion subsequently
degrading the environment. Commercial crop cultivation demands use of pesticides
and fertilizers thereby reducing the quality of land over the years in the land where
such crops are grown. In recent times extent of area under commercial crops such as
cotton, groundnut and onion is on the rise. Groundnut and onion need opening of soil
while harvesting leading to enhancement of soil erosion potential as the fields are left
unattended after harvest. Sugarcane and cotton need pesticides and fertilizers and
therefore toxicity builds up in the soil due to use of chemicals.
• Low density of trees in the farmland is also responsible for land degradation. Trees
act as shelterbelts and reduce evaporation besides creating micro-climate favorable for
good soil structure and development. Absences of trees coupled with higher evapo-
transpiration causes breakdown of soil structure and reduce the organic content in the
soil. Bellary records lowest tree density.
• Crop rotation and mixture maintains the fertility of soil in addition to enhancing farm
income. However, as in most command areas, continuous mono-cropping has
contributed to the decline of fertility in Bellary region. Cultivation of paddy and
sugarcane throughout the year has rendered the soil less fertile. Organic carbon levels
have decreased to 0.3 or 0.4 % in agricultural lands in these areas due to lack of
application of organic manure and increased crop intensity. Further, enhancement of
crops under groundnut and onion has increased the potential to erode soils from the
agricultural lands as the crop involves opening of soils during harvest. Not adopting
mixed crop and crop rotation system with cereals and legumes in command areas
have increased the chance of increased fertilizer application and therefore resulted in
loss of soil fertility, particularly the organic matter. Cultivation of paddy
continuously in standing water in command areas has resulted in loss of soil structure.
• The density of livestock, especially of goats and sheep, is one of the major causes of
land degradation. By and large, livestock population has increased over the two
census periods. Interestingly, the goat and sheep population have increased and
buffalo and cattle population has decreased perhaps due to paucity of grazing lands
and unable to feed the livestock with their agricultural byproduct. Successive xeric
conditions have made the farmers to go for sheep and goats. Both sheep and goats are
hardy species that can live in xeric conditions (Table 8.6).
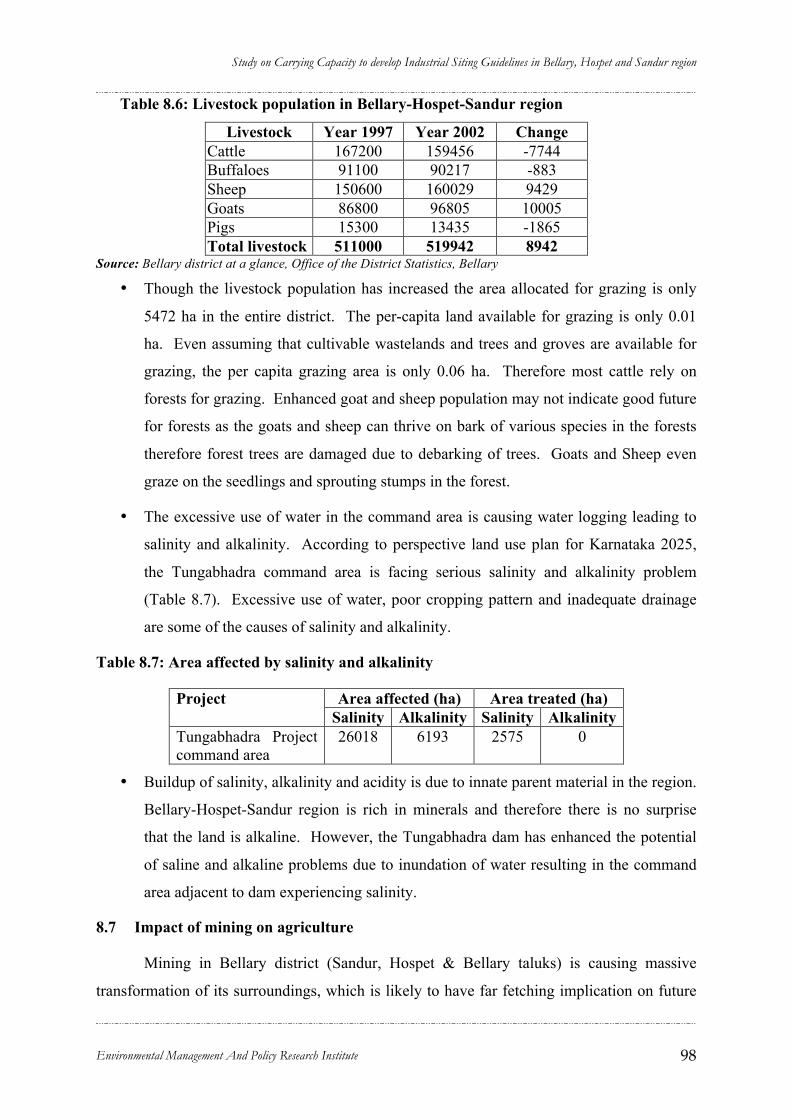
Study on Carrying Capacity to develop Industrial Siting Guidelines in Bellary, Hospet and Sandur region
Environmental Management And Policy Research Institute 98
Table 8.6: Livestock population in Bellary-Hospet-Sandur region
Livestock Year 1997 Year 2002 Change Cattle 167200 159456 -7744 Buffaloes 91100 90217 -883 Sheep 150600 160029 9429 Goats 86800 96805 10005 Pigs 15300 13435 -1865 Total livestock 511000 519942 8942
Source: Bellary district at a glance, Office of the District Statistics, Bellary
• Though the livestock population has increased the area allocated for grazing is only
5472 ha in the entire district. The per-capita land available for grazing is only 0.01
ha. Even assuming that cultivable wastelands and trees and groves are available for
grazing, the per capita grazing area is only 0.06 ha. Therefore most cattle rely on
forests for grazing. Enhanced goat and sheep population may not indicate good future
for forests as the goats and sheep can thrive on bark of various species in the forests
therefore forest trees are damaged due to debarking of trees. Goats and Sheep even
graze on the seedlings and sprouting stumps in the forest.
• The excessive use of water in the command area is causing water logging leading to
salinity and alkalinity. According to perspective land use plan for Karnataka 2025,
the Tungabhadra command area is facing serious salinity and alkalinity problem
(Table 8.7). Excessive use of water, poor cropping pattern and inadequate drainage
are some of the causes of salinity and alkalinity.
Table 8.7: Area affected by salinity and alkalinity
Area affected (ha) Area treated (ha) Project Salinity Alkalinity Salinity Alkalinity
Tungabhadra Project command area
26018 6193 2575 0
• Buildup of salinity, alkalinity and acidity is due to innate parent material in the region.
Bellary-Hospet-Sandur region is rich in minerals and therefore there is no surprise
that the land is alkaline. However, the Tungabhadra dam has enhanced the potential
of saline and alkaline problems due to inundation of water resulting in the command
area adjacent to dam experiencing salinity.
8.7 Impact of mining on agriculture
Mining in Bellary district (Sandur, Hospet & Bellary taluks) is causing massive
transformation of its surroundings, which is likely to have far fetching implication on future
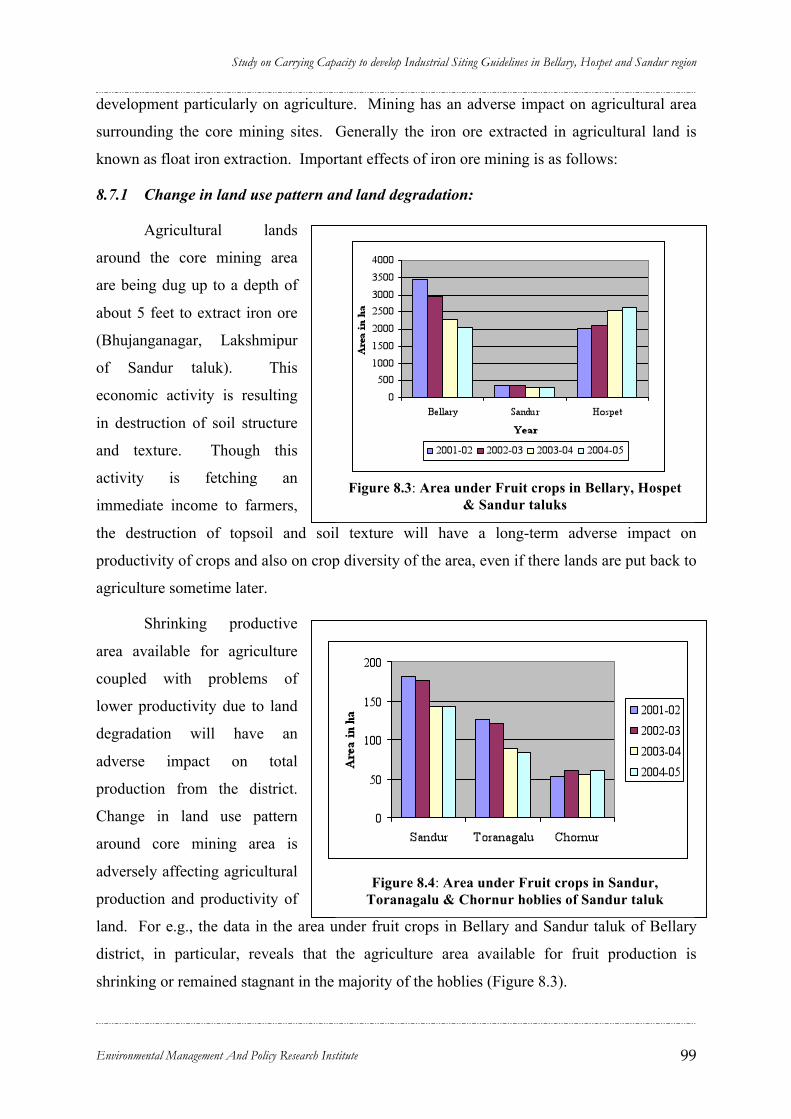
Study on Carrying Capacity to develop Industrial Siting Guidelines in Bellary, Hospet and Sandur region
Environmental Management And Policy Research Institute 99
Figure 8.4: Area under Fruit crops in Sandur, Toranagalu & Chornur hoblies of Sandur taluk
Figure 8.3: Area under Fruit crops in Bellary, Hospet & Sandur taluks
development particularly on agriculture. Mining has an adverse impact on agricultural area
surrounding the core mining sites. Generally the iron ore extracted in agricultural land is
known as float iron extraction. Important effects of iron ore mining is as follows:
8.7.1 Change in land use pattern and land degradation:
Agricultural lands
around the core mining area
are being dug up to a depth of
about 5 feet to extract iron ore
(Bhujanganagar, Lakshmipur
of Sandur taluk). This
economic activity is resulting
in destruction of soil structure
and texture. Though this
activity is fetching an
immediate income to farmers,
the destruction of topsoil and soil texture will have a long-term adverse impact on
productivity of crops and also on crop diversity of the area, even if there lands are put back to
agriculture sometime later.
Shrinking productive
area available for agriculture
coupled with problems of
lower productivity due to land
degradation will have an
adverse impact on total
production from the district.
Change in land use pattern
around core mining area is
adversely affecting agricultural
production and productivity of
land. For e.g., the data in the area under fruit crops in Bellary and Sandur taluk of Bellary
district, in particular, reveals that the agriculture area available for fruit production is
shrinking or remained stagnant in the majority of the hoblies (Figure 8.3).
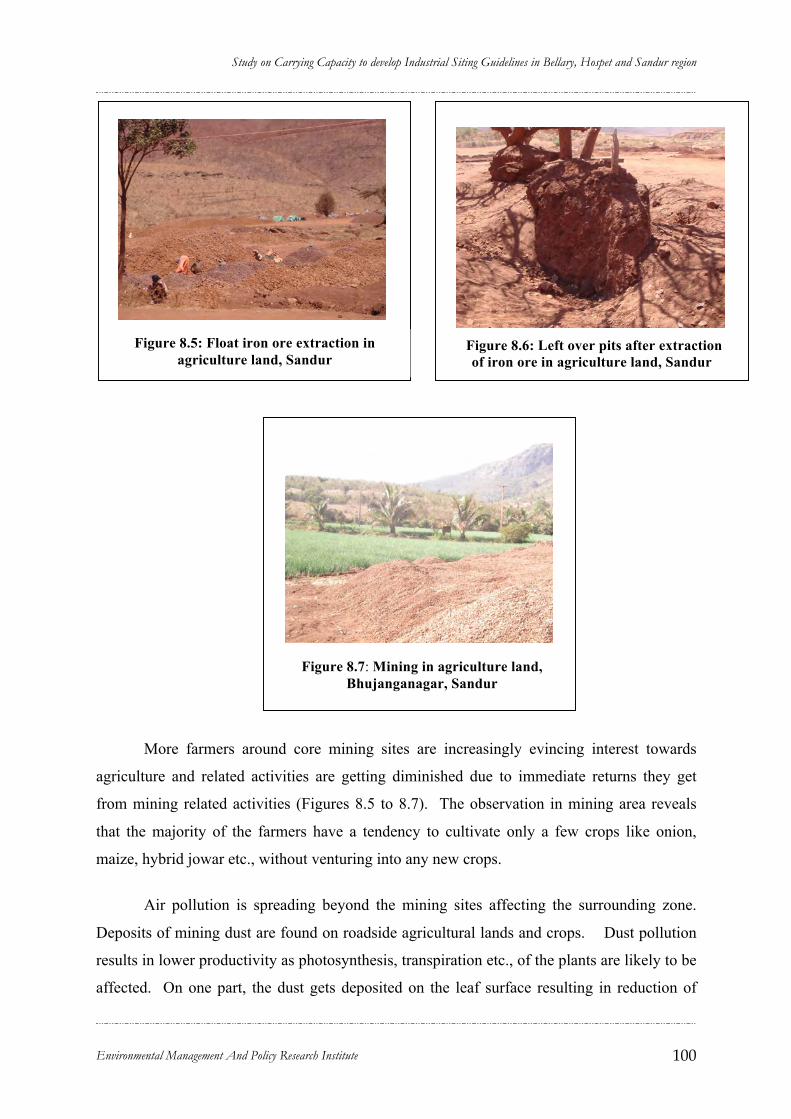
Study on Carrying Capacity to develop Industrial Siting Guidelines in Bellary, Hospet and Sandur region
Environmental Management And Policy Research Institute 100
Figure 8.5: Float iron ore extraction in agriculture land, Sandur
Figure 8.6: Left over pits after extraction of iron ore in agriculture land, Sandur
Figure 8.7: Mining in agriculture land, Bhujanganagar, Sandur
More farmers around core mining sites are increasingly evincing interest towards
agriculture and related activities are getting diminished due to immediate returns they get
from mining related activities (Figures 8.5 to 8.7). The observation in mining area reveals
that the majority of the farmers have a tendency to cultivate only a few crops like onion,
maize, hybrid jowar etc., without venturing into any new crops.
Air pollution is spreading beyond the mining sites affecting the surrounding zone.
Deposits of mining dust are found on roadside agricultural lands and crops. Dust pollution
results in lower productivity as photosynthesis, transpiration etc., of the plants are likely to be
affected. On one part, the dust gets deposited on the leaf surface resulting in reduction of
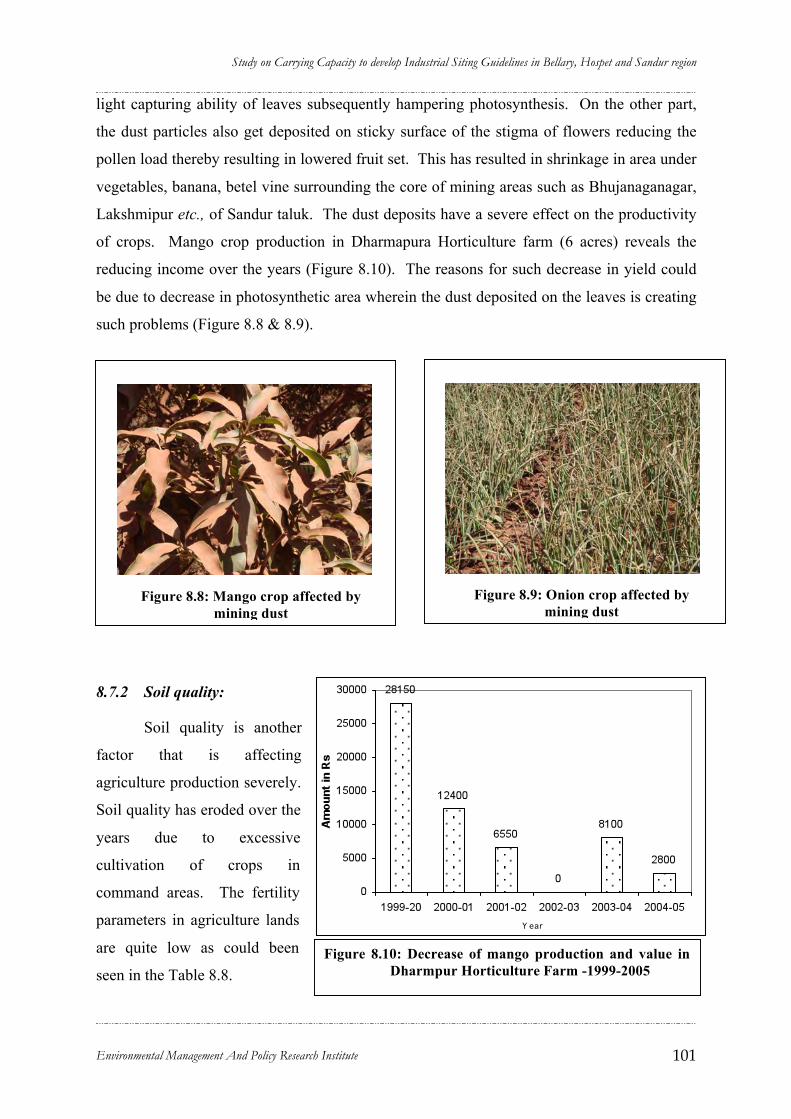
Study on Carrying Capacity to develop Industrial Siting Guidelines in Bellary, Hospet and Sandur region
Environmental Management And Policy Research Institute 101
Figure 8.10: Decrease of mango production and value in Dharmpur Horticulture Farm -1999-2005
Figure 8.8: Mango crop affected by mining dust
Figure 8.9: Onion crop affected by mining dust
light capturing ability of leaves subsequently hampering photosynthesis. On the other part,
the dust particles also get deposited on sticky surface of the stigma of flowers reducing the
pollen load thereby resulting in lowered fruit set. This has resulted in shrinkage in area under
vegetables, banana, betel vine surrounding the core of mining areas such as Bhujanaganagar,
Lakshmipur etc., of Sandur taluk. The dust deposits have a severe effect on the productivity
of crops. Mango crop production in Dharmapura Horticulture farm (6 acres) reveals the
reducing income over the years (Figure 8.10). The reasons for such decrease in yield could
be due to decrease in photosynthetic area wherein the dust deposited on the leaves is creating
such problems (Figure 8.8 & 8.9).
8.7.2 Soil quality:
Soil quality is another
factor that is affecting
agriculture production severely.
Soil quality has eroded over the
years due to excessive
cultivation of crops in
command areas. The fertility
parameters in agriculture lands
are quite low as could been
seen in the Table 8.8.
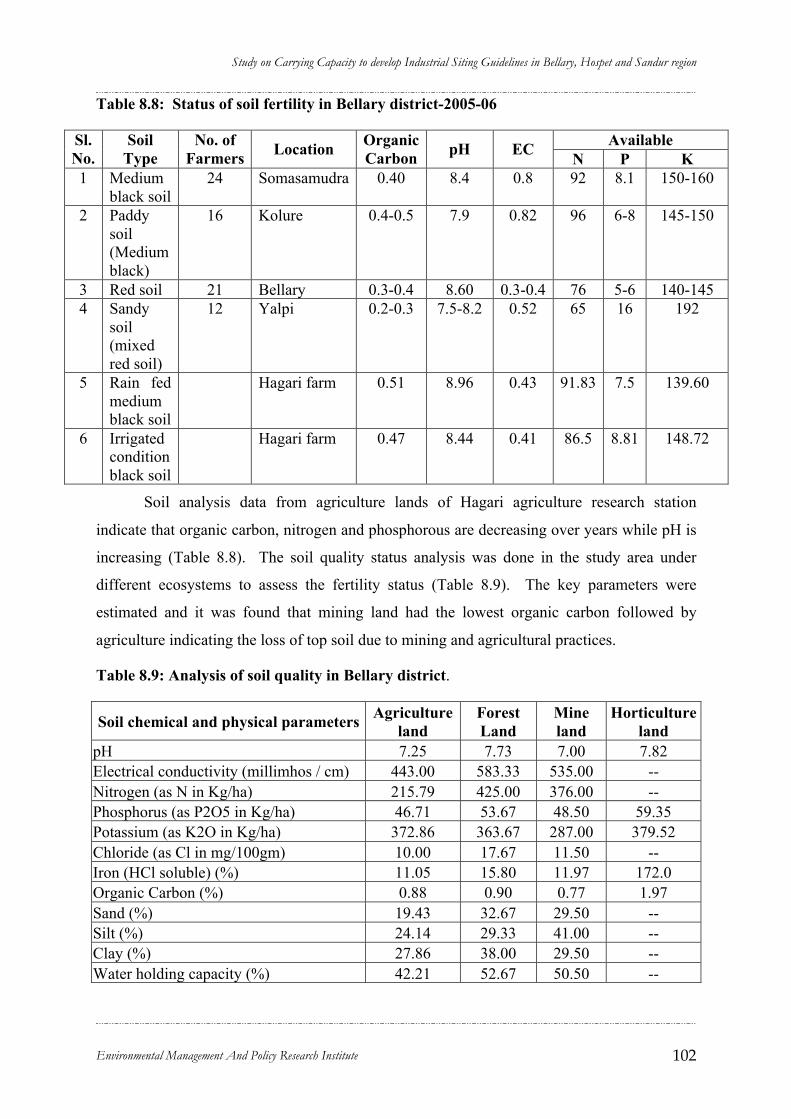
Study on Carrying Capacity to develop Industrial Siting Guidelines in Bellary, Hospet and Sandur region
Environmental Management And Policy Research Institute 102
Table 8.8: Status of soil fertility in Bellary district-2005-06
Available Sl. No.
Soil Type
No. of Farmers Location Organic
Carbon pH EC N P K 1 Medium
black soil 24 Somasamudra 0.40 8.4 0.8 92 8.1 150-160
2 Paddy soil (Medium black)
16 Kolure 0.4-0.5 7.9 0.82 96 6-8 145-150
3 Red soil 21 Bellary 0.3-0.4 8.60 0.3-0.4 76 5-6 140-145 4 Sandy
soil (mixed red soil)
12 Yalpi 0.2-0.3 7.5-8.2 0.52 65 16 192
5 Rain fed medium black soil
Hagari farm 0.51 8.96 0.43 91.83 7.5 139.60
6 Irrigated condition black soil
Hagari farm 0.47 8.44 0.41 86.5 8.81 148.72
Soil analysis data from agriculture lands of Hagari agriculture research station
indicate that organic carbon, nitrogen and phosphorous are decreasing over years while pH is
increasing (Table 8.8). The soil quality status analysis was done in the study area under
different ecosystems to assess the fertility status (Table 8.9). The key parameters were
estimated and it was found that mining land had the lowest organic carbon followed by
agriculture indicating the loss of top soil due to mining and agricultural practices.
Table 8.9: Analysis of soil quality in Bellary district.
Soil chemical and physical parameters Agriculture land
Forest Land
Mine land
Horticulture land
pH 7.25 7.73 7.00 7.82 Electrical conductivity (millimhos / cm) 443.00 583.33 535.00 -- Nitrogen (as N in Kg/ha) 215.79 425.00 376.00 -- Phosphorus (as P2O5 in Kg/ha) 46.71 53.67 48.50 59.35 Potassium (as K2O in Kg/ha) 372.86 363.67 287.00 379.52 Chloride (as Cl in mg/100gm) 10.00 17.67 11.50 -- Iron (HCl soluble) (%) 11.05 15.80 11.97 172.0 Organic Carbon (%) 0.88 0.90 0.77 1.97 Sand (%) 19.43 32.67 29.50 -- Silt (%) 24.14 29.33 41.00 -- Clay (%) 27.86 38.00 29.50 -- Water holding capacity (%) 42.21 52.67 50.50 --
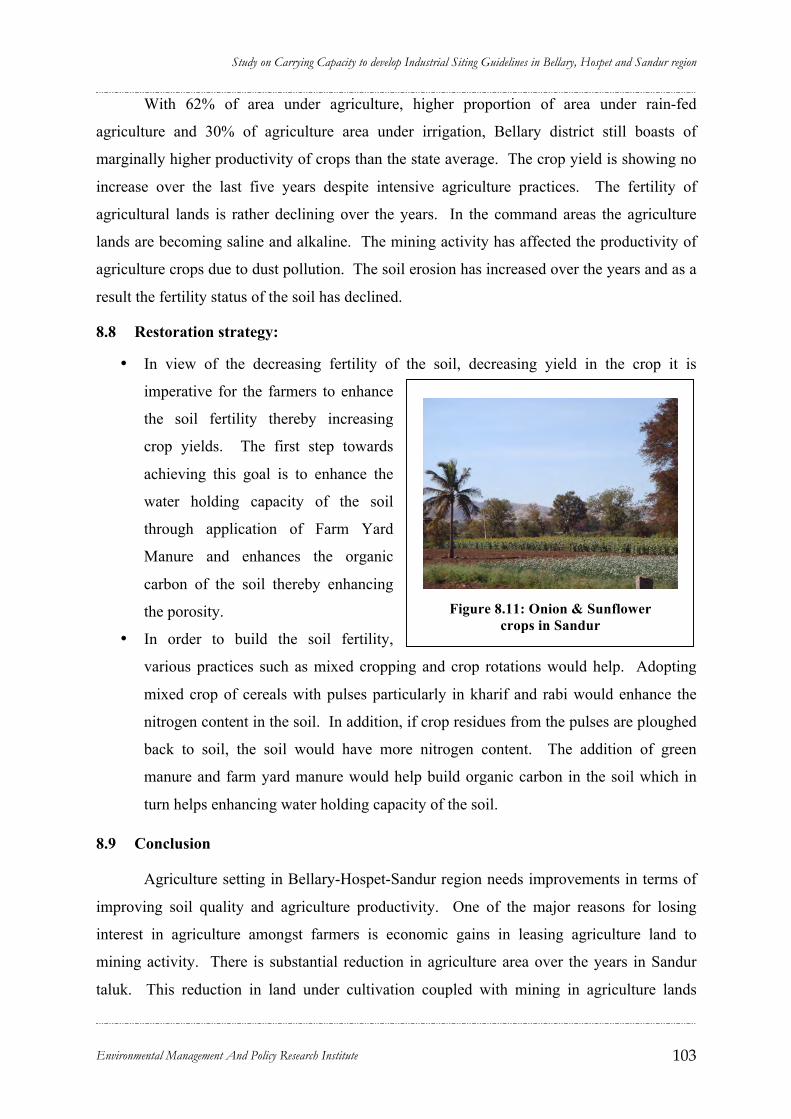
Study on Carrying Capacity to develop Industrial Siting Guidelines in Bellary, Hospet and Sandur region
Environmental Management And Policy Research Institute 103
Figure 8.11: Onion & Sunflower crops in Sandur
With 62% of area under agriculture, higher proportion of area under rain-fed
agriculture and 30% of agriculture area under irrigation, Bellary district still boasts of
marginally higher productivity of crops than the state average. The crop yield is showing no
increase over the last five years despite intensive agriculture practices. The fertility of
agricultural lands is rather declining over the years. In the command areas the agriculture
lands are becoming saline and alkaline. The mining activity has affected the productivity of
agriculture crops due to dust pollution. The soil erosion has increased over the years and as a
result the fertility status of the soil has declined.
8.8 Restoration strategy:
• In view of the decreasing fertility of the soil, decreasing yield in the crop it is
imperative for the farmers to enhance
the soil fertility thereby increasing
crop yields. The first step towards
achieving this goal is to enhance the
water holding capacity of the soil
through application of Farm Yard
Manure and enhances the organic
carbon of the soil thereby enhancing
the porosity.
• In order to build the soil fertility,
various practices such as mixed cropping and crop rotations would help. Adopting
mixed crop of cereals with pulses particularly in kharif and rabi would enhance the
nitrogen content in the soil. In addition, if crop residues from the pulses are ploughed
back to soil, the soil would have more nitrogen content. The addition of green
manure and farm yard manure would help build organic carbon in the soil which in
turn helps enhancing water holding capacity of the soil.
8.9 Conclusion
Agriculture setting in Bellary-Hospet-Sandur region needs improvements in terms of
improving soil quality and agriculture productivity. One of the major reasons for losing
interest in agriculture amongst farmers is economic gains in leasing agriculture land to
mining activity. There is substantial reduction in agriculture area over the years in Sandur
taluk. This reduction in land under cultivation coupled with mining in agriculture lands

Study on Carrying Capacity to develop Industrial Siting Guidelines in Bellary, Hospet and Sandur region
Environmental Management And Policy Research Institute 104
seriously affects agriculture in the near future. Land reclamation after mining activities needs
to be considered seriously. Dust pollution should be mitigated as it affects the productivity
and yield in orchards and commercial crops. The green and farmyard manure must be
applied instead of chemical fertilizers for sustainable agriculture. The usage of pesticides has
to be replaced by adopting biological methods of pest control as it is eco-friendly in nature.

Study on Carrying Capacity to develop Industrial Siting Guidelines in Bellary, Hospet and Sandur region
Environmental Management And Policy Research Institute 105
CHAPTER CHAPTER 99 FORESTFOREST
9.1 Background
Bellary forest division is located in the eastern region of Karnataka and forms a part
of the southern portion of Deccan peninsula. It is situated between longitudinal parallels of
14030′ and 15050′ east of Greenwich and latitudes parallel 75040′ and 77011′ north of equator.
Geographically, the landscape of the study region which is part of Bellary forest division, is
varied and composed of two distinct regions viz., Eastern and Western regions separated by
Sandur Hills which cuts across Bellary district from northwest to southeast.
The eastern region is having Bellary and Hospet taluks. This region is flat and devoid
of trees with sporadic rocks emerging here and there. This is the characteristic feature of
Deccan plateau. The western region is broken up except in Hadagali taluk by succession of
wild and rugged hills with picturesque valleys. Both the natural regions slope gradually
northwards and drain into Tungabhadra River. The Sandur hills begin at Mallapuram on the
Bank of Tungabhadra river which runs southeast ward for nearly 40 kms with only one break;
the two gorges at Narihalla and are characterized by picturesque gorges and steep hills with
lush green vegetation broken up frequently by numerous mines.
The forests are classified as notified forests and unclassed forests. Reserve forests
declared under the provisions of Section 16, Madras Forest Act 1882 or under section 17 of
Karnataka Forest Act, 1963 and Forest Blocks notified under section-4 of the Madras Forest
Act, 1882 or under Section 4 of the Karnataka Forest Act 1963 are categorized as notified
forests. The remaining forest blocks that are not legally notified at present under any
prevailing law are categorized as unclassed forests. There are no ‘Village forests’ in the
study area. The percentage of forest to the total geographical area is roughly around 11.5%
which is very low as compared to the state average and national average (Table 9.1). The
extent of forest area in different classes and the current status is given in the following table.
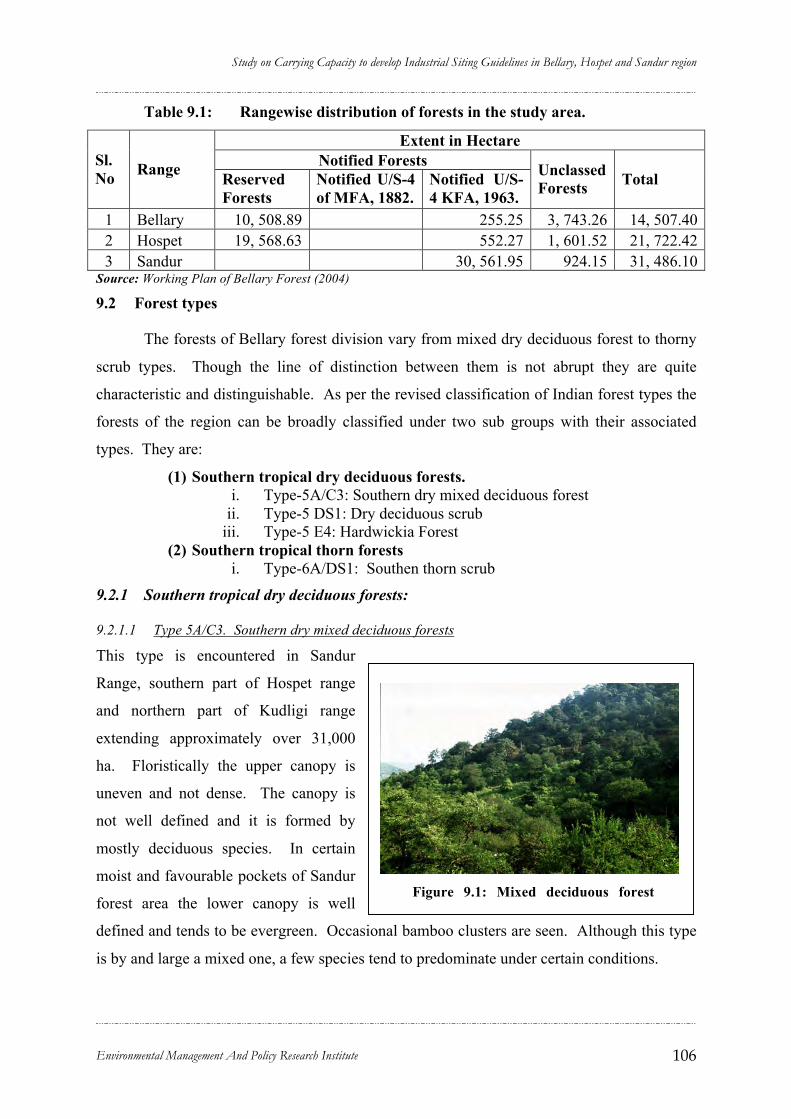
Study on Carrying Capacity to develop Industrial Siting Guidelines in Bellary, Hospet and Sandur region
Environmental Management And Policy Research Institute 106
Figure 9.1: Mixed deciduous forest ,Sandur
Table 9.1: Rangewise distribution of forests in the study area.
Extent in Hectare Notified Forests Sl.
No Range Reserved Forests
Notified U/S-4 of MFA, 1882.
Notified U/S-4 KFA, 1963.
Unclassed Forests Total
1 Bellary 10, 508.89 255.25 3, 743.26 14, 507.40 2 Hospet 19, 568.63 552.27 1, 601.52 21, 722.42 3 Sandur 30, 561.95 924.15 31, 486.10
Source: Working Plan of Bellary Forest (2004)
9.2 Forest types
The forests of Bellary forest division vary from mixed dry deciduous forest to thorny
scrub types. Though the line of distinction between them is not abrupt they are quite
characteristic and distinguishable. As per the revised classification of Indian forest types the
forests of the region can be broadly classified under two sub groups with their associated
types. They are:
(1) Southern tropical dry deciduous forests. i. Type-5A/C3: Southern dry mixed deciduous forest
ii. Type-5 DS1: Dry deciduous scrub iii. Type-5 E4: Hardwickia Forest
(2) Southern tropical thorn forests i. Type-6A/DS1: Southen thorn scrub
9.2.1 Southern tropical dry deciduous forests:
9.2.1.1 Type 5A/C3. Southern dry mixed deciduous forests
This type is encountered in Sandur
Range, southern part of Hospet range
and northern part of Kudligi range
extending approximately over 31,000
ha. Floristically the upper canopy is
uneven and not dense. The canopy is
not well defined and it is formed by
mostly deciduous species. In certain
moist and favourable pockets of Sandur
forest area the lower canopy is well
defined and tends to be evergreen. Occasional bamboo clusters are seen. Although this type
is by and large a mixed one, a few species tend to predominate under certain conditions.

Study on Carrying Capacity to develop Industrial Siting Guidelines in Bellary, Hospet and Sandur region
Environmental Management And Policy Research Institute 107
Areas that get burnt annually contain almost pure patches of Anogeissus latifolia. In
dry slopes and shallow soils Boswellia serrata occurs in association with Chloroxylon
swietenia. The under growth is shrubby dominated by Doddonea viscosa and Lantana
camera. Thorny shrubs increase in proportion as a result of heavy grazing and forest fire.
As per the working plan report (2004) of the Karnataka Forest Department the
following floristic compositions have been reported.
Anogeissus latifolia, Albizzia lebbeck, Boswellia serrata, Chloroxylon swietenia, Dalbergia paniculata, Feronia elephantum, Hardwickia binata, Erythroxylon monogynum, Azadirachta indica 9.2.1.2 Type-5/DS1: dry deciduous Scrub:
These types are found in the eastern part of Bellary, Hadagali, Hospet and Kudligi
ranges extending to approximately over 43,000 hectares. According to Working Plan report
(2004) of Bellary division the forests are in highly degraded condition. The degradation is
mainly due to felling, grazing and forest fire. Due to removal of the useful species over a
prolonged period of time the tree growth has virtually disappeared and it is not allowed to
grow beyond the height of a shrub and as a result the forests have become an open layer of
shrubby growth with odd trees scattered here and there. However, such forests could be
improved into dry deciduous forests if properly protected. On the contrary, if further
ravaged, it get degraded into thorny type and ultimately dry grass prevails and naked boulders
are exposed.
As per the working plan report (2004) of Bellary Forest Division the following
floristic compositions have been reported.
Albizia amara, Acacia luecophloea, Butea monosperma, Bauhinia racemosa, Carrisa carandus, Dalbergia paniculata, Diospyros spp, Emblica officinalis, Erythroxylon monogynum, Feronia elephantum, Santalum album 9.2.1.3 Type-5E4: Hardwickia forest.
This is a distinct edaphic type of the dry deciduous forest characterized by the
gregarious occurrence of Hardwickia binata [Kamara, Anjan] owing to which the
classification comes into prominence. This tendency is particularly noticed in dry forests
wherein a particular species, in the instant case, Hardwickia binata, adapts itself to the
prevailing environmental conditions forming pure forest. This species occurs gregariously
and often in complete occupation of the ground. This type is encountered in certain forests of

Study on Carrying Capacity to develop Industrial Siting Guidelines in Bellary, Hospet and Sandur region
Environmental Management And Policy Research Institute 108
Hospet and Kudligi Ranges extending approximately to over 1500 hectares. The growing
stock is of recent origin though aged and gnarled trees are found scattered. Hardwickia
binata has relatively not many associates, both floristically and numerically. However, the
occurence of fire hardy species like Chloroxylon swietenia and Anogeissus latifolia is
indicative of the typically habitual ground fire occurring in these forests. Fire-hardiness
coupled with heavy periodical seeding enables this species to grow gregariously. The factors
that sustain the growth of such species do not encourage the growth of other species barring
the chief associates named above. This is the main reason which accounts for the existence
of the forest type.
9.2.2 Southern thorn scrub:
9.2.2.1 Type-6A/DS1: Southern thorn scrub:
This type is the most widely spread forest type occurring throughout the Bellary
division approximately over 60,043.69 hectares. In its most degraded form the thorn forests
of the division are totally devoid of tree growth with an open layer of scrub and thorny
bushes. Goat browsing is a common feature. Much of the soil is barren but there is usually a
thin cover of grass. Such areas cover a large portion of the forests of Bellary division where
total barrenness of several huge rocky hills of irretrievable stage can be noticed.
As per the working plan report (2004) of Bellary Forest Division the following
floristic compositions have been reported.
Albizzia amara, Acacia sundra, Cassia fistula, Carissa carandus, Cassia auriculata, Doddonea viscosa, Euphorbia spp, Randia dumetorum, Zizyphus spp.
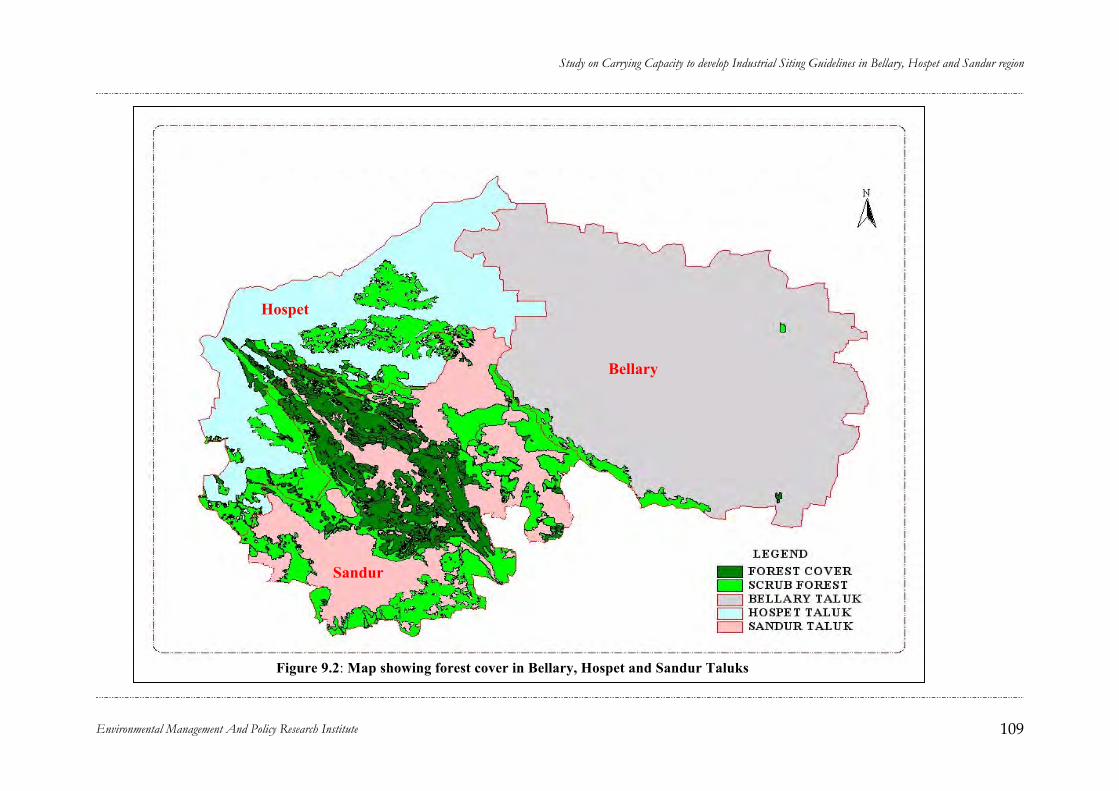
Study on Carrying Capacity to develop Industrial Siting Guidelines in Bellary, Hospet and Sandur region
Environmental Management And Policy Research Institute 109
Figure 9.2: Map showing forest cover in Bellary, Hospet and Sandur Taluks
Bellary
Sandur
Hospet
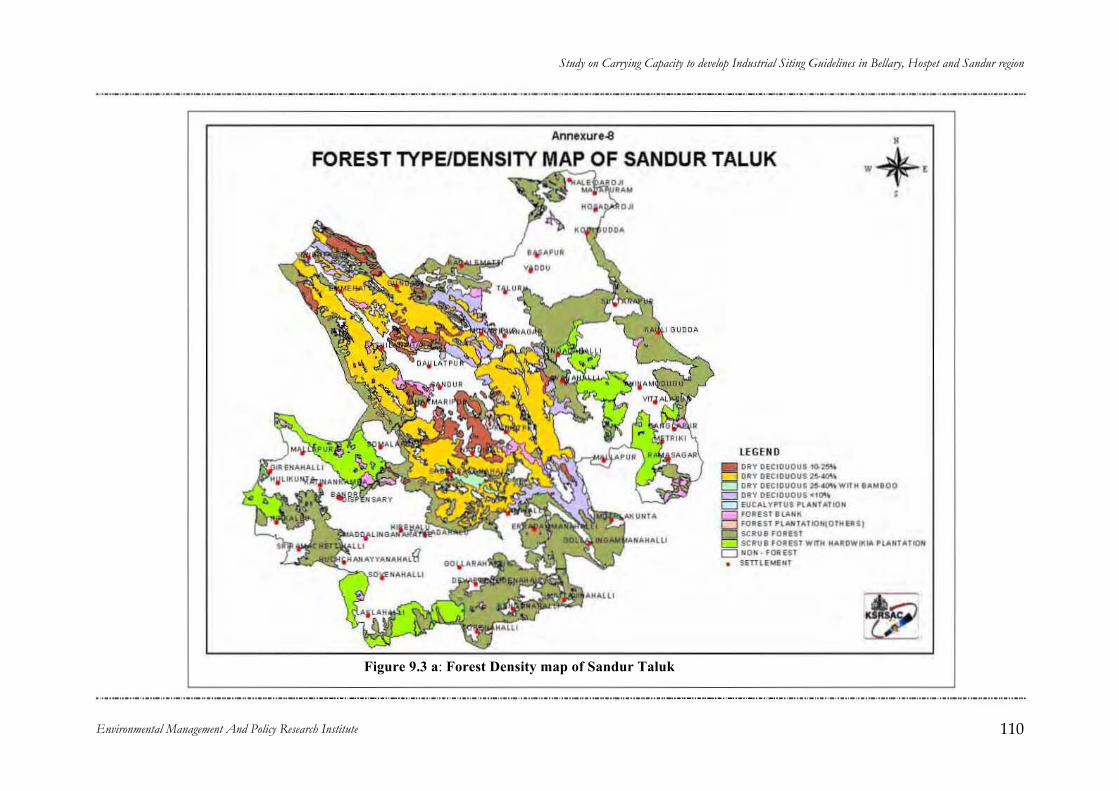
Study on Carrying Capacity to develop Industrial Siting Guidelines in Bellary, Hospet and Sandur region
Environmental Management And Policy Research Institute 110
Figure 9.3 a: Forest Density map of Sandur Taluk
Annexure.a , FOREST TYPE/DENSITY OF SANDUR TALUK .• '
lEGEND
~ DRV DECIDUOUI IQ.~ DRV DiClDUOUS ~OO% DRV DECIDUOII I :zo.OO%WITH ..... 00
D DRv DECIDUOUS .,0'It0 D EIICAL VI'TUI ~LA N IATIO N
~fOR(STBLANK
'OREIT ~L ""1A'IO N{O'HU' ) SC RuB fOUII SCRUB ' ORnl WITH HARDWIIUA ~I..& N U'ION
OMON. fORnl • SHHE"EN '
Annexure..e , FOREST TYPE/DENSITY M OF SANDUR TALUK .• ' ,
LE GEND
~ lillY GUIOIIOIII !II-~ (>~Y '11;""OIl'~_ CIIY 01(10"0111 _WIlIlI.o.WIOO
c:::J OilY Ofe.,,,o,,, "(P'Oo
c:J EIIC.o.lY"" ....... IITATIOII
~fO.EST .l.t. •• fOUt. "'''.''''TOO",OTIIUII SCIIIII'OIlIl I se.". 'OUST WIfIlIl".OW"Ul HAlifATOOII
c:J Mall · 'OIInl • n"li~lIl
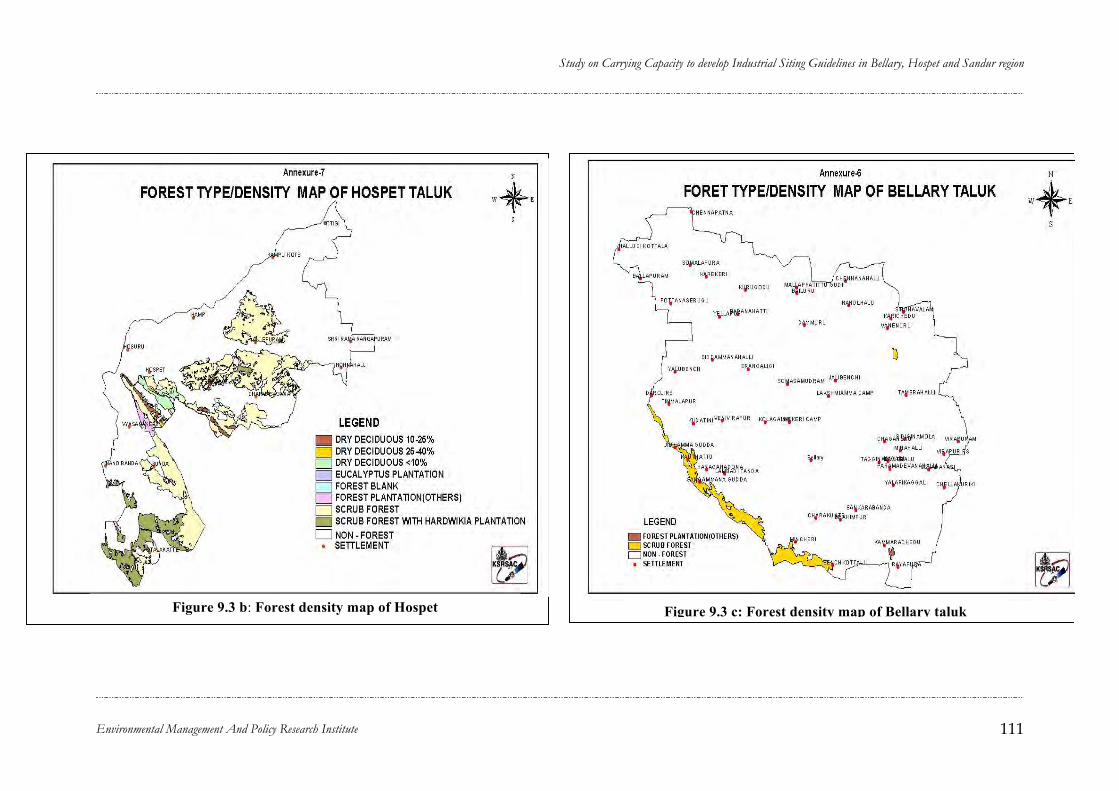
Study on Carrying Capacity to develop Industrial Siting Guidelines in Bellary, Hospet and Sandur region
Environmental Management And Policy Research Institute 111
Figure 9.3 b: Forest density map of Hospet
Figure 9.3 c: Forest density map of Bellary taluk

Study on Carrying Capacity to develop Industrial Siting Guidelines in Bellary, Hospet and Sandur region
Environmental Management And Policy Research Institute 112
Figure 9.4: Mixed Forest in Sandur
9.3 Bio-diversity profile
9.3.1 Flora
The Bellary forest division with
varied edaphic conditions harbours
diverse genepools and a variety of
biomass. From the inventory of the
flora it is evident that there are 27
families, 44 genera and 58 species
expressing a ratio of 1:1.6:2.14.
Fabaceae is the most widely represented
family with nine genera and seventeen
species. However, some very valuable
species like Santalum album and Salvadora persica are found originally in the mining sites of
Swamimalai forests. In the vegetation analysis, it has been found that some species are very
lowly represented which are in the threatened category due to low frequency in the region
though they are occurring in abundance in other parts of the region.
A survey carried out by the Forest Department for their Working Plan 2004 has
revealed that Anogeissus latifolia and Hardwickia binata are the major species in terms of
value and distribution. The sandy belt of Moka RF in Bellary harbours one of the utility
species Salvodora parsica (Meswak) known for its medicinal value. Hemidesmus indica a
prostrate wiry shrub occurs in open forests. Extract of the root of Hemidesmus indica is
commonly used as desi drink supposed to be a very good coolant. The common trees are
Anogeissus latifolia, Azadiracta indica, bamboo, etc.,.occurring as understorey in the dry
deciduous forests of Sandur. The common shrubs are Adathoda vasica, Calotropis procera,
Lantana camera. The species having less than 0.5 % of the total species in their distribution
are as follows. Emblica officinalis, Adina cordifolia, Diospyros Montana, Pterocarpus
marsupium, Ficus bengalensis, Madhuca indica, Terminalia ballirica, Albizzia lebbeck,
Terminalia chebula, Bridelia retusa, Feronia elephantum, Elaeodendron glaucum.
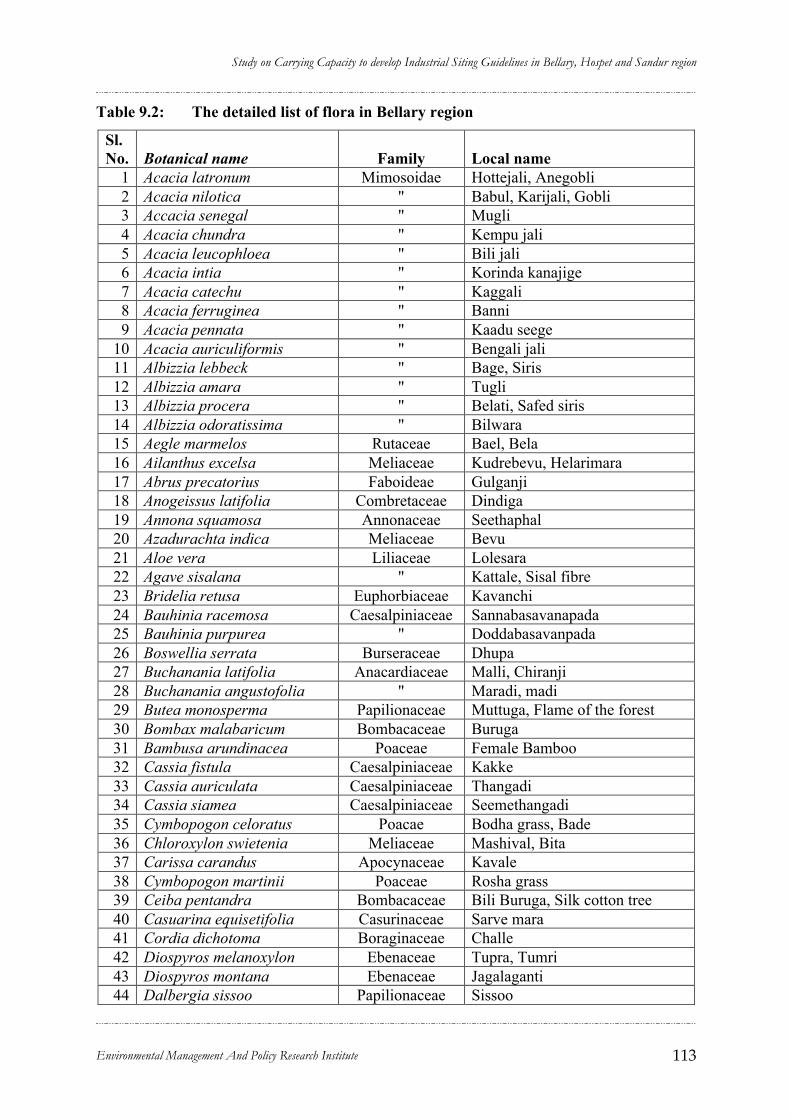
Study on Carrying Capacity to develop Industrial Siting Guidelines in Bellary, Hospet and Sandur region
Environmental Management And Policy Research Institute 113
Table 9.2: The detailed list of flora in Bellary region
Sl. No. Botanical name Family Local name
1 Acacia latronum Mimosoidae Hottejali, Anegobli 2 Acacia nilotica " Babul, Karijali, Gobli 3 Accacia senegal " Mugli 4 Acacia chundra " Kempu jali 5 Acacia leucophloea " Bili jali 6 Acacia intia " Korinda kanajige 7 Acacia catechu " Kaggali 8 Acacia ferruginea " Banni 9 Acacia pennata " Kaadu seege
10 Acacia auriculiformis " Bengali jali 11 Albizzia lebbeck " Bage, Siris 12 Albizzia amara " Tugli 13 Albizzia procera " Belati, Safed siris 14 Albizzia odoratissima " Bilwara 15 Aegle marmelos Rutaceae Bael, Bela 16 Ailanthus excelsa Meliaceae Kudrebevu, Helarimara 17 Abrus precatorius Faboideae Gulganji 18 Anogeissus latifolia Combretaceae Dindiga 19 Annona squamosa Annonaceae Seethaphal 20 Azadurachta indica Meliaceae Bevu 21 Aloe vera Liliaceae Lolesara 22 Agave sisalana " Kattale, Sisal fibre 23 Bridelia retusa Euphorbiaceae Kavanchi 24 Bauhinia racemosa Caesalpiniaceae Sannabasavanapada 25 Bauhinia purpurea " Doddabasavanpada 26 Boswellia serrata Burseraceae Dhupa 27 Buchanania latifolia Anacardiaceae Malli, Chiranji 28 Buchanania angustofolia " Maradi, madi 29 Butea monosperma Papilionaceae Muttuga, Flame of the forest 30 Bombax malabaricum Bombacaceae Buruga 31 Bambusa arundinacea Poaceae Female Bamboo 32 Cassia fistula Caesalpiniaceae Kakke 33 Cassia auriculata Caesalpiniaceae Thangadi 34 Cassia siamea Caesalpiniaceae Seemethangadi 35 Cymbopogon celoratus Poacae Bodha grass, Bade 36 Chloroxylon swietenia Meliaceae Mashival, Bita 37 Carissa carandus Apocynaceae Kavale 38 Cymbopogon martinii Poaceae Rosha grass 39 Ceiba pentandra Bombacaceae Bili Buruga, Silk cotton tree 40 Casuarina equisetifolia Casurinaceae Sarve mara 41 Cordia dichotoma Boraginaceae Challe 42 Diospyros melanoxylon Ebenaceae Tupra, Tumri 43 Diospyros montana Ebenaceae Jagalaganti 44 Dalbergia sissoo Papilionaceae Sissoo
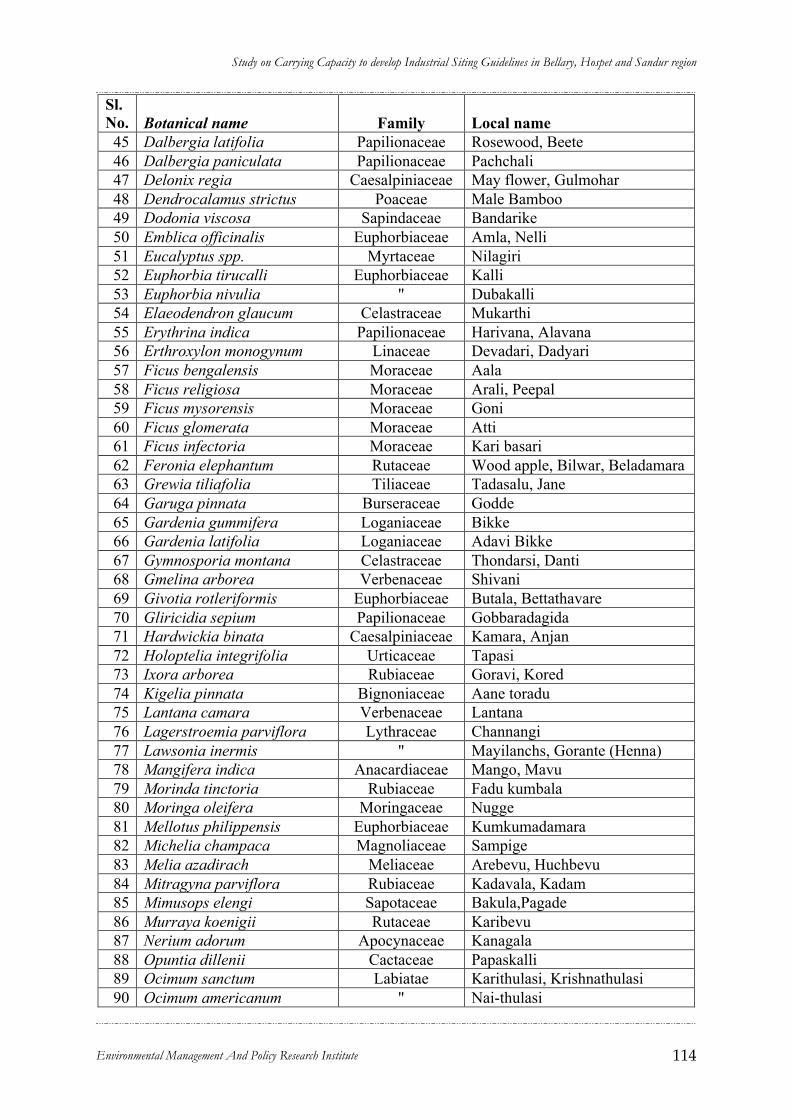
Study on Carrying Capacity to develop Industrial Siting Guidelines in Bellary, Hospet and Sandur region
Environmental Management And Policy Research Institute 114
Sl. No. Botanical name Family Local name 45 Dalbergia latifolia Papilionaceae Rosewood, Beete 46 Dalbergia paniculata Papilionaceae Pachchali 47 Delonix regia Caesalpiniaceae May flower, Gulmohar 48 Dendrocalamus strictus Poaceae Male Bamboo 49 Dodonia viscosa Sapindaceae Bandarike 50 Emblica officinalis Euphorbiaceae Amla, Nelli 51 Eucalyptus spp. Myrtaceae Nilagiri 52 Euphorbia tirucalli Euphorbiaceae Kalli 53 Euphorbia nivulia " Dubakalli 54 Elaeodendron glaucum Celastraceae Mukarthi 55 Erythrina indica Papilionaceae Harivana, Alavana 56 Erthroxylon monogynum Linaceae Devadari, Dadyari 57 Ficus bengalensis Moraceae Aala 58 Ficus religiosa Moraceae Arali, Peepal 59 Ficus mysorensis Moraceae Goni 60 Ficus glomerata Moraceae Atti 61 Ficus infectoria Moraceae Kari basari 62 Feronia elephantum Rutaceae Wood apple, Bilwar, Beladamara 63 Grewia tiliafolia Tiliaceae Tadasalu, Jane 64 Garuga pinnata Burseraceae Godde 65 Gardenia gummifera Loganiaceae Bikke 66 Gardenia latifolia Loganiaceae Adavi Bikke 67 Gymnosporia montana Celastraceae Thondarsi, Danti 68 Gmelina arborea Verbenaceae Shivani 69 Givotia rotleriformis Euphorbiaceae Butala, Bettathavare 70 Gliricidia sepium Papilionaceae Gobbaradagida 71 Hardwickia binata Caesalpiniaceae Kamara, Anjan 72 Holoptelia integrifolia Urticaceae Tapasi 73 Ixora arborea Rubiaceae Goravi, Kored 74 Kigelia pinnata Bignoniaceae Aane toradu 75 Lantana camara Verbenaceae Lantana 76 Lagerstroemia parviflora Lythraceae Channangi 77 Lawsonia inermis " Mayilanchs, Gorante (Henna) 78 Mangifera indica Anacardiaceae Mango, Mavu 79 Morinda tinctoria Rubiaceae Fadu kumbala 80 Moringa oleifera Moringaceae Nugge 81 Mellotus philippensis Euphorbiaceae Kumkumadamara 82 Michelia champaca Magnoliaceae Sampige 83 Melia azadirach Meliaceae Arebevu, Huchbevu 84 Mitragyna parviflora Rubiaceae Kadavala, Kadam 85 Mimusops elengi Sapotaceae Bakula,Pagade 86 Murraya koenigii Rutaceae Karibevu 87 Nerium adorum Apocynaceae Kanagala 88 Opuntia dillenii Cactaceae Papaskalli 89 Ocimum sanctum Labiatae Karithulasi, Krishnathulasi 90 Ocimum americanum " Nai-thulasi

Study on Carrying Capacity to develop Industrial Siting Guidelines in Bellary, Hospet and Sandur region
Environmental Management And Policy Research Institute 115
Sl. No. Botanical name Family Local name 91 Pongamia pinnata Papilionaceae Honge, Kanige 92 Pterocarpus marsupium " Honne 93 Phoenix sylvestris Palmae Ichalu 94 Premna tomentosa Verbenaceae Narane 95 Prosopis juliflora Mimosoidae Bellary jali 96 Parthenium histerophorus Asteraceae Congress grass, parthenium 97 Peltophorum ferrugineum Caesalpiniaceae Peltoform
98 Polyalthia longifolia Annonaceae Kambada mara, False Ashoka tree
99 Randia dumetorum Rubiaceae Mangare 100 Randia uliginosa Rubiaceae Kare 101 Samania saman Mimosoidae Rain tree 102 Santalum album Santalaceae Shrigandha, Sandalwood 103 Semecarpus anacardium Anacardiaceae Geru, Marking nut 104 Soymida febrifuga " Some 105 Shorea talura Dipterocarpaceae Jalari 106 Syzygium cuminii Myrtaceae Nerale 107 Stereospermum chelonoides Bignoniaceae Uded 108 Sterculia urens Sterculiaceae Kembutale 109 Tamarindus indica Caesalpiniaceae Tamarind, Hunse 110 Tectona grandis Verbenaceae Teak, Tega, Sagawani 111 Terminalia tomentosa Combretaceae Karimatti 112 Terminalia chebula " Alale, Harda 113 Terminalia arjuna " Arjun, Holematti, Billamathi 114 Terminalia belirica " Tare 115 Tetrameles nudiflora Dasticaceae Kadbende 116 Typha angustata Typhaceae Aapu, Anechondu 117 Vitex negundo Verbenaceae Lakki 118 Wrightia tinctoria Apocynaceae Hale, Halgouri 119 Zizyphus xylopyrus Rhamnaceae Gotte 120 Zizyphus jujuba " Bore
9.3.1.1 Bio-diversity of Medicinal Plant Conservation Area
Sandur forests are a potential source of medicinal plants. Many eternal springs locally
termed ‘Theerthas’ originate in the region. The important ones are Agastya theertha, Gaja
theertha, Koti theertha, Brahma theertha and Hari Shankara theertha. Invaluable medicinal
plants are found in the wild around these springs and the mineral springs are accredited with
manifold healing virtues. The Karnataka Forest Department has established a Medicinal
Plant Conservation Area (MPCA) in 1998 at Sandur with the help of Foundation for
Revitalisation of Local Health Traditions (FRLHT) and it is being managed with the help of
local people. The MPCA extends over 345 hectares in Swamimalai Block and is situated at
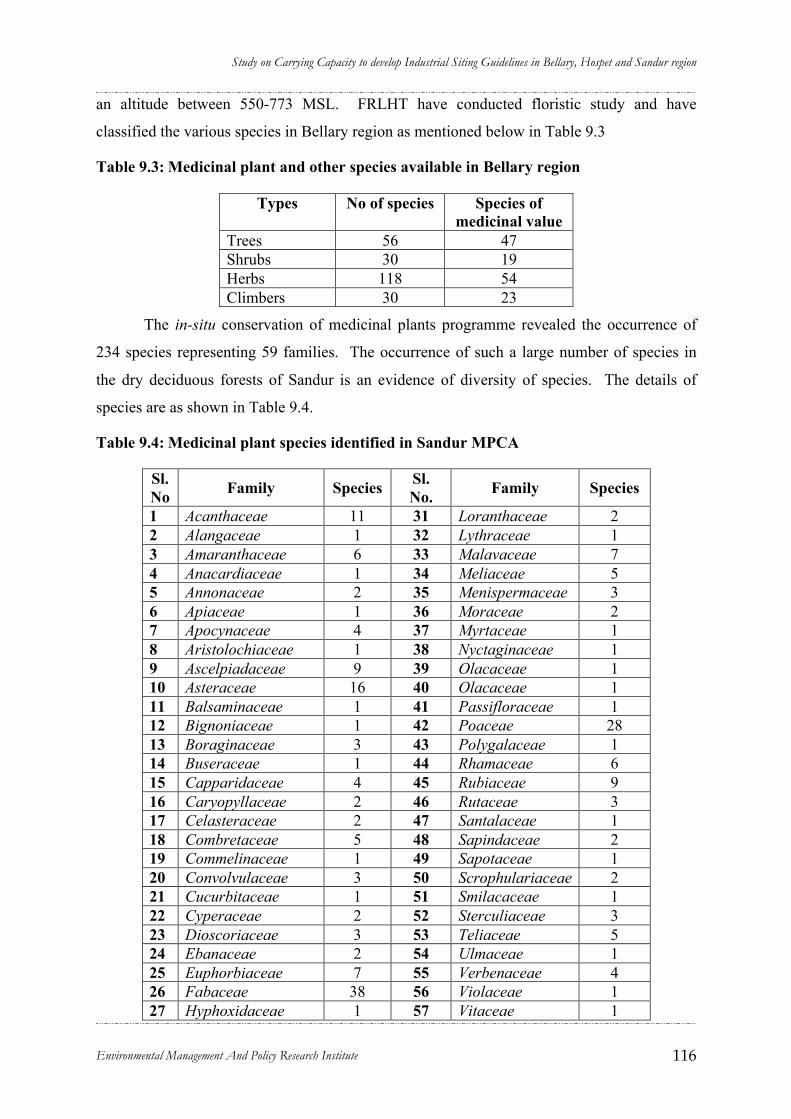
Study on Carrying Capacity to develop Industrial Siting Guidelines in Bellary, Hospet and Sandur region
Environmental Management And Policy Research Institute 116
an altitude between 550-773 MSL. FRLHT have conducted floristic study and have
classified the various species in Bellary region as mentioned below in Table 9.3
Table 9.3: Medicinal plant and other species available in Bellary region
Types No of species Species of medicinal value
Trees 56 47 Shrubs 30 19 Herbs 118 54 Climbers 30 23
The in-situ conservation of medicinal plants programme revealed the occurrence of
234 species representing 59 families. The occurrence of such a large number of species in
the dry deciduous forests of Sandur is an evidence of diversity of species. The details of
species are as shown in Table 9.4.
Table 9.4: Medicinal plant species identified in Sandur MPCA
Sl. No Family Species Sl.
No. Family Species
1 Acanthaceae 11 31 Loranthaceae 2 2 Alangaceae 1 32 Lythraceae 1 3 Amaranthaceae 6 33 Malavaceae 7 4 Anacardiaceae 1 34 Meliaceae 5 5 Annonaceae 2 35 Menispermaceae 3 6 Apiaceae 1 36 Moraceae 2 7 Apocynaceae 4 37 Myrtaceae 1 8 Aristolochiaceae 1 38 Nyctaginaceae 1 9 Ascelpiadaceae 9 39 Olacaceae 1 10 Asteraceae 16 40 Olacaceae 1 11 Balsaminaceae 1 41 Passifloraceae 1 12 Bignoniaceae 1 42 Poaceae 28 13 Boraginaceae 3 43 Polygalaceae 1 14 Buseraceae 1 44 Rhamaceae 6 15 Capparidaceae 4 45 Rubiaceae 9 16 Caryopyllaceae 2 46 Rutaceae 3 17 Celasteraceae 2 47 Santalaceae 1 18 Combretaceae 5 48 Sapindaceae 2 19 Commelinaceae 1 49 Sapotaceae 1 20 Convolvulaceae 3 50 Scrophulariaceae 2 21 Cucurbitaceae 1 51 Smilacaceae 1 22 Cyperaceae 2 52 Sterculiaceae 3 23 Dioscoriaceae 3 53 Teliaceae 5 24 Ebanaceae 2 54 Ulmaceae 1 25 Euphorbiaceae 7 55 Verbenaceae 4 26 Fabaceae 38 56 Violaceae 1 27 Hyphoxidaceae 1 57 Vitaceae 1

Study on Carrying Capacity to develop Industrial Siting Guidelines in Bellary, Hospet and Sandur region
Environmental Management And Policy Research Institute 117
Sl. No Family Species Sl.
No. Family Species
28 Lamiaceae 6 58 Zygophyllaceae 1 29 Liliaceae 2 59 Adiantaceae 1 30 Loganiaceae 2 Total 234
The rare, endangered and threatened species in Sandur were also recorded by FRLHT.
Table 9.5: Rare Endangered and Threatened Species recorded in Sandur MPCA
Sl. No. Botanical name
Threat Status
Sl. No. Botanical name
Threat Status
1 Acorus calamus
VU 37 Lamrachaenium microcephalum EN
2 Adenia hondola VU 38 Madhuca diplostemon EN 3 Adhatoda beddemei CR 39 Madhuca insignis EX 4 Aegle marmelos VU 40 Mappia foetida VU 5 Aerva wightii EX 41 Michelia champaca VU
6 Amorphophallus paeonifolius VU 42
Moringa concanensis VU
7 Ampelicissus arnaneosa VU 43 Myristica malabarica EN 8 Ampelocissus arnottiana EN 44 Nervlia aragoana EN 9 Andrographis paniculata LR-LC 45 Niligiranthus ciliatus EN
10 Aristolachia bracteata LR 46 Ochernauclea missionis VU 11 Aristolochia tagala VU 47 Operculina turpethum LR-NT 12 Artemesia nilagirica LR 48 Oroxylum indicum VU 13 Asparagus rottleri EX 49 Paphiopedilium druryi CR 14 Balanites aegyptica LR 50 Phoenix pusilla LR-LC 15 Buchanania lanzan LR-LC 51 Piper barberi. CR-LR 16 Cayratia pedata CR 52 Piper longum NT 17 Commiphora mukul VU 53 Piper mullesua VU 18 Cosicinium fenestratum CR 54 Piper nigrum VU 19 Cycas circinalis CR 55 Plectranthus vettiveriodes EW 20 Cyclea fissicalyx EN 56 Psedarthira viscida LR-NT 21 Drosera indica LR-NT 57 Pterocarpus santalinus EN 22 Drosera peltata VU 58 Pueraria tuberose LR-NT 23 Elaegnus confera LR 59 Rawolfia serpentina EN 24 Embelia ribes LR-NT 60 Saraca asoka EN 25 Garcinia indica VU 61 Schrebera sweiteniodes VU 26 Garcinia Morella VU 62 Symplocos cochinchinensis LR-NT 27 Gardenia gummifera LR-NT 63 Symplocos racemosa VU 28 Gloriosa superba LR-NT 64 Syzygium travancoricum CR 29 Glycosmis macrocarpa LR-NT 65 Tinospora sinensis VU 30 Hedy chium coronarium LR-NT 66 Tragia bicolor VU 31 Heliotropium Keralense EN 67 Trychopus zeylanicus CR 32 Holostemma annulare VU 68 Utleria slicifolia CR 33 Hydnocarpus macrocarpa VU 69 Vateria macrocarpa CR
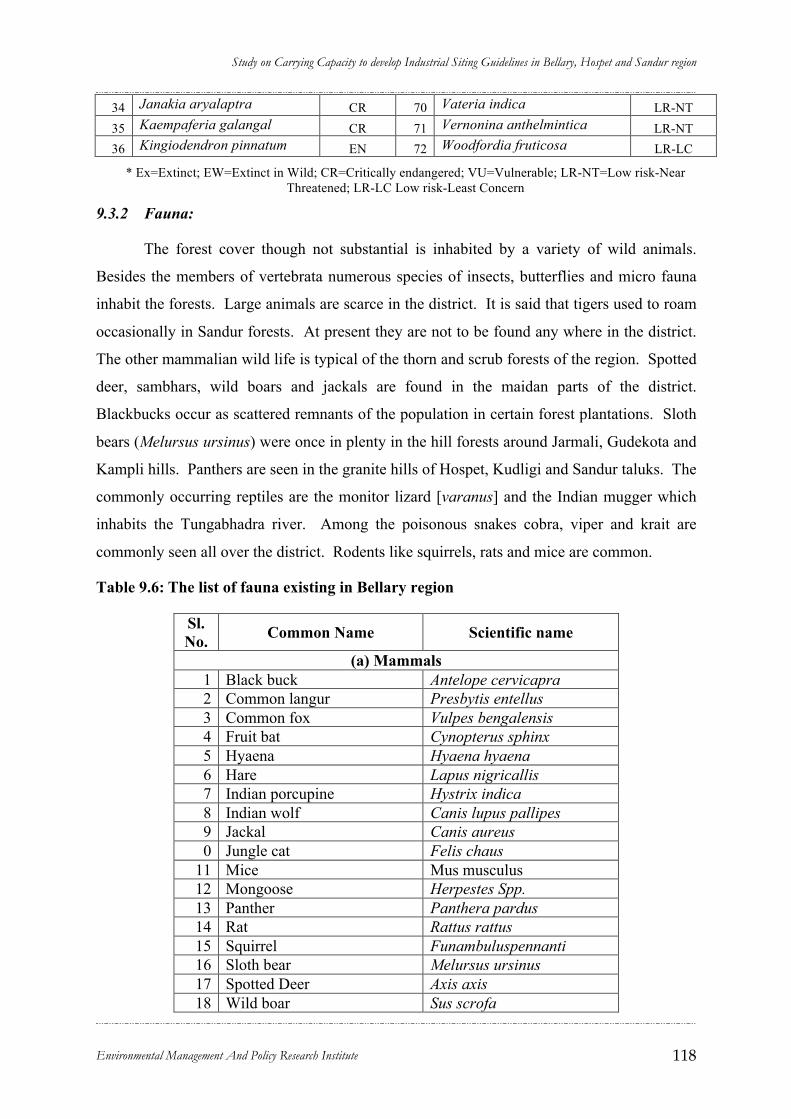
Study on Carrying Capacity to develop Industrial Siting Guidelines in Bellary, Hospet and Sandur region
Environmental Management And Policy Research Institute 118
34 Janakia aryalaptra CR 70 Vateria indica LR-NT 35 Kaempaferia galangal CR 71 Vernonina anthelmintica LR-NT 36 Kingiodendron pinnatum EN 72 Woodfordia fruticosa LR-LC
* Ex=Extinct; EW=Extinct in Wild; CR=Critically endangered; VU=Vulnerable; LR-NT=Low risk-Near Threatened; LR-LC Low risk-Least Concern
9.3.2 Fauna:
The forest cover though not substantial is inhabited by a variety of wild animals.
Besides the members of vertebrata numerous species of insects, butterflies and micro fauna
inhabit the forests. Large animals are scarce in the district. It is said that tigers used to roam
occasionally in Sandur forests. At present they are not to be found any where in the district.
The other mammalian wild life is typical of the thorn and scrub forests of the region. Spotted
deer, sambhars, wild boars and jackals are found in the maidan parts of the district.
Blackbucks occur as scattered remnants of the population in certain forest plantations. Sloth
bears (Melursus ursinus) were once in plenty in the hill forests around Jarmali, Gudekota and
Kampli hills. Panthers are seen in the granite hills of Hospet, Kudligi and Sandur taluks. The
commonly occurring reptiles are the monitor lizard [varanus] and the Indian mugger which
inhabits the Tungabhadra river. Among the poisonous snakes cobra, viper and krait are
commonly seen all over the district. Rodents like squirrels, rats and mice are common.
Table 9.6: The list of fauna existing in Bellary region
Sl. No. Common Name Scientific name
(a) Mammals 1 Black buck Antelope cervicapra 2 Common langur Presbytis entellus 3 Common fox Vulpes bengalensis 4 Fruit bat Cynopterus sphinx 5 Hyaena Hyaena hyaena 6 Hare Lapus nigricallis 7 Indian porcupine Hystrix indica 8 Indian wolf Canis lupus pallipes 9 Jackal Canis aureus 0 Jungle cat Felis chaus
11 Mice Mus musculus 12 Mongoose Herpestes Spp. 13 Panther Panthera pardus 14 Rat Rattus rattus 15 Squirrel Funambuluspennanti 16 Sloth bear Melursus ursinus 17 Spotted Deer Axis axis 18 Wild boar Sus scrofa

Study on Carrying Capacity to develop Industrial Siting Guidelines in Bellary, Hospet and Sandur region
Environmental Management And Policy Research Institute 119
(b) Birds 1 Ashy wren warbler Prinia socialis 2 Black drongo Dicrurus adsimilis 3 Black winged kite Elanus caerulus 4 Blossom headed parakeet Psittacula cyanocephala 5 Blue pigeon Columba livia 6 Blue jay Coracias benghalensis 7 Black headed oriole Oriolus xanthornus 8 Common weaver bird Ploceus phillippinus 9 Crow pheasant Centropus sinensis
10 Chestnut bellied nut-hatch Sitta castanea 11 Common myna Acridotheres tristis 12 Common hawk Cuculus varins 13 Cattle egret Babulus ibis 14 Common peafowl Pavo cristatus 15 Common kingfisher Alcedo atthis 16 Crey babbler Turdoides malcolmi 17 Grey wagtail Motacilla caspica 18 Grey jungle fowl Gallus sonnerata 19 Great horned owl Bubo bubo 20 Grey partridge Francolinus pondicerianus 21 Golden backed wood pecker Dinopium benghalensis 22 House sparrow Passer domesticus 23 Indian robin Saxicoloides fulicata 24 Jungle babbler Turdoides striatus 25 Jungle myna Acridotheres fusens 26 Jungle crow Corvus macroshynchos 27 Koel Eudynamys scolopacea 28 Luggar falcon Falco biarmicus jugger 29 Munia Lonchura Spp. 30 Pied wagtail Motacilla maderaspansis 31 Pariah kite Milnus migrans 32 Red vented bulbul Pycnonotus eafer 33 Red turtle dove Streptopelia Spp. 34 Rose ringed parakeet Psittaculla krameri 35 Whistling thrush Myiophoneus horsfieldii
(c) Reptiles 1 Cobra Naja tripudians 2 Chameleon Chameleo calcaratus 3 Garden lizard Gecko gecko 4 Krait Bangarus ceruleus 5 Monitor lizard Varanus spp. 6 Python Python molurus 7 Rat snake Coluber mucosus 8 Tortoise 9 Viper Echis carinata
(d) Crustaceans and insects 1 Butterflies and moths
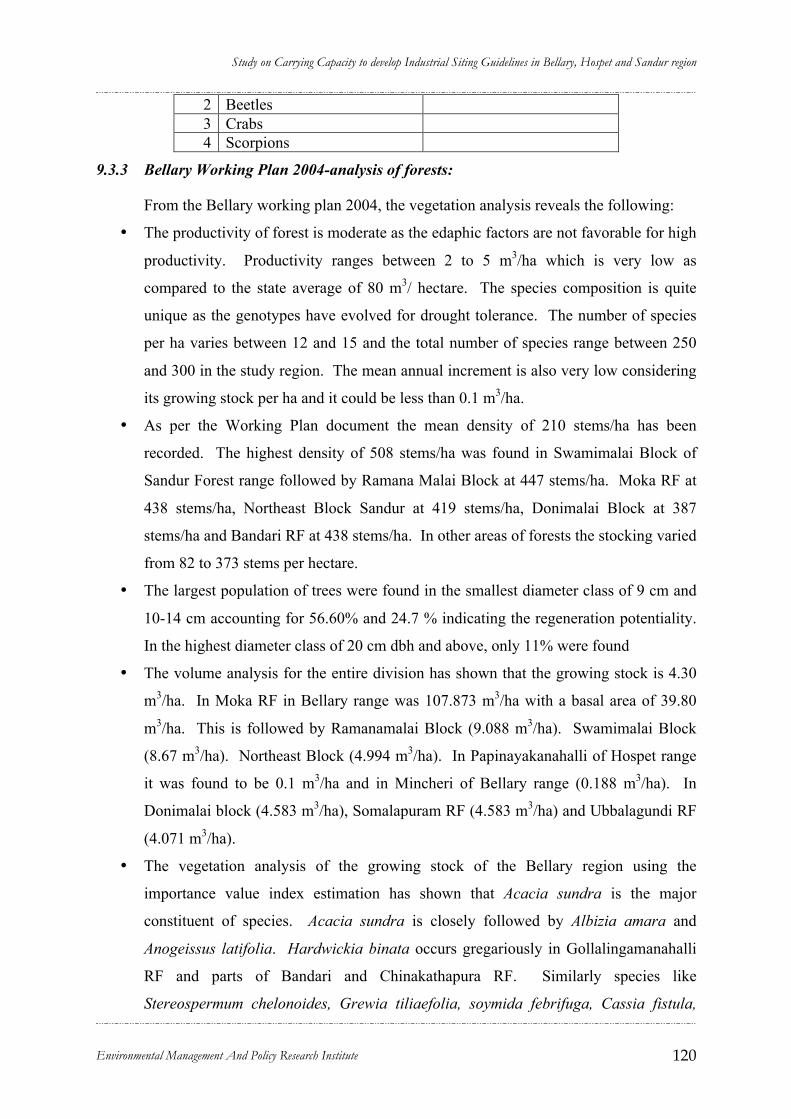
Study on Carrying Capacity to develop Industrial Siting Guidelines in Bellary, Hospet and Sandur region
Environmental Management And Policy Research Institute 120
2 Beetles 3 Crabs 4 Scorpions
9.3.3 Bellary Working Plan 2004-analysis of forests:
From the Bellary working plan 2004, the vegetation analysis reveals the following:
• The productivity of forest is moderate as the edaphic factors are not favorable for high
productivity. Productivity ranges between 2 to 5 m3/ha which is very low as
compared to the state average of 80 m3/ hectare. The species composition is quite
unique as the genotypes have evolved for drought tolerance. The number of species
per ha varies between 12 and 15 and the total number of species range between 250
and 300 in the study region. The mean annual increment is also very low considering
its growing stock per ha and it could be less than 0.1 m3/ha.
• As per the Working Plan document the mean density of 210 stems/ha has been
recorded. The highest density of 508 stems/ha was found in Swamimalai Block of
Sandur Forest range followed by Ramana Malai Block at 447 stems/ha. Moka RF at
438 stems/ha, Northeast Block Sandur at 419 stems/ha, Donimalai Block at 387
stems/ha and Bandari RF at 438 stems/ha. In other areas of forests the stocking varied
from 82 to 373 stems per hectare.
• The largest population of trees were found in the smallest diameter class of 9 cm and
10-14 cm accounting for 56.60% and 24.7 % indicating the regeneration potentiality.
In the highest diameter class of 20 cm dbh and above, only 11% were found
• The volume analysis for the entire division has shown that the growing stock is 4.30
m3/ha. In Moka RF in Bellary range was 107.873 m3/ha with a basal area of 39.80
m3/ha. This is followed by Ramanamalai Block (9.088 m3/ha). Swamimalai Block
(8.67 m3/ha). Northeast Block (4.994 m3/ha). In Papinayakanahalli of Hospet range
it was found to be 0.1 m3/ha and in Mincheri of Bellary range (0.188 m3/ha). In
Donimalai block (4.583 m3/ha), Somalapuram RF (4.583 m3/ha) and Ubbalagundi RF
(4.071 m3/ha).
• The vegetation analysis of the growing stock of the Bellary region using the
importance value index estimation has shown that Acacia sundra is the major
constituent of species. Acacia sundra is closely followed by Albizia amara and
Anogeissus latifolia. Hardwickia binata occurs gregariously in Gollalingamanahalli
RF and parts of Bandari and Chinakathapura RF. Similarly species like
Stereospermum chelonoides, Grewia tiliaefolia, soymida febrifuga, Cassia fistula,
Study on Carrying Capacity to develop Industrial Siting Guidelines in Bellary, Hospet and Sandur region
Environmental Management And Policy Research Institute 121
Dalbergia paniculata, Wrightia tictoria, Diospyros melonoxylon, Terminalia
tomentosa, Acacia leucophloea, Chloroxylon swietenia. Sandal occurs in varying
proportion in Bandari RF (2.1). Donimalai Block I(1.45) , Gunda RF (4.27), Jermali
RF (7.57), Ramanamalai Block(1.03) and Swamimalai Block (1.23). Teak is found in
Bandri (20.90), Donimalai (40.67), NorthEast Block (29.55), Ranamalai Block 37.01)
and Swamimalai Block (50.37).
• Bellary division is rich in forest products exporting significant quantity of products
from the region. Sandal, the most valuable product is exported to the tune of 413 m3
during 2002-03 and 80 m3 during 2003-04. Firewood is another important value
product extracted every year in significant quantities. Among non-timber forest
products, charcoal, beedi leaves and tamarind are the products extracted in significant
quantities (Table 9.7).
Table 9.7: Forest products collected in Bellary forest division.
Name of the product 2001-02 2002-03 2003-04 1. Timber products Round poles 1.300 4.000 Firewood 12.037 238.804 79.920 Sandal 413.000 80.000 Teak 0.974 Eucalyptus 21.206 11.391 Others 37.898 202.66 2. Non-timber forest products Charcoal 55 202.66 136.6 Beedi leaves 28.65 183.1 30.25 Tamarind 30.42 30.5 30.42 Sigekai 2.0 0.25 Oil Seeds 0.65 11.0 1.82 Fruits 13.0 1.05 Antwala 2.0 0.3 Nelli 1.2 Alalekai 3.0 2.0 Gum 0.6
Source: Annual Report, Karnataka Forest Department
9.4 Change in forest cover & forest use
The forest use and forest cover change analysis was done by KSRSAC using IRS-1C
satellite imageries with PAN data. The change in forest cover during 2000 and 2004 for the
study area are discussed below.
Study on Carrying Capacity to develop Industrial Siting Guidelines in Bellary, Hospet and Sandur region
Environmental Management And Policy Research Institute 122
Forest cover: Land use cover analysis has shown that there has been considerable
decrease in the forest cover between 2000 and 2004 to an extent of 180 ha in Bellary, Sandur
and Hospet region. It is evident from Figure 9.3 that loss of vegetation is mainly in the sites,
where mining activity is rampant. Change in forest cover is mainly due to increased mining
activity. However, there is a large extent of scrub forest in the study area which is around
17.50% of total geographical area, but has very low canopy density i.e., less than 10%
density.
Sandur: As per the record maintained by Karnataka Forest Department the extent of
forest in Sandur Taluk was 31% of total geographical area. However, as per the land use
change analysis the area under Forest cover in Sandur Taluk has reduced by 173 ha mainly
due to mining activity. The land use change map of Sandur indicates significant increase in
mining activity in Sandur Forest significantly between the years 2000 and 2004 (Figure 4.7 A
& B).
Hospet and Bellary: As per the land use change analysis the area under Forest in
Bellary taluk is nil and in Hospet taluk it has reduced by 7 ha between 2000 and 2004; the
percentage of change in Forest is 0.06%.
From the satellite imageries it is also evident that there has been expansion of mining
activity in the forests over the years resulting in loss of vegetation cover. From the land use
analysis it is evident that the forest cover has decreased substantially and the bulk of forest
area has been diverted to non-forestry uses to a large extent in Sandur taluk and marginally in
the remaining two taluks of the study region. Besides the loss of forestland the degradation
of the adjacent forest due to edge effect is quite evident from the satellite map. Productivity
of forests in the adjoining areas where mining is undertaken has been affected due to
deposition of dust on trees, shrubs, herbs and grasses. The fragmentation of forest has
affected the movement of wildlife in the corridors affecting the population dynamics and
breeding behavior. There is damage to regeneration of forest and growth of trees, shrubs,
herbs, bamboo etc. affecting productivity.
There has been a significant change in the forest cover and forest use change in the
study area between 2000 and 2004. The land use change analysis has shown that:
• Mining in the forest area has undergone expansion in the last five years. • Forest cover has decreased in the study area from 33251.90 hectare to 33071.89
hectare largely due to mining and dumping of mining waste.

Study on Carrying Capacity to develop Industrial Siting Guidelines in Bellary, Hospet and Sandur region
Environmental Management And Policy Research Institute 123
Figure 9.5: Forest fire in Thimmappanaguddi, Sandur range
• Area under mining activity has increased from 1201.12 hectare to 1508.03 hectare. The changes are largely in the Forest areas (plate 3 and 4).
• Area covered with mining waste has increased from 64.8 ha to 156.28 ha. The change is largely in the forest areas.
• Scrub Forest has decreased from 68241.24 ha largely due to mining and dumping of mining waste.
• The fragmentation of forest ecosystem is very clearly visible. • The diversion of forest area to mining is more in Sandur than in other two taluks
9.4.1 Mining in forest area:
As per the Working Plan of Bellary division 2004, there are 50 active mines and 35
closed mines spread over an area of 5487.64 ha. The forest area leased for mining is around
5500 ha in the reserve forests as reported by Karnataka Forest Department. These include
both active and abandoned mining areas in the study region.
Table 9.8: Mining in forest area
Extent in Ha SL. No Taluk Active Mines Abandoned Mines Closed Mines Total 1 Bellary 97.10 (4) ─ 72.65 (5) 169.75 (9) 2 Hospet 647.58 (5) ─ 258.78 (8) 906.36 (13) 3 Sandur 3067.72 (41) ─ 1343.81 (22) 4411.53 (63)
Total 3, 862.34 (50) 1,675.24 (35) 5487.64 (85) Note: Active mines data is as per Forest Department, Bellary and the Closed mine data are as per Working Plan of 2004, Bellary Division. In addition to forest leases the mining leases granted in the minor forests that are yet to
declared as reserve forests is around 10,000 ha, which is largely distributed in Sandur taluk.
9.5 Forest degradation:
In our country villages are located
along the periphery of forest area. Local
communities are using these forests for
meeting their day-to-day requirements like
firewood, small timber, fodder and many
minor forest products. Fire and heavy
grazing has affected the regeneration of
many species. In addition to these problems,
mining is the most severe problem
encountered in the forest area.
As a result of large scale mining
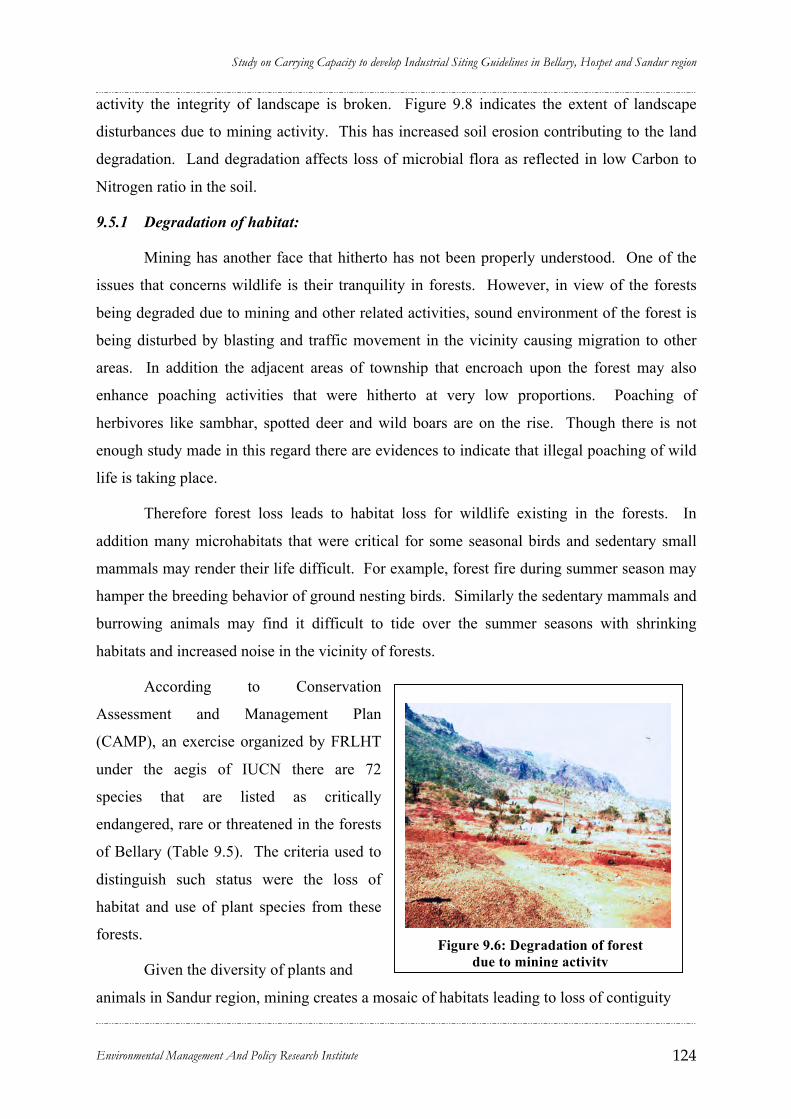
Study on Carrying Capacity to develop Industrial Siting Guidelines in Bellary, Hospet and Sandur region
Environmental Management And Policy Research Institute 124
Figure 9.6: Degradation of forest due to mining activity
activity the integrity of landscape is broken. Figure 9.8 indicates the extent of landscape
disturbances due to mining activity. This has increased soil erosion contributing to the land
degradation. Land degradation affects loss of microbial flora as reflected in low Carbon to
Nitrogen ratio in the soil.
9.5.1 Degradation of habitat:
Mining has another face that hitherto has not been properly understood. One of the
issues that concerns wildlife is their tranquility in forests. However, in view of the forests
being degraded due to mining and other related activities, sound environment of the forest is
being disturbed by blasting and traffic movement in the vicinity causing migration to other
areas. In addition the adjacent areas of township that encroach upon the forest may also
enhance poaching activities that were hitherto at very low proportions. Poaching of
herbivores like sambhar, spotted deer and wild boars are on the rise. Though there is not
enough study made in this regard there are evidences to indicate that illegal poaching of wild
life is taking place.
Therefore forest loss leads to habitat loss for wildlife existing in the forests. In
addition many microhabitats that were critical for some seasonal birds and sedentary small
mammals may render their life difficult. For example, forest fire during summer season may
hamper the breeding behavior of ground nesting birds. Similarly the sedentary mammals and
burrowing animals may find it difficult to tide over the summer seasons with shrinking
habitats and increased noise in the vicinity of forests.
According to Conservation
Assessment and Management Plan
(CAMP), an exercise organized by FRLHT
under the aegis of IUCN there are 72
species that are listed as critically
endangered, rare or threatened in the forests
of Bellary (Table 9.5). The criteria used to
distinguish such status were the loss of
habitat and use of plant species from these
forests.
Given the diversity of plants and
animals in Sandur region, mining creates a mosaic of habitats leading to loss of contiguity

Study on Carrying Capacity to develop Industrial Siting Guidelines in Bellary, Hospet and Sandur region
Environmental Management And Policy Research Institute 125
and integrity of forests. The forest and mining area maps indicate that huge area of land is
excavated creating a discontinuous forest patch. Forest discontinuity restricts pollen flow, in
other words gene flow and also restricts seed dispersal. Similarly, mining activity adjacent to
forest create destruction of corridor for migratory mammals such as Cheetal, Sambhar etc.
Some of the impacts of habitat loss on environment are as follows:
• Change in the microclimate. • Loss of genetic diversity of plant and animal species. • Fragmentation of habitat and disturbance in the gene flow in both plant and animal
population.
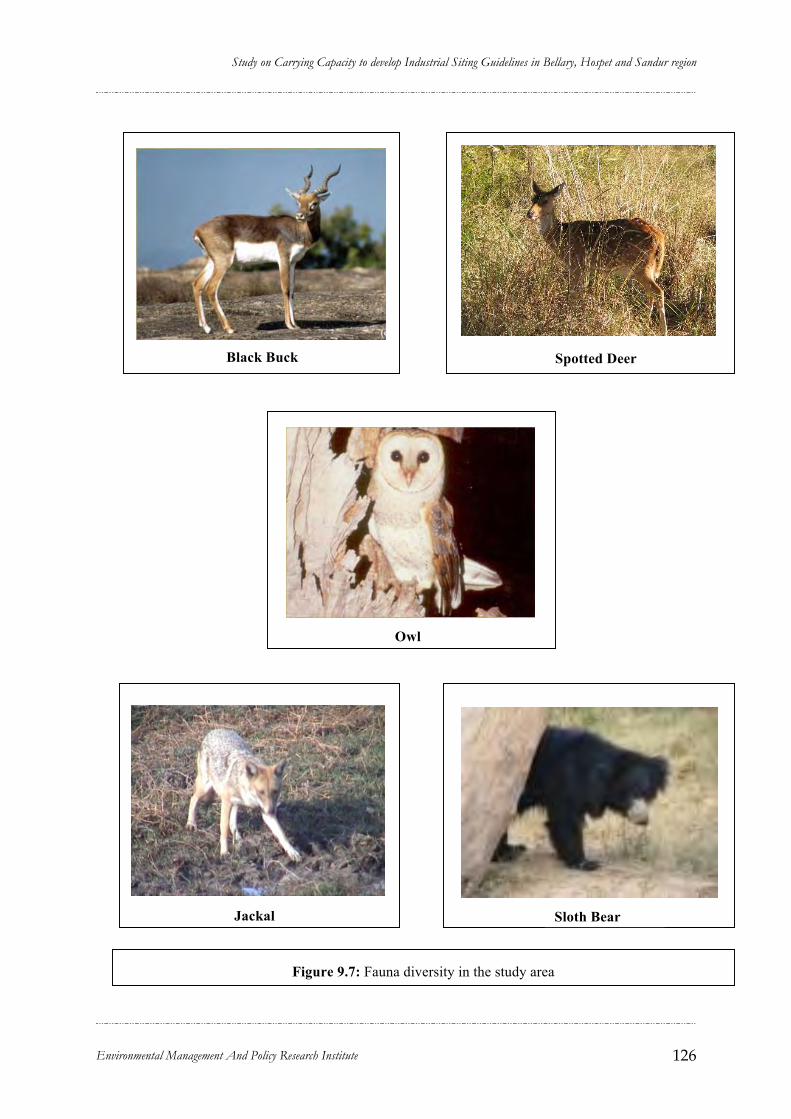
Study on Carrying Capacity to develop Industrial Siting Guidelines in Bellary, Hospet and Sandur region
Environmental Management And Policy Research Institute 126
Black Buck Spotted Deer
Owl
Jackal Sloth Bear
Figure 9.7: Fauna diversity in the study area
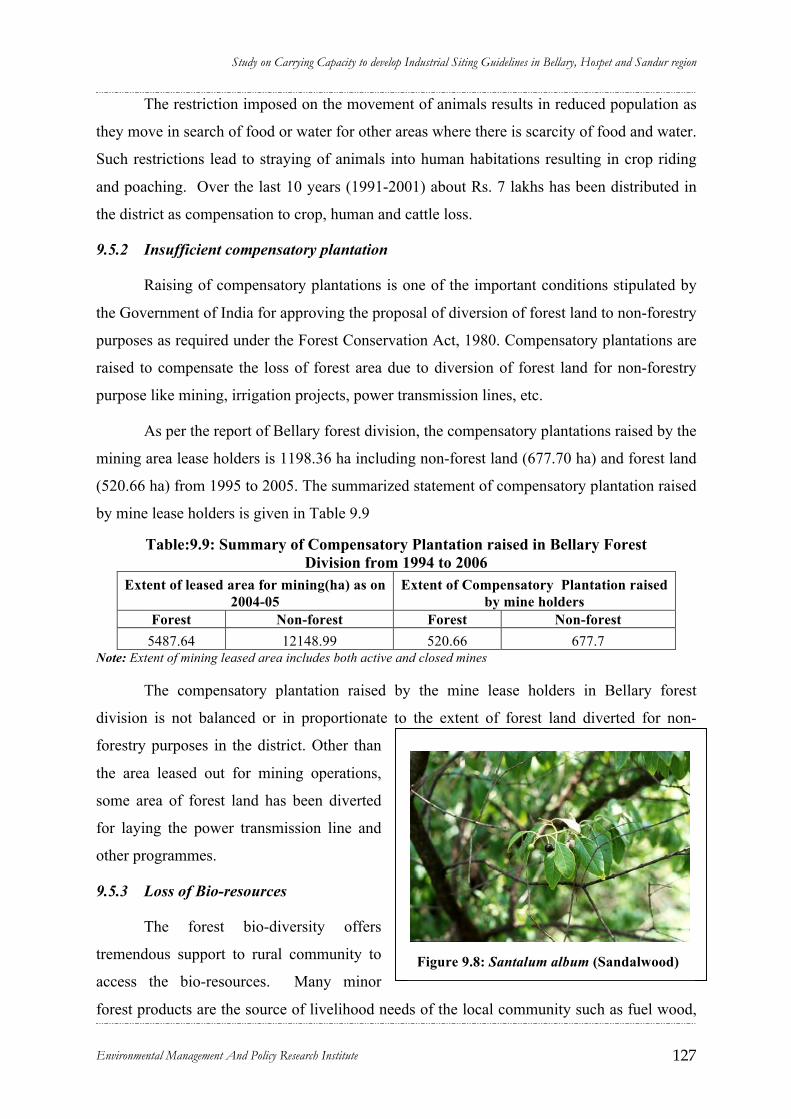
Study on Carrying Capacity to develop Industrial Siting Guidelines in Bellary, Hospet and Sandur region
Environmental Management And Policy Research Institute 127
Figure 9.8: Santalum album (Sandalwood)
The restriction imposed on the movement of animals results in reduced population as
they move in search of food or water for other areas where there is scarcity of food and water.
Such restrictions lead to straying of animals into human habitations resulting in crop riding
and poaching. Over the last 10 years (1991-2001) about Rs. 7 lakhs has been distributed in
the district as compensation to crop, human and cattle loss.
9.5.2 Insufficient compensatory plantation
Raising of compensatory plantations is one of the important conditions stipulated by
the Government of India for approving the proposal of diversion of forest land to non-forestry
purposes as required under the Forest Conservation Act, 1980. Compensatory plantations are
raised to compensate the loss of forest area due to diversion of forest land for non-forestry
purpose like mining, irrigation projects, power transmission lines, etc.
As per the report of Bellary forest division, the compensatory plantations raised by the
mining area lease holders is 1198.36 ha including non-forest land (677.70 ha) and forest land
(520.66 ha) from 1995 to 2005. The summarized statement of compensatory plantation raised
by mine lease holders is given in Table 9.9
Table:9.9: Summary of Compensatory Plantation raised in Bellary Forest Division from 1994 to 2006
Extent of leased area for mining(ha) as on 2004-05
Extent of Compensatory Plantation raised by mine holders
Forest Non-forest Forest Non-forest 5487.64 12148.99 520.66 677.7
Note: Extent of mining leased area includes both active and closed mines
The compensatory plantation raised by the mine lease holders in Bellary forest
division is not balanced or in proportionate to the extent of forest land diverted for non-
forestry purposes in the district. Other than
the area leased out for mining operations,
some area of forest land has been diverted
for laying the power transmission line and
other programmes.
9.5.3 Loss of Bio-resources
The forest bio-diversity offers
tremendous support to rural community to
access the bio-resources. Many minor
forest products are the source of livelihood needs of the local community such as fuel wood,

Study on Carrying Capacity to develop Industrial Siting Guidelines in Bellary, Hospet and Sandur region
Environmental Management And Policy Research Institute 128
fruits, seeds, green leaves, small timber and herbal plants. The loss of bio-diversity has
resulted in the denial of access to bio-resources among the rural community.
9.5.4 Grazing:
Mining in forest area has reduced grazing of cattle in the forests. The loss of ground
vegetation due to soil disturbance has affected the regeneration potential of the forests. This
has also forced the farmers to sell their cattle resulting in the decline of cattle population and
diversity.
9.6 Conclusion
In conclusion, mining activity has brought about qualitative and quantitative changes
in forest biodiversity. More importantly, the land degradation due to mining activity has
seriously affected the functioning of ecosystem reducing the productivity of land and forest
regeneration. Therefore, there should be some measures taken immediately to arrest the
irreversible ecosystem functions and maintain the forest and biodiversity in the region.
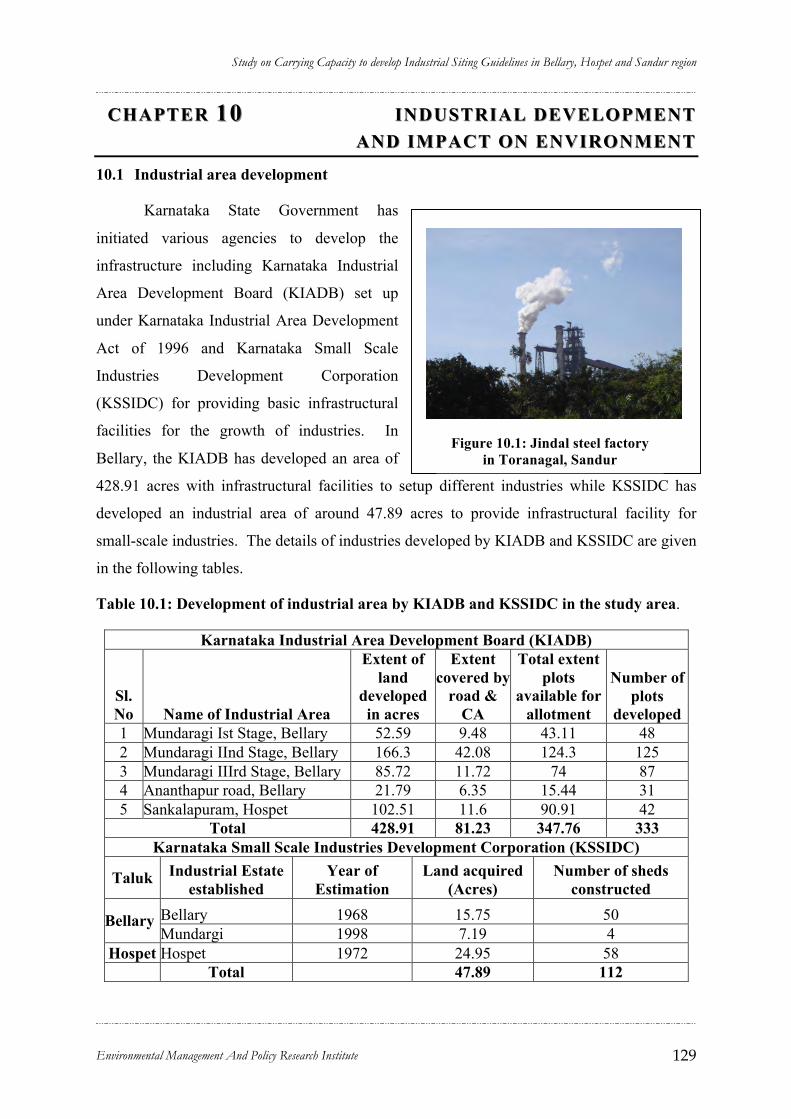
Study on Carrying Capacity to develop Industrial Siting Guidelines in Bellary, Hospet and Sandur region
Environmental Management And Policy Research Institute 129
Figure 10.1: Jindal steel factory in Toranagal, Sandur
CHAPTER CHAPTER 1010 INDUSTRIAL DEVELOPMEINDUSTRIAL DEVELOPME NT NT AND IMPACT ON ENVIROAND IMPACT ON ENVIRO NMENTNMENT
10.1 Industrial area development
Karnataka State Government has
initiated various agencies to develop the
infrastructure including Karnataka Industrial
Area Development Board (KIADB) set up
under Karnataka Industrial Area Development
Act of 1996 and Karnataka Small Scale
Industries Development Corporation
(KSSIDC) for providing basic infrastructural
facilities for the growth of industries. In
Bellary, the KIADB has developed an area of
428.91 acres with infrastructural facilities to setup different industries while KSSIDC has
developed an industrial area of around 47.89 acres to provide infrastructural facility for
small-scale industries. The details of industries developed by KIADB and KSSIDC are given
in the following tables.
Table 10.1: Development of industrial area by KIADB and KSSIDC in the study area.
Karnataka Industrial Area Development Board (KIADB)
Sl. No Name of Industrial Area
Extent of land
developed in acres
Extent covered by
road & CA
Total extent plots
available for allotment
Number of plots
developed 1 Mundaragi Ist Stage, Bellary 52.59 9.48 43.11 48 2 Mundaragi IInd Stage, Bellary 166.3 42.08 124.3 125 3 Mundaragi IIIrd Stage, Bellary 85.72 11.72 74 87 4 Ananthapur road, Bellary 21.79 6.35 15.44 31 5 Sankalapuram, Hospet 102.51 11.6 90.91 42
Total 428.91 81.23 347.76 333 Karnataka Small Scale Industries Development Corporation (KSSIDC)
Taluk Industrial Estate established
Year of Estimation
Land acquired (Acres)
Number of sheds constructed
Bellary 1968 15.75 50 Bellary Mundargi 1998 7.19 4
Hospet Hospet 1972 24.95 58 Total 47.89 112
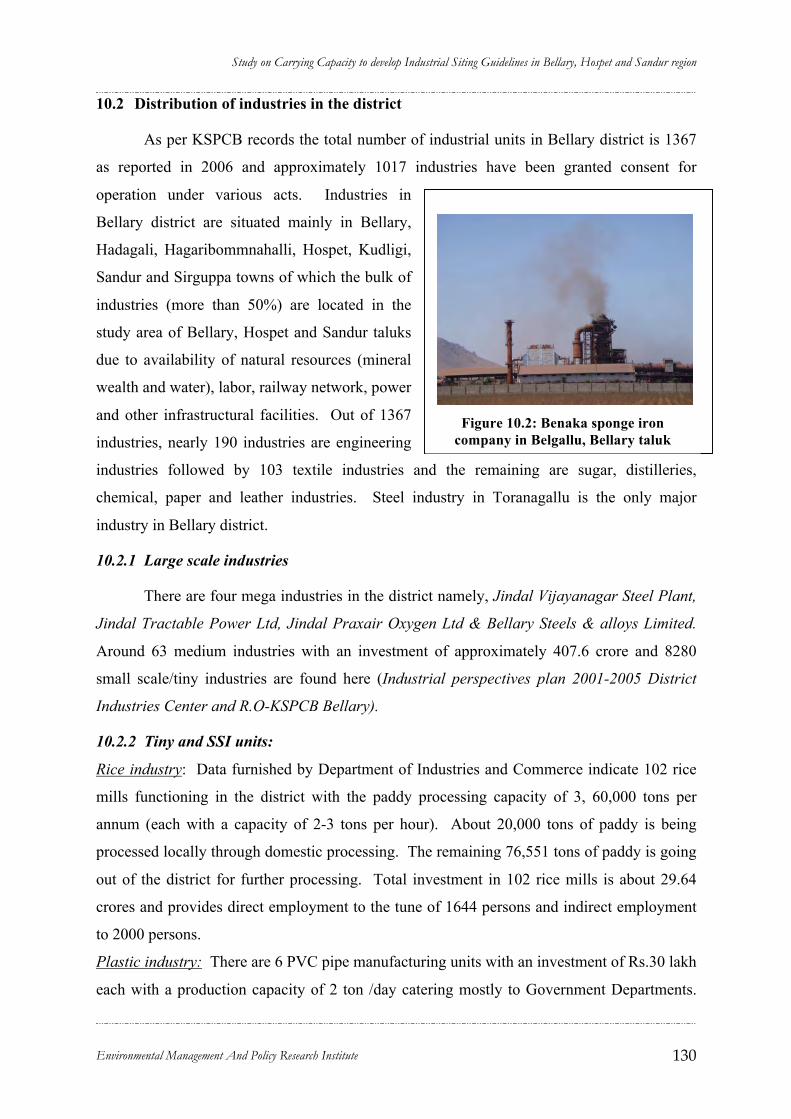
Study on Carrying Capacity to develop Industrial Siting Guidelines in Bellary, Hospet and Sandur region
Environmental Management And Policy Research Institute 130
Figure 10.2: Benaka sponge iron company in Belgallu, Bellary taluk
10.2 Distribution of industries in the district
As per KSPCB records the total number of industrial units in Bellary district is 1367
as reported in 2006 and approximately 1017 industries have been granted consent for
operation under various acts. Industries in
Bellary district are situated mainly in Bellary,
Hadagali, Hagaribommnahalli, Hospet, Kudligi,
Sandur and Sirguppa towns of which the bulk of
industries (more than 50%) are located in the
study area of Bellary, Hospet and Sandur taluks
due to availability of natural resources (mineral
wealth and water), labor, railway network, power
and other infrastructural facilities. Out of 1367
industries, nearly 190 industries are engineering
industries followed by 103 textile industries and the remaining are sugar, distilleries,
chemical, paper and leather industries. Steel industry in Toranagallu is the only major
industry in Bellary district.
10.2.1 Large scale industries
There are four mega industries in the district namely, Jindal Vijayanagar Steel Plant,
Jindal Tractable Power Ltd, Jindal Praxair Oxygen Ltd & Bellary Steels & alloys Limited.
Around 63 medium industries with an investment of approximately 407.6 crore and 8280
small scale/tiny industries are found here (Industrial perspectives plan 2001-2005 District
Industries Center and R.O-KSPCB Bellary).
10.2.2 Tiny and SSI units:
Rice industry: Data furnished by Department of Industries and Commerce indicate 102 rice
mills functioning in the district with the paddy processing capacity of 3, 60,000 tons per
annum (each with a capacity of 2-3 tons per hour). About 20,000 tons of paddy is being
processed locally through domestic processing. The remaining 76,551 tons of paddy is going
out of the district for further processing. Total investment in 102 rice mills is about 29.64
crores and provides direct employment to the tune of 1644 persons and indirect employment
to 2000 persons.
Plastic industry: There are 6 PVC pipe manufacturing units with an investment of Rs.30 lakh
each with a production capacity of 2 ton /day catering mostly to Government Departments.
Study on Carrying Capacity to develop Industrial Siting Guidelines in Bellary, Hospet and Sandur region
Environmental Management And Policy Research Institute 131
Existing units receive their raw material supplies (grade 50 materials) from Mumbai. There
are 8 plastic waste recycling units producing mugs, pots, and buckets in Bellary and Hospet,
with a capacity of 100 kg/day. These units depend on the waste plastic available in the
district.
Stone cutting & polishing unit: Around 30 industries exist with an installed capacity of 500
sq ft/day, out of which 18 units became sick because of the drop in market.
Red oxide industry: There are 16 industries with a production capacity of 4 tons/day which
manufacture oxide colors like red oxide with old technology. The raw material is available in
Sandur, Hospet and Bellary taluks. These are hazardous air polluting units.
Cotton ginning and pressing unit: Cotton being an important crop of the district; it has been
estimated that 99,618 tons of cotton is produced in the district per annum. There are 66
cotton ginning and pressing units functioning in the district with total capacity of processing
3 lakh tons of cotton per annum. The deficit quantity of around 2 lakh tons of cotton is
obtained from neighboring districts like Chitradurga, Gadag, Davanagare and Bijapur.
Readymade garments (Jeans): There are 48 registered tiny and small-scale industries
currently engaged in the manufacture of ready-made garments, particularly jeans. Most of
the ready-made garment units in the district are concentrated in Bellary city. These units
provide direct employment to around 3000 persons and indirect employment to around
10,000 persons. Total annual production from these units is 40.5 lakh pieces worth Rs. 150
crore.
Jeans washing unit: There are around 42 Jean’s Washing Units with an investment of Rs.10
Lakhs each, and production capacity of 500 pants/day, located in Bellary.
10.3 Distribution of industries in the study area
10.3.1 Type of industries
Majority of industries registered in the district (more than 50%) are located in the
study area due to availability of water and relatively good infrastructure facility. Again large
number of industries in the study area are located close to eco-sensitive zones like water
bodies, forest area and historical monuments.
10.3.1.1 Red, Orange and Green category industries
The Karnataka State Pollution Control Board (KSPCB) has categorized the industries
as Red, Orange and Green category based on size, scale of operation and their pollution
potential. Out of 1367 industries located in Bellary district, nearly 1017 industries are located

Study on Carrying Capacity to develop Industrial Siting Guidelines in Bellary, Hospet and Sandur region
Environmental Management And Policy Research Institute 132
in Sandur, Bellary and Hospet region accounting for nearly 70 % of the total industries. The
table below shows the number of industries classified under different categories in the study
area.
Table 10.2: Category of industries in the study region.
Large Medium Small Sl. No. Taluk Name
Red Orange Green Red Orange Green Red Orange Green Total
1 Bellary 32 34 2 20 3 8 114 92 229 534 2 Sandur 16 4 20 1 0 177 0 14 232 3 Hospet 9 0 2 9 0 2 137 82 10 251
Total 57 34 8 49 4 10 428 174 253 1017 Source: Regional office KSPCB, Bellary
Of the 632 red category industries in Bellary district the study area has 534 industries
which is very high as compared to the size of industrial activity in the district. The number of
orange category industries in the study area is 212 which is comparatively higher than the
district total of 255 industries. Total number of green category industries in Bellary district is
372 while the total green category industries in the study area are 271.
10.3.1.2 Mining industry:
Mining has become a major industry in Bellary district in the recent past due to rich
deposit of iron (constituting 62 to 68% of Iron) and manganese ores. There 71 major and
minor mining industries currently operating in the study area. In Bellary district, richest
concentration of iron ore is confined to two main bands. They are (1) the eastern copper
mountain belt and (2) western Sandur belt.
Table 10.3: List of active mines in the study area
Taluk No. of mining (Lease) Area under mining (hectares)
Bellary 5 475.78 Sandur 51 13961.77 Hospet 15 1389.19
Total 71 15826.74
Table 10.4: Production of minerals in the study area - 2004-05
Sl.No Minerals
Production in Metric
tons 1 Iron Ore, I.O.Fines, Red-oxide 30,618,477.0 2 Manganese Ore 355969.0

Study on Carrying Capacity to develop Industrial Siting Guidelines in Bellary, Hospet and Sandur region
Environmental Management And Policy Research Institute 133
Figure 10.3: Growth of industries in Bellary. (Source: Industrial perspective plan 2001-2005, District Industries Center, Bellary)
3 Quartz 34194.0 4 Soap Stone 1845.0 Grand Total 31010485
* Note: The detailed table is given in Annexure
10.4 Industrial employment opportunity in Bellary district
The percentage of persons employed per registered factory in the district is 3.2% of
the state which is very less as compared to Bangalore district, which has 31% (13,115
persons/registered factory) of the state’s employment (Subramaniam, undated). However,
due to increase in mining activity the number of persons working in industrial establishment
has increased significantly. At present there are 1017 major and minor industries providing
employment to 16,000 employees and 8,280 small scale/tiny industries providing
employment to 40,020 employees (District Census Book, 2004). At present the number of
employees working in industrial and mining sectors is approximately 70,645, which work out
to 3.48% of the total population. Number of people depending on industrial employment in
the district is around 3.5% and mining activity is roughly employing 1.27% of the total
population in the study area. The per capita income in Bellary during 2001-2002 was Rs.17,
895. However, the mining activity in the district has improved the income level marginally
(District Census Book-2004).
10.5 Growth pattern
The growth rate of
industrialization though
very slow in Bellary
district number of
initiatives by the state
Government has helped
in the growth of many
tiny industrial units. The
development of small
scale/tiny industries in
Bellary district from 1970
to 2000 is shown in the
Figure 10.3. The growth
of industries is exponential indicating mushrooming of industries in the area over the last 30
years.
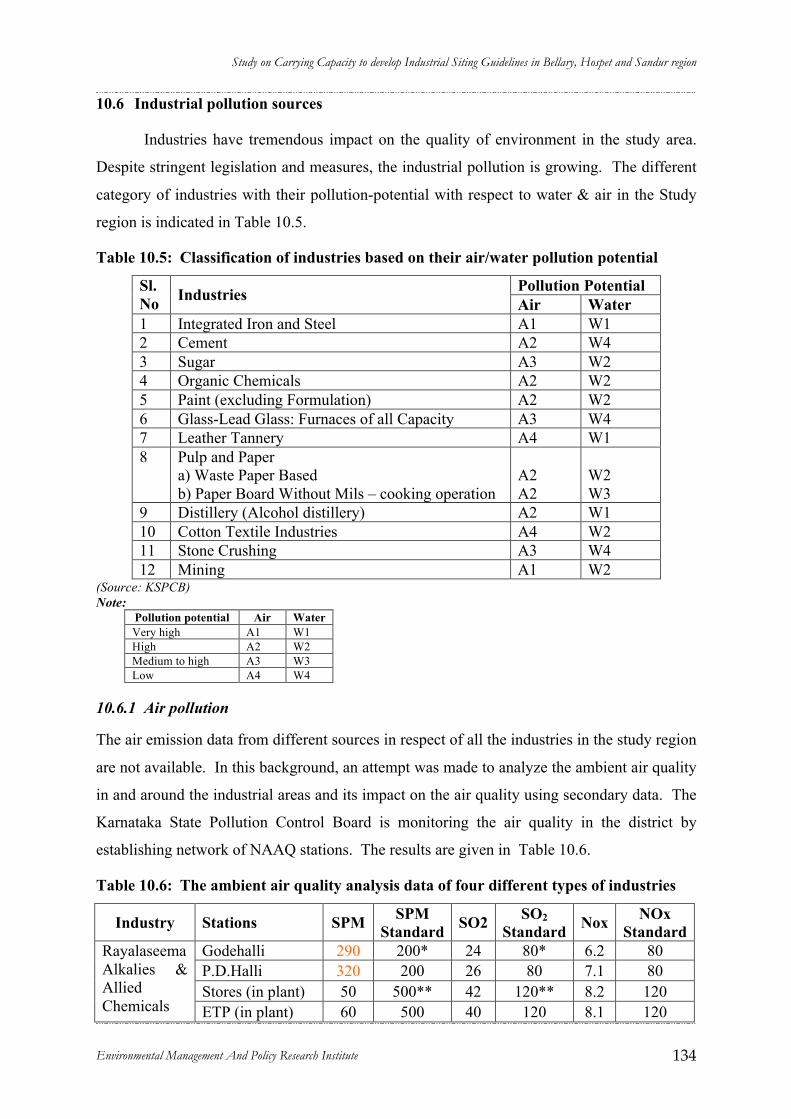
Study on Carrying Capacity to develop Industrial Siting Guidelines in Bellary, Hospet and Sandur region
Environmental Management And Policy Research Institute 134
10.6 Industrial pollution sources
Industries have tremendous impact on the quality of environment in the study area.
Despite stringent legislation and measures, the industrial pollution is growing. The different
category of industries with their pollution-potential with respect to water & air in the Study
region is indicated in Table 10.5.
Table 10.5: Classification of industries based on their air/water pollution potential
Pollution Potential Sl. No Industries Air Water 1 Integrated Iron and Steel A1 W1 2 Cement A2 W4 3 Sugar A3 W2 4 Organic Chemicals A2 W2 5 Paint (excluding Formulation) A2 W2 6 Glass-Lead Glass: Furnaces of all Capacity A3 W4 7 Leather Tannery A4 W1 8 Pulp and Paper
a) Waste Paper Based b) Paper Board Without Mils – cooking operation
A2 A2
W2 W3
9 Distillery (Alcohol distillery) A2 W1 10 Cotton Textile Industries A4 W2 11 Stone Crushing A3 W4 12 Mining A1 W2
(Source: KSPCB) Note:
Pollution potential Air Water Very high A1 W1 High A2 W2 Medium to high A3 W3 Low A4 W4
10.6.1 Air pollution
The air emission data from different sources in respect of all the industries in the study region
are not available. In this background, an attempt was made to analyze the ambient air quality
in and around the industrial areas and its impact on the air quality using secondary data. The
Karnataka State Pollution Control Board is monitoring the air quality in the district by
establishing network of NAAQ stations. The results are given in Table 10.6.
Table 10.6: The ambient air quality analysis data of four different types of industries
Industry Stations SPM SPM Standard SO2 SO2
Standard Nox NOx Standard
Godehalli 290 200* 24 80* 6.2 80 P.D.Halli 320 200 26 80 7.1 80 Stores (in plant) 50 500** 42 120** 8.2 120
Rayalaseema Alkalies & Allied Chemicals ETP (in plant) 60 500 40 120 8.1 120
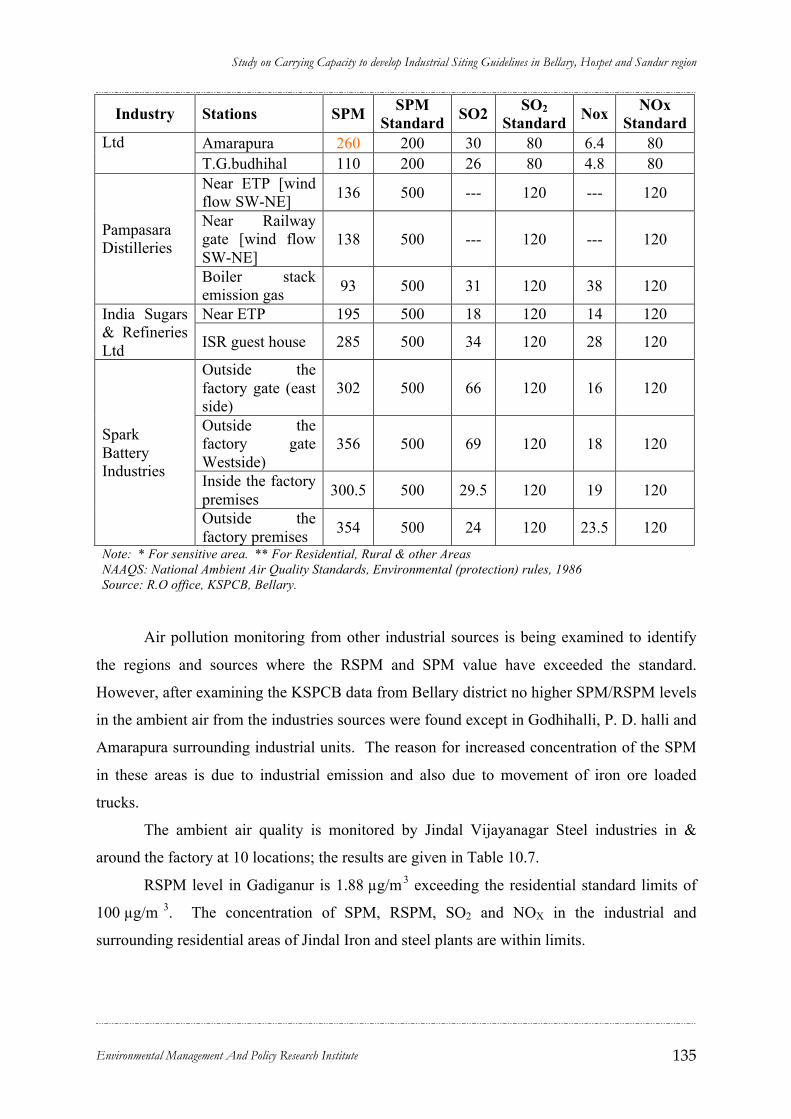
Study on Carrying Capacity to develop Industrial Siting Guidelines in Bellary, Hospet and Sandur region
Environmental Management And Policy Research Institute 135
Industry Stations SPM SPM Standard SO2 SO2
Standard Nox NOx Standard
Amarapura 260 200 30 80 6.4 80 Ltd T.G.budhihal 110 200 26 80 4.8 80 Near ETP [wind flow SW-NE] 136 500 --- 120 --- 120
Near Railway gate [wind flow SW-NE]
138 500 --- 120 --- 120 Pampasara Distilleries
Boiler stack emission gas 93 500 31 120 38 120
Near ETP 195 500 18 120 14 120 India Sugars & Refineries Ltd ISR guest house 285 500 34 120 28 120
Outside the factory gate (east side)
302 500 66 120 16 120
Outside the factory gate Westside)
356 500 69 120 18 120
Inside the factory premises 300.5 500 29.5 120 19 120
Spark Battery Industries
Outside the factory premises 354 500 24 120 23.5 120
Note: * For sensitive area. ** For Residential, Rural & other Areas NAAQS: National Ambient Air Quality Standards, Environmental (protection) rules, 1986 Source: R.O office, KSPCB, Bellary.
Air pollution monitoring from other industrial sources is being examined to identify
the regions and sources where the RSPM and SPM value have exceeded the standard.
However, after examining the KSPCB data from Bellary district no higher SPM/RSPM levels
in the ambient air from the industries sources were found except in Godhihalli, P. D. halli and
Amarapura surrounding industrial units. The reason for increased concentration of the SPM
in these areas is due to industrial emission and also due to movement of iron ore loaded
trucks.
The ambient air quality is monitored by Jindal Vijayanagar Steel industries in &
around the factory at 10 locations; the results are given in Table 10.7.
RSPM level in Gadiganur is 1.88 µg/m3 exceeding the residential standard limits of
100 µg/m 3. The concentration of SPM, RSPM, SO2 and NOX in the industrial and
surrounding residential areas of Jindal Iron and steel plants are within limits.
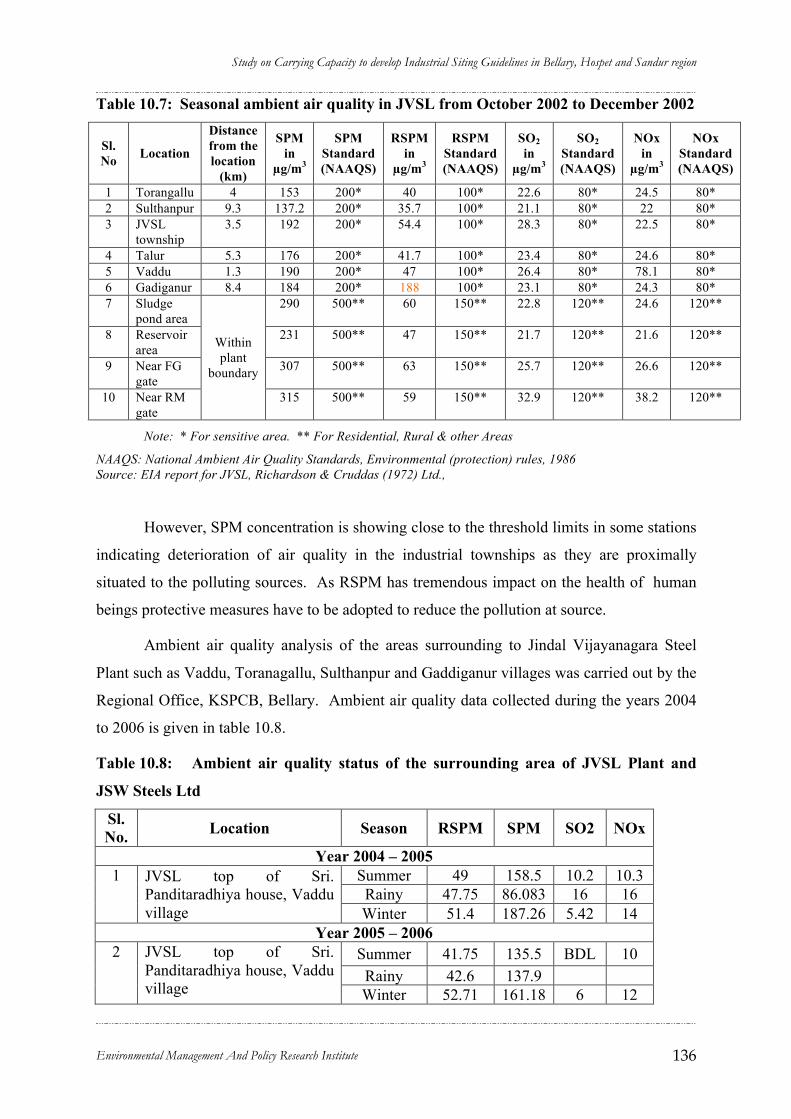
Study on Carrying Capacity to develop Industrial Siting Guidelines in Bellary, Hospet and Sandur region
Environmental Management And Policy Research Institute 136
Table 10.7: Seasonal ambient air quality in JVSL from October 2002 to December 2002
Sl. No Location
Distance from the location
(km)
SPM in
µg/m3
SPM Standard (NAAQS)
RSPM in
µg/m3
RSPM Standard (NAAQS)
SO2 in
µg/m3
SO2 Standard (NAAQS)
NOx in
µg/m3
NOx Standard (NAAQS)
1 Torangallu 4 153 200* 40 100* 22.6 80* 24.5 80* 2 Sulthanpur 9.3 137.2 200* 35.7 100* 21.1 80* 22 80* 3 JVSL
township 3.5 192 200* 54.4 100* 28.3 80* 22.5 80*
4 Talur 5.3 176 200* 41.7 100* 23.4 80* 24.6 80* 5 Vaddu 1.3 190 200* 47 100* 26.4 80* 78.1 80* 6 Gadiganur 8.4 184 200* 188 100* 23.1 80* 24.3 80* 7 Sludge
pond area 290 500** 60 150** 22.8 120** 24.6 120**
8 Reservoir area
231 500** 47 150** 21.7 120** 21.6 120**
9 Near FG gate
307 500** 63 150** 25.7 120** 26.6 120**
10 Near RM gate
Within plant
boundary
315 500** 59 150** 32.9 120** 38.2 120**
Note: * For sensitive area. ** For Residential, Rural & other Areas
NAAQS: National Ambient Air Quality Standards, Environmental (protection) rules, 1986 Source: EIA report for JVSL, Richardson & Cruddas (1972) Ltd.,
However, SPM concentration is showing close to the threshold limits in some stations
indicating deterioration of air quality in the industrial townships as they are proximally
situated to the polluting sources. As RSPM has tremendous impact on the health of human
beings protective measures have to be adopted to reduce the pollution at source.
Ambient air quality analysis of the areas surrounding to Jindal Vijayanagara Steel
Plant such as Vaddu, Toranagallu, Sulthanpur and Gaddiganur villages was carried out by the
Regional Office, KSPCB, Bellary. Ambient air quality data collected during the years 2004
to 2006 is given in table 10.8.
Table 10.8: Ambient air quality status of the surrounding area of JVSL Plant and
JSW Steels Ltd
Sl. No. Location Season RSPM SPM SO2 NOx
Year 2004 – 2005 Summer 49 158.5 10.2 10.3 Rainy 47.75 86.083 16 16
1 JVSL top of Sri. Panditaradhiya house, Vaddu village Winter 51.4 187.26 5.42 14
Year 2005 – 2006 Summer 41.75 135.5 BDL 10 Rainy 42.6 137.9
2 JVSL top of Sri. Panditaradhiya house, Vaddu village Winter 52.71 161.18 6 12
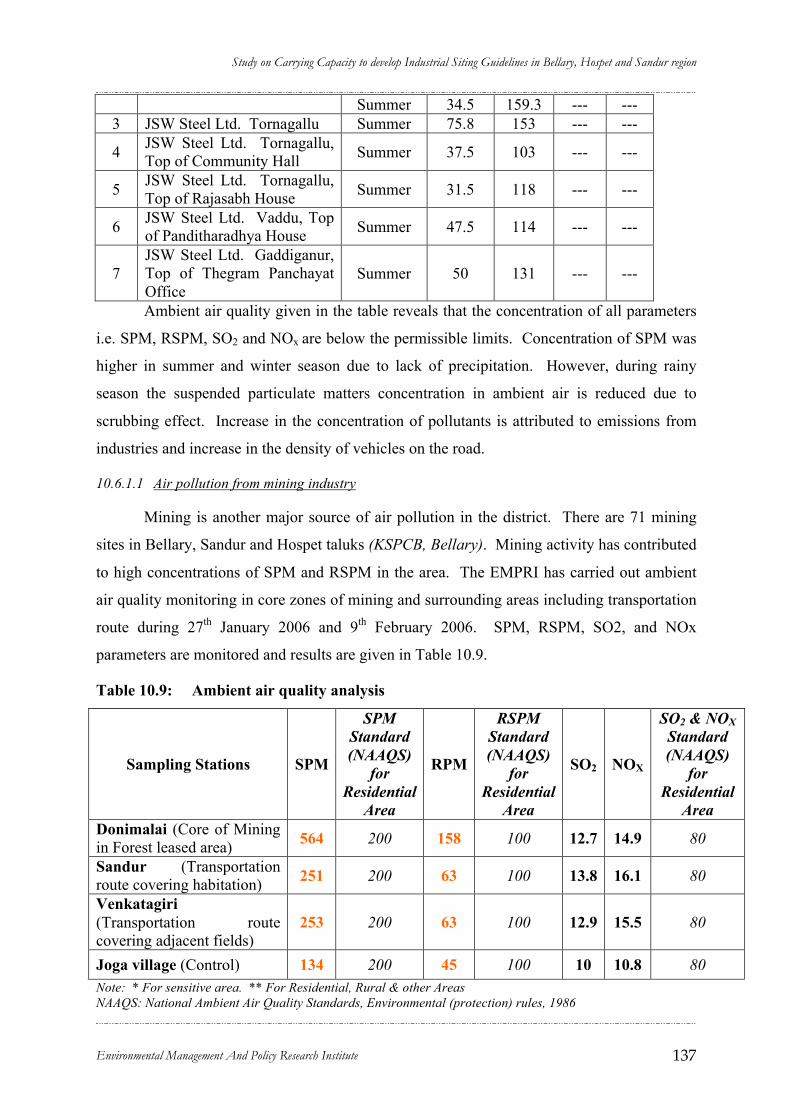
Study on Carrying Capacity to develop Industrial Siting Guidelines in Bellary, Hospet and Sandur region
Environmental Management And Policy Research Institute 137
Summer 34.5 159.3 --- --- 3 JSW Steel Ltd. Tornagallu Summer 75.8 153 --- ---
4 JSW Steel Ltd. Tornagallu, Top of Community Hall Summer 37.5 103 --- ---
5 JSW Steel Ltd. Tornagallu, Top of Rajasabh House Summer 31.5 118 --- ---
6 JSW Steel Ltd. Vaddu, Top of Panditharadhya House Summer 47.5 114 --- ---
7 JSW Steel Ltd. Gaddiganur, Top of Thegram Panchayat Office
Summer 50 131 --- ---
Ambient air quality given in the table reveals that the concentration of all parameters
i.e. SPM, RSPM, SO2 and NOx are below the permissible limits. Concentration of SPM was
higher in summer and winter season due to lack of precipitation. However, during rainy
season the suspended particulate matters concentration in ambient air is reduced due to
scrubbing effect. Increase in the concentration of pollutants is attributed to emissions from
industries and increase in the density of vehicles on the road.
10.6.1.1 Air pollution from mining industry
Mining is another major source of air pollution in the district. There are 71 mining
sites in Bellary, Sandur and Hospet taluks (KSPCB, Bellary). Mining activity has contributed
to high concentrations of SPM and RSPM in the area. The EMPRI has carried out ambient
air quality monitoring in core zones of mining and surrounding areas including transportation
route during 27th January 2006 and 9th February 2006. SPM, RSPM, SO2, and NOx
parameters are monitored and results are given in Table 10.9.
Table 10.9: Ambient air quality analysis
Sampling Stations SPM
SPM Standard (NAAQS)
for Residential
Area
RPM
RSPM Standard (NAAQS)
for Residential
Area
SO2 NOX
SO2 & NOX Standard (NAAQS)
for Residential
Area Donimalai (Core of Mining in Forest leased area) 564 200 158 100 12.7 14.9 80
Sandur (Transportation route covering habitation) 251 200 63 100 13.8 16.1 80
Venkatagiri (Transportation route covering adjacent fields)
253 200 63 100 12.9 15.5 80
Joga village (Control) 134 200 45 100 10 10.8 80 Note: * For sensitive area. ** For Residential, Rural & other Areas NAAQS: National Ambient Air Quality Standards, Environmental (protection) rules, 1986
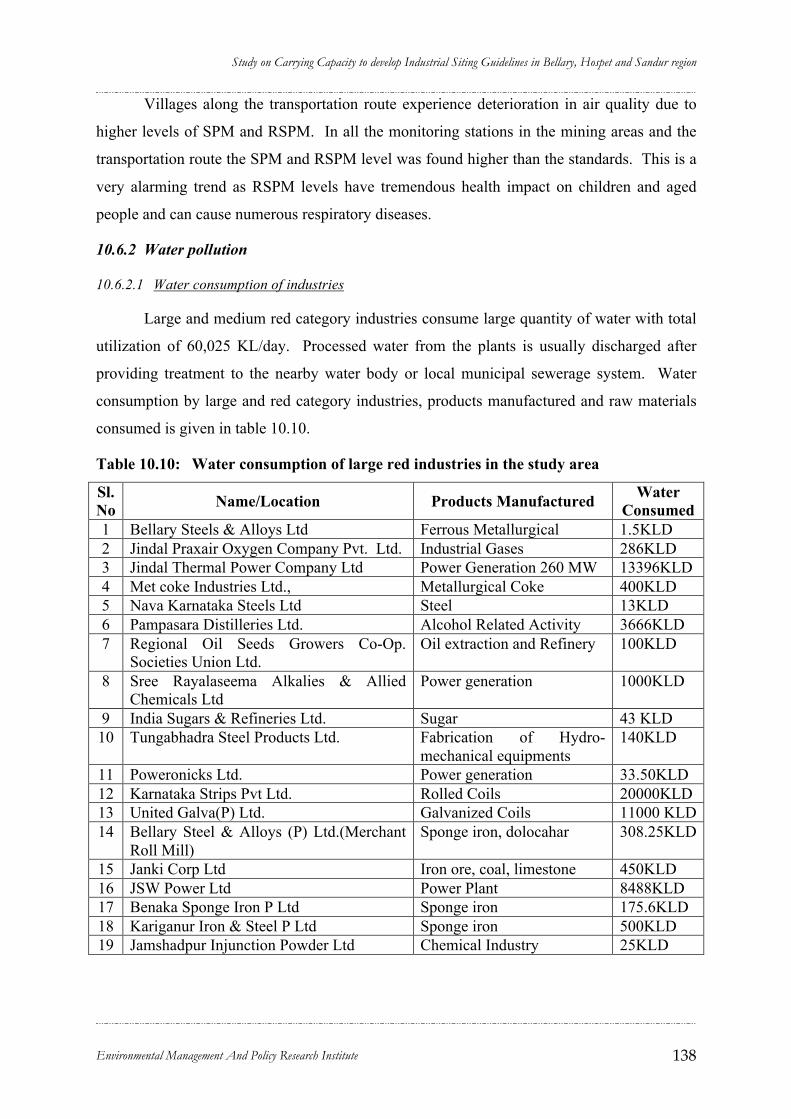
Study on Carrying Capacity to develop Industrial Siting Guidelines in Bellary, Hospet and Sandur region
Environmental Management And Policy Research Institute 138
Villages along the transportation route experience deterioration in air quality due to
higher levels of SPM and RSPM. In all the monitoring stations in the mining areas and the
transportation route the SPM and RSPM level was found higher than the standards. This is a
very alarming trend as RSPM levels have tremendous health impact on children and aged
people and can cause numerous respiratory diseases.
10.6.2 Water pollution
10.6.2.1 Water consumption of industries
Large and medium red category industries consume large quantity of water with total
utilization of 60,025 KL/day. Processed water from the plants is usually discharged after
providing treatment to the nearby water body or local municipal sewerage system. Water
consumption by large and red category industries, products manufactured and raw materials
consumed is given in table 10.10.
Table 10.10: Water consumption of large red industries in the study area
Sl. No Name/Location Products Manufactured Water
Consumed 1 Bellary Steels & Alloys Ltd Ferrous Metallurgical 1.5KLD 2 Jindal Praxair Oxygen Company Pvt. Ltd. Industrial Gases 286KLD 3 Jindal Thermal Power Company Ltd Power Generation 260 MW 13396KLD 4 Met coke Industries Ltd., Metallurgical Coke 400KLD 5 Nava Karnataka Steels Ltd Steel 13KLD 6 Pampasara Distilleries Ltd. Alcohol Related Activity 3666KLD 7 Regional Oil Seeds Growers Co-Op.
Societies Union Ltd. Oil extraction and Refinery 100KLD
8 Sree Rayalaseema Alkalies & Allied Chemicals Ltd
Power generation 1000KLD
9 India Sugars & Refineries Ltd. Sugar 43 KLD 10 Tungabhadra Steel Products Ltd. Fabrication of Hydro-
mechanical equipments 140KLD
11 Poweronicks Ltd. Power generation 33.50KLD 12 Karnataka Strips Pvt Ltd. Rolled Coils 20000KLD 13 United Galva(P) Ltd. Galvanized Coils 11000 KLD 14 Bellary Steel & Alloys (P) Ltd.(Merchant
Roll Mill) Sponge iron, dolocahar 308.25KLD
15 Janki Corp Ltd Iron ore, coal, limestone 450KLD 16 JSW Power Ltd Power Plant 8488KLD 17 Benaka Sponge Iron P Ltd Sponge iron 175.6KLD 18 Kariganur Iron & Steel P Ltd Sponge iron 500KLD 19 Jamshadpur Injunction Powder Ltd Chemical Industry 25KLD
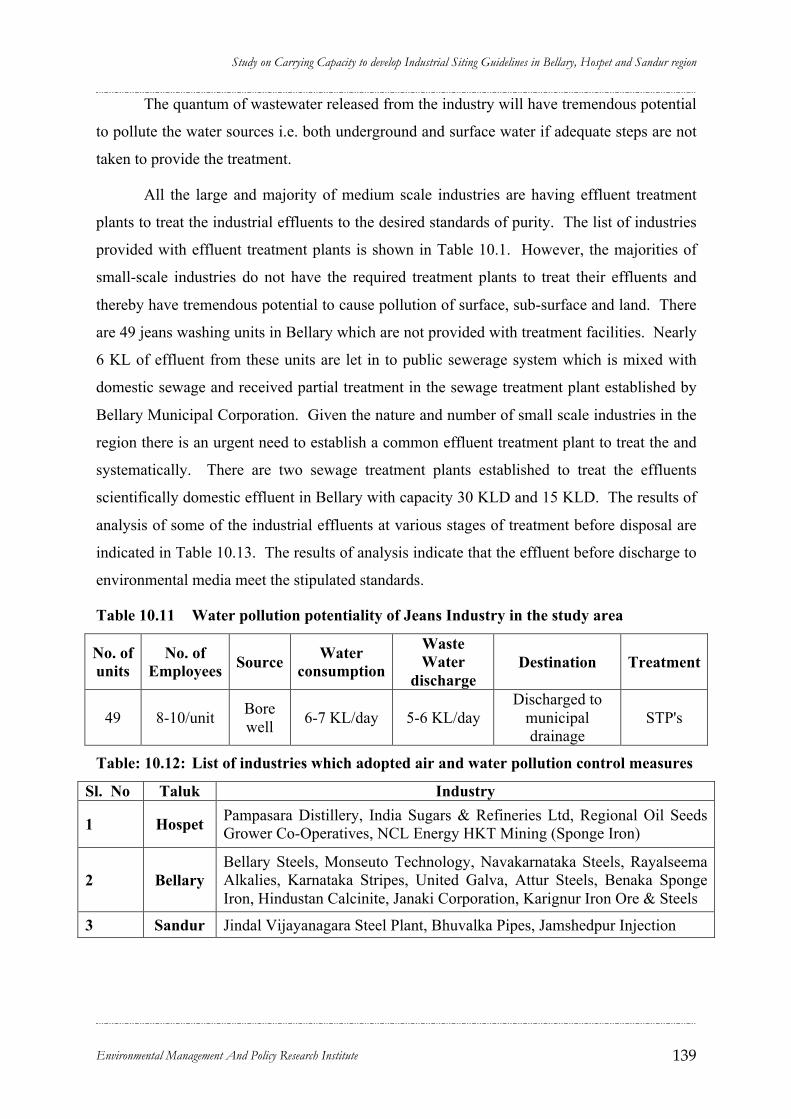
Study on Carrying Capacity to develop Industrial Siting Guidelines in Bellary, Hospet and Sandur region
Environmental Management And Policy Research Institute 139
The quantum of wastewater released from the industry will have tremendous potential
to pollute the water sources i.e. both underground and surface water if adequate steps are not
taken to provide the treatment.
All the large and majority of medium scale industries are having effluent treatment
plants to treat the industrial effluents to the desired standards of purity. The list of industries
provided with effluent treatment plants is shown in Table 10.1. However, the majorities of
small-scale industries do not have the required treatment plants to treat their effluents and
thereby have tremendous potential to cause pollution of surface, sub-surface and land. There
are 49 jeans washing units in Bellary which are not provided with treatment facilities. Nearly
6 KL of effluent from these units are let in to public sewerage system which is mixed with
domestic sewage and received partial treatment in the sewage treatment plant established by
Bellary Municipal Corporation. Given the nature and number of small scale industries in the
region there is an urgent need to establish a common effluent treatment plant to treat the and
systematically. There are two sewage treatment plants established to treat the effluents
scientifically domestic effluent in Bellary with capacity 30 KLD and 15 KLD. The results of
analysis of some of the industrial effluents at various stages of treatment before disposal are
indicated in Table 10.13. The results of analysis indicate that the effluent before discharge to
environmental media meet the stipulated standards.
Table 10.11 Water pollution potentiality of Jeans Industry in the study area
No. of units
No. of Employees Source Water
consumption
Waste Water
discharge Destination Treatment
49 8-10/unit Bore well 6-7 KL/day 5-6 KL/day
Discharged to municipal drainage
STP's
Table: 10.12: List of industries which adopted air and water pollution control measures
Sl. No Taluk Industry
1 Hospet Pampasara Distillery, India Sugars & Refineries Ltd, Regional Oil Seeds Grower Co-Operatives, NCL Energy HKT Mining (Sponge Iron)
2 Bellary Bellary Steels, Monseuto Technology, Navakarnataka Steels, Rayalseema Alkalies, Karnataka Stripes, United Galva, Attur Steels, Benaka Sponge Iron, Hindustan Calcinite, Janaki Corporation, Karignur Iron Ore & Steels
3 Sandur Jindal Vijayanagara Steel Plant, Bhuvalka Pipes, Jamshedpur Injection

Study on Carrying Capacity to develop Industrial Siting Guidelines in Bellary, Hospet and Sandur region
Environmental Management And Policy Research Institute 140
Table: 10.13: Results of the Industrial effluent of some major industries in the study area
Sl.No Industry Sample pH
Oil & grease mg/l
Conductivity Sulphates mg/l
Chlorides mg/l
TSS mg/l
COD mg/l
BOD mg/l
Outlet of PETP 8.8 0.4 13860 960 1586 1289 16552 3100 Outlet of SETP 8.9 trace 6895 296 800 158 1856 412 Dilution point-1 8.1 trace 1350 126 421 81 364 89
1 Pampasara distillery
Dilution point-2 8 trace 1315 92 385 70 345 71 Treated Effluent 8.6 1 998 221 773 88 24
2 India sugars & Refineries Industrial cooling water
outlet to Raya canal 7.1 1.2 524 68 96 45 4
Domestic effluent 42 11 3 JSW Steel Ltd.
JPL-2 DM plant effluent 4 2
4 Rayalseema
Alkalies & allied Chemicals
Effluent 8.7 3.6 1840 800 590 30 30
Inland surface water 5.5 to 9 10 100 250 30 Public sewers 5.5 to 9 20 600 --- 350
General Standards for discharge of
Environmental pollutants as per The Environment (protection) Rules, 1986
Land for Irrigation 5.5 to 9 10 200 --- 100
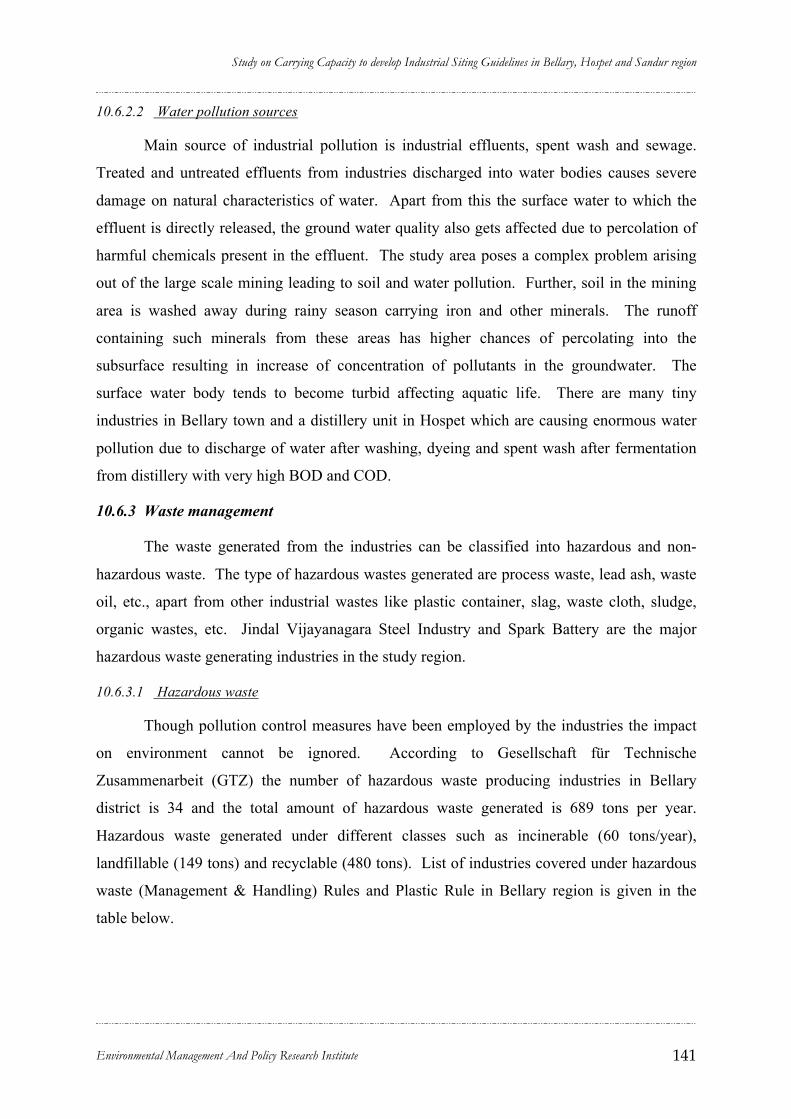
Study on Carrying Capacity to develop Industrial Siting Guidelines in Bellary, Hospet and Sandur region
Environmental Management And Policy Research Institute 141
10.6.2.2 Water pollution sources
Main source of industrial pollution is industrial effluents, spent wash and sewage.
Treated and untreated effluents from industries discharged into water bodies causes severe
damage on natural characteristics of water. Apart from this the surface water to which the
effluent is directly released, the ground water quality also gets affected due to percolation of
harmful chemicals present in the effluent. The study area poses a complex problem arising
out of the large scale mining leading to soil and water pollution. Further, soil in the mining
area is washed away during rainy season carrying iron and other minerals. The runoff
containing such minerals from these areas has higher chances of percolating into the
subsurface resulting in increase of concentration of pollutants in the groundwater. The
surface water body tends to become turbid affecting aquatic life. There are many tiny
industries in Bellary town and a distillery unit in Hospet which are causing enormous water
pollution due to discharge of water after washing, dyeing and spent wash after fermentation
from distillery with very high BOD and COD.
10.6.3 Waste management
The waste generated from the industries can be classified into hazardous and non-
hazardous waste. The type of hazardous wastes generated are process waste, lead ash, waste
oil, etc., apart from other industrial wastes like plastic container, slag, waste cloth, sludge,
organic wastes, etc. Jindal Vijayanagara Steel Industry and Spark Battery are the major
hazardous waste generating industries in the study region.
10.6.3.1 Hazardous waste
Though pollution control measures have been employed by the industries the impact
on environment cannot be ignored. According to Gesellschaft für Technische
Zusammenarbeit (GTZ) the number of hazardous waste producing industries in Bellary
district is 34 and the total amount of hazardous waste generated is 689 tons per year.
Hazardous waste generated under different classes such as incinerable (60 tons/year),
landfillable (149 tons) and recyclable (480 tons). List of industries covered under hazardous
waste (Management & Handling) Rules and Plastic Rule in Bellary region is given in the
table below.
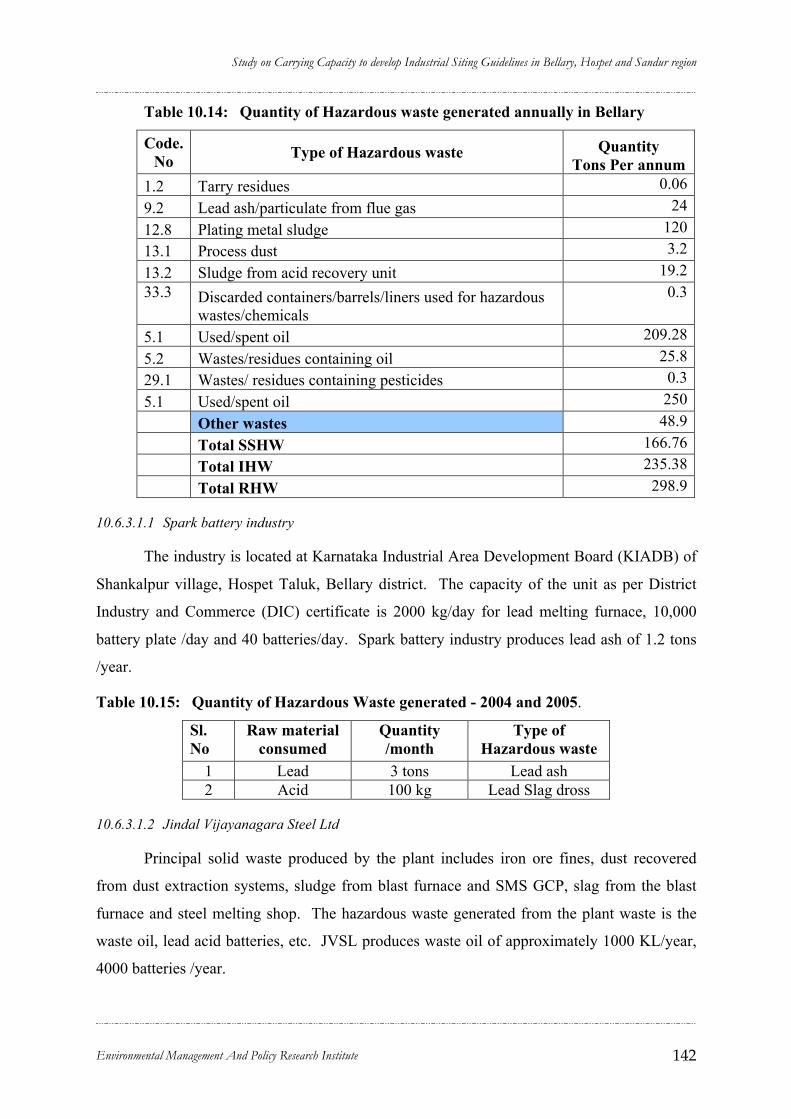
Study on Carrying Capacity to develop Industrial Siting Guidelines in Bellary, Hospet and Sandur region
Environmental Management And Policy Research Institute 142
Table 10.14: Quantity of Hazardous waste generated annually in Bellary
Code. No Type of Hazardous waste Quantity
Tons Per annum 1.2 Tarry residues 0.06 9.2 Lead ash/particulate from flue gas 24 12.8 Plating metal sludge 120 13.1 Process dust 3.2 13.2 Sludge from acid recovery unit 19.2 33.3 Discarded containers/barrels/liners used for hazardous
wastes/chemicals 0.3
5.1 Used/spent oil 209.28 5.2 Wastes/residues containing oil 25.8 29.1 Wastes/ residues containing pesticides 0.3 5.1 Used/spent oil 250 Other wastes 48.9 Total SSHW 166.76 Total IHW 235.38 Total RHW 298.9
10.6.3.1.1 Spark battery industry
The industry is located at Karnataka Industrial Area Development Board (KIADB) of
Shankalpur village, Hospet Taluk, Bellary district. The capacity of the unit as per District
Industry and Commerce (DIC) certificate is 2000 kg/day for lead melting furnace, 10,000
battery plate /day and 40 batteries/day. Spark battery industry produces lead ash of 1.2 tons
/year.
Table 10.15: Quantity of Hazardous Waste generated - 2004 and 2005.
Sl. No
Raw material consumed
Quantity /month
Type of Hazardous waste
1 Lead 3 tons Lead ash 2 Acid 100 kg Lead Slag dross
10.6.3.1.2 Jindal Vijayanagara Steel Ltd
Principal solid waste produced by the plant includes iron ore fines, dust recovered
from dust extraction systems, sludge from blast furnace and SMS GCP, slag from the blast
furnace and steel melting shop. The hazardous waste generated from the plant waste is the
waste oil, lead acid batteries, etc. JVSL produces waste oil of approximately 1000 KL/year,
4000 batteries /year.
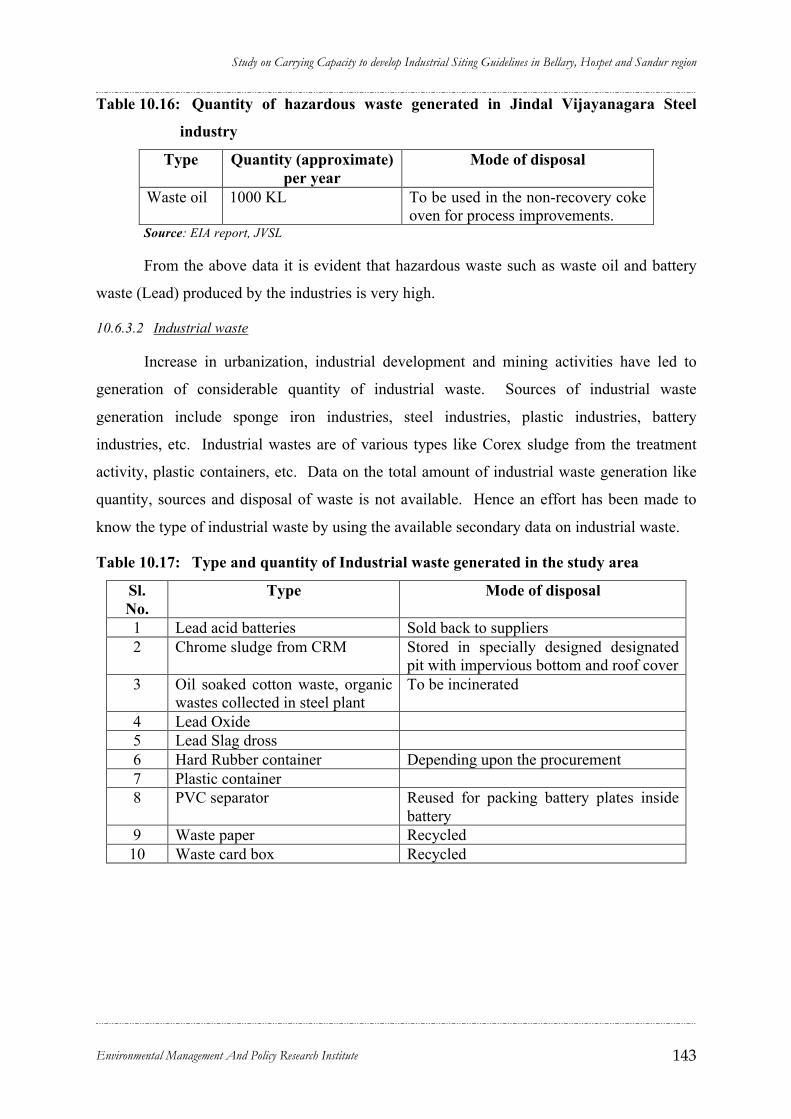
Study on Carrying Capacity to develop Industrial Siting Guidelines in Bellary, Hospet and Sandur region
Environmental Management And Policy Research Institute 143
Table 10.16: Quantity of hazardous waste generated in Jindal Vijayanagara Steel
industry
Type Quantity (approximate) per year
Mode of disposal
Waste oil 1000 KL To be used in the non-recovery coke oven for process improvements.
Source: EIA report, JVSL
From the above data it is evident that hazardous waste such as waste oil and battery
waste (Lead) produced by the industries is very high.
10.6.3.2 Industrial waste
Increase in urbanization, industrial development and mining activities have led to
generation of considerable quantity of industrial waste. Sources of industrial waste
generation include sponge iron industries, steel industries, plastic industries, battery
industries, etc. Industrial wastes are of various types like Corex sludge from the treatment
activity, plastic containers, etc. Data on the total amount of industrial waste generation like
quantity, sources and disposal of waste is not available. Hence an effort has been made to
know the type of industrial waste by using the available secondary data on industrial waste.
Table 10.17: Type and quantity of Industrial waste generated in the study area
Sl. No.
Type Mode of disposal
1 Lead acid batteries Sold back to suppliers 2 Chrome sludge from CRM Stored in specially designed designated
pit with impervious bottom and roof cover 3 Oil soaked cotton waste, organic
wastes collected in steel plant To be incinerated
4 Lead Oxide 5 Lead Slag dross 6 Hard Rubber container Depending upon the procurement 7 Plastic container 8 PVC separator Reused for packing battery plates inside
battery 9 Waste paper Recycled 10 Waste card box Recycled

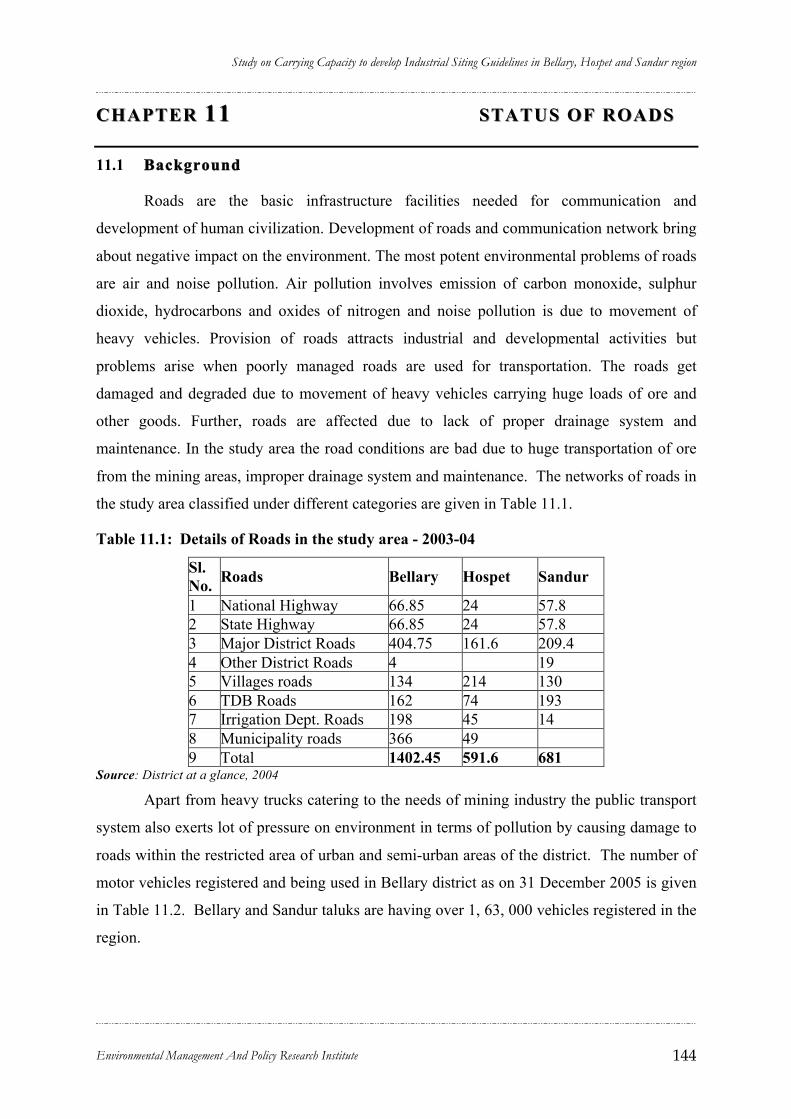
Study on Carrying Capacity to develop Industrial Siting Guidelines in Bellary, Hospet and Sandur region
Environmental Management And Policy Research Institute 144
CHAPTER CHAPTER 1111 STATUS OF ROADSSTATUS OF ROADS
11.1 Background
Roads are the basic infrastructure facilities needed for communication and
development of human civilization. Development of roads and communication network bring
about negative impact on the environment. The most potent environmental problems of roads
are air and noise pollution. Air pollution involves emission of carbon monoxide, sulphur
dioxide, hydrocarbons and oxides of nitrogen and noise pollution is due to movement of
heavy vehicles. Provision of roads attracts industrial and developmental activities but
problems arise when poorly managed roads are used for transportation. The roads get
damaged and degraded due to movement of heavy vehicles carrying huge loads of ore and
other goods. Further, roads are affected due to lack of proper drainage system and
maintenance. In the study area the road conditions are bad due to huge transportation of ore
from the mining areas, improper drainage system and maintenance. The networks of roads in
the study area classified under different categories are given in Table 11.1.
Table 11.1: Details of Roads in the study area - 2003-04
Sl. No. Roads Bellary Hospet Sandur
1 National Highway 66.85 24 57.8 2 State Highway 66.85 24 57.8 3 Major District Roads 404.75 161.6 209.4 4 Other District Roads 4 19 5 Villages roads 134 214 130 6 TDB Roads 162 74 193 7 Irrigation Dept. Roads 198 45 14 8 Municipality roads 366 49 9 Total 1402.45 591.6 681
Source: District at a glance, 2004
Apart from heavy trucks catering to the needs of mining industry the public transport
system also exerts lot of pressure on environment in terms of pollution by causing damage to
roads within the restricted area of urban and semi-urban areas of the district. The number of
motor vehicles registered and being used in Bellary district as on 31 December 2005 is given
in Table 11.2. Bellary and Sandur taluks are having over 1, 63, 000 vehicles registered in the
region.

Study on Carrying Capacity to develop Industrial Siting Guidelines in Bellary, Hospet and Sandur region
Environmental Management And Policy Research Institute 145
Figure 11.1: NH 63 Hospet-Bellary road damaged by ore transportation
Table 11.2: Motor vehicles registered in Bellary District (As on 31-12- 2005)
Sl. No. Category of vehicles Bellary Hospet Total 1 Motor Cycle upto 50 CC 26329 16803 43132 2 Motor Cycle 51-300 CC 43645 34052 79697 3 Motor Cycle above 300 CC 797 549 1346 Two Wheelers 72771 51404 124175 4 Motor Car 3839 3246 7085 5 Invalid Carriage 5 6 11 6 Jeeps 888 489 1377 7 Autorickshaws 2336 1087 3423 8 Motor cab 246 324 570 9 Omni Bus 529 596 1125 11 Stage Carriage 1010 65 1075 12 Private Bus 91 20 111 13 Goods Vehicle 2888 2902 5790 15 Tractor 4318 4191 8509 16 Trailor 3019 3362 6381 17 Dumpers 4 24 28 19 Road Rollers 0 1282 1282 20 Tippers 837 0 837 21 Power Tiller 23 17 40 23 Fire Engine 8 0 8 24 Delivary Van 600 2 602 25 Ambulance 48 256 304 26 Fire Fighter 1 32 33 27 Tanker 52 4 56 28 Maxi Cabs 145 441 586 29 Others 160 420 580 Total 93818 70170 163988
Source: Transport Department Bellary District
During the field survey following roads were found to be in bad conditions:
1. Kudalgi – Sandur road, 2. Sandur-Donimalai 3. Donimalai – Deogiri 4. Hospet-Bellary 5. Sandur-Hospet 6. Bhujanganagar-Sandur via Lakshmipur 7. Sandur- Torangallu

Study on Carrying Capacity to develop Industrial Siting Guidelines in Bellary, Hospet and Sandur region
Environmental Management And Policy Research Institute 146
Figure 11.2: Hospet-Sandur road damaged by ore transportation.
Figure 11.3: Concrete road damaged by ore transportation, Sandur town
The ore from different mining areas is
transported to railway stations located at
Hospet, Kariganur, Papinayakanahalli,
Torangallu, Yeshwanthnagara, Ramgadh,
Bannihatti, Bellary, Rajapura, Ranjitpura,
Bayaluvaddigeri Vynsankere, Swamimalai and
Jindal Vijayanagar by road.
11.2 Impact on roads:
1. Due to transportation of ore by using
heavy vehicles there is emission and
smoke which gets mixed up with air to form the suspended particulate matter.
2. It is confirmed from the studies that carbon monoxide concentration in the air could
result in hazardous effect on human health particularly in heart and lung patients.
3. Oxides of nitrogen and hydrocarbons are not directly toxic but interact in the presence
of sunlight to produce the oxidant smog, which causes irritation of eyes and damage
to lungs.
The transportation of ore from steep
slopes to the railway station and to the ports
through heavy vehicles has resulted in causing
severe damage to roads (Figure 11.1, 11.2 &
11.3). Continuous movement of heavy vehicles
has caused irreparable damage to the roads.
One of the immediate and visible impacts of
iron and manganese ore transportation is
formation of huge pot holes, thus making
movement of passenger vehicles, light motor
vehicles and two wheelers very difficult.
Annually around 30 million tons of ore is being transported through these roads. As the
roads were not made to take such heavy loads through vehicular movement the roads have
sustained severe damage and they have been made unworthy to travel.

Study on Carrying Capacity to develop Industrial Siting Guidelines in Bellary, Hospet and Sandur region
Environmental Management And Policy Research Institute 147
Figure 11.4: Open transportation of iron ore fines
Figure 11.5: Dust pollution caused by ore transportation
Figure 11.6: Wetting of road in Subbarayanahalli, Sandur
11.2.1 Dust Level on the road sides
The heavy vehicles involved in the transportation of iron ore without tarpaulin cover
is generating vast amount of dust all along the roads affecting the quality of air. The air
quality test conducted on the samples collected from different roads have shown high level
of SPM. Break down of heavy vehicles carrying iron ore to distant places is very common
resulting in heaps of iron ore dumped along the road side causing disruption of vehicular
movement. Sprinkling of water to reduce the dust and pollution of air creates muddy heaps on
the roads hampering the movement of vehicles.

Study on Carrying Capacity to develop Industrial Siting Guidelines in Bellary, Hospet and Sandur region
Environmental Management And Policy Research Institute 148
Figure 11.7: Chain of vehicles queued up for loading iron ore
11.2.2 Density of vehicles
Heavy traffic movement on the narrow
roads of Sandur, Bellary and Hospet has caused
severe damage to roads during the last five years.
Round the clock movement of heavy vehicles
carrying heavy loads of iron ore has become a
major problem in the study area. Increase in the
density of vehicles during the last five years in
Sandur, Bellary and Hospet region was studied to
illustrate the growth of vehicular movement in the
region.
11.2.3 Impact of heavy vehicle movement on the roads:
• During field survey in the study region it was observed that heavy vehicles moving on the
narrow roads have caused heavy damage to the roads. The size and depth of pot holes are
increasing day by day varying from 0.5 m2 to 5.0 m2. The pot holes keep expanding due
to continuous movement of iron ore laden vehicles.
• Break down of vehicles in transit also leaves heaps of mineral ore along the road causing
hindrance to traffic. During rainy season the roads are muddy and slippery due to spillage
of mineral ore.
• On an average about 6,000 heavy duty vehicles are transporting iron ore everyday causing
high SPM and RSPM all along the roads particularly, from Sandur, Hospet and Bellary to
different destinations like Toranagal, Mangalore and Karwar ports.
• Deposition of dust along the road side causes harmful effect on road side vegetation.
• Agriculture and horticulture crops along the roads are also affected by dust pollution.

Study on Carrying Capacity to develop Industrial Siting Guidelines in Bellary, Hospet and Sandur region
Environmental Management And Policy Research Institute 149
Table 11.3: Implication of bad roads on environment
Parameter Environmental Implications Associated social Impacts Deterioration of riding quality
Increased noise pollution (increased friction between tyre and the road resulting in higher noise levels
Psychological Stress Impairment of speech communication visuality and health problems
Increased Fuel consumption
Air pollution (partially-burnt hydrocarbons and other pollutants being released into air)
Health problems (respiratory diseases due to increased air pollution and accumulation of lead in food chain
Social Implications Associated Environmental Implications
Increased transportation and travel times
Reduction in mobility of labours resulting in permanent migration to urban areas Reduced access to education health, social and civic facilities Restricted potential of agriculture, diary and poultry sectors
Increased population pressures, straining of civil infrastructure and deterioration of environmental quality of urban areas Increased pressure on local environmental resource and their exploitation beyond sustainable limits under subsistence pressures
Increased vehicle operating costs
Increased input cost and decreased of competitiveness of local economy
On the whole the impact of vehicular movement on the roads of study area is serious
as it is causing damage to surface and drainage pattern of roads resulting in non-usable
condition. Thus, roads as vehicles of development of economy, if not maintained properly
can counter the objective for which they were built. In addition to negative implications on
social and economic issues the roads have brought about negative effect on environmental
issues due to enhanced air pollution and noise pollution levels. Hence roads are to be
maintained and free flow of vehicles could contribute directly to enhanced economic gains
apart from enhanced environmental effects.
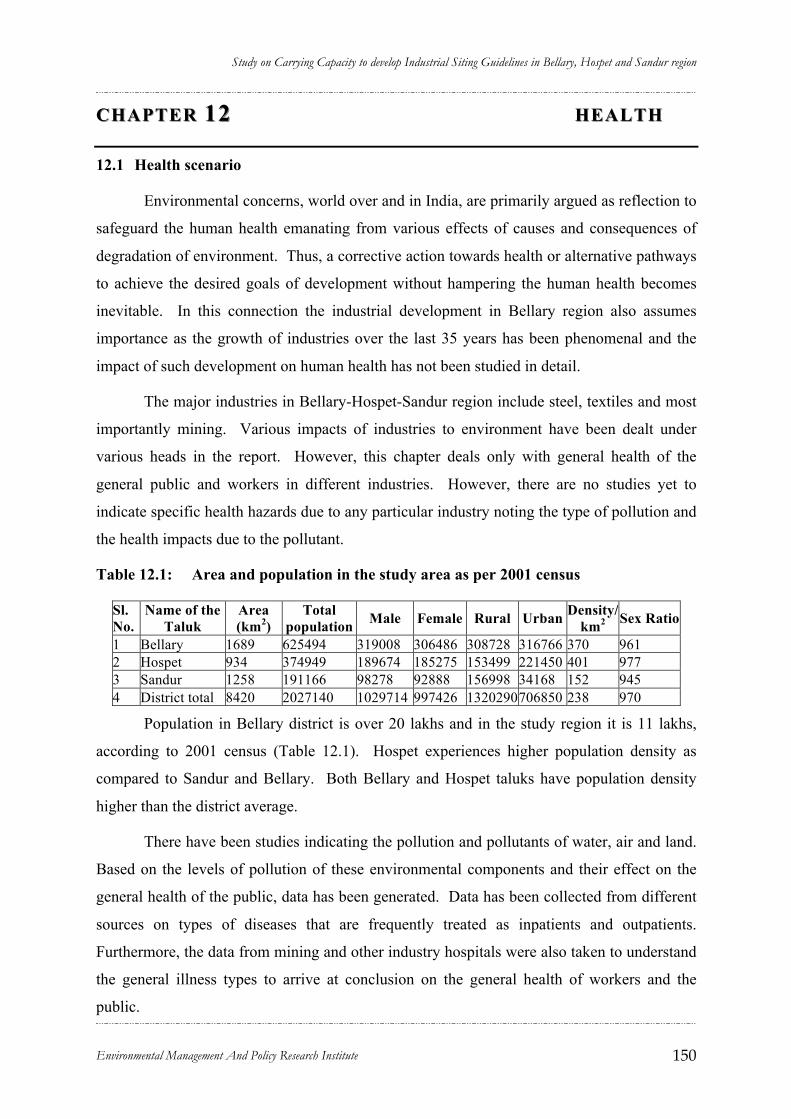
Study on Carrying Capacity to develop Industrial Siting Guidelines in Bellary, Hospet and Sandur region
Environmental Management And Policy Research Institute 150
CHAPTER CHAPTER 1212 HEALTHHEALTH
12.1 Health scenario
Environmental concerns, world over and in India, are primarily argued as reflection to
safeguard the human health emanating from various effects of causes and consequences of
degradation of environment. Thus, a corrective action towards health or alternative pathways
to achieve the desired goals of development without hampering the human health becomes
inevitable. In this connection the industrial development in Bellary region also assumes
importance as the growth of industries over the last 35 years has been phenomenal and the
impact of such development on human health has not been studied in detail.
The major industries in Bellary-Hospet-Sandur region include steel, textiles and most
importantly mining. Various impacts of industries to environment have been dealt under
various heads in the report. However, this chapter deals only with general health of the
general public and workers in different industries. However, there are no studies yet to
indicate specific health hazards due to any particular industry noting the type of pollution and
the health impacts due to the pollutant.
Table 12.1: Area and population in the study area as per 2001 census
Sl. No.
Name of the Taluk
Area (km2)
Total population Male Female Rural Urban Density/
km2 Sex Ratio
1 Bellary 1689 625494 319008 306486 308728 316766 370 961 2 Hospet 934 374949 189674 185275 153499 221450 401 977 3 Sandur 1258 191166 98278 92888 156998 34168 152 945 4 District total 8420 2027140 1029714 997426 1320290 706850 238 970
Population in Bellary district is over 20 lakhs and in the study region it is 11 lakhs,
according to 2001 census (Table 12.1). Hospet experiences higher population density as
compared to Sandur and Bellary. Both Bellary and Hospet taluks have population density
higher than the district average.
There have been studies indicating the pollution and pollutants of water, air and land.
Based on the levels of pollution of these environmental components and their effect on the
general health of the public, data has been generated. Data has been collected from different
sources on types of diseases that are frequently treated as inpatients and outpatients.
Furthermore, the data from mining and other industry hospitals were also taken to understand
the general illness types to arrive at conclusion on the general health of workers and the
public.
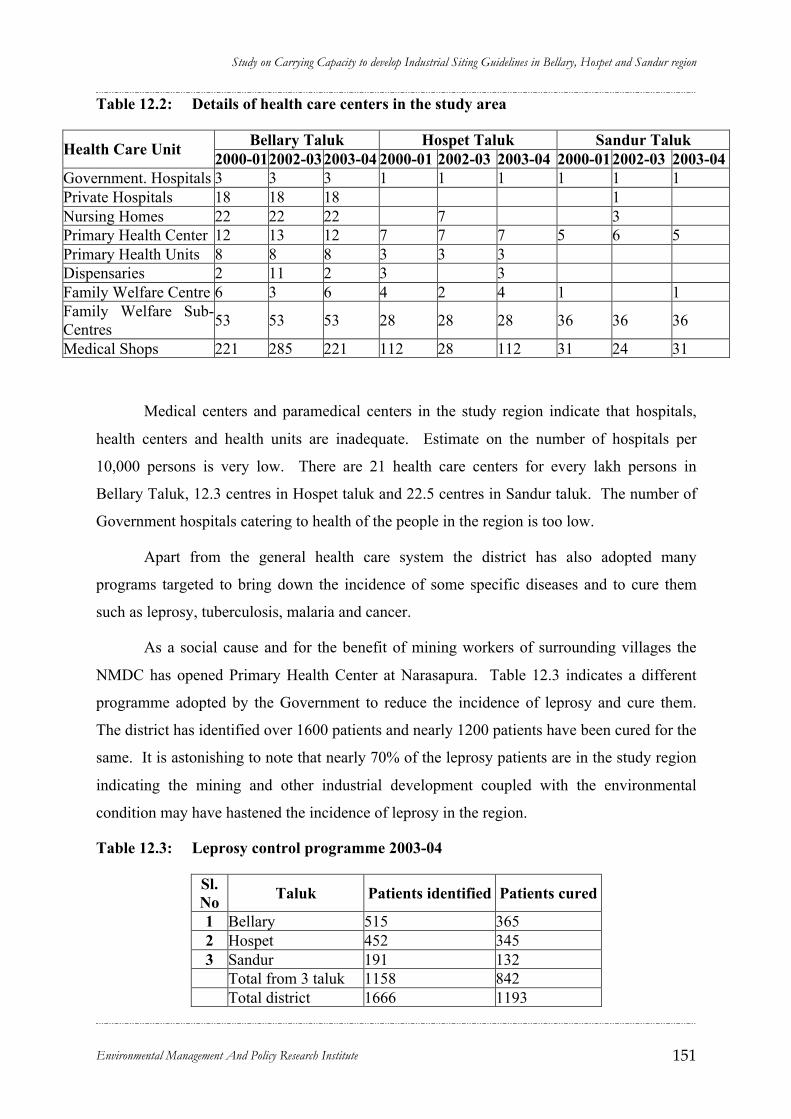
Study on Carrying Capacity to develop Industrial Siting Guidelines in Bellary, Hospet and Sandur region
Environmental Management And Policy Research Institute 151
Table 12.2: Details of health care centers in the study area
Bellary Taluk Hospet Taluk Sandur Taluk Health Care Unit 2000-01 2002-03 2003-04 2000-01 2002-03 2003-04 2000-01 2002-03 2003-04 Government. Hospitals 3 3 3 1 1 1 1 1 1 Private Hospitals 18 18 18 1 Nursing Homes 22 22 22 7 3 Primary Health Center 12 13 12 7 7 7 5 6 5 Primary Health Units 8 8 8 3 3 3 Dispensaries 2 11 2 3 3 Family Welfare Centre 6 3 6 4 2 4 1 1 Family Welfare Sub-Centres 53 53 53 28 28 28 36 36 36
Medical Shops 221 285 221 112 28 112 31 24 31
Medical centers and paramedical centers in the study region indicate that hospitals,
health centers and health units are inadequate. Estimate on the number of hospitals per
10,000 persons is very low. There are 21 health care centers for every lakh persons in
Bellary Taluk, 12.3 centres in Hospet taluk and 22.5 centres in Sandur taluk. The number of
Government hospitals catering to health of the people in the region is too low.
Apart from the general health care system the district has also adopted many
programs targeted to bring down the incidence of some specific diseases and to cure them
such as leprosy, tuberculosis, malaria and cancer.
As a social cause and for the benefit of mining workers of surrounding villages the
NMDC has opened Primary Health Center at Narasapura. Table 12.3 indicates a different
programme adopted by the Government to reduce the incidence of leprosy and cure them.
The district has identified over 1600 patients and nearly 1200 patients have been cured for the
same. It is astonishing to note that nearly 70% of the leprosy patients are in the study region
indicating the mining and other industrial development coupled with the environmental
condition may have hastened the incidence of leprosy in the region.
Table 12.3: Leprosy control programme 2003-04
Sl. No Taluk Patients identified Patients cured
1 Bellary 515 365 2 Hospet 452 345 3 Sandur 191 132
Total from 3 taluk 1158 842 Total district 1666 1193
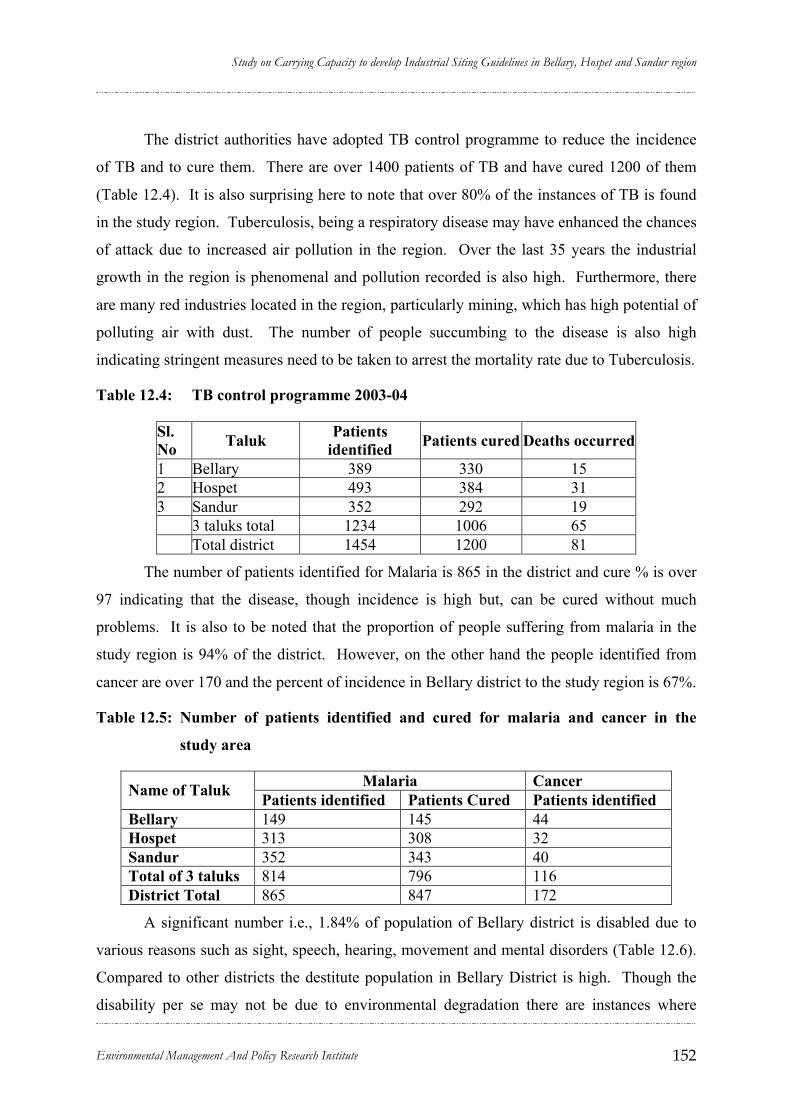
Study on Carrying Capacity to develop Industrial Siting Guidelines in Bellary, Hospet and Sandur region
Environmental Management And Policy Research Institute 152
The district authorities have adopted TB control programme to reduce the incidence
of TB and to cure them. There are over 1400 patients of TB and have cured 1200 of them
(Table 12.4). It is also surprising here to note that over 80% of the instances of TB is found
in the study region. Tuberculosis, being a respiratory disease may have enhanced the chances
of attack due to increased air pollution in the region. Over the last 35 years the industrial
growth in the region is phenomenal and pollution recorded is also high. Furthermore, there
are many red industries located in the region, particularly mining, which has high potential of
polluting air with dust. The number of people succumbing to the disease is also high
indicating stringent measures need to be taken to arrest the mortality rate due to Tuberculosis.
Table 12.4: TB control programme 2003-04
Sl. No Taluk Patients
identified Patients cured Deaths occurred
1 Bellary 389 330 15 2 Hospet 493 384 31 3 Sandur 352 292 19 3 taluks total 1234 1006 65 Total district 1454 1200 81
The number of patients identified for Malaria is 865 in the district and cure % is over
97 indicating that the disease, though incidence is high but, can be cured without much
problems. It is also to be noted that the proportion of people suffering from malaria in the
study region is 94% of the district. However, on the other hand the people identified from
cancer are over 170 and the percent of incidence in Bellary district to the study region is 67%.
Table 12.5: Number of patients identified and cured for malaria and cancer in the
study area
Malaria Cancer Name of Taluk Patients identified Patients Cured Patients identified Bellary 149 145 44 Hospet 313 308 32 Sandur 352 343 40 Total of 3 taluks 814 796 116 District Total 865 847 172
A significant number i.e., 1.84% of population of Bellary district is disabled due to
various reasons such as sight, speech, hearing, movement and mental disorders (Table 12.6).
Compared to other districts the destitute population in Bellary District is high. Though the
disability per se may not be due to environmental degradation there are instances where

Study on Carrying Capacity to develop Industrial Siting Guidelines in Bellary, Hospet and Sandur region
Environmental Management And Policy Research Institute 153
consumption of contaminated water or air could lead to disabilities. For instances,
consumption of water pesticide residues could lead to bone deformities rendering the people
to keep indoors. Measures to rehabilitate the people with these deformities should be done as
a top priority as they would be the worst sufferers of environmental degradation in the region.
Table 12.6: People with disability in rural and urban regions of Bellary District.
Types of Disability Total Rural Urban % of total population
In Seeing 18,127 11,041 7,086 0.89 In Speech 3,407 2,238 1,169 0.17 In Hearing 1,595 1,162 433 0.08 In Movement 10,943 7,992 2,951 0.54 Mental 3,198 1,963 1,235 0.16 Total disabled population 37,270 24,396 12,874 1.84
Table 12.7: Incidence of leprosy and tuberculosis in the study region and in Bellary
district
Leprosy Tuberculosis Particulars Identified Cured Identified Cured Dead Study Region 1158 842 1234 1066 85 Incidence/ lakh population 97.18 70.66 103.56 89.45 7.13 District 1666 1193 1454 1200 81 Incidence/ lakh population 82.16 58.85 71.72 59.2 3.99
From the overall analysis it can be inferred that larger proportion of incidence of
major diseases such as leprosy and tuberculosis is occurring in the study region (Table 12.7).
This high incidence of diseases which are endemic in nature may be because of pollution
occurring at various levels and from various environmental components. Considering the
number of hospitals available and the facilities available it is also noted that conditions
available to people for healthcare system is very poor and therefore enough initiatives are
essential to step up the health care needs of the people. It is also noted that some of the
hospitals catering to the needs of the workers of the industry may be getting enough care but,
the people at large who are not industry workers also get affected due to industrial pollution.
There are no health insurance schemes of health support facility available for the general
public.

Study on Carrying Capacity to develop Industrial Siting Guidelines in Bellary, Hospet and Sandur region
Environmental Management And Policy Research Institute 154
12.2 Preventive safety and health measures
Safety and health issues in mining arise due to usage of mining machinery and
explosives. Equipments used for mining include machinery like blasting equipments,
continuous miners, belt conveyors, scoops, shuttle cars, locomotives and utility vehicles.
Many a time accidents happen due to the following engineering faults:
• Poor original design or redesign • Control-display layout • Inadequate ingress/egress design • Exposed wiring and hot surfaces • Exposed sharp surfaces or pinch points • Unguarded moving parts and • Restricted visibility
A continuous need exists to reduce equipment hazards, improve component and
system reliabilities, and minimize the occurrence of unplanned catastrophic accidents. The
potential for health and safety risks introduced by new technologies must be addressed
proactively especially by understanding the system requirements and specifications and to
address human interface issues involving the operation, maintenance and repair of
equipments as well as computerized control of equipments
Equipment design and maintainability using proper programmable electronic systems
and giving emphasis on ergonomics should be followed. Emergency management and
hazardous material management especially explosives should be given high priority. Hazards
for the workers include contact with electric current, diesel exhaust, dusts, emotional stress,
explosives and noise. Various diseases like musculoskeletal diseases, respiratory diseases,
injuries, and disorders like hearing loss are very common in mining sector. Further, accidents
and emergencies arising due to explosions, fires and rock falls
Table 12.8: Some proposed safety and health issues
Sl. No
Mining Activities
Present Safety and Health Scenario
Proposed Safety and Health Scenario
1 Excavation of Ore
Both manual and machinery used lead to very high dust levels
Proper masks for the mine workers to be made compulsory
2 Use of explosives
Safety of explosives in storage, transportation, and use not upto the mark
Stringent application of the Explosive Act and Rules necessary. Though the rules are being followed in the mine area, adjacent villages are not being warned about leading to damage to property in the villages and increased danger to life
3 Transport of mined ore
Transport of fines leading to dust. Majority of transport occurring through roads
Change over the rail would decreased dust induced diseases in the towns and villages
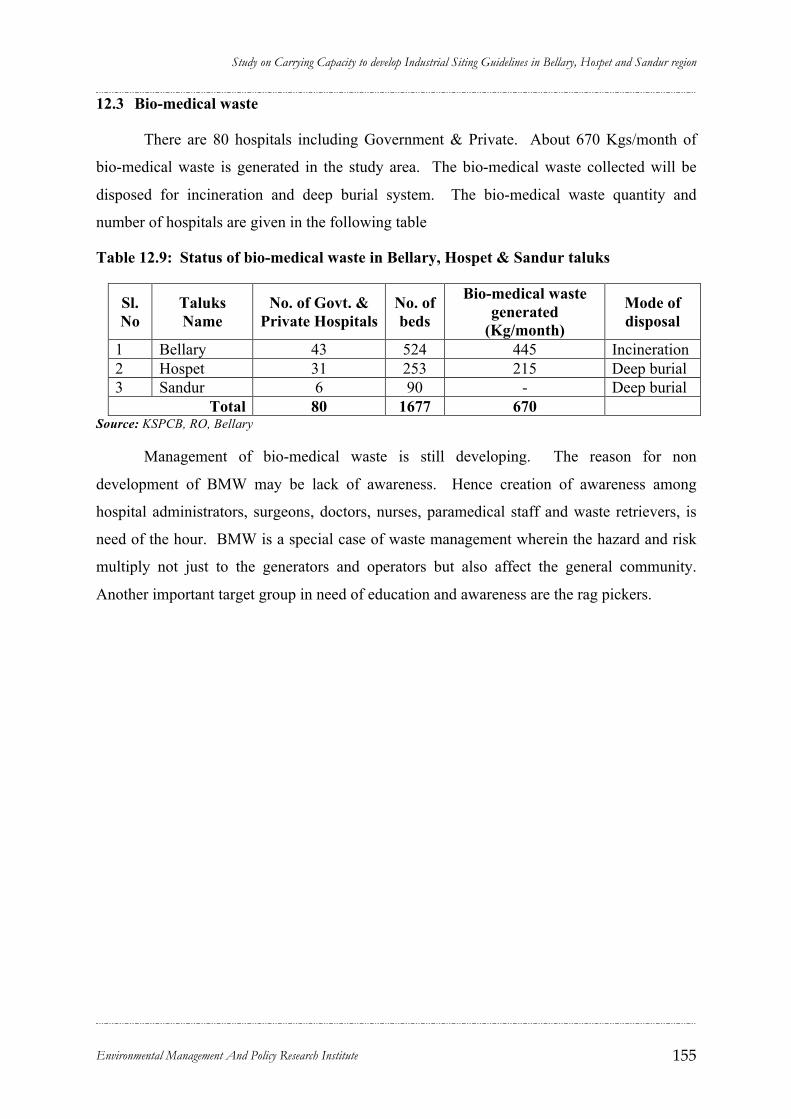
Study on Carrying Capacity to develop Industrial Siting Guidelines in Bellary, Hospet and Sandur region
Environmental Management And Policy Research Institute 155
12.3 Bio-medical waste
There are 80 hospitals including Government & Private. About 670 Kgs/month of
bio-medical waste is generated in the study area. The bio-medical waste collected will be
disposed for incineration and deep burial system. The bio-medical waste quantity and
number of hospitals are given in the following table
Table 12.9: Status of bio-medical waste in Bellary, Hospet & Sandur taluks
Sl. No
Taluks Name
No. of Govt. & Private Hospitals
No. of beds
Bio-medical waste generated
(Kg/month)
Mode of disposal
1 Bellary 43 524 445 Incineration 2 Hospet 31 253 215 Deep burial 3 Sandur 6 90 - Deep burial
Total 80 1677 670 Source: KSPCB, RO, Bellary
Management of bio-medical waste is still developing. The reason for non
development of BMW may be lack of awareness. Hence creation of awareness among
hospital administrators, surgeons, doctors, nurses, paramedical staff and waste retrievers, is
need of the hour. BMW is a special case of waste management wherein the hazard and risk
multiply not just to the generators and operators but also affect the general community.
Another important target group in need of education and awareness are the rag pickers.

Study on Carrying Capacity to develop Industrial Siting Guidelines in Bellary, Hospet and Sandur region
Environmental Management And Policy Research Institute 156
CHAPTER CHAPTER 1313 ENVIRONMENTAL IMPACTENVIRONMENTAL IMPACT ANALYSIS AND ENVIRONANALYSIS AND ENVIRON MENTAL MANAGEMENT PLMENTAL MANAGEMENT PL ANAN
A detailed understanding of the project area was carried out along with the
identification of environmental issues with respect to various natural resources, social issues
like quality of life, and livelihood activities like mining and agriculture and their impacts on
the surrounding environment and vice versa. Various kinds of emission were monitored and
simultaneously mass balancing of natural resource like water was carried out. Based on
various primary and secondary data analysis and the observations made during field visits a
detailed listing of environmental issues were arrived at and subsequently environmental
mitigation steps have been proposed in the following table.

Study on Carrying Capacity to develop Industrial Siting Guidelines in Bellary, Hospet and Sandur region
Environmental Management And Policy Research Institute 157
Table 13.1: Environmental Impact and Mitigation Options
Indicators Environmental Component
Problems Impacts Parameter Present Future
Mitigation Options
Ambient Air Quality
SPM (ug/m3) 563 <200
RSPM (ug/m3) 158 <100
SO2 (ug/m3) 12.35 <80 NOx (ug/m3) 14.33 <80
Indoor air quality SPM (ug/m3) 128 <140
RSPM (ug/m3) 60 <60
SO2 (ug/m3)
12.35 <60
Air 1. Ambient air Causes mining activity, industrial activity, dumping mine waste Transport of ore 2. Indoor Air Causes: Use of firewood and kerosene for cooking and other domestic purposes.
Mining activity, processing of ore and transport of ore from mining area to railheads on poor quality roads Burning firewood, Kerosene for cooking and other domestic purposes.
Health problems such as asthma, TB, bronchitis Drastic changes in cropping pattern Reduction of agricultural productivity Impact on wildlife. Health problems such as TB, Bronchitis etc. Continuous inhalation of CO and CO2 leads to health problems such as Asthama, Bronchitis and other respiratory diseases.
NOx (ug/m3) 14.33 <60
1. Regulation of mining activity which is causing erosion of habitable environment. 2. Adoption of sustainable mining practices. 3. Use of mechanized mining technology. 4. Pellet formation of iron ore to reduce transport cost of crude iron and dust emanating from the transport vehicles carrying ore. Railway transportation safer than the road transport. 5. Establishment of greenbelt in and around mining areas. Increase green cover along roads and rehabilitation of old mines. 6. Soil erosion can be prevented by covering the over burden mining waste with mat , tarpaulin etc. 7. Tree planting around dust emission points like storage piles, ore processing units, loading/unloading operations at railway heads 8. Regulating the trucks/loads/prevention of over loads. 9. Stabilization of unpaved roads, continuous repair of roads from mines to the highways, reduction in fine quality of iron ore transportation, strict enforcement on covering of ore with tarpaulin during transportation. 10. Ban on mining around the wildlife Sanctuaries (5 km radius) /Reserve Forest to protect wild life from SPM and RSPM impacts. 11. Wet suppression: Application of water or solution of chemical agent or micron sized foam to the dust emission surfaces. However, Village roads to be scraped to reduce the deposition of dust on wet roads leading to bad roads 12. Strict enforcement of controlled, scientific method of drilling, blasting and sorting of ore. 13. Increase rail transport and establishment of alternate railway routes to increase ore transport quantities and minimize the road transport. 14. Alternate bye pass roads for all villages to reduce air pollution exposure by villagers 15. Provisioning of LPG 16. Alternate energy sources energy efficient smokeless devices such as ASTRA stoves, Biogas, Biomass gasifiers, solar water heaters etc.,

Study on Carrying Capacity to develop Industrial Siting Guidelines in Bellary, Hospet and Sandur region
Environmental Management And Policy Research Institute 158
Indicators Environmental
Component Problems Impacts
Parameter Present Future Mitigation Options
Industrial 75 dB Residential 55 dB
Noise Environment Causes Residential Passage of trucks Other transport vehicles Industrial Blasting Mining equipments Operating machineries etc.
Impact on community: near roads due to truck traffic. Vibrations due to blasting, especially in case of small leased mines/quarries Occupational exposure to noise.
General public exposed to vehicular transport Loss of wildlife Irritation, anxiety, deafness of workers exposed to blasting
Commercial
65 dB
1. Banning of mining activity around National parks/Sanctuaries/Reserve forest as per The Wild Life Protection Act. 2. Banning of mining activity in the residential and forest areas. The Wildlife protection act prohibits mining within 1 km radius of the Reserved Forest, National Park and Wildlife sanctuary boundary. 3. Strict implementation of Blasting regulation around places of sensitive ecosystems to prevent noise pollution affecting birds/wild life. 4. Greenbelt around mining areas and by the side of roads to ensure noise alternation. 5. Mine owners to procure less noise generating equipments or machines and maintain equipments, machines, silences, mufflers properly. 6. Alternate bye pass roads for all villages to prevent exposure to noise pollution. 7. Sound proof enclosures and Ear muffs for staff working near noise generating source. Strict enforcement to use ear muffs.
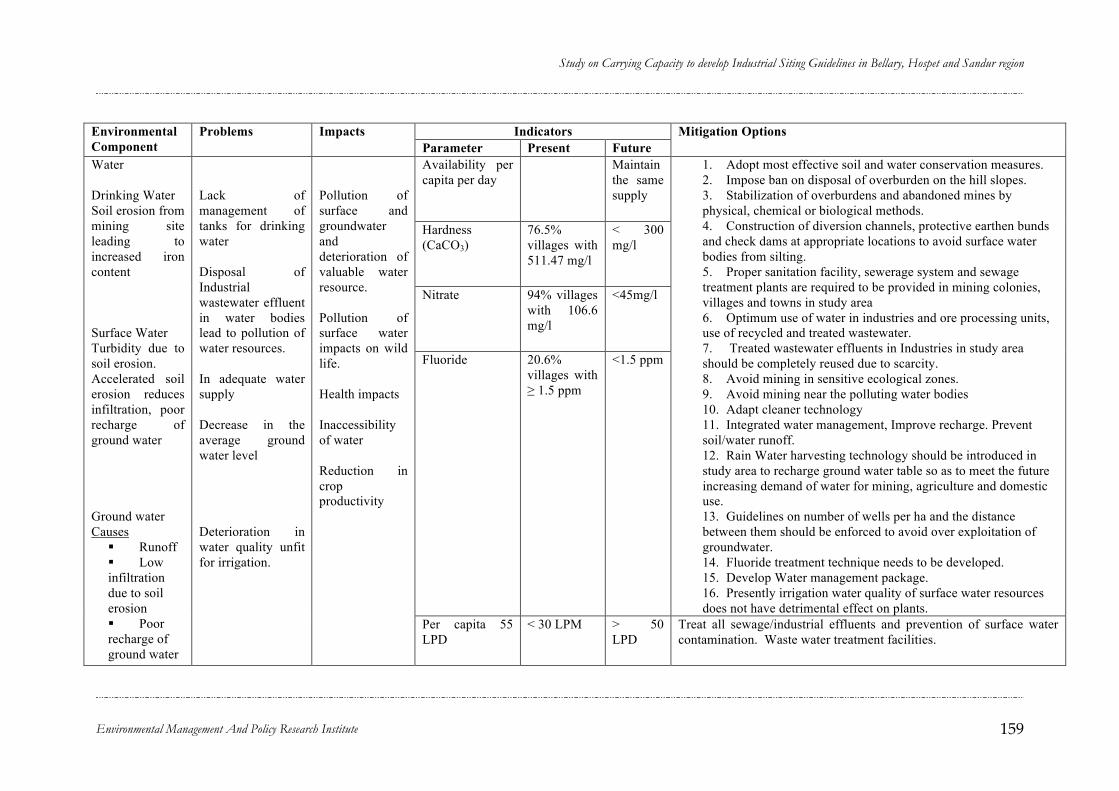
Study on Carrying Capacity to develop Industrial Siting Guidelines in Bellary, Hospet and Sandur region
Environmental Management And Policy Research Institute 159
Indicators Environmental
Component Problems Impacts
Parameter Present Future Mitigation Options
Availability per capita per day
Maintain the same supply
Hardness (CaCO3)
76.5% villages with 511.47 mg/l
< 300 mg/l
Nitrate 94% villages with 106.6 mg/l
<45mg/l
Fluoride 20.6% villages with ≥ 1.5 ppm
<1.5 ppm
1. Adopt most effective soil and water conservation measures. 2. Impose ban on disposal of overburden on the hill slopes. 3. Stabilization of overburdens and abandoned mines by physical, chemical or biological methods. 4. Construction of diversion channels, protective earthen bunds and check dams at appropriate locations to avoid surface water bodies from silting. 5. Proper sanitation facility, sewerage system and sewage treatment plants are required to be provided in mining colonies, villages and towns in study area 6. Optimum use of water in industries and ore processing units, use of recycled and treated wastewater. 7. Treated wastewater effluents in Industries in study area should be completely reused due to scarcity. 8. Avoid mining in sensitive ecological zones. 9. Avoid mining near the polluting water bodies 10. Adapt cleaner technology 11. Integrated water management, Improve recharge. Prevent soil/water runoff. 12. Rain Water harvesting technology should be introduced in study area to recharge ground water table so as to meet the future increasing demand of water for mining, agriculture and domestic use. 13. Guidelines on number of wells per ha and the distance between them should be enforced to avoid over exploitation of groundwater. 14. Fluoride treatment technique needs to be developed. 15. Develop Water management package. 16. Presently irrigation water quality of surface water resources does not have detrimental effect on plants.
Water Drinking Water Soil erosion from mining site leading to increased iron content Surface Water Turbidity due to soil erosion. Accelerated soil erosion reduces infiltration, poor recharge of ground water Ground water Causes
Runoff Low infiltration due to soil erosion Poor recharge of ground water
Lack of management of tanks for drinking water Disposal of Industrial wastewater effluent in water bodies lead to pollution of water resources. In adequate water supply Decrease in the average ground water level Deterioration in water quality unfit for irrigation.
Pollution of surface and groundwater and deterioration of valuable water resource. Pollution of surface water impacts on wild life. Health impacts Inaccessibility of water Reduction in crop productivity
Per capita 55 LPD
< 30 LPM
> 50 LPD
Treat all sewage/industrial effluents and prevention of surface water contamination. Waste water treatment facilities.

Study on Carrying Capacity to develop Industrial Siting Guidelines in Bellary, Hospet and Sandur region
Environmental Management And Policy Research Institute 160
Indicators Environmental Component
Problems Impacts Parameter Present Future
Mitigation Options
Treat all sewage/industrial effluents and prevention of surface water contamination. Waste water treatment facilities.
Chemical farming Fluoride pollution (due to industries and mining)
BOD of surface water Iron content Drinking water as per WHO standards
> 50 < 10
Organic farming, avoid on balanced chemical farming, avoid nitrate fertilizers.
Land and Soil degradation Soil Erosion Causes Mining Quarrying Loss of
vegetation Grazing Soil Fertility Subsistence
farming Mono
cropping
Fragmentation of landscape Land degradation due to overburdens and no restoration of mined areas. Leaching pollutants and metals from overburden to surface and groundwater bodies. Use of large quantity of pesticides and fertilizers leading to non point source pollution Decrease in agricultural productivity Diversion of
Mining on Steep slopes and some water sheds with high erosion potential. Low organic carbon content in the soil
Erosion losses Organic carbon Nitrogen pH Crop productivity Net area tree density
20 t/ha/year <0.5 % 220 kg/ha 7 – 9 Low yields > 1.2
<1 t/ha/year >0.75 % >250 kg/ha 6.5 – 8.5 Sustainable level
1. Avoid mining on steep slopes, avoid quarrying in sensitive ecosystems 2. Restoration and stabilization of abandoned mines and overburdens as given in EMP should be made strictly followed and the enforcing authority should properly monitor the plan. 3. Reforestation/tree planting/ agro forestry practices 4. Detailed watershed management should be carried out for water conservation and soil erosion control program with large scale a forestation in hilly areas and social forestry in water sheds. 5. The farmers should be educated about the problems arising due to use of agricultural land for mining leading to degradation of land and to increase the cultivation of tolerant crops to air pollution and to enhance the agricultural production. 6. Reforestation cropping/multiple cropping, organic farming. Integrated farming practice. Sustainable agriculture practices. Diversification of agriculture

Study on Carrying Capacity to develop Industrial Siting Guidelines in Bellary, Hospet and Sandur region
Environmental Management And Policy Research Institute 161
Indicators Environmental Component
Problems Impacts Parameter Present Future
Mitigation Options
agricultural land for mining activity. Non implementation of traditional mulching and other soil conservation techniques Stagnation of water
Decreased carrying capacity of the land.
< 2/hr
1.0 25/hr
Forest and Biodiversity Causes Mining Grazing Fire Unsustainable
exploitation Poor
regeneration
Non maintenance of sustainable fodder to livestock ratio, non implementation of social forestry schemes Less forest area, Forest degradation Excavation of forest land for mining Loss of biodiversity Low regeneration Species loss, wildlife disturbance
Disturbance in water recharge cycle Deforestation Decreased grass productivity Reduced regeneration Decreased stem density Species loss Loss of forest cover Reduced IVI of species Low productivity Reduction in NTFP flow. Decline in wildlife
Forest cover Species Number Stem density Productivity Threatened species Food species NTFP
10.19 % 234 207 / ha 6m2 BA 72
33% Enhance Enhance 10 m2 BA Sustainable level
1. No mining in the forest ecosystem 2. Close down all mining operations 3. A forestation / reforestation measures 4. Wildlife protection and conservation measures 5. JFPM/people participation
Agriculture Rainfed agriculture
Reduced crop yields/uncertainty of crop
Low income poverty Fodder security for families
Crop productivity Cropping intensity
1 ton/ha 1.14
1.5 t/ha 2.0

Study on Carrying Capacity to develop Industrial Siting Guidelines in Bellary, Hospet and Sandur region
Environmental Management And Policy Research Institute 162
Indicators Environmental Component
Problems Impacts Parameter Present Future
Mitigation Options
Irrigated Agriculture
Salinity/Alkalinity
Natural Resources and minerals
Depletion of good quality (60-68%) iron ore and Improper disposal of rejected low quality ore lead to wastage of this valuable resource.
Presently the low-quality ore is not processed due to non-availability of cost effective technology. Therefore it is necessary to have secured disposal of low quality ore for future use after the depletion of good quality iron ore.
IBM guidelines 1. Sustainable growth of mining activity in concurrence with environmental protection need to be done with strict implementation of environmental management plan along with increase in scientific mining. 2. The mining activity in the region needs to be planned thoroughly with a regional plan for the same including environmental conservation efforts. 3. The realized good quality iron ore would last up to 2030 AD. Therefore detailed exploration of iron ore reserves through deep drilling need to be carried out to broaden the resource database for future use. 4. Detailed exploration should indicate ore configuration, their breadth, length and depth so as to achieve minimum land degradation and overburden production. 5. Discarded low quality ore should be stacked separately and stabilized for further use after the depletion of good quality ore. 6. State Government should promote R/D projects for developing cost-effective technology for processing and concentrating low-grade ore.
Agricultural production is reduced due to dust pollution. Loss of organic matter in soil, loss of soil biota, drastic changes in soil profile
Yield/ha Low Sustainable
1. Integrated cropping management 2. Ban mining on agricultural lands 3. Agro forestry 4. Reduce grazing impact 5. Introduce local crop varieties
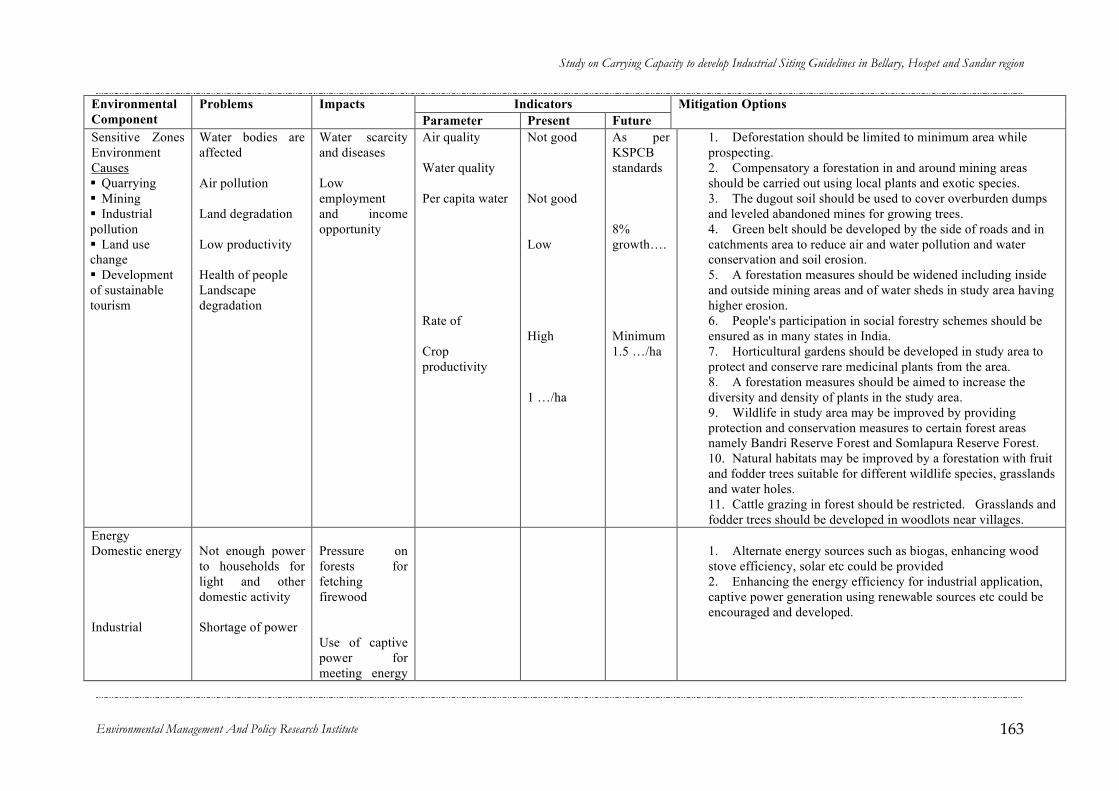
Study on Carrying Capacity to develop Industrial Siting Guidelines in Bellary, Hospet and Sandur region
Environmental Management And Policy Research Institute 163
Indicators Environmental Component
Problems Impacts Parameter Present Future
Mitigation Options
Sensitive Zones Environment Causes Quarrying Mining Industrial pollution Land use change Development of sustainable tourism
Water bodies are affected Air pollution Land degradation Low productivity Health of people Landscape degradation
Water scarcity and diseases Low employment and income opportunity
Air quality Water quality Per capita water Rate of Crop productivity
Not good Not good Low High 1 …/ha
As per KSPCB standards 8% growth…. Minimum 1.5 …/ha
1. Deforestation should be limited to minimum area while prospecting. 2. Compensatory a forestation in and around mining areas should be carried out using local plants and exotic species. 3. The dugout soil should be used to cover overburden dumps and leveled abandoned mines for growing trees. 4. Green belt should be developed by the side of roads and in catchments area to reduce air and water pollution and water conservation and soil erosion. 5. A forestation measures should be widened including inside and outside mining areas and of water sheds in study area having higher erosion. 6. People's participation in social forestry schemes should be ensured as in many states in India. 7. Horticultural gardens should be developed in study area to protect and conserve rare medicinal plants from the area. 8. A forestation measures should be aimed to increase the diversity and density of plants in the study area. 9. Wildlife in study area may be improved by providing protection and conservation measures to certain forest areas namely Bandri Reserve Forest and Somlapura Reserve Forest. 10. Natural habitats may be improved by a forestation with fruit and fodder trees suitable for different wildlife species, grasslands and water holes. 11. Cattle grazing in forest should be restricted. Grasslands and fodder trees should be developed in woodlots near villages.
Energy Domestic energy Industrial
Not enough power to households for light and other domestic activity Shortage of power
Pressure on forests for fetching firewood Use of captive power for meeting energy
1. Alternate energy sources such as biogas, enhancing wood stove efficiency, solar etc could be provided 2. Enhancing the energy efficiency for industrial application, captive power generation using renewable sources etc could be encouraged and developed.
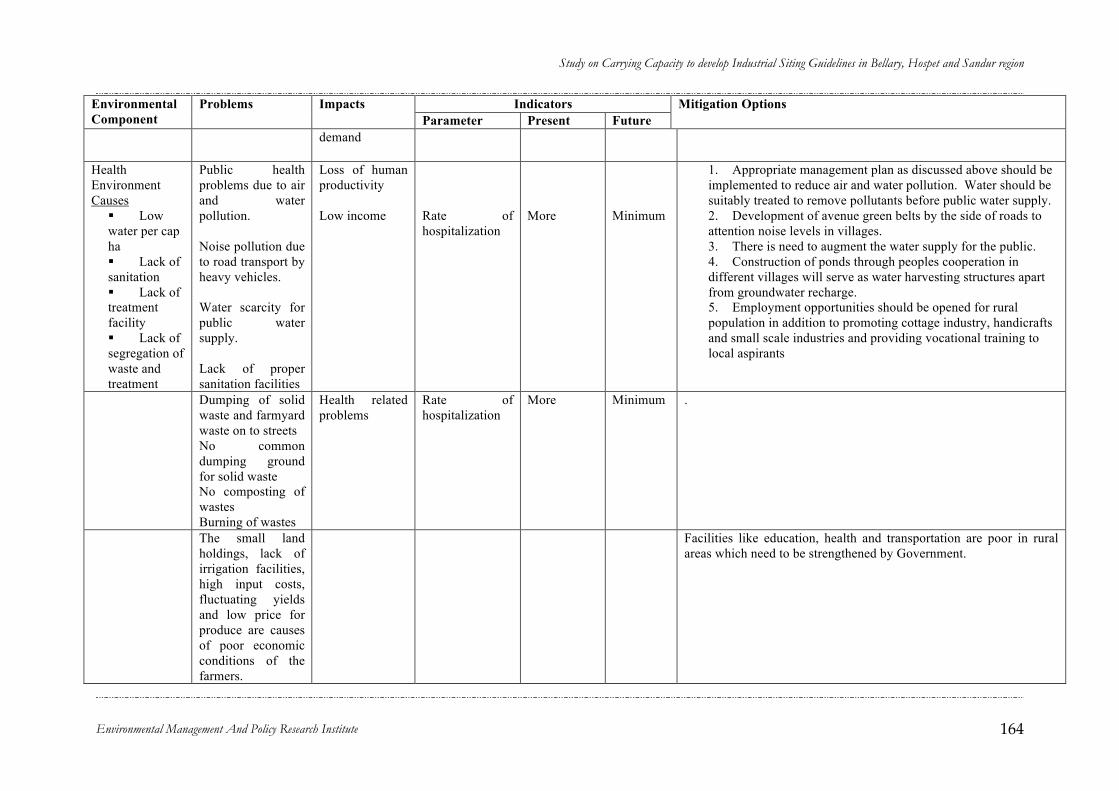
Study on Carrying Capacity to develop Industrial Siting Guidelines in Bellary, Hospet and Sandur region
Environmental Management And Policy Research Institute 164
Indicators Environmental Component
Problems Impacts Parameter Present Future
Mitigation Options
demand
Health Environment Causes
Low water per cap ha Lack of sanitation Lack of treatment facility Lack of segregation of waste and treatment
Public health problems due to air and water pollution. Noise pollution due to road transport by heavy vehicles. Water scarcity for public water supply. Lack of proper sanitation facilities
Loss of human productivity Low income
Rate of hospitalization
More
Minimum
1. Appropriate management plan as discussed above should be implemented to reduce air and water pollution. Water should be suitably treated to remove pollutants before public water supply. 2. Development of avenue green belts by the side of roads to attention noise levels in villages. 3. There is need to augment the water supply for the public. 4. Construction of ponds through peoples cooperation in different villages will serve as water harvesting structures apart from groundwater recharge. 5. Employment opportunities should be opened for rural population in addition to promoting cottage industry, handicrafts and small scale industries and providing vocational training to local aspirants
Dumping of solid waste and farmyard waste on to streets No common dumping ground for solid waste No composting of wastes Burning of wastes
Health related problems
Rate of hospitalization
More Minimum .
The small land holdings, lack of irrigation facilities, high input costs, fluctuating yields and low price for produce are causes of poor economic conditions of the farmers.
Facilities like education, health and transportation are poor in rural areas which need to be strengthened by Government.
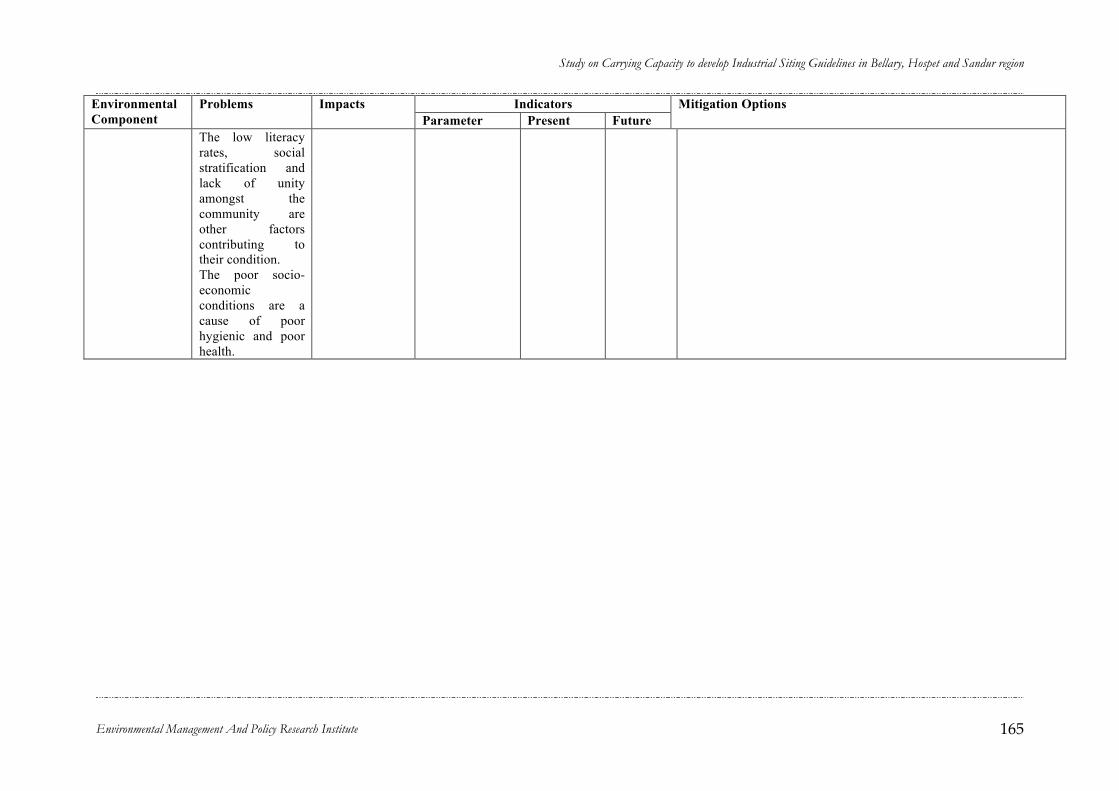
Study on Carrying Capacity to develop Industrial Siting Guidelines in Bellary, Hospet and Sandur region
Environmental Management And Policy Research Institute 165
Indicators Environmental Component
Problems Impacts Parameter Present Future
Mitigation Options
The low literacy rates, social stratification and lack of unity amongst the community are other factors contributing to their condition. The poor socio-economic conditions are a cause of poor hygienic and poor health.

Study on Carrying Capacity to develop Industrial Siting Guidelines in Bellary, Hospet and Sandur region
Environmental Management And Policy Research Institute 166
CHAPTER CHAPTER 1414 CARRYING CAPACITY ANCARRYING CAPACITY AN D D ECOLOGICAL FOOT PRINECOLOGICAL FOOT PRIN TSTS
14.1 Defining “Carrying Capacity”
The concepts of defining and estimating the Carrying capacity of a natural system
varies in different contexts and have many models to assess. One such simple definition is
that “Carrying capacity refers to the number of individuals who can be supported without
degrading the physical, ecological, cultural, and social environment i.e. without reducing the
ability of the environment to sustain the desired quality of life over a long period of time”.
Carrying capacity is generally estimated by taking up inventory of natural resources
and estimating the constraints restricting the use and to assess the overall balancing of
resources. There are several approaches to calculate the carrying capacity in relation to
population pressure and external demand on the ecosystem. One such approach is to estimate
the productivity of land on sustainable basis, natural resources and the current demand on
these resources. Difference between the demand and sustainable productivity gives the
excess or deficit demand of a particular resource. Demand exceeding the productivity is an
indication of unsustainable use of resources. In the present study efforts have been made to
analyze the carrying capacity of Sandur, Bellary and Hospet by using secondary data of
resources like food production, forest cover, water resources and usage of land.
14.2 Methodology adopted
There are different methods available to estimate the carrying capacity of an area.
The following steps have been adopted to assess the carrying capacity of the study area.
Carrying capacity is the maximum number of activities like domestic, agriculture, transport,
industries- that can be done continuously over a period of time without affecting:
a) The existing quality of life (from the point of view of existing traditional practices,
access to resources, health and pollution levels.
b) The overall balancing of resources (Renew ability/regeneration).
c) The fact that activities can be done on a sustainable manner.
d) Neighboring systems.
e) Existing ecological systems like agriculture, horticulture, forest etc.

Study on Carrying Capacity to develop Industrial Siting Guidelines in Bellary, Hospet and Sandur region
Environmental Management And Policy Research Institute 167
14.3 Status in study area
14.3.1 Quality of life
Bellary is one of the most backward districts in Karnataka with more than 50%
population living below the poverty line. Droughts and famines are very common in the
district. Rain fed agriculture is the main occupation of the people with very little industrial
development in the district. Poverty, malnutrition, and unavailability of drinking water are
still a major problem in the district. In the study areas of Sandur, Hospet and Bellary, similar
socio-economic conditions are prevailing thereby indicating acute backwardness of the area.
14.3.2 Population
The density of population is 238/km3. More than 50% of the population is made of
agricultural laborers. The Scheduled caste and Scheduled tribe population is around 30%
which is higher than the national average and state average. The literacy percentage is less
than 60 %. The percentage of people living below the poverty line is 46.50%. Around
18%of the families do not have safe drinking water facilities.
14.3.3 Income levels
The annual per capita income of the district is around Rs. 17895 as per 2001-2002
census. The gross income of the district is 3.6 billion rupees which is below the national
average. The low GDP indicates the backwardness of the district and low socio-economic
standards.
14.3.4 Health status and pollution problems
Malnutrition and other types of diseases are very common and access to health
facilities is very low. The mortality of children is 119/1000 LB, which is quite high as
compared to the state average.
14.3.5 Carrying capacity of human population
The carrying capacity of human population in a given ecosystem is estimated by
calculating:
Population that can be fed: It the ratio of the food supply to individual food
requirement and population water requirement. For Bellary district the ratio is
0.63 which is less than the carrying capacity value 1.0. In other words the current
level of food production is sufficient to meet 63% of the population. The same

Study on Carrying Capacity to develop Industrial Siting Guidelines in Bellary, Hospet and Sandur region
Environmental Management And Policy Research Institute 168
estimate holds good for the study area also. From the human carrying capacity
estimation it is evident that the study region has reached unalterable level.
Requirement of Water: Another parameter estimated is requirement of water
which is again less than the carrying capacity value of 1.0 as the district is facing
deficit in drinking water and surface water. The per capita water availability of
the district is 3200 m3 as compared to the national average of 35,000 m3.
However Sandur taluk is better placed as compared to the district average.
14.3.6 Primary productivity
To assess the renewable resource and regeneration capacity of an ecosystem the
estimation of primary productivity is essential. Carrying capacity of primary productivity
components such as food production of the area, biomass productivity in the forest
ecosystem, water availability, average grass production, fish productivity, etc., has been
analyzed to assess the carrying capacity of the study area.
1. Food production in the area: The study area has around 61% of total geographical
area (TGA) under food production, which is higher than the district average of 50%.
The food production is 273,163 tons as against the demand of 4 lakh tons for the
district. Similarly in the study area of 3 taluks the food production is just 143,000
tons as against the demand of 224,000 tons indicating the shortfall of nearly 40 %.
However, if we exclude the urban population and estimate the demand for food grains
it is sufficient to meet the demand of rural population.
2. Land usage carrying capacity: For any region land is the most important resource. It
is a basic resource used for agriculture, animals and human settlements, industries,
schools, communication, roads, storage reservoirs, trading establishments, service
units, power stations and most importantly forests in order to maintain the ecological
balance of a region state or country.

Study on Carrying Capacity to develop Industrial Siting Guidelines in Bellary, Hospet and Sandur region
Environmental Management And Policy Research Institute 169
Table 14.1: Land use pattern in the study area
Sl. No
Land use needs
Extent in Hectare
Deficit/excess
1 Agriculture 242412 (62.5%) Exceeds the requirement. Productivity of land can be improved by using high yielding varieties.
2 Forests 110113.21 (26%) Deficit by 30,000 ha. Needs to be covered from agriculture sector and wastelands.
3 Built-up area
9391.8 (2.42%) Deficit by 9300 ha to make it to 5 % of the TGA.
4 Mining 1508.03 It should be restricted to 0.1 % TGA through scientific mining.
5 Wasteland 7308.00 Should be converted as Forestland. (To make it 33%) 6 Others use 14,000 ha 7 TGA 388801.80 45% of the TGA is adequate for food production. By
increasing the area under irrigation and by adopting good package of practices the current level of food production can be improved.
The current land use for various needs are estimated and subtracted from the total land
of the area. (The difference will be the total land available for the future uses.). From the
table 14.1 the total land available is estimated below.
3. Land usage pattern: As per the land use change analysis the following types of land
use has been identified in the study region (Table 14.2).
Table 14.2: Satellite imagery showing land use pattern in Bellary, Hospet and Sandur
taluks - 2004.
Land use type Extent in ha
% of TGA
Change in area
between 2000 &
2004(ha)
Remarks
Built up 9391.82 2.42 5.18 Increase in the built up area
Crop land 242444.94 62.36 -32.71 Very negligible reduction in the cropland
Forest 33251.9 8.55 -180.01 Substantial reduction in forestland
Scrub forest 68241.77 17.55 -199.53 Reduction in the forest area
Barren area 9882.46 2.54 0 No net change
Mining area 1201.12 0.31 306.91 Substantial increase in mining area
Mining waste 64.8 0.02 91.48 Increase in the mining area
Quarrying 223.11 0.39 0 No change
Wasteland 7308.39 1.88 1.88 Marginal
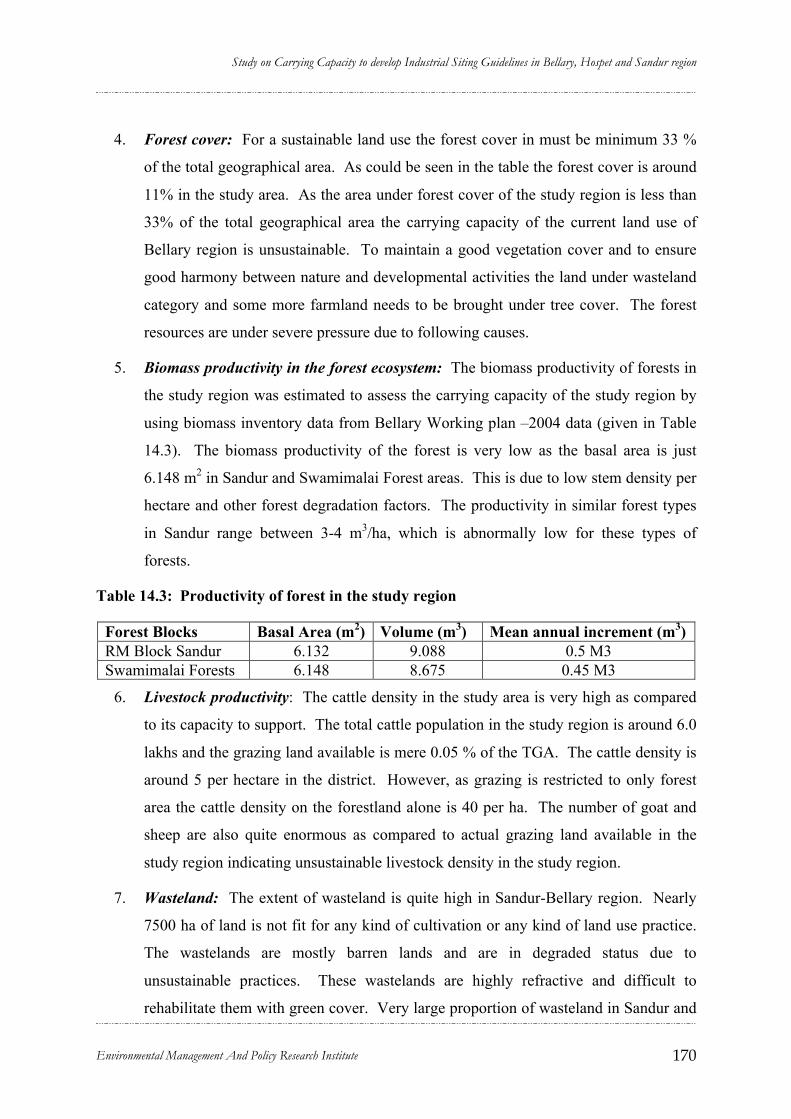
Study on Carrying Capacity to develop Industrial Siting Guidelines in Bellary, Hospet and Sandur region
Environmental Management And Policy Research Institute 170
4. Forest cover: For a sustainable land use the forest cover in must be minimum 33 %
of the total geographical area. As could be seen in the table the forest cover is around
11% in the study area. As the area under forest cover of the study region is less than
33% of the total geographical area the carrying capacity of the current land use of
Bellary region is unsustainable. To maintain a good vegetation cover and to ensure
good harmony between nature and developmental activities the land under wasteland
category and some more farmland needs to be brought under tree cover. The forest
resources are under severe pressure due to following causes.
5. Biomass productivity in the forest ecosystem: The biomass productivity of forests in
the study region was estimated to assess the carrying capacity of the study region by
using biomass inventory data from Bellary Working plan –2004 data (given in Table
14.3). The biomass productivity of the forest is very low as the basal area is just
6.148 m2 in Sandur and Swamimalai Forest areas. This is due to low stem density per
hectare and other forest degradation factors. The productivity in similar forest types
in Sandur range between 3-4 m3/ha, which is abnormally low for these types of
forests.
Table 14.3: Productivity of forest in the study region
Forest Blocks Basal Area (m2) Volume (m3) Mean annual increment (m3) RM Block Sandur 6.132 9.088 0.5 M3 Swamimalai Forests 6.148 8.675 0.45 M3
6. Livestock productivity: The cattle density in the study area is very high as compared
to its capacity to support. The total cattle population in the study region is around 6.0
lakhs and the grazing land available is mere 0.05 % of the TGA. The cattle density is
around 5 per hectare in the district. However, as grazing is restricted to only forest
area the cattle density on the forestland alone is 40 per ha. The number of goat and
sheep are also quite enormous as compared to actual grazing land available in the
study region indicating unsustainable livestock density in the study region.
7. Wasteland: The extent of wasteland is quite high in Sandur-Bellary region. Nearly
7500 ha of land is not fit for any kind of cultivation or any kind of land use practice.
The wastelands are mostly barren lands and are in degraded status due to
unsustainable practices. These wastelands are highly refractive and difficult to
rehabilitate them with green cover. Very large proportion of wasteland in Sandur and
Study on Carrying Capacity to develop Industrial Siting Guidelines in Bellary, Hospet and Sandur region
Environmental Management And Policy Research Institute 171
Bellary region are highly unsustainable hence there is shrinkage in the carrying
capacity of the land. Similarly other categories of wastelands including quarry sites,
mining waste dump areas, and barren areas is significantly high and have negative
impact on the ecosystem making the landscape highly unsustainable.
8. Livestock grazing: The livestock grazing pressure in the district is currently high.
The land to cattle ratio is very high. In Bellary region the proportion of the cattle
population is very high in the district as compared to the state average. The cattle
population at the taluka level of the study area indicates very high density as
compared to the state average indicating unsustainable grazing pressure on the land
use. At present the per capita grazing land available to each livestock is mere 0.004
ha which is relatively very low and has lead to unsustainable land use practices
(Perspective Land use Plan for Karnataka, 2025).
9. Crop production: In Bellary district the percentage of agricultural area to the total
geographical area is comparatively high indicating the bulk of rural population is
dependent on crop cultivation. As more than 62 % of the total geographical area
(TGA) is under agriculture with the crop intensity of more than 1.2 the carrying
capacity of the land has exceeded the sustainable limit. The Crop productivity is also
declining over years in horticulture crops indicating unsustainable agriculture
practices at landscape level
10. Ecological footprints: Ecological footprint is an estimation of the productivity of
natural resources in a given ecosystem and the capacity to meet the demand on its
resources. This is estimated by aggregating the average consumption of resources by
the population based on per capita energy and food demand and estimating the per
capita land area required to produce the same. The Footprint of an American citizen
is 10.3 ha where as an Indian it is 0.8 ha. Similar estimation has been done in the
study region and it is found that the footprint is (0.6 ha) which is less than the per
capita land available to them. Ecological footprint calculation involves complex
calculations based on export, import etc. However, in view of the non-availability of
data on such matters in the small district such as Bellary simple calculations were
used to arrive at “Ecological footprint” of Bellary district and the study area i.e.,
Bellary-Hospet-Sandur region. The calculation involves per capita food consumption
for two meals a day and the land required for it. Energy consumed for cooking,
lighting and other domestic and industrial sectors. Actual data from forest on

Study on Carrying Capacity to develop Industrial Siting Guidelines in Bellary, Hospet and Sandur region
Environmental Management And Policy Research Institute 172
firewood supply was taken to calculate the energy requirements in terms of area
required to grow the fuel wood. In addition the consumption of electricity from the
district was taken and equivalent of wood required to produce the required quantity of
electricity was calculated and later the land area that is required to produce the
required quantity of wood was calculated. Similarly the number of cattle in the
district was calculated and the area required to grow fodder for those cattle was
calculated based on the average consumption of grass by the cattle. Based on the area
required to get food, energy and grazing as obtained from the above method, the area
was multiplied with the population of the region to get the land requirement for each
of the category. Summing up of each of these categories will give us the total land
required to support the people living in that area. Computing the difference between
the availability of land for each of these activities will give us the difference in area to
make the people of that region self-sufficient. This gap in area is considered as the
deficit. Table 14.5 gives the details of calculations based on the above assumptions.
Table 14.4: Calculation of ecological footprint
Area required in ha (population * per
capita area required)
Area available (ha)
Deficit (per capita ha)
Sl No.
Land required for
production of
Study site (pop: 1191609)
District (pop:
2027140)
Study site
District Study site
District
1 Food 214489.6 364885.2 173003 414288 -0.0348 0.024
2 Energy 238321.8 405428 183761 398908 -0.0457 -0.003
3 Grazing 357482.7 608142 815 3564 -0.2993 -0.298
4 Total 810294.0 1378455 355760 813196 -0.299 -0.401
Table 14.5: Summary of Ecological Foot Print in Bellary-Hospet-Sandur Region
Sl No Dependency category Land area required ha/capita
1 Food 0.18 2 Energy 0.2 3 Grazing needs 0.3 Total 0.68 4 Productive Land area
available 0.38
5 Deficit 0.30

Study on Carrying Capacity to develop Industrial Siting Guidelines in Bellary, Hospet and Sandur region
Environmental Management And Policy Research Institute 173
Table 14.6: Ecological footprint of different countries
Countries Population (as in 1997)
Footprint in
[ha/cap]
available capacity
in [ha/cap]
ecol. deficit (if –ve ) in [ha/cap]
total fp [km2]
Total av. Cap [km2]
Argentina 35,405,000 3.9 4.6 0.7 1,380,795 1,628,630 Australia 18,550,000 9 14 5 1,669,500 2,597,000 Bangladesh 125,898,000 0.5 0.3 -0.2 629,490 415,463 Brazil 167,046,000 3.1 6.7 3.6 5,178,426 11,192,082 Canada 30,101,000 7.7 9.6 1.9 2,317,777 2,889,696 China 1,247,315,000 1.2 0.8 -0.4 14,967,780 9,978,520 Denmark 5,194,000 5.9 5.2 -0.7 306,446 270,088 France 58,433,000 4.1 4.2 0.1 2,395,753 2,454,186 Germany 81,845,000 5.3 1.9 -3.4 4,337,785 1,555,055 India 970,230,000 0.8 0.5 -0.3 7,761,840 4,851,150 Indonesia 203,631,000 1.4 2.6 1.2 2,850,834 5,294,406 Italy 57,247,000 4.2 1.3 -2.9 2,404,374 744,211 Japan 125,672,000 4.3 0.9 -3.4 5,403,896 1,131,048 Jordan 5,849,000 1.9 0.1 -1.8 111,131 5,849 Korea, Rep 45,864,000 3.4 0.5 -2.9 1,559,376 229,320 Malaysia 21,018,000 3.3 3.7 0.4 693,594 777,666 Mexico 97,245,000 2.6 1.4 -1.2 2,528,370 1,361,430 Netherlands 15,697,000 5.3 1.7 -3.6 831,941 266,849 Pakistan 148,686,000 0.8 0.5 -0.3 1,189,488 743,430 Russian Federation 146,381,000 6 3.7 -2.3 8,782,860 5,416,097 Singapore 2,899,000 7.2 0.1 -7.1 208,728 2,899 South Africa 43,325,000 3.2 1.3 -1.9 1,386,400 563,225 Switzerland 7,332,000 5 1.8 -3.2 366,600 131,976 Thailand 60,046,000 2.8 1.2 -1.6 1,681,288 720,552 United Kingdom 58,587,000 5.2 1.7 -3.5 3,046,524 995,979 United States
268,189,000 10.3 6.7 -3.6 27,623,467 17,968,663
WORLD 5,892,480,000 2.8 2.1 -0.7 Source: www.dcp.ufl.edu/ckibert/BCN6585/EcologicalFootprint/ranking.htm
14.3.7 Secondary productivity:
The following secondary productivity like soil productivity, population that can be
supported by an area, bio-diversity, and productivity of land has been assessed to estimate the
carrying capacity of Sandur, Bellary and Hospet.
1. Soil productivity: Soil productivity of the study area is very low due to
inherent climatic and edaphic factors. The average organic carbon content of
the soil is less than 0.5 in the study area indicating low productivity potential
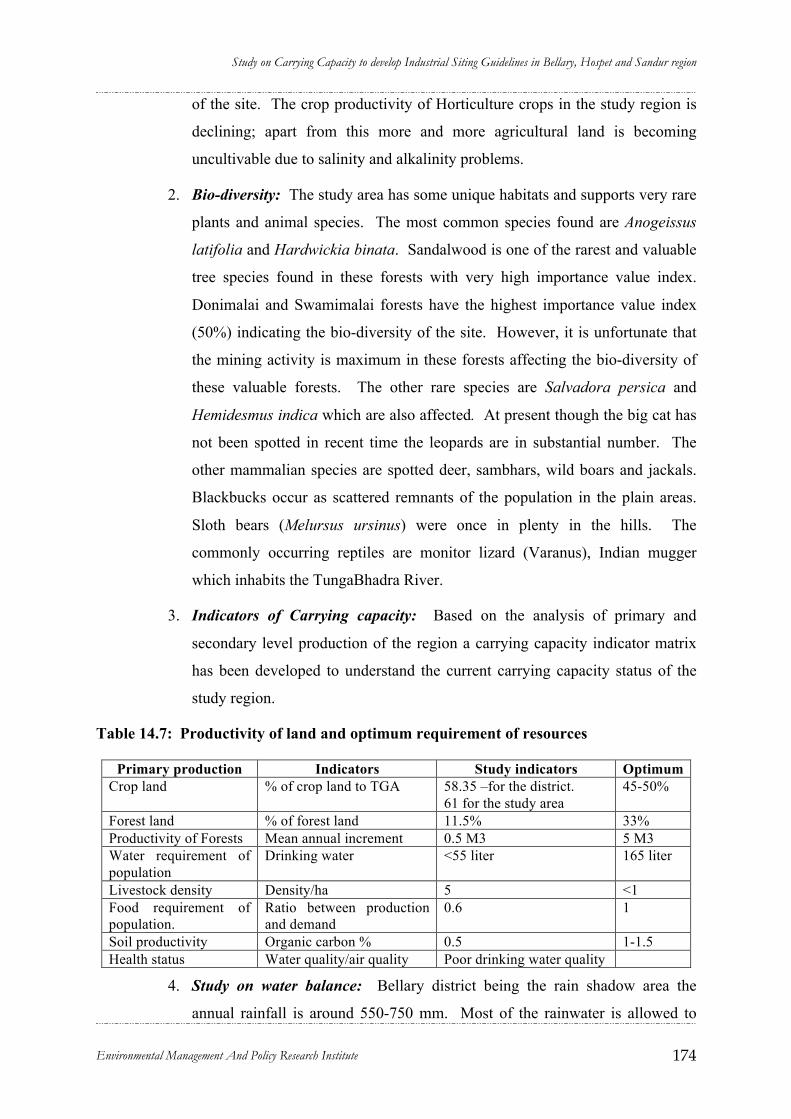
Study on Carrying Capacity to develop Industrial Siting Guidelines in Bellary, Hospet and Sandur region
Environmental Management And Policy Research Institute 174
of the site. The crop productivity of Horticulture crops in the study region is
declining; apart from this more and more agricultural land is becoming
uncultivable due to salinity and alkalinity problems.
2. Bio-diversity: The study area has some unique habitats and supports very rare
plants and animal species. The most common species found are Anogeissus
latifolia and Hardwickia binata. Sandalwood is one of the rarest and valuable
tree species found in these forests with very high importance value index.
Donimalai and Swamimalai forests have the highest importance value index
(50%) indicating the bio-diversity of the site. However, it is unfortunate that
the mining activity is maximum in these forests affecting the bio-diversity of
these valuable forests. The other rare species are Salvadora persica and
Hemidesmus indica which are also affected. At present though the big cat has
not been spotted in recent time the leopards are in substantial number. The
other mammalian species are spotted deer, sambhars, wild boars and jackals.
Blackbucks occur as scattered remnants of the population in the plain areas.
Sloth bears (Melursus ursinus) were once in plenty in the hills. The
commonly occurring reptiles are monitor lizard (Varanus), Indian mugger
which inhabits the TungaBhadra River.
3. Indicators of Carrying capacity: Based on the analysis of primary and
secondary level production of the region a carrying capacity indicator matrix
has been developed to understand the current carrying capacity status of the
study region.
Table 14.7: Productivity of land and optimum requirement of resources
Primary production Indicators Study indicators Optimum Crop land % of crop land to TGA 58.35 –for the district.
61 for the study area 45-50%
Forest land % of forest land 11.5% 33% Productivity of Forests Mean annual increment 0.5 M3 5 M3 Water requirement of population
Drinking water <55 liter 165 liter
Livestock density Density/ha 5 <1 Food requirement of population.
Ratio between production and demand
0.6 1
Soil productivity Organic carbon % 0.5 1-1.5 Health status Water quality/air quality Poor drinking water quality
4. Study on water balance: Bellary district being the rain shadow area the
annual rainfall is around 550-750 mm. Most of the rainwater is allowed to

Study on Carrying Capacity to develop Industrial Siting Guidelines in Bellary, Hospet and Sandur region
Environmental Management And Policy Research Institute 175
drain off due to poor vegetation cover and low infiltration capacity of the site.
The ground water recharge is very low and the surface water joins the major
river basin Tungabhadra. The number of small tanks to hold the water is very
few and as a result the scarcity of water is acute in the district. Using satellite
imageries the ground water potential in the study area has been estimated.
From the map it is evident that except in few pockets of Bellary and Sandur
taluks other parts of the study area have moderate to low status of ground
water potential. Many study reports have indicated that these three taluks are
water deficit taluks.
Bellary district receives 500 to 600 mm rainfall annually out of which nearly 60%
of the rainfall is not utilizable as the rainwater is subjected to surface runoff and
evapo-transpiration loss. From various studies conducted in similar rainfall zones
it is reported that the 20% of the total rainfall may be taken as available water for
meeting agricultural and domestic needs. Assuming that there will be 500 mm of
rainfall per annum and unavailability of 50% the water available for 1.2 ha land
holding is 250 mm or 3000 m3. It is reported that the domestic demand of water
per family is 800 to 100 cubic meter per year leaving around 2000 cubic meter
available for crop production.. In other words nearly 180 mm is available for
crops. If the crops of 120 days are cultivated the water available per day is around
1.5 mm/ha /day. This indicates the possibility of growing very low water demand
crops like jowar or cotton or groundnut with very high risk. From the demand and
supply of water in Bellary region it is evident that there is no surplus water
available at family unit level. The details of water balance are given in chapter on
water demand and supply in Bellary, Hospet and Sandur Taluks.
The study area has a catchment area of 3.88 lakh ha. The total rainfall received
is 500 mm/year. The total water available after deducting transpiration, evapo-
transpiration, run off (60%), the total utilizable water is 760 mm3. The detailed
water demand and supply status has been discussed under separate chapters.
5. Drinking water status: The availability of drinking water is very low in the
study area. More than 55% of habitations have less than 55 liters of water per
head per day.

Study on Carrying Capacity to develop Industrial Siting Guidelines in Bellary, Hospet and Sandur region
Environmental Management And Policy Research Institute 176
6. Irrigation status: The irrigation potentiality of Bellary region is very poor as
the ground water as well as surface water availability is very low. At present
Bellary and Hospet taluks are being irrigated by Tungabhadra reservoir. The
total irrigated area is around 40% of TGA in Bellary taluk (including minor
irrigation and ground water source). In Hospet the irrigated area is around
45% of the cropped area. However in Sandur the irrigated area is very
negligible. Irrigation of crops in Bellary and Hospet taluks has caused land
degradation due to salinity and alkalinity. Excessive irrigation in these two
taluks has made nearly 25 % of land unsuitable for crop cultivation.
7. Ground water potential: The ground water potential of Sandur Hospet and
Bellary region is very low due to low rainfall and low infiltration
8. Total Availability of Surface water: The state is having 1263.30 TMC of
water out of which the state has planned already to utilize 887.16 TMC of
water. There is also a plan to utilize the balance of 376 TMC of water out of
which 183 TMC is from Krishna basin, which has nearly 60 % of total TGA
and the population (Table 14.11). Out of 183 TMC only 5 % is allocated to
industrial development. However this 8 TMC of water which is nearly
215,000 M3 may not be adequate. Hence, based on the river basin it may not
be prudent to expect the supply of water to Bellary district to meet the
industrial requirement or catering to any other non-agricultural demand.
Table 14.8: Allocation and utilization of water in different river basins of Karnataka
River Basin Allocation in TMC
Utilization achieved up to 3/2000 (in TMC)
Balance water to be used (in TMC)
Krishna 729.0 532.19 196.81 Cauvery 408.62 307.09 101.53 Godavari 22.37 13.13 9.24 Other Basins 103.31 34.75 68.56
9. Water allocation for different uses: Water required for uses other than
irrigation such as domestic, power generation, navigation, industries, etc. are
not considered separately. There is substantial loss of water in storage
reservoirs due to evaporation. It may also be necessary to ensure minimum
flow of water in the river to maintain the aquatic life. The National
Commission for Integrated Water Resource Development Plan 1999 has
worked out various percentages of water requirements for various uses. As a

Study on Carrying Capacity to develop Industrial Siting Guidelines in Bellary, Hospet and Sandur region
Environmental Management And Policy Research Institute 177
national average the requirement of water for uses other than irrigation
accounts for about 20% of utilizable water resources.
Table 14.9: Requirement of water by different sectors
Requirement of water
Requirement Till 2010
(%)
Requirement till 2025 (%)
Use of water
including
Requirement 2010 (%)
Requirement 2025 (%)
Irrigation 78 72 Flood control 0 0
Domestic use 6 7 Navigation 1 1
Industrial use 5 8 Ecology and Environment 1 1
Power generation 3 4 Evaporation
loss 6 6
10. The water balance estimates for Bellary region is indicating severe shortage of
water. If the projection of demand for water is done for the next 20 years the
shortage of water would be quite severe due to increase in the domestic
consumption. Under these circumstances the availability of water for
industrial need would be very much restricted.
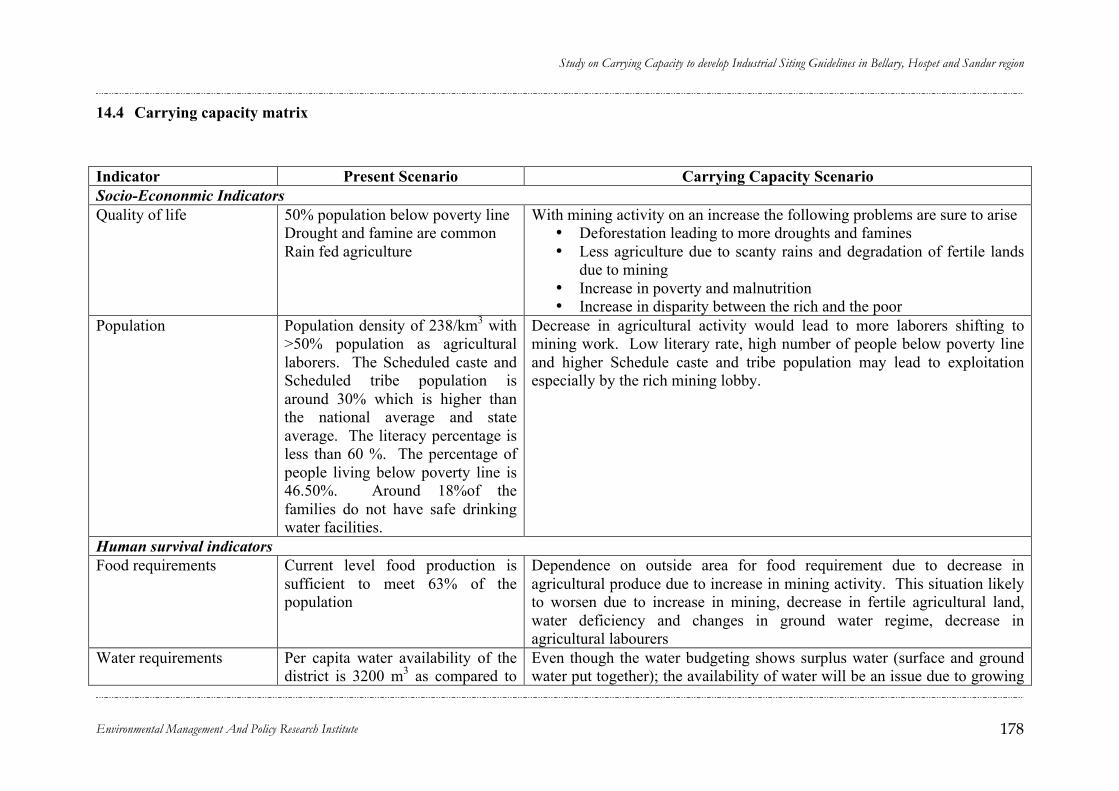
Study on Carrying Capacity to develop Industrial Siting Guidelines in Bellary, Hospet and Sandur region
Environmental Management And Policy Research Institute 178
14.4 Carrying capacity matrix
Indicator Present Scenario Carrying Capacity Scenario Socio-Econonmic Indicators Quality of life 50% population below poverty line
Drought and famine are common Rain fed agriculture
With mining activity on an increase the following problems are sure to arise • Deforestation leading to more droughts and famines • Less agriculture due to scanty rains and degradation of fertile lands
due to mining • Increase in poverty and malnutrition • Increase in disparity between the rich and the poor
Population Population density of 238/km3 with >50% population as agricultural laborers. The Scheduled caste and Scheduled tribe population is around 30% which is higher than the national average and state average. The literacy percentage is less than 60 %. The percentage of people living below poverty line is 46.50%. Around 18%of the families do not have safe drinking water facilities.
Decrease in agricultural activity would lead to more laborers shifting to mining work. Low literary rate, high number of people below poverty line and higher Schedule caste and tribe population may lead to exploitation especially by the rich mining lobby.
Human survival indicators Food requirements Current level food production is
sufficient to meet 63% of the population
Dependence on outside area for food requirement due to decrease in agricultural produce due to increase in mining activity. This situation likely to worsen due to increase in mining, decrease in fertile agricultural land, water deficiency and changes in ground water regime, decrease in agricultural labourers
Water requirements Per capita water availability of the district is 3200 m3 as compared to
Even though the water budgeting shows surplus water (surface and ground water put together); the availability of water will be an issue due to growing
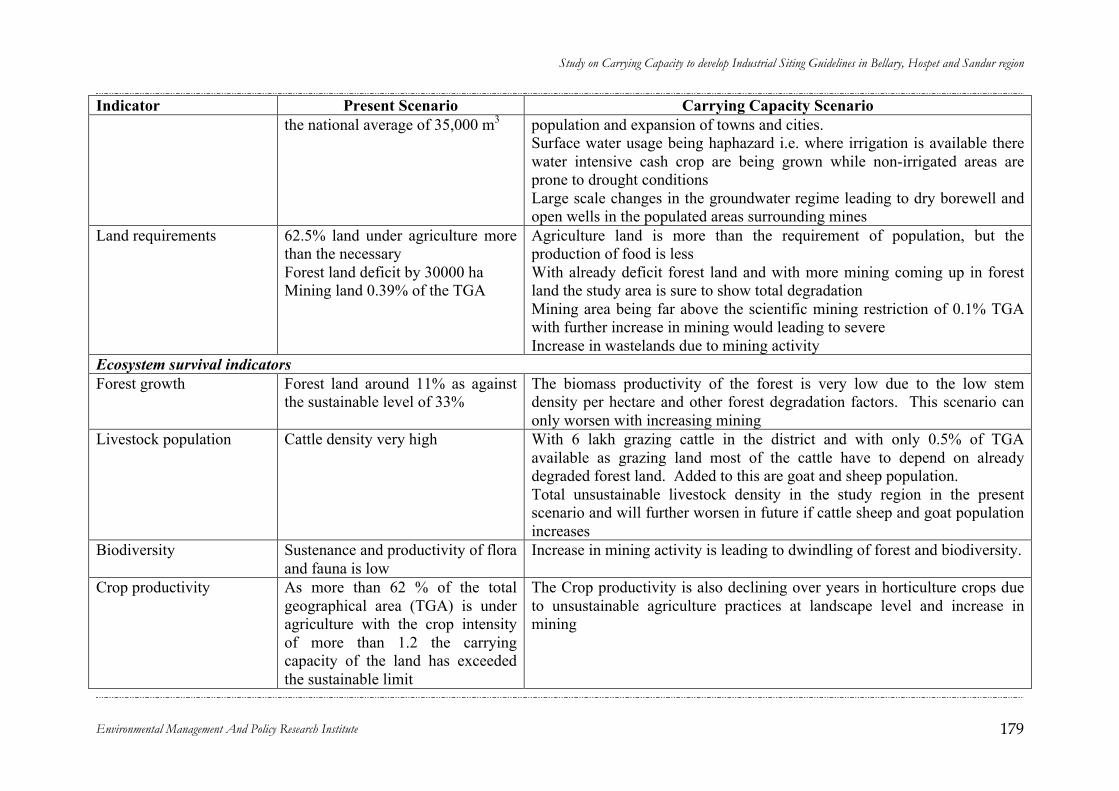
Study on Carrying Capacity to develop Industrial Siting Guidelines in Bellary, Hospet and Sandur region
Environmental Management And Policy Research Institute 179
Indicator Present Scenario Carrying Capacity Scenario the national average of 35,000 m3 population and expansion of towns and cities.
Surface water usage being haphazard i.e. where irrigation is available there water intensive cash crop are being grown while non-irrigated areas are prone to drought conditions Large scale changes in the groundwater regime leading to dry borewell and open wells in the populated areas surrounding mines
Land requirements 62.5% land under agriculture more than the necessary Forest land deficit by 30000 ha Mining land 0.39% of the TGA
Agriculture land is more than the requirement of population, but the production of food is less With already deficit forest land and with more mining coming up in forest land the study area is sure to show total degradation Mining area being far above the scientific mining restriction of 0.1% TGA with further increase in mining would leading to severe Increase in wastelands due to mining activity
Ecosystem survival indicators Forest growth Forest land around 11% as against
the sustainable level of 33% The biomass productivity of the forest is very low due to the low stem density per hectare and other forest degradation factors. This scenario can only worsen with increasing mining
Livestock population Cattle density very high With 6 lakh grazing cattle in the district and with only 0.5% of TGA available as grazing land most of the cattle have to depend on already degraded forest land. Added to this are goat and sheep population. Total unsustainable livestock density in the study region in the present scenario and will further worsen in future if cattle sheep and goat population increases
Biodiversity Sustenance and productivity of flora and fauna is low
Increase in mining activity is leading to dwindling of forest and biodiversity.
Crop productivity As more than 62 % of the total geographical area (TGA) is under agriculture with the crop intensity of more than 1.2 the carrying capacity of the land has exceeded the sustainable limit
The Crop productivity is also declining over years in horticulture crops due to unsustainable agriculture practices at landscape level and increase in mining

Study on Carrying Capacity to develop Industrial Siting Guidelines in Bellary, Hospet and Sandur region
Environmental Management And Policy Research Institute 180
Indicator Present Scenario Carrying Capacity Scenario Mining productivity Mining is done in 1508 ha i.e.
0.39% of TGA resulting in extensive environmental problems
It should be restricted to 0.1 % TGA through scientific mining.
Land productivity Soil productivity of the study area is very low due to inherent climatic and edaphic factors
Average organic carbon content of the soil is less than 0.5 in the study area indicating the low productivity potentiality of the site more agricultural land is becoming uncultivable due to salinity and alkalinity problems


Study on Carrying Capacity to develop Industrial Siting Guidelines in Bellary, Hospet and Sandur region
Environmental Management And Policy Research Institute 181
CHAPTER CHAPTER 1515 FEASIBILITY OF PUMPIFEASIBILITY OF PUMPI NG NG WATER FROM ALAMATTI WATER FROM ALAMATTI RESERVOIRRESERVOIR
15.1 Background of Almatti Dam
Almatti dam is a component of the ongoing Upper Krishna Project on Krishna River
in Bagalkot district of Karnataka constructed by the Government of Karnataka along with the
Narayanpur Dam across the river Krishna. The main storage is at Almatti Dam, a few
kilometers downstream of the confluence of Ghataprabha River and Krishna river while the
lower dam at Narayanpur is a few kilometers downstream of the confluence of Malaprabha
river and Krishna river and serves as a diversion dam. The project is planned to be
implemented in different stages and phases. Stage-I of the project plans to utilise 119 TMC
of water to irrigate 4,25,000 hectares of lands on the left bank of the river. In Stage-II 54
TMC (thousand million cubic feet) of water will be utilised, to irrigate 1, 97,120 Ha. of land
partly by flow on right bank and partly by lifting to higher levels on the left and right bank.
The dam functions as a conservation structure for releasing water to Narayanpur dam
for irrigation to the drought prone areas of Bijapur, Gulburga and Raichur districts. The link
canal off takes from right bank of Almatti reservoir with FRL 510.00 m. The principal levels
and corresponding storages of the reservoir are furnished in Table below.
Table 15.1: Principal levels and corresponding storages of Almatti reservoir
Level (m) Storage (Mm3) FRL (Full Reservoir Level) 519.600 3439.70 DSL (Dead Storage Level0 504.744 335.00
The Almatti reservoir (Stage -II) submerges a total area of about 490 sq.km at FRL
519.6m, which lies in Bagalkot district of Karnataka state. No sedimentation studies of the
reservoir have been carried out after impounding. A portion of the fine sediment entering the
reservoir during floods may flow out through the water drawn through the link canal and
hence the introduction of link canal will help in increasing the life of reservoir.

Study on Carrying Capacity to develop Industrial Siting Guidelines in Bellary, Hospet and Sandur region
Environmental Management And Policy Research Institute 182
Table 15.2: Salient features of the upper krishna project stage I and stage II
Stage 1: Almatti Dam details
Sl. No. Particular Details
1 Name of the project Upper Krishna-I (Alamatti) 2 Location (a) Near by village/Town Alamatti (b) Taluk Bagewadi (c) District Bijapur (d) Latitude 160 19' 48" N (e) Longitude 750 53' 15" E 3 Catchment area in sq.km. 33,375 4 75 % dependable yield (tmc) 743.64 5 Storage in tmc (a) Gross 42.19 (b) Live (above MDDL) 29.73 (c ) Dead (below cill) 12.47 6 Utilisation in tmc (a) Withdrawals by canals (b) Reservoir losses (c ) Water supply (d ) Total 7 Dam (a) Type Composite (b) Length 1565.15 M (c ) Height 23.31 M (d) MWL 512.06 M (e) FRL 512.06 M (f) MDDL 504.75 M (g) Cill 509.02 M 8 Spillway (a) Location Central (b) Length 486.50 M (c) Flood lift 15.24 M (d) Discharge (cumecs) 31,000 (e) Crest gates i) Nos. 26 ii) Size in mtrs. 15 x 15.24 M (radial) 9 Submergence (a) Area in Ha. 24,230 (b) Villages affected 136 ( c) Population 1,80,000 10 Irrigation in Ha. 16,200 11 Canals (a) Almatti left bank canal 103 km. Length (b) Irrigation in Ha. 16,200
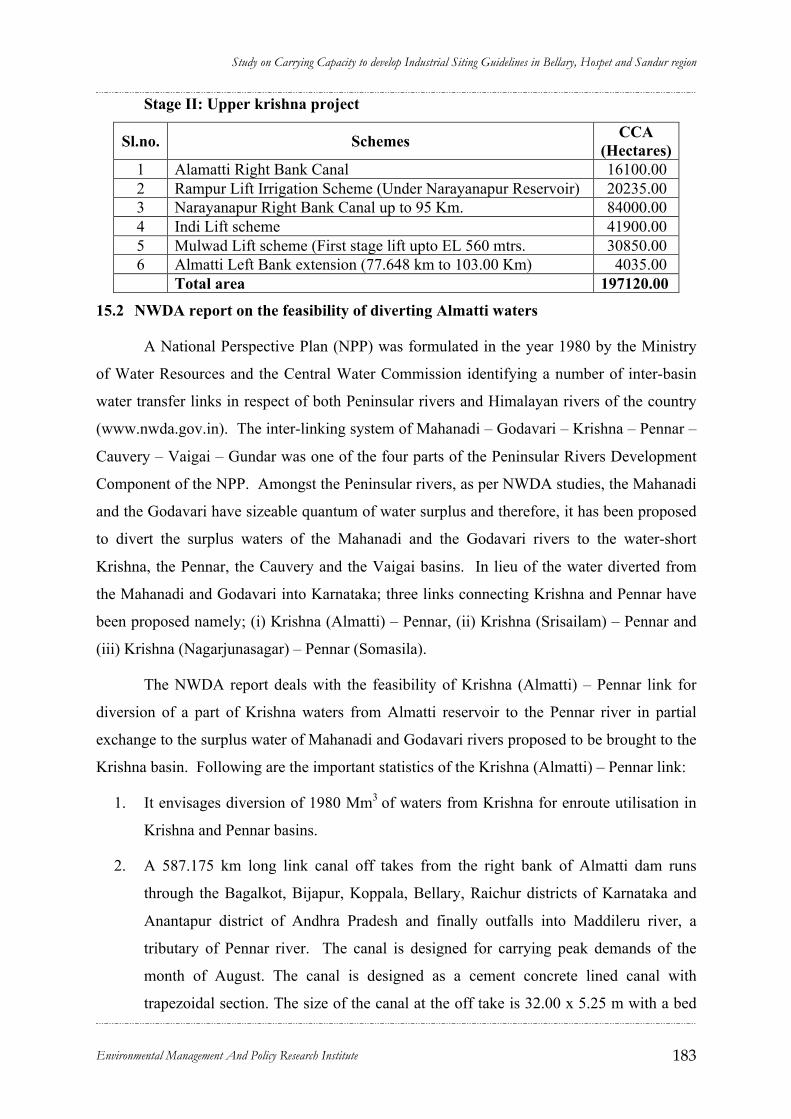
Study on Carrying Capacity to develop Industrial Siting Guidelines in Bellary, Hospet and Sandur region
Environmental Management And Policy Research Institute 183
Stage II: Upper krishna project
Sl.no. Schemes CCA (Hectares)
1 Alamatti Right Bank Canal 16100.00 2 Rampur Lift Irrigation Scheme (Under Narayanapur Reservoir) 20235.00 3 Narayanapur Right Bank Canal up to 95 Km. 84000.00 4 Indi Lift scheme 41900.00 5 Mulwad Lift scheme (First stage lift upto EL 560 mtrs. 30850.00 6 Almatti Left Bank extension (77.648 km to 103.00 Km) 4035.00
Total area 197120.00
15.2 NWDA report on the feasibility of diverting Almatti waters
A National Perspective Plan (NPP) was formulated in the year 1980 by the Ministry
of Water Resources and the Central Water Commission identifying a number of inter-basin
water transfer links in respect of both Peninsular rivers and Himalayan rivers of the country
(www.nwda.gov.in). The inter-linking system of Mahanadi – Godavari – Krishna – Pennar –
Cauvery – Vaigai – Gundar was one of the four parts of the Peninsular Rivers Development
Component of the NPP. Amongst the Peninsular rivers, as per NWDA studies, the Mahanadi
and the Godavari have sizeable quantum of water surplus and therefore, it has been proposed
to divert the surplus waters of the Mahanadi and the Godavari rivers to the water-short
Krishna, the Pennar, the Cauvery and the Vaigai basins. In lieu of the water diverted from
the Mahanadi and Godavari into Karnataka; three links connecting Krishna and Pennar have
been proposed namely; (i) Krishna (Almatti) – Pennar, (ii) Krishna (Srisailam) – Pennar and
(iii) Krishna (Nagarjunasagar) – Pennar (Somasila).
The NWDA report deals with the feasibility of Krishna (Almatti) – Pennar link for
diversion of a part of Krishna waters from Almatti reservoir to the Pennar river in partial
exchange to the surplus water of Mahanadi and Godavari rivers proposed to be brought to the
Krishna basin. Following are the important statistics of the Krishna (Almatti) – Pennar link:
1. It envisages diversion of 1980 Mm3 of waters from Krishna for enroute utilisation in
Krishna and Pennar basins.
2. A 587.175 km long link canal off takes from the right bank of Almatti dam runs
through the Bagalkot, Bijapur, Koppala, Bellary, Raichur districts of Karnataka and
Anantapur district of Andhra Pradesh and finally outfalls into Maddileru river, a
tributary of Pennar river. The canal is designed for carrying peak demands of the
month of August. The canal is designed as a cement concrete lined canal with
trapezoidal section. The size of the canal at the off take is 32.00 x 5.25 m with a bed
Study on Carrying Capacity to develop Industrial Siting Guidelines in Bellary, Hospet and Sandur region
Environmental Management And Policy Research Institute 184
slope of 1 in 20000. Out of the total length of 587.175 km, five tunnels constituting to
a total length of 35.660 km are proposed to cross the ridges to avoid heavy cutting.
The maximum diameter of the tunnel is 13.60 m with a bed slope of 1 in 10000.
3. The annual irrigation proposed through the link is 258334 ha which comprises 16334
ha in Middle Krishna sub-basin, 46224 ha in Tungabhadra subbasin, 83741 ha in
Vedavathi sub-basin and 112035 ha in Upper Pennar sub-basin.
4. The annual utilization in Middle Krishna, Tungabhadra and Vedavathi sub-basins will
be 85 Mm3, 253 Mm3 and 505 Mm3 respectively while the same in Upper Pennar sub-
basin will be 871 Mm3 as per the suggested cropping pattern.
5. Apart from irrigation, it is also proposed to provide for future domestic and industrial
water requirements in the command area. Additional domestic and industrial
requirements, projected to 2050 AD, are estimated to be 22 Mm3 and 34 Mm3
respectively.
6. Transmission loss in the link canal is estimated to be 210 Mm3.
7. A power house is proposed at the canal off take with an installed capacity of 13.5
MW and annual power generation of about 42.5 MU.
8. The total cost of the link project has been estimated under three units, viz., i) Head
works, ii) Canal system and iii) Power house. The schedule of construction of the
link is planned for a period of 10 years. The total cost of the link project is estimated
to be Rs.6599.80 crores at 2003-04 price level. The cost per Mm3 of water diverted
works out to Rs.3.33 crores.
9. The benefit-cost ratio of the whole project has been worked out considering the
annual cost of the project and the annual benefits from the project and is found to be
1.20. The internal rate of return of the project with and without distributional and
employment impacts works out to 14.26% and 9.51% respectively.
The objective of the feasibility report was mainly to facilitate firming up of the
proposals and for discussions among the concerned States to arrive at broad agreements on
the quantum of diversion and utilisation of water, sharing of cost and benefits, etc. Detailed
topographical survey of the proposed canal alignment was carried out by NWDA. Special
surveys / Investigations such as Geophysical investigation, Geotechnical Investigation,
Borrow area survey, Construction material survey, Environmental, ecological and socio-

Study on Carrying Capacity to develop Industrial Siting Guidelines in Bellary, Hospet and Sandur region
Environmental Management And Policy Research Institute 185
economic survey, etc., were got carried out through Geological Survey of India [GSI],
Central Water Commission [CWC], Central Soil and Materials Research Station [CSMRS],
Pune University, a private consultancy firm, etc. Details of various surveys, investigations,
hydrology, design and layout of structures, estimates, etc., are covered

Study on Carrying Capacity to develop Industrial Siting Guidelines in Bellary, Hospet and Sandur region
Environmental Management And Policy Research Institute 186
• BIJAPUR
KRISHNA
• SHIIoIOGA
N D
BASIN
KARNATAKA
t:HITRADURGA
(
I C .
. r'
• IoWiBUBNAGAR
P ESH PENNAR BASIN
~1i<.i o;:,;L !
... n ""....,... _._-
.,""..,.,.... -...,""-~ "" !.,. -~ ..... """ .... ~ """""""", ... _--, ..-.. ",.~"u -'q~ ---.- • • • ~ ....... ""."", ....... - -
..... _-, ...... __ ... -.... _.,...-..." .... ""-"' .. _ .... _..... "' .. -, .. -'-...... ,-.. -.... ~. '--.... ~"' . ..-......-. .--' .... .. ---"" ...... - ... -~ .... -.... ........ _,'..., ... ''''., ........ ....
MINISTRY OF WATER RESOURCES NATIONAL WATER DEVELOPMENT AGENCY
• BIJAPUR
KRISHNA
• SHIIoIOGA
N D
BASIN
KARNATAKA
(:HITRADURGA,
(
I C . . r'
• MAHBUBNAGAR
P ESH BASIN
+, s
1."<.iij1!>l' ......... ""'" _.- -""""""""'- -..., ... ~ ,, "- .!.-~ ..... ,-_ . ~ .-'-""""""'---.-..-.,,,, ... ~ -.- ---.- • • • < • • ",. ",,-, .. -. - -
..... _-, ...... __ ... _"' .. _ ..... -..." ... ""-'-"-"-.... _ .. -, .. -'~ ...... ' ..... _ .. _'.' '"-... ~ .... -........ --'- .. ---""..- ~- ... - ...... -... ........ _, ... , _""".,tt->~ .....
MINISTRY OF ..... ATER RESOURCES NATIONAL WATER DEVELOPMENT AGENCY

Study on Carrying Capacity to develop Industrial Siting Guidelines in Bellary, Hospet and Sandur region
Environmental Management And Policy Research Institute 187
15.3 Surface water balance studies
Surface water balance studies were carried out up to Almatti dam site in Krishna basin
and up to Somasila dam site (Terminal reservoir in Pennar basin) in Pennar basin by NWDA.
The water balance has been worked out after considering the future upstream demands up to
2050 AD. Details are given in Table 15.3.
Table 15.3: Surface water balance
Water balance (Mm3) Name of the diversion point
At 75% Dependability At 50% Dependability
Krishna basin up to Almatti dam (+) 5611 (+) 8247
Pennar basin up to Somasila dam (-) 3820 (-) 3590
It can be seen that the total surplus water balance available at Almatti at 75%
dependability is 5611 Mm3 out of which the proposed diversion is 1980 Mm3. However this
diversion is in exchange for the water brought from Mahanadi and Godavari basins to
Krishna basin. Even though the surplus water available at Almatti dam is estimated as 5611
Mm3, this water could not be considered as surplus as per the downstream commitments as
envisaged under the provisions of the KWDT. Hence, the present diversion under the Krishna
(Almatti) – Pennar link, proposed as a scheme based on the principle of substitution and
exchange.
15.4 The KWDT award
The competitive claims of the riparian states for the utilisation of the waters of the
Krishna basin have given rise to disputes amongst them for sharing of the water. Eventually,
the Central Government constituted the Krishna Water Disputes Tribunal (KWDT) and
referred various disputes for adjudication. As per the Tribunal, the availability of water in the
Krishna basin at 75% dependability is 2060 TMC (58333 Mm3). The Tribunal allocated this
quantity of water, among the riparian states as indicated in Table 15.4 below.
Table 15.4: State-wise water allocation as per KWDT award
Sl. No. State Allocated quantum
TMC (Mm3) Allocated regenerated flows
TMC (Mm3) 1 Maharashtra 560 (15857) 25 (708) 2 Karnataka 700 (19822) 34 (963) 3 Andhra Pradesh 800 (22654) 11 (311)
Total 2060 (58333) 70 (1982)

Study on Carrying Capacity to develop Industrial Siting Guidelines in Bellary, Hospet and Sandur region
Environmental Management And Policy Research Institute 188
The Govt. of Maharashtra, Karnataka, & AP have agreed to spare a quantum of 5
TMC (142 Mm3) each out of their respective allocation by KWDT for water supply to
Chennai city.
There is a proposal formulated by the Govt. of Andhra Pradesh for transfer of 2265
Mm3 (80 TMC) water from Polavaram dam on Godavari to Prakasam Barrage on Krishna for
irrigation in Krishna delta area. This proposal was endorsed by the Godavari Water Disputes
Tribunal (GWDT). According to this proposal, 2265 Mm3 of water to be received in Krishna
river at Prakasam Barrage would be utilised to take over the command in Krishna delta,
which otherwise is served by the existing Nagarjunasagar project. This arrangement provides
for utilisation of an equivalent quantity under projects upstream of Nagarjunasagar dam. This
proposal was concurred by the Governments of Andhra Pradesh and Karnataka by an
agreement entered into in August 1978. This quantum of 2265 Mm3 of water so conserved in
Krishna would be shared among Andhra Pradesh, Maharashtra and Karnataka in the order of
1274 Mm3, 396 Mm3and 595 Mm3 respectively.
15.5 Analysis of the NWDA report
1. Reduction in power generation: The simulation studies carried out by Karnataka
Power Corporation shows that the average power generation at Almatti with FRL at
519.60 m is about 800 MU. With the introduction of link canal, the reduction in
power generation is 85.5 MU (nearly 10%). The reduction in power generation is said
to get eliminated by further raising the FRL of Almatti reservoir as envisaged in
Upper Krishna Project, which is in contention. A power house is proposed at the
canal off take at Kalvapalli with an installed capacity of 13.5 MW and annual power
generation of about 42.5 MU.
2. Wildlife loss: The NWDA report states that about 71 ha of forest land is required to
be acquired for the proposed link canal. The report also states that the project area
(the canal) consists of 61% forestland, 31.6% cultivable wasteland 7.03%
uncultivable land. The report admits that “Location of proposed link canal will
partially affect wildlife due to reduction, disturbance and loss of habitat. The proposed
link canal through Daroji Bear Sanctuary will create hindrance in wildlife movement
migration path due to canal. However, apart from stating “…As a large forest area is
available, wildlife will temporarily migrate to the higher reaches of forest hence,
impact on wildlife and endangered species will be the minimum. As regards the
Study on Carrying Capacity to develop Industrial Siting Guidelines in Bellary, Hospet and Sandur region
Environmental Management And Policy Research Institute 189
Natural reserve in the form of Daroji Bear Sanctuary, possibilities of realignment
should be explored involving minimum protected area” there is no mention as to how
the realignment should be carried out. Moreover, a paltry provision of Rs. 15 lakhs
has been made in the project cost for improvement of Environment and Ecology.”
3. Cropping pattern changes: The project is said to bring about more than 258334ha
under irrigation of which 16334 ha is in Middle Krishna sub-basin, 46224 ha is in
Tungabhadra subbasin, 83741 ha is in Vedavathi sub-basin and 112035 ha is in Upper
Pennar sub-basin..
4. Impacts on historical and cultural monuments: No mention of the archeological
place of Hampi is found in the report. As more and more excavations are being
carried out, the impact of the link canal on the city of Hampi needs to be looked into
in great depth.
5. Pollution of surface water: The report raises the issue of pollution of surface water
at proposed Kalvapalli reservoir through silting and sedimentation, nutrient leaching
and agricultural runoff. However, the remediation/mitigation measures is not stated
clearly.
6. Issue of salinity: Salinity arising due to water logging problems is addressed in the
report. However, the impact of changed cropping patterns on the salinity is not
addressed. What needs to be addressed is the wrong cropping patterns taken up by
farmers which results is over water application leading to water logging in turn
leading to salinity.
7. Introduction of species: Tree species mainly eucalyptus (Eucalyptus tereticornis) and
bamboo (Bambusa arundinacea) have been recommended for preventing water
logging by controlling the rise of water table. These species are not native to the
region. More emphasis should be given to native species.
8. Impact on mining and vice versa: The impact of the link canal water on the mining
areas in Bellary has not been addressed in the report. A very detailed analysis of the
issues of water usage, sedimentation in the canal, canal strength especially near
blasting area, abstraction of water for both mining and mining based industries needs
to be carried out.
9. Only environmental benefits have been addressed.

Study on Carrying Capacity to develop Industrial Siting Guidelines in Bellary, Hospet and Sandur region
Environmental Management And Policy Research Institute 190
15.6 Further studies:
The report prepared by NWDA shows that the Krishna – Pennar link is feasible.
However, the environmental issues mentioned in the above section need to be looked into in
more depth. Though the NWDA report on the Krishna-Pennar link shows that the link would
be passing through the Bellary district, the feasibility of pumping water from Alamatti
reservoir for industrial needs in Bellary has not been addressed. With the exponential
increase in the mining activity in Bellary the availability of water both for mining and mining
based industries needs to be studied keeping in view various hydrology, design and layout of
structures, canal alignment studies, geophysical investigation, geotechnical investigation,
borrow area survey, construction material survey, environmental, ecological and socio-
economic survey, etc. The various studies could not be carried out, as it was not the scope of
this report. Even secondary data collection was not available. This requires a very in depth
study and hence could not be addressed in this study. Hence, it is suggested that the
feasibility study be taken up as a new project.
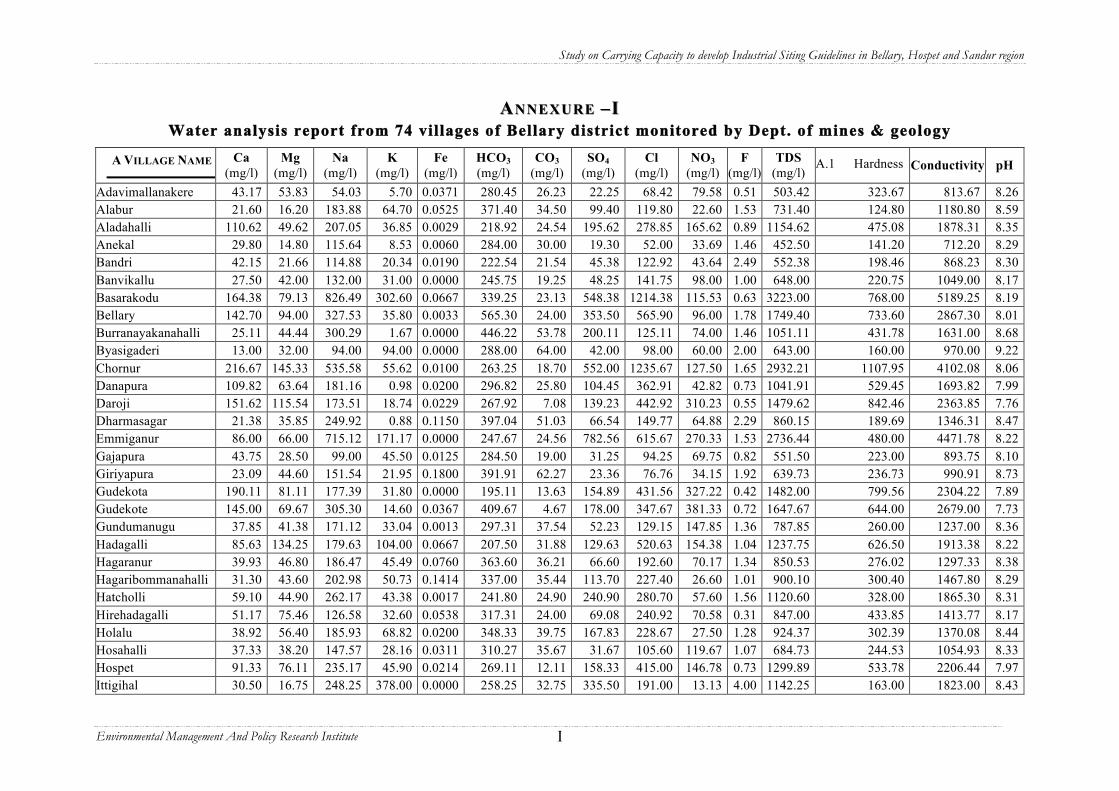
Study on Carrying Capacity to develop Industrial Siting Guidelines in Bellary, Hospet and Sandur region
Environmental Management And Policy Research Institute I
AA NNEXURE NNEXURE –– II Water analysis report from 74 villages of Bellary district monitored by Dept. of mines & geology
A VILLAGE NAME Ca (mg/l)
Mg (mg/l)
Na (mg/l)
K (mg/l)
Fe (mg/l)
HCO3 (mg/l)
CO3 (mg/l)
SO4 (mg/l)
Cl (mg/l)
NO3 (mg/l)
F (mg/l)
TDS (mg/l)
A.1 Hardness Conductivity pH
Adavimallanakere 43.17 53.83 54.03 5.70 0.0371 280.45 26.23 22.25 68.42 79.58 0.51 503.42 323.67 813.67 8.26 Alabur 21.60 16.20 183.88 64.70 0.0525 371.40 34.50 99.40 119.80 22.60 1.53 731.40 124.80 1180.80 8.59 Aladahalli 110.62 49.62 207.05 36.85 0.0029 218.92 24.54 195.62 278.85 165.62 0.89 1154.62 475.08 1878.31 8.35 Anekal 29.80 14.80 115.64 8.53 0.0060 284.00 30.00 19.30 52.00 33.69 1.46 452.50 141.20 712.20 8.29 Bandri 42.15 21.66 114.88 20.34 0.0190 222.54 21.54 45.38 122.92 43.64 2.49 552.38 198.46 868.23 8.30 Banvikallu 27.50 42.00 132.00 31.00 0.0000 245.75 19.25 48.25 141.75 98.00 1.00 648.00 220.75 1049.00 8.17 Basarakodu 164.38 79.13 826.49 302.60 0.0667 339.25 23.13 548.38 1214.38 115.53 0.63 3223.00 768.00 5189.25 8.19 Bellary 142.70 94.00 327.53 35.80 0.0033 565.30 24.00 353.50 565.90 96.00 1.78 1749.40 733.60 2867.30 8.01 Burranayakanahalli 25.11 44.44 300.29 1.67 0.0000 446.22 53.78 200.11 125.11 74.00 1.46 1051.11 431.78 1631.00 8.68 Byasigaderi 13.00 32.00 94.00 94.00 0.0000 288.00 64.00 42.00 98.00 60.00 2.00 643.00 160.00 970.00 9.22 Chornur 216.67 145.33 535.58 55.62 0.0100 263.25 18.70 552.00 1235.67 127.50 1.65 2932.21 1107.95 4102.08 8.06 Danapura 109.82 63.64 181.16 0.98 0.0200 296.82 25.80 104.45 362.91 42.82 0.73 1041.91 529.45 1693.82 7.99 Daroji 151.62 115.54 173.51 18.74 0.0229 267.92 7.08 139.23 442.92 310.23 0.55 1479.62 842.46 2363.85 7.76 Dharmasagar 21.38 35.85 249.92 0.88 0.1150 397.04 51.03 66.54 149.77 64.88 2.29 860.15 189.69 1346.31 8.47 Emmiganur 86.00 66.00 715.12 171.17 0.0000 247.67 24.56 782.56 615.67 270.33 1.53 2736.44 480.00 4471.78 8.22 Gajapura 43.75 28.50 99.00 45.50 0.0125 284.50 19.00 31.25 94.25 69.75 0.82 551.50 223.00 893.75 8.10 Giriyapura 23.09 44.60 151.54 21.95 0.1800 391.91 62.27 23.36 76.76 34.15 1.92 639.73 236.73 990.91 8.73 Gudekota 190.11 81.11 177.39 31.80 0.0000 195.11 13.63 154.89 431.56 327.22 0.42 1482.00 799.56 2304.22 7.89 Gudekote 145.00 69.67 305.30 14.60 0.0367 409.67 4.67 178.00 347.67 381.33 0.72 1647.67 644.00 2679.00 7.73 Gundumanugu 37.85 41.38 171.12 33.04 0.0013 297.31 37.54 52.23 129.15 147.85 1.36 787.85 260.00 1237.00 8.36 Hadagalli 85.63 134.25 179.63 104.00 0.0667 207.50 31.88 129.63 520.63 154.38 1.04 1237.75 626.50 1913.38 8.22 Hagaranur 39.93 46.80 186.47 45.49 0.0760 363.60 36.21 66.60 192.60 70.17 1.34 850.53 276.02 1297.33 8.38 Hagaribommanahalli 31.30 43.60 202.98 50.73 0.1414 337.00 35.44 113.70 227.40 26.60 1.01 900.10 300.40 1467.80 8.29 Hatcholli 59.10 44.90 262.17 43.38 0.0017 241.80 24.90 240.90 280.70 57.60 1.56 1120.60 328.00 1865.30 8.31 Hirehadagalli 51.17 75.46 126.58 32.60 0.0538 317.31 24.00 69.08 240.92 70.58 0.31 847.00 433.85 1413.77 8.17 Holalu 38.92 56.40 185.93 68.82 0.0200 348.33 39.75 167.83 228.67 27.50 1.28 924.37 302.39 1370.08 8.44 Hosahalli 37.33 38.20 147.57 28.16 0.0311 310.27 35.67 31.67 105.60 119.67 1.07 684.73 244.53 1054.93 8.33 Hospet 91.33 76.11 235.17 45.90 0.0214 269.11 12.11 158.33 415.00 146.78 0.73 1299.89 533.78 2206.44 7.97 Ittigihal 30.50 16.75 248.25 378.00 0.0000 258.25 32.75 335.50 191.00 13.13 4.00 1142.25 163.00 1823.00 8.43
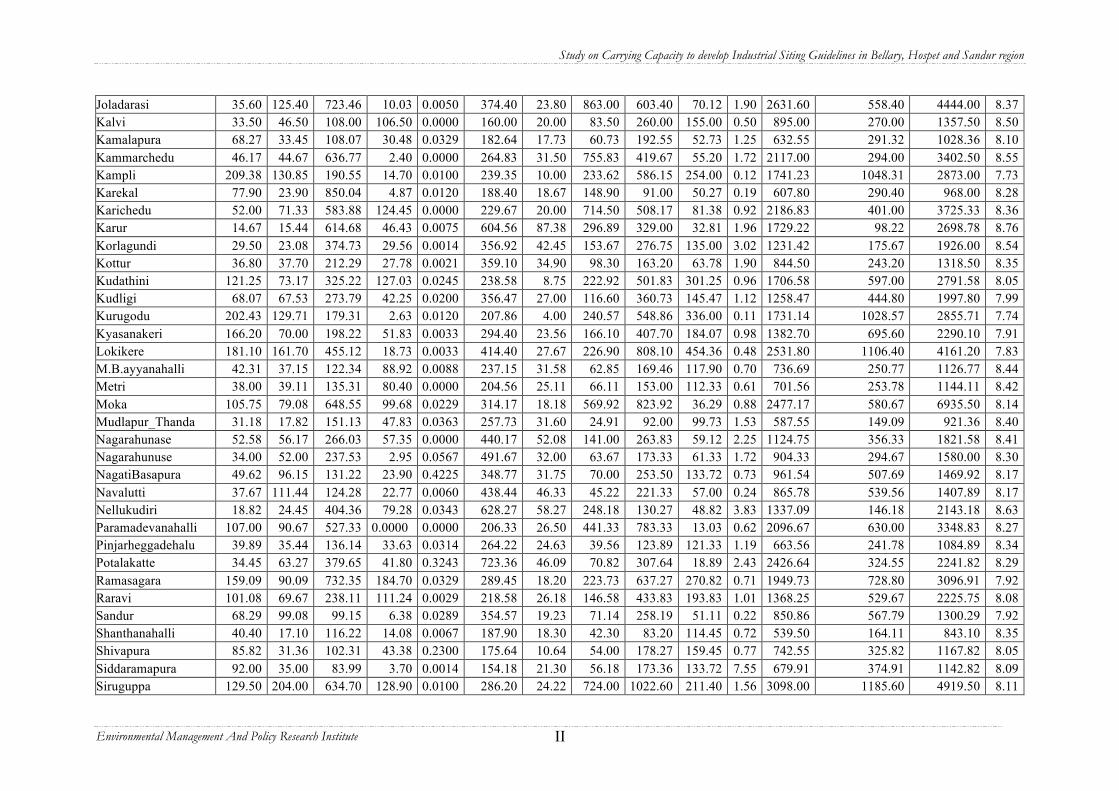
Study on Carrying Capacity to develop Industrial Siting Guidelines in Bellary, Hospet and Sandur region
Environmental Management And Policy Research Institute II
Joladarasi 35.60 125.40 723.46 10.03 0.0050 374.40 23.80 863.00 603.40 70.12 1.90 2631.60 558.40 4444.00 8.37 Kalvi 33.50 46.50 108.00 106.50 0.0000 160.00 20.00 83.50 260.00 155.00 0.50 895.00 270.00 1357.50 8.50 Kamalapura 68.27 33.45 108.07 30.48 0.0329 182.64 17.73 60.73 192.55 52.73 1.25 632.55 291.32 1028.36 8.10 Kammarchedu 46.17 44.67 636.77 2.40 0.0000 264.83 31.50 755.83 419.67 55.20 1.72 2117.00 294.00 3402.50 8.55 Kampli 209.38 130.85 190.55 14.70 0.0100 239.35 10.00 233.62 586.15 254.00 0.12 1741.23 1048.31 2873.00 7.73 Karekal 77.90 23.90 850.04 4.87 0.0120 188.40 18.67 148.90 91.00 50.27 0.19 607.80 290.40 968.00 8.28 Karichedu 52.00 71.33 583.88 124.45 0.0000 229.67 20.00 714.50 508.17 81.38 0.92 2186.83 401.00 3725.33 8.36 Karur 14.67 15.44 614.68 46.43 0.0075 604.56 87.38 296.89 329.00 32.81 1.96 1729.22 98.22 2698.78 8.76 Korlagundi 29.50 23.08 374.73 29.56 0.0014 356.92 42.45 153.67 276.75 135.00 3.02 1231.42 175.67 1926.00 8.54 Kottur 36.80 37.70 212.29 27.78 0.0021 359.10 34.90 98.30 163.20 63.78 1.90 844.50 243.20 1318.50 8.35 Kudathini 121.25 73.17 325.22 127.03 0.0245 238.58 8.75 222.92 501.83 301.25 0.96 1706.58 597.00 2791.58 8.05 Kudligi 68.07 67.53 273.79 42.25 0.0200 356.47 27.00 116.60 360.73 145.47 1.12 1258.47 444.80 1997.80 7.99 Kurugodu 202.43 129.71 179.31 2.63 0.0120 207.86 4.00 240.57 548.86 336.00 0.11 1731.14 1028.57 2855.71 7.74 Kyasanakeri 166.20 70.00 198.22 51.83 0.0033 294.40 23.56 166.10 407.70 184.07 0.98 1382.70 695.60 2290.10 7.91 Lokikere 181.10 161.70 455.12 18.73 0.0033 414.40 27.67 226.90 808.10 454.36 0.48 2531.80 1106.40 4161.20 7.83 M.B.ayyanahalli 42.31 37.15 122.34 88.92 0.0088 237.15 31.58 62.85 169.46 117.90 0.70 736.69 250.77 1126.77 8.44 Metri 38.00 39.11 135.31 80.40 0.0000 204.56 25.11 66.11 153.00 112.33 0.61 701.56 253.78 1144.11 8.42 Moka 105.75 79.08 648.55 99.68 0.0229 314.17 18.18 569.92 823.92 36.29 0.88 2477.17 580.67 6935.50 8.14 Mudlapur_Thanda 31.18 17.82 151.13 47.83 0.0363 257.73 31.60 24.91 92.00 99.73 1.53 587.55 149.09 921.36 8.40 Nagarahunase 52.58 56.17 266.03 57.35 0.0000 440.17 52.08 141.00 263.83 59.12 2.25 1124.75 356.33 1821.58 8.41 Nagarahunuse 34.00 52.00 237.53 2.95 0.0567 491.67 32.00 63.67 173.33 61.33 1.72 904.33 294.67 1580.00 8.30 NagatiBasapura 49.62 96.15 131.22 23.90 0.4225 348.77 31.75 70.00 253.50 133.72 0.73 961.54 507.69 1469.92 8.17 Navalutti 37.67 111.44 124.28 22.77 0.0060 438.44 46.33 45.22 221.33 57.00 0.24 865.78 539.56 1407.89 8.17 Nellukudiri 18.82 24.45 404.36 79.28 0.0343 628.27 58.27 248.18 130.27 48.82 3.83 1337.09 146.18 2143.18 8.63 Paramadevanahalli 107.00 90.67 527.33 0.0000 0.0000 206.33 26.50 441.33 783.33 13.03 0.62 2096.67 630.00 3348.83 8.27 Pinjarheggadehalu 39.89 35.44 136.14 33.63 0.0314 264.22 24.63 39.56 123.89 121.33 1.19 663.56 241.78 1084.89 8.34 Potalakatte 34.45 63.27 379.65 41.80 0.3243 723.36 46.09 70.82 307.64 18.89 2.43 2426.64 324.55 2241.82 8.29 Ramasagara 159.09 90.09 732.35 184.70 0.0329 289.45 18.20 223.73 637.27 270.82 0.71 1949.73 728.80 3096.91 7.92 Raravi 101.08 69.67 238.11 111.24 0.0029 218.58 26.18 146.58 433.83 193.83 1.01 1368.25 529.67 2225.75 8.08 Sandur 68.29 99.08 99.15 6.38 0.0289 354.57 19.23 71.14 258.19 51.11 0.22 850.86 567.79 1300.29 7.92 Shanthanahalli 40.40 17.10 116.22 14.08 0.0067 187.90 18.30 42.30 83.20 114.45 0.72 539.50 164.11 843.10 8.35 Shivapura 85.82 31.36 102.31 43.38 0.2300 175.64 10.64 54.00 178.27 159.45 0.77 742.55 325.82 1167.82 8.05 Siddaramapura 92.00 35.00 83.99 3.70 0.0014 154.18 21.30 56.18 173.36 133.72 7.55 679.91 374.91 1142.82 8.09 Siruguppa 129.50 204.00 634.70 128.90 0.0100 286.20 24.22 724.00 1022.60 211.40 1.56 3098.00 1185.60 4919.50 8.11

Study on Carrying Capacity to develop Industrial Siting Guidelines in Bellary, Hospet and Sandur region
Environmental Management And Policy Research Institute III
Somalapura 36.38 58.80 165.56 32.02 0.0213 338.79 38.59 55.08 201.92 57.05 0.92 794.69 326.46 1248.77 8.46 Somasamudram 201.10 205.80 1209.95 11.77 0.0040 314.50 24.44 2130.80 846.50 201.50 1.38 5053.60 1327.60 7803.80 8.06 Suseelanagar 47.64 104.91 113.46 15.33 0.0133 428.73 38.45 43.00 227.27 37.09 0.19 840.64 538.91 1352.27 8.06 Tambrahalli 28.00 50.00 90.50 106.00 0.0000 128.00 29.00 66.00 198.50 108.10 0.63 688.50 270.00 1056.50 8.60 Taranagar 36.50 35.50 103.45 16.60 0.0380 247.51 31.36 25.63 101.25 58.41 0.38 524.25 233.25 831.13 8.48 Tekkalakote 94.60 116.00 562.67 38.80 0.0120 275.30 29.56 727.70 630.80 25.16 2.32 2341.60 701.60 3744.80 8.18 Thumati_Tanda 35.82 64.82 99.74 14.65 0.0043 297.18 41.36 90.82 82.73 75.18 1.09 653.00 348.73 1026.64 8.42 Torangal 69.19 97.63 308.16 29.74 0.0145 293.50 20.80 193.69 425.63 228.25 1.08 1500.81 563.75 2399.69 8.17 Ujjini 122.31 151.85 386.86 66.72 0.0386 338.15 15.42 197.46 771.31 300.72 0.20 1938.23 914.62 3396.08 7.92 Vaddarahalli 29.10 59.60 135.14 34.10 0.0200 360.50 41.80 49.60 108.70 63.30 1.22 690.80 306.40 1086.60 8.40 Varadapura 21.00 25.00 155.50 125.00 0.0000 203.50 41.50 62.00 144.00 22.75 0.93 654.50 152.00 965.00 8.48 Grand Total 76.47 69.07 284.81 46.96 0.0398 314.31 29.41 208.17 344.64 122.71 1.31 1308.25 468.73 2113.00 8.23
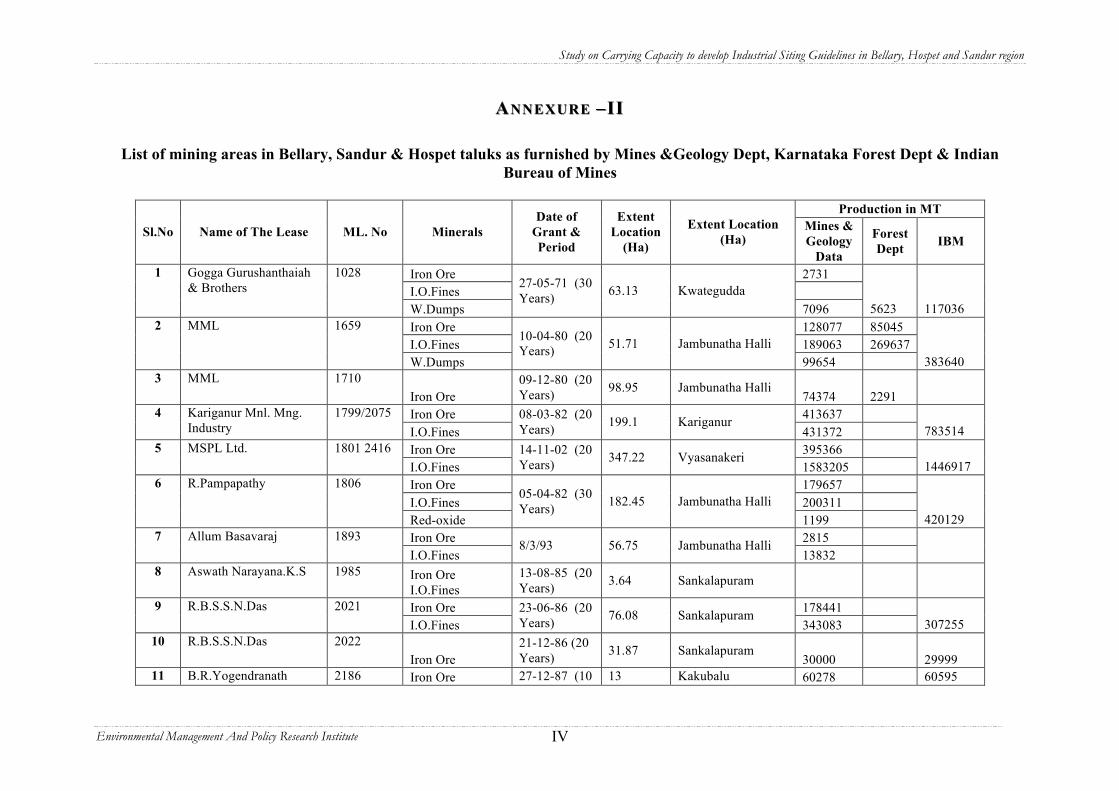
Study on Carrying Capacity to develop Industrial Siting Guidelines in Bellary, Hospet and Sandur region
Environmental Management And Policy Research Institute IV
AA NNEXURE NNEXURE –– IIII
List of mining areas in Bellary, Sandur & Hospet taluks as furnished by Mines &Geology Dept, Karnataka Forest Dept & Indian Bureau of Mines
Production in MT
Sl.No Name of The Lease ML. No Minerals Date of
Grant & Period
Extent Location
(Ha)
Extent Location (Ha)
Mines & Geology
Data
Forest Dept IBM
Iron Ore 2731 I.O.Fines
1 Gogga Gurushanthaiah & Brothers
1028
W.Dumps
27-05-71 (30 Years) 63.13 Kwategudda
7096 5623 117036 Iron Ore 128077 85045 I.O.Fines 189063 269637
2 MML 1659
W.Dumps
10-04-80 (20 Years) 51.71 Jambunatha Halli
99654 383640 3 MML 1710
Iron Ore 09-12-80 (20 Years) 98.95 Jambunatha Halli
74374 2291 Iron Ore 413637 4 Kariganur Mnl. Mng.
Industry 1799/2075
I.O.Fines 08-03-82 (20 Years) 199.1 Kariganur
431372 783514 Iron Ore 395366 5 MSPL Ltd. 1801 2416 I.O.Fines
14-11-02 (20 Years) 347.22 Vyasanakeri
1583205 1446917 Iron Ore 179657 I.O.Fines 200311
6 R.Pampapathy 1806
Red-oxide
05-04-82 (30 Years) 182.45 Jambunatha Halli
1199 420129 Iron Ore 2815 7 Allum Basavaraj 1893 I.O.Fines
8/3/93 56.75 Jambunatha Halli 13832
8 Aswath Narayana.K.S 1985 Iron Ore I.O.Fines
13-08-85 (20 Years) 3.64 Sankalapuram
Iron Ore 178441 9 R.B.S.S.N.Das 2021 I.O.Fines
23-06-86 (20 Years) 76.08 Sankalapuram
343083 307255 10 R.B.S.S.N.Das 2022
Iron Ore 21-12-86 (20 Years) 31.87 Sankalapuram
30000 29999 11 B.R.Yogendranath 2186 Iron Ore 27-12-87 (10 13 Kakubalu 60278 60595
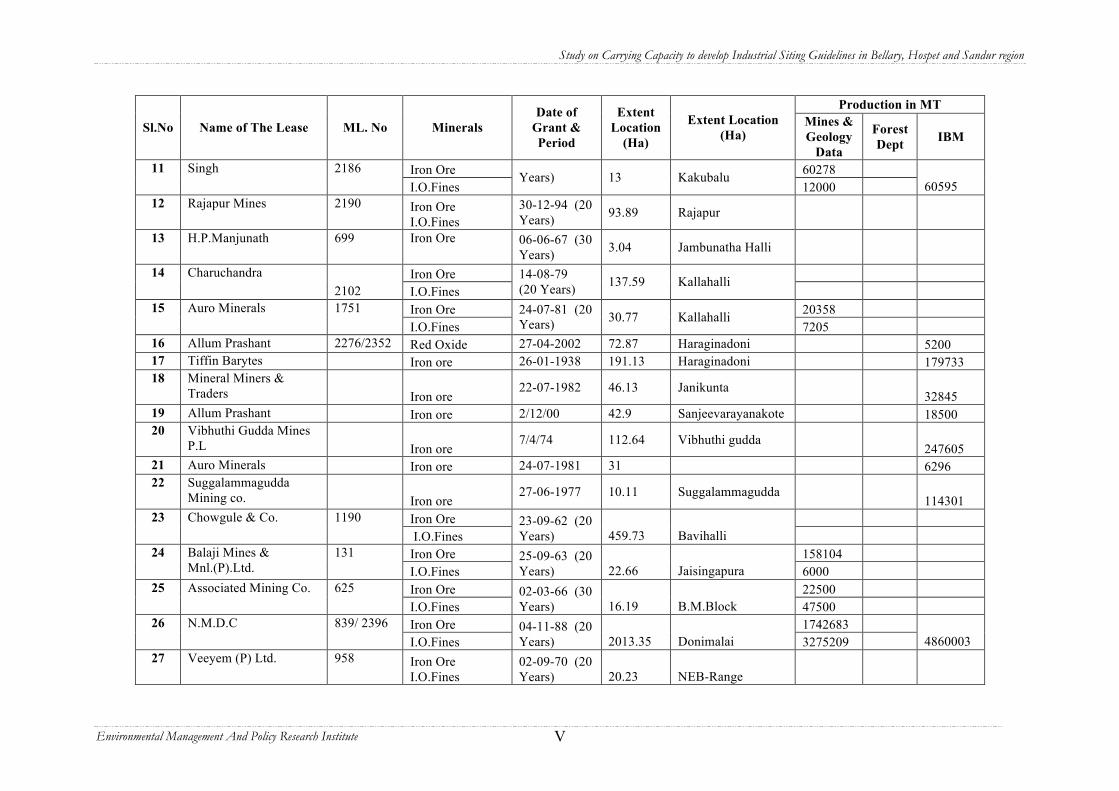
Study on Carrying Capacity to develop Industrial Siting Guidelines in Bellary, Hospet and Sandur region
Environmental Management And Policy Research Institute V
Production in MT
Sl.No Name of The Lease ML. No Minerals Date of
Grant & Period
Extent Location
(Ha)
Extent Location (Ha)
Mines & Geology
Data
Forest Dept IBM
Iron Ore 60278 11 Singh 2186 I.O.Fines
Years) 13 Kakubalu 12000 60595
12 Rajapur Mines 2190 Iron Ore I.O.Fines
30-12-94 (20 Years) 93.89 Rajapur
13 H.P.Manjunath 699 Iron Ore 06-06-67 (30
Years) 3.04 Jambunatha Halli
Iron Ore 14 Charuchandra 2102 I.O.Fines
14-08-79 (20 Years) 137.59 Kallahalli
Iron Ore 20358 15 Auro Minerals 1751 I.O.Fines
24-07-81 (20 Years) 30.77 Kallahalli
7205 16 Allum Prashant 2276/2352 Red Oxide 27-04-2002 72.87 Haraginadoni 5200 17 Tiffin Barytes Iron ore 26-01-1938 191.13 Haraginadoni 179733 18 Mineral Miners &
Traders
Iron ore 22-07-1982 46.13 Janikunta
32845 19 Allum Prashant Iron ore 2/12/00 42.9 Sanjeevarayanakote 18500 20 Vibhuthi Gudda Mines
P.L
Iron ore 7/4/74 112.64 Vibhuthi gudda
247605 21 Auro Minerals Iron ore 24-07-1981 31 6296 22 Suggalammagudda
Mining co.
Iron ore 27-06-1977 10.11 Suggalammagudda
114301 Iron Ore 23 Chowgule & Co. 1190 I.O.Fines
23-09-62 (20 Years) 459.73 Bavihalli
Iron Ore 158104 24 Balaji Mines & Mnl.(P).Ltd.
131 I.O.Fines
25-09-63 (20 Years) 22.66 Jaisingapura 6000
Iron Ore 22500 25 Associated Mining Co. 625 I.O.Fines
02-03-66 (30 Years) 16.19 B.M.Block 47500
Iron Ore 1742683 26 N.M.D.C 839/ 2396 I.O.Fines
04-11-88 (20 Years) 2013.35 Donimalai 3275209 4860003
27 Veeyem (P) Ltd. 958 Iron Ore I.O.Fines
02-09-70 (20 Years) 20.23 NEB-Range

Study on Carrying Capacity to develop Industrial Siting Guidelines in Bellary, Hospet and Sandur region
Environmental Management And Policy Research Institute VI
Production in MT
Sl.No Name of The Lease ML. No Minerals Date of
Grant & Period
Extent Location
(Ha)
Extent Location (Ha)
Mines & Geology
Data
Forest Dept IBM
Iron Ore 65316 28 N.M.D.C 1111 I.O.Fines
18-10-72 (30 Years) 647.5 Kumarswamy 105366 162347
Iron Ore I.O.Fines
29 M.M.L 995
Wdumps
20-09-70 (20 Years)
80.94 Ubbalagundi
Iron Ore 149000 30 S.B.Minerals 1114/2393 I.O.Fines
30-11-92 (20 Years) 40.47 Ramghad 600000 92000
Iron Ore 287845 31 Sandur Mn.& I.O. Ltd 1179 I.O.Fines
01-01-74 ( 20 Years)
7511.04 Devagiri 674213
Iron Ore 178300 32 S.B.Minerals 1301 I.O.Fines
17-01-76 (30 Years) 44.52 NEB-Range 770000
Iron Ore 12670 33 N.Manzoor Ahmed 1324 I.O.Fines
07-04-76 (30 Years) 15.97 NEB-Range 12010
34 Narayan Mines (P) Ltd 1602 Iron Ore I.O.Fines
23-01-77 (20 Years) 109.27 A.M.Pendra
Iron Ore 18000 20500 35 K.M.Parvathamma 1625 I.O.Fines
21-09-73 (20 Years) 121.41 Rajapur 11000 0
Iron Ore 185100 36 S.V.Srinivasulu 1634 I.O.Fines
28-05-79 (20 Years) 149.73 Jaisingapur 46911 271497
Iron Ore 2980 37 Trident Mng.Co.(P) Ltd 1732 I.O.Fines
01-01-89 (10 Years) 5.26 RM.Durga 51773 40124
Iron Ore 38 Gogga Gurushanthaiah & Brothers
1874 I.O.Fines
04-09-83 (20 Years)
18.21 N.E.Block 7098 7019
Iron Ore 288074 39 Lakshmi Narayana Mining.Co
1876/2487 I.O.Fines
21-05-03 (20 Years) 175.63 Karadikolla 953322 874538
Iron Ore 109020 40 R.M.M.P.L. (Sachidananda Minerals)
1894/2451
I.O.Fines 30-01-03 (20 Years) 24.28 Venkatagiri 380574 474276
Iron Ore 235650 41 P.Balasubba Setty & Son
1898/2006 I.O.Fines
05-09-83 (10 Years) 44.11 Karadikolla 262251 497900
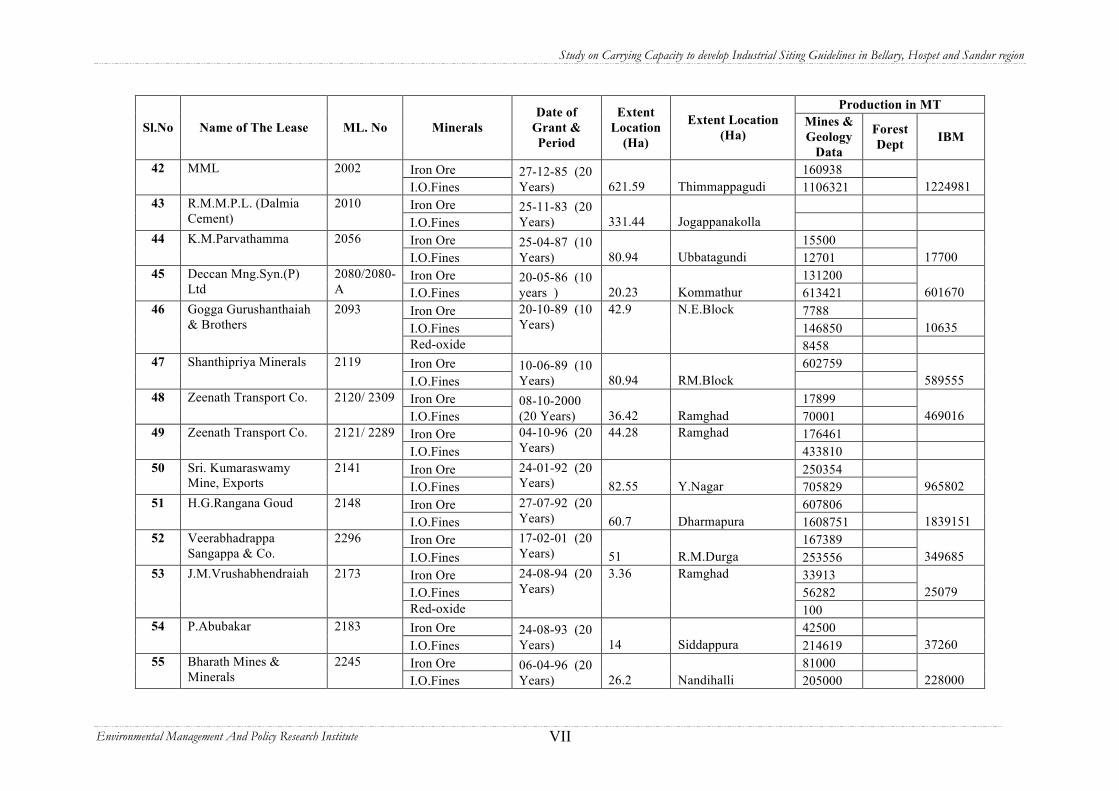
Study on Carrying Capacity to develop Industrial Siting Guidelines in Bellary, Hospet and Sandur region
Environmental Management And Policy Research Institute VII
Production in MT
Sl.No Name of The Lease ML. No Minerals Date of
Grant & Period
Extent Location
(Ha)
Extent Location (Ha)
Mines & Geology
Data
Forest Dept IBM
Iron Ore 160938 42 MML 2002 I.O.Fines
27-12-85 (20 Years) 621.59 Thimmappagudi 1106321 1224981
Iron Ore 43 R.M.M.P.L. (Dalmia Cement)
2010 I.O.Fines
25-11-83 (20 Years) 331.44 Jogappanakolla
Iron Ore 15500 44 K.M.Parvathamma 2056 I.O.Fines
25-04-87 (10 Years) 80.94 Ubbatagundi 12701 17700
Iron Ore 131200 45 Deccan Mng.Syn.(P) Ltd
2080/2080-A I.O.Fines
20-05-86 (10 years ) 20.23 Kommathur 613421 601670
Iron Ore 7788 I.O.Fines 146850 10635
46 Gogga Gurushanthaiah & Brothers
2093
Red-oxide
20-10-89 (10 Years)
42.9 N.E.Block
8458 Iron Ore 602759 47 Shanthipriya Minerals 2119 I.O.Fines
10-06-89 (10 Years) 80.94 RM.Block 589555
Iron Ore 17899 48 Zeenath Transport Co. 2120/ 2309 I.O.Fines
08-10-2000 (20 Years) 36.42 Ramghad 70001 469016
Iron Ore 176461 49 Zeenath Transport Co. 2121/ 2289 I.O.Fines
04-10-96 (20 Years)
44.28 Ramghad 433810
Iron Ore 250354 50 Sri. Kumaraswamy Mine, Exports
2141 I.O.Fines
24-01-92 (20 Years) 82.55 Y.Nagar 705829 965802
Iron Ore 607806 51 H.G.Rangana Goud 2148 I.O.Fines
27-07-92 (20 Years) 60.7 Dharmapura 1608751 1839151
Iron Ore 167389 52 Veerabhadrappa Sangappa & Co.
2296 I.O.Fines
17-02-01 (20 Years) 51 R.M.Durga 253556 349685
Iron Ore 33913 I.O.Fines 56282 25079
53 J.M.Vrushabhendraiah 2173
Red-oxide
24-08-94 (20 Years)
3.36 Ramghad
100 Iron Ore 42500 54 P.Abubakar 2183 I.O.Fines
24-08-93 (20 Years) 14 Siddappura 214619 37260
Iron Ore 81000 55 Bharath Mines & Minerals
2245 I.O.Fines
06-04-96 (20 Years) 26.2 Nandihalli 205000 228000

Study on Carrying Capacity to develop Industrial Siting Guidelines in Bellary, Hospet and Sandur region
Environmental Management And Policy Research Institute VIII
Production in MT
Sl.No Name of The Lease ML. No Minerals Date of
Grant & Period
Extent Location
(Ha)
Extent Location (Ha)
Mines & Geology
Data
Forest Dept IBM
Iron Ore 133058 56 H.R.Gaviappa 2247 2483 I.O.Fines
02-04-02 (14 Years) 34 Navalatti 104122 270293
Iron Ore 57 A.M.Minerals 2278 I.O.Fines
31-07-2000 (20 Years) 2.02 RM.Block 59500
Iron Ore 548403 427352 58 V.S.Lad & Sons 2290 I.O.Fines
31-07-96 (20 Years) 105.06 S.J.Haravu 1151942 1700351
Iron Ore 259928 59 Veerabhadrappa Sangappa & Co.
2160 I.O.Fines
19-10-92 (20 Years) 18.62 RMB Range 414221 612067
Iron Ore 375197 60 Hothur Traders 2313 I.O.Fines
23-12-98 (20 Years) 21.11 Malgolla 905220 1214015
Iron Ore 126745 61 Tirdent Minerals 2315 I.O.Fines
10-05-93 (20 Years) 32.27 Venkatagiri 194931 307374
Iron Ore 62 Mineral Syndicate 2320 I.O.Fines
08-04-02 (10 Years) 2.12 NEB Range
Iron Ore 33422 63 Muneer Enterprises 2339 I.O.Fines
12-02-02 (20 Years) 36.42 NEB Range 398060 364507
Iron Ore 17600 64 Ambika Ghorpade 2354 I.O.Fines 15-06-02 4.95 Kommathur 355069 218600 Iron Ore 621421 65 M.M.L W.P I.O.Fines
13-04-99 (20 Years) 168.02 Subbarayanahalli 1045319
Iron Ore 48326 66 Tungabhadra Mineral Pvt Ltd
2365 I.O.Fines
30-07-88 (20 Years) 125.58 Taranagar 377049 723628
Iron Ore 93716 67 Tungabhadra Mineral Pvt Ltd
2366 I.O.Fines
14-01-88 (20 Years) 33.97 Taranagar 277123
Iron Ore 68 Aswathnarayana Singh & Co.
626 I.O.Fines
24-03-66 (30 Years) 129.49 Jaisingapura
Iron Ore 24587 69 Mahaboob Transport 109 I.O.Fines
21-09-62 (30Years) 16.19 Vittalapura 118725
70 P.Venganna Setty & Bros
1046 I.O.Fines
21-07-72 (20 Years) 123.84 NEB Range 99976
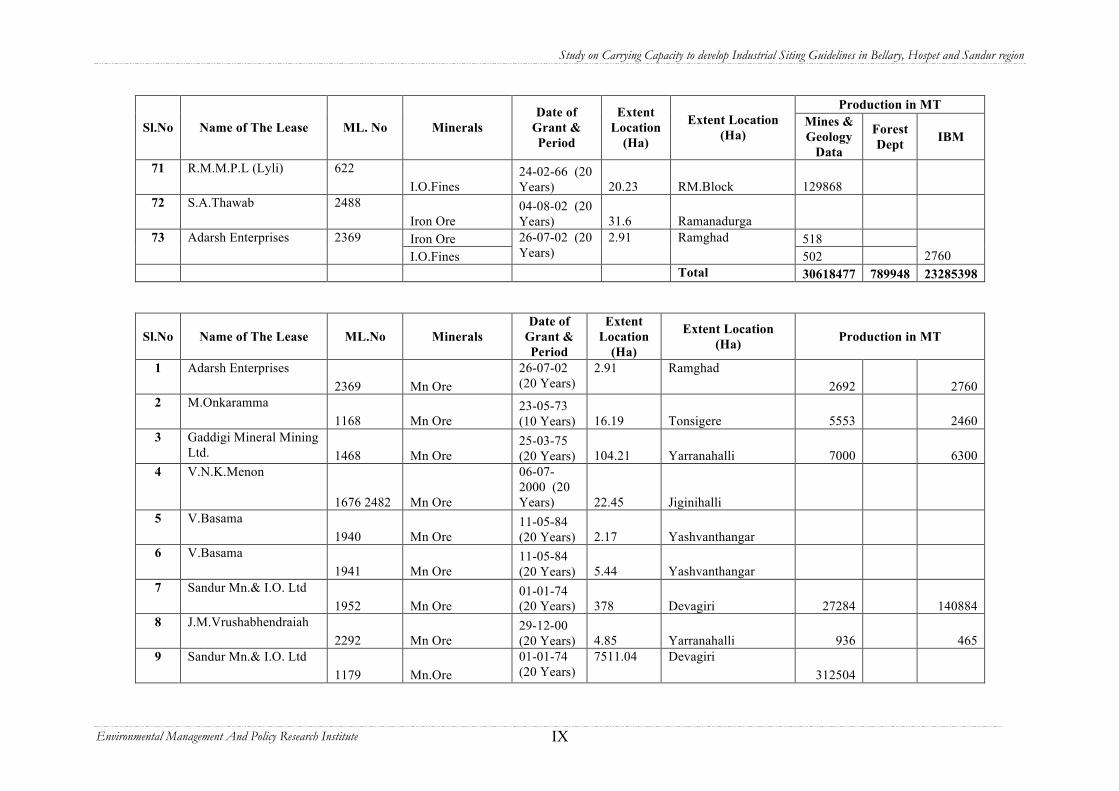
Study on Carrying Capacity to develop Industrial Siting Guidelines in Bellary, Hospet and Sandur region
Environmental Management And Policy Research Institute IX
Production in MT
Sl.No Name of The Lease ML. No Minerals Date of
Grant & Period
Extent Location
(Ha)
Extent Location (Ha)
Mines & Geology
Data
Forest Dept IBM
71 R.M.M.P.L (Lyli) 622 I.O.Fines
24-02-66 (20 Years) 20.23 RM.Block 129868
72 S.A.Thawab 2488 Iron Ore
04-08-02 (20 Years) 31.6 Ramanadurga
Iron Ore 518 73 Adarsh Enterprises 2369 I.O.Fines
26-07-02 (20 Years)
2.91 Ramghad 502 2760
Total 30618477 789948 23285398
Sl.No Name of The Lease ML.No Minerals Date of
Grant & Period
Extent Location
(Ha)
Extent Location (Ha) Production in MT
1 Adarsh Enterprises 2369 Mn Ore
26-07-02 (20 Years)
2.91 Ramghad 2692 2760
2 M.Onkaramma 1168 Mn Ore
23-05-73 (10 Years) 16.19 Tonsigere 5553 2460
3 Gaddigi Mineral Mining Ltd. 1468 Mn Ore
25-03-75 (20 Years) 104.21 Yarranahalli 7000 6300
4 V.N.K.Menon
1676 2482 Mn Ore
06-07-2000 (20 Years) 22.45 Jiginihalli
5 V.Basama 1940 Mn Ore
11-05-84 (20 Years) 2.17 Yashvanthangar
6 V.Basama 1941 Mn Ore
11-05-84 (20 Years) 5.44 Yashvanthangar
7 Sandur Mn.& I.O. Ltd 1952 Mn Ore
01-01-74 (20 Years) 378 Devagiri 27284 140884
8 J.M.Vrushabhendraiah 2292 Mn Ore
29-12-00 (20 Years) 4.85 Yarranahalli 936 465
9 Sandur Mn.& I.O. Ltd 1179 Mn.Ore
01-01-74 (20 Years)
7511.04 Devagiri 312504
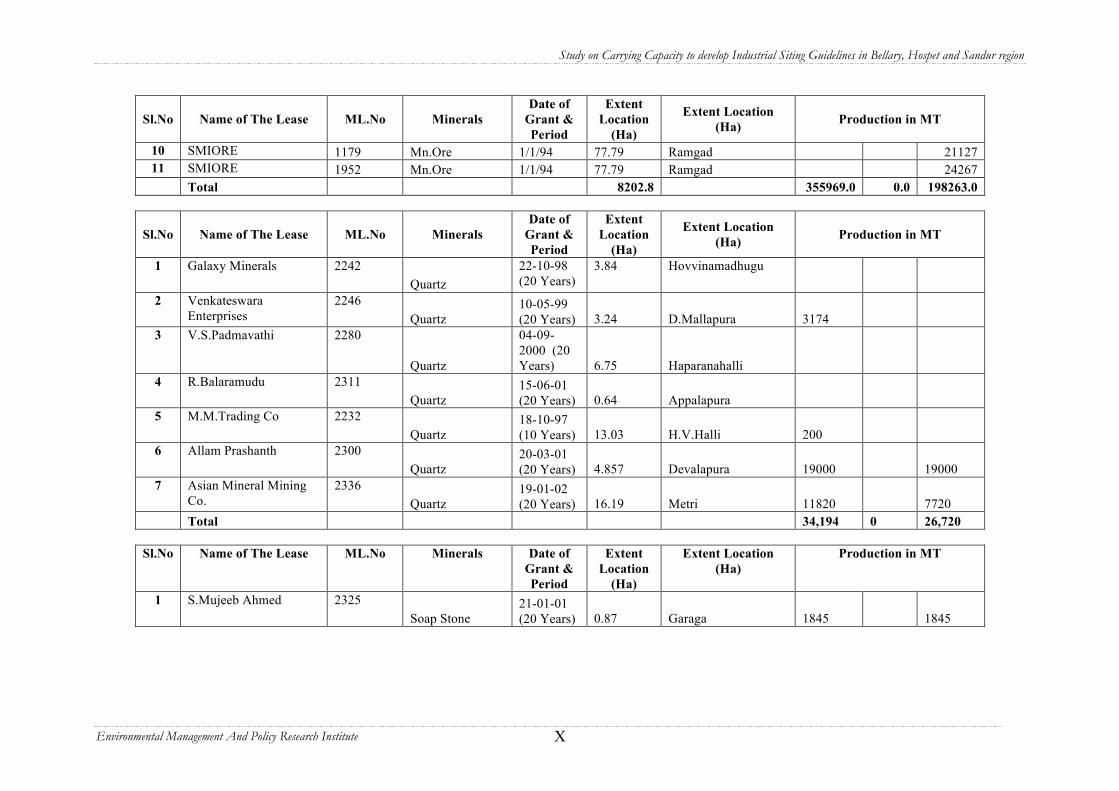
Study on Carrying Capacity to develop Industrial Siting Guidelines in Bellary, Hospet and Sandur region
Environmental Management And Policy Research Institute X
Sl.No Name of The Lease ML.No Minerals Date of
Grant & Period
Extent Location
(Ha)
Extent Location (Ha) Production in MT
10 SMIORE 1179 Mn.Ore 1/1/94 77.79 Ramgad 21127 11 SMIORE 1952 Mn.Ore 1/1/94 77.79 Ramgad 24267
Total 8202.8 355969.0 0.0 198263.0
Sl.No Name of The Lease ML.No Minerals Date of
Grant & Period
Extent Location
(Ha)
Extent Location (Ha) Production in MT
1 Galaxy Minerals 2242 Quartz
22-10-98 (20 Years)
3.84 Hovvinamadhugu
2 Venkateswara Enterprises
2246 Quartz
10-05-99 (20 Years) 3.24 D.Mallapura 3174
3 V.S.Padmavathi 2280
Quartz
04-09-2000 (20 Years) 6.75 Haparanahalli
4 R.Balaramudu 2311 Quartz
15-06-01 (20 Years) 0.64 Appalapura
5 M.M.Trading Co 2232 Quartz
18-10-97 (10 Years) 13.03 H.V.Halli 200
6 Allam Prashanth 2300 Quartz
20-03-01 (20 Years) 4.857 Devalapura 19000 19000
7 Asian Mineral Mining Co.
2336 Quartz
19-01-02 (20 Years) 16.19 Metri 11820 7720
Total 34,194 0 26,720
Sl.No Name of The Lease ML.No Minerals Date of Grant & Period
Extent Location
(Ha)
Extent Location (Ha)
Production in MT
1 S.Mujeeb Ahmed 2325 Soap Stone
21-01-01 (20 Years) 0.87 Garaga 1845 1845
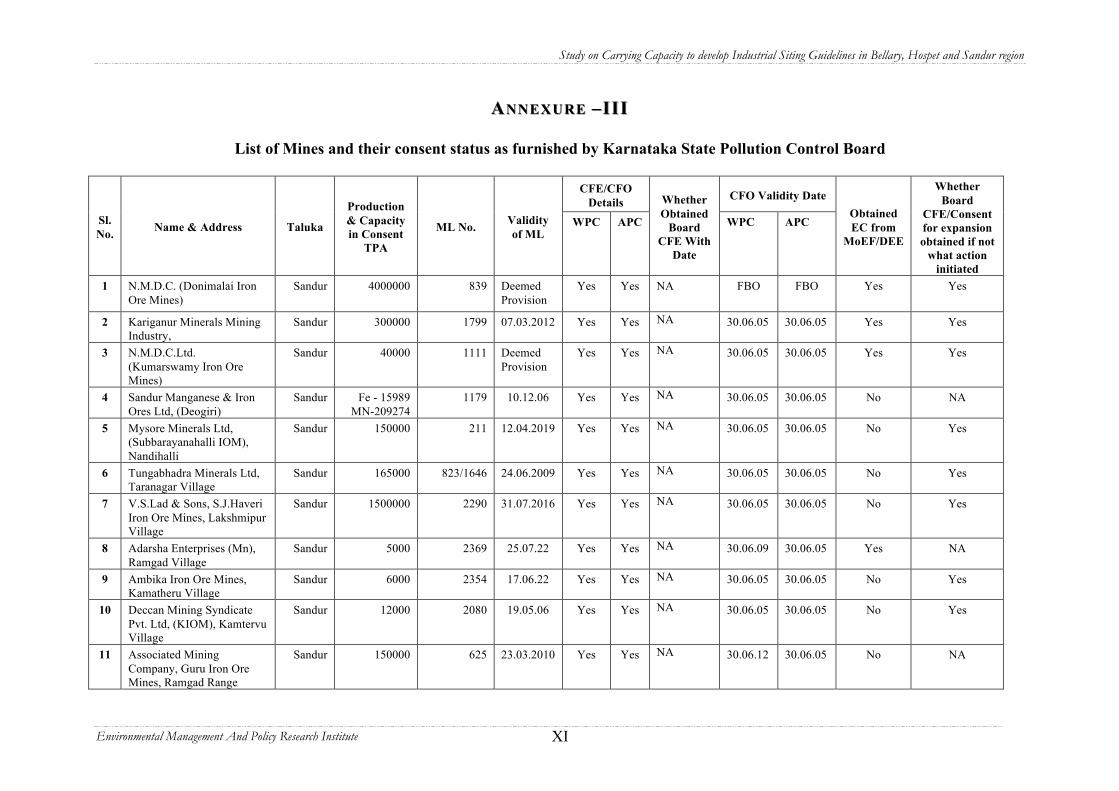
Study on Carrying Capacity to develop Industrial Siting Guidelines in Bellary, Hospet and Sandur region
Environmental Management And Policy Research Institute XI
AA NNEXURE NNEXURE –– IIIIII
List of Mines and their consent status as furnished by Karnataka State Pollution Control Board
CFE/CFO Details CFO Validity Date
Sl. No. Name & Address Taluka
Production & Capacity in Consent
TPA
ML No. Validity of ML
WPC APC
Whether Obtained
Board CFE With
Date
WPC APC Obtained EC from
MoEF/DEE
Whether Board
CFE/Consent for expansion obtained if not
what action initiated
1 N.M.D.C. (Donimalai Iron Ore Mines)
Sandur 4000000 839 Deemed Provision
Yes Yes NA FBO FBO Yes Yes
2 Kariganur Minerals Mining Industry,
Sandur 300000 1799 07.03.2012 Yes Yes NA 30.06.05 30.06.05 Yes Yes
3 N.M.D.C.Ltd. (Kumarswamy Iron Ore Mines)
Sandur 40000 1111 Deemed Provision
Yes Yes NA 30.06.05 30.06.05 Yes Yes
4 Sandur Manganese & Iron Ores Ltd, (Deogiri)
Sandur Fe - 15989 MN-209274
1179 10.12.06 Yes Yes NA 30.06.05 30.06.05 No NA
5 Mysore Minerals Ltd, (Subbarayanahalli IOM), Nandihalli
Sandur 150000 211 12.04.2019 Yes Yes NA 30.06.05 30.06.05 No Yes
6 Tungabhadra Minerals Ltd, Taranagar Village
Sandur 165000 823/1646 24.06.2009 Yes Yes NA 30.06.05 30.06.05 No Yes
7 V.S.Lad & Sons, S.J.Haveri Iron Ore Mines, Lakshmipur Village
Sandur 1500000 2290 31.07.2016 Yes Yes NA 30.06.05 30.06.05 No Yes
8 Adarsha Enterprises (Mn), Ramgad Village
Sandur 5000 2369 25.07.22 Yes Yes NA 30.06.09 30.06.05 Yes NA
9 Ambika Iron Ore Mines, Kamatheru Village
Sandur 6000 2354 17.06.22 Yes Yes NA 30.06.05 30.06.05 No Yes
10 Deccan Mining Syndicate Pvt. Ltd, (KIOM), Kamtervu Village
Sandur 12000 2080 19.05.06 Yes Yes NA 30.06.05 30.06.05 No Yes
11 Associated Mining Company, Guru Iron Ore Mines, Ramgad Range
Sandur 150000 625 23.03.2010 Yes Yes NA 30.06.12 30.06.05 No NA
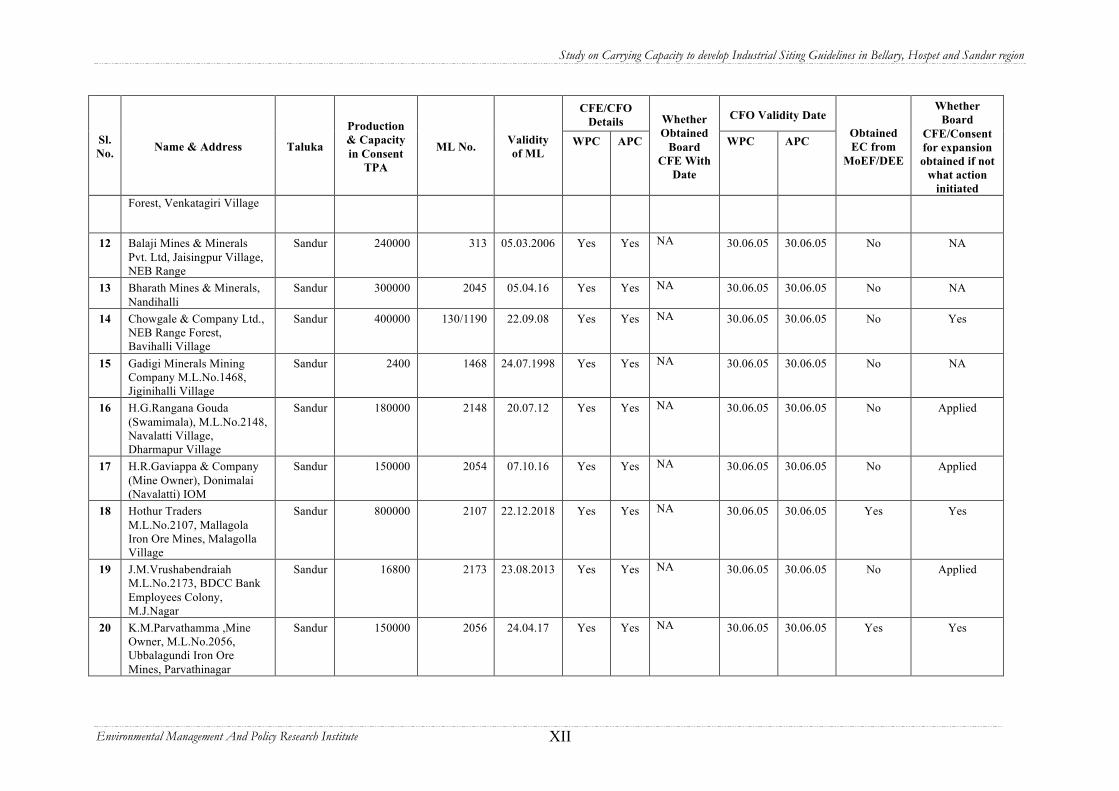
Study on Carrying Capacity to develop Industrial Siting Guidelines in Bellary, Hospet and Sandur region
Environmental Management And Policy Research Institute XII
CFE/CFO Details CFO Validity Date
Sl. No. Name & Address Taluka
Production & Capacity in Consent
TPA
ML No. Validity of ML
WPC APC
Whether Obtained
Board CFE With
Date
WPC APC Obtained EC from
MoEF/DEE
Whether Board
CFE/Consent for expansion obtained if not
what action initiated
Forest, Venkatagiri Village
12 Balaji Mines & Minerals Pvt. Ltd, Jaisingpur Village, NEB Range
Sandur 240000 313 05.03.2006 Yes Yes NA 30.06.05 30.06.05 No NA
13 Bharath Mines & Minerals, Nandihalli
Sandur 300000 2045 05.04.16 Yes Yes NA 30.06.05 30.06.05 No NA
14 Chowgale & Company Ltd., NEB Range Forest, Bavihalli Village
Sandur 400000 130/1190 22.09.08 Yes Yes NA 30.06.05 30.06.05 No Yes
15 Gadigi Minerals Mining Company M.L.No.1468, Jiginihalli Village
Sandur 2400 1468 24.07.1998 Yes Yes NA 30.06.05 30.06.05 No NA
16 H.G.Rangana Gouda (Swamimala), M.L.No.2148, Navalatti Village, Dharmapur Village
Sandur 180000 2148 20.07.12 Yes Yes NA 30.06.05 30.06.05 No Applied
17 H.R.Gaviappa & Company (Mine Owner), Donimalai (Navalatti) IOM
Sandur 150000 2054 07.10.16 Yes Yes NA 30.06.05 30.06.05 No Applied
18 Hothur Traders M.L.No.2107, Mallagola Iron Ore Mines, Malagolla Village
Sandur 800000 2107 22.12.2018 Yes Yes NA 30.06.05 30.06.05 Yes Yes
19 J.M.Vrushabendraiah M.L.No.2173, BDCC Bank Employees Colony, M.J.Nagar
Sandur 16800 2173 23.08.2013 Yes Yes NA 30.06.05 30.06.05 No Applied
20 K.M.Parvathamma ,Mine Owner, M.L.No.2056, Ubbalagundi Iron Ore Mines, Parvathinagar
Sandur 150000 2056 24.04.17 Yes Yes NA 30.06.05 30.06.05 Yes Yes

Study on Carrying Capacity to develop Industrial Siting Guidelines in Bellary, Hospet and Sandur region
Environmental Management And Policy Research Institute XIII
CFE/CFO Details CFO Validity Date
Sl. No. Name & Address Taluka
Production & Capacity in Consent
TPA
ML No. Validity of ML
WPC APC
Whether Obtained
Board CFE With
Date
WPC APC Obtained EC from
MoEF/DEE
Whether Board
CFE/Consent for expansion obtained if not
what action initiated
21 K.M.Parvathamma ,Mine Owner, M.L.No.2056, Ubbalagundi Iron Ore Mines, Parvathinagar
Sandur 180000 1625 03.02.10 Yes Yes NA 30.06.05 30.06.05 No NA
22 Lakshminarayana Mining Co. Siddapura Village
Sandur 850000 1876 20.05.03 Yes Yes NA 30.06.05 30.06.05 Yes Yes
23 Mehaboob Transport Company Vittal Iron Ore Mines, Vittalapur Village
Sandur ML.No.109 20.09.12 Yes Yes NA Refused Refused No NA, Recommended
for Closure 24 Mysore Minerals Ltd.
(Timmapannagudi) Sandur 600000 2022 29.09.20 Yes Yes NA 30.06.05 30.06.05 Yes Yes
25 Omkaramma Tonsigiri Managanese Mines, Tonsigiri Village
Sandur 7200 1168 30.13.10 Yes Yes NA 30.06.05 30.06.05 No N
26 P.Venganna Shetty & Bros Pathikonda Iron Ore Mines, Karadikolla, Jaisngpur Village
Sandur 24000 1046 Deemed Provision
Yes Yes NA 30.06.05 30.06.05 No Yes
27 S.A.Tawab (Mines Owner & Exporters), Ramgad Village
Sandur 18000 1770 Deemed Provision
Yes Yes NA 30.06.05 30.06.05 No NA
28 S.B.Minerals Ramgad Iron Ore Mines, Ramgad Village
Sandur 150000 1114 29.11.12 Yes Yes NA 30.06.05 30.06.05 No NA
29 S.B.Minerals Jaisingpur Iron Ore Mines, NEB Range
Sandur 30000 1301 16.01.06 Yes Yes NA 30.06.05 30.06.05 No Yes
30 Sri Shantipriya Minerals R.M.Block,
Sandur 225000 2119 24.08.09 Yes Yes NA 30.06.05 30.06.05 No Yes
31 The Sandur Manganese & Iron Ore Ltd . Deogiri,
Sandur MN-29106 1952 05.12.06 Yes Yes NA 30.06.05 30.06.05 No NA
32 Trident Minerals Venkatagiri Iron Ore Mines, Venkatagiri Village,
Sandur 30000 122 10.05.13 Yes Yes NA 30.06.05 30.06.05 No Applied
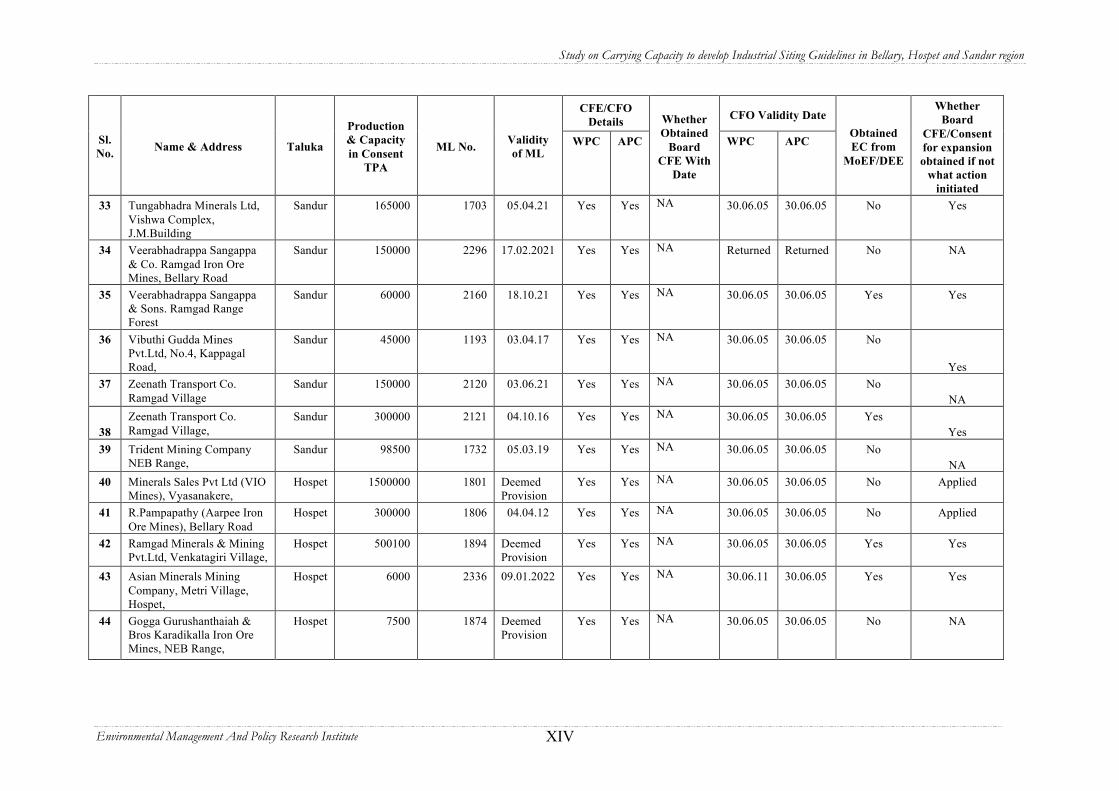
Study on Carrying Capacity to develop Industrial Siting Guidelines in Bellary, Hospet and Sandur region
Environmental Management And Policy Research Institute XIV
CFE/CFO Details CFO Validity Date
Sl. No. Name & Address Taluka
Production & Capacity in Consent
TPA
ML No. Validity of ML
WPC APC
Whether Obtained
Board CFE With
Date
WPC APC Obtained EC from
MoEF/DEE
Whether Board
CFE/Consent for expansion obtained if not
what action initiated
33 Tungabhadra Minerals Ltd, Vishwa Complex, J.M.Building
Sandur 165000 1703 05.04.21 Yes Yes NA 30.06.05 30.06.05 No Yes
34 Veerabhadrappa Sangappa & Co. Ramgad Iron Ore Mines, Bellary Road
Sandur 150000 2296 17.02.2021 Yes Yes NA Returned Returned No NA
35 Veerabhadrappa Sangappa & Sons. Ramgad Range Forest
Sandur 60000 2160 18.10.21 Yes Yes NA 30.06.05 30.06.05 Yes Yes
36 Vibuthi Gudda Mines Pvt.Ltd, No.4, Kappagal Road,
Sandur 45000 1193 03.04.17 Yes Yes NA 30.06.05 30.06.05 No
Yes 37 Zeenath Transport Co.
Ramgad Village Sandur 150000 2120 03.06.21 Yes Yes NA 30.06.05 30.06.05 No
NA
38 Zeenath Transport Co. Ramgad Village,
Sandur 300000 2121 04.10.16 Yes Yes NA 30.06.05 30.06.05 Yes Yes
39 Trident Mining Company NEB Range,
Sandur 98500 1732 05.03.19 Yes Yes NA 30.06.05 30.06.05 No NA
40 Minerals Sales Pvt Ltd (VIO Mines), Vyasanakere,
Hospet 1500000 1801 Deemed Provision
Yes Yes NA 30.06.05 30.06.05 No Applied
41 R.Pampapathy (Aarpee Iron Ore Mines), Bellary Road
Hospet 300000 1806 04.04.12 Yes Yes NA 30.06.05 30.06.05 No Applied
42 Ramgad Minerals & Mining Pvt.Ltd, Venkatagiri Village,
Hospet 500100 1894 Deemed Provision
Yes Yes NA 30.06.05 30.06.05 Yes Yes
43 Asian Minerals Mining Company, Metri Village, Hospet,
Hospet 6000 2336 09.01.2022 Yes Yes NA 30.06.11 30.06.05 Yes Yes
44 Gogga Gurushanthaiah & Bros Karadikalla Iron Ore Mines, NEB Range,
Hospet 7500 1874 Deemed Provision
Yes Yes NA 30.06.05 30.06.05 No NA

Study on Carrying Capacity to develop Industrial Siting Guidelines in Bellary, Hospet and Sandur region
Environmental Management And Policy Research Institute XV
CFE/CFO Details CFO Validity Date
Sl. No. Name & Address Taluka
Production & Capacity in Consent
TPA
ML No. Validity of ML
WPC APC
Whether Obtained
Board CFE With
Date
WPC APC Obtained EC from
MoEF/DEE
Whether Board
CFE/Consent for expansion obtained if not
what action initiated
45 Gogga Gurushanthaiah & Bros Jambunath, NEB Range, Jambunath IOM Kariganur Village
Hospet 180000 2093 1.8.2023 Yes Yes NA 30.06.05 30.06.05 No NA
46 H.P.Manjunatha SY.No.115 B, Jammbunathanahalli Village,
Hospet 2625 699 Deemed Provision
Yes Yes NA 30.06.05 30.06.05 No NA
47 Mehrunisa Iron Ore Mines Venkatagiri Village,
Hospet 15000 1324 07.04.06 Yes Yes NA 30.06.05 30.06.05 No NA
48 Mineral Syndicate 6/10 Hampi Road,
Hospet 24000 140 07.04.14 Yes Yes NA 30.06.05 30.06.05 No NA
49 Muneer Enterprises PVS Complex, Hampi Road,
Hospet 120000 2339 11.02.10 Yes Yes NA 30.06.05 30.06.05 No Yes
50 Mysore Minerals Ltd, (Jambunathana Halli), Jambunatha Temple Road
Hospet 420852 1659 Deemed Provision
Yes Yes NA 30.06.05 30.06.05 No Applied
51 P.Balasubba Setty & Sons Hampi Road,
Hospet 180000 1898 13.03.07 Yes Yes NA 30.06.05 30.06.05 No Yes
52 P.Abubakar, Mine Owner, Dam Road,
Hospet 30000 2183 11.04.04 Yes Yes NA 30.06.05 30.06.05 No Yes
53 R.B.Seth Shree Ram Narasingdas (S.Iron Ore Mines) Sanklapur Iron Ore Mines, P.B.No.38, Karignur,
Hospet 30000 2022 21.08.06 Yes Yes NA 30.06.05 30.06.05 No NA
54 Sankalapuram Iron Ore Mines of RBSSN Das, Karigunur Village,
Hospet 150000 2022 20.08.06 Yes Yes NA 30.06.05 30.06.05 No Yes
55 Sree Allum Prashanth Quartz Mines, Sy.No.96(1), Devaapura Village
Hospet
Yes Yes NA NA NA No
NA 56 Auro Minerals Kallahalli
Village, Hospet 30000 1751
Yes Yes NA Applied Applied No NA, Recommended
for Closure

Study on Carrying Capacity to develop Industrial Siting Guidelines in Bellary, Hospet and Sandur region
Environmental Management And Policy Research Institute XVI
CFE/CFO Details CFO Validity Date
Sl. No. Name & Address Taluka
Production & Capacity in Consent
TPA
ML No. Validity of ML
WPC APC
Whether Obtained
Board CFE With
Date
WPC APC Obtained EC from
MoEF/DEE
Whether Board
CFE/Consent for expansion obtained if not
what action initiated
order
57 Bellary Mining Corporation, Halkundi Village, Bellary
Bellary 60000 1586 Deemed Provision
Yes Yes NA 30.06.05 30.06.05 No NA
58 Sri Kumar Swamy Minerals Exports 11th Cross, I Link Road, Parvathinagar,
Bellary 105000 2141 23.01.12 Yes Yes NA 30.06.05 30.06.05 Yes Yes
59 Minerals Miners & Traders Janekunta Red Oxide & Iron Oxide Mines, Janekunta Village
Bellary 56900 2185 22.07.12 Yes Yes NA 30.06.05 30.06.05 No NA
60 Tiffin's Barytees Asbestors & Paints Ltd. No.127, Angappa Street,
Bellary 45000 2086 25.05.18 Yes Yes NA NA Closure Order
No NA, Closure Order Issued
61 Sri Allum Prashanth (Araginadone Village) Sy.No.276, Araginadoni Village
Bellary 14400 2276 01.12.20 Yes Yes NA Returned Returned No NA
62 Sri Allum Prashanth (Mine Owners) IOM, Sanjeevarayana Kote Village, Gadigi Palace, Car Street,
Bellary 8736 01.12.20 Yes Yes NA Returned Returned No NA
63 Suggalammagudda Mining & Company, No.7/19, Kanaka Street, Cowl Bazar, Bellary- 583102,
Bellary 24000 1083 20.05.07 Yes Yes NA 30.06.05 30.06.05 No NA
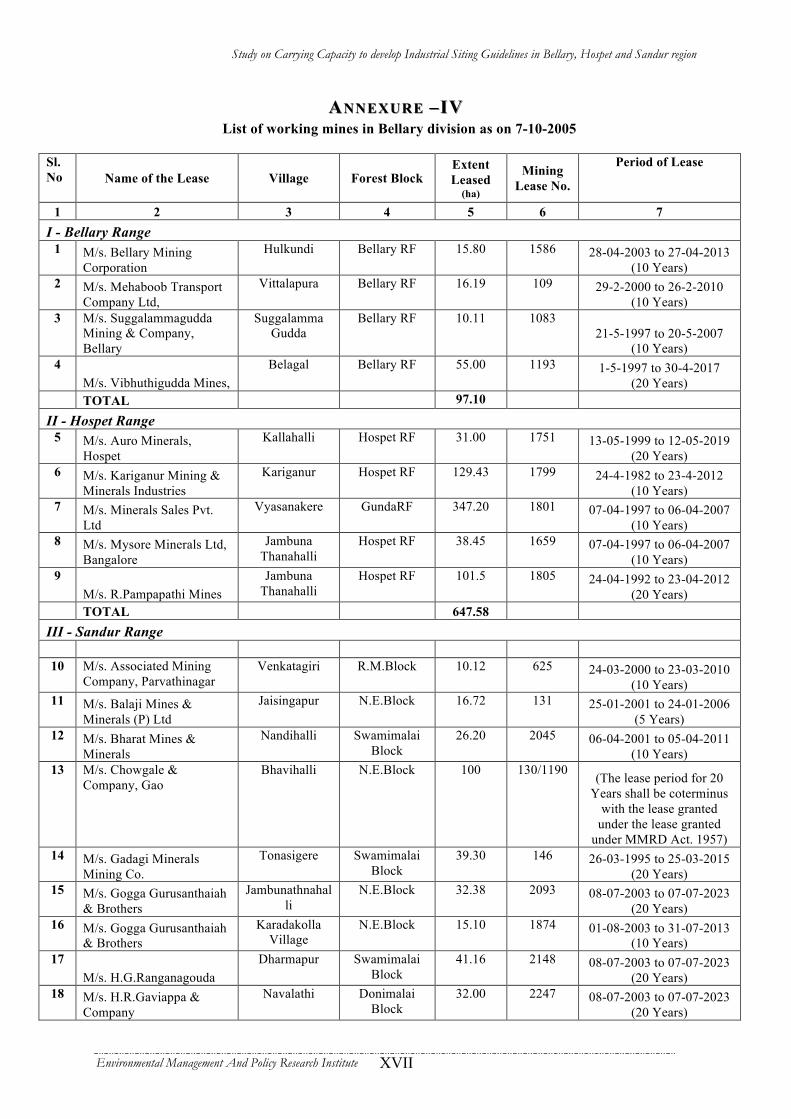
Study on Carrying Capacity to develop Industrial Siting Guidelines in Bellary, Hospet and Sandur region
Environmental Management And Policy Research Institute XVII
AA NNEXURE NNEXURE –– IVIV List of working mines in Bellary division as on 7-10-2005
Sl.No Name of the Lease Village Forest Block
Extent Leased
(ha)
Mining Lease No.
Period of Lease
1 2 3 4 5 6 7 I - Bellary Range
1 M/s. Bellary Mining Corporation
Hulkundi Bellary RF 15.80 1586 28-04-2003 to 27-04-2013 (10 Years)
2 M/s. Mehaboob Transport Company Ltd,
Vittalapura Bellary RF 16.19 109 29-2-2000 to 26-2-2010 (10 Years)
3 M/s. Suggalammagudda Mining & Company, Bellary
Suggalamma Gudda
Bellary RF 10.11 1083 21-5-1997 to 20-5-2007
(10 Years) 4
M/s. Vibhuthigudda Mines, Belagal Bellary RF 55.00 1193 1-5-1997 to 30-4-2017
(20 Years) TOTAL 97.10 II - Hospet Range
5 M/s. Auro Minerals, Hospet
Kallahalli Hospet RF 31.00 1751 13-05-1999 to 12-05-2019 (20 Years)
6 M/s. Kariganur Mining & Minerals Industries
Kariganur Hospet RF 129.43 1799 24-4-1982 to 23-4-2012 (10 Years)
7 M/s. Minerals Sales Pvt. Ltd
Vyasanakere GundaRF 347.20 1801 07-04-1997 to 06-04-2007 (10 Years)
8 M/s. Mysore Minerals Ltd, Bangalore
Jambuna Thanahalli
Hospet RF 38.45 1659 07-04-1997 to 06-04-2007 (10 Years)
9 M/s. R.Pampapathi Mines
Jambuna Thanahalli
Hospet RF 101.5 1805 24-04-1992 to 23-04-2012 (20 Years)
TOTAL 647.58 III - Sandur Range 10 M/s. Associated Mining
Company, Parvathinagar Venkatagiri R.M.Block 10.12 625 24-03-2000 to 23-03-2010
(10 Years) 11 M/s. Balaji Mines &
Minerals (P) Ltd Jaisingapur N.E.Block 16.72 131 25-01-2001 to 24-01-2006
(5 Years) 12 M/s. Bharat Mines &
Minerals Nandihalli Swamimalai
Block 26.20 2045 06-04-2001 to 05-04-2011
(10 Years) 13 M/s. Chowgale &
Company, Gao Bhavihalli N.E.Block 100 130/1190 (The lease period for 20
Years shall be coterminus with the lease granted
under the lease granted under MMRD Act. 1957)
14 M/s. Gadagi Minerals Mining Co.
Tonasigere Swamimalai Block
39.30 146 26-03-1995 to 25-03-2015 (20 Years)
15 M/s. Gogga Gurusanthaiah & Brothers
Jambunathnahalli
N.E.Block 32.38 2093 08-07-2003 to 07-07-2023 (20 Years)
16 M/s. Gogga Gurusanthaiah & Brothers
Karadakolla Village
N.E.Block 15.10 1874 01-08-2003 to 31-07-2013 (10 Years)
17 M/s. H.G.Ranganagouda
Dharmapur Swamimalai Block
41.16 2148 08-07-2003 to 07-07-2023 (20 Years)
18 M/s. H.R.Gaviappa & Company
Navalathi Donimalai Block
32.00 2247 08-07-2003 to 07-07-2023 (20 Years)
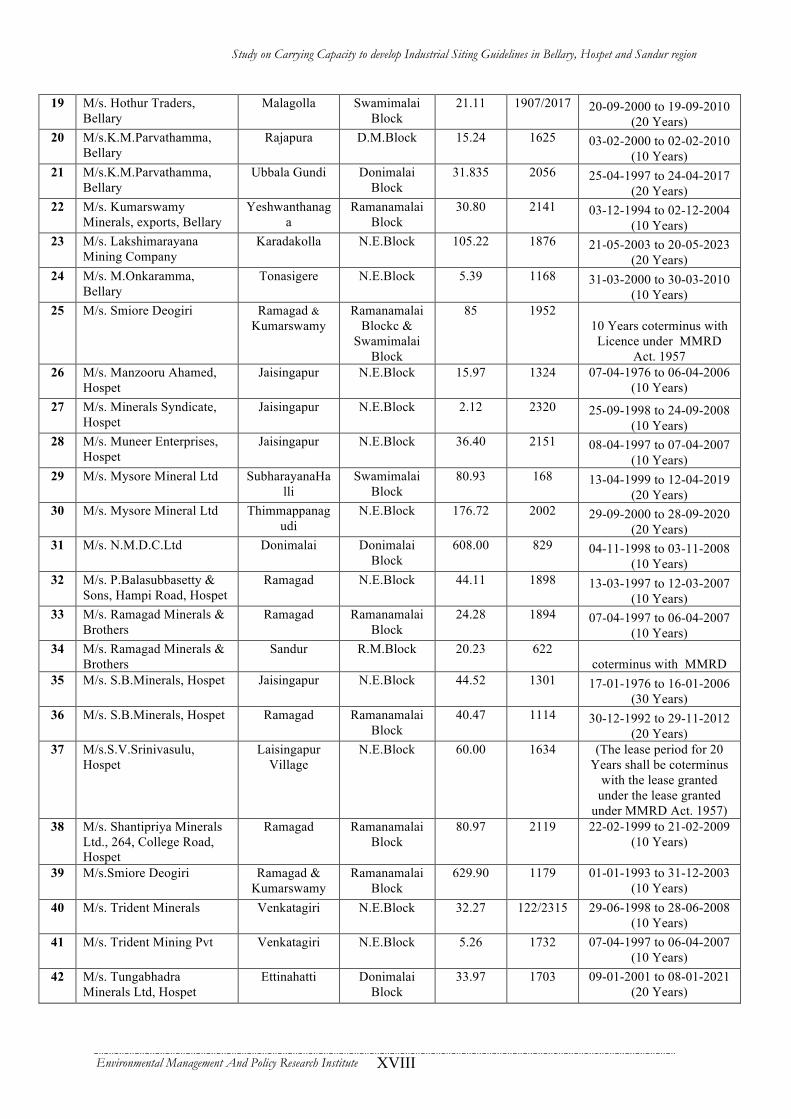
Study on Carrying Capacity to develop Industrial Siting Guidelines in Bellary, Hospet and Sandur region
Environmental Management And Policy Research Institute XVIII
19 M/s. Hothur Traders, Bellary
Malagolla Swamimalai Block
21.11 1907/2017 20-09-2000 to 19-09-2010 (20 Years)
20 M/s.K.M.Parvathamma, Bellary
Rajapura D.M.Block 15.24 1625 03-02-2000 to 02-02-2010 (10 Years)
21 M/s.K.M.Parvathamma, Bellary
Ubbala Gundi Donimalai Block
31.835 2056 25-04-1997 to 24-04-2017 (20 Years)
22 M/s. Kumarswamy Minerals, exports, Bellary
Yeshwanthanaga
Ramanamalai Block
30.80 2141 03-12-1994 to 02-12-2004 (10 Years)
23 M/s. Lakshimarayana Mining Company
Karadakolla N.E.Block 105.22 1876 21-05-2003 to 20-05-2023 (20 Years)
24 M/s. M.Onkaramma, Bellary
Tonasigere N.E.Block 5.39 1168 31-03-2000 to 30-03-2010 (10 Years)
25 M/s. Smiore Deogiri Ramagad & Kumarswamy
Ramanamalai Blockc &
Swamimalai Block
85 1952 10 Years coterminus with Licence under MMRD
Act. 1957 26 M/s. Manzooru Ahamed,
Hospet Jaisingapur N.E.Block 15.97 1324 07-04-1976 to 06-04-2006
(10 Years) 27 M/s. Minerals Syndicate,
Hospet Jaisingapur N.E.Block 2.12 2320 25-09-1998 to 24-09-2008
(10 Years) 28 M/s. Muneer Enterprises,
Hospet Jaisingapur N.E.Block 36.40 2151 08-04-1997 to 07-04-2007
(10 Years) 29 M/s. Mysore Mineral Ltd SubharayanaHa
lli Swamimalai
Block 80.93 168 13-04-1999 to 12-04-2019
(20 Years) 30 M/s. Mysore Mineral Ltd Thimmappanag
udi N.E.Block 176.72 2002 29-09-2000 to 28-09-2020
(20 Years) 31 M/s. N.M.D.C.Ltd Donimalai Donimalai
Block 608.00 829 04-11-1998 to 03-11-2008
(10 Years) 32 M/s. P.Balasubbasetty &
Sons, Hampi Road, Hospet Ramagad N.E.Block 44.11 1898 13-03-1997 to 12-03-2007
(10 Years) 33 M/s. Ramagad Minerals &
Brothers Ramagad Ramanamalai
Block 24.28 1894 07-04-1997 to 06-04-2007
(10 Years) 34 M/s. Ramagad Minerals &
Brothers Sandur R.M.Block 20.23 622
coterminus with MMRD 35 M/s. S.B.Minerals, Hospet Jaisingapur N.E.Block 44.52 1301 17-01-1976 to 16-01-2006
(30 Years) 36 M/s. S.B.Minerals, Hospet Ramagad Ramanamalai
Block 40.47 1114 30-12-1992 to 29-11-2012
(20 Years) 37 M/s.S.V.Srinivasulu,
Hospet Laisingapur
Village N.E.Block 60.00 1634 (The lease period for 20
Years shall be coterminus with the lease granted
under the lease granted under MMRD Act. 1957)
38 M/s. Shantipriya Minerals Ltd., 264, College Road, Hospet
Ramagad Ramanamalai Block
80.97 2119 22-02-1999 to 21-02-2009 (10 Years)
39 M/s.Smiore Deogiri Ramagad & Kumarswamy
Ramanamalai Block
629.90 1179 01-01-1993 to 31-12-2003 (10 Years)
40 M/s. Trident Minerals Venkatagiri N.E.Block 32.27 122/2315 29-06-1998 to 28-06-2008 (10 Years)
41 M/s. Trident Mining Pvt Venkatagiri N.E.Block 5.26 1732 07-04-1997 to 06-04-2007 (10 Years)
42 M/s. Tungabhadra Minerals Ltd, Hospet
Ettinahatti Donimalai Block
33.97 1703 09-01-2001 to 08-01-2021 (20 Years)

Study on Carrying Capacity to develop Industrial Siting Guidelines in Bellary, Hospet and Sandur region
Environmental Management And Policy Research Institute XIX
43 M/s. Tungabhadra Minerals Ltd, Hospet
Donimalai Areas
Donimalai Block
125.58 823/1646 09-06-1999 to 08-06-2009 (10 Years)
44 M/s. V.S.Lad & Sons Lakshmipura Swamimalai Block
105.06 1524 06-07-1996 to 05-07-2016 (20 Years)
45 M/s. V.S.Padmavathi Mines
Huchagona Halli Village
Chikkakereyagina Halli RF
6.75 2280 21-06-1999 to 20-06-2009 (10 Years)
46 M/s. Veerabhadrappa Sangappa & Company
Ramagad R.M.Block 51.00 2296 10-12-1999 to 09-12-2029 (30 Years)
47 M/s. Veerabhadrappa Sangappa & Company
Dharmapura Ramanamalai Block
17.65 2160 01-07-2003 to 30-06-2023 (20 Years)
48 M/s. P.Vengannasetty & Brothers, Hospet
Sandur N.E.Block 50.00 1046 coterminus with MMRD Act. 1957)
49 M/s. Zeenath Transport Co. Ramagad Ramanamalai Block
36.42 1663/2120 04-10-1990 to 03-10-2010 (20 Years)
50 M/s. Zeenath Transport Co. Ramagad Ramanamalai Block
44.13 1627/2121 04-10-1990 to 03-10-2010 (20 Years)
TOTAL 2933.07 Grand Total- I,II,III 3677.75
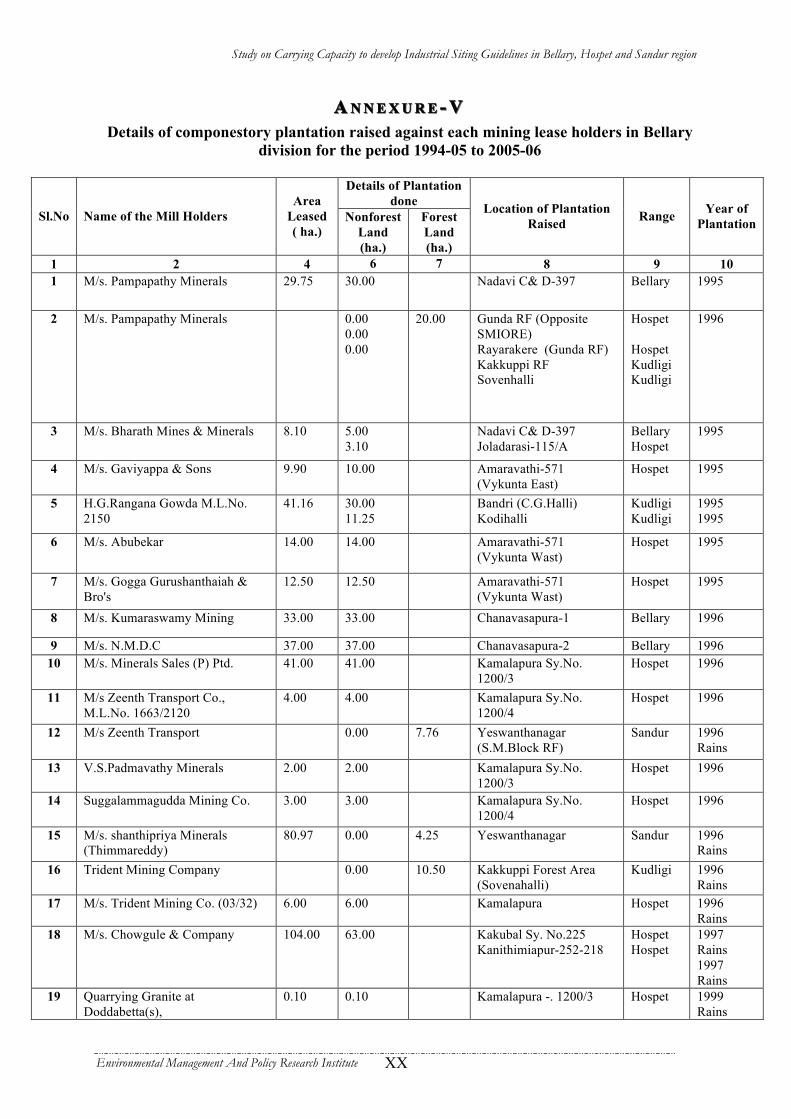
Study on Carrying Capacity to develop Industrial Siting Guidelines in Bellary, Hospet and Sandur region
Environmental Management And Policy Research Institute XX
AA N N E X U R EN N E X U R E -- VV Details of componestory plantation raised against each mining lease holders in Bellary
division for the period 1994-05 to 2005-06
Details of Plantation done
Sl.No Name of the Mill Holders Area
Leased ( ha.)
Nonforest Land (ha.)
Forest Land (ha.)
Location of Plantation Raised Range Year of
Plantation
1 2 4 6 7 8 9 10 1 M/s. Pampapathy Minerals 29.75 30.00 Nadavi C& D-397 Bellary 1995
2 M/s. Pampapathy Minerals 0.00 0.00 0.00
20.00 Gunda RF (Opposite SMIORE) Rayarakere (Gunda RF) Kakkuppi RF Sovenhalli
Hospet Hospet Kudligi Kudligi
1996
3 M/s. Bharath Mines & Minerals 8.10 5.00 3.10
Nadavi C& D-397 Joladarasi-115/A
Bellary Hospet
1995
4 M/s. Gaviyappa & Sons 9.90 10.00 Amaravathi-571 (Vykunta East)
Hospet 1995
5 H.G.Rangana Gowda M.L.No. 2150
41.16 30.00 11.25
Bandri (C.G.Halli) Kodihalli
Kudligi Kudligi
1995 1995
6 M/s. Abubekar 14.00 14.00 Amaravathi-571 (Vykunta Wast)
Hospet 1995
7 M/s. Gogga Gurushanthaiah & Bro's
12.50 12.50 Amaravathi-571 (Vykunta Wast)
Hospet 1995
8 M/s. Kumaraswamy Mining 33.00 33.00 Chanavasapura-1 Bellary 1996
9 M/s. N.M.D.C 37.00 37.00 Chanavasapura-2 Bellary 1996 10 M/s. Minerals Sales (P) Ptd. 41.00 41.00 Kamalapura Sy.No.
1200/3 Hospet 1996
11 M/s Zeenth Transport Co., M.L.No. 1663/2120
4.00 4.00 Kamalapura Sy.No. 1200/4
Hospet 1996
12 M/s Zeenth Transport 0.00 7.76 Yeswanthanagar (S.M.Block RF)
Sandur 1996 Rains
13 V.S.Padmavathy Minerals 2.00 2.00 Kamalapura Sy.No. 1200/3
Hospet 1996
14 Suggalammagudda Mining Co. 3.00 3.00 Kamalapura Sy.No. 1200/4
Hospet 1996
15 M/s. shanthipriya Minerals (Thimmareddy)
80.97 0.00 4.25 Yeswanthanagar Sandur 1996 Rains
16 Trident Mining Company 0.00 10.50 Kakkuppi Forest Area (Sovenahalli)
Kudligi 1996 Rains
17 M/s. Trident Mining Co. (03/32) 6.00 6.00 Kamalapura Hospet 1996 Rains
18 M/s. Chowgule & Company 104.00 63.00 Kakubal Sy. No.225 Kanithimiapur-252-218
Hospet Hospet
1997 Rains 1997 Rains
19 Quarrying Granite at Doddabetta(s),
0.10 0.10 Kamalapura -. 1200/3 Hospet 1999 Rains
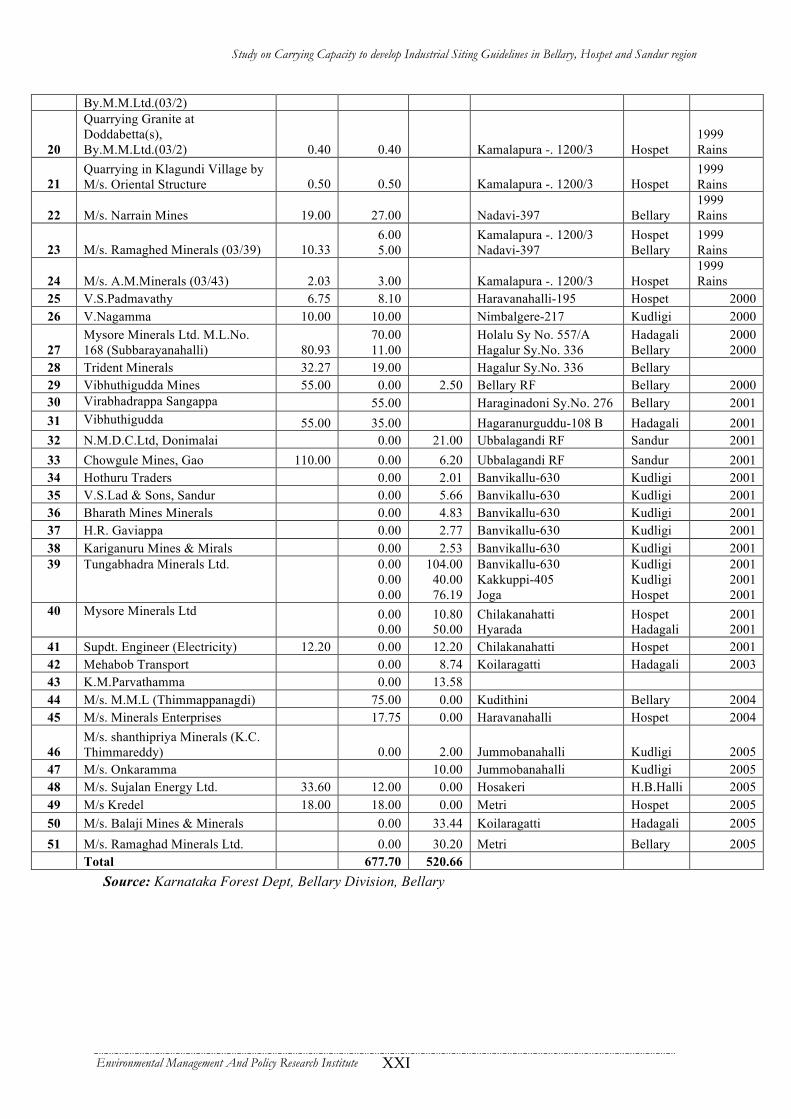
Study on Carrying Capacity to develop Industrial Siting Guidelines in Bellary, Hospet and Sandur region
Environmental Management And Policy Research Institute XXI
By.M.M.Ltd.(03/2)
20
Quarrying Granite at Doddabetta(s), By.M.M.Ltd.(03/2) 0.40 0.40 Kamalapura -. 1200/3 Hospet
1999 Rains
21 Quarrying in Klagundi Village by M/s. Oriental Structure 0.50 0.50 Kamalapura -. 1200/3 Hospet
1999 Rains
22 M/s. Narrain Mines 19.00 27.00 Nadavi-397 Bellary 1999 Rains
23 M/s. Ramaghed Minerals (03/39) 10.33 6.00 5.00
Kamalapura -. 1200/3 Nadavi-397
Hospet Bellary
1999 Rains
24 M/s. A.M.Minerals (03/43) 2.03 3.00 Kamalapura -. 1200/3 Hospet 1999 Rains
25 V.S.Padmavathy 6.75 8.10 Haravanahalli-195 Hospet 2000 26 V.Nagamma 10.00 10.00 Nimbalgere-217 Kudligi 2000
27 Mysore Minerals Ltd. M.L.No. 168 (Subbarayanahalli) 80.93
70.00 11.00
Holalu Sy No. 557/A Hagalur Sy.No. 336
Hadagali Bellary
2000 2000
28 Trident Minerals 32.27 19.00 Hagalur Sy.No. 336 Bellary 29 Vibhuthigudda Mines 55.00 0.00 2.50 Bellary RF Bellary 2000 30 Virabhadrappa Sangappa 55.00 Haraginadoni Sy.No. 276 Bellary 2001 31 Vibhuthigudda 55.00 35.00 Hagaranurguddu-108 B Hadagali 2001 32 N.M.D.C.Ltd, Donimalai 0.00 21.00 Ubbalagandi RF Sandur 2001 33 Chowgule Mines, Gao 110.00 0.00 6.20 Ubbalagandi RF Sandur 2001 34 Hothuru Traders 0.00 2.01 Banvikallu-630 Kudligi 2001 35 V.S.Lad & Sons, Sandur 0.00 5.66 Banvikallu-630 Kudligi 2001 36 Bharath Mines Minerals 0.00 4.83 Banvikallu-630 Kudligi 2001 37 H.R. Gaviappa 0.00 2.77 Banvikallu-630 Kudligi 2001 38 Kariganuru Mines & Mirals 0.00 2.53 Banvikallu-630 Kudligi 2001 39 Tungabhadra Minerals Ltd.
0.00 0.00 0.00
104.00 40.00 76.19
Banvikallu-630 Kakkuppi-405 Joga
Kudligi Kudligi Hospet
2001 2001 2001
40 Mysore Minerals Ltd
0.00 0.00
10.80 50.00
Chilakanahatti Hyarada
Hospet Hadagali
2001 2001
41 Supdt. Engineer (Electricity) 12.20 0.00 12.20 Chilakanahatti Hospet 2001 42 Mehabob Transport 0.00 8.74 Koilaragatti Hadagali 2003 43 K.M.Parvathamma 0.00 13.58 44 M/s. M.M.L (Thimmappanagdi) 75.00 0.00 Kudithini Bellary 2004 45 M/s. Minerals Enterprises 17.75 0.00 Haravanahalli Hospet 2004
46 M/s. shanthipriya Minerals (K.C. Thimmareddy) 0.00 2.00 Jummobanahalli Kudligi 2005
47 M/s. Onkaramma 10.00 Jummobanahalli Kudligi 2005 48 M/s. Sujalan Energy Ltd. 33.60 12.00 0.00 Hosakeri H.B.Halli 2005 49 M/s Kredel 18.00 18.00 0.00 Metri Hospet 2005 50 M/s. Balaji Mines & Minerals 0.00 33.44 Koilaragatti Hadagali 2005 51 M/s. Ramaghad Minerals Ltd. 0.00 30.20 Metri Bellary 2005
Total 677.70 520.66 Source: Karnataka Forest Dept, Bellary Division, Bellary

Study on Carrying Capacity to develop Industrial Siting Guidelines in Bellary, Hospet and Sandur region
Environmental Management And Policy Research Institute XXII
AA N N E X U R EN N E X U R E -- V IV I Estimated fish production (in M.T) in Bellary, Hospet & Sandur
Sl. No. Year Bellary Hospet Sandur
1 1988-89 152 142 120
2 1989-90 142 350 1800
3 1990-91 120 2106 1850
4 1991-92 120 1925 900
5 1992-93 135 2400 525
6 1993-94 152 2545 650
7 1994-95 170 2800 755
8 1995-96 250 3300 1140
9 1996-97 650 4594 960
10 1997-98 690 4750 950
11 1998-99 856 5475 1950
12 1999-00 1020 5319 1090
13 2000-01 1020 3750 1062
14 2001-02 970 2849 940.14
15 2002-03 715 2922 1050
16 2003-04 650 2500 1300
17 2004-05 631.8 1691.82 2871.54
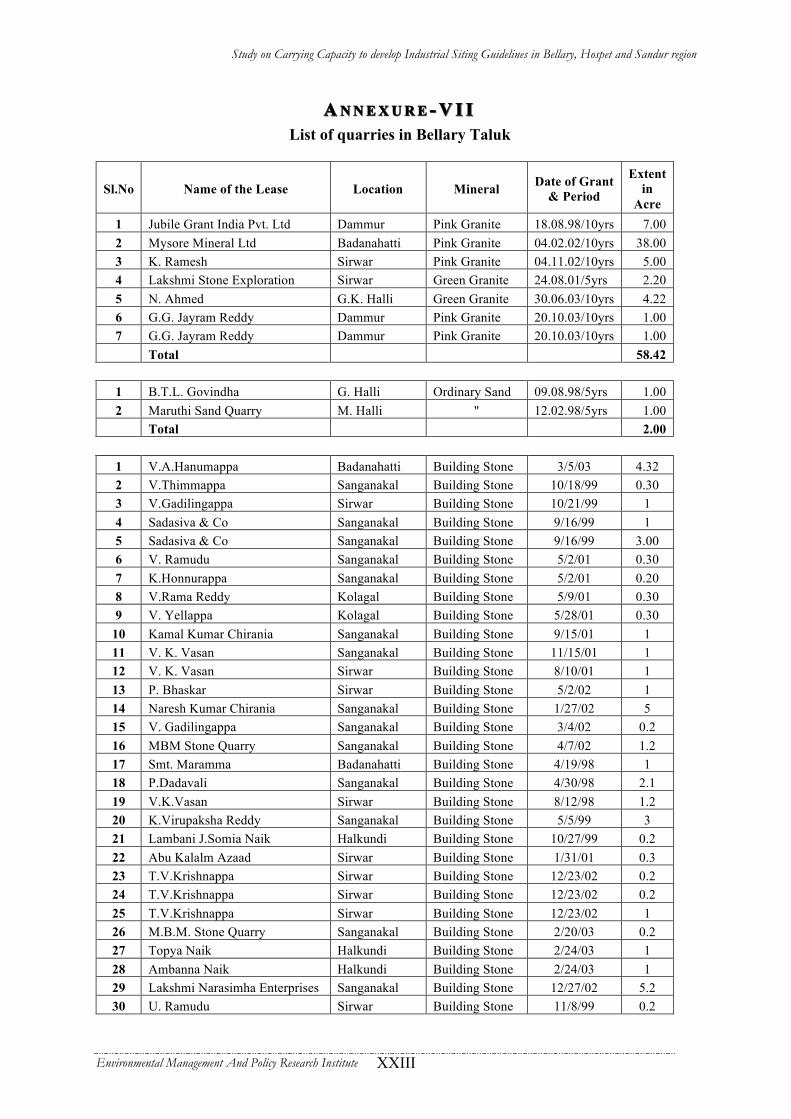
Study on Carrying Capacity to develop Industrial Siting Guidelines in Bellary, Hospet and Sandur region
Environmental Management And Policy Research Institute XXIII
AA N N E X U R EN N E X U R E -- V I IV I I
List of quarries in Bellary Taluk
Sl.No Name of the Lease Location Mineral Date of Grant & Period
Extent in
Acre 1 Jubile Grant India Pvt. Ltd Dammur Pink Granite 18.08.98/10yrs 7.00 2 Mysore Mineral Ltd Badanahatti Pink Granite 04.02.02/10yrs 38.00 3 K. Ramesh Sirwar Pink Granite 04.11.02/10yrs 5.00 4 Lakshmi Stone Exploration Sirwar Green Granite 24.08.01/5yrs 2.20 5 N. Ahmed G.K. Halli Green Granite 30.06.03/10yrs 4.22 6 G.G. Jayram Reddy Dammur Pink Granite 20.10.03/10yrs 1.00 7 G.G. Jayram Reddy Dammur Pink Granite 20.10.03/10yrs 1.00 Total 58.42
1 B.T.L. Govindha G. Halli Ordinary Sand 09.08.98/5yrs 1.00 2 Maruthi Sand Quarry M. Halli " 12.02.98/5yrs 1.00
Total 2.00
1 V.A.Hanumappa Badanahatti Building Stone 3/5/03 4.32 2 V.Thimmappa Sanganakal Building Stone 10/18/99 0.30 3 V.Gadilingappa Sirwar Building Stone 10/21/99 1 4 Sadasiva & Co Sanganakal Building Stone 9/16/99 1 5 Sadasiva & Co Sanganakal Building Stone 9/16/99 3.00 6 V. Ramudu Sanganakal Building Stone 5/2/01 0.30 7 K.Honnurappa Sanganakal Building Stone 5/2/01 0.20 8 V.Rama Reddy Kolagal Building Stone 5/9/01 0.30 9 V. Yellappa Kolagal Building Stone 5/28/01 0.30
10 Kamal Kumar Chirania Sanganakal Building Stone 9/15/01 1 11 V. K. Vasan Sanganakal Building Stone 11/15/01 1 12 V. K. Vasan Sirwar Building Stone 8/10/01 1 13 P. Bhaskar Sirwar Building Stone 5/2/02 1 14 Naresh Kumar Chirania Sanganakal Building Stone 1/27/02 5 15 V. Gadilingappa Sanganakal Building Stone 3/4/02 0.2 16 MBM Stone Quarry Sanganakal Building Stone 4/7/02 1.2 17 Smt. Maramma Badanahatti Building Stone 4/19/98 1 18 P.Dadavali Sanganakal Building Stone 4/30/98 2.1 19 V.K.Vasan Sirwar Building Stone 8/12/98 1.2 20 K.Virupaksha Reddy Sanganakal Building Stone 5/5/99 3 21 Lambani J.Somia Naik Halkundi Building Stone 10/27/99 0.2 22 Abu Kalalm Azaad Sirwar Building Stone 1/31/01 0.3 23 T.V.Krishnappa Sirwar Building Stone 12/23/02 0.2 24 T.V.Krishnappa Sirwar Building Stone 12/23/02 0.2 25 T.V.Krishnappa Sirwar Building Stone 12/23/02 1 26 M.B.M. Stone Quarry Sanganakal Building Stone 2/20/03 0.2 27 Topya Naik Halkundi Building Stone 2/24/03 1 28 Ambanna Naik Halkundi Building Stone 2/24/03 1 29 Lakshmi Narasimha Enterprises Sanganakal Building Stone 12/27/02 5.2 30 U. Ramudu Sirwar Building Stone 11/8/99 0.2
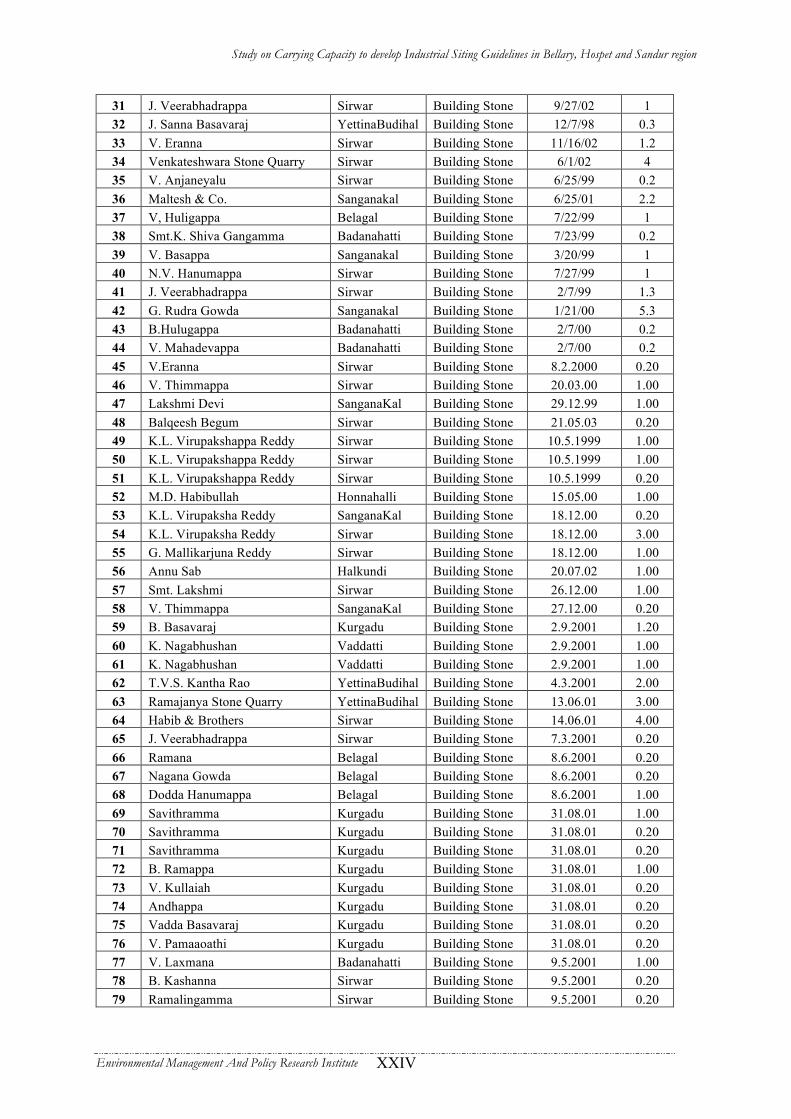
Study on Carrying Capacity to develop Industrial Siting Guidelines in Bellary, Hospet and Sandur region
Environmental Management And Policy Research Institute XXIV
31 J. Veerabhadrappa Sirwar Building Stone 9/27/02 1 32 J. Sanna Basavaraj YettinaBudihal Building Stone 12/7/98 0.3 33 V. Eranna Sirwar Building Stone 11/16/02 1.2 34 Venkateshwara Stone Quarry Sirwar Building Stone 6/1/02 4 35 V. Anjaneyalu Sirwar Building Stone 6/25/99 0.2 36 Maltesh & Co. Sanganakal Building Stone 6/25/01 2.2 37 V, Huligappa Belagal Building Stone 7/22/99 1 38 Smt.K. Shiva Gangamma Badanahatti Building Stone 7/23/99 0.2 39 V. Basappa Sanganakal Building Stone 3/20/99 1 40 N.V. Hanumappa Sirwar Building Stone 7/27/99 1 41 J. Veerabhadrappa Sirwar Building Stone 2/7/99 1.3 42 G. Rudra Gowda Sanganakal Building Stone 1/21/00 5.3 43 B.Hulugappa Badanahatti Building Stone 2/7/00 0.2 44 V. Mahadevappa Badanahatti Building Stone 2/7/00 0.2 45 V.Eranna Sirwar Building Stone 8.2.2000 0.20 46 V. Thimmappa Sirwar Building Stone 20.03.00 1.00 47 Lakshmi Devi SanganaKal Building Stone 29.12.99 1.00 48 Balqeesh Begum Sirwar Building Stone 21.05.03 0.20 49 K.L. Virupakshappa Reddy Sirwar Building Stone 10.5.1999 1.00 50 K.L. Virupakshappa Reddy Sirwar Building Stone 10.5.1999 1.00 51 K.L. Virupakshappa Reddy Sirwar Building Stone 10.5.1999 0.20 52 M.D. Habibullah Honnahalli Building Stone 15.05.00 1.00 53 K.L. Virupaksha Reddy SanganaKal Building Stone 18.12.00 0.20 54 K.L. Virupaksha Reddy Sirwar Building Stone 18.12.00 3.00 55 G. Mallikarjuna Reddy Sirwar Building Stone 18.12.00 1.00 56 Annu Sab Halkundi Building Stone 20.07.02 1.00 57 Smt. Lakshmi Sirwar Building Stone 26.12.00 1.00 58 V. Thimmappa SanganaKal Building Stone 27.12.00 0.20 59 B. Basavaraj Kurgadu Building Stone 2.9.2001 1.20 60 K. Nagabhushan Vaddatti Building Stone 2.9.2001 1.00 61 K. Nagabhushan Vaddatti Building Stone 2.9.2001 1.00 62 T.V.S. Kantha Rao YettinaBudihal Building Stone 4.3.2001 2.00 63 Ramajanya Stone Quarry YettinaBudihal Building Stone 13.06.01 3.00 64 Habib & Brothers Sirwar Building Stone 14.06.01 4.00 65 J. Veerabhadrappa Sirwar Building Stone 7.3.2001 0.20 66 Ramana Belagal Building Stone 8.6.2001 0.20 67 Nagana Gowda Belagal Building Stone 8.6.2001 0.20 68 Dodda Hanumappa Belagal Building Stone 8.6.2001 1.00 69 Savithramma Kurgadu Building Stone 31.08.01 1.00 70 Savithramma Kurgadu Building Stone 31.08.01 0.20 71 Savithramma Kurgadu Building Stone 31.08.01 0.20 72 B. Ramappa Kurgadu Building Stone 31.08.01 1.00 73 V. Kullaiah Kurgadu Building Stone 31.08.01 0.20 74 Andhappa Kurgadu Building Stone 31.08.01 0.20 75 Vadda Basavaraj Kurgadu Building Stone 31.08.01 0.20 76 V. Pamaaoathi Kurgadu Building Stone 31.08.01 0.20 77 V. Laxmana Badanahatti Building Stone 9.5.2001 1.00 78 B. Kashanna Sirwar Building Stone 9.5.2001 0.20 79 Ramalingamma Sirwar Building Stone 9.5.2001 0.20

Study on Carrying Capacity to develop Industrial Siting Guidelines in Bellary, Hospet and Sandur region
Environmental Management And Policy Research Institute XXV
80 H. Chandrashekar Halkundi Building Stone 10.6.2001 0.20 81 B. Gangadharappa Kurgadu Building Stone 23.10.01 1.00 82 V. Hanumanatappa Badanahatti Building Stone 11.8.2001 1.00 83 K. Shiva Gangamma Badanahatti Building Stone 26.11.01 0.20 84 Yerriswamy Sirwar Building Stone 26.11.01 0.20 85 V. Venkatramanna Sirwar Building Stone 22.11.01 1.00 86 Laxmana Kurgadu Building Stone 12.12.2001 0.20 87 G. Venkateshalu Sirwar Building Stone 15.12.02 1.00 88 V. Sunkanna Kurgadu Building Stone 15.12.02 2.00 89 V. Sanjevappa SanganaKal Building Stone 15.12.02 0.30 90 Pamappanna Kurgadu Building Stone 3.2.2002 2.00 91 V. Thimmappa Kurgadu Building Stone 3.2.2002 2.00 92 V. Pogal Anjineyal Sirwar Building Stone 21.05.02 0.20 93 N. Ravindra Gowda Kurgadu Building Stone 20.07.02 2.00 94 V. Sanjevappa SanganaKal Building Stone 25.07.02 1.00 95 Smt. Gouramma Munadargi Building Stone 20.08.02 0.20 96 B. Badrinarayana Gupta Sirwar Building Stone 8.4.2002 2.00 97 V. Anjaneyalu Sirwar Building Stone 30.08.02 1.00 98 M. Kakunayak H.Halli Building Stone 9.2.2002 1.00 99 V. Govindappa SanganaKal Building Stone 16.09.02 1.00
100 V. Gopinatha Sirwar Building Stone 16.09.02 1.00 101 P. Hanumathappa Sirwar Building Stone 9.5.2002 0.20 102 V.H. Dooth Badanahatti Building Stone 10.9.2002 0.10 103 S. Krishna Reddy K. Gal Building Stone 11.8.2002 3.00 104 K. Pamappanna B. Gal Building Stone 12.5.2002 0.20 105 V. Gopinatha Sirwar Building Stone 13.12.02 1.00 106 R. Madhu sudhan K. Gal Building Stone 19.12.02 1.20 107 S. Paramshwar Reddy S.mola Building Stone 21.12.02 4.00 108 S. Paramshwar Reddy S.mola Building Stone 21.12.02 4.00 109 V. Appaaiah Kurgadu Building Stone 17.02.03 0.20 110 V. Nagaraj Sirwar Building Stone 03.10.03 1.00 111 Laxmi vasan Sirwar Building Stone 03.10.03 1.00 112 Radha Krishna Stone Quarry Sirwar Building Stone 12.04.02 0.32 113 V. Ramajaneyalu Sirwar Building Stone 28.07.02 0.20 114 B. Mahesh G. Halli Building Stone 25.04.03 4.00 115 Chandra Halkundi Building Stone 05.06.03 0.20 116 Hussain Halkundi Building Stone 05.06.03 0.20 117 V. Durganna Kurgadu Building Stone 05.06.03 0.20 118 V. Eranna Sirwar Building Stone 05.09.03 1.20 119 S.V. Paravathaiah Kurgadu Building Stone 21.05.03 2.00 120 V. Rajagopal SanganaKal Building Stone 19.06.03 1.00 121 D. Satish Kumar H.Halli Building Stone 23.06.03 5.00 122 D. Satish Kumar H.Halli Building Stone 23.06.03 3.00 123 B. Mahesh G. Halli Building Stone 24.07.03 0.30 124 V. H. Nagaraj Bellary Building Stone 24.07.03 0.20 125 S. Srinivasalu S.mola Building Stone 08.02.03 4.00 126 K. Nagabhushan Bellary Building Stone 13.08.03 0.20 127 G. Shiva shankar B. Gal Building Stone 26.08.03 1.00 128 K.L. Virupakshareddy SanganaKal Building Stone 26.08.03 0.30
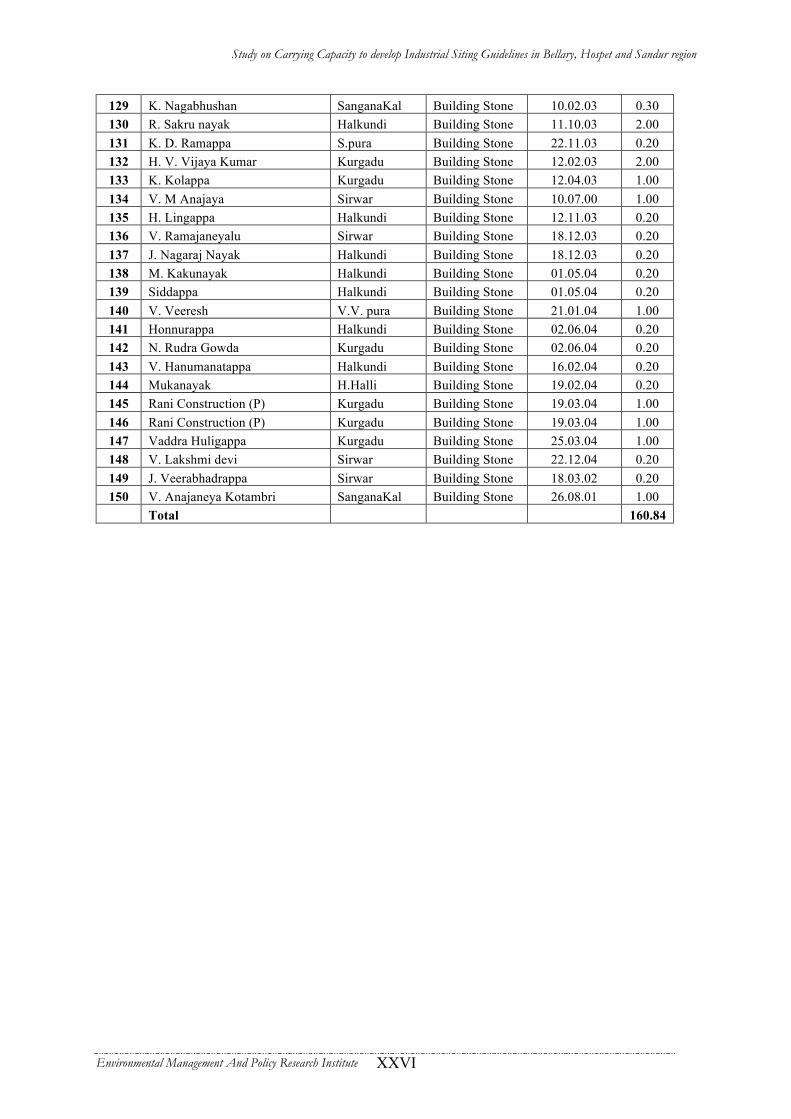
Study on Carrying Capacity to develop Industrial Siting Guidelines in Bellary, Hospet and Sandur region
Environmental Management And Policy Research Institute XXVI
129 K. Nagabhushan SanganaKal Building Stone 10.02.03 0.30 130 R. Sakru nayak Halkundi Building Stone 11.10.03 2.00 131 K. D. Ramappa S.pura Building Stone 22.11.03 0.20 132 H. V. Vijaya Kumar Kurgadu Building Stone 12.02.03 2.00 133 K. Kolappa Kurgadu Building Stone 12.04.03 1.00 134 V. M Anajaya Sirwar Building Stone 10.07.00 1.00 135 H. Lingappa Halkundi Building Stone 12.11.03 0.20 136 V. Ramajaneyalu Sirwar Building Stone 18.12.03 0.20 137 J. Nagaraj Nayak Halkundi Building Stone 18.12.03 0.20 138 M. Kakunayak Halkundi Building Stone 01.05.04 0.20 139 Siddappa Halkundi Building Stone 01.05.04 0.20 140 V. Veeresh V.V. pura Building Stone 21.01.04 1.00 141 Honnurappa Halkundi Building Stone 02.06.04 0.20 142 N. Rudra Gowda Kurgadu Building Stone 02.06.04 0.20 143 V. Hanumanatappa Halkundi Building Stone 16.02.04 0.20 144 Mukanayak H.Halli Building Stone 19.02.04 0.20 145 Rani Construction (P) Kurgadu Building Stone 19.03.04 1.00 146 Rani Construction (P) Kurgadu Building Stone 19.03.04 1.00 147 Vaddra Huligappa Kurgadu Building Stone 25.03.04 1.00 148 V. Lakshmi devi Sirwar Building Stone 22.12.04 0.20 149 J. Veerabhadrappa Sirwar Building Stone 18.03.02 0.20 150 V. Anajaneya Kotambri SanganaKal Building Stone 26.08.01 1.00
Total 160.84

Study on Carrying Capacity to develop Industrial Siting Guidelines in Bellary, Hospet and Sandur region
Environmental Management And Policy Research Institute XXVII
List of quarries in Hospet Taluk
Sl. No. Name of the Lease Location Mineral Date of Grant &
Period Extent in acres
1 Arogydas Kalaghatta Building Stone 21-03-99 (5 Years) 6.00 2 M.D.Inayatulla Basha G.Hobalapura Building Stone 05-05-99 (5 Years) 1.05 3 M.D.Inayatulla Basha G.Hobalapura Building Stone 06-07-99 (5 Years) 0.75 4 S. Gurubasava Raj, D.N.Kere Building Stone 05-05-99 (5 Years) 2.00 5 Ray Constructions Papinayakanahalli Building Stone 12-01-01 (5 Years) 3.00 6 Shivamurtheppa A.K.Halli Building Stone 26-03-01 (5 Years) 1.25 7 A.Gangadharappa Kamalapura Building Stone 03-06-01 (5 Years) 6.00 8 Medar Thimmappa Ingalagi Building Stone 12-05-98 (5 Years) 2.00 9 Pavadappa D.N.Kere Building Stone 15-03-00 (5 Years) 100.00
10 K.Hanumanthappa Gollarahalli Building Stone 15-03-00 (5 Years) 1.00 11 B.P.Ananda Kumar Bailuvaddigere Building Stone 05-08-98 (5 Years) 3.00 12 B.P.Ananda Kumar Bailuvaddigere Building Stone 05-08-98 (5 Years) 3.00 13 Pujar Hanumanthappa Garaga Building Stone 22-12-01 (5 Years) 1.00 14 S.Anke Reddi Bailuvaddigere Building Stone 30-10-01 (5 Years) 2.00 15 Kishor.A.S Ingalagi Building Stone 20-06-00 (5 Years) 2.00 16 S.Anke Reddi Kamalapura Building Stone 30-10-01 (5 Years) 1.50 17 D.Abdul Haseed Nandibandi Building Stone 28-09-02 (5 Years) 2.00 18 Ambika Jalaga Bailuvaddigere Building Stone 24-01-03 (5 Years) 1.00 19 Soundh Aggrigate
Mylarlingeshwara Bailuvaddigere Building Stone 11-12-02 (5 Years) 6.00 20 S.Parameshwara Reddy Bailuvaddigere Building Stone 24-12-02 (5 Years) 8.00 21 L.Shivaram Gollarahalli Building Stone 03-01-03 (5 Years) 1.00 22 L.Krishna Gollarahalli Building Stone 03-01-03 (5 Years) 1.00 23 M.V.Subbarao Ingalagi Building Stone 06-01-03 (5 Years) 2.00 24 A.Rita D.N.Kere Building Stone 07-01-03 (5 Years) 3.00 25 K.B.Sreenivasa Kamalapura Building Stone 04-06-96 (5 Years) 4.00 26 S.Gurubasavaraj Ingalagi Building Stone 12-09-03 (5 Years) 2.00 27 Medar Thimmappa Ingalagi Building Stone 23-05-03 (5 Years) 2.00 28 Janardhan Reddy Ingalagi Building Stone 30-05-03 (5 Years) 3.00 29 K.S.Nagaraj Bailuvaddigere Building Stone 24-04-03 (5 Years) 1.00 30 G.Chandrashekar Kalaghatta Building Stone 06-09-03 (5 Years) 1.00 31 D.Mahadevappa Ingalagi Building Stone 04-12-03 (5 Years) 3.00
Total 175.55
1 M.M.Granite Bukkasagar Grey Granite 28-08-98 (10 Years) 5.00
2 Shri.Govinda Rao & Co. Gadiganur Black Granite 17-06-00 (10 Years) 3.00
3 Gowri Shankara Granite & Co. Gadiganur Black Granite 17-06-00 (10 Years) 1.00
4 B.Khajaji Thimmalapura Black Granite 04-05-00 (10 Years) 1.00 5 B.Manjunatha Thimmalapura Black Granite 28-04-00 (10 Years) 3.50
Total 13.50
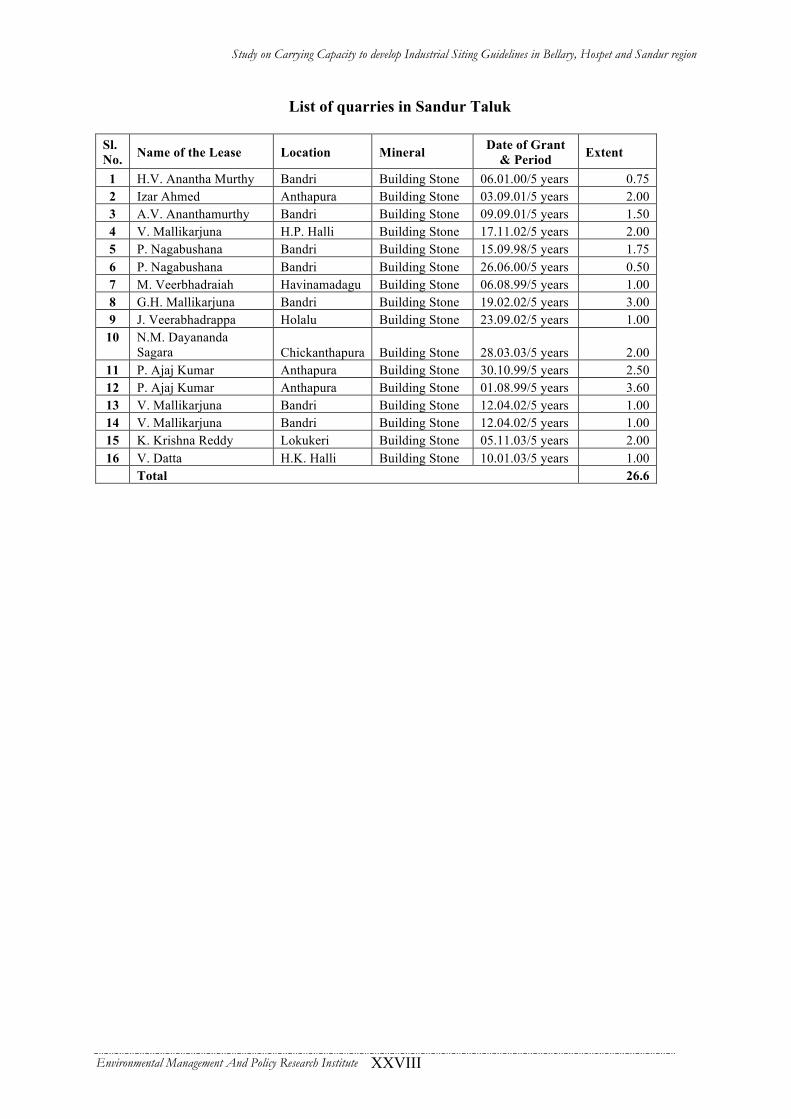
Study on Carrying Capacity to develop Industrial Siting Guidelines in Bellary, Hospet and Sandur region
Environmental Management And Policy Research Institute XXVIII
List of quarries in Sandur Taluk
Sl. No. Name of the Lease Location Mineral Date of Grant
& Period Extent
1 H.V. Anantha Murthy Bandri Building Stone 06.01.00/5 years 0.75 2 Izar Ahmed Anthapura Building Stone 03.09.01/5 years 2.00 3 A.V. Ananthamurthy Bandri Building Stone 09.09.01/5 years 1.50 4 V. Mallikarjuna H.P. Halli Building Stone 17.11.02/5 years 2.00 5 P. Nagabushana Bandri Building Stone 15.09.98/5 years 1.75 6 P. Nagabushana Bandri Building Stone 26.06.00/5 years 0.50 7 M. Veerbhadraiah Havinamadagu Building Stone 06.08.99/5 years 1.00 8 G.H. Mallikarjuna Bandri Building Stone 19.02.02/5 years 3.00 9 J. Veerabhadrappa Holalu Building Stone 23.09.02/5 years 1.00
10 N.M. Dayananda Sagara Chickanthapura Building Stone 28.03.03/5 years 2.00
11 P. Ajaj Kumar Anthapura Building Stone 30.10.99/5 years 2.50 12 P. Ajaj Kumar Anthapura Building Stone 01.08.99/5 years 3.60 13 V. Mallikarjuna Bandri Building Stone 12.04.02/5 years 1.00 14 V. Mallikarjuna Bandri Building Stone 12.04.02/5 years 1.00 15 K. Krishna Reddy Lokukeri Building Stone 05.11.03/5 years 2.00 16 V. Datta H.K. Halli Building Stone 10.01.03/5 years 1.00 Total 26.6
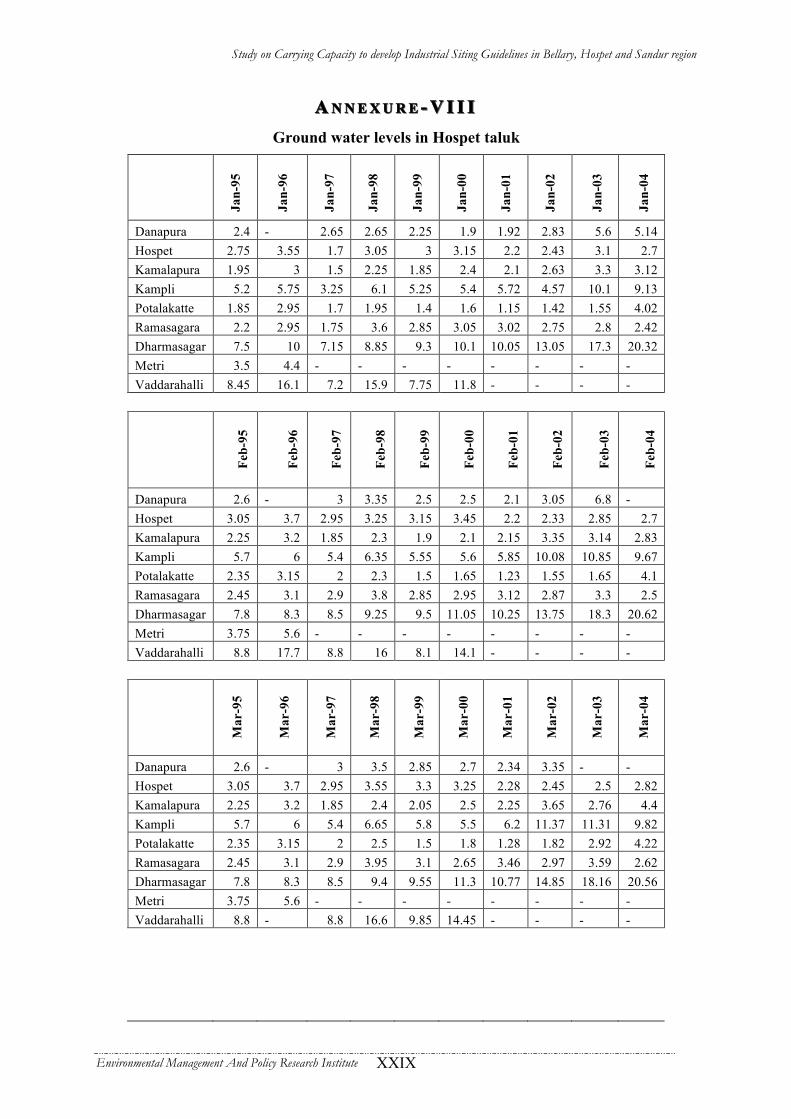
Study on Carrying Capacity to develop Industrial Siting Guidelines in Bellary, Hospet and Sandur region
Environmental Management And Policy Research Institute XXIX
AA N N E X U R EN N E X U R E -- V I I IV I I I Ground water levels in Hospet taluk
Jan-
95
Jan-
96
Jan-
97
Jan-
98
Jan-
99
Jan-
00
Jan-
01
Jan-
02
Jan-
03
Jan-
04
Danapura 2.4 - 2.65 2.65 2.25 1.9 1.92 2.83 5.6 5.14 Hospet 2.75 3.55 1.7 3.05 3 3.15 2.2 2.43 3.1 2.7 Kamalapura 1.95 3 1.5 2.25 1.85 2.4 2.1 2.63 3.3 3.12 Kampli 5.2 5.75 3.25 6.1 5.25 5.4 5.72 4.57 10.1 9.13 Potalakatte 1.85 2.95 1.7 1.95 1.4 1.6 1.15 1.42 1.55 4.02 Ramasagara 2.2 2.95 1.75 3.6 2.85 3.05 3.02 2.75 2.8 2.42 Dharmasagar 7.5 10 7.15 8.85 9.3 10.1 10.05 13.05 17.3 20.32 Metri 3.5 4.4 - - - - - - - - Vaddarahalli 8.45 16.1 7.2 15.9 7.75 11.8 - - - -
Feb-
95
Feb-
96
Feb-
97
Feb-
98
Feb-
99
Feb-
00
Feb-
01
Feb-
02
Feb-
03
Feb-
04
Danapura 2.6 - 3 3.35 2.5 2.5 2.1 3.05 6.8 - Hospet 3.05 3.7 2.95 3.25 3.15 3.45 2.2 2.33 2.85 2.7 Kamalapura 2.25 3.2 1.85 2.3 1.9 2.1 2.15 3.35 3.14 2.83 Kampli 5.7 6 5.4 6.35 5.55 5.6 5.85 10.08 10.85 9.67 Potalakatte 2.35 3.15 2 2.3 1.5 1.65 1.23 1.55 1.65 4.1 Ramasagara 2.45 3.1 2.9 3.8 2.85 2.95 3.12 2.87 3.3 2.5 Dharmasagar 7.8 8.3 8.5 9.25 9.5 11.05 10.25 13.75 18.3 20.62 Metri 3.75 5.6 - - - - - - - - Vaddarahalli 8.8 17.7 8.8 16 8.1 14.1 - - - -
Mar
-95
Mar
-96
Mar
-97
Mar
-98
Mar
-99
Mar
-00
Mar
-01
Mar
-02
Mar
-03
Mar
-04
Danapura 2.6 - 3 3.5 2.85 2.7 2.34 3.35 - - Hospet 3.05 3.7 2.95 3.55 3.3 3.25 2.28 2.45 2.5 2.82 Kamalapura 2.25 3.2 1.85 2.4 2.05 2.5 2.25 3.65 2.76 4.4 Kampli 5.7 6 5.4 6.65 5.8 5.5 6.2 11.37 11.31 9.82 Potalakatte 2.35 3.15 2 2.5 1.5 1.8 1.28 1.82 2.92 4.22 Ramasagara 2.45 3.1 2.9 3.95 3.1 2.65 3.46 2.97 3.59 2.62 Dharmasagar 7.8 8.3 8.5 9.4 9.55 11.3 10.77 14.85 18.16 20.56 Metri 3.75 5.6 - - - - - - - - Vaddarahalli 8.8 - 8.8 16.6 9.85 14.45 - - - -

Study on Carrying Capacity to develop Industrial Siting Guidelines in Bellary, Hospet and Sandur region
Environmental Management And Policy Research Institute XXX
Apr
-95
Apr
-96
Apr
-97
Apr
-98
Apr
-99
Apr
-00
Apr
-01
Apr
-02
Apr
-03
Apr
-04
Danapura 4 - 3.25 3.65 2.8 2.75 2.45 3.9 - 20.72 Hospet 3.2 3.35 3.3 3.65 3.5 3.4 2.35 2.7 2.96 3.04 Kamalapura 2.55 2.45 2.1 2.5 2.3 2.25 2.5 3.85 2.91 4.56 Kampli 5.95 5.75 5.8 6.75 5.55 5.7 6.25 11.6 1.1 10.22 Potalakatte 2.9 3.5 2.25 2.75 1.6 1.85 1.4 1.7 2.98 4.34 Ramasagara 2.85 2.82 2.3 4 2.7 2.65 3.6 3.35 3.71 2.87 Dharmasagar 9.1 10.35 9.05 9.6 9.9 11.95 11.1 17.27 17.74 20.72 Metri 4.05 6 - - - - - - - - Vaddarahalli 11.9 35 9.3 16.85 12 - - - - -
May
-95
May
-96
May
-97
May
-98
May
-99
May
-00
May
-01
May
-02
May
-03
May
-04
Danapura 5.1 - 3.35 6.1 2.35 3.05 2.6 4.02 - - Hospet 2.95 3.45 3.35 - 3.35 3.6 2.4 2.75 3.24 - Kamalapura 2.75 2.35 2.15 2.35 2.05 2.05 2.6 3.89 3.51 - Kampli 6.2 6.5 5.85 6.75 5.85 6.15 6.3 11.7 10.58 - Potalakatte 3.1 3.7 2.4 3.1 1.7 2.25 1.5 1.68 3.07 - Ramasagara 3.1 3.1 2.45 3.1 2.9 2.7 3.7 3.49 3.95 - Dharmasagar 9.15 10.55 9.1 9.9 9.85 14.55 11.4 18.6 18.92 - Metri 6 6 - - - - - - - - Vaddarahalli 13.3 35.6 9.45 16.85 13 - - - - -
Jun-
95
Jun-
96
Jun-
97
Jun-
98
Jun-
99
Jun-
00
Jun-
01
Jun-
02
Jun-
03
Jun-
04
Danapura 5.85 - 4 7.45 2.45 3.2 2.8 4.68 - - Hospet 3.6 3.25 3.45 - 2.95 3.15 2.6 3.02 3.13 2.88 Kamalapura 2.3 2.1 2.3 2.15 2.75 2.3 3 2.4 3.56 4.45 Kampli 5.9 6.35 5.95 5.7 5.15 6.1 6.55 11.2 10.73 10.46 Potalakatte 3.5 3.55 3 3.55 1.8 2.35 1.7 2.77 3.02 4.4 Ramasagara 3 2.7 2.8 3.6 2.85 2.65 4 3.9 3.99 2.94 Dharmasagar 9.25 10.3 9.25 10.85 9.85 15.1 11.6 14.65 19.08 - Metri 5.9 - - - - - - - - - Vaddarahalli 13.6 36 9.65 34.6 11.05 - - - - -

Study on Carrying Capacity to develop Industrial Siting Guidelines in Bellary, Hospet and Sandur region
Environmental Management And Policy Research Institute XXXI
Jul-9
5
Jul-9
6
Jul-9
7
Jul-9
8
Jul-9
9
Jul-0
0
Jul-0
1
Jul-0
2
Jul-0
3
Jul-0
4
Danapura 5.3 - 4.95 7.45 2.7 3.3 5.4 4.72 - - Hospet 2.95 3.1 3.15 - 3.25 2.05 2.55 2.33 3.08 2.55 Kamalapura 2.95 2 2.45 1.85 2.65 1.85 3.6 2.53 3.64 3.99 Kampli 5.8 6.6 6.3 4.95 5.5 5.55 6.1 10.68 11.87 10.22 Potalakatte 3.35 3.8 2.9 3.65 1.5 2.2 2 1.73 3.45 4.05 Ramasagara 3 2.5 3.9 3.1 3.05 3.25 3.65 4.01 5.35 2.44 Dharmasagar 8.75 10.9 8.65 10.95 10.55 14.6 19.65 15.7 19.76 19.15 Metri 5.75 - - - - - - - - - Vaddarahalli 12.65 36.7 9.5 34.9 13.7 - - - - -
Aug
-95
Aug
-96
Aug
-97
Aug
-98
Aug
-99
Aug
-00
Aug
-01
Aug
-02
Aug
-03
Aug
-04
Danapura 5.95 - 4.7 4.1 2.6 2.95 5.8 3.89 - - Hospet 2.85 2.95 3 3.05 3.55 1.8 2.65 2.37 2.32 2.38 Kamalapura 2.9 2 2.3 1.65 1.95 1.45 3.75 2.57 3.57 3.62 Kampli 4.5 6.5 6.2 4.85 5.45 5.1 6.02 10.76 10.81 9.7 Potalakatte 2.8 3.75 2.85 3.5 1.45 1.9 2.05 1.78 3.26 4.18 Ramasagara 2.95 2.45 3.75 3.05 2.95 2.9 3.85 4.03 3.81 2.38 Dharmasagar 8.75 10.8 8.5 10.78 10.9 14.15 19.95 15.81 20.13 19.38 Metri 5.15 - - - - - - - - - Vaddarahalli 10.4 36.6 9.4 34.9 13.8 - - - - -
Sep-
95
Sep-
96
Sep-
97
Sep-
98
Sep-
99
Sep-
00
Sep-
01
Sep-
02
Sep-
03
Sep-
04
Danapura 6.5 1.25 2.75 3.05 2.6 3 3.1 3.92 - - Hospet 2.85 2.4 3.25 2.7 3.3 2.43 1.9 2.43 2.84 2.12 Kamalapura 2.78 1.9 2.45 2.15 1.9 2.05 1.95 2.6 3.52 3.27 Kampli 4.4 6 6.25 3.87 5.4 4.72 4.9 10.88 9.88 9.15 Potalakatte 2.8 3.1 3.3 2.4 1.65 1.52 1.6 1.82 4.47 3.98 Ramasagara 2.84 2.1 4.1 2.85 3 2.87 2.85 4.17 3.36 2.17 Dharmasagar 9.85 10.05 9.1 10.7 11.3 14 18.1 15.98 21 18.69 Metri 5.05 - - - - - - - - - Vaddarahalli 13.5 34 9.9 15.05 40 - - - - -

Study on Carrying Capacity to develop Industrial Siting Guidelines in Bellary, Hospet and Sandur region
Environmental Management And Policy Research Institute XXXII
Oct
-95
Oct
-96
Oct
-97
Oct
-98
Oct
-99
Oct
-00
Oct
-01
Oct
-02
Oct
-03
Oct
-04
Danapura 6.3 1.25 2.25 1 0.7 2.65 1.05 3.18 4.42 - Hospet 2.7 2.4 3.55 1.5 1.55 2.2 0.9 1.71 2.02 2.07 Kamalapura 2.65 1.45 1.9 1.25 1 1.5 0.87 2.33 2.52 2.89 Kampli 4.3 2.95 5.5 3.1 3.45 4.4 2.3 10.25 7.74 6.62 Potalakatte 2.65 1.4 3 1.65 1.15 1.45 0.65 1.53 3.6 3.73 Ramasagara 2.6 1.6 3.25 1.75 1.25 2.55 0.77 3.29 2.9 1.98 Dharmasagar 9.7 6.85 9.55 8.35 9.25 10.3 12.14 15.02 19.35 18.25 Metri 4.9 - - - - - - - - - Vaddarahalli 13.9 7.5 10.6 6.9 8.25 11.1 - - - -
Nov
-95
Nov
-96
Nov
-97
Nov
-98
Nov
-99
Nov
-00
Nov
-01
Nov
-02
Nov
-03
Nov
-04
Danapura 5.55 1.5 1.45 1.65 1.2 2.15 2.5 4.1 4.72 4.22 Hospet 2.55 2.25 2.65 2.35 2.25 2.3 2 2.65 2.44 2.58 Kamalapura 2.6 1.5 1.55 1.75 1.95 2.42 2.48 2.85 2.46 3.43 Kampli 5.9 3 5.68 4.15 4.2 3.98 3.8 8.8 8.44 6.42 Potalakatte 2.2 1.45 2.6 2.1 1.45 0.68 1.2 1.3 3.73 3.87 Ramasagara 2.55 1.65 3.35 2.4 2.1 2.7 1.9 2.35 - 2.33 Dharmasagar 9.1 6.8 9.6 8.55 9.65 14.05 13.9 18.2 19.89 20.15 Metri 3.6 - - - - - - - - - Vaddarahalli 14.15 7.8 10.6 6.9 8.8 15.4 - - - -
Dec
-95
Dec
-96
Dec
-97
Dec
-98
Dec
-99
Dec
-00
Dec
-01
Dec
-02
Dec
-03
Dec
-04
Danapura 6 2.5 1.8 2.2 1.6 2.24 2.7 4.75 4.07 5.06 Hospet 2.7 1.8 2.55 2.9 2.4 2.9 1.97 2.7 2.82 2.72 Kamalapura 2.85 1.6 2.13 1.65 2.05 3.1 - 2.9 2.57 3.74 Kampli 6.1 3.1 6.72 4.9 4.45 4.48 4.5 8.9 - 6.68 Potalakatte 2.7 1.5 2.25 1.35 1.5 1.08 1.3 1.35 3.9 3.92 Ramasagara 2.65 1.7 3.81 3 2.25 3.3 2.6 2.4 2.24 2.88 Dharmasagar 9.85 7 8.55 8.85 9.9 16.3 12.93 16.4 20.27 20.43 Metri 3.95 - - - - - - - - - Vaddarahalli 15.9 7 10.6 7.25 9.15 17 - - - -
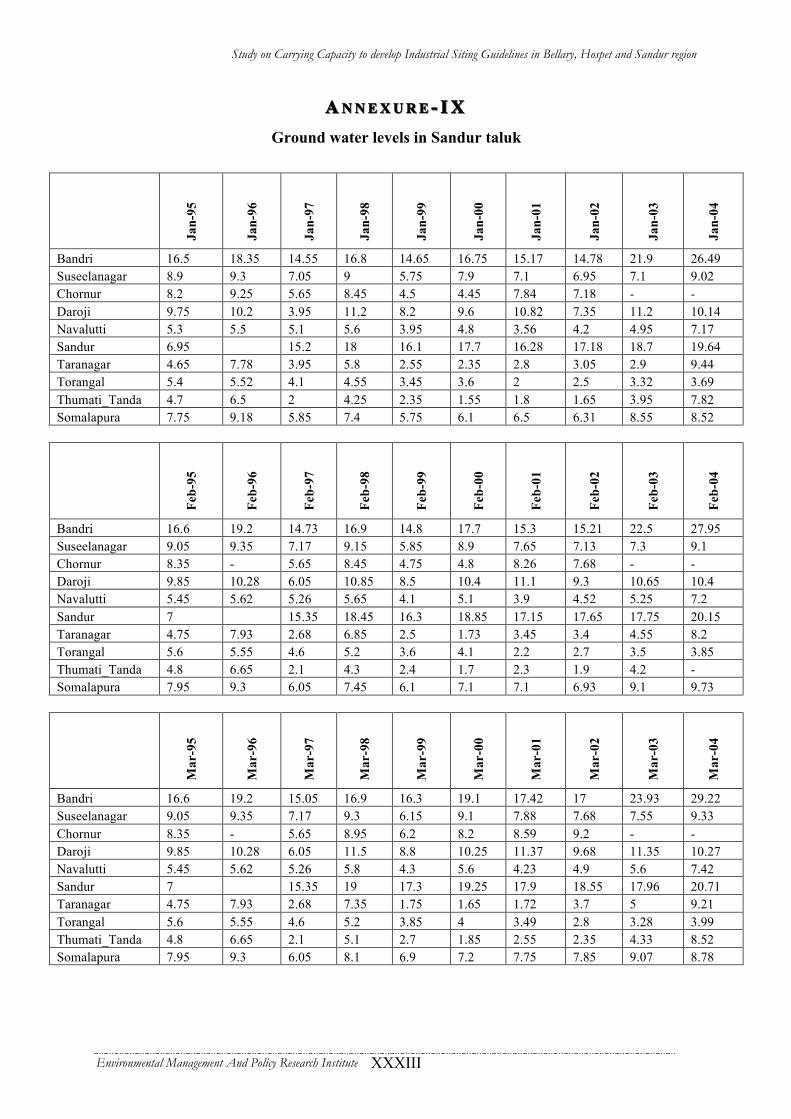
Study on Carrying Capacity to develop Industrial Siting Guidelines in Bellary, Hospet and Sandur region
Environmental Management And Policy Research Institute XXXIII
AA N N E X U R EN N E X U R E -- I XI X Ground water levels in Sandur taluk
Ja
n-95
Jan-
96
Jan-
97
Jan-
98
Jan-
99
Jan-
00
Jan-
01
Jan-
02
Jan-
03
Jan-
04
Bandri 16.5 18.35 14.55 16.8 14.65 16.75 15.17 14.78 21.9 26.49 Suseelanagar 8.9 9.3 7.05 9 5.75 7.9 7.1 6.95 7.1 9.02 Chornur 8.2 9.25 5.65 8.45 4.5 4.45 7.84 7.18 - - Daroji 9.75 10.2 3.95 11.2 8.2 9.6 10.82 7.35 11.2 10.14 Navalutti 5.3 5.5 5.1 5.6 3.95 4.8 3.56 4.2 4.95 7.17 Sandur 6.95 15.2 18 16.1 17.7 16.28 17.18 18.7 19.64 Taranagar 4.65 7.78 3.95 5.8 2.55 2.35 2.8 3.05 2.9 9.44 Torangal 5.4 5.52 4.1 4.55 3.45 3.6 2 2.5 3.32 3.69 Thumati_Tanda 4.7 6.5 2 4.25 2.35 1.55 1.8 1.65 3.95 7.82 Somalapura 7.75 9.18 5.85 7.4 5.75 6.1 6.5 6.31 8.55 8.52
Feb-
95
Feb-
96
Feb-
97
Feb-
98
Feb-
99
Feb-
00
Feb-
01
Feb-
02
Feb-
03
Feb-
04
Bandri 16.6 19.2 14.73 16.9 14.8 17.7 15.3 15.21 22.5 27.95 Suseelanagar 9.05 9.35 7.17 9.15 5.85 8.9 7.65 7.13 7.3 9.1 Chornur 8.35 - 5.65 8.45 4.75 4.8 8.26 7.68 - - Daroji 9.85 10.28 6.05 10.85 8.5 10.4 11.1 9.3 10.65 10.4 Navalutti 5.45 5.62 5.26 5.65 4.1 5.1 3.9 4.52 5.25 7.2 Sandur 7 15.35 18.45 16.3 18.85 17.15 17.65 17.75 20.15 Taranagar 4.75 7.93 2.68 6.85 2.5 1.73 3.45 3.4 4.55 8.2 Torangal 5.6 5.55 4.6 5.2 3.6 4.1 2.2 2.7 3.5 3.85 Thumati_Tanda 4.8 6.65 2.1 4.3 2.4 1.7 2.3 1.9 4.2 - Somalapura 7.95 9.3 6.05 7.45 6.1 7.1 7.1 6.93 9.1 9.73
Mar
-95
Mar
-96
Mar
-97
Mar
-98
Mar
-99
Mar
-00
Mar
-01
Mar
-02
Mar
-03
Mar
-04
Bandri 16.6 19.2 15.05 16.9 16.3 19.1 17.42 17 23.93 29.22 Suseelanagar 9.05 9.35 7.17 9.3 6.15 9.1 7.88 7.68 7.55 9.33 Chornur 8.35 - 5.65 8.95 6.2 8.2 8.59 9.2 - - Daroji 9.85 10.28 6.05 11.5 8.8 10.25 11.37 9.68 11.35 10.27 Navalutti 5.45 5.62 5.26 5.8 4.3 5.6 4.23 4.9 5.6 7.42 Sandur 7 15.35 19 17.3 19.25 17.9 18.55 17.96 20.71 Taranagar 4.75 7.93 2.68 7.35 1.75 1.65 1.72 3.7 5 9.21 Torangal 5.6 5.55 4.6 5.2 3.85 4 3.49 2.8 3.28 3.99 Thumati_Tanda 4.8 6.65 2.1 5.1 2.7 1.85 2.55 2.35 4.33 8.52 Somalapura 7.95 9.3 6.05 8.1 6.9 7.2 7.75 7.85 9.07 8.78
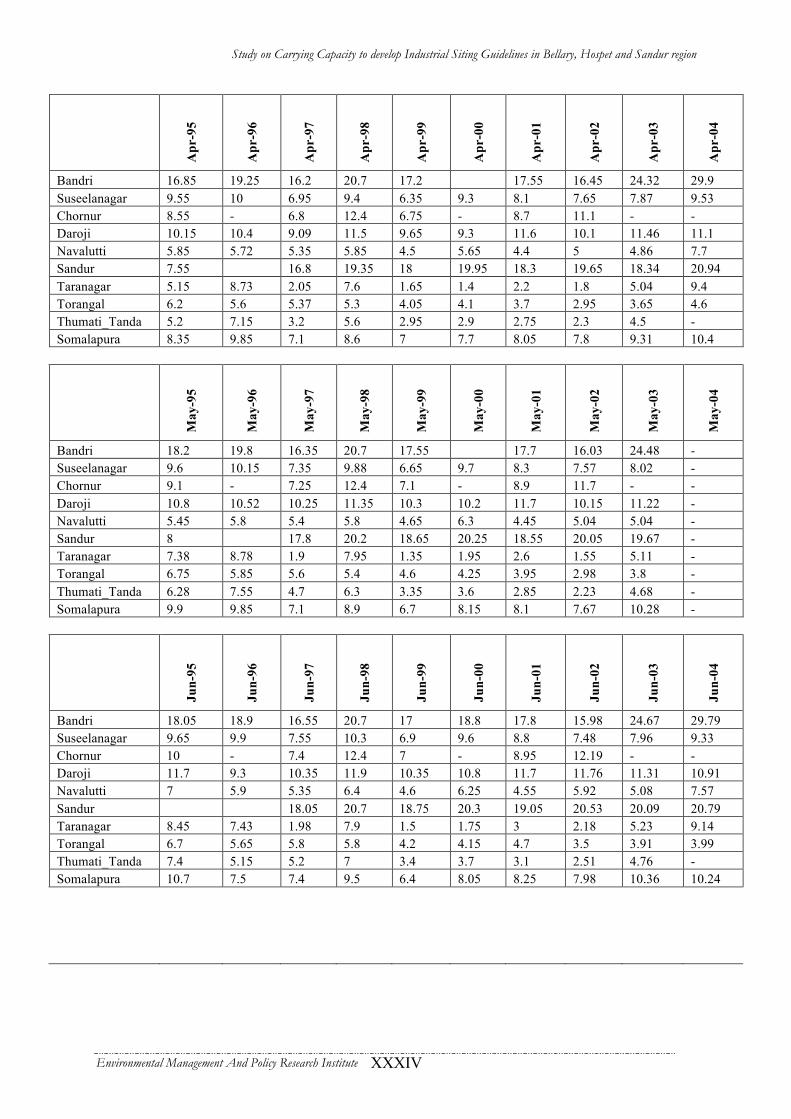
Study on Carrying Capacity to develop Industrial Siting Guidelines in Bellary, Hospet and Sandur region
Environmental Management And Policy Research Institute XXXIV
Apr
-95
Apr
-96
Apr
-97
Apr
-98
Apr
-99
Apr
-00
Apr
-01
Apr
-02
Apr
-03
Apr
-04
Bandri 16.85 19.25 16.2 20.7 17.2 17.55 16.45 24.32 29.9 Suseelanagar 9.55 10 6.95 9.4 6.35 9.3 8.1 7.65 7.87 9.53 Chornur 8.55 - 6.8 12.4 6.75 - 8.7 11.1 - - Daroji 10.15 10.4 9.09 11.5 9.65 9.3 11.6 10.1 11.46 11.1 Navalutti 5.85 5.72 5.35 5.85 4.5 5.65 4.4 5 4.86 7.7 Sandur 7.55 16.8 19.35 18 19.95 18.3 19.65 18.34 20.94 Taranagar 5.15 8.73 2.05 7.6 1.65 1.4 2.2 1.8 5.04 9.4 Torangal 6.2 5.6 5.37 5.3 4.05 4.1 3.7 2.95 3.65 4.6 Thumati_Tanda 5.2 7.15 3.2 5.6 2.95 2.9 2.75 2.3 4.5 - Somalapura 8.35 9.85 7.1 8.6 7 7.7 8.05 7.8 9.31 10.4
May
-95
May
-96
May
-97
May
-98
May
-99
May
-00
May
-01
May
-02
May
-03
May
-04
Bandri 18.2 19.8 16.35 20.7 17.55 17.7 16.03 24.48 - Suseelanagar 9.6 10.15 7.35 9.88 6.65 9.7 8.3 7.57 8.02 - Chornur 9.1 - 7.25 12.4 7.1 - 8.9 11.7 - - Daroji 10.8 10.52 10.25 11.35 10.3 10.2 11.7 10.15 11.22 - Navalutti 5.45 5.8 5.4 5.8 4.65 6.3 4.45 5.04 5.04 - Sandur 8 17.8 20.2 18.65 20.25 18.55 20.05 19.67 - Taranagar 7.38 8.78 1.9 7.95 1.35 1.95 2.6 1.55 5.11 - Torangal 6.75 5.85 5.6 5.4 4.6 4.25 3.95 2.98 3.8 - Thumati_Tanda 6.28 7.55 4.7 6.3 3.35 3.6 2.85 2.23 4.68 - Somalapura 9.9 9.85 7.1 8.9 6.7 8.15 8.1 7.67 10.28 -
Jun-
95
Jun-
96
Jun-
97
Jun-
98
Jun-
99
Jun-
00
Jun-
01
Jun-
02
Jun-
03
Jun-
04
Bandri 18.05 18.9 16.55 20.7 17 18.8 17.8 15.98 24.67 29.79 Suseelanagar 9.65 9.9 7.55 10.3 6.9 9.6 8.8 7.48 7.96 9.33 Chornur 10 - 7.4 12.4 7 - 8.95 12.19 - - Daroji 11.7 9.3 10.35 11.9 10.35 10.8 11.7 11.76 11.31 10.91 Navalutti 7 5.9 5.35 6.4 4.6 6.25 4.55 5.92 5.08 7.57 Sandur 18.05 20.7 18.75 20.3 19.05 20.53 20.09 20.79 Taranagar 8.45 7.43 1.98 7.9 1.5 1.75 3 2.18 5.23 9.14 Torangal 6.7 5.65 5.8 5.8 4.2 4.15 4.7 3.5 3.91 3.99 Thumati_Tanda 7.4 5.15 5.2 7 3.4 3.7 3.1 2.51 4.76 - Somalapura 10.7 7.5 7.4 9.5 6.4 8.05 8.25 7.98 10.36 10.24

Study on Carrying Capacity to develop Industrial Siting Guidelines in Bellary, Hospet and Sandur region
Environmental Management And Policy Research Institute XXXV
Jul-9
5
Jul-9
6
Jul-9
7
Jul-9
8
Jul-9
9
Jul-0
0
Jul-0
1
Jul-0
2
Jul-0
3
Jul-0
4
Bandri 18.15 19.2 15.55 20.7 17.4 17.75 18.05 17.37 26.27 28.37 Suseelanagar 9.4 9.85 7.7 10.4 7.3 8.75 8.5 7.54 8.13 8.87 Chornur 10.15 - 7.6 12.4 6.8 8.2 - 10.69 - - Daroji 12 9.25 11.3 15 10.9 12.45 12.5 12.41 - 10.27 Navalutti 6.32 6.05 5.25 6.65 4.7 6 4.9 5.23 5.19 6.95 Sandur 19.95 18.2 20.7 19.1 19.3 19.28 20.02 19.33 20.17 Taranagar 8.45 7.4 2.35 8.1 1.88 1.85 2.1 1.7 6.98 8.92 Torangal 6.78 5.5 5.7 6.05 4.5 3.7 4.2 3.53 4.08 4.46 Thumati_Tanda 7.4 5.18 5.5 7.2 4.35 3.6 3 3.19 6.15 - Somalapura 10.85 7.65 7.1 8.5 6.6 6.55 8.1 7.76 10.6 8.78
Aug
-95
Aug
-96
Aug
-97
Aug
-98
Aug
-99
Aug
-00
Aug
-01
Aug
-02
Aug
-03
Aug
-04
Bandri 18.05 19.5 16.65 20.7 17.45 17.05 18.05 17.42 22.99 28.55 Suseelanagar 9.18 9.85 7.45 10.02 7.4 8.5 8.45 7.59 8.03 9.27 Chornur 9.25 - 7.1 12.4 6.7 7.5 - 10.82 - - Daroji 10.65 10.4 10.55 12 9.95 12.15 12.08 12.46 9.95 Navalutti 5.5 5.8 5.05 6.6 4.85 5.5 4.75 5.29 5.04 7.17 Sandur 17.2 18.45 20.3 19.25 17.87 19.05 20.13 19.14 20.32 Taranagar 7.28 7.28 2.9 7.7 2.48 1.5 1.1 1.76 7.84 9.05 Torangal 5.45 5.9 5.9 5.8 4.1 3.3 4 3.56 4.08 4.18 Thumati_Tanda 7.4 5.05 3.95 7.4 4.4 2.55 3.3 3.23 - - Somalapura 9.4 6.8 7.6 6.8 7.4 6 8.03 7.82 10.82 8.95
Sep-
95
Sep-
96
Sep-
97
Sep-
98
Sep-
99
Sep-
00
Sep-
01
Sep-
02
Sep-
03
Sep-
04
Bandri 18.1 17.75 17 19.2 18.2 17.3 17.55 17.49 24.98 26.88 Suseelanagar 9 8.55 7.95 9.6 8.1 8.4 8.25 7.62 8.11 8.85 Chornur 9.2 7.5 7.8 8.5 6.6 7.3 - 10.91 - - Daroji 10.2 4 11.2 10.5 9.85 9.69 11.2 12.55 9.19 Navalutti 5.2 4.65 5.55 5.6 5 5.1 4.5 5.34 - 6.72 Sandur 13.21 18.1 19.8 19.85 17.4 18.1 20.28 19.47 18.94 Taranagar 6.94 5.18 3.55 7.85 3.23 2.57 1.1 1.79 8.36 8.66 Torangal 5.2 5.25 5.15 5.4 4.2 2.87 3.95 3.85 4.39 3.64 Thumati_Tanda 4.95 4.1 7 3.25 2.4 2.9 3.3 7.28 - Somalapura 9.26 4.1 7.8 6.16 7.4 5.6 6.9 7.89 10.45 7.27

Study on Carrying Capacity to develop Industrial Siting Guidelines in Bellary, Hospet and Sandur region
Environmental Management And Policy Research Institute XXXVI
Oct
-95
Oct
-96
Oct
-97
Oct
-98
Oct
-99
Oct
-00
Oct
-01
Oct
-02
Oct
-03
Oct
-04
Bandri 17.4 14.82 17.1 12.8 15.9 17.2 14.9 15.05 19.58 22.65 Suseelanagar 8.5 6.23 8.1 5.7 7.7 8.05 6.45 5.23 8.28 Chornur 8.8 5.08 8 5.6 4.2 6.7 4.6 8.72 - - Daroji 9.35 1.1 10.9 3.75 7.1 9.45 5.75 11.14 11.23 7.92 Navalutti 4.7 3.85 5.6 4.25 3.9 5 3.2 3.76 - 6.25 Sandur 20.05 13.53 18.35 15.4 17.45 17.1 17.45 19.04 17.85 17.64 Taranagar 7.23 3.68 4.55 4.75 2.3 2.4 1.05 1.32 8.05 8.24 Torangal 4.85 4.05 5.35 4.1 3.6 2.87 2.08 1.51 3.48 3.06 Thumati_Tanda 5.65 3.13 4.25 5.2 0.85 2.18 1.7 2.78 6.93 - Somalapura 8.9 3.7 8.1 2.35 3.6 5.4 2.95 8.04 7.73 7.05
Nov
-95
Nov
-96
Nov
-97
Nov
-98
Nov
-99
Nov
-00
Nov
-01
Nov
-02
Nov
-03
Nov
-04
Bandri 18.05 14.1 17 13.2 16.35 13.83 14.6 15.25 20.38 23.55 Suseelanagar 8.73 6.03 8.05 5.45 7.6 6.78 6.45 5.5 8.7 8.63 Chornur 9.2 5.18 7.9 3.75 4 5.73 - 8.8 - - Daroji 9.95 2.1 9.25 4.75 7.3 8.43 9.9 9.8 9.61 8.21 Navalutti 5.2 4.1 5.55 4.2 4.25 3.08 3.3 4.35 6.53 6.54 Sandur 20.3 13.53 17.85 15.1 16.65 15.5 16.65 19.1 18.3 18.19 Taranagar 7.28 3.53 4.05 4.5 2.65 2.18 2.82 1.5 8.17 9.08 Torangal 5.15 4.05 5.1 3.55 3.25 3.47 2.1 1.65 3.6 3.37 Thumati_Tanda 5.7 2.55 4.1 4.9 1.05 1.55 1.85 2.85 6.94 8.77 Somalapura 8.9 4.1 8.2 3.55 4.7 6 5.5 8.1 7.75 7.83
Dec
-95
Dec
-96
Dec
-97
Dec
-98
Dec
-99
Dec
-00
Dec
-01
Dec
-02
Dec
-03
Dec
-04
Bandri 18.2 14.42 16.2 14.4 16.55 13.95 14.65 15.4 22.86 21.41 Suseelanagar 8.9 6.85 7.9 5.65 7.7 6.85 6.73 5.65 8.88 8.92 Chornur 9.2 5.58 7.95 4.35 4.15 5.95 6.8 9 - - Daroji 10.05 2.29 10 6.8 7.45 8.5 7.15 10.2 10.1 8.43 Navalutti 5.38 4.89 5.4 3.85 4.5 3.26 4 4.5 6.76 6.76 Sandur 20.65 14.15 17.3 15.75 17.4 16.15 16.79 19.2 18.31 Taranagar 7.48 3.89 4.85 3.7 2.1 2.3 2.95 1.75 8.23 9.32 Torangal 5.15 4.25 4.8 3.4 3.45 1.88 2.38 1.7 3.6 3.3 Thumati_Tanda 6.05 2.35 3.55 2.25 1.2 1.67 1.2 2.95 7.28 9.13 Somalapura 9 4.96 6.6 5.05 4.8 6.3 6.05 7.9 8.04 7.94

Study on Carrying Capacity to develop Industrial Siting Guidelines in Bellary, Hospet and Sandur region
Environmental Management And Policy Research Institute XXXVII
AA N N E X U R EN N E X U R E -- XX List of industries in Bellary, Hospet & Sandur taluks
Sl. No Name & Address of the Unit Name of the End Product Investment
(In Lakhs) Employment
Status as on Oct 2005
1 M/s.N.K.Steel Bellary Ananthpura Road, Bellary Billets & Sheet production 1700 485 Working 2 M/s.Karnataka Strips Pvt.,Ltd., Bellary Colo Rolled Strips 2053 28 Working 3 M/s.Mullangi Sinrex Ltd, 87/ Andral Road, Bellary Cotton Yarn 465 60 Working 4 M/s.Sirdi Sai Spintex Pvt.Ltd, New Andral Ramanagar Bommananal Road, Bellary Cotton Yarn 4.61 40 Working 5 M/s.Tungabhadra Steel Products,TB. Dam, Hospet Engineering Design & Fabrication 793 946 Working 6 M/s.Bnavalka Pipes JVSL Ancillary Indl.Estate, Toranagallu ERW Galvanised Steel Pipes 900 200 Working 7 M/s.United Galva Pvt.,Ltd., Bellary GP & GC Sheets 1665 30 Working 8 M/s.Padmavathi Ferross Pvt., Ltd., J.V.S.L. Ancillary Indl. Estate Toranagallu High Carbon Ferr Manganese 3300 66 Working 9 M/s.N.M.D.C.Ltd, Donimalai, Sandur Iron ore 320 118 Working
10 M/s.Tungabhadra Minerals, Vishwa Complex Station Road, Hospet Iron Work 320 118 Working 11 M/s.Sandur Manganese and Iron Ores, Deoagiri, Sandur Manganese Iron Ore 510 1322 Working 12 M/s.Bellary Steels & Rolling Mill, ATP Road, Bellary MS flats & Angles 4500 60 Working 13 M/s.Siddeswara Oils & Allied Products Pvt.Ltd, No.211/5, Halkundi, Bellary Tq Oil 4.36 15 Working 14 M/s.KOF Ltd, KIADB Indl Area, Bellary Road, Hospet Oil, Oilcake 1385 156 Working 15 M/s.Pampasara Distilery Ltd, Chitwadgi, Hospet Rectified Spirit & IML 1136 225 Working 16 M/s.Sharada Veg Oil Ltd, Bangalore Road, Bellary Solvent Extraction 450 40 Working 17 M/s.Bellary Steels & Alloy Ltd No. 10 Ananthpura Road, Bellary Sponge Iron 4500 385 Working 18 M/s.Minerals Sales Pvt. Ltd, N.R.Colony, Hospet Sponge Iron 344 423 Working 19 M/s.India Sugar & Refinanace, Chitwadgi, Hospet Sugar 3000 688 Working 20 M/s.Siruguppa Sugar & Chemicals, Deshnoor,Siruguppa Sugar 497 490 Working 21 M/s.Poweroniks Ltd.,Adoni Road,Sriguppa Bio-Mass Based Powder 24 200 Pipeline* 22 M/s.Millenium Spices Ltd, Mincheri Villagr,Bellary Tq Chilli Oil 5 30 Pipeline* 23 M/s.Sree Raghavendra Carbans Coal Bricqettes Coal Bricqetter 9.9 60 Pipeline* 24 M/s.Padmavathi Coke Pvt.Ltd JVSl Site Thoranagatti,JVSI Ancillary,Sandur Tq Coke 2.83 80 Pipeline* 25 M/s.Keshav Castings Pvt.Ltd.Bannihalli Coke Woven Products 2.83 80 Pipeline* 26 M/s.BSAL (ISP) Ananthapur Road, Bellary M.S.Steel 1500 500 Pipeline* 27 M/s.SlS Power Industries Ltd.,Suguru Village, Sirguppa Tq Power Generation 31.41 100 Pipeline* 28 M/s.Janki Corp Ltd, Shidiginamola, Bellary Tq Sponge Iron 18.83 128 Pipeline*

Study on Carrying Capacity to develop Industrial Siting Guidelines in Bellary, Hospet and Sandur region
Environmental Management And Policy Research Institute XXXVIII
Sl. No Name & Address of the Unit Name of the End Product Investment
(In Lakhs) Employment
Status as on Oct 2005
29 M/s.H.K.T.Mining Pvt.,Ltd., Danapura,Hospet Tq Sponge Iron 12.38 100 Pipeline* 30 M/s.Hindustan Calcined Metal Pvt.Ltd,Janekunta,Bellary Tq Sponge Iron 10.4 85 Pipeline* 31 M/s.K.R.Alloy Ltd.,Meenakshi,Bellary Tq Sponge Iron 10 80 Pipeline* 32 M/s.Banaka Sponge Iron Pvt.Ltd.Belagal Village, Bellary Tq Sponge Iron 9.51 85 Pipeline* 33 M/s.Hothur Steels Gonehal Village, Bellary Sponge Iron 9 100 Pipeline* 34 M/s.Papuri Steels Ltd.,J.V.S.L.Ancillary Indl.Estate, Thoranagallu Sponge Iron 8.85 74 Pipeline* 35 M/s.Kargnur Iron & Steel Pvt.Ltd.J.V.S.L.Ancillary Indl.Estate, Thoranagallu Sponge Iron 8.7 81 Pipeline* 36 M/s.Rangineni Steel Pvt.Ltd Halakundi, Bellary Tq Sponge Iron 3.05 65 Pipeline* 37 M/s.Sigma Solid Strips Pvt.Ltd Halakundhi, Bellary Tq Sponge Iron 3.01 65 Pipeline* 38 M/s.Panyam Cement & Minerals Hagari Pura, Sandur Calcium Carbide 1662 342 Closed 39 M/s.Sandur Micro Circuites Ltd, Lakshmi Pura Capacitors Network 835 49 Closed 40 M/s.Sandur Laminates Lakshmi Pura, Sandur Copper Clade Lamination 7231 223 Closed 41 M/s.Sandur Manganese and Iron Ores Vyasanakere, Hospet Ferrous Silicon, Ferrous
Managanese 543 600 Closed
42 M/s.Unimetal Ispat Ltd, Siruguppa Foundry Grade Pig Iron 450 400 Closed 43 M/s.Kampli Sugar Co-operative, Kampli, Hospet Tq Sugar 636 250 Closed
Source: Karnataka Udyoga Mitra GoK * Units Cleared by State Level & District Level Single Window Agency
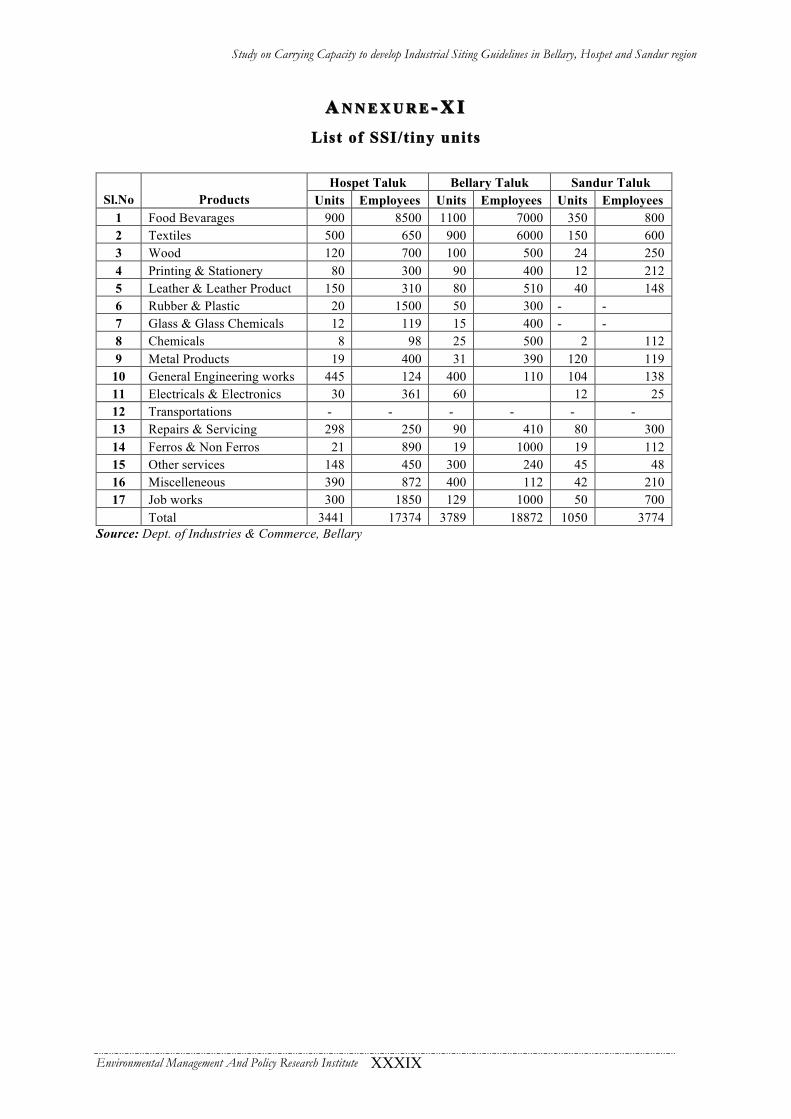
Study on Carrying Capacity to develop Industrial Siting Guidelines in Bellary, Hospet and Sandur region
Environmental Management And Policy Research Institute XXXIX
AA N N E X U R EN N E X U R E -- X IX I List of SSI/tiny units
Hospet Taluk Bellary Taluk Sandur Taluk
Sl.No Products Units Employees Units Employees Units Employees 1 Food Bevarages 900 8500 1100 7000 350 800 2 Textiles 500 650 900 6000 150 600 3 Wood 120 700 100 500 24 250 4 Printing & Stationery 80 300 90 400 12 212 5 Leather & Leather Product 150 310 80 510 40 148 6 Rubber & Plastic 20 1500 50 300 - - 7 Glass & Glass Chemicals 12 119 15 400 - - 8 Chemicals 8 98 25 500 2 112 9 Metal Products 19 400 31 390 120 119
10 General Engineering works 445 124 400 110 104 138 11 Electricals & Electronics 30 361 60 12 25 12 Transportations - - - - - - 13 Repairs & Servicing 298 250 90 410 80 300 14 Ferros & Non Ferros 21 890 19 1000 19 112 15 Other services 148 450 300 240 45 48 16 Miscelleneous 390 872 400 112 42 210 17 Job works 300 1850 129 1000 50 700
Total 3441 17374 3789 18872 1050 3774 Source: Dept. of Industries & Commerce, Bellary

Study on Carrying Capacity to develop Industrial Siting Guidelines in Bellary, Hospet and Sandur region
Environmental Management And Policy Research Institute XL
AA N N E X U R EN N E X U R E -- X I IX I I Particulars of fuel used for domestic purpose
Type of fuel used for cooking
Area Name Total
number of households
Fire
woo
d
Cro
p re
sidu
e
Cow
dung
ca
ke
Coa
l, L
igni
te,
Cha
rcoa
l
Ker
osen
e
LPG
Ele
ctri
city
Bio
gas
Any
oth
er
No
cook
ing
Karnataka 10,232,133 6,639,769 540,957 24,481 3,498 938,747 1,874,198 44,493 124,817 8,003 33,170 Bellary Dist. 368,360 280,378 17,478 542 109 17,905 46,980 1,494 2,214 205 1,055 Hospet 69,319 47,565 2,970 185 36 4,619 12,645 532 471 116 180 Bellary 113,747 75,130 4,862 106 47 10,307 21,158 587 1,020 18 512 Sandur 35,114 27,435 1,098 20 3 911 5,303 102 161 1 80 Total in 3 talukas 218,180 150,130 8,930 311 86 15,837 39,106 1,221 1,652 135 772
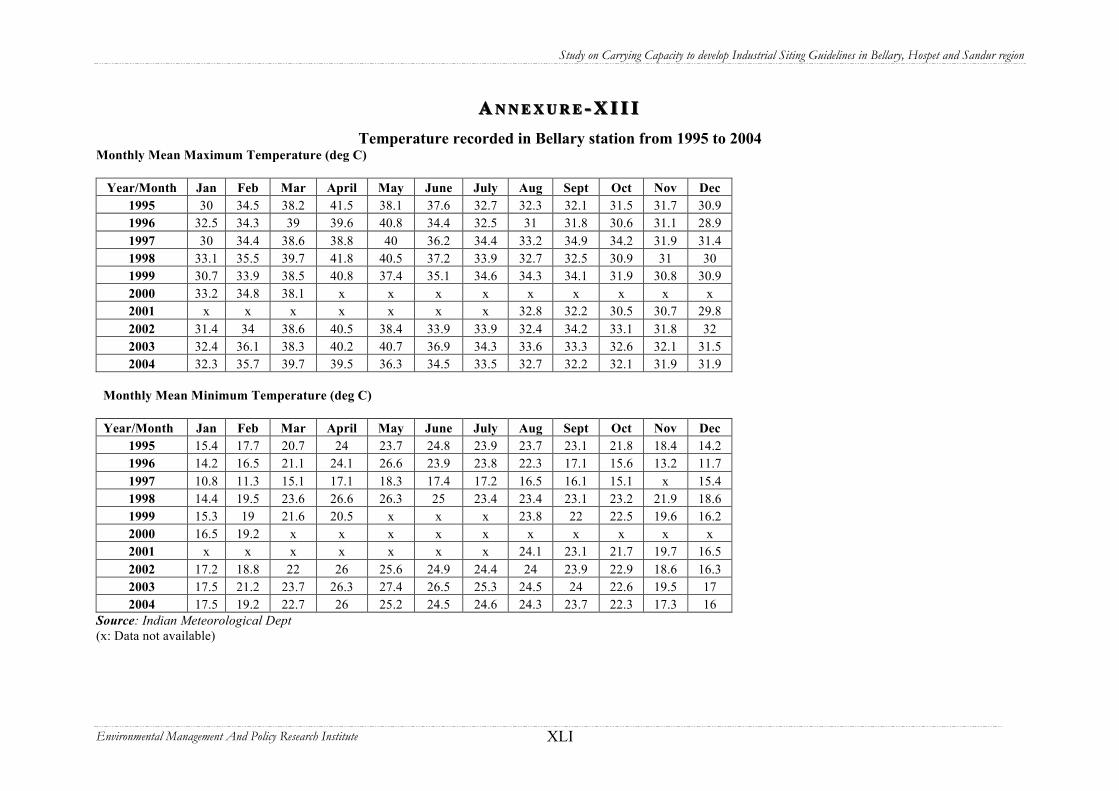
Study on Carrying Capacity to develop Industrial Siting Guidelines in Bellary, Hospet and Sandur region
Environmental Management And Policy Research Institute XLI
AA N N E X U R EN N E X U R E -- X I I IX I I I Temperature recorded in Bellary station from 1995 to 2004
Monthly Mean Maximum Temperature (deg C)
Year/Month Jan Feb Mar April May June July Aug Sept Oct Nov Dec 1995 30 34.5 38.2 41.5 38.1 37.6 32.7 32.3 32.1 31.5 31.7 30.9 1996 32.5 34.3 39 39.6 40.8 34.4 32.5 31 31.8 30.6 31.1 28.9 1997 30 34.4 38.6 38.8 40 36.2 34.4 33.2 34.9 34.2 31.9 31.4 1998 33.1 35.5 39.7 41.8 40.5 37.2 33.9 32.7 32.5 30.9 31 30 1999 30.7 33.9 38.5 40.8 37.4 35.1 34.6 34.3 34.1 31.9 30.8 30.9 2000 33.2 34.8 38.1 x x x x x x x x x 2001 x x x x x x x 32.8 32.2 30.5 30.7 29.8 2002 31.4 34 38.6 40.5 38.4 33.9 33.9 32.4 34.2 33.1 31.8 32 2003 32.4 36.1 38.3 40.2 40.7 36.9 34.3 33.6 33.3 32.6 32.1 31.5 2004 32.3 35.7 39.7 39.5 36.3 34.5 33.5 32.7 32.2 32.1 31.9 31.9
Monthly Mean Minimum Temperature (deg C) Year/Month Jan Feb Mar April May June July Aug Sept Oct Nov Dec
1995 15.4 17.7 20.7 24 23.7 24.8 23.9 23.7 23.1 21.8 18.4 14.2 1996 14.2 16.5 21.1 24.1 26.6 23.9 23.8 22.3 17.1 15.6 13.2 11.7 1997 10.8 11.3 15.1 17.1 18.3 17.4 17.2 16.5 16.1 15.1 x 15.4 1998 14.4 19.5 23.6 26.6 26.3 25 23.4 23.4 23.1 23.2 21.9 18.6 1999 15.3 19 21.6 20.5 x x x 23.8 22 22.5 19.6 16.2 2000 16.5 19.2 x x x x x x x x x x 2001 x x x x x x x 24.1 23.1 21.7 19.7 16.5 2002 17.2 18.8 22 26 25.6 24.9 24.4 24 23.9 22.9 18.6 16.3 2003 17.5 21.2 23.7 26.3 27.4 26.5 25.3 24.5 24 22.6 19.5 17 2004 17.5 19.2 22.7 26 25.2 24.5 24.6 24.3 23.7 22.3 17.3 16
Source: Indian Meteorological Dept (x: Data not available)
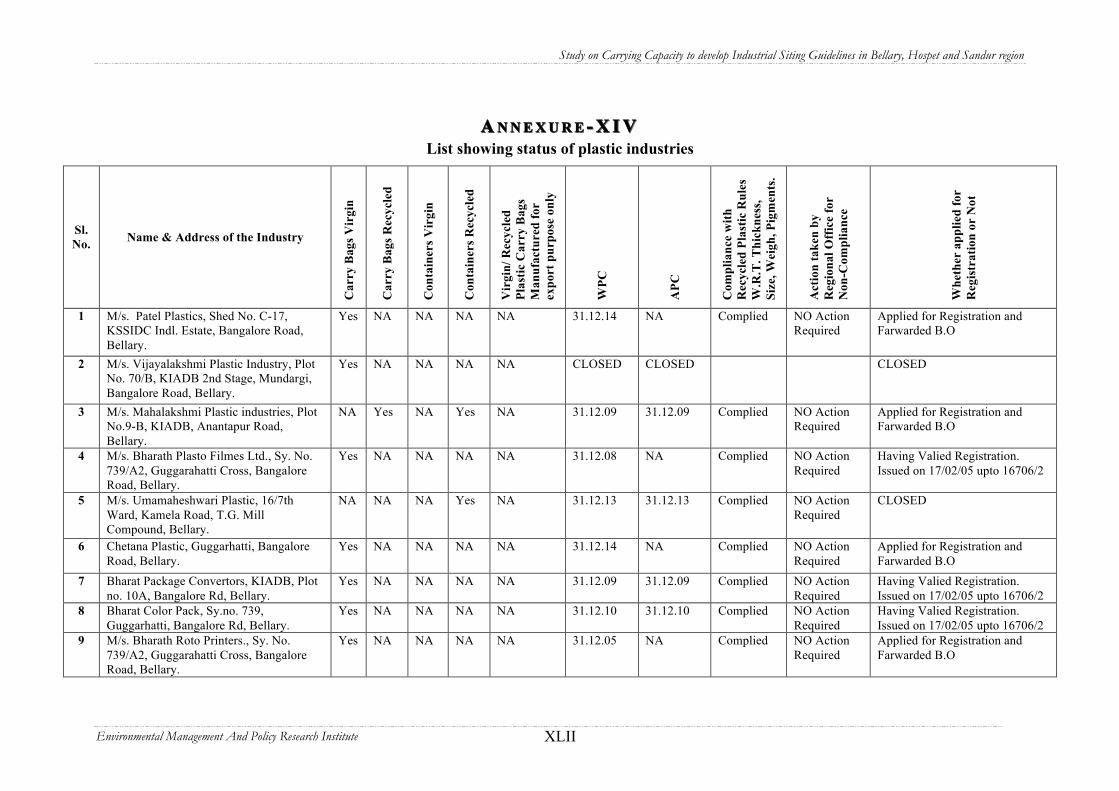
Study on Carrying Capacity to develop Industrial Siting Guidelines in Bellary, Hospet and Sandur region
Environmental Management And Policy Research Institute XLII
AA N N E X U R EN N E X U R E -- X I VX I V
List showing status of plastic industries
Sl. No. Name & Address of the Industry
Car
ry B
ags V
irgi
n
Car
ry B
ags R
ecyc
led
Con
tain
ers V
irgi
n
Con
tain
ers R
ecyc
led
Vir
gin/
Rec
ycle
d Pl
astic
Car
ry B
ags
Man
ufac
ture
d fo
r ex
port
pur
pose
onl
y
WPC
APC
Com
plia
nce
with
R
ecyc
led
Plas
tic R
ules
W
.R.T
. Thi
ckne
ss,
Size
, Wei
gh, P
igm
ents
.
Act
ion
take
n by
R
egio
nal O
ffic
e fo
r N
on-C
ompl
ianc
e
Whe
ther
app
lied
for
Reg
istr
atio
n or
Not
1 M/s. Patel Plastics, Shed No. C-17, KSSIDC Indl. Estate, Bangalore Road, Bellary.
Yes NA NA NA NA 31.12.14 NA Complied NO Action Required
Applied for Registration and Farwarded B.O
2 M/s. Vijayalakshmi Plastic Industry, Plot No. 70/B, KIADB 2nd Stage, Mundargi, Bangalore Road, Bellary.
Yes NA NA NA NA CLOSED CLOSED CLOSED
3 M/s. Mahalakshmi Plastic industries, Plot No.9-B, KIADB, Anantapur Road, Bellary.
NA Yes NA Yes NA 31.12.09 31.12.09 Complied NO Action Required
Applied for Registration and Farwarded B.O
4 M/s. Bharath Plasto Filmes Ltd., Sy. No. 739/A2, Guggarahatti Cross, Bangalore Road, Bellary.
Yes NA NA NA NA 31.12.08 NA Complied NO Action Required
Having Valied Registration. Issued on 17/02/05 upto 16706/2
5 M/s. Umamaheshwari Plastic, 16/7th Ward, Kamela Road, T.G. Mill Compound, Bellary.
NA NA NA Yes NA 31.12.13 31.12.13 Complied NO Action Required
CLOSED
6 Chetana Plastic, Guggarhatti, Bangalore Road, Bellary.
Yes NA NA NA NA 31.12.14 NA Complied NO Action Required
Applied for Registration and Farwarded B.O
7 Bharat Package Convertors, KIADB, Plot no. 10A, Bangalore Rd, Bellary.
Yes NA NA NA NA 31.12.09 31.12.09 Complied NO Action Required
Having Valied Registration. Issued on 17/02/05 upto 16706/2
8 Bharat Color Pack, Sy.no. 739, Guggarhatti, Bangalore Rd, Bellary.
Yes NA NA NA NA 31.12.10 31.12.10 Complied NO Action Required
Having Valied Registration. Issued on 17/02/05 upto 16706/2
9 M/s. Bharath Roto Printers., Sy. No. 739/A2, Guggarahatti Cross, Bangalore Road, Bellary.
Yes NA NA NA NA 31.12.05 NA Complied NO Action Required
Applied for Registration and Farwarded B.O

Study on Carrying Capacity to develop Industrial Siting Guidelines in Bellary, Hospet and Sandur region
Environmental Management And Policy Research Institute XLIII
AA N N E X U R EN N E X U R E -- X VX V Particulars of landfill sites identified under MSW rules in Bellary district
Sl. No.
Name of the Local Body
Qty. of Solid Waste (tonnes/month) Disposal Location Area
(Acres) Whether
Govt/Pvt. Land 1 CMC, Bellary 100 Sy. No. 147, Haddinagundu 6.32 Government 2 CMC, Hospet 20 Sy. No. 72B3 10.32 Private 3 TMC, Kampli 4 Sy. No. 1477E, 1478C/1, 1478C/3 10.58 Private 4 T.P. Siriguppa 9.36 Sy. No. 191 7 Government
Sy. No. 736A/1 2.73 Government 5 T.P. Tekkalakote 1 Sy. No. 736A/1 5.71 Private
6 T.P., Sandur 34 Sy. No. 4 7.43 Government Sy. No.64 2.97 7 T.P. Kudligi 3 to 4 Sy. No.247A2 5.68
Private
8 T.P. Kotturu 5 to 6 Sy. No. 341 8.03 Government 9 T.P. Kamalapura 5 to 6 Sy. No.683B 4 Private
10 T.P. Hadagali 5 Sy. No. 30A, 30B, 31C/1, 31C/2 8.1 Private
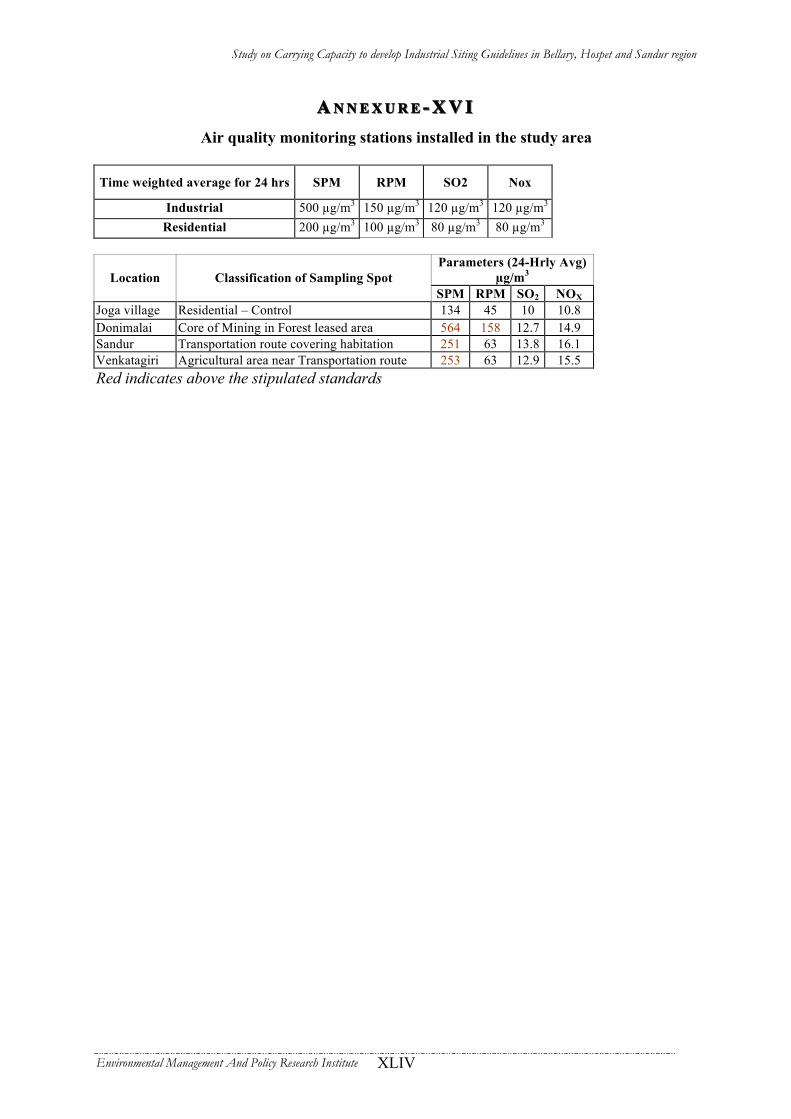
Study on Carrying Capacity to develop Industrial Siting Guidelines in Bellary, Hospet and Sandur region
Environmental Management And Policy Research Institute XLIV
AA N N E X U R EN N E X U R E -- X V IX V I Air quality monitoring stations installed in the study area
Time weighted average for 24 hrs SPM RPM SO2 Nox
Industrial 500 µg/m3 150 µg/m3 120 µg/m3 120 µg/m3
Residential 200 µg/m3 100 µg/m3 80 µg/m3 80 µg/m3
Parameters (24-Hrly Avg)
µg/m3 Location Classification of Sampling Spot SPM RPM SO2 NOX
Joga village Residential – Control 134 45 10 10.8 Donimalai Core of Mining in Forest leased area 564 158 12.7 14.9 Sandur Transportation route covering habitation 251 63 13.8 16.1 Venkatagiri Agricultural area near Transportation route 253 63 12.9 15.5 Red indicates above the stipulated standards
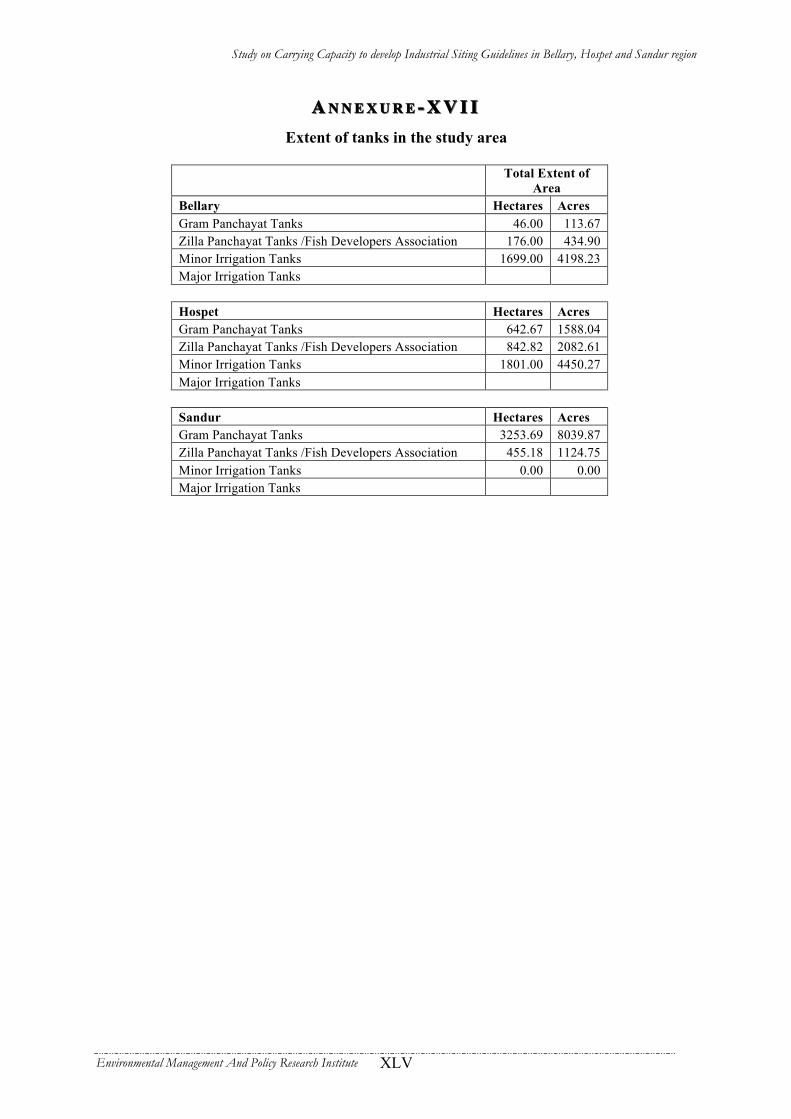
Study on Carrying Capacity to develop Industrial Siting Guidelines in Bellary, Hospet and Sandur region
Environmental Management And Policy Research Institute XLV
AA N N E X U R EN N E X U R E -- X V I IX V I I Extent of tanks in the study area
Total Extent of
Area Bellary Hectares Acres Gram Panchayat Tanks 46.00 113.67 Zilla Panchayat Tanks /Fish Developers Association 176.00 434.90 Minor Irrigation Tanks 1699.00 4198.23 Major Irrigation Tanks Hospet Hectares Acres Gram Panchayat Tanks 642.67 1588.04 Zilla Panchayat Tanks /Fish Developers Association 842.82 2082.61 Minor Irrigation Tanks 1801.00 4450.27 Major Irrigation Tanks Sandur Hectares Acres Gram Panchayat Tanks 3253.69 8039.87 Zilla Panchayat Tanks /Fish Developers Association 455.18 1124.75 Minor Irrigation Tanks 0.00 0.00 Major Irrigation Tanks

Study on Carrying Capacity to develop Industrial Siting Guidelines in Bellary, Hospet and Sandur region
Environmental Management And Policy Research Institute XLVI
AA N N E X U R EN N E X U R E -- X V I I IX V I I I List of tanks coming under Gram Panchayats, Zilla Panchayat and Fish Farmers
Development Association in the Project area
Sl.No. Taluk Tanks Name Village Name Extent of
Lake (ha) Atchkat in
ha. 1.Nagala Kere Bellary 6.00 3.75 2.Kolagal kere Kolegal 17.00 11.25 3.Vadrakunte kere Bellary 3.00 3.00 4.S.P. Kunte Bellary 5.00 5.00 5.Railway Kunte (Kunte gunde) Bellary 6.00 6.00 6.Sindhigere kere Sindhikere 3.00 3.00
1 *Bellary
7.Kalukumba kere Kalukumba 6.00 6.00 Subtotal GP Tanks 46.00
1 **Bellary Kuduthini Kere Kuduthini 176.00 176.00 Total 222.00 214.00
1. Ayyanahalli kere Ayyanahalli 15.51 5.66 2. Basapura kere Basapura 39.54 9.42 3. Bylurudhegeri kere Bylurudhegeri 23.68 6.07 4. Rudhegere kere Onthegudda 25.09 6.99 5. Golarahalli Basavana Durga kere Golara halli 26.93 26.99 6. Garaga dodda kere Garaga 23.31 30.14 7. Devalapura kere Devalapura 24.61 30.14 8. Chalikunte kere Chilakanahatti 20.17 21.75 9. Halli kere Kamalapura 40.00 40.00 10. Hampli somappana kere Hampli 10.00 10.00 11. Dodda basappa kere Bulla sagara 10.00 10.00 12. Heggalagi kere Higgalige 4.00 4.00 Naduvulu kere Thali basapura 3.00 3.00 Thali basapura Thali basapura 3.00 3.00 Vadakanakatte kere Oddinakatte 25.00 25.00 Gundakere Gundaa 50.16 29.31 Haravahalli (Maragadayyana) kere Haravanahalli 57.59 30.35 Jambayyana kere Thimmalapura 68.79 32.96 Nandi bandakere Nandibanda 62.15 26.51 Puttalakatte kere Puttalakatte 60.14 22.62
2 *Hospet
Moodinayakanakere Gunda 50.00 29.31 Subtotal GP Tanks 642.67
1. Byalakundi kere Byalakundi 58.52 47.10 2. Dananayakana kere Dananayakanahalli 163.00 205.00 3. Kamalapura kere Kamalapura 480.00 516.00 4. Gowrammanapura kere Mudddapura 45.00 45.00 5. Ramasagara kere Ramasagara 70.00 90.00 6. Hosachinapura kere Hosachinapura 16.30 50.00
2 **Hospet
7. Sunkalammana (Thayammana) kere Hosachinapura 10.00 50.00
Subtotal ZP Tanks 842.82 Total 1485.49 1406.32
1. S. Hulikunte kere Hulikunte 30.00 46.00 3 *Sandur 2. Jigginahalli kere Jigginahalli 41.00 40.00
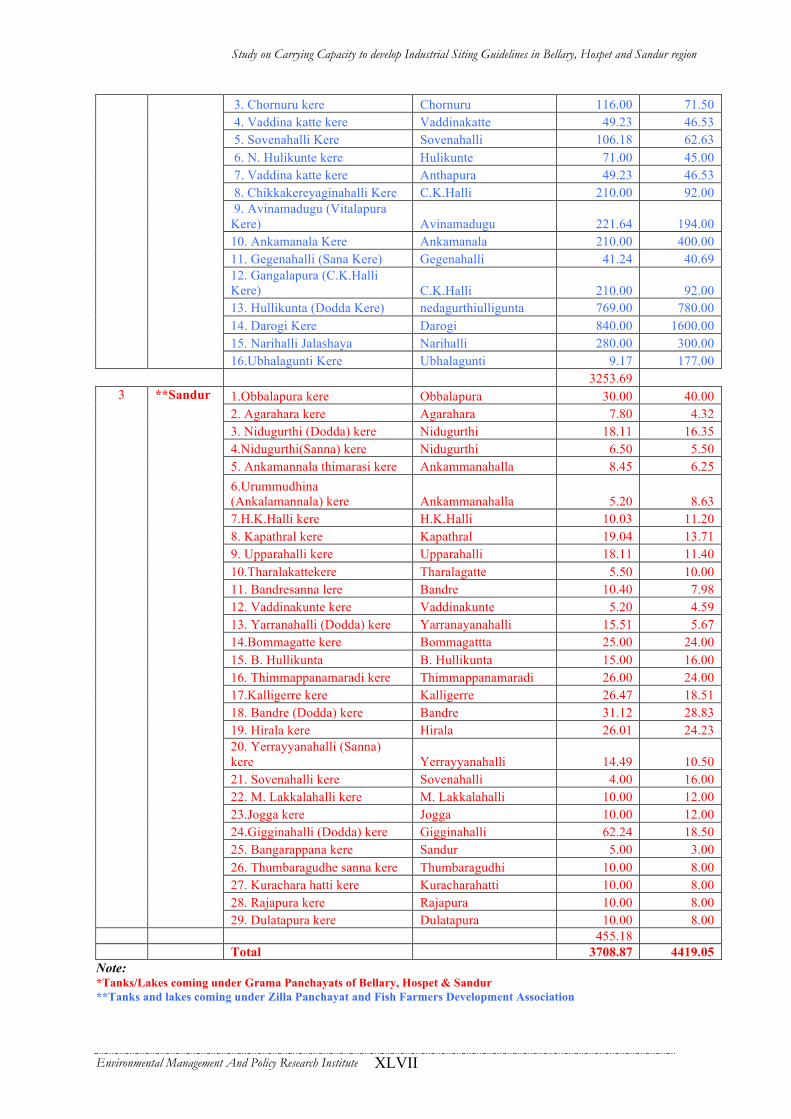
Study on Carrying Capacity to develop Industrial Siting Guidelines in Bellary, Hospet and Sandur region
Environmental Management And Policy Research Institute XLVII
3. Chornuru kere Chornuru 116.00 71.50 4. Vaddina katte kere Vaddinakatte 49.23 46.53 5. Sovenahalli Kere Sovenahalli 106.18 62.63 6. N. Hulikunte kere Hulikunte 71.00 45.00 7. Vaddina katte kere Anthapura 49.23 46.53 8. Chikkakereyaginahalli Kere C.K.Halli 210.00 92.00 9. Avinamadugu (Vitalapura Kere) Avinamadugu 221.64 194.00 10. Ankamanala Kere Ankamanala 210.00 400.00 11. Gegenahalli (Sana Kere) Gegenahalli 41.24 40.69 12. Gangalapura (C.K.Halli Kere) C.K.Halli 210.00 92.00 13. Hullikunta (Dodda Kere) nedagurthiulligunta 769.00 780.00 14. Darogi Kere Darogi 840.00 1600.00 15. Narihalli Jalashaya Narihalli 280.00 300.00
16.Ubhalagunti Kere Ubhalagunti 9.17 177.00 Subtotal GP Tanks 3253.69
1.Obbalapura kere Obbalapura 30.00 40.00 2. Agarahara kere Agarahara 7.80 4.32 3. Nidugurthi (Dodda) kere Nidugurthi 18.11 16.35 4.Nidugurthi(Sanna) kere Nidugurthi 6.50 5.50 5. Ankamannala thimarasi kere Ankammanahalla 8.45 6.25 6.Urummudhina (Ankalamannala) kere Ankammanahalla 5.20 8.63 7.H.K.Halli kere H.K.Halli 10.03 11.20 8. Kapathral kere Kapathral 19.04 13.71 9. Upparahalli kere Upparahalli 18.11 11.40 10.Tharalakattekere Tharalagatte 5.50 10.00 11. Bandresanna lere Bandre 10.40 7.98 12. Vaddinakunte kere Vaddinakunte 5.20 4.59 13. Yarranahalli (Dodda) kere Yarranayanahalli 15.51 5.67 14.Bommagatte kere Bommagattta 25.00 24.00 15. B. Hullikunta B. Hullikunta 15.00 16.00 16. Thimmappanamaradi kere Thimmappanamaradi 26.00 24.00 17.Kalligerre kere Kalligerre 26.47 18.51 18. Bandre (Dodda) kere Bandre 31.12 28.83 19. Hirala kere Hirala 26.01 24.23 20. Yerrayyanahalli (Sanna) kere Yerrayyanahalli 14.49 10.50 21. Sovenahalli kere Sovenahalli 4.00 16.00 22. M. Lakkalahalli kere M. Lakkalahalli 10.00 12.00 23.Jogga kere Jogga 10.00 12.00 24.Gigginahalli (Dodda) kere Gigginahalli 62.24 18.50 25. Bangarappana kere Sandur 5.00 3.00 26. Thumbaragudhe sanna kere Thumbaragudhi 10.00 8.00 27. Kurachara hatti kere Kuracharahatti 10.00 8.00 28. Rajapura kere Rajapura 10.00 8.00
3 **Sandur
29. Dulatapura kere Dulatapura 10.00 8.00 Subtotal ZP Tanks 455.18 Total 3708.87 4419.05
Note: *Tanks/Lakes coming under Grama Panchayats of Bellary, Hospet & Sandur **Tanks and lakes coming under Zilla Panchayat and Fish Farmers Development Association

Study on Carrying Capacity to develop Industrial Siting Guidelines in Bellary, Hospet and Sandur region
Environmental Management And Policy Research Institute XLVIII
AA N N E X U R EN N E X U R E -- X I XX I X
Details of Minor Irrigation Tanks in the Project Area
Lift Irrigation Scheme Sl.No Taluk
No of Tanks. Atchkat In Hects
1 Bellary 6 1699 2 Hospet 5 1801 3 Sandur 0 0 4 District Total 46 12160
Under MI LIS Scheme Sl.No. Name of the Tank Taluk Atchkat In Hects
1 LIS Emiiganur Bellary 250 2 LIS Basarkodu Bellary 283 3 LIS Thambra Halli Bellary 498 4 LIS Yerragudi Bellary 142 5 LIS D.Nagenahalli Bellary 263 6 LIS Badanahatti Bellary 263 1 LIS Hirejayaganur Hospet 85 2 LIS Nandibanda Hospet 202 3 LIS Vyasankere I Hospet 727 4 LIS Jawuku Hospet 82 5 LIS Vyasankere II Hospet 705
Total 3500 Under Other MI Schemes
1 Nagalapura Kere Hospet 48 1 Lakkalahalli Kere Sandur 100 2 Ragavapura Kere Sandur 185 3 Metriki Tank Sandur 160
Total 493

Study on Carrying Capacity to develop Industrial Siting Guidelines in Bellary, Hospet and Sandur region
Environmental Management And Policy Research Institute XLIX
AA N N E X U R EN N E X U R E -- X XX X
Ground Water Resources and Irrigation Potential of Karnataka as on 31-3-1998 ( Zone III , Northern Dry Zone)
Sl.No. Taluks
Annual Natural Rech.
Mha.m
Prov.For Drink & Ind.Use Mha.m
Avail. Rech.
Mha.m
Utilisation Rech.
Mha.m
Net Draft
Mha.m
Balance GW
Avail. Mha.m
Category Stage of Dev %
Wt.Av. Delta in Meters
Uti'ble Irr.Pot
for Dev.Mha
1 Bellary 0.0143 0.0022 0.0121 0.0109 0.0012 0.0109 W 10 0.4 0.0272 2 Hospet 0.0085 0.0012 0.0073 0.0066 0.0028 0.0045 W 38 0.4 0.0165 3 Sandur 0.0053 0.0008 0.0045 0.004 0.0018 0.0027 W 40 0.4 0.01
Total 0.0281 0.0042 0.0239 0.0215 0.0058 0.0181 1.2 0.0537 District Total 0.0593 0.0089 0.0504 0.0453 0.0153 0.0351 W 30 0.4 0.1131
Waterlogged, Saline and alkaline soils in command areas (Area in ha)
Sl.No.
Name of CADA
Total Irrigated
area
Water logged Saline Alkaline Total
% of Irrigated
area 1 TB project 362795 21202 26018 6195 53415 14.7 2 UPK project 173092 3448 5639 19077 28164 16.3
Total 1285620 49017 46576 31336 126929 9.9
Source: B.Puttaswamy 1999. Reclamation of water-logged saline and alkali areas. Paper presented at the state level seminar on water and land resources management in Karnataka, IAT, Bangalore

Study on Carrying Capacity to develop Industrial Siting Guidelines in Bellary, Hospet and Sandur region
Environmental Management And Policy Research Institute L
AA N N E X U R EN N E X U R E -- X X IX X I
List of industries generating hazardous waste in Bellary district (Tons/Annum)
INR Code
Sl No. NAME District 1.2 9.2 12.8 13.1 13.2 33.3 5.1 5.2 29.1 5.1 Other
wastes Total
SSHW Total IHW
Total RHW
104870 41 Anuj Industry Bellary 0 0 120 0 0 0 0 0 0 0 0 120 0 0
104984 118 Bellary Steel & Alloys Ltd Bellary 0 0 0 0 0 0 4 0 0 0 0 0 4 0
102643 364 India Sugars and Refineries Limited Bellary 0 0 0 0 0 0 1 0 0 0 0 0 1 0
102490 408 Jindal Thermal Power Company Ltd. Bellary 0 0 0 0 0 0 14 0 0 149 0 0 14 149
444 Karnataka Strips Pvt. Ltd. Bellary 0 0 0 0 19.2 0 0 0 0 100 48 19.2 0 148
105797 478 Krishna Mini Chem Industries Bellary 0.06 0 0 0 0 0 0 0 0 0 0 0.06 0 0
105650 511 KSRTC Depot Hospet Bellary 0 0 0 0 0 0 0 8.6 0 0 0 0 8.6 0 105635 534 KSRTC Depot-I Bellary 0 0 0 0 0 0 9.6 0 0 0 0 0 9.6 0
105638 537 KSRTC Depot-II Bellary Bellary 0 0 0 0 0 0 0 8.6 0 0 0.9 0 8.6 0.9
105641 544 KSRTC Divisonal Workshop Bellary 0 0 0 0 0 0 60 0 0 0 0 0 60 0
105647 557 KSRTC Workshop Kudiligi Bellary 0 0 0 0 0 0 0 8.6 0 0 0 0 8.6 0
104602 648 MSPL Limited Bellary 0 0 0 0 0 0 0.18 0 0 0 0 0 0.18 0
102668 668 N.M.D.C (Donimaliiron ore mines) Bellary 0 0 0 3.2 0 0 10 0 0 0 0 3.2 10 0
106156 785
PVS Industries(Pesticides& Formulations unit) Bellary 0 0 0 0 0 0.3 0 0 0.3 0 0 0.3 0.3 0
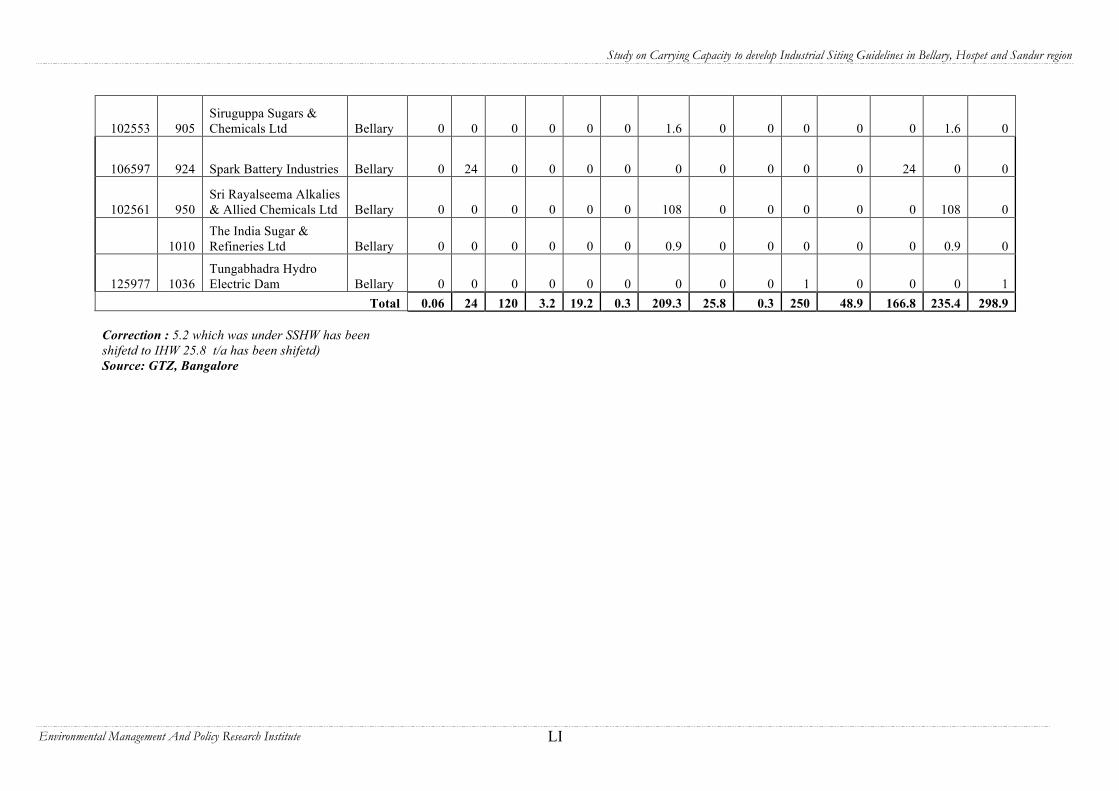
Study on Carrying Capacity to develop Industrial Siting Guidelines in Bellary, Hospet and Sandur region
Environmental Management And Policy Research Institute LI
102553 905 Siruguppa Sugars & Chemicals Ltd Bellary 0 0 0 0 0 0 1.6 0 0 0 0 0 1.6 0
106597 924 Spark Battery Industries Bellary 0 24 0 0 0 0 0 0 0 0 0 24 0 0
102561 950 Sri Rayalseema Alkalies & Allied Chemicals Ltd Bellary 0 0 0 0 0 0 108 0 0 0 0 0 108 0
1010 The India Sugar & Refineries Ltd Bellary 0 0 0 0 0 0 0.9 0 0 0 0 0 0.9 0
125977 1036 Tungabhadra Hydro Electric Dam Bellary 0 0 0 0 0 0 0 0 0 1 0 0 0 1
Total 0.06 24 120 3.2 19.2 0.3 209.3 25.8 0.3 250 48.9 166.8 235.4 298.9 Correction : 5.2 which was under SSHW has been shifetd to IHW 25.8 t/a has been shifetd) Source: GTZ, Bangalore
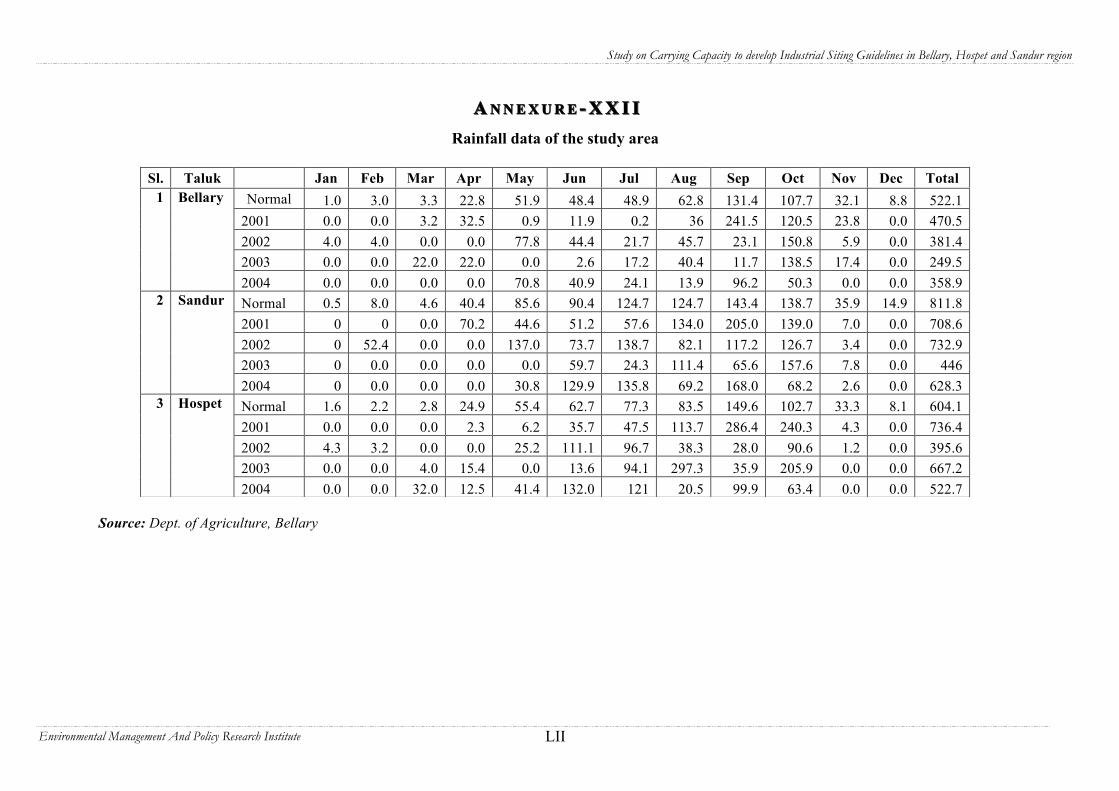
Study on Carrying Capacity to develop Industrial Siting Guidelines in Bellary, Hospet and Sandur region
Environmental Management And Policy Research Institute LII
AA N N E X U R EN N E X U R E -- X X I IX X I I
Rainfall data of the study area
Source: Dept. of Agriculture, Bellary
Sl. Taluk Jan Feb Mar Apr May Jun Jul Aug Sep Oct Nov Dec Total Normal 1.0 3.0 3.3 22.8 51.9 48.4 48.9 62.8 131.4 107.7 32.1 8.8 522.1
2001 0.0 0.0 3.2 32.5 0.9 11.9 0.2 36 241.5 120.5 23.8 0.0 470.5 2002 4.0 4.0 0.0 0.0 77.8 44.4 21.7 45.7 23.1 150.8 5.9 0.0 381.4 2003 0.0 0.0 22.0 22.0 0.0 2.6 17.2 40.4 11.7 138.5 17.4 0.0 249.5
1 Bellary
2004 0.0 0.0 0.0 0.0 70.8 40.9 24.1 13.9 96.2 50.3 0.0 0.0 358.9 Normal 0.5 8.0 4.6 40.4 85.6 90.4 124.7 124.7 143.4 138.7 35.9 14.9 811.8 2001 0 0 0.0 70.2 44.6 51.2 57.6 134.0 205.0 139.0 7.0 0.0 708.6 2002 0 52.4 0.0 0.0 137.0 73.7 138.7 82.1 117.2 126.7 3.4 0.0 732.9 2003 0 0.0 0.0 0.0 0.0 59.7 24.3 111.4 65.6 157.6 7.8 0.0 446
2 Sandur
2004 0 0.0 0.0 0.0 30.8 129.9 135.8 69.2 168.0 68.2 2.6 0.0 628.3 Normal 1.6 2.2 2.8 24.9 55.4 62.7 77.3 83.5 149.6 102.7 33.3 8.1 604.1 2001 0.0 0.0 0.0 2.3 6.2 35.7 47.5 113.7 286.4 240.3 4.3 0.0 736.4 2002 4.3 3.2 0.0 0.0 25.2 111.1 96.7 38.3 28.0 90.6 1.2 0.0 395.6 2003 0.0 0.0 4.0 15.4 0.0 13.6 94.1 297.3 35.9 205.9 0.0 0.0 667.2
3 Hospet
2004 0.0 0.0 32.0 12.5 41.4 132.0 121 20.5 99.9 63.4 0.0 0.0 522.7

Study on Carrying Capacity to develop Industrial Siting Guidelines in Bellary, Hospet and Sandur region
Environmental Management And Policy Research Institute LIII
AA N N E X U R EN N E X U R E -- X X I I IX X I I I
Statement of motor vehicles registerd in the study region between 1999-2005
Sl.No Years
Multi Axiled
Vehicles & Articulated
Vehicles > 10 Tyres
Lorries, >16,200 above
Tonnes Capacity
Medium &
Heavy Lorries within 16,200 (Tonnes
Capacity)
Jeeps Tractors Maxicabs Buses Scooter/Mopedcycles Total
1 1.04.98 to 31.03.1999 1 51 47 271 7 31 1642 4054 2 1.04.99 to 31.03.2000 - 50 659 541 - 24 1933 5040 3 1.04.00 to 31.03.2001 46 100 36 526 7 57 2315 5339 4 1.04.01 to 31.03.2002 74 96 63 346 1 57 2661 5555 5 1.04.02 to 31.03.2003 27 74 95 495 1 45 4178 6959 6 1.04.03 to 31.03.2004 128 174 110 244(144) Trailors 19 100 3566 6329 7 1.04.04 to 31.03.2005 260 322 206 297 (179) Trailors 32 18 5146 8498
Total 536 1216 4155 (3934) Trailors
334 961 KSRTC,99
Pvt
26315 (Including other Mopeds), 43,467
90838

Study on Carrying Capacity to develop Industrial Siting Guidelines in Bellary, Hospet and Sandur region
Environmental Management And Policy Research Institute LIV
AA N N E X U R EN N E X U R E -- X X I VX X I V Statement showing taluka wise area & production of horticulture crops in Bellary district as on 31.03.01
Bellary Hospet Sandur Total District Area
Sl. No. Name of the Crops
Area Prod Yield/ ha Value Area Prod Yield/
ha Value Area Prod Yield/ ha Value Area Prod Yield/
ha Value Value
/ ton
I Fruit Crops
1 Mango 900 13500 15 675.00 220 4400 20 132.00 188 1296 7 64.80 2280 26466 13 1418.52 0.05
2 Banana a). Cavandi 245 6125 25 153.12 339 8925 11 289.62 0.03
b). Others 1511 30220 20 604.40 58 2200 38 100.00 1636 34084 23 734.17 0.02
Banana Total 0 0 0 0.00 1756 36345 45 757.52 58 2200 38 100.00 1975 43009 23 1023.79 0.02
3 Guava 5 100 20 1.00 14 210 15 6.30 59 1125 14 19.05 0.02
4 Sapota 600 6000 10 60.00 32 320 10 12.80 155 750 5 37.00 1036 9738 10 228.61 0.02
Citres varieties 0 0 0 0.00
a. Lime 65 1300 20 13.00 23 506 22 25.30 2 30 15 1.50 111 2072 16 49.16 0.02
b. Mosambi 15 150 10 15.00 4 37 505 8 38.59 0.08
c. Other citres 48 12 0.96 4 48 2 0.96 0.02
Citres Total 80 1450 28.00 27 554 26.26 2 30 1.50 152 2625 0 88.71 0.03
5 Pomogramate 800 9600 12 32.00 27 324 12 29.16 2 1351 15700 9 302.04 0.02
6 Jack 6 240 40 12.16 12 364 13 13.58 0.04
7 Papaya 250 20000 80 200.00 32 2560 80 51.20 12 96 8 1.92 323 24231 58 276.62 0.01
8 Ber 14 350 25 10.56 5 125 25 11.25 29 850 18 28.65 0.03
9 Grapes Anab-e-sh 2 60 30 0.60 2 60 4 0.60 0.01
Grapes Other 7 100 14.2 12.00 7 100 2 12.00 0.12
10 Fig 102 816 8 80.10 4 48 12 9.60 1 5 5 0.50 142 1249 7 135.40 0.11
11 Others 5 50 1 2.50 0.05
Total Fruits 2751 51816 1086.60 2123 45126 1048.09 427 4537 218.82 7373 125567 3550.07
II Vegetable Crops
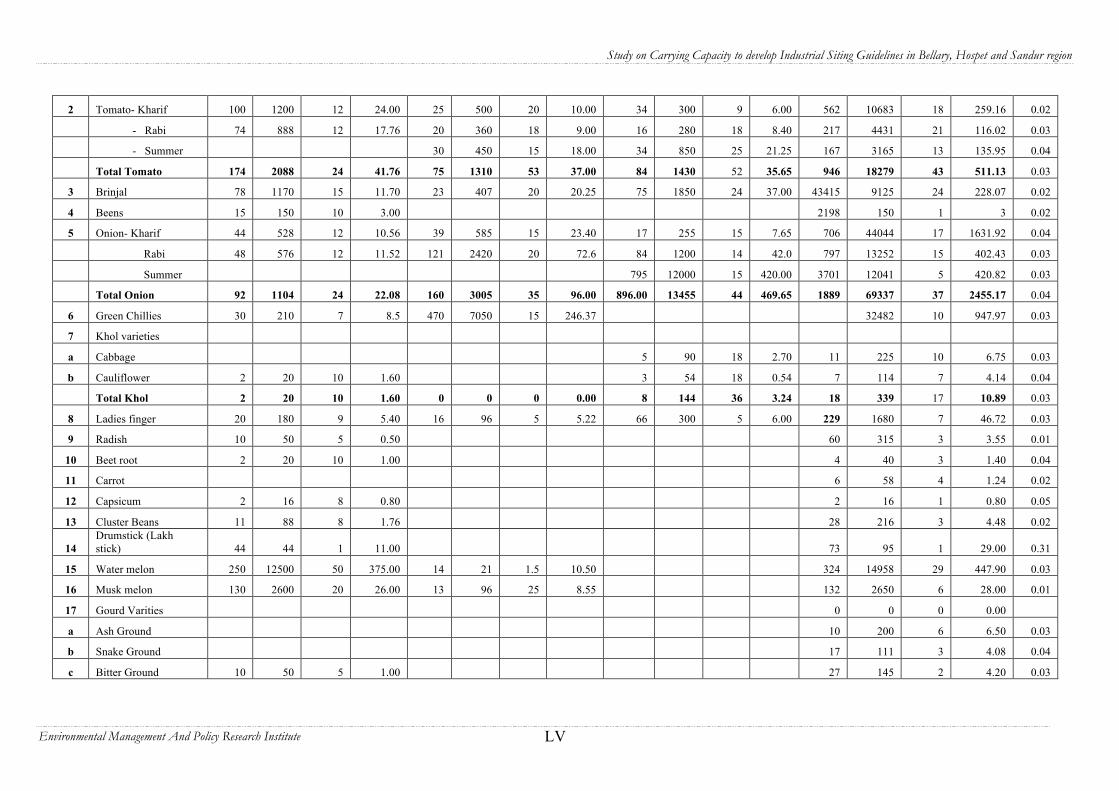
Study on Carrying Capacity to develop Industrial Siting Guidelines in Bellary, Hospet and Sandur region
Environmental Management And Policy Research Institute LV
2 Tomato- Kharif 100 1200 12 24.00 25 500 20 10.00 34 300 9 6.00 562 10683 18 259.16 0.02
- Rabi 74 888 12 17.76 20 360 18 9.00 16 280 18 8.40 217 4431 21 116.02 0.03
- Summer 30 450 15 18.00 34 850 25 21.25 167 3165 13 135.95 0.04
Total Tomato 174 2088 24 41.76 75 1310 53 37.00 84 1430 52 35.65 946 18279 43 511.13 0.03
3 Brinjal 78 1170 15 11.70 23 407 20 20.25 75 1850 24 37.00 43415 9125 24 228.07 0.02
4 Beens 15 150 10 3.00 2198 150 1 3 0.02
5 Onion- Kharif 44 528 12 10.56 39 585 15 23.40 17 255 15 7.65 706 44044 17 1631.92 0.04
Rabi 48 576 12 11.52 121 2420 20 72.6 84 1200 14 42.0 797 13252 15 402.43 0.03
Summer 795 12000 15 420.00 3701 12041 5 420.82 0.03
Total Onion 92 1104 24 22.08 160 3005 35 96.00 896.00 13455 44 469.65 1889 69337 37 2455.17 0.04
6 Green Chillies 30 210 7 8.5 470 7050 15 246.37 32482 10 947.97 0.03
7 Khol varieties
a Cabbage 5 90 18 2.70 11 225 10 6.75 0.03
b Cauliflower 2 20 10 1.60 3 54 18 0.54 7 114 7 4.14 0.04
Total Khol 2 20 10 1.60 0 0 0 0.00 8 144 36 3.24 18 339 17 10.89 0.03
8 Ladies finger 20 180 9 5.40 16 96 5 5.22 66 300 5 6.00 229 1680 7 46.72 0.03
9 Radish 10 50 5 0.50 60 315 3 3.55 0.01
10 Beet root 2 20 10 1.00 4 40 3 1.40 0.04
11 Carrot 6 58 4 1.24 0.02
12 Capsicum 2 16 8 0.80 2 16 1 0.80 0.05
13 Cluster Beans 11 88 8 1.76 28 216 3 4.48 0.02
14 Drumstick (Lakh stick) 44 44 1 11.00 73 95 1 29.00 0.31
15 Water melon 250 12500 50 375.00 14 21 1.5 10.50 324 14958 29 447.90 0.03
16 Musk melon 130 2600 20 26.00 13 96 25 8.55 132 2650 6 28.00 0.01
17 Gourd Varities 0 0 0 0.00
a Ash Ground 10 200 6 6.50 0.03
b Snake Ground 17 111 3 4.08 0.04
c Bitter Ground 10 50 5 1.00 27 145 2 4.20 0.03
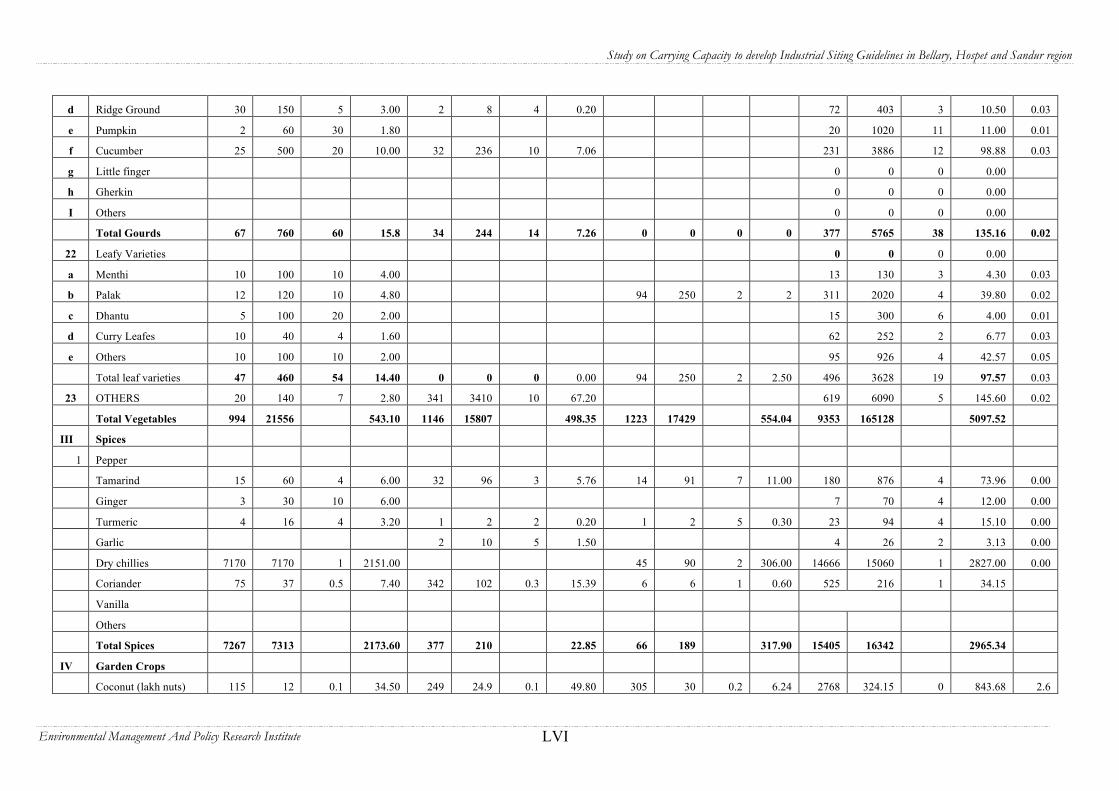
Study on Carrying Capacity to develop Industrial Siting Guidelines in Bellary, Hospet and Sandur region
Environmental Management And Policy Research Institute LVI
d Ridge Ground 30 150 5 3.00 2 8 4 0.20 72 403 3 10.50 0.03
e Pumpkin 2 60 30 1.80 20 1020 11 11.00 0.01
f Cucumber 25 500 20 10.00 32 236 10 7.06 231 3886 12 98.88 0.03
g Little finger 0 0 0 0.00
h Gherkin 0 0 0 0.00
I Others 0 0 0 0.00
Total Gourds 67 760 60 15.8 34 244 14 7.26 0 0 0 0 377 5765 38 135.16 0.02
22 Leafy Varieties 0 0 0 0.00
a Menthi 10 100 10 4.00 13 130 3 4.30 0.03
b Palak 12 120 10 4.80 94 250 2 2 311 2020 4 39.80 0.02
c Dhantu 5 100 20 2.00 15 300 6 4.00 0.01
d Curry Leafes 10 40 4 1.60 62 252 2 6.77 0.03
e Others 10 100 10 2.00 95 926 4 42.57 0.05
Total leaf varieties 47 460 54 14.40 0 0 0 0.00 94 250 2 2.50 496 3628 19 97.57 0.03
23 OTHERS 20 140 7 2.80 341 3410 10 67.20 619 6090 5 145.60 0.02
Total Vegetables 994 21556 543.10 1146 15807 498.35 1223 17429 554.04 9353 165128 5097.52
III Spices
1 Pepper
Tamarind 15 60 4 6.00 32 96 3 5.76 14 91 7 11.00 180 876 4 73.96 0.00
Ginger 3 30 10 6.00 7 70 4 12.00 0.00
Turmeric 4 16 4 3.20 1 2 2 0.20 1 2 5 0.30 23 94 4 15.10 0.00
Garlic 2 10 5 1.50 4 26 2 3.13 0.00
Dry chillies 7170 7170 1 2151.00 45 90 2 306.00 14666 15060 1 2827.00 0.00
Coriander 75 37 0.5 7.40 342 102 0.3 15.39 6 6 1 0.60 525 216 1 34.15
Vanilla
Others
Total Spices 7267 7313 2173.60 377 210 22.85 66 189 317.90 15405 16342 2965.34
IV Garden Crops
Coconut (lakh nuts) 115 12 0.1 34.50 249 24.9 0.1 49.80 305 30 0.2 6.24 2768 324.15 0 843.68 2.6
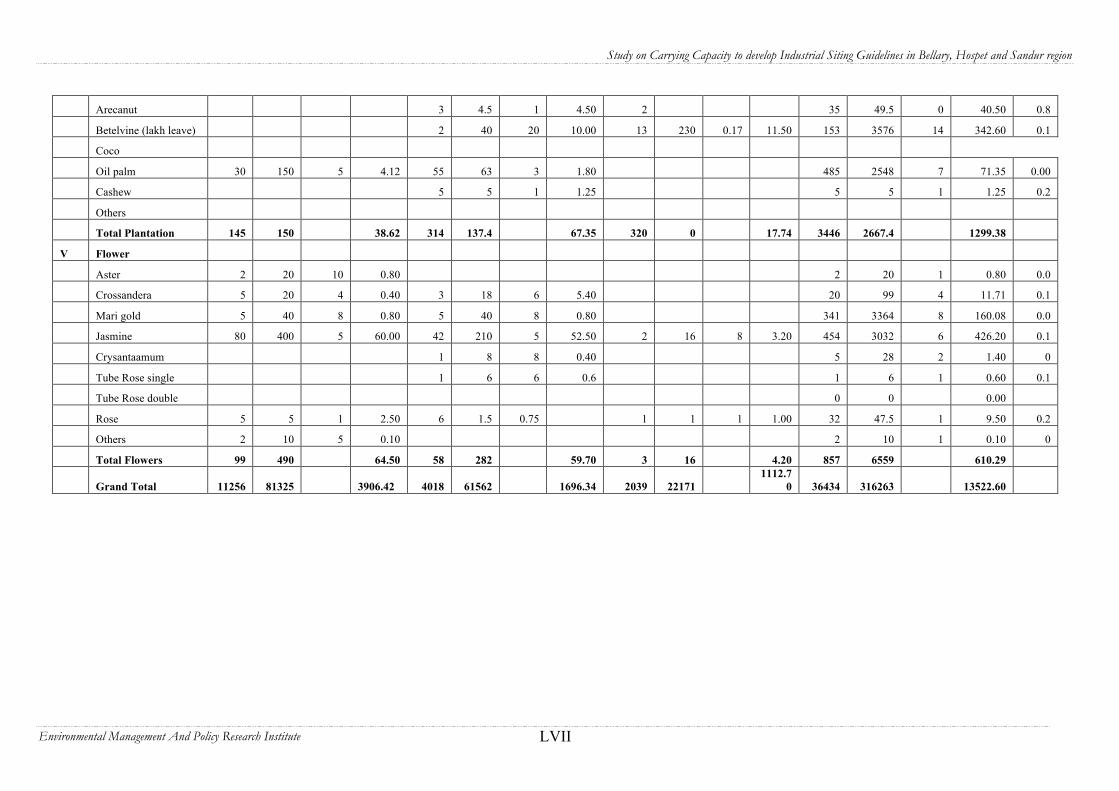
Study on Carrying Capacity to develop Industrial Siting Guidelines in Bellary, Hospet and Sandur region
Environmental Management And Policy Research Institute LVII
Arecanut 3 4.5 1 4.50 2 35 49.5 0 40.50 0.8
Betelvine (lakh leave) 2 40 20 10.00 13 230 0.17 11.50 153 3576 14 342.60 0.1
Coco
Oil palm 30 150 5 4.12 55 63 3 1.80 485 2548 7 71.35 0.00
Cashew 5 5 1 1.25 5 5 1 1.25 0.2
Others
Total Plantation 145 150 38.62 314 137.4 67.35 320 0 17.74 3446 2667.4 1299.38
V Flower
Aster 2 20 10 0.80 2 20 1 0.80 0.0
Crossandera 5 20 4 0.40 3 18 6 5.40 20 99 4 11.71 0.1
Mari gold 5 40 8 0.80 5 40 8 0.80 341 3364 8 160.08 0.0
Jasmine 80 400 5 60.00 42 210 5 52.50 2 16 8 3.20 454 3032 6 426.20 0.1
Crysantaamum 1 8 8 0.40 5 28 2 1.40 0
Tube Rose single 1 6 6 0.6 1 6 1 0.60 0.1
Tube Rose double 0 0 0.00
Rose 5 5 1 2.50 6 1.5 0.75 1 1 1 1.00 32 47.5 1 9.50 0.2
Others 2 10 5 0.10 2 10 1 0.10 0
Total Flowers 99 490 64.50 58 282 59.70 3 16 4.20 857 6559 610.29
Grand Total 11256 81325 3906.42 4018 61562 1696.34 2039 22171 1112.7
0 36434 316263 13522.60

Study on Carrying Capacity to develop Industrial Siting Guidelines in Bellary, Hospet and Sandur region
Environmental Management And Policy Research Institute LVIII
AA N N E X U R EN N E X U R E -- X X VX X V Statement showing taluka wise area & production of horticulture crops in Bellary district as on 31.03.02
Bellary Hospet Sandur Total District Area
Sl. No. Name of the Crops
Area Prod Yield/ ha Value Area Prod Yield/
ha Value Area Prod Yield/ ha Value Area Prod Yield/
ha Value Value/ ton
I Fruit Crops
1 Mango 900 3585 5 717.00 221 3315 15 663.0 190 855 5 42.75 1669 13129 12 0.16
2 Banana a). Cavandi 5 200 40 6.00 0 0 0 0.00 0 0 0 0.00 5 200 6 0.03
b). Others 0 0 0 0.00 1703 34060 20 681.20 77 2310 30 69.30 2038 43180 22 969.2 0.02
Banana Total 5 200 0 6.00 1703 34060 0 681.20 77 2310 0 69.30 2043 43380 968.2
3 Guava 6 70 14 1.40 12 180 15 3.60 0 0 0 0.00 62 1200 16 26.25 0.02
4 Sapota 600 4900 10 490.00 18 180 10 3.60 58 580 10 17.40 762 6652 11 560.6 0.08
Citres varieties 0 0 0 0.00 0 0 0 0.00 0 0 0 0.00
a. Lime 50 464 16 9.28 14 280 20 5.60 2 50 25 15.00 100 22 52.03 0.03
b. Mosambi 47 360 8 28.80 0 0 0 0.00 2 70 0 5.60 58 1574 4 44.54 0.08
c. Other citres 0 0 0 0.00 0 0 0 0.00 0 0 0 0 0 568 0 0
Citres Total 97 824 0 38.08 14 280 0 5.60 4 120 0 20.60 158 0 96.57
5 Pomogramate 1200 9558 9 286.74 21 252 12 5.04 6 60 10 1.20 1810 15619 11 529.19
6 Jack 0 0 0 0.00 0 0 0 0.00 0 0 0 0.00 2 80 0 1.6 0.02
7 Papaya 400 25425 75 254.25 26 1950 75 19.50 20 900 0 9.00 461 29350 54 300.5 0.01
8 Ber 14 216 18 6.48 2 50 25 1.5 0 0 0 0.00 22 471 24 15.18 0.03
9 Grapes Anab-e-sh 0 0 0 0.00 0 0 0 0.00 0 0 0 0.00 0 0 0 0
Grapes Other 0 0 0 0.00 4 8 2 0.96 5 10 0 1.20 12 18 3 2.16 0.12
10 Fig 215 1211 7 242.20 4 48 12 5.28 0 0 0 0.00 265 1793 8 305.38 0.17
11 Others 0 0 0 0.00 0 0 0 0.00 0 0 0 0.00 10 100 1 2 0.02
Total Fruits 3437 45989 0 2042.15 2025 40323 0 1389.28 360 4835 0 161.45 7276 113934 4972.3
II Vegetable Crops

Study on Carrying Capacity to develop Industrial Siting Guidelines in Bellary, Hospet and Sandur region
Environmental Management And Policy Research Institute LIX
2 Tomato- Kharif 40 630 18 12.60 11 220 20 4.40 30 540 18 10.80 536 11610 21 248.6 0.02
- Rabi 31 567 21 17.01 14 252 18 7.56 16 336 21 10.08 159 4085 21 111.55 0.03
- Summer 20 320 20 12.80 52 780 15 31.20 12 156 13 0.05 151 3146 18 74.1 0.02
Total Tomato 91 1517 0 42.41 77 1252 0 43.16 58 1032 0 27.12 846 18841 440.39
3 Brinjal 74 1650 25 33.00 23 460 20 9.20 29 580 20 11.60 380 9523 25 250.15 0.03
4 Beens 15 195 15 5.85 0 0 0 0.00 0 0 0 0.00 31 355 4 12.15 0.03
5 Onion- Kharif 5 85 17 3.40 57 855 15 34.20 183 2745 15 109.80 2257 57485 17 1821.5 0.03
Rabi 0 0 15 0.00 72 1440 20 43.20 333 4662 14 139.9 1047 18942 18 678.06 0.04
Summer 5 0 15 3.75 31 620 20 18.60 676 10140 15 304.20 742 11360 16 350.55 0.03
Total Onion 10 160 0 7.15 160 2915 0 96.00 1192.0
0 17547 0 553.86 4046 87862 2850.1
6 Green Chillies 464 4100 10 410.00 135 2025 15 101.25 21.00 252 12 7.56 2182 23827 15 1839.8 0.08
7 Khol varieties 0 0 0 0 0 0 0 0.00 0.00 0 0 0.00
a Cabbage 0 0 10 0.00 0 0 0 0.00 5 90 0 2.70 10 215 5 7.7 0.04
b Cauliflower 2 14 7 0.56 0 0 0 0.00 3 54 0 0.54 7 108 1 3.1 0.03
Total Khol 2 14 0 0.56 0 0 0 0.00 8 144 0 3.24 17 323 10.8
8 Ladies finger 25 264 12 7.92 16 80 5 2.40 27 255 8.3 7.65 219 1837 8 64.41 0.04
9 Radish 6 25 5 0.25 0 0 0 0.00 0 0 0 0.00 134 1165 1 21.65 0.02
10 Beet root 0 0 0 0.00 0 0 0 0.00 0 0 0 0.00 0 0 0 0
11 Carrot 0 0 0 0.00 0 0 0 0.00 0 0 0 0.00 5 50 1 0.5 0.01
12 Capsicum 3 45 15 6.75 0 0 0 0.00 0 0 0 0.00 9 90 2 8.6 0.10
13 Cluster Beans 18 160 10 3.20 0 0 0 0.00 2 6 3 0.12 67 507 4 11.63 0.02
14 Drumstick (Lakh stick) 52 44 1 1.10 14 21 1.5 5.25 6 5 1 1.50 108 138.5 2 24.5 0.18
15 Water melon 262 6720 30 201.60 15 375 25 11.25 0 0 0 0.00 362 10255 26 285.9 0.03
16 Musk melon 125 1140 10 11.40 0 0 0 0.00 0 0 0 0.00 125 1140 1 11.4 0.01
17 Gourd Varities 0 0 0 0.00 0 0 0 0.00 0 0 0 0.00
a Ash Ground 0 0 0 0.00 0 0 0 0.00 0 0 0 0.00 5 125 4 3.75 0.03
b Snake Ground 0 0 0 0.00 0 0 0 0.00 0 0 0 0.00 5 75 2 3 0.04
c Bitter Ground 10 45 5 1.35 0 0 0 0.00 0 0 0 0.00 15 80 2 2.4 0.03

Study on Carrying Capacity to develop Industrial Siting Guidelines in Bellary, Hospet and Sandur region
Environmental Management And Policy Research Institute LX
d Ridge Ground 15 70 5 2.10 2 8 4 0.24 2.00 6 3 0.18 46 360 5 11.16 0.03
e Pumpkin 1 10 10 0.50 0 0 0 0.00 0 0 0 0 31 660 6 12 0.02
f Cucumber 21 216 12 6.48 32 320 10 9.60 1 12 12 0.36 191 3309 14 81.18 0.02
g Little finger 2 16 8 0.32 0 0 0 0.00 0 0 0 0.00 2 16 1 0.32 0.02
h Gherkin 0 0 0 0.00 0 0 0 0.00 0 0 0 0.00 5 50 1 0.5 0.01
I Others 0 0 0 0.00 0 0 0 0.00 0 0 0 0.00 0 0 0 0
Total Gourds 49 357 0 10.75 34 328 0 9.84 3 18 0 0.54 300 4675 114.31 0.02
22 Leafy Varieties 0 0 0 0.00 0 0 0 0.00 0 0 0 0.00
a Menthi 8 21 3 0.63 41 123 3 3.69 10 30 3 0.90 122 363 3 10.89 0.03
b Palak 9 32 4 0.96 48 192 4 3.84 60 240 4 4.00 202 804 4 15.89 0.02
c Dhantu 11 45 5 0.90 0 0 0 0.00 5 30 0 0.30 16 75 1 1.2 0.02
d Curry Leafes 12 20 2 0.60 2 4 2 0.12 5 10 2 0.30 105 230 3 7.62 0.03
e Others 4 12 4 0.36 0 0 0 0.00 25 96 4 1.92 49 188 2 6.28 0.03
Total leaf varieties 44 130 0 3.45 91 319 0 7.65 105 406 0 8.22 494 1660 42.39 0.03
23 OTHERS 2 10 5 0.30 0 0 0 0.00 0 0 0 0 147 1460 1 192.3 0.13
Total Vgetables 1242 16487 0 745.69 565 7754 0 286.00 1451 20240 0 621.41 9472 163570 6181 0.04
III Spices
1 Pepper
Tamarind 15 20 5 1.60 22 66 3 5.28 18 126 0 10.08 177 822 3 54.78 0.07
Ginger 0 0 0 0.00 0 0 0 0 0 0 0 0.00 29 148 1 22.06 0.15
Turmeric 0 0 0 0.00 1 2 2 0.32 4 16 4 2.56 20 158 3 22.8 0.14
Garlic 0 0 0 0.00 2 10 5 1.20 0 0 0 0.00 2 10 2 1.2 0.12
Dry chillies 1100
0 18310 2 4028.20 335 670 2 134.00 260 520 2 114.40 15255 23820 2 6103.6 0.26
Coriander 1266 892 1 142.72 342 171 0.5 25.65 3 3 1 0.48 1696 1137.5 1 176.6 0.16
Vanilla
Others 0 0 0 0.00 65 325 3 32.5 0.10
Total Spices 1228
1 19222 0 12.15 702 919 0 166.45 285 665 0 127.52 17244 26421 6413.5 0.24
IV Garden Crops

Study on Carrying Capacity to develop Industrial Siting Guidelines in Bellary, Hospet and Sandur region
Environmental Management And Policy Research Institute LXI
Coconut (lakh nuts) 115 4.86 0.06 12.15 249 24.9 0.1 74.7 135 22 44.00 1938 218.14 0 570.72 2.62
Arecanut 0 0 0 0.00 5 5 1 4.00 0 0 0.2 0.00 31 44 0 35.2 0.80
Betelvine (lakh leave) 0 0 0 0.00 2 0.4 0.2 0.03 11 1.87 0 0.04 150 2433.3 4 224.67 0.09
Coco
Oil palm 100 13.26 0.26 0.36 61 128 2.1 2.37 18 15 0.2 0.41 503 438.02 2 10.892 0.2
Cashew 0 0 0 0.00 3 3 1 0.75 0 0 1 0.00 3 3 0 0.75 0.25
Others 1 0 0 0.00 21 0 0 0
Total Plantation 216 13.26 0 12.51 320 136 0 81.85 164 15 0 44.45 2646 485.02 842.23
V Flowers
Aster 1 1 1 0.04 0 0 0 0.00 0 0 0 0.00 2 2 0 0.08 0.04
Crossandera 2 8 4 0.96 0 0 0 0.00 0 0 0 0.00 13 59 2 11.63 0.20
Mari gold 5 32 8 1.60 2 16 8 0.80 0 0 0 0.00 264 2568 7 121.4 0.05
Jasmine 115 300 6 42 21 105 5 15.75 2 16 8 3.20 451 2519 6 352.75 0.14
Crysantaamum 0 0 0 0.00 3 24 8 1.20 0 0 0 0.00 10 116 6 4 0.03
Tube Rose single 0 0 0 0.00 0 0 0 0.00 0 0 0 0.00 0 0 0 0
Tube Rose double 0 0 0 0.00 0 0 0 0.00 0 0 0 0.00 0 0 0 0
Rose 5 4 1 1.60 2 2 1 0.40 1 1 0 1.00 25 24 1 6.4 0.27
Others 3 9 3 0.36 0 0 0 0.00 0 0 0 0.00 3 9 0 0.36 0.04
Total Flowers 131 350 0 46.56 28 147 0 18.15 3 17 0 4.20 768 5276 496.62
Grand Total 1730
7 82307 82061 0 3640 49279 0 1941.73 2263 15772 0 959.03 37406 309686 0 18906

Study on Carrying Capacity to develop Industrial Siting Guidelines in Bellary, Hospet and Sandur region
Environmental Management And Policy Research Institute LXII
AA N N E X U R EN N E X U R E -- X X V IX X V I Statement showing taluka wise area & production of horticulture crops in Bellary district as on 31.03.03
Bellary Hospet Sandur Total District Area Sl. No.
Name of the Crops Area Prod Yield/
ha Value Area Prod Yield/ ha Value Area Prod Yield/
ha Value Area Prod Yield/ ha Value Value/
ton
I Fruit Crops
1 Mango 500 2500 5 225.00 221 4420 20 442.0 1620 1620 10 243.00 1224 13845 14 1600.4 0.12
2 Banana a). Cavandi 0 0 0 0.00 0 0 0 0.00 0 0 0 0.00 0 0 0 0
b). Others 11 330 30 9.90 1800 36000 20 720 90 2700 30 81.00 2192 47015 26 970.6 0.02
Banana Total 11 330 9.90 1800 3600 720.00 90 2700 81.00 2192 47015 966.4
3 Guava 6 84 14 1.40 12 180 15 3.60 0 0 0 0.00 64 1249 16 24.7 0.02
4 Sapota 610 6100 10 550.00 18 180 10 3.60 43 430 10 12.90 786 8050 11 615.74 0.08
Citres varieties 0 0 0 0.00 0 0 0 0.00 0 0 0 0.00
a. Lime 50 800 16 9.28 14 280 20 5.60 2 50 25 15.00 103 1980 22 46.38 0.02
b. Mosambi 47 376 8 28.80 0 0 0 0.00 2 70 0 5.60 63 654 6 55.24 0.08
c. Other citres 0 0 0 0.00 0 0 0 0.00 0 0 0 0 0 0 0 0
Citres Total 97 1176 38.08 14 280 5.60 4 50 20.60 166 2564 101.6
5 Pomogramate 1150 6900 6 182.16 15 180 12 3.60 25 250 10 5.00 1786 13213 10 422.47 0.03
6 Jack 0 0 0 0.00 0 0 0 0.00 0 0 0 0.00 7 180 3 1.8 0.01
7 Papaya 350 26250 75 216.75 26 1950 75 19.50 25 1275 0 12.75 425 31225 54 266.5 0.01
8 Ber 14 252 18 6.48 2 50 25 1.5 0 0 0 0.00 27 547 20 13.98 0.03
9 Grapes Anab-e-sh 0 0 0 0.00 0 0 0 0.00 0 0 0 0.00 0 0 0 0
Grapes Other 0 0 0 0.00 2 4 2 0.48 10 20 2 2.40 17 54 2 5.88 0.11
10 Fig 232 1624 7 266.00 4 48 12 5.28 0 0 0 0.00 295 2360 9 343.58 0.15
11 Others 0 0 0 0.00 0 0 0 0.00 0 0 0 0.00 10 100 1 2 0.02
Total Fruits 2970 45216 1495.77 2114 43292 1205.00 359 6345 377.65 6999 120400 4365
II Vegetable Crops 2 Tomato- Kharif 120 2160 18 37.80 15 300 20 6.00 20 360 18 7.20 667 15152 21 357.58 0.02
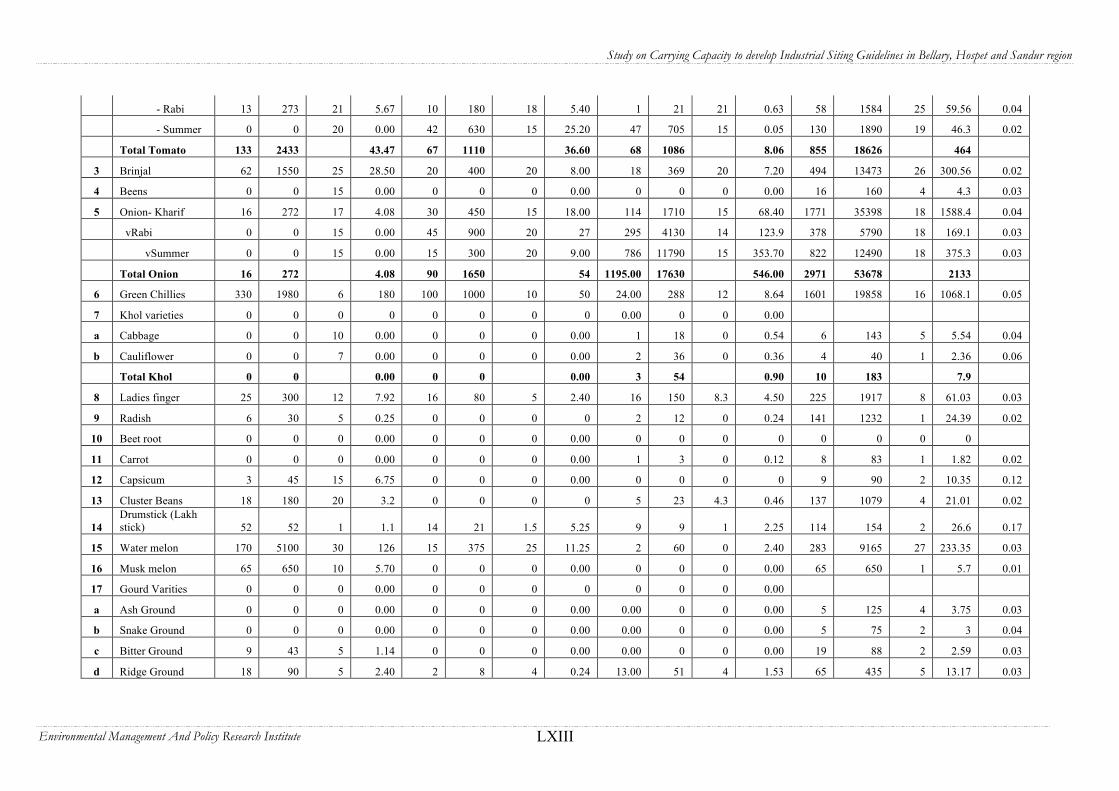
Study on Carrying Capacity to develop Industrial Siting Guidelines in Bellary, Hospet and Sandur region
Environmental Management And Policy Research Institute LXIII
- Rabi 13 273 21 5.67 10 180 18 5.40 1 21 21 0.63 58 1584 25 59.56 0.04
- Summer 0 0 20 0.00 42 630 15 25.20 47 705 15 0.05 130 1890 19 46.3 0.02
Total Tomato 133 2433 43.47 67 1110 36.60 68 1086 8.06 855 18626 464
3 Brinjal 62 1550 25 28.50 20 400 20 8.00 18 369 20 7.20 494 13473 26 300.56 0.02
4 Beens 0 0 15 0.00 0 0 0 0.00 0 0 0 0.00 16 160 4 4.3 0.03
5 Onion- Kharif 16 272 17 4.08 30 450 15 18.00 114 1710 15 68.40 1771 35398 18 1588.4 0.04
vRabi 0 0 15 0.00 45 900 20 27 295 4130 14 123.9 378 5790 18 169.1 0.03
vSummer 0 0 15 0.00 15 300 20 9.00 786 11790 15 353.70 822 12490 18 375.3 0.03
Total Onion 16 272 4.08 90 1650 54 1195.00 17630 546.00 2971 53678 2133
6 Green Chillies 330 1980 6 180 100 1000 10 50 24.00 288 12 8.64 1601 19858 16 1068.1 0.05
7 Khol varieties 0 0 0 0 0 0 0 0 0.00 0 0 0.00
a Cabbage 0 0 10 0.00 0 0 0 0.00 1 18 0 0.54 6 143 5 5.54 0.04
b Cauliflower 0 0 7 0.00 0 0 0 0.00 2 36 0 0.36 4 40 1 2.36 0.06
Total Khol 0 0 0.00 0 0 0.00 3 54 0.90 10 183 7.9
8 Ladies finger 25 300 12 7.92 16 80 5 2.40 16 150 8.3 4.50 225 1917 8 61.03 0.03
9 Radish 6 30 5 0.25 0 0 0 0 2 12 0 0.24 141 1232 1 24.39 0.02
10 Beet root 0 0 0 0.00 0 0 0 0.00 0 0 0 0 0 0 0 0
11 Carrot 0 0 0 0.00 0 0 0 0.00 1 3 0 0.12 8 83 1 1.82 0.02
12 Capsicum 3 45 15 6.75 0 0 0 0.00 0 0 0 0 9 90 2 10.35 0.12
13 Cluster Beans 18 180 20 3.2 0 0 0 0 5 23 4.3 0.46 137 1079 4 21.01 0.02
14 Drumstick (Lakh stick) 52 52 1 1.1 14 21 1.5 5.25 9 9 1 2.25 114 154 2 26.6 0.17
15 Water melon 170 5100 30 126 15 375 25 11.25 2 60 0 2.40 283 9165 27 233.35 0.03
16 Musk melon 65 650 10 5.70 0 0 0 0.00 0 0 0 0.00 65 650 1 5.7 0.01
17 Gourd Varities 0 0 0 0.00 0 0 0 0 0 0 0 0.00
a Ash Ground 0 0 0 0.00 0 0 0 0.00 0.00 0 0 0.00 5 125 4 3.75 0.03
b Snake Ground 0 0 0 0.00 0 0 0 0.00 0.00 0 0 0.00 5 75 2 3 0.04
c Bitter Ground 9 43 5 1.14 0 0 0 0.00 0.00 0 0 0.00 19 88 2 2.59 0.03
d Ridge Ground 18 90 5 2.40 2 8 4 0.24 13.00 51 4 1.53 65 435 5 13.17 0.03
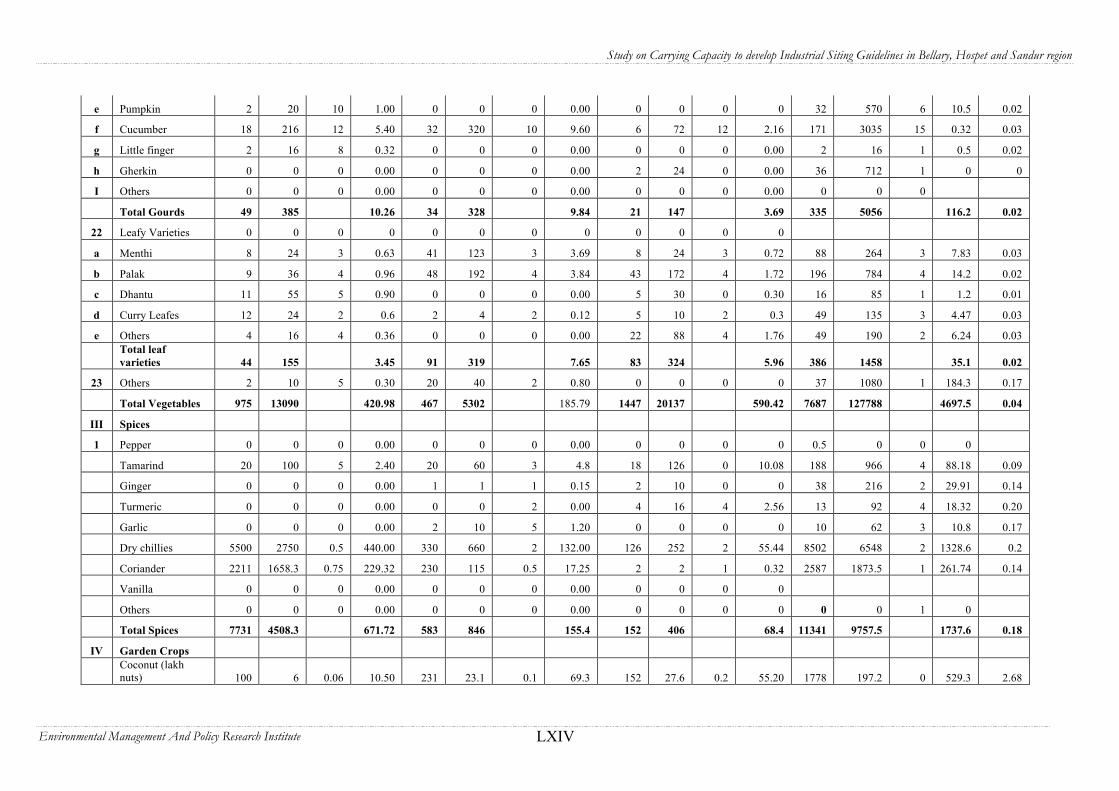
Study on Carrying Capacity to develop Industrial Siting Guidelines in Bellary, Hospet and Sandur region
Environmental Management And Policy Research Institute LXIV
e Pumpkin 2 20 10 1.00 0 0 0 0.00 0 0 0 0 32 570 6 10.5 0.02
f Cucumber 18 216 12 5.40 32 320 10 9.60 6 72 12 2.16 171 3035 15 0.32 0.03
g Little finger 2 16 8 0.32 0 0 0 0.00 0 0 0 0.00 2 16 1 0.5 0.02
h Gherkin 0 0 0 0.00 0 0 0 0.00 2 24 0 0.00 36 712 1 0 0
I Others 0 0 0 0.00 0 0 0 0.00 0 0 0 0.00 0 0 0
Total Gourds 49 385 10.26 34 328 9.84 21 147 3.69 335 5056 116.2 0.02
22 Leafy Varieties 0 0 0 0 0 0 0 0 0 0 0 0
a Menthi 8 24 3 0.63 41 123 3 3.69 8 24 3 0.72 88 264 3 7.83 0.03
b Palak 9 36 4 0.96 48 192 4 3.84 43 172 4 1.72 196 784 4 14.2 0.02
c Dhantu 11 55 5 0.90 0 0 0 0.00 5 30 0 0.30 16 85 1 1.2 0.01
d Curry Leafes 12 24 2 0.6 2 4 2 0.12 5 10 2 0.3 49 135 3 4.47 0.03
e Others 4 16 4 0.36 0 0 0 0.00 22 88 4 1.76 49 190 2 6.24 0.03
Total leaf varieties 44 155 3.45 91 319 7.65 83 324 5.96 386 1458 35.1 0.02
23 Others 2 10 5 0.30 20 40 2 0.80 0 0 0 0 37 1080 1 184.3 0.17
Total Vegetables 975 13090 420.98 467 5302 185.79 1447 20137 590.42 7687 127788 4697.5 0.04
III Spices
1 Pepper 0 0 0 0.00 0 0 0 0.00 0 0 0 0 0.5 0 0 0
Tamarind 20 100 5 2.40 20 60 3 4.8 18 126 0 10.08 188 966 4 88.18 0.09
Ginger 0 0 0 0.00 1 1 1 0.15 2 10 0 0 38 216 2 29.91 0.14
Turmeric 0 0 0 0.00 0 0 2 0.00 4 16 4 2.56 13 92 4 18.32 0.20
Garlic 0 0 0 0.00 2 10 5 1.20 0 0 0 0 10 62 3 10.8 0.17
Dry chillies 5500 2750 0.5 440.00 330 660 2 132.00 126 252 2 55.44 8502 6548 2 1328.6 0.2
Coriander 2211 1658.3 0.75 229.32 230 115 0.5 17.25 2 2 1 0.32 2587 1873.5 1 261.74 0.14
Vanilla 0 0 0 0.00 0 0 0 0.00 0 0 0 0
Others 0 0 0 0.00 0 0 0 0.00 0 0 0 0 0 0 1 0
Total Spices 7731 4508.3 671.72 583 846 155.4 152 406 68.4 11341 9757.5 1737.6 0.18
IV Garden Crops
Coconut (lakh nuts) 100 6 0.06 10.50 231 23.1 0.1 69.3 152 27.6 0.2 55.20 1778 197.2 0 529.3 2.68
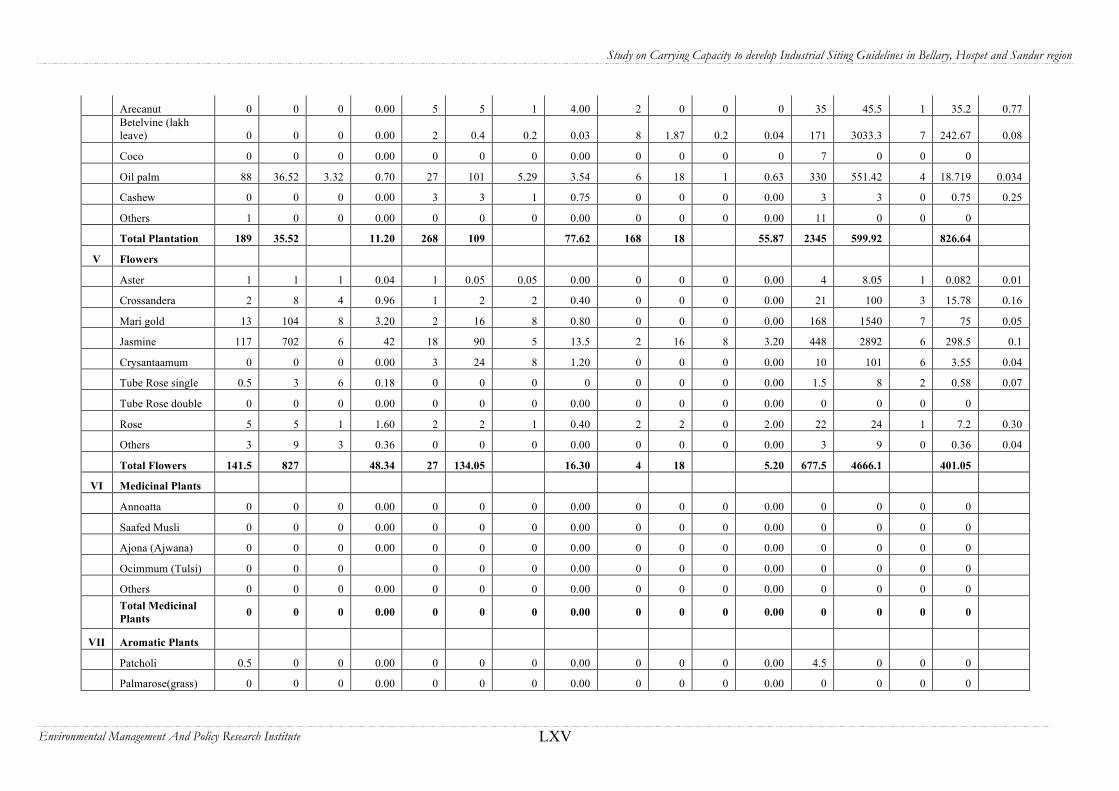
Study on Carrying Capacity to develop Industrial Siting Guidelines in Bellary, Hospet and Sandur region
Environmental Management And Policy Research Institute LXV
Arecanut 0 0 0 0.00 5 5 1 4.00 2 0 0 0 35 45.5 1 35.2 0.77
Betelvine (lakh leave) 0 0 0 0.00 2 0.4 0.2 0.03 8 1.87 0.2 0.04 171 3033.3 7 242.67 0.08
Coco 0 0 0 0.00 0 0 0 0.00 0 0 0 0 7 0 0 0
Oil palm 88 36.52 3.32 0.70 27 101 5.29 3.54 6 18 1 0.63 330 551.42 4 18.719 0.034
Cashew 0 0 0 0.00 3 3 1 0.75 0 0 0 0.00 3 3 0 0.75 0.25
Others 1 0 0 0.00 0 0 0 0.00 0 0 0 0.00 11 0 0 0
Total Plantation 189 35.52 11.20 268 109 77.62 168 18 55.87 2345 599.92 826.64
V Flowers
Aster 1 1 1 0.04 1 0.05 0.05 0.00 0 0 0 0.00 4 8.05 1 0.082 0.01
Crossandera 2 8 4 0.96 1 2 2 0.40 0 0 0 0.00 21 100 3 15.78 0.16
Mari gold 13 104 8 3.20 2 16 8 0.80 0 0 0 0.00 168 1540 7 75 0.05
Jasmine 117 702 6 42 18 90 5 13.5 2 16 8 3.20 448 2892 6 298.5 0.1
Crysantaamum 0 0 0 0.00 3 24 8 1.20 0 0 0 0.00 10 101 6 3.55 0.04
Tube Rose single 0.5 3 6 0.18 0 0 0 0 0 0 0 0.00 1.5 8 2 0.58 0.07
Tube Rose double 0 0 0 0.00 0 0 0 0.00 0 0 0 0.00 0 0 0 0
Rose 5 5 1 1.60 2 2 1 0.40 2 2 0 2.00 22 24 1 7.2 0.30
Others 3 9 3 0.36 0 0 0 0.00 0 0 0 0.00 3 9 0 0.36 0.04
Total Flowers 141.5 827 48.34 27 134.05 16.30 4 18 5.20 677.5 4666.1 401.05
VI Medicinal Plants
Annoatta 0 0 0 0.00 0 0 0 0.00 0 0 0 0.00 0 0 0 0
Saafed Musli 0 0 0 0.00 0 0 0 0.00 0 0 0 0.00 0 0 0 0
Ajona (Ajwana) 0 0 0 0.00 0 0 0 0.00 0 0 0 0.00 0 0 0 0
Ocimmum (Tulsi) 0 0 0 0 0 0 0.00 0 0 0 0.00 0 0 0 0
Others 0 0 0 0.00 0 0 0 0.00 0 0 0 0.00 0 0 0 0
Total Medicinal Plants 0 0 0 0.00 0 0 0 0.00 0 0 0 0.00 0 0 0 0
VII Aromatic Plants
Patcholi 0.5 0 0 0.00 0 0 0 0.00 0 0 0 0.00 4.5 0 0 0
Palmarose(grass) 0 0 0 0.00 0 0 0 0.00 0 0 0 0.00 0 0 0 0

Study on Carrying Capacity to develop Industrial Siting Guidelines in Bellary, Hospet and Sandur region
Environmental Management And Policy Research Institute LXVI
Lemon grass 0 0 0 0.00 0 0 0 0.00 0 0 0 0.00 0 0 0 0
Others 0 0 0 0 0 0 0 0.00 0 0 0 0.00 0 0 0 0
Total Aromatic Plants
0.5 0 0.00 0 0 0.00 0 0 0.00 4.5 0
0
Grand Total 12007 63678 0 2783.00 3459 49683 0 1640.27 2130 26924 0 1098 29054 263211 12028

Study on Carrying Capacity to develop Industrial Siting Guidelines in Bellary, Hospet and Sandur region
Environmental Management And Policy Research Institute LXVII
AA N N E X U R EN N E X U R E -- X X V I IX X V I I Statement showing taluka wise area & production of horticulture crops in Bellary district as on 31.03.04
Bellary Hospet Sandur Total District Area Sl. No. Name of the Crops
Area Prod Yield/ ha Value Area Prod
Yield/
ha Value Area Prod Yield/
ha Value Area Prod Yield/ ha
Value Value/ ton
I Fruit Crops
1 Mango 360 2160 6 324.00 221 4420 20 663.00 162 1296 8 220.32 1053 12851 14 1877.2 0.15
2 Banana a). Cavandi 0 0 0 0.00 0 0 0 0 0 0 0 0 0 0 0 0
b). Others 14 420 30 12.60 2255 45100 20 902.00 64 1600 25 64.00 2516 52210 26 1103.9 0.02
Banana Total 14 420 12.60 2255 45100 902.00 0 1600 64.00 2516 52210 1084
3 Guava 6 84 14 1.68 4 60 15 1.20 0 0 0 0.00 43 899 16 17.98 0.02
4 Sapota 610 6100 10 671.00 14 140 10 2.80 10 80 8 2.40 733 7488 11 715.4 0.10
Citres varieties 0 0 0 0.00 0 0 0 0.00 0 0 0 0.00
a. Lime 44 704 16 14.08 8 160 20 3.20 2 50 25 15.00 88 1704 22 47.58 0.03
b. Mosambi 33 264 8 21.12 0 0 0 0.00 2 70 35 5.60 53 577 14 45.56 0.08
c. Other citres 0 0 0 0.00 0 0 0 0.00 0 0 0 0.00 0 0 0 0
Citres Total 77 968 35.20 8 106 3.20 4 120 20.60 141 2281 93.14
5 Pomogramate 907 5298 6 158.94 17 204 12 4.08 15 120 8 2.40 1942 15585 9 560.07 0.04
6 Jack 0 0 0 0.00 0 0 0 0.00 0 0 0 0.00 7 180 9 1.8 0.01
7 Papaya 38 2850 75 28.50 12 900 75 9.00 15 1625 65 24.38 105 7600 62 84.1125 0.01
8 Ber 14 252 18 7.56 2 50 25 1.50 0 0 0 0.00 21 477 21 12.26 0.03
9 Grapes Anab-e-sh 0 0 0 0.00 0 0 0 0.00 0 0 0 0.00 0 0 0 0
Grapes Other 0 0 0 0.00 2 4 2 0.48 8 16 2 2.56 16 56 1 6.64 0.12
10 Fig 256 1792 7 358.40 4 48 12 5.28 0 0 0 0.00 299 2300 8 419.18 0.18
11 Others 6 18 3 0.90 2 14 7 0.28 0 0 0 0.00 18 132 3 3.18 0.02
Total Fruits 2288 19942 1598.78 2541 51100 1593 288 4857 336.66 6894 102059 4874.6
II Vegitable Crops
2 Tomato- Kharif 93 1674 18 64.00 23 460 20 13.80 22 396 18 7.92 400 8659 21 219.64 0.03
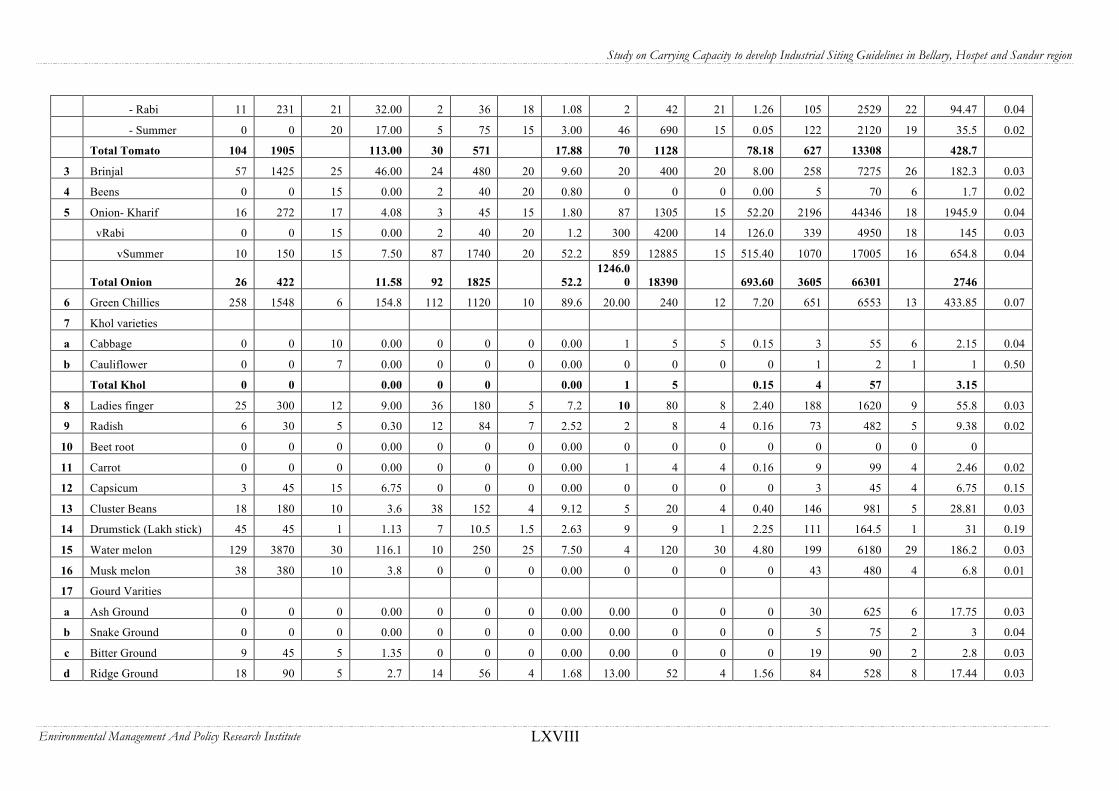
Study on Carrying Capacity to develop Industrial Siting Guidelines in Bellary, Hospet and Sandur region
Environmental Management And Policy Research Institute LXVIII
- Rabi 11 231 21 32.00 2 36 18 1.08 2 42 21 1.26 105 2529 22 94.47 0.04
- Summer 0 0 20 17.00 5 75 15 3.00 46 690 15 0.05 122 2120 19 35.5 0.02
Total Tomato 104 1905 113.00 30 571 17.88 70 1128 78.18 627 13308 428.7
3 Brinjal 57 1425 25 46.00 24 480 20 9.60 20 400 20 8.00 258 7275 26 182.3 0.03
4 Beens 0 0 15 0.00 2 40 20 0.80 0 0 0 0.00 5 70 6 1.7 0.02
5 Onion- Kharif 16 272 17 4.08 3 45 15 1.80 87 1305 15 52.20 2196 44346 18 1945.9 0.04
vRabi 0 0 15 0.00 2 40 20 1.2 300 4200 14 126.0 339 4950 18 145 0.03
vSummer 10 150 15 7.50 87 1740 20 52.2 859 12885 15 515.40 1070 17005 16 654.8 0.04
Total Onion 26 422 11.58 92 1825 52.2 1246.0
0 18390 693.60 3605 66301 2746
6 Green Chillies 258 1548 6 154.8 112 1120 10 89.6 20.00 240 12 7.20 651 6553 13 433.85 0.07
7 Khol varieties
a Cabbage 0 0 10 0.00 0 0 0 0.00 1 5 5 0.15 3 55 6 2.15 0.04
b Cauliflower 0 0 7 0.00 0 0 0 0.00 0 0 0 0 1 2 1 1 0.50
Total Khol 0 0 0.00 0 0 0.00 1 5 0.15 4 57 3.15
8 Ladies finger 25 300 12 9.00 36 180 5 7.2 10 80 8 2.40 188 1620 9 55.8 0.03
9 Radish 6 30 5 0.30 12 84 7 2.52 2 8 4 0.16 73 482 5 9.38 0.02
10 Beet root 0 0 0 0.00 0 0 0 0.00 0 0 0 0 0 0 0 0
11 Carrot 0 0 0 0.00 0 0 0 0.00 1 4 4 0.16 9 99 4 2.46 0.02
12 Capsicum 3 45 15 6.75 0 0 0 0.00 0 0 0 0 3 45 4 6.75 0.15
13 Cluster Beans 18 180 10 3.6 38 152 4 9.12 5 20 4 0.40 146 981 5 28.81 0.03
14 Drumstick (Lakh stick) 45 45 1 1.13 7 10.5 1.5 2.63 9 9 1 2.25 111 164.5 1 31 0.19
15 Water melon 129 3870 30 116.1 10 250 25 7.50 4 120 30 4.80 199 6180 29 186.2 0.03
16 Musk melon 38 380 10 3.8 0 0 0 0.00 0 0 0 0 43 480 4 6.8 0.01
17 Gourd Varities
a Ash Ground 0 0 0 0.00 0 0 0 0.00 0.00 0 0 0 30 625 6 17.75 0.03
b Snake Ground 0 0 0 0.00 0 0 0 0.00 0.00 0 0 0 5 75 2 3 0.04
c Bitter Ground 9 45 5 1.35 0 0 0 0.00 0.00 0 0 0 19 90 2 2.8 0.03
d Ridge Ground 18 90 5 2.7 14 56 4 1.68 13.00 52 4 1.56 84 528 8 17.44 0.03
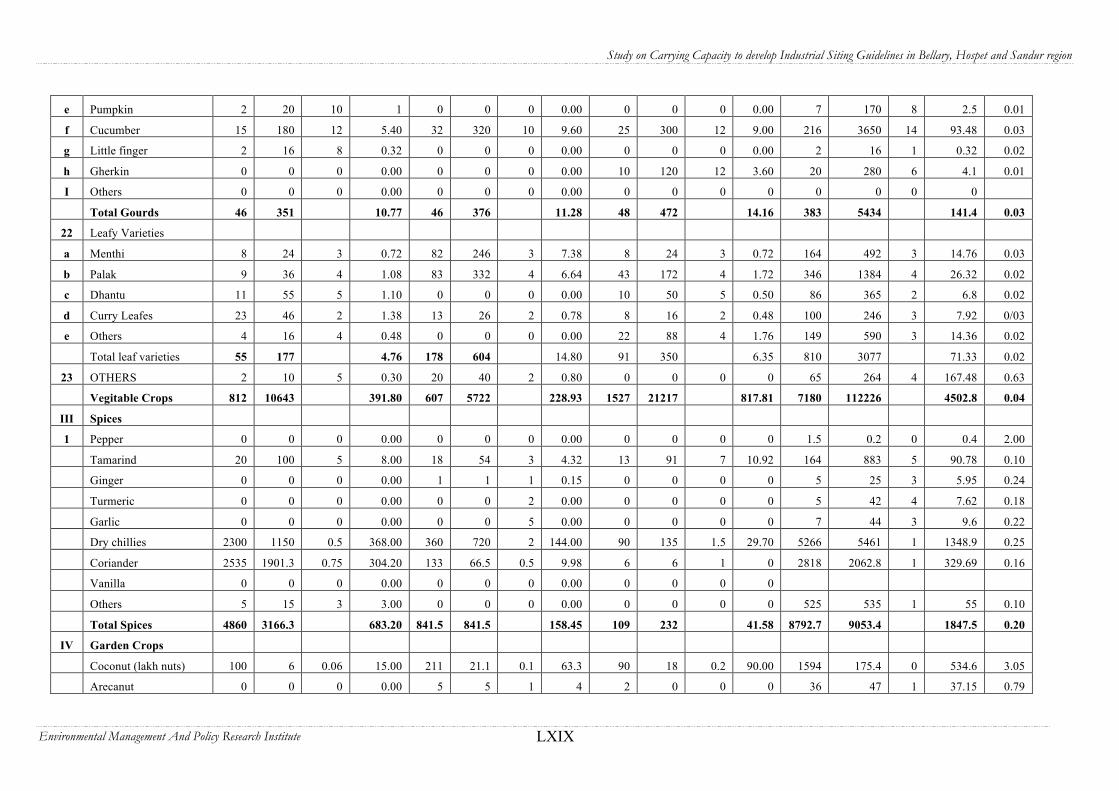
Study on Carrying Capacity to develop Industrial Siting Guidelines in Bellary, Hospet and Sandur region
Environmental Management And Policy Research Institute LXIX
e Pumpkin 2 20 10 1 0 0 0 0.00 0 0 0 0.00 7 170 8 2.5 0.01
f Cucumber 15 180 12 5.40 32 320 10 9.60 25 300 12 9.00 216 3650 14 93.48 0.03
g Little finger 2 16 8 0.32 0 0 0 0.00 0 0 0 0.00 2 16 1 0.32 0.02
h Gherkin 0 0 0 0.00 0 0 0 0.00 10 120 12 3.60 20 280 6 4.1 0.01
I Others 0 0 0 0.00 0 0 0 0.00 0 0 0 0 0 0 0 0
Total Gourds 46 351 10.77 46 376 11.28 48 472 14.16 383 5434 141.4 0.03
22 Leafy Varieties
a Menthi 8 24 3 0.72 82 246 3 7.38 8 24 3 0.72 164 492 3 14.76 0.03
b Palak 9 36 4 1.08 83 332 4 6.64 43 172 4 1.72 346 1384 4 26.32 0.02
c Dhantu 11 55 5 1.10 0 0 0 0.00 10 50 5 0.50 86 365 2 6.8 0.02
d Curry Leafes 23 46 2 1.38 13 26 2 0.78 8 16 2 0.48 100 246 3 7.92 0/03
e Others 4 16 4 0.48 0 0 0 0.00 22 88 4 1.76 149 590 3 14.36 0.02
Total leaf varieties 55 177 4.76 178 604 14.80 91 350 6.35 810 3077 71.33 0.02
23 OTHERS 2 10 5 0.30 20 40 2 0.80 0 0 0 0 65 264 4 167.48 0.63
Vegitable Crops 812 10643 391.80 607 5722 228.93 1527 21217 817.81 7180 112226 4502.8 0.04
III Spices
1 Pepper 0 0 0 0.00 0 0 0 0.00 0 0 0 0 1.5 0.2 0 0.4 2.00
Tamarind 20 100 5 8.00 18 54 3 4.32 13 91 7 10.92 164 883 5 90.78 0.10
Ginger 0 0 0 0.00 1 1 1 0.15 0 0 0 0 5 25 3 5.95 0.24
Turmeric 0 0 0 0.00 0 0 2 0.00 0 0 0 0 5 42 4 7.62 0.18
Garlic 0 0 0 0.00 0 0 5 0.00 0 0 0 0 7 44 3 9.6 0.22
Dry chillies 2300 1150 0.5 368.00 360 720 2 144.00 90 135 1.5 29.70 5266 5461 1 1348.9 0.25
Coriander 2535 1901.3 0.75 304.20 133 66.5 0.5 9.98 6 6 1 0 2818 2062.8 1 329.69 0.16
Vanilla 0 0 0 0.00 0 0 0 0.00 0 0 0 0
Others 5 15 3 3.00 0 0 0 0.00 0 0 0 0 525 535 1 55 0.10
Total Spices 4860 3166.3 683.20 841.5 841.5 158.45 109 232 41.58 8792.7 9053.4 1847.5 0.20
IV Garden Crops
Coconut (lakh nuts) 100 6 0.06 15.00 211 21.1 0.1 63.3 90 18 0.2 90.00 1594 175.4 0 534.6 3.05
Arecanut 0 0 0 0.00 5 5 1 4 2 0 0 0 36 47 1 37.15 0.79
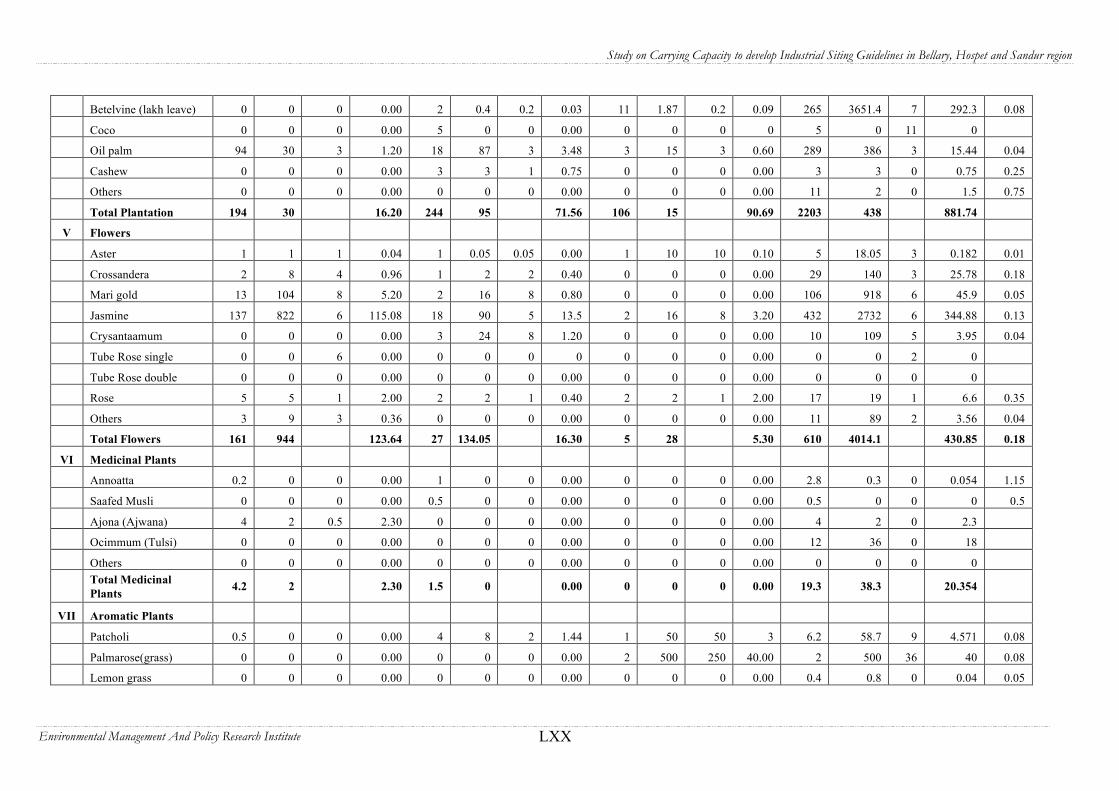
Study on Carrying Capacity to develop Industrial Siting Guidelines in Bellary, Hospet and Sandur region
Environmental Management And Policy Research Institute LXX
Betelvine (lakh leave) 0 0 0 0.00 2 0.4 0.2 0.03 11 1.87 0.2 0.09 265 3651.4 7 292.3 0.08
Coco 0 0 0 0.00 5 0 0 0.00 0 0 0 0 5 0 11 0
Oil palm 94 30 3 1.20 18 87 3 3.48 3 15 3 0.60 289 386 3 15.44 0.04
Cashew 0 0 0 0.00 3 3 1 0.75 0 0 0 0.00 3 3 0 0.75 0.25
Others 0 0 0 0.00 0 0 0 0.00 0 0 0 0.00 11 2 0 1.5 0.75
Total Plantation 194 30 16.20 244 95 71.56 106 15 90.69 2203 438 881.74
V Flowers
Aster 1 1 1 0.04 1 0.05 0.05 0.00 1 10 10 0.10 5 18.05 3 0.182 0.01
Crossandera 2 8 4 0.96 1 2 2 0.40 0 0 0 0.00 29 140 3 25.78 0.18
Mari gold 13 104 8 5.20 2 16 8 0.80 0 0 0 0.00 106 918 6 45.9 0.05
Jasmine 137 822 6 115.08 18 90 5 13.5 2 16 8 3.20 432 2732 6 344.88 0.13
Crysantaamum 0 0 0 0.00 3 24 8 1.20 0 0 0 0.00 10 109 5 3.95 0.04
Tube Rose single 0 0 6 0.00 0 0 0 0 0 0 0 0.00 0 0 2 0
Tube Rose double 0 0 0 0.00 0 0 0 0.00 0 0 0 0.00 0 0 0 0
Rose 5 5 1 2.00 2 2 1 0.40 2 2 1 2.00 17 19 1 6.6 0.35
Others 3 9 3 0.36 0 0 0 0.00 0 0 0 0.00 11 89 2 3.56 0.04
Total Flowers 161 944 123.64 27 134.05 16.30 5 28 5.30 610 4014.1 430.85 0.18
VI Medicinal Plants
Annoatta 0.2 0 0 0.00 1 0 0 0.00 0 0 0 0.00 2.8 0.3 0 0.054 1.15
Saafed Musli 0 0 0 0.00 0.5 0 0 0.00 0 0 0 0.00 0.5 0 0 0 0.5
Ajona (Ajwana) 4 2 0.5 2.30 0 0 0 0.00 0 0 0 0.00 4 2 0 2.3
Ocimmum (Tulsi) 0 0 0 0.00 0 0 0 0.00 0 0 0 0.00 12 36 0 18
Others 0 0 0 0.00 0 0 0 0.00 0 0 0 0.00 0 0 0 0
Total Medicinal Plants 4.2 2 2.30 1.5 0 0.00 0 0 0 0.00 19.3 38.3 20.354
VII Aromatic Plants
Patcholi 0.5 0 0 0.00 4 8 2 1.44 1 50 50 3 6.2 58.7 9 4.571 0.08
Palmarose(grass) 0 0 0 0.00 0 0 0 0.00 2 500 250 40.00 2 500 36 40 0.08
Lemon grass 0 0 0 0.00 0 0 0 0.00 0 0 0 0.00 0.4 0.8 0 0.04 0.05
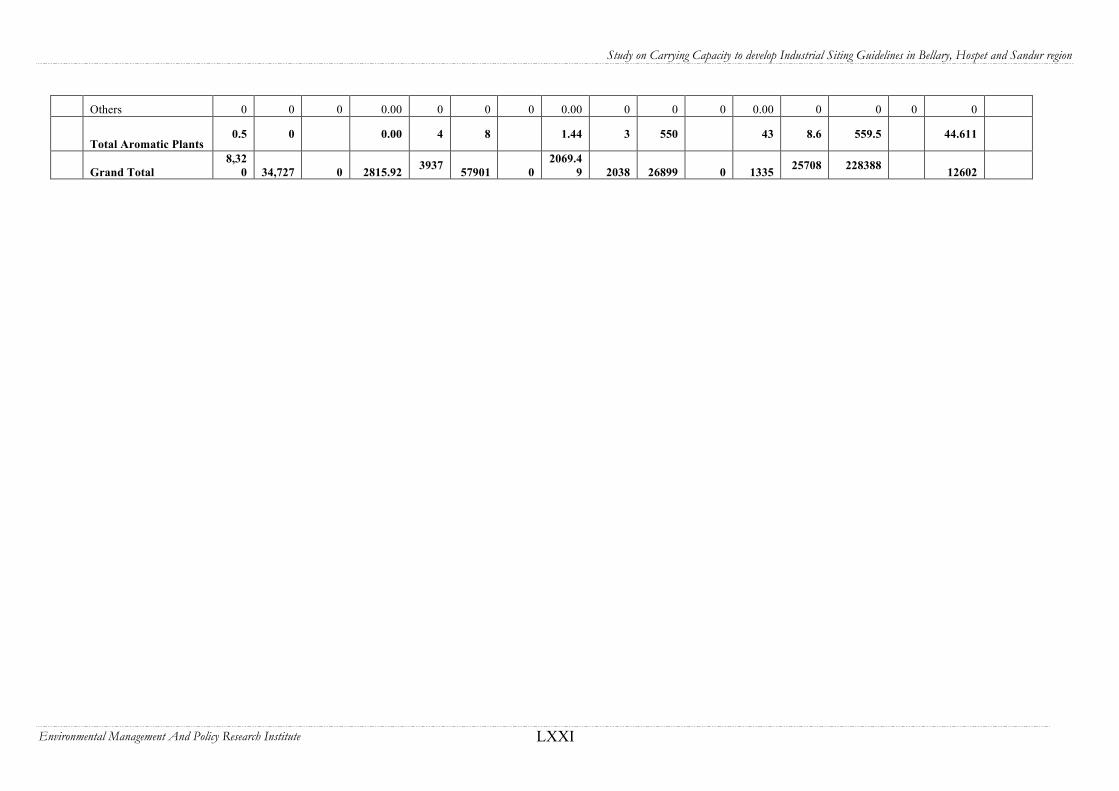
Study on Carrying Capacity to develop Industrial Siting Guidelines in Bellary, Hospet and Sandur region
Environmental Management And Policy Research Institute LXXI
Others 0 0 0 0.00 0 0 0 0.00 0 0 0 0.00 0 0 0 0
Total Aromatic Plants 0.5 0 0.00 4 8 1.44 3 550 43 8.6 559.5 44.611
Grand Total 8,32
0 34,727 0 2815.92 3937 57901 0 2069.4
9 2038 26899 0 1335 25708 228388 12602

Study on Carrying Capacity to develop Industrial Siting Guidelines in Bellary, Hospet and Sandur region
Environmental Management And Policy Research Institute LXXII
AA N N E X U R EN N E X U R E -- X X V I I IX X V I I I Statement showing taluka wise area & production of horticulture crops in Bellary district as on 31.03.05
Bellary Hospet Sandur Total District Area Sl. No. Name of the Crops
Area Prod Yield/ Ha Value Area Prod Yield/
ha Value Area Prod Yield/ ha Value Area Prod Yield/
ha Value Value/ ton
I Fruit Crops
1 Mango 310 5580 18 837.00 200 3600 18 540.00 162 1296 8 220.32 1035 16479 16 2397.3 0.15
2 Banana a). Cavandi 0 0 30 0.00 0 0 30 0.00 0 0 30 0 0 0 30 0
b). Others 26 1040 40 31.20 2354 94160 40 1883 72 1800 25 72 2629 103300 35 2148.5 0.02
Banana Total 26 1040 0 31.20 2354 94160 0 1883 72 1800 72 2629 103300 2148
3 Guava 4 56 14 1.12 9 126 14 2.52 0 0 14 0 46 930 17 18.6 0.02
4 Sapota 600 6000 10 660.00 27 270 10 5.40 10 80 8 2.4 807 8270 10 737.4 0.09
Citres varieties 0 0 0 0.00 0 0 0 0.00 0 0 0 0
a. Lime 28 448 16 8.96 8 128 16 2.56 2 50 25 1.5 71 1343 20 27.11 0.02
b. Mosambi 32 256 8 20.48 0 0 8 0.00 2 50 25 4 74 700 13 59.6 0.09
c. Other citres 0 0 5 0.00 0 0 5 0.00 0 0 5 0 0 0 5 0
Citres Total 60 704 0 29.44 8 128 0 2.56 4 100 5.5 145 2043 86.71
5 Pomogramate 703 6327 9 189.81 16 144 9 2.88 10 80 8 1.6 1846 17690 9 633.78 0.04
6 Jack 0 0 25 0.00 0 0 25 0.00 0 0 25 0 7 175 25 1.75 0.01
7 Papaya 20 1500 75 15.00 12 900 75 9.00 25 1625 65 24.38 113 8225 74 90.375 0.01
8 Ber 13 234 18 7.02 2 36 18 1.08 0 0 18 0 20 421 24 14.58 0.03
9 Grapes Anab-e-sh 0 0 0 0.00 0 0 0 0.00 0 0 0 0 0 0 0 0
Grapes Other 0 0 8 0.00 2 16 8 1.92 5 10 2 1.6 23 122 7 13.12 0.11
10 Fig 300 2700 9 540.00 2 18 9 1.98 0 0 9 0 341 3168 10 596.67 0.19
11 Others 6 18 3 0.90 5 15 3 0.30 0 0 3 0 21 133 4 3.2 0.02
Total Fruits 2042 24159 0 2311.49 2637 99413 2451.00 288 4991 327.8 7033 160956 6742
II Vegetable Crops
2 Tomato- Kharif 93 1674 18 33.48 55 990 18 29.70 97 1746 18 34.92 523 10362 20 268 0.03
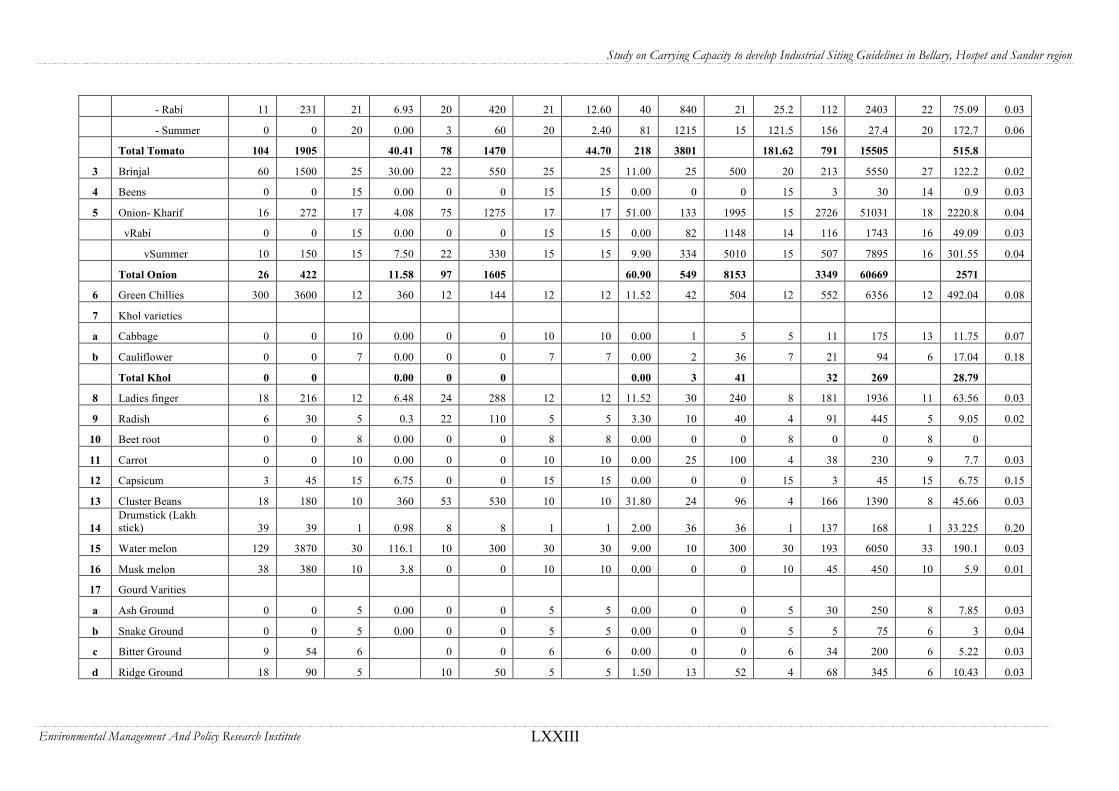
Study on Carrying Capacity to develop Industrial Siting Guidelines in Bellary, Hospet and Sandur region
Environmental Management And Policy Research Institute LXXIII
- Rabi 11 231 21 6.93 20 420 21 12.60 40 840 21 25.2 112 2403 22 75.09 0.03
- Summer 0 0 20 0.00 3 60 20 2.40 81 1215 15 121.5 156 27.4 20 172.7 0.06
Total Tomato 104 1905 40.41 78 1470 44.70 218 3801 181.62 791 15505 515.8
3 Brinjal 60 1500 25 30.00 22 550 25 25 11.00 25 500 20 213 5550 27 122.2 0.02
4 Beens 0 0 15 0.00 0 0 15 15 0.00 0 0 15 3 30 14 0.9 0.03
5 Onion- Kharif 16 272 17 4.08 75 1275 17 17 51.00 133 1995 15 2726 51031 18 2220.8 0.04
vRabi 0 0 15 0.00 0 0 15 15 0.00 82 1148 14 116 1743 16 49.09 0.03
vSummer 10 150 15 7.50 22 330 15 15 9.90 334 5010 15 507 7895 16 301.55 0.04
Total Onion 26 422 11.58 97 1605 60.90 549 8153 3349 60669 2571
6 Green Chillies 300 3600 12 360 12 144 12 12 11.52 42 504 12 552 6356 12 492.04 0.08
7 Khol varieties
a Cabbage 0 0 10 0.00 0 0 10 10 0.00 1 5 5 11 175 13 11.75 0.07
b Cauliflower 0 0 7 0.00 0 0 7 7 0.00 2 36 7 21 94 6 17.04 0.18
Total Khol 0 0 0.00 0 0 0.00 3 41 32 269 28.79
8 Ladies finger 18 216 12 6.48 24 288 12 12 11.52 30 240 8 181 1936 11 63.56 0.03
9 Radish 6 30 5 0.3 22 110 5 5 3.30 10 40 4 91 445 5 9.05 0.02
10 Beet root 0 0 8 0.00 0 0 8 8 0.00 0 0 8 0 0 8 0
11 Carrot 0 0 10 0.00 0 0 10 10 0.00 25 100 4 38 230 9 7.7 0.03
12 Capsicum 3 45 15 6.75 0 0 15 15 0.00 0 0 15 3 45 15 6.75 0.15
13 Cluster Beans 18 180 10 360 53 530 10 10 31.80 24 96 4 166 1390 8 45.66 0.03
14 Drumstick (Lakh stick) 39 39 1 0.98 8 8 1 1 2.00 36 36 1 137 168 1 33.225 0.20
15 Water melon 129 3870 30 116.1 10 300 30 30 9.00 10 300 30 193 6050 33 190.1 0.03
16 Musk melon 38 380 10 3.8 0 0 10 10 0.00 0 0 10 45 450 10 5.9 0.01
17 Gourd Varities
a Ash Ground 0 0 5 0.00 0 0 5 5 0.00 0 0 5 30 250 8 7.85 0.03
b Snake Ground 0 0 5 0.00 0 0 5 5 0.00 0 0 5 5 75 6 3 0.04
c Bitter Ground 9 54 6 0 0 6 6 0.00 0 0 6 34 200 6 5.22 0.03
d Ridge Ground 18 90 5 10 50 5 5 1.50 13 52 4 68 345 6 10.43 0.03

Study on Carrying Capacity to develop Industrial Siting Guidelines in Bellary, Hospet and Sandur region
Environmental Management And Policy Research Institute LXXIV
e Pumpkin 2 30 15 0 0 15 15 0 0 0 15 7 180 17 3 0.02
f Cucumber 19 228 12 6.84 43 516 12 15.48 30 360 12 10.8 250 4065 15 111.98 0.03
g Little finger 2 60 30 1.2 0 0 30 0 0 0 30 0 2 60 30 1.2 0.02
h Gherkin 0 0 15 0 0 0 15 0 10 120 12 3.6 66 935 14 25.6 0.03
I Others 0 0 10 0 0 0 10 0 0 0 10 0 7 70 10 0
Total Gourds 50 462 13.86 53 566 16.98 53 532 15.96 469 6180 168.3 0.03
22 Leafy Varieties
a Menthi 8 80 10 2.4 85 850 10 25.5 18 54 3 1.62 181 1663 8 49.89 0.03
b Palak 9 81 9 2.43 88 792 9 15.84 24 96 4 0.96 297 2063 8 41.11 0.02
c Dhantu 11 187 17 3.74 0 0 17 0 10 50 5 0.5 64 968 15 18.86 0.02
d Curry Leafes 20 40 2 1.2 13 26 2 0.78 18 36 2 1.08 106 212 2 6 0.03
e Others 4 24 6 0.72 0 0 6 0 30 120 4 2.4 107 542 5 13.48 0.02
Total leaf varieties 52 412 10.49 186 1668 42.12 100 356 6.56 755 5448 129.3 0.02
23 OTHERS 2 10 5 0.3 50 250 5 5 0 0 5 0 191 2470 7 213 0.09
Total Vegetables 845 13032 604.65 615 7481 249.84 1125 14663 579.33 7209 113023 4603.7 0.04
III Spices
1 Pepper 0 0 0 0 0 0 0 0 0 0 0 0 1.5 0 0 0
Tamarind 19 47.5 2.5 3.8 24 60 2.5 4.8 50 350 7 42 270 970 4 105.5 0.11
Ginger 0 0 1.6 0 5 8 1.6 1.2 0 0 1.6 0 7 11.2 2 1.68 0.15
Turmeric 0 0 1 0 0 0 1 0 2 2 1 0 7 16 3 3.14 0.2
Garlic 0 0 5 0 2 10 5 1.2 0 0 5 0 18 111 5 14.1 0.13
Dry chillies 7500 15000 2 4800 325 650 2 130 93 186 2 40.92 10844 21688 2 6458.5 0.3
Coriander 3465 2598.8 0.75 415.8 860 645 0.75 96.75 6 6 1 0.96 4467 3331 1 525.81 0.16
Vanilla 0 0 0.25 0 0 0 0.25 0 0 0 0.3 0
Others 5 15 3 3 0 0 3 0 0 0 3 0 525 1575 3 159 0.1
Total Spices 10989 17661 5222.6 1216 1373 233.95 151 544 83.88 16142 27702 7267.8 0.26
IV Garden Crops
Coconut (lakh nuts) 100 6 0.06 15 206 12.36 0.06 37.08 75 4.5 0.1 22.5 1552 115.96 0 329.28 2.84
Arecanut 0 0 0.15 0.00 11 1.65 0.15 1.32 2 0.3 0.2 0.24 42 9 0 6.75 0.75
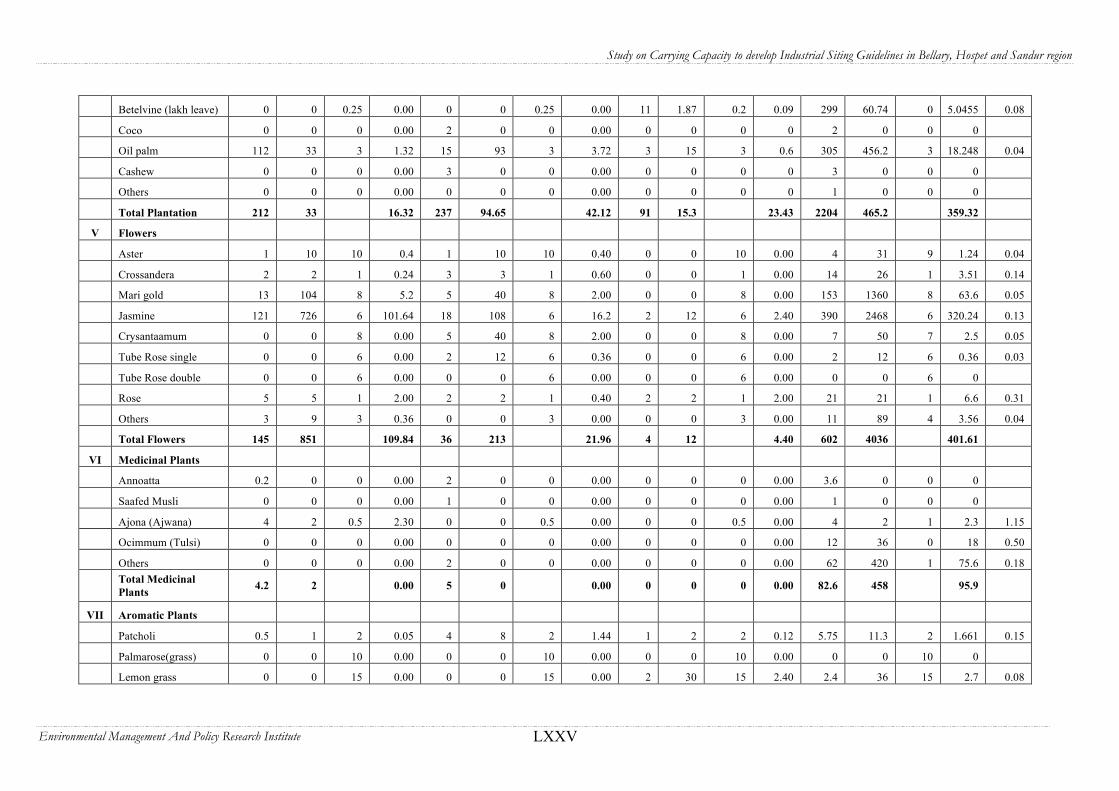
Study on Carrying Capacity to develop Industrial Siting Guidelines in Bellary, Hospet and Sandur region
Environmental Management And Policy Research Institute LXXV
Betelvine (lakh leave) 0 0 0.25 0.00 0 0 0.25 0.00 11 1.87 0.2 0.09 299 60.74 0 5.0455 0.08
Coco 0 0 0 0.00 2 0 0 0.00 0 0 0 0 2 0 0 0
Oil palm 112 33 3 1.32 15 93 3 3.72 3 15 3 0.6 305 456.2 3 18.248 0.04
Cashew 0 0 0 0.00 3 0 0 0.00 0 0 0 0 3 0 0 0
Others 0 0 0 0.00 0 0 0 0.00 0 0 0 0 1 0 0 0
Total Plantation 212 33 16.32 237 94.65 42.12 91 15.3 23.43 2204 465.2 359.32
V Flowers
Aster 1 10 10 0.4 1 10 10 0.40 0 0 10 0.00 4 31 9 1.24 0.04
Crossandera 2 2 1 0.24 3 3 1 0.60 0 0 1 0.00 14 26 1 3.51 0.14
Mari gold 13 104 8 5.2 5 40 8 2.00 0 0 8 0.00 153 1360 8 63.6 0.05
Jasmine 121 726 6 101.64 18 108 6 16.2 2 12 6 2.40 390 2468 6 320.24 0.13
Crysantaamum 0 0 8 0.00 5 40 8 2.00 0 0 8 0.00 7 50 7 2.5 0.05
Tube Rose single 0 0 6 0.00 2 12 6 0.36 0 0 6 0.00 2 12 6 0.36 0.03
Tube Rose double 0 0 6 0.00 0 0 6 0.00 0 0 6 0.00 0 0 6 0
Rose 5 5 1 2.00 2 2 1 0.40 2 2 1 2.00 21 21 1 6.6 0.31
Others 3 9 3 0.36 0 0 3 0.00 0 0 3 0.00 11 89 4 3.56 0.04
Total Flowers 145 851 109.84 36 213 21.96 4 12 4.40 602 4036 401.61
VI Medicinal Plants
Annoatta 0.2 0 0 0.00 2 0 0 0.00 0 0 0 0.00 3.6 0 0 0
Saafed Musli 0 0 0 0.00 1 0 0 0.00 0 0 0 0.00 1 0 0 0
Ajona (Ajwana) 4 2 0.5 2.30 0 0 0.5 0.00 0 0 0.5 0.00 4 2 1 2.3 1.15
Ocimmum (Tulsi) 0 0 0 0.00 0 0 0 0.00 0 0 0 0.00 12 36 0 18 0.50
Others 0 0 0 0.00 2 0 0 0.00 0 0 0 0.00 62 420 1 75.6 0.18
Total Medicinal Plants 4.2 2 0.00 5 0 0.00 0 0 0 0.00 82.6 458 95.9
VII Aromatic Plants
Patcholi 0.5 1 2 0.05 4 8 2 1.44 1 2 2 0.12 5.75 11.3 2 1.661 0.15
Palmarose(grass) 0 0 10 0.00 0 0 10 0.00 0 0 10 0.00 0 0 10 0
Lemon grass 0 0 15 0.00 0 0 15 0.00 2 30 15 2.40 2.4 36 15 2.7 0.08

Study on Carrying Capacity to develop Industrial Siting Guidelines in Bellary, Hospet and Sandur region
Environmental Management And Policy Research Institute LXXVI
Others 0 0 5 0.00 2 10 5 0.20 0 0 5 0.00 2 10 5 0.2 0.02
Total Aromatic Plants
0.5 1 0.00 6 18 18 1.64 3 32 2.52 10.15 57.3 4.511
Grand Total 14,238 55,739 0 8267.2 4752 1,08,593 0 3000.4 1662 20257 0 1021 33282 306698 19475
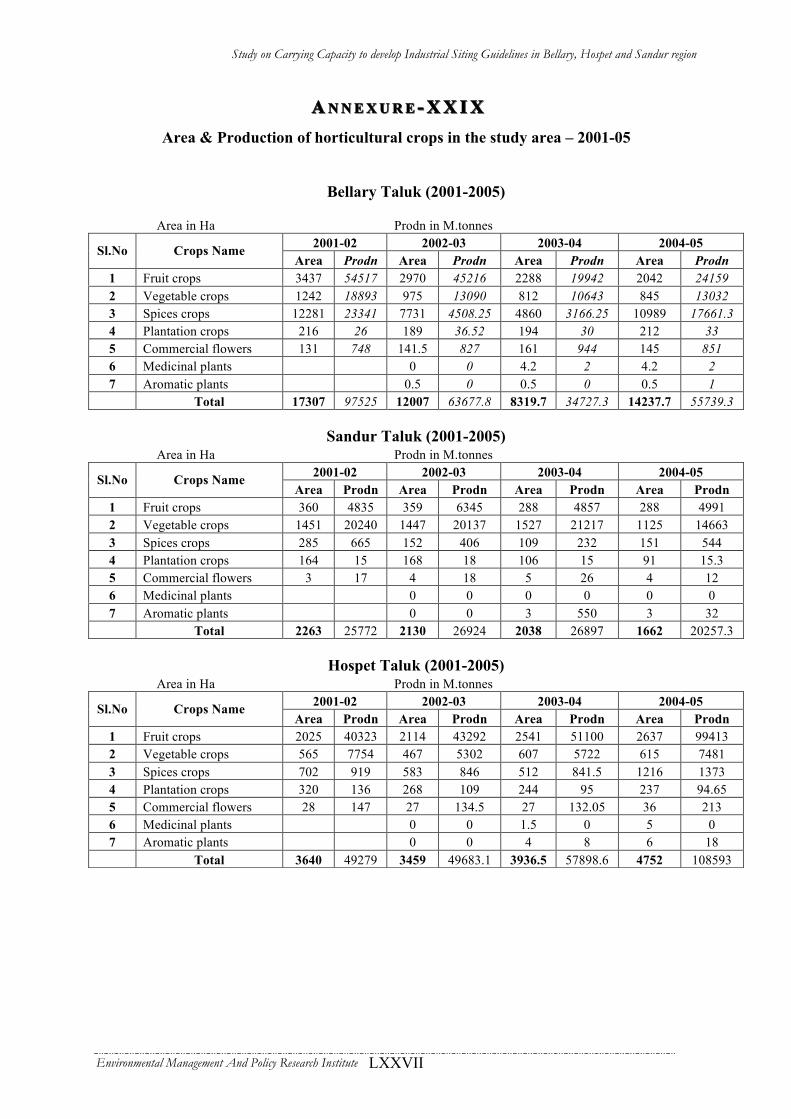
Study on Carrying Capacity to develop Industrial Siting Guidelines in Bellary, Hospet and Sandur region
Environmental Management And Policy Research Institute LXXVII
AA N N E X U R EN N E X U R E -- X X I XX X I X
Area & Production of horticultural crops in the study area – 2001-05
Bellary Taluk (2001-2005)
Area in Ha Prodn in M.tonnes 2001-02 2002-03 2003-04 2004-05 Sl.No Crops Name
Area Prodn Area Prodn Area Prodn Area Prodn 1 Fruit crops 3437 54517 2970 45216 2288 19942 2042 24159 2 Vegetable crops 1242 18893 975 13090 812 10643 845 13032 3 Spices crops 12281 23341 7731 4508.25 4860 3166.25 10989 17661.3 4 Plantation crops 216 26 189 36.52 194 30 212 33 5 Commercial flowers 131 748 141.5 827 161 944 145 851 6 Medicinal plants 0 0 4.2 2 4.2 2 7 Aromatic plants 0.5 0 0.5 0 0.5 1
Total 17307 97525 12007 63677.8 8319.7 34727.3 14237.7 55739.3
Sandur Taluk (2001-2005) Area in Ha Prodn in M.tonnes
2001-02 2002-03 2003-04 2004-05 Sl.No Crops Name Area Prodn Area Prodn Area Prodn Area Prodn
1 Fruit crops 360 4835 359 6345 288 4857 288 4991 2 Vegetable crops 1451 20240 1447 20137 1527 21217 1125 14663 3 Spices crops 285 665 152 406 109 232 151 544 4 Plantation crops 164 15 168 18 106 15 91 15.3 5 Commercial flowers 3 17 4 18 5 26 4 12 6 Medicinal plants 0 0 0 0 0 0 7 Aromatic plants 0 0 3 550 3 32
Total 2263 25772 2130 26924 2038 26897 1662 20257.3
Hospet Taluk (2001-2005) Area in Ha Prodn in M.tonnes
2001-02 2002-03 2003-04 2004-05 Sl.No Crops Name Area Prodn Area Prodn Area Prodn Area Prodn
1 Fruit crops 2025 40323 2114 43292 2541 51100 2637 99413 2 Vegetable crops 565 7754 467 5302 607 5722 615 7481 3 Spices crops 702 919 583 846 512 841.5 1216 1373 4 Plantation crops 320 136 268 109 244 95 237 94.65 5 Commercial flowers 28 147 27 134.5 27 132.05 36 213 6 Medicinal plants 0 0 1.5 0 5 0 7 Aromatic plants 0 0 4 8 6 18
Total 3640 49279 3459 49683.1 3936.5 57898.6 4752 108593

Study on Carrying Capacity to develop Industrial Siting Guidelines in Bellary, Hospet and Sandur region
Environmental Management And Policy Research Institute LXXVIII
AA N N E X U R EN N E X U R E -- X X XX X X
Statement showing hobliwise area & production of horticulture crops in Sandur taluk-20001-05
Sandur Hobli (2001-2005)
Area in Ha Prodn in M.tonnes
2001-02 2002-03 2003-04 2004-05 Sl.No Crops Name Area Prodn Area Prodn Area Prodn Area Prodn
1 Fruit crops 181 2665 176 3235 143 2168 143 2148 2 Vegetable crops 729 10434 824 11797 847 12174 531 7424 3 Spices crops 5 35 5 35 5 23 12 72 4 Plantation crops 67 15 58 18 59 15 41 15.3 5 Commercial flowers 3 17 4 18 5 26 4 12 6 Medicinal plants 0 0 0 0 0 0 7 Aromatic plants 0 0 3 550 3 32
Total 985 13166 1067 15103 1062 14956 734 9703.3
Chornur Hobli (2001-2005)
Area in Ha Prodn in M.tonnes
2001-02 2002-03 2003-04 2004-05 Sl.No Crops Name Area Prodn Area Prodn Area Prodn Area Prodn
1 Fruit crops 53 415 61 990 56 752 61 946 2 Vegetable crops 81 799 78 721 121 1322 204 2206 3 Spices crops 93 239 15 89 9 51 29 179 4 Plantation crops 35 0 43 0 19 0 30 0 5 Commercial flowers 0 0 0 0 0 0 0 0 6 Medicinal plants 0 0 0 0 0 0 7 Aromatic plants 0 0 0 0 0 0
Total 262 1453 197 1800 205 134.51 324 3331
Toranagalu Hobli (2001-2005)
Area in Ha Prodn in M.tonnes
2001-02 2002-03 2003-04 2004-05 Sl.No Crops Name Area Prodn Area Prodn Area Prodn Area Prodn
1 Fruit crops 126 1755 122 2120 89 1937 84 1897 2 Vegetable crops 641 9007 545 7619 559 7721 390 5033 3 Spices crops 187 391 132 282 95 158 110 293 4 Plantation crops 62 0 67 0 28 0 20 0 5 Commercial flowers 0 0 0 0 0 0 0 0 6 Medicinal plants 0 0 0 0 0 0 7 Aromatic plants 0 0 0 0 0 0
Total 1016 11153 866 10021 771 9816 604 7223

Study on Carrying Capacity to develop Industrial Siting Guidelines in Bellary, Hospet and Sandur region
Environmental Management And Policy Research Institute LXXIX
AA N N E X U R EN N E X U R E -- X X X IX X X I
Statement showing the motor vehicles registerd in Hospet RTO -2005
Sl.No Name of the Vehicles
Total Kept Under as on Aug
2005 1 Motor Cycle- 50cc
51-300cc Abmc-300cc
16513 32136
546 2 Motor Cars 3071 3 Invalid Carriage 6 4 Jeeps 488 5 Autoricshaw 996 6 Motor Cabs 305 7 Omni Buses 553 8 Station Wagons - 9 Stage Carriage
K.S.R.T.C, Buses 64 09
10 Private Buses 10 11 Goods Vehicles Public
Carriers Private Carriers 2797
12 Contract Carriage - 13 Tractor 3958 14 Trailers 3176 15 Dumpers 24 16 Buldozors - 17 Tippers 1135 18 Road Rollers - 19 Power Tiller 15 20 Maxi Cabs 400 21 Rockers 2 22 Fire Engines 228 23 Delivery Vans 33 24 Ambulance Vans 4 25 Fire-Fighter 48 26 Tankers 382
others 66947
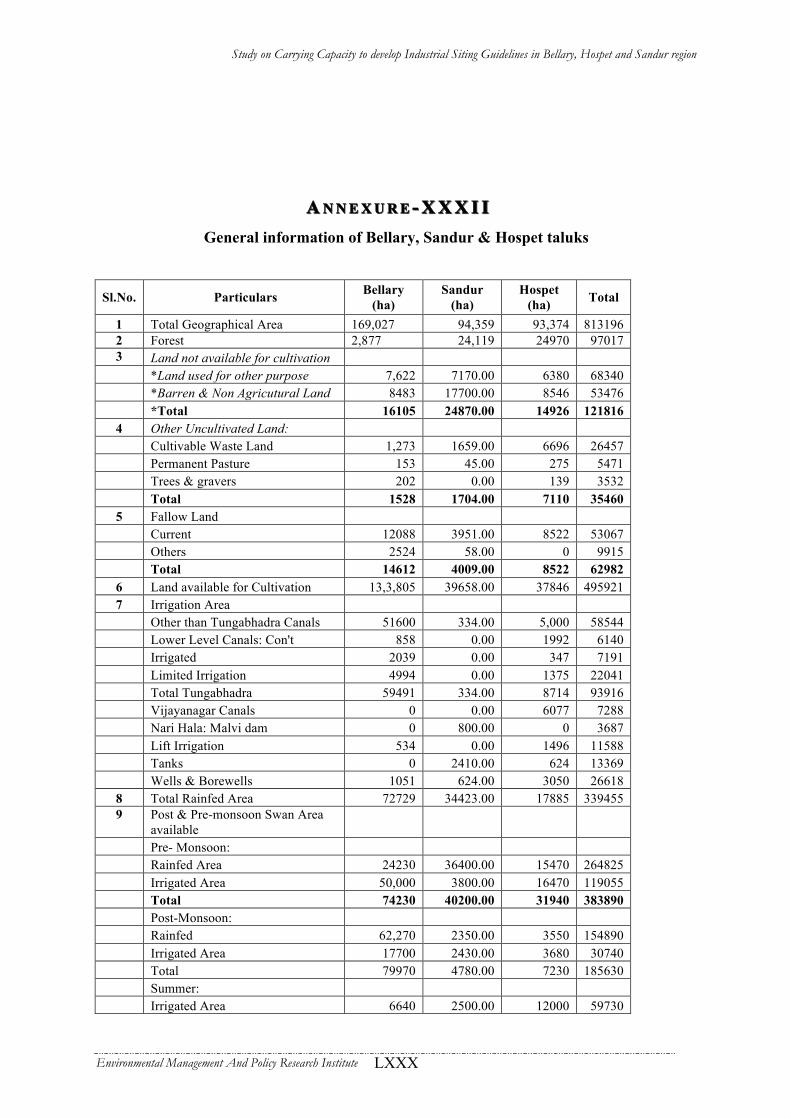
Study on Carrying Capacity to develop Industrial Siting Guidelines in Bellary, Hospet and Sandur region
Environmental Management And Policy Research Institute LXXX
AA N N E X U R EN N E X U R E -- X X X I IX X X I I
General information of Bellary, Sandur & Hospet taluks
Sl.No. Particulars Bellary (ha)
Sandur (ha)
Hospet (ha) Total
1 Total Geographical Area 169,027 94,359 93,374 813196 2 Forest 2,877 24,119 24970 97017 3 Land not available for cultivation *Land used for other purpose 7,622 7170.00 6380 68340 *Barren & Non Agricutural Land 8483 17700.00 8546 53476 *Total 16105 24870.00 14926 121816
4 Other Uncultivated Land: Cultivable Waste Land 1,273 1659.00 6696 26457 Permanent Pasture 153 45.00 275 5471 Trees & gravers 202 0.00 139 3532 Total 1528 1704.00 7110 35460
5 Fallow Land Current 12088 3951.00 8522 53067 Others 2524 58.00 0 9915 Total 14612 4009.00 8522 62982
6 Land available for Cultivation 13,3,805 39658.00 37846 495921 7 Irrigation Area Other than Tungabhadra Canals 51600 334.00 5,000 58544 Lower Level Canals: Con't 858 0.00 1992 6140 Irrigated 2039 0.00 347 7191 Limited Irrigation 4994 0.00 1375 22041 Total Tungabhadra 59491 334.00 8714 93916 Vijayanagar Canals 0 0.00 6077 7288 Nari Hala: Malvi dam 0 800.00 0 3687 Lift Irrigation 534 0.00 1496 11588 Tanks 0 2410.00 624 13369 Wells & Borewells 1051 624.00 3050 26618
8 Total Rainfed Area 72729 34423.00 17885 339455 9 Post & Pre-monsoon Swan Area
available Pre- Monsoon: Rainfed Area 24230 36400.00 15470 264825 Irrigated Area 50,000 3800.00 16470 119055 Total 74230 40200.00 31940 383890 Post-Monsoon: Rainfed 62,270 2350.00 3550 154890 Irrigated Area 17700 2430.00 3680 30740 Total 79970 4780.00 7230 185630 Summer: Irrigated Area 6640 2500.00 12000 59730
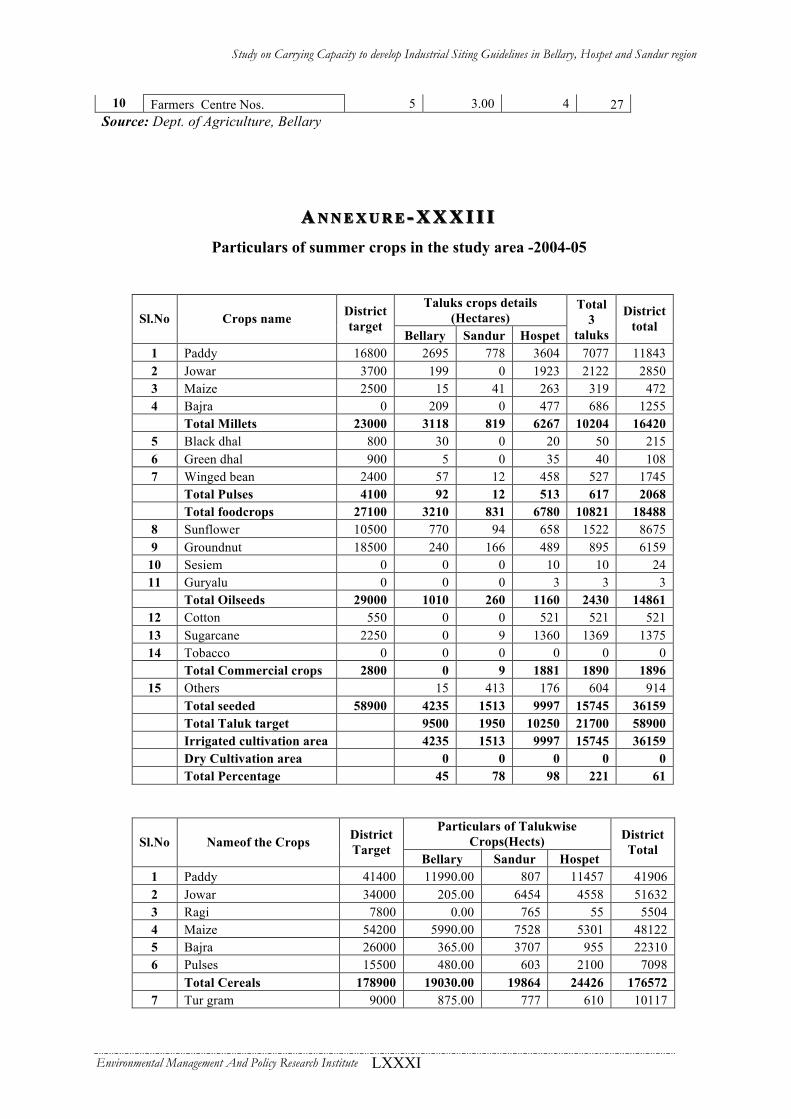
Study on Carrying Capacity to develop Industrial Siting Guidelines in Bellary, Hospet and Sandur region
Environmental Management And Policy Research Institute LXXXI
10 Farmers Centre Nos. 5 3.00 4 27 Source: Dept. of Agriculture, Bellary
AA N N E X U R EN N E X U R E -- X X X I I IX X X I I I
Particulars of summer crops in the study area -2004-05
Taluks crops details (Hectares) Sl.No Crops name District
target Bellary Sandur Hospet
Total 3
taluks
District total
1 Paddy 16800 2695 778 3604 7077 11843 2 Jowar 3700 199 0 1923 2122 2850 3 Maize 2500 15 41 263 319 472 4 Bajra 0 209 0 477 686 1255 Total Millets 23000 3118 819 6267 10204 16420 5 Black dhal 800 30 0 20 50 215 6 Green dhal 900 5 0 35 40 108 7 Winged bean 2400 57 12 458 527 1745 Total Pulses 4100 92 12 513 617 2068 Total foodcrops 27100 3210 831 6780 10821 18488 8 Sunflower 10500 770 94 658 1522 8675 9 Groundnut 18500 240 166 489 895 6159
10 Sesiem 0 0 0 10 10 24 11 Guryalu 0 0 0 3 3 3 Total Oilseeds 29000 1010 260 1160 2430 14861
12 Cotton 550 0 0 521 521 521 13 Sugarcane 2250 0 9 1360 1369 1375 14 Tobacco 0 0 0 0 0 0 Total Commercial crops 2800 0 9 1881 1890 1896
15 Others 15 413 176 604 914 Total seeded 58900 4235 1513 9997 15745 36159 Total Taluk target 9500 1950 10250 21700 58900
Irrigated cultivation area 4235 1513 9997 15745 36159 Dry Cultivation area 0 0 0 0 0 Total Percentage 45 78 98 221 61
Particulars of Talukwise
Crops(Hects) Sl.No Nameof the Crops District Target
Bellary Sandur Hospet
District Total
1 Paddy 41400 11990.00 807 11457 41906 2 Jowar 34000 205.00 6454 4558 51632 3 Ragi 7800 0.00 765 55 5504 4 Maize 54200 5990.00 7528 5301 48122 5 Bajra 26000 365.00 3707 955 22310 6 Pulses 15500 480.00 603 2100 7098 Total Cereals 178900 19030.00 19864 24426 176572 7 Tur gram 9000 875.00 777 610 10117
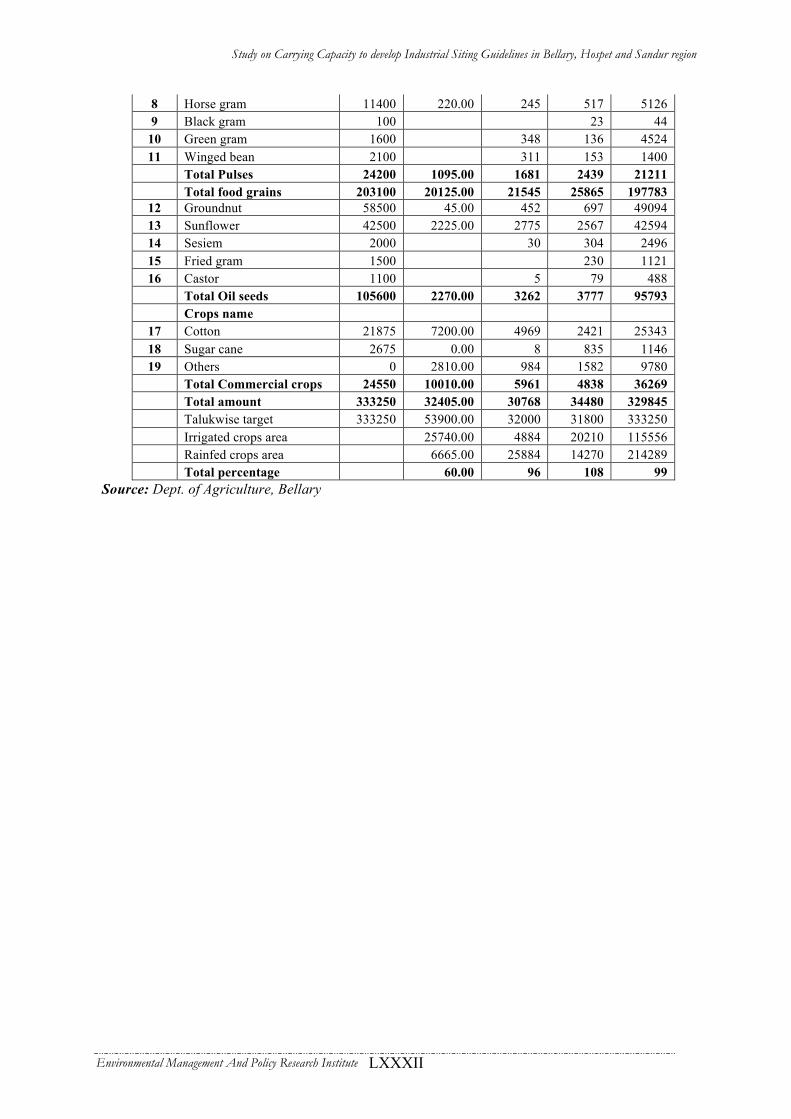
Study on Carrying Capacity to develop Industrial Siting Guidelines in Bellary, Hospet and Sandur region
Environmental Management And Policy Research Institute LXXXII
8 Horse gram 11400 220.00 245 517 5126 9 Black gram 100 23 44
10 Green gram 1600 348 136 4524 11 Winged bean 2100 311 153 1400 Total Pulses 24200 1095.00 1681 2439 21211 Total food grains 203100 20125.00 21545 25865 197783
12 Groundnut 58500 45.00 452 697 49094 13 Sunflower 42500 2225.00 2775 2567 42594 14 Sesiem 2000 30 304 2496 15 Fried gram 1500 230 1121 16 Castor 1100 5 79 488 Total Oil seeds 105600 2270.00 3262 3777 95793 Crops name
17 Cotton 21875 7200.00 4969 2421 25343 18 Sugar cane 2675 0.00 8 835 1146 19 Others 0 2810.00 984 1582 9780
Total Commercial crops 24550 10010.00 5961 4838 36269 Total amount 333250 32405.00 30768 34480 329845 Talukwise target 333250 53900.00 32000 31800 333250 Irrigated crops area 25740.00 4884 20210 115556 Rainfed crops area 6665.00 25884 14270 214289 Total percentage 60.00 96 108 99
Source: Dept. of Agriculture, Bellary
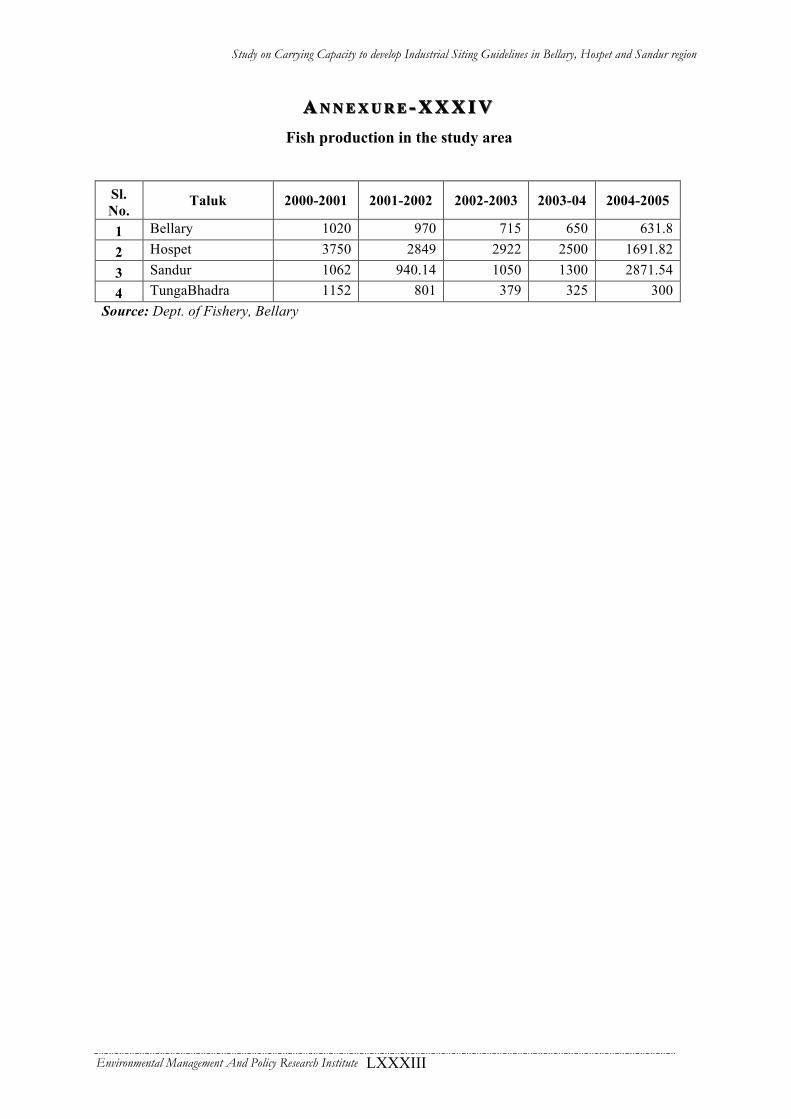
Study on Carrying Capacity to develop Industrial Siting Guidelines in Bellary, Hospet and Sandur region
Environmental Management And Policy Research Institute LXXXIII
AA N N E X U R EN N E X U R E -- X X X I VX X X I V
Fish production in the study area
Sl. No.
Taluk 2000-2001 2001-2002 2002-2003 2003-04 2004-2005
1 Bellary 1020 970 715 650 631.8
2 Hospet 3750 2849 2922 2500 1691.82
3 Sandur 1062 940.14 1050 1300 2871.54
4 TungaBhadra 1152 801 379 325 300 Source: Dept. of Fishery, Bellary
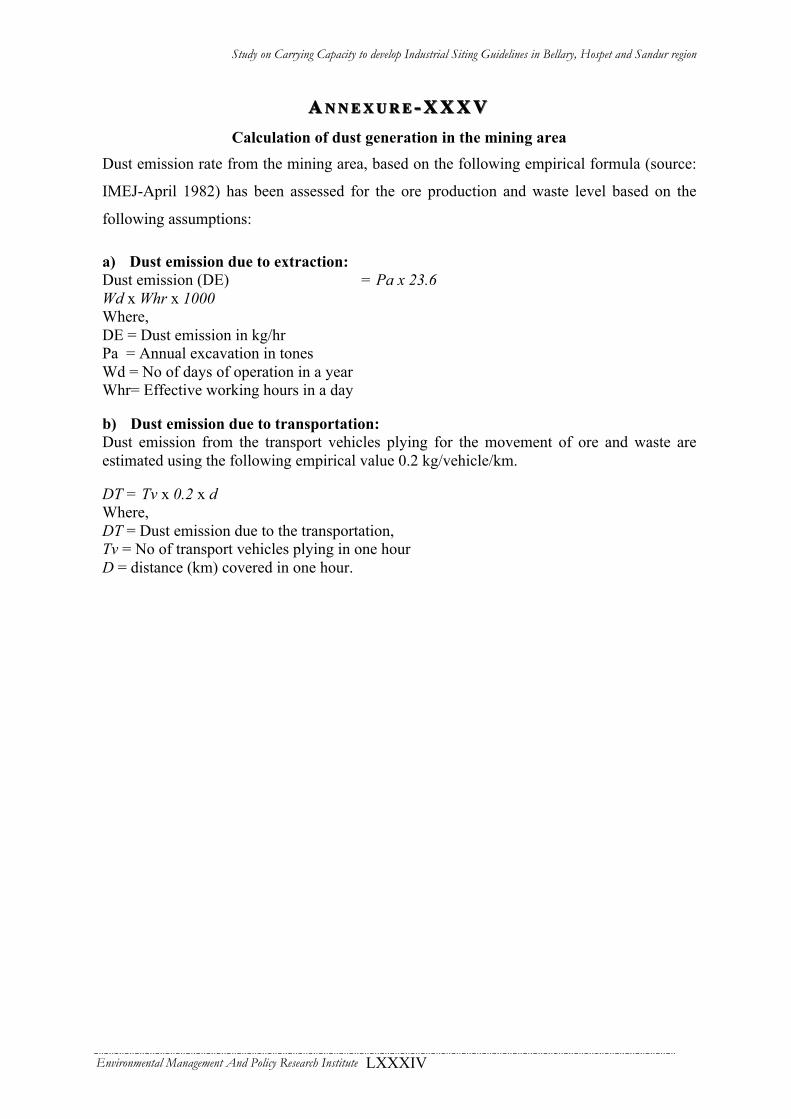
Study on Carrying Capacity to develop Industrial Siting Guidelines in Bellary, Hospet and Sandur region
Environmental Management And Policy Research Institute LXXXIV
AA N N E X U R EN N E X U R E -- X X X VX X X V
Calculation of dust generation in the mining area Dust emission rate from the mining area, based on the following empirical formula (source:
IMEJ-April 1982) has been assessed for the ore production and waste level based on the
following assumptions: a) Dust emission due to extraction: Dust emission (DE) = Pa x 23.6 Wd x Whr x 1000 Where, DE = Dust emission in kg/hr Pa = Annual excavation in tones Wd = No of days of operation in a year Whr= Effective working hours in a day b) Dust emission due to transportation: Dust emission from the transport vehicles plying for the movement of ore and waste are estimated using the following empirical value 0.2 kg/vehicle/km. DT = Tv x 0.2 x d Where, DT = Dust emission due to the transportation, Tv = No of transport vehicles plying in one hour D = distance (km) covered in one hour.

Study on Carrying Capacity to develop Industrial Siting Guidelines in Bellary, Hospet and Sandur region
Environmental Management And Policy Research Institute LXXXV
List of References: The following books,reports, studies in connection with the study on carrying capacity to develop industrial siting guidelines in Bellary-Hospet-Sandur region have been referred.:
1. Regional Environmental Impact Assessment for mining operation in Bellary-
Hospet region Karnataka. National Environmental Engineering Research
Institute, (NEERI) 2004, Nagpur.
2. Working Plan for the Bellary Forest Division (for the period 2003 -2004 to
2012 – 2013, Karnataka Forest Department.
3. State of Environment Report & Action Plan, 2003 – Department of Forest,
Ecology and Environment, Government of Karnataka.
4. Mining and Forest cover change detection in parts of Bellary District using
Multi-temporal satellite data & GIS- Karnataka State Remote Sensing
Application Center.
5. Mineral Resources of Karnataka - B. P. Radhakrishna, Geological Society of
India.
6. Geology of Karnataka – B. P. Radhakrishna & Vaidhyanathan, Geological
Society of India.
7. ‘Bellary District at a Glance 2003-04’, Department of Economics & Statistics,
Government of Karnataka.
8. Census Report 1991-2001.
9. Report on Dynamic Ground Water Resources of Karnataka as on March
2004, Department of Mines & Geology, Government of Karnataka & Central
Ground Water Board, 2005
10. Banking on Biomass – Environment & Development Series, by K.R. Dayte,
Published by Center for Environment Education.
11. Perspective Landuse for Karnataka 2025, Published in 2002
12. Report on Landuse/Landcover (2004) & Change Detection (2000 – 2004) for
Bellary, Sandur & Hospet Taluks of Bellary Distric – IRS 1C/1D Satellite
Image of Sandur Area, Prepared for EMPRI by KSRSAC.
13. Hand Book on Environmental Laws and Guidelines, Karnataka State Pollution
Control Board Officer’s Association (R) 2000.
14. Bellary District Environmental Atlas - KSPCB

Study on Carrying Capacity to develop Industrial Siting Guidelines in Bellary, Hospet and Sandur region
Environmental Management And Policy Research Institute LXXXVI
Research Papers and Journals
1. Adhikari, R. N., Chittaranjan, S., M. S., Rama Mohan Rao., and Husenpaa, V.,
2003, Hydrological Data Analysis for Black Soil Small Agricultural
Catchment in Dryland Zone of Karnataka, Indian J. Dryland Agric. Res. &
Dev. 2003 18(1), 95-99.
2. Adhikari, R. N., S. and Rama Mohan Rao, M. S., 2003, Effect and Feasibility of
Soil and Water Conservation Measure in Tungabhadra River Valley
Catchments of Southern Karnataka, Agnc. Sci. Digest. 23 (3): 179 – 182, 2003.
3. Rao, M.S.R.M., Adhikari, R. N., Math, S. K. N., and Patil, S. L., 2002, Evaluation
of Watershed Development programme, under river valley projects located in
Karnataka.
4. Paul.R.Baumann, 2001, The Dry Monsoon of the Deccan Plateau, India
(Geo/SAT2).
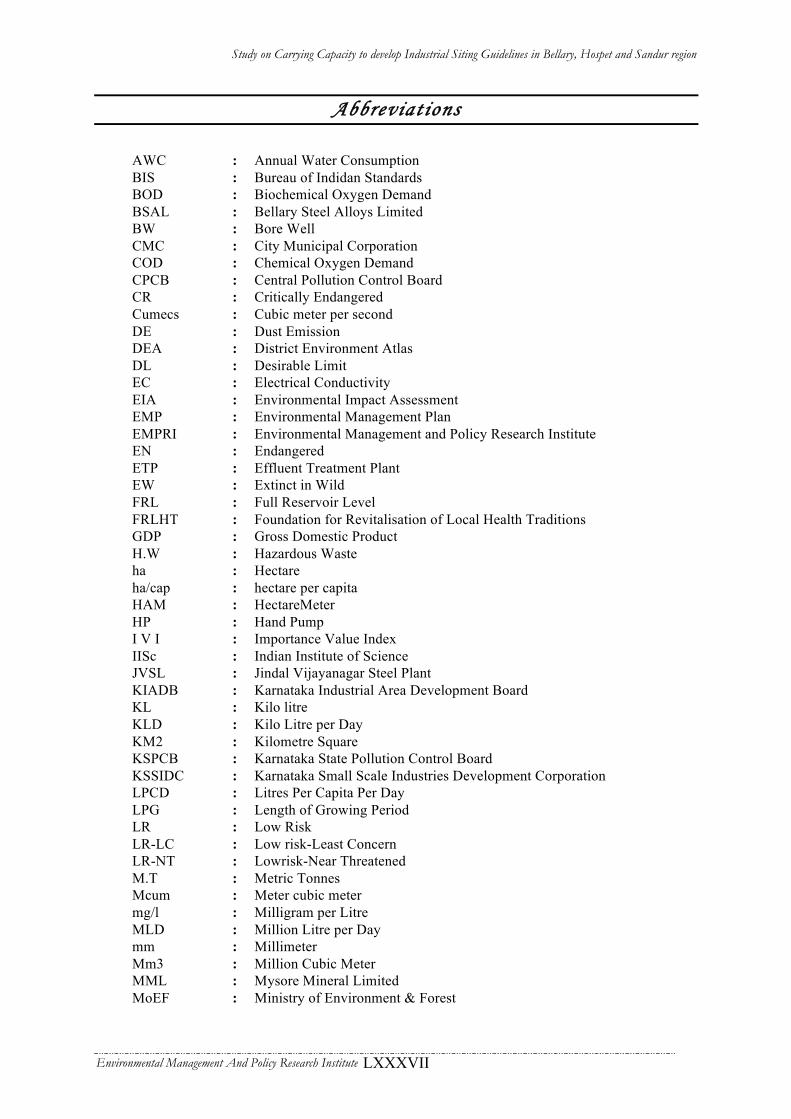
Study on Carrying Capacity to develop Industrial Siting Guidelines in Bellary, Hospet and Sandur region
Environmental Management And Policy Research Institute LXXXVII
Abbreviations
AWC : Annual Water Consumption BIS : Bureau of Indidan Standards BOD : Biochemical Oxygen Demand BSAL : Bellary Steel Alloys Limited BW : Bore Well CMC : City Municipal Corporation COD : Chemical Oxygen Demand CPCB : Central Pollution Control Board CR : Critically Endangered Cumecs : Cubic meter per second DE : Dust Emission DEA : District Environment Atlas DL : Desirable Limit EC : Electrical Conductivity EIA : Environmental Impact Assessment EMP : Environmental Management Plan EMPRI : Environmental Management and Policy Research Institute EN : Endangered ETP : Effluent Treatment Plant EW : Extinct in Wild FRL : Full Reservoir Level FRLHT : Foundation for Revitalisation of Local Health Traditions GDP : Gross Domestic Product H.W : Hazardous Waste ha : Hectare ha/cap : hectare per capita HAM : HectareMeter HP : Hand Pump I V I : Importance Value Index IISc : Indian Institute of Science JVSL : Jindal Vijayanagar Steel Plant KIADB : Karnataka Industrial Area Development Board KL : Kilo litre KLD : Kilo Litre per Day KM2 : Kilometre Square KSPCB : Karnataka State Pollution Control Board KSSIDC : Karnataka Small Scale Industries Development Corporation LPCD : Litres Per Capita Per Day LPG : Length of Growing Period LR : Low Risk LR-LC : Low risk-Least Concern LR-NT : Lowrisk-Near Threatened M.T : Metric Tonnes Mcum : Meter cubic meter mg/l : Milligram per Litre MLD : Million Litre per Day mm : Millimeter Mm3 : Million Cubic Meter MML : Mysore Mineral Limited MoEF : Ministry of Environment & Forest
Study on Carrying Capacity to develop Industrial Siting Guidelines in Bellary, Hospet and Sandur region
Environmental Management And Policy Research Institute LXXXVIII
MPCA : Medicinal Plants Conservation Area MSW : Municipal Solid Waste mtrs : Meters NAAQS : National Ambient Air Quality Standards NEB : North Eastern Block NEERI : National Environmental Engineering Research Institute NH : National Highway NMDC : National Mineral Development Corporation NOx : Nitrous Oxide NT : Near Threatened O.C : Organic Carbon PET : Potential Evapotranspiration PL : Permissible Limit PVC : Poly Vinyl Chloride RF : Range Forest RSPM : Respirable Suspended Particulate Matter SMIORE : Sandur Manganese and Iron Ore SO2 : Sulphur di oxide SoER : State of Environment Report SPM : Suspended Particulate Matter Sq.Km : Square Kilometre SSI : Small Scale Industries SWOT : Strength Waknesses Opportunities and Threats T.B : Tuberculosis t/ha/yr : Ton per hectare per year TB.Board : Tungabhadra Board TB.dam : Tungabhadra dam TERI : Tata Energy Research Institute TGA : Total Geographical Area TM : Taluk Municipality TP : Taluk Panchayat USDA : United States Department of Agriculture USLE : United Soil Loss Equation VU : Vulnerable YTC : Yet To Commence
Related Documents