Carroll County Maryland Proposed Budget Summary Operating Budget Fiscal Year 2021 Operating Plan Fiscal Years 2021-2026 And Capital Budget Fiscal Years 2021-2026 Available online at: https://www.carrollcountymd.gov/government/directory/management-budget/bureau-of-budget/budget-documents/

Welcome message from author
This document is posted to help you gain knowledge. Please leave a comment to let me know what you think about it! Share it to your friends and learn new things together.
Transcript
Carroll County Maryland
Proposed Budget Summary
Operating Budget Fiscal Year 2021
Operating Plan Fiscal Years 2021-2026 And
Capital Budget Fiscal Years 2021-2026
Available online at: https://www.carrollcountymd.gov/government/directory/management-budget/bureau-of-budget/budget-documents/

PRODUCED BY
Department of Management and Budget
Ted Zaleski........................................................................................................................... Director Deborah Effingham .................................................................................... Chief, Bureau of Budget Heidi Pepin............................................................... Management and Budget Project Coordinator Judy Flickinger................................................................. Senior Management and Budget Analyst Taylor Hockensmith......................................................... Senior Management and Budget Analyst Stephanie Krome .............................................................. Senior Management and Budget Analyst Chizuko Godwin .......................................................................... Management and Budget Analyst Ashleigh Smith............................................................................. Management and Budget Analyst
Special thanks to the staff in Production and Distribution
Accessibility
The Americans with Disabilities Act applies to the Carroll County Government and its programs, services, activities, and facilities. If you have questions, suggestions, or complaints, please contact at 410-386-3600 or MD Relay 711/ (800) 735-2258 or email [email protected]. The mailing address is: 10 Distillery Drive, Suite 101, Westminster, Maryland 21157.

FY 21 Proposed Budget Summary
Table of Contents
Board of County Commissioners Board of County Commissioners Title Page .......................................................................1 Board of County Commissioners ........................................................................................3
Budget Message Budget Message Title Page ..................................................................................................5 Fiscal Year 2021 Proposed Budget Summary .....................................................................6
Debt Management Debt Management Title Page .............................................................................................11 Debt Management ..............................................................................................................13 Schedule of Debt Service Requirements on Direct County Debt ......................................16 Debt Issued and Outstanding .............................................................................................17 Computation of Projected Legal Debt Margin ...................................................................20
Fund Balance Fund Balance Title Page ....................................................................................................21 Explanation of Fund Balance .............................................................................................23 Projected Fund Balance .....................................................................................................24
Total Budget Summary Total Budget Summary Title Page .....................................................................................25 All Funds Sources – By Category ......................................................................................27 All Funds Uses – By Category...........................................................................................28 All Funds Uses – By Fund .................................................................................................29 All Funds Revenue Summary ............................................................................................30
General Fund Summary General Fund Summary Title Page ....................................................................................31 General Fund Sources – By Category ................................................................................33 General Fund Uses – By Category.....................................................................................34 General Fund Revenues General Fund Revenues Title Page ....................................................................................35 General Fund Revenue Analysis ........................................................................................37 General Fund Operating Revenues ....................................................................................38 Operating Budget Revenues Pie Chart ..............................................................................42 Operating Plan Operating Plan Title Page ..................................................................................................43 Six-Year Operating Revenue Forecast ...............................................................................45 Proposed Operating Plan FY 20 – FY 25 ..........................................................................46
General Fund Appropriations General Fund Appropriations Title Page ...........................................................................51 Public Schools Summary ...................................................................................................53 Education Other Summary .................................................................................................54 Public Safety and Corrections Summary ...........................................................................55 Public Works Summary .....................................................................................................57 Citizen Services Summary .................................................................................................58 Recreation and Culture Summary ......................................................................................59 General Government Summary .........................................................................................60 Conservation and Natural Resources Summary ................................................................63 Debt, Transfers and Reserves Summary ............................................................................64 Capital Fund Summary Capital Fund Summary Title Page .....................................................................................65 FY 19 – FY 21 Capital Fund Revenues .............................................................................67 Capital Fund Revenues – Graph ........................................................................................68 Capital Fund Revenues – Charts ........................................................................................69 FY 19 – FY 21 Capital Fund Appropriations ....................................................................70 FY 19 – FY 21 Capital Fund Appropriations – Expanded ................................................71 Capital Fund Appropriations – Graph................................................................................72 Capital Fund Appropriations – Charts ...............................................................................73 FY 21 Schedule of Reappropriations .................................................................................74 Community Investment Plan for Fiscal Year 21................................................................75 Capital Budget Summary Capital Budget Summary Title Page..................................................................................77 FY 21 – FY 26 Community Investment Plan ....................................................................79 Enterprise Funds Enterprise Funds Title Page ...............................................................................................87 Airport Enterprise Fund Title Page ....................................................................................89 Airport Summary ...............................................................................................................91 Airport Community Investment Plan FY 21 – FY 26........................................................92 Fiber Network Enterprise Fund Title Page ........................................................................93 Fiber Network Summary....................................................................................................95 Fiber Network Community Investment Plan FY 21 – FY 26 ............................................96 Firearms Enterprise Fund Title Page .................................................................................97 Firearms Summary .............................................................................................................99 Septage Enterprise Fund Title Page .................................................................................101 Septage Summary ............................................................................................................103 Solid Waste Enterprise Fund Title Page .........................................................................105 Solid Waste Summary......................................................................................................107 Utilities Enterprise Fund Title Page .................................................................................109 Utilities Summary ............................................................................................................111 Utilities Community Investment Plan FY 21 – FY 26 ....................................................112 FY 21 Enterprise Funds Schedule of Reappropriations ...................................................113
Grant Fund Grant Fund Title Page ......................................................................................................115 Grant Fund Summary .......................................................................................................117 FY 21 Program Summary by Function ............................................................................118 OPEB, Pension Trust and Special Revenue Funds OPEB, Pension Trust and Special Revenue Funds Title Page.........................................119 Other Post-Employment Benefits ....................................................................................121 Pension Trust Fund ..........................................................................................................122 Certified Law Officers Pension Trust Fund .....................................................................123 Length of Service Award Program Trust Fund................................................................124 Special Revenue Fund......................................................................................................125 Watershed Protection and Restoration Fund....................................................................126 Internal Service Funds Internal Service Funds Title Page ....................................................................................127 Fringe Benefits Internal Service Fund .............................................................................129 Risk Management Auto Damage Internal Service Fund ................................................130 Risk Management Insurance Deductible Internal Service Fund .....................................131 Risk Management Liability Internal Service Fund ..........................................................132 Risk Management Workers Compensation Internal Service Fund ..................................133 Position Summary Position Summary Title Page...........................................................................................135 Position Summary ............................................................................................................137 Authorized Position History ............................................................................................138

Board of County Commissioners
1

2
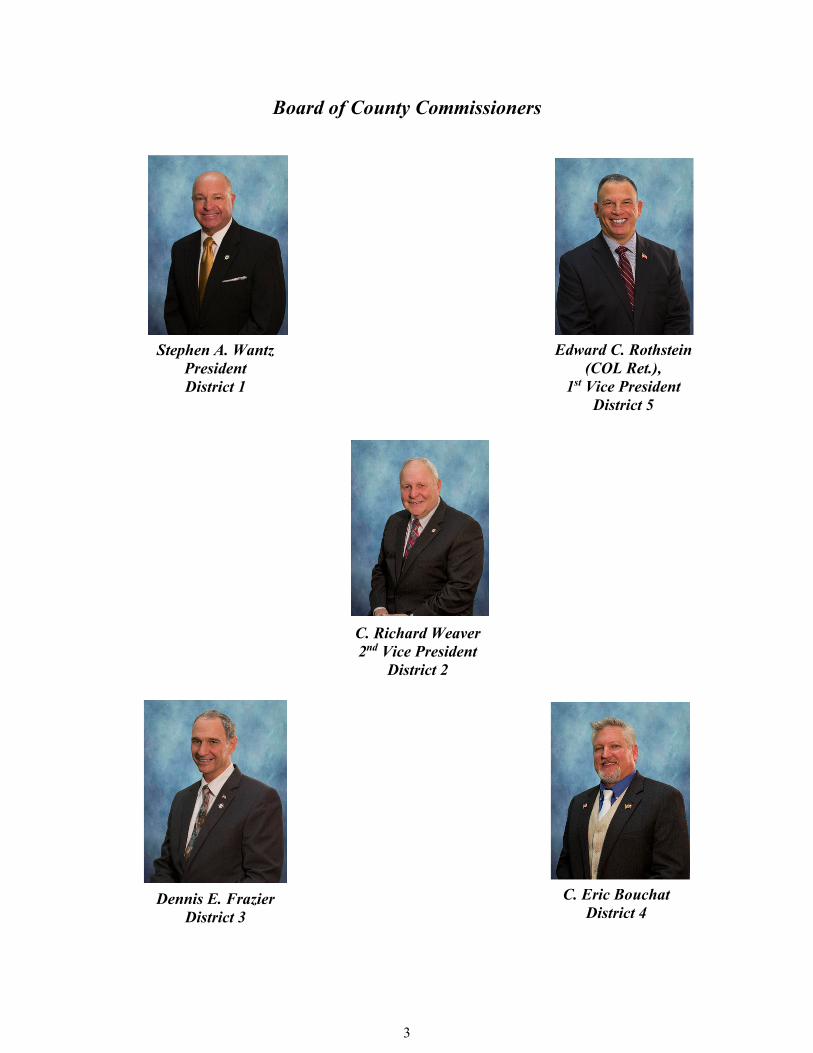
Board of County Commissioners
C. Richard Weaver 2nd Vice President
District 2
Stephen A. Wantz President District 1
Dennis E. Frazier District 3
C. Eric Bouchat District 4
Edward C. Rothstein (COL Ret.),
1st Vice President District 5
3

Appointed Officials
Roberta Windham County Administrator
Robert M. Burk
Comptroller
Timothy C. Burke County Attorney
Scott R. Campbell
Director of Public Safety
Jeffrey D. Castonguay Director of Public Works
Jeff R. Degitz
Director of Recreation and Parks
Thomas S. Devilbiss Director of Land and Resource Management
Lynda D. Eisenberg
Director of Comprehensive Planning
Kimberly L. Frock Director of Human Resources
John T. Lyburn
Director of Economic Development
Mark E. Ripper Director of Technology Services
Celene Steckel
Director of Citizen Services
Ted Zaleski, III Director of Management and Budget
4

Budget Message
5

6
Fiscal Year 2021 Proposed Budget Summary
A difficult decade, and then COVID-19
Like many local governments, Carroll County has never really recovered from the impact of the Great Recession. Carroll’s fiscal health though stabilized, never returned to robust growth. As the demand for and the cost of providing services, facilities and infrastructure have continued to grow revenues haven’t kept pace with average annual growth of just 1.5% since FY 10. Then… Covid-19 hit and changed everything. The impact of COVID-19
The most important impact of COVID-19 has, of course, been the spread of sickness and death. The resulting shutdown of businesses, schools and public gatherings has had a sudden and severe impact on Carroll’s revenues and expenditures. Preliminary estimates show a possible revenue loss of $4 million per month for as long as the shutdown continues. If the shutdown continues through the end of the fiscal year, FY 20 revenues could be $15 million short of budget.
In building this FY 21 Proposed Budget, a huge unknown was the impact of the COVID-19 shutdown on revenues and expenditures on FY 21. No one has that answer. Concerns are great enough that the Commissioners Proposed FY 21 Budget is slightly smaller than the current FY 20 Budget. It could be that events will play out in a way that results in a better outcome than the Budget suggests, but we believe there is more downside risk than there is upside hope.
We will need to proceed cautiously in FY 21. The Commissioners have suggested revisiting the budget in the fall when we have more information. We will hope that we have seen the end of the shutdown, but even if we do it will take time to get important revenue information. We don’t get the property tax reassessment until January and we don’t get our first big income tax distribution until the end of November. Questions will remain.
Every budget process is filled with uncertainty, but we have never had to deal with the uncertainty we face today.
The Total Budget
The General Fund, or what people often think of as the Operating Budget, gets most of the attention, but the County Budget includes thirteen funds. The All Funds budget is $565.5M, an increase of $17.5, or 3.2%, from FY 20. There are changes to every fund, but the increase is driven primarily by an expansion and modernization of Carroll County Public School’s Career and Technology facility and water and sewer upgrades in the Town of Sykesville.
7
The Operating Budget
The FY 21 Proposed Operating Budget is $417.6M, a $1.2M, or 0.03%, decrease from FY 20. The lack of growth in ongoing revenue is largely driven by negative impacts to income tax, our second largest revenue, recordation tax, and our investment income.
In the FY 21 Proposed Operating Budget most agencies have flat or declining budgets. The one notable exception is:
• $1.2M to Carroll County Public Schools to meet State-mandated Maintenance of Effort funding
Commissioner actions during Proposed Budget deliberations include:
• General Fund (Operating Budget) o Did not increase tax rates. o Reduced the General Fund transfer to the Solid Waste Enterprise Fund by
$467,000 in FY 21 and a planned $742,000/year in FY 23 and beyond. o Increased Development Review fee revenue by $342,000 per year. o Increased Permit fee revenue by $220,000 per year. o Capped property tax to the Agricultural Land Preservation Community
Investment Plan (CIP) program at $2.5 million per year. o Reduced Economic Development Infrastructure and Grants to $850,000 per
year. • Solid Waste Enterprise Fund
o Eliminated coupons increasing revenue by $192,000 per year. o Increased the tipping fee by $1 increasing revenue by $100,000 per year. o Established a $30 per ton recycling tipping fee increasing revenue by
$450,000 per year.
Multi-year balanced Operating Plan
Since the 1990s, Carroll has, in addition to adopting the budget, adopted a multi-year Operating Plan. The Plan makes it more difficult to make unsustainable budget decisions. Unfortunately, our current situation and extreme uncertainty will leave us with an unbalanced Plan. Once we get through the immediate and short-term impacts of COVID-19, we will face the additional challenge of figuring out how we move to a balanced position again.
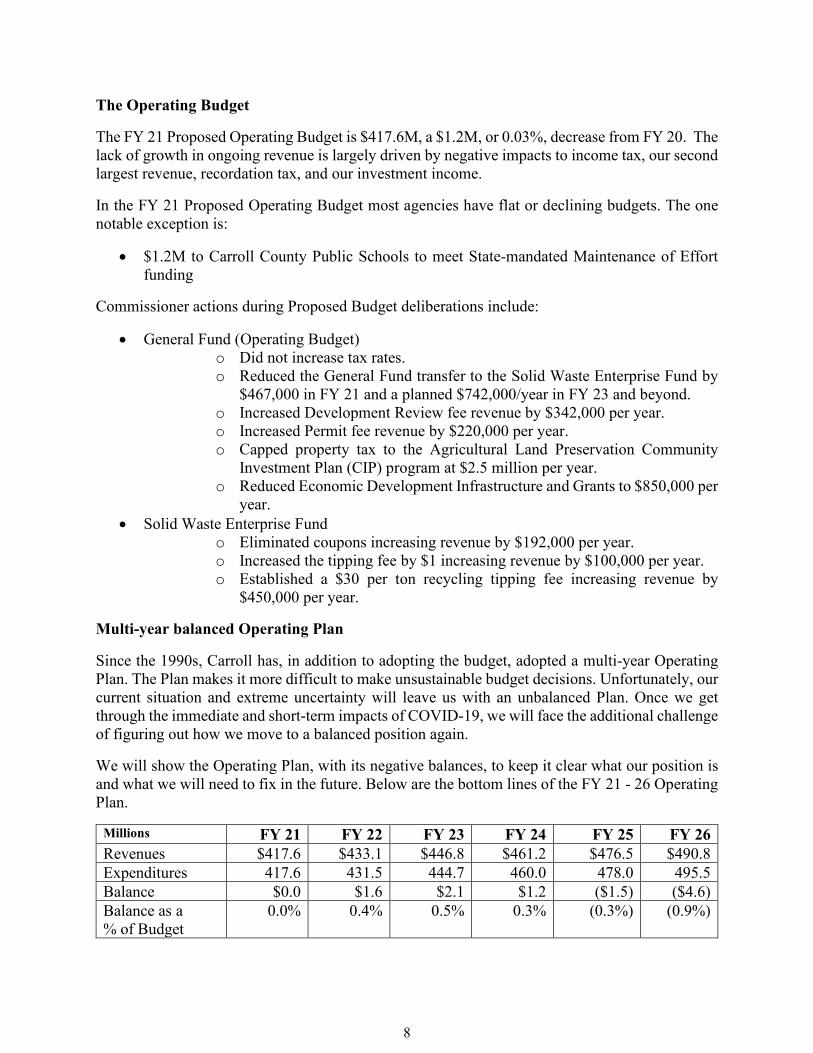
We will show the Operating Plan, with its negative balances, to keep it clear what our position is and what we will need to fix in the future. Below are the bottom lines of the FY 21 - 26 Operating Plan.
Millions FY 21 FY 22 FY 23 FY 24 FY 25 FY 26 Revenues $417.6 $433.1 $446.8 $461.2 $476.5 $490.8 Expenditures 417.6 431.5 444.7 460.0 478.0 495.5 Balance $0.0 $1.6 $2.1 $1.2 ($1.5) ($4.6) Balance as a % of Budget
0.0% 0.4% 0.5% 0.3% (0.3%) (0.9%)
8

County Highlights
Even after numerous years of troubled economic conditions and modest revenue growth, the County has many good things to talk about:
• Carroll County Public Schools continues to be among the most highly ranked systems in the highly ranked State of Maryland.
• Carroll County Public Library continues to have one of the highest circulation rates per capita in the State.
• Significant business and employment developments are progressing, creating the potential for high-quality job opportunities.
• Approximately 75,000 acres are under permanent easement in our Agricultural Land Preservation programs, supporting agribusiness and maintaining our rural heritage while avoiding the costs of services and infrastructure to serve residential development.
• Carroll continues to be highly rated by the credit rating agencies with three AAAs. We continue to see strong demand for our bonds.
Stay Informed The Commissioners continue to make their actions available for review and participation by the public. You can follow the budget, and other actions and discussions, through:
• Cable Channel 24 broadcasts • Carroll County’s YouTube channel • The County website with links to live and on demand video • Carroll Connect, the County’s email subscription service • Facebook, Twitter, and Instagram • A video archive of public meetings on the website • A Commissioner radio report broadcast live on WTTR on Sunday mornings and available
on the County website
All the FY 21 budget sessions, from the first Budget Overview to the release of the Proposed Budget, were open to the public and appeared on the local government channel. These videos remain available on the County website. Thank you for your interest in the Commissioners’ budget.
Ted Zaleski, Director
Management and Budget
9

10
Debt Management
11

12
Debt Management
Capital Expenditures vs. Current Expenditures
Local government expenditures can be broadly categorized as either current or capital. Generally, current expenditures are related to ongoing operations or purchases that are relatively inexpensive or short lived. Capital expenditures tend to be for one-time, relatively high costs, or for long-lived assets. There is not a perfectly clear line separating current and capital expenditures, but current expenditures should be funded with current sources of revenue and it may be appropriate to fund capital expenditures with current revenue and/or debt financing. When debt financing is used, it is important that the useful life of the asset exceed the time necessary to pay for the asset. Carroll County’s operating expenditures are entirely funded by current revenue. A mix of sources, such as bonds, grants, and paygo funding, is used to fund capital projects.
Paying for Capital Assets
There are two general approaches to paying for capital assets: paygo, or using current resources to pay as the expenditure occurs, and debt financing, paying over time as the asset is used. Paygo funding creates no long-term obligation, but may require years of saving, which delays addressing a need. Paygo funding places the entire burden on the existing taxpayer, even though a long-lived asset may benefit new taxpayers in future years. Debt financing commits the County to a long-term obligation and increases the cost of the funding but allows timely filling of needs and spreads the cost of an asset over a larger number of taxpayers who will benefit from its use. To benefit from the advantages of each of these approaches, Carroll County uses a mix of paygo and debt funding in the Capital Budget.
Bonds
For local governments, financing with long-term debt usually means issuing bonds. A bond is like a mortgage; it is written evidence of the issuer’s obligation to repay a specified principal amount on a certain date (maturity date), together with interest at a stated rate, or according to a formula for determining that rate.
General obligation bonds are used when the capital project is beneficial to the community. Examples would be expenditures for law enforcement, fire protection, education, community facilities, or roads and bridges. The payments are financed by the taxpayers of the issuing government because general obligation bonds are secured unconditionally by the full faith, credit, and taxing powers of the issuing government. These bonds typically carry high credit ratings with correspondingly low risk. Serial bonds are a package of individual bonds with each bond potentially having a different maturity than the rest. Typically, a municipal serial bond issue has maturities ranging from one year to more than twenty years. General obligation bond issues are usually entirely in serial form.
13
Debt Retirement As of June 30, 2019, 72.7% of long-term debt owed by the County will be retired within ten years and 41.0% will be retired in five years. New Public Improvement Bonds issued in November 2019 have an aggregate principal amount of $30.0 million of new bonds.
Rating Agencies There are currently three credit rating agencies used by Carroll County: Moody’s, Fitch, and Standard & Poor’s. These agencies tackle the difficult task of evaluating municipal bond issues in light of demographic, economic, financial, and debt factors. The result of the evaluation process is a “rating” that is assigned to the bond issue. Ratings generally measure the probability of the timely repayment of principal and interest on municipal bonds. The higher the credit rating assigned to the issue, the lower the interest rate the County will need to attract investors.
The following table displays the various rating categories used by the rating agencies: Moody’s1 Standard & Poor’s2 Fitch Description Aaa AAA AAA Highest quality, extremely
strong capacity to pay Aa AA AA High quality, very strong
capacity to pay A A A Upper medium quality,
strong capacity to pay Baa BBB BBB Medium quality, adequate
capacity to pay Ba BB BB Questionable quality, low
capacity to pay 1Relative ranking within a range may be designated by a 1, 2, or 3. 2Relative ranking within a range may be designated by a + or -.
Credit evaluation, to some extent, is subjective which may result in different analysts looking at different data or assigning different weight to the same data. The rating agencies do not necessarily give the same credit ratings to the same bond issues.
Ratings are initially made before issuance and are continuously reviewed and amended as necessary to reflect change in the issuer’s credit position. According to the rating agencies, Carroll County demonstrates very strong credit worthiness. Moody’s has assigned Carroll County a rating of Aaa, Standard & Poor’s AAA, and Fitch AAA. These high ratings allow Carroll County to benefit from lower interest rates for capital projects financed with long-term debt issues. The County’s goal is to maintain our current bond ratings in order to minimize borrowing costs.
14
Sale of Bonds Bonds are sold to investors through the services of an underwriter. Underwriters buy the entire bond issue from the issuer and then resell the individual bonds to investors. Since they assume the responsibility of distributing the bonds, they risk having to sell the bonds at a price below the purchase price and thus may realize a loss.
The financial advisor helps the issuer design the bond issue in terms of maturity dates, maturity amounts, and call provisions; prepares the official statement; selects an appropriate time to mark the issue; and complies with legal requirements.
Carroll County historically uses a competitive bid process to sell its bonds. This means that at a specified date and time, bids are accepted from various underwriters. The underwriter submitting the lowest bid (interest rate) is selected to purchase the bonds. Within a few days of the bond purchase, the underwriter sells the bonds to various investors.
Debt Affordability
Carroll County does not have a legal debt limit. The County uses a debt affordability model to evaluate the County’s ability to support debt. The model establishes guidelines for the amount of debt the County can initiate each year, and projects the effects of that financing through six years of the CIP.
Debt affordability measures a number of criteria, such as total debt to assessable base and debt service to General Fund revenue, and compares the projected ratios to guideline ratios. The model takes into account potential changes in revenue and interest. The model distinguishes between direct debt (i.e., debt to be paid with General Fund revenue) and indirect debt (i.e., debt that is backed by the government but with an associated revenue stream separate from the General Fund).
15
Prin
cipa
l
In
tere
st
Pri
ncip
al
Inte
rest
P
rinc
ipal
I
nter
est
Pri
ncip
al
Inte
rest
Pr
inci
pal
In
tere
st
T
otal
Deb
t Se
rvic
e
Prin
cipa
l
Inte
rest
Tot
al D
ebt S
ervi
ce
2021
22
,594
,090
8
,322
,575
823
,847
4
83,5
82
39
1,24
5
1
01,4
61
-
1,8
42,3
03
23
,809
,182
10,
749,
921
34
,559
,103
1
,476
,008
371,
766
1,84
7,77
4
36,4
06,8
77
2022
19
,083
,166
7
,400
,643
826
,589
4
47,3
27
34
4,96
6
91,0
64
2
46,0
00
1,8
42,3
03
20
,500
,721
9
,781
,337
30,2
82,0
58
1,4
17,9
55
30
2,39
8
1,
720,
353
32
,002
,411
2023
18
,181
,458
6
,571
,866
830
,634
4
10,1
41
39
1,97
1
82,3
29
6
80,9
30
1,8
10,8
58
20
,084
,993
8
,875
,194
28,9
60,1
87
1,3
08,1
07
26
4,77
3
1,
572,
880
30
,533
,067
2024
17
,394
,919
5
,771
,886
832
,100
3
70,3
35
40
1,97
5
73,0
26
1,0
06,6
24
1,7
90,5
44
19
,635
,618
8
,005
,791
27,6
41,4
09
5,4
83,7
37
22
1,66
0
5,
705,
397
33
,346
,806
2025
15
,495
,876
5
,031
,242
799
,178
3
31,1
81
41
1,50
5
63,4
96
2,1
79,9
34
1,6
80,5
77
18
,886
,493
7
,106
,496
25,9
92,9
89
4
95,7
22
9
2,69
2
588,
414
26
,581
,403
2026
15
,856
,330
4
,381
,285
801
,873
2
96,3
34
42
1,26
1
53,7
40
1,3
46,0
00
1,6
12,3
52
18
,425
,464
6
,343
,711
24,7
69,1
75
5
20,7
83
7
1,57
1
592,
354
25
,361
,529
2027
16
,131
,358
3
,768
,237
804
,802
2
64,0
38
43
1,24
8
43,7
52
2,5
84,0
00
1,5
65,4
65
19
,951
,408
5
,641
,492
25,5
92,9
00
5
43,7
01
5
3,69
8
597,
399
26
,190
,299
2028
16
,486
,489
3
,149
,247
807
,649
2
33,3
87
44
1,47
2
33,5
28
-
1,4
28,4
85
17
,735
,610
4
,844
,647
22,5
80,2
57
5
66,6
30
3
5,03
7
601,
667
23
,181
,924
2029
16
,865
,261
2
,510
,700
810
,343
2
02,7
37
45
1,93
8
23,0
62
1
07,2
90
1,4
28,4
85
18
,234
,832
4
,164
,984
22,3
99,8
16
5
91,1
05
1
5,56
1
606,
666
23
,006
,482
2030
13
,065
,641
1
,917
,138
813
,427
1
71,9
16
46
2,65
3
12,3
47
4,6
62,4
30
1,3
47,3
57
19
,004
,151
3
,448
,758
22,4
52,9
09
1
13,6
15
2,9
74
11
6,58
9
22,5
69,4
98
2031
9
,710
,021
1
,459
,034
765
,472
1
41,9
76
23
5,42
4
2,0
77
1
3,11
5,50
0
974
,376
23,8
26,4
17
2,5
77,4
63
26
,403
,880
2,77
1
68
2
,839
26,4
06,7
19
2032
8
,387
,644
1
,141
,978
757
,356
1
15,8
82
-
-
-
3
91,4
16
9
,145
,000
1
,649
,276
10,7
94,2
76
-
-
-
10,7
94,2
76
2033
7
,161
,427
899
,711
728
,573
92,
802
-
-
445
,320
379
,726
8,3
35,3
20
1,3
72,2
39
9
,707
,559
-
-
-
9
,707
,559
2034
6
,136
,903
686
,012
678
,098
70,
566
-
-
3
,475
,344
368
,037
10,2
90,3
45
1,1
24,6
15
11
,414
,960
-
-
-
11
,414
,960
2035
4
,975
,395
509
,327
579
,605
50,
873
-
-
-
1
85,5
81
5
,555
,000
745
,781
6,3
00,7
81
-
-
-
6,3
00,7
81
2036
4
,332
,360
363
,924
472
,640
34,
570
-
-
473
,924
173
,140
5,2
78,9
24
5
71,6
34
5
,850
,558
-
-
-
5
,850
,558
2037
3
,144
,080
246
,652
305
,920
22,
598
-
-
1
,303
,000
128
,125
4,7
53,0
00
3
97,3
75
5
,150
,375
-
-
-
5
,150
,375
2038
2
,522
,500
157
,922
227
,500
14,
578
-
-
-
95,
550
2
,750
,000
268
,050
3,0
18,0
50
-
-
-
3,0
18,0
50
2039
2
,522
,500
77
,672
227
,500
7,
641
-
-
887
,000
7
3,37
5
3,6
37,0
00
1
58,6
88
3
,795
,688
-
-
-
3
,795
,688
2040
1
,350
,000
18
,563
150
,000
2,
062
-
-
1
,024
,000
5
1,20
0
2,5
24,0
00
71,8
25
2
,595
,825
-
-
-
2
,595
,825
2041
-
-
-
-
-
-
-
-
-
-
-
-
-
-
-
Tota
l $
2
21,3
97,4
18
$ 5
4,38
5,61
4 $
13
,043
,106
$
3,7
64,5
26
$
4,38
5,65
8 $
5
79,8
82
$ 3
3,53
7,29
6 $
19
,169
,255
$
2
72,3
63,4
78
$ 7
7,89
9,27
7 $
3
50,2
62,7
55
$
12,5
20,1
34
$
1,43
2,19
8 $
13,
952,
332
$
364
,215
,087
Sour
ce: C
arro
ll C
ount
y D
epar
tmen
t of t
he C
ompt
rolle
r.
Sche
dule
of D
ebt S
ervi
ce R
equi
rem
ents
on
Dir
ect C
ount
y D
ebt
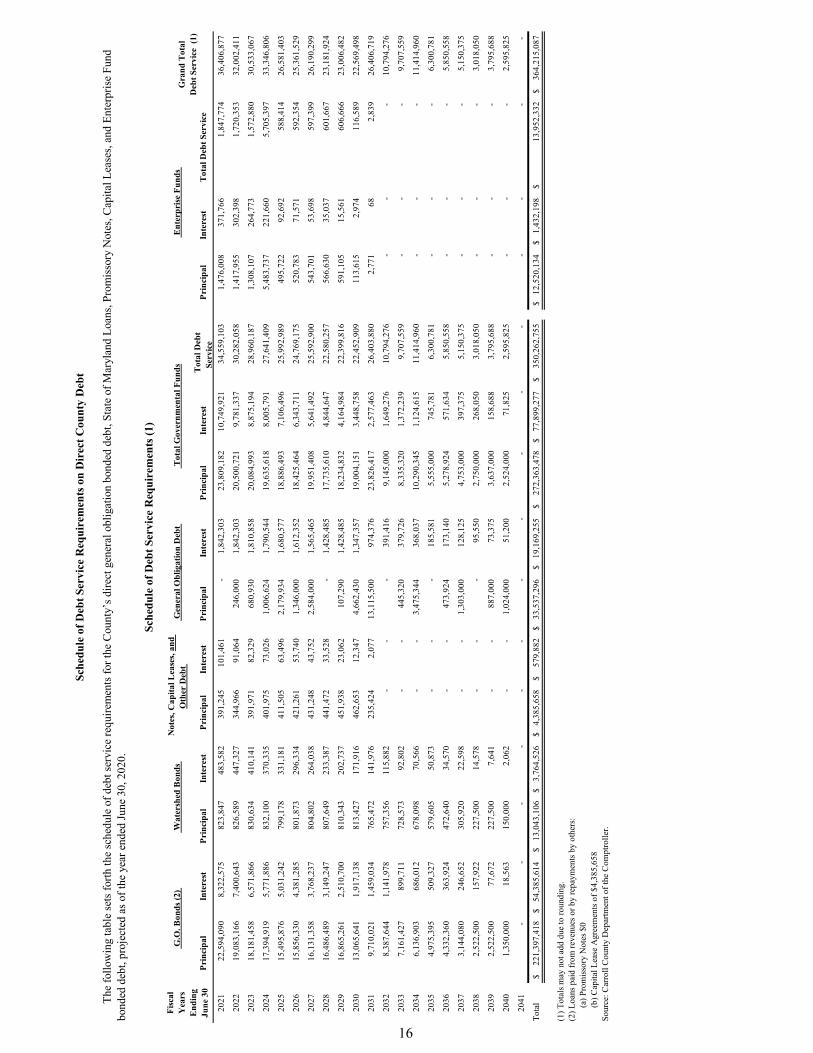
The
follo
win
g ta
ble
sets
forth
the
sche
dule
of d
ebt s
ervi
ce re
quire
men
ts fo
r the
Cou
nty’
s dire
ct g
ener
al o
blig
atio
n bo
nded
deb
t, St
ate
of M
aryl
and
Loan
s, Pr
omis
sory
Not
es, C
apita
l Lea
ses,
and
Ente
rpris
e Fu
nd
bond
ed d
ebt,
proj
ecte
d as
of t
he y
ear e
nded
June
30,
202
0.
Sche
dule
of D
ebt S
ervi
ce R
equi
rem
ents
(1)
Fisc
al
Y
ears
E
ndin
g Ju
ne 3
0
G.O
. Bon
ds (2
) W
ater
shed
Bon
ds
Not
es, C
apita
l Lea
ses,
and
Oth
er D
ebt
Gen
eral
Obl
igat
ion
Deb
t T
otal
Gov
ernm
enta
l Fun
ds E
nter
prise
Fun
ds
Gra
nd T
otal
D
ebt S
ervi
ce (
1)
(1) T
otal
s may
not
add
due
to ro
undi
ng.
(2) L
oans
pai
d fr
om re
venu
es o
r by
repa
ymen
ts by
oth
ers:
(a) P
rom
issor
y N
otes
$0
(b) C
apita
l Lea
se A
gree
men
ts of
$4,
385,
658
16
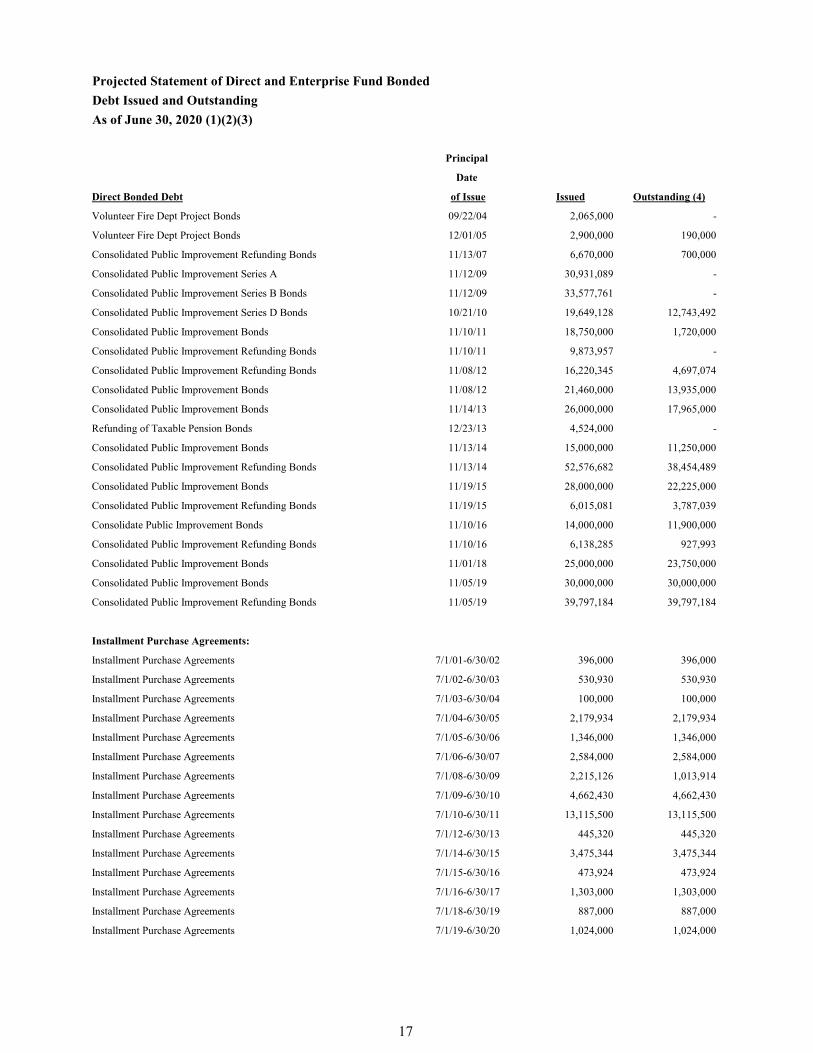
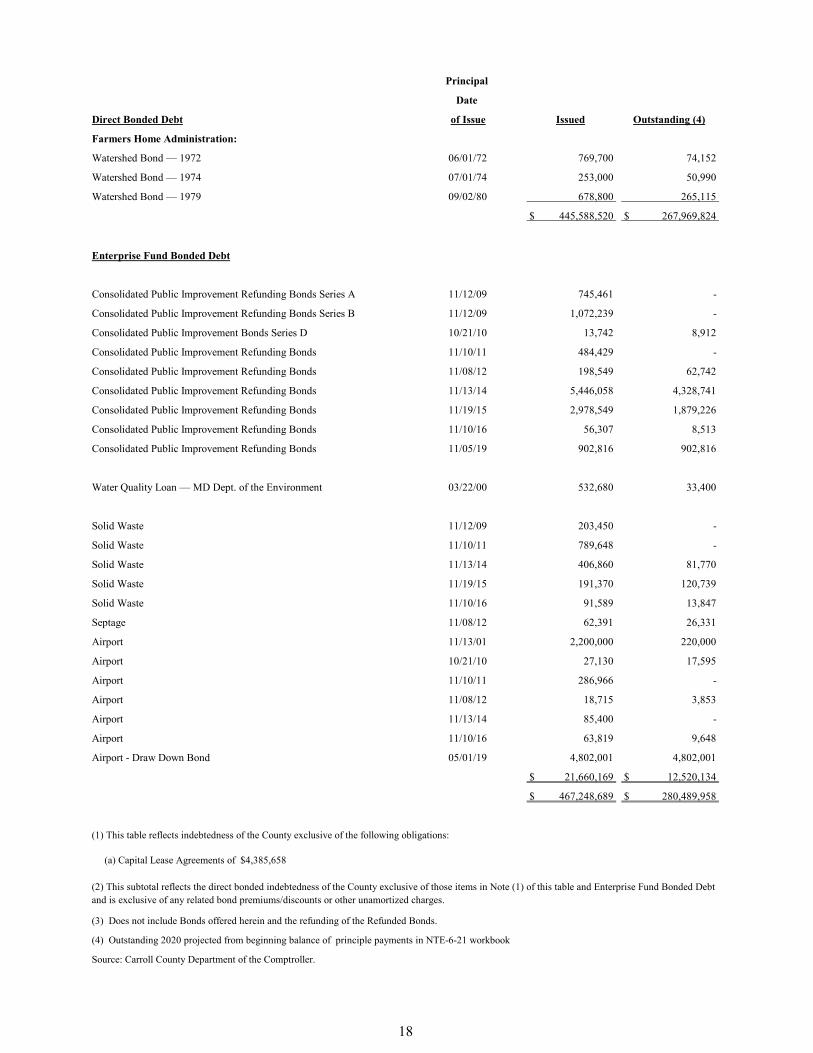
Projected Statement of Direct and Enterprise Fund BondedDebt Issued and OutstandingAs of June 30, 2020 (1)(2)(3)
Principal
Date
Direct Bonded Debt of Issue Issued Outstanding (4)
Volunteer Fire Dept Project Bonds 09/22/04 2,065,000 -
Volunteer Fire Dept Project Bonds 12/01/05 2,900,000 190,000
Consolidated Public Improvement Refunding Bonds 11/13/07 6,670,000 700,000
Consolidated Public Improvement Series A 11/12/09 30,931,089 -
Consolidated Public Improvement Series B Bonds 11/12/09 33,577,761 -
Consolidated Public Improvement Series D Bonds 10/21/10 19,649,128 12,743,492
Consolidated Public Improvement Bonds 11/10/11 18,750,000 1,720,000
Consolidated Public Improvement Refunding Bonds 11/10/11 9,873,957 -
Consolidated Public Improvement Refunding Bonds 11/08/12 16,220,345 4,697,074
Consolidated Public Improvement Bonds 11/08/12 21,460,000 13,935,000
Consolidated Public Improvement Bonds 11/14/13 26,000,000 17,965,000
Refunding of Taxable Pension Bonds 12/23/13 4,524,000 -
Consolidated Public Improvement Bonds 11/13/14 15,000,000 11,250,000
Consolidated Public Improvement Refunding Bonds 11/13/14 52,576,682 38,454,489
Consolidated Public Improvement Bonds 11/19/15 28,000,000 22,225,000
Consolidated Public Improvement Refunding Bonds 11/19/15 6,015,081 3,787,039
Consolidate Public Improvement Bonds 11/10/16 14,000,000 11,900,000
Consolidated Public Improvement Refunding Bonds 11/10/16 6,138,285 927,993
Consolidated Public Improvement Bonds 11/01/18 25,000,000 23,750,000
Consolidated Public Improvement Bonds 11/05/19 30,000,000 30,000,000
Consolidated Public Improvement Refunding Bonds 11/05/19 39,797,184 39,797,184
Installment Purchase Agreements:
Installment Purchase Agreements 7/1/01-6/30/02 396,000 396,000
Installment Purchase Agreements 7/1/02-6/30/03 530,930 530,930
Installment Purchase Agreements 7/1/03-6/30/04 100,000 100,000
Installment Purchase Agreements 7/1/04-6/30/05 2,179,934 2,179,934
Installment Purchase Agreements 7/1/05-6/30/06 1,346,000 1,346,000
Installment Purchase Agreements 7/1/06-6/30/07 2,584,000 2,584,000
Installment Purchase Agreements 7/1/08-6/30/09 2,215,126 1,013,914
Installment Purchase Agreements 7/1/09-6/30/10 4,662,430 4,662,430
Installment Purchase Agreements 7/1/10-6/30/11 13,115,500 13,115,500
Installment Purchase Agreements 7/1/12-6/30/13 445,320 445,320
Installment Purchase Agreements 7/1/14-6/30/15 3,475,344 3,475,344
Installment Purchase Agreements 7/1/15-6/30/16 473,924 473,924
Installment Purchase Agreements 7/1/16-6/30/17 1,303,000 1,303,000
Installment Purchase Agreements 7/1/18-6/30/19 887,000 887,000
Installment Purchase Agreements 7/1/19-6/30/20 1,024,000 1,024,000
17
Principal
Date
Direct Bonded Debt of Issue Issued Outstanding (4)
Farmers Home Administration:
Watershed Bond — 1972 06/01/72 769,700 74,152
Watershed Bond — 1974 07/01/74 253,000 50,990
Watershed Bond — 1979 09/02/80 678,800 265,115
$ 445,588,520 $ 267,969,824
Enterprise Fund Bonded Debt
Consolidated Public Improvement Refunding Bonds Series A 11/12/09 745,461 -
Consolidated Public Improvement Refunding Bonds Series B 11/12/09 1,072,239 -
Consolidated Public Improvement Bonds Series D 10/21/10 13,742 8,912
Consolidated Public Improvement Refunding Bonds 11/10/11 484,429 -
Consolidated Public Improvement Refunding Bonds 11/08/12 198,549 62,742
Consolidated Public Improvement Refunding Bonds 11/13/14 5,446,058 4,328,741
Consolidated Public Improvement Refunding Bonds 11/19/15 2,978,549 1,879,226
Consolidated Public Improvement Refunding Bonds 11/10/16 56,307 8,513
Consolidated Public Improvement Refunding Bonds 11/05/19 902,816 902,816
Water Quality Loan — MD Dept. of the Environment 03/22/00 532,680 33,400
Solid Waste 11/12/09 203,450 -
Solid Waste 11/10/11 789,648 -
Solid Waste 11/13/14 406,860 81,770
Solid Waste 11/19/15 191,370 120,739
Solid Waste 11/10/16 91,589 13,847
Septage 11/08/12 62,391 26,331
Airport 11/13/01 2,200,000 220,000
Airport 10/21/10 27,130 17,595
Airport 11/10/11 286,966 -
Airport 11/08/12 18,715 3,853
Airport 11/13/14 85,400 -
Airport 11/10/16 63,819 9,648
Airport - Draw Down Bond 05/01/19 4,802,001 4,802,001
$ 21,660,169 $ 12,520,134
$ 467,248,689 $ 280,489,958
Source: Carroll County Department of the Comptroller.
(1) This table reflects indebtedness of the County exclusive of the following obligations:
(a) Capital Lease Agreements of $4,385,658
(2) This subtotal reflects the direct bonded indebtedness of the County exclusive of those items in Note (1) of this table and Enterprise Fund Bonded Debt and is exclusive of any related bond premiums/discounts or other unamortized charges.
(3) Does not include Bonds offered herein and the refunding of the Refunded Bonds.
(4) Outstanding 2020 projected from beginning balance of principle payments in NTE-6-21 workbook
18
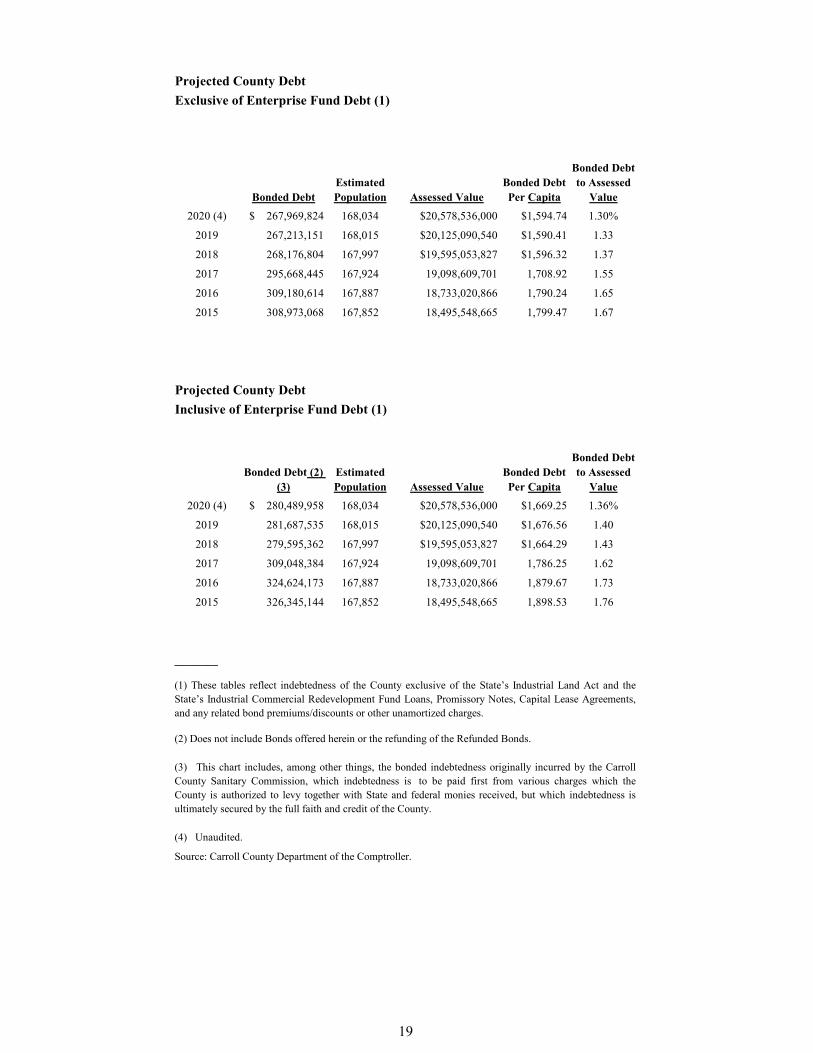
Projected County DebtExclusive of Enterprise Fund Debt (1)
2020 (4) $ 267,969,824 168,034 $20,578,536,000 $1,594.74 1.30%
2019 267,213,151 168,015 $20,125,090,540 $1,590.41 1.33
2018 268,176,804 167,997 $19,595,053,827 $1,596.32 1.37
2017 295,668,445 167,924 19,098,609,701 1,708.92 1.55
2016 309,180,614 167,887 18,733,020,866 1,790.24 1.65
2015 308,973,068 167,852 18,495,548,665 1,799.47 1.67
Projected County DebtInclusive of Enterprise Fund Debt (1)
2020 (4) $ 280,489,958 168,034 $20,578,536,000 $1,669.25 1.36%
2019 281,687,535 168,015 $20,125,090,540 $1,676.56 1.40
2018 279,595,362 167,997 $19,595,053,827 $1,664.29 1.43
2017 309,048,384 167,924 19,098,609,701 1,786.25 1.62
2016 324,624,173 167,887 18,733,020,866 1,879.67 1.73
2015 326,345,144 167,852 18,495,548,665 1,898.53 1.76
________
(1) These tables reflect indebtedness of the County exclusive of the State’s Industrial Land Act and theState’s Industrial Commercial Redevelopment Fund Loans, Promissory Notes, Capital Lease Agreements,and any related bond premiums/discounts or other unamortized charges.
(2) Does not include Bonds offered herein or the refunding of the Refunded Bonds.
(3) This chart includes, among other things, the bonded indebtedness originally incurred by the CarrollCounty Sanitary Commission, which indebtedness is to be paid first from various charges which theCounty is authorized to levy together with State and federal monies received, but which indebtedness isultimately secured by the full faith and credit of the County.
(4) Unaudited.
Source: Carroll County Department of the Comptroller.
Bonded Debt to Assessed
Value
Bonded DebtEstimated Population Assessed Value
Bonded Debt Per Capita
Bonded Debt to Assessed
Value
Bonded Debt (2) (3)
Estimated Population Assessed Value
Bonded Debt Per Capita
19
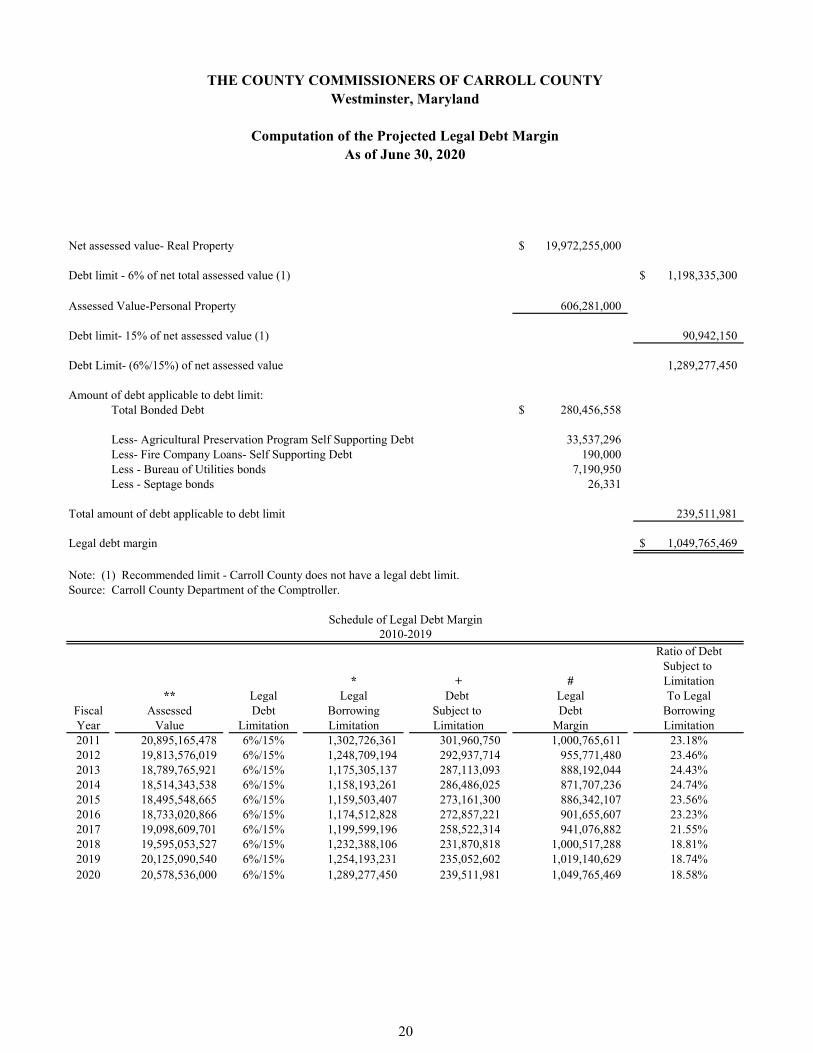
Net assessed value- Real Property 19,972,255,000$
Debt limit - 6% of net total assessed value (1) 1,198,335,300$
Assessed Value-Personal Property 606,281,000
Debt limit- 15% of net assessed value (1) 90,942,150
Debt Limit- (6%/15%) of net assessed value 1,289,277,450
Amount of debt applicable to debt limit:Total Bonded Debt 280,456,558$
Less- Agricultural Preservation Program Self Supporting Debt 33,537,296Less- Fire Company Loans- Self Supporting Debt 190,000Less - Bureau of Utilities bonds 7,190,950Less - Septage bonds 26,331
Total amount of debt applicable to debt limit 239,511,981
Legal debt margin 1,049,765,469$
Note: (1) Recommended limit - Carroll County does not have a legal debt limit.Source: Carroll County Department of the Comptroller.
Ratio of DebtSubject to
* + # Limitation** Legal Legal Debt Legal To Legal
Fiscal Assessed Debt Borrowing Subject to Debt BorrowingYear Value Limitation Limitation Limitation Margin Limitation2011 20,895,165,478 6%/15% 1,302,726,361 301,960,750 1,000,765,611 23.18%2012 19,813,576,019 6%/15% 1,248,709,194 292,937,714 955,771,480 23.46%2013 18,789,765,921 6%/15% 1,175,305,137 287,113,093 888,192,044 24.43%2014 18,514,343,538 6%/15% 1,158,193,261 286,486,025 871,707,236 24.74%2015 18,495,548,665 6%/15% 1,159,503,407 273,161,300 886,342,107 23.56%2016 18,733,020,866 6%/15% 1,174,512,828 272,857,221 901,655,607 23.23%2017 19,098,609,701 6%/15% 1,199,599,196 258,522,314 941,076,882 21.55%2018 19,595,053,527 6%/15% 1,232,388,106 231,870,818 1,000,517,288 18.81%2019 20,125,090,540 6%/15% 1,254,193,231 235,052,602 1,019,140,629 18.74%2020 20,578,536,000 6%/15% 1,289,277,450 239,511,981 1,049,765,469 18.58%
2010-2019
THE COUNTY COMMISSIONERS OF CARROLL COUNTYWestminster, Maryland
Computation of the Projected Legal Debt MarginAs of June 30, 2020
Schedule of Legal Debt Margin
20
Fund Balance
21

22
Explanation of Fund Balance Governmental funds report the difference between their assets and liabilities as fund balance. In February 2009, The Governmental Accounting Standards Board (GASB) issued Statement No. 54, Fund Balance Reporting and Governmental Fund Type Definitions, requiring implementation by June 30, 2011. This GASB standard does not affect the calculation of fund balance, but fundamentally alters the various components used to report it. Fund balance is now divided as follows:
1. Nonspendable 2. Restricted 3. Committed 4. Assigned 5. Unassigned
Nonspendable funds are not in a spendable form or must be maintained intact. Examples are inventories, prepaid expenses, and loans to various agencies. Restricted funds can be used only for the specific purposes as stipulated by external creditors, grantors, or laws of other governments; constitutionally; or through enabling legislation. Committed funds are those constrained by limitations that the government imposes on itself at the highest level of decision-making authority. Commitments may be changed or lifted only by the same formal action that imposed the original constraint. Assigned funds are intended to be used by the government for a specific purpose. This intention can be expressed by the governing body, an official, or a body to which the governing body delegates the authority. Unassigned funds are technically available for any purpose. Carroll’s consists of anticipated current year unassigned funds.
23

Actual for 6/30/19 Projected for 6/30/20 ProjectedAudited - CAFR as of 4/22/20 for 6/30/21
Beginning Fund Balance $112,740,625 $117,550,515 $100,864,568Revenues 410,767,448 393,979,383 413,189,293Expenditures -406,844,558 -410,665,330 -417,611,000GO Bond Proceeds, Premium, and Redemption 887,000 0 0Projected Ending Fund Balance $117,550,515 $100,864,568 $96,442,861
NonspendableInventory 1,831,223 1,831,223 1,831,223Prepaid Expenses 7,234,856 7,234,856 7,234,856Loans for Economic Development 4,373,072 4,373,072 4,373,072Loans to Volunteer Fire Companies 7,186,625 7,186,625 7,186,625Loans to Municipalities 149,037 149,037 149,037Advances to Industrial Development Authority 612,910 612,910 612,910Due from other Governmental Funds 7,864,134 7,864,134 7,864,134Total Nonspendable 29,251,857 29,251,857 29,251,857
RestrictedWeed Control Future Equipment Purchases 179,704 179,704 152,204Agricultural Preservation Payables 28,791,572 28,791,572 28,791,572Loans Collectible Within One Year 1,160,347 1,160,347 1,160,347Farmers & Merchants - Collateral 230,000 230,000 230,000Total Restricted 30,361,623 30,361,623 30,334,123
CommittedStabilization Fund 20,940,467 20,880,550 20,880,550Total Committed 20,940,467 20,880,550 20,880,550
AssignedAppropriation of Prior Year Unassigned Fund Balance 19,193,601 8,710,647 4,288,940Community Media Center/Gamber Fire Co/CCPL 2,506,478 2,479,718 2,480,000Encumbrances 1,745,330 2,100,000 2,100,000Total Assigned 23,445,409 13,290,365 8,868,940
UnassignedUnassigned 13,551,159 7,080,173 7,107,392Total Unassigned 13,551,159 7,080,173 7,107,392
SummaryEnding Fund Balance 117,550,515 100,864,568 96,442,861Less: Nonspendable (29,251,857) (29,251,857) (29,251,857)Less: Restricted (30,361,623) (30,361,623) (30,334,123)Less: Committed (20,940,467) (20,880,550) (20,880,550)Less: Assigned (23,445,409) (13,290,365) (8,868,940)Current Year Unassigned $13,551,159 $7,080,173 $7,107,392
Fund Balance
General FundSchedule of Changes in Fund Balance
24
Total Budget Summary
25

26
CategoryFY 19
ActualsFY 20 Budget
Change from FY 19
FY 21 Budget
Change from FY 20
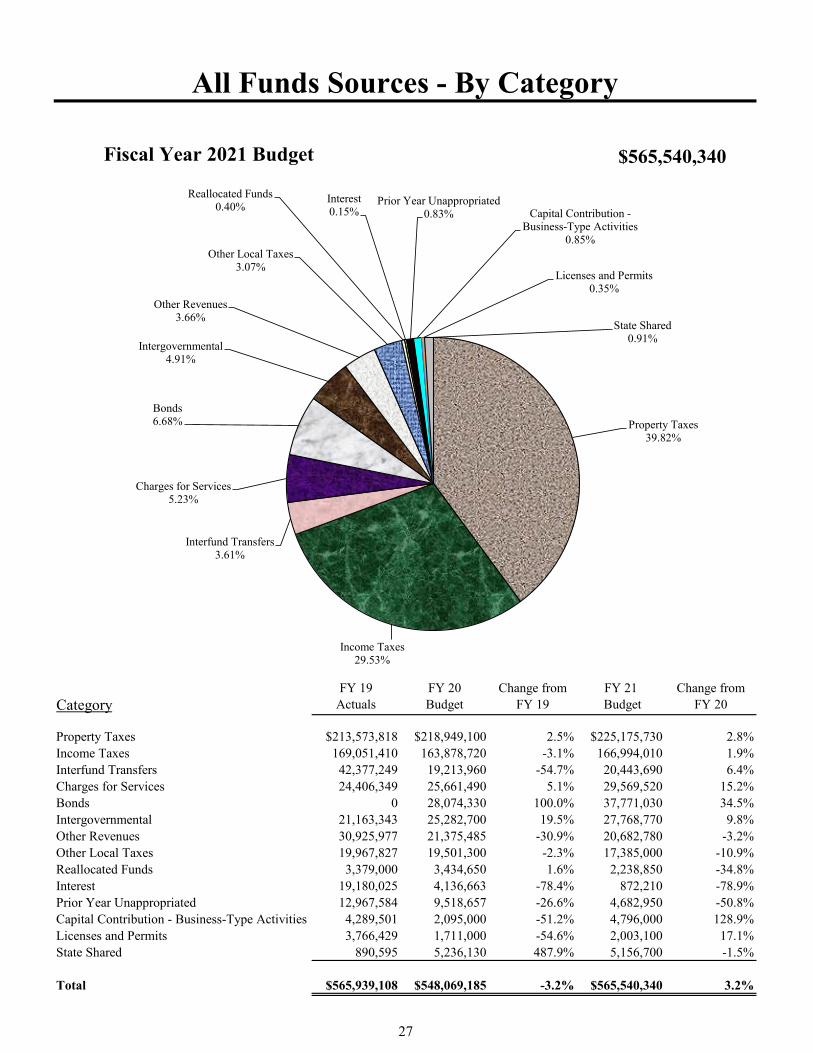
Property Taxes $213,573,818 $218,949,100 2.5% $225,175,730 2.8%Income Taxes 169,051,410 163,878,720 -3.1% 166,994,010 1.9%Interfund Transfers 42,377,249 19,213,960 -54.7% 20,443,690 6.4%Charges for Services 24,406,349 25,661,490 5.1% 29,569,520 15.2%Bonds 0 28,074,330 100.0% 37,771,030 34.5%Intergovernmental 21,163,343 25,282,700 19.5% 27,768,770 9.8%Other Revenues 30,925,977 21,375,485 -30.9% 20,682,780 -3.2%Other Local Taxes 19,967,827 19,501,300 -2.3% 17,385,000 -10.9%Reallocated Funds 3,379,000 3,434,650 1.6% 2,238,850 -34.8%Interest 19,180,025 4,136,663 -78.4% 872,210 -78.9%Prior Year Unappropriated 12,967,584 9,518,657 -26.6% 4,682,950 -50.8%Capital Contribution - Business-Type Activities 4,289,501 2,095,000 -51.2% 4,796,000 128.9%Licenses and Permits 3,766,429 1,711,000 -54.6% 2,003,100 17.1%State Shared 890,595 5,236,130 487.9% 5,156,700 -1.5%
Total $565,939,108 $548,069,185 -3.2% $565,540,340 3.2%
All Funds Sources - By Category
Property Taxes39.82%
Income Taxes29.53%
Interfund Transfers3.61%
Charges for Services5.23%
Bonds 6.68%
Intergovernmental4.91%
Other Revenues3.66%
Other Local Taxes3.07%
Reallocated Funds0.40%
Interest 0.15%
Prior Year Unappropriated 0.83% Capital Contribution -
Business-Type Activities0.85%
Licenses and Permits0.35%
State Shared0.91%
Fiscal Year 2021 Budget $565,540,340
27

CategoryFY 19Actual
FY 20Budget
Change fromFY 19
FY 21Budget
Change fromFY 20
Education $222,871,877 $239,380,220 7.4% $251,018,696 4.9%Public Safety and Corrections 64,927,017 53,355,477 -17.8% 53,520,280 0.3%Education Other 31,732,153 21,146,370 -33.4% 21,110,380 -0.2%Public Works 43,671,721 48,807,100 11.8% 48,699,240 -0.2%Culture and Recreation 4,310,734 4,823,680 11.9% 5,030,270 4.3%Citizen Services 20,608,292 19,078,038 -7.4% 19,599,680 2.7%General Government 41,837,687 81,392,070 94.5% 79,628,964 -2.2%Conservation and Natural Resources 12,833,446 9,465,430 -26.2% 9,188,750 -2.9%Business-Type Activities 22,224,301 26,010,730 17.0% 34,260,020 31.7%Debt, Transfers, and Reserves 41,287,196 44,610,070 8.0% 43,484,060 -2.5%
Total $506,304,424 $548,069,185 8.2% $565,540,340 3.2%
All Funds Uses - By Category
Education44.39%
Public Safety and Corrections
9.46%
Education Other3.73%
Public Works8.61%
Culture and Recreation0.89%
Citizen Services3.47%
General Government14.08%
Conservation and Natural Resources
1.62%
Business-Type Activities6.06%
Debt, Transfers, and Reserves
7.69%
Fiscal Year 2021 Budget $565,540,340
28

FundFY 19Actual
FY 20Budget
Change from FY 19
FY 21 Budget
Change from FY 20
General $406,749,056 $418,809,330 3.0% $417,611,000 -0.3%Capital 48,669,835 65,792,709 35.2% 74,902,140 13.8%Utilities 11,194,425 15,077,020 34.7% 21,626,710 43.4%Grant 16,828,919 16,405,796 -2.5% 17,654,760 7.6%Solid Waste 8,199,955 8,224,770 0.3% 9,575,810 16.4%OPEB 5,320,680 13,093,310 146.1% 13,216,510 0.9%Pension 3,037,839 4,487,350 47.7% 4,313,550 -3.9%Airport 985,628 1,030,990 4.6% 1,228,650 19.2%Special Revenue 2,635,907 3,071,960 16.5% 3,184,360 3.7%Septage 1,264,073 1,073,750 -15.1% 1,090,400 1.6%Firearms 204,850 159,200 -22.3% 314,140 97.3%Fiber Network 375,370 445,000 18.5% 424,310 -4.6%LOSAP 837,887 398,000 -52.5% 398,000 0.0%
Total $506,304,424 $548,069,185 8.2% $565,540,340 3.2%
All Funds Uses - By Fund
General73.84%
Capital13.24%
Utilities3.82%
Grant3.12%
Solid Waste1.69%
OPEB2.34%
Pension0.76%
Airport0.22%
Special Revenue0.56%
Septage0.19%
Firearms0.06%
Fiber Network0.08%
LOSAP0.07%
Fiscal Year 2021 Budget $565,540,340
29

All Funds Revenue Summary
All Funds revenue is projected to be $565.5M in FY 21 with 69.3% of this amount coming from Property Taxes and Income Tax. Total revenue is $17.5M, or 3.2%, above FY 20. Increases in property taxes and income taxes are offset by declines in use of prior year unappropriated, interest income, and other local taxes. The total budget is increasing primarily due to the replacement Career and Technology Center and water and sewer upgrades in the Town of Sykesville.
Revenue In Millions FY 19Budget
Percent of Total
FY 20Budget
Percent of Total
FY 21Budget
Percent of Total
Property Taxes $212.8 37.4% $218.9 35.9% $225.2 39.8%
Income Taxes 161.0 28.3% 163.9 27.5% 167.0 29.5%
Bonds 29.1 5.1% 28.1 5.0% 37.8 6.7%
Charges for Services 25.8 4.5% 25.7 4.3% 29.6 5.2%
Intergovernmental 31.4 5.5% 25.3 4.7% 27.8 4.9%
Interfund Transfers 19.0 3.3% 19.2 4.0% 20.4 3.6%
Other Revenues 20.5 3.6% 21.4 3.7% 20.7 3.7%
Other Local Taxes 18.6 3.3% 19.5 3.1% 17.4 3.1%
Prior Year Unappropriated 13.0 2.3% 9.5 2.0% 4.7 0.8%
Capital Contribution - Business-Type Activities
0.7 0.1% 2.1 7.3% 4.8 0.8%
State Shared 4.4 0.8% 5.2 0.5% 5.2 0.9%
Reallocated Funds 27.5 4.8% 3.4 1.2% 2.2 0.4%
Licenses and Permits 1.6 0.3% 1.7 0.3% 2.0 0.4%
Interest 3.7 0.7% 4.1 0.5% 0.9 0.2%
Total Revenue $569.0 100% $548.1 100% $565.5 100%
Percentages may not add to 100% due to rounding
30
General Fund Summary
31

32

CategoryFY 19
ActualsFY 20 Budget
Change from FY 19
FY 21 Budget
Change from FY 20
Property Taxes $208,315,929 $214,244,760 2.8% $220,266,083 2.8%Income Taxes 155,378,135 151,798,000 -2.3% 154,622,849 1.9%Prior Year Unappropriated 11,688,400 9,281,447 -20.6% 4,449,207 -52.1%Interfund Transfers 10,713,719 10,633,930 -0.7% 10,873,160 2.2%Other Local Taxes 16,824,354 19,351,300 15.0% 16,765,000 -13.4%Charges for Services 3,812,350 4,229,550 10.9% 4,412,350 4.3%Licenses and Permits 1,714,842 1,586,000 -7.5% 2,003,100 26.3%Interest 1,483,033 728,270 -50.9% 577,700 -20.7%Intergovernmental 1,370,570 1,375,460 0.4% 803,362 -41.6%Other Revenues 10,263,922 4,720,613 -54.0% 1,968,189 -58.3%State Shared 890,595 860,000 -3.4% 870,000 1.2%
Total $422,455,848 $418,809,330 -0.9% $417,611,000 -0.3%
General Fund Sources - By Category
Property Taxes52.74%Income Taxes
37.03%
Prior Year Unappropriated
1.07%
Interfund Transfers2.60%
Other Local Taxes4.01%
Charges for Services1.06%
Licenses and Permits0.48%
Interest 0.14% Intergovernmental
0.19%
Other Revenues0.47%
State Shared0.21%
Fiscal Year 2021 Budget $417,611,000
33
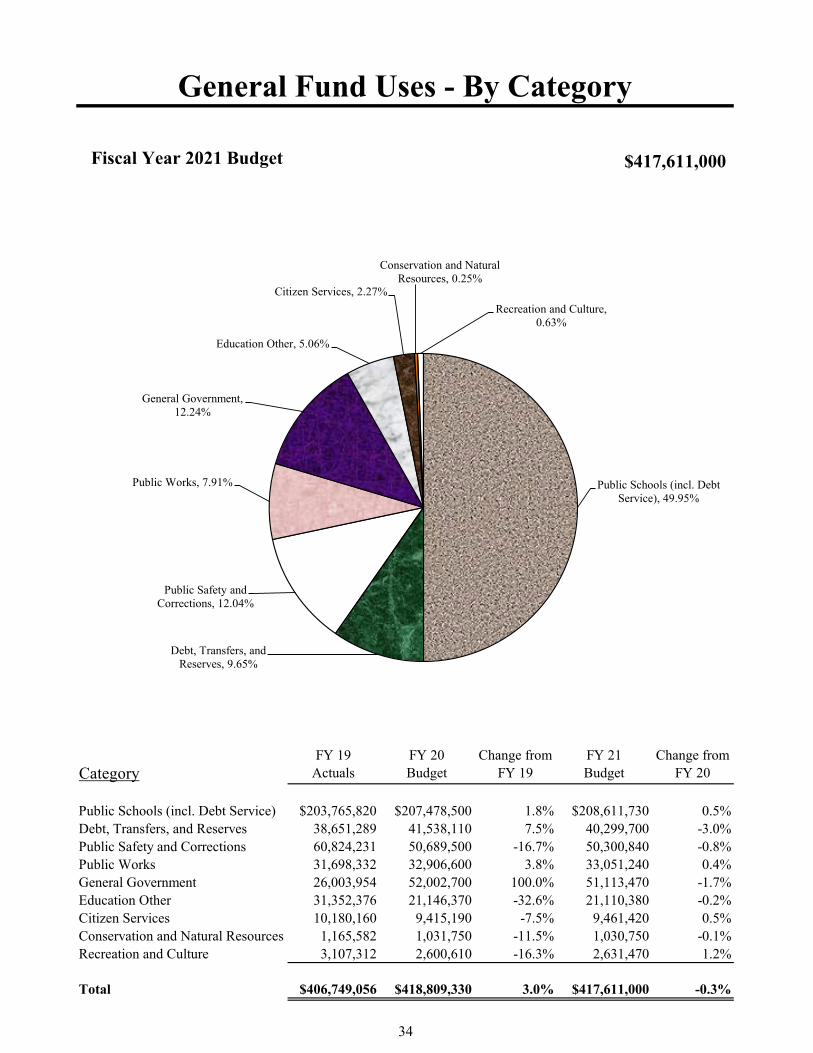
CategoryFY 19
Actuals FY 20Budget
Change from FY 19
FY 21Budget
Change from FY 20
Public Schools (incl. Debt Service) $203,765,820 $207,478,500 1.8% $208,611,730 0.5%Debt, Transfers, and Reserves 38,651,289 41,538,110 7.5% 40,299,700 -3.0%Public Safety and Corrections 60,824,231 50,689,500 -16.7% 50,300,840 -0.8%Public Works 31,698,332 32,906,600 3.8% 33,051,240 0.4%General Government 26,003,954 52,002,700 100.0% 51,113,470 -1.7%Education Other 31,352,376 21,146,370 -32.6% 21,110,380 -0.2%Citizen Services 10,180,160 9,415,190 -7.5% 9,461,420 0.5%Conservation and Natural Resources 1,165,582 1,031,750 -11.5% 1,030,750 -0.1%Recreation and Culture 3,107,312 2,600,610 -16.3% 2,631,470 1.2%
Total $406,749,056 $418,809,330 3.0% $417,611,000 -0.3%
General Fund Uses - By Category
Public Schools (incl. Debt Service), 49.95%
Debt, Transfers, and Reserves, 9.65%
Public Safety and Corrections, 12.04%
Public Works, 7.91%
General Government, 12.24%
Education Other, 5.06%
Citizen Services, 2.27%
Conservation and Natural Resources, 0.25%
Recreation and Culture, 0.63%
Fiscal Year 2021 Budget $417,611,000
34

General Fund Revenues
35

36
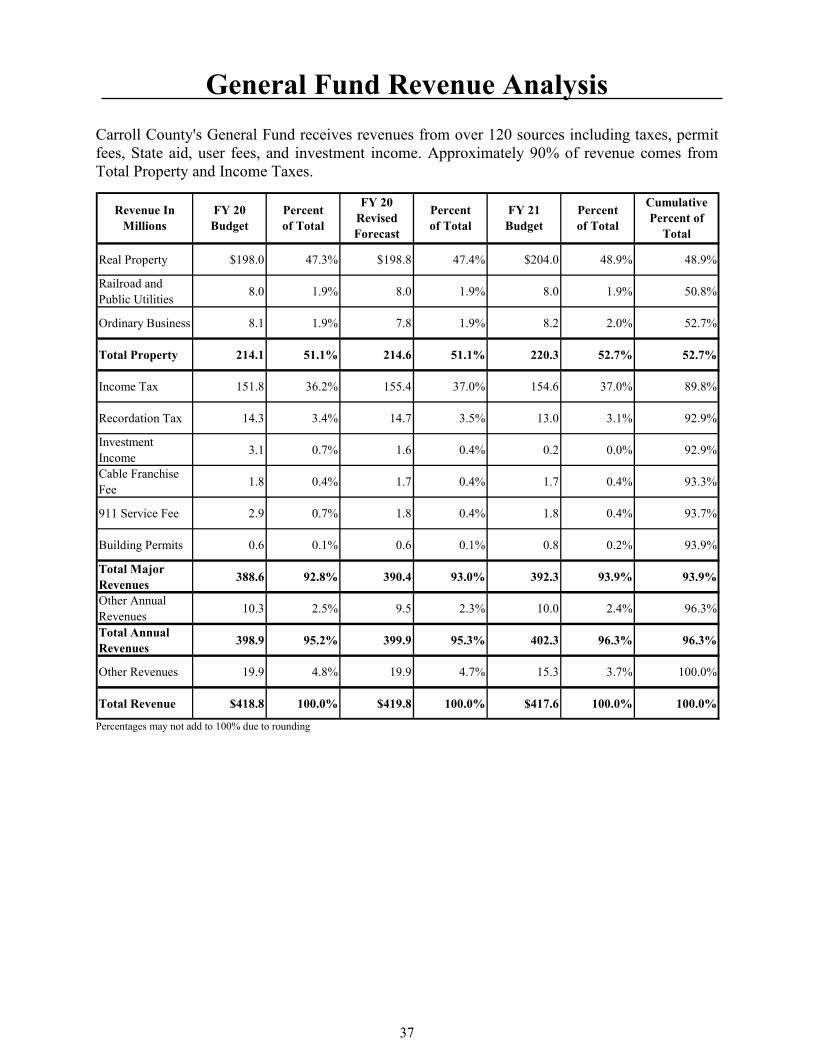
General Fund Revenue Analysis Carroll County's General Fund receives revenues from over 120 sources including taxes, permit fees, State aid, user fees, and investment income. Approximately 90% of revenue comes from Total Property and Income Taxes.
Real Property $198.0 47.3% $198.8 47.4% $204.0 48.9% 48.9%
Railroad and Public Utilities 8.0 1.9% 8.0 1.9% 8.0 1.9% 50.8%
Ordinary Business 8.1 1.9% 7.8 1.9% 8.2 2.0% 52.7%
Total Property 214.1 51.1% 214.6 51.1% 220.3 52.7% 52.7%
Income Tax 151.8 36.2% 155.4 37.0% 154.6 37.0% 89.8%
Recordation Tax 14.3 3.4% 14.7 3.5% 13.0 3.1% 92.9%
Investment Income 3.1 0.7% 1.6 0.4% 0.2 0.0% 92.9%
Cable Franchise Fee 1.8 0.4% 1.7 0.4% 1.7 0.4% 93.3%
911 Service Fee 2.9 0.7% 1.8 0.4% 1.8 0.4% 93.7%
Building Permits 0.6 0.1% 0.6 0.1% 0.8 0.2% 93.9%
Total Major Revenues 388.6 92.8% 390.4 93.0% 392.3 93.9% 93.9%
Other Annual Revenues 10.3 2.5% 9.5 2.3% 10.0 2.4% 96.3%
Total Annual Revenues 398.9 95.2% 399.9 95.3% 402.3 96.3% 96.3%
Other Revenues 19.9 4.8% 19.9 4.7% 15.3 3.7% 100.0%
Total Revenue $418.8 100.0% $419.8 100.0% $417.6 100.0% 100.0%
Percent of Total
Cumulative Percent of
Total
Revenue In Millions
FY 20Budget
Percent of Total
FY 20Revised Forecast
Percent of Total
FY 21Budget
Percentages may not add to 100% due to rounding
37
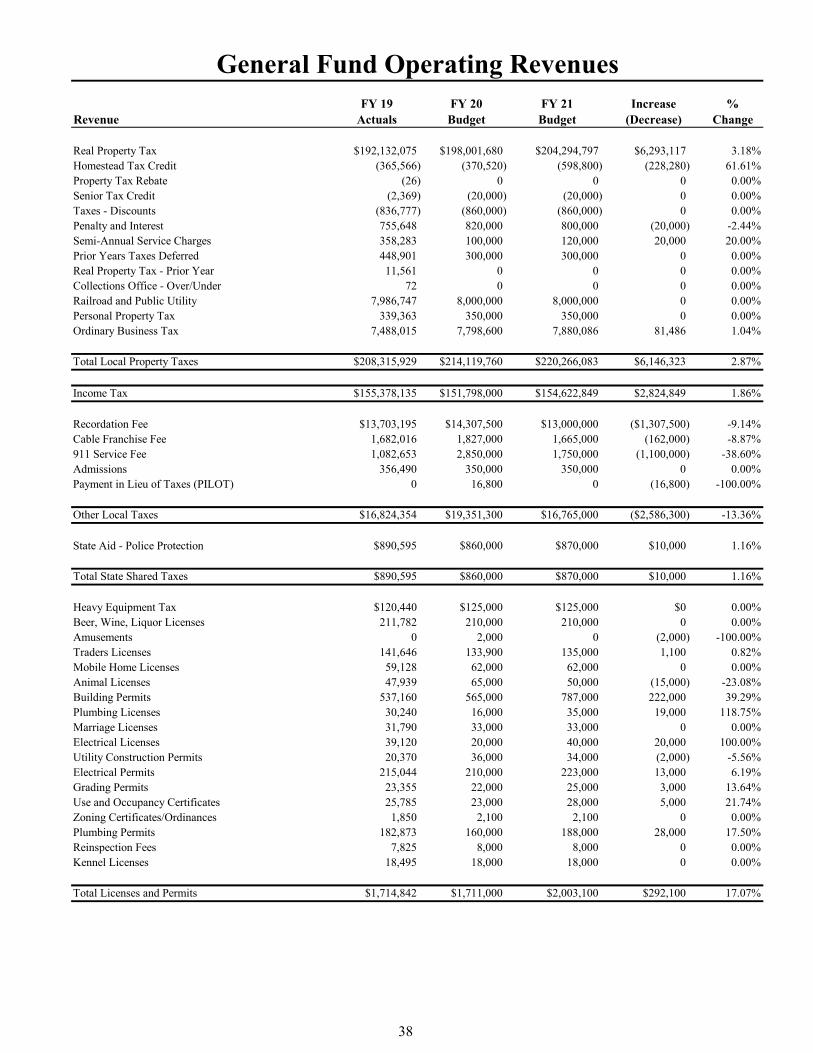
General Fund Operating RevenuesFY 19 FY 20 FY 21 Increase %
Revenue Actuals Budget Budget (Decrease) Change
Real Property Tax $192,132,075 $198,001,680 $204,294,797 $6,293,117 3.18%Homestead Tax Credit (365,566) (370,520) (598,800) (228,280) 61.61%Property Tax Rebate (26) 0 0 0 0.00%Senior Tax Credit (2,369) (20,000) (20,000) 0 0.00%Taxes - Discounts (836,777) (860,000) (860,000) 0 0.00%Penalty and Interest 755,648 820,000 800,000 (20,000) -2.44%Semi-Annual Service Charges 358,283 100,000 120,000 20,000 20.00%Prior Years Taxes Deferred 448,901 300,000 300,000 0 0.00%Real Property Tax - Prior Year 11,561 0 0 0 0.00%Collections Office - Over/Under 72 0 0 0 0.00%Railroad and Public Utility 7,986,747 8,000,000 8,000,000 0 0.00%Personal Property Tax 339,363 350,000 350,000 0 0.00%Ordinary Business Tax 7,488,015 7,798,600 7,880,086 81,486 1.04%
Total Local Property Taxes $208,315,929 $214,119,760 $220,266,083 $6,146,323 2.87%
Income Tax $155,378,135 $151,798,000 $154,622,849 $2,824,849 1.86%
Recordation Fee $13,703,195 $14,307,500 $13,000,000 ($1,307,500) -9.14%Cable Franchise Fee 1,682,016 1,827,000 1,665,000 (162,000) -8.87%911 Service Fee 1,082,653 2,850,000 1,750,000 (1,100,000) -38.60%Admissions 356,490 350,000 350,000 0 0.00%Payment in Lieu of Taxes (PILOT) 0 16,800 0 (16,800) -100.00%
Other Local Taxes $16,824,354 $19,351,300 $16,765,000 ($2,586,300) -13.36%
State Aid - Police Protection $890,595 $860,000 $870,000 $10,000 1.16%
Total State Shared Taxes $890,595 $860,000 $870,000 $10,000 1.16%
Heavy Equipment Tax $120,440 $125,000 $125,000 $0 0.00%Beer, Wine, Liquor Licenses 211,782 210,000 210,000 0 0.00%Amusements 0 2,000 0 (2,000) -100.00%Traders Licenses 141,646 133,900 135,000 1,100 0.82%Mobile Home Licenses 59,128 62,000 62,000 0 0.00%Animal Licenses 47,939 65,000 50,000 (15,000) -23.08%Building Permits 537,160 565,000 787,000 222,000 39.29%Plumbing Licenses 30,240 16,000 35,000 19,000 118.75%Marriage Licenses 31,790 33,000 33,000 0 0.00%Electrical Licenses 39,120 20,000 40,000 20,000 100.00%Utility Construction Permits 20,370 36,000 34,000 (2,000) -5.56%Electrical Permits 215,044 210,000 223,000 13,000 6.19%Grading Permits 23,355 22,000 25,000 3,000 13.64%Use and Occupancy Certificates 25,785 23,000 28,000 5,000 21.74%Zoning Certificates/Ordinances 1,850 2,100 2,100 0 0.00%Plumbing Permits 182,873 160,000 188,000 28,000 17.50%Reinspection Fees 7,825 8,000 8,000 0 0.00%Kennel Licenses 18,495 18,000 18,000 0 0.00%
Total Licenses and Permits $1,714,842 $1,711,000 $2,003,100 $292,100 17.07%
38
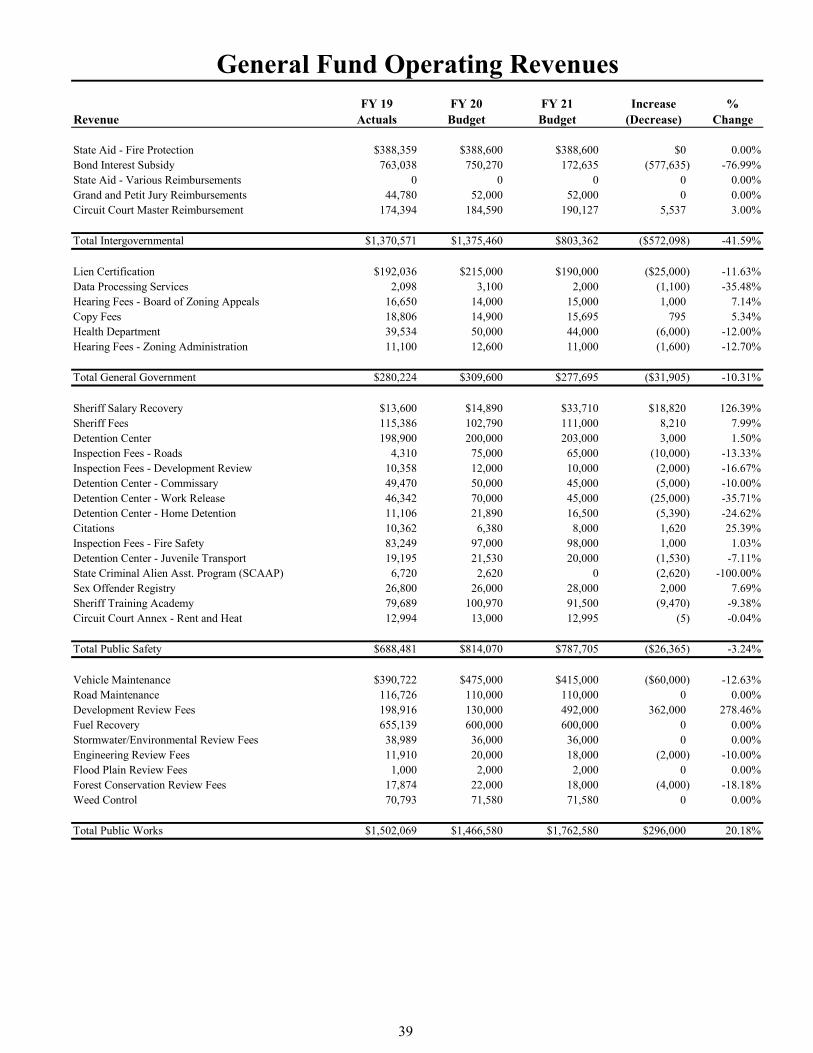
General Fund Operating RevenuesFY 19 FY 20 FY 21 Increase %
Revenue Actuals Budget Budget (Decrease) Change
State Aid - Fire Protection $388,359 $388,600 $388,600 $0 0.00%Bond Interest Subsidy 763,038 750,270 172,635 (577,635) -76.99%State Aid - Various Reimbursements 0 0 0 0 0.00%Grand and Petit Jury Reimbursements 44,780 52,000 52,000 0 0.00%Circuit Court Master Reimbursement 174,394 184,590 190,127 5,537 3.00%
Total Intergovernmental $1,370,571 $1,375,460 $803,362 ($572,098) -41.59%
Lien Certification $192,036 $215,000 $190,000 ($25,000) -11.63%Data Processing Services 2,098 3,100 2,000 (1,100) -35.48%Hearing Fees - Board of Zoning Appeals 16,650 14,000 15,000 1,000 7.14%Copy Fees 18,806 14,900 15,695 795 5.34%Health Department 39,534 50,000 44,000 (6,000) -12.00%Hearing Fees - Zoning Administration 11,100 12,600 11,000 (1,600) -12.70%
Total General Government $280,224 $309,600 $277,695 ($31,905) -10.31%
Sheriff Salary Recovery $13,600 $14,890 $33,710 $18,820 126.39%Sheriff Fees 115,386 102,790 111,000 8,210 7.99%Detention Center 198,900 200,000 203,000 3,000 1.50%Inspection Fees - Roads 4,310 75,000 65,000 (10,000) -13.33%Inspection Fees - Development Review 10,358 12,000 10,000 (2,000) -16.67%Detention Center - Commissary 49,470 50,000 45,000 (5,000) -10.00%Detention Center - Work Release 46,342 70,000 45,000 (25,000) -35.71%Detention Center - Home Detention 11,106 21,890 16,500 (5,390) -24.62%Citations 10,362 6,380 8,000 1,620 25.39%Inspection Fees - Fire Safety 83,249 97,000 98,000 1,000 1.03%Detention Center - Juvenile Transport 19,195 21,530 20,000 (1,530) -7.11%State Criminal Alien Asst. Program (SCAAP) 6,720 2,620 0 (2,620) -100.00%Sex Offender Registry 26,800 26,000 28,000 2,000 7.69%Sheriff Training Academy 79,689 100,970 91,500 (9,470) -9.38%Circuit Court Annex - Rent and Heat 12,994 13,000 12,995 (5) -0.04%
Total Public Safety $688,481 $814,070 $787,705 ($26,365) -3.24%
Vehicle Maintenance $390,722 $475,000 $415,000 ($60,000) -12.63%Road Maintenance 116,726 110,000 110,000 0 0.00%Development Review Fees 198,916 130,000 492,000 362,000 278.46%Fuel Recovery 655,139 600,000 600,000 0 0.00%Stormwater/Environmental Review Fees 38,989 36,000 36,000 0 0.00%Engineering Review Fees 11,910 20,000 18,000 (2,000) -10.00%Flood Plain Review Fees 1,000 2,000 2,000 0 0.00%Forest Conservation Review Fees 17,874 22,000 18,000 (4,000) -18.18%Weed Control 70,793 71,580 71,580 0 0.00%
Total Public Works $1,502,069 $1,466,580 $1,762,580 $296,000 20.18%
39
General Fund Operating RevenuesFY 19 FY 20 FY 21 Increase %
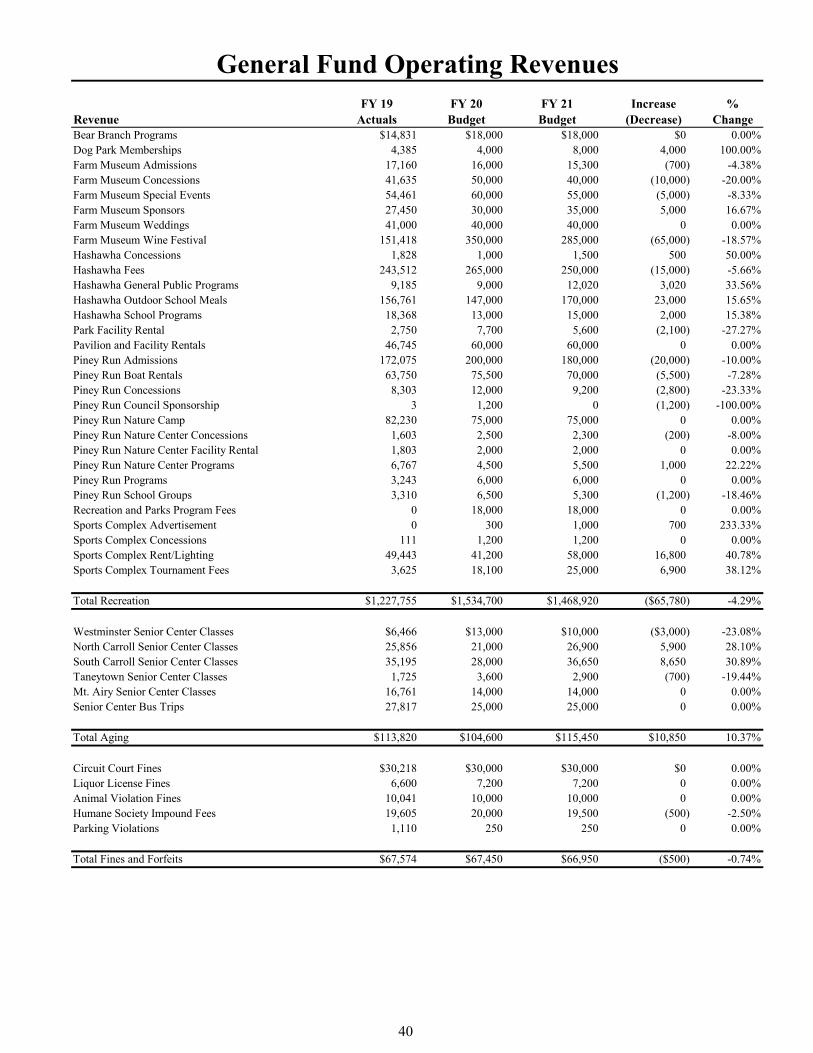
Revenue Actuals Budget Budget (Decrease) ChangeBear Branch Programs $14,831 $18,000 $18,000 $0 0.00%Dog Park Memberships 4,385 4,000 8,000 4,000 100.00%Farm Museum Admissions 17,160 16,000 15,300 (700) -4.38%Farm Museum Concessions 41,635 50,000 40,000 (10,000) -20.00%Farm Museum Special Events 54,461 60,000 55,000 (5,000) -8.33%Farm Museum Sponsors 27,450 30,000 35,000 5,000 16.67%Farm Museum Weddings 41,000 40,000 40,000 0 0.00%Farm Museum Wine Festival 151,418 350,000 285,000 (65,000) -18.57%Hashawha Concessions 1,828 1,000 1,500 500 50.00%Hashawha Fees 243,512 265,000 250,000 (15,000) -5.66%Hashawha General Public Programs 9,185 9,000 12,020 3,020 33.56%Hashawha Outdoor School Meals 156,761 147,000 170,000 23,000 15.65%Hashawha School Programs 18,368 13,000 15,000 2,000 15.38%Park Facility Rental 2,750 7,700 5,600 (2,100) -27.27%Pavilion and Facility Rentals 46,745 60,000 60,000 0 0.00%Piney Run Admissions 172,075 200,000 180,000 (20,000) -10.00%Piney Run Boat Rentals 63,750 75,500 70,000 (5,500) -7.28%Piney Run Concessions 8,303 12,000 9,200 (2,800) -23.33%Piney Run Council Sponsorship 3 1,200 0 (1,200) -100.00%Piney Run Nature Camp 82,230 75,000 75,000 0 0.00%Piney Run Nature Center Concessions 1,603 2,500 2,300 (200) -8.00%Piney Run Nature Center Facility Rental 1,803 2,000 2,000 0 0.00%Piney Run Nature Center Programs 6,767 4,500 5,500 1,000 22.22%Piney Run Programs 3,243 6,000 6,000 0 0.00%Piney Run School Groups 3,310 6,500 5,300 (1,200) -18.46%Recreation and Parks Program Fees 0 18,000 18,000 0 0.00%Sports Complex Advertisement 0 300 1,000 700 233.33%Sports Complex Concessions 111 1,200 1,200 0 0.00%Sports Complex Rent/Lighting 49,443 41,200 58,000 16,800 40.78%Sports Complex Tournament Fees 3,625 18,100 25,000 6,900 38.12%
Total Recreation $1,227,755 $1,534,700 $1,468,920 ($65,780) -4.29%
Westminster Senior Center Classes $6,466 $13,000 $10,000 ($3,000) -23.08%North Carroll Senior Center Classes 25,856 21,000 26,900 5,900 28.10%South Carroll Senior Center Classes 35,195 28,000 36,650 8,650 30.89%Taneytown Senior Center Classes 1,725 3,600 2,900 (700) -19.44%Mt. Airy Senior Center Classes 16,761 14,000 14,000 0 0.00%Senior Center Bus Trips 27,817 25,000 25,000 0 0.00%
Total Aging $113,820 $104,600 $115,450 $10,850 10.37%
Circuit Court Fines $30,218 $30,000 $30,000 $0 0.00%Liquor License Fines 6,600 7,200 7,200 0 0.00%Animal Violation Fines 10,041 10,000 10,000 0 0.00%Humane Society Impound Fees 19,605 20,000 19,500 (500) -2.50%Parking Violations 1,110 250 250 0 0.00%
Total Fines and Forfeits $67,574 $67,450 $66,950 ($500) -0.74%
40
General Fund Operating RevenuesFY 19 FY 20 FY 21 Increase %
Revenue Actuals Budget Budget (Decrease) Change
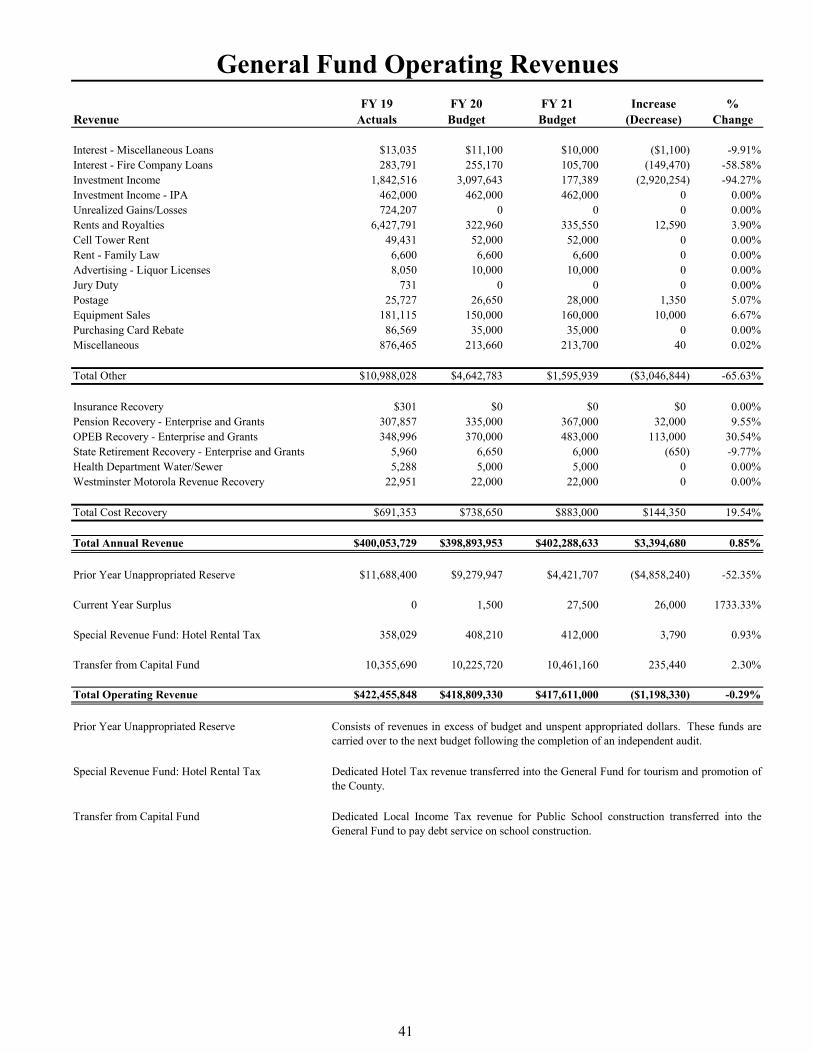
Interest - Miscellaneous Loans $13,035 $11,100 $10,000 ($1,100) -9.91%Interest - Fire Company Loans 283,791 255,170 105,700 (149,470) -58.58%Investment Income 1,842,516 3,097,643 177,389 (2,920,254) -94.27%Investment Income - IPA 462,000 462,000 462,000 0 0.00%Unrealized Gains/Losses 724,207 0 0 0 0.00%Rents and Royalties 6,427,791 322,960 335,550 12,590 3.90%Cell Tower Rent 49,431 52,000 52,000 0 0.00%Rent - Family Law 6,600 6,600 6,600 0 0.00%Advertising - Liquor Licenses 8,050 10,000 10,000 0 0.00%Jury Duty 731 0 0 0 0.00%Postage 25,727 26,650 28,000 1,350 5.07%Equipment Sales 181,115 150,000 160,000 10,000 6.67%Purchasing Card Rebate 86,569 35,000 35,000 0 0.00%Miscellaneous 876,465 213,660 213,700 40 0.02%
Total Other $10,988,028 $4,642,783 $1,595,939 ($3,046,844) -65.63%
Insurance Recovery $301 $0 $0 $0 0.00%Pension Recovery - Enterprise and Grants 307,857 335,000 367,000 32,000 9.55%OPEB Recovery - Enterprise and Grants 348,996 370,000 483,000 113,000 30.54%State Retirement Recovery - Enterprise and Grants 5,960 6,650 6,000 (650) -9.77%Health Department Water/Sewer 5,288 5,000 5,000 0 0.00%Westminster Motorola Revenue Recovery 22,951 22,000 22,000 0 0.00%
Total Cost Recovery $691,353 $738,650 $883,000 $144,350 19.54%
Total Annual Revenue $400,053,729 $398,893,953 $402,288,633 $3,394,680 0.85%
Prior Year Unappropriated Reserve $11,688,400 $9,279,947 $4,421,707 ($4,858,240) -52.35%
Current Year Surplus 0 1,500 27,500 26,000 1733.33%
Special Revenue Fund: Hotel Rental Tax 358,029 408,210 412,000 3,790 0.93%
Transfer from Capital Fund 10,355,690 10,225,720 10,461,160 235,440 2.30%
Total Operating Revenue $422,455,848 $418,809,330 $417,611,000 ($1,198,330) -0.29%
Prior Year Unappropriated Reserve
Special Revenue Fund: Hotel Rental Tax
Transfer from Capital Fund
Consists of revenues in excess of budget and unspent appropriated dollars. These funds arecarried over to the next budget following the completion of an independent audit.
Dedicated Local Income Tax revenue for Public School construction transferred into theGeneral Fund to pay debt service on school construction.
Dedicated Hotel Tax revenue transferred into the General Fund for tourism and promotion ofthe County.
41
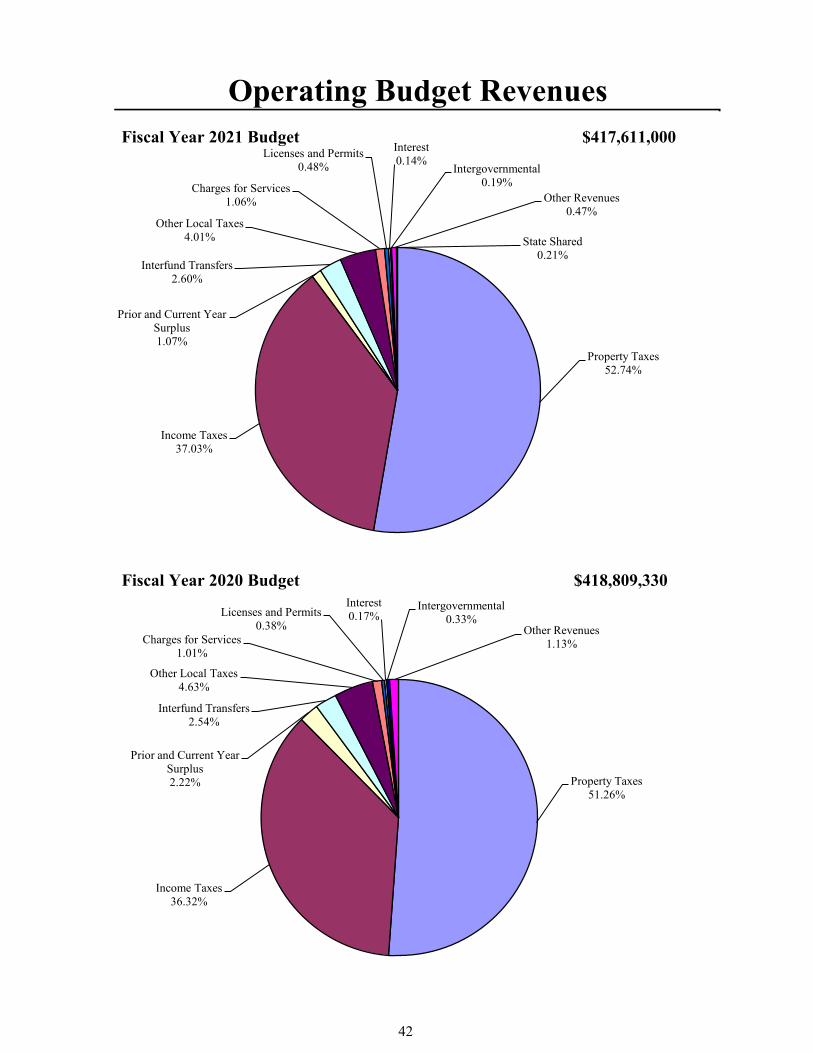
Operating Budget Revenues
Property Taxes52.74%
Income Taxes37.03%
Prior and Current Year Surplus1.07%
Interfund Transfers2.60%
Other Local Taxes4.01%
Charges for Services1.06%
Licenses and Permits0.48%
Interest0.14%
Intergovernmental0.19%
Other Revenues0.47%
State Shared0.21%
Fiscal Year 2021 Budget $417,611,000
Property Taxes51.26%
Income Taxes36.32%
Prior and Current Year Surplus2.22%
Interfund Transfers2.54%
Other Local Taxes4.63%
Charges for Services1.01%
Licenses and Permits0.38%
Interest0.17%
Intergovernmental0.33%
Other Revenues1.13%
Fiscal Year 2020 Budget $418,809,330
42
Operating Plan
43

44
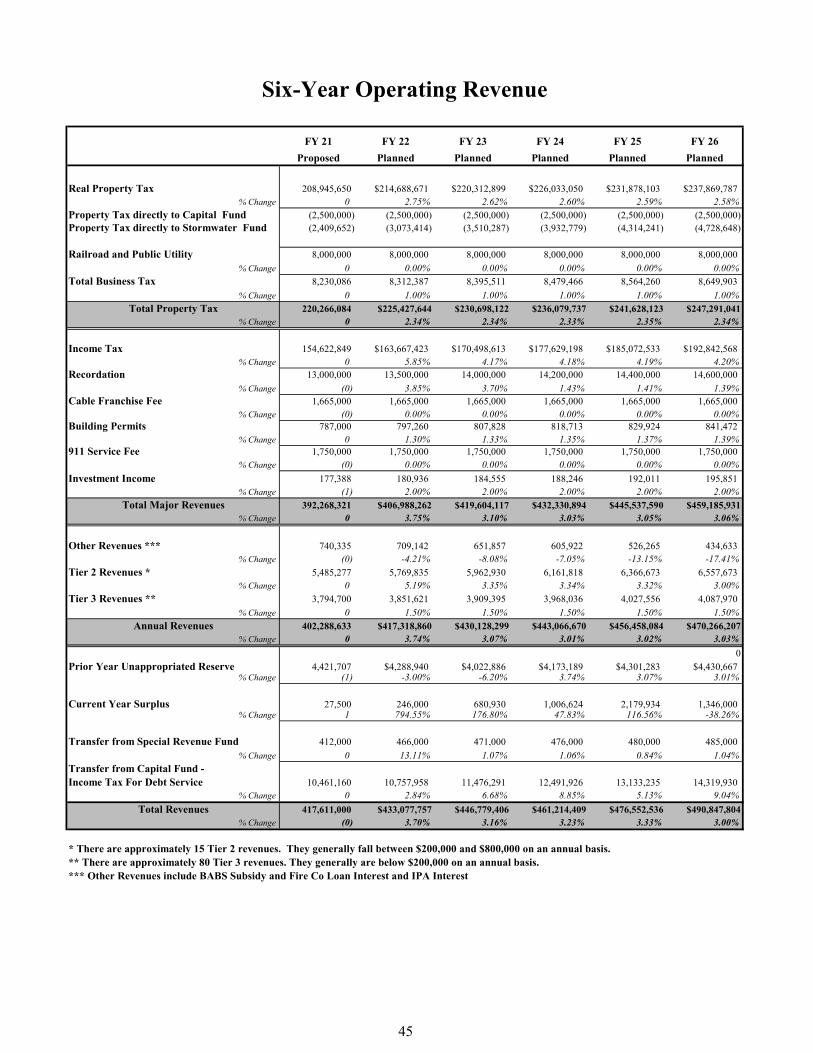
FY 21 FY 22 FY 23 FY 24 FY 25 FY 26Proposed Planned Planned Planned Planned Planned
Real Property Tax 208,945,650 $214,688,671 $220,312,899 $226,033,050 $231,878,103 $237,869,787% Change 0 2.75% 2.62% 2.60% 2.59% 2.58%
Property Tax directly to Capital Fund (2,500,000) (2,500,000) (2,500,000) (2,500,000) (2,500,000) (2,500,000)Property Tax directly to Stormwater Fund (2,409,652) (3,073,414) (3,510,287) (3,932,779) (4,314,241) (4,728,648)
Railroad and Public Utility 8,000,000 8,000,000 8,000,000 8,000,000 8,000,000 8,000,000% Change 0 0.00% 0.00% 0.00% 0.00% 0.00%
Total Business Tax 8,230,086 8,312,387 8,395,511 8,479,466 8,564,260 8,649,903% Change 0 1.00% 1.00% 1.00% 1.00% 1.00%
Total Property Tax 220,266,084 $225,427,644 $230,698,122 $236,079,737 $241,628,123 $247,291,041% Change 0 2.34% 2.34% 2.33% 2.35% 2.34%
Income Tax 154,622,849 $163,667,423 $170,498,613 $177,629,198 $185,072,533 $192,842,568% Change 0 5.85% 4.17% 4.18% 4.19% 4.20%
Recordation 13,000,000 13,500,000 14,000,000 14,200,000 14,400,000 14,600,000% Change (0) 3.85% 3.70% 1.43% 1.41% 1.39%
Cable Franchise Fee 1,665,000 1,665,000 1,665,000 1,665,000 1,665,000 1,665,000% Change (0) 0.00% 0.00% 0.00% 0.00% 0.00%
Building Permits 787,000 797,260 807,828 818,713 829,924 841,472% Change 0 1.30% 1.33% 1.35% 1.37% 1.39%
911 Service Fee 1,750,000 1,750,000 1,750,000 1,750,000 1,750,000 1,750,000% Change (0) 0.00% 0.00% 0.00% 0.00% 0.00%
Investment Income 177,388 180,936 184,555 188,246 192,011 195,851% Change (1) 2.00% 2.00% 2.00% 2.00% 2.00%
Total Major Revenues 392,268,321 $406,988,262 $419,604,117 $432,330,894 $445,537,590 $459,185,931% Change 0 3.75% 3.10% 3.03% 3.05% 3.06%
Other Revenues *** 740,335 709,142 651,857 605,922 526,265 434,633% Change (0) -4.21% -8.08% -7.05% -13.15% -17.41%
Tier 2 Revenues * 5,485,277 5,769,835 5,962,930 6,161,818 6,366,673 6,557,673% Change 0 5.19% 3.35% 3.34% 3.32% 3.00%
Tier 3 Revenues ** 3,794,700 3,851,621 3,909,395 3,968,036 4,027,556 4,087,970% Change 0 1.50% 1.50% 1.50% 1.50% 1.50%
Annual Revenues 402,288,633 $417,318,860 $430,128,299 $443,066,670 $456,458,084 $470,266,207% Change 0 3.74% 3.07% 3.01% 3.02% 3.03%
0Prior Year Unappropriated Reserve 4,421,707 $4,288,940 $4,022,886 $4,173,189 $4,301,283 $4,430,667
% Change (1) -3.00% -6.20% 3.74% 3.07% 3.01%
Current Year Surplus 27,500 246,000 680,930 1,006,624 2,179,934 1,346,000% Change 1 794.55% 176.80% 47.83% 116.56% -38.26%
Transfer from Special Revenue Fund 412,000 466,000 471,000 476,000 480,000 485,000% Change 0 13.11% 1.07% 1.06% 0.84% 1.04%
Transfer from Capital Fund - Income Tax For Debt Service 10,461,160 10,757,958 11,476,291 12,491,926 13,133,235 14,319,930
% Change 0 2.84% 6.68% 8.85% 5.13% 9.04%Total Revenues 417,611,000 $433,077,757 $446,779,406 $461,214,409 $476,552,536 $490,847,804
% Change (0) 3.70% 3.16% 3.23% 3.33% 3.00%
* There are approximately 15 Tier 2 revenues. They generally fall between $200,000 and $800,000 on an annual basis.** There are approximately 80 Tier 3 revenues. They generally are below $200,000 on an annual basis.*** Other Revenues include BABS Subsidy and Fire Co Loan Interest and IPA Interest
Six-Year Operating Revenue
45

FY 21 FY 22 FY 23 FY 24 FY 25 FY 26Department/Agency Proposed Planned Planned Planned Planned PlannedPublic SchoolsCarroll County Public Schools 198,407,700 204,617,860 211,022,400 217,627,400 224,439,140 231,172,310Carroll County Public Schools Debt Service 10,204,030 10,522,140 11,254,050 12,301,680 12,967,830 14,180,560Total Public Schools 208,611,730 215,140,000 222,276,450 229,929,080 237,406,970 245,352,870
Education OtherCable Regulatory Commission 164,600 172,830 181,470 190,550 200,070 210,080Carroll Community College 10,607,100 10,925,310 11,253,070 11,590,660 11,938,380 12,296,540Carroll Community College - Adult Basic Educ 284,040 284,040 284,040 284,040 284,040 284,040Carroll Community College - Entrepreneurship 110,000 113,300 116,700 120,200 123,810 127,520Carroll County Public Library 9,279,640 9,558,030 9,844,770 10,140,110 10,444,320 10,757,650Community Media Center 665,000 665,000 665,000 665,000 665,000 665,000Total Education Other 21,110,380 21,718,510 22,345,050 22,990,560 23,655,620 24,340,830
Public Safety and CorrectionsCircuit Court 2,216,710 2,285,250 2,354,970 2,424,490 2,498,520 2,572,150Circuit Court Magistrates 412,870 425,580 438,510 451,680 465,230 479,190Orphans Court 61,640 61,700 61,760 61,820 61,890 62,060Volunteer Community Service Program 186,420 192,010 197,770 203,710 209,820 216,110Total Courts 2,877,640 2,964,540 3,053,010 3,141,700 3,235,460 3,329,510Public Safety 911 5,656,760 6,212,940 6,155,270 6,348,640 6,811,920 6,763,330Total Public Safety 911 5,656,760 6,212,940 6,155,270 6,348,640 6,811,920 6,763,330Administrative Services 3,147,120 3,273,500 3,407,290 3,541,000 3,816,760 3,968,210Advocacy and Investigation Center 23,370 21,070 21,700 22,350 23,020 27,220Corrections 8,808,980 9,100,980 9,459,100 9,836,760 10,259,510 10,636,460Law Enforcement 11,428,940 11,884,390 12,337,600 12,823,430 13,337,410 13,911,700Training Academy 71,850 74,000 76,210 78,490 80,840 83,250Total Sheriff's Office 23,480,260 24,353,940 25,301,900 26,302,030 27,517,540 28,626,840State's Attorney's Office 3,591,330 3,699,410 3,810,590 3,924,920 4,042,660 4,163,950Total State's Attorney's Office 3,591,330 3,699,410 3,810,590 3,924,920 4,042,660 4,163,950Animal Control 897,180 966,100 995,080 980,370 1,054,780 1,086,480EMS 24/7 Services 4,657,180 4,796,900 4,940,800 5,089,030 5,241,700 5,398,950Fire Services Administration 234,790 239,770 246,970 254,380 262,010 269,870Length of Service Award Program 398,000 630,000 680,000 730,000 780,000 830,000Volunteer Emergency Services Association 8,507,700 8,762,930 9,025,820 9,296,590 9,575,490 9,862,760Total Public Safety and Corrections Other 14,694,850 15,395,700 15,888,670 16,350,370 16,913,980 17,448,060Total Public Safety and Corrections 50,300,840 52,626,530 54,209,440 56,067,660 58,521,560 60,331,690
Public WorksPublic Works Administration 542,020 548,410 564,860 581,900 599,260 623,240Building Construction 334,550 344,390 355,220 363,900 374,620 385,860Engineering Administration 545,680 561,050 577,880 595,220 653,070 672,670Engineering - Construction Inspection 392,940 404,730 416,870 429,380 443,130 455,530Engineering - Design 330,590 340,510 350,720 361,240 372,080 383,240Engineering - Survey 258,190 251,610 259,060 266,930 274,840 307,190Facilities 11,541,160 11,141,300 11,750,340 12,149,860 12,610,570 12,996,890Fleet Management 7,703,160 8,248,660 8,315,870 8,565,350 8,822,310 9,086,980Permits and Inspections 1,407,170 1,455,640 1,491,650 1,536,250 1,592,000 1,630,100Roads Operations 7,205,650 7,438,640 7,661,800 7,891,640 8,128,380 8,372,240Storm Emergencies 2,167,160 2,264,480 2,361,360 2,468,320 2,580,290 2,697,520Traffic Control 356,000 339,800 349,990 360,480 371,290 382,420Transit Administration 141,670 145,920 150,300 154,810 159,450 164,230Veteran Transit Services 125,300 134,700 144,800 155,660 167,330 179,880Total Public Works 33,051,240 33,619,840 34,750,720 35,880,940 37,148,620 38,337,990
Operating PlanFiscal Years 2021 - 2026
FY 21 FY 22 FY 23 FY 24 FY 25 FY 26Department/Agency Proposed Planned Planned Planned Planned Planned
Operating PlanFiscal Years 2021 - 2026
Citizen ServicesCitizen Services Administration 346,130 356,510 367,210 378,230 389,570 401,260Aging and Disabilities 1,249,680 1,293,460 1,328,760 1,372,130 1,409,790 1,455,580Recovery Support Services 411,940 915,510 942,670 965,650 994,470 1,024,160Total Citizen Services 2,007,750 2,565,480 2,638,640 2,716,010 2,793,830 2,881,000Access Carroll 20,000 20,000 20,000 20,000 20,000 20,000The Arc Carroll County 270,800 276,220 281,740 287,380 293,120 298,990CHANGE, Inc. 265,540 270,850 276,270 281,790 287,430 293,180Family and Children's Services 392,070 403,830 415,950 428,430 441,280 454,520Flying Colors of Success 46,640 48,970 51,420 53,990 56,690 59,530Human Services of Program 1,217,310 1,241,660 1,266,490 1,291,820 1,317,660 1,344,010Mosaic Community Services 109,760 111,960 114,190 116,480 118,810 121,180Rape Crisis Intervention Service 168,630 177,060 185,910 195,210 204,970 215,220Target Community and Educational Services 270,800 276,220 281,740 287,380 293,120 298,990Youth Services Bureau 1,070,390 1,166,800 1,190,130 1,213,940 1,238,220 1,262,980Citizen Services Non - Profits 3,831,940 3,993,570 4,083,840 4,176,420 4,271,300 4,368,600Health Department 3,601,730 3,709,780 3,821,080 3,935,710 4,053,780 4,175,390Social Services 20,000 20,000 20,000 20,000 20,000 20,000Citizen Services State 3,621,730 3,729,780 3,841,080 3,955,710 4,073,780 4,195,390Total Citizen Services 9,461,420 10,288,830 10,563,560 10,848,140 11,138,910 11,444,990
0Recreation and CultureRecreation and Parks Administration 419,180 425,620 438,380 452,750 465,090 484,030Hashawha 826,150 843,890 871,700 906,540 928,390 957,210Piney Run Park 663,310 687,950 713,110 742,030 780,330 803,730Recreation 438,530 454,250 470,140 486,390 503,730 519,140Sports Complex 204,300 211,080 221,110 228,310 235,890 242,970Total Recreation and Parks 2,551,470 2,622,790 2,714,440 2,816,020 2,913,430 3,007,080Historical Society of Carroll County 60,000 60,000 60,000 60,000 60,000 60,000Union Mills Homestead 20,000 20,000 20,000 20,000 20,000 20,000Total Culture 80,000 80,000 80,000 80,000 80,000 80,000Total Recreation and Culture 2,631,470 2,702,790 2,794,440 2,896,020 2,993,430 3,087,080
General GovernmentComprehensive Planning 798,090 821,210 843,890 869,210 895,290 922,140Total Comprehensive Planning 798,090 821,210 843,890 869,210 895,290 922,140Comptroller Administration 329,170 338,970 347,640 358,020 368,830 377,220Accounting 1,081,040 1,113,470 1,144,270 1,179,330 1,214,710 1,248,460Bond Issuance Expense 218,460 284,310 269,420 262,410 268,950 261,580Collections Office 1,221,890 1,266,410 1,311,270 1,358,410 1,407,950 1,457,960Independent Post Audit 51,770 53,320 54,920 57,670 59,400 61,180Purchasing 390,620 403,640 416,750 428,450 442,600 454,780Total Comptroller 3,292,950 3,460,120 3,544,270 3,644,290 3,762,440 3,861,180County Attorney 716,270 737,760 759,890 782,690 806,170 830,350Total County Attorney 716,270 737,760 759,890 782,690 806,170 830,350Economic Development Administration 859,950 885,000 910,800 937,370 964,740 992,940Business Employment and Resource Center 197,240 203,160 209,250 215,530 222,000 228,660Economic Dev. Infrastructure and Investments 850,000 850,000 850,000 850,000 850,000 850,000Farm Museum 942,810 972,210 1,002,630 1,033,860 1,066,330 1,098,960Tourism 374,220 389,930 401,630 413,680 426,090 438,870Total Economic Development 3,224,220 3,300,300 3,374,310 3,450,440 3,529,160 3,609,430

FY 21 FY 22 FY 23 FY 24 FY 25 FY 26Department/Agency Proposed Planned Planned Planned Planned Planned
Operating PlanFiscal Years 2021 - 2026
Human Resources Administration 882,180 908,650 935,900 963,980 992,900 1,022,690Health and Fringe Benefits 28,409,510 30,244,550 32,076,440 33,342,950 35,581,300 38,642,490Personnel Services 149,180 153,660 158,270 163,010 167,900 172,940Total Human Resources 29,440,870 31,306,860 33,170,610 34,469,940 36,742,100 39,838,120Land and Resource Management Administratio 741,580 763,830 786,740 810,340 834,650 859,690Development Review 493,450 508,250 523,500 539,210 555,380 572,040Resource Management 703,270 726,960 748,760 771,220 794,350 818,180Zoning Administration 231,070 238,000 245,140 252,500 260,070 267,880Total Land and Resource Management 2,169,370 2,237,040 2,304,140 2,373,270 2,444,450 2,517,790Management and Budget Administration 247,530 254,960 262,600 270,480 278,600 286,960Budget 546,860 563,270 580,160 597,570 615,500 633,960Grants Office 163,470 163,310 173,430 171,730 183,980 182,190Risk Management 2,302,620 2,419,970 2,535,330 2,656,380 2,784,920 2,918,000Total Management and Budget 3,260,480 3,401,510 3,551,520 3,696,160 3,863,000 4,021,110Technology Services 4,631,260 5,032,450 5,334,220 5,494,550 5,706,720 5,837,240Production and Distribution Services 434,120 447,140 460,560 474,370 488,610 503,260Total Technology Services 5,065,380 5,479,590 5,794,780 5,968,920 6,195,330 6,340,500Administrative Hearings 78,400 80,750 83,170 85,670 88,240 90,890Audio Video Production 184,240 189,770 195,460 201,330 207,370 213,600Board of Elections 1,505,150 1,569,250 1,635,930 1,728,420 1,802,520 1,903,290Board of License Commissioners 86,340 88,930 91,600 94,350 97,180 100,090County Commissioners 991,710 1,020,850 1,057,320 1,084,850 1,118,430 1,151,960Not in Carroll 300,000 300,000 300,000 300,000 300,000 300,000Total General Government Other 3,145,840 3,249,550 3,363,480 3,494,620 3,613,740 3,759,830Total General Government 51,113,470 53,993,940 56,706,890 58,749,540 61,851,680 65,700,450
0Conservation and Natural ResourcesExtension Office of Carroll County 515,080 530,530 546,450 562,840 579,730 597,120Gypsy Moth 30,000 30,000 30,000 30,000 30,000 30,000Soil Conservation District 383,690 395,200 407,060 419,270 431,850 444,800Weed Control 101,980 76,710 79,020 81,390 83,830 86,340Total Conservation and Natural Resource 1,030,750 1,032,440 1,062,530 1,093,500 1,125,410 1,158,260
Debt and TransfersDebt Service 21,884,520 20,075,630 21,447,090 22,238,120 22,186,110 23,899,030Debt Service - Ag Pres. 1,828,000 2,168,440 2,626,070 2,986,360 4,103,920 3,256,220Intergovernmental Transfers 3,210,590 3,282,830 3,356,690 3,432,220 3,509,440 3,588,400Total Debt and Transfers 26,923,110 25,526,900 27,429,850 28,656,700 29,799,470 30,743,650
ReservesReserve for Contingencies 4,408,380 4,330,780 4,467,790 4,612,140 4,765,530 4,908,480Reserve for Positions 0 0 0 0 0 0Total Reserves 4,408,380 4,330,780 4,467,790 4,612,140 4,765,530 4,908,480
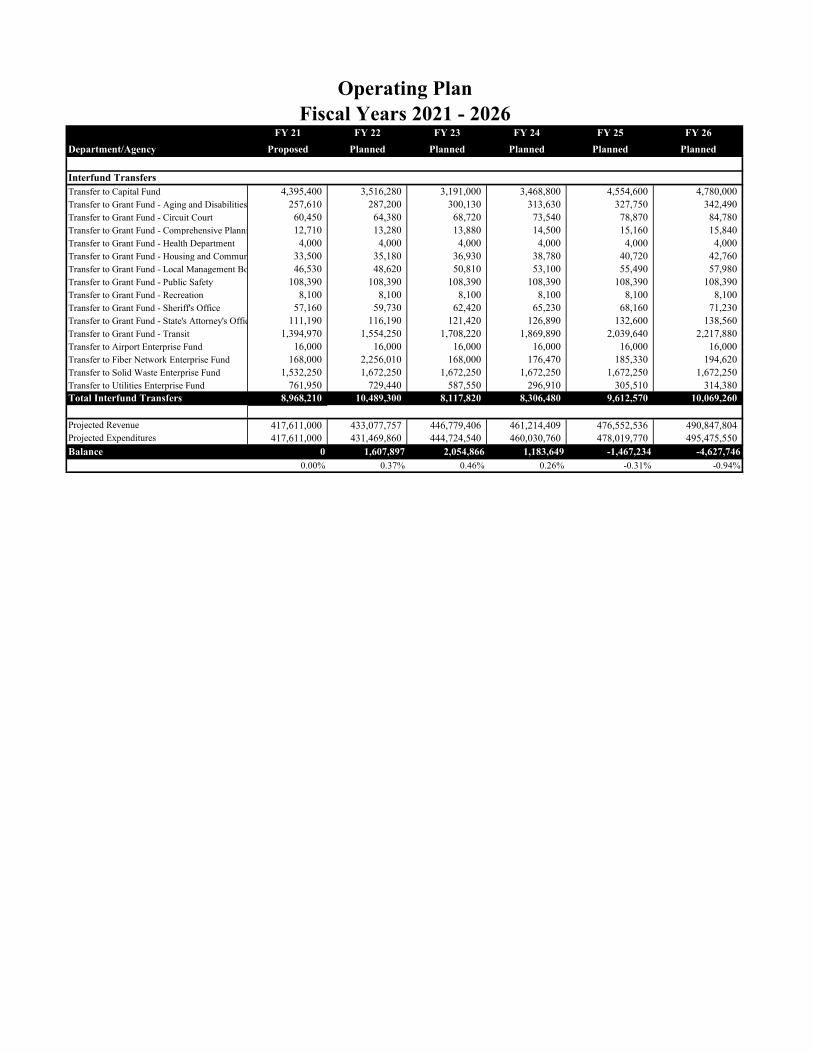
FY 21 FY 22 FY 23 FY 24 FY 25 FY 26Department/Agency Proposed Planned Planned Planned Planned Planned
Operating PlanFiscal Years 2021 - 2026
Interfund TransfersTransfer to Capital Fund 4,395,400 3,516,280 3,191,000 3,468,800 4,554,600 4,780,000Transfer to Grant Fund - Aging and Disabilities 257,610 287,200 300,130 313,630 327,750 342,490Transfer to Grant Fund - Circuit Court 60,450 64,380 68,720 73,540 78,870 84,780Transfer to Grant Fund - Comprehensive Planni 12,710 13,280 13,880 14,500 15,160 15,840Transfer to Grant Fund - Health Department 4,000 4,000 4,000 4,000 4,000 4,000Transfer to Grant Fund - Housing and Commun 33,500 35,180 36,930 38,780 40,720 42,760Transfer to Grant Fund - Local Management Bo 46,530 48,620 50,810 53,100 55,490 57,980Transfer to Grant Fund - Public Safety 108,390 108,390 108,390 108,390 108,390 108,390Transfer to Grant Fund - Recreation 8,100 8,100 8,100 8,100 8,100 8,100Transfer to Grant Fund - Sheriff's Office 57,160 59,730 62,420 65,230 68,160 71,230Transfer to Grant Fund - State's Attorney's Offic 111,190 116,190 121,420 126,890 132,600 138,560Transfer to Grant Fund - Transit 1,394,970 1,554,250 1,708,220 1,869,890 2,039,640 2,217,880Transfer to Airport Enterprise Fund 16,000 16,000 16,000 16,000 16,000 16,000Transfer to Fiber Network Enterprise Fund 168,000 2,256,010 168,000 176,470 185,330 194,620Transfer to Solid Waste Enterprise Fund 1,532,250 1,672,250 1,672,250 1,672,250 1,672,250 1,672,250Transfer to Utilities Enterprise Fund 761,950 729,440 587,550 296,910 305,510 314,380Total Interfund Transfers 8,968,210 10,489,300 8,117,820 8,306,480 9,612,570 10,069,260
Projected Revenue 417,611,000 433,077,757 446,779,406 461,214,409 476,552,536 490,847,804Projected Expenditures 417,611,000 431,469,860 444,724,540 460,030,760 478,019,770 495,475,550Balance 0 1,607,897 2,054,866 1,183,649 -1,467,234 -4,627,746
0.00% 0.37% 0.46% 0.26% -0.31% -0.94%

50
General Fund Appropriations
51

52
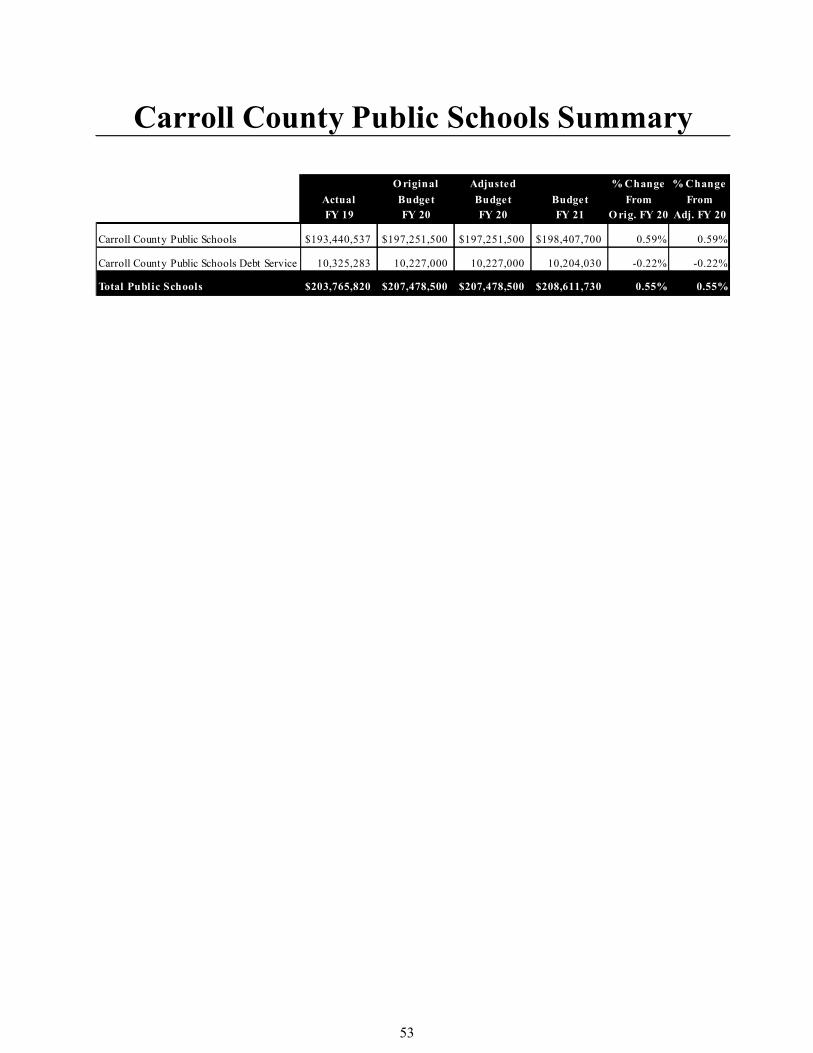
Carroll County Public Schools Summary
O riginal Adjusted % Change % Change
Actual Budget Budget Budget From FromFY 19 FY 20 FY 20 FY 21 O rig. FY 20 Adj. FY 20
Carroll County Public Schools $193,440,537 $197,251,500 $197,251,500 $198,407,700 0.59% 0.59%
Carroll County Public Schools Debt Service 10,325,283 10,227,000 10,227,000 10,204,030 -0.22% -0.22%
Total Public Schools $203,765,820 $207,478,500 $207,478,500 $208,611,730 0.55% 0.55%
53
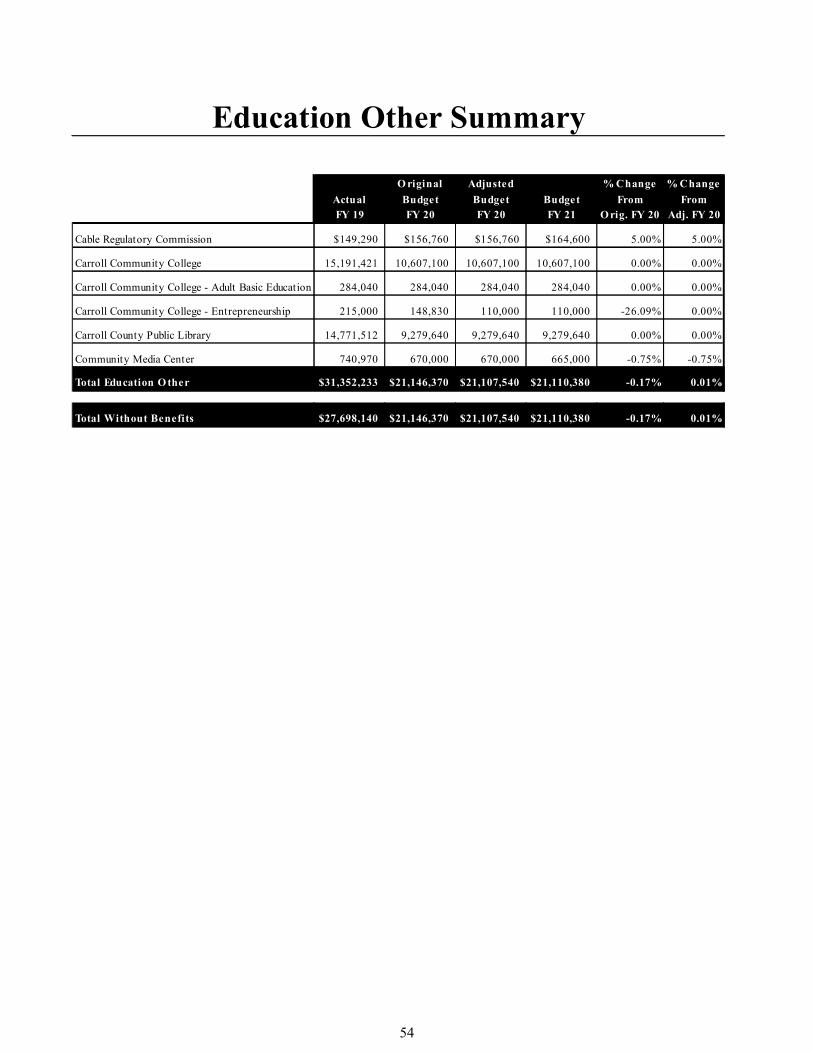
O riginal Adjusted % Change % Change
Actual Budget Budget Budget From FromFY 19 FY 20 FY 20 FY 21 O rig. FY 20 Adj. FY 20
Cable Regulatory Commission $149,290 $156,760 $156,760 $164,600 5.00% 5.00%
Carroll Community College 15,191,421 10,607,100 10,607,100 10,607,100 0.00% 0.00%
Carroll Community College - Adult Basic Education 284,040 284,040 284,040 284,040 0.00% 0.00%
Carroll Community College - Entrepreneurship 215,000 148,830 110,000 110,000 -26.09% 0.00%
Carroll County Public Library 14,771,512 9,279,640 9,279,640 9,279,640 0.00% 0.00%
Community Media Center 740,970 670,000 670,000 665,000 -0.75% -0.75%
Total Education O ther $31,352,233 $21,146,370 $21,107,540 $21,110,380 -0.17% 0.01%
Total Without Benefits $27,698,140 $21,146,370 $21,107,540 $21,110,380 -0.17% 0.01%
Education Other Summary
54
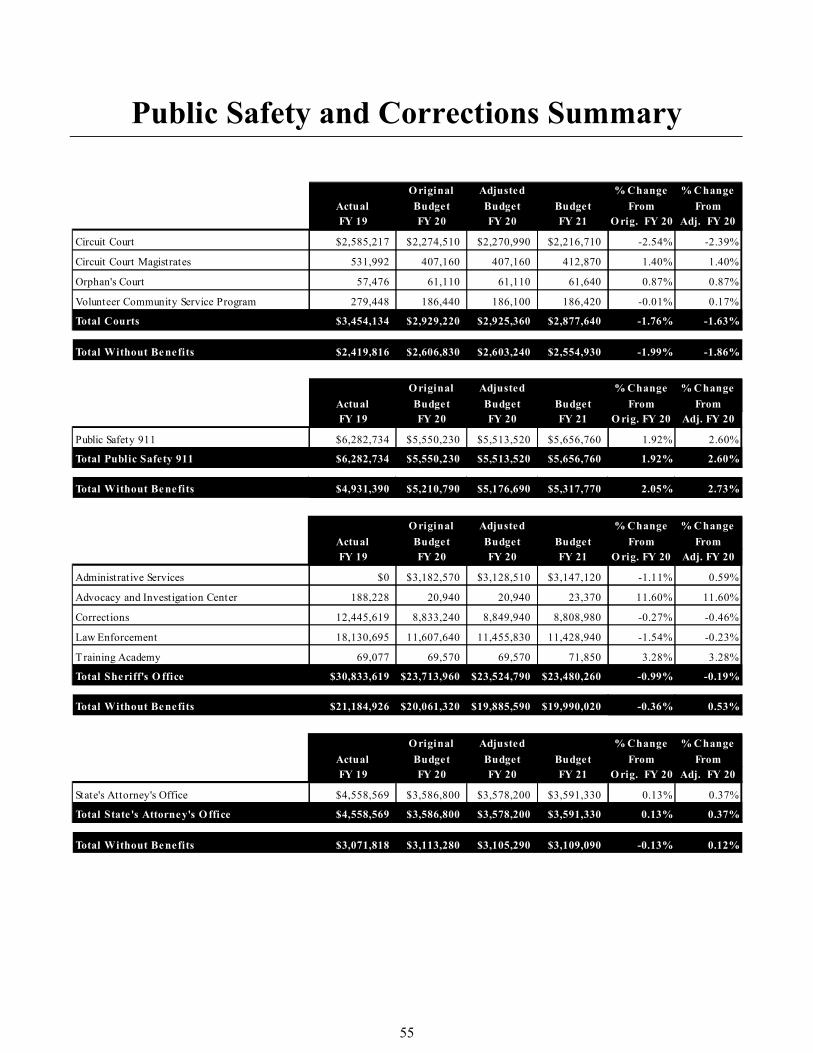
Public Safety and Corrections Summary
Original Adjusted % Change % Change
Actual Budget Budget Budget From FromFY 19 FY 20 FY 20 FY 21 O rig. FY 20 Adj. FY 20
Circuit Court $2,585,217 $2,274,510 $2,270,990 $2,216,710 -2.54% -2.39%
Circuit Court Magistrates 531,992 407,160 407,160 412,870 1.40% 1.40%
Orphan's Court 57,476 61,110 61,110 61,640 0.87% 0.87%
Volunteer Community Service Program 279,448 186,440 186,100 186,420 -0.01% 0.17%
Total Courts $3,454,134 $2,929,220 $2,925,360 $2,877,640 -1.76% -1.63%
Total Without Benefits $2,419,816 $2,606,830 $2,603,240 $2,554,930 -1.99% -1.86%
Original Adjusted % Change % Change
Actual Budget Budget Budget From FromFY 19 FY 20 FY 20 FY 21 O rig. FY 20 Adj. FY 20
Public Safety 911 $6,282,734 $5,550,230 $5,513,520 $5,656,760 1.92% 2.60%
Total Public Safety 911 $6,282,734 $5,550,230 $5,513,520 $5,656,760 1.92% 2.60%
Total Without Benefits $4,931,390 $5,210,790 $5,176,690 $5,317,770 2.05% 2.73%
Original Adjusted % Change % Change
Actual Budget Budget Budget From FromFY 19 FY 20 FY 20 FY 21 O rig. FY 20 Adj. FY 20
Administrat ive Services $0 $3,182,570 $3,128,510 $3,147,120 -1.11% 0.59%
Advocacy and Investigation Center 188,228 20,940 20,940 23,370 11.60% 11.60%
Corrections 12,445,619 8,833,240 8,849,940 8,808,980 -0.27% -0.46%
Law Enforcement 18,130,695 11,607,640 11,455,830 11,428,940 -1.54% -0.23%
Training Academy 69,077 69,570 69,570 71,850 3.28% 3.28%
Total Sheriff's O ffice $30,833,619 $23,713,960 $23,524,790 $23,480,260 -0.99% -0.19%
Total Without Benefits $21,184,926 $20,061,320 $19,885,590 $19,990,020 -0.36% 0.53%
Original Adjusted % Change % Change
Actual Budget Budget Budget From FromFY 19 FY 20 FY 20 FY 21 O rig. FY 20 Adj. FY 20
State's Attorney's Office $4,558,569 $3,586,800 $3,578,200 $3,591,330 0.13% 0.37%
Total State's Attorney's O ffice $4,558,569 $3,586,800 $3,578,200 $3,591,330 0.13% 0.37%
Total Without Benefits $3,071,818 $3,113,280 $3,105,290 $3,109,090 -0.13% 0.12%
55
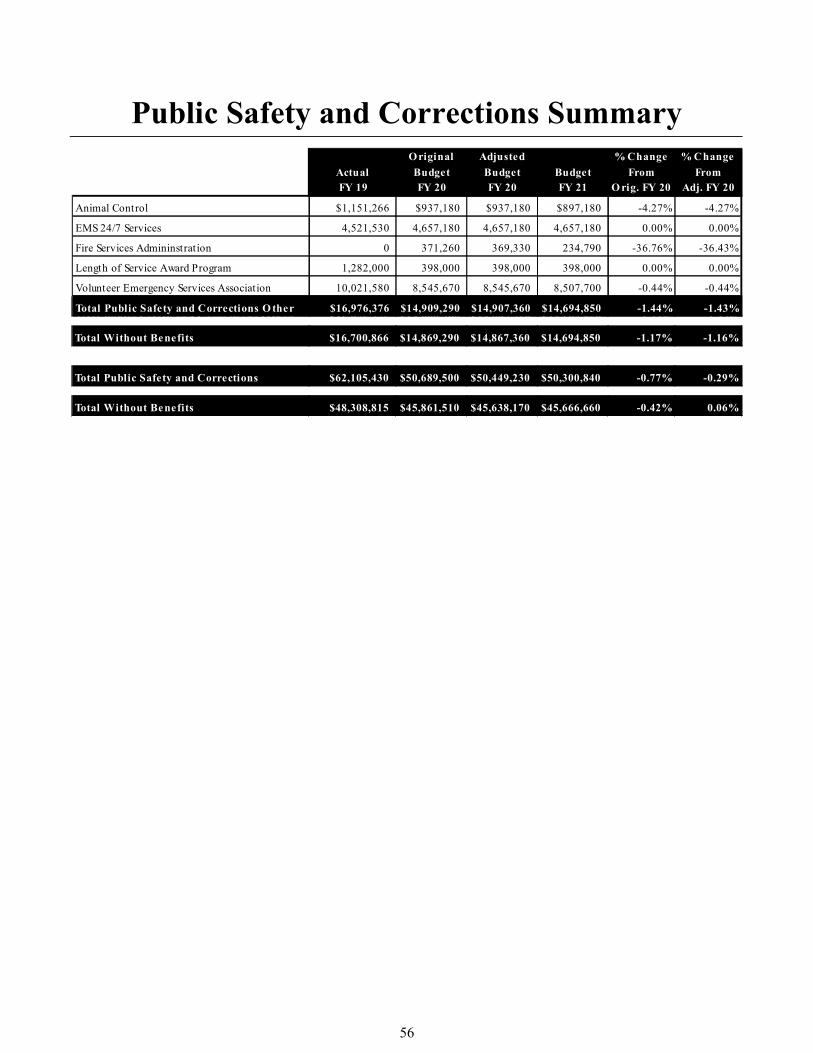
Public Safety and Corrections Summary
Original Adjusted % Change % Change
Actual Budget Budget Budget From FromFY 19 FY 20 FY 20 FY 21 O rig. FY 20 Adj. FY 20
Animal Control $1,151,266 $937,180 $937,180 $897,180 -4.27% -4.27%
EMS 24/7 Services 4,521,530 4,657,180 4,657,180 4,657,180 0.00% 0.00%
Fire Services Admininstration 0 371,260 369,330 234,790 -36.76% -36.43%
Length of Service Award Program 1,282,000 398,000 398,000 398,000 0.00% 0.00%
Volunteer Emergency Services Association 10,021,580 8,545,670 8,545,670 8,507,700 -0.44% -0.44%
Total Public Safety and Corrections O ther $16,976,376 $14,909,290 $14,907,360 $14,694,850 -1.44% -1.43%Total Public Safety and Corrections O ther $16,976,376 $14,909,290 $14,907,360 $14,694,850 -1.44% -1.43%
Total Without Benefits $16,700,866 $14,869,290 $14,867,360 $14,694,850 -1.17% -1.16%
Total Public Safety and Corrections $62,105,430 $50,689,500 $50,449,230 $50,300,840 -0.77% -0.29%
Total Without Benefits $48,308,815 $45,861,510 $45,638,170 $45,666,660 -0.42% 0.06%
56
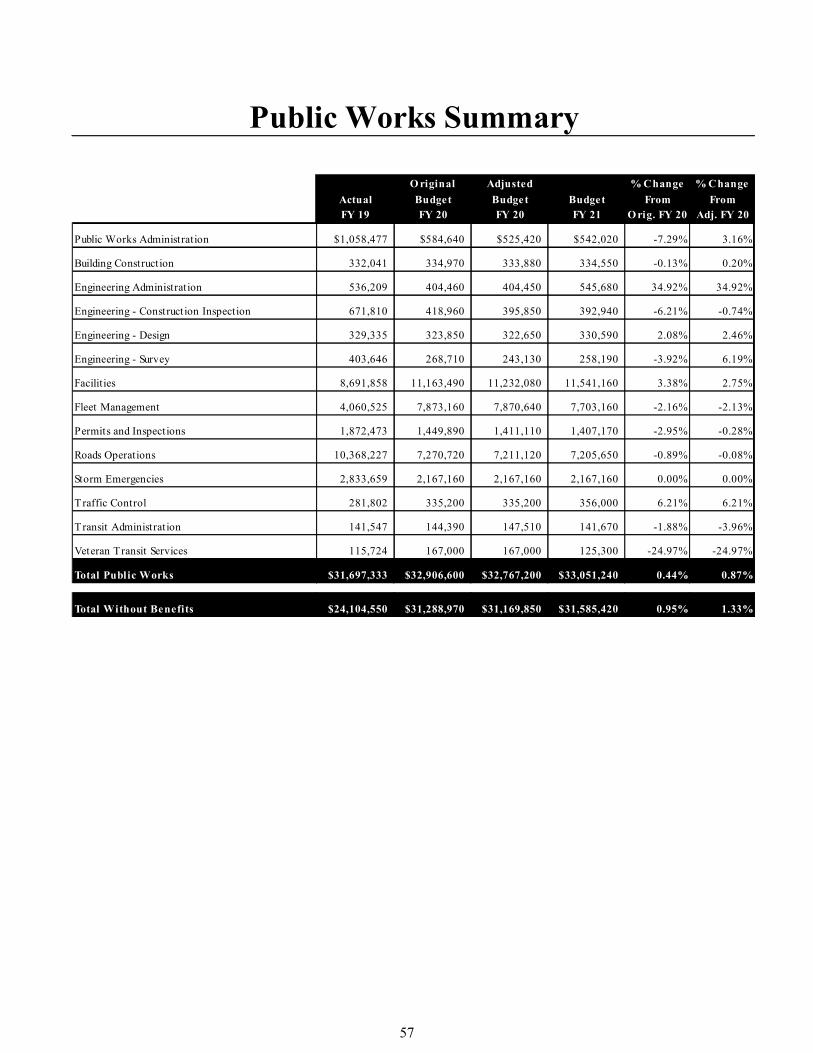
Public Works Summary
O riginal Adjusted % Change % Change
Actual Budget Budget Budget From FromFY 19 FY 20 FY 20 FY 21 O rig. FY 20 Adj. FY 20
Public Works Administration $1,058,477 $584,640 $525,420 $542,020 -7.29% 3.16%
Building Construction 332,041 334,970 333,880 334,550 -0.13% 0.20%
Engineering Administration 536,209 404,460 404,450 545,680 34.92% 34.92%
Engineering - Construction Inspection 671,810 418,960 395,850 392,940 -6.21% -0.74%
Engineering - Design 329,335 323,850 322,650 330,590 2.08% 2.46%
Engineering - Survey 403,646 268,710 243,130 258,190 -3.92% 6.19%
Facilities 8,691,858 11,163,490 11,232,080 11,541,160 3.38% 2.75%
Fleet Management 4,060,525 7,873,160 7,870,640 7,703,160 -2.16% -2.13%
Permits and Inspections 1,872,473 1,449,890 1,411,110 1,407,170 -2.95% -0.28%
Roads Operations 10,368,227 7,270,720 7,211,120 7,205,650 -0.89% -0.08%
Storm Emergencies 2,833,659 2,167,160 2,167,160 2,167,160 0.00% 0.00%
Traffic Control 281,802 335,200 335,200 356,000 6.21% 6.21%
Transit Administrat ion 141,547 144,390 147,510 141,670 -1.88% -3.96%
Veteran Transit Services 115,724 167,000 167,000 125,300 -24.97% -24.97%
Total Public Works $31,697,333 $32,906,600 $32,767,200 $33,051,240 0.44% 0.87%
Total Without Benefits $24,104,550 $31,288,970 $31,169,850 $31,585,420 0.95% 1.33%
57
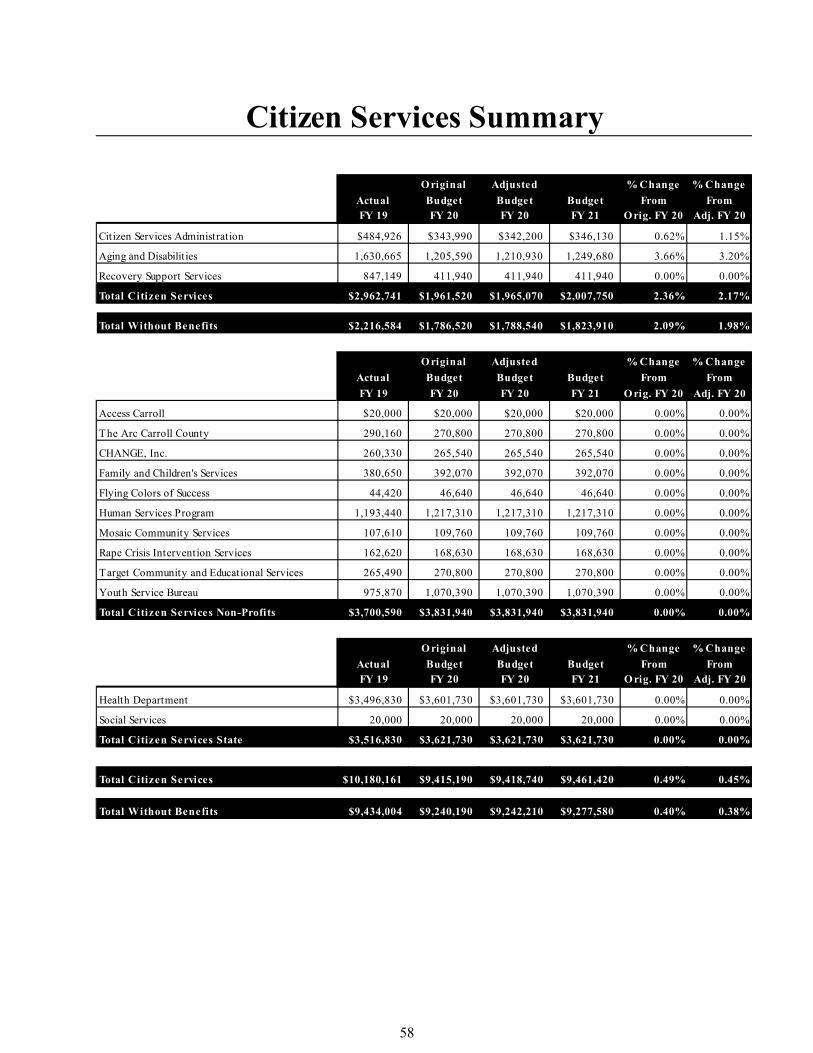
Citizen Services Summary
O riginal Adjusted % Change % ChangeActual Budget Budget Budget From FromFY 19 FY 20 FY 20 FY 21 O rig. FY 20 Adj. FY 20
Citizen Services Administration $484,926 $343,990 $342,200 $346,130 0.62% 1.15%
Aging and Disabilit ies 1,630,665 1,205,590 1,210,930 1,249,680 3.66% 3.20%
Recovery Support Services 847,149 411,940 411,940 411,940 0.00% 0.00%
Total Citizen Services $2,962,741 $1,961,520 $1,965,070 $2,007,750 2.36% 2.17%
Total Without Benefits $2,216,584 $1,786,520 $1,788,540 $1,823,910 2.09% 1.98%
O riginal Adjusted % Change % ChangeActual Budget Budget Budget From FromFY 19 FY 20 FY 20 FY 21 O rig. FY 20 Adj. FY 20
Access Carroll $20,000 $20,000 $20,000 $20,000 0.00% 0.00%
The Arc Carroll County 290,160 270,800 270,800 270,800 0.00% 0.00%
CHANGE, Inc. 260,330 265,540 265,540 265,540 0.00% 0.00%
Family and Children's Services 380,650 392,070 392,070 392,070 0.00% 0.00%
Flying Colors of Success 44,420 46,640 46,640 46,640 0.00% 0.00%
Human Services Program 1,193,440 1,217,310 1,217,310 1,217,310 0.00% 0.00%
Mosaic Community Services 107,610 109,760 109,760 109,760 0.00% 0.00%
Rape Crisis Intervention Services 162,620 168,630 168,630 168,630 0.00% 0.00%
Target Community and Educational Services 265,490 270,800 270,800 270,800 0.00% 0.00%
Youth Service Bureau 975,870 1,070,390 1,070,390 1,070,390 0.00% 0.00%
Total Citizen Services Non-Profits $3,700,590 $3,831,940 $3,831,940 $3,831,940 0.00% 0.00%
O riginal Adjusted % Change % ChangeActual Budget Budget Budget From FromFY 19 FY 20 FY 20 FY 21 O rig. FY 20 Adj. FY 20
Health Department $3,496,830 $3,601,730 $3,601,730 $3,601,730 0.00% 0.00%
Social Services 20,000 20,000 20,000 20,000 0.00% 0.00%
Total Citizen Services State $3,516,830 $3,621,730 $3,621,730 $3,621,730 0.00% 0.00%
Total Citizen Services $10,180,161 $9,415,190 $9,418,740 $9,461,420 0.49% 0.45%
Total Without Benefits $9,434,004 $9,240,190 $9,242,210 $9,277,580 0.40% 0.38%
58
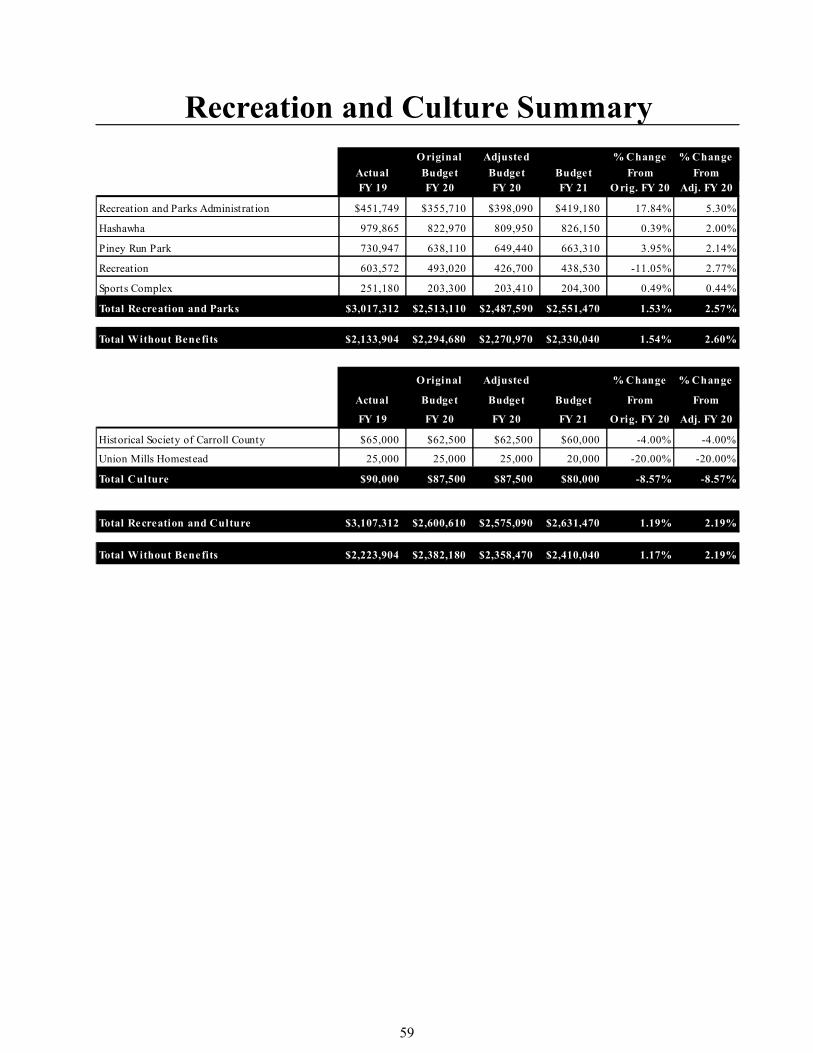
Recreation and Culture SummaryOriginal Adjusted % Change % Change
Actual Budget Budget Budget From FromFY 19 FY 20 FY 20 FY 21 O rig. FY 20 Adj. FY 20
Recreation and Parks Administrat ion $451,749 $355,710 $398,090 $419,180 17.84% 5.30%
Hashawha 979,865 822,970 809,950 826,150 0.39% 2.00%
Piney Run Park 730,947 638,110 649,440 663,310 3.95% 2.14%
Recreation 603,572 493,020 426,700 438,530 -11.05% 2.77%
Sports Complex 251,180 203,300 203,410 204,300 0.49% 0.44%
Total Recreation and Parks $3,017,312 $2,513,110 $2,487,590 $2,551,470 1.53% 2.57%0 $0 $0 $0 $0 0.00% 0.00%
Total Without Benefits $2,133,904 $2,294,680 $2,270,970 $2,330,040 1.54% 2.60%
Original Adjusted % Change % Change
Actual Budget Budget Budget From From
FY 19 FY 20 FY 20 FY 21 O rig. FY 20 Adj. FY 20
Historical Society of Carroll County $65,000 $62,500 $62,500 $60,000 -4.00% -4.00%
Union Mills Homestead 25,000 25,000 25,000 20,000 -20.00% -20.00%
Total Culture $90,000 $87,500 $87,500 $80,000 -8.57% -8.57%
Total Recreation and Culture $3,107,312 $2,600,610 $2,575,090 $2,631,470 1.19% 2.19%
Total Without Benefits $2,223,904 $2,382,180 $2,358,470 $2,410,040 1.17% 2.19%
59
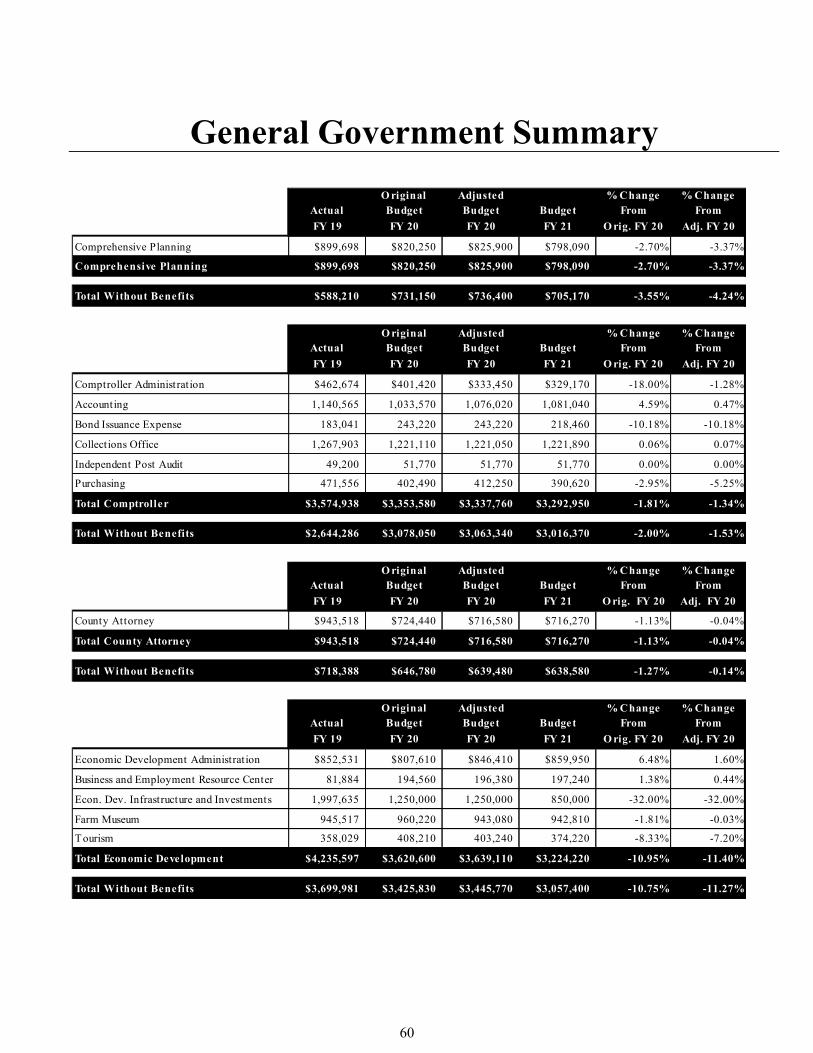
General Government Summary
O riginal Adjusted % Change % ChangeActual Budget Budget Budget From From
FY 19 FY 20 FY 20 FY 21 O rig. FY 20 Adj. FY 20
Comprehensive Planning $899,698 $820,250 $825,900 $798,090 -2.70% -3.37%
Comprehensive Planning $899,698 $820,250 $825,900 $798,090 -2.70% -3.37%
Total Without Benefits $588,210 $731,150 $736,400 $705,170 -3.55% -4.24%
O riginal Adjusted % Change % ChangeActual Budget Budget Budget From From
FY 19 FY 20 FY 20 FY 21 O rig. FY 20 Adj. FY 20
Comptroller Administrat ion $462,674 $401,420 $333,450 $329,170 -18.00% -1.28%
Accounting 1,140,565 1,033,570 1,076,020 1,081,040 4.59% 0.47%
Bond Issuance Expense 183,041 243,220 243,220 218,460 -10.18% -10.18%
Collections Office 1,267,903 1,221,110 1,221,050 1,221,890 0.06% 0.07%
Independent Post Audit 49,200 51,770 51,770 51,770 0.00% 0.00%
Purchasing 471,556 402,490 412,250 390,620 -2.95% -5.25%
Total Comptroller $3,574,938 $3,353,580 $3,337,760 $3,292,950 -1.81% -1.34%0 $0 $0 $0 $0 0.00% 0.00%
Total Without Benefits $2,644,286 $3,078,050 $3,063,340 $3,016,370 -2.00% -1.53%
O riginal Adjusted % Change % ChangeActual Budget Budget Budget From From
FY 19 FY 20 FY 20 FY 21 O rig. FY 20 Adj. FY 20
County Attorney $943,518 $724,440 $716,580 $716,270 -1.13% -0.04%
Total County Attorney $943,518 $724,440 $716,580 $716,270 -1.13% -0.04%
Total Without Benefits $718,388 $646,780 $639,480 $638,580 -1.27% -0.14%
O riginal Adjusted % Change % ChangeActual Budget Budget Budget From From
FY 19 FY 20 FY 20 FY 21 O rig. FY 20 Adj. FY 20
Economic Development Administrat ion $852,531 $807,610 $846,410 $859,950 6.48% 1.60%
Business and Employment Resource Center 81,884 194,560 196,380 197,240 1.38% 0.44%
Econ. Dev. Infrastructure and Investments 1,997,635 1,250,000 1,250,000 850,000 -32.00% -32.00%
Farm Museum 945,517 960,220 943,080 942,810 -1.81% -0.03%
Tourism 358,029 408,210 403,240 374,220 -8.33% -7.20%
Total Economic Development $4,235,597 $3,620,600 $3,639,110 $3,224,220 -10.95% -11.40%
Total Without Benefits $3,699,981 $3,425,830 $3,445,770 $3,057,400 -10.75% -11.27%
60
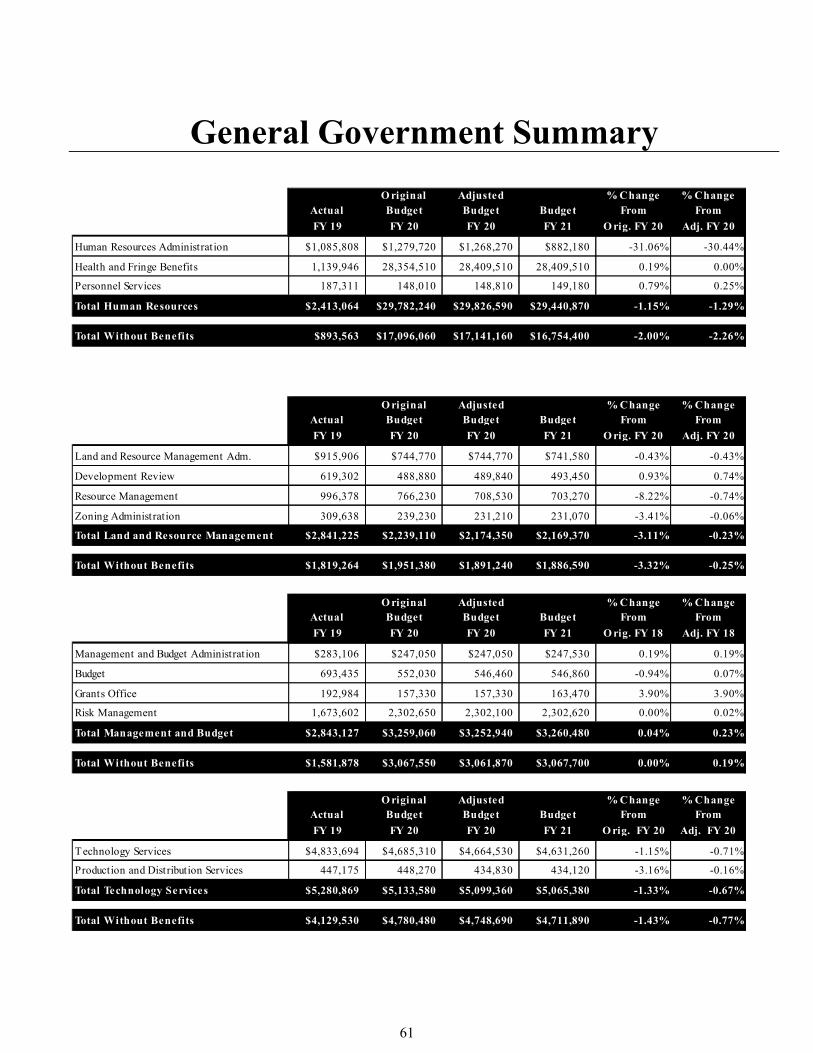
General Government Summary
O riginal Adjusted % Change % ChangeActual Budget Budget Budget From From
FY 19 FY 20 FY 20 FY 21 O rig. FY 20 Adj. FY 20
Human Resources Administrat ion $1,085,808 $1,279,720 $1,268,270 $882,180 -31.06% -30.44%
Health and Fringe Benefits 1,139,946 28,354,510 28,409,510 28,409,510 0.19% 0.00%
Personnel Services 187,311 148,010 148,810 149,180 0.79% 0.25%
Total Human Resources $2,413,064 $29,782,240 $29,826,590 $29,440,870 -1.15% -1.29%
Total Without Benefits $893,563 $17,096,060 $17,141,160 $16,754,400 -2.00% -2.26%
O riginal Adjusted % Change % ChangeActual Budget Budget Budget From From
FY 19 FY 20 FY 20 FY 21 O rig. FY 20 Adj. FY 20
Land and Resource Management Adm. $915,906 $744,770 $744,770 $741,580 -0.43% -0.43%
Development Review 619,302 488,880 489,840 493,450 0.93% 0.74%
Resource Management 996,378 766,230 708,530 703,270 -8.22% -0.74%
Zoning Administration 309,638 239,230 231,210 231,070 -3.41% -0.06%
Total Land and Resource Management $2,841,225 $2,239,110 $2,174,350 $2,169,370 -3.11% -0.23%
Total Without Benefits $1,819,264 $1,951,380 $1,891,240 $1,886,590 -3.32% -0.25%
O riginal Adjusted % Change % ChangeActual Budget Budget Budget From From
FY 19 FY 20 FY 20 FY 21 O rig. FY 18 Adj. FY 18
Management and Budget Administrat ion $283,106 $247,050 $247,050 $247,530 0.19% 0.19%
Budget 693,435 552,030 546,460 546,860 -0.94% 0.07%
Grants Office 192,984 157,330 157,330 163,470 3.90% 3.90%
Risk Management 1,673,602 2,302,650 2,302,100 2,302,620 0.00% 0.02%
Total Management and Budget $2,843,127 $3,259,060 $3,252,940 $3,260,480 0.04% 0.23%
Total Without Benefits $1,581,878 $3,067,550 $3,061,870 $3,067,700 0.00% 0.19%
O riginal Adjusted % Change % ChangeActual Budget Budget Budget From From
FY 19 FY 20 FY 20 FY 21 O rig. FY 20 Adj. FY 20
Technology Services $4,833,694 $4,685,310 $4,664,530 $4,631,260 -1.15% -0.71%
Production and Distribution Services 447,175 448,270 434,830 434,120 -3.16% -0.16%
Total Technology Services $5,280,869 $5,133,580 $5,099,360 $5,065,380 -1.33% -0.67%
Total Without Benefits $4,129,530 $4,780,480 $4,748,690 $4,711,890 -1.43% -0.77%
61
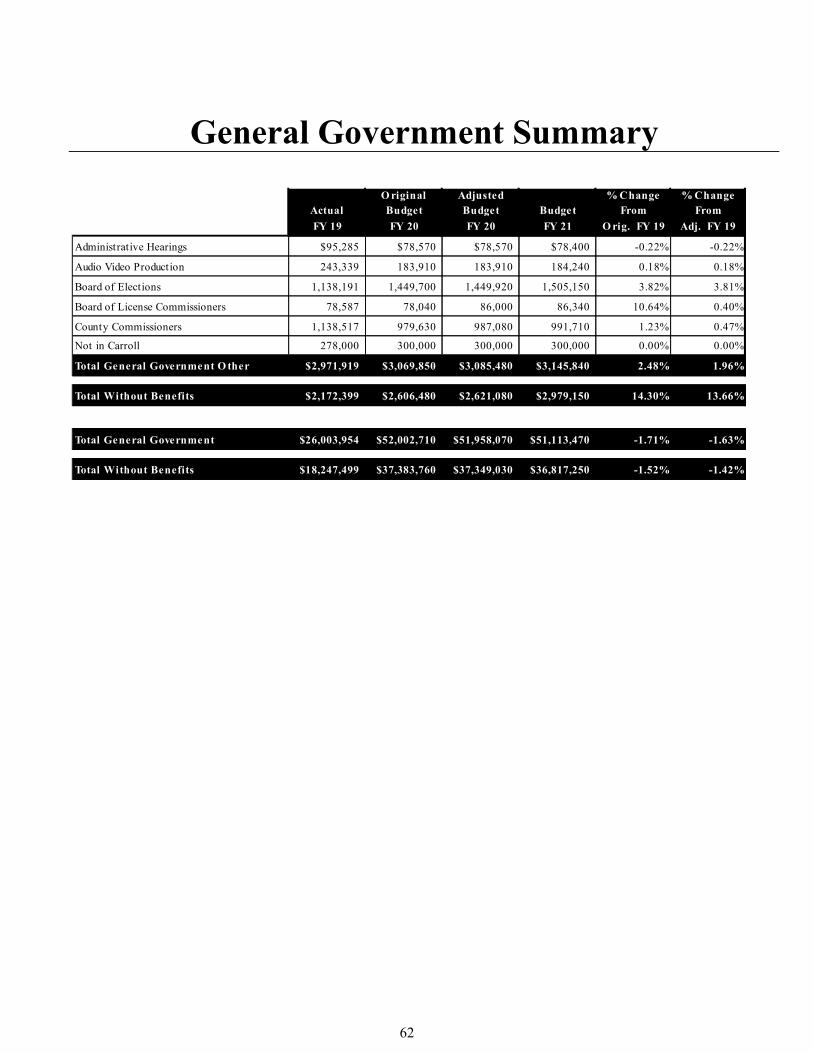
General Government Summary
O riginal Adjusted % Change % ChangeActual Budget Budget Budget From From
FY 19 FY 20 FY 20 FY 21 O rig. FY 19 Adj. FY 19
Administrative Hearings $95,285 $78,570 $78,570 $78,400 -0.22% -0.22%
Audio Video Production 243,339 183,910 183,910 184,240 0.18% 0.18%
Board of Elections 1,138,191 1,449,700 1,449,920 1,505,150 3.82% 3.81%
Board of License Commissioners 78,587 78,040 86,000 86,340 10.64% 0.40%
County Commissioners 1,138,517 979,630 987,080 991,710 1.23% 0.47%
Not in Carroll 278,000 300,000 300,000 300,000 0.00% 0.00%
Total General Government O ther $2,971,919 $3,069,850 $3,085,480 $3,145,840 2.48% 1.96%
Total Without Benefits $2,172,399 $2,606,480 $2,621,080 $2,979,150 14.30% 13.66%
Total General Government $26,003,954 $52,002,710 $51,958,070 $51,113,470 -1.71% -1.63%
Total Without Benefits $18,247,499 $37,383,760 $37,349,030 $36,817,250 -1.52% -1.42%
62
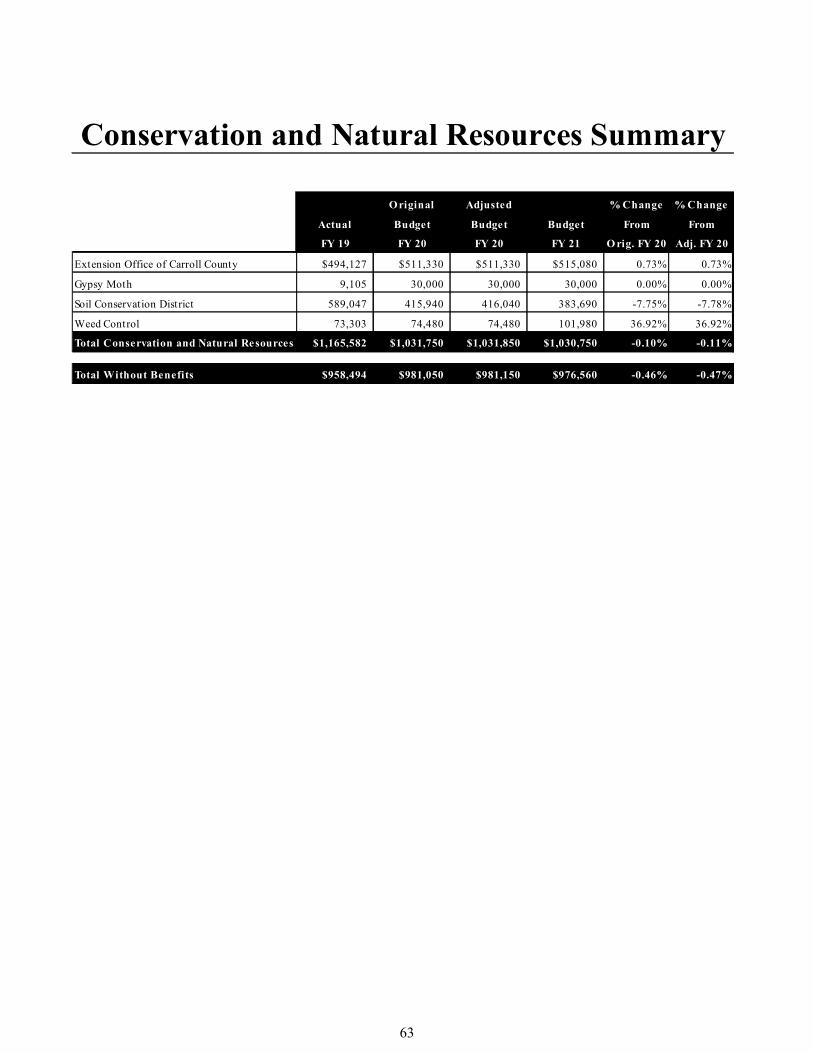
Conservation and Natural Resources Summary
Original Adjusted % Change % Change
Actual Budget Budget Budget From From
FY 19 FY 20 FY 20 FY 21 O rig. FY 20 Adj. FY 20
Extension Office of Carroll County $494,127 $511,330 $511,330 $515,080 0.73% 0.73%
Gypsy Moth 9,105 30,000 30,000 30,000 0.00% 0.00%
Soil Conservation District 589,047 415,940 416,040 383,690 -7.75% -7.78%
Weed Control 73,303 74,480 74,480 101,980 36.92% 36.92%
Total Conservation and Natural Resources $1,165,582 $1,031,750 $1,031,850 $1,030,750 -0.10% -0.11%
Total Without Benefits $958,494 $981,050 $981,150 $976,560 -0.46% -0.47%
63
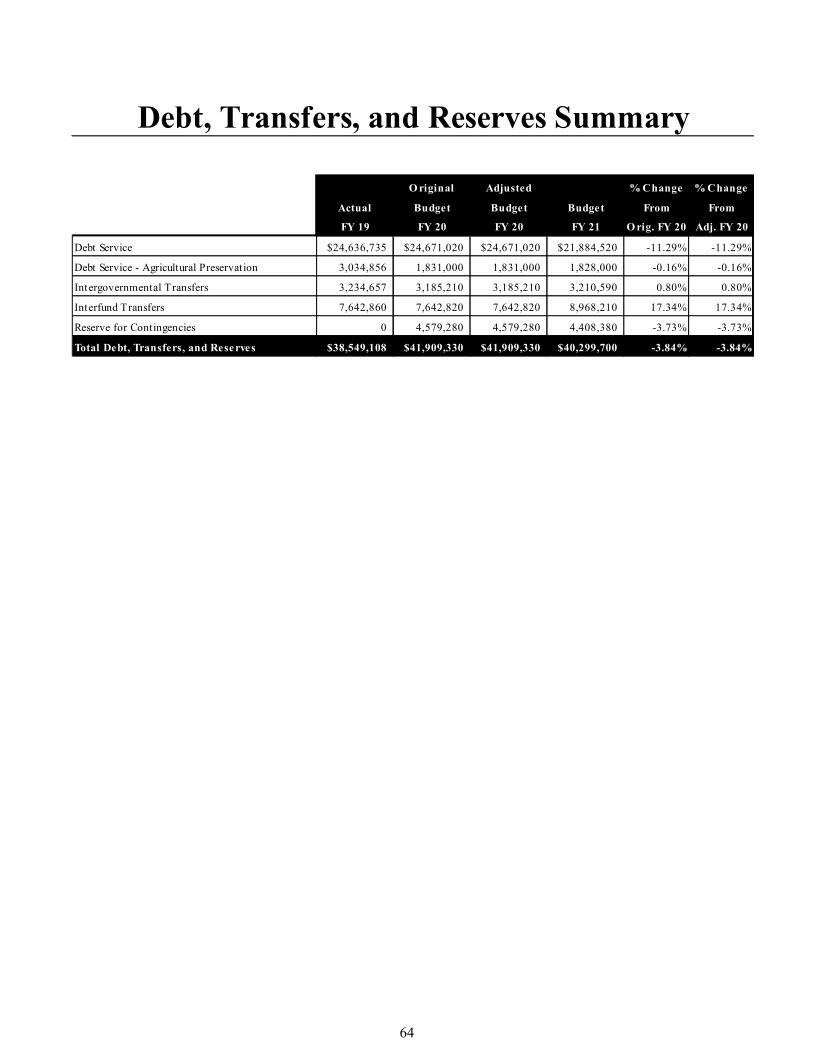
Debt, Transfers, and Reserves Summary
O riginal Adjusted % Change % Change
Actual Budget Budget Budget From From
FY 19 FY 20 FY 20 FY 21 O rig. FY 20 Adj. FY 20
Debt Service $24,636,735 $24,671,020 $24,671,020 $21,884,520 -11.29% -11.29%
Debt Service - Agricultural Preservation 3,034,856 1,831,000 1,831,000 1,828,000 -0.16% -0.16%
Intergovernmental Transfers 3,234,657 3,185,210 3,185,210 3,210,590 0.80% 0.80%
Interfund Transfers 7,642,860 7,642,820 7,642,820 8,968,210 17.34% 17.34%
Reserve for Contingencies 0 4,579,280 4,579,280 4,408,380 -3.73% -3.73%
Total Debt, Transfers, and Reserves $38,549,108 $41,909,330 $41,909,330 $40,299,700 -3.84% -3.84%
64

Capital Fund Summary
65

66
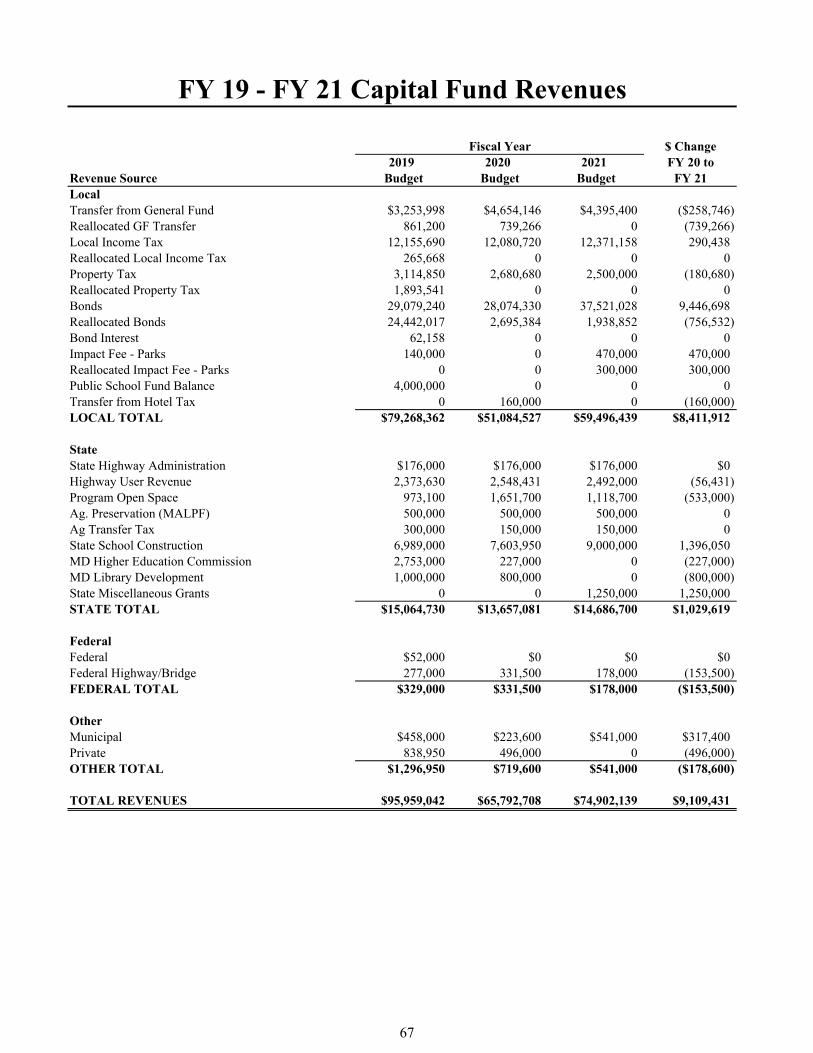
$ Change2019 2020 2021 FY 20 to
Revenue Source Budget Budget Budget FY 21LocalTransfer from General Fund $3,253,998 $4,654,146 $4,395,400 ($258,746)Reallocated GF Transfer 861,200 739,266 0 (739,266)Local Income Tax 12,155,690 12,080,720 12,371,158 290,438Reallocated Local Income Tax 265,668 0 0 0Property Tax 3,114,850 2,680,680 2,500,000 (180,680)Reallocated Property Tax 1,893,541 0 0 0Bonds 29,079,240 28,074,330 37,521,028 9,446,698Reallocated Bonds 24,442,017 2,695,384 1,938,852 (756,532)Bond Interest 62,158 0 0 0Impact Fee - Parks 140,000 0 470,000 470,000Reallocated Impact Fee - Parks 0 0 300,000 300,000Public School Fund Balance 4,000,000 0 0 0Transfer from Hotel Tax 0 160,000 0 (160,000)LOCAL TOTAL $79,268,362 $51,084,527 $59,496,439 $8,411,912
StateState Highway Administration $176,000 $176,000 $176,000 $0Highway User Revenue 2,373,630 2,548,431 2,492,000 (56,431)Program Open Space 973,100 1,651,700 1,118,700 (533,000)Ag. Preservation (MALPF) 500,000 500,000 500,000 0Ag Transfer Tax 300,000 150,000 150,000 0State School Construction 6,989,000 7,603,950 9,000,000 1,396,050MD Higher Education Commission 2,753,000 227,000 0 (227,000)MD Library Development 1,000,000 800,000 0 (800,000)State Miscellaneous Grants 0 0 1,250,000 1,250,000STATE TOTAL $15,064,730 $13,657,081 $14,686,700 $1,029,619
FederalFederal $52,000 $0 $0 $0Federal Highway/Bridge 277,000 331,500 178,000 (153,500)FEDERAL TOTAL $329,000 $331,500 $178,000 ($153,500)
OtherMunicipal $458,000 $223,600 $541,000 $317,400Private 838,950 496,000 0 (496,000)OTHER TOTAL $1,296,950 $719,600 $541,000 ($178,600)
TOTAL REVENUES $95,959,042 $65,792,708 $74,902,139 $9,109,431
FY 19 - FY 21 Capital Fund Revenues
Fiscal Year
67
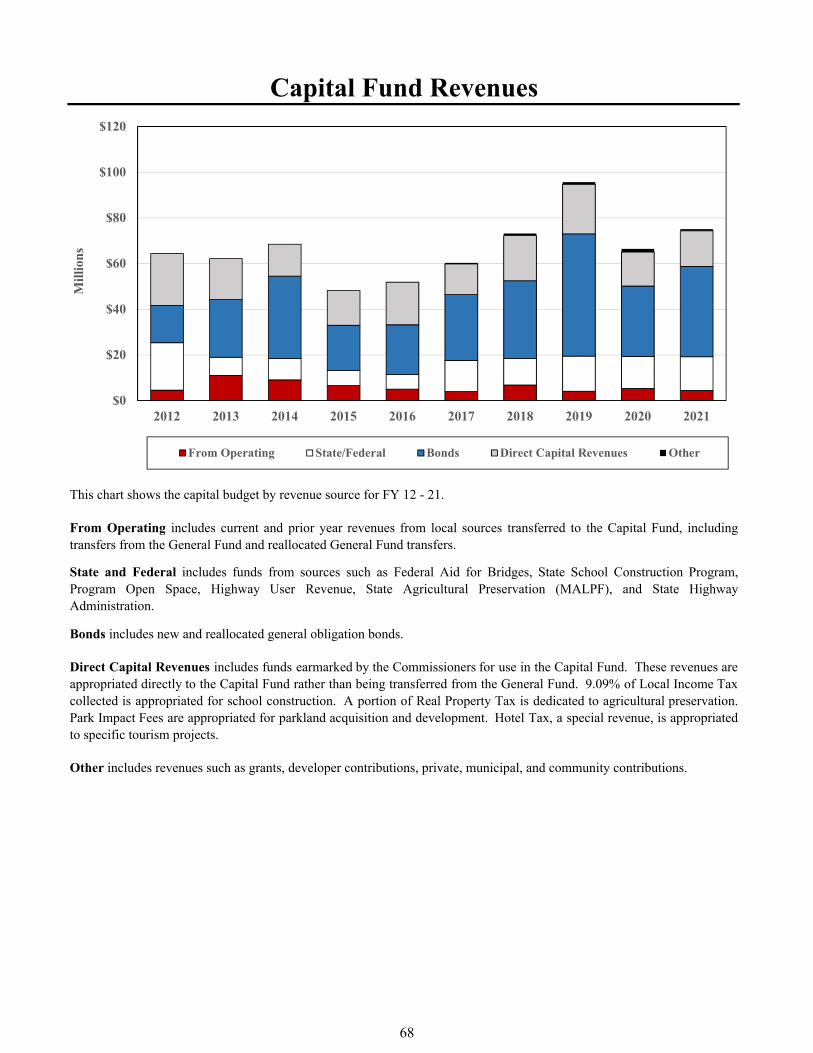
8140530
Other includes revenues such as grants, developer contributions, private, municipal, and community contributions.
Capital Fund Revenues
This chart shows the capital budget by revenue source for FY 12 - 21.
From Operating includes current and prior year revenues from local sources transferred to the Capital Fund, includingtransfers from the General Fund and reallocated General Fund transfers.
State and Federal includes funds from sources such as Federal Aid for Bridges, State School Construction Program,Program Open Space, Highway User Revenue, State Agricultural Preservation (MALPF), and State HighwayAdministration.
Bonds includes new and reallocated general obligation bonds.
Direct Capital Revenues includes funds earmarked by the Commissioners for use in the Capital Fund. These revenues areappropriated directly to the Capital Fund rather than being transferred from the General Fund. 9.09% of Local Income Taxcollected is appropriated for school construction. A portion of Real Property Tax is dedicated to agricultural preservation.Park Impact Fees are appropriated for parkland acquisition and development. Hotel Tax, a special revenue, is appropriatedto specific tourism projects.
$0
$20
$40
$60
$80
$100
$120
2012 2013 2014 2015 2016 2017 2018 2019 2020 2021
Mill
ion
s
From Operating State/Federal Bonds Direct Capital Revenues Other
68
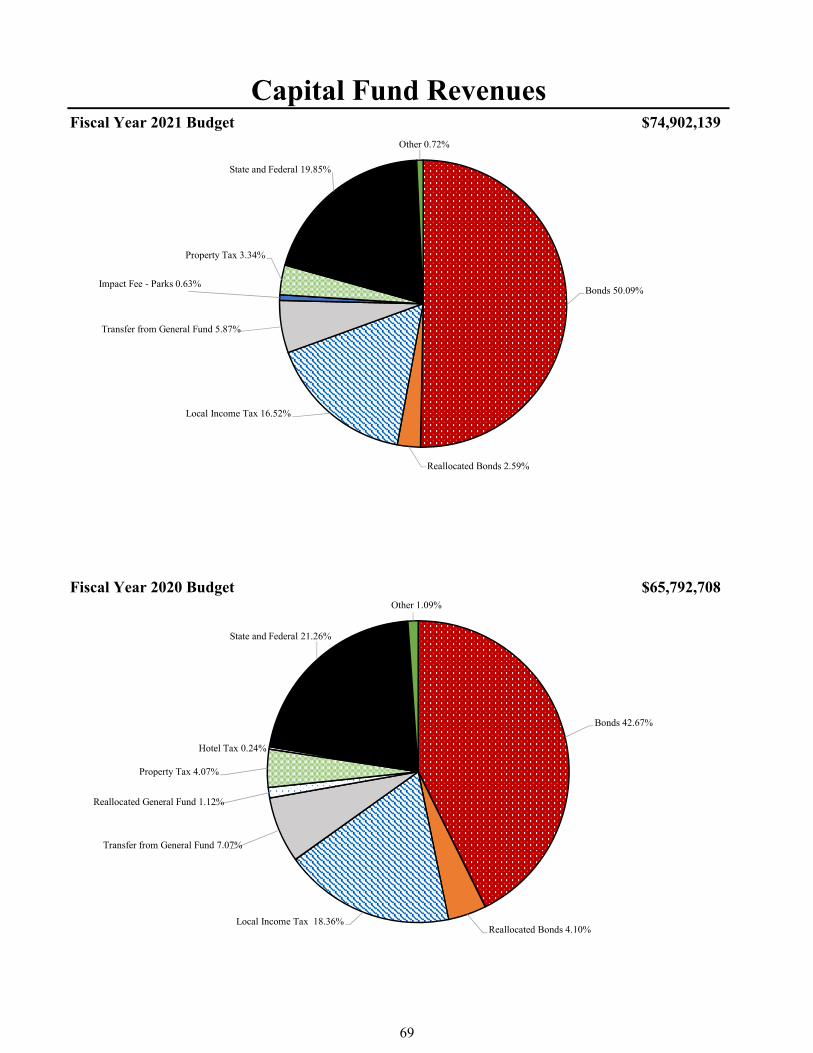
8140530
Fiscal Year 2020 Budget
Fiscal Year 2021 Budget $74,902,139
Capital Fund Revenues
$65,792,708
Bonds 42.67%
Reallocated Bonds 4.10%Local Income Tax 18.36%
Transfer from General Fund 7.07%
Reallocated General Fund 1.12%
Property Tax 4.07%
Hotel Tax 0.24%
State and Federal 21.26%
Other 1.09%
Bonds 50.09%
Reallocated Bonds 2.59%
Local Income Tax 16.52%
Transfer from General Fund 5.87%
Impact Fee - Parks 0.63%
Property Tax 3.34%
State and Federal 19.85%
Other 0.72%
69
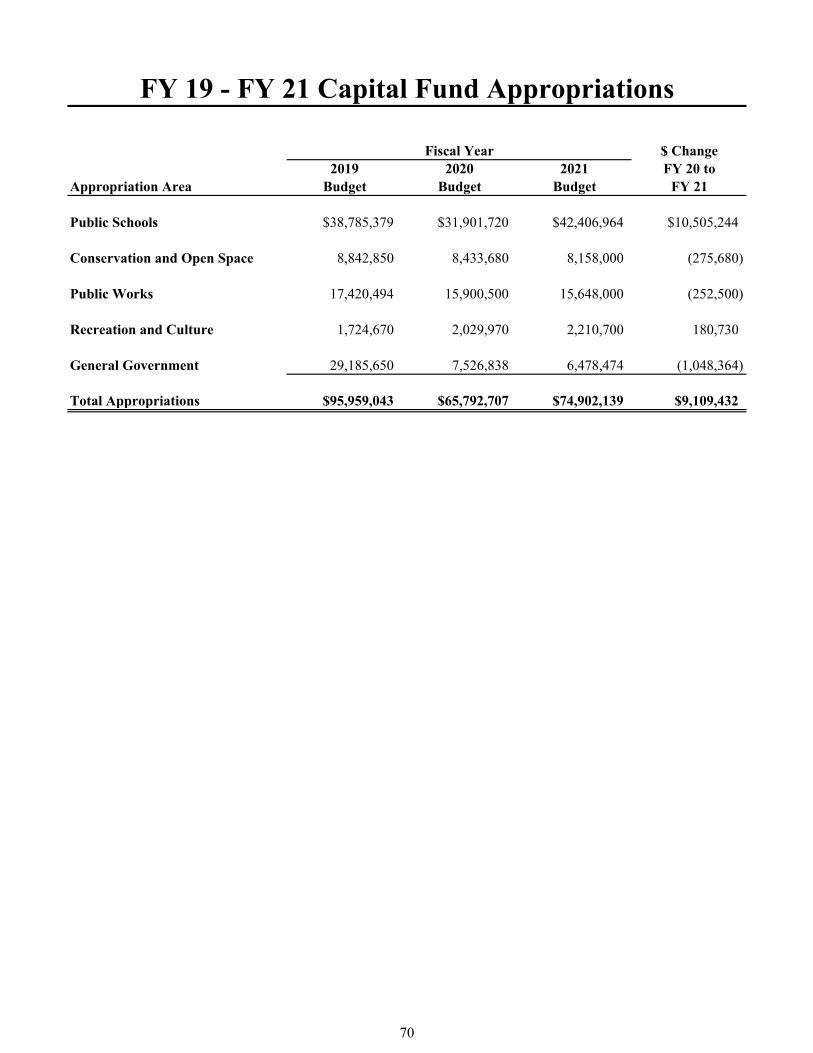
$ Change2019 2020 2021 FY 20 to
Appropriation Area Budget Budget Budget FY 21
Public Schools $38,785,379 $31,901,720 $42,406,964 $10,505,244
Conservation and Open Space 8,842,850 8,433,680 8,158,000 (275,680)
Public Works 17,420,494 15,900,500 15,648,000 (252,500)
Recreation and Culture 1,724,670 2,029,970 2,210,700 180,730
General Government 29,185,650 7,526,838 6,478,474 (1,048,364)
Total Appropriations $95,959,043 $65,792,707 $74,902,139 $9,109,432
Fiscal Year
FY 19 - FY 21 Capital Fund Appropriations
70
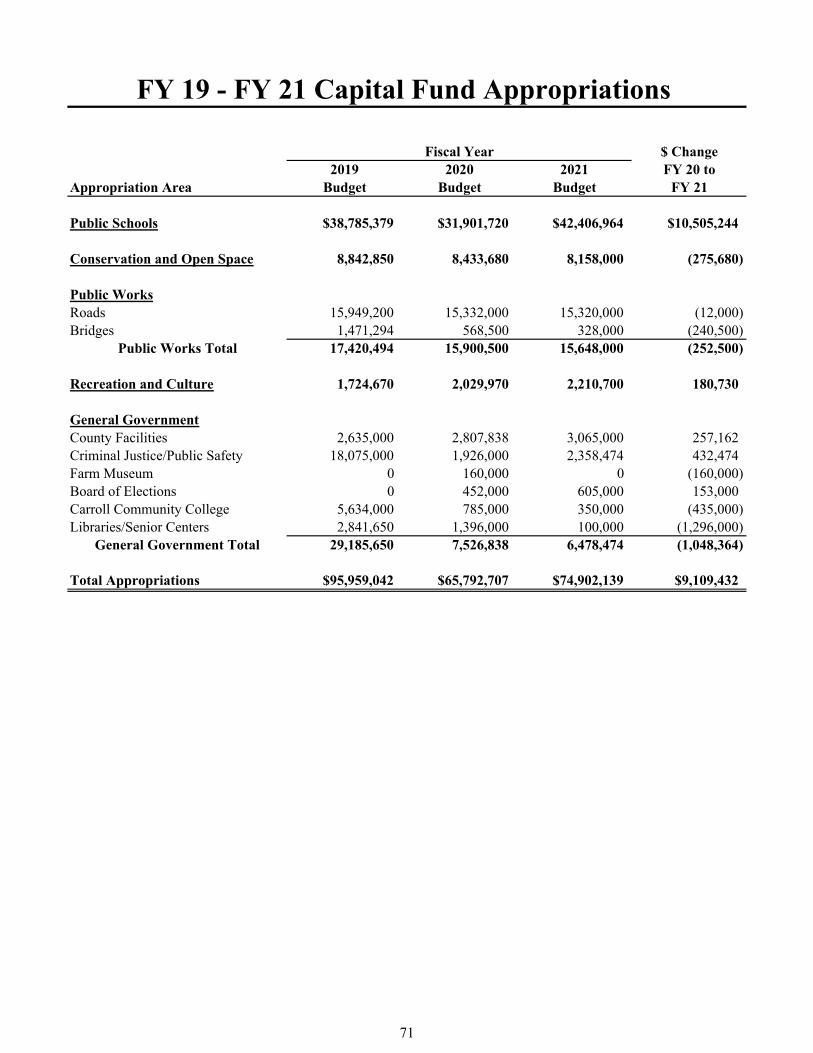
$ Change2019 2020 2021 FY 20 to
Appropriation Area Budget Budget Budget FY 21
Public Schools $38,785,379 $31,901,720 $42,406,964 $10,505,244
Conservation and Open Space 8,842,850 8,433,680 8,158,000 (275,680)
Public WorksRoads 15,949,200 15,332,000 15,320,000 (12,000)Bridges 1,471,294 568,500 328,000 (240,500)
Public Works Total 17,420,494 15,900,500 15,648,000 (252,500)
Recreation and Culture 1,724,670 2,029,970 2,210,700 180,730
General GovernmentCounty Facilities 2,635,000 2,807,838 3,065,000 257,162Criminal Justice/Public Safety 18,075,000 1,926,000 2,358,474 432,474Farm Museum 0 160,000 0 (160,000)Board of Elections 0 452,000 605,000 153,000Carroll Community College 5,634,000 785,000 350,000 (435,000)Libraries/Senior Centers 2,841,650 1,396,000 100,000 (1,296,000)
General Government Total 29,185,650 7,526,838 6,478,474 (1,048,364)
Total Appropriations $95,959,042 $65,792,707 $74,902,139 $9,109,432
FY 19 - FY 21 Capital Fund Appropriations
Fiscal Year
71
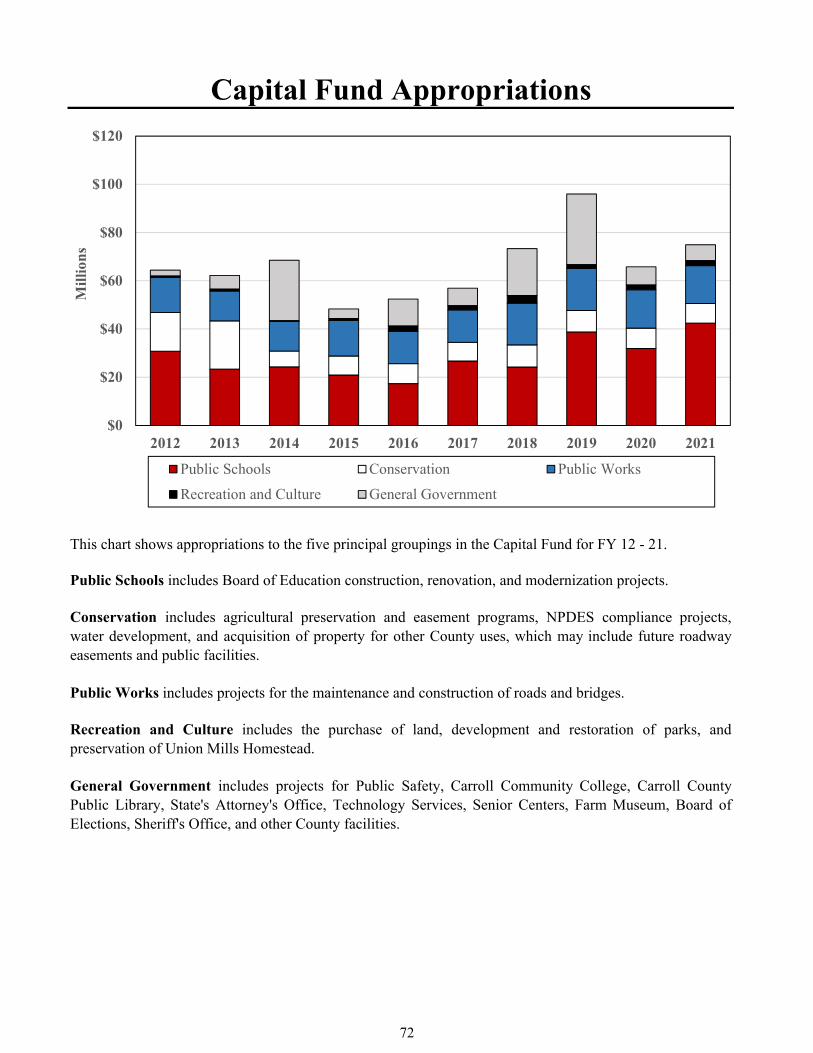
Recreation and Culture includes the purchase of land, development and restoration of parks, andpreservation of Union Mills Homestead.
General Government includes projects for Public Safety, Carroll Community College, Carroll CountyPublic Library, State's Attorney's Office, Technology Services, Senior Centers, Farm Museum, Board ofElections, Sheriff's Office, and other County facilities.
Capital Fund Appropriations
Public Schools includes Board of Education construction, renovation, and modernization projects.
Conservation includes agricultural preservation and easement programs, NPDES compliance projects,water development, and acquisition of property for other County uses, which may include future roadwayeasements and public facilities.
Public Works includes projects for the maintenance and construction of roads and bridges.
This chart shows appropriations to the five principal groupings in the Capital Fund for FY 12 - 21.
$0
$20
$40
$60
$80
$100
$120
2012 2013 2014 2015 2016 2017 2018 2019 2020 2021
Mill
ion
s
Public Schools Conservation Public Works
Recreation and Culture General Government
72

Capital Fund AppropriationsFiscal Year 2021 Budget $74,902,139
Fiscal Year 2020 Budget $65,792,707
Public Schools 56.62%
Conservation and Open Space 10.89%
Public Works 20.89%
Recreation and Culture 2.95%
General Government 8.65%
Public Schools 40.42%
Conservation and Open Space 9.22%Public Works 18.15%
Recreation and Culture 1.80%
General Government 30.41%
73
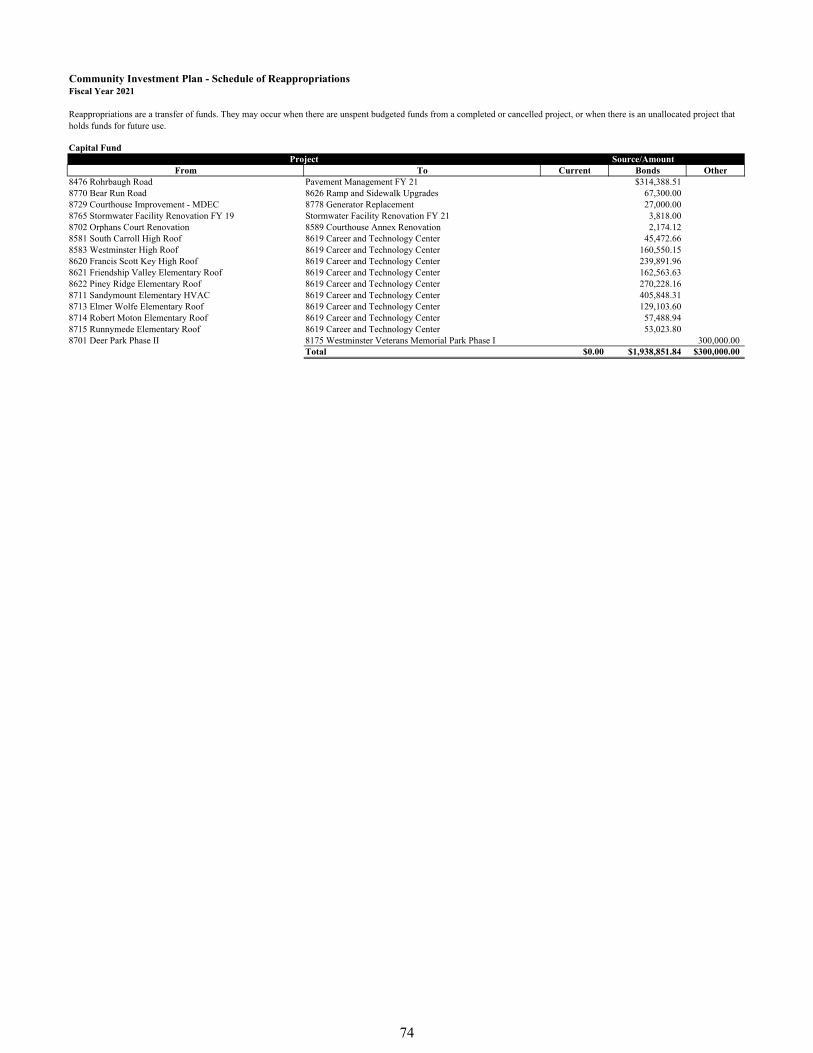
Community Investment Plan - Schedule of ReappropriationsFiscal Year 2021
Capital Fund
Current Bonds Other8476 Rohrbaugh Road Pavement Management FY 21 $314,388.518770 Bear Run Road 8626 Ramp and Sidewalk Upgrades 67,300.008729 Courthouse Improvement - MDEC 8778 Generator Replacement 27,000.008765 Stormwater Facility Renovation FY 19 Stormwater Facility Renovation FY 21 3,818.008702 Orphans Court Renovation 8589 Courthouse Annex Renovation 2,174.128581 South Carroll High Roof 8619 Career and Technology Center 45,472.668583 Westminster High Roof 8619 Career and Technology Center 160,550.158620 Francis Scott Key High Roof 8619 Career and Technology Center 239,891.968621 Friendship Valley Elementary Roof 8619 Career and Technology Center 162,563.638622 Piney Ridge Elementary Roof 8619 Career and Technology Center 270,228.168711 Sandymount Elementary HVAC 8619 Career and Technology Center 405,848.318713 Elmer Wolfe Elementary Roof 8619 Career and Technology Center 129,103.608714 Robert Moton Elementary Roof 8619 Career and Technology Center 57,488.948715 Runnymede Elementary Roof 8619 Career and Technology Center 53,023.808701 Deer Park Phase II 8175 Westminster Veterans Memorial Park Phase I 300,000.00
Total $0.00 $1,938,851.84 $300,000.00
Reappropriations are a transfer of funds. They may occur when there are unspent budgeted funds from a completed or cancelled project, or when there is an unallocated project that holds funds for future use.
From ToProject Source/Amount
74
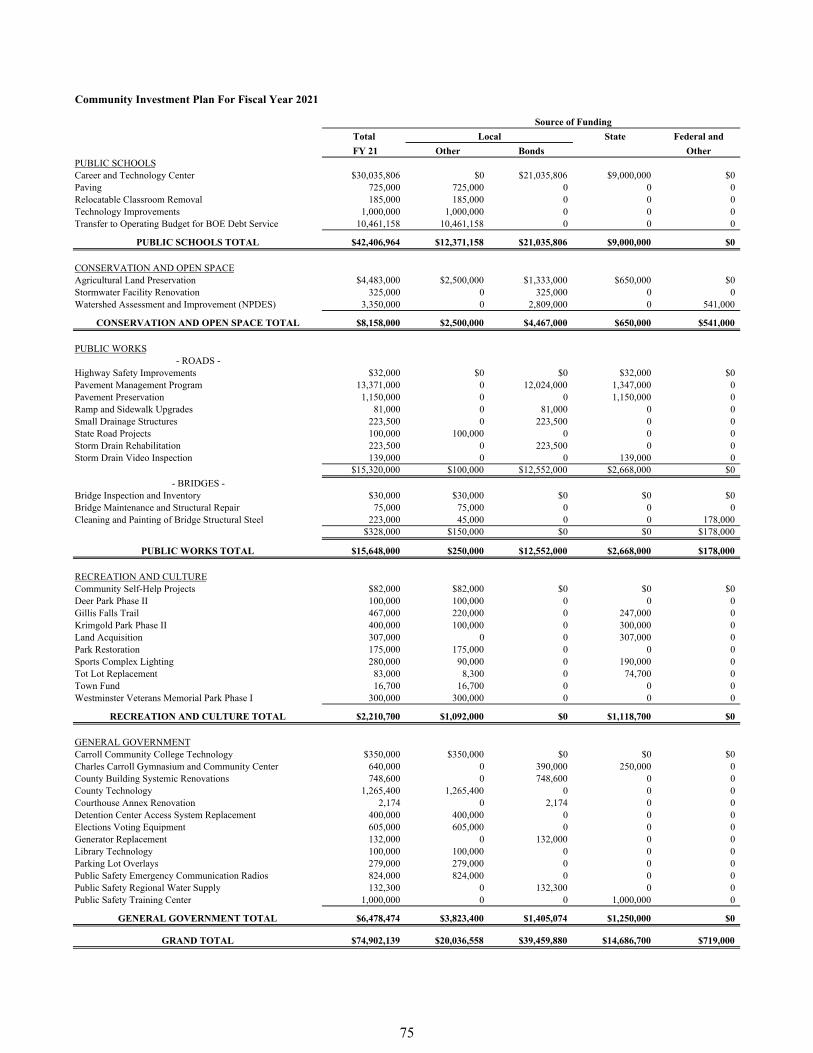
Community Investment Plan For Fiscal Year 2021
Total State Federal and
FY 21 Other Bonds OtherPUBLIC SCHOOLSCareer and Technology Center $30,035,806 $0 $21,035,806 $9,000,000 $0Paving 725,000 725,000 0 0 0Relocatable Classroom Removal 185,000 185,000 0 0 0Technology Improvements 1,000,000 1,000,000 0 0 0Transfer to Operating Budget for BOE Debt Service 10,461,158 10,461,158 0 0 0
PUBLIC SCHOOLS TOTAL $42,406,964 $12,371,158 $21,035,806 $9,000,000 $0
CONSERVATION AND OPEN SPACEAgricultural Land Preservation $4,483,000 $2,500,000 $1,333,000 $650,000 $0Stormwater Facility Renovation 325,000 0 325,000 0 0Watershed Assessment and Improvement (NPDES) 3,350,000 0 2,809,000 0 541,000
CONSERVATION AND OPEN SPACE TOTAL $8,158,000 $2,500,000 $4,467,000 $650,000 $541,000
PUBLIC WORKS- ROADS -
Highway Safety Improvements $32,000 $0 $0 $32,000 $0Pavement Management Program 13,371,000 0 12,024,000 1,347,000 0Pavement Preservation 1,150,000 0 0 1,150,000 0Ramp and Sidewalk Upgrades 81,000 0 81,000 0 0Small Drainage Structures 223,500 0 223,500 0 0State Road Projects 100,000 100,000 0 0 0Storm Drain Rehabilitation 223,500 0 223,500 0 0Storm Drain Video Inspection 139,000 0 0 139,000 0
$15,320,000 $100,000 $12,552,000 $2,668,000 $0
- BRIDGES -Bridge Inspection and Inventory $30,000 $30,000 $0 $0 $0Bridge Maintenance and Structural Repair 75,000 75,000 0 0 0Cleaning and Painting of Bridge Structural Steel 223,000 45,000 0 0 178,000
$328,000 $150,000 $0 $0 $178,000
PUBLIC WORKS TOTAL $15,648,000 $250,000 $12,552,000 $2,668,000 $178,000
RECREATION AND CULTURECommunity Self-Help Projects $82,000 $82,000 $0 $0 $0Deer Park Phase II 100,000 100,000 0 0 0Gillis Falls Trail 467,000 220,000 0 247,000 0Krimgold Park Phase II 400,000 100,000 0 300,000 0Land Acquisition 307,000 0 0 307,000 0Park Restoration 175,000 175,000 0 0 0Sports Complex Lighting 280,000 90,000 0 190,000 0Tot Lot Replacement 83,000 8,300 0 74,700 0Town Fund 16,700 16,700 0 0 0Westminster Veterans Memorial Park Phase I 300,000 300,000 0 0 0
RECREATION AND CULTURE TOTAL $2,210,700 $1,092,000 $0 $1,118,700 $0
GENERAL GOVERNMENTCarroll Community College Technology $350,000 $350,000 $0 $0 $0Charles Carroll Gymnasium and Community Center 640,000 0 390,000 250,000 0County Building Systemic Renovations 748,600 0 748,600 0 0County Technology 1,265,400 1,265,400 0 0 0Courthouse Annex Renovation 2,174 0 2,174 0 0Detention Center Access System Replacement 400,000 400,000 0 0 0Elections Voting Equipment 605,000 605,000 0 0 0Generator Replacement 132,000 0 132,000 0 0Library Technology 100,000 100,000 0 0 0Parking Lot Overlays 279,000 279,000 0 0 0Public Safety Emergency Communication Radios 824,000 824,000 0 0 0Public Safety Regional Water Supply 132,300 0 132,300 0 0Public Safety Training Center 1,000,000 0 0 1,000,000 0
GENERAL GOVERNMENT TOTAL $6,478,474 $3,823,400 $1,405,074 $1,250,000 $0
GRAND TOTAL $74,902,139 $20,036,558 $39,459,880 $14,686,700 $719,000
Local
Source of Funding
75

76
Capital Budget Summary
77

78
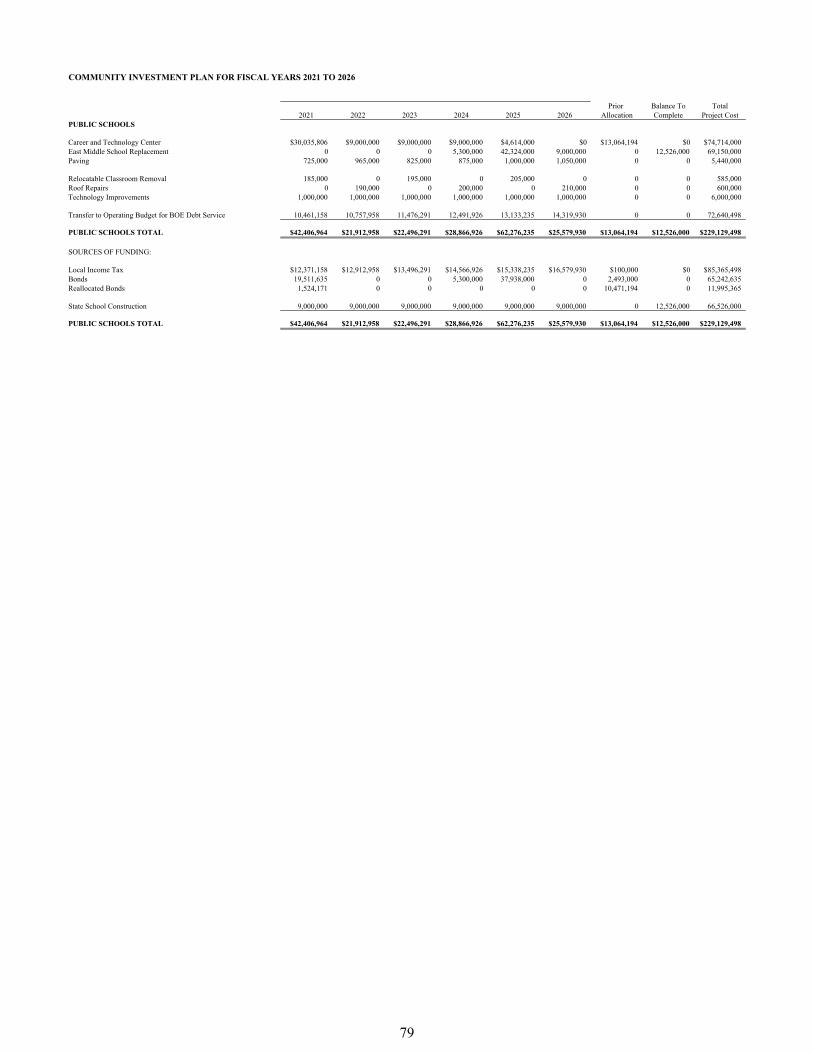
COMMUNITY INVESTMENT PLAN FOR FISCAL YEARS 2021 TO 2026
Prior Balance To Total2021 2022 2023 2024 2025 2026 Allocation Complete Project Cost
PUBLIC SCHOOLS
Career and Technology Center $30,035,806 $9,000,000 $9,000,000 $9,000,000 $4,614,000 $0 $13,064,194 $0 $74,714,000East Middle School Replacement 0 0 0 5,300,000 42,324,000 9,000,000 0 12,526,000 69,150,000Paving 725,000 965,000 825,000 875,000 1,000,000 1,050,000 0 0 5,440,000
Relocatable Classroom Removal 185,000 0 195,000 0 205,000 0 0 0 585,000Roof Repairs 0 190,000 0 200,000 0 210,000 0 0 600,000Technology Improvements 1,000,000 1,000,000 1,000,000 1,000,000 1,000,000 1,000,000 0 0 6,000,000
Transfer to Operating Budget for BOE Debt Service 10,461,158 10,757,958 11,476,291 12,491,926 13,133,235 14,319,930 0 0 72,640,498
PUBLIC SCHOOLS TOTAL $42,406,964 $21,912,958 $22,496,291 $28,866,926 $62,276,235 $25,579,930 $13,064,194 $12,526,000 $229,129,498
SOURCES OF FUNDING:
Local Income Tax $12,371,158 $12,912,958 $13,496,291 $14,566,926 $15,338,235 $16,579,930 $100,000 $0 $85,365,498Bonds 19,511,635 0 0 5,300,000 37,938,000 0 2,493,000 0 65,242,635Reallocated Bonds 1,524,171 0 0 0 0 0 10,471,194 0 11,995,365
State School Construction 9,000,000 9,000,000 9,000,000 9,000,000 9,000,000 9,000,000 0 12,526,000 66,526,000
PUBLIC SCHOOLS TOTAL $42,406,964 $21,912,958 $22,496,291 $28,866,926 $62,276,235 $25,579,930 $13,064,194 $12,526,000 $229,129,498
79
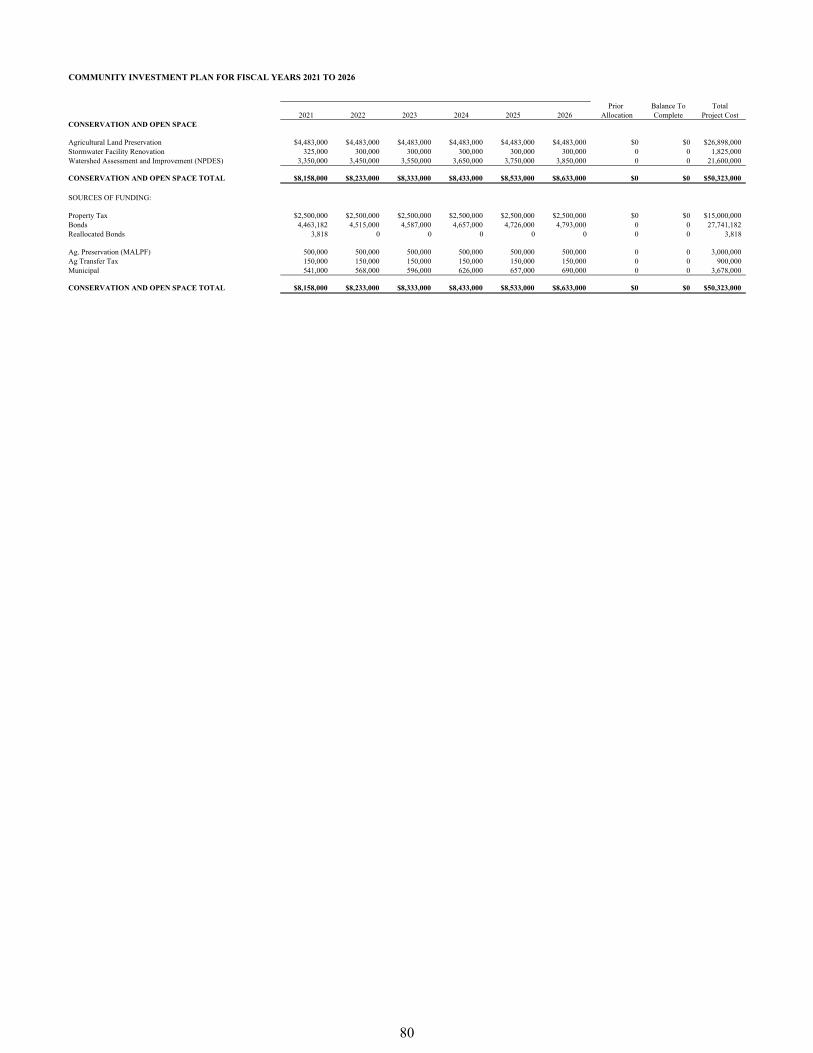
COMMUNITY INVESTMENT PLAN FOR FISCAL YEARS 2021 TO 2026
Prior Balance To Total2021 2022 2023 2024 2025 2026 Allocation Complete Project Cost
CONSERVATION AND OPEN SPACE
Agricultural Land Preservation $4,483,000 $4,483,000 $4,483,000 $4,483,000 $4,483,000 $4,483,000 $0 $0 $26,898,000Stormwater Facility Renovation 325,000 300,000 300,000 300,000 300,000 300,000 0 0 1,825,000Watershed Assessment and Improvement (NPDES) 3,350,000 3,450,000 3,550,000 3,650,000 3,750,000 3,850,000 0 0 21,600,000
CONSERVATION AND OPEN SPACE TOTAL $8,158,000 $8,233,000 $8,333,000 $8,433,000 $8,533,000 $8,633,000 $0 $0 $50,323,000
SOURCES OF FUNDING:
Property Tax $2,500,000 $2,500,000 $2,500,000 $2,500,000 $2,500,000 $2,500,000 $0 $0 $15,000,000Bonds 4,463,182 4,515,000 4,587,000 4,657,000 4,726,000 4,793,000 0 0 27,741,182Reallocated Bonds 3,818 0 0 0 0 0 0 0 3,818
Ag. Preservation (MALPF) 500,000 500,000 500,000 500,000 500,000 500,000 0 0 3,000,000Ag Transfer Tax 150,000 150,000 150,000 150,000 150,000 150,000 0 0 900,000Municipal 541,000 568,000 596,000 626,000 657,000 690,000 0 0 3,678,000
CONSERVATION AND OPEN SPACE TOTAL $8,158,000 $8,233,000 $8,333,000 $8,433,000 $8,533,000 $8,633,000 $0 $0 $50,323,000
80
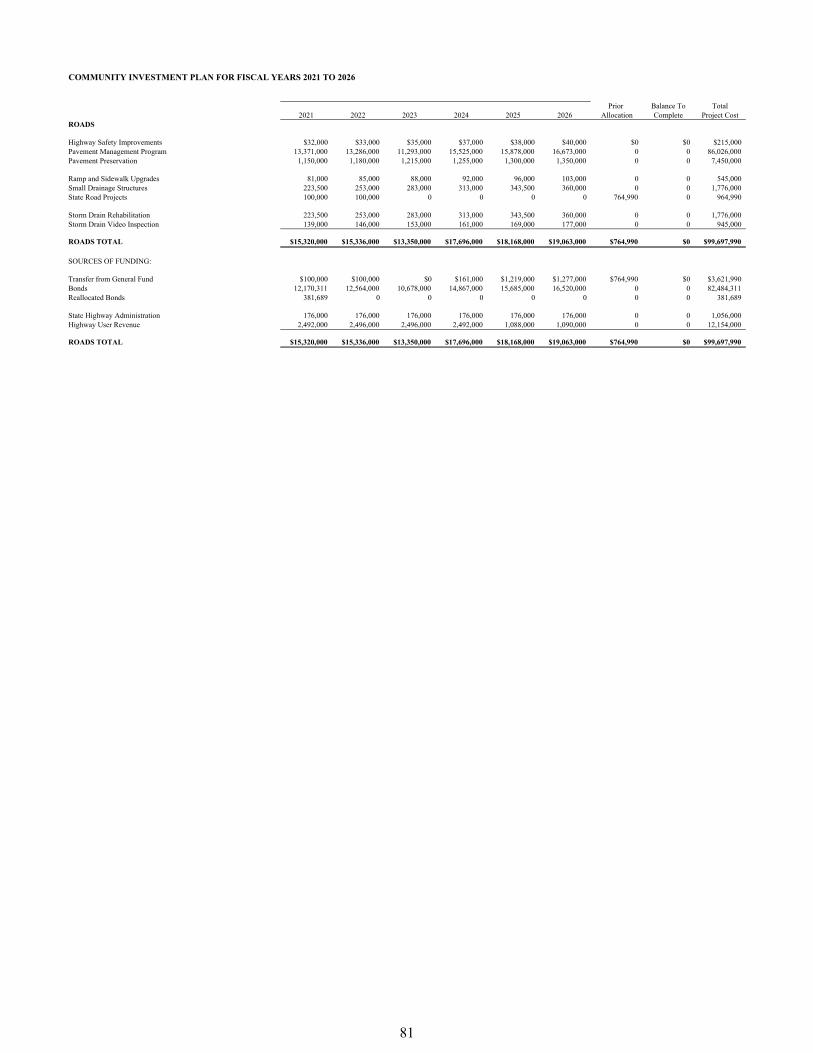
COMMUNITY INVESTMENT PLAN FOR FISCAL YEARS 2021 TO 2026
Prior Balance To Total2021 2022 2023 2024 2025 2026 Allocation Complete Project Cost
ROADS
Highway Safety Improvements $32,000 $33,000 $35,000 $37,000 $38,000 $40,000 $0 $0 $215,000Pavement Management Program 13,371,000 13,286,000 11,293,000 15,525,000 15,878,000 16,673,000 0 0 86,026,000Pavement Preservation 1,150,000 1,180,000 1,215,000 1,255,000 1,300,000 1,350,000 0 0 7,450,000
Ramp and Sidewalk Upgrades 81,000 85,000 88,000 92,000 96,000 103,000 0 0 545,000Small Drainage Structures 223,500 253,000 283,000 313,000 343,500 360,000 0 0 1,776,000State Road Projects 100,000 100,000 0 0 0 0 764,990 0 964,990
Storm Drain Rehabilitation 223,500 253,000 283,000 313,000 343,500 360,000 0 0 1,776,000Storm Drain Video Inspection 139,000 146,000 153,000 161,000 169,000 177,000 0 0 945,000
ROADS TOTAL $15,320,000 $15,336,000 $13,350,000 $17,696,000 $18,168,000 $19,063,000 $764,990 $0 $99,697,990
SOURCES OF FUNDING:
Transfer from General Fund $100,000 $100,000 $0 $161,000 $1,219,000 $1,277,000 $764,990 $0 $3,621,990Bonds 12,170,311 12,564,000 10,678,000 14,867,000 15,685,000 16,520,000 0 0 82,484,311Reallocated Bonds 381,689 0 0 0 0 0 0 0 381,689
State Highway Administration 176,000 176,000 176,000 176,000 176,000 176,000 0 0 1,056,000Highway User Revenue 2,492,000 2,496,000 2,496,000 2,492,000 1,088,000 1,090,000 0 0 12,154,000
ROADS TOTAL $15,320,000 $15,336,000 $13,350,000 $17,696,000 $18,168,000 $19,063,000 $764,990 $0 $99,697,990
81
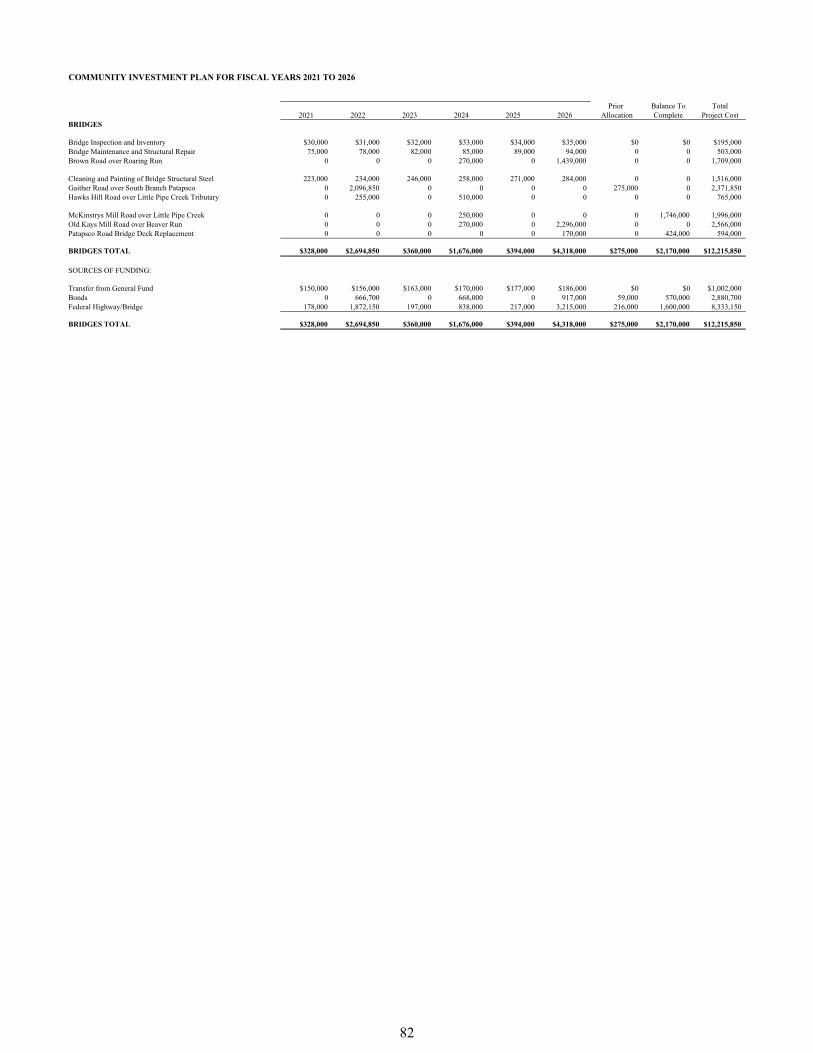
COMMUNITY INVESTMENT PLAN FOR FISCAL YEARS 2021 TO 2026
Prior Balance To Total2021 2022 2023 2024 2025 2026 Allocation Complete Project Cost
BRIDGES
Bridge Inspection and Inventory $30,000 $31,000 $32,000 $33,000 $34,000 $35,000 $0 $0 $195,000Bridge Maintenance and Structural Repair 75,000 78,000 82,000 85,000 89,000 94,000 0 0 503,000Brown Road over Roaring Run 0 0 0 270,000 0 1,439,000 0 0 1,709,000
Cleaning and Painting of Bridge Structural Steel 223,000 234,000 246,000 258,000 271,000 284,000 0 0 1,516,000Gaither Road over South Branch Patapsco 0 2,096,850 0 0 0 0 275,000 0 2,371,850Hawks Hill Road over Little Pipe Creek Tributary 0 255,000 0 510,000 0 0 0 0 765,000
McKinstrys Mill Road over Little Pipe Creek 0 0 0 250,000 0 0 0 1,746,000 1,996,000Old Kays Mill Road over Beaver Run 0 0 0 270,000 0 2,296,000 0 0 2,566,000Patapsco Road Bridge Deck Replacement 0 0 0 0 0 170,000 0 424,000 594,000
BRIDGES TOTAL $328,000 $2,694,850 $360,000 $1,676,000 $394,000 $4,318,000 $275,000 $2,170,000 $12,215,850
SOURCES OF FUNDING:
Transfer from General Fund $150,000 $156,000 $163,000 $170,000 $177,000 $186,000 $0 $0 $1,002,000Bonds 0 666,700 0 668,000 0 917,000 59,000 570,000 2,880,700Federal Highway/Bridge 178,000 1,872,150 197,000 838,000 217,000 3,215,000 216,000 1,600,000 8,333,150
BRIDGES TOTAL $328,000 $2,694,850 $360,000 $1,676,000 $394,000 $4,318,000 $275,000 $2,170,000 $12,215,850
82

COMMUNITY INVESTMENT PLAN FOR FISCAL YEARS 2021 TO 2026
Prior Balance To Total2021 2022 2023 2024 2025 2026 Allocation Complete Project Cost
RECREATION AND CULTURE
Bark Hill Park Trail $0 $0 $0 $0 $0 $312,000 $0 $0 $312,000Bear Branch Nature Center Pavilion Replacement 0 0 0 197,000 0 0 0 0 197,000Cape Horn Park Waterless Restroom Replacement 0 0 0 0 0 294,000 0 0 294,000
Community Self-Help Projects 82,000 84,000 86,000 88,000 90,000 92,000 0 0 522,000Deer Park Lighting Replacement 0 0 0 0 291,000 0 0 0 291,000Deer Park Phase II 100,000 0 0 0 0 0 1,604,000 0 1,704,000
Gillis Falls Trail 467,000 0 0 0 0 0 0 0 467,000Hashawha and Bear Branch Paving 0 0 552,000 0 0 0 0 0 552,000Krimgold Park Phase II 400,000 0 0 0 0 0 0 0 400,000
Land Acquisition 307,000 340,000 358,000 365,000 376,000 387,000 0 0 2,133,000Leister Park Phase II 0 191,000 0 0 0 0 0 0 191,000Northwest Trail 0 0 0 0 1,100,000 0 0 0 1,100,000
Park Restoration 175,000 180,000 185,000 190,000 195,000 200,000 0 0 1,125,000Piney Run Pavilion Replacement 0 0 0 181,000 0 0 0 0 181,000Piney Run Pavilion Road Paving 0 213,000 0 0 0 0 0 0 213,000
Piney Run Paving 0 0 0 0 0 290,000 0 0 290,000Piney Run Seawall and Launch Replacement 0 0 0 0 0 277,000 0 0 277,000Sports Complex Building Roof 0 0 301,000 0 0 0 0 0 301,000
Sports Complex Lighting 280,000 0 525,000 0 0 0 683,000 0 1,488,000Tot Lot Replacement 83,000 86,000 89,000 92,000 97,000 321,000 0 0 768,000Town Fund 16,700 17,800 17,800 17,800 17,800 17,800 0 0 105,700
Union Mills Flume, Shaft, and Waterwheel Replacement 0 0 164,000 435,000 0 0 291,000 0 890,000Westminster Veterans Memorial Park Phase I 300,000 0 0 0 0 0 2,303,596 0 2,603,596
RECREATION AND CULTURE TOTAL $2,210,700 $1,111,800 $2,277,800 $1,565,800 $2,166,800 $2,190,800 $4,881,596 $0 $16,405,296
SOURCES OF FUNDING:
Transfer from General Fund $322,000 $331,700 $408,000 $342,800 $351,600 $428,000 $28,100 $0 $2,212,200Reallocated GF Transfer 0 0 0 0 0 0 65,300 0 65,300Bonds 0 0 164,000 435,000 0 0 275,168 0 874,168
Impact Fee - Parks 470,000 90,000 325,000 0 750,000 250,000 925,000 0 2,810,000Reallocated Impact Fee - Parks 300,000 0 0 0 0 0 0 0 300,000Program Open Space 1,118,700 690,100 1,380,800 788,000 1,065,200 1,512,800 2,438,028 0 8,993,628
Reallocated Program Open Space 0 0 0 0 0 0 1,054,000 0 1,054,000State Miscellaneous Grants 0 0 0 0 0 0 96,000 0 96,000
RECREATION AND CULTURE $2,210,700 $1,111,800 $2,277,800 $1,565,800 $2,166,800 $2,190,800 $4,881,596 $0 $16,405,296
83

COMMUNITY INVESTMENT PLAN FOR FISCAL YEARS 2021 TO 2026
Prior Balance To Total2021 2022 2023 2024 2025 2026 Allocation Complete Project Cost
GENERAL GOVERNMENT
Carroll Community College Systemic Renovations $0 $0 $2,473,650 $0 $0 $0 $5,744,000 $0 $8,217,650Carroll Community College Technology 350,000 350,000 0 0 0 0 1,050,000 0 1,750,000Charles Carroll Gymnasium and Community Center 640,000 0 0 0 0 0 3,510,000 0 4,150,000
County Building Systemic Renovations 748,600 788,500 826,500 864,500 912,000 960,000 0 0 5,100,100County Technology 1,265,400 1,307,580 1,368,000 1,368,000 1,558,000 1,600,000 0 0 8,466,980Courthouse Annex Renovation 2,174 0 897,826 0 0 0 152,400 0 1,052,400
Detention Center Access System Replacement 400,000 0 0 0 0 0 0 0 400,000Elections Voting Equipment 605,000 0 0 0 0 0 0 0 605,000Fleet Lift Replacements 0 212,000 0 212,000 0 0 0 0 424,000
Generator Replacement 132,000 139,000 146,000 153,000 161,000 170,000 0 0 901,000Library Technology 100,000 100,000 100,000 100,000 100,000 100,000 0 0 600,000Parking Lot Overlays 279,000 322,000 367,000 436,000 222,000 233,000 0 0 1,859,000
Public Safety Emergency Communication Radios 824,000 849,000 785,000 891,000 927,000 956,000 0 0 5,232,000Public Safety Regional Water Supply 132,300 139,000 146,000 153,000 160,000 168,000 0 0 898,300Public Safety Training Center 1,000,000 1,000,000 0 0 0 0 5,300,000 0 7,300,000
Sheriff's Office - Eldersburg Precinct 0 0 650,000 6,500,000 0 0 0 0 7,150,000
GENERAL GOVERNMENT TOTAL $6,478,474 $5,207,080 $7,759,976 $10,677,500 $4,040,000 $4,187,000 $15,756,400 $0 $54,106,430
SOURCES OF FUNDING:
Transfer from General Fund $3,823,400 $2,928,580 $2,620,000 $2,795,000 $2,807,000 $2,889,000 $1,050,000 $0 $18,912,980Bonds 1,375,900 1,278,500 3,851,206 7,882,500 1,233,000 1,298,000 7,676,400 0 24,595,506Reallocated Bonds 29,174 0 0 0 0 0 2,400,000 0 2,429,174
MD Higher Education Commission 0 0 1,288,770 0 0 0 2,980,000 0 4,268,770State Miscellaneous Grants 1,250,000 1,000,000 0 0 0 0 1,650,000 0 3,900,000
GENERAL GOVERNMENT TOTAL $6,478,474 $5,207,080 $7,759,976 $10,677,500 $4,040,000 $4,187,000 $15,756,400 $0 $54,106,430
84
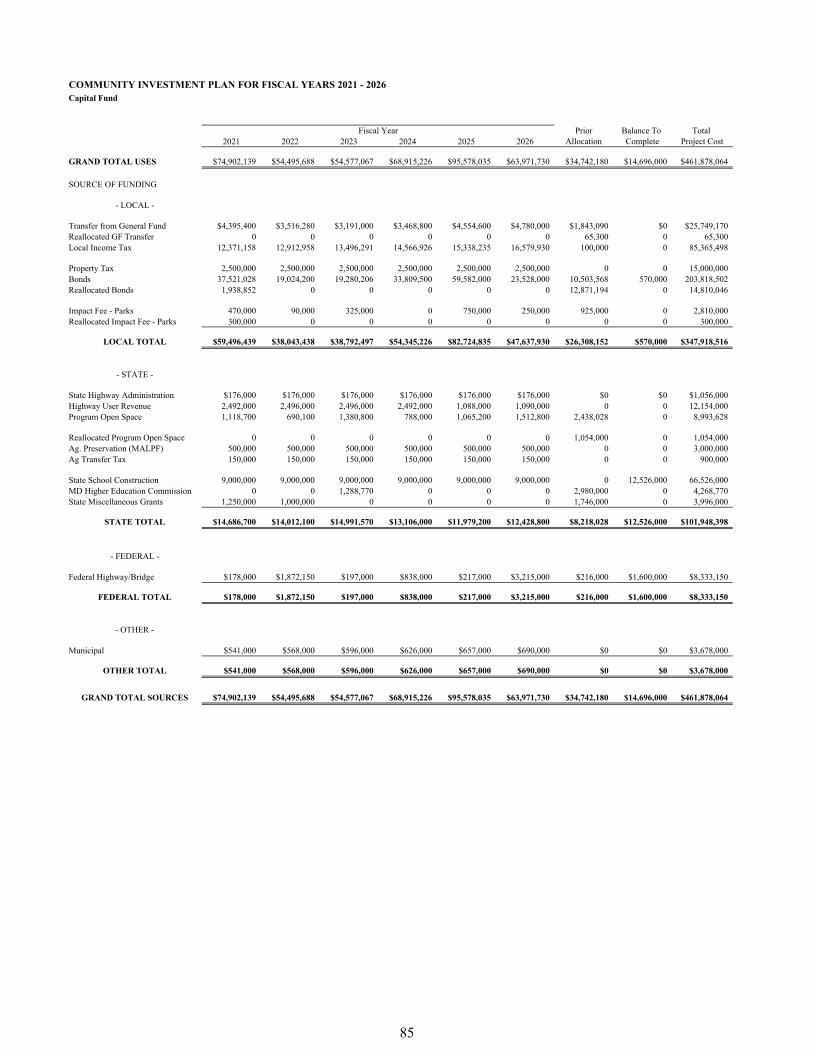
COMMUNITY INVESTMENT PLAN FOR FISCAL YEARS 2021 - 2026Capital Fund
Prior Balance To Total 2021 2022 2023 2024 2025 2026 Allocation Complete Project Cost
GRAND TOTAL USES $74,902,139 $54,495,688 $54,577,067 $68,915,226 $95,578,035 $63,971,730 $34,742,180 $14,696,000 $461,878,064
SOURCE OF FUNDING
- LOCAL -
Transfer from General Fund $4,395,400 $3,516,280 $3,191,000 $3,468,800 $4,554,600 $4,780,000 $1,843,090 $0 $25,749,170Reallocated GF Transfer 0 0 0 0 0 0 65,300 0 65,300Local Income Tax 12,371,158 12,912,958 13,496,291 14,566,926 15,338,235 16,579,930 100,000 0 85,365,498
Property Tax 2,500,000 2,500,000 2,500,000 2,500,000 2,500,000 2,500,000 0 0 15,000,000Bonds 37,521,028 19,024,200 19,280,206 33,809,500 59,582,000 23,528,000 10,503,568 570,000 203,818,502Reallocated Bonds 1,938,852 0 0 0 0 0 12,871,194 0 14,810,046
Impact Fee - Parks 470,000 90,000 325,000 0 750,000 250,000 925,000 0 2,810,000Reallocated Impact Fee - Parks 300,000 0 0 0 0 0 0 0 300,000
LOCAL TOTAL $59,496,439 $38,043,438 $38,792,497 $54,345,226 $82,724,835 $47,637,930 $26,308,152 $570,000 $347,918,516
- STATE -
State Highway Administration $176,000 $176,000 $176,000 $176,000 $176,000 $176,000 $0 $0 $1,056,000Highway User Revenue 2,492,000 2,496,000 2,496,000 2,492,000 1,088,000 1,090,000 0 0 12,154,000Program Open Space 1,118,700 690,100 1,380,800 788,000 1,065,200 1,512,800 2,438,028 0 8,993,628
Reallocated Program Open Space 0 0 0 0 0 0 1,054,000 0 1,054,000Ag. Preservation (MALPF) 500,000 500,000 500,000 500,000 500,000 500,000 0 0 3,000,000Ag Transfer Tax 150,000 150,000 150,000 150,000 150,000 150,000 0 0 900,000
State School Construction 9,000,000 9,000,000 9,000,000 9,000,000 9,000,000 9,000,000 0 12,526,000 66,526,000MD Higher Education Commission 0 0 1,288,770 0 0 0 2,980,000 0 4,268,770State Miscellaneous Grants 1,250,000 1,000,000 0 0 0 0 1,746,000 0 3,996,000
STATE TOTAL $14,686,700 $14,012,100 $14,991,570 $13,106,000 $11,979,200 $12,428,800 $8,218,028 $12,526,000 $101,948,398
- FEDERAL -
Federal Highway/Bridge $178,000 $1,872,150 $197,000 $838,000 $217,000 $3,215,000 $216,000 $1,600,000 $8,333,150
FEDERAL TOTAL $178,000 $1,872,150 $197,000 $838,000 $217,000 $3,215,000 $216,000 $1,600,000 $8,333,150
- OTHER -
Municipal $541,000 $568,000 $596,000 $626,000 $657,000 $690,000 $0 $0 $3,678,000
OTHER TOTAL $541,000 $568,000 $596,000 $626,000 $657,000 $690,000 $0 $0 $3,678,000
GRAND TOTAL SOURCES $74,902,139 $54,495,688 $54,577,067 $68,915,226 $95,578,035 $63,971,730 $34,742,180 $14,696,000 $461,878,064
Fiscal Year
85

86
Enterprise Funds
87

88

Airport Enterprise Fund
89

90
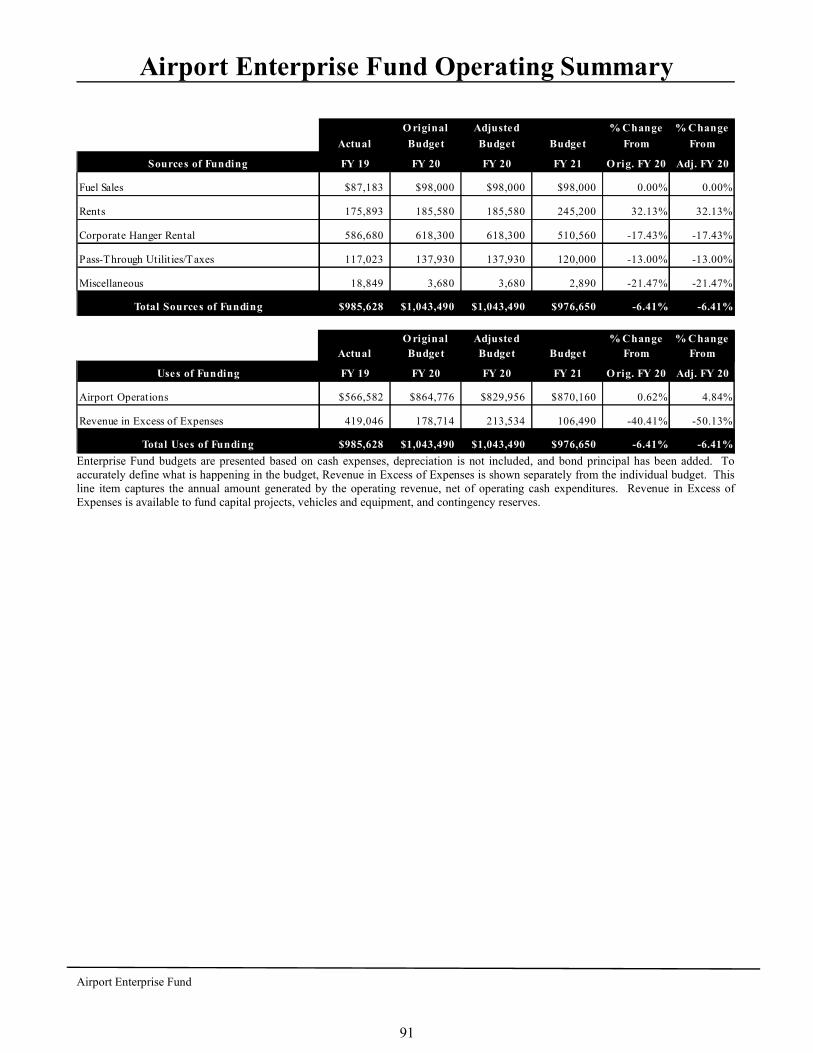
Airport Enterprise Fund
Airport Enterprise Fund Operating Summary
O riginal Adjusted % Change % Change
Actual Budget Budget Budget From From
Sources of Funding FY 19 FY 20 FY 20 FY 21 Orig. FY 20 Adj. FY 20
Fuel Sales $87,183 $98,000 $98,000 $98,000 0.00% 0.00%
Rents 175,893 185,580 185,580 245,200 32.13% 32.13%
Corporate Hanger Rental 586,680 618,300 618,300 510,560 -17.43% -17.43%
Pass-Through Utilit ies/Taxes 117,023 137,930 137,930 120,000 -13.00% -13.00%
Miscellaneous 18,849 3,680 3,680 2,890 -21.47% -21.47%
Total Sources of Funding $985,628 $1,043,490 $1,043,490 $976,650 -6.41% -6.41%
O riginal Adjusted % Change % ChangeActual Budget Budget Budget From From
Uses of Funding FY 19 FY 20 FY 20 FY 21 Orig. FY 20 Adj. FY 20
Airport Operations $566,582 $864,776 $829,956 $870,160 0.62% 4.84%
Revenue in Excess of Expenses 419,046 178,714 213,534 106,490 -40.41% -50.13%
Total Uses of Funding $985,628 $1,043,490 $1,043,490 $976,650 -6.41% -6.41% Enterprise Fund budgets are presented based on cash expenses, depreciation is not included, and bond principal has been added. To accurately define what is happening in the budget, Revenue in Excess of Expenses is shown separately from the individual budget. This line item captures the annual amount generated by the operating revenue, net of operating cash expenditures. Revenue in Excess of Expenses is available to fund capital projects, vehicles and equipment, and contingency reserves.
91
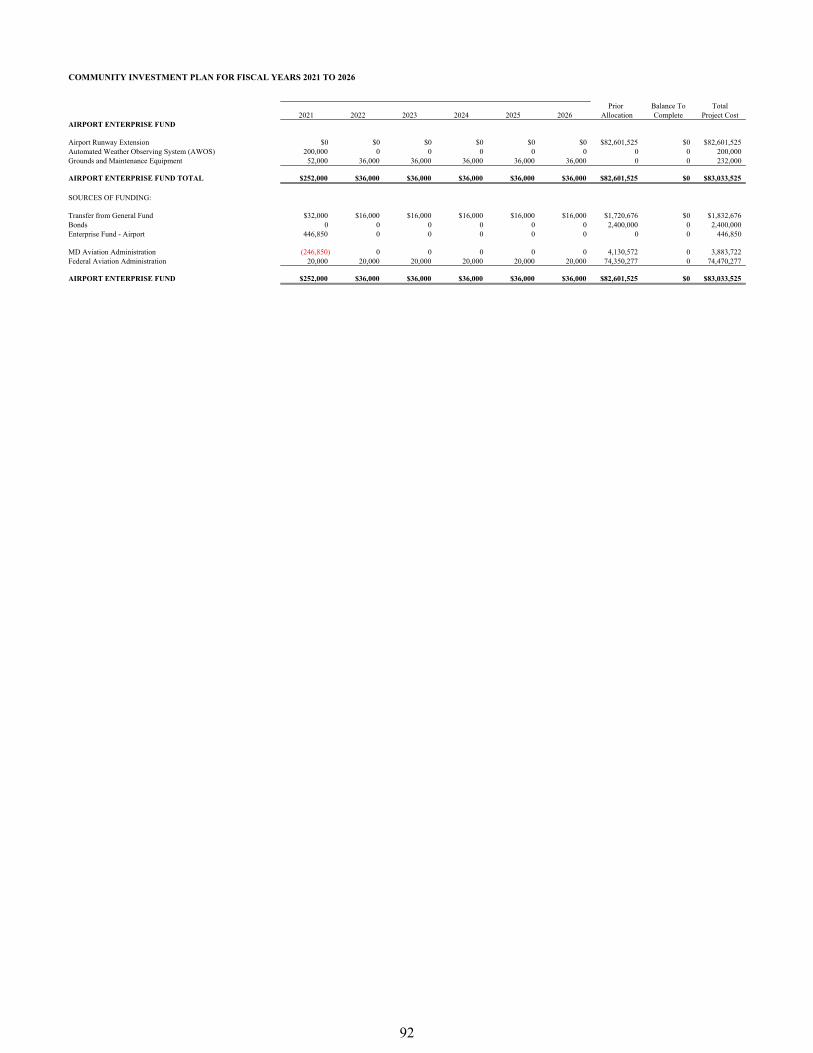
COMMUNITY INVESTMENT PLAN FOR FISCAL YEARS 2021 TO 2026
Prior Balance To Total2021 2022 2023 2024 2025 2026 Allocation Complete Project Cost
AIRPORT ENTERPRISE FUND
Airport Runway Extension $0 $0 $0 $0 $0 $0 $82,601,525 $0 $82,601,525Automated Weather Observing System (AWOS) 200,000 0 0 0 0 0 0 0 200,000Grounds and Maintenance Equipment 52,000 36,000 36,000 36,000 36,000 36,000 0 0 232,000
AIRPORT ENTERPRISE FUND TOTAL $252,000 $36,000 $36,000 $36,000 $36,000 $36,000 $82,601,525 $0 $83,033,525
SOURCES OF FUNDING:
Transfer from General Fund $32,000 $16,000 $16,000 $16,000 $16,000 $16,000 $1,720,676 $0 $1,832,676Bonds 0 0 0 0 0 0 2,400,000 0 2,400,000Enterprise Fund - Airport 446,850 0 0 0 0 0 0 0 446,850
MD Aviation Administration (246,850) 0 0 0 0 0 4,130,572 0 3,883,722Federal Aviation Administration 20,000 20,000 20,000 20,000 20,000 20,000 74,350,277 0 74,470,277
AIRPORT ENTERPRISE FUND $252,000 $36,000 $36,000 $36,000 $36,000 $36,000 $82,601,525 $0 $83,033,525
92

Fiber Network Enterprise Fund
93

94

Fiber Network Enterprise Fund
Fiber Network Enterprise Fund Operating Summary
Original Adjusted % Change % Change
Actual Budget Budget Budget From FromSources of Funding FY 19 FY 20 FY 20 FY 21 O rig. FY 20 Adj. FY 20
General Fund Transfer $45,000 $0 $0 $168,000 100.00% 100.00%
Dark Fiber Lease 246,230 252,200 251,270 256,310 1.63% 2.01%
Transfer from Fund Balance 84,140 192,800 193,730 0 -100.00% -100.00%
Total Sources of Funding $375,370 $445,000 $445,000 $424,310 -4.65% -4.65%
Original Adjusted % Change % Change
Actual Budget Budget Budget From FromUses of Funding FY 19 FY 20 FY 20 FY 21 Orig. FY 20 Adj. FY 20
Fiber Network $375,370 $445,000 $445,000 $424,310 -4.65% -4.65%
Total Uses of Funding $375,370 $445,000 $445,000 $424,310 -4.65% -4.65%
Enterprise Fund budgets are presented based on cash expenses, depreciation is not included, and bond principal has been added. To accurately define what is happening in the budget, Revenue in Excess of Expenses is shown separately from the individual budget. This line item captures the annual amount generated by the operating revenue, net of operating cash expenditures. Revenue in Excess of Expenses is available to fund capital projects, vehicles and equipment, and contingency reserves.
95
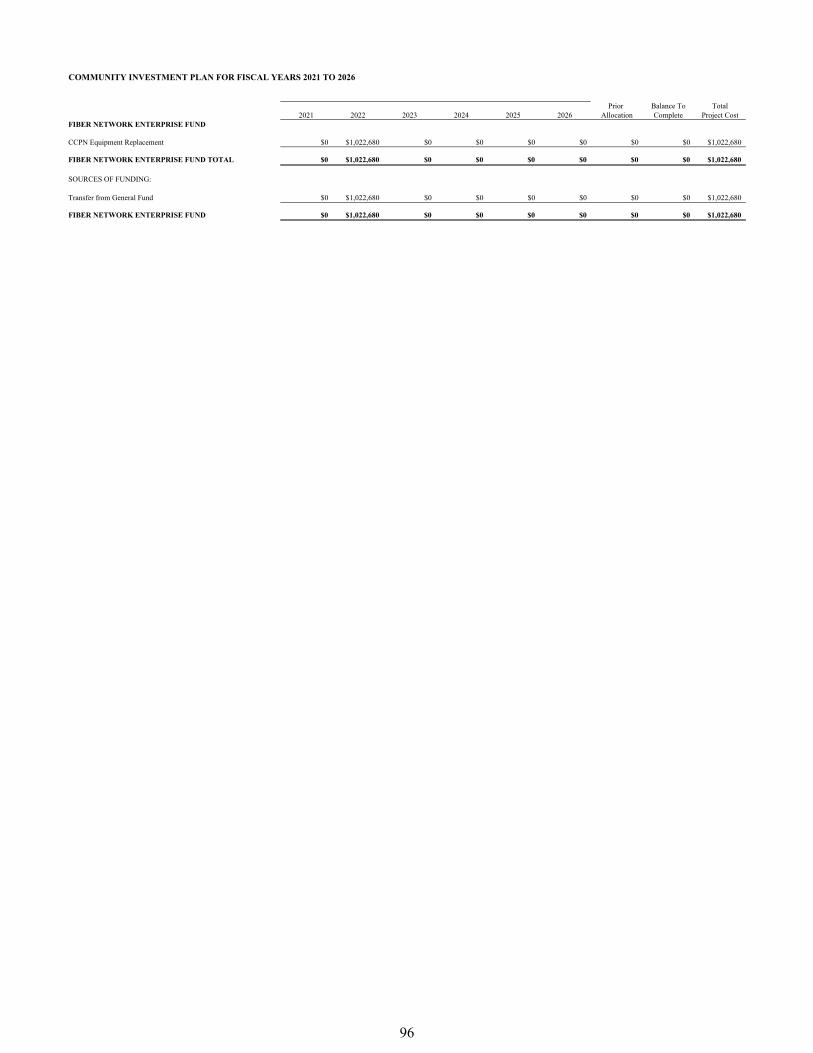
COMMUNITY INVESTMENT PLAN FOR FISCAL YEARS 2021 TO 2026
Prior Balance To Total2021 2022 2023 2024 2025 2026 Allocation Complete Project Cost
FIBER NETWORK ENTERPRISE FUND
CCPN Equipment Replacement $0 $1,022,680 $0 $0 $0 $0 $0 $0 $1,022,680
FIBER NETWORK ENTERPRISE FUND TOTAL $0 $1,022,680 $0 $0 $0 $0 $0 $0 $1,022,680
SOURCES OF FUNDING:
Transfer from General Fund $0 $1,022,680 $0 $0 $0 $0 $0 $0 $1,022,680
FIBER NETWORK ENTERPRISE FUND $0 $1,022,680 $0 $0 $0 $0 $0 $0 $1,022,680
96
Firearms Enterprise Fund
97

98
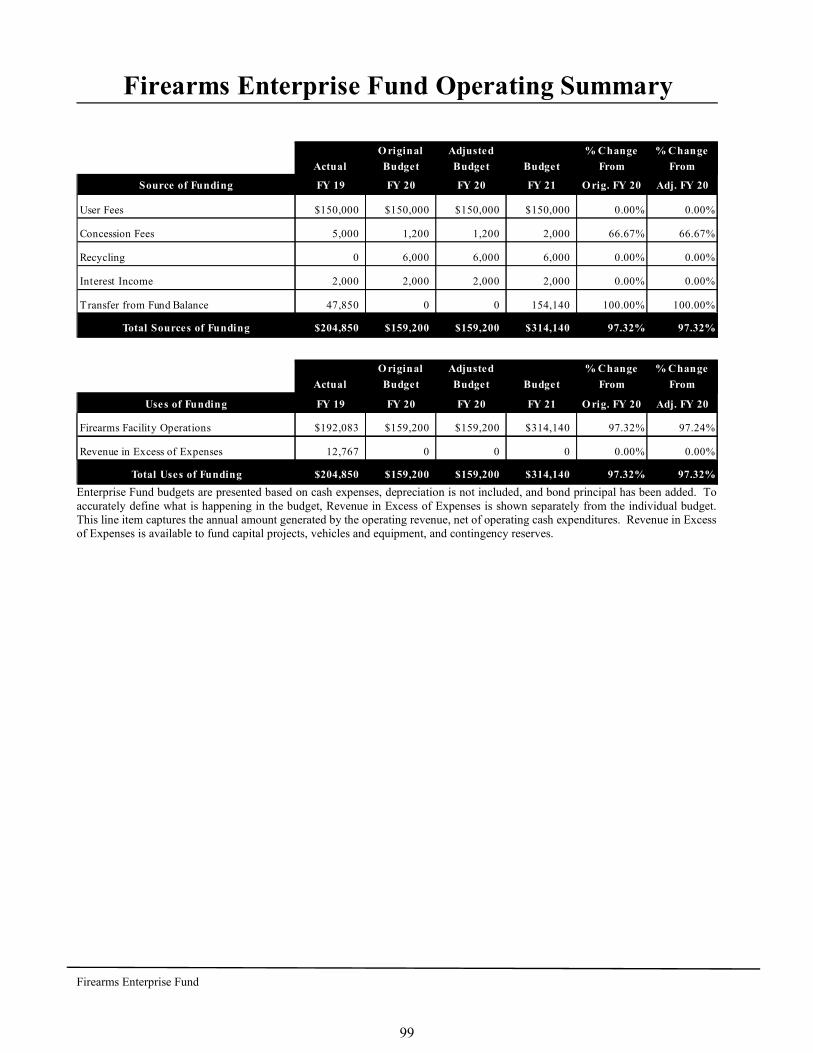
Firearms Enterprise Fund
Firearms Enterprise Fund Operating Summary
O riginal Adjusted % Change % Change
Actual Budget Budget Budget From From
Source of Funding FY 19 FY 20 FY 20 FY 21 Orig. FY 20 Adj. FY 20
User Fees $150,000 $150,000 $150,000 $150,000 0.00% 0.00%
Concession Fees 5,000 1,200 1,200 2,000 66.67% 66.67%
Recycling 0 6,000 6,000 6,000 0.00% 0.00%
Interest Income 2,000 2,000 2,000 2,000 0.00% 0.00%
Transfer from Fund Balance 47,850 0 0 154,140 100.00% 100.00%
Total Sources of Funding $204,850 $159,200 $159,200 $314,140 97.32% 97.32%
O riginal Adjusted % Change % Change
Actual Budget Budget Budget From From
Uses of Funding FY 19 FY 20 FY 20 FY 21 O rig. FY 20 Adj. FY 20
Firearms Facility Operations $192,083 $159,200 $159,200 $314,140 97.32% 97.24%
Revenue in Excess of Expenses 12,767 0 0 0 0.00% 0.00%
Total Uses of Funding $204,850 $159,200 $159,200 $314,140 97.32% 97.32%
Enterprise Fund budgets are presented based on cash expenses, depreciation is not included, and bond principal has been added. To accurately define what is happening in the budget, Revenue in Excess of Expenses is shown separately from the individual budget. This line item captures the annual amount generated by the operating revenue, net of operating cash expenditures. Revenue in Excess of Expenses is available to fund capital projects, vehicles and equipment, and contingency reserves.
99

100
Septage Enterprise Fund
101

102
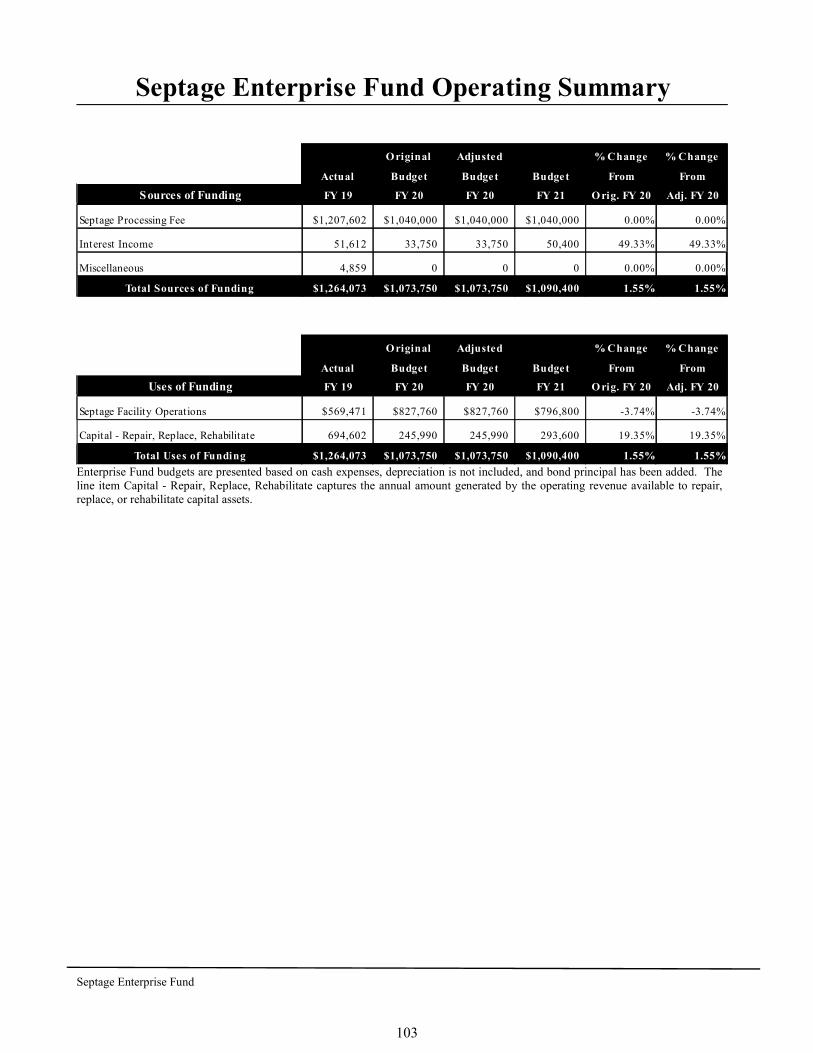
Septage Enterprise Fund
Septage Enterprise Fund Operating Summary
Original Adjusted % Change % Change
Actual Budget Budget Budget From From
Sources of Funding FY 19 FY 20 FY 20 FY 21 O rig. FY 20 Adj. FY 20
Septage Processing Fee $1,207,602 $1,040,000 $1,040,000 $1,040,000 0.00% 0.00%
Interest Income 51,612 33,750 33,750 50,400 49.33% 49.33%
Miscellaneous 4,859 0 0 0 0.00% 0.00%
Total Sources of Funding $1,264,073 $1,073,750 $1,073,750 $1,090,400 1.55% 1.55%
Original Adjusted % Change % Change
Actual Budget Budget Budget From From
Uses of Funding FY 19 FY 20 FY 20 FY 21 O rig. FY 20 Adj. FY 20
Septage Facility Operations $569,471 $827,760 $827,760 $796,800 -3.74% -3.74%
Capital - Repair, Replace, Rehabilitate 694,602 245,990 245,990 293,600 19.35% 19.35%
Total Uses of Funding $1,264,073 $1,073,750 $1,073,750 $1,090,400 1.55% 1.55%
Enterprise Fund budgets are presented based on cash expenses, depreciation is not included, and bond principal has been added. The line item Capital - Repair, Replace, Rehabilitate captures the annual amount generated by the operating revenue available to repair, replace, or rehabilitate capital assets.
103

104
Solid Waste Enterprise Fund
105

106
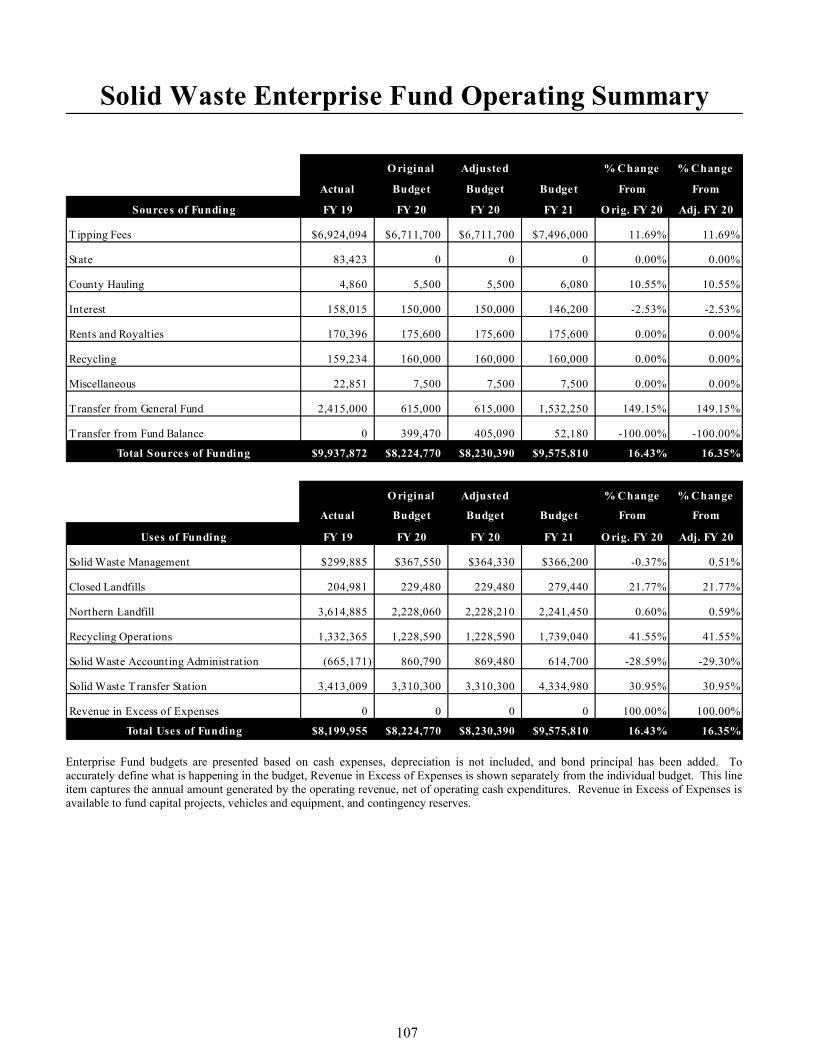
Solid Waste Enterprise Fund Operating Summary
O riginal Adjusted % Change % Change
Actual Budget Budget Budget From From
Sources of Funding FY 19 FY 20 FY 20 FY 21 O rig. FY 20 Adj. FY 20
Tipping Fees $6,924,094 $6,711,700 $6,711,700 $7,496,000 11.69% 11.69%
State 83,423 0 0 0 0.00% 0.00%
County Hauling 4,860 5,500 5,500 6,080 10.55% 10.55%
Interest 158,015 150,000 150,000 146,200 -2.53% -2.53%
Rents and Royalties 170,396 175,600 175,600 175,600 0.00% 0.00%
Recycling 159,234 160,000 160,000 160,000 0.00% 0.00%
Miscellaneous 22,851 7,500 7,500 7,500 0.00% 0.00%
Transfer from General Fund 2,415,000 615,000 615,000 1,532,250 149.15% 149.15%
Transfer from Fund Balance 0 399,470 405,090 52,180 -100.00% -100.00%
Total Sources of Funding $9,937,872 $8,224,770 $8,230,390 $9,575,810 16.43% 16.35%
O riginal Adjusted % Change % Change
Actual Budget Budget Budget From From
Uses of Funding FY 19 FY 20 FY 20 FY 21 O rig. FY 20 Adj. FY 20
Solid Waste Management $299,885 $367,550 $364,330 $366,200 -0.37% 0.51%
Closed Landfills 204,981 229,480 229,480 279,440 21.77% 21.77%
Northern Landfill 3,614,885 2,228,060 2,228,210 2,241,450 0.60% 0.59%
Recycling Operations 1,332,365 1,228,590 1,228,590 1,739,040 41.55% 41.55%
Solid Waste Accounting Administration (665,171) 860,790 869,480 614,700 -28.59% -29.30%
Solid Waste Transfer Station 3,413,009 3,310,300 3,310,300 4,334,980 30.95% 30.95%
Revenue in Excess of Expenses 0 0 0 0 100.00% 100.00%
Total Uses of Funding $8,199,955 $8,224,770 $8,230,390 $9,575,810 16.43% 16.35% Enterprise Fund budgets are presented based on cash expenses, depreciation is not included, and bond principal has been added. To accurately define what is happening in the budget, Revenue in Excess of Expenses is shown separately from the individual budget. This line item captures the annual amount generated by the operating revenue, net of operating cash expenditures. Revenue in Excess of Expenses is available to fund capital projects, vehicles and equipment, and contingency reserves.
107

108
Utilities Enterprise Fund
109

110
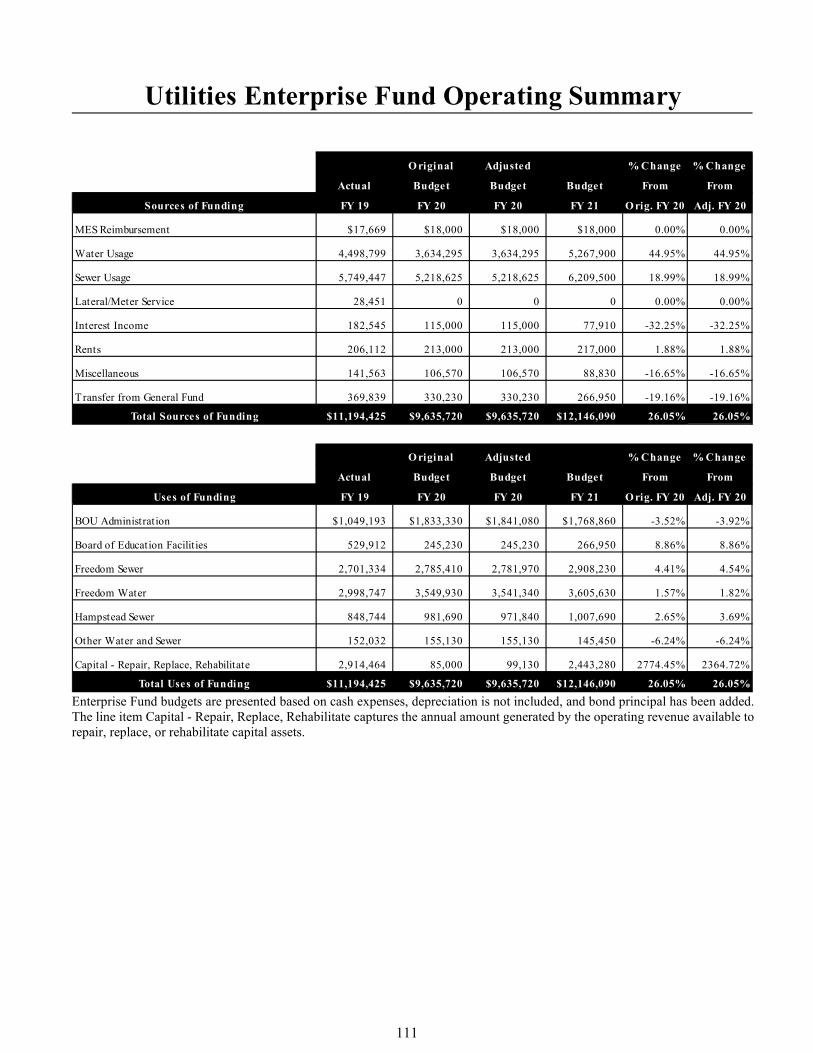
Utilities Enterprise Fund Operating Summary
O riginal Adjusted % Change % Change
Actual Budget Budget Budget From From
Sources of Funding FY 19 FY 20 FY 20 FY 21 O rig. FY 20 Adj. FY 20
MES Reimbursement $17,669 $18,000 $18,000 $18,000 0.00% 0.00%
Water Usage 4,498,799 3,634,295 3,634,295 5,267,900 44.95% 44.95%
Sewer Usage 5,749,447 5,218,625 5,218,625 6,209,500 18.99% 18.99%
Lateral/Meter Service 28,451 0 0 0 0.00% 0.00%
Interest Income 182,545 115,000 115,000 77,910 -32.25% -32.25%
Rents 206,112 213,000 213,000 217,000 1.88% 1.88%
Miscellaneous 141,563 106,570 106,570 88,830 -16.65% -16.65%
Transfer from General Fund 369,839 330,230 330,230 266,950 -19.16% -19.16%
Total Sources of Funding $11,194,425 $9,635,720 $9,635,720 $12,146,090 26.05% 26.05%
O riginal Adjusted % Change % Change
Actual Budget Budget Budget From From
Uses of Funding FY 19 FY 20 FY 20 FY 21 O rig. FY 20 Adj. FY 20
BOU Administration $1,049,193 $1,833,330 $1,841,080 $1,768,860 -3.52% -3.92%
Board of Education Facilit ies 529,912 245,230 245,230 266,950 8.86% 8.86%
Freedom Sewer 2,701,334 2,785,410 2,781,970 2,908,230 4.41% 4.54%
Freedom Water 2,998,747 3,549,930 3,541,340 3,605,630 1.57% 1.82%
Hampstead Sewer 848,744 981,690 971,840 1,007,690 2.65% 3.69%
Other Water and Sewer 152,032 155,130 155,130 145,450 -6.24% -6.24%
Capital - Repair, Replace, Rehabilitate 2,914,464 85,000 99,130 2,443,280 2774.45% 2364.72%
Total Uses of Funding $11,194,425 $9,635,720 $9,635,720 $12,146,090 26.05% 26.05% Enterprise Fund budgets are presented based on cash expenses, depreciation is not included, and bond principal has been added. The line item Capital - Repair, Replace, Rehabilitate captures the annual amount generated by the operating revenue available to repair, replace, or rehabilitate capital assets.
111
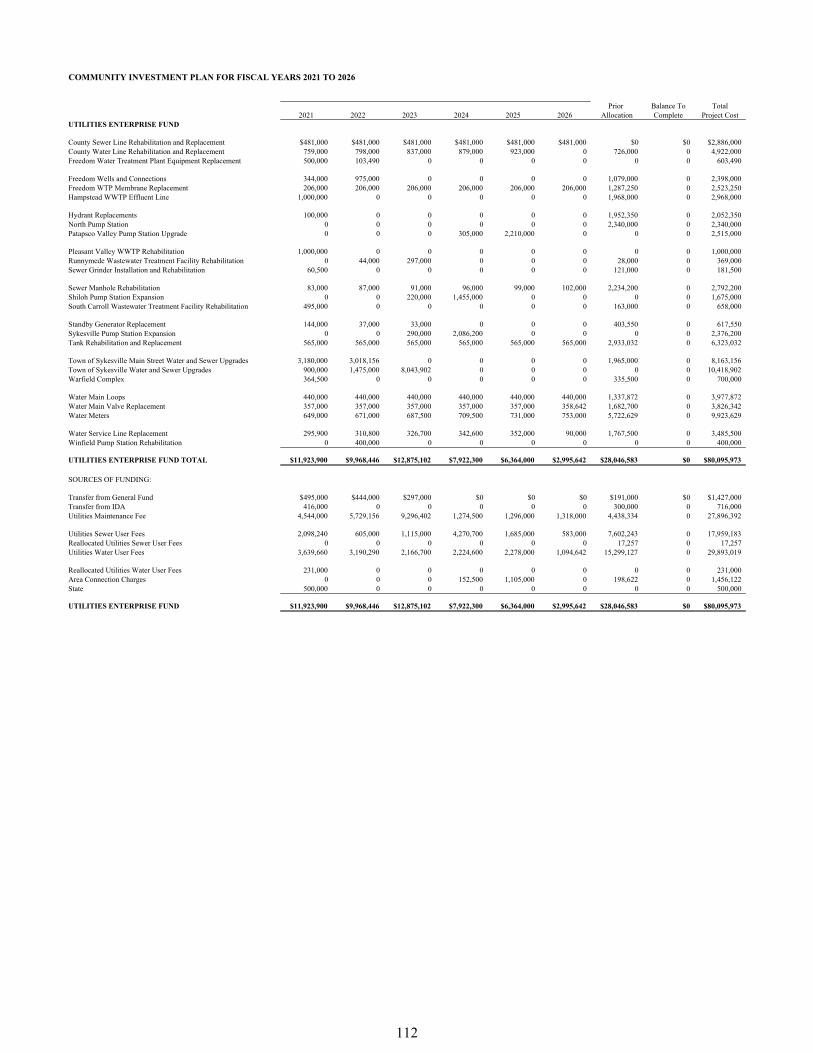
COMMUNITY INVESTMENT PLAN FOR FISCAL YEARS 2021 TO 2026
Prior Balance To Total2021 2022 2023 2024 2025 2026 Allocation Complete Project Cost
UTILITIES ENTERPRISE FUND
County Sewer Line Rehabilitation and Replacement $481,000 $481,000 $481,000 $481,000 $481,000 $481,000 $0 $0 $2,886,000County Water Line Rehabilitation and Replacement 759,000 798,000 837,000 879,000 923,000 0 726,000 0 4,922,000Freedom Water Treatment Plant Equipment Replacement 500,000 103,490 0 0 0 0 0 0 603,490
Freedom Wells and Connections 344,000 975,000 0 0 0 0 1,079,000 0 2,398,000Freedom WTP Membrane Replacement 206,000 206,000 206,000 206,000 206,000 206,000 1,287,250 0 2,523,250Hampstead WWTP Effluent Line 1,000,000 0 0 0 0 0 1,968,000 0 2,968,000
Hydrant Replacements 100,000 0 0 0 0 0 1,952,350 0 2,052,350North Pump Station 0 0 0 0 0 0 2,340,000 0 2,340,000Patapsco Valley Pump Station Upgrade 0 0 0 305,000 2,210,000 0 0 0 2,515,000
Pleasant Valley WWTP Rehabilitation 1,000,000 0 0 0 0 0 0 0 1,000,000Runnymede Wastewater Treatment Facility Rehabilitation 0 44,000 297,000 0 0 0 28,000 0 369,000Sewer Grinder Installation and Rehabilitation 60,500 0 0 0 0 0 121,000 0 181,500
Sewer Manhole Rehabilitation 83,000 87,000 91,000 96,000 99,000 102,000 2,234,200 0 2,792,200Shiloh Pump Station Expansion 0 0 220,000 1,455,000 0 0 0 0 1,675,000South Carroll Wastewater Treatment Facility Rehabilitation 495,000 0 0 0 0 0 163,000 0 658,000
Standby Generator Replacement 144,000 37,000 33,000 0 0 0 403,550 0 617,550Sykesville Pump Station Expansion 0 0 290,000 2,086,200 0 0 0 0 2,376,200Tank Rehabilitation and Replacement 565,000 565,000 565,000 565,000 565,000 565,000 2,933,032 0 6,323,032
Town of Sykesville Main Street Water and Sewer Upgrades 3,180,000 3,018,156 0 0 0 0 1,965,000 0 8,163,156Town of Sykesville Water and Sewer Upgrades 900,000 1,475,000 8,043,902 0 0 0 0 0 10,418,902Warfield Complex 364,500 0 0 0 0 0 335,500 0 700,000
Water Main Loops 440,000 440,000 440,000 440,000 440,000 440,000 1,337,872 0 3,977,872Water Main Valve Replacement 357,000 357,000 357,000 357,000 357,000 358,642 1,682,700 0 3,826,342Water Meters 649,000 671,000 687,500 709,500 731,000 753,000 5,722,629 0 9,923,629
Water Service Line Replacement 295,900 310,800 326,700 342,600 352,000 90,000 1,767,500 0 3,485,500Winfield Pump Station Rehabilitation 0 400,000 0 0 0 0 0 0 400,000
UTILITIES ENTERPRISE FUND TOTAL $11,923,900 $9,968,446 $12,875,102 $7,922,300 $6,364,000 $2,995,642 $28,046,583 $0 $80,095,973
SOURCES OF FUNDING:
Transfer from General Fund $495,000 $444,000 $297,000 $0 $0 $0 $191,000 $0 $1,427,000Transfer from IDA 416,000 0 0 0 0 0 300,000 0 716,000Utilities Maintenance Fee 4,544,000 5,729,156 9,296,402 1,274,500 1,296,000 1,318,000 4,438,334 0 27,896,392
Utilities Sewer User Fees 2,098,240 605,000 1,115,000 4,270,700 1,685,000 583,000 7,602,243 0 17,959,183Reallocated Utilities Sewer User Fees 0 0 0 0 0 0 17,257 0 17,257Utilities Water User Fees 3,639,660 3,190,290 2,166,700 2,224,600 2,278,000 1,094,642 15,299,127 0 29,893,019
Reallocated Utilities Water User Fees 231,000 0 0 0 0 0 0 0 231,000Area Connection Charges 0 0 0 152,500 1,105,000 0 198,622 0 1,456,122State 500,000 0 0 0 0 0 0 0 500,000
UTILITIES ENTERPRISE FUND $11,923,900 $9,968,446 $12,875,102 $7,922,300 $6,364,000 $2,995,642 $28,046,583 $0 $80,095,973
112
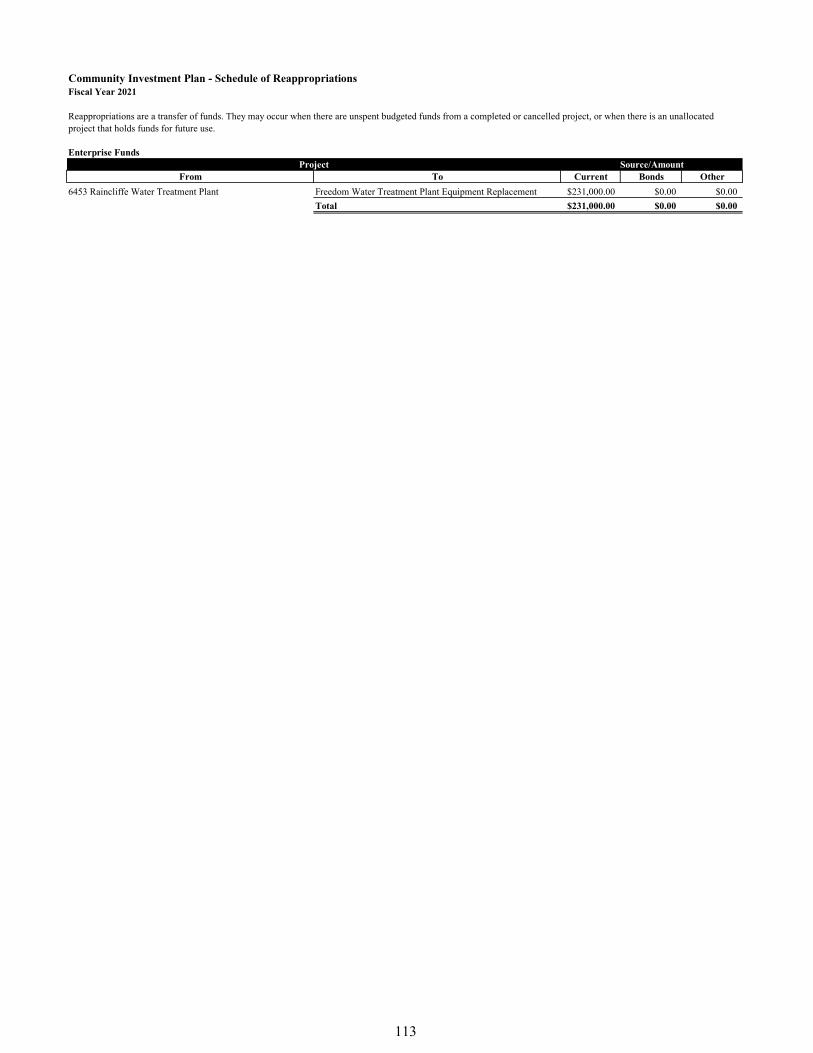
Community Investment Plan - Schedule of ReappropriationsFiscal Year 2021
Enterprise Funds
Current Bonds Other6453 Raincliffe Water Treatment Plant Freedom Water Treatment Plant Equipment Replacement $231,000.00 $0.00 $0.00
$231,000.00 $0.00 $0.00Total
Reappropriations are a transfer of funds. They may occur when there are unspent budgeted funds from a completed or cancelled project, or when there is an unallocated project that holds funds for future use.
Project Source/AmountFrom To
113

114
Grant Fund
115

116
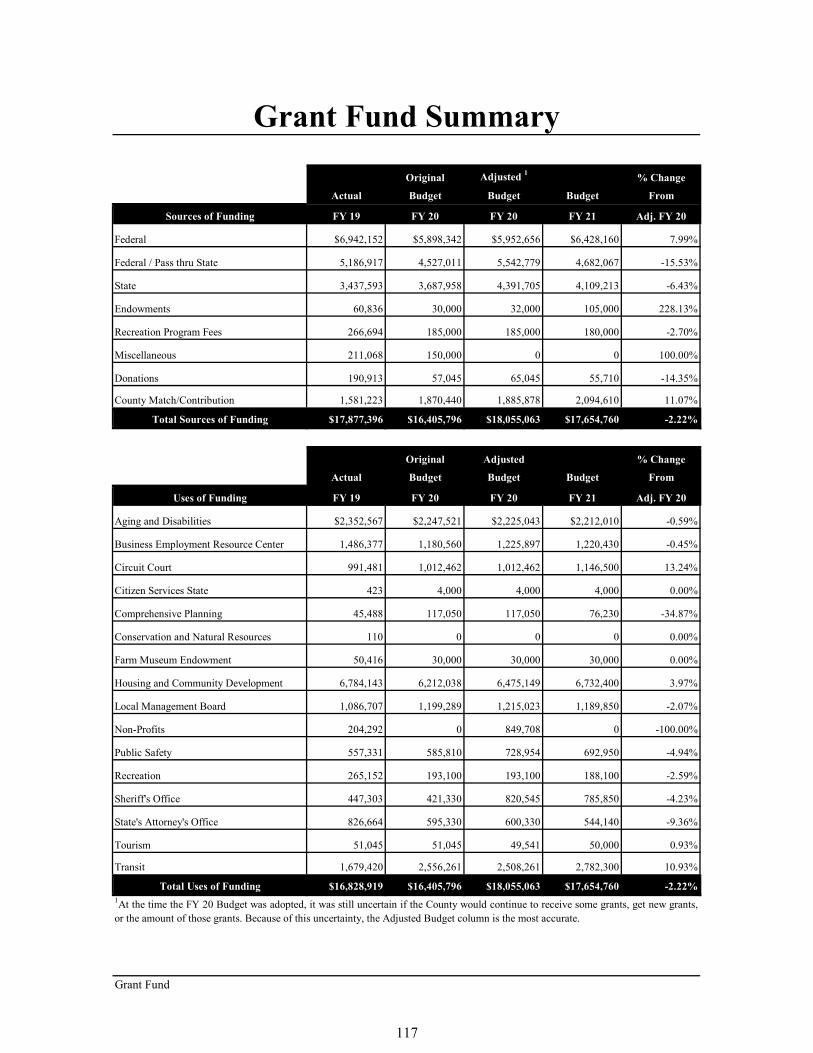
Grant Fund Summary
Original Adjusted 1 % Change
Actual Budget Budget Budget From
Sources of Funding FY 19 FY 20 FY 20 FY 21 Adj. FY 20
Federal $6,942,152 $5,898,342 $5,952,656 $6,428,160 7.99%
Federal / Pass thru State 5,186,917 4,527,011 5,542,779 4,682,067 -15.53%
State 3,437,593 3,687,958 4,391,705 4,109,213 -6.43%
Endowments 60,836 30,000 32,000 105,000 228.13%
Recreation Program Fees 266,694 185,000 185,000 180,000 -2.70%
Miscellaneous 211,068 150,000 0 0 100.00%
Donations 190,913 57,045 65,045 55,710 -14.35%
County Match/Contribution 1,581,223 1,870,440 1,885,878 2,094,610 11.07%
Total Sources of Funding $17,877,396 $16,405,796 $18,055,063 $17,654,760 -2.22%
Original Adjusted % Change
Actual Budget Budget Budget From
Uses of Funding FY 19 FY 20 FY 20 FY 21 Adj. FY 20
Aging and Disabilities $2,352,567 $2,247,521 $2,225,043 $2,212,010 -0.59%
Business Employment Resource Center 1,486,377 1,180,560 1,225,897 1,220,430 -0.45%
Circuit Court 991,481 1,012,462 1,012,462 1,146,500 13.24%
Citizen Services State 423 4,000 4,000 4,000 0.00%
Comprehensive Planning 45,488 117,050 117,050 76,230 -34.87%
Conservation and Natural Resources 110 0 0 0 0.00%
Farm Museum Endowment 50,416 30,000 30,000 30,000 0.00%
Housing and Community Development 6,784,143 6,212,038 6,475,149 6,732,400 3.97%
Local Management Board 1,086,707 1,199,289 1,215,023 1,189,850 -2.07%
Non-Profits 204,292 0 849,708 0 -100.00%
Public Safety 557,331 585,810 728,954 692,950 -4.94%
Recreation 265,152 193,100 193,100 188,100 -2.59%
Sheriff's Office 447,303 421,330 820,545 785,850 -4.23%
State's Attorney's Office 826,664 595,330 600,330 544,140 -9.36%
Tourism 51,045 51,045 49,541 50,000 0.93%
Transit 1,679,420 2,556,261 2,508,261 2,782,300 10.93%
Total Uses of Funding $16,828,919 $16,405,796 $18,055,063 $17,654,760 -2.22%
Grant Fund
1At the time the FY 20 Budget was adopted, it was still uncertain if the County would continue to receive some grants, get new grants,or the amount of those grants. Because of this uncertainty, the Adjusted Budget column is the most accurate.
117
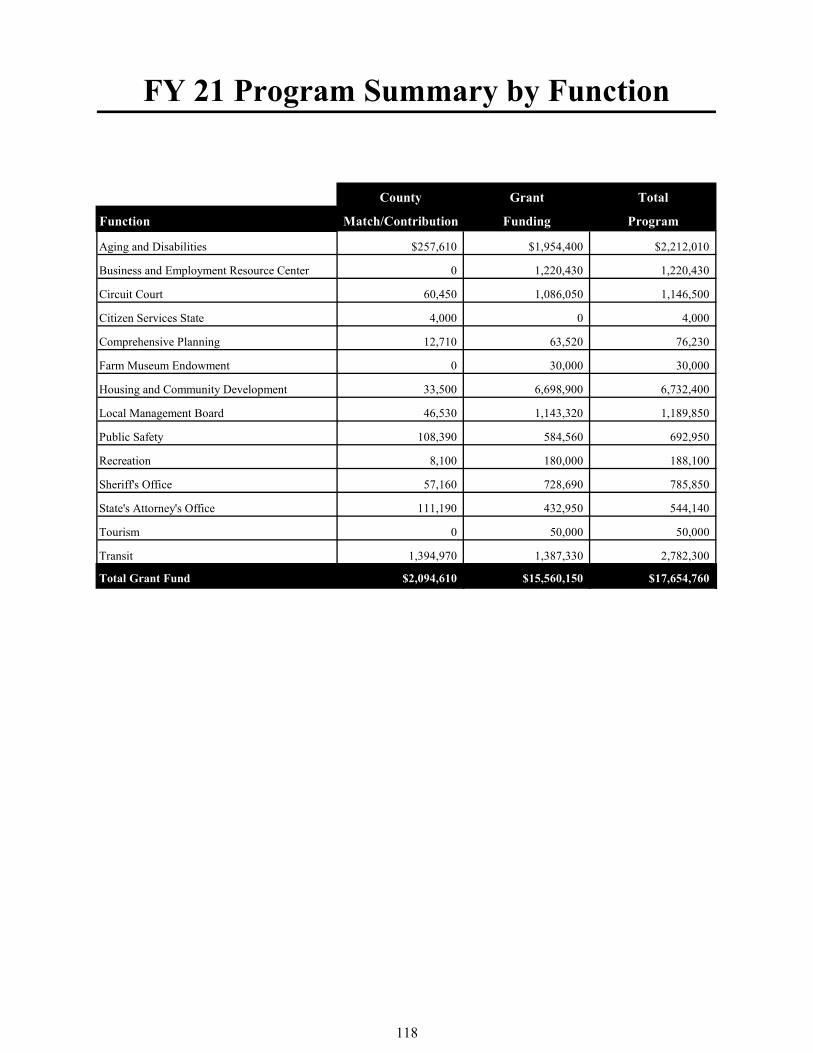
FY 21 Program Summary by Function
County Grant Total
Function Match/Contribution Funding Program
Aging and Disabilities $257,610 $1,954,400 $2,212,010
Business and Employment Resource Center 0 1,220,430 1,220,430
Circuit Court 60,450 1,086,050 1,146,500
Citizen Services State 4,000 0 4,000
Comprehensive Planning 12,710 63,520 76,230
Farm Museum Endowment 0 30,000 30,000
Housing and Community Development 33,500 6,698,900 6,732,400
Local Management Board 46,530 1,143,320 1,189,850
Public Safety 108,390 584,560 692,950
Recreation 8,100 180,000 188,100
Sheriff's Office 57,160 728,690 785,850
State's Attorney's Office 111,190 432,950 544,140
Tourism 0 50,000 50,000
Transit 1,394,970 1,387,330 2,782,300
Total Grant Fund $2,094,610 $15,560,150 $17,654,760
118
OPEB, Pension Trust,
and Special Revenue Funds
119

120

FY 19 FY 20 FY 21 Increase
Sources of Funding Actual Budget Budget (Decrease)
OPEB Contribution - Transfer from General Fund $11,430,300 $12,493,310 $12,461,510 ($31,800)
Retiree Contributions 743,864 600,000 755,000 155,000
Interest 180,828 0 0 0
Unrealized Gain/(Loss) 7,703,052 0 0 0
Total Sources of Funding $20,058,044 $13,093,310 $13,216,510 $123,200
Uses of Funding
Budgeted Employer OPEB Trust Contribution $0 $6,077,810 $5,468,350 ($609,460)
Audit Fees 2,440 0 0 0
Consulting Fees 21,280 0 0 0
Retiree Health Benefit Payments 5,296,960 7,015,500 7,748,160 732,660
Total Uses of Funding $5,320,680 $13,093,310 $13,216,510 $123,200
OPEB, Pension Trust, and Special Revenue Funds
Other Post Employment Benefits Trust FundOther Post Employment Benefits (OPEB) includes medical and prescription coverage for retirees, as well as funding to meet futureliability.
121
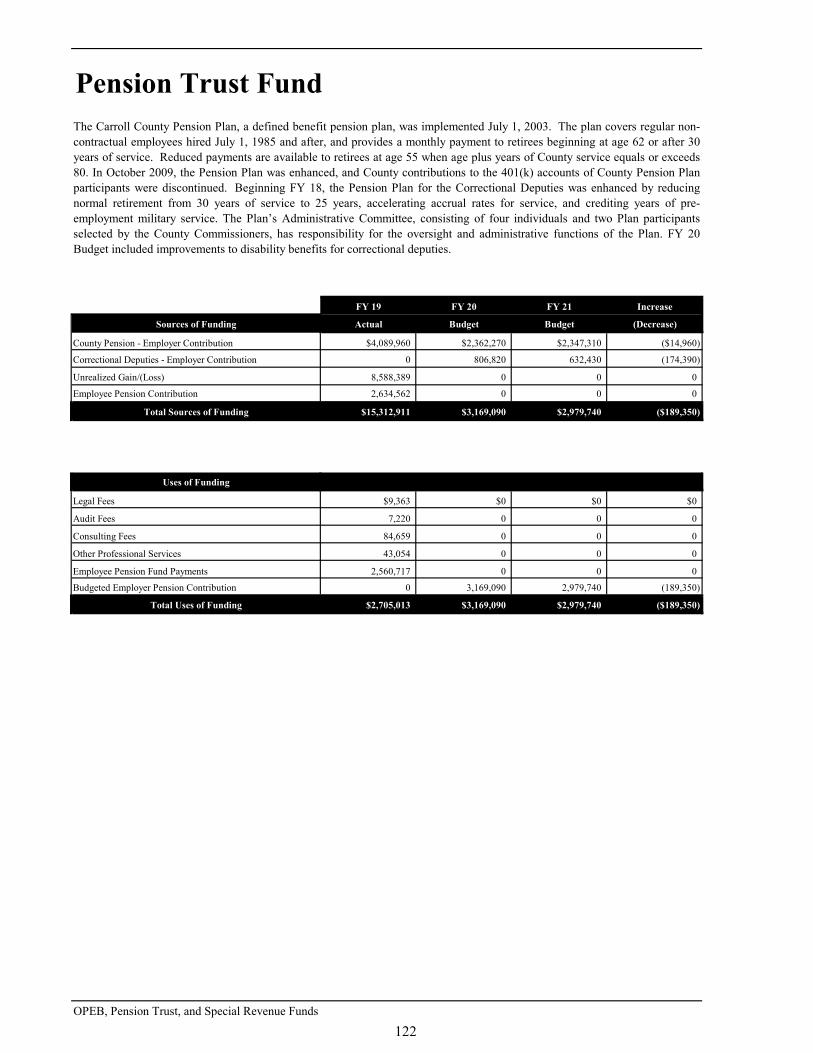
FY 19 FY 20 FY 21 Increase
Sources of Funding Actual Budget Budget (Decrease)
County Pension - Employer Contribution $4,089,960 $2,362,270 $2,347,310 ($14,960)
Correctional Deputies - Employer Contribution 0 806,820 632,430 (174,390)
Unrealized Gain/(Loss) 8,588,389 0 0 0
Employee Pension Contribution 2,634,562 0 0 0
Total Sources of Funding $15,312,911 $3,169,090 $2,979,740 ($189,350)
Uses of Funding
Legal Fees $9,363 $0 $0 $0
Audit Fees 7,220 0 0 0
Consulting Fees 84,659 0 0 0
Other Professional Services 43,054 0 0 0
Employee Pension Fund Payments 2,560,717 0 0 0
Budgeted Employer Pension Contribution 0 3,169,090 2,979,740 (189,350)
Total Uses of Funding $2,705,013 $3,169,090 $2,979,740 ($189,350)
OPEB, Pension Trust, and Special Revenue Funds
Pension Trust FundThe Carroll County Pension Plan, a defined benefit pension plan, was implemented July 1, 2003. The plan covers regular non-contractual employees hired July 1, 1985 and after, and provides a monthly payment to retirees beginning at age 62 or after 30years of service. Reduced payments are available to retirees at age 55 when age plus years of County service equals or exceeds80. In October 2009, the Pension Plan was enhanced, and County contributions to the 401(k) accounts of County Pension Planparticipants were discontinued. Beginning FY 18, the Pension Plan for the Correctional Deputies was enhanced by reducingnormal retirement from 30 years of service to 25 years, accelerating accrual rates for service, and crediting years of pre-employment military service. The Plan’s Administrative Committee, consisting of four individuals and two Plan participantsselected by the County Commissioners, has responsibility for the oversight and administrative functions of the Plan. FY 20Budget included improvements to disability benefits for correctional deputies.
122

FY 19 FY 20 FY 21 Increase
Sources of Funding Actual Budget Budget (Decrease)
Employer Pension Contribution $932,680 $1,318,260 $1,333,810 $15,550
Unrealized Gain/(Loss) 1,274,949 0 0 0
Employee Pension Contribution 543,413 0 0 0
Total Sources of Funding $2,751,042 $1,318,260 $1,333,810 $15,550
Uses of Funding
Audit Fees $2,440 $0 $0 $0
Consulting Fees 28,288 0 0 0
Other Miscellaneous Fees 5,496 0 0 0
Certified Law Officers Pension Fund Payments 296,602 0 0 0
Budgeted Employer Pension Contribution 0 1,318,260 1,333,810 15,550
Total Uses of Funding $332,826 $1,318,260 $1,333,810 $15,550
OPEB, Pension Trust, and Special Revenue Funds
Certified Law Officers Pension Trust FundThe Carroll County Certified Law Officers Pension Plan, a defined benefit pension plan, was established October 1, 2009. ThePlan covers certified law enforcement officers employed by the Carroll County Sheriff’s Office. A monthly benefit is providedfor officers who attain 25 years of service or who leave employment after age 55 with at least 15 years of service. Officers withat least 15, but less than 25, years of service who leave employment prior to age 55 are eligible for a monthly pension at age 62.The Plan’s Administrative Committee, consisting of four individuals and two Plan participants selected by the CountyCommissioners, has responsibility for the oversight and administrative functions of the Plan. FY 20 Budget includedimprovements to disability benefits for law enforcement officers.
123
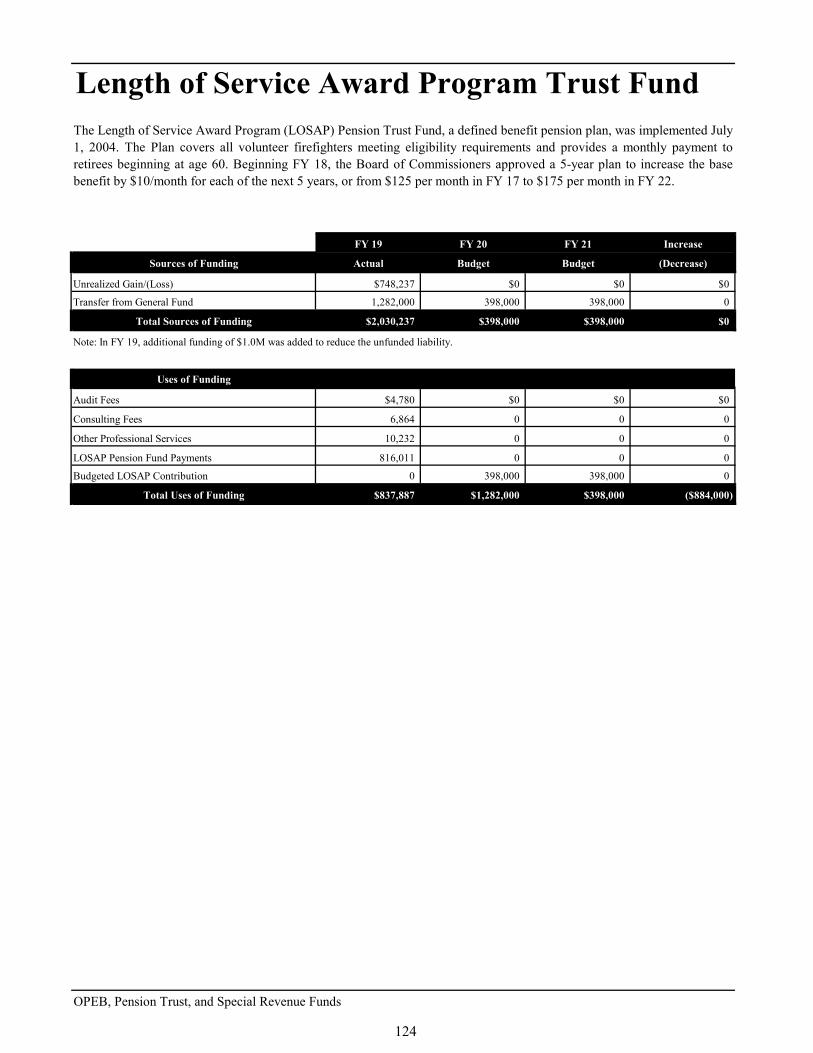
FY 19 FY 20 FY 21 Increase
Sources of Funding Actual Budget Budget (Decrease)
Unrealized Gain/(Loss) $748,237 $0 $0 $0
Transfer from General Fund 1,282,000 398,000 398,000 0
Total Sources of Funding $2,030,237 $398,000 $398,000 $0
Note: In FY 19, additional funding of $1.0M was added to reduce the unfunded liability.
Uses of Funding
Audit Fees $4,780 $0 $0 $0
Consulting Fees 6,864 0 0 0
Other Professional Services 10,232 0 0 0
LOSAP Pension Fund Payments 816,011 0 0 0
Budgeted LOSAP Contribution 0 398,000 398,000 0
Total Uses of Funding $837,887 $1,282,000 $398,000 ($884,000)
OPEB, Pension Trust, and Special Revenue Funds
Length of Service Award Program Trust FundThe Length of Service Award Program (LOSAP) Pension Trust Fund, a defined benefit pension plan, was implemented July1, 2004. The Plan covers all volunteer firefighters meeting eligibility requirements and provides a monthly payment toretirees beginning at age 60. Beginning FY 18, the Board of Commissioners approved a 5-year plan to increase the basebenefit by $10/month for each of the next 5 years, or from $125 per month in FY 17 to $175 per month in FY 22.
124
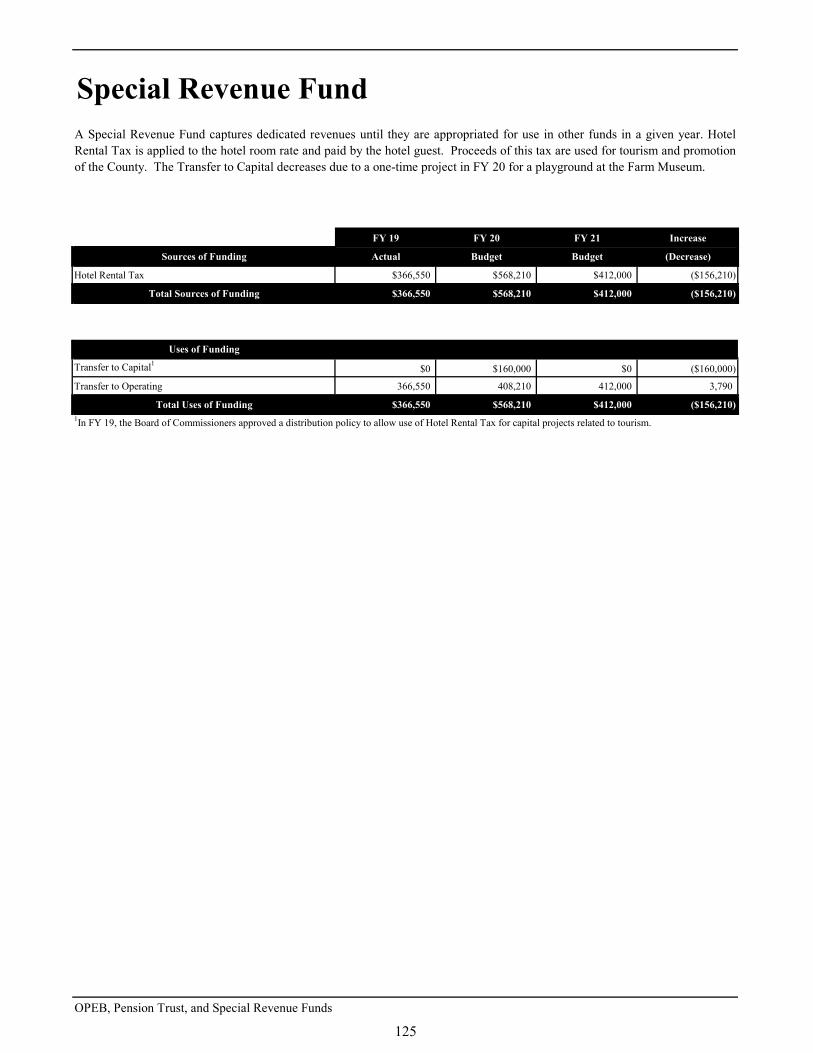
FY 19 FY 20 FY 21 Increase
Sources of Funding Actual Budget Budget (Decrease)
Hotel Rental Tax $366,550 $568,210 $412,000 ($156,210)
Total Sources of Funding $366,550 $568,210 $412,000 ($156,210)
Uses of Funding
Transfer to Capital1 $0 $160,000 $0 ($160,000)
Transfer to Operating 366,550 408,210 412,000 3,790
Total Uses of Funding $366,550 $568,210 $412,000 ($156,210)1In FY 19, the Board of Commissioners approved a distribution policy to allow use of Hotel Rental Tax for capital projects related to tourism.
OPEB, Pension Trust, and Special Revenue Funds
A Special Revenue Fund captures dedicated revenues until they are appropriated for use in other funds in a given year. HotelRental Tax is applied to the hotel room rate and paid by the hotel guest. Proceeds of this tax are used for tourism and promotionof the County. The Transfer to Capital decreases due to a one-time project in FY 20 for a playground at the Farm Museum.
Special Revenue Fund
125
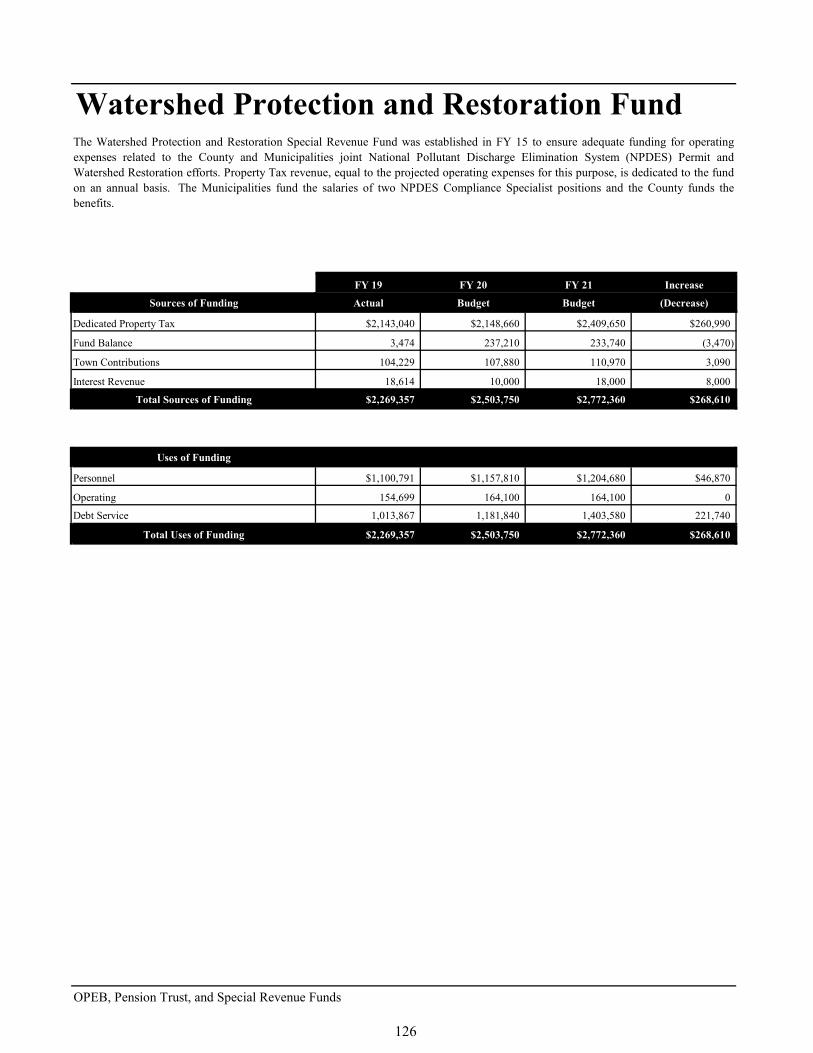
FY 19 FY 20 FY 21 Increase
Sources of Funding Actual Budget Budget (Decrease)
Dedicated Property Tax $2,143,040 $2,148,660 $2,409,650 $260,990
Fund Balance 3,474 237,210 233,740 (3,470)
Town Contributions 104,229 107,880 110,970 3,090
Interest Revenue 18,614 10,000 18,000 8,000
Total Sources of Funding $2,269,357 $2,503,750 $2,772,360 $268,610
Uses of Funding
Personnel $1,100,791 $1,157,810 $1,204,680 $46,870
Operating 154,699 164,100 164,100 0
Debt Service 1,013,867 1,181,840 1,403,580 221,740
Total Uses of Funding $2,269,357 $2,503,750 $2,772,360 $268,610
OPEB, Pension Trust, and Special Revenue Funds
Watershed Protection and Restoration FundThe Watershed Protection and Restoration Special Revenue Fund was established in FY 15 to ensure adequate funding for operatingexpenses related to the County and Municipalities joint National Pollutant Discharge Elimination System (NPDES) Permit andWatershed Restoration efforts. Property Tax revenue, equal to the projected operating expenses for this purpose, is dedicated to the fundon an annual basis. The Municipalities fund the salaries of two NPDES Compliance Specialist positions and the County funds thebenefits.
126

Internal Service Funds
127

128
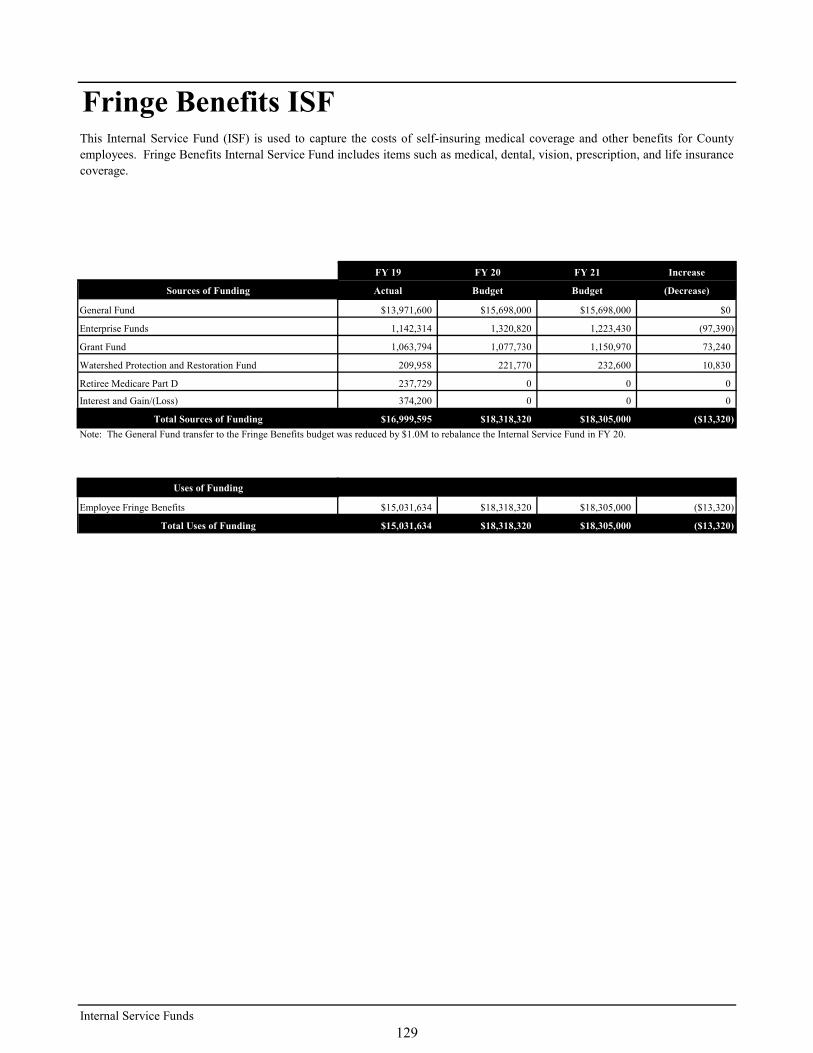
FY 19 FY 20 FY 21 Increase
Sources of Funding Actual Budget Budget (Decrease)
General Fund $13,971,600 $15,698,000 $15,698,000 $0
Enterprise Funds 1,142,314 1,320,820 1,223,430 (97,390)
Grant Fund 1,063,794 1,077,730 1,150,970 73,240
Watershed Protection and Restoration Fund 209,958 221,770 232,600 10,830
Retiree Medicare Part D 237,729 0 0 0
Interest and Gain/(Loss) 374,200 0 0 0
Total Sources of Funding $16,999,595 $18,318,320 $18,305,000 ($13,320)
Uses of Funding
Employee Fringe Benefits $15,031,634 $18,318,320 $18,305,000 ($13,320)
Total Uses of Funding $15,031,634 $18,318,320 $18,305,000 ($13,320)
Internal Service Funds
Fringe Benefits ISFThis Internal Service Fund (ISF) is used to capture the costs of self-insuring medical coverage and other benefits for Countyemployees. Fringe Benefits Internal Service Fund includes items such as medical, dental, vision, prescription, and life insurancecoverage.
Note: The General Fund transfer to the Fringe Benefits budget was reduced by $1.0M to rebalance the Internal Service Fund in FY 20.
129
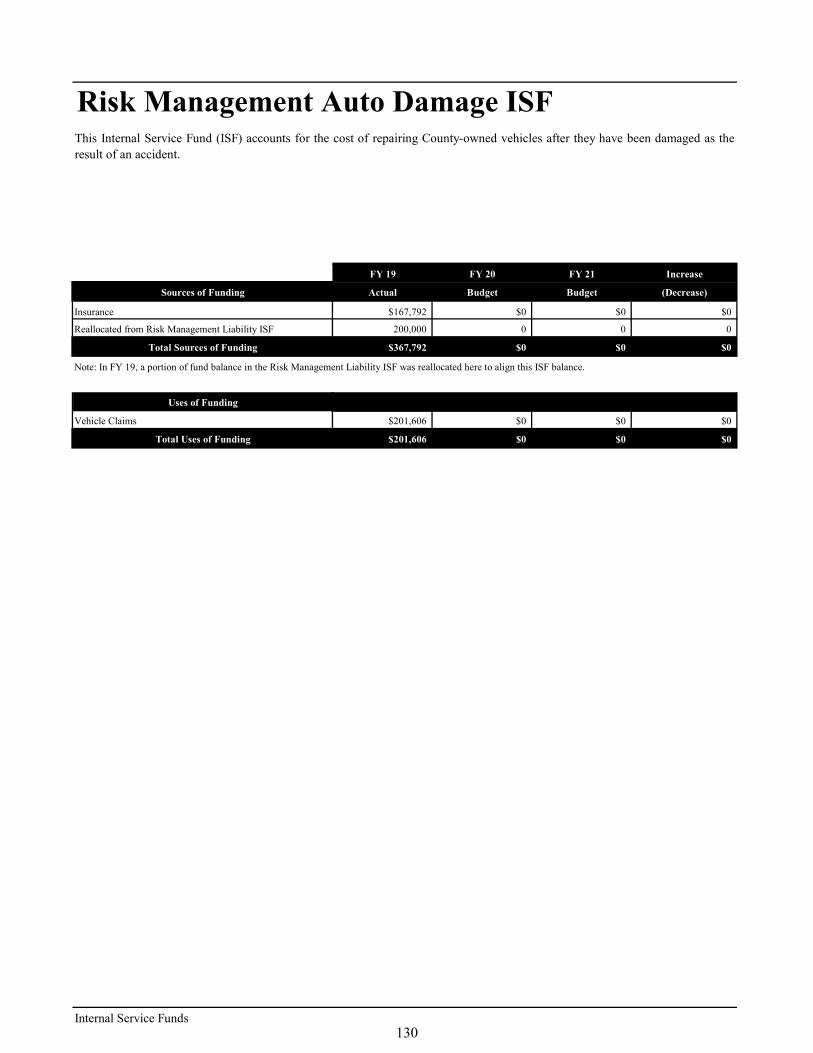
FY 19 FY 20 FY 21 Increase
Sources of Funding Actual Budget Budget (Decrease)
Insurance $167,792 $0 $0 $0
Reallocated from Risk Management Liability ISF 200,000 0 0 0
Total Sources of Funding $367,792 $0 $0 $0
Note: In FY 19, a portion of fund balance in the Risk Management Liability ISF was reallocated here to align this ISF balance.
Uses of Funding
Vehicle Claims $201,606 $0 $0 $0
Total Uses of Funding $201,606 $0 $0 $0
Internal Service Funds
Risk Management Auto Damage ISFThis Internal Service Fund (ISF) accounts for the cost of repairing County-owned vehicles after they have been damaged as theresult of an accident.
130
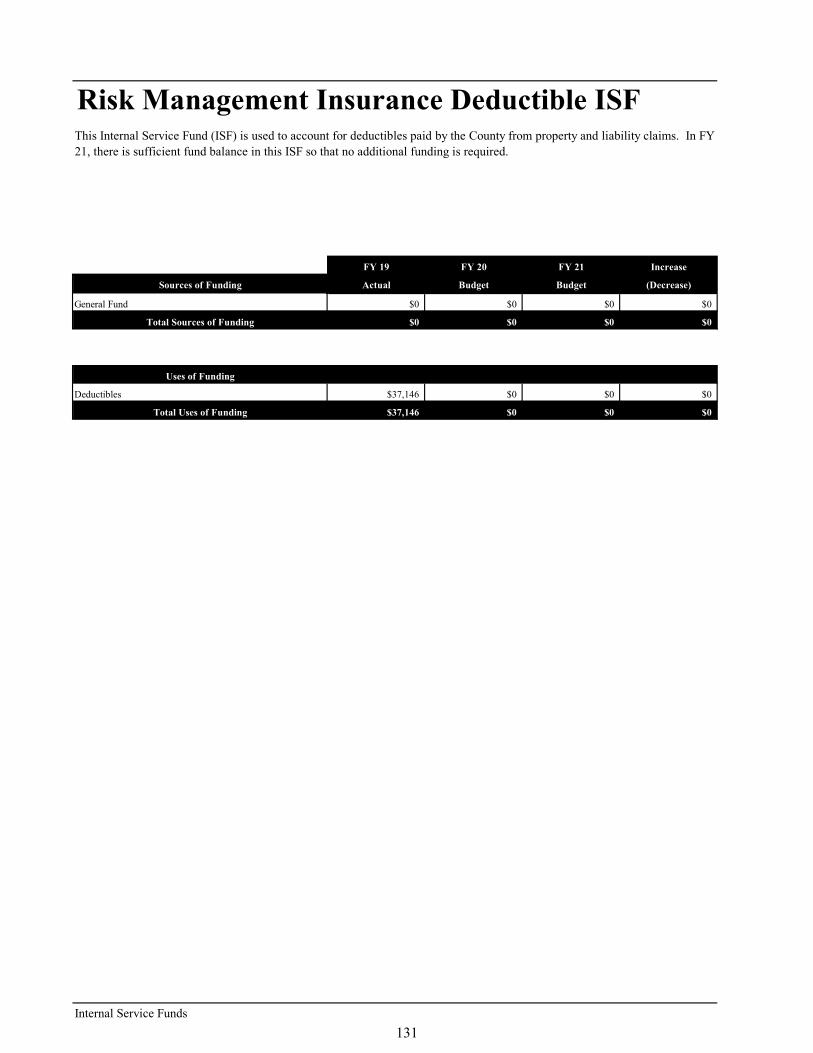
FY 19 FY 20 FY 21 Increase
Sources of Funding Actual Budget Budget (Decrease)
General Fund $0 $0 $0 $0
Total Sources of Funding $0 $0 $0 $0
Uses of Funding
Deductibles $37,146 $0 $0 $0
Total Uses of Funding $37,146 $0 $0 $0
Internal Service Funds
Risk Management Insurance Deductible ISFThis Internal Service Fund (ISF) is used to account for deductibles paid by the County from property and liability claims. In FY21, there is sufficient fund balance in this ISF so that no additional funding is required.
131

FY 19 FY 20 FY 21 Increase
Sources of Funding Actual Budget Budget (Decrease)
Insurance $7,396 $0 $0 $0
Total Sources of Funding $7,396 $0 $0 $0
Note: In FY 19, a portion of fund balance in this ISF was reallocated to align the Risk Management Auto Damage ISF balance.
Uses of Funding
Claims ($13,728) $0 $0 $0
Reallocated to Auto Damage ISF 200,000 0 0 0
Total Uses of Funding $186,272 $0 $0 $0
Internal Service Funds
Risk Management Liability ISFThis Internal Service Fund (ISF) accounts for and finances the County's uninsured risk. This fund accounts for losses relating toproperty and liability claims filed against the County.
132

FY 19 FY 20 FY 21 Increase
Sources of Funding Actual Budget Budget (Decrease)
General Fund $1,070,110 $968,000 $1,009,000 $41,000
Grant Fund 74,402 57,000 66,300 9,300
Enterprise Funds 73,522 61,500 60,700 (800)
Watershed Protection and Restoration Fund 18,332 13,500 14,000 500
Total Sources of Funding $1,236,365 $1,100,000 $1,150,000 $50,000
Uses of Funding
Claims $634,485 $1,100,000 $1,150,000 $50,000
Total Uses of Funding $634,485 $1,100,000 $1,150,000 $50,000
Internal Service Funds
Risk Management Workers Compensation ISFThis Internal Service Fund (ISF) was established in FY 16 to account for the cost of the County's Workers Compensationclaims.
133

134
Position Summary
135

136
Position Summary The following pages include a summary of positions in Carroll County government. All positions are General Fund positions unless specified as a Grant Fund, Enterprise Fund, or Special Revenue Fund position.
General Fund positions are supported by taxes, fees, and other general fund revenues. Grant Fund positions are supported primarily by State and Federal grants. Enterprise Fund positions are supported by revenues generated primarily by specific services;
for example, water and sewer charges support Utilities positions. Special Revenue Fund positions are supported by funds dedicated to a specific purpose, for
example, Property Tax dedicated to Watershed Protection and Restoration. The categories are arranged by Department and/or Bureau. The summary lists Full-Time Equivalent (FTE) totals of full-time, part-time, or other employees within the department or bureau. In some cases, a position may be more than one of these. For example, Circuit Court bailiffs are part-time and contractual.
Full-Time (FT) are regular full-time positions with full benefits. Part-Time (PT) are positions scheduled for fewer than 30 hours per week with limited or no
benefits. Other (O) are positions that are either subject to: the provisions of a contract that typically
lasts for one year or less and have limited or no benefits (Contractual); hired for temporary, seasonal work and do not have benefits (Seasonal); or required by law with salaries set by law (By-Law).
Some of the positions included in the summary are paid by the County, but do not report to the County Commissioners. They are listed under Board of Elections, Sheriff’s Office, Circuit Court, Circuit Court Magistrates, Orphan’s Court, Volunteer Community Service Program, State’s Attorney’s Office, and Soil Conservation. The overall number of authorized positions for FY 21 is 1,068.85 FTE, a decrease of 0.49 FTE from FY 20 Budget. For FY 20 Adjusted Budget, the following changes are included:
Two full-time positions were added to Fire Services Administration, a Director and an Administrative Assistant.
A full-time contractual Bailiff position was eliminated from Public Works Administration. A full-time position was transferred from Recreation to Recreation and Parks Administration. A seasonal contractual Assistant Camp Director was added to Piney Run Park. A full-time Fiscal Analyst was transferred from Comptroller Administration to Accounting. A Legal Administrative Assistant’s hours increased for County Attorney. A full-time Resource Management Technician is charged 20% to Resource Management and
80% to Watershed Protection and Restoration. Aging and Disabilities grant funded positions decrease for a change in salary allocations, offset
by an increase to Aging and Disabilities General Fund positions. A part-time Local Management Board grant-funded position was eliminated. A full-time grant-funded position for State’s Attorney’s Office was eliminated.
137
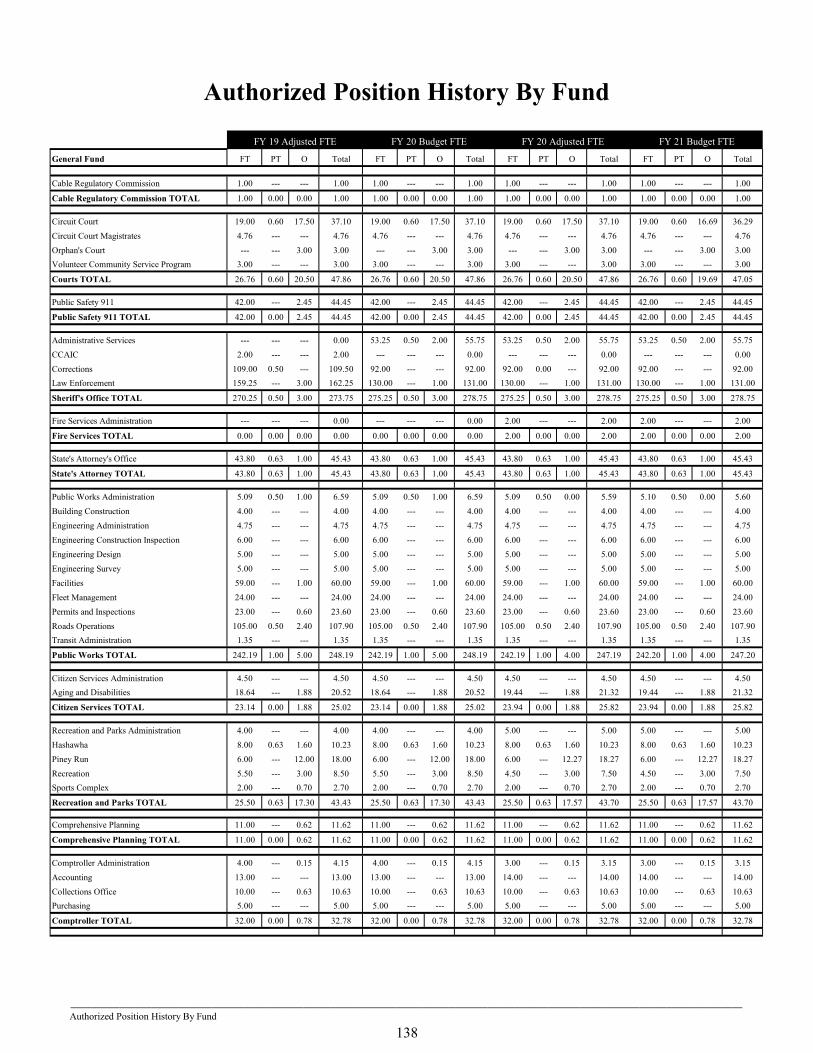
General Fund FT PT O Total FT PT O Total FT PT O Total FT PT O Total
Cable Regulatory Commission 1.00 --- --- 1.00 1.00 --- --- 1.00 1.00 --- --- 1.00 1.00 --- --- 1.00
Cable Regulatory Commission TOTAL 1.00 0.00 0.00 1.00 1.00 0.00 0.00 1.00 1.00 0.00 0.00 1.00 1.00 0.00 0.00 1.00
Circuit Court 19.00 0.60 17.50 37.10 19.00 0.60 17.50 37.10 19.00 0.60 17.50 37.10 19.00 0.60 16.69 36.29
Circuit Court Magistrates 4.76 --- --- 4.76 4.76 --- --- 4.76 4.76 --- --- 4.76 4.76 --- --- 4.76
Orphan's Court --- --- 3.00 3.00 --- --- 3.00 3.00 --- --- 3.00 3.00 --- --- 3.00 3.00
Volunteer Community Service Program 3.00 --- --- 3.00 3.00 --- --- 3.00 3.00 --- --- 3.00 3.00 --- --- 3.00
Courts TOTAL 26.76 0.60 20.50 47.86 26.76 0.60 20.50 47.86 26.76 0.60 20.50 47.86 26.76 0.60 19.69 47.05
Public Safety 911 42.00 --- 2.45 44.45 42.00 --- 2.45 44.45 42.00 --- 2.45 44.45 42.00 --- 2.45 44.45
Public Safety 911 TOTAL 42.00 0.00 2.45 44.45 42.00 0.00 2.45 44.45 42.00 0.00 2.45 44.45 42.00 0.00 2.45 44.45
Administrative Services --- --- --- 0.00 53.25 0.50 2.00 55.75 53.25 0.50 2.00 55.75 53.25 0.50 2.00 55.75
CCAIC 2.00 --- --- 2.00 --- --- --- 0.00 --- --- --- 0.00 --- --- --- 0.00
Corrections 109.00 0.50 --- 109.50 92.00 --- --- 92.00 92.00 0.00 --- 92.00 92.00 --- --- 92.00
Law Enforcement 159.25 --- 3.00 162.25 130.00 --- 1.00 131.00 130.00 --- 1.00 131.00 130.00 --- 1.00 131.00
Sheriff's Office TOTAL 270.25 0.50 3.00 273.75 275.25 0.50 3.00 278.75 275.25 0.50 3.00 278.75 275.25 0.50 3.00 278.75
Fire Services Administration --- --- --- 0.00 --- --- --- 0.00 2.00 --- --- 2.00 2.00 --- --- 2.00
Fire Services TOTAL 0.00 0.00 0.00 0.00 0.00 0.00 0.00 0.00 2.00 0.00 0.00 2.00 2.00 0.00 0.00 2.00
State's Attorney's Office 43.80 0.63 1.00 45.43 43.80 0.63 1.00 45.43 43.80 0.63 1.00 45.43 43.80 0.63 1.00 45.43
State's Attorney TOTAL 43.80 0.63 1.00 45.43 43.80 0.63 1.00 45.43 43.80 0.63 1.00 45.43 43.80 0.63 1.00 45.43
Public Works Administration 5.09 0.50 1.00 6.59 5.09 0.50 1.00 6.59 5.09 0.50 0.00 5.59 5.10 0.50 0.00 5.60
Building Construction 4.00 --- --- 4.00 4.00 --- --- 4.00 4.00 --- --- 4.00 4.00 --- --- 4.00
Engineering Administration 4.75 --- --- 4.75 4.75 --- --- 4.75 4.75 --- --- 4.75 4.75 --- --- 4.75
Engineering Construction Inspection 6.00 --- --- 6.00 6.00 --- --- 6.00 6.00 --- --- 6.00 6.00 --- --- 6.00
Engineering Design 5.00 --- --- 5.00 5.00 --- --- 5.00 5.00 --- --- 5.00 5.00 --- --- 5.00
Engineering Survey 5.00 --- --- 5.00 5.00 --- --- 5.00 5.00 --- --- 5.00 5.00 --- --- 5.00
Facilities 59.00 --- 1.00 60.00 59.00 --- 1.00 60.00 59.00 --- 1.00 60.00 59.00 --- 1.00 60.00
Fleet Management 24.00 --- --- 24.00 24.00 --- --- 24.00 24.00 --- --- 24.00 24.00 --- --- 24.00
Permits and Inspections 23.00 --- 0.60 23.60 23.00 --- 0.60 23.60 23.00 --- 0.60 23.60 23.00 --- 0.60 23.60
Roads Operations 105.00 0.50 2.40 107.90 105.00 0.50 2.40 107.90 105.00 0.50 2.40 107.90 105.00 0.50 2.40 107.90
Transit Administration 1.35 --- --- 1.35 1.35 --- --- 1.35 1.35 --- --- 1.35 1.35 --- --- 1.35
Public Works TOTAL 242.19 1.00 5.00 248.19 242.19 1.00 5.00 248.19 242.19 1.00 4.00 247.19 242.20 1.00 4.00 247.20
Citizen Services Administration 4.50 --- --- 4.50 4.50 --- --- 4.50 4.50 --- --- 4.50 4.50 --- --- 4.50
Aging and Disabilities 18.64 --- 1.88 20.52 18.64 --- 1.88 20.52 19.44 --- 1.88 21.32 19.44 --- 1.88 21.32
Citizen Services TOTAL 23.14 0.00 1.88 25.02 23.14 0.00 1.88 25.02 23.94 0.00 1.88 25.82 23.94 0.00 1.88 25.82
Recreation and Parks Administration 4.00 --- --- 4.00 4.00 --- --- 4.00 5.00 --- --- 5.00 5.00 --- --- 5.00
Hashawha 8.00 0.63 1.60 10.23 8.00 0.63 1.60 10.23 8.00 0.63 1.60 10.23 8.00 0.63 1.60 10.23
Piney Run 6.00 --- 12.00 18.00 6.00 --- 12.00 18.00 6.00 --- 12.27 18.27 6.00 --- 12.27 18.27
Recreation 5.50 --- 3.00 8.50 5.50 --- 3.00 8.50 4.50 --- 3.00 7.50 4.50 --- 3.00 7.50
Sports Complex 2.00 --- 0.70 2.70 2.00 --- 0.70 2.70 2.00 --- 0.70 2.70 2.00 --- 0.70 2.70
Recreation and Parks TOTAL 25.50 0.63 17.30 43.43 25.50 0.63 17.30 43.43 25.50 0.63 17.57 43.70 25.50 0.63 17.57 43.70
Comprehensive Planning 11.00 --- 0.62 11.62 11.00 --- 0.62 11.62 11.00 --- 0.62 11.62 11.00 --- 0.62 11.62
Comprehensive Planning TOTAL 11.00 0.00 0.62 11.62 11.00 0.00 0.62 11.62 11.00 0.00 0.62 11.62 11.00 0.00 0.62 11.62
Comptroller Administration 4.00 --- 0.15 4.15 4.00 --- 0.15 4.15 3.00 --- 0.15 3.15 3.00 --- 0.15 3.15
Accounting 13.00 --- --- 13.00 13.00 --- --- 13.00 14.00 --- --- 14.00 14.00 --- --- 14.00
Collections Office 10.00 --- 0.63 10.63 10.00 --- 0.63 10.63 10.00 --- 0.63 10.63 10.00 --- 0.63 10.63
Purchasing 5.00 --- --- 5.00 5.00 --- --- 5.00 5.00 --- --- 5.00 5.00 --- --- 5.00
Comptroller TOTAL 32.00 0.00 0.78 32.78 32.00 0.00 0.78 32.78 32.00 0.00 0.78 32.78 32.00 0.00 0.78 32.78
FY 19 Adjusted FTE FY 20 Budget FTE
Authorized Position History By Fund
FY 20 Adjusted FTE FY 21 Budget FTE
Authorized Position History By Fund____________________________________________________________________________________________________________________________
138

FY 19 Adjusted FTE FY 20 Budget FTE
Authorized Position History By Fund
FY 20 Adjusted FTE FY 21 Budget FTE
County Attorney 6.75 --- --- 6.75 6.75 --- --- 6.75 7.00 --- --- 7.00 7.00 --- --- 7.00
County Attorney TOTAL 6.75 0.00 0.00 6.75 6.75 0.00 0.00 6.75 7.00 0.00 0.00 7.00 7.00 0.00 0.00 7.00
Economic Development Administration 5.75 --- --- 5.75 5.75 --- --- 5.75 5.75 --- --- 5.75 5.75 --- --- 5.75
BERC 2.85 --- --- 2.85 2.85 --- --- 2.85 2.85 --- --- 2.85 2.85 --- --- 2.85
Farm Museum 7.00 0.70 3.40 11.10 7.00 0.70 3.40 11.10 7.00 0.70 3.40 11.10 7.00 0.70 3.40 11.10
Tourism 1.00 --- 1.90 2.90 1.00 --- 1.90 2.90 1.00 --- 1.70 2.70 1.00 --- 1.70 2.70
Economic Development TOTAL 16.60 0.70 5.30 22.60 16.60 0.70 5.30 22.60 16.60 0.70 5.10 22.40 16.60 0.70 5.10 22.40
Human Resources 10.00 --- --- 10.00 11.00 --- --- 11.00 11.00 --- --- 11.00 11.00 --- --- 11.00
Personnel Services 4.00 --- --- 4.00 4.00 --- --- 4.00 4.00 --- --- 4.00 4.00 --- --- 4.00
Human Resources TOTAL 14.00 0.00 0.00 14.00 15.00 0.00 0.00 15.00 15.00 0.00 0.00 15.00 15.00 0.00 0.00 15.00
Land and Res. Management Administration 9.20 --- 0.23 9.43 9.20 --- 0.23 9.43 9.20 --- 0.23 9.43 9.20 --- 0.23 9.43
Development Review 8.00 --- --- 8.00 8.00 --- --- 8.00 8.00 --- --- 8.00 8.00 --- --- 8.00
Resource Management 10.15 --- --- 10.15 10.65 --- --- 10.65 10.35 --- --- 10.35 10.35 --- --- 10.35
Zoning Administration 4.00 --- --- 4.00 4.00 --- --- 4.00 4.00 --- --- 4.00 4.00 --- --- 4.00
Land and Resource Management TOTAL 31.35 0.00 0.23 31.58 31.85 0.00 0.23 32.08 31.55 0.00 0.23 31.78 31.55 0.00 0.23 31.78
Management and Budget Administration 2.00 --- --- 2.00 2.00 --- --- 2.00 2.00 --- --- 2.00 2.00 --- --- 2.00
Budget 7.00 --- 0.15 7.15 7.00 --- 0.15 7.15 7.00 --- 0.15 7.15 7.00 --- 0.15 7.15
Grant Management 2.00 --- --- 2.00 2.00 --- --- 2.00 2.00 --- --- 2.00 2.00 --- --- 2.00
Risk Management 4.00 --- --- 4.00 4.00 --- --- 4.00 4.00 --- --- 4.00 4.00 --- --- 4.00
Management and Budget TOTAL 15.00 0.00 0.15 15.15 15.00 0.00 0.15 15.15 15.00 0.00 0.15 15.15 15.00 0.00 0.15 15.15
Technology Services 31.00 --- 0.17 31.17 32.00 --- 0.17 32.17 32.00 --- 0.17 32.17 32.00 --- 0.17 32.17
Production and Distribution Services 3.00 --- --- 3.00 3.00 --- --- 3.00 3.00 --- --- 3.00 3.00 --- --- 3.00
Technology Services TOTAL 34.00 0.00 0.17 34.17 35.00 0.00 0.17 35.17 35.00 0.00 0.17 35.17 35.00 0.00 0.17 35.17
Administrative Hearings 1.00 --- --- 1.00 1.00 --- --- 1.00 1.00 --- --- 1.00 1.00 --- --- 1.00
Audio Video Production 3.00 --- --- 3.00 3.00 --- --- 3.00 3.00 --- --- 3.00 3.00 --- --- 3.00
Board of Elections --- --- 0.62 0.62 --- --- 0.62 0.62 --- --- 0.62 0.62 --- --- 0.62 0.62
Board of License Commissioners 1.00 --- 0.18 1.18 1.00 --- 0.18 1.18 1.00 --- 0.18 1.18 1.00 --- 0.18 1.18
County Commissioners 7.00 --- 6.65 13.65 7.00 --- 6.65 13.65 7.00 --- 6.65 13.65 7.00 --- 6.65 13.65
Gen Government Other TOTAL 12.00 0.00 7.45 19.45 12.00 0.00 7.45 19.45 12.00 0.00 7.45 19.45 12.00 0.00 7.45 19.45
Soil Conservation 5.00 0.63 --- 5.63 5.00 0.63 --- 5.63 5.00 0.63 --- 5.63 5.00 0.63 --- 5.63
Cons. and Natural Resources TOTAL 5.00 0.63 0.00 5.63 5.00 0.63 0.00 5.63 5.00 0.63 0.00 5.63 5.00 0.63 0.00 5.63
TOTAL General Fund 852.34 4.69 65.83 922.86 859.84 4.69 65.83 930.36 862.59 4.69 64.90 932.18 862.60 4.69 64.09 931.38
Authorized Position History By Fund____________________________________________________________________________________________________________________________
139
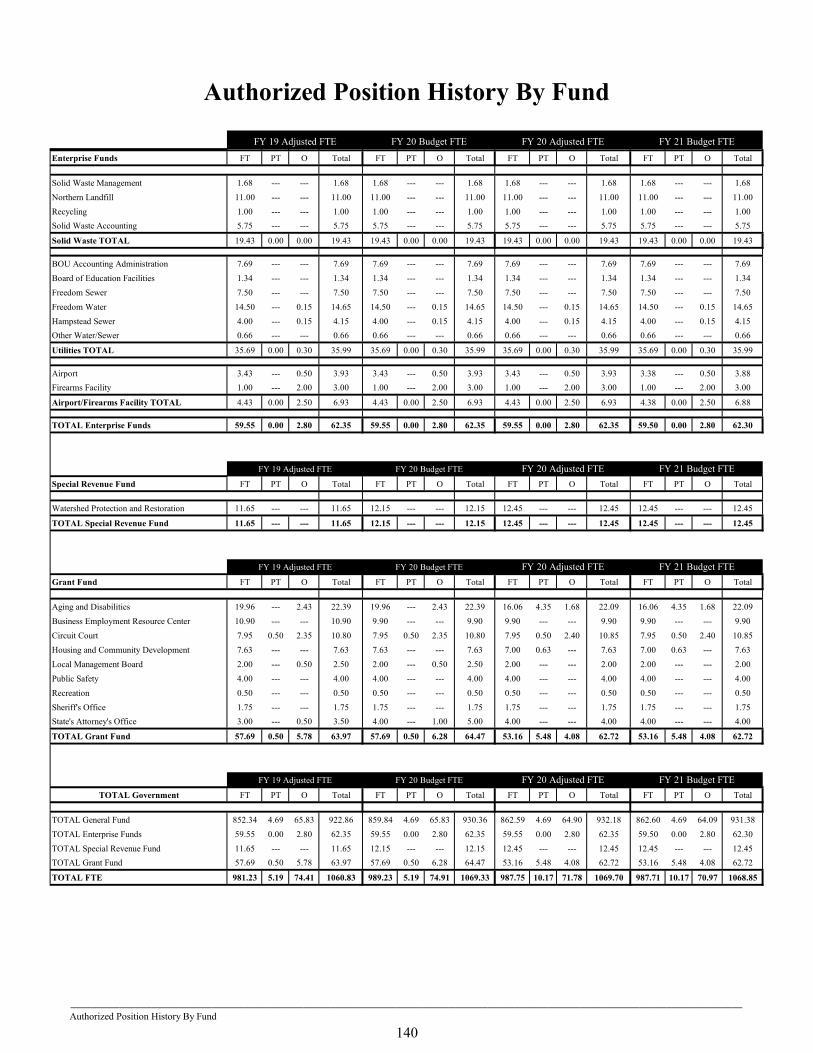
FY 19 Adjusted FTE FY 20 Budget FTE
Authorized Position History By Fund
FY 20 Adjusted FTE FY 21 Budget FTE
Enterprise Funds FT PT O Total FT PT O Total FT PT O Total FT PT O Total
Solid Waste Management 1.68 --- --- 1.68 1.68 --- --- 1.68 1.68 --- --- 1.68 1.68 --- --- 1.68
Northern Landfill 11.00 --- --- 11.00 11.00 --- --- 11.00 11.00 --- --- 11.00 11.00 --- --- 11.00
Recycling 1.00 --- --- 1.00 1.00 --- --- 1.00 1.00 --- --- 1.00 1.00 --- --- 1.00
Solid Waste Accounting 5.75 --- --- 5.75 5.75 --- --- 5.75 5.75 --- --- 5.75 5.75 --- --- 5.75
Solid Waste TOTAL 19.43 0.00 0.00 19.43 19.43 0.00 0.00 19.43 19.43 0.00 0.00 19.43 19.43 0.00 0.00 19.43
BOU Accounting Administration 7.69 --- --- 7.69 7.69 --- --- 7.69 7.69 --- --- 7.69 7.69 --- --- 7.69
Board of Education Facilities 1.34 --- --- 1.34 1.34 --- --- 1.34 1.34 --- --- 1.34 1.34 --- --- 1.34
Freedom Sewer 7.50 --- --- 7.50 7.50 --- --- 7.50 7.50 --- --- 7.50 7.50 --- --- 7.50
Freedom Water 14.50 --- 0.15 14.65 14.50 --- 0.15 14.65 14.50 --- 0.15 14.65 14.50 --- 0.15 14.65
Hampstead Sewer 4.00 --- 0.15 4.15 4.00 --- 0.15 4.15 4.00 --- 0.15 4.15 4.00 --- 0.15 4.15
Other Water/Sewer 0.66 --- --- 0.66 0.66 --- --- 0.66 0.66 --- --- 0.66 0.66 --- --- 0.66
Utilities TOTAL 35.69 0.00 0.30 35.99 35.69 0.00 0.30 35.99 35.69 0.00 0.30 35.99 35.69 0.00 0.30 35.99
Airport 3.43 --- 0.50 3.93 3.43 --- 0.50 3.93 3.43 --- 0.50 3.93 3.38 --- 0.50 3.88
Firearms Facility 1.00 --- 2.00 3.00 1.00 --- 2.00 3.00 1.00 --- 2.00 3.00 1.00 --- 2.00 3.00
Airport/Firearms Facility TOTAL 4.43 0.00 2.50 6.93 4.43 0.00 2.50 6.93 4.43 0.00 2.50 6.93 4.38 0.00 2.50 6.88
TOTAL Enterprise Funds 59.55 0.00 2.80 62.35 59.55 0.00 2.80 62.35 59.55 0.00 2.80 62.35 59.50 0.00 2.80 62.30
Special Revenue Fund FT PT O Total FT PT O Total FT PT O Total FT PT O Total
Watershed Protection and Restoration 11.65 --- --- 11.65 12.15 --- --- 12.15 12.45 --- --- 12.45 12.45 --- --- 12.45
TOTAL Special Revenue Fund 11.65 --- --- 11.65 12.15 --- --- 12.15 12.45 --- --- 12.45 12.45 --- --- 12.45
Grant Fund FT PT O Total FT PT O Total FT PT O Total FT PT O Total
Aging and Disabilities 19.96 --- 2.43 22.39 19.96 --- 2.43 22.39 16.06 4.35 1.68 22.09 16.06 4.35 1.68 22.09
Business Employment Resource Center 10.90 --- --- 10.90 9.90 --- --- 9.90 9.90 --- --- 9.90 9.90 --- --- 9.90
Circuit Court 7.95 0.50 2.35 10.80 7.95 0.50 2.35 10.80 7.95 0.50 2.40 10.85 7.95 0.50 2.40 10.85
Housing and Community Development 7.63 --- --- 7.63 7.63 --- --- 7.63 7.00 0.63 --- 7.63 7.00 0.63 --- 7.63
Local Management Board 2.00 --- 0.50 2.50 2.00 --- 0.50 2.50 2.00 --- --- 2.00 2.00 --- --- 2.00
Public Safety 4.00 --- --- 4.00 4.00 --- --- 4.00 4.00 --- --- 4.00 4.00 --- --- 4.00
Recreation 0.50 --- --- 0.50 0.50 --- --- 0.50 0.50 --- --- 0.50 0.50 --- --- 0.50
Sheriff's Office 1.75 --- --- 1.75 1.75 --- --- 1.75 1.75 --- --- 1.75 1.75 --- --- 1.75
State's Attorney's Office 3.00 --- 0.50 3.50 4.00 --- 1.00 5.00 4.00 --- --- 4.00 4.00 --- --- 4.00
TOTAL Grant Fund 57.69 0.50 5.78 63.97 57.69 0.50 6.28 64.47 53.16 5.48 4.08 62.72 53.16 5.48 4.08 62.72
TOTAL Government FT PT O Total FT PT O Total FT PT O Total FT PT O Total
TOTAL General Fund 852.34 4.69 65.83 922.86 859.84 4.69 65.83 930.36 862.59 4.69 64.90 932.18 862.60 4.69 64.09 931.38
TOTAL Enterprise Funds 59.55 0.00 2.80 62.35 59.55 0.00 2.80 62.35 59.55 0.00 2.80 62.35 59.50 0.00 2.80 62.30
TOTAL Special Revenue Fund 11.65 --- --- 11.65 12.15 --- --- 12.15 12.45 --- --- 12.45 12.45 --- --- 12.45
TOTAL Grant Fund 57.69 0.50 5.78 63.97 57.69 0.50 6.28 64.47 53.16 5.48 4.08 62.72 53.16 5.48 4.08 62.72
TOTAL FTE 981.23 5.19 74.41 1060.83 989.23 5.19 74.91 1069.33 987.75 10.17 71.78 1069.70 987.71 10.17 70.97 1068.85
FY 20 Adjusted FTE FY 21 Budget FTE
FY 19 Adjusted FTE FY 20 Budget FTE
FY 19 Adjusted FTE FY 20 Budget FTE
FY 19 Adjusted FTE FY 20 Budget FTE
FY 20 Adjusted FTE FY 21 Budget FTE
FY 20 Adjusted FTE FY 21 Budget FTE
Authorized Position History By Fund____________________________________________________________________________________________________________________________
140
Related Documents