Putting it all together: Housing Inventory Chart (HIC) Point in Time (PIT) Service Point (WISP) Carrie Poser – Starting Points Adam Smith – Division of Housing May 2012

Carrie Poser – Starting Points Adam Smith – Division of Housing May 2012.
Dec 15, 2015
Welcome message from author
This document is posted to help you gain knowledge. Please leave a comment to let me know what you think about it! Share it to your friends and learn new things together.
Transcript

Putting it all together:
Housing Inventory Chart (HIC) Point in Time (PIT)
Service Point (WISP)
Carrie Poser – Starting PointsAdam Smith – Division of HousingMay 2012
What is the Housing Inventory Chart?
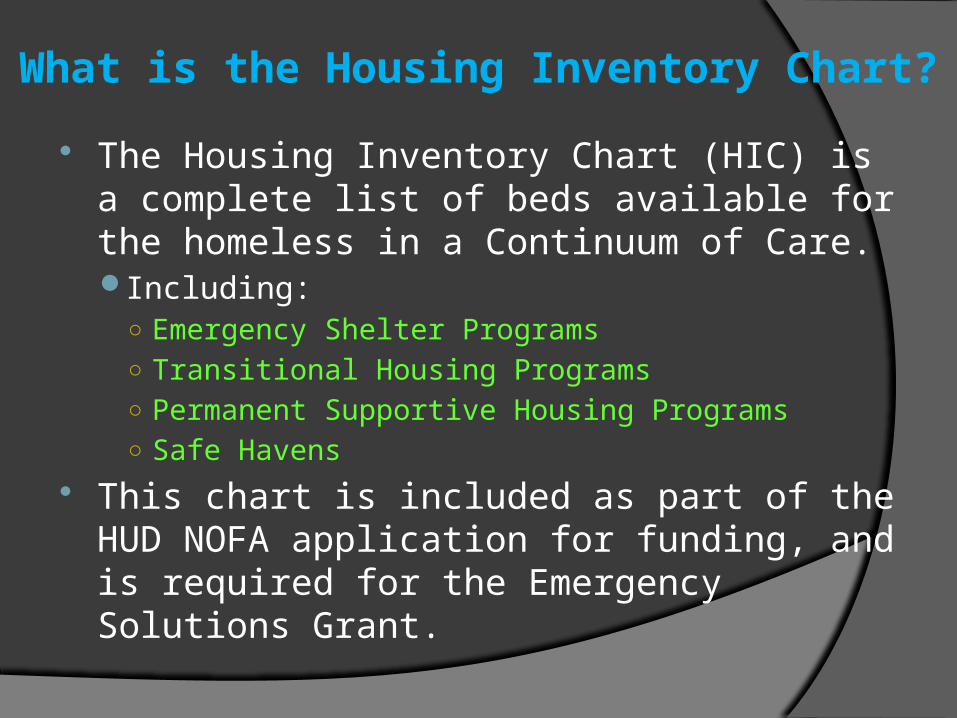
The Housing Inventory Chart (HIC) is a complete list of beds available for the homeless in a Continuum of Care. Including:
○ Emergency Shelter Programs○ Transitional Housing Programs○ Permanent Supportive Housing Programs○ Safe Havens
This chart is included as part of the HUD NOFA application for funding, and is required for the Emergency Solutions Grant.
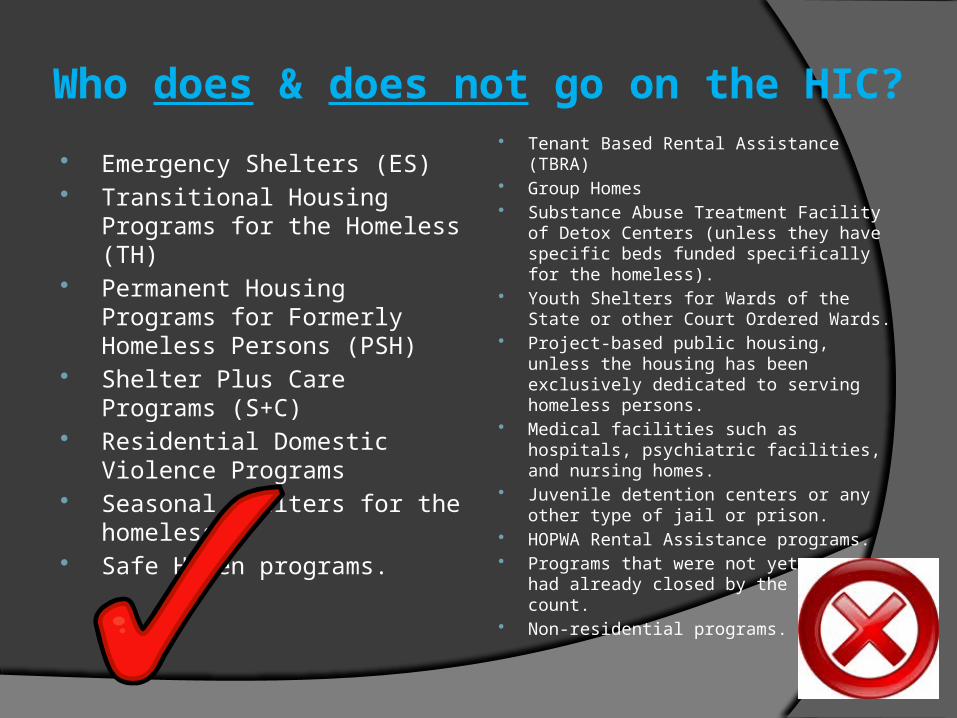
Who does & does not go on the HIC?
Emergency Shelters (ES) Transitional Housing
Programs for the Homeless (TH)
Permanent Housing Programs for Formerly Homeless Persons (PSH)
Shelter Plus Care Programs (S+C)
Residential Domestic Violence Programs
Seasonal shelters for the homeless.
Safe Haven programs.
Tenant Based Rental Assistance (TBRA)
Group Homes Substance Abuse Treatment Facility
of Detox Centers (unless they have specific beds funded specifically for the homeless).
Youth Shelters for Wards of the State or other Court Ordered Wards.
Project-based public housing, unless the housing has been exclusively dedicated to serving homeless persons.
Medical facilities such as hospitals, psychiatric facilities, and nursing homes.
Juvenile detention centers or any other type of jail or prison.
HOPWA Rental Assistance programs. Programs that were not yet open or
had already closed by the PIT count. Non-residential programs.

What kind of information does the HIC contain?
Who is providing the service?○ Provider & Facility Name
Where is the place located?○ Geocode
Who can stay there?○ Subpopulation served ○ Is it funded by HUD McKinney-Vento dollars?
How much room is there?○ Number of beds designated for individuals ○ Number of beds designated for families○ Number of beds designated for children○ Total number of year round beds○ Number of seasonal beds○ Number of overflow & voucher beds
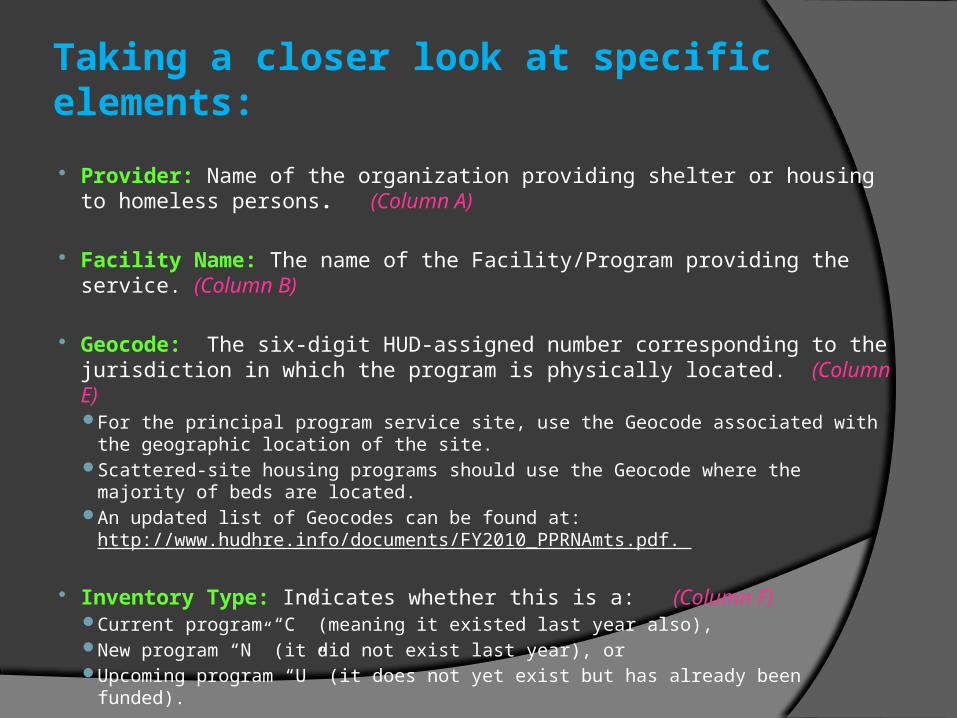
Taking a closer look at specific elements:
Provider: Name of the organization providing shelter or housing to homeless persons. (Column A)
Facility Name: The name of the Facility/Program providing the service. (Column B)
Geocode: The six-digit HUD-assigned number corresponding to the jurisdiction in which the program is physically located. (Column E) For the principal program service site, use the Geocode associated with the
geographic location of the site. Scattered-site housing programs should use the Geocode where the
majority of beds are located. An updated list of Geocodes can be found at:
http://www.hudhre.info/documents/FY2010_PPRNAmts.pdf.
Inventory Type: Indicates whether this is a: (Column F) Current program “C” (meaning it existed last year also), New program “N” (it did not exist last year), or Upcoming program “U” (it does not yet exist but has already been funded).
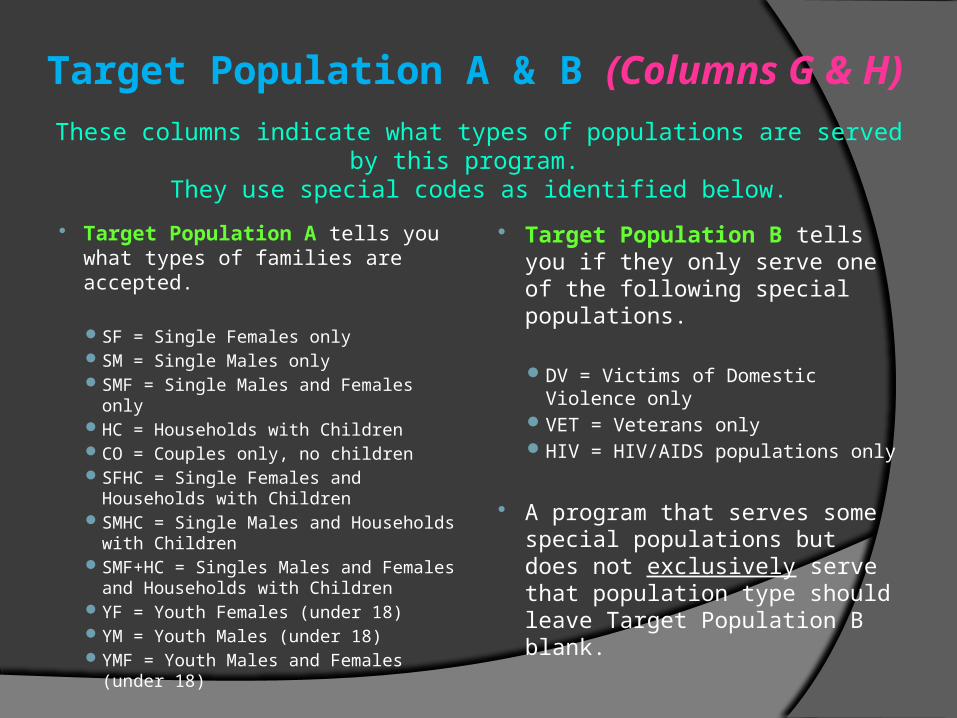
Target Population A & B (Columns G & H)
Target Population A tells you what types of families are accepted.
SF = Single Females only SM = Single Males only SMF = Single Males and Females
only HC = Households with Children CO = Couples only, no children SFHC = Single Females and
Households with Children SMHC = Single Males and
Households with Children SMF+HC = Singles Males and
Females and Households with Children
YF = Youth Females (under 18) YM = Youth Males (under 18) YMF = Youth Males and Females
(under 18)
Target Population B tells you if they only serve one of the following special populations.
DV = Victims of Domestic Violence only
VET = Veterans only HIV = HIV/AIDS populations
only
A program that serves some special populations but does not exclusively serve that population type should leave Target Population B blank.
These columns indicate what types of populations are served by this program.
They use special codes as identified below.
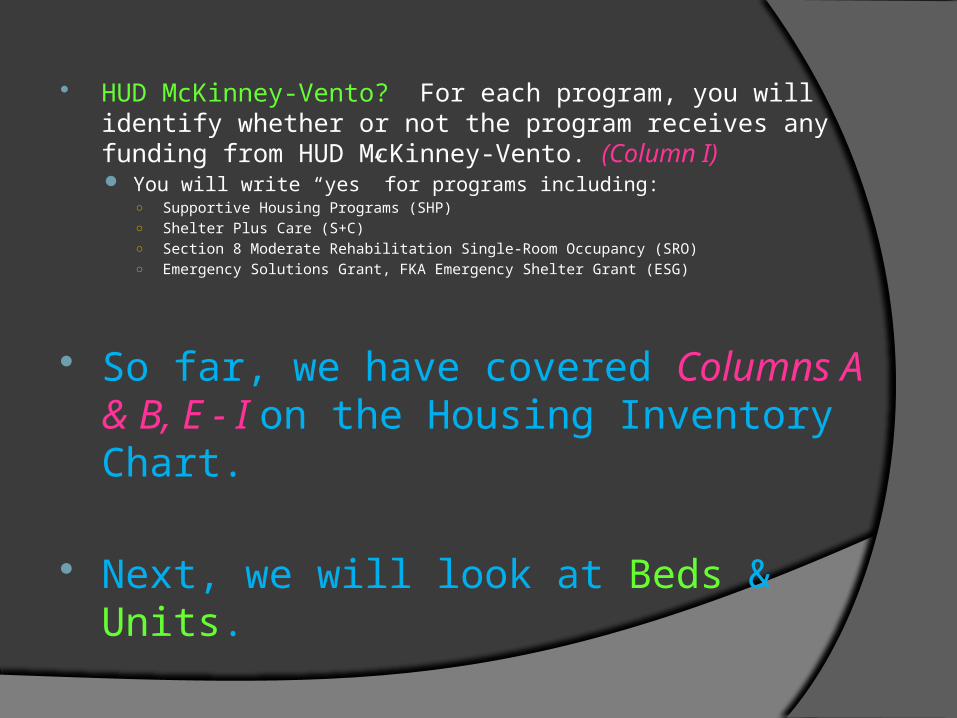
HUD McKinney-Vento? For each program, you will identify whether or not the program receives any funding from HUD McKinney-Vento. (Column I) You will write “yes” for programs including:
○ Supportive Housing Programs (SHP)○ Shelter Plus Care (S+C)○ Section 8 Moderate Rehabilitation Single-Room Occupancy (SRO)○ Emergency Solutions Grant, FKA Emergency Shelter Grant (ESG)
So far, we have covered Columns A & B, E - I on the Housing Inventory Chart.
Next, we will look at Beds & Units.

All Year Beds & Units The most important part of the Housing Inventory
Chart is the listing of available beds in each program. This can be one of the more confusing parts of the chart for
some programs.
This section of the chart does not include any seasonal programs or any overflow or voucher beds. This is only for Year-Round Beds.
This section is split into four main parts: Family Beds (Column J) Family Units (Column K) Individual Beds (Column L) Children Only Beds (Column M)
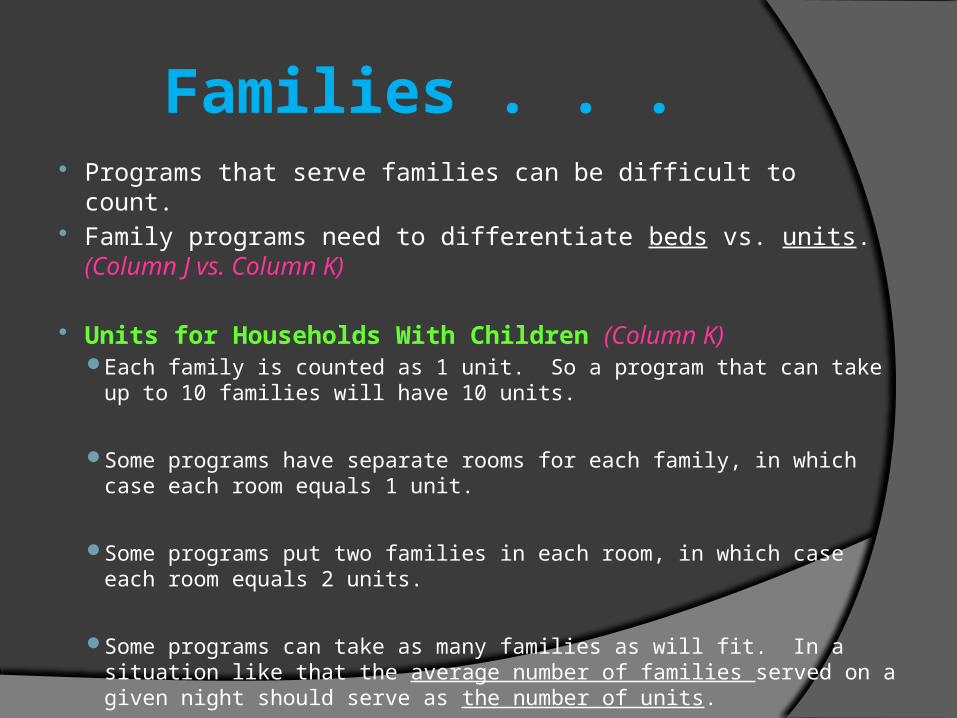
Families . . . Programs that serve families can be difficult to count. Family programs need to differentiate beds vs. units.
(Column J vs. Column K)
Units for Households With Children (Column K) Each family is counted as 1 unit. So a program that can take
up to 10 families will have 10 units.
Some programs have separate rooms for each family, in which case each room equals 1 unit.
Some programs put two families in each room, in which case each room equals 2 units.
Some programs can take as many families as will fit. In a situation like that the average number of families served on a given night should serve as the number of units.
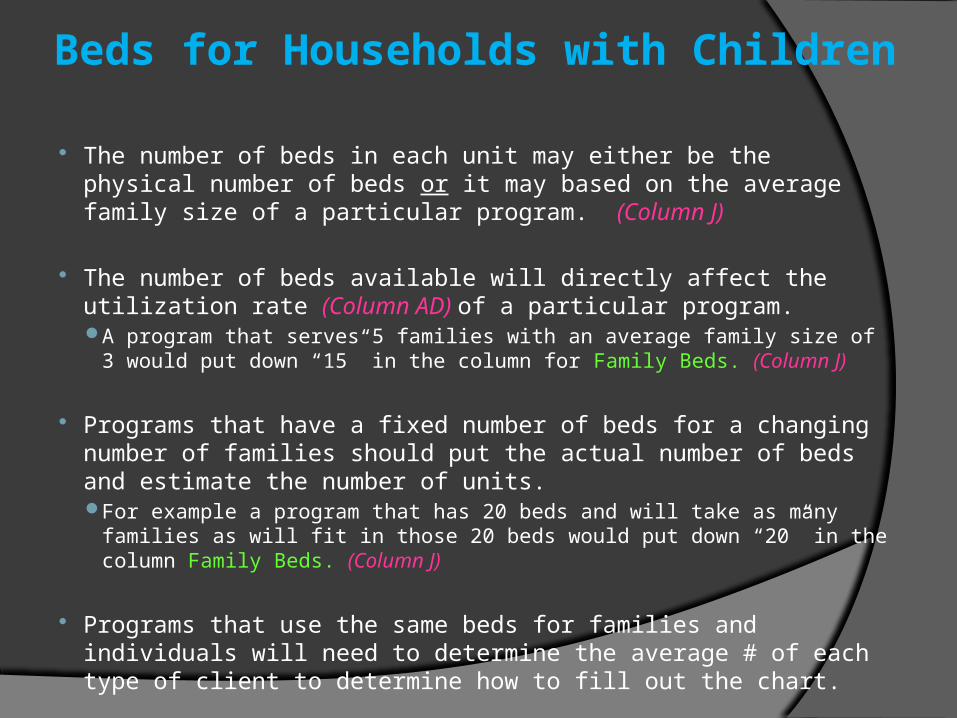
Beds for Households with Children
The number of beds in each unit may either be the physical number of beds or it may based on the average family size of a particular program. (Column J)
The number of beds available will directly affect the utilization rate (Column AD) of a particular program. A program that serves 5 families with an average family size of 3
would put down “15” in the column for Family Beds. (Column J)
Programs that have a fixed number of beds for a changing number of families should put the actual number of beds and estimate the number of units. For example a program that has 20 beds and will take as many
families as will fit in those 20 beds would put down “20” in the column Family Beds. (Column J)
Programs that use the same beds for families and individuals will need to determine the average # of each type of client to determine how to fill out the chart.
Beds for Households without Children
Programs that serve only single individuals are easy to count. Simply count the number of beds that are available year-round and
write down that number in the column for individual beds. (Column L)
Seasonal Beds, Overflow Beds, and Voucher Beds are not included in the Year-Round Bed Count.
Programs that serve both Families and Singles are encouraged to designate individual beds (Column L) and family beds (Column J) in order to make counting simpler.
Programs that intermingle family and single beds depending on demand should use: The average number of individuals as their count of individual beds
(Column L), and The average number of families to determine the number of family
beds (Column J) and units. (Column K)
Children Only Beds
Children only beds are handled the same as single beds. However, now they have to go into their own column. (Column M)
Simply count the number of beds that are available year-round and write down that number in the column.
These beds should correlated with YM, YF, and YMF programs. YF = Youth Females (under 18)YM = Youth Males (under 18)YMF = Youth Males and Females (under 18)
Total Year Round Beds
The Total Year Round Beds (Column N) for any program is:The number of family beds (Column J) plus
the number of individual beds (Column L) and children only beds. (Column M)
The Total Year Round Beds (Column N) is one of the numbers used to determine a program’s utilization rate. (Column AC)
Chronically Homeless Beds
In the Permanent Supportive Housing section of the Housing Inventory Chart, there is one additional column called CH Beds. (Column T)
In this column, you identify how many beds are designated for Chronically Homeless. Definition located on next slide.
These beds are specifically funded for Chronically Homeless persons and may not be used by anyone but Chronically Homeless.
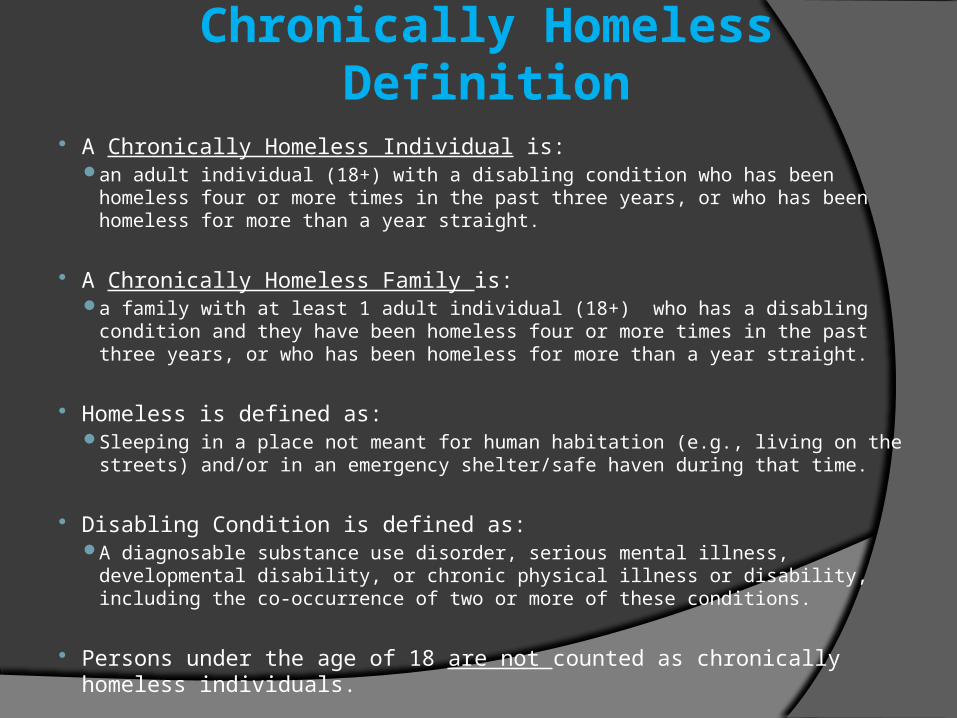
Chronically Homeless Definition
A Chronically Homeless Individual is: an adult individual (18+) with a disabling condition who has been homeless
four or more times in the past three years, or who has been homeless for more than a year straight.
A Chronically Homeless Family is: a family with at least 1 adult individual (18+) who has a disabling condition
and they have been homeless four or more times in the past three years, or who has been homeless for more than a year straight.
Homeless is defined as: Sleeping in a place not meant for human habitation (e.g., living on the streets) and/or in
an emergency shelter/safe haven during that time.
Disabling Condition is defined as: A diagnosable substance use disorder, serious mental illness, developmental disability,
or chronic physical illness or disability, including the co-occurrence of two or more of these conditions.
Persons under the age of 18 are not counted as chronically homeless individuals.
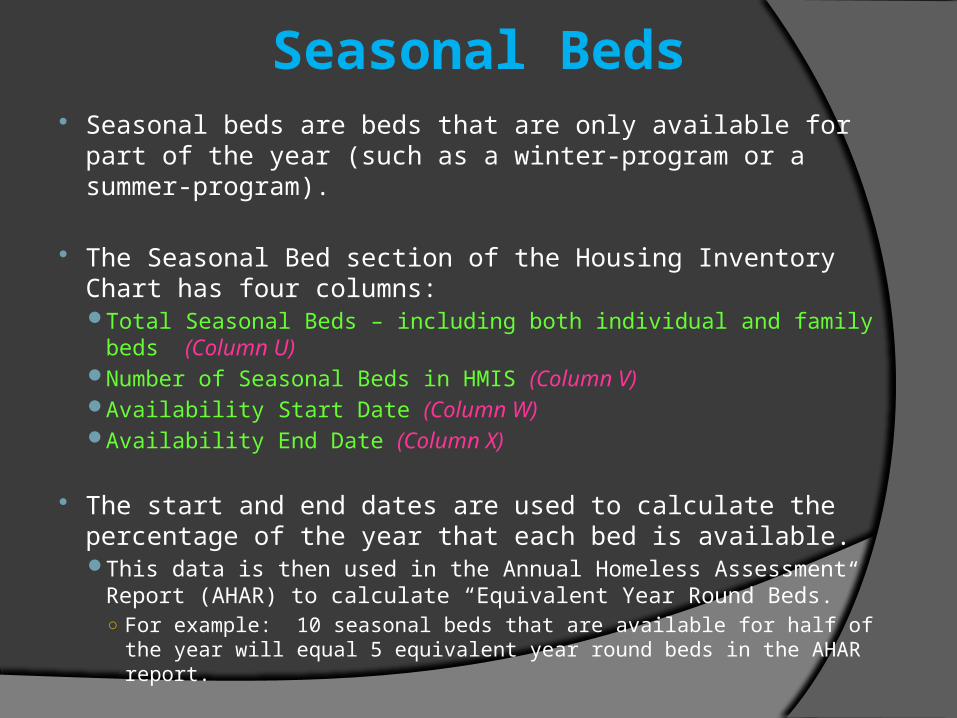
Seasonal Beds Seasonal beds are beds that are only available for part of
the year (such as a winter-program or a summer-program).
The Seasonal Bed section of the Housing Inventory Chart has four columns: Total Seasonal Beds – including both individual and family beds
(Column U) Number of Seasonal Beds in HMIS (Column V) Availability Start Date (Column W) Availability End Date (Column X)
The start and end dates are used to calculate the percentage of the year that each bed is available. This data is then used in the Annual Homeless Assessment
Report (AHAR) to calculate “Equivalent Year Round Beds.” ○ For example: 10 seasonal beds that are available for half of the
year will equal 5 equivalent year round beds in the AHAR report.

Overflow & Voucher Beds Overflow beds are beds available only during
special situations. (Column Y)These beds may be available year-round or seasonally. They can include cots, mats, and couches – used when
all of the program’s regular beds are full.Seasonal beds which are always available during
specific parts of the year are not counted as overflow beds.
Voucher beds should be counted as Overflow
beds as well. (Column Y)These beds may include motel vouchers for homeless
persons or an emergency shelter voucher used for hotels, motels, or campground space.
So far, we have covered Columns A & B, E – N, and U - Z on the Housing Inventory Chart.
Next, we will look at how WISP plays a role on the chart.

Connection to Service Point (WISP)
The Housing Inventory Chart (HIC) lists important WISP related information:WISP Provider ID # (Column C)Provider Name in WISP (Column D)Number of year round family beds in HMIS (Column O)Number of year round individual beds in HMIS (Column P)Number of year round children only beds in HMIS (Column
Q)Percentage of year round family beds in HMIS (Column R)Number of year round individual beds in HMIS (Column S)Number of seasonal beds in HMIS (Column V)Number of overflow/voucher beds in HMIS (Column Z)
Taking a closer look at specific elements:
WISP Provider ID #: This is the number used in Service Point to identify the exact provider . Each provider on your “tree” has a different number. (Column C)
Provider Name in WISP: This is the exact name associated with the WISP Provider ID # mentioned above. This name should match exactly to what is in WISP. (Column D)

Beds & WISP Number of year round family beds in HMIS: For
programs that use Service Point, you must identify the number of family beds listed in Column J that are reported in WISP. (Column O)
Number of year round individual beds in HMIS: For programs that use Service Point, you must identify the number of individual beds listed in Column L that are reported in WISP. (Column P)
Number of children only beds in HMIS: For programs that use Service Point, you must identify the number of children only beds listed in Column M that are reported in WISP. (Column Q)
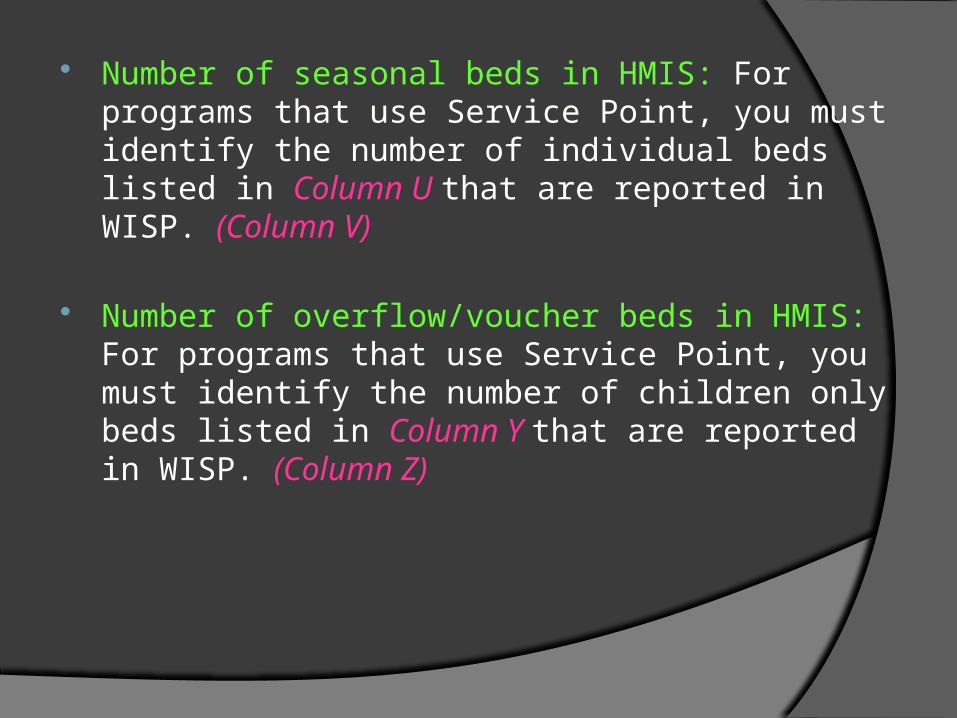
Number of seasonal beds in HMIS: For programs that use Service Point, you must identify the number of individual beds listed in Column U that are reported in WISP. (Column V)
Number of overflow/voucher beds in HMIS: For programs that use Service Point, you must identify the number of children only beds listed in Column Y that are reported in WISP. (Column Z)
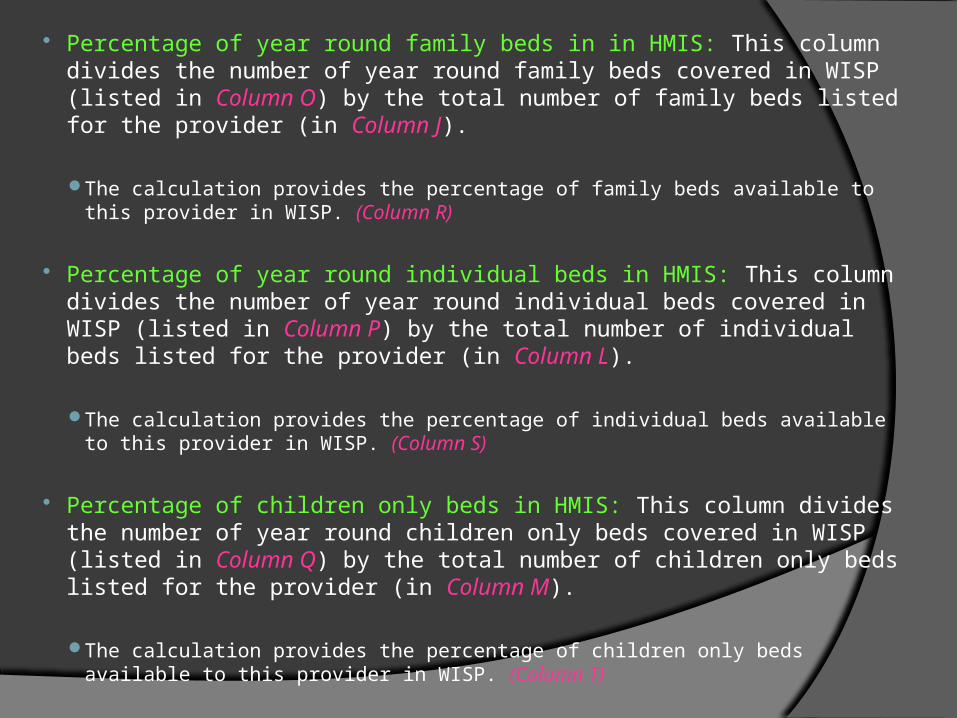
Percentage of year round family beds in in HMIS: This column divides the number of year round family beds covered in WISP (listed in Column O) by the total number of family beds listed for the provider (in Column J).
The calculation provides the percentage of family beds available to this provider in WISP. (Column R)
Percentage of year round individual beds in HMIS: This column divides the number of year round individual beds covered in WISP (listed in Column P) by the total number of individual beds listed for the provider (in Column L).
The calculation provides the percentage of individual beds available to this provider in WISP. (Column S)
Percentage of children only beds in HMIS: This column divides the number of year round children only beds covered in WISP (listed in Column Q) by the total number of children only beds listed for the provider (in Column M).
The calculation provides the percentage of children only beds available to this provider in WISP. (Column T)

Making a Match in WISP Program Type Code
Each provider must have this question answered in the Admin settings in WISP.
○ Go to “Admin”○ Go to “Provider Admin”○ Search by the provider name or provider ID#○ Click the provider○ Click on the “Standards Information” tab○ Scroll down to the “HUD Standards Information” section.○ Make sure that each provider is listed appropriately.
Do not change the Organization Identified or COC code.A case management only program should be listed as a “service
only program.”
○ SAVE before exiting.

Bed & Unit InventoryAll motel voucher, emergency shelter, & transitional
housing programs need an updated inventory of beds and units in WISP.
To get to this section, follow the same procedure to find Program Type Codes (previous slide)○ Then, scroll down to “Bed and Unit Inventory” section.○ Click the pencil to view and/or edit.○ A new screen will appear.
You must complete the Name, Household Type, Bed Type, and Availability questions.
Then, you will enter the Bed Inventory (Column N), Unit Inventory (Columns K+L), Inventory Start Date, HMIS Participating Beds (Columns O+P), HMIS Participation Start Date, Target Population A & B (Columns G & H).
The start dates for the inventory & HMIS participation can be the same number as long as they are prior to the current year.
SAVE before exiting.
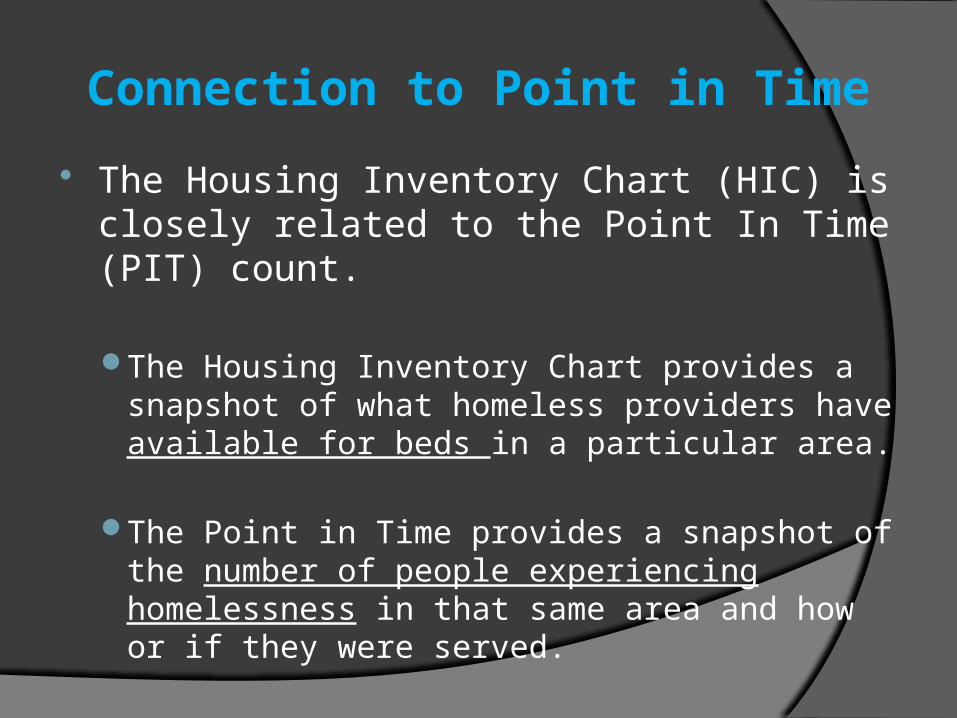
Connection to Point in Time
The Housing Inventory Chart (HIC) is closely related to the Point In Time (PIT) count.
The Housing Inventory Chart provides a snapshot of what homeless providers have available for beds in a particular area.
The Point in Time provides a snapshot of the number of people experiencing homelessness in that same area and how or if they were served.
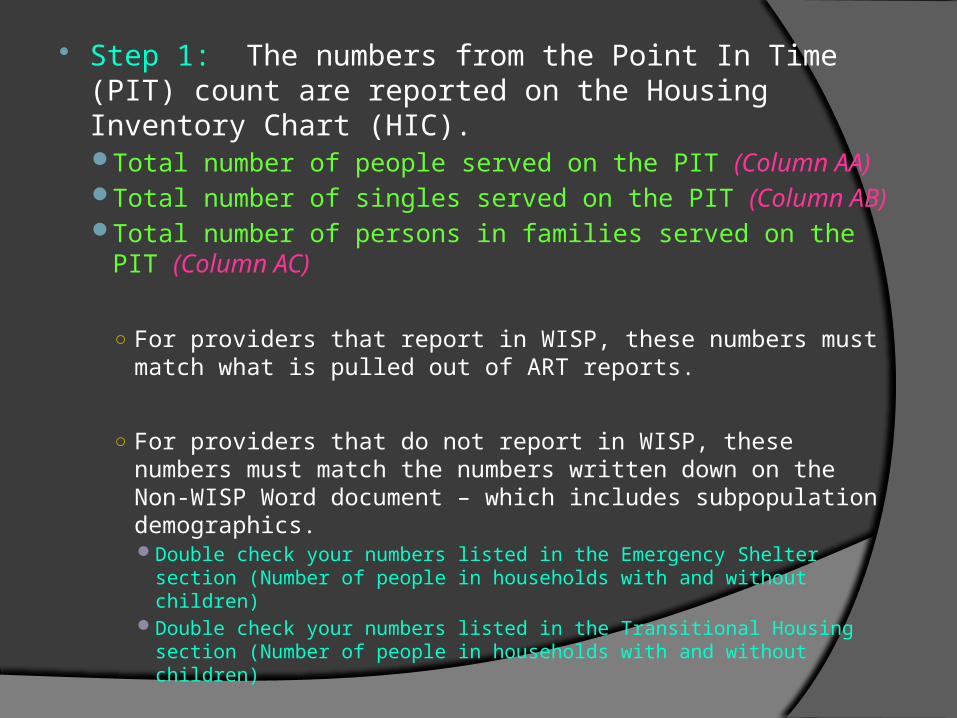
Step 1: The numbers from the Point In Time (PIT) count are reported on the Housing Inventory Chart (HIC).Total number of people served on the PIT (Column AA)Total number of singles served on the PIT (Column AB)Total number of persons in families served on the PIT
(Column AC)
○ For providers that report in WISP, these numbers must match what is pulled out of ART reports.
○ For providers that do not report in WISP, these numbers must match the numbers written down on the Non-WISP Word document – which includes subpopulation demographics. Double check your numbers listed in the Emergency Shelter
section (Number of people in households with and without children)
Double check your numbers listed in the Transitional Housing section (Number of people in households with and without children)

Step 2: Determine the program’s utilization rate (%). (Column AD)In the Shelter section, this rate (%) is
calculated by:○ Dividing the Total number of people served on the
PIT (Column AA) by the total number of beds available in the area. The total number of beds available in the area is
calculated by adding the number of Overflow and Voucher Beds (Column Y) + Total Seasonal Beds (Column U) + Total Year Round Beds (Column N).
In the Transitional Housing section, this rate (%) is calculated by:○ Dividing the Total number of people served on the
PIT (Column AA) by the Total Year Round Beds (Column N).
What if my utilization rate is not 100% ?
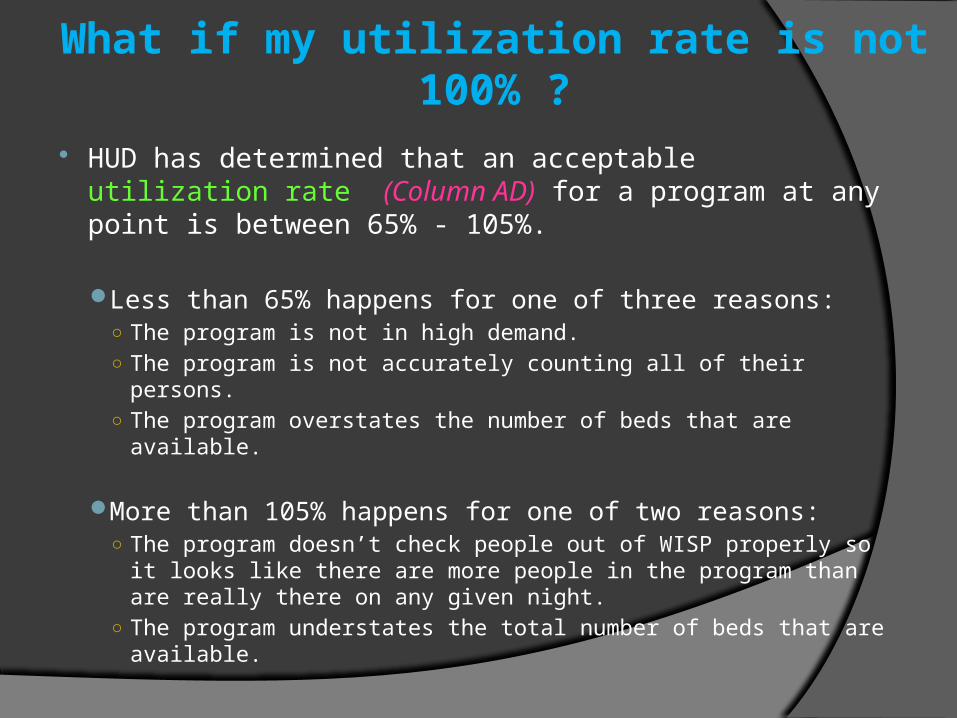
HUD has determined that an acceptable utilization rate (Column AD) for a program at any point is between 65% - 105%.
Less than 65% happens for one of three reasons: ○ The program is not in high demand. ○ The program is not accurately counting all of their persons.○ The program overstates the number of beds that are
available.
More than 105% happens for one of two reasons:○ The program doesn’t check people out of WISP properly so
it looks like there are more people in the program than are really there on any given night.
○ The program understates the total number of beds that are available.
Getting PIT numbers from WISP
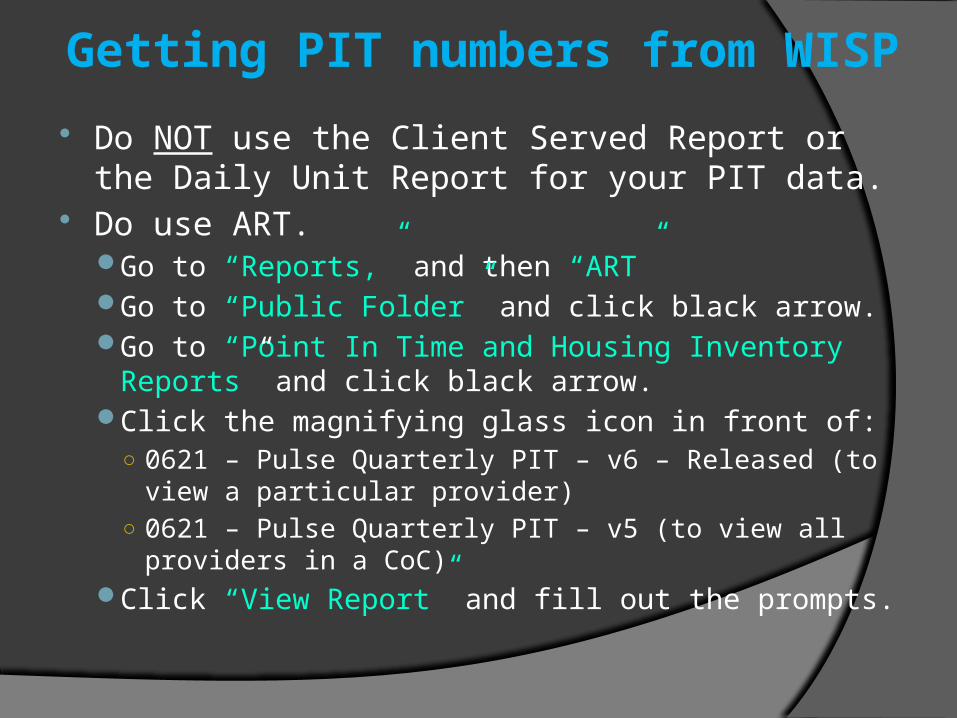
Do NOT use the Client Served Report or the Daily Unit Report for your PIT data.
Do use ART.Go to “Reports,” and then “ART”Go to “Public Folder” and click black arrow.Go to “Point In Time and Housing Inventory
Reports” and click black arrow.Click the magnifying glass icon in front of:
○ 0621 – Pulse Quarterly PIT – v6 – Released (to view a particular provider)
○ 0621 – Pulse Quarterly PIT – v5 (to view all providers in a CoC)
Click “View Report” and fill out the prompts.
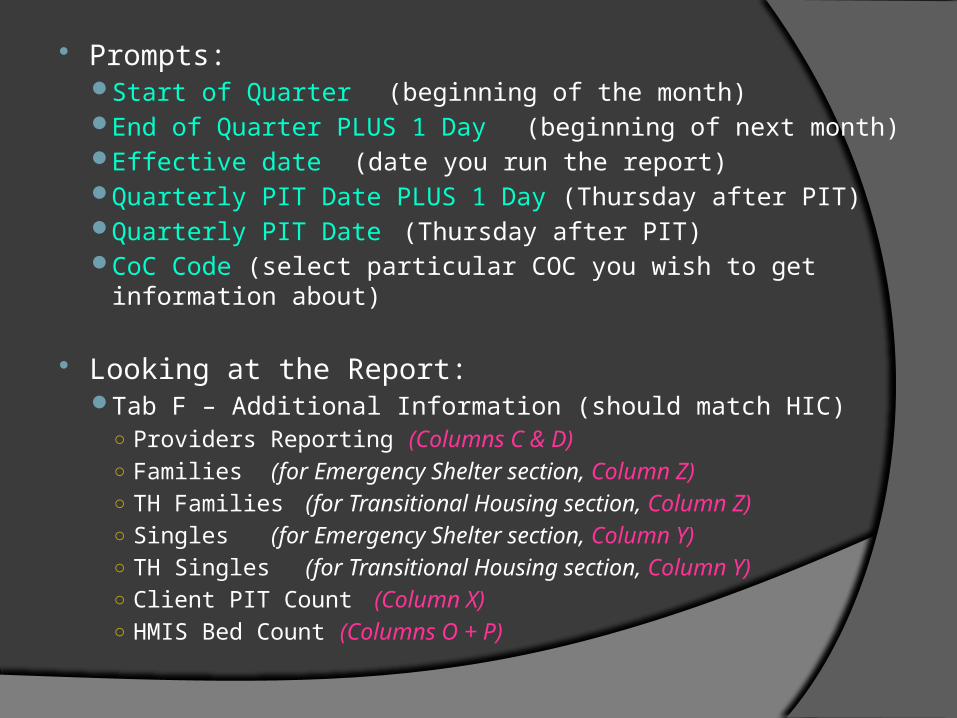
Prompts:Start of Quarter (beginning of the month)End of Quarter PLUS 1 Day (beginning of next month)Effective date (date you run the report)Quarterly PIT Date PLUS 1 Day (Thursday after PIT)Quarterly PIT Date (Thursday after PIT)CoC Code (select particular COC you wish to get
information about)
Looking at the Report:Tab F – Additional Information (should match HIC)
○ Providers Reporting (Columns C & D)○ Families (for Emergency Shelter section, Column Z)○ TH Families (for Transitional Housing section, Column
Z)○ Singles (for Emergency Shelter section, Column Y)○ TH Singles (for Transitional Housing section, Column Y)○ Client PIT Count (Column X)○ HMIS Bed Count (Columns O + P)
WISP vs. Non-WISP Providers
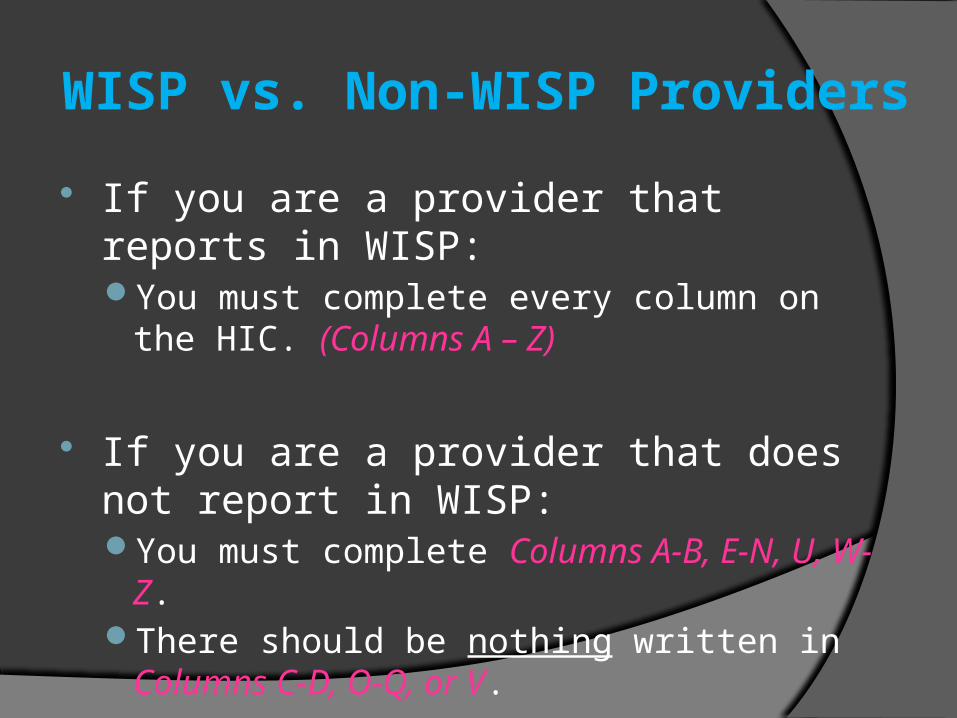
If you are a provider that reports in WISP:You must complete every column on the
HIC. (Columns A – Z)
If you are a provider that does not report in WISP:You must complete Columns A-B, E-N, U,
W-Z.There should be nothing written in
Columns C-D, O-Q, or V.
Bringing them all together Do the Point in Time (PIT) count.
Collect your numbers and data from:○ Non-WISP providers for Shelter & Transitional○ The street/known location count and other unsheltered/turnaway
numbers from WISP and Non-WISP providers, and ○ ART reports run for WISP providers.
Review the Housing Inventory Chart (HIC) line-by-line Make adjustments/changes to providers and beds in RED font. If a provider should no longer be listed on the chart, do not
delete, just strikeout the row.
Take the numbers and data from the PIT count and put them in the corresponding provider rows in Columns AA, AB, AC. The only data from the PIT count that does not go on the HIC is
the:○ Unsheltered/turnaway numbers○ Homeless subpopulation
Double Check Your Math
Non-WISP Providers Take the non-WISP provider data and compare it to the
totals on the chart. If you add up the non-WISP provider numbers in Column AA,
does it match what was turned in on the Word document? Check the Sheltered section & then the Transitional section. Do the numbers make sense based on the number and type
of beds this provider has?
WISP Providers Run the ART report for WISP providers before the PIT count
so they can see what Service Points says about who is in their programs.
Run the ART Report again after the PIT. Do the numbers make sense based on the number and type
of beds this provider has?
Impact on Federal Funding NOFA Application
If the application gets enough points , it will meet a threshold & the continuum will be awarded additional money for new projects.
The HIC is used by the NOFA application in the following ways:○ It shows how many programs and beds are available. ○ It shows how many programs use HMIS. ○ It is used to calculate the Utilization Rate in the Annual Homeless Assessment
Report (AHAR).
AHAR AHAR compares the data in HMIS with the information reported in the
Housing Inventory Chart in order to calculate the HMIS Participation Rate and the true Program Utilization Rate.
In order for data to be accepted by HUD each type of program (ES, TH, and PH) must have 50% HMIS Participation Rate and 70% Program Utilization Rate.
If our Participate Rate is too low, our data will be rejected. This results in a loss of points on the NOFA application.
ETH Failure to report accurate beds and monthly census counts can result in a
loss or reduction in funding.

Resources:
http://www.hudhre.info/documents/2011HICInstructions.pdf
Related Documents