CARICOM 2 0 0 0 - 2 0 0 5 2 0 0 0 - 2 0 0 5 CARICOM’S TRADE IN SERVICES CARICOM’S TRADE IN SERVICES CARIBBEAN COMMUNITY(CARICOM) SECRETARIAT GEORGETOWN, GUYANA

CARICOM Trade in Services: 2000 2005
Jul 17, 2015
Welcome message from author
This document is posted to help you gain knowledge. Please leave a comment to let me know what you think about it! Share it to your friends and learn new things together.
Transcript
CARICOM
2000
-
2005
2000
-
2005
CARICOM’S
TRADE IN SERVICES
CARICOM’S
TRADE IN SERVICES
CARIBBEAN COMMUNITY(CARICOM) SECRETARIAT
GEORGETOWN, GUYANA


CCAARRIICCOOMM’’SS TTRRAADDEE IINN SSEERRVVIICCEESS
22000000 -- 22000055
REGIONAL STATISTICS SUB-PROGRAMME CARIBBEAN COMMUNITY SECRETARIAT
March 2008
Copyright © 2008, The CARICOM Secretariat All rights reserved. CARICOM’S TRADE IN SERVICES 2000-2005 Prepared and Compiled by The Regional Statistics Sub-Programme Caribbean Community (CARICOM) Secretariat Turkeyen Guyana Telephone: (592) 222-0001-75 Fax: (592) 222-0098 E-mail: [email protected] Web site: www.caricomstats.org ISBN 978-976-600-193-3 EAN 9789766001933
ACKNOWLEDGEMENTS
The CARICOM Secretariat expresses its sincere thanks to the Central Banks of Barbados, The Bahamas, Belize, Jamaica and Trinidad and Tobago; the Eastern Caribbean Central Bank and the National Statistical Offices in Member States for supplying the data used to compile this report,
Sincere thanks and appreciation to the staff of the Secretariat’s Statistics Sub-programme for compiling and preparing the report and to the Single Market and Economy Sub-programme in which the project mentioned above originated.
PREFACE
This report, the second of its kind in the Caribbean Community (CARICOM), highlights statistics on International Trade in Services for fourteen (14) Member States of the Region. The impetus for this report is past developmental work that was executed during 2001-2002 through funding obtained from the Canadian International Development Agency (CIDA) as well as through the USAID Caribbean Trade and Competitiveness Programme (C-TRADECOM) project conducted in 2004-2005.
The approach to producing this report attempts to use a common methodological framework that is grounded in statistics on the Balance of Payments (BOP) provided by Central Banks and Central Statistical Offices in Member States. In particular, the Services component of the Current Account of the BOP was the basis for the data that have been compiled. Unlike the previous report where there were no data for Guyana and Suriname, this report contains data for fourteen (14) of our Member States that usually submit BOP statistics to the CARICOM Secretariat. All of these Member States produce their BOP statistics in accordance with the Balance of Payments Manual fifth edition (BPM5), standard components. In at least three cases, Barbados, Belize and St. Vincent and the Grenadines, efforts have been instituted to produce more detailed information. Essentially the approach that has been activated in the Region to produce services statistics includes the following:
o Data on services transactions between residents and non-residents of an economy
should be compiled according to the Extended Balance of Payments in Services (EBOPS). Firstly, all Member States should ensure that data for the BOP are compiled according to the standard components of the BPM5 which should be followed by movement to the EBOPS;
o Additionally, there is also the need to produce more detailed industry data at the level of production of services and to closely link the data on production with that on trade as well as to produce data by origin and destination;
o To satisfy the data requirements at the national and regional level including that of our regional negotiators, it may be necessary on a selective basis to give consideration to the production of data at the level of the United Nations Central Product Classification (CPC);
o National statistical offices have also been encouraged to activate the process of obtaining more comprehensive establishment registers, to update their questionnaire formats and to pay attention to improving response rates in establishment and other surveys;
o The production of common methodological guidelines at the regional level inclusive of the use of a common classification system to be used for the production of statistics across all Member States is also an imperative.
Some of the above activities were executed under the C-TRADECOM project such as the preparation of a proposed Common Classification System and preparation of detailed data for six (6) selected Member States at the level of the Extended Balance of Payments in Services. The challenge that lies ahead is evident and will be even greater for product level details. It is obvious in some cases that estimates are not made for certain categories of services or are inadequate and incomplete. For example, the data inadequacy may be due to problems related to the
iv

unavailability of information as a result of removal of foreign exchange restrictions in particular member states with implications for vital sources of information from the administrative reporting systems, a vital source of information on financial services or business and other travel. In addition, the absence of surveys that can provide complete information on services delivered through consultants (inward or outward) of the compiling economy, affect the coverage of services traded. With the implementation of project activity under the Ninth European Development Fund (9th EDF), it is expected that technical assistance would be executed to undertake development of International Trade In Services statistics that can lead to the filling of the existing data gaps.
REGIONAL STATISTICS SUB-PROGRAMME INFORMATION AND COMMUNICATION PROGRAMME CARIBBEAN COMMUNITY (CARICOM) SECRETARIAT DECEMBER 2007
v
GLOSSARY OF ACRONYMS, ABBREVIATIONS AND SYMBOLS
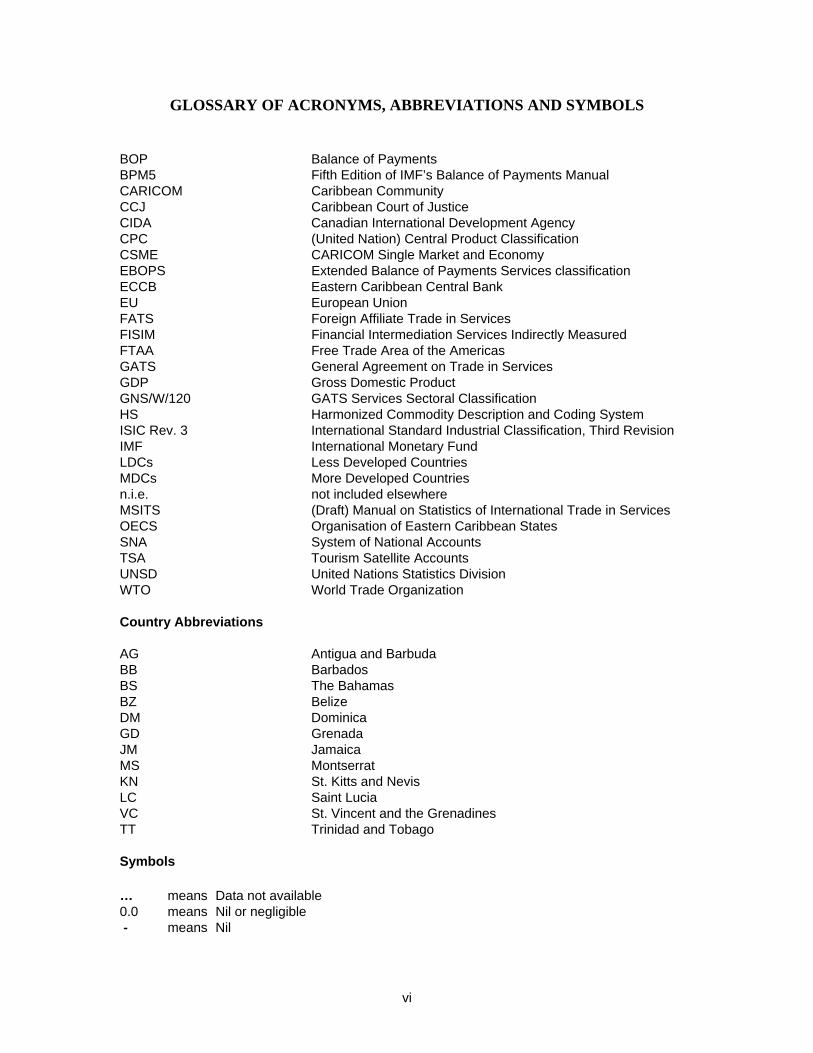
BOP Balance of Payments BPM5 Fifth Edition of IMF’s Balance of Payments Manual CARICOM Caribbean Community CCJ Caribbean Court of Justice CIDA Canadian International Development Agency CPC (United Nation) Central Product Classification CSME CARICOM Single Market and Economy EBOPS Extended Balance of Payments Services classification ECCB Eastern Caribbean Central Bank EU European Union FATS Foreign Affiliate Trade in Services FISIM Financial Intermediation Services Indirectly Measured FTAA Free Trade Area of the Americas GATS General Agreement on Trade in Services GDP Gross Domestic Product GNS/W/120 GATS Services Sectoral Classification HS Harmonized Commodity Description and Coding System ISIC Rev. 3 International Standard Industrial Classification, Third Revision IMF International Monetary Fund LDCs Less Developed Countries MDCs More Developed Countries n.i.e. not included elsewhere MSITS (Draft) Manual on Statistics of International Trade in Services OECS Organisation of Eastern Caribbean States SNA System of National Accounts TSA Tourism Satellite Accounts UNSD United Nations Statistics Division WTO World Trade Organization Country Abbreviations AG Antigua and Barbuda BB Barbados BS The Bahamas BZ Belize DM Dominica GD Grenada JM Jamaica MS Montserrat KN St. Kitts and Nevis LC Saint Lucia VC St. Vincent and the Grenadines TT Trinidad and Tobago Symbols
… means Data not available 0.0 means Nil or negligible - means Nil
vi

GENERAL NOTES
1. CARICOM refers to the Caribbean Single Market and Economy (CSME) and The
Bahamas. The Caribbean Common Market has been transformed into the CSME upon the signing of the nine Protocols revising the Treaty of Chaguaramas. The Bahamas is not a part of the CSME.
2. Figures may not always add up due to rounding errors. 3. Data are not available for Guyana and Suriname. These two countries do not yet present
their Balance of Payments data according to the Balance of Payments Manual 5th Edition. 4. Calculations at the levels of CARICOM, MDCs, LDCs and OECS, exclude those
countries for which data may not be available. 5. Credits refer to the Exports or receipt of services, while Debits refer to the Imports or
payments. 6. All tables and graphs are presented in United States (US) Dollars. Except for Jamaica
and Trinidad and Tobago, data for the other Member States were originally extracted in the National currency and then converted to the US dollar for comparison purposes.
7. Billion refers to 1,000 million. 8. The data in this report may have been revised compared to those previously published in
our External Public Debt of CARICOM Member States, 2000-2005 report. 9. More detailed information on the methodology and classifications related to international
trade in services can be found at the following web sites:
For information on Statistics on International Trade in Services, including the MSITS, the EBOPS and the GNS/W/120:
http://unstats.un.org/unsd/tradeserv/default.asp For information on the System of National Accounts:
http://unstats.un.org/unsd/sna1993/introduction.asp For information on the United Nations classifications (CPC v1.0 and 1.1, ISIC Rev.3 and 3.1):
http://unstats.un.org/unsd/cr/registry/ For information on the Balance of Payments Manual 5th Edition (BPM5): http://www.imf.org For information on the General Agreement on Trade in Services (GATS): http://www.wto.org In the event that the URLs to the above web sites are not clear, please contact the Statistics Sub-programme at [email protected], [email protected] or [email protected].
vii

CONTENTS
Page
Acknowledgements iii Preface iv Glossary of Acronyms, Abbreviations and Symbols vi General Notes vii Concepts and Definitions xvi About the Data xxvii Data Highlights xxxLIST OF TABLES
SECTION 1
CARICOM’S TRADE IN SERVICES BY BROAD SERVICE AREA 1.1.1 Value of CARICOM’s Receipt of Services, by Broad Service Area: 2000 and 2005 ................. 3 1.1.2 Value of CARICOM’s Payment of Services, by Broad Service Area: 2000 and 2005 ............... 3 1.1.3 Value of CARICOM’s Balance of Services, by Broad Service Area: 2000 and 2005 ................ 4 1.2.1 Value of CARICOM's Total Receipt of Services, by Country: 2000-2005.................................. 6 1.2.2 Percentage Distribution of CARICOM's Total Receipt of Services, by Country: 2000-2005 ............................................................................................................... 7 1.2.3 CARICOM’s Receipt of Services – Transportation: 2000-2005 ................................................. 9 1.2.4 CARICOM’s Receipt of Services – Travel: 2000-2005 .............................................................. 11 1.2.5 CARICOM’s Receipt of Services – Commercial Services: 2000-2005 ...................................... 13 1.2.6 CARICOM’s Receipt of Services – Government Services: 2000-2005...................................... 15 1.3.1 Value of CARICOM's Total Payment of Services, by Country: 2000-2005................................ 17 1.3.2 Percentage Distribution of CARICOM's Total Payment of Services, by Country: 2000-2005 ............................................................................................................... 18 1.3.3 CARICOM’s Payment of Services – Transportation: 2000-2005 ............................................... 20 1.3.4 CARICOM’s Payment of Services – Travel: 2000-2005 ............................................................ 22 1.3.5 CARICOM’s Payment of Services – Commercial Services: 2000-2005 .................................... 24 1.3.6 CARICOM’s Payment of Services – Government Services: 2000-2005.................................... 26 1.4.1 CARICOM’s Balance of Services – All Services: 2000-2005..................................................... 28 1.4.2 CARICOM’s Merchandise Trade Balance: 2000-2005 .............................................................. 29 1.4.3 CARICOM’s Balance of Services – Transportation: 2000-2005 ................................................ 31 1.4.4 CARICOM’s Balance of Services – Travel: 2000-2005.............................................................. 33 1.4.5 CARICOM’s Balance of Services – Commercial Services: 2000-2005...................................... 35 1.4.6 CARICOM’s Balance of Services – Government Services: 2000-2005..................................... 37 1.5.1 Value of CARICOM’s Trade in Services, by Broad Service Area: 2000-2005 ........................... 41 1.5.2 Percentage Distribution of CARICOM’s Trade in Services, by Broad Service Area: 2000-2005 ............................................................................................ 42
viii
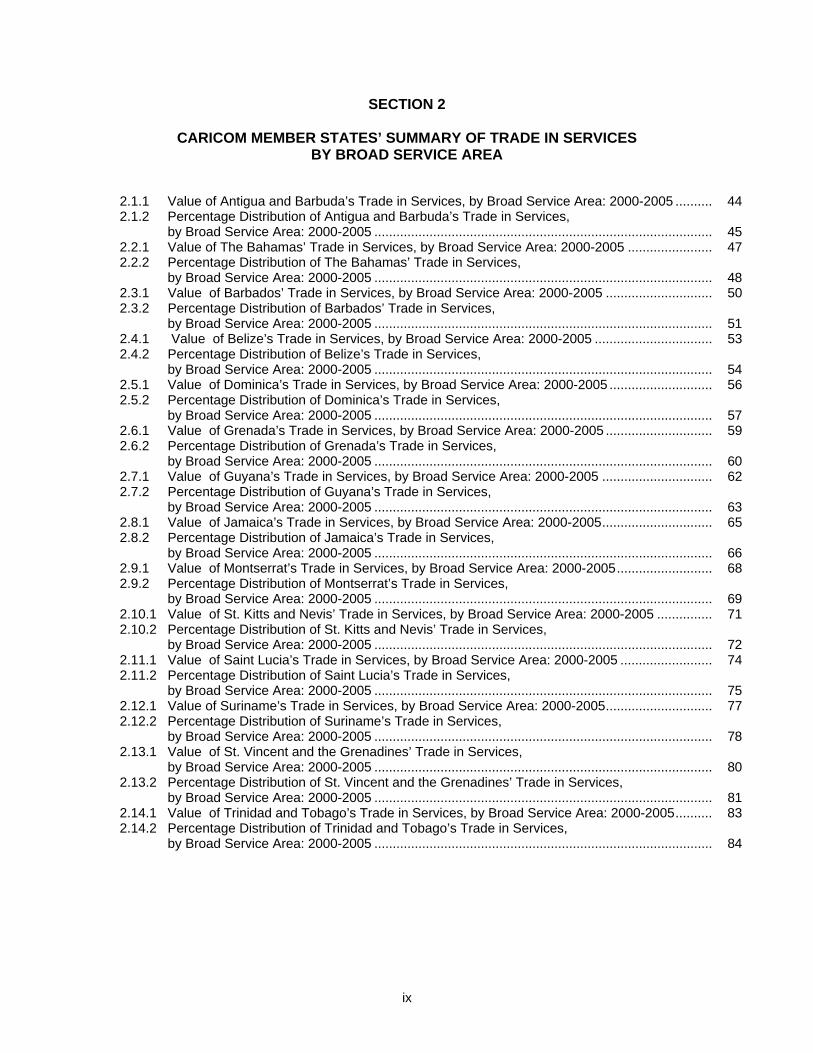
SECTION 2
CARICOM MEMBER STATES’ SUMMARY OF TRADE IN SERVICES BY BROAD SERVICE AREA
2.1.1 Value of Antigua and Barbuda’s Trade in Services, by Broad Service Area: 2000-2005 .......... 44 2.1.2 Percentage Distribution of Antigua and Barbuda’s Trade in Services, by Broad Service Area: 2000-2005 ............................................................................................ 45 2.2.1 Value of The Bahamas’ Trade in Services, by Broad Service Area: 2000-2005 ....................... 47 2.2.2 Percentage Distribution of The Bahamas’ Trade in Services, by Broad Service Area: 2000-2005 ............................................................................................ 48 2.3.1 Value of Barbados’ Trade in Services, by Broad Service Area: 2000-2005 ............................. 50 2.3.2 Percentage Distribution of Barbados’ Trade in Services, by Broad Service Area: 2000-2005 ............................................................................................ 51 2.4.1 Value of Belize’s Trade in Services, by Broad Service Area: 2000-2005 ................................ 53 2.4.2 Percentage Distribution of Belize’s Trade in Services, by Broad Service Area: 2000-2005 ............................................................................................ 54 2.5.1 Value of Dominica’s Trade in Services, by Broad Service Area: 2000-2005 ............................ 56 2.5.2 Percentage Distribution of Dominica’s Trade in Services, by Broad Service Area: 2000-2005 ............................................................................................ 57 2.6.1 Value of Grenada’s Trade in Services, by Broad Service Area: 2000-2005 ............................. 59 2.6.2 Percentage Distribution of Grenada’s Trade in Services, by Broad Service Area: 2000-2005 ............................................................................................ 60 2.7.1 Value of Guyana’s Trade in Services, by Broad Service Area: 2000-2005 .............................. 62 2.7.2 Percentage Distribution of Guyana’s Trade in Services, by Broad Service Area: 2000-2005 ............................................................................................ 63 2.8.1 Value of Jamaica’s Trade in Services, by Broad Service Area: 2000-2005.............................. 65 2.8.2 Percentage Distribution of Jamaica’s Trade in Services, by Broad Service Area: 2000-2005 ............................................................................................ 66 2.9.1 Value of Montserrat’s Trade in Services, by Broad Service Area: 2000-2005.......................... 68 2.9.2 Percentage Distribution of Montserrat’s Trade in Services, by Broad Service Area: 2000-2005 ............................................................................................ 69 2.10.1 Value of St. Kitts and Nevis’ Trade in Services, by Broad Service Area: 2000-2005 ............... 71 2.10.2 Percentage Distribution of St. Kitts and Nevis’ Trade in Services, by Broad Service Area: 2000-2005 ............................................................................................ 72 2.11.1 Value of Saint Lucia’s Trade in Services, by Broad Service Area: 2000-2005 ......................... 74 2.11.2 Percentage Distribution of Saint Lucia’s Trade in Services, by Broad Service Area: 2000-2005 ............................................................................................ 75 2.12.1 Value of Suriname’s Trade in Services, by Broad Service Area: 2000-2005............................. 77 2.12.2 Percentage Distribution of Suriname’s Trade in Services, by Broad Service Area: 2000-2005 ............................................................................................ 78 2.13.1 Value of St. Vincent and the Grenadines’ Trade in Services, by Broad Service Area: 2000-2005 ............................................................................................ 80 2.13.2 Percentage Distribution of St. Vincent and the Grenadines’ Trade in Services, by Broad Service Area: 2000-2005 ............................................................................................ 81 2.14.1 Value of Trinidad and Tobago’s Trade in Services, by Broad Service Area: 2000-2005.......... 83 2.14.2 Percentage Distribution of Trinidad and Tobago’s Trade in Services, by Broad Service Area: 2000-2005 ............................................................................................ 84
ix
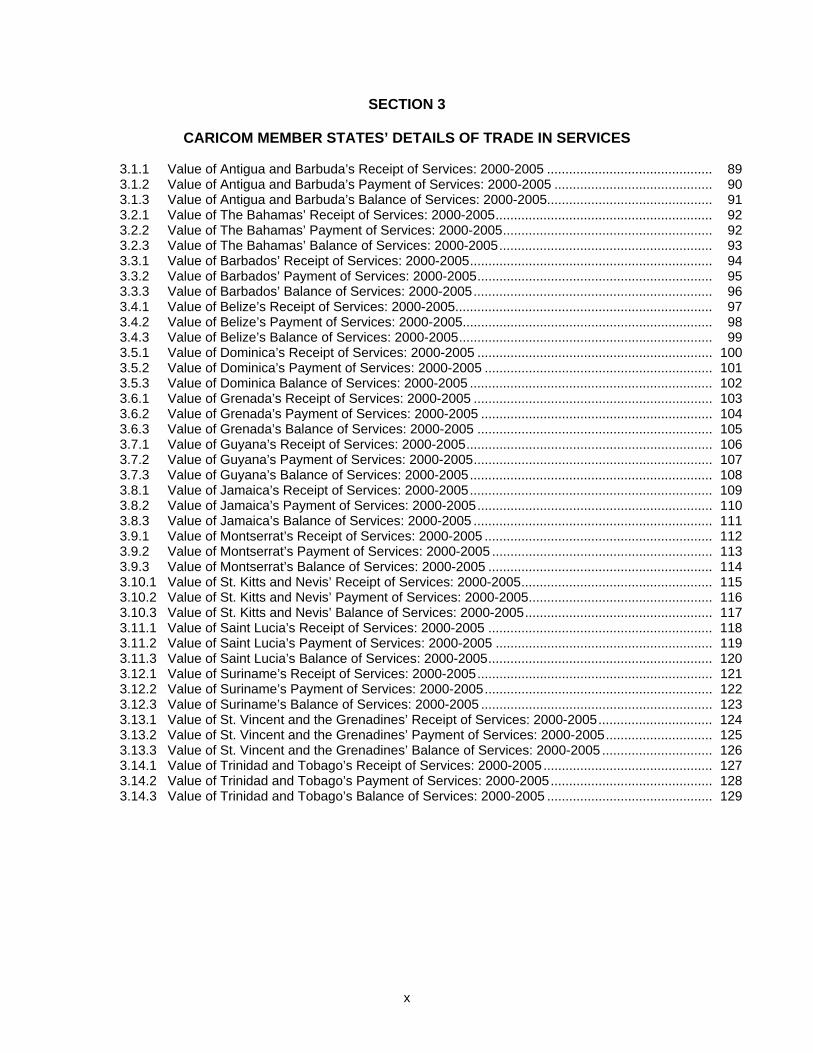
SECTION 3
CARICOM MEMBER STATES’ DETAILS OF TRADE IN SERVICES 3.1.1 Value of Antigua and Barbuda’s Receipt of Services: 2000-2005 ............................................. 89 3.1.2 Value of Antigua and Barbuda’s Payment of Services: 2000-2005 ........................................... 90 3.1.3 Value of Antigua and Barbuda’s Balance of Services: 2000-2005............................................. 91 3.2.1 Value of The Bahamas’ Receipt of Services: 2000-2005........................................................... 92 3.2.2 Value of The Bahamas’ Payment of Services: 2000-2005......................................................... 92 3.2.3 Value of The Bahamas’ Balance of Services: 2000-2005.......................................................... 93 3.3.1 Value of Barbados’ Receipt of Services: 2000-2005.................................................................. 94 3.3.2 Value of Barbados’ Payment of Services: 2000-2005................................................................ 95 3.3.3 Value of Barbados’ Balance of Services: 2000-2005................................................................. 96 3.4.1 Value of Belize’s Receipt of Services: 2000-2005...................................................................... 97 3.4.2 Value of Belize’s Payment of Services: 2000-2005.................................................................... 98 3.4.3 Value of Belize’s Balance of Services: 2000-2005..................................................................... 99 3.5.1 Value of Dominica’s Receipt of Services: 2000-2005 ................................................................ 100 3.5.2 Value of Dominica’s Payment of Services: 2000-2005 .............................................................. 101 3.5.3 Value of Dominica Balance of Services: 2000-2005 .................................................................. 102 3.6.1 Value of Grenada’s Receipt of Services: 2000-2005 ................................................................. 103 3.6.2 Value of Grenada’s Payment of Services: 2000-2005 ............................................................... 104 3.6.3 Value of Grenada’s Balance of Services: 2000-2005 ................................................................ 105 3.7.1 Value of Guyana’s Receipt of Services: 2000-2005................................................................... 106 3.7.2 Value of Guyana’s Payment of Services: 2000-2005................................................................. 107 3.7.3 Value of Guyana’s Balance of Services: 2000-2005.................................................................. 108 3.8.1 Value of Jamaica’s Receipt of Services: 2000-2005.................................................................. 109 3.8.2 Value of Jamaica’s Payment of Services: 2000-2005................................................................ 110 3.8.3 Value of Jamaica’s Balance of Services: 2000-2005 ................................................................. 111 3.9.1 Value of Montserrat’s Receipt of Services: 2000-2005 .............................................................. 112 3.9.2 Value of Montserrat’s Payment of Services: 2000-2005 ............................................................ 113 3.9.3 Value of Montserrat’s Balance of Services: 2000-2005 ............................................................. 114 3.10.1 Value of St. Kitts and Nevis’ Receipt of Services: 2000-2005.................................................... 115 3.10.2 Value of St. Kitts and Nevis’ Payment of Services: 2000-2005.................................................. 116 3.10.3 Value of St. Kitts and Nevis’ Balance of Services: 2000-2005................................................... 117 3.11.1 Value of Saint Lucia’s Receipt of Services: 2000-2005 ............................................................. 118 3.11.2 Value of Saint Lucia’s Payment of Services: 2000-2005 ........................................................... 119 3.11.3 Value of Saint Lucia’s Balance of Services: 2000-2005............................................................. 120 3.12.1 Value of Suriname’s Receipt of Services: 2000-2005................................................................ 121 3.12.2 Value of Suriname’s Payment of Services: 2000-2005.............................................................. 122 3.12.3 Value of Suriname’s Balance of Services: 2000-2005 ............................................................... 123 3.13.1 Value of St. Vincent and the Grenadines’ Receipt of Services: 2000-2005............................... 124 3.13.2 Value of St. Vincent and the Grenadines’ Payment of Services: 2000-2005............................. 125 3.13.3 Value of St. Vincent and the Grenadines’ Balance of Services: 2000-2005 .............................. 126 3.14.1 Value of Trinidad and Tobago’s Receipt of Services: 2000-2005.............................................. 127 3.14.2 Value of Trinidad and Tobago’s Payment of Services: 2000-2005............................................ 128 3.14.3 Value of Trinidad and Tobago’s Balance of Services: 2000-2005 ............................................. 129
x
SECTION 4
CARICOM MEMBER STATES’ PRODUCTION OF SERVICES 4.1.1 Value of CARICOM’S Production of Services at Current Prices, by Broad Service Area: 2000-2005 ............................................................................................ 132 4.1.2 Value of CARICOM’S Production of Services at Constant 2000 Prices, by Broad Service Area: 2000-2005 ............................................................................................ 132 4.2.1 Value of Antigua and Barbuda’s Production of Services at Current Prices, by Broad Service Area: 2000-2005 ............................................................................................ 133 4.2.2 Value of Antigua and Barbuda’s Production of Services at Constant 2000 Prices, by Broad Service Area: 2000-2005 ............................................................................................ 133 4.3.1 Value of The Bahamas’ Production of Services at Current Prices, by Broad Service Area: 2000-2005 ............................................................................................ 134 4.3.2 Value of The Bahamas’ Production of Services at Constant 2000 Prices, by Broad Service Area: 2000-2005 ............................................................................................ 134 4.4.1 Value of Barbados’ Production of Services at Current Prices, by Broad Service Area: 2000-2005 ............................................................................................ 135 4.4.2 Value of Barbados’ Production of Services at Constant 2000 Prices, by Broad Service Area: 2000-2005 ............................................................................................ 135 4.5.1 Value of Belize’s Production of Services at Current Prices, by Broad Service Area: 2000-2005 ............................................................................................ 136 4.5.2 Value of Belize’s Production of Services at Constant 2000 Prices, by Broad Service Area: 2000-2005 ............................................................................................ 136 4.6.1 Value of Dominica’s Production of Services at Current Prices, by Broad Service Area: 2000-2005 ............................................................................................ 137 4.6.2 Value of Dominica’s Production of Services at Constant 2000 Prices, by Broad Service Area: 2000-2005 ............................................................................................ 137 4.7.1 Value of Grenada’s Production of Services at Current Prices, by Broad Service Area: 2000-2005 ............................................................................................ 138 4.7.2 Value of Grenada’s Production of Services at Constant 2000 Prices, by Broad Service Area: 2000-2005 ............................................................................................ 138 4.8.1 Value of Guyana’s Production of Services at Current Prices, by Broad Service Area: 2000-2005 ............................................................................................ 139 4.8.2 Value of Guyana’s Production of Services at Constant 2000 Prices, by Broad Service Area: 2000-2005 ............................................................................................ 139 4.9.1 Value of Jamaica’s Production of Services at Current Prices, by Broad Service Area: 2000-2005 ............................................................................................ 140 4.9.2 Value of Jamaica’s Production of Services at Constant 2000 Prices, by Broad Service Area: 2000-2005 ............................................................................................ 140 4.10.1 Value of Montserrat’s Production of Services at Current Prices, by Broad Service Area: 2000-2005 ............................................................................................ 141 4.10.2 Value of Montserrat’s Production of Services at Constant 2000 Prices, by Broad Service Area: 2000-2005 ............................................................................................ 141 4.11.1 Value of St. Kitts and Nevis’ Production of Services at Current Prices, by Broad Service Area: 2000-2005 ............................................................................................ 142 4.11.2 Value of St. Kitts and Nevis’ Production of Services at Constant 2000 Prices, by Broad Service Area: 2000-2005 ............................................................................................ 142 4.12.1 Value of Saint Lucia’s Production of Services at Current Prices, by Broad Service Area: 2000-2005 ............................................................................................ 143 4.12.2 Value of Saint Lucia’s Production of Services at Constant 2000 Prices, by Broad Service Area: 2000-2005 ............................................................................................ 143 4.13.1 Value of St. Vincent and the Grenadines’ Production of Services at Current Prices, by Broad Service Area: 2000-2005 ............................................................................................ 144
xi
4.13.2 Value of St. Vincent and the Grenadines’ Production of Services at Constant 2000 Prices, by Broad Service Area: 2000-2005 ............................................................................................ 144 4.14.1 Value of Suriname’s Production of Services at Current Prices, by Broad Service Area: 2000-2005 ............................................................................................ 145 4.14.2 Value of Suriname’s Production of Services at Constant 2000 Prices, by Broad Service Area: 2000-2005 ............................................................................................ 145 4.15.1 Value of Trinidad and Tobago’s Production of Services at Current Prices, by Broad Service Area: 2000-2005 ............................................................................................ 146 4.15.2 Value of Trinidad and Tobago’s Production of Services at Constant 2000 Prices, by Broad Service Area: 2000-2005 ............................................................................................ 146
SECTION 5
CARICOM MEMBER STATES’ EMPLOYMENT OF SERVICES 5.1.1 Value of CARICOM’S Employment of Services, by Broad Industry Area: 2001..................................................................................................... 151
SECTION 6
SELECTED ECONOMIC INDICATORS 6.1.1 Selected Economic Indicators: 2000 and 2005.......................................................................... 156
ANNEXES I Balance of Payments Standard Components (BPM5) ............................................................... 169 II Extended Balance of Payments Services Classification (EBOPS) ............................................ 171 III General Agreement on Trade in Services (GATS)..................................................................... 174 IV GATS Services Sectoral Classification (GNS/W/120)................................................................ 176 V Central Product Classification (CPC v.1.0) excerpt.................................................................... 183 VI Correspondence between EBOPS - CPC v.1.0 - GNS/W/120................................................... 187 VII Correspondence between GNS/W/120 - CPC v.1.0 – EBOPS.................................................. 192 VIII The Draft Manual on Statistics of International Trade in Services and Tourism Satellite Accounts ......................................................................................................... 196 IX International Standard Industrial Classification Rev. 3............................................................... 199 X Sources of Balance of Payments Data in CARICOM Member States ....................................... 206
LIST OF GRAPHS 1.1 Distribution of CARICOM’s Receipt of Services, by Broad Service Area: 2000 ........................ 5 1.2 Distribution of CARICOM’s Payment of Services, by Broad Service Area: 2000 ...................... 5 1.3 Distribution of CARICOM’s Receipt of Services, by Broad Service Area: 2005 ........................ 5 1.4 Distribution of CARICOM’s Payment of Services, by Broad Service Area: 2005 ...................... 5
xii
1.5 CARICOM Member States Total Receipt of Services: 2000 & 2005 ......................................... 8 1.6 Proportions of CARICOM’s Total Receipt of Services: 2000-2005............................................ 8 1.7 CARICOM Member States’ Receipt of Services by Broad Service Area: 2005......................... 8 1.8 Selected Member State’s Share of CARICOM’s Total Receipt of Services: 2005..................... 8 1.9 CARICOM, MDCs, LDCs and The Bahamas’ Receipts of Services - Transportation: 2000-2005 ......................................................................................................... 10 1.10 MDCs’ Receipt of Services - Transportation: 2000-2005........................................................... 10 1.11 LDCs’ Receipt of Services - Transportation: 2000-2005............................................................ 10 1.12 CARICOM, MDCs, LDCs and The Bahamas’ Receipts of Services - Travel: 2000-2005 ...................................................................................................................... 12 1.13 MDCs’ Receipt of Services - Travel: 2000-2005 ........................................................................ 12 1.14 LDCs’ Receipt of Services - Travel: 2000-2005 ......................................................................... 12 1.15 CARICOM, MDCs, LDCs and The Bahamas’ Receipts of Services – Commercial Services: 2000-2005 .............................................................................................. 14 1.16 MDCs’ Receipt of Services - Commercial Services : 2000-2005 ............................................... 14 1.17 LDCs’ Receipt of Services - Commercial Services: 2000-2005................................................. 14 1.18 CARICOM, MDCs, LDCs and The Bahamas’ Receipts of Services – Government Services: 2000-2005.............................................................................................. 16 1.19 MDCs’ Receipt of Services - Government Services: 2000-2005 ............................................... 16 1.20 LDCs’ Receipt of Services - Government Services: 2000-2005 ................................................ 16 1.21 CARICOM Member States Total Payment of Services: 2000 & 2005 ....................................... 19 1.22 Proportions of CARICOM’s Total Payment of Services: 2000-2005.......................................... 19 1.23 CARICOM Member States’ Payment of Services by Broad Service Area: 2005....................... 19 1.24 Selected Member State’s Share of CARICOM’s Total Payment of Services: 2005................... 19 1.25 CARICOM, MDCs, LDCs and The Bahamas’ Payment of Services - Transportation: 2000-2005 ......................................................................................................... 21 1.26 MDCs’ Payment of Services - Transportation : 2000-2005........................................................ 21 1.27 LDCs’ Payment of Services - Transportation : 2000-2005......................................................... 21 1.28 CARICOM, MDCs, LDCs and The Bahamas’ Payment of Services - Travel: 2000-2005 ......... 21 1.29 MDCs’ Payment of Services - Travel : 2000-2005 ..................................................................... 23 1.30 LDCs’ Payment of Services - Travel : 2000-2005 ...................................................................... 23 1.31 CARICOM, MDCs, LDCs and The Bahamas’ Payment of Services -
Commercial Services: 2000-2005 .............................................................................................. 25 1.32 MDCs’ Payment of Services – Commercial Services : 2000-2005 ............................................ 25 1.33 LDCs’ Payment of Services – Commercial Services : 2000-2005 ............................................. 25 1.34 CARICOM, MDCs, LDCs and The Bahamas’ Payment of Services -
Commercial Services: 2000-2005 .............................................................................................. 27 1.35 MDCs’ Payment of Services – Commercial Services : 2000-2005 ............................................ 27 1.36 LDCs’ Payment of Services – Government Services : 2000-2005............................................. 27 1.37 CARICOM’s Balances of Goods and Services : 2000-2005 ...................................................... 30 1.38 MDCs’ Balances of Goods and Services: 2000-2005 ................................................................ 30 1.39 LDCs’ Balances of Goods and Services: 2000-2005 ................................................................. 30 1.40 MDCs and The Bahamas’ Transportation Balance: 2000-2005................................................. 32 1.41(a) Selected LDCs Transportation Balance: 2000-2005 ................................................................. 32 1.41(b) Selected LDCs Transportation Balance: 2000-2005 ................................................................. 32 1.42 MDCs and The Bahamas’ Travel Balance: 2000-2005............................................................. 34 1.43(a) Selected LDCs Travel Balance: 2000-2005............................................................................... 34 1.43(b) Selected LDCs Travel Balance: 2000-2005............................................................................... 34 1.44 MDCs and The Bahamas’ Commercial Services Balance: 2000-2005..................................... 36 1.45(a) Selected LDCs Commercial Services Balance: 2000-2005...................................................... 36 1.45(b) Selected LDCs Commercial Services Balance: 2000-2005...................................................... 36 1.46 MDCs and The Bahamas’ Government Services Balance: 2000-2005 .................................... 38 1.47(a) Selected LDCs Government Services Balance: 2000-2005..................................................... 38 1.47(b) Selected LDCs Government Services Balance: 2000-2005..................................................... 38 1.48 CARICOM’s Trade in Services-Receipt, Payment and Balance of Services: 2000-2005........ 43 1.49 CARICOM’s Receipt of Services: 2000-2005........................................................................... 43
xiii

1.50 CARICOM’s Payment of Services: 2000-2005.......................................................................... 43 1.51 Antigua and Barbuda’s Trade in Services- Receipt, Payment and Balance of Services: 2000-2005................................................................................................................................... 46 1.52 Antigua and Barbuda’s Receipt of Services: 2000-2005............................................................ 46 1.53 Antigua and Barbuda’s Payment of Services: 2000-2005.......................................................... 46 1.54 The Bahamas’ Trade in Services- Receipt, Payment and Balance of Services: 2000-2005................................................................................................................................... 49 1.55 The Bahamas’ Receipt of Services: 2000-2005......................................................................... 49 1.56 The Bahamas’ Payment of Services: 2000-2005....................................................................... 49 1.57 Barbados’ Trade in Services- Receipt, Payment and Balance of Services: 2000-2005 ............ 52 1.58 Barbados’ Receipt of Services: 2000-2005 ................................................................................ 52 1.59 Barbados’ Payment of Services: 2000-2005.............................................................................. 52 1.60 Belize’s Trade in Services- Receipt, Payment and Balance of Services: 2000-2005................ 55 1.61 Belize’s Receipt of Services: 2000-2005.................................................................................... 55 1.62 Belize’s Payment of Services: 2000-2005.................................................................................. 55 1.63 Dominica’s Trade in Services- Receipt, Payment and Balance of Services: 2000-2005........... 58 1.64 Dominica’s Receipt of Services: 2000-2005............................................................................... 58 1.65 Dominica’s Payment of Services: 2000-2005............................................................................. 58 1.66 Grenada’s Trade in Services- Receipt, Payment and Balance of Services: 2000-2005............ 61 1.67 Grenada’s Receipt of Services: 2000-2005................................................................................ 61 1.68 Grenada’s Payment of Services: 2000-2005.............................................................................. 61 1.69 Guyana’s Trade in Services- Receipt, Payment and Balance of Services: 2000-2005 ............. 64 1.70 Guyana’s Receipt of Services: 2000-2005 ................................................................................. 64 1.71 Guyana’s Payment of Services: 2000-2005 ............................................................................... 64 1.72 Jamaica’s Trade in Services- Receipt, Payment and Balance of Services: 2000-2005 ............ 67 1.73 Jamaica’s Receipt of Services: 2000-2005 ................................................................................ 67 1.74 Jamaica’s Payment of Services: 2000-2005 .............................................................................. 67 1.75 Montserrat’s Trade in Services- Receipt, Payment and Balance of Services: 2000-2005 ........ 70 1.76 Montserrat’s Receipt of Services: 2000-2005 ............................................................................ 70 1.77 Montserrat’s Payment of Services: 2000-2005 .......................................................................... 70 1.78 St. Kitts and Nevis’ Trade in Services- Receipt, Payment and Balance of Services: 2000-2005................................................................................................................................... 73 1.79 St. Kitts and Nevis’ Receipt of Services: 2000-2005.................................................................. 73 1.80 St. Kitts and Nevis’ Payment of Services: 2000-2005................................................................ 73 1.81 Saint Lucia’s Trade in Services- Receipt, Payment and Balance of Services: 2000-2005........ 76 1.82 Saint Lucia’s Receipt of Services: 2000-2005............................................................................ 76 1.83 Saint Lucia’s Payment of Services: 2000-2005.......................................................................... 76 1.84 Suriname’s Trade in Services- Receipt, Payment and Balance of Services: 2000-2005 .......... 79 1.85 Suriname’s Receipt of Services: 2000-2005 .............................................................................. 79 1.86 Suriname’s Payment of Services: 2000-2005 ............................................................................ 79 1.87 St. Vincent and the Grenadines' Trade in Services- Receipt, Payment and Balance of Services: 2000-2005................................................................................................. 82 1.88 St. Vincent and the Grenadines’ Receipt of Services: 2000-2005 ............................................. 82 1.89 St. Vincent and the Grenadines’ Payment of Services: 2000-2005 ........................................... 82 1.90 Trinidad and Tobago’s Trade in Services- Receipt, Payment and Balance of Services:
2000-2005................................................................................................................................... 85 1.91 Trinidad and Tobago’s Receipt of Services: 2000-2005 ............................................................ 85 1.92 Trinidad and Tobago’s Payment of Services: 2000-2005 .......................................................... 85
xiv

xv
CONCEPTS AND DEFINITIONS 1. General Note on Framework of International Trade in Services
1.1 Framework for compiling International Trade in Services
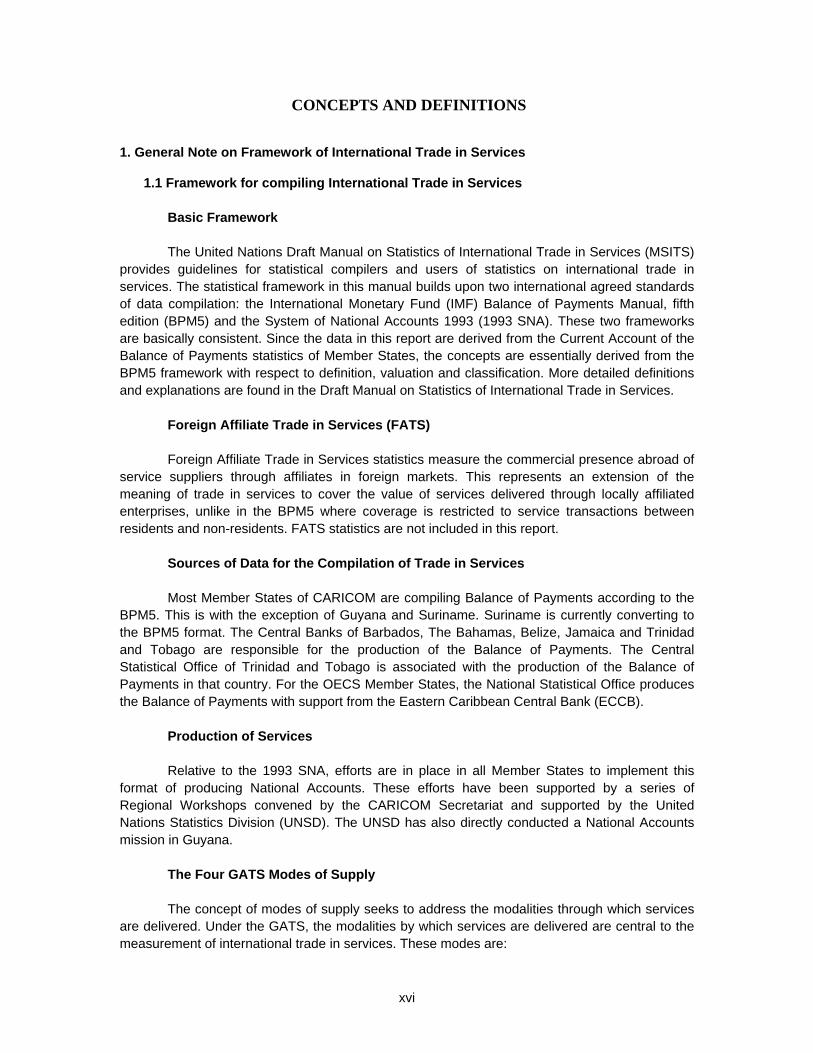
Basic Framework The United Nations Draft Manual on Statistics of International Trade in Services (MSITS)
provides guidelines for statistical compilers and users of statistics on international trade in services. The statistical framework in this manual builds upon two international agreed standards of data compilation: the International Monetary Fund (IMF) Balance of Payments Manual, fifth edition (BPM5) and the System of National Accounts 1993 (1993 SNA). These two frameworks are basically consistent. Since the data in this report are derived from the Current Account of the Balance of Payments statistics of Member States, the concepts are essentially derived from the BPM5 framework with respect to definition, valuation and classification. More detailed definitions and explanations are found in the Draft Manual on Statistics of International Trade in Services.
Foreign Affiliate Trade in Services (FATS) Foreign Affiliate Trade in Services statistics measure the commercial presence abroad of
service suppliers through affiliates in foreign markets. This represents an extension of the meaning of trade in services to cover the value of services delivered through locally affiliated enterprises, unlike in the BPM5 where coverage is restricted to service transactions between residents and non-residents. FATS statistics are not included in this report.
Sources of Data for the Compilation of Trade in Services Most Member States of CARICOM are compiling Balance of Payments according to the
BPM5. This is with the exception of Guyana and Suriname. Suriname is currently converting to the BPM5 format. The Central Banks of Barbados, The Bahamas, Belize, Jamaica and Trinidad and Tobago are responsible for the production of the Balance of Payments. The Central Statistical Office of Trinidad and Tobago is associated with the production of the Balance of Payments in that country. For the OECS Member States, the National Statistical Office produces the Balance of Payments with support from the Eastern Caribbean Central Bank (ECCB).
Production of Services Relative to the 1993 SNA, efforts are in place in all Member States to implement this
format of producing National Accounts. These efforts have been supported by a series of Regional Workshops convened by the CARICOM Secretariat and supported by the United Nations Statistics Division (UNSD). The UNSD has also directly conducted a National Accounts mission in Guyana.
The Four GATS Modes of Supply The concept of modes of supply seeks to address the modalities through which services
are delivered. Under the GATS, the modalities by which services are delivered are central to the measurement of international trade in services. These modes are:
xvi
Mode 1: Cross border supply Cross-border supply takes place when the consumer remains in his or her home territory while the service crosses the border, the supplier being located in another country. Examples of the delivery of this mode of delivery are: fax, Internet, telephone, mail and so forth. Freight services associated with the transport of goods and correspondence courses are examples of services delivered by this mode. Mode 2: Consumption abroad Consumption abroad occurs when a consumer moves outside his or her home territory and consumes services in another country. Tourist activities such as visits to museums, theatres, and accommodation expenditure are examples of consumption abroad. Mode 3: Commercial presence Commercial presence covers those services that entail the establishment of a commercial presence abroad to ensure close contact with the consumer in his or her home territory during production, delivery and after-delivery. Commercial presence covers juridical persons in the strict legal sense and also legal entities, such as branches, representative offices, and subsidiaries of foreign companies. Mode 4: Presence of Natural Persons Occurs when an individual moves to the territory of the consumer to provide a service on his or her own behalf or on behalf of his or her employer. Presence of natural persons covers non-permanent employment in the country of the consumer. Examples are short-term professionals, intra-corporate staff transfers, short-term employment of foreign staff in foreign affiliates, construction workers and domestic helpers. Concept of Residence This is a fundamental concept to the BOP since the transactions that are included in the
BOP are those that occur between residents and non-residents. The concept of residence is based on two notions: the centre of economic interest and the economic territory of a country. The economic territory of a country comprises the geographic territory administered by a government. Within this territory persons, goods and capital move freely. Included in the economic territory are the airspace, territorial waters and continental shelf lying in international waters over which the country enjoys exclusive rights, or claims to have jurisdiction over fishing rights and so forth. Territorial enclaves of a country in the rest of the world such as embassies, consulates and military bases form part of the economic territory of that country. However, free zones, bonded warehouses and offshore enterprises form part of the economic territory of the country in which these are located.
With respect to the notion of the centre of economic interest, an institutional unit has a
centre of economic interest within a country when there exists, within the economic territory of the country, some location, dwelling, place of production or other premises in or from which it engages in economic activities on a significant scale for a period of time usually for one year or more.
xvii

Under the concept of residence in the BPM5, the domestic sales of a foreign affiliate (FATS) are not included in the BOP. However as mentioned above these services are included in international trade in services. The concept of residence is also not based on nationality
1.2 Classification Systems for Trade in Services
There are five main classifications that are relevant to be mentioned. In the preface,
mention has already been made of the BPM5 standard components of the IMF (Annex I), of which the services component is essentially the foundation for the production of statistics on international trade in services. The other classifications of importance to services are the Extended Balance of Payments in Services (EBOPS), the GATS Services Sectoral Classification (GNS/W/120), the United Nations Central Product Classification (CPC version 1.0) and particularly with regard to production the International Standard Industrial Classification of all Economic Activities -Revision 3 (ISIC Rev. 3). The EBOPS is essentially a disaggregation of the BPM5 classification. The EBOPS classification is shown in Annex II
The GATS Services Sectoral classification (GNS/W/120) identifies a list of relevant
sectors and sub-sectors of services which resulted from consultations with member countries. The list facilitates negotiations of specific commitments with regards to national services regulations and is therefore considered a classification for negotiation purposes rather than statistical. This list is reproduced in Annex IV.
The CPC constitutes a comprehensive product classification covering both goods and
services. The main aim of establishing the CPC classification was to derive an international standard for compiling and disseminating data requiring product detail such as in national accounts (covering both goods and service industries), domestic and foreign commodity trade, international trade in services, balance of payments, industrial production, consumption and price statistics. The CPC is also fully harmonized with the Harmonized Commodity Description and Coding System (HS) with respect to the classification of goods. Of primary concern was also the need to harmonize various types of statistics. An excerpt from this classification is presented in Annex V. At present, the CPC version 1.1 is available but this is provisional. The MSITS provides a correspondence between the EBOPS and the CPC, a sample of which can be found in Annex VI and in Annex VII, a correlation between the GNS/W/120 and the CPC is presented.
The International Standard Industrial Classification of All Economic Activities Revision 3
(ISIC Rev. 3) is utilised to facilitate data comparison in the areas of economic and social statistics such as industrial production, value added and employment. The ISIC is a standard classification of productive economic activities in accordance with the kind of activity of an enterprise or establishment. This classification is available in Annex IX.
1.3 Recommendations for the Compilation of Statistics on International Trade in Services
The summary of recommendations with respect to the compilation of statistics on
international trade in services from the Draft Manual on Statistics of International Trade in Services is outlined below:
- The recommendations in the BPM5 with respect to the principles of recording (residency, valuation, time of recording, currency of recording and conversion) are to be followed.
xviii
- Data on services transactions between residents and non-residents of an economy should be compiled according to the EBOPS classification. Of highest priority is the compilation of data at the level of BPM5; this should be followed by the introduction of the EBOPS level of detail, but taking into consideration the data requirements in individual compiling economies. Of less immediate priority is the compilation of data on the EBOPS classification memorandum items.
- Data should be compiled on an individual trading partner basis, at least at the level of the 11 major components of the BPM5 classification
- Data for total services transactions with related or unrelated parties - Each EBOPS component should be allocated either to one dominant mode or where
there is no single dominant mode, to the most significant modes of supply. This is accorded a low priority.
2. Concepts and Definition of Services
Definition of Services
The Draft Manual on Statistics of International Trade in Services uses the
definition in accordance with the 1993 SNA: Services are not separate entities over which ownership rights can be established. They cannot be traded separately from their production. Services are defined as heterogeneous outputs produced to order and typically consist of changes in the conditions of the consuming units realized by the activities of the producers at the demand of the customers. By the time that the production is completed they must have been provided to the consumers
The data for the current report were derived from the Services Component of the
Balance of Payments. The BOP Current Account is divided into three components: Goods and Services (which is further sub-divided); Income and Current Transfers. Four main items under services that comprised the focus of the report are Transportation, Travel, Commercial and Government Services. These and other items are defined below.
2.1 Transportation services Transportation comprises international receipts and payments for all modes of
transportation performed by residents of one economy for those of another and auxiliary and supporting services related to transport. Transportation includes the carriage of goods (freight), passenger and rental of carriers with crew, cargo handling fees, navigation fees and maintenance.
The modes of transport are therefore: sea, air, and other. Some items that are
excluded from transport include, freight insurance (included in insurance services); goods procured in port by non-resident carriers and repairs of transportation equipment (included in goods); repairs of railway, harbour and airfield facilities (construction services); and rentals and charters of carriers without crew (included in other business services-operating leasing services).
Included in passenger services are those passenger services performed within an economy provided by non-resident carriers to residents, fares that are part of a package tour, charges for excess baggage, vehicles or other personal accompanying effects and personal expenditure made while on board carriers.
Excluded are passenger services provided to non-residents by resident carriers within the resident economies (travel services) and cruise fares (travel services).
xix
2.2 Travel Travel includes all services acquired for personal use by a traveller during a visit
in a host economy, for a period of less than one year. The goods and services are purchased on behalf of the traveller or provided quid pro quo. A traveller is a person staying for less than one year in an economy of which he or she is not a resident. Excluded from the definition of a traveller are: persons stationed at a military base or a dependent of such a person, a person working for an agency of his or her government; Expenditure made by these persons is recorded under government services.
Expenditure made in the economy of an employing enterprise by seasonal or
border workers are recorded under travel. In the case of the BPM5, the one-year guideline does not apply to students or patients receiving health care abroad, who remain residents of the economy of origin even if the length of stay in another country is one year or more. The BPM5 recommends a breakdown of travel into business, personal and other travel.
Excluded from travel is the international carriage of travellers which is covered
under transportation. However passenger services provided to non-residents by resident carriers within the resident economies and cruise fares are included in travel services.
It should be noted that the concept of a traveller used in the MSITS and the
BPM5 differs from the concept of visitor used by the World Tourism Organization in the Tourism Satellite Accounts (TSA). The BPM5 and the MSITS regard students and medical patients as residents of their economies of origin, recording their expenditure under travel, even if the period of time in another country is more than a year. However TSA do not regard the students and medical patients who have been in another country for more than one year as a visitor since their “usual environment” will be the university or the hospital or wherever they live.
A second point of difference between the TSA and the BPM5/MSITS is on the
question of remuneration. The TSA exclude those visitors whose primary purpose is in the exercise of an activity for which they are being remunerated from within the place of visit. The BPM5 and the MSITS adhere to the one year guideline recommending that if a person moves to a country for the purpose of remuneration for a period of less than one year then the person must be regarded as a traveller notwithstanding the purpose of the visit. An example of this is border and seasonal workers that are included in the case of the BPM5 and the MSITS but are excluded in the TSA. 2.2.1 Business Travel
Business travel covers travellers going abroad for all types of business activities such as carrier crews stopping off or laying over; government employees on official travel; employees of international organizations on official business and employees working for enterprises that are resident in an economy different from that of the employee. They may be in an economy for sales campaigns, market exploration, commercial negotiations, missions, meetings, production or installation work or other business purposes on behalf of an enterprise resident in another economy. Also included as business travellers are seasonal and border workers who are residents of one economy employed by enterprises in a different economy. Business travel comprises goods and services acquired by the traveller for his or her own use including those reimbursed by employers but excluding the sales or purchases that the travellers may conclude on behalf of the enterprise they
xx
represent. Personal expenditure by seasonal or border workers in economies in which they are employed are recorded under business travel.
2.2.2 Personal Travel
Personal travel covers travellers going abroad for purposes other than business such as holidays, participation in recreation and cultural activities, visits with friends and relations, pilgrimage, and education and health-related purposes. It is recommended that personal travel be broken down into three sub-components: health related expenditure (total expenditure by those travelling for medical reasons); education-related expenditure (total expenditure by students) and all other travel.
2.2.3 Recommendations on Alternative Breakdown of Travel
The MSITS recommends a further breakdown of travel into: Expenditure on goods; Expenditure on accommodation and restaurant services; and all other travel expenditure to be included in the Memorandum items of the EBOPS.
All goods and services (except international passenger fares) acquired by travellers from the economies in which they are travelling for their own use are recorded under travel. The most common goods and services are: lodging, food, beverages, entertainment and transportation within the country.
2.3 Communication
Communication services covers postal and courier services and
telecommunication services. Postal and courier services covers the pick-up, transport and delivery of letters, newspapers, periodicals, brochures, other printed matter, parcels and packages, including post office counter and mailbox rental services. Included in this component are: telegrams, post office counter services such as sale of stamps, money orders and so forth. Excluded are financial services rendered by postal administration such as postal giro, banking and savings accounts, mail preparation services.
Telecommunication services comprises the transmission of sound, images or
other information by telephone, telex, telegram, cable and broadcasting, satellite, electronic mail, facsimile services, teleconferencing and so forth. It does not include the value of the information transported. Also included are cellular telephone services, internet services. Excluded are installation services of telephone networks equipment (included in construction services) and database services and related computer services to access and manipulate data provided by database servers (included in computer and information services).
2.4 Construction Services Construction services covers work performed on construction projects and
installation by employees of an enterprise.
In the BPM5, expenditure on goods and services purchased in the host economy are to be included in other business services which is a deviation from the recommendation above.
The MSITS recommends that construction be broken up into construction abroad and construction in the reporting economy. This recommendation allows for a disaggregation for the recording of both the construction services provided and the goods
xxi
and services purchased in the host economy by non-resident enterprises that are providing the services.
2.5 Insurance Services Insurance services covers the provision of various types of insurance to non-
residents by resident insurance enterprises and vice-versa. These services are estimated or valued by the service charges included in total premiums. Separate estimates are recommended for freight insurance, pension funding, other direct insurance, reinsurance and life.
Freight: the insurance service charges for resident insurers providing insurance services to non-residents are estimated as the difference between premiums earned and claims payable on goods lost or destroyed.
For pension funding and other direct insurance: Insurance services are estimated in a similar manner to freight as the difference between premiums earned and claims payable.
2.6 Financial Services Financial services covers financial intermediation and auxiliary services except
those of life insurance enterprises and pension funds (which are included in life insurance and pension funding) and other insurance services that are conducted between residents and non-residents. Financial services include those provided by banks, stock exchanges, factoring enterprises, and credit card enterprises.
Included in financial services are: explicit and implicit commissions and fees such as: deposit taking and lending, including mortgage and non-mortgage loan services for business and personal purposes; letters of credit, bankers’ acceptances, lines of credit and other similar instruments; financial leasing; factoring; financial derivative transactions and so forth; financial advisory services; custody services for financial assets and bullions; financial asset management services; merger and acquisition services; corporate finance and venture capital services; credit card and other credit granting services; the spread on foreign exchange transactions; administration of financial markets; credit rating; and so forth.
Excluded from financial services are: interest earned on deposits, loans, financial leases and debt securities (investment income); dividends earned; life insurance and pension intermediation services (life insurance and pension funds); other insurance services; non-financial advisory services provided by banks; gains and losses made on purchase and sales of securities and financial derivatives on own account and FISIM. Two memorandum items are recommended for completion: financial intermediation services indirectly measured (FISIM) and financial services including FISIM.
The BPM5 does not recommend the inclusion of FISIM in the imports and exports of services.
2.7 Computer and related services Computer services consists of hardware and software related services and data processing services such as: hardware and software consultancy services; maintenance and repair of computers and peripheral equipment; disaster recovery services; provision
xxii
of advice, and assistance on matters related to the management of computer resources; analysis and design and programming of systems ready to use (including web page development and design); and technical consultancy related to software development, production, supply and documentation of customized software, including operating systems made on order for specific users; systems maintenance and other support services such as training provided as part of consultancy; data processing services such as data entry, tabulation, processing on a time-sharing basis; web page hosting services and computer facilities management.
Excluded from computer services are the provision of packaged (non-
customised) software (classified as goods therefore not included in EBOPS) and non-specific computer training courses (included in other personal, cultural and recreational services). News agency services includes the provision of news, photographs and feature articles to the media. Other information and provision services includes database services, database conception, data storage and the dissemination of data and databases (including directories and mailing lists), both on-line and through magnetic, optical or printed media; and web search portals (search engine services that find internet addresses for clients who input keyword queries). Also included are direct, non-bulk subscriptions to newspapers and periodicals whether by mail, electronic transmission or other means.
2.8 Royalties and license fees Royalties and license fees includes franchises and similar rights such as
international payments and receipts of franchising fees and the royalties paid for the use of registered trademarks; other royalties and license fees for international payments and receipts for the authorized use of intangible non-produced, non-financial assets and proprietary rights (such as patents, copyrights, and industrial processes and designs) and with the use through licensing agreements of produced originals and prototypes (such as manuscripts, computer programmes and cinematographic works and sound recordings). Payments and receipts for the outright purchases or sale of these assets and rights are excluded (following BPM5, these are recorded as capital account transactions, not as services). Excluded also are distributive rights for audiovisual products for a limited period or a limited area, these are included in audiovisual and related services.
The MSITS recommends that royalties and license fees that appears in the BPM5 format be disaggregated into franchise and similar rights and other royalties and license fees.
2.9.Other Business Services
The coverage of other business is identical to the coverage of the BPM5 component however the disaggregation proposed is more detailed than in the BPM5.
2.9.1 Merchanting
Merchanting is defined as the purchase of a good by a resident of the compiling economy from a non-resident and the subsequent resale of the good to another non-resident; during the process the good does not enter or leave the compiling economy.
2.9.2 Other trade-related services
Other trade-related services covers commissions on goods and service transactions between (i) resident merchants, commodity brokers, dealers and commission agents and (ii) non-residents. This component also includes
xxiii
transactions in ships, aircraft and sale of goods by auction. Excluded are franchising fees (included in franchise and similar rights) brokerage and financial services (included in financial services) and transport-related fees (included in transportation services).
2.9.3 Operational leasing services
Operational leasing services covers resident/non-resident leasing (rental) and charters, without operators, of ships, aircraft and transport equipment such as railway cars, containers, rigs and so forth without crew. Excluded are financial leasing (capital leasing), leasing of telecommunications lines or capacity (included in telecommunication services), rental of ships and aircraft with crew (included in transportation services) and rental of vehicles to foreign travellers (included in travel).
2.9.4 Legal services
Legal services covers legal advisory and representation services in any legal, judicial and statutory procedures; drafting services of legal documentation and instruments; certification consultancy; and escrow and settlement services.
2.9.5 Accounting, auditing, bookkeeping and tax consultancy services
Accounting, auditing, bookkeeping and tax consultancy services covers the recording of commercial transactions for businesses and others; examination services of accounting records and financial statements; business tax planning and consulting; and preparation of documents.
2.9.6 Business and management consultancy and public relations services
Business and management consultancy and public relations services covers advisory, guidance and operational assistance services provided to businesses for business policy and strategy and overall planning, structuring and control of an organization. Included are management auditing; market management; human resources; production management and project management consultancy; and advisory, guidance and operational services related to improving the image of clients and their relations with the general public and other institutions.
2.9.7 Advertising, market research and public opinion polling transactions
Advertising, market research and public opinion polling transactions covers the design, creation and marketing of advertisements by advertising agencies; media placement, including the purchase and sale of advertising space; exhibition services provided by trade fairs, the promotion of products abroad; market research; telemarketing and public opinion polling.
2.9.8 Research and development
Research and development covers basic research, applied research and experimental development of new products and processes. In principle activities in the physical, social sciences and humanities are covered, including the development of operating systems that represent technological advances. Also included is commercial research related to electronics, pharmaceuticals and
xxiv

biotechnology. Excluded are technical studies and consultancy work (included in business and management consultancy, public relations services).
2.9.9 Architectural, engineering and other technical services
Architectural, engineering and other technical services covers transactions between residents and non-residents related to architectural design of urban and other development projects; planning and project design and supervision of dams, bridges, airports, turnkey projects and so forth; surveying; cartography; product testing and certification and technical inspection services. Mining engineering is included in mining services.
2.9.10 Waste treatment and depollution services
Waste treatment and depollution services includes the treatment of radioactive and other waste of contaminated soil; cleaning up of pollution including oil spills; restoration of mining sites; and de-contamination and salination services. Also included are all other services that relate to the cleaning or restoring of the environment.
2.9.11 Agricultural, mining and on-site processing services
Agricultural, mining and on-site processing services includes agricultural services that are incidental to agriculture such as the provision of agricultural machinery with crew, harvesting, treatment of crops, pest control, animal boarding, animal care and breeding services. Services in hunting, trapping, forestry and logging and fishing are also included. Mining services provided at oil and gas fields including drilling, derrick building, repair and dismantling services and oil and gas well casing and cementing are included. Services incidental to mineral prospecting and exploration as well as mining engineering and geological surveying are also included here. Other on-site processing services covers on-site processing of or work on goods that have been imported without change of ownership, processed but not re-exported to the country from which the goods were consigned (but are instead either sold in the processing economy or sold to a third economy) or vice versa.
2.9.12 Other miscellaneous business services
Other miscellaneous business services covers services transactions between residents and non-residents such as placement of personnel, security and investigative services, translation and interpretation, photographic services, building cleaning, real estate services to business and any other business services that cannot be classified to any of the other business services listed above. Included are services related to the distribution of electricity, water, gas and other petroleum products.
2.9.13 Services between related enterprises n.i.e.
This is a residual category. It covers payments between related enterprises for services that cannot be specifically classified to any other component of EBOPS. It includes payments from branches, subsidiaries and associates to their parent enterprise or other related enterprises that represent contributions to the general management costs of the branches, subsidiaries and associates (for planning, organizing and controlling) and also reimbursements of expenses settled directly
xxv
by parent enterprises. Also included are transactions between parent enterprises and their branches, subsidiaries and associates to cover overhead expenses.
2.10. Personal, cultural and recreational services
This component comprises two sub-components: Audio-visual and related
services and other personal, cultural and recreational services.
Audio-visual and related services comprises services and associated fees related to the production of motion pictures (on film or videotape), radio and television programs (live or tape) and musical recordings. Included are receipts or payments for rentals; fees received by resident actors, producers, and so forth for production abroad (or by non-residents for work carried out in the compiling economy); fees for distribution rights sold to the media for a limited number of showings in specified areas; and access to encrypted television channels (such as cable services).
Fees to actors, directors and producers involved with theatrical and musical
productions, sporting events, circuses and other similar events and fees for distribution rights (for television, radio and film) for these activities are included. Excluded are purchases and sales of films, television and radio programmes, recorded music, musical compositions and manuscripts and the rights to these (because purchases and sales of merchandise and assets are not within the scope of EBOPS). Also excluded are the sale of rights of video editions of films and television programmes (included in the memorandum item audiovisual transactions).
Other personal, cultural and recreational services includes services such as those associated with museums, libraries and other cultural and sporting and recreational activities. Two separate items beyond the detail of the BPM5 have been identified: education services and health services. Education services comprises services supplied between resident and non-residents relating to education such as correspondence courses, and education through television and the internet as well as through teachers and similar who provide services directly in the host country.
Health services comprises services provided by doctors, nurses and paramedical and similar people as well as laboratory and similar services whether rendered remotely or on-site. Excluded is all expenditure by travellers on education and health (travel).
2.11. Government services not included elsewhere (n.i.e.)
Government services n.i.e. is a residual category covering government transactions (including those of international organizations) not contained in other components of the EBOPS classification. Included are all transactions (in both goods and services) by embassies, consulates, military units and defence agencies with residents of economies in which the embassies, consulates, military units and defence agencies are located and all transactions with other economies. Excluded are transactions with residents of the home economies represented by the embassies, consulates, military units and defence agencies and transactions in the commissaries, post exchanges, and these embassies and consulates.
The recommendation of the MSITS is to sub-divide this item into embassies and consulates and military units and agencies.
xxvi

ABOUT THE DATA
APPROACH TO PRESENTING THE DATA
As mentioned elsewhere, this report seeks a common approach to the production of statistics on International Trade in Services using as a basis the statistics provided for the services component of the Current Account of the Balance of Payments of CARICOM Member States. Even though the twelve Member states, for which data have been produced in this report, compile data in accordance with the BPM5, there were differences in the level of disaggregation of data across Member States. Ideally, therefore, the initial approach was to compile the statistics according to four broad service areas: Transportation, Travel, Commercial Services and Government Services not included elsewhere.
Tables 1.1.1 – 1.1.3 show a summary of services statistics by these broad service areas for the years 1993 and 2000. This was to show the change over time in receipts, payments and balance of services. The choice of 1993 was to enable the inclusion of The Bahamas since there was no information available for The Bahamas in this format for 1992. The second set of data from Tables 1.2.1-1.4.6 presents a series of data for the period 2000-2005 by Member States, individually highlighting each of the broad service areas for receipts, payments and balance of payments as well as the total receipts, payments and balances of services. Tables 1.5.1 –1.5.13 attempt to disaggregate at the level of CARICOM and for each Member State one of the broad service areas with respect to the commercial services: insurance services, financial services and other business services, for receipts, payments and balance of services. The attempt to disaggregate the commercial services highlighted some of the problems of data coverage, accuracy and quality. Tables 2.1.1 – 2.12.3 provide the most disaggregated data on services that are available for each Member State by receipts, payments and balance of services. This set of tables effectively shows the work that is ahead at the regional and national levels relative to movement from the BPM5 standard presentation to the more detailed EBOPS format. Annex II shows the EBOPS format, which, if it is matched back to Belize and Barbados’ more detailed presentations in Section 2, shows that these two Member States are well on the way to producing data by EBOPS. DATA COVERAGE AND QUALITY A thorough evaluation of this report and the developmental work that has been undertaken on the CIDA-funded project is required to comprehensively itemize coverage issues that currently exist in services and that affect the accuracy and the quality of the data. However, a close scrutiny of the data presented, the explanatory notes and, concepts and definitions provided some leads with regard to problems of coverage. In addition, a comparison of key components over time and across Member States also led to the discovery of possible coverage problems that are identified below. These issues have implications for the accuracy and quality of the data that are presented.
xxvii

Problems Identified in Data Compilation 1. The definition of the offshore enterprises some of which comprise offshore financial
companies poses some problems relative to the inclusion of information in the balance of payments. Looking at the data for The Bahamas, for example, it was evident that the data for financial services did not include the financial transactions of the offshore enterprises with the rest of the world. Only the local expenses of offshore companies are included since the offshore companies are defined by The Bahamas as non-resident and therefore services transactions between these companies and the rest of the world are treated as transactions between non-resident and non-resident entities and are excluded from the BOP. This is further justified by Member States, like The Bahamas, due to the fact that there is no overlap of these transactions with the domestic economies. According to the IMF’s BPM5, offshore enterprises engaged in manufacturing processes (including assembly of components manufactured elsewhere) are residents of the economies in which the offshore enterprises are located and should be included in the BOP. This is applicable regardless of the location of these enterprises relative to special zones of exemptions from customs or other concessions and regulations and also applies to non-manufacturing operations such as trading, financial enterprises and other services. Therefore, according to this definition, the local expenses transactions ought to be excluded from the BOP. This is also the case with Barbados. Concern about the definition and treatment of offshore financial sector and other offshore companies was raised in the situational assessment and requires further investigation and standardization across the region. At present, therefore, the lack of standardization in the treatment of offshore enterprises affects the quality and the accuracy of the data on services. This is, therefore, one major area requiring common guidelines for the production of statistics of international trade in services as well as the national accounts compilation that can serve to improve data accuracy and quality at the level of Member States and regionally. This whole issue hinges on the concept of residence, which is said to be under review.
2. Under Commercial services, the sector Financial services was sparse for several
Member States for both receipts and payments and was non-existent as a category in the case of Trinidad and Tobago. The estimate of trade in financial services appears to be very weak for most Member States. In the case of Barbados, it was obvious that efforts have been made to improve the accuracy and quality of this estimate in the post 1994 period as reflected in the high increase in 1995 over 1994..
3. In the sector Other Business services, which also falls under commercial services, there
is need to disaggregate this component to inform of precisely what are the key services that are contained and how the estimate is derived. For example, in the case of Member States that attempted to disaggregate this component, it was obvious that there were missing estimates from areas such as business, professional and technical services inward while an estimation was attempted or available for the period 1990-93 only with respect to the payments side in one case. Other business categories such as computer and related services , communication services and entertainment were in general not disaggregated.
4. Travel is also another area, which, during our workshops, it was realized that the
estimate might not be complete or accurate. This component of services reflects the
xxviii

mode of delivery consumption abroad of tourists. In some Member States, there is need for more up to date Visitor Expenditure surveys to gauge more effectively the contribution of travel to services to strengthen the debit side of this component. Also, the absence of inward-bound surveys also affects the payments side of this sector. In addition, checks can be made on the major tourists destinations for nationals of our member states to see how much our nationals spend abroad to strengthen this estimate. The absence of exchange controls would also have affected the supply of information on business travellers and points to the need to look at alternative sources of information as suggested above. Useful discussions on Tourism Satellite Accounts have been held relative to improvement of the estimation of the contribution of tourism in the 1993 SNA. Data quality for travel is therefore affected by the problems outlined above. In addition, a breakdown of travel into personal, business and so forth was not available for most member states and this needs to be addressed in the future. While there was a breakdown in the case of Trinidad and Tobago, it will be necessary to reorient this to bring it more closely in line with the EBOPS format.
5. For transportation, the breakdown into sea, air and other were available for most member
states. Based on the sources of data indicated, this data appears to be fairly reliable. However, further breakdown of these categories are required for the EBOPS format.
6. Coverage of establishments other than subsidiaries of multinationals is required in an
effort to obtain information on trade in services from other enterprises. 7. There is also need for Member States to report the response rates, as is the case for
Barbados, for the various surveys that are utilised in collecting information so that a better idea can be obtained of the quality of the estimates of services that are produced. In addition, more details should be furnished relative to the methods of estimation for missing data and in general more information on their methodologies and sources of data.
xxix
DATA HIGHLIGHTS
CARICOM Services by Broad Service Areas 2000-2005 1.1 Total Receipts (Exports) of Services Total receipts of services for CARICOM Member States was $US 9.0 billion in 2005 as compared to $US 7.3 billion in 2000, an annual average growth rate of 4.4 percent for the period 2000-2005. For CSME countries for which data were available, total receipts of services stood at $US6.6 billion in 2005 or approximately 72.5 percent of total Receipts of Services for CARICOM. The annual average for the CSME countries was 9.3 percent. In 2000 the value of total receipts of services for the CSME countries was $US 5.3 billion or 72.8 percent of the total receipts of services for CARICOM for that year. The percentage change of total receipts of services in 2005 over the previous year was 6.4 percent as compared to 11.1 percent in 2004. For the More Developed Countries (MDCs)1, the total receipts of services stood at $US 4.8 billion (53.5 percent of total receipts) in 2005 while the corresponding figures for the Less Developed Countries (LDCs) was $US1.7 billion (19 percent) and for the OECS it was $US1.4 billion (15.7 percent). The annual growth rates for the subgroups were: MDCs, 4.2 percent, LDCs, 4.5 percent with the OECS contributing to, 3.0 percent. The Bahamas ($US2.5 billion or 27.5 percent), Jamaica ($US2.3 billion or 25.8 percent) and Barbados ($US1.5 billion or 16.1 percent) were the countries with the highest receipts of services in 2005. Travel contributed $US 6.3 billion or 69 percent to CARICOM’s total receipt of services in 2005. This was the most significant component of services across all countries. The category, Commercial Services was the next highest component with $US 1.7 billion or 19 percent of total receipts of services in 2005. Transportation services contributed to 10 percent of the total receipts of services in 2005. There was little change in the percentage contribution of transporatation services from 2000 to 2005. The Bahamas contributed 33.1 percent to CARICOM’s Total Travel Receipts in 2005 with $US 2 billion, followed by Jamaica with $US 1.6 billon or 24.7 percent. The OECS as a subgroup contributed to $US1 billion or 16.7 percent of total travel receipts in 2005. The contribution of Barbados to this category was $US0.9 billion or 14.3 percent of CARICOM’s total receipts of services. Barbados was the highest contributor to total receipt of commercial services with $US 0. 5 billion or 28.8 percent of the total receipts of this category of services. Under Receipts of Commercial Services, Insurance Services stood at $US340.9 million or 3.8 percent of total receipt of services in 2005, as compared with US$298.8 million or 3.5 percent in 2004. Communication Services contributed to $US247.6 million and Financial Services $US202.3 million. 1.2 Total Payments (Imports) of Services Total Payment of Services in 2005 was $US5.4 billion as compared to $US4.4 in 2000,an annual average growth rate of 4.1 percent. For CSME countries for which data were available, total payments of services stood at $US4 billion in 2005 or approximately 74.6 percent of Total CARICOM Payments of Services with an annual growth rate of 3.4 percent. In 2000 the value of total payments of services was $US 3.4 billion or 76.9 percent of the total for that year.
1The term MDC, as stated in Article 4 of the Revised Treaty of Chaguaramas establishing the Caribbean Community including the CARICOM Single Market and Economy , refers to More Developed Countries namely Barbados, Guyana, Jamaica, Suriname and Trinidad and Tobago. The other Member States were designated as Less Developed Countries (LDC)according to the Revised Treaty.
xxx
The percentage change of total payments of services in 2005 over the previous year was 4.6 percent as compared to 10.4 percent in 2004 over 2003. For the MDCs, the total payments of services stood at $US 3.2 billion (58.2 percent) in 2005 while the corresponding figures for the LDCs was $US0.9 billion (16.4 percent) and for the OECS it was $US0.7 billion (13.4 percent). The annual growth rates of the subgroups for the period 2000-2005 were: MDCs, 3.1 percent, LDCs, 4.6 percent and the OECS, 4.5 percent. There were marginal changes in the distribution for these subgroups in 2005 as compared to 2000. The percentage change in total payments of services in 2005 over 2004 was 4.5 percent as compared with approximately 10.4 percent in 2004 over 2003. For the CSME countries the percentage change for payments of services was 2.4 percent in 2005 as compared with 9.7 percent in 2004. In 2005 percentages changes in payments of services over the previous year was 0.5 percent for the MDCs, 9.7 percent for the LDCs and 9.7 for the OECS. The percentage changes in 2004 were 10.2 percent for the MDCs, 7.8 percent for the LDCs and 8.5 percent for the OECS. Jamaica ($US1.7 billion or 32 percent), The Bahamas ($US1.4 billion or 25.4 percent) and Barbados ($US0.7 billion or 12.6 percent) were the countries with the highest payments of services in 2005. Commercial Services contributed $US 2.1 billion to CARICOM’s Total payments of services in 2005 or 39.2 percent. The category, Transportation services was the next highest component with $US 1.9 billion or 35 percent of Total payments of services in 2005. Travel payments contributed (1.1 billion) or 20 percent of the total payments of services in 2005. There was little change in the percentage contribution from 2000 to 2005. For Payments of Commercial Services, Insurance Services contributed to $US562.4 million. The category, Other Business Services comprising all Other services not elsewhere classified exhibited the highest values under receipts and payments of services with $US 754.4 million and $US 1.2 billion respectively. Jamaica was the highest contributor to payments of Commercial Services with $US 708.6 million or 33.4 percent. However for Jamaica Payments of Transportation Services exceeded that of Commercial services with $US 724.9 million or 37.8 percent of total payment of transportation services. The Bahamas was the highest contributor to Travel with $US344.3 million or 31.9 percent followed by Jamaica with $US249.5 million or 23.2 percent. The Bahamas with $US77.7 million or 27 percent was the highest contributor to payments of Government services followed by Trinidad and Tobago with $US69.9 million or 24.3 percent. BALANCE OF SERVICES Total Balance of Services for CARICOM stood at $US3.6 billion in 2005 compared to $US2.9 billion in 2000 an annual growth rate of 4.8 percent over the period. The Bahamas exhibited the largest single contribution to the balance of services with $US 1.11 billion or 30.6 percent of the total. The CSME countries balance of services was $US2.52 billion or 69.4 percent of the total balance of which the MDCs contributed $US1.68 billion or 46. 4 percent and the LDCs $US834.3 million or 23 percent. The OECS as a subgroup contributed to $US692.7 million or 19.1 percent of the balance of services. Travel was the most significant and the only positive contributor to the Balance of Services with a total of $US 5.18 billion. All other categories of services exhibited negative balances of services. These negative balances were: Transportation showing $US989.7; Commercial services with $US429.8 million and Government Services with $US127.3 million.
xxxi

MEMBER STATES TRADE IN SERVICES Antigua and Barbuda The value of receipts of Services of Antigua and Barbuda was $US488 million in 2005 of which Travel was the highest category contributing $US335 million or 68.6 percent. Total receipts of services increased by approximately 2.2 percent over the figure in 2004. Total Payments of Services was $US208.1 in 2005 with Transportation contributing to $US70.7 million or 34 percent of the total. The Balance of Payments on services was positive recording a value of $US279.9 million and continuing the positive trend from the previous years The Bahamas Total receipts of services for The Bahamas recorded a value of $US2.5 billion in 2005, an increase of 10.8 percent over 2004. The category, Travel contributed the highest value to total receipts for this Member State with $US2.1 billion or 83.2 percent. Total payments of services stood at $US1.4 billion. Commercial services with $US583 million or 42.4 percent was the highest value. The trend in the balance of services continued to be positive with the balance in 2005 recording a value of $US1.1 billion. The values of the Balance of Services of all the categories except travel were negative Barbados The value of Total Receipts of Services for Barbados stood at $US1.5 billion an increase of 20.0 percent over 2004. The category Travel recorded the highest value with $US896.8 million or 61.5 percent. Commercial Services was the next highest category with $US488.4 million or 33.5 percent. Total Payments of Services recorded a value of $US679.7 million of which commercial services was the largest contributor with $US321.7 million or 47.3 percent of total payments. The value of Balance of Payments in 2005 stood at $US777.6 million. Travel with $US801.1 million and commercial services with $US166.7 million were the most significant categories contributing to the positive balance of trade in services. Belize Total Receipts of Services for Belize stood at $US301.3 million in 2005 representing an increase of 51.2 percent over 2004. Travel contributed 70.9 percent or $US213.7 million. The value of payment of services was $US 159.7 million which resulted in a positive balance of trade in services of $US141.6 million in 2005. Dominica The value of total receipt of services for Dominica stood at $US83.4 million in 2005 recording a decline of 4.8 percent over 2004. Travel contributed $US55.6 million or 66.6 percent of total receipts of services. The total payments of services stood at $US52.1 million resulting in a positive balance of trade in services of $US31.4 million. Grenada Grenada recorded Total Receipts of services of $US116.6 million in 2005, a decrease of 25.8 percent over 2004. Travel was the highest component of Total receipts of services with a figure of $US71.4 million in 2005 or 61.3 percent. Total payments of services stood at $US92.8 million in 2005 with Transportation recording a value of $US45.3 million or 48.8 percent. The balance of payments for services stood at $US23.8 million.
xxxii
Guyana Total receipts of services for Guyana recorded a value of $US147.1 million in 2005 a decrease of 9.6 percent over 2004. In the case of Guyana, the category, Commercial Services recorded the highest value for receipts of services with $104.4 billion or 71 percent. Total payments of services stood at $US196.6 million in 2005 resulting in a deficit on the balance of trade in services of $US49.5 million. Transportation exhibited the largest negative balance of trade in services with $US64.3 million. Jamaica Jamaica recorded a value of $US2.3 billion in 2005 an increase of 1.4 percent over 2004. Travel was the most significant component with $US1.5 billion or 66.3 percent. Total payment of services stood at $US1.7 billion. Transportation with $US724.9 million or 41.9 percent and Commercial Services with $US708.6 million or 41 percent were the most significant contributors to total payments of services. The value of balance of trade in services was $US600.2 million with travel having the most significant balance of $US1.3 billion. Transportation, Commercial and Government services recorded negative balances. Montserrat The trend of deficits in the balance of trade in services continued into 2005 for Montserrat. The value of receipts of services was $US14.8 million while the value for payments of services was $US25.6 million. Travel was the most significant component under receipts with 60.9 percent. St Kitts and Nevis Total receipts of services for St. Kitts and Nevis stood at $US147.7 in 2005 an increase of 8.5 percent over 2004. The largest category was Travel with $US110.2 million or 74.6 percent. Total payments of services recorded a value of $US92 million. The balance of trade in services was $US55.8 million. Saint Lucia The value of total receipts of services for Saint Lucia was $US410.1 million in 2005 an increase of 11.7 percent over 2004. Travel was the largest component with $US356 million or 86.8 percent. Total payments in Services stood at $US171.1 million resulting in a positive balance of trade in Services of $US239 million. Travel was also the most significant category in the balance of trade in services. St Vincent and the Grenadines Total receipts of services for St. Vincent and the Grenadines stood at $US158.8 million an increase of 9.9 percent over 2004. Travel with $US105.1 million or 66.2 percent was the most significant component of receipts of services. Total payments of services was $US85 million in 2005 with transportation, $US34.4 million and Commercial services $US29.3 million being the significant components with a combined percentage contribution of 74.9 percent. Suriname Suriname’s total receipts in services stood at $US141.3 million in 2004 an increase of 137.5 percent over the figure for 2003. Commercial Services was the most significant category of receipts of services in 2004.recording a figure of $US62.6 million or 44.3 percent of the total.
xxxiii
Total payments of services stood at $US271 million in 2004 resulting in a deficit in the balance of trade in services of $US129.7 million. Trinidad and Tobago Total receipts of services stood at $US896.9 million in 2005. Travel was the most significant category with $US453 million or 50.5 percent of the total. Total payments of services stood at $US540.7 million. Transportation with $US191.4 million or 35.4 percent and Travel with $US180 million or 33.3 percent were the highest components of total payments in services for this Member State. The balance of trade in services continued its positive trend in to 2005 with a value of $US356.2 million.
xxxiv
Section 1
CARICOM’s Trade in Services by Broad Service Area
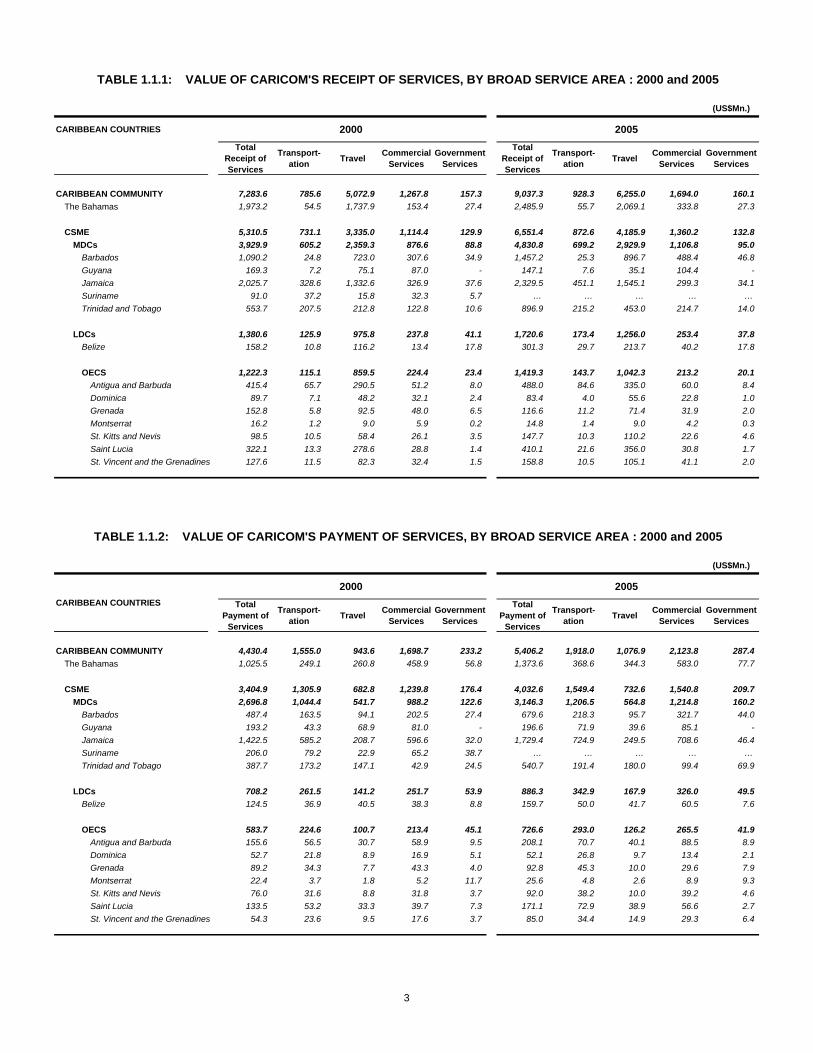
(US$Mn.)
CARIBBEAN COUNTRIES
Total Receipt of Services
Transport-ation Travel Commercial
ServicesGovernment
Services
Total Receipt of Services
Transport-ation Travel Commercial
ServicesGovernment
Services
CARIBBEAN COMMUNITY 7,283.6 785.6 5,072.9 1,267.8 157.3 9,037.3 928.3 6,255.0 1,694.0 160.1 The Bahamas 1,973.2 54.5 1,737.9 153.4 27.4 2,485.9 55.7 2,069.1 333.8 27.3
CSME 5,310.5 731.1 3,335.0 1,114.4 129.9 6,551.4 872.6 4,185.9 1,360.2 132.8 MDCs 3,929.9 605.2 2,359.3 876.6 88.8 4,830.8 699.2 2,929.9 1,106.8 95.0
Barbados 1,090.2 24.8 723.0 307.6 34.9 1,457.2 25.3 896.7 488.4 46.8 Guyana 169.3 7.2 75.1 87.0 - 147.1 7.6 35.1 104.4 - Jamaica 2,025.7 328.6 1,332.6 326.9 37.6 2,329.5 451.1 1,545.1 299.3 34.1 Suriname 91.0 37.2 15.8 32.3 5.7 … … … … …Trinidad and Tobago 553.7 207.5 212.8 122.8 10.6 896.9 215.2 453.0 214.7 14.0
LDCs 1,380.6 125.9 975.8 237.8 41.1 1,720.6 173.4 1,256.0 253.4 37.8 Belize 158.2 10.8 116.2 13.4 17.8 301.3 29.7 213.7 40.2 17.8
OECS 1,222.3 115.1 859.5 224.4 23.4 1,419.3 143.7 1,042.3 213.2 20.1 Antigua and Barbuda 415.4 65.7 290.5 51.2 8.0 488.0 84.6 335.0 60.0 8.4 Dominica 89.7 7.1 48.2 32.1 2.4 83.4 4.0 55.6 22.8 1.0 Grenada 152.8 5.8 92.5 48.0 6.5 116.6 11.2 71.4 31.9 2.0 Montserrat 16.2 1.2 9.0 5.9 0.2 14.8 1.4 9.0 4.2 0.3 St. Kitts and Nevis 98.5 10.5 58.4 26.1 3.5 147.7 10.3 110.2 22.6 4.6 Saint Lucia 322.1 13.3 278.6 28.8 1.4 410.1 21.6 356.0 30.8 1.7 St. Vincent and the Grenadines 127.6 11.5 82.3 32.4 1.5 158.8 10.5 105.1 41.1 2.0
(US$Mn.)
Total Payment of
Services
Transport-ation Travel Commercial
ServicesGovernment
Services
Total Payment of
Services
Transport-ation Travel Commercial
ServicesGovernment
Services
CARIBBEAN COMMUNITY 4,430.4 1,555.0 943.6 1,698.7 233.2 5,406.2 1,918.0 1,076.9 2,123.8 287.4 The Bahamas 1,025.5 249.1 260.8 458.9 56.8 1,373.6 368.6 344.3 583.0 77.7
CSME 3,404.9 1,305.9 682.8 1,239.8 176.4 4,032.6 1,549.4 732.6 1,540.8 209.7 MDCs 2,696.8 1,044.4 541.7 988.2 122.6 3,146.3 1,206.5 564.8 1,214.8 160.2
Barbados 487.4 163.5 94.1 202.5 27.4 679.6 218.3 95.7 321.7 44.0 Guyana 193.2 43.3 68.9 81.0 - 196.6 71.9 39.6 85.1 - Jamaica 1,422.5 585.2 208.7 596.6 32.0 1,729.4 724.9 249.5 708.6 46.4 Suriname 206.0 79.2 22.9 65.2 38.7 … … … … …Trinidad and Tobago 387.7 173.2 147.1 42.9 24.5 540.7 191.4 180.0 99.4 69.9
LDCs 708.2 261.5 141.2 251.7 53.9 886.3 342.9 167.9 326.0 49.5 Belize 124.5 36.9 40.5 38.3 8.8 159.7 50.0 41.7 60.5 7.6
OECS 583.7 224.6 100.7 213.4 45.1 726.6 293.0 126.2 265.5 41.9 Antigua and Barbuda 155.6 56.5 30.7 58.9 9.5 208.1 70.7 40.1 88.5 8.9 Dominica 52.7 21.8 8.9 16.9 5.1 52.1 26.8 9.7 13.4 2.1 Grenada 89.2 34.3 7.7 43.3 4.0 92.8 45.3 10.0 29.6 7.9 Montserrat 22.4 3.7 1.8 5.2 11.7 25.6 4.8 2.6 8.9 9.3 St. Kitts and Nevis 76.0 31.6 8.8 31.8 3.7 92.0 38.2 10.0 39.2 4.6 Saint Lucia 133.5 53.2 33.3 39.7 7.3 171.1 72.9 38.9 56.6 2.7 St. Vincent and the Grenadines 54.3 23.6 9.5 17.6 3.7 85.0 34.4 14.9 29.3 6.4
2000
TABLE 1.1.1: VALUE OF CARICOM'S RECEIPT OF SERVICES, BY BROAD SERVICE AREA : 2000 and 2005
2005
2005
TABLE 1.1.2: VALUE OF CARICOM'S PAYMENT OF SERVICES, BY BROAD SERVICE AREA : 2000 and 2005
2000CARIBBEAN COUNTRIES
3
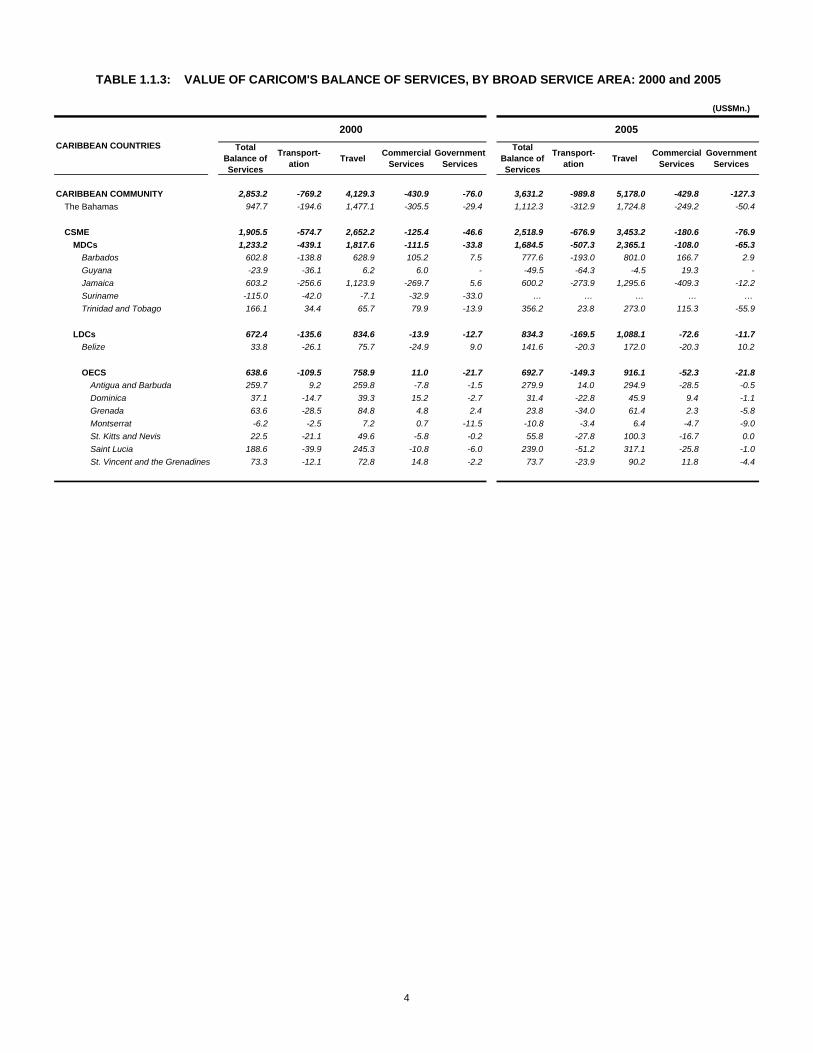
(US$Mn.)
Total Balance of Services
Transport-ation Travel Commercial
ServicesGovernment
Services
Total Balance of Services
Transport-ation Travel Commercial
ServicesGovernment
Services
CARIBBEAN COMMUNITY 2,853.2 -769.2 4,129.3 -430.9 -76.0 3,631.2 -989.8 5,178.0 -429.8 -127.3 The Bahamas 947.7 -194.6 1,477.1 -305.5 -29.4 1,112.3 -312.9 1,724.8 -249.2 -50.4
CSME 1,905.5 -574.7 2,652.2 -125.4 -46.6 2,518.9 -676.9 3,453.2 -180.6 -76.9 MDCs 1,233.2 -439.1 1,817.6 -111.5 -33.8 1,684.5 -507.3 2,365.1 -108.0 -65.3
Barbados 602.8 -138.8 628.9 105.2 7.5 777.6 -193.0 801.0 166.7 2.9 Guyana -23.9 -36.1 6.2 6.0 - -49.5 -64.3 -4.5 19.3 - Jamaica 603.2 -256.6 1,123.9 -269.7 5.6 600.2 -273.9 1,295.6 -409.3 -12.2 Suriname -115.0 -42.0 -7.1 -32.9 -33.0 … … … … …Trinidad and Tobago 166.1 34.4 65.7 79.9 -13.9 356.2 23.8 273.0 115.3 -55.9
LDCs 672.4 -135.6 834.6 -13.9 -12.7 834.3 -169.5 1,088.1 -72.6 -11.7 Belize 33.8 -26.1 75.7 -24.9 9.0 141.6 -20.3 172.0 -20.3 10.2
OECS 638.6 -109.5 758.9 11.0 -21.7 692.7 -149.3 916.1 -52.3 -21.8 Antigua and Barbuda 259.7 9.2 259.8 -7.8 -1.5 279.9 14.0 294.9 -28.5 -0.5 Dominica 37.1 -14.7 39.3 15.2 -2.7 31.4 -22.8 45.9 9.4 -1.1 Grenada 63.6 -28.5 84.8 4.8 2.4 23.8 -34.0 61.4 2.3 -5.8 Montserrat -6.2 -2.5 7.2 0.7 -11.5 -10.8 -3.4 6.4 -4.7 -9.0 St. Kitts and Nevis 22.5 -21.1 49.6 -5.8 -0.2 55.8 -27.8 100.3 -16.7 0.0 Saint Lucia 188.6 -39.9 245.3 -10.8 -6.0 239.0 -51.2 317.1 -25.8 -1.0 St. Vincent and the Grenadines 73.3 -12.1 72.8 14.8 -2.2 73.7 -23.9 90.2 11.8 -4.4
2005
TABLE 1.1.3: VALUE OF CARICOM'S BALANCE OF SERVICES, BY BROAD SERVICE AREA: 2000 and 2005
CARIBBEAN COUNTRIES
2000
4

TransportationTravelCommercial ServicesGovernment Services
TransportationTravelCommercial ServicesGovernment Services
Figure 1.1: Distribution of CARICOM Receipt of Services, By Broad Service Area: 2000
Transportation11%
Travel70%
Commercial Services
17%
Government Services
2%
Transportation Travel Commercial Services Government Services
Figure 1.2: Distribution of CARICOM Payment of Services, By Broad Service Area: 2000
Travel21%
Government Services
5%
Transportation35%
Commercial Services
39%
Transportation Travel Commercial Services Government Services
Figure 1.3: Distribution of CARICOM Receipt of Services, By Broad Service Area: 2005
Transportation10%
Travel69%
Commercial Services
19%
Government Services
2%
Transportation Travel Commercial Services Government Services
Figure 1.4: Distribution of CARICOM Payment of Services, By Broad Service Area: 2005
Travel20%
Government Services
5%Transportation
35%
Commercial Services
40%
Transportation Travel Commercial Services Government Services
5

(US$Mn.)
CARIBBEAN COUNTRIES 2000 2001 2002 2003 2004 2005
CARIBBEAN COMMUNITY 7,283.6 6,891.8 7,113.9 7,640.8 8,492.6 9,037.3
The Bahamas 1,973.2 1,804.3 2,061.7 2,054.7 2,242.5 2,485.9
CSME 5,310.5 5,087.4 5,052.1 5,586.1 6,250.1 6,551.4
MDCs 3,929.9 3,800.5 3,801.3 4,205.3 4,666.2 4,830.8
Barbados 1,090.2 1,068.5 1,041.3 1,165.5 1,214.2 1,457.2
Guyana 169.3 172.0 172.3 156.8 162.8 147.1
Jamaica 2,025.7 1,897.0 1,912.2 2,138.3 2,297.1 2,329.5
Suriname 91.0 59.4 38.5 59.5 141.3 …
Trinidad and Tobago 553.7 603.6 637.0 685.2 850.8 896.9
LDCs 1,380.6 1,286.9 1,250.9 1,380.8 1,583.8 1,720.6
Belize 158.2 157.3 156.9 178.6 199.2 301.3
OECS 1,222.3 1,129.6 1,093.9 1,202.1 1,384.7 1,419.3
Antigua and Barbuda 415.4 402.1 391.2 419.3 477.3 488.0
Dominica 89.7 75.6 79.7 80.5 87.6 83.4
Grenada 152.8 133.3 133.0 134.0 157.3 116.6
Montserrat 16.2 14.7 13.9 12.1 14.9 14.8
St. Kitts and Nevis 98.5 97.9 90.2 107.2 136.1 147.7
Saint Lucia 322.1 272.8 249.2 317.0 367.1 410.1
St. Vincent and the Grenadines 127.6 133.2 136.6 132.1 144.5 158.8
TABLE 1.2.1: VALUE OF CARICOM'S TOTAL RECEIPT OF SERVICES, BY COUNTRY: 2000-2005
6

(Percent)
CARIBBEAN COUNTRIES 2000 2001 2002 2003 2004 2005
CARIBBEAN COMMUNITY 100.0 100.0 100.0 100.0 100.0 100.0
The Bahamas 27.1 26.2 29.0 26.9 26.4 27.5
CSME 72.9 73.8 71.0 73.1 73.6 72.5
MDCs 54.0 55.1 53.4 55.0 54.9 53.5
Barbados 15.0 15.5 14.6 15.3 14.3 16.1
Guyana 2.3 2.5 2.4 2.1 1.9 1.6
Jamaica 27.8 27.5 26.9 28.0 27.0 25.8
Suriname 1.2 0.9 0.5 0.8 1.7 …
Trinidad and Tobago 7.6 8.8 9.0 9.0 10.0 9.9
LDCs 19.0 18.7 17.6 18.1 18.6 19.0
Belize 2.2 2.3 2.2 2.3 2.3 3.3
OECS 16.8 16.4 15.4 15.7 16.3 15.7
Antigua and Barbuda 5.7 5.8 5.5 5.5 5.6 5.4
Dominica 1.2 1.1 1.1 1.1 1.0 0.9
Grenada 2.1 1.9 1.9 1.8 1.9 1.3
Montserrat 0.2 0.2 0.2 0.2 0.2 0.2
St. Kitts and Nevis 1.4 1.4 1.3 1.4 1.6 1.6
Saint Lucia 4.4 4.0 3.5 4.1 4.3 4.5
St. Vincent and the Grenadines 1.8 1.9 1.9 1.7 1.7 1.8
TABLE 1.2.2: PERCENTAGE DISTRIBUTION OF CARICOM'S TOTAL RECEIPTS OF SERVICES, BY COUNTRY: 2000-2005
7
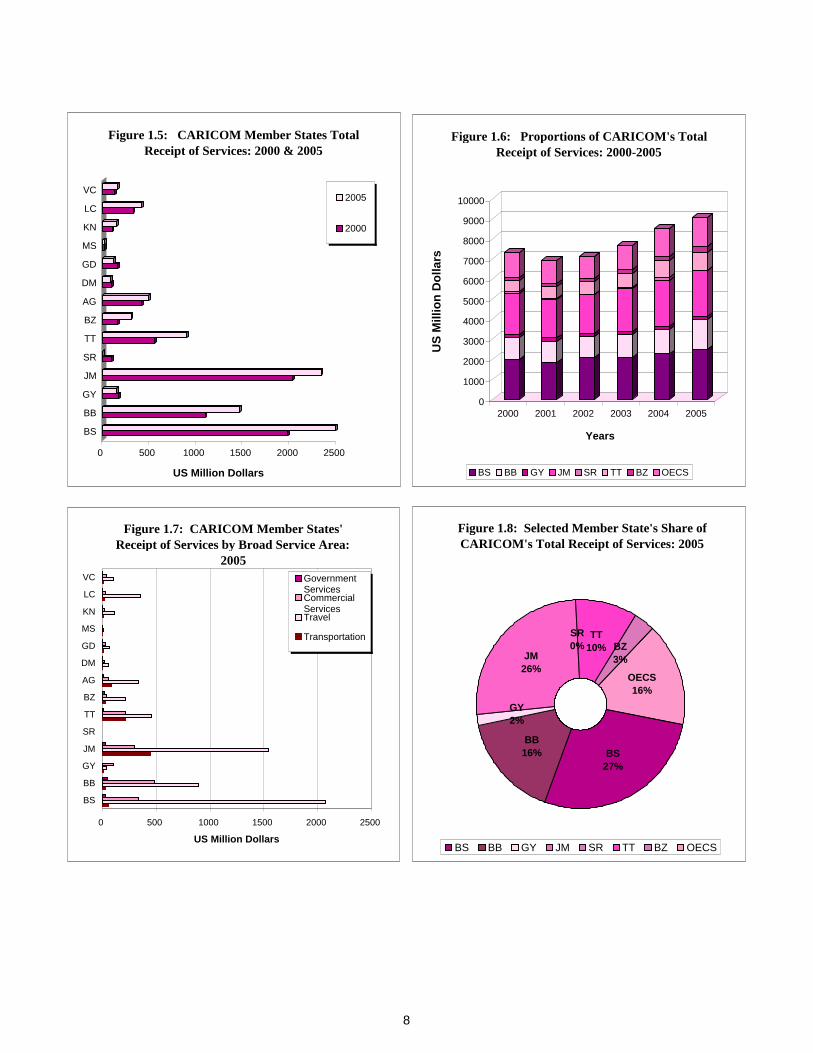
CCBSBBGYJMSRTTBZOECSAGDMGDMSKNLCVC
0
1000
2000
3000
4000
5000
6000
7000
8000
9000
10000
US
Mill
ion
Dol
lars
2000 2001 2002 2003 2004 2005
Years
Figure 1.6: Proportions of CARICOM's Total Receipt of Services: 2000-2005
BS BB GY JM SR TT BZ OECS
Figure 1.7: CARICOM Member States' Receipt of Services by Broad Service Area:
2005
0 500 1000 1500 2000 2500
BS
BB
GY
JM
SR
TT
BZ
AG
DM
GD
MS
KN
LC
VC
US Million Dollars
GovernmentServicesCommercialServicesTravel
Transportation
Figure 1.8: Selected Member State's Share of CARICOM's Total Receipt of Services: 2005
BS27%
BB16%
GY2%
JM26%
SR0%
TT10% BZ
3%
OECS16%
BS BB GY JM SR TT BZ OECS
0 500 1000 1500 2000 2500
US Million Dollars
BS
BB
GY
JM
SR
TT
BZ
AG
DM
GD
MS
KN
LC
VC
Figure 1.5: CARICOM Member States Total Receipt of Services: 2000 & 2005
2005
2000
8

(US$Mn.)
CARIBBEAN COUNTRIES 2000 2001 2002 2003 2004 2005
CARIBBEAN COMMUNITY 785.6 793.3 823.5 982.7 1,090.5 928.3
The Bahamas 54.5 50.2 57.5 56.7 55.3 55.7
CSME 731.1 743.1 766.0 926.0 1,035.2 872.6
MDCs 605.2 608.3 624.7 777.0 874.5 699.2
Barbados 24.8 22.4 21.0 23.2 25.9 25.3
Guyana 7.2 9.2 9.3 6.7 7.2 7.6
Jamaica 328.6 350.5 368.7 474.3 497.3 451.1
Suriname 37.2 18.9 23.2 26.3 49.4 …
Trinidad and Tobago 207.5 207.3 202.5 246.5 294.7 215.2
LDCs 125.9 134.8 141.3 149.1 160.7 173.4
Belize 10.8 11.8 18.1 22.1 27.4 29.7
OECS 115.1 123.0 123.2 126.9 133.3 143.7
Antigua and Barbuda 65.7 74.6 76.7 80.6 79.7 84.6
Dominica 7.1 6.1 5.4 4.9 6.1 4.0
Grenada 5.8 8.1 7.8 9.0 9.3 11.2
Montserrat 1.2 1.3 1.4 1.4 1.4 1.4
St. Kitts and Nevis 10.5 11.4 10.0 9.3 9.8 10.3
Saint Lucia 13.3 11.8 10.9 11.5 15.3 21.6
St. Vincent and the Grenadines 11.5 9.6 10.9 10.2 11.6 10.5
TABLE 1.2.3: CARICOM'S RECEIPT OF SERVICES - TRANSPORTATION: 2000-2005
9

Figure 1.9: CARICOM, MDCs, LDCs & The Bahamas' Receipts of Services - Transportation: 2000-2005
0
200
400
600
800
1000
1200
2000 2001 2002 2003 2004 2005
Years
US
Mill
ion
Dol
lars
CARICOM MDCs LDCs BS
Figure 1.10: MDCs' Receipt of Services - Transportation: 2000-2005
0
100
200
300
400
500
600
2000 2001 2002 2003 2004 2005Years
US
Mill
ion
Dol
lars
BB GY JM SR TT
0
20
40
60
80
100
120
US
Mill
ion
Dol
lars
2000 2001 2002 2003 2004 2005Years
Figure 1.11: LDCs' Receipt of Services - Transportation: 2000-2005
AG BZ DM GD MS KN LC VC
10
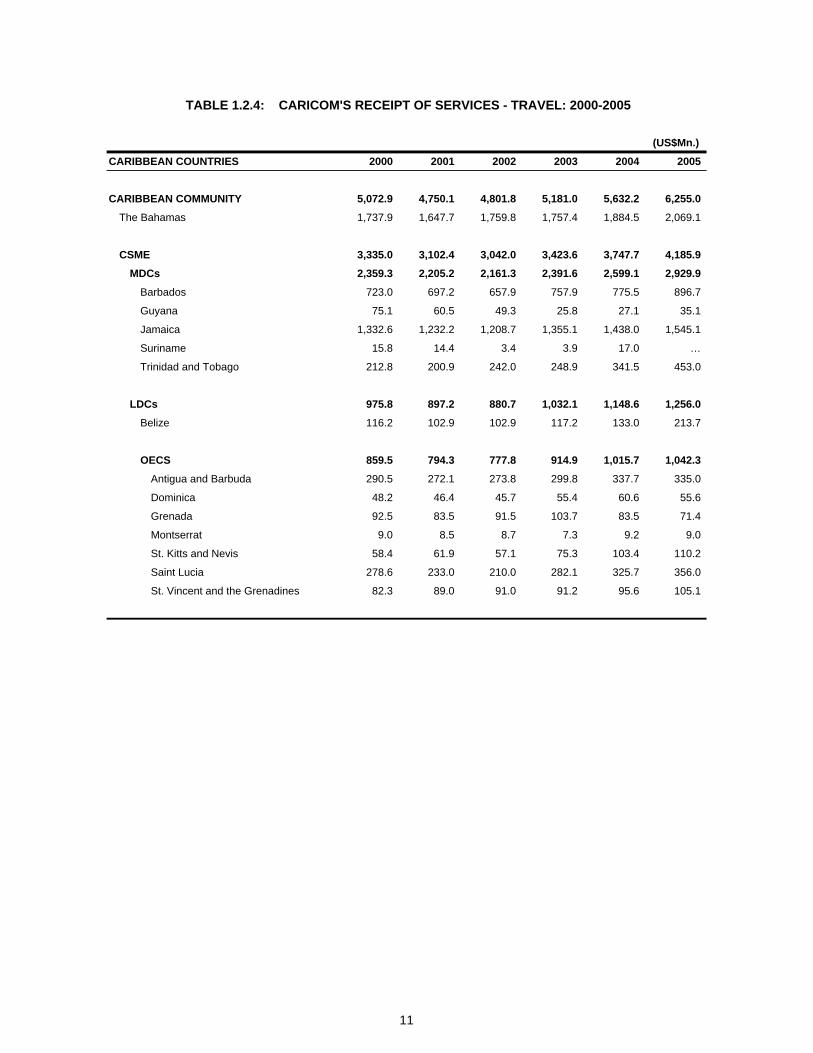
(US$Mn.)
CARIBBEAN COUNTRIES 2000 2001 2002 2003 2004 2005
CARIBBEAN COMMUNITY 5,072.9 4,750.1 4,801.8 5,181.0 5,632.2 6,255.0
The Bahamas 1,737.9 1,647.7 1,759.8 1,757.4 1,884.5 2,069.1
CSME 3,335.0 3,102.4 3,042.0 3,423.6 3,747.7 4,185.9
MDCs 2,359.3 2,205.2 2,161.3 2,391.6 2,599.1 2,929.9
Barbados 723.0 697.2 657.9 757.9 775.5 896.7
Guyana 75.1 60.5 49.3 25.8 27.1 35.1
Jamaica 1,332.6 1,232.2 1,208.7 1,355.1 1,438.0 1,545.1
Suriname 15.8 14.4 3.4 3.9 17.0 …
Trinidad and Tobago 212.8 200.9 242.0 248.9 341.5 453.0
LDCs 975.8 897.2 880.7 1,032.1 1,148.6 1,256.0
Belize 116.2 102.9 102.9 117.2 133.0 213.7
OECS 859.5 794.3 777.8 914.9 1,015.7 1,042.3
Antigua and Barbuda 290.5 272.1 273.8 299.8 337.7 335.0
Dominica 48.2 46.4 45.7 55.4 60.6 55.6
Grenada 92.5 83.5 91.5 103.7 83.5 71.4
Montserrat 9.0 8.5 8.7 7.3 9.2 9.0
St. Kitts and Nevis 58.4 61.9 57.1 75.3 103.4 110.2
Saint Lucia 278.6 233.0 210.0 282.1 325.7 356.0
St. Vincent and the Grenadines 82.3 89.0 91.0 91.2 95.6 105.1
TABLE 1.2.4: CARICOM'S RECEIPT OF SERVICES - TRAVEL: 2000-2005
11

1
2
3
4
5
6
7
8
9
10
11
12
13
1
2
3
4
5
6
7
8
9
10
11
12
13
1
2
3
4
5
6
7
8
9
10
11
12
13
Figure 1.12: CARICOM, MDCs, LDCs & The Bahamas' Receipt of Services - Travel: 2000-2005
0
1000
2000
3000
4000
5000
6000
7000
2000 2001 2002 2003 2004 2005Years
US
Mill
ion
Dol
lars
CARICOM MDCs LDCs BS
0
250
500
750
1000
US
Mill
ion
Dol
lars
2000 2001 2002 2003 2004 2005
Years
Figure 1.14: LDCs' Receipt of Services - Travel: 2000-2005
AG BZ DM GD MS KN LC VC
Figure 1.13: MDCs' Receipt of Services - Travel: 2000-2005
0
300
600
900
1200
1500
1800
2000 2001 2002 2003 2004 2005
Years
US
Mill
ion
Dol
lars
BB GY JM SR TT
12

(US$Mn.)
CARIBBEAN COUNTRIES 2000 2001 2002 2003 2004 2005
CARIBBEAN COMMUNITY 1,267.8 1,166.9 1,319.8 1,323.7 1,605.7 1,694.0
The Bahamas 153.4 78.3 218.1 214.1 269.4 333.8
CSME 1,114.4 1,088.6 1,101.6 1,109.6 1,336.3 1,360.2
MDCs 876.6 877.6 903.8 939.3 1,089.9 1,106.8
Barbados 307.6 312.9 324.4 342.7 370.2 488.4
Guyana 87.0 102.3 113.7 124.3 128.5 104.4
Jamaica 326.9 284.6 303.5 274.1 327.2 299.3
Suriname 32.3 22.9 8.6 21.8 62.6 …
Trinidad and Tobago 122.8 155.0 153.6 176.5 201.4 214.7
LDCs 237.8 211.0 197.8 170.3 246.4 253.4
Belize 13.4 19.5 20.8 23.2 26.9 40.2
OECS 224.4 191.5 177.0 147.1 219.4 213.2
Antigua and Barbuda 51.2 47.8 36.6 35.2 53.4 60.0
Dominica 32.1 21.3 26.8 19.1 19.5 22.8
Grenada 48.0 37.4 30.9 19.6 62.8 31.9
Montserrat 5.9 4.7 3.7 3.1 4.1 4.2
St. Kitts and Nevis 26.1 20.4 18.8 18.3 18.8 22.6
Saint Lucia 28.8 26.6 26.9 22.0 24.7 30.8
St. Vincent and the Grenadines 32.4 33.3 33.3 29.7 36.1 41.1
TABLE 1.2.5: CARICOM'S RECEIPT OF SERVICES - COMMERCIAL SERVICES: 2000-2005
13
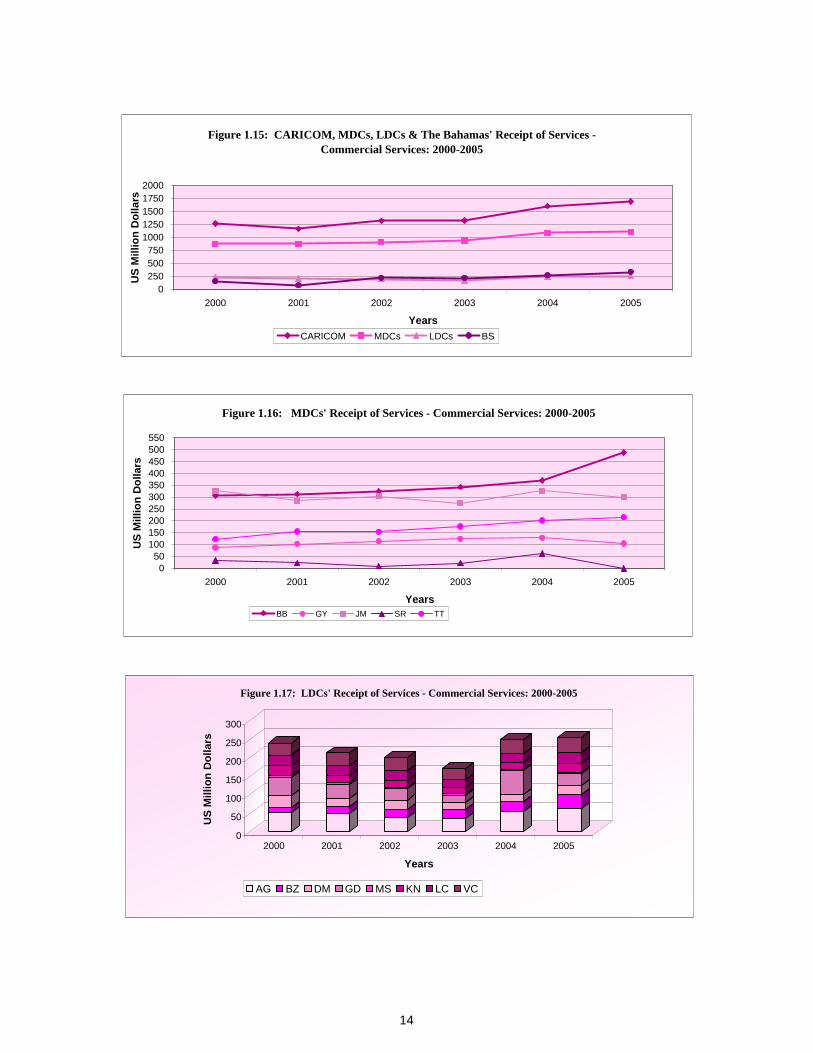
1
2
3
4
5
6
7
8
9
10
11
12
13
1
2
3
4
5
6
7
8
9
10
11
12
13
1
2
3
4
5
6
7
8
9
10
11
12
13
Figure 1.15: CARICOM, MDCs, LDCs & The Bahamas' Receipt of Services - Commercial Services: 2000-2005
0250500750
10001250150017502000
2000 2001 2002 2003 2004 2005
Years
US
Mill
ion
Dol
lars
CARICOM MDCs LDCs BS
Figure 1.16: MDCs' Receipt of Services - Commercial Services: 2000-2005
050
100150200250300350400450500550
2000 2001 2002 2003 2004 2005
Years
US
Mill
ion
Dol
lars
BB GY JM SR TT
0
50
100
150
200
250
300
US
Mill
ion
Dol
lars
2000 2001 2002 2003 2004 2005
Years
Figure 1.17: LDCs' Receipt of Services - Commercial Services: 2000-2005
AG BZ DM GD MS KN LC VC
14

(US$Mn.)
CARIBBEAN COUNTRIES 2000 2001 2002 2003 2004 2005
CARIBBEAN COMMUNITY 157.3 181.5 168.9 153.3 164.2 160.1
The Bahamas 27.4 28.2 26.3 26.5 33.3 27.3
CSME 129.9 153.3 142.6 126.8 130.9 132.8
MDCs 88.8 109.4 111.5 97.5 102.7 95.0
Barbados 34.9 36.1 38.0 41.8 42.6 46.8
Guyana - - - - - -
Jamaica 37.6 29.7 31.3 34.8 34.6 34.1
Suriname 5.7 3.2 3.3 7.6 12.3 …
Trinidad and Tobago 10.6 40.4 38.9 13.3 13.2 14.0
LDCs 41.1 43.9 31.1 29.3 28.2 37.8
Belize 17.8 23.1 15.1 16.1 11.9 17.8
OECS 23.4 20.8 16.0 13.2 16.3 20.1
Antigua and Barbuda 8.0 7.6 4.1 3.7 6.4 8.4
Dominica 2.4 1.7 1.8 1.0 1.3 1.0
Grenada 6.5 4.4 2.8 1.7 1.6 2.0
Montserrat 0.2 0.2 0.2 0.2 0.2 0.3
St. Kitts and Nevis 3.5 4.2 4.2 4.2 4.1 4.6
Saint Lucia 1.4 1.4 1.4 1.5 1.5 1.7
St. Vincent and the Grenadines 1.5 1.3 1.4 1.0 1.2 2.0
TABLE 1.2.6: CARICOM'S RECEIPT OF SERVICES - GOVERNMENT SERVICES: 2000-2005
15
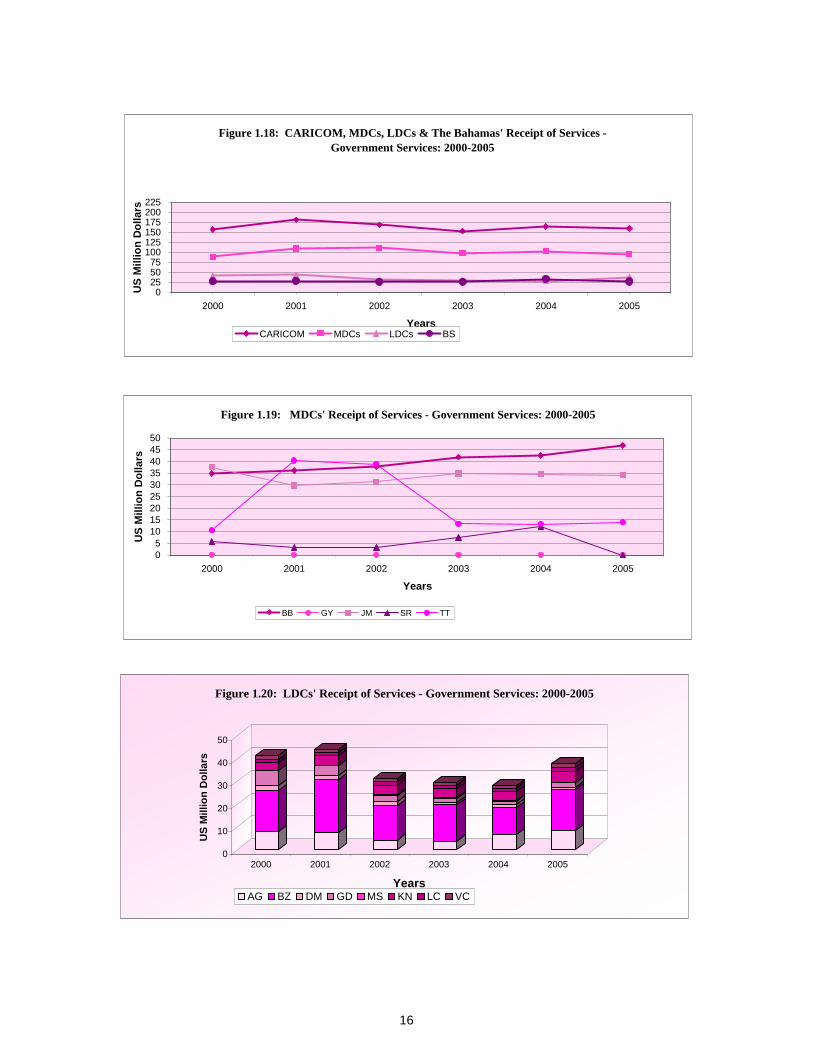
1
2
3
4
5
6
7
8
9
10
11
12
13
1
2
3
4
5
6
7
8
9
10
11
12
13
1
2
3
4
5
6
7
8
9
10
11
12
13
Figure 1.18: CARICOM, MDCs, LDCs & The Bahamas' Receipt of Services - Government Services: 2000-2005
0255075
100125150175200225
2000 2001 2002 2003 2004 2005
Years
US
Mill
ion
Dol
lars
CARICOM MDCs LDCs BS
0
10
20
30
40
50
US
Mill
ion
Dol
lars
2000 2001 2002 2003 2004 2005
Years
Figure 1.20: LDCs' Receipt of Services - Government Services: 2000-2005
AG BZ DM GD MS KN LC VC
Figure 1.19: MDCs' Receipt of Services - Government Services: 2000-2005
05
101520253035404550
2000 2001 2002 2003 2004 2005
Years
US
Mill
ion
Dol
lars
BB GY JM SR TT
16
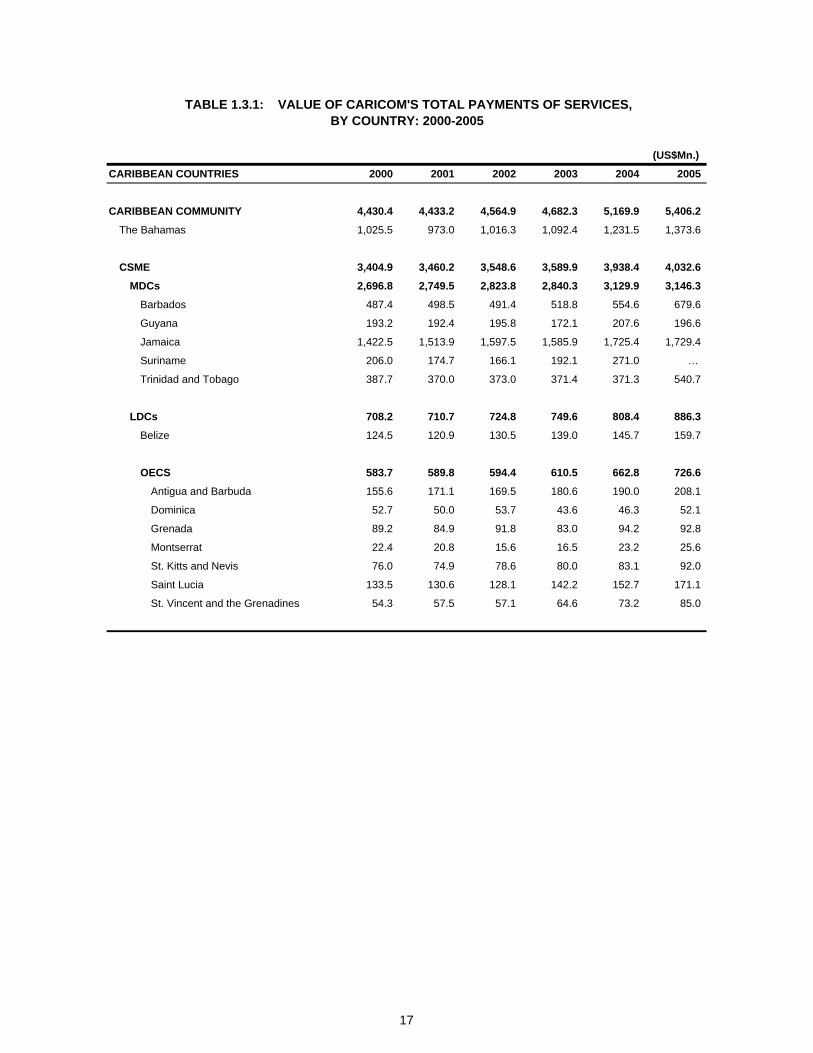
(US$Mn.)
CARIBBEAN COUNTRIES 2000 2001 2002 2003 2004 2005
CARIBBEAN COMMUNITY 4,430.4 4,433.2 4,564.9 4,682.3 5,169.9 5,406.2
The Bahamas 1,025.5 973.0 1,016.3 1,092.4 1,231.5 1,373.6
CSME 3,404.9 3,460.2 3,548.6 3,589.9 3,938.4 4,032.6
MDCs 2,696.8 2,749.5 2,823.8 2,840.3 3,129.9 3,146.3
Barbados 487.4 498.5 491.4 518.8 554.6 679.6
Guyana 193.2 192.4 195.8 172.1 207.6 196.6
Jamaica 1,422.5 1,513.9 1,597.5 1,585.9 1,725.4 1,729.4
Suriname 206.0 174.7 166.1 192.1 271.0 …
Trinidad and Tobago 387.7 370.0 373.0 371.4 371.3 540.7
LDCs 708.2 710.7 724.8 749.6 808.4 886.3
Belize 124.5 120.9 130.5 139.0 145.7 159.7
OECS 583.7 589.8 594.4 610.5 662.8 726.6
Antigua and Barbuda 155.6 171.1 169.5 180.6 190.0 208.1
Dominica 52.7 50.0 53.7 43.6 46.3 52.1
Grenada 89.2 84.9 91.8 83.0 94.2 92.8
Montserrat 22.4 20.8 15.6 16.5 23.2 25.6
St. Kitts and Nevis 76.0 74.9 78.6 80.0 83.1 92.0
Saint Lucia 133.5 130.6 128.1 142.2 152.7 171.1
St. Vincent and the Grenadines 54.3 57.5 57.1 64.6 73.2 85.0
TABLE 1.3.1: VALUE OF CARICOM'S TOTAL PAYMENTS OF SERVICES, BY COUNTRY: 2000-2005
17
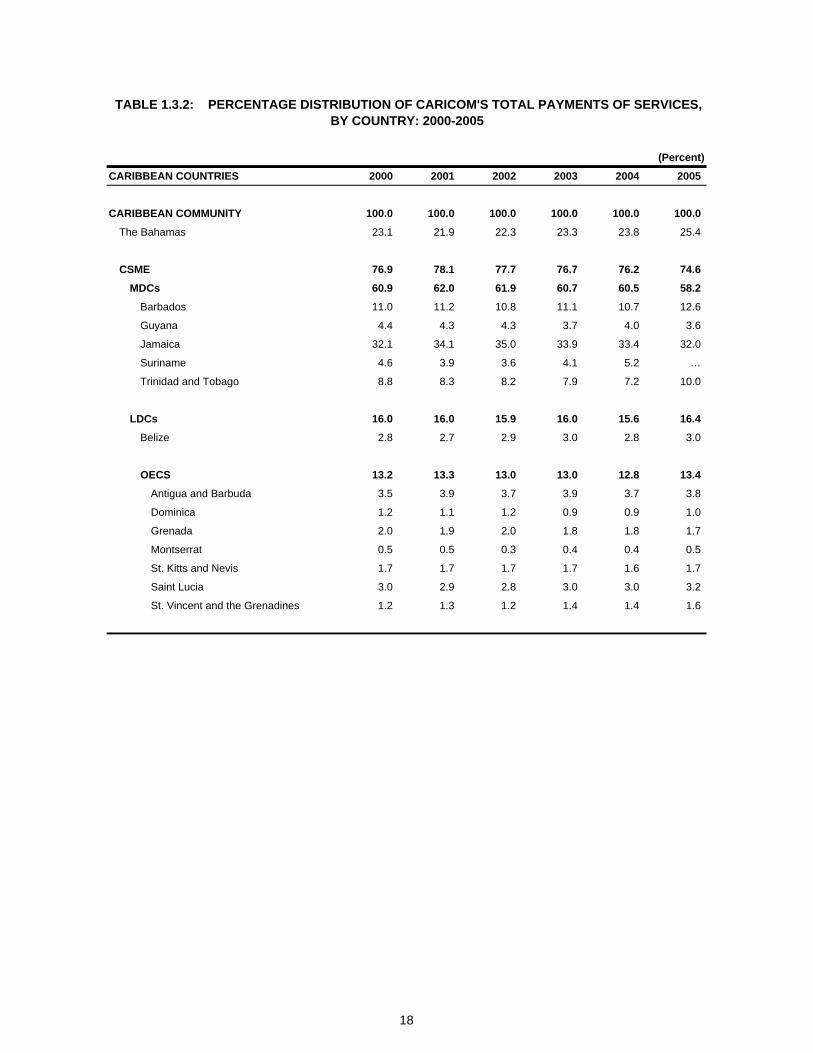
(Percent)
CARIBBEAN COUNTRIES 2000 2001 2002 2003 2004 2005
CARIBBEAN COMMUNITY 100.0 100.0 100.0 100.0 100.0 100.0
The Bahamas 23.1 21.9 22.3 23.3 23.8 25.4
CSME 76.9 78.1 77.7 76.7 76.2 74.6
MDCs 60.9 62.0 61.9 60.7 60.5 58.2
Barbados 11.0 11.2 10.8 11.1 10.7 12.6
Guyana 4.4 4.3 4.3 3.7 4.0 3.6
Jamaica 32.1 34.1 35.0 33.9 33.4 32.0
Suriname 4.6 3.9 3.6 4.1 5.2 …
Trinidad and Tobago 8.8 8.3 8.2 7.9 7.2 10.0
LDCs 16.0 16.0 15.9 16.0 15.6 16.4
Belize 2.8 2.7 2.9 3.0 2.8 3.0
OECS 13.2 13.3 13.0 13.0 12.8 13.4
Antigua and Barbuda 3.5 3.9 3.7 3.9 3.7 3.8
Dominica 1.2 1.1 1.2 0.9 0.9 1.0
Grenada 2.0 1.9 2.0 1.8 1.8 1.7
Montserrat 0.5 0.5 0.3 0.4 0.4 0.5
St. Kitts and Nevis 1.7 1.7 1.7 1.7 1.6 1.7
Saint Lucia 3.0 2.9 2.8 3.0 3.0 3.2
St. Vincent and the Grenadines 1.2 1.3 1.2 1.4 1.4 1.6
TABLE 1.3.2: PERCENTAGE DISTRIBUTION OF CARICOM'S TOTAL PAYMENTS OF SERVICES, BY COUNTRY: 2000-2005
18
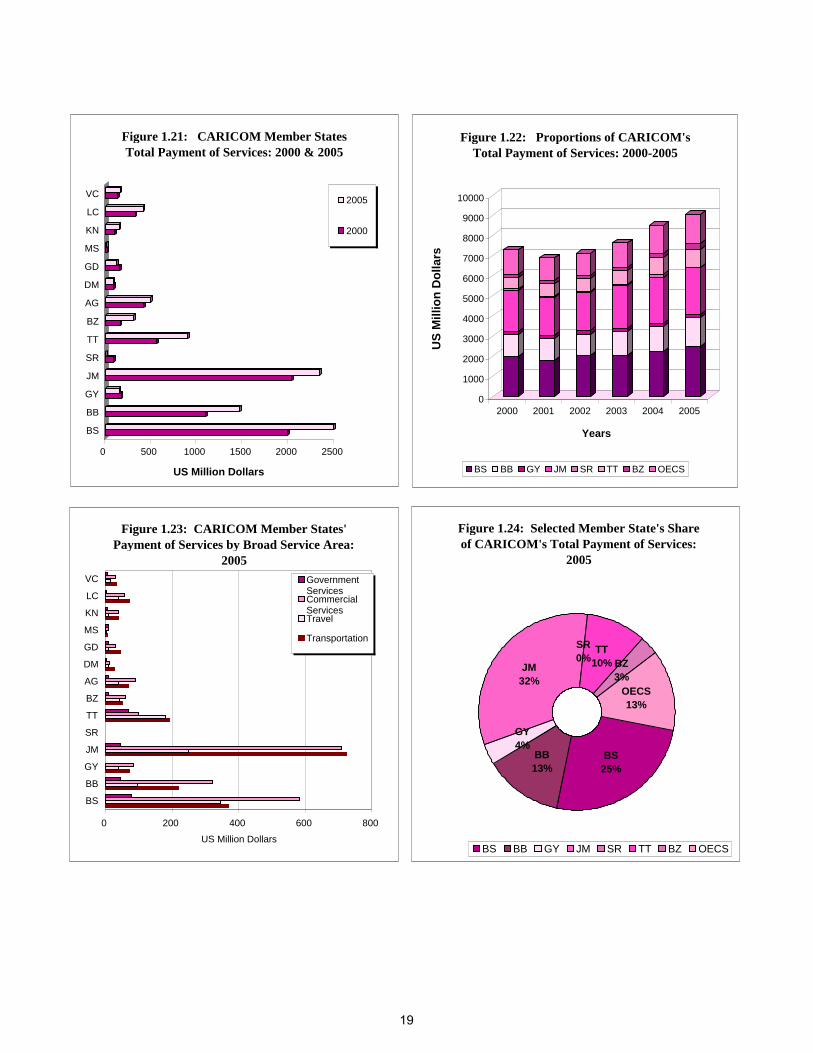
CCBSBBGYJMSRTTBZOECSAGDMGDMSKNLCVC
0
1000
2000
3000
4000
5000
6000
7000
8000
9000
10000
US
Mill
ion
Dol
lars
2000 2001 2002 2003 2004 2005
Years
Figure 1.22: Proportions of CARICOM's Total Payment of Services: 2000-2005
BS BB GY JM SR TT BZ OECS
0 500 1000 1500 2000 2500
US Million Dollars
BS
BB
GY
JM
SR
TT
BZ
AG
DM
GD
MS
KN
LC
VC
Figure 1.21: CARICOM Member States Total Payment of Services: 2000 & 2005
2005
2000
Figure 1.23: CARICOM Member States' Payment of Services by Broad Service Area:
2005
0 200 400 600 800
BS
BB
GY
JM
SR
TT
BZ
AG
DM
GD
MS
KN
LC
VC
US Million Dollars
GovernmentServicesCommercialServicesTravel
Transportation
Figure 1.24: Selected Member State's Share of CARICOM's Total Payment of Services:
2005
BS25%
BB13%
GY4%
JM32%
SR0%
TT10% BZ
3%OECS13%
BS BB GY JM SR TT BZ OECS
19

(US$Mn.)
CARIBBEAN COUNTRIES 2000 2001 2002 2003 2004 2005
CARIBBEAN COMMUNITY 1,555.0 1,508.3 1,507.5 1,637.5 1,814.1 1,918.0
The Bahamas 249.1 254.6 236.4 244.1 304.6 368.6
CSME 1,305.9 1,253.7 1,271.1 1,393.4 1,509.5 1,549.4
MDCs 1,044.4 993.1 1,014.6 1,104.9 1,196.1 1,206.5
Barbados 163.5 156.0 155.3 169.8 197.4 218.3
Guyana 43.3 50.0 55.3 50.7 59.6 71.9
Jamaica 585.2 606.7 614.3 617.9 647.6 724.9
Suriname 79.2 63.8 72.3 105.3 129.1 …
Trinidad and Tobago 173.2 116.6 117.4 161.3 162.3 191.4
LDCs 261.5 260.6 256.5 288.5 313.4 342.9
Belize 36.9 35.8 37.4 39.3 44.3 50.0
OECS 224.6 224.8 219.1 249.2 269.2 293.0
Antigua and Barbuda 56.5 57.8 56.4 61.4 66.1 70.7
Dominica 21.8 20.0 18.5 19.0 21.9 26.8
Grenada 34.3 32.9 30.5 39.2 41.1 45.3
Montserrat 3.7 3.5 4.2 4.5 4.7 4.8
St. Kitts and Nevis 31.6 30.8 31.9 33.4 34.7 38.2
Saint Lucia 53.2 53.9 50.5 62.2 68.3 72.9
St. Vincent and the Grenadines 23.6 26.0 27.1 29.6 32.4 34.4
TABLE 1.3.3: CARICOM'S PAYMENTS OF SERVICES - TRANSPORTATION: 2000-2005
20
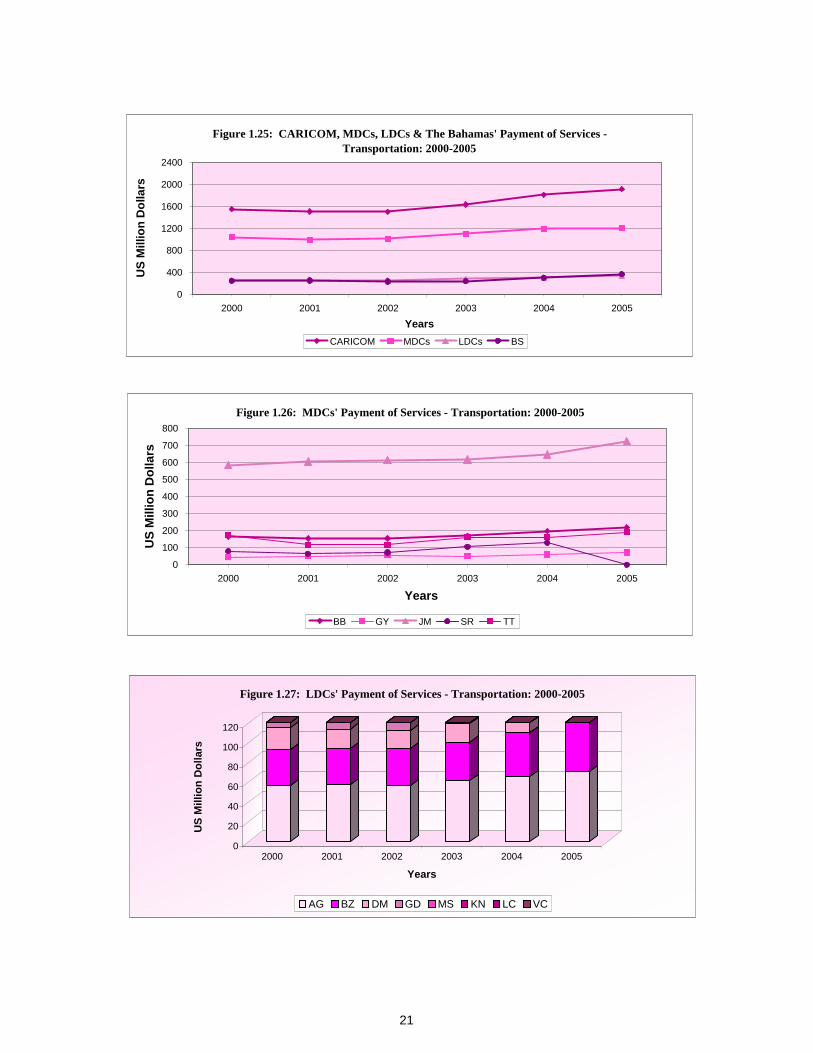
Figure 1.25: CARICOM, MDCs, LDCs & The Bahamas' Payment of Services - Transportation: 2000-2005
0
400
800
1200
1600
2000
2400
2000 2001 2002 2003 2004 2005
Years
US
Mill
ion
Dol
lars
CARICOM MDCs LDCs BS
Figure 1.26: MDCs' Payment of Services - Transportation: 2000-2005
0
100
200
300
400
500
600
700
800
2000 2001 2002 2003 2004 2005
Years
US
Mill
ion
Dol
lars
BB GY JM SR TT
0
20
40
60
80
100
120
US
Mill
ion
Dol
lars
2000 2001 2002 2003 2004 2005
Years
Figure 1.27: LDCs' Payment of Services - Transportation: 2000-2005
AG BZ DM GD MS KN LC VC
21
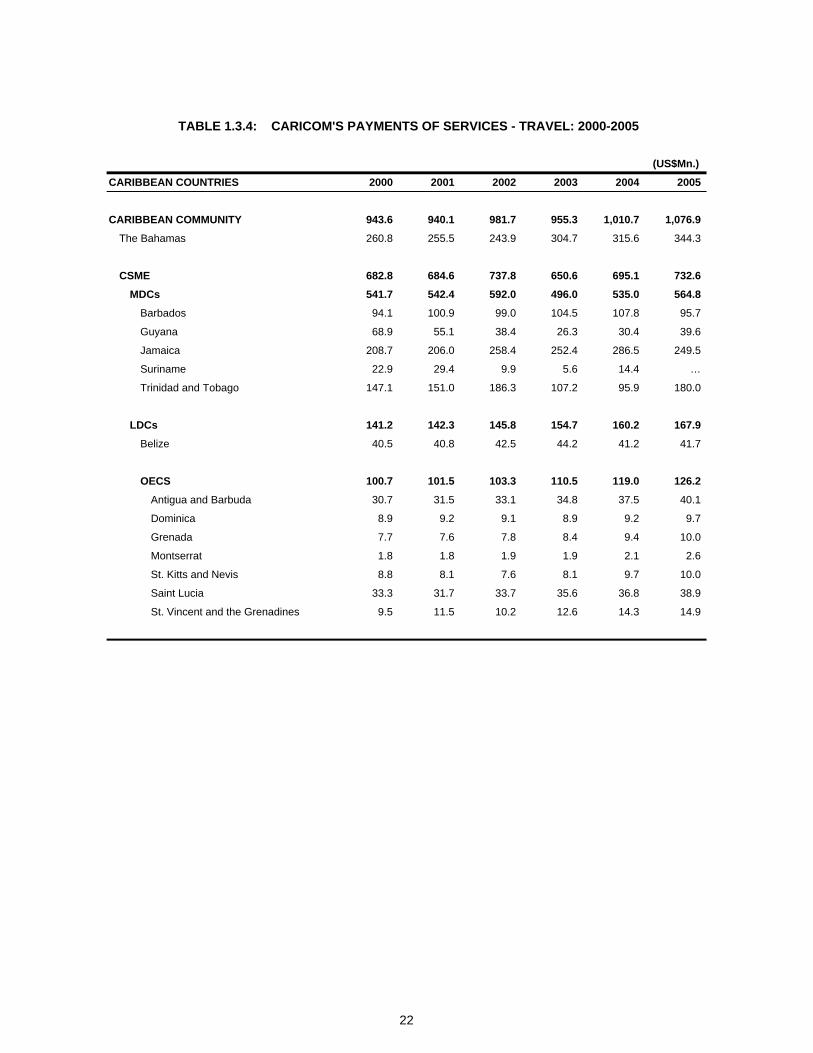
(US$Mn.)
CARIBBEAN COUNTRIES 2000 2001 2002 2003 2004 2005
CARIBBEAN COMMUNITY 943.6 940.1 981.7 955.3 1,010.7 1,076.9
The Bahamas 260.8 255.5 243.9 304.7 315.6 344.3
CSME 682.8 684.6 737.8 650.6 695.1 732.6
MDCs 541.7 542.4 592.0 496.0 535.0 564.8
Barbados 94.1 100.9 99.0 104.5 107.8 95.7
Guyana 68.9 55.1 38.4 26.3 30.4 39.6
Jamaica 208.7 206.0 258.4 252.4 286.5 249.5
Suriname 22.9 29.4 9.9 5.6 14.4 …
Trinidad and Tobago 147.1 151.0 186.3 107.2 95.9 180.0
LDCs 141.2 142.3 145.8 154.7 160.2 167.9
Belize 40.5 40.8 42.5 44.2 41.2 41.7
OECS 100.7 101.5 103.3 110.5 119.0 126.2
Antigua and Barbuda 30.7 31.5 33.1 34.8 37.5 40.1
Dominica 8.9 9.2 9.1 8.9 9.2 9.7
Grenada 7.7 7.6 7.8 8.4 9.4 10.0
Montserrat 1.8 1.8 1.9 1.9 2.1 2.6
St. Kitts and Nevis 8.8 8.1 7.6 8.1 9.7 10.0
Saint Lucia 33.3 31.7 33.7 35.6 36.8 38.9
St. Vincent and the Grenadines 9.5 11.5 10.2 12.6 14.3 14.9
TABLE 1.3.4: CARICOM'S PAYMENTS OF SERVICES - TRAVEL: 2000-2005
22
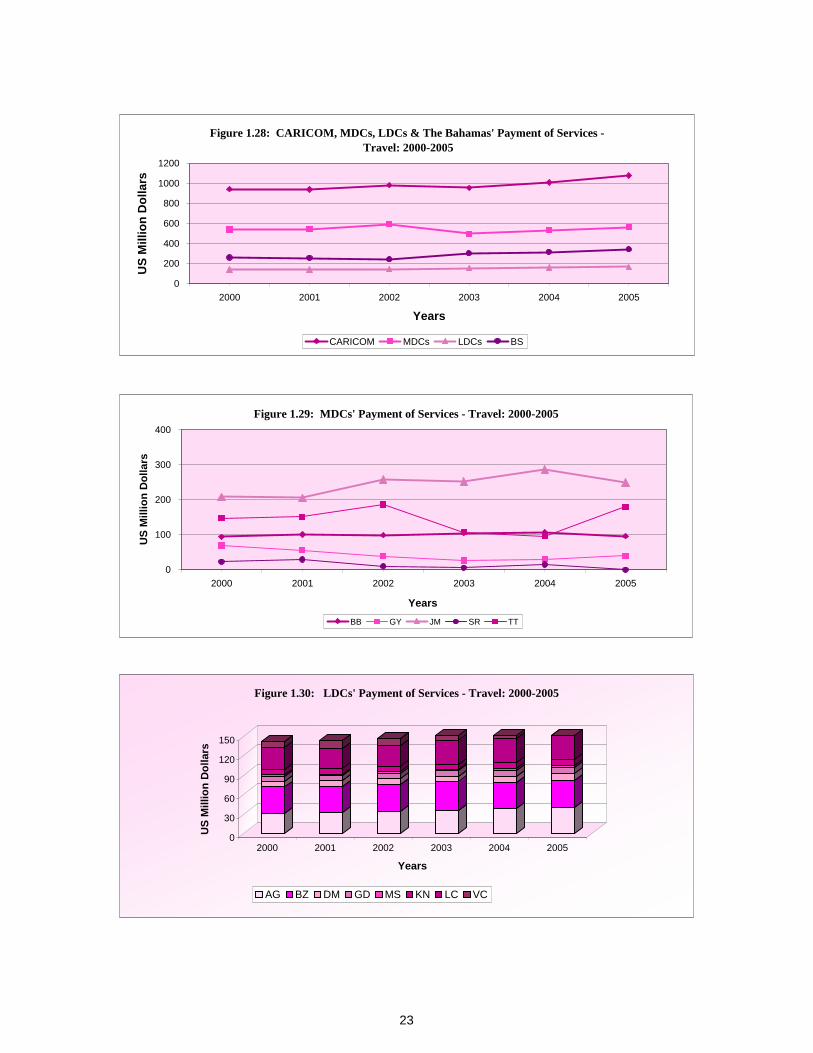
1
2
3
4
5
6
7
8
9
10
11
12
13
1
2
3
4
5
6
7
8
9
10
11
12
13
1
2
3
4
5
6
7
8
9
10
11
12
13
Figure 1.28: CARICOM, MDCs, LDCs & The Bahamas' Payment of Services - Travel: 2000-2005
0
200
400
600
800
1000
1200
2000 2001 2002 2003 2004 2005
Years
US
Mill
ion
Dol
lars
CARICOM MDCs LDCs BS
0
30
60
90
120
150
US
Mill
ion
Dol
lars
2000 2001 2002 2003 2004 2005
Years
Figure 1.30: LDCs' Payment of Services - Travel: 2000-2005
AG BZ DM GD MS KN LC VC
Figure 1.29: MDCs' Payment of Services - Travel: 2000-2005
0
100
200
300
400
2000 2001 2002 2003 2004 2005
Years
US
Mill
ion
Dol
lars
BB GY JM SR TT
23
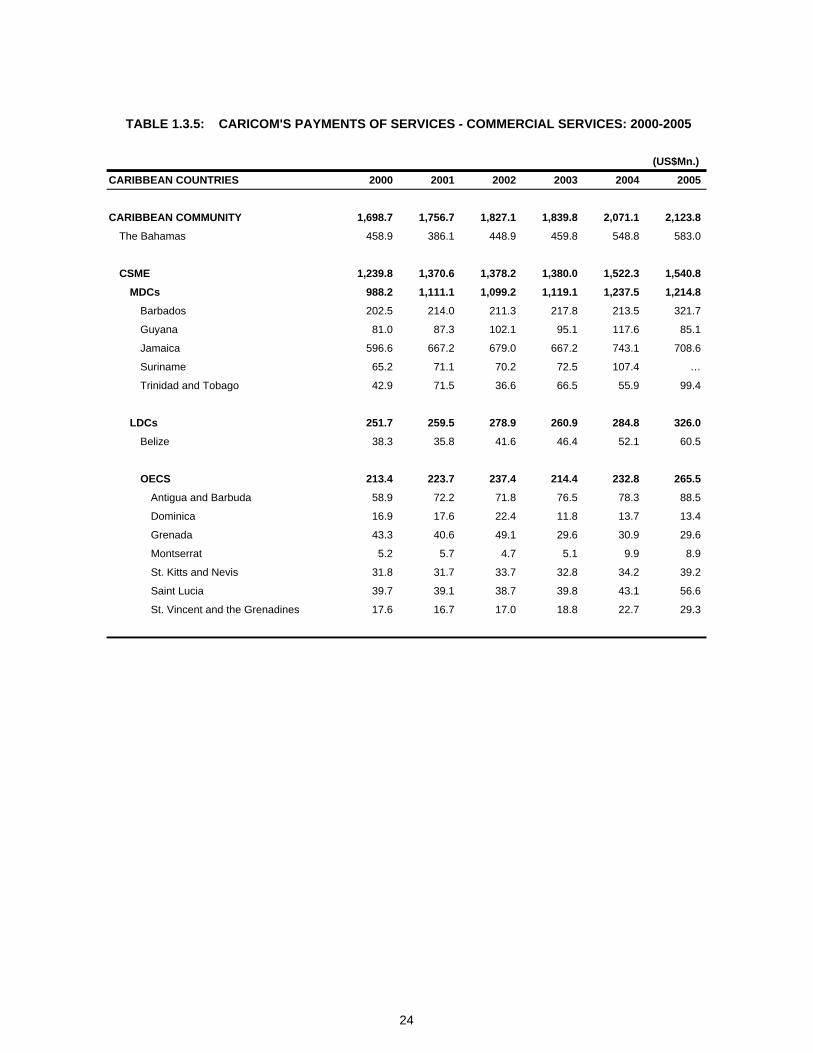
(US$Mn.)
CARIBBEAN COUNTRIES 2000 2001 2002 2003 2004 2005
CARIBBEAN COMMUNITY 1,698.7 1,756.7 1,827.1 1,839.8 2,071.1 2,123.8
The Bahamas 458.9 386.1 448.9 459.8 548.8 583.0
CSME 1,239.8 1,370.6 1,378.2 1,380.0 1,522.3 1,540.8
MDCs 988.2 1,111.1 1,099.2 1,119.1 1,237.5 1,214.8
Barbados 202.5 214.0 211.3 217.8 213.5 321.7
Guyana 81.0 87.3 102.1 95.1 117.6 85.1
Jamaica 596.6 667.2 679.0 667.2 743.1 708.6
Suriname 65.2 71.1 70.2 72.5 107.4 …
Trinidad and Tobago 42.9 71.5 36.6 66.5 55.9 99.4
LDCs 251.7 259.5 278.9 260.9 284.8 326.0
Belize 38.3 35.8 41.6 46.4 52.1 60.5
OECS 213.4 223.7 237.4 214.4 232.8 265.5
Antigua and Barbuda 58.9 72.2 71.8 76.5 78.3 88.5
Dominica 16.9 17.6 22.4 11.8 13.7 13.4
Grenada 43.3 40.6 49.1 29.6 30.9 29.6
Montserrat 5.2 5.7 4.7 5.1 9.9 8.9
St. Kitts and Nevis 31.8 31.7 33.7 32.8 34.2 39.2
Saint Lucia 39.7 39.1 38.7 39.8 43.1 56.6
St. Vincent and the Grenadines 17.6 16.7 17.0 18.8 22.7 29.3
TABLE 1.3.5: CARICOM'S PAYMENTS OF SERVICES - COMMERCIAL SERVICES: 2000-2005
24

1
2
3
4
5
6
7
8
9
10
11
12
13
1
2
3
4
5
6
7
8
9
10
11
12
13
1
2
3
4
5
6
7
8
9
10
11
12
13
Figure 1.31: CARICOM, MDCs, LDCs & The Bahamas' Payment of Services - Commercial Services: 2000-2005
0250500750
100012501500175020002250
2000 2001 2002 2003 2004 2005
Years
US
Mill
ion
Dol
lars
CARICOM MDCs LDCs BS
Figure 1.32: MDCs' Payment of Services - Commercial Services: 2000-2005
0
100
200
300
400
500
600
700
800
2000 2001 2002 2003 2004 2005
Years
US
Mill
ion
Dol
lars
BB GY JM SR TT
0
50
100
150
200
250
300
US
Mill
ion
Dol
lars
2000 2001 2002 2003 2004 2005
Years
Figure 1.33: LDCs' Payment of Services - Commercial Services: 2000-2005
AG BZ DM GD MS KN LC VC
25
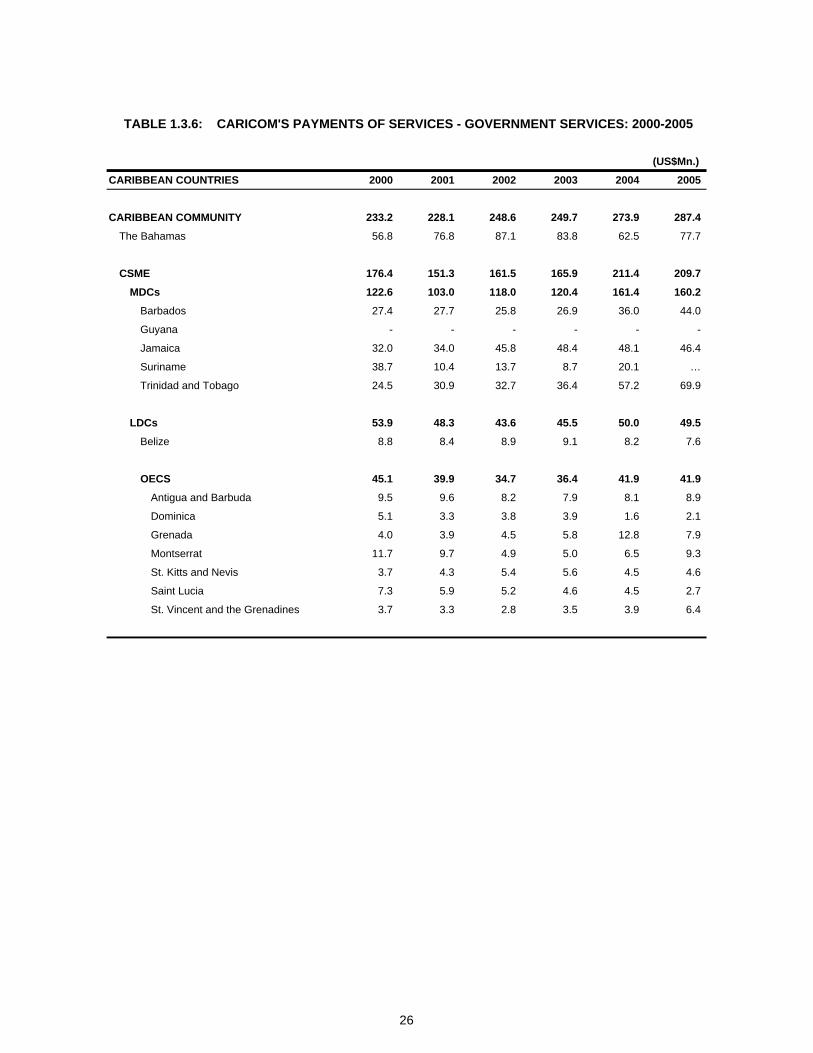
(US$Mn.)
CARIBBEAN COUNTRIES 2000 2001 2002 2003 2004 2005
CARIBBEAN COMMUNITY 233.2 228.1 248.6 249.7 273.9 287.4
The Bahamas 56.8 76.8 87.1 83.8 62.5 77.7
CSME 176.4 151.3 161.5 165.9 211.4 209.7
MDCs 122.6 103.0 118.0 120.4 161.4 160.2
Barbados 27.4 27.7 25.8 26.9 36.0 44.0
Guyana - - - - - -
Jamaica 32.0 34.0 45.8 48.4 48.1 46.4
Suriname 38.7 10.4 13.7 8.7 20.1 …
Trinidad and Tobago 24.5 30.9 32.7 36.4 57.2 69.9
LDCs 53.9 48.3 43.6 45.5 50.0 49.5
Belize 8.8 8.4 8.9 9.1 8.2 7.6
OECS 45.1 39.9 34.7 36.4 41.9 41.9
Antigua and Barbuda 9.5 9.6 8.2 7.9 8.1 8.9
Dominica 5.1 3.3 3.8 3.9 1.6 2.1
Grenada 4.0 3.9 4.5 5.8 12.8 7.9
Montserrat 11.7 9.7 4.9 5.0 6.5 9.3
St. Kitts and Nevis 3.7 4.3 5.4 5.6 4.5 4.6
Saint Lucia 7.3 5.9 5.2 4.6 4.5 2.7
St. Vincent and the Grenadines 3.7 3.3 2.8 3.5 3.9 6.4
TABLE 1.3.6: CARICOM'S PAYMENTS OF SERVICES - GOVERNMENT SERVICES: 2000-2005
26
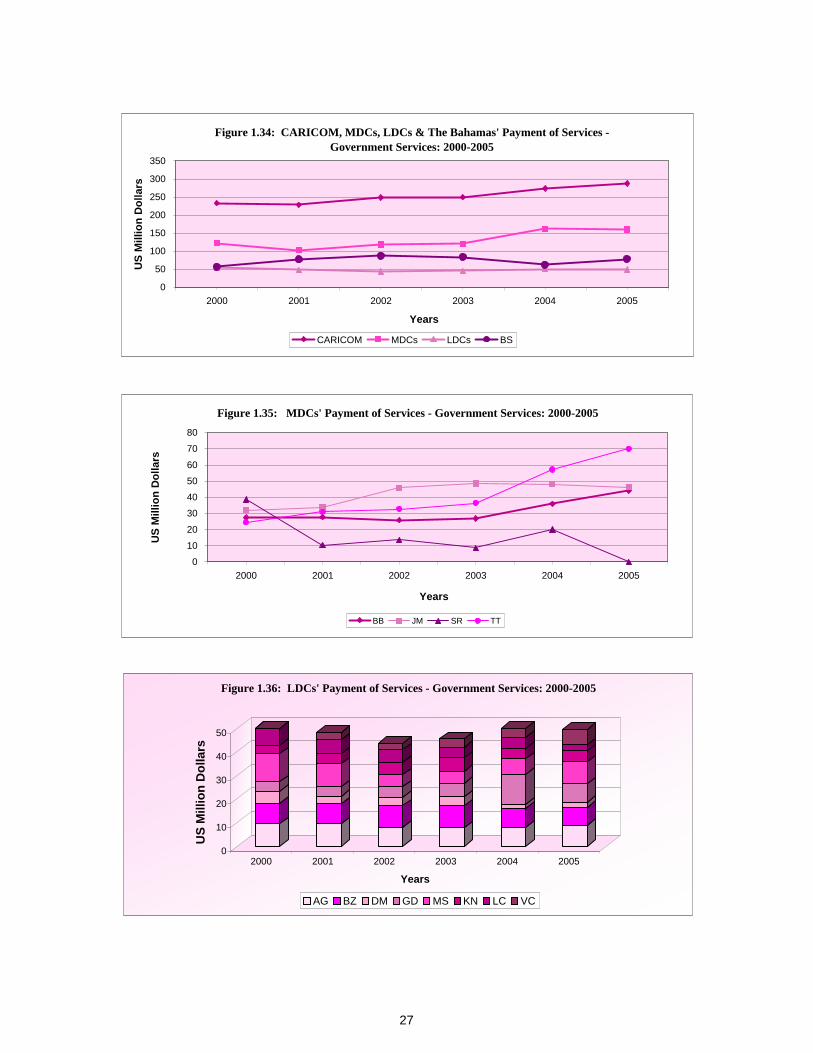
1
2
3
4
5
6
7
8
9
10
11
12
13
1
2
3
4
5
6
7
8
9
10
11
12
13
1
2
3
4
5
6
7
8
9
10
11
12
13
Figure 1.34: CARICOM, MDCs, LDCs & The Bahamas' Payment of Services - Government Services: 2000-2005
0
50
100
150
200
250
300
350
2000 2001 2002 2003 2004 2005
Years
US
Mill
ion
Dol
lars
CARICOM MDCs LDCs BS
0
10
20
30
40
50
US
Mill
ion
Dol
lars
2000 2001 2002 2003 2004 2005
Years
Figure 1.36: LDCs' Payment of Services - Government Services: 2000-2005
AG BZ DM GD MS KN LC VC
Figure 1.35: MDCs' Payment of Services - Government Services: 2000-2005
0
10
20
30
40
50
60
70
80
2000 2001 2002 2003 2004 2005
Years
US
Mill
ion
Dol
lars
BB JM SR TT
27

(US$Mn.)
CARIBBEAN COUNTRIES 2000 2001 2002 2003 2004 2005
CARIBBEAN COMMUNITY 2,853.2 2,458.5 2,549.0 2,958.5 3,322.7 3,631.2
The Bahamas 947.7 831.3 1,045.4 962.3 1,011.0 1,112.3
CSME 1,905.5 1,627.2 1,503.5 1,996.2 2,311.7 2,518.9
MDCs 1,233.2 1,051.0 977.5 1,365.0 1,536.3 1,684.5
Barbados 602.9 570.0 549.9 646.7 659.6 777.6
Guyana -23.9 -20.4 -23.5 -15.3 -44.8 -49.5
Jamaica 603.2 383.1 314.7 552.4 571.7 600.2
Suriname -115.0 -115.3 -127.6 -132.6 -129.7 …
Trinidad and Tobago 166.0 233.6 264.0 313.8 479.5 356.2
LDCs 672.4 576.2 526.0 631.2 775.4 834.3
Belize 33.8 36.5 26.5 39.6 53.5 141.6
OECS 638.6 539.8 499.6 591.6 721.9 692.7
Antigua and Barbuda 259.7 231.0 221.7 238.7 287.3 279.9
Dominica 37.1 25.6 26.0 36.9 41.2 31.4
Grenada 63.6 48.4 41.2 51.0 63.0 23.8
Montserrat -6.2 -6.1 -1.7 -4.4 -8.3 -10.8
St. Kitts and Nevis 22.5 23.0 11.7 27.2 53.0 55.8
Saint Lucia 188.6 142.2 121.1 174.8 214.4 239.0
St. Vincent and the Grenadines 73.3 75.7 79.5 67.5 71.3 73.7
TABLE 1.4.1: CARICOM'S BALANCE OF SERVICES - ALL SERVICES: 2000-2005
28

(US$Mn.)
CARIBBEAN COUNTRIES 2000 2001 2002 2003 2004 2005
CARIBBEAN COMMUNITY -3,939.8 -4,294.5 -4,788.4 -3,760.6 -3,923.0 -3,051.1
The Bahamas -1,518.2 -1,387.3 -1,326.5 -1,330.7 -1,427.5 -1,850.2
CSME -2,421.6 -2,907.2 -3,461.8 -2,429.9 -2,495.5 -1,200.9
MDCs -1,247.0 -1,707.4 -2,334.9 -1,268.8 -1,209.2 220.8
Barbados -714.1 -743.9 -681.1 -702.0 -801.4 -971.0
Guyana -47.2 -55.6 -23.8 -17.3 -14.1 -174.3
Jamaica -1,441.5 -1,618.2 -1,870.5 -1,942.6 -1,944.5 -2,581.6
Suriname -13.0 -7.8 2.8 99.9 42.1 …
Trinidad and Tobago 968.8 718.1 237.7 1,293.2 1,508.7 3,947.7
LDCs -1,174.6 -1,199.8 -1,126.9 -1,161.1 -1,286.3 -1,421.8
Belize -196.6 -208.7 -187.2 -206.8 -173.8 -237.8
OECS -978.0 -991.1 -939.7 -954.3 -1,112.4 -1,184.0
Antigua and Barbuda -315.3 -290.0 -280.5 -296.3 -308.5 -323.6
Dominica -65.6 -75.6 -71.3 -59.4 -64.5 -84.9
Grenada -110.3 -138.0 -133.2 -139.4 -180.9 -201.9
Montserrat -18.1 -17.9 -16.1 -20.4 -22.2 -20.5
St. Kitts and Nevis -90.2 -121.2 -111.6 -114.5 -123.1 -118.0
Saint Lucia -251.1 -255.7 -217.8 -207.5 -275.6 -275.5
St. Vincent and the Grenadines -127.4 -92.6 -109.2 -116.5 -137.6 -159.7
Balances
TABLE 1.4.2: CARICOM'S MERCHANDISE TRADE BALANCE: 2000-2005
29

CARIBBEAN COMMUNITY Goods & Se (1,086.5) (1,836.0) (2,239.4) (802.1) (600.3) 580.0
MDC's Goods & Services (13.8) (656.4) (1,357.4) 96.2 327.1 1,905.4
LDC's Goods & Services (502.2) (623.5) (600.9) (529.9) (510.9) (587.4)
1.0
2.0
3.0
4.0
5.0
6.0
7.0
8.0
9.0
10.0
11.0
12.0
13.0
1.0
2.0
3.0
4.0
5.0
6.0
7.0
8.0
9.0
10.0
11.0
12.0
1
1.0
2.0
3.0
4.0
5.0
6.0
7.0
8.0
9.0
10.0
11.0
12.0
13.0
Figure 1.37: CARICOM's Balances of Goods and Services: 2000-2005
-6000
-4000
-2000
0
2000
4000
6000
2000 2001 2002 2003 2004 2005Years
US
Mill
ion
Dol
lars
Services Goods Goods & Services
Figure 1.39: LDCs' Balances of Goods and Services: 2000-2005
-1600
-1200
-800
-400
0
400
800
1200
2000 2001 2002 2003 2004 2005Years
US
Mill
ion
Dol
lars
Services Goods Goods & Services
Figure 1.38: MDCs' Balances of Goods and Services: 2000-2005
-3000
-2000
-1000
0
1000
2000
3000
2000 2001 2002 2003 2004 2005Years
US
Mill
ion
Dol
lars
Services Goods Goods & Services
30

(US$Mn.)
CARIBBEAN COUNTRIES 2000 2001 2002 2003 2004 2005
CARIBBEAN COMMUNITY -769.3 -715.0 -684.0 -654.8 -723.7 -989.8
The Bahamas -194.6 -204.5 -178.9 -187.4 -249.3 -312.9
CSME -574.8 -510.6 -505.1 -467.4 -474.4 -676.9
MDCs -439.2 -384.8 -389.9 -328.0 -321.6 -507.3
Barbados -138.8 -133.6 -134.3 -146.6 -171.5 -193.0
Guyana -36.1 -40.8 -46.0 -44.0 -52.4 -64.3
Jamaica -256.6 -256.2 -245.6 -143.6 -150.3 -273.9
Suriname -42.0 -44.9 -49.1 -79.0 -79.8 …
Trinidad and Tobago 34.3 90.7 85.1 85.2 132.4 23.8
LDCs -135.6 -125.8 -115.2 -139.4 -152.8 -169.5
Belize -26.1 -24.0 -19.3 -17.1 -16.9 -20.3
OECS -109.5 -101.8 -95.9 -122.3 -135.9 -149.3
Antigua and Barbuda 9.2 16.9 20.3 19.2 13.7 14.0
Dominica -14.7 -13.9 -13.0 -14.0 -15.9 -22.8
Grenada -28.5 -24.7 -22.6 -30.2 -31.8 -34.0
Montserrat -2.5 -2.1 -2.8 -3.0 -3.3 -3.4
St. Kitts and Nevis -21.1 -19.4 -21.9 -24.1 -24.9 -27.8
Saint Lucia -39.9 -42.1 -39.6 -50.7 -53.0 -51.2
St. Vincent and the Grenadines -12.1 -16.4 -16.2 -19.4 -20.7 -23.9
TABLE 1.4.3: CARICOM'S BALANCE OF SERVICES - TRANSPORTATION: 2000-2005
31
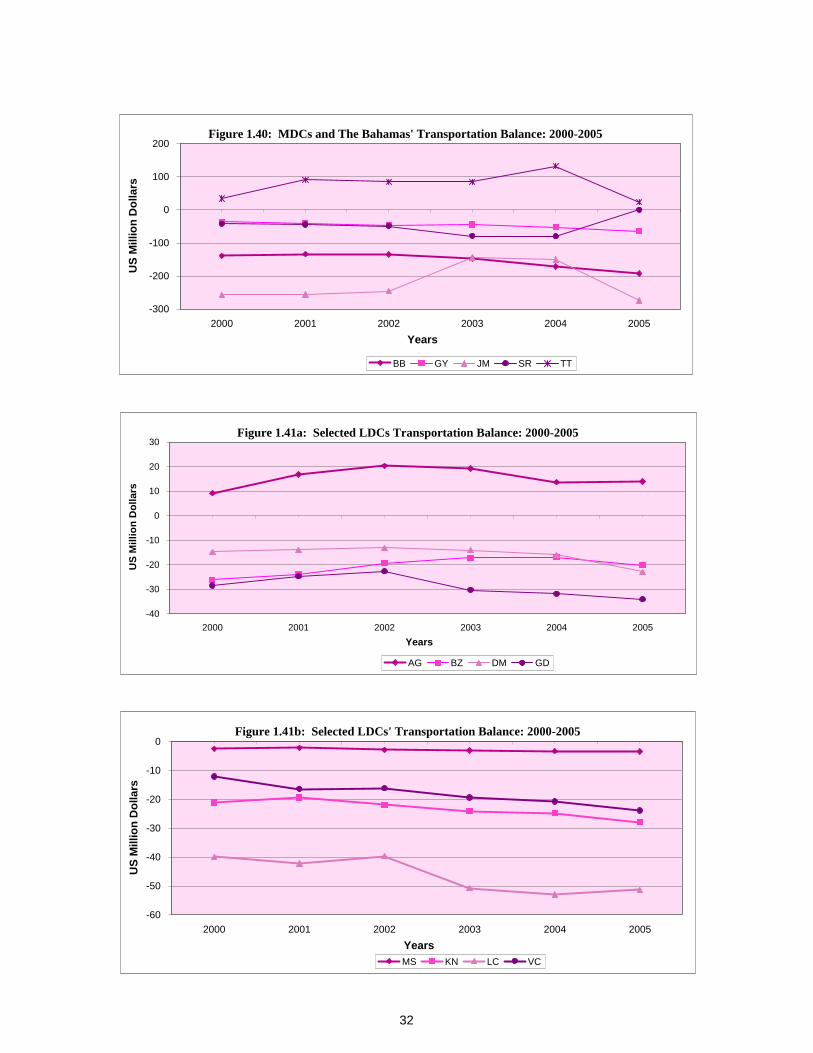
Figure 1.40: MDCs and The Bahamas' Transportation Balance: 2000-2005
-300
-200
-100
0
100
200
2000 2001 2002 2003 2004 2005Years
US
Mill
ion
Dol
lars
BB GY JM SR TT
Figure 1.41b: Selected LDCs' Transportation Balance: 2000-2005
-60
-50
-40
-30
-20
-10
0
2000 2001 2002 2003 2004 2005Years
US
Mill
ion
Dol
lars
MS KN LC VC
Figure 1.41a: Selected LDCs Transportation Balance: 2000-2005
-40
-30
-20
-10
0
10
20
30
2000 2001 2002 2003 2004 2005Years
US
Mill
ion
Dol
lars
AG BZ DM GD
32

(US$Mn.)
CARIBBEAN COUNTRIES 2000 2001 2002 2003 2004 2005
CARIBBEAN COMMUNITY 4,129.3 3,810.0 3,820.1 4,225.7 4,621.5 5,178.0
The Bahamas 1,477.1 1,392.2 1,515.9 1,452.7 1,568.9 1,724.8
CSME 2,652.2 2,417.8 2,304.1 2,773.0 3,052.6 3,453.2
MDCs 1,817.6 1,662.9 1,569.3 1,895.6 2,064.1 2,365.1
Barbados 628.9 596.4 558.9 653.4 667.7 801.0
Guyana 6.2 5.4 10.9 -0.5 -3.3 -4.5
Jamaica 1,123.9 1,026.2 950.3 1,102.7 1,151.5 1,295.6
Suriname -7.1 -15.0 -6.5 -1.7 2.6 …
Trinidad and Tobago 65.7 49.9 55.7 141.7 245.6 273.0
LDCs 834.6 754.9 734.8 877.4 988.5 1,088.1
Belize 75.7 62.2 60.4 73.0 91.8 172.0
OECS 758.9 692.8 674.5 804.4 896.7 916.1
Antigua and Barbuda 259.8 240.5 240.7 265.0 300.2 294.9
Dominica 39.3 37.2 36.6 46.5 51.5 45.9
Grenada 84.8 75.9 83.7 95.3 74.1 61.4
Montserrat 7.2 6.7 6.8 5.4 7.1 6.4
St. Kitts and Nevis 49.6 53.8 49.5 67.2 93.7 100.3
Saint Lucia 245.3 201.3 176.3 246.4 288.8 317.1
St. Vincent and the Grenadines 72.8 77.5 80.8 78.5 81.3 90.2
TABLE 1.4.4: CARICOM'S BALANCE OF SERVICES - TRAVEL: 2000-2005
33
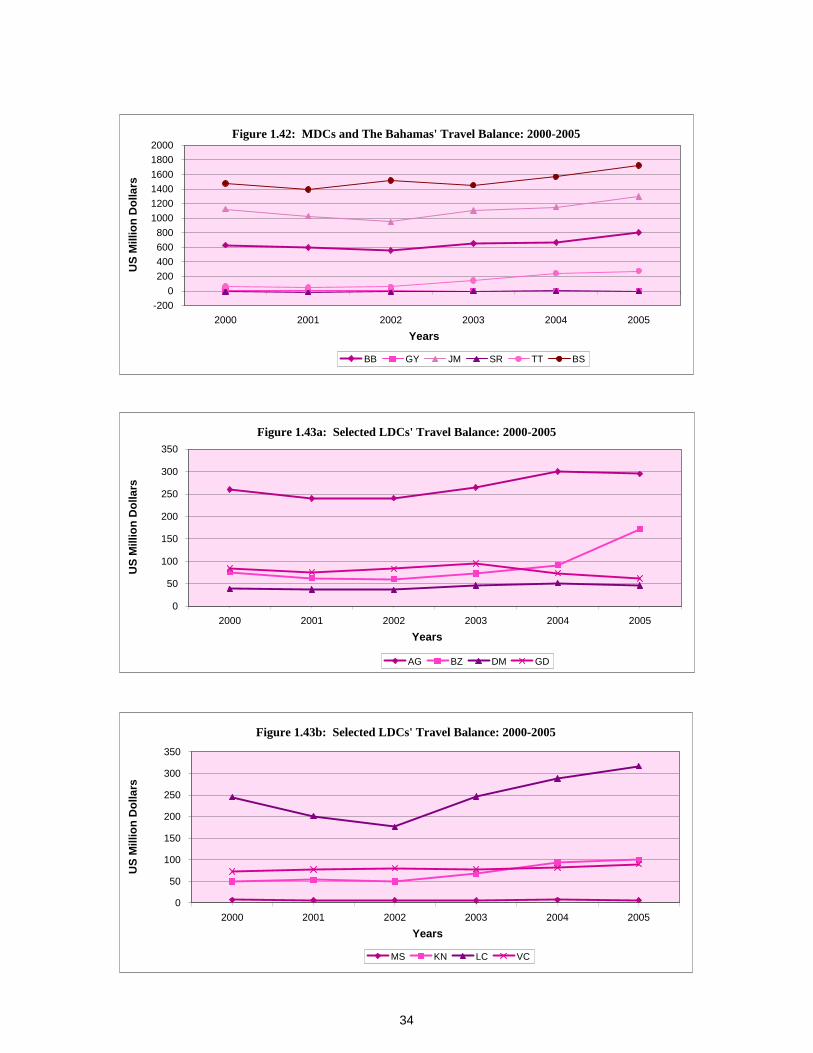
Figure 1.42: MDCs and The Bahamas' Travel Balance: 2000-2005
-2000
200400600800
100012001400160018002000
2000 2001 2002 2003 2004 2005Years
US
Mill
ion
Dol
lars
BB GY JM SR TT BS
Figure 1.43a: Selected LDCs' Travel Balance: 2000-2005
0
50
100
150
200
250
300
350
2000 2001 2002 2003 2004 2005Years
US
Mill
ion
Dol
lars
AG BZ DM GD
Figure 1.43b: Selected LDCs' Travel Balance: 2000-2005
0
50
100
150
200
250
300
350
2000 2001 2002 2003 2004 2005Years
US
Mill
ion
Dol
lars
MS KN LC VC
34
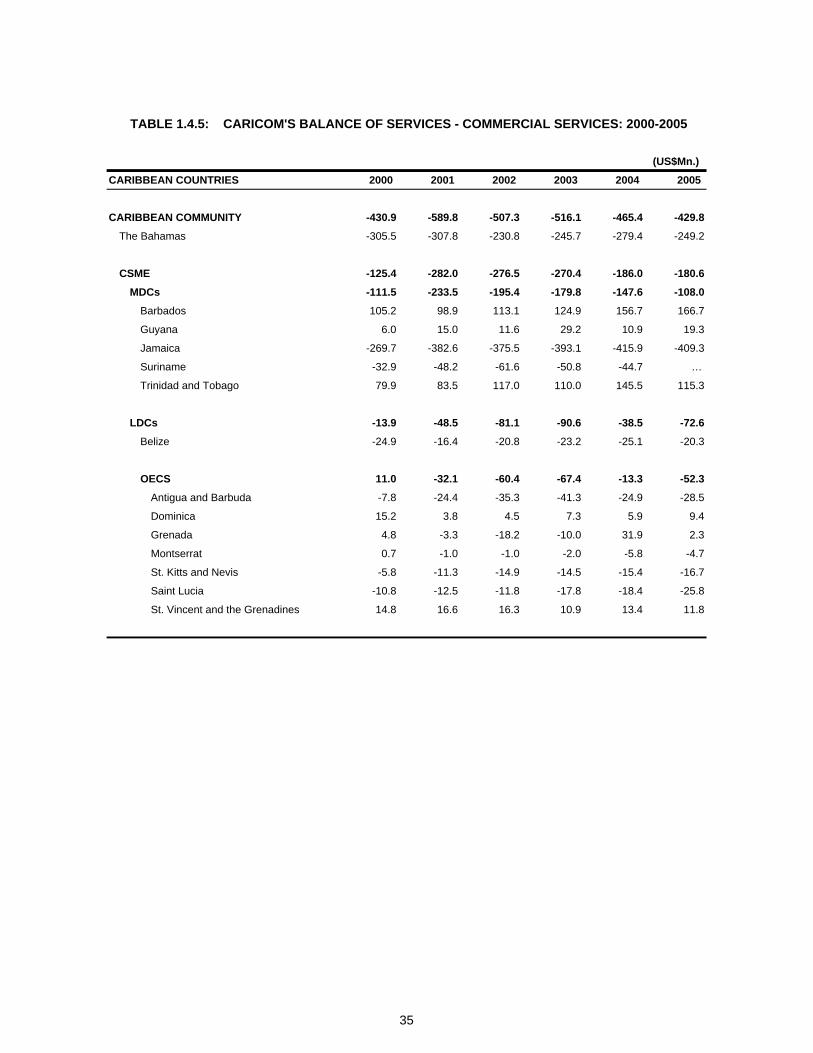
(US$Mn.)
CARIBBEAN COUNTRIES 2000 2001 2002 2003 2004 2005
CARIBBEAN COMMUNITY -430.9 -589.8 -507.3 -516.1 -465.4 -429.8
The Bahamas -305.5 -307.8 -230.8 -245.7 -279.4 -249.2
CSME -125.4 -282.0 -276.5 -270.4 -186.0 -180.6
MDCs -111.5 -233.5 -195.4 -179.8 -147.6 -108.0
Barbados 105.2 98.9 113.1 124.9 156.7 166.7
Guyana 6.0 15.0 11.6 29.2 10.9 19.3
Jamaica -269.7 -382.6 -375.5 -393.1 -415.9 -409.3
Suriname -32.9 -48.2 -61.6 -50.8 -44.7 …
Trinidad and Tobago 79.9 83.5 117.0 110.0 145.5 115.3
LDCs -13.9 -48.5 -81.1 -90.6 -38.5 -72.6
Belize -24.9 -16.4 -20.8 -23.2 -25.1 -20.3
OECS 11.0 -32.1 -60.4 -67.4 -13.3 -52.3
Antigua and Barbuda -7.8 -24.4 -35.3 -41.3 -24.9 -28.5
Dominica 15.2 3.8 4.5 7.3 5.9 9.4
Grenada 4.8 -3.3 -18.2 -10.0 31.9 2.3
Montserrat 0.7 -1.0 -1.0 -2.0 -5.8 -4.7
St. Kitts and Nevis -5.8 -11.3 -14.9 -14.5 -15.4 -16.7
Saint Lucia -10.8 -12.5 -11.8 -17.8 -18.4 -25.8
St. Vincent and the Grenadines 14.8 16.6 16.3 10.9 13.4 11.8
TABLE 1.4.5: CARICOM'S BALANCE OF SERVICES - COMMERCIAL SERVICES: 2000-2005
35

Figure 1.44: MDCs and The Bahamas' Commercial Services Balance: 2000-2005
-500
-400
-300
-200
-100
0
100
200
2000 2001 2002 2003 2004 2005Years
US
Mill
ion
Dol
lars
BB GY JM SR TT BS
Figure 1.45a: Selected LDCs' Commercial Services Balance: 2000-2005
-15
-10
-5
0
5
10
15
20
2000 2001 2002 2003 2004 2005Years
US
Mill
ion
Dol
lars
AG BZ DM GD
Figure 1.45b: Selected LDCs' Commercial Services Balance: 2000-2005
-30
-25
-20
-15
-10
-5
0
5
10
15
20
2000 2001 2002 2003 2004 2005Years
US
Mill
ion
Dol
lars
MS KN LC VC
36

(US$Mn.)
CARIBBEAN COUNTRIES 2000 2001 2002 2003 2004 2005
CARIBBEAN COMMUNITY -75.9 -46.6 -79.7 -96.3 -109.7 -127.3
The Bahamas -29.4 -48.6 -60.8 -57.3 -29.2 -50.4
CSME -46.5 2.0 -18.9 -39.0 -80.5 -76.9
MDCs -33.7 6.4 -6.5 -22.9 -58.7 -65.3
Barbados 7.6 8.4 12.2 15.0 6.6 2.9
Guyana 0.0 0.0 0.0 0.0 0.0 0.0
Jamaica 5.6 -4.3 -14.5 -13.6 -13.5 -12.2
Suriname -33.0 -7.2 -10.4 -1.1 -7.8 …
Trinidad and Tobago -13.9 9.5 6.2 -23.1 -44.0 -55.9
LDCs -12.7 -4.4 -12.4 -16.2 -21.8 -11.7
Belize 9.0 14.7 6.2 7.0 3.7 10.2
OECS -21.7 -19.1 -18.6 -23.2 -25.5 -21.8
Antigua and Barbuda -1.5 -2.0 -4.0 -4.3 -1.7 -0.5
Dominica -2.7 -1.6 -2.0 -2.9 -0.2 -1.1
Grenada 2.4 0.5 -1.6 -4.1 -11.1 -5.8
Montserrat -11.5 -9.6 -4.7 -4.8 -6.3 -9.0
St. Kitts and Nevis -0.2 -0.1 -1.1 -1.4 -0.5 0.0
Saint Lucia -6.0 -4.5 -3.7 -3.2 -3.0 -1.0
St. Vincent and the Grenadines -2.2 -1.9 -1.4 -2.5 -2.7 -4.4
TABLE 1.4.6: CARICOM'S BALANCE OF SERVICES - GOVERNMENT SERVICES: 2000-2005
37
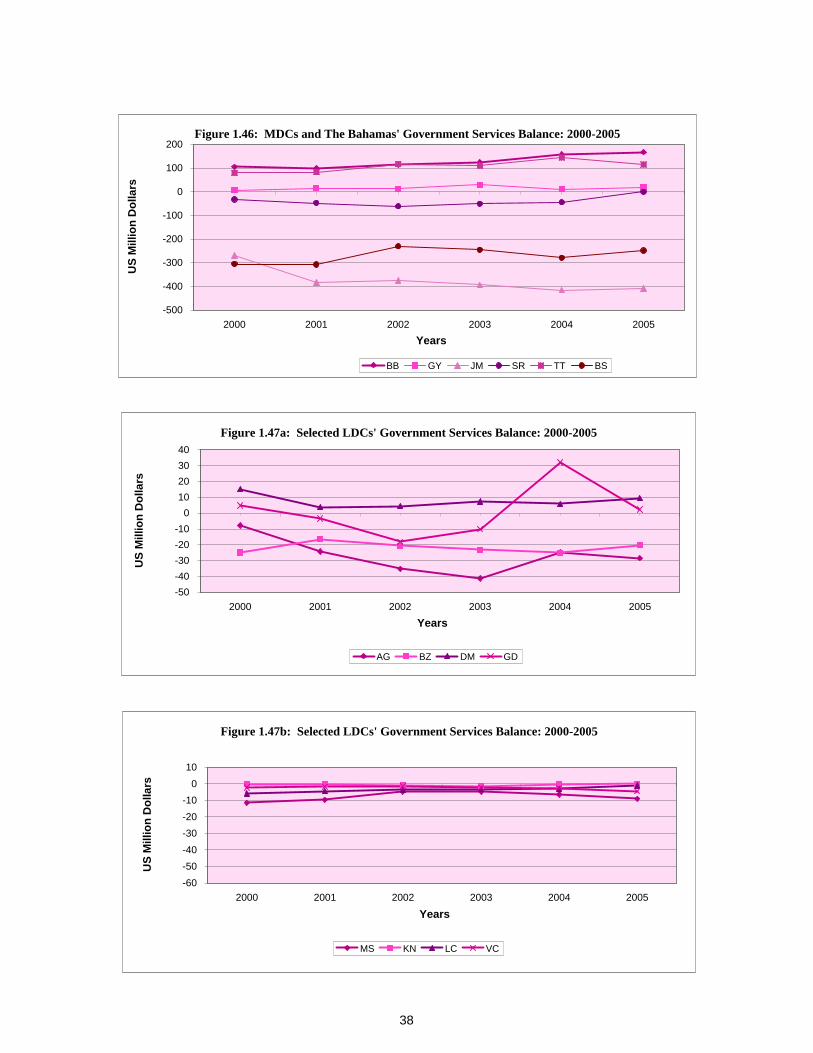
Figure 1.46: MDCs and The Bahamas' Government Services Balance: 2000-2005
-500
-400
-300
-200
-100
0
100
200
2000 2001 2002 2003 2004 2005Years
US
Mill
ion
Dol
lars
BB GY JM SR TT BS
Figure 1.47a: Selected LDCs' Government Services Balance: 2000-2005
-50-40-30-20-10
010203040
2000 2001 2002 2003 2004 2005
Years
US
Mill
ion
Dol
lars
AG BZ DM GD
Figure 1.47b: Selected LDCs' Government Services Balance: 2000-2005
-60-50-40-30-20-10
010
2000 2001 2002 2003 2004 2005
Years
US
Mill
ion
Dol
lars
MS KN LC VC
38
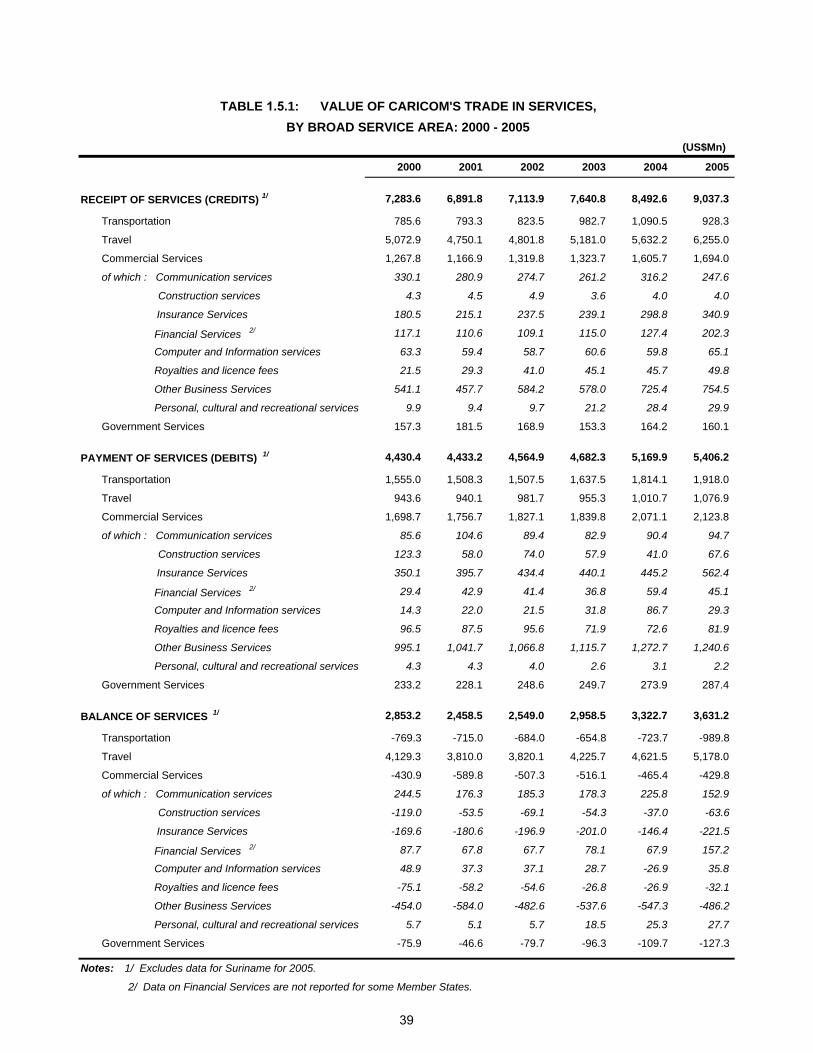
(US$Mn)
2000 2001 2002 2003 2004 2005
RECEIPT OF SERVICES (CREDITS) 1/ 7,283.6 6,891.8 7,113.9 7,640.8 8,492.6 9,037.3
Transportation 785.6 793.3 823.5 982.7 1,090.5 928.3
Travel 5,072.9 4,750.1 4,801.8 5,181.0 5,632.2 6,255.0
Commercial Services 1,267.8 1,166.9 1,319.8 1,323.7 1,605.7 1,694.0
of which : Communication services 330.1 280.9 274.7 261.2 316.2 247.6
Construction services 4.3 4.5 4.9 3.6 4.0 4.0
Insurance Services 180.5 215.1 237.5 239.1 298.8 340.9
Financial Services 2/ 117.1 110.6 109.1 115.0 127.4 202.3
Computer and Information services 63.3 59.4 58.7 60.6 59.8 65.1
Royalties and licence fees 21.5 29.3 41.0 45.1 45.7 49.8
Other Business Services 541.1 457.7 584.2 578.0 725.4 754.5
Personal, cultural and recreational services 9.9 9.4 9.7 21.2 28.4 29.9
Government Services 157.3 181.5 168.9 153.3 164.2 160.1
PAYMENT OF SERVICES (DEBITS) 1/ 4,430.4 4,433.2 4,564.9 4,682.3 5,169.9 5,406.2
Transportation 1,555.0 1,508.3 1,507.5 1,637.5 1,814.1 1,918.0
Travel 943.6 940.1 981.7 955.3 1,010.7 1,076.9
Commercial Services 1,698.7 1,756.7 1,827.1 1,839.8 2,071.1 2,123.8
of which : Communication services 85.6 104.6 89.4 82.9 90.4 94.7
Construction services 123.3 58.0 74.0 57.9 41.0 67.6
Insurance Services 350.1 395.7 434.4 440.1 445.2 562.4
Financial Services 2/ 29.4 42.9 41.4 36.8 59.4 45.1
Computer and Information services 14.3 22.0 21.5 31.8 86.7 29.3
Royalties and licence fees 96.5 87.5 95.6 71.9 72.6 81.9
Other Business Services 995.1 1,041.7 1,066.8 1,115.7 1,272.7 1,240.6
Personal, cultural and recreational services 4.3 4.3 4.0 2.6 3.1 2.2
Government Services 233.2 228.1 248.6 249.7 273.9 287.4
BALANCE OF SERVICES 1/ 2,853.2 2,458.5 2,549.0 2,958.5 3,322.7 3,631.2
Transportation -769.3 -715.0 -684.0 -654.8 -723.7 -989.8
Travel 4,129.3 3,810.0 3,820.1 4,225.7 4,621.5 5,178.0
Commercial Services -430.9 -589.8 -507.3 -516.1 -465.4 -429.8
of which : Communication services 244.5 176.3 185.3 178.3 225.8 152.9
Construction services -119.0 -53.5 -69.1 -54.3 -37.0 -63.6
Insurance Services -169.6 -180.6 -196.9 -201.0 -146.4 -221.5
Financial Services 2/ 87.7 67.8 67.7 78.1 67.9 157.2
Computer and Information services 48.9 37.3 37.1 28.7 -26.9 35.8
Royalties and licence fees -75.1 -58.2 -54.6 -26.8 -26.9 -32.1
Other Business Services -454.0 -584.0 -482.6 -537.6 -547.3 -486.2
Personal, cultural and recreational services 5.7 5.1 5.7 18.5 25.3 27.7
Government Services -75.9 -46.6 -79.7 -96.3 -109.7 -127.3
Notes: 1/ Excludes data for Suriname for 2005.
2/ Data on Financial Services are not reported for some Member States.
BY BROAD SERVICE AREA: 2000 - 2005TABLE 1.5.1: VALUE OF CARICOM'S TRADE IN SERVICES,
39

(Per cent)
2000 2001 2002 2003 2004 2005
RECEIPT OF SERVICES (CREDITS) 1/ 100.0 100.0 100.0 100.0 100.0 100.0
Transportation 10.8 11.5 11.6 12.9 12.8 10.3
Travel 69.6 68.9 67.5 67.8 66.3 69.2
Commercial Services 17.4 16.9 18.6 17.3 18.9 18.7
of which : Communication services 4.5 4.1 3.9 3.4 3.7 2.7
Construction services 0.1 0.1 0.1 0.0 0.0 0.0
Insurance Services 2.5 3.1 3.3 3.1 3.5 3.8
Financial Services 2/ 1.6 1.6 1.5 1.5 1.5 2.2
Computer and Information services 0.9 0.9 0.8 0.8 0.7 0.7
Royalties and licence fees 0.3 0.4 0.6 0.6 0.5 0.6
Other Business Services 7.4 6.6 8.2 7.6 8.5 8.3
Personal, cultural and recreational services 0.1 0.1 0.1 0.3 0.3 0.3
Government Services 2.2 2.6 2.4 2.0 1.9 1.8
PAYMENT OF SERVICES (DEBITS) 1/ 100.0 100.0 100.0 100.0 100.0 100.0
Transportation 35.1 34.0 33.0 35.0 35.1 35.5
Travel 21.3 21.2 21.5 20.4 19.6 19.9
Commercial Services 38.3 39.6 40.0 39.3 40.1 39.3
of which : Communication services 1.9 2.4 2.0 1.8 1.7 1.8
Construction services 2.8 1.3 1.6 1.2 0.8 1.3
Insurance Services 7.9 8.9 9.5 9.4 8.6 10.4
Financial Services 2/ 0.7 1.0 0.9 0.8 1.1 0.8
Computer and Information services 0.3 0.5 0.5 0.7 1.7 0.5
Royalties and licence fees 2.2 2.0 2.1 1.5 1.4 1.5
Other Business Services 22.5 23.5 23.4 23.8 24.6 22.9
Personal, cultural and recreational services 0.1 0.1 0.1 0.1 0.1 0.0
Government Services 5.3 5.1 5.4 5.3 5.3 5.3
TABLE 1.5.2: PERCENTAGE DISTRIBUTION OF CARICOM'S TRADE IN SERVICES,BY BROAD SERVICE AREA: 2000 - 2005
40

Figure 1.48: CARICOM's Trade in Services -Receipt, Payment and Balance of Services: 2000-2005
0100020003000400050006000700080009000
10000
2000 2001 2002 2003 2004 2005
Years
US
Mill
ion
Dol
lars
Receipt of Services Payment of Services Trade Balance
0100020003000400050006000700080009000
10000
US
Mill
ion
Dol
lars
2000 2001 2002 2003 2004 2005
Years
Figure 1.49: CARICOM's Receipt of Services: 2000-2005
Transportation Travel Commercial Services Government Services
0500
1000150020002500300035004000450050005500
US
Mill
ion
Dol
lars
2000 2001 2002 2003 2004 2005
Years
Figure 1.50: CARICOM's Payment of Services: 2000-2005
Transportation Travel Commercial Services Government Services
41

Section 2
CARICOM Member States’ Trade in Services by Broad Service Area

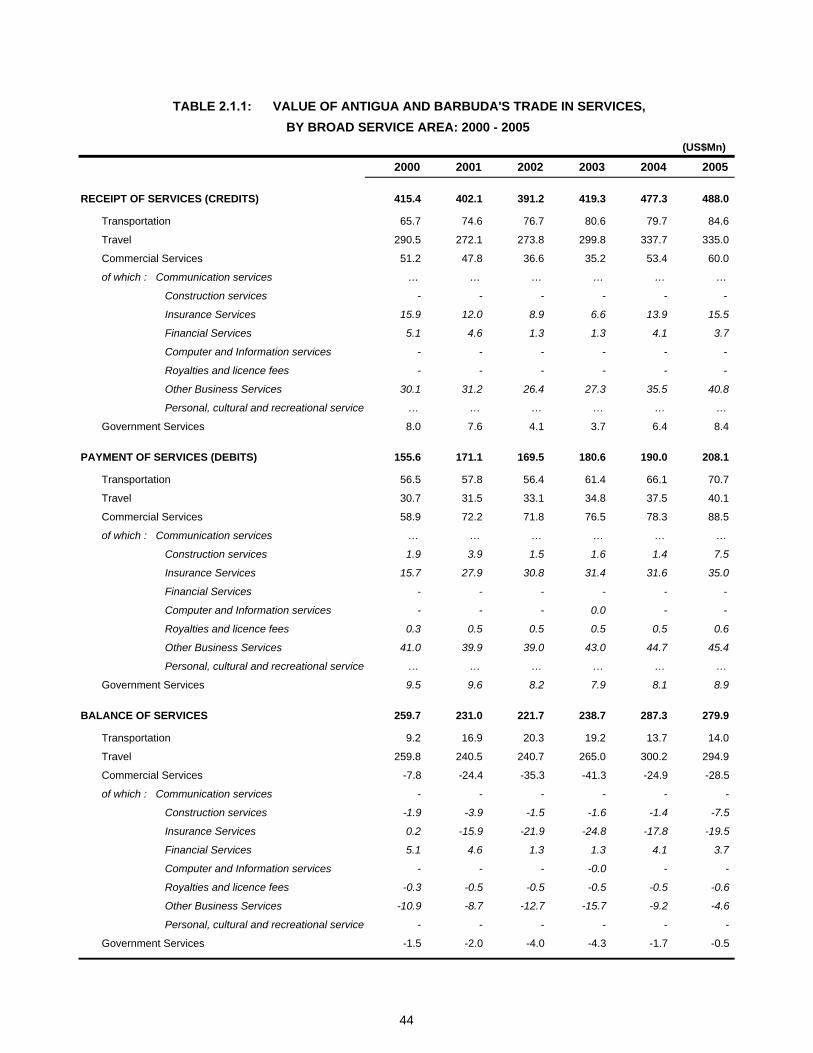
(US$Mn)
2000 2001 2002 2003 2004 2005
RECEIPT OF SERVICES (CREDITS) 415.4 402.1 391.2 419.3 477.3 488.0
Transportation 65.7 74.6 76.7 80.6 79.7 84.6
Travel 290.5 272.1 273.8 299.8 337.7 335.0
Commercial Services 51.2 47.8 36.6 35.2 53.4 60.0
of which : Communication services … … … … … …
Construction services - - - - - -
Insurance Services 15.9 12.0 8.9 6.6 13.9 15.5
Financial Services 5.1 4.6 1.3 1.3 4.1 3.7
Computer and Information services - - - - - -
Royalties and licence fees - - - - - -
Other Business Services 30.1 31.2 26.4 27.3 35.5 40.8
Personal, cultural and recreational service … … … … … …
Government Services 8.0 7.6 4.1 3.7 6.4 8.4
PAYMENT OF SERVICES (DEBITS) 155.6 171.1 169.5 180.6 190.0 208.1
Transportation 56.5 57.8 56.4 61.4 66.1 70.7
Travel 30.7 31.5 33.1 34.8 37.5 40.1
Commercial Services 58.9 72.2 71.8 76.5 78.3 88.5
of which : Communication services … … … … … …
Construction services 1.9 3.9 1.5 1.6 1.4 7.5
Insurance Services 15.7 27.9 30.8 31.4 31.6 35.0
Financial Services - - - - - -
Computer and Information services - - - 0.0 - -
Royalties and licence fees 0.3 0.5 0.5 0.5 0.5 0.6
Other Business Services 41.0 39.9 39.0 43.0 44.7 45.4
Personal, cultural and recreational service … … … … … …
Government Services 9.5 9.6 8.2 7.9 8.1 8.9
BALANCE OF SERVICES 259.7 231.0 221.7 238.7 287.3 279.9
Transportation 9.2 16.9 20.3 19.2 13.7 14.0
Travel 259.8 240.5 240.7 265.0 300.2 294.9
Commercial Services -7.8 -24.4 -35.3 -41.3 -24.9 -28.5
of which : Communication services - - - - - -
Construction services -1.9 -3.9 -1.5 -1.6 -1.4 -7.5
Insurance Services 0.2 -15.9 -21.9 -24.8 -17.8 -19.5
Financial Services 5.1 4.6 1.3 1.3 4.1 3.7
Computer and Information services - - - -0.0 - -
Royalties and licence fees -0.3 -0.5 -0.5 -0.5 -0.5 -0.6
Other Business Services -10.9 -8.7 -12.7 -15.7 -9.2 -4.6
Personal, cultural and recreational service - - - - - -
Government Services -1.5 -2.0 -4.0 -4.3 -1.7 -0.5
BY BROAD SERVICE AREA: 2000 - 2005TABLE 2.1.1: VALUE OF ANTIGUA AND BARBUDA'S TRADE IN SERVICES,
44

(Per cent)
2000 2001 2002 2003 2004 2005
RECEIPT OF SERVICES (CREDITS) 100.0 100.0 100.0 100.0 100.0 100.0
Transportation 15.8 18.6 19.6 19.2 16.7 17.3
Travel 69.9 67.7 70.0 71.5 70.8 68.6
Commercial Services 12.3 11.9 9.3 8.4 11.2 12.3
of which : Communication services - - - - - -
Construction services - - - - - -
Insurance Services 3.8 3.0 2.3 1.6 2.9 3.2
Financial Services 1.2 1.1 0.3 0.3 0.8 0.7
Computer and Information services - - - - - -
Royalties and licence fees - - - - - -
Other Business Services 7.2 7.8 6.7 6.5 7.4 8.4
Personal, cultural and recreational service - - - - - -
Government Services 1.9 1.9 1.1 0.9 1.3 1.7
PAYMENT OF SERVICES (DEBITS) 100.0 100.0 100.0 100.0 100.0 100.0
Transportation 36.3 33.8 33.3 34.0 34.8 34.0
Travel 19.7 18.4 19.5 19.3 19.7 19.2
Commercial Services 37.9 42.2 42.4 42.3 41.2 42.5
of which : Communication services - - - - - -
Construction services 1.2 2.3 0.9 0.9 0.8 3.6
Insurance Services 10.1 16.3 18.1 17.4 16.6 16.8
Financial Services - - - - - -
Computer and Information services - - - 0.0 - -
Royalties and licence fees 0.2 0.3 0.3 0.3 0.3 0.3
Other Business Services 26.4 23.3 23.0 23.8 23.5 21.8
Personal, cultural and recreational service - - - - - -
Government Services 6.1 5.6 4.8 4.4 4.3 4.3
TABLE 2.1.2: PERCENTAGE DISTRIBUTION OF ANTIGUA AND BARBUDA'S TRADE IN SERVICES,BY BROAD SERVICE AREA: 2000 - 2005
45

Figure 1.51: Antigua and Barbuda's Trade in Services -Receipt, Payment and Balance of Services: 2000-2005
0
100
200
300
400
500
600
2000 2001 2002 2003 2004 2005
Years
US
Mill
ion
Dol
lars
Receipt of Services Payment of Services Trade Balance
0
100
200
300
400
500
US
Mill
ion
Dol
lars
2000 2001 2002 2003 2004 2005
Years
Figure 1.52: Antigua and Barbuda's Receipt of Services: 2000-2005
Transportation Travel Commercial Services Government Services Series2
0
50
100
150
200
US
Mill
ion
Dol
lars
2000 2001 2002 2003 2004 2005
Years
Figure 1.53: Antigua and Barbuda's Payment of Services: 2000-2005
Transportation Travel Commercial Services Government Services
46

(US$Mn)
2000 2001 2002 2003 2004 2005
RECEIPT OF SERVICES (CREDITS) 1,973.2 1,804.3 2,061.7 2,054.7 2,242.5 2,485.9
Transportation 54.5 50.2 57.5 56.7 55.3 55.7
Travel 1,737.9 1,647.7 1,759.8 1,757.4 1,884.5 2,069.1
Commercial Services 153.4 78.3 218.1 214.1 269.4 333.8
of which : Communication services … … … … … …
Construction services - - - - - -
Insurance Services - - - - - -
Financial Services … … … … … …
Computer and Information services … … … … … …
Royalties and licence fees - - - - - -
Other Business Services 153.4 78.3 218.1 214.1 269.4 333.8
Personal, cultural and recreational service … … … … … …
Government Services 27.4 28.2 26.3 26.5 33.3 27.3
PAYMENT OF SERVICES (DEBITS) 1,025.5 973.0 1,016.3 1,092.4 1,231.5 1,373.6
Transportation 249.1 254.6 236.4 244.1 304.6 368.6
Travel 260.8 255.5 243.9 304.7 315.6 344.3
Commercial Services 458.9 386.1 448.9 459.8 548.8 583.0
of which : Communication services … … … … … …
Construction services 101.6 33.0 55.2 37.8 23.4 40.7
Insurance Services 74.2 83.6 92.7 105.7 81.6 97.1
Financial Services … … … … … …
Computer and Information services … … … … … …
Royalties and licence fees 14.2 13.3 13.7 14.6 18.6 16.0
Other Business Services 268.9 256.2 287.3 301.7 425.2 429.2
Personal, cultural and recreational service … … … … … …
Government Services 56.8 76.8 87.1 83.8 62.5 77.7
BALANCE OF SERVICES 947.7 831.3 1,045.4 962.3 1,011.0 1,112.3
Transportation -194.6 -204.5 -178.9 -187.4 -249.3 -312.9
Travel 1,477.1 1,392.2 1,515.9 1,452.7 1,568.9 1,724.8
Commercial Services -305.5 -307.8 -230.8 -245.7 -279.4 -249.2
of which : Communication services … … … … … …
Construction services -101.6 -33.0 -55.2 -37.8 -23.4 -40.7
Insurance Services -74.2 -83.6 -92.7 -105.7 -81.6 -97.1
Financial Services … … … … … …
Computer and Information services … … … … … …
Royalties and licence fees -14.2 -13.3 -13.7 -14.6 -18.6 -16.0
Other Business Services -115.5 -177.9 -69.2 -87.6 -155.8 -95.4
Personal, cultural and recreational service … … … … … …
Government Services -29.4 -48.6 -60.8 -57.3 -29.2 -50.4
BY BROAD SERVICE AREA: 2000 - 2005TABLE 2.2.1: VALUE OF THE BAHAMAS' TRADE IN SERVICES,
47
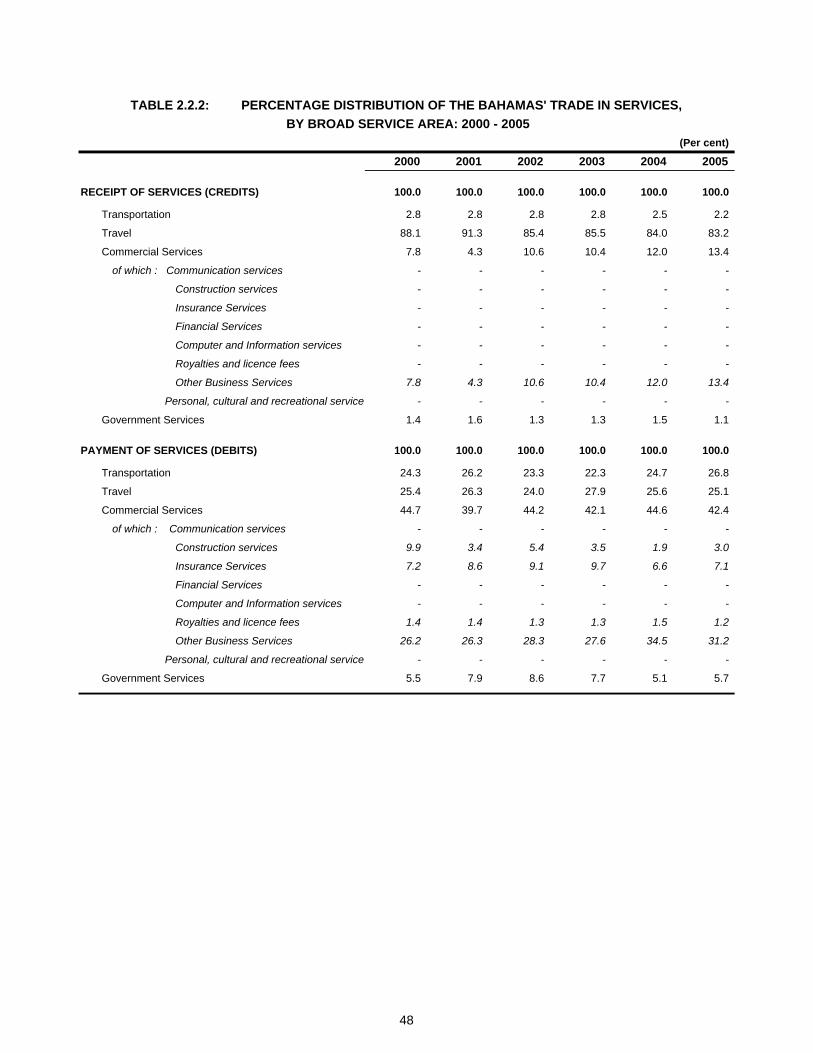
(Per cent)
2000 2001 2002 2003 2004 2005
RECEIPT OF SERVICES (CREDITS) 100.0 100.0 100.0 100.0 100.0 100.0
Transportation 2.8 2.8 2.8 2.8 2.5 2.2
Travel 88.1 91.3 85.4 85.5 84.0 83.2
Commercial Services 7.8 4.3 10.6 10.4 12.0 13.4
of which : Communication services - - - - - -
Construction services - - - - - -
Insurance Services - - - - - -
Financial Services - - - - - -
Computer and Information services - - - - - -
Royalties and licence fees - - - - - -
Other Business Services 7.8 4.3 10.6 10.4 12.0 13.4
Personal, cultural and recreational service - - - - - -
Government Services 1.4 1.6 1.3 1.3 1.5 1.1
PAYMENT OF SERVICES (DEBITS) 100.0 100.0 100.0 100.0 100.0 100.0
Transportation 24.3 26.2 23.3 22.3 24.7 26.8
Travel 25.4 26.3 24.0 27.9 25.6 25.1
Commercial Services 44.7 39.7 44.2 42.1 44.6 42.4
of which : Communication services - - - - - -
Construction services 9.9 3.4 5.4 3.5 1.9 3.0
Insurance Services 7.2 8.6 9.1 9.7 6.6 7.1
Financial Services - - - - - -
Computer and Information services - - - - - -
Royalties and licence fees 1.4 1.4 1.3 1.3 1.5 1.2
Other Business Services 26.2 26.3 28.3 27.6 34.5 31.2
Personal, cultural and recreational service - - - - - -
Government Services 5.5 7.9 8.6 7.7 5.1 5.7
TABLE 2.2.2: PERCENTAGE DISTRIBUTION OF THE BAHAMAS' TRADE IN SERVICES,BY BROAD SERVICE AREA: 2000 - 2005
48
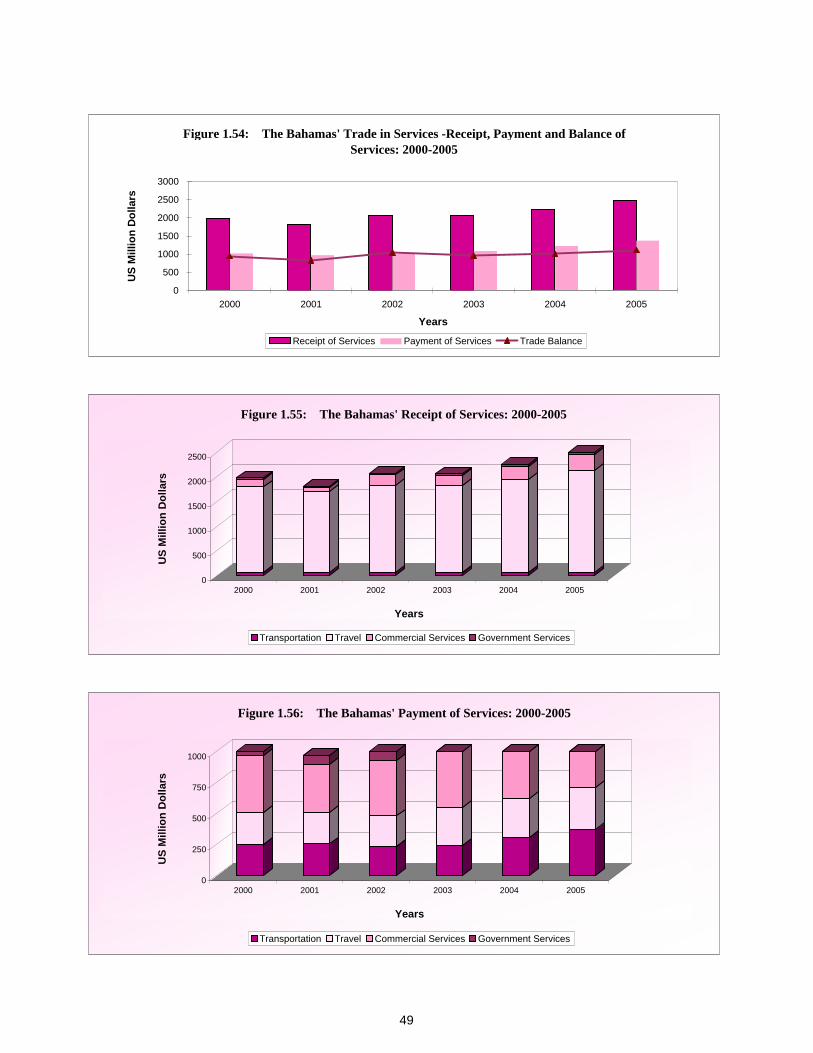
Figure 1.54: The Bahamas' Trade in Services -Receipt, Payment and Balance of Services: 2000-2005
0
500
1000
1500
2000
2500
3000
2000 2001 2002 2003 2004 2005
Years
US
Mill
ion
Dol
lars
Receipt of Services Payment of Services Trade Balance
0
500
1000
1500
2000
2500
US
Mill
ion
Dol
lars
2000 2001 2002 2003 2004 2005
Years
Figure 1.55: The Bahamas' Receipt of Services: 2000-2005
Transportation Travel Commercial Services Government Services
0
250
500
750
1000
US
Mill
ion
Dol
lars
2000 2001 2002 2003 2004 2005
Years
Figure 1.56: The Bahamas' Payment of Services: 2000-2005
Transportation Travel Commercial Services Government Services
49

2000 2001 2002 2003 2004 2005
RECEIPT OF SERVICES (CREDITS) 1,090.2 1,068.5 1,041.3 1,165.5 1,214.2 1,457.2
Transportation 24.8 22.4 21.0 23.2 25.9 25.3
Travel 723.0 697.2 657.9 757.9 775.5 896.7
Commercial Services 307.6 312.9 324.4 342.7 370.2 488.4
of which : Communication services 27.8 29.4 30.9 32.2 32.3 32.5
Construction services 2.8 2.9 3.1 3.6 3.8 3.6
Insurance Services 79.5 84.9 87.3 90.1 91.0 143.2
Financial Services 75.2 71.0 70.0 73.6 79.7 117.1
Computer and Information services 17.4 17.5 17.6 18.1 19.9 22.7
Royalties and licence fees 0.3 0.3 0.5 0.9 2.3 1.7
Other Business Services 104.5 106.7 114.6 123.7 141.3 167.4
Personal, cultural and recreational service 0.3 0.4 0.5 0.8 0.0 0.2
Government Services 34.9 36.1 38.0 41.8 42.6 46.8
PAYMENT OF SERVICES (DEBITS) 487.4 498.5 491.4 518.8 554.6 679.6
Transportation 163.5 156.0 155.3 169.8 197.4 218.3
Travel 94.1 100.9 99.0 104.5 107.8 95.7
Commercial Services 202.5 214.0 211.3 217.8 213.5 321.7
of which : Communication services 7.9 9.4 9.7 11.2 12.5 11.8
Construction services 2.1 2.2 2.3 3.0 3.0 3.3
Insurance Services 109.5 117.4 119.1 123.1 121.1 194.1
Financial Services 5.1 5.2 5.8 5.3 5.5 5.8
Computer and Information services 5.2 5.5 5.7 6.9 7.2 8.2
Royalties and licence fees 23.7 24.3 24.6 25.0 20.0 29.1
Other Business Services 48.9 49.9 44.2 43.4 43.9 69.2
Personal, cultural and recreational service 0.2 0.3 - 0.1 0.3 0.2
Government Services 27.4 27.7 25.8 26.9 36.0 44.0
BALANCE OF SERVICES 602.9 570.0 549.9 646.7 659.6 777.6
Transportation -138.8 -133.6 -134.3 -146.6 -171.5 -193.0
Travel 628.9 596.4 558.9 653.4 667.7 801.0
Commercial Services 105.2 98.9 113.1 124.9 156.7 166.7
of which : Communication services 20.0 20.0 21.3 21.0 19.8 20.7
Construction services 0.7 0.8 0.8 0.6 0.8 0.2
Insurance Services -30.0 -32.5 -31.9 -33.0 -30.1 -50.9
Financial Services 70.2 65.8 64.3 68.3 74.2 111.3
Computer and Information services 12.2 12.0 11.9 11.2 12.6 14.4
Royalties and licence fees -23.5 -24.0 -24.1 -24.1 -17.7 -27.4
Other Business Services 55.6 56.8 70.4 80.3 97.4 98.2
Personal, cultural and recreational service 0.2 0.1 0.5 0.7 -0.3 0.1
Government Services 7.6 8.4 12.2 15.0 6.6 2.9
BY BROAD SERVICE AREA: 2000-2005TABLE 2.3.1: VALUE OF BARBADOS' TRADE IN SERVICES,
50
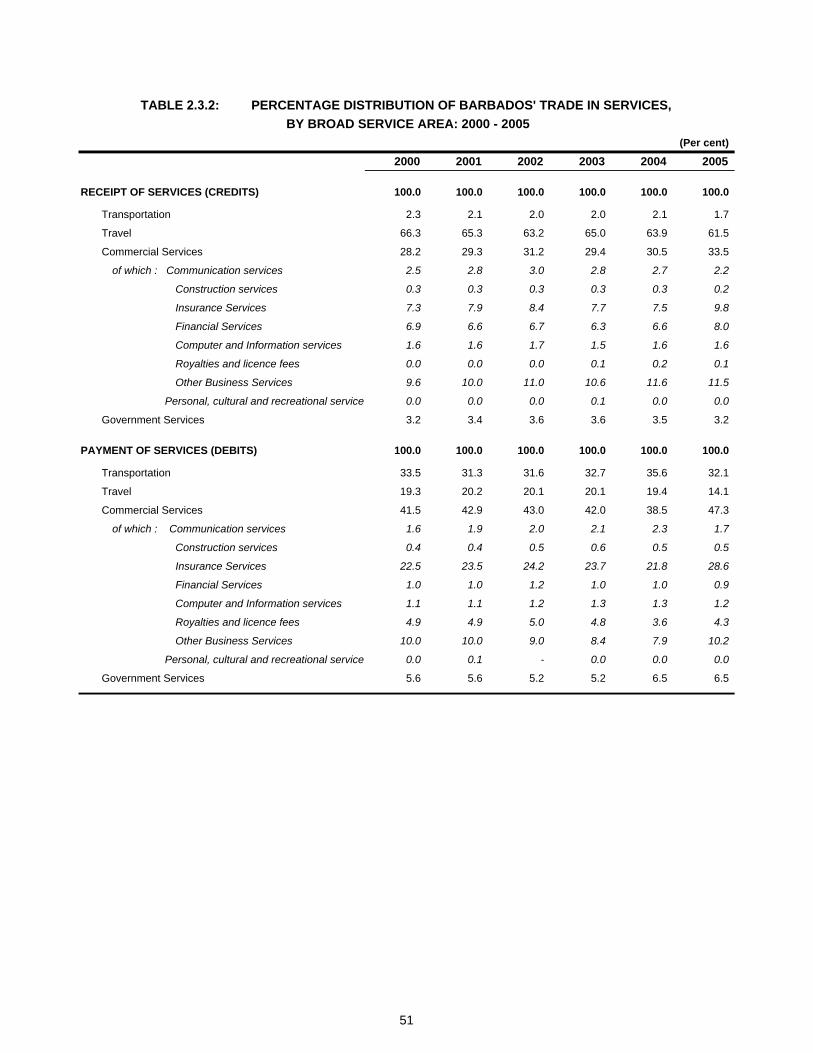
(Per cent)
2000 2001 2002 2003 2004 2005
RECEIPT OF SERVICES (CREDITS) 100.0 100.0 100.0 100.0 100.0 100.0
Transportation 2.3 2.1 2.0 2.0 2.1 1.7
Travel 66.3 65.3 63.2 65.0 63.9 61.5
Commercial Services 28.2 29.3 31.2 29.4 30.5 33.5
of which : Communication services 2.5 2.8 3.0 2.8 2.7 2.2
Construction services 0.3 0.3 0.3 0.3 0.3 0.2
Insurance Services 7.3 7.9 8.4 7.7 7.5 9.8
Financial Services 6.9 6.6 6.7 6.3 6.6 8.0
Computer and Information services 1.6 1.6 1.7 1.5 1.6 1.6
Royalties and licence fees 0.0 0.0 0.0 0.1 0.2 0.1
Other Business Services 9.6 10.0 11.0 10.6 11.6 11.5
Personal, cultural and recreational service 0.0 0.0 0.0 0.1 0.0 0.0
Government Services 3.2 3.4 3.6 3.6 3.5 3.2
PAYMENT OF SERVICES (DEBITS) 100.0 100.0 100.0 100.0 100.0 100.0
Transportation 33.5 31.3 31.6 32.7 35.6 32.1
Travel 19.3 20.2 20.1 20.1 19.4 14.1
Commercial Services 41.5 42.9 43.0 42.0 38.5 47.3
of which : Communication services 1.6 1.9 2.0 2.1 2.3 1.7
Construction services 0.4 0.4 0.5 0.6 0.5 0.5
Insurance Services 22.5 23.5 24.2 23.7 21.8 28.6
Financial Services 1.0 1.0 1.2 1.0 1.0 0.9
Computer and Information services 1.1 1.1 1.2 1.3 1.3 1.2
Royalties and licence fees 4.9 4.9 5.0 4.8 3.6 4.3
Other Business Services 10.0 10.0 9.0 8.4 7.9 10.2
Personal, cultural and recreational service 0.0 0.1 - 0.0 0.0 0.0
Government Services 5.6 5.6 5.2 5.2 6.5 6.5
TABLE 2.3.2: PERCENTAGE DISTRIBUTION OF BARBADOS' TRADE IN SERVICES,BY BROAD SERVICE AREA: 2000 - 2005
51
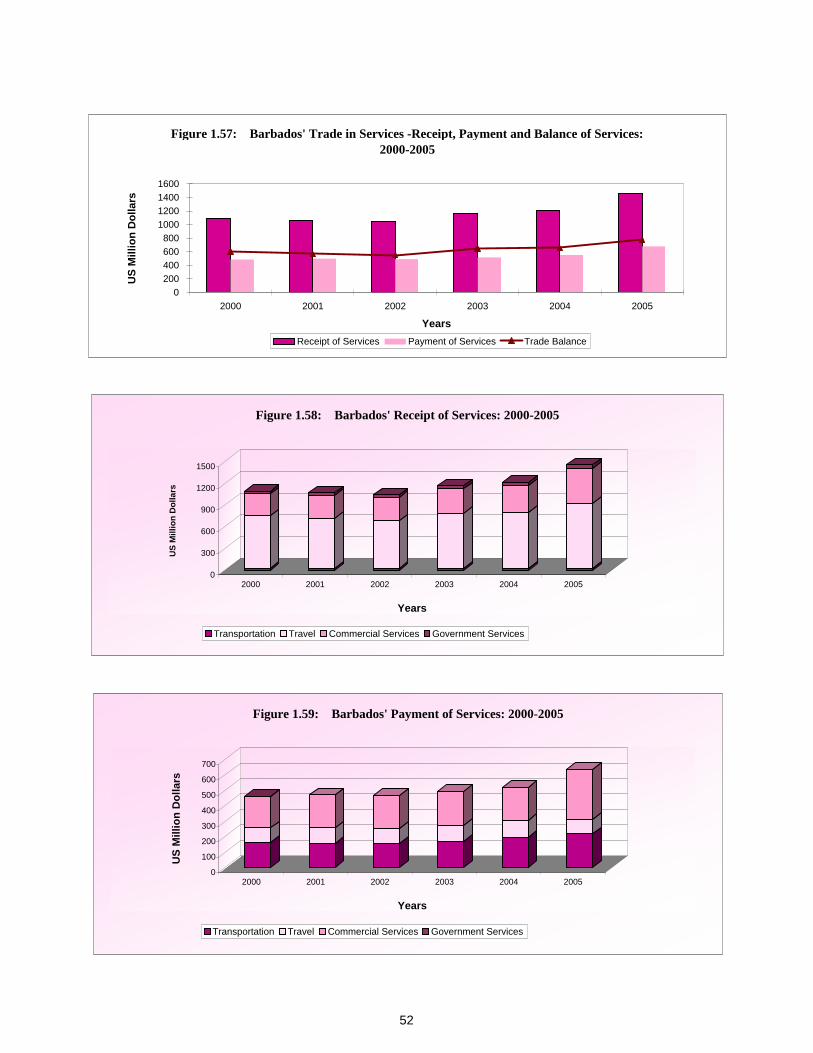
Figure 1.57: Barbados' Trade in Services -Receipt, Payment and Balance of Services: 2000-2005
0200400600800
1000120014001600
2000 2001 2002 2003 2004 2005
Years
US
Mill
ion
Dol
lars
Receipt of Services Payment of Services Trade Balance
0
300
600
900
1200
1500
US
Mill
ion
Dol
lars
2000 2001 2002 2003 2004 2005
Years
Figure 1.58: Barbados' Receipt of Services: 2000-2005
Transportation Travel Commercial Services Government Services
0
100
200
300
400
500
600
700
US
Mill
ion
Dol
lars
2000 2001 2002 2003 2004 2005
Years
Figure 1.59: Barbados' Payment of Services: 2000-2005
Transportation Travel Commercial Services Government Services
52

(US$Mn)
2000 2001 2002 2003 2004 2005
RECEIPT OF SERVICES (CREDITS) 158.2 157.3 156.9 178.6 199.2 301.3
Transportation 10.8 11.8 18.1 22.1 27.4 29.7
Travel 116.2 102.9 102.9 117.2 133.0 213.7
Commercial Services 13.4 19.5 20.8 23.2 26.9 40.2
of which : Communication services 7.2 6.1 4.8 6.1 5.7 …
Construction services … … … … … …
Insurance Services - - - - - …
Financial Services - - - - - …
Computer and Information services - - - - - …
Royalties and licence fees - - - - - …
Other Business Services 6.3 13.4 16.0 17.2 21.3 40.2
Personal, cultural and recreational service - - - - - …
Government Services 17.8 23.1 15.1 16.1 11.9 17.8
PAYMENT OF SERVICES (DEBITS) 124.5 120.9 130.5 139.0 145.7 159.7
Transportation 36.9 35.8 37.4 39.3 44.3 50.0
Travel 40.5 40.8 42.5 44.2 41.2 41.7
Commercial Services 38.3 35.8 41.6 46.4 52.1 60.5
of which : Communication services 4.1 2.6 1.0 1.3 1.4 …
Construction services … … … … … …
Insurance Services 10.2 11.3 13.6 17.5 17.2 …
Financial Services 1.3 0.9 7.0 6.1 12.5 …
Computer and Information services 0.5 0.6 0.4 0.6 0.4 …
Royalties and licence fees 2.9 2.2 0.3 0.2 0.4 …
Other Business Services 19.2 18.3 19.3 20.7 19.8 60.5
Personal, cultural and recreational service - - - 0.1 0.4 …
Government Services 8.8 8.4 8.9 9.1 8.2 7.6
BALANCE OF SERVICES 33.8 36.5 26.5 39.6 53.5 141.6
Transportation -26.1 -24.0 -19.3 -17.1 -16.9 -20.3
Travel 75.7 62.2 60.4 73.0 91.8 172.0
Commercial Services -24.9 -16.4 -20.8 -23.2 -25.1 -20.3
of which : Communication services 3.0 3.5 3.8 4.8 4.3 …
Construction services - - - - - …
Insurance Services -10.2 -11.3 -13.6 -17.5 -17.2 …
Financial Services -1.3 -0.9 -7.0 -6.1 -12.5 …
Computer and Information services -0.5 -0.6 -0.4 -0.6 -0.4 …
Royalties and licence fees -2.9 -2.2 -0.3 -0.2 -0.4 …
Other Business Services -13.0 -4.9 -3.2 -3.5 1.5 -20.3
Personal, cultural and recreational service - - - -0.1 -0.4 …
Government Services 9.0 14.7 6.2 7.0 3.7 10.2
BY BROAD SERVICE AREA: 2000 - 2005TABLE 2.4.1: VALUE OF BELIZE'S TRADE IN SERVICES,
53

(Per cent)
2000 2001 2002 2003 2004 2005
RECEIPT OF SERVICES (CREDITS) 100.0 100.0 100.0 100.0 100.0 100.0
Transportation 6.8 7.5 11.5 12.4 13.7 9.9
Travel 73.4 65.4 65.6 65.6 66.8 70.9
Commercial Services 8.5 12.4 13.3 13.0 13.5 13.3
of which : Communication services 4.5 3.9 3.1 3.4 2.8 -
Construction services - - - - - -
Insurance Services - - - - - -
Financial Services - - - - - -
Computer and Information services - - - - - -
Royalties and licence fees - - - - - -
Other Business Services 4.0 8.5 10.2 9.6 10.7 13.3
Personal, cultural and recreational service - - - - - -
Government Services 11.2 14.7 9.6 9.0 6.0 5.9
PAYMENT OF SERVICES (DEBITS) 100.0 100.0 100.0 100.0 100.0 100.0
Transportation 29.6 29.7 28.7 28.3 30.4 31.3
Travel 32.5 33.7 32.6 31.8 28.3 26.1
Commercial Services 30.8 29.7 31.9 33.4 35.7 37.9
of which : Communication services 3.3 2.1 0.8 0.9 0.9 -
Construction services - - - - - -
Insurance Services 8.2 9.4 10.4 12.6 11.8 -
Financial Services 1.0 0.7 5.4 4.4 8.6 -
Computer and Information services 0.4 0.5 0.3 0.4 0.3 -
Royalties and licence fees 2.3 1.8 0.2 0.1 0.3 -
Other Business Services 15.4 15.1 14.8 14.9 13.6 37.9
Personal, cultural and recreational service - - - 0.1 0.3 -
Government Services 7.1 7.0 6.8 6.6 5.6 4.8
TABLE 2.4.2: PERCENTAGE DISTRIBUTION OF BELIZE'S TRADE IN SERVICES,BY BROAD SERVICE AREA: 2000 - 2005
54
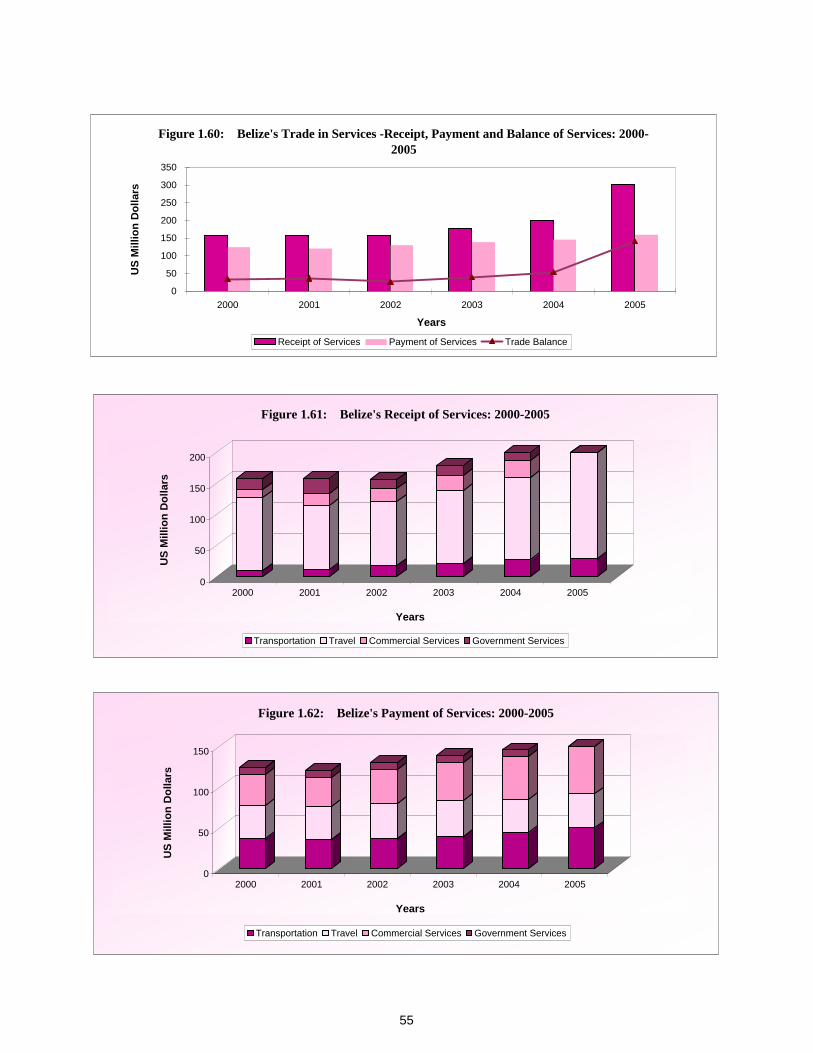
Figure 1.60: Belize's Trade in Services -Receipt, Payment and Balance of Services: 2000-2005
0
50
100
150
200
250
300
350
2000 2001 2002 2003 2004 2005
Years
US
Mill
ion
Dol
lars
Receipt of Services Payment of Services Trade Balance
0
50
100
150
200
US
Mill
ion
Dol
lars
2000 2001 2002 2003 2004 2005
Years
Figure 1.61: Belize's Receipt of Services: 2000-2005
Transportation Travel Commercial Services Government Services
0
50
100
150
US
Mill
ion
Dol
lars
2000 2001 2002 2003 2004 2005
Years
Figure 1.62: Belize's Payment of Services: 2000-2005
Transportation Travel Commercial Services Government Services
55

(US$Mn)
2000 2001 2002 2003 2004 2005
RECEIPT OF SERVICES (CREDITS) 89.7 75.6 79.7 80.5 87.6 83.4
Transportation 7.1 6.1 5.4 4.9 6.1 4.0
Travel 48.2 46.4 45.7 55.4 60.6 55.6
Commercial Services 32.1 21.3 26.8 19.1 19.5 22.8
of which : Communication services … … … … … …
Construction services - - - - - -
Insurance Services 3.4 2.4 2.1 2.0 1.3 1.7
Financial Services 0.9 0.4 0.1 0.1 0.1 0.1
Computer and Information services - - - - - -
Royalties and licence fees 0.0 - - - - -
Other Business Services 27.7 18.6 24.7 17.1 18.1 21.0
Personal, cultural and recreational service … … … … … …
Government Services 2.4 1.7 1.8 1.0 1.3 1.0
PAYMENT OF SERVICES (DEBITS) 52.7 50.0 53.7 43.6 46.3 52.1
Transportation 21.8 20.0 18.5 19.0 21.9 26.8
Travel 8.9 9.2 9.1 8.9 9.2 9.7
Commercial Services 16.9 17.6 22.4 11.8 13.7 13.4
of which : Communication services … … … … … …
Construction services 0.5 1.7 0.9 0.8 0.3 0.5
Insurance Services 4.7 4.4 5.0 4.3 5.2 6.0
Financial Services 0.0 0.0 0.0 0.0 0.0 -
Computer and Information services - - - - - 0.0
Royalties and licence fees 0.1 0.1 0.1 0.1 0.1 0.1
Other Business Services 11.6 11.3 16.3 6.7 8.1 6.8
Personal, cultural and recreational service … … … … … …
Government Services 5.1 3.3 3.8 3.9 1.6 2.1
BALANCE OF SERVICES 37.1 25.6 26.0 36.9 41.2 31.4
Transportation -14.7 -13.9 -13.0 -14.0 -15.9 -22.8
Travel 39.3 37.2 36.6 46.5 51.5 45.9
Commercial Services 15.2 3.8 4.5 7.3 5.9 9.4
of which : Communication services … … … … … …
Construction services -0.5 -1.7 -0.9 -0.8 -0.3 -0.5
Insurance Services -1.3 -2.1 -2.9 -2.3 -3.9 -4.3
Financial Services 0.9 0.4 0.1 0.1 0.1 0.1
Computer and Information services - - - - - -0.0
Royalties and licence fees -0.1 -0.1 -0.1 -0.1 -0.1 -0.1
Other Business Services 16.2 7.3 8.4 10.4 10.1 14.3
Personal, cultural and recreational service - - - - - -
Government Services -2.7 -1.6 -2.0 -2.9 -0.2 -1.1
BY BROAD SERVICE AREA: 2000-2005TABLE 2.5.1: VALUE OF DOMINICA'S TRADE IN SERVICES,
56

(Per cent)
2000 2001 2002 2003 2004 2005
RECEIPT OF SERVICES (CREDITS) 100.0 100.0 100.0 100.0 100.0 100.0
Transportation 7.9 8.1 6.8 6.1 7.0 4.8
Travel 53.7 61.4 57.3 68.9 69.2 66.6
Commercial Services 35.8 28.2 33.7 23.8 22.3 27.3
of which : Communication services - - - - - -
Construction services - - - - - -
Insurance Services 3.8 3.1 2.6 2.5 1.5 2.0
Financial Services 1.0 0.5 0.1 0.1 0.1 0.1
Computer and Information services - - - - - -
Royalties and licence fees 0.0 - - - - -
Other Business Services 30.9 24.6 30.9 21.2 20.7 25.2
Personal, cultural and recreational service - - - - - -
Government Services 2.7 2.3 2.3 1.2 1.5 1.2
PAYMENT OF SERVICES (DEBITS) 100.0 100.0 100.0 100.0 100.0 100.0
Transportation 41.3 40.0 34.4 43.5 47.3 51.6
Travel 16.9 18.4 17.0 20.5 19.8 18.7
Commercial Services 32.1 35.1 41.6 27.1 29.5 25.7
of which : Communication services - - - - - -
Construction services 1.0 3.4 1.7 1.8 0.7 0.9
Insurance Services 8.9 8.9 9.3 9.8 11.1 11.5
Financial Services 0.0 0.0 0.0 0.0 0.0 -
Computer and Information services - - - - - 0.0
Royalties and licence fees 0.2 0.2 0.2 0.2 0.2 0.2
Other Business Services 22.0 22.6 30.4 15.3 17.4 13.0
Personal, cultural and recreational service - - - - - -
Government Services 9.6 6.5 7.1 8.9 3.4 4.0
TABLE 2.5.2: PERCENTAGE DISTRIBUTION OF DOMINICA'S TRADE IN SERVICES,BY BROAD SERVICE AREA: 2000 - 2005
57
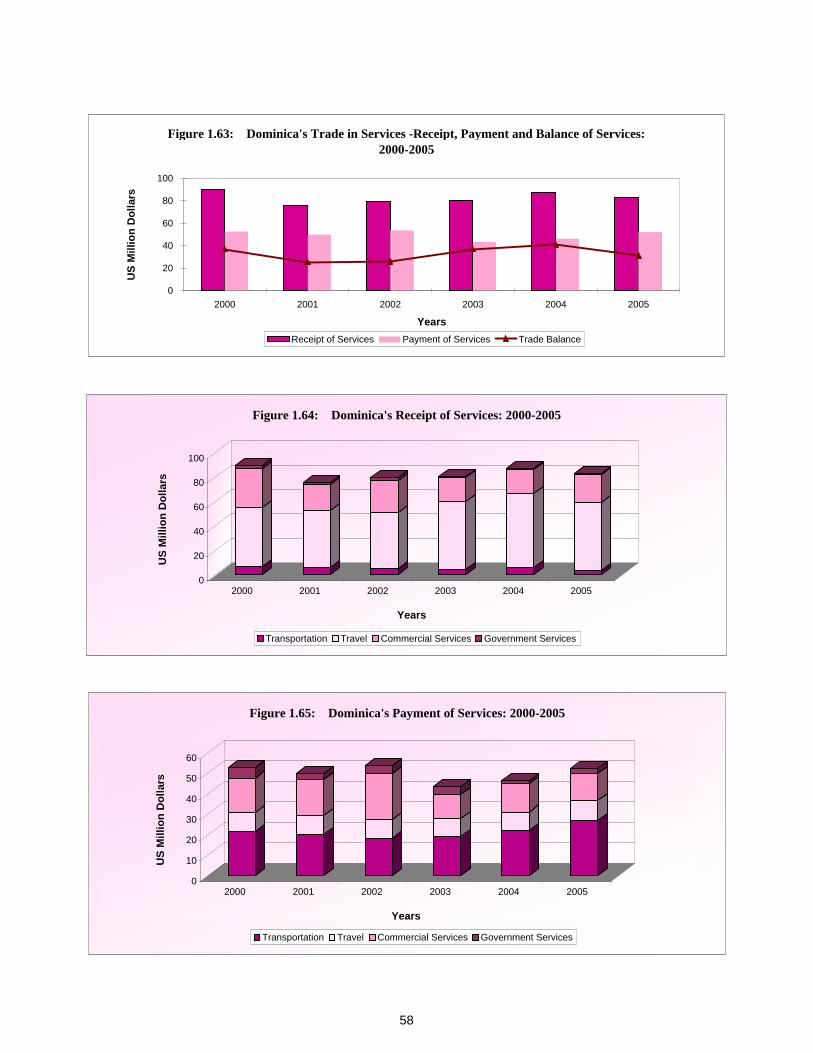
Figure 1.63: Dominica's Trade in Services -Receipt, Payment and Balance of Services: 2000-2005
0
20
40
60
80
100
2000 2001 2002 2003 2004 2005
Years
US
Mill
ion
Dol
lars
Receipt of Services Payment of Services Trade Balance
0
20
40
60
80
100
US
Mill
ion
Dol
lars
2000 2001 2002 2003 2004 2005
Years
Figure 1.64: Dominica's Receipt of Services: 2000-2005
Transportation Travel Commercial Services Government Services
0
10
20
30
40
50
60
US
Mill
ion
Dol
lars
2000 2001 2002 2003 2004 2005
Years
Figure 1.65: Dominica's Payment of Services: 2000-2005
Transportation Travel Commercial Services Government Services
58

(US$Mn)
2000 2001 2002 2003 2004 2005
RECEIPT OF SERVICES (CREDITS) 152.8 133.3 133.0 134.0 157.3 116.6
Transportation 5.8 8.1 7.8 9.0 9.3 11.2
Travel 92.5 83.5 91.5 103.7 83.5 71.4
Commercial Services 48.0 37.4 30.9 19.6 62.8 31.9
of which : Communication services … … … … … …
Construction services - - - - - -
Insurance Services 3.2 3.4 5.0 3.5 45.0 13.6
Financial Services 9.1 5.6 3.1 0.1 0.0 -
Computer and Information services - - - - - -
Royalties and licence fees - - - - - -
Other Business Services 35.7 28.4 22.9 16.0 17.8 18.2
Personal, cultural and recreational service … … … … … …
Government Services 6.5 4.4 2.8 1.7 1.6 2.0
PAYMENT OF SERVICES (DEBITS) 89.2 84.9 91.8 83.0 94.2 92.8
Transportation 34.3 32.9 30.5 39.2 41.1 45.3
Travel 7.7 7.6 7.8 8.4 9.4 10.0
Commercial Services 43.3 40.6 49.1 29.6 30.9 29.6
of which : Communication services … … … … … …
Construction services 1.8 3.2 3.4 4.9 3.0 4.1
Insurance Services 8.2 8.0 8.1 9.0 9.5 12.2
Financial Services 0.5 0.0 4.2 0.0 - -
Computer and Information services - - - - - -
Royalties and licence fees 0.6 0.7 0.4 0.6 0.8 0.9
Other Business Services 32.1 28.8 33.0 15.2 17.6 12.4
Personal, cultural and recreational service … … … … … …
Government Services 4.0 3.9 4.5 5.8 12.8 7.9
BALANCE OF SERVICES 63.6 48.4 41.2 51.0 63.0 23.8
Transportation -28.5 -24.7 -22.6 -30.2 -31.8 -34.0
Travel 84.8 75.9 83.7 95.3 74.1 61.4
Commercial Services 4.8 -3.3 -18.2 -10.0 31.9 2.3
of which : Communication services - - - - - -
Construction services -1.8 -3.2 -3.4 -4.9 -3.0 -4.1
Insurance Services -5.0 -4.6 -3.1 -5.5 35.5 1.4
Financial Services 8.6 5.5 -1.1 0.1 0.0 -
Computer and Information services - - - - - -
Royalties and licence fees -0.6 -0.7 -0.4 -0.6 -0.8 -0.9
Other Business Services 3.6 -0.3 -10.1 0.9 0.2 5.8
Personal, cultural and recreational service - - - - - -
Government Services 2.4 0.5 -1.6 -4.1 -11.1 -5.8
BY BROAD SERVICE AREA: 2000-2005TABLE 2.6.1: VALUE OF GRENADA'S TRADE IN SERVICES,
59

(Per cent)
2000 2001 2002 2003 2004 2005
RECEIPT OF SERVICES (CREDITS) 100.0 100.0 100.0 100.0 100.0 100.0
Transportation 3.8 6.1 5.9 6.7 5.9 9.6
Travel 60.6 62.6 68.8 77.4 53.1 61.3
Commercial Services 31.4 28.0 23.2 14.6 40.0 27.3
of which : Communication services - - - - - -
Construction services - - - - - -
Insurance Services 2.1 2.5 3.7 2.6 28.6 11.7
Financial Services 6.0 4.2 2.3 0.1 0.0 -
Computer and Information services - - - - - -
Royalties and licence fees - - - - - -
Other Business Services 23.4 21.3 17.2 12.0 11.3 15.6
Personal, cultural and recreational service - - - - - -
Government Services 4.2 3.3 2.1 1.3 1.0 1.7
PAYMENT OF SERVICES (DEBITS) 100.0 100.0 100.0 100.0 100.0 100.0
Transportation 38.4 38.7 33.2 47.2 43.6 48.8
Travel 8.6 8.9 8.4 10.1 10.0 10.8
Commercial Services 48.5 47.8 53.5 35.7 32.8 31.9
of which : Communication services - - - - - -
Construction services 2.1 3.8 3.7 5.9 3.2 4.4
Insurance Services 9.2 9.4 8.8 10.8 10.1 13.2
Financial Services 0.6 0.0 4.6 0.0 - -
Computer and Information services - - - - - -
Royalties and licence fees 0.7 0.8 0.5 0.7 0.8 1.0
Other Business Services 35.9 33.8 35.9 18.3 18.7 13.4
Personal, cultural and recreational service - - - - - -
Government Services 4.5 4.5 4.9 7.0 13.5 8.5
TABLE 2.6.2: PERCENTAGE DISTRIBUTION OF GRENADA'S TRADE IN SERVICES,BY BROAD SERVICE AREA: 2000 - 2005
60
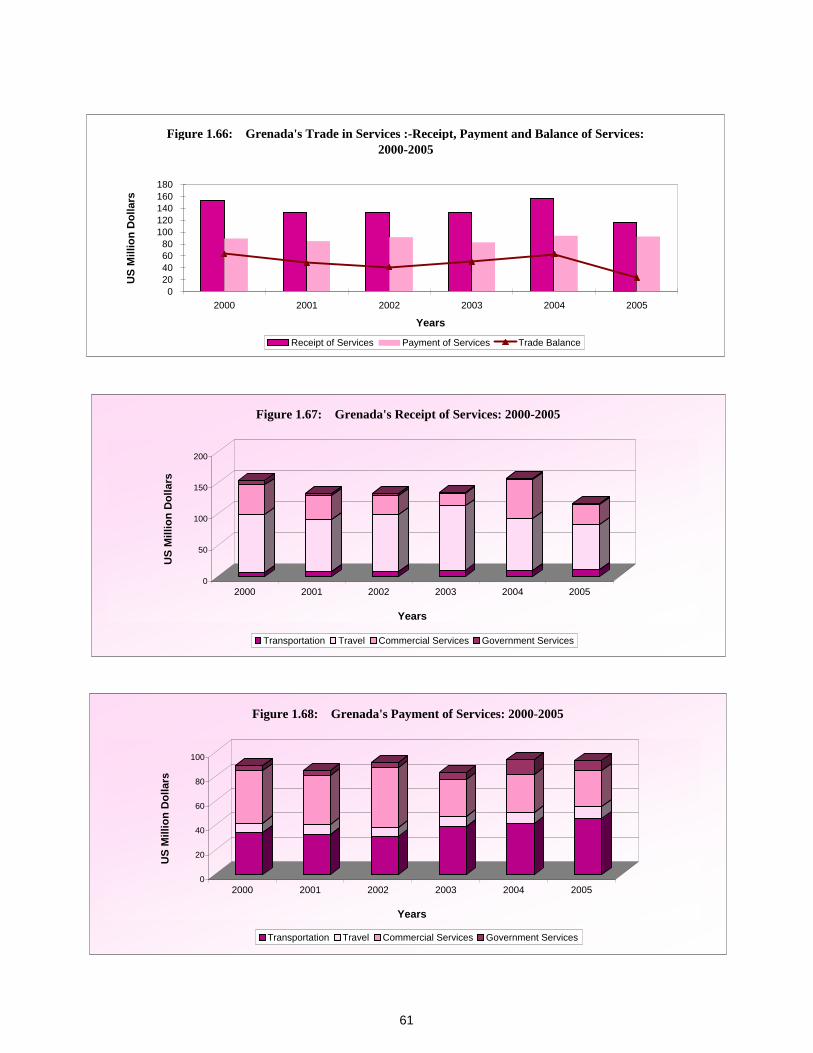
Figure 1.66: Grenada's Trade in Services :-Receipt, Payment and Balance of Services: 2000-2005
020406080
100120140160180
2000 2001 2002 2003 2004 2005
Years
US
Mill
ion
Dol
lars
Receipt of Services Payment of Services Trade Balance
0
50
100
150
200
US
Mill
ion
Dol
lars
2000 2001 2002 2003 2004 2005
Years
Figure 1.67: Grenada's Receipt of Services: 2000-2005
Transportation Travel Commercial Services Government Services
0
20
40
60
80
100
US
Mill
ion
Dol
lars
2000 2001 2002 2003 2004 2005
Years
Figure 1.68: Grenada's Payment of Services: 2000-2005
Transportation Travel Commercial Services Government Services
61
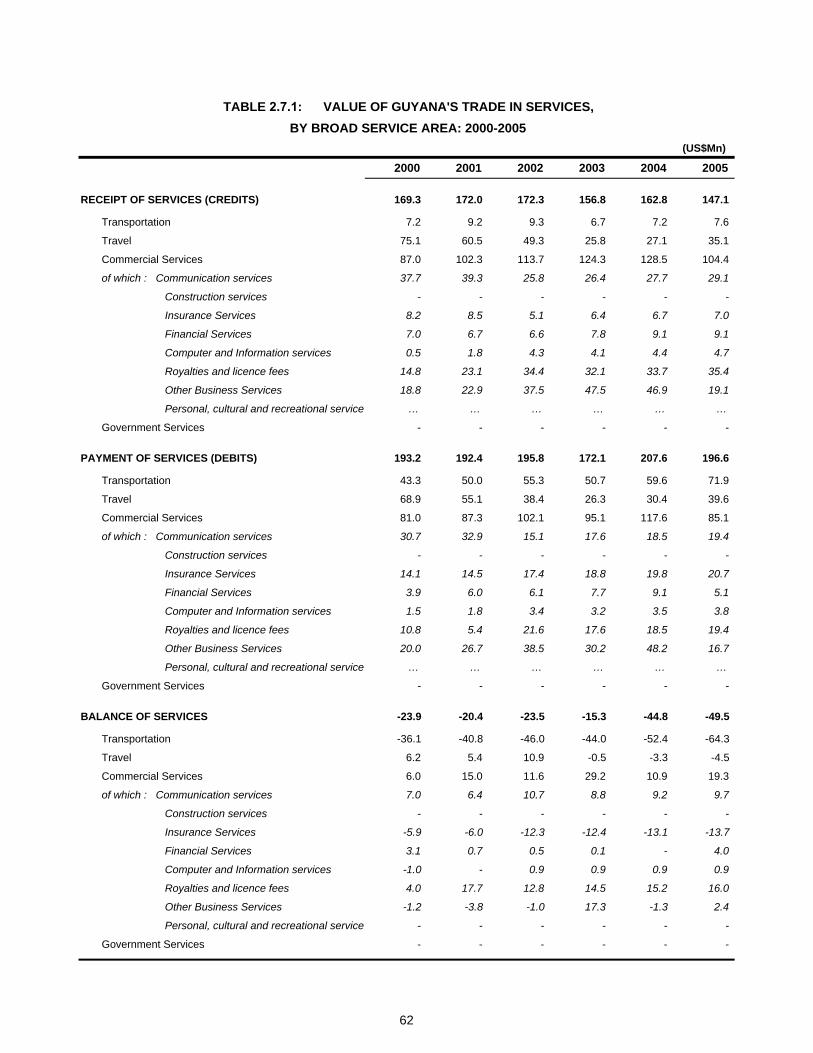
(US$Mn)
2000 2001 2002 2003 2004 2005
RECEIPT OF SERVICES (CREDITS) 169.3 172.0 172.3 156.8 162.8 147.1
Transportation 7.2 9.2 9.3 6.7 7.2 7.6
Travel 75.1 60.5 49.3 25.8 27.1 35.1
Commercial Services 87.0 102.3 113.7 124.3 128.5 104.4
of which : Communication services 37.7 39.3 25.8 26.4 27.7 29.1
Construction services - - - - - -
Insurance Services 8.2 8.5 5.1 6.4 6.7 7.0
Financial Services 7.0 6.7 6.6 7.8 9.1 9.1
Computer and Information services 0.5 1.8 4.3 4.1 4.4 4.7
Royalties and licence fees 14.8 23.1 34.4 32.1 33.7 35.4
Other Business Services 18.8 22.9 37.5 47.5 46.9 19.1
Personal, cultural and recreational service … … … … … …
Government Services - - - - - -
PAYMENT OF SERVICES (DEBITS) 193.2 192.4 195.8 172.1 207.6 196.6
Transportation 43.3 50.0 55.3 50.7 59.6 71.9
Travel 68.9 55.1 38.4 26.3 30.4 39.6
Commercial Services 81.0 87.3 102.1 95.1 117.6 85.1
of which : Communication services 30.7 32.9 15.1 17.6 18.5 19.4
Construction services - - - - - -
Insurance Services 14.1 14.5 17.4 18.8 19.8 20.7
Financial Services 3.9 6.0 6.1 7.7 9.1 5.1
Computer and Information services 1.5 1.8 3.4 3.2 3.5 3.8
Royalties and licence fees 10.8 5.4 21.6 17.6 18.5 19.4
Other Business Services 20.0 26.7 38.5 30.2 48.2 16.7
Personal, cultural and recreational service … … … … … …
Government Services - - - - - -
BALANCE OF SERVICES -23.9 -20.4 -23.5 -15.3 -44.8 -49.5
Transportation -36.1 -40.8 -46.0 -44.0 -52.4 -64.3
Travel 6.2 5.4 10.9 -0.5 -3.3 -4.5
Commercial Services 6.0 15.0 11.6 29.2 10.9 19.3
of which : Communication services 7.0 6.4 10.7 8.8 9.2 9.7
Construction services - - - - - -
Insurance Services -5.9 -6.0 -12.3 -12.4 -13.1 -13.7
Financial Services 3.1 0.7 0.5 0.1 - 4.0
Computer and Information services -1.0 - 0.9 0.9 0.9 0.9
Royalties and licence fees 4.0 17.7 12.8 14.5 15.2 16.0
Other Business Services -1.2 -3.8 -1.0 17.3 -1.3 2.4
Personal, cultural and recreational service - - - - - -
Government Services - - - - - -
BY BROAD SERVICE AREA: 2000-2005TABLE 2.7.1: VALUE OF GUYANA'S TRADE IN SERVICES,
62

(Per cent)
2000 2001 2002 2003 2004 2005
RECEIPT OF SERVICES (CREDITS) 100.0 100.0 100.0 100.0 100.0 100.0
Transportation 4.3 5.3 5.4 4.3 4.4 5.2
Travel 44.4 35.2 28.6 16.5 16.6 23.9
Commercial Services 51.4 59.5 66.0 79.3 78.9 71.0
of which : Communication services 22.3 22.8 15.0 16.8 17.0 19.8
Construction services - - - - - -
Insurance Services 4.8 4.9 3.0 4.1 4.1 4.8
Financial Services 4.1 3.9 3.8 5.0 5.6 6.2
Computer and Information services 0.3 1.0 2.5 2.6 2.7 3.2
Royalties and licence fees 8.7 13.4 20.0 20.5 20.7 24.1
Other Business Services 11.1 13.3 21.8 30.3 28.8 13.0
Personal, cultural and recreational service - - - - - -
Government Services - - - - - -
PAYMENT OF SERVICES (DEBITS) 100.0 100.0 100.0 100.0 100.0 100.0
Transportation 22.4 26.0 28.2 29.5 28.7 36.6
Travel 35.7 28.6 19.6 15.3 14.6 20.1
Commercial Services 41.9 45.4 52.1 55.3 56.6 43.3
of which : Communication services 15.9 17.1 7.7 10.2 8.9 9.9
Construction services - - - - - -
Insurance Services 7.3 7.5 8.9 10.9 9.5 10.5
Financial Services 2.0 3.1 3.1 4.5 4.4 2.6
Computer and Information services 0.8 0.9 1.7 1.9 1.7 1.9
Royalties and licence fees 5.6 2.8 11.0 10.2 8.9 9.9
Other Business Services 10.4 13.9 19.7 17.5 23.2 8.5
Personal, cultural and recreational service - - - - - -
Government Services - - - - - -
TABLE 2.7.2: PERCENTAGE DISTRIBUTION OF GUYANA'S TRADE IN SERVICES,BY BROAD SERVICE AREA: 2000 - 2005
63
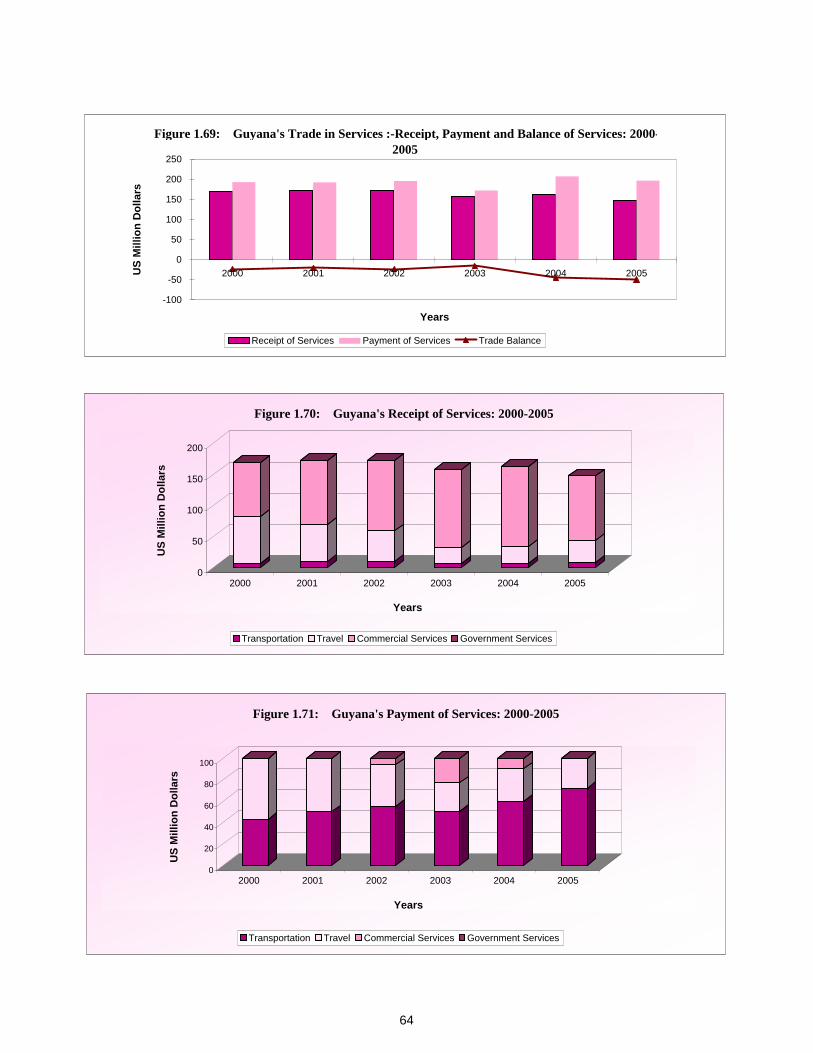
Figure 1.69: Guyana's Trade in Services :-Receipt, Payment and Balance of Services: 2000-2005
-100
-50
0
50
100
150
200
250
2000 2001 2002 2003 2004 2005
Years
US
Mill
ion
Dol
lars
Receipt of Services Payment of Services Trade Balance
0
50
100
150
200
US
Mill
ion
Dol
lars
2000 2001 2002 2003 2004 2005
Years
Figure 1.70: Guyana's Receipt of Services: 2000-2005
Transportation Travel Commercial Services Government Services
0
20
40
60
80
100
US
Mill
ion
Dol
lars
2000 2001 2002 2003 2004 2005
Years
Figure 1.71: Guyana's Payment of Services: 2000-2005
Transportation Travel Commercial Services Government Services
64
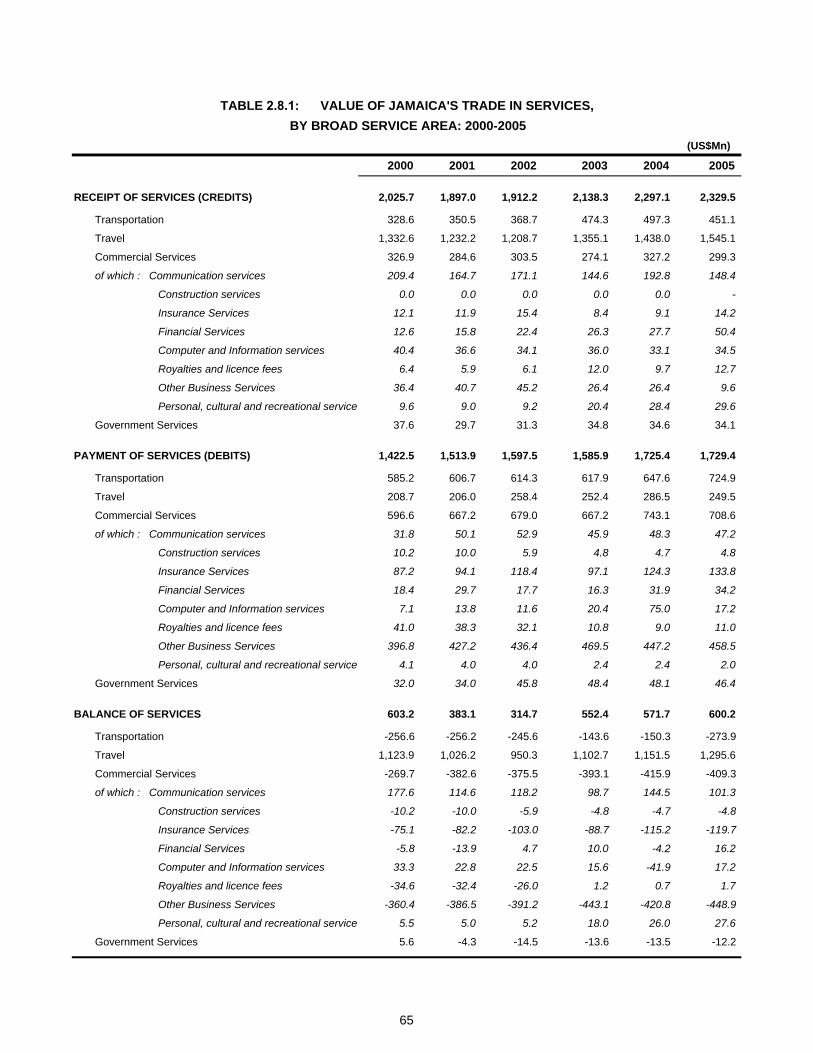
(US$Mn)
2000 2001 2002 2003 2004 2005
RECEIPT OF SERVICES (CREDITS) 2,025.7 1,897.0 1,912.2 2,138.3 2,297.1 2,329.5
Transportation 328.6 350.5 368.7 474.3 497.3 451.1
Travel 1,332.6 1,232.2 1,208.7 1,355.1 1,438.0 1,545.1
Commercial Services 326.9 284.6 303.5 274.1 327.2 299.3
of which : Communication services 209.4 164.7 171.1 144.6 192.8 148.4
Construction services 0.0 0.0 0.0 0.0 0.0 -
Insurance Services 12.1 11.9 15.4 8.4 9.1 14.2
Financial Services 12.6 15.8 22.4 26.3 27.7 50.4
Computer and Information services 40.4 36.6 34.1 36.0 33.1 34.5
Royalties and licence fees 6.4 5.9 6.1 12.0 9.7 12.7
Other Business Services 36.4 40.7 45.2 26.4 26.4 9.6
Personal, cultural and recreational service 9.6 9.0 9.2 20.4 28.4 29.6
Government Services 37.6 29.7 31.3 34.8 34.6 34.1
PAYMENT OF SERVICES (DEBITS) 1,422.5 1,513.9 1,597.5 1,585.9 1,725.4 1,729.4
Transportation 585.2 606.7 614.3 617.9 647.6 724.9
Travel 208.7 206.0 258.4 252.4 286.5 249.5
Commercial Services 596.6 667.2 679.0 667.2 743.1 708.6
of which : Communication services 31.8 50.1 52.9 45.9 48.3 47.2
Construction services 10.2 10.0 5.9 4.8 4.7 4.8
Insurance Services 87.2 94.1 118.4 97.1 124.3 133.8
Financial Services 18.4 29.7 17.7 16.3 31.9 34.2
Computer and Information services 7.1 13.8 11.6 20.4 75.0 17.2
Royalties and licence fees 41.0 38.3 32.1 10.8 9.0 11.0
Other Business Services 396.8 427.2 436.4 469.5 447.2 458.5
Personal, cultural and recreational service 4.1 4.0 4.0 2.4 2.4 2.0
Government Services 32.0 34.0 45.8 48.4 48.1 46.4
BALANCE OF SERVICES 603.2 383.1 314.7 552.4 571.7 600.2
Transportation -256.6 -256.2 -245.6 -143.6 -150.3 -273.9
Travel 1,123.9 1,026.2 950.3 1,102.7 1,151.5 1,295.6
Commercial Services -269.7 -382.6 -375.5 -393.1 -415.9 -409.3
of which : Communication services 177.6 114.6 118.2 98.7 144.5 101.3
Construction services -10.2 -10.0 -5.9 -4.8 -4.7 -4.8
Insurance Services -75.1 -82.2 -103.0 -88.7 -115.2 -119.7
Financial Services -5.8 -13.9 4.7 10.0 -4.2 16.2
Computer and Information services 33.3 22.8 22.5 15.6 -41.9 17.2
Royalties and licence fees -34.6 -32.4 -26.0 1.2 0.7 1.7
Other Business Services -360.4 -386.5 -391.2 -443.1 -420.8 -448.9
Personal, cultural and recreational service 5.5 5.0 5.2 18.0 26.0 27.6
Government Services 5.6 -4.3 -14.5 -13.6 -13.5 -12.2
BY BROAD SERVICE AREA: 2000-2005TABLE 2.8.1: VALUE OF JAMAICA'S TRADE IN SERVICES,
65
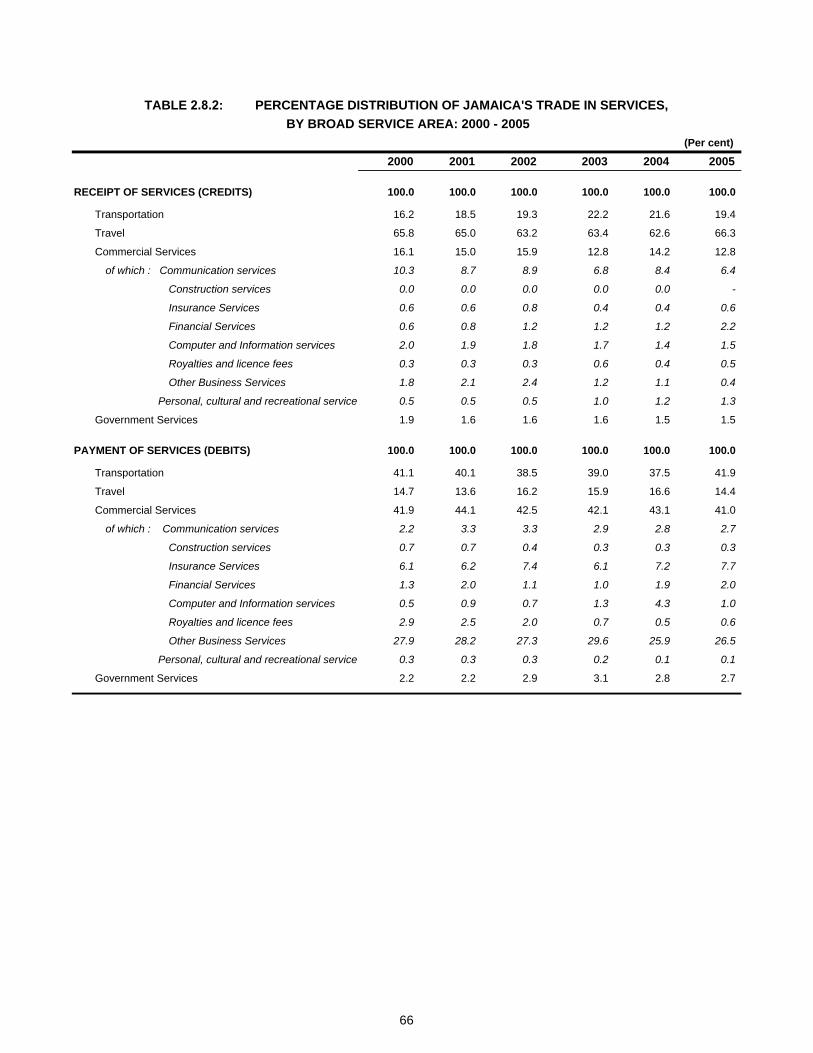
(Per cent)
2000 2001 2002 2003 2004 2005
RECEIPT OF SERVICES (CREDITS) 100.0 100.0 100.0 100.0 100.0 100.0
Transportation 16.2 18.5 19.3 22.2 21.6 19.4
Travel 65.8 65.0 63.2 63.4 62.6 66.3
Commercial Services 16.1 15.0 15.9 12.8 14.2 12.8
of which : Communication services 10.3 8.7 8.9 6.8 8.4 6.4
Construction services 0.0 0.0 0.0 0.0 0.0 -
Insurance Services 0.6 0.6 0.8 0.4 0.4 0.6
Financial Services 0.6 0.8 1.2 1.2 1.2 2.2
Computer and Information services 2.0 1.9 1.8 1.7 1.4 1.5
Royalties and licence fees 0.3 0.3 0.3 0.6 0.4 0.5
Other Business Services 1.8 2.1 2.4 1.2 1.1 0.4
Personal, cultural and recreational service 0.5 0.5 0.5 1.0 1.2 1.3
Government Services 1.9 1.6 1.6 1.6 1.5 1.5
PAYMENT OF SERVICES (DEBITS) 100.0 100.0 100.0 100.0 100.0 100.0
Transportation 41.1 40.1 38.5 39.0 37.5 41.9
Travel 14.7 13.6 16.2 15.9 16.6 14.4
Commercial Services 41.9 44.1 42.5 42.1 43.1 41.0
of which : Communication services 2.2 3.3 3.3 2.9 2.8 2.7
Construction services 0.7 0.7 0.4 0.3 0.3 0.3
Insurance Services 6.1 6.2 7.4 6.1 7.2 7.7
Financial Services 1.3 2.0 1.1 1.0 1.9 2.0
Computer and Information services 0.5 0.9 0.7 1.3 4.3 1.0
Royalties and licence fees 2.9 2.5 2.0 0.7 0.5 0.6
Other Business Services 27.9 28.2 27.3 29.6 25.9 26.5
Personal, cultural and recreational service 0.3 0.3 0.3 0.2 0.1 0.1
Government Services 2.2 2.2 2.9 3.1 2.8 2.7
TABLE 2.8.2: PERCENTAGE DISTRIBUTION OF JAMAICA'S TRADE IN SERVICES,BY BROAD SERVICE AREA: 2000 - 2005
66
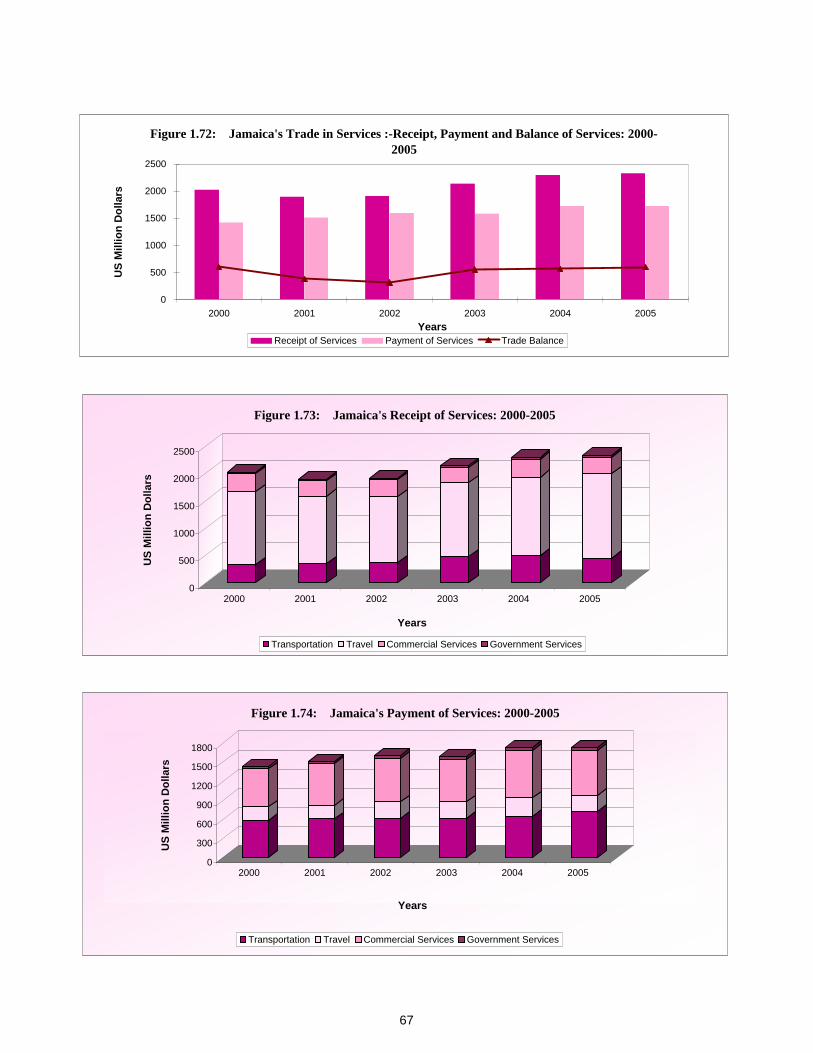
Figure 1.72: Jamaica's Trade in Services :-Receipt, Payment and Balance of Services: 2000-2005
0
500
1000
1500
2000
2500
2000 2001 2002 2003 2004 2005Years
US
Mill
ion
Dol
lars
Receipt of Services Payment of Services Trade Balance
0
500
1000
1500
2000
2500
US
Mill
ion
Dol
lars
2000 2001 2002 2003 2004 2005
Years
Figure 1.73: Jamaica's Receipt of Services: 2000-2005
Transportation Travel Commercial Services Government Services
0
300
600
900
1200
1500
1800
US
Mill
ion
Dol
lars
2000 2001 2002 2003 2004 2005
Years
Figure 1.74: Jamaica's Payment of Services: 2000-2005
Transportation Travel Commercial Services Government Services
67

(US$Mn)
2000 2001 2002 2003 2004 2005
RECEIPT OF SERVICES (CREDITS) 16.2 14.7 13.9 12.1 14.9 14.8
Transportation 1.2 1.3 1.4 1.4 1.4 1.4
Travel 9.0 8.5 8.7 7.3 9.2 9.0
Commercial Services 5.9 4.7 3.7 3.1 4.1 4.2
of which : Communication services … … … … … …
Construction services - - - - - -
Insurance Services 0.2 0.2 0.3 0.3 0.4 0.6
Financial Services 0.4 0.5 0.6 0.8 0.6 0.5
Computer and Information services - - - - - -
Royalties and licence fees - - - - - -
Other Business Services 5.3 4.0 2.8 2.0 3.1 3.1
Personal, cultural and recreational service … … … … … …
Government Services 0.2 0.2 0.2 0.2 0.2 0.3
PAYMENT OF SERVICES (DEBITS) 22.4 20.8 15.6 16.5 23.2 25.6
Transportation 3.7 3.5 4.2 4.5 4.7 4.8
Travel 1.8 1.8 1.9 1.9 2.1 2.6
Commercial Services 5.2 5.7 4.7 5.1 9.9 8.9
of which : Communication services … … … … … …
Construction services 0.1 0.1 0.0 0.4 3.6 2.9
Insurance Services 0.6 0.5 0.6 0.7 0.8 1.0
Financial Services - - - - - -
Computer and Information services - - 0.1 0.1 0.1 0.0
Royalties and licence fees 0.0 0.0 0.0 0.1 0.1 0.1
Other Business Services 4.5 5.1 3.9 3.9 5.3 4.9
Personal, cultural and recreational service … … … … … …
Government Services 11.7 9.7 4.9 5.0 6.5 9.3
BALANCE OF SERVICES -6.2 -6.1 -1.7 -4.4 -8.3 -10.8
Transportation -2.5 -2.1 -2.8 -3.0 -3.3 -3.4
Travel 7.2 6.7 6.8 5.4 7.1 6.4
Commercial Services 0.7 -1.0 -1.0 -2.0 -5.8 -4.7
of which : Communication services … … … … … …
Construction services -0.1 -0.1 -0.0 -0.4 -3.6 -2.9
Insurance Services -0.4 -0.3 -0.3 -0.4 -0.4 -0.4
Financial Services 0.4 0.5 0.6 0.8 0.6 0.5
Computer and Information services - - -0.1 -0.1 -0.1 -0.0
Royalties and licence fees -0.0 -0.0 -0.0 -0.1 -0.1 -0.1
Other Business Services 0.8 -1.1 -1.2 -1.8 -2.2 -1.8
Personal, cultural and recreational service … … … … … …
Government Services -11.5 -9.6 -4.7 -4.8 -6.3 -9.0
BY BROAD SERVICE AREA: 2000-2005 TABLE 2.9.1: VALUE OF MONTSERRAT'S TRADE IN SERVICES,
68
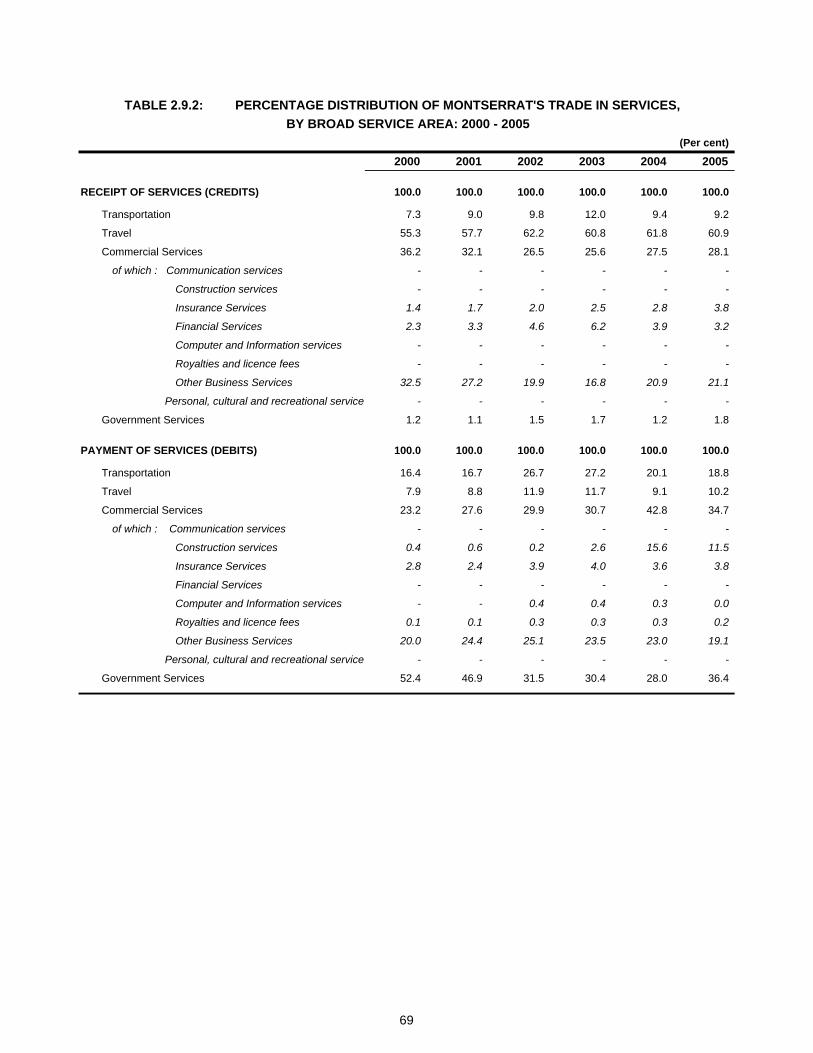
(Per cent)
2000 2001 2002 2003 2004 2005
RECEIPT OF SERVICES (CREDITS) 100.0 100.0 100.0 100.0 100.0 100.0
Transportation 7.3 9.0 9.8 12.0 9.4 9.2
Travel 55.3 57.7 62.2 60.8 61.8 60.9
Commercial Services 36.2 32.1 26.5 25.6 27.5 28.1
of which : Communication services - - - - - -
Construction services - - - - - -
Insurance Services 1.4 1.7 2.0 2.5 2.8 3.8
Financial Services 2.3 3.3 4.6 6.2 3.9 3.2
Computer and Information services - - - - - -
Royalties and licence fees - - - - - -
Other Business Services 32.5 27.2 19.9 16.8 20.9 21.1
Personal, cultural and recreational service - - - - - -
Government Services 1.2 1.1 1.5 1.7 1.2 1.8
PAYMENT OF SERVICES (DEBITS) 100.0 100.0 100.0 100.0 100.0 100.0
Transportation 16.4 16.7 26.7 27.2 20.1 18.8
Travel 7.9 8.8 11.9 11.7 9.1 10.2
Commercial Services 23.2 27.6 29.9 30.7 42.8 34.7
of which : Communication services - - - - - -
Construction services 0.4 0.6 0.2 2.6 15.6 11.5
Insurance Services 2.8 2.4 3.9 4.0 3.6 3.8
Financial Services - - - - - -
Computer and Information services - - 0.4 0.4 0.3 0.0
Royalties and licence fees 0.1 0.1 0.3 0.3 0.3 0.2
Other Business Services 20.0 24.4 25.1 23.5 23.0 19.1
Personal, cultural and recreational service - - - - - -
Government Services 52.4 46.9 31.5 30.4 28.0 36.4
TABLE 2.9.2: PERCENTAGE DISTRIBUTION OF MONTSERRAT'S TRADE IN SERVICES,BY BROAD SERVICE AREA: 2000 - 2005
69

Figure 1.75: Montserrat's Trade in Services :-Receipt, Payment and Balance of Services: 2000-2005
-15
-10
-5
0
5
10
15
20
25
30
2000 2001 2002 2003 2004 2005Years
US
Mill
ion
Dol
lars
Receipt of Services Payment of Services Trade Balance
0
5
10
15
20
25
30
US
Mill
ion
Dol
lars
2000 2001 2002 2003 2004 2005
Years
Figure 1.76: Montserrat's Receipt of Services: 2000-2005
Transportation Travel Commercial Services Government Services
0
5
10
15
20
25
US
Mill
ion
Dol
lars
2000 2001 2002 2003 2004 2005
Years
Figure 1.77: Montserrat's Payment of Services: 2000-2005
Transportation Travel Commercial Services Government Services
70

(US$Mn)
2000 2001 2002 2003 2004 2005
RECEIPT OF SERVICES (CREDITS) 98.5 97.9 90.2 107.2 136.1 147.7
Transportation 10.5 11.4 10.0 9.3 9.8 10.3
Travel 58.4 61.9 57.1 75.3 103.4 110.2
Commercial Services 26.1 20.4 18.8 18.3 18.8 22.6
of which : Communication services … … … … … …
Construction services 1.6 1.6 1.8 0.1 0.2 0.4
Insurance Services 3.2 2.1 2.2 1.9 1.9 2.0
Financial Services 6.8 6.2 4.9 5.0 6.1 7.5
Computer and Information services - - - - - -
Royalties and licence fees - - - 0.1 - -
Other Business Services 14.6 10.6 9.8 11.2 10.5 12.7
Personal, cultural and recreational service … … … … … …
Government Services 3.5 4.2 4.2 4.2 4.1 4.6
PAYMENT OF SERVICES (DEBITS) 76.0 74.9 78.6 80.0 83.1 92.0
Transportation 31.6 30.8 31.9 33.4 34.7 38.2
Travel 8.8 8.1 7.6 8.1 9.7 10.0
Commercial Services 31.8 31.7 33.7 32.8 34.2 39.2
of which : Communication services … … … … … …
Construction services 5.1 3.9 4.8 4.6 1.5 3.8
Insurance Services 8.5 8.4 9.5 9.1 9.0 10.7
Financial Services 0.0 0.8 0.6 1.3 0.1 -
Computer and Information services - - - - 0.0 0.0
Royalties and licence fees 0.8 0.9 0.8 1.3 1.8 2.0
Other Business Services 17.4 17.8 18.0 16.6 21.8 22.7
Personal, cultural and recreational service … … … … … …
Government Services 3.7 4.3 5.4 5.6 4.5 4.6
BALANCE OF SERVICES 22.5 23.0 11.7 27.2 53.0 55.8
Transportation -21.1 -19.4 -21.9 -24.1 -24.9 -27.8
Travel 49.6 53.8 49.5 67.2 93.7 100.3
Commercial Services -5.8 -11.3 -14.9 -14.5 -15.4 -16.7
of which : Communication services … … … … … …
Construction services -3.6 -2.3 -2.9 -4.6 -1.2 -3.4
Insurance Services -5.3 -6.3 -7.3 -7.2 -7.1 -8.7
Financial Services 6.8 5.4 4.3 3.8 6.0 7.5
Computer and Information services - - - - -0.0 -0.0
Royalties and licence fees -0.8 -0.9 -0.8 -1.2 -1.8 -2.0
Other Business Services -2.9 -7.2 -8.2 -5.4 -11.3 -10.0
Personal, cultural and recreational service … … … … … …
Government Services -0.2 -0.1 -1.1 -1.4 -0.5 0.0
BY BROAD SERVICE AREA: 2000-2005TABLE 2.10.1: VALUE OF ST. KITTS AND NEVIS' TRADE IN SERVICES,
71
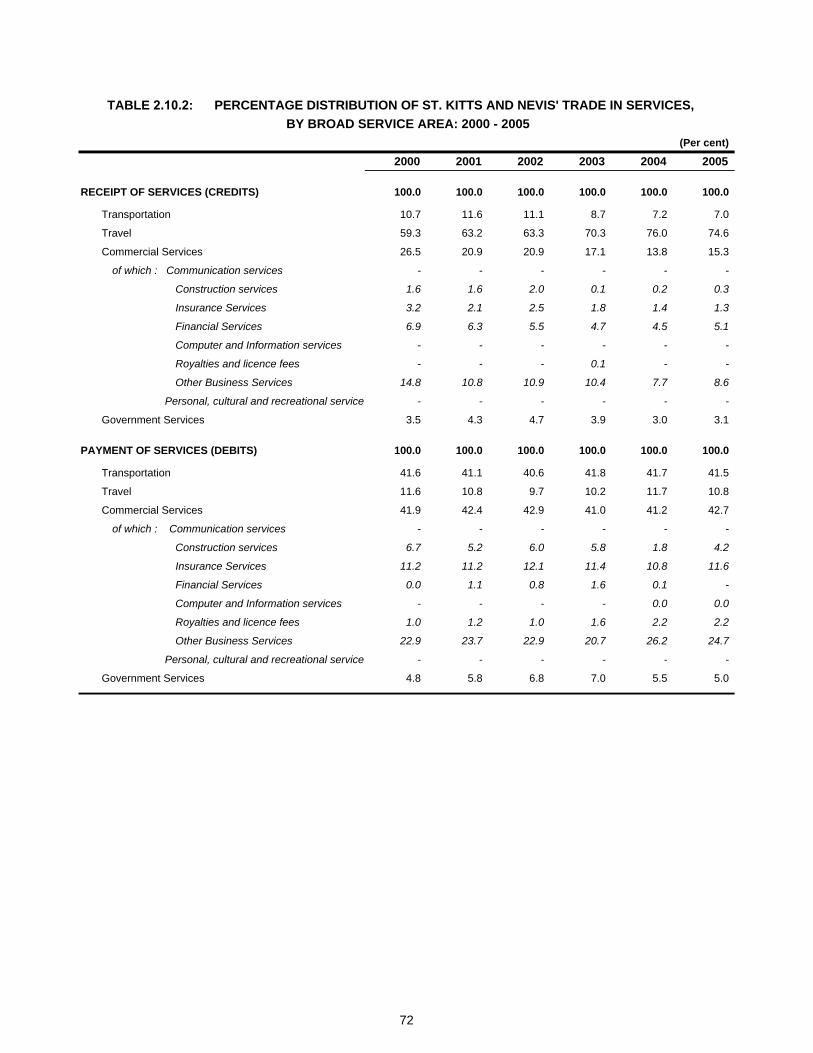
(Per cent)
2000 2001 2002 2003 2004 2005
RECEIPT OF SERVICES (CREDITS) 100.0 100.0 100.0 100.0 100.0 100.0
Transportation 10.7 11.6 11.1 8.7 7.2 7.0
Travel 59.3 63.2 63.3 70.3 76.0 74.6
Commercial Services 26.5 20.9 20.9 17.1 13.8 15.3
of which : Communication services - - - - - -
Construction services 1.6 1.6 2.0 0.1 0.2 0.3
Insurance Services 3.2 2.1 2.5 1.8 1.4 1.3
Financial Services 6.9 6.3 5.5 4.7 4.5 5.1
Computer and Information services - - - - - -
Royalties and licence fees - - - 0.1 - -
Other Business Services 14.8 10.8 10.9 10.4 7.7 8.6
Personal, cultural and recreational service - - - - - -
Government Services 3.5 4.3 4.7 3.9 3.0 3.1
PAYMENT OF SERVICES (DEBITS) 100.0 100.0 100.0 100.0 100.0 100.0
Transportation 41.6 41.1 40.6 41.8 41.7 41.5
Travel 11.6 10.8 9.7 10.2 11.7 10.8
Commercial Services 41.9 42.4 42.9 41.0 41.2 42.7
of which : Communication services - - - - - -
Construction services 6.7 5.2 6.0 5.8 1.8 4.2
Insurance Services 11.2 11.2 12.1 11.4 10.8 11.6
Financial Services 0.0 1.1 0.8 1.6 0.1 -
Computer and Information services - - - - 0.0 0.0
Royalties and licence fees 1.0 1.2 1.0 1.6 2.2 2.2
Other Business Services 22.9 23.7 22.9 20.7 26.2 24.7
Personal, cultural and recreational service - - - - - -
Government Services 4.8 5.8 6.8 7.0 5.5 5.0
TABLE 2.10.2: PERCENTAGE DISTRIBUTION OF ST. KITTS AND NEVIS' TRADE IN SERVICES,BY BROAD SERVICE AREA: 2000 - 2005
72

0
20
40
60
80
100
US
Mill
ion
Dol
lars
2000 2001 2002 2003 2004 2005
Years
Figure 1.79: St. Kitts and Nevis' Receipt of Services: 2000-2005
Transportation Travel Commercial Services Government Services
0
20
40
60
80
100
US
Mill
ion
Dol
lars
2000 2001 2002 2003 2004 2005
Years
Figure 1.80: St. Kitts and Nevis' Payment of Services: 2000-2005
Transportation Travel Commercial Services Government Services
Figure 1.78: St. Kitts and Nevis' Trade in Services :-Receipt, Payment and Balance of Services: 2000-2005
020406080
100120140160
2000 2001 2002 2003 2004 2005
Years
US
Mill
ion
Dol
lars
Receipt of Services Payment of Services Trade Balance
73

(US$Mn)
2000 2001 2002 2003 2004 2005
RECEIPT OF SERVICES (CREDITS) 322.1 272.8 249.2 317.0 367.1 410.1
Transportation 13.3 11.8 10.9 11.5 15.3 21.6
Travel 278.6 233.0 210.0 282.1 325.7 356.0
Commercial Services 28.8 26.6 26.9 22.0 24.7 30.8
of which : Communication services … … … … … …
Construction services - - - - - -
Insurance Services 4.1 5.0 4.6 4.4 4.2 5.6
Financial Services - - - - - -
Computer and Information services 5.0 3.5 2.4 2.4 2.4 3.3
Royalties and licence fees - - - - - -
Other Business Services 19.7 18.2 19.9 15.2 18.1 21.8
Personal, cultural and recreational service … … … … … …
Government Services 1.4 1.4 1.4 1.5 1.5 1.7
PAYMENT OF SERVICES (DEBITS) 133.5 130.6 128.1 142.2 152.7 171.1
Transportation 53.2 53.9 50.5 62.2 68.3 72.9
Travel 33.3 31.7 33.7 35.6 36.8 38.9
Commercial Services 39.7 39.1 38.7 39.8 43.1 56.6
of which : Communication services … … … … … …
Construction services - - - - - -
Insurance Services 9.9 9.3 9.5 10.8 12.0 13.3
Financial Services - - - - - -
Computer and Information services - 0.4 0.3 0.5 0.4 -
Royalties and licence fees 1.6 1.4 1.0 0.9 2.4 2.4
Other Business Services 28.2 28.1 27.8 27.5 28.3 40.9
Personal, cultural and recreational service … … … … … …
Government Services 7.3 5.9 5.2 4.6 4.5 2.7
BALANCE OF SERVICES 188.6 142.2 121.1 174.8 214.4 239.0
Transportation -39.9 -42.1 -39.6 -50.7 -53.0 -51.2
Travel 245.3 201.3 176.3 246.4 288.8 317.1
Commercial Services -10.8 -12.5 -11.8 -17.8 -18.4 -25.8
of which : Communication services - - - - - -
Construction services - - - - - -
Insurance Services -5.8 -4.3 -5.0 -6.4 -7.8 -7.7
Financial Services - - - - - -
Computer and Information services 5.0 3.1 2.1 1.9 2.0 3.3
Royalties and licence fees -1.6 -1.4 -1.0 -0.9 -2.4 -2.4
Other Business Services -8.5 -9.9 -7.9 -12.4 -10.2 -19.1
Personal, cultural and recreational service … … … … … …
Government Services -6.0 -4.5 -3.7 -3.2 -3.0 -1.0
BY BROAD SERVICE AREA: 2000-2005TABLE 2.11.1: VALUE OF SAINT LUCIA'S TRADE IN SERVICES,
74

(Per cent)
2000 2001 2002 2003 2004 2005
RECEIPT OF SERVICES (CREDITS) 100.0 100.0 100.0 100.0 100.0 100.0
Transportation 4.1 4.3 4.4 3.6 4.2 5.3
Travel 86.5 85.4 84.3 89.0 88.7 86.8
Commercial Services 8.9 9.8 10.8 6.9 6.7 7.5
of which : Communication services - - - - - -
Construction services - - - - - -
Insurance Services 1.3 1.8 1.8 1.4 1.1 1.4
Financial Services - - - - - -
Computer and Information services 1.6 1.3 1.0 0.8 0.7 0.8
Royalties and licence fees - - - - - -
Other Business Services 6.1 6.7 8.0 4.8 4.9 5.3
Personal, cultural and recreational service - - - - - -
Government Services 0.4 0.5 0.6 0.5 0.4 0.4
PAYMENT OF SERVICES (DEBITS) 100.0 100.0 100.0 100.0 100.0 100.0
Transportation 39.8 41.3 39.5 43.7 44.7 42.6
Travel 24.9 24.3 26.3 25.1 24.1 22.7
Commercial Services 29.7 30.0 30.2 28.0 28.2 33.1
of which : Communication services - - - - - -
Construction services - - - - - -
Insurance Services 7.4 7.1 7.4 7.6 7.9 7.8
Financial Services - - - - - -
Computer and Information services - 0.3 0.3 0.4 0.3 -
Royalties and licence fees 1.2 1.1 0.8 0.7 1.6 1.4
Other Business Services 21.2 21.5 21.7 19.4 18.5 23.9
Personal, cultural and recreational service - - - - - -
Government Services 5.5 4.5 4.0 3.3 3.0 1.6
TABLE 2.11.2: PERCENTAGE DISTRIBUTION OF SAINT LUCIA'S TRADE IN SERVICES,BY BROAD SERVICE AREA: 2000 - 2005
75
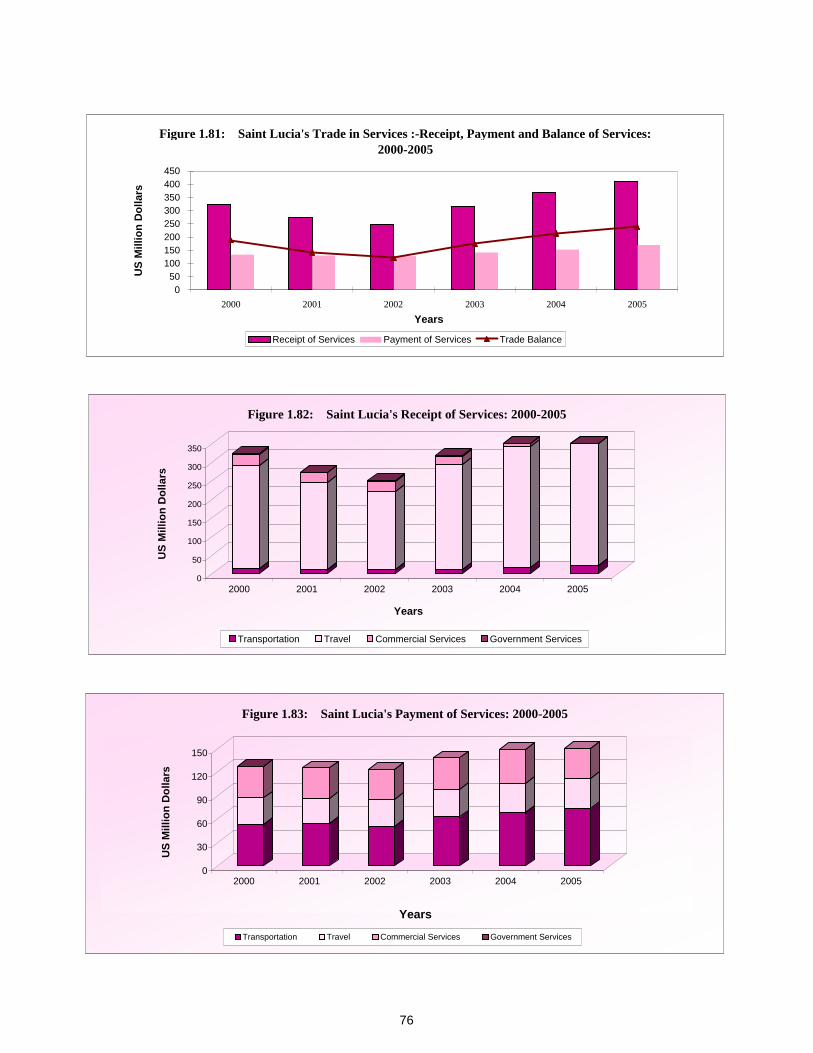
Figure 1.81: Saint Lucia's Trade in Services :-Receipt, Payment and Balance of Services: 2000-2005
050
100150200250300350400450
2000 2001 2002 2003 2004 2005Years
US
Mill
ion
Dol
lars
Receipt of Services Payment of Services Trade Balance
0
50
100
150
200
250
300
350
US
Mill
ion
Dol
lars
2000 2001 2002 2003 2004 2005
Years
Figure 1.82: Saint Lucia's Receipt of Services: 2000-2005
Transportation Travel Commercial Services Government Services
0
30
60
90
120
150
US
Mill
ion
Dol
lars
2000 2001 2002 2003 2004 2005
Years
Figure 1.83: Saint Lucia's Payment of Services: 2000-2005
Transportation Travel Commercial Services Government Services
76
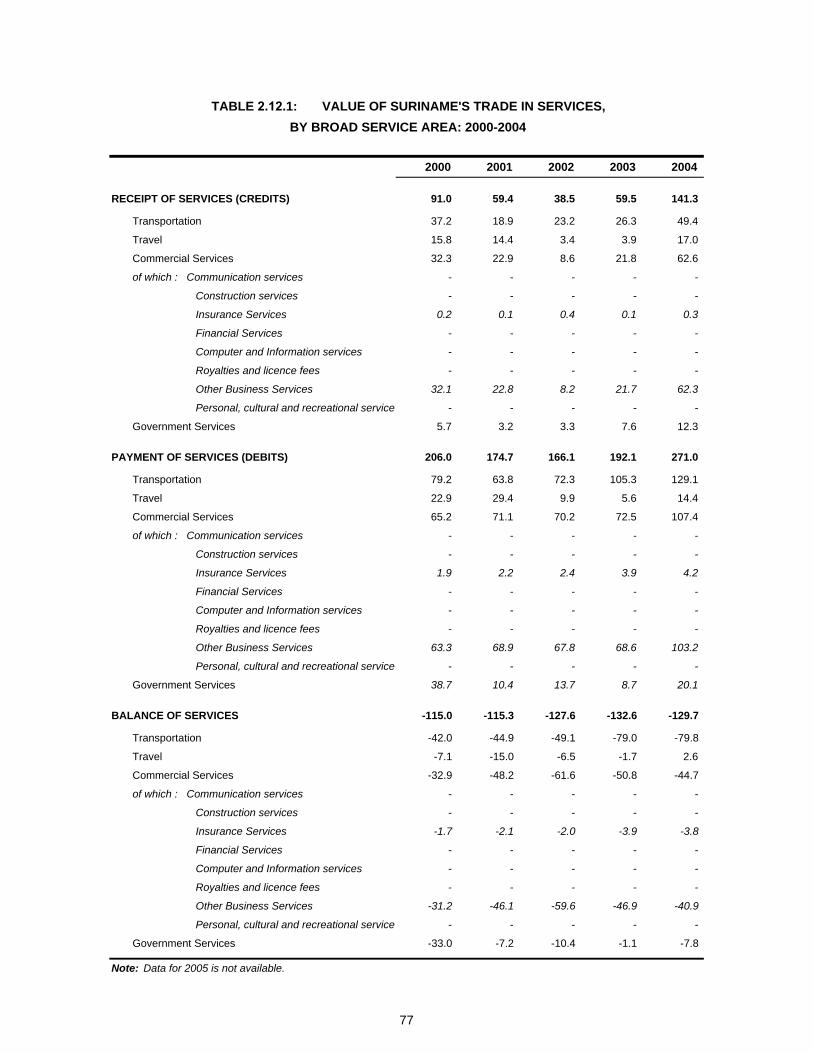
2000 2001 2002 2003 2004
RECEIPT OF SERVICES (CREDITS) 91.0 59.4 38.5 59.5 141.3
Transportation 37.2 18.9 23.2 26.3 49.4
Travel 15.8 14.4 3.4 3.9 17.0
Commercial Services 32.3 22.9 8.6 21.8 62.6
of which : Communication services - - - - -
Construction services - - - - -
Insurance Services 0.2 0.1 0.4 0.1 0.3
Financial Services - - - - -
Computer and Information services - - - - -
Royalties and licence fees - - - - -
Other Business Services 32.1 22.8 8.2 21.7 62.3
Personal, cultural and recreational service - - - - -
Government Services 5.7 3.2 3.3 7.6 12.3
PAYMENT OF SERVICES (DEBITS) 206.0 174.7 166.1 192.1 271.0
Transportation 79.2 63.8 72.3 105.3 129.1
Travel 22.9 29.4 9.9 5.6 14.4
Commercial Services 65.2 71.1 70.2 72.5 107.4
of which : Communication services - - - - -
Construction services - - - - -
Insurance Services 1.9 2.2 2.4 3.9 4.2
Financial Services - - - - -
Computer and Information services - - - - -
Royalties and licence fees - - - - -
Other Business Services 63.3 68.9 67.8 68.6 103.2
Personal, cultural and recreational service - - - - -
Government Services 38.7 10.4 13.7 8.7 20.1
BALANCE OF SERVICES -115.0 -115.3 -127.6 -132.6 -129.7
Transportation -42.0 -44.9 -49.1 -79.0 -79.8
Travel -7.1 -15.0 -6.5 -1.7 2.6
Commercial Services -32.9 -48.2 -61.6 -50.8 -44.7
of which : Communication services - - - - -
Construction services - - - - -
Insurance Services -1.7 -2.1 -2.0 -3.9 -3.8
Financial Services - - - - -
Computer and Information services - - - - -
Royalties and licence fees - - - - -
Other Business Services -31.2 -46.1 -59.6 -46.9 -40.9
Personal, cultural and recreational service - - - - -
Government Services -33.0 -7.2 -10.4 -1.1 -7.8
Note: Data for 2005 is not available.
TABLE 2.12.1: VALUE OF SURINAME'S TRADE IN SERVICES, BY BROAD SERVICE AREA: 2000-2004
77

(Per cent)
2000 2001 2002 2003 2004
RECEIPT OF SERVICES (CREDITS) 100.0 100.0 100.0 100.0 100.0
Transportation 40.9 31.9 60.3 44.1 34.9
Travel 17.4 24.2 8.8 6.6 12.0
Commercial Services 35.5 38.5 22.3 36.6 44.3
of which : Communication services - - - - -
Construction services - - - - -
Insurance Services 0.2 0.1 1.0 0.1 0.2
Financial Services - - - - -
Computer and Information services - - - - -
Royalties and licence fees - - - - -
Other Business Services 35.3 38.4 21.3 36.5 44.1
Personal, cultural and recreational service - - - - -
Government Services 6.3 5.4 8.6 12.8 8.7
PAYMENT OF SERVICES (DEBITS) 100.0 100.0 100.0 100.0 100.0
Transportation 38.4 36.5 43.5 54.8 47.7
Travel 11.1 16.8 6.0 2.9 5.3
Commercial Services 31.7 40.7 42.3 37.8 39.6
of which : Communication services - - - - -
Construction services - - - - -
Insurance Services 0.9 1.2 1.5 2.0 1.5
Financial Services - - - - -
Computer and Information services - - - - -
Royalties and licence fees - - - - -
Other Business Services 30.7 39.4 40.8 35.7 38.1
Personal, cultural and recreational service - - - - -
Government Services 18.8 6.0 8.2 4.5 7.4
TABLE 2.12.2: PERCENTAGE DISTRIBUTION OF SURINAME'S TRADE IN SERVICES,BY BROAD SERVICE AREA: 2000 - 2004
78
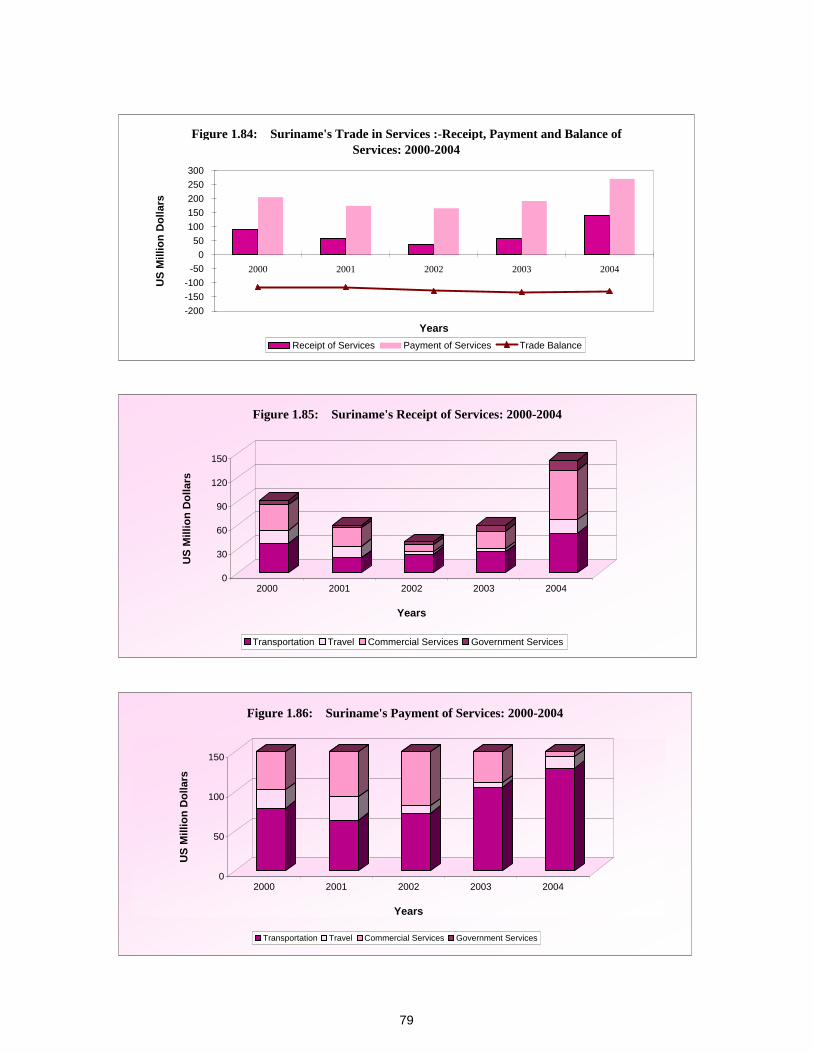
Figure 1.84: Suriname's Trade in Services :-Receipt, Payment and Balance of Services: 2000-2004
-200-150-100-50
050
100150200250300
2000 2001 2002 2003 2004
Years
US
Mill
ion
Dol
lars
Receipt of Services Payment of Services Trade Balance
0
30
60
90
120
150
US
Mill
ion
Dol
lars
2000 2001 2002 2003 2004
Years
Figure 1.85: Suriname's Receipt of Services: 2000-2004
Transportation Travel Commercial Services Government Services
0
50
100
150
US
Mill
ion
Dol
lars
2000 2001 2002 2003 2004
Years
Figure 1.86: Suriname's Payment of Services: 2000-2004
Transportation Travel Commercial Services Government Services
79

(US$Mn)
2000 2001 2002 2003 2004 2005
RECEIPT OF SERVICES (CREDITS) 127.6 133.2 136.6 132.1 144.5 158.8
Transportation 11.5 9.6 10.9 10.2 11.6 10.5
Travel 82.3 89.0 91.0 91.2 95.6 105.1
Commercial Services 32.4 33.3 33.3 29.7 36.1 41.1
of which : Communication services 11.7 11.6 12.2 12.5 12.5 -
Construction services - - - - - -
Insurance Services 4.7 6.2 6.5 7.3 11.8 2.3
Financial Services - - - - - 14.0
Computer and Information services - - 0.2 - - -
Royalties and licence fees - - - - - -
Other Business Services 16.0 15.5 14.4 9.9 11.8 24.8
Personal, cultural and recreational service - - - - - -
Government Services 1.5 1.3 1.4 1.0 1.2 2.0
PAYMENT OF SERVICES (DEBITS) 54.3 57.5 57.1 64.6 73.2 85.0
Transportation 23.6 26.0 27.1 29.6 32.4 34.4
Travel 9.5 11.5 10.2 12.6 14.3 14.9
Commercial Services 17.6 16.7 17.0 18.8 22.7 29.3
of which : Communication services 5.6 4.0 5.3 3.5 3.9 -
Construction services - - - - - -
Insurance Services 5.3 6.1 7.0 8.8 8.7 7.9
Financial Services 0.2 0.2 0.1 0.2 0.3 -
Computer and Information services - - - 0.2 - -
Royalties and licence fees 0.5 0.5 0.3 0.3 0.4 0.4
Other Business Services 5.9 5.8 4.2 5.9 9.5 21.0
Personal, cultural and recreational service - - - - - -
Government Services 3.7 3.3 2.8 3.5 3.9 6.4
BALANCE OF SERVICES 73.3 75.7 79.5 67.5 71.3 73.7
Transportation -12.1 -16.4 -16.2 -19.4 -20.7 -23.9
Travel 72.8 77.5 80.8 78.5 81.3 90.2
Commercial Services 14.8 16.6 16.3 10.9 13.4 11.8
of which : Communication services 6.2 7.6 6.9 9.0 8.6 -
Construction services - - - - - -
Insurance Services -0.6 0.1 -0.6 -1.5 3.1 -5.6
Financial Services -0.2 -0.2 -0.1 -0.2 -0.3 14.0
Computer and Information services - - 0.2 -0.2 - -
Royalties and licence fees -0.5 -0.5 -0.3 -0.3 -0.4 -0.4
Other Business Services 10.1 9.6 10.1 4.0 2.4 3.8
Personal, cultural and recreational service - - - - - -
Government Services -2.2 -1.9 -1.4 -2.5 -2.7 -4.4
BY BROAD SERVICE AREA: 2000-2005TABLE 2.13.1: VALUE OF ST. VINCENT AND THE GRENADINES' TRADE IN SERVICES,
80
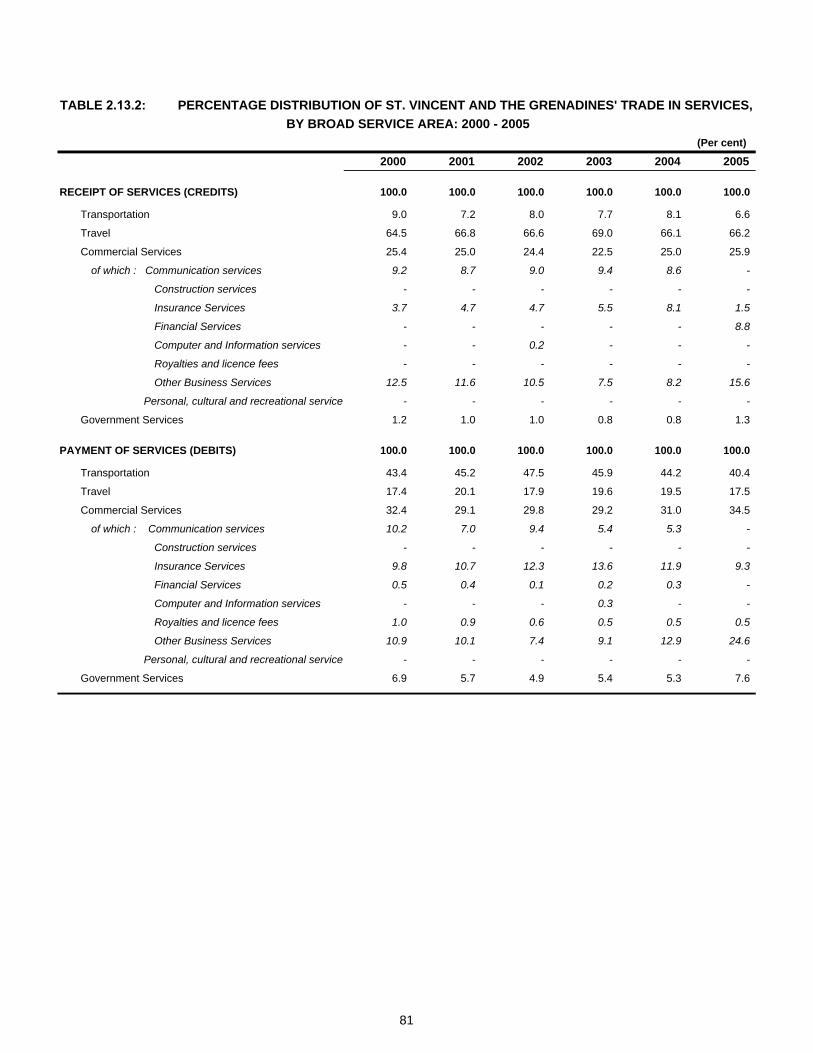
(Per cent)
2000 2001 2002 2003 2004 2005
RECEIPT OF SERVICES (CREDITS) 100.0 100.0 100.0 100.0 100.0 100.0
Transportation 9.0 7.2 8.0 7.7 8.1 6.6
Travel 64.5 66.8 66.6 69.0 66.1 66.2
Commercial Services 25.4 25.0 24.4 22.5 25.0 25.9
of which : Communication services 9.2 8.7 9.0 9.4 8.6 -
Construction services - - - - - -
Insurance Services 3.7 4.7 4.7 5.5 8.1 1.5
Financial Services - - - - - 8.8
Computer and Information services - - 0.2 - - -
Royalties and licence fees - - - - - -
Other Business Services 12.5 11.6 10.5 7.5 8.2 15.6
Personal, cultural and recreational service - - - - - -
Government Services 1.2 1.0 1.0 0.8 0.8 1.3
PAYMENT OF SERVICES (DEBITS) 100.0 100.0 100.0 100.0 100.0 100.0
Transportation 43.4 45.2 47.5 45.9 44.2 40.4
Travel 17.4 20.1 17.9 19.6 19.5 17.5
Commercial Services 32.4 29.1 29.8 29.2 31.0 34.5
of which : Communication services 10.2 7.0 9.4 5.4 5.3 -
Construction services - - - - - -
Insurance Services 9.8 10.7 12.3 13.6 11.9 9.3
Financial Services 0.5 0.4 0.1 0.2 0.3 -
Computer and Information services - - - 0.3 - -
Royalties and licence fees 1.0 0.9 0.6 0.5 0.5 0.5
Other Business Services 10.9 10.1 7.4 9.1 12.9 24.6
Personal, cultural and recreational service - - - - - -
Government Services 6.9 5.7 4.9 5.4 5.3 7.6
TABLE 2.13.2: PERCENTAGE DISTRIBUTION OF ST. VINCENT AND THE GRENADINES' TRADE IN SERVICES,BY BROAD SERVICE AREA: 2000 - 2005
81

Figure 1.87: St. Vincent and the Grenadines' Trade in Services :-Receipt, Payment and Balance of Services: 2000-2005
020406080
100120140160180
2000 2001 2002 2003 2004 2005
Years
US
Mill
ion
Dol
lars
Receipt of Services Payment of Services Trade Balance
0
25
50
75
100
125
150
US
Mill
ion
Dol
lars
2000 2001 2002 2003 2004 2005
Years
Figure 1.88: St. Vincent and the Grenadines' Receipt of Services: 2000-2005
Transportation Travel Commercial Services Government Services
0
20
40
60
80
100
US
Mill
ion
Dol
lars
2000 2001 2002 2003 2004 2005
Years
Figure 1.89: St. Vincent and the Grenadines' Payment of Services: 2000-2005
Transportation Travel Commercial Services Government Services
82

2000 2001 2002 2003 2004 2005
RECEIPT OF SERVICES (CREDITS) 553.7 603.6 637.0 685.2 850.8 896.9
Transportation 207.5 207.3 202.5 246.5 294.7 215.2
Travel 212.8 200.9 242.0 248.9 341.5 453.0
Commercial Services 122.8 155.0 153.6 176.5 201.4 214.7
of which : Communication services 36.3 29.8 29.9 39.5 45.3 37.6
Construction services … … … … … …
Insurance Services 45.8 78.6 99.8 108.2 113.2 135.2
Financial Services … … … … … …
Computer and Information services … … … … … …
Royalties and licence fees … … … … … …
Other Business Services 40.7 46.6 23.9 28.8 42.9 41.9
Personal, cultural and recreational service … … … … … …
Government Services 10.6 40.4 38.9 13.3 13.2 14.0
PAYMENT OF SERVICES (DEBITS) 387.7 370.0 373.0 371.4 371.3 540.7
Transportation 173.2 116.6 117.4 161.3 162.3 191.4
Travel 147.1 151.0 186.3 107.2 95.9 180.0
Commercial Services 42.9 71.5 36.6 66.5 55.9 99.4
of which : Communication services 5.5 5.6 5.4 3.5 5.8 16.4
Construction services … … … … … …
Insurance Services 0.1 8.1 0.2 0.1 0.2 30.5
Financial Services … … … … … …
Computer and Information services … … … … … …
Royalties and licence fees … … … … … …
Other Business Services 37.3 57.8 31.0 62.9 49.9 52.5
Personal, cultural and recreational service … … … … … …
Government Services 24.5 30.9 32.7 36.4 57.2 69.9
BALANCE OF SERVICES 166.0 233.6 264.0 313.8 479.5 356.2
Transportation 34.3 90.7 85.1 85.2 132.4 23.8
Travel 65.7 49.9 55.7 141.7 245.6 273.0
Commercial Services 79.9 83.5 117.0 110.0 145.5 115.3
of which : Communication services 30.8 24.2 24.5 36.0 39.5 21.2
Construction services … … … … … …
Insurance Services 45.7 70.5 99.6 108.1 113.0 104.7
Financial Services … … … … … …
Computer and Information services … … … … … …
Royalties and licence fees … … … … … …
Other Business Services 3.4 -11.2 -7.1 -34.1 -7.0 -10.6
Personal, cultural and recreational service … … … … … …
Government Services -13.9 9.5 6.2 -23.1 -44.0 -55.9
BY BROAD SERVICE AREA: 2000-2005TABLE 2.14.1: VALUE OF TRINIDAD & TOBAGO'S TRADE IN SERVICES,
83

2000 2001 2002 2003 2004 2005
RECEIPT OF SERVICES (CREDITS) 100.0 100.0 100.0 100.0 100.0 100.0
Transportation 37.5 34.3 31.8 36.0 34.6 24.0
Travel 38.4 33.3 38.0 36.3 40.1 50.5
Commercial Services 22.2 25.7 24.1 25.8 23.7 23.9
of which : Communication services 6.6 4.9 4.7 5.8 5.3 4.2
Construction services - - - - - -
Insurance Services 8.3 13.0 15.7 15.8 13.3 15.1
Financial Services - - - - - -
Computer and Information services - - - - - -
Royalties and licence fees - - - - - -
Other Business Services 7.4 7.7 3.8 4.2 5.0 4.7
Personal, cultural and recreational service - - - - - -
Government Services 1.9 6.7 6.1 1.9 1.6 1.6
PAYMENT OF SERVICES (DEBITS) 100.0 100.0 100.0 100.0 100.0 100.0
Transportation 44.7 31.5 31.5 43.4 43.7 35.4
Travel 37.9 40.8 49.9 28.9 25.8 33.3
Commercial Services 11.1 19.3 9.8 17.9 15.1 18.4
of which : Communication services 1.4 1.5 1.4 0.9 1.6 3.0
Construction services - - - - - -
Insurance Services 0.0 2.2 0.1 0.0 0.1 5.6
Financial Services - - - - - -
Computer and Information services - - - - - -
Royalties and licence fees - - - - - -
Other Business Services 9.6 15.6 8.3 16.9 13.4 9.7
Personal, cultural and recreational service - - - - - -
Government Services 6.3 8.4 8.8 9.8 15.4 12.9
TABLE 2.14.2: PERCENTAGE DISTRIBUTION OF TRINIDAD & TOBAGO'S TRADE IN SERVICES,BY BROAD SERVICE AREA: 2000 - 2005
84

Figure 1.90: Trinidad and Tobago's Trade in Services :- Receipt, Payment and Balance of Services: 2000-2005
0
200
400
600
800
1000
2000 2001 2002 2003 2004 2005
Years
US
Mill
ion
Dol
lars
Receipt of Services Payment of Services Trade Balance
0
100
200
300
400
500
US
Mill
ion
Dol
lars
2000 2001 2002 2003 2004 2005
Years
Figure 1.91: Trinidad and Tobago's Receipt of Services: 2000-2005
Transportation Travel Commercial Services Government Services
0
100
200
300
400
500
US
Mill
ion
Dol
lars
2000 2001 2002 2003 2004 2005
Years
Figure 1.92: Trinidad and Tobago's Payment of Services: 2000-2005
Transportation Travel Commercial Services Government Services
85

Section 3
CARICOM Member States’ Details of Trade in Services


(US$Mn)
2000 2001 2002 2003 2004 2005
RECEIPT OF SERVICES (CREDITS) 415.4 402.1 391.2 419.3 477.3 488.0
Transportation 65.7 74.6 76.7 80.6 79.7 84.6
Sea Transport 9.1 8.3 9.6 10.1 11.3 11.1
Air Transport 56.6 66.3 67.2 70.5 68.4 73.5
Travel 290.5 272.1 273.8 299.8 337.7 335.0
Insurance Services 15.9 12.0 8.9 6.6 13.9 15.5
Freight Insurance 1.5 0.4 0.4 - 0.0 -
Life insurance - - - - - -
General Insurance 0.6 0.6 0.7 0.8 1.1 1.1
Re - Insurance 10.7 7.1 3.1 0.6 6.9 7.4
Insurance Agents Commission 3.0 3.9 4.7 5.2 5.9 7.1
Financial Services 5.1 4.6 1.3 1.3 4.1 3.7
Other Business Services 30.1 31.2 26.4 27.3 35.5 40.8
Construction and Engineering Services
- - - - - -
Management and Consultancy Services
- - - - - -
Computer And Information Services - - - - - -
Royalty And Licenses Fees - - - - - -
Other Services 30.1 31.2 26.4 27.3 35.5 40.8
Government Services 8.0 7.6 4.1 3.7 6.4 8.4
Resident Government 7.3 7.0 3.6 3.2 5.8 7.8
Foreign Government 0.7 0.6 0.5 0.5 0.6 0.6
Other - - - - - -
TABLE 3.1.1: VALUE OF ANTIGUA AND BARBUDA'S RECEIPT OF SERVICES: 2000 - 2005
89
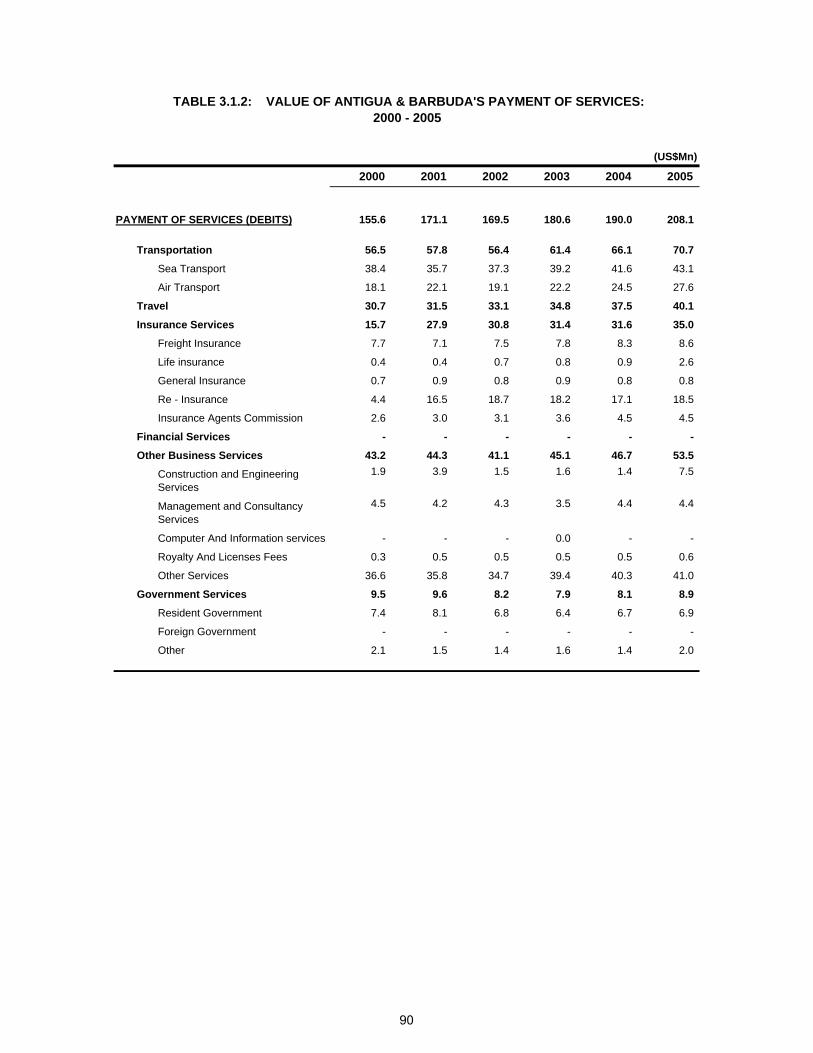
(US$Mn)
2000 2001 2002 2003 2004 2005
PAYMENT OF SERVICES (DEBITS) 155.6 171.1 169.5 180.6 190.0 208.1
Transportation 56.5 57.8 56.4 61.4 66.1 70.7
Sea Transport 38.4 35.7 37.3 39.2 41.6 43.1
Air Transport 18.1 22.1 19.1 22.2 24.5 27.6
Travel 30.7 31.5 33.1 34.8 37.5 40.1
Insurance Services 15.7 27.9 30.8 31.4 31.6 35.0
Freight Insurance 7.7 7.1 7.5 7.8 8.3 8.6
Life insurance 0.4 0.4 0.7 0.8 0.9 2.6
General Insurance 0.7 0.9 0.8 0.9 0.8 0.8
Re - Insurance 4.4 16.5 18.7 18.2 17.1 18.5
Insurance Agents Commission 2.6 3.0 3.1 3.6 4.5 4.5
Financial Services - - - - - -
Other Business Services 43.2 44.3 41.1 45.1 46.7 53.5
Construction and Engineering Services
1.9 3.9 1.5 1.6 1.4 7.5
Management and Consultancy Services
4.5 4.2 4.3 3.5 4.4 4.4
Computer And Information services - - - 0.0 - -
Royalty And Licenses Fees 0.3 0.5 0.5 0.5 0.5 0.6
Other Services 36.6 35.8 34.7 39.4 40.3 41.0
Government Services 9.5 9.6 8.2 7.9 8.1 8.9
Resident Government 7.4 8.1 6.8 6.4 6.7 6.9
Foreign Government - - - - - -
Other 2.1 1.5 1.4 1.6 1.4 2.0
TABLE 3.1.2: VALUE OF ANTIGUA & BARBUDA'S PAYMENT OF SERVICES: 2000 - 2005
90
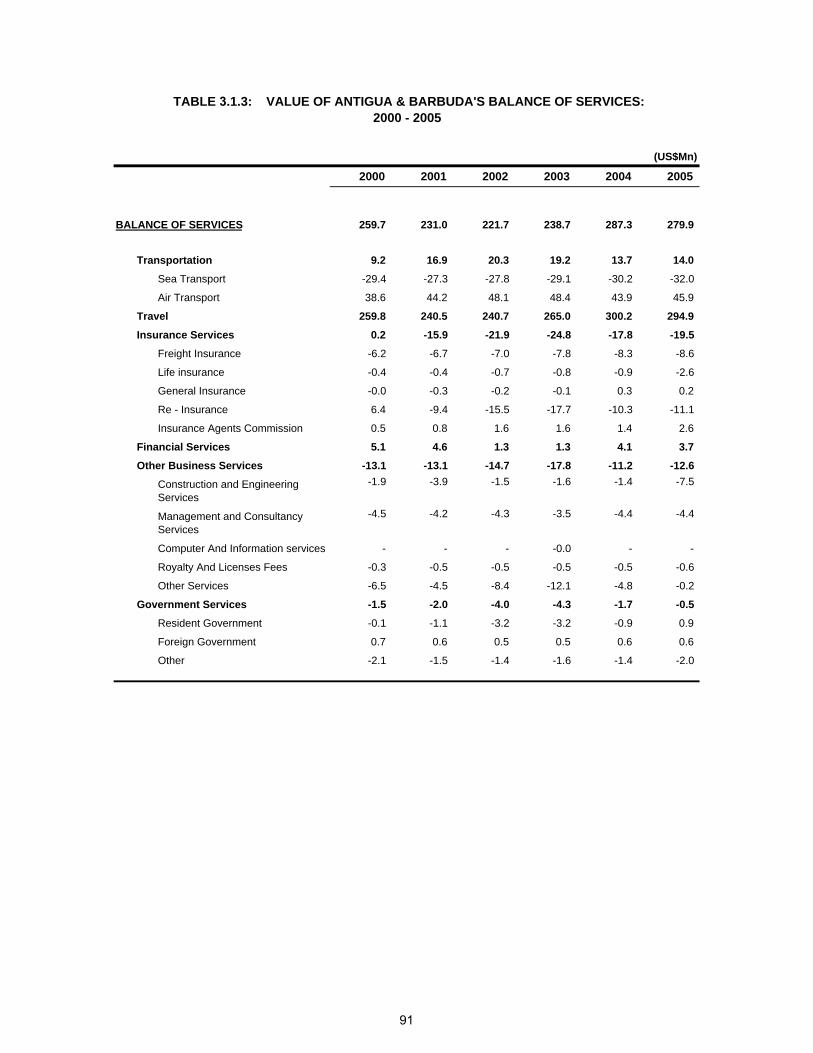
(US$Mn)
2000 2001 2002 2003 2004 2005
BALANCE OF SERVICES 259.7 231.0 221.7 238.7 287.3 279.9
Transportation 9.2 16.9 20.3 19.2 13.7 14.0
Sea Transport -29.4 -27.3 -27.8 -29.1 -30.2 -32.0
Air Transport 38.6 44.2 48.1 48.4 43.9 45.9
Travel 259.8 240.5 240.7 265.0 300.2 294.9
Insurance Services 0.2 -15.9 -21.9 -24.8 -17.8 -19.5
Freight Insurance -6.2 -6.7 -7.0 -7.8 -8.3 -8.6
Life insurance -0.4 -0.4 -0.7 -0.8 -0.9 -2.6
General Insurance -0.0 -0.3 -0.2 -0.1 0.3 0.2
Re - Insurance 6.4 -9.4 -15.5 -17.7 -10.3 -11.1
Insurance Agents Commission 0.5 0.8 1.6 1.6 1.4 2.6
Financial Services 5.1 4.6 1.3 1.3 4.1 3.7
Other Business Services -13.1 -13.1 -14.7 -17.8 -11.2 -12.6
Construction and Engineering Services
-1.9 -3.9 -1.5 -1.6 -1.4 -7.5
Management and Consultancy Services
-4.5 -4.2 -4.3 -3.5 -4.4 -4.4
Computer And Information services - - - -0.0 - -
Royalty And Licenses Fees -0.3 -0.5 -0.5 -0.5 -0.5 -0.6
Other Services -6.5 -4.5 -8.4 -12.1 -4.8 -0.2
Government Services -1.5 -2.0 -4.0 -4.3 -1.7 -0.5
Resident Government -0.1 -1.1 -3.2 -3.2 -0.9 0.9
Foreign Government 0.7 0.6 0.5 0.5 0.6 0.6
Other -2.1 -1.5 -1.4 -1.6 -1.4 -2.0
TABLE 3.1.3: VALUE OF ANTIGUA & BARBUDA'S BALANCE OF SERVICES: 2000 - 2005
91
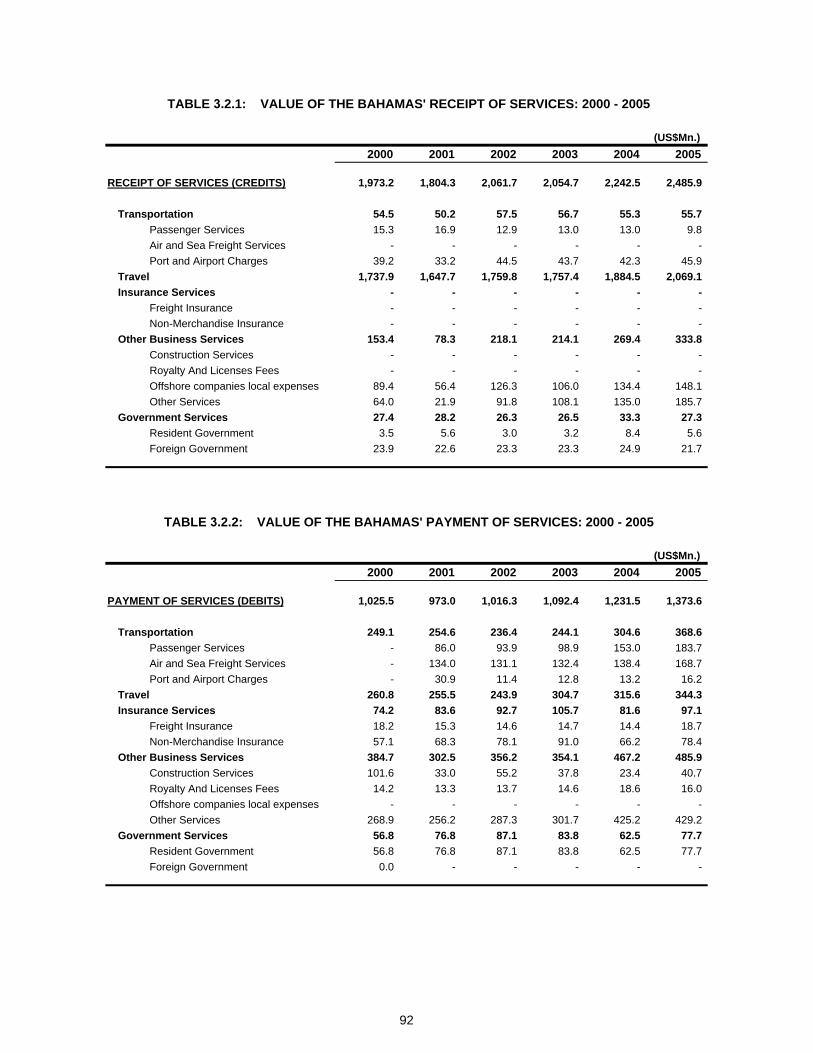
(US$Mn.)2000 2001 2002 2003 2004 2005
RECEIPT OF SERVICES (CREDITS) 1,973.2 1,804.3 2,061.7 2,054.7 2,242.5 2,485.9
Transportation 54.5 50.2 57.5 56.7 55.3 55.7 Passenger Services 15.3 16.9 12.9 13.0 13.0 9.8 Air and Sea Freight Services - - - - - - Port and Airport Charges 39.2 33.2 44.5 43.7 42.3 45.9
Travel 1,737.9 1,647.7 1,759.8 1,757.4 1,884.5 2,069.1 Insurance Services - - - - - -
Freight Insurance - - - - - - Non-Merchandise Insurance - - - - - -
Other Business Services 153.4 78.3 218.1 214.1 269.4 333.8 Construction Services - - - - - - Royalty And Licenses Fees - - - - - - Offshore companies local expenses 89.4 56.4 126.3 106.0 134.4 148.1 Other Services 64.0 21.9 91.8 108.1 135.0 185.7
Government Services 27.4 28.2 26.3 26.5 33.3 27.3 Resident Government 3.5 5.6 3.0 3.2 8.4 5.6 Foreign Government 23.9 22.6 23.3 23.3 24.9 21.7
(US$Mn.)2000 2001 2002 2003 2004 2005
PAYMENT OF SERVICES (DEBITS) 1,025.5 973.0 1,016.3 1,092.4 1,231.5 1,373.6
Transportation 249.1 254.6 236.4 244.1 304.6 368.6 Passenger Services - 86.0 93.9 98.9 153.0 183.7 Air and Sea Freight Services - 134.0 131.1 132.4 138.4 168.7 Port and Airport Charges - 30.9 11.4 12.8 13.2 16.2
Travel 260.8 255.5 243.9 304.7 315.6 344.3 Insurance Services 74.2 83.6 92.7 105.7 81.6 97.1
Freight Insurance 18.2 15.3 14.6 14.7 14.4 18.7 Non-Merchandise Insurance 57.1 68.3 78.1 91.0 66.2 78.4
Other Business Services 384.7 302.5 356.2 354.1 467.2 485.9 Construction Services 101.6 33.0 55.2 37.8 23.4 40.7 Royalty And Licenses Fees 14.2 13.3 13.7 14.6 18.6 16.0 Offshore companies local expenses - - - - - - Other Services 268.9 256.2 287.3 301.7 425.2 429.2
Government Services 56.8 76.8 87.1 83.8 62.5 77.7 Resident Government 56.8 76.8 87.1 83.8 62.5 77.7 Foreign Government 0.0 - - - - -
TABLE 3.2.1: VALUE OF THE BAHAMAS' RECEIPT OF SERVICES: 2000 - 2005
TABLE 3.2.2: VALUE OF THE BAHAMAS' PAYMENT OF SERVICES: 2000 - 2005
92

(US$Mn.)2000 2001 2002 2003 2004 2005
BALANCE OF SERVICES 947.7 831.3 1,045.4 962.3 1,011.0 1,112.3
Transportation -194.6 -204.5 -178.9 -187.4 -249.3 -312.9 Passenger Services 15.3 -69.1 -81.0 -85.9 -140.0 -173.9 Air and Sea Freight Services - -134.0 -131.1 -132.4 -138.4 -168.7 Port and Airport Charges 39.2 2.3 33.1 30.9 29.1 29.7
Travel 1,477.1 1,392.2 1,515.9 1,452.7 1,568.9 1,724.8 Insurance Services -74.2 -83.6 -92.7 -105.7 -81.6 -97.1
Freight Insurance -18.2 -15.3 -14.6 -14.7 -14.4 -18.7 Non-Merchandise Insurance -57.1 -68.3 -78.1 -91.0 -66.2 -78.4
Other Business Services -231.3 -224.2 -138.1 -140.0 -197.8 -152.1 Construction Services -101.6 -33.0 -55.2 -37.8 -23.4 -40.7 Royalty And Licenses Fees -14.2 -13.3 -13.7 -14.6 -18.6 -16.0 Offshore companies local expenses 89.4 56.4 126.3 106.0 134.4 148.1 Other Services -204.9 -234.3 -195.5 -193.6 -290.2 -243.5
Government Services -29.4 -48.6 -60.8 -57.3 -29.2 -50.4 Resident Government -53.3 -71.2 -84.1 -80.6 -54.1 -72.1 Foreign Government 23.9 22.6 23.3 23.3 24.9 21.7
TABLE 3.2.3: VALUE OF THE BAHAMAS' BALANCE OF SERVICES: 2000 - 2005
93
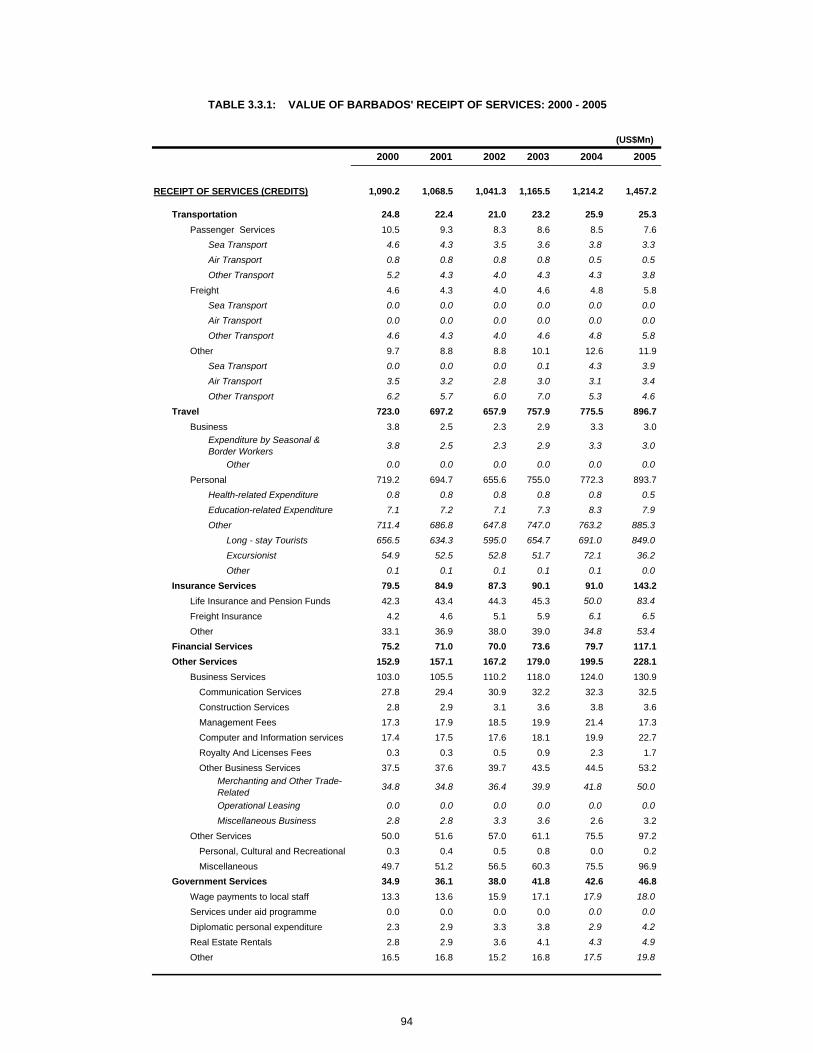
(US$Mn)
2000 2001 2002 2003 2004 2005
RECEIPT OF SERVICES (CREDITS) 1,090.2 1,068.5 1,041.3 1,165.5 1,214.2 1,457.2
Transportation 24.8 22.4 21.0 23.2 25.9 25.3Passenger Services 10.5 9.3 8.3 8.6 8.5 7.6
Sea Transport 4.6 4.3 3.5 3.6 3.8 3.3Air Transport 0.8 0.8 0.8 0.8 0.5 0.5Other Transport 5.2 4.3 4.0 4.3 4.3 3.8
Freight 4.6 4.3 4.0 4.6 4.8 5.8Sea Transport 0.0 0.0 0.0 0.0 0.0 0.0Air Transport 0.0 0.0 0.0 0.0 0.0 0.0Other Transport 4.6 4.3 4.0 4.6 4.8 5.8
Other 9.7 8.8 8.8 10.1 12.6 11.9Sea Transport 0.0 0.0 0.0 0.1 4.3 3.9Air Transport 3.5 3.2 2.8 3.0 3.1 3.4Other Transport 6.2 5.7 6.0 7.0 5.3 4.6
Travel 723.0 697.2 657.9 757.9 775.5 896.7Business 3.8 2.5 2.3 2.9 3.3 3.0
Expenditure by Seasonal & Border Workers 3.8 2.5 2.3 2.9 3.3 3.0
Other 0.0 0.0 0.0 0.0 0.0 0.0
Personal 719.2 694.7 655.6 755.0 772.3 893.7Health-related Expenditure 0.8 0.8 0.8 0.8 0.8 0.5Education-related Expenditure 7.1 7.2 7.1 7.3 8.3 7.9Other 711.4 686.8 647.8 747.0 763.2 885.3
Long - stay Tourists 656.5 634.3 595.0 654.7 691.0 849.0Excursionist 54.9 52.5 52.8 51.7 72.1 36.2Other 0.1 0.1 0.1 0.1 0.1 0.0
Insurance Services 79.5 84.9 87.3 90.1 91.0 143.2Life Insurance and Pension Funds 42.3 43.4 44.3 45.3 50.0 83.4
Freight Insurance 4.2 4.6 5.1 5.9 6.1 6.5
Other 33.1 36.9 38.0 39.0 34.8 53.4Financial Services 75.2 71.0 70.0 73.6 79.7 117.1Other Services 152.9 157.1 167.2 179.0 199.5 228.1
Business Services 103.0 105.5 110.2 118.0 124.0 130.9Communication Services 27.8 29.4 30.9 32.2 32.3 32.5Construction Services 2.8 2.9 3.1 3.6 3.8 3.6Management Fees 17.3 17.9 18.5 19.9 21.4 17.3Computer and Information services 17.4 17.5 17.6 18.1 19.9 22.7Royalty And Licenses Fees 0.3 0.3 0.5 0.9 2.3 1.7Other Business Services 37.5 37.6 39.7 43.5 44.5 53.2
Merchanting and Other Trade-Related 34.8 34.8 36.4 39.9 41.8 50.0
Operational Leasing 0.0 0.0 0.0 0.0 0.0 0.0Miscellaneous Business 2.8 2.8 3.3 3.6 2.6 3.2
Other Services 50.0 51.6 57.0 61.1 75.5 97.2Personal, Cultural and Recreational 0.3 0.4 0.5 0.8 0.0 0.2Miscellaneous 49.7 51.2 56.5 60.3 75.5 96.9
Government Services 34.9 36.1 38.0 41.8 42.6 46.8Wage payments to local staff 13.3 13.6 15.9 17.1 17.9 18.0
Services under aid programme 0.0 0.0 0.0 0.0 0.0 0.0
Diplomatic personal expenditure 2.3 2.9 3.3 3.8 2.9 4.2
Real Estate Rentals 2.8 2.9 3.6 4.1 4.3 4.9
Other 16.5 16.8 15.2 16.8 17.5 19.8
TABLE 3.3.1: VALUE OF BARBADOS' RECEIPT OF SERVICES: 2000 - 2005
94
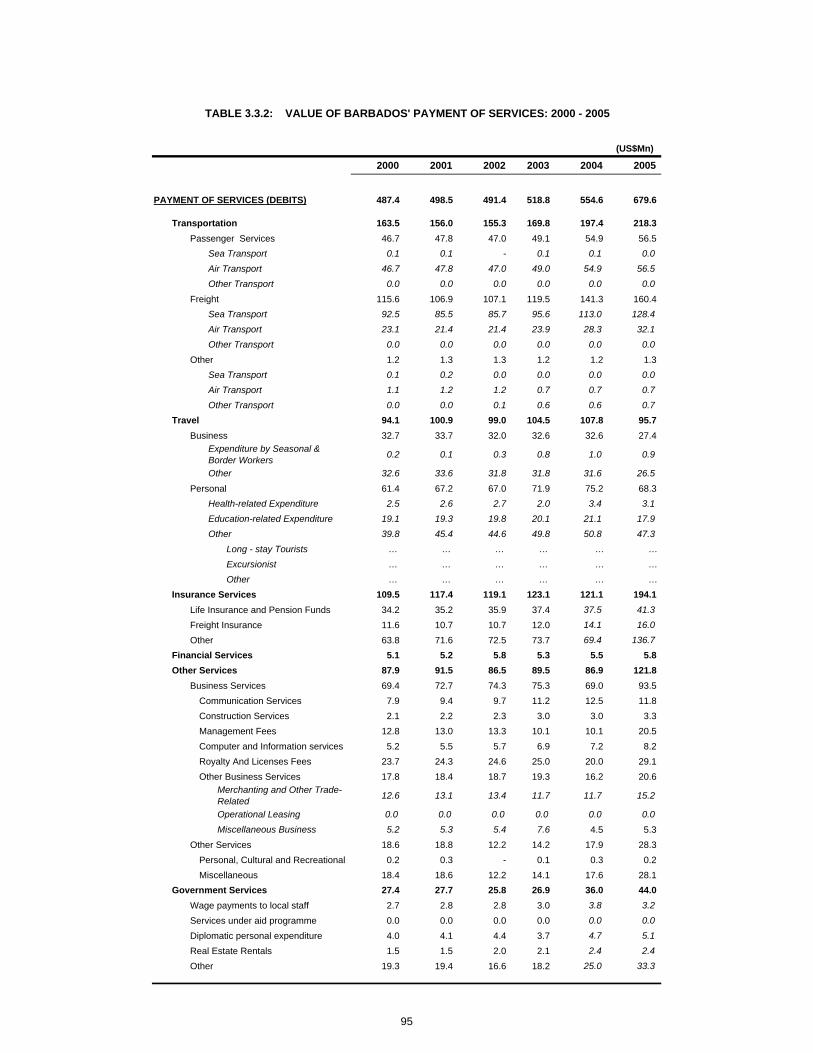
(US$Mn)
2000 2001 2002 2003 2004 2005
PAYMENT OF SERVICES (DEBITS) 487.4 498.5 491.4 518.8 554.6 679.6
Transportation 163.5 156.0 155.3 169.8 197.4 218.3Passenger Services 46.7 47.8 47.0 49.1 54.9 56.5
Sea Transport 0.1 0.1 - 0.1 0.1 0.0Air Transport 46.7 47.8 47.0 49.0 54.9 56.5Other Transport 0.0 0.0 0.0 0.0 0.0 0.0
Freight 115.6 106.9 107.1 119.5 141.3 160.4Sea Transport 92.5 85.5 85.7 95.6 113.0 128.4Air Transport 23.1 21.4 21.4 23.9 28.3 32.1Other Transport 0.0 0.0 0.0 0.0 0.0 0.0
Other 1.2 1.3 1.3 1.2 1.2 1.3Sea Transport 0.1 0.2 0.0 0.0 0.0 0.0Air Transport 1.1 1.2 1.2 0.7 0.7 0.7Other Transport 0.0 0.0 0.1 0.6 0.6 0.7
Travel 94.1 100.9 99.0 104.5 107.8 95.7Business 32.7 33.7 32.0 32.6 32.6 27.4
Expenditure by Seasonal & Border Workers 0.2 0.1 0.3 0.8 1.0 0.9
Other 32.6 33.6 31.8 31.8 31.6 26.5
Personal 61.4 67.2 67.0 71.9 75.2 68.3Health-related Expenditure 2.5 2.6 2.7 2.0 3.4 3.1Education-related Expenditure 19.1 19.3 19.8 20.1 21.1 17.9Other 39.8 45.4 44.6 49.8 50.8 47.3
Long - stay Tourists … … … … … …Excursionist … … … … … …Other … … … … … …
Insurance Services 109.5 117.4 119.1 123.1 121.1 194.1Life Insurance and Pension Funds 34.2 35.2 35.9 37.4 37.5 41.3
Freight Insurance 11.6 10.7 10.7 12.0 14.1 16.0
Other 63.8 71.6 72.5 73.7 69.4 136.7Financial Services 5.1 5.2 5.8 5.3 5.5 5.8Other Services 87.9 91.5 86.5 89.5 86.9 121.8
Business Services 69.4 72.7 74.3 75.3 69.0 93.5Communication Services 7.9 9.4 9.7 11.2 12.5 11.8Construction Services 2.1 2.2 2.3 3.0 3.0 3.3Management Fees 12.8 13.0 13.3 10.1 10.1 20.5Computer and Information services 5.2 5.5 5.7 6.9 7.2 8.2Royalty And Licenses Fees 23.7 24.3 24.6 25.0 20.0 29.1Other Business Services 17.8 18.4 18.7 19.3 16.2 20.6
Merchanting and Other Trade-Related 12.6 13.1 13.4 11.7 11.7 15.2
Operational Leasing 0.0 0.0 0.0 0.0 0.0 0.0Miscellaneous Business 5.2 5.3 5.4 7.6 4.5 5.3
Other Services 18.6 18.8 12.2 14.2 17.9 28.3Personal, Cultural and Recreational 0.2 0.3 - 0.1 0.3 0.2Miscellaneous 18.4 18.6 12.2 14.1 17.6 28.1
Government Services 27.4 27.7 25.8 26.9 36.0 44.0Wage payments to local staff 2.7 2.8 2.8 3.0 3.8 3.2
Services under aid programme 0.0 0.0 0.0 0.0 0.0 0.0
Diplomatic personal expenditure 4.0 4.1 4.4 3.7 4.7 5.1
Real Estate Rentals 1.5 1.5 2.0 2.1 2.4 2.4
Other 19.3 19.4 16.6 18.2 25.0 33.3
TABLE 3.3.2: VALUE OF BARBADOS' PAYMENT OF SERVICES: 2000 - 2005
95

(US$Mn)
2000 2001 2002 2003 2004 2005
BALANCE OF SERVICES 602.9 570.0 550.0 646.7 659.6 777.6
Transportation -138.8 -133.6 -134.3 -146.6 -171.5 -193.0Passenger Services -36.3 -38.5 -38.8 -40.5 -46.4 -48.9
Sea Transport 4.5 4.2 3.5 3.5 3.7 3.3Air Transport -45.9 -47.0 -46.3 -48.2 -54.4 -56.1Other Transport 5.1 4.3 4.0 4.2 4.3 3.8
Freight -111.0 -102.6 -103.0 -114.9 -136.5 -154.6Sea Transport -92.5 -85.4 -85.6 -95.6 -113.0 -128.4Air Transport -23.1 -21.4 -21.4 -23.9 -28.3 -32.1Other Transport 4.6 4.2 4.0 4.5 4.8 5.8
Other 8.5 7.5 7.5 8.8 11.4 10.6Sea Transport -0.1 -0.1 - 0.0 4.3 3.9Air Transport 2.4 2.0 1.6 2.4 2.4 2.8Other Transport 6.2 5.6 6.0 6.5 4.7 3.9
Travel 628.9 596.4 558.9 653.4 667.7 801.0Business -28.9 -31.2 -29.7 -29.7 -29.3 -24.4
Expenditure by Seasonal & Border Workers 3.6 2.4 2.1 2.1 2.3 2.1
Other -32.5 -33.6 -31.7 -31.8 -31.6 -26.5
Personal 657.9 627.6 588.6 683.2 697.0 825.4Health-related Expenditure -1.7 -1.8 -2.0 -1.2 -2.6 -2.5Education-related Expenditure -12.0 -12.1 -12.7 -12.8 -12.8 -10.0Other 671.6 641.4 603.3 697.2 712.4 838.0
Long - stay Tourists … … … … … …Excursionist … … … … … …Other … … … … … …
Insurance Services -30.0 -32.5 -31.9 -33.0 -30.1 -50.9Life Insurance and Pension Funds 8.1 8.3 8.4 7.9 12.5 42.0
Freight Insurance -7.4 -6.1 -5.7 -6.1 -8.0 -9.6
Other -30.7 -34.7 -34.6 -34.7 -34.6 -83.4Financial Services 70.2 65.8 64.3 68.3 74.2 111.3Other Services 65.0 65.6 80.7 89.6 112.6 106.3
Business Services 33.6 32.9 36.0 42.7 55.0 37.4Communication Services 20.0 20.0 21.3 21.0 19.8 20.7
Construction Services 0.7 0.8 0.8 0.6 0.8 0.2
Management Fees 4.6 5.0 5.2 9.9 11.3 -3.3Computer and Information services 12.2 12.0 11.9 11.2 12.6 14.4
Royalty And Licenses Fees -23.5 -24.0 -24.1 -24.1 -17.7 -27.4
Other Business Services 19.8 19.2 21.0 24.2 28.2 32.7Merchanting and Other Trade-Related 22.2 21.7 23.0 28.2 30.1 34.8
Operational Leasing - - - - - - Miscellaneous Business -2.5 -2.5 -2.1 -4.0 -1.9 -2.1
Other Services 31.4 32.8 44.8 46.9 57.5 68.9Personal, Cultural and Recreational 0.2 0.1 0.5 0.7 -0.3 0.1
Miscellaneous 31.3 32.7 44.3 46.2 57.8 68.8Government Services 7.6 8.4 12.3 15.0 6.6 2.9
Wage payments to local staff 10.6 10.8 13.1 14.2 14.1 14.8Services under aid programme - - - - - - Diplomatic personal expenditure -1.7 -1.2 -1.1 0.1 -1.9 -0.9Real Estate Rentals 1.4 1.4 1.7 2.1 1.9 2.4Other -2.8 -2.7 -1.5 -1.4 -7.5 -13.5
TABLE 3.3.3: VALUE OF BARBADOS' BALANCE OF SERVICES: 2000 - 2005
96

(US$Mn)
2000 2001 2002 2003 2004 2005
RECEIPT OF SERVICES (CREDITS) 158.2 157.3 156.9 178.6 199.2 301.3
Transportation 10.8 11.8 18.1 22.1 27.4 29.7 Sea Transport 8.2 8.1 14.8 18.8 22.1 …
Passenger - - - - - …Freight - - - - - …Other 8.2 8.1 14.8 18.8 22.1 …
Air Transport 2.6 3.7 3.3 3.4 5.3 …Passenger - - - - - …Freight - - - - - …Other 2.6 3.7 3.3 3.4 5.3 …
Other Transport - - - - - …Passenger - - - - - …Freight - - - - - …Other - - - - - …
Travel 116.2 102.9 102.9 117.2 133.0 213.7 Business 7.6 7.4 8.2 8.7 9.2 …
Expenditure by seasonal and border workers
3.8 3.2 2.9 3.7 4.3 …
Other 3.7 4.2 5.3 4.987 4.9 …Personal 108.7 95.5 94.7 108.4 123.8 …
Health-related expenditure - - - - - …Education-related expenditure 1.2 1.0 1.2 0.7 0.7 …Other 107.4 94.5 93.5 107.8 123.0 …
Tourist Expenditure in Belize … … … … … …Expenditure of returning residents … … … … … …
Communication 7.2 6.1 4.8 6.1 5.7 …Postal and courier services 0.5 0.6 0.2 0.581 0.3 …Telecommunication services 6.6 5.5 4.6 5.473 5.3 …
Insurance Services - - - - - …Life insurance & pension funding - - - - - …Freight insurance - - - - - …Other direct insurance - - - - - …Reinsurance - - - - - …Auxilliary services - - - - - …
Financial Services (other than insurance)
- - - - - …
Other Business Services 1/ 6.3 13.4 16.0 17.2 21.3 40.2 Computer and information Services - - - - - …
Computer services - - - - - …Information services - - - - - …
Royalties and License fees - - - - - …Other Business services 6.3 13.4 16.0 17.2 21.3 …
Merchanting and other trade-related services
0.0 0.1 0.1 0.1 0.1 …
Merchanting 0.0 0.1 0.1 0.1 0.1 …Other - - - - - …
Operational leasing services - - - - - …Miscellaneous business, professional and technical
6.2 13.3 15.9 17.0 21.2 …
Legal, accounting, managementconsult and public relations
- - - - - …
Legal services - - - - - …Accounting, auditing, bookkeeping and tax consultation services
- - - - - …
Business and management - - - - - …Advertising, market research and public opinion polling
- - - - - …
Research and development - - - - - …Architectural, engineering and other technical
- - - - - …
Agricultural, mining and on-site processing
…
Waste treatment and depollution
- - - - - …
Other - - 0.2 0.2 0.2 …Other 6.2 13.3 15.7 16.9 21.0 …Services between affiliated enterprises, n.i.e.
- - - - - …
Personal, Cultural and Recreational services
- - - - - …
Audio-visual & related services services
- - - - - …
Other personal,cultural and recreational services
- - - - - …
Government services, n.i.e. 17.8 23.1 15.1 16.1 11.9 17.8 Embassies and consulates 8.4 9.2 4.5 4.6 3.1 …Military units and agencies 5.9 8.3 5.4 6.8 7.4 …Other 3.5 5.6 5.2 4.7 1.4 …
Notes: 1/ Includes Communication, Insurance and Finanacial Services for 2005.
TABLE 3.4.1: VALUE OF BELIZE'S RECEIPT OF SERVICES: 2000 - 2005
97
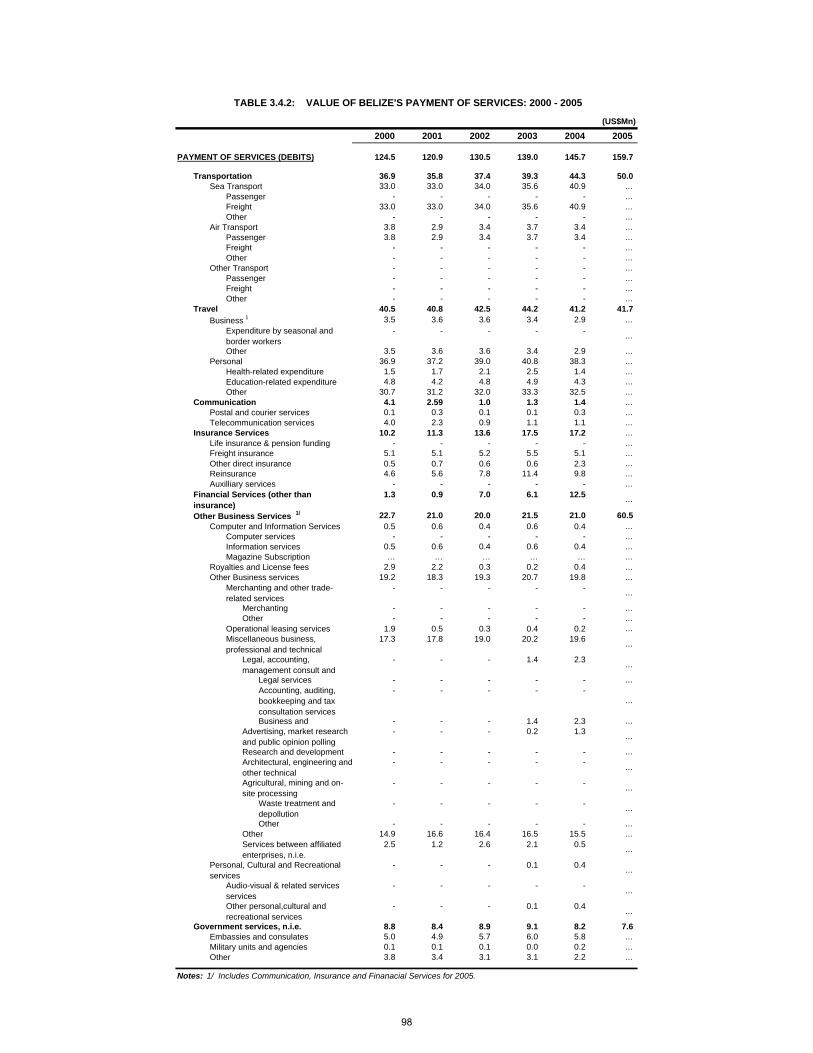
(US$Mn)
2000 2001 2002 2003 2004 2005
PAYMENT OF SERVICES (DEBITS) 124.5 120.9 130.5 139.0 145.7 159.7
Transportation 36.9 35.8 37.4 39.3 44.3 50.0 Sea Transport 33.0 33.0 34.0 35.6 40.9 …
Passenger - - - - - …Freight 33.0 33.0 34.0 35.6 40.9 …Other - - - - - …
Air Transport 3.8 2.9 3.4 3.7 3.4 …Passenger 3.8 2.9 3.4 3.7 3.4 …Freight - - - - - …Other - - - - - …
Other Transport - - - - - …Passenger - - - - - …Freight - - - - - …Other - - - - - …
Travel 40.5 40.8 42.5 44.2 41.2 41.7 Business 1 3.5 3.6 3.6 3.4 2.9 …
Expenditure by seasonal and border workers
- - - - - …
Other 3.5 3.6 3.6 3.4 2.9 …Personal 36.9 37.2 39.0 40.8 38.3 …
Health-related expenditure 1.5 1.7 2.1 2.5 1.4 …Education-related expenditure 4.8 4.2 4.8 4.9 4.3 …Other 30.7 31.2 32.0 33.3 32.5 …
Communication 4.1 2.59 1.0 1.3 1.4 …Postal and courier services 0.1 0.3 0.1 0.1 0.3 …Telecommunication services 4.0 2.3 0.9 1.1 1.1 …
Insurance Services 10.2 11.3 13.6 17.5 17.2 …Life insurance & pension funding - - - - - …Freight insurance 5.1 5.1 5.2 5.5 5.1 …Other direct insurance 0.5 0.7 0.6 0.6 2.3 …Reinsurance 4.6 5.6 7.8 11.4 9.8 …Auxilliary services - - - - - …
Financial Services (other than insurance)
1.3 0.9 7.0 6.1 12.5 …
Other Business Services 1/ 22.7 21.0 20.0 21.5 21.0 60.5 Computer and Information Services 0.5 0.6 0.4 0.6 0.4 …
Computer services - - - - - …Information services 0.5 0.6 0.4 0.6 0.4 …Magazine Subscription … … … … … …
Royalties and License fees 2.9 2.2 0.3 0.2 0.4 …Other Business services 19.2 18.3 19.3 20.7 19.8 …
Merchanting and other trade-related services
- - - - - …
Merchanting - - - - - …Other - - - - - …
Operational leasing services 1.9 0.5 0.3 0.4 0.2 …Miscellaneous business, professional and technical
17.3 17.8 19.0 20.2 19.6 …
Legal, accounting, management consult and
- - - 1.4 2.3 …
Legal services - - - - - …Accounting, auditing, bookkeeping and tax consultation services
- - - - - …
Business and - - - 1.4 2.3 …Advertising, market research and public opinion polling
- - - 0.2 1.3 …
Research and development - - - - - …Architectural, engineering andother technical
- - - - - …
Agricultural, mining and on-site processing
- - - - - …
Waste treatment and depollution
- - - - - …
Other - - - - - …Other 14.9 16.6 16.4 16.5 15.5 …Services between affiliated enterprises, n.i.e.
2.5 1.2 2.6 2.1 0.5 …
Personal, Cultural and Recreational services
- - - 0.1 0.4 …
Audio-visual & related services services
- - - - - …
Other personal,cultural and recreational services
- - - 0.1 0.4 …
Government services, n.i.e. 8.8 8.4 8.9 9.1 8.2 7.6 Embassies and consulates 5.0 4.9 5.7 6.0 5.8 …Military units and agencies 0.1 0.1 0.1 0.0 0.2 …Other 3.8 3.4 3.1 3.1 2.2 …
Notes: 1/ Includes Communication, Insurance and Finanacial Services for 2005.
TABLE 3.4.2: VALUE OF BELIZE'S PAYMENT OF SERVICES: 2000 - 2005
98
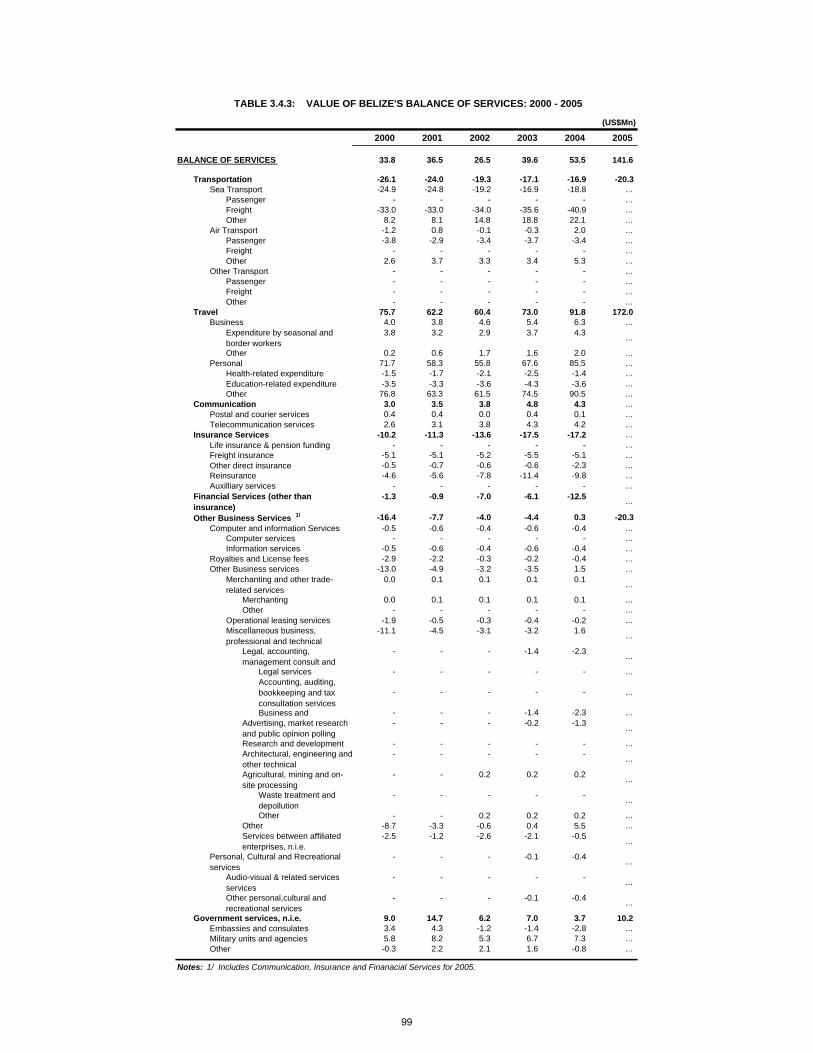
(US$Mn)
2000 2001 2002 2003 2004 2005
BALANCE OF SERVICES 33.8 36.5 26.5 39.6 53.5 141.6
Transportation -26.1 -24.0 -19.3 -17.1 -16.9 -20.3 Sea Transport -24.9 -24.8 -19.2 -16.9 -18.8 …
Passenger - - - - - …Freight -33.0 -33.0 -34.0 -35.6 -40.9 …Other 8.2 8.1 14.8 18.8 22.1 …
Air Transport -1.2 0.8 -0.1 -0.3 2.0 …Passenger -3.8 -2.9 -3.4 -3.7 -3.4 …Freight - - - - - …Other 2.6 3.7 3.3 3.4 5.3 …
Other Transport - - - - - …Passenger - - - - - …Freight - - - - - …Other - - - - - …
Travel 75.7 62.2 60.4 73.0 91.8 172.0 Business 4.0 3.8 4.6 5.4 6.3 …
Expenditure by seasonal and border workers
3.8 3.2 2.9 3.7 4.3 …
Other 0.2 0.6 1.7 1.6 2.0 …Personal 71.7 58.3 55.8 67.6 85.5 …
Health-related expenditure -1.5 -1.7 -2.1 -2.5 -1.4 …Education-related expenditure -3.5 -3.3 -3.6 -4.3 -3.6 …Other 76.8 63.3 61.5 74.5 90.5 …
Communication 3.0 3.5 3.8 4.8 4.3 …Postal and courier services 0.4 0.4 0.0 0.4 0.1 …Telecommunication services 2.6 3.1 3.8 4.3 4.2 …
Insurance Services -10.2 -11.3 -13.6 -17.5 -17.2 …Life insurance & pension funding - - - - - …Freight insurance -5.1 -5.1 -5.2 -5.5 -5.1 …Other direct insurance -0.5 -0.7 -0.6 -0.6 -2.3 …Reinsurance -4.6 -5.6 -7.8 -11.4 -9.8 …Auxilliary services - - - - - …
Financial Services (other than insurance)
-1.3 -0.9 -7.0 -6.1 -12.5 …
Other Business Services 1/ -16.4 -7.7 -4.0 -4.4 0.3 -20.3 Computer and information Services -0.5 -0.6 -0.4 -0.6 -0.4 …
Computer services - - - - - …Information services -0.5 -0.6 -0.4 -0.6 -0.4 …
Royalties and License fees -2.9 -2.2 -0.3 -0.2 -0.4 …Other Business services -13.0 -4.9 -3.2 -3.5 1.5 …
Merchanting and other trade-related services
0.0 0.1 0.1 0.1 0.1 …
Merchanting 0.0 0.1 0.1 0.1 0.1 …Other - - - - - …
Operational leasing services -1.9 -0.5 -0.3 -0.4 -0.2 …Miscellaneous business, professional and technical
-11.1 -4.5 -3.1 -3.2 1.6 …
Legal, accounting, management consult and
- - - -1.4 -2.3 …
Legal services - - - - - …Accounting, auditing, bookkeeping and tax consultation services
- - - - - …
Business and - - - -1.4 -2.3 …Advertising, market research and public opinion polling
- - - -0.2 -1.3 …
Research and development - - - - - …Architectural, engineering andother technical
- - - - - …
Agricultural, mining and on-site processing
- - 0.2 0.2 0.2 …
Waste treatment and depollution
- - - - - …
Other - - 0.2 0.2 0.2 …Other -8.7 -3.3 -0.6 0.4 5.5 …Services between affiliated enterprises, n.i.e.
-2.5 -1.2 -2.6 -2.1 -0.5 …
Personal, Cultural and Recreational services
- - - -0.1 -0.4 …
Audio-visual & related services services
- - - - - …
Other personal,cultural and recreational services
- - - -0.1 -0.4 …
Government services, n.i.e. 9.0 14.7 6.2 7.0 3.7 10.2 Embassies and consulates 3.4 4.3 -1.2 -1.4 -2.8 …Military units and agencies 5.8 8.2 5.3 6.7 7.3 …Other -0.3 2.2 2.1 1.6 -0.8 …
Notes: 1/ Includes Communication, Insurance and Finanacial Services for 2005.
TABLE 3.4.3: VALUE OF BELIZE'S BALANCE OF SERVICES: 2000 - 2005
99
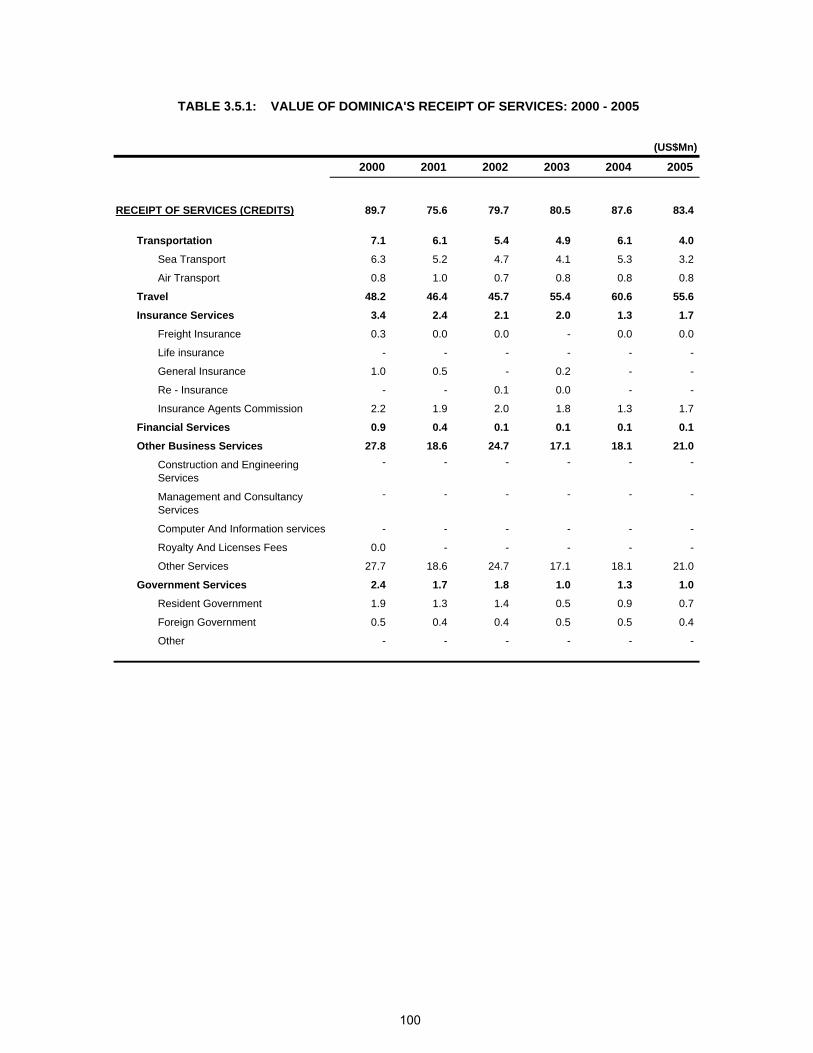
(US$Mn)
2000 2001 2002 2003 2004 2005
RECEIPT OF SERVICES (CREDITS) 89.7 75.6 79.7 80.5 87.6 83.4
Transportation 7.1 6.1 5.4 4.9 6.1 4.0
Sea Transport 6.3 5.2 4.7 4.1 5.3 3.2
Air Transport 0.8 1.0 0.7 0.8 0.8 0.8
Travel 48.2 46.4 45.7 55.4 60.6 55.6
Insurance Services 3.4 2.4 2.1 2.0 1.3 1.7
Freight Insurance 0.3 0.0 0.0 - 0.0 0.0
Life insurance - - - - - -
General Insurance 1.0 0.5 - 0.2 - -
Re - Insurance - - 0.1 0.0 - -
Insurance Agents Commission 2.2 1.9 2.0 1.8 1.3 1.7
Financial Services 0.9 0.4 0.1 0.1 0.1 0.1
Other Business Services 27.8 18.6 24.7 17.1 18.1 21.0
Construction and Engineering Services
- - - - - -
Management and Consultancy Services
- - - - - -
Computer And Information services - - - - - -
Royalty And Licenses Fees 0.0 - - - - -
Other Services 27.7 18.6 24.7 17.1 18.1 21.0
Government Services 2.4 1.7 1.8 1.0 1.3 1.0
Resident Government 1.9 1.3 1.4 0.5 0.9 0.7
Foreign Government 0.5 0.4 0.4 0.5 0.5 0.4
Other - - - - - -
TABLE 3.5.1: VALUE OF DOMINICA'S RECEIPT OF SERVICES: 2000 - 2005
100

(US$Mn)
2000 2001 2002 2003 2004 2005
PAYMENT OF SERVICES (DEBITS) 52.7 50.0 53.7 43.6 46.3 52.1
Transportation 21.8 20.0 18.5 19.0 21.9 26.8
Sea Transport 14.8 13.1 11.6 11.9 14.5 16.5
Air Transport 7.0 6.9 6.8 7.1 7.4 10.3
Travel 8.9 9.2 9.1 8.9 9.2 9.7
Insurance Services 4.7 4.4 5.0 4.3 5.2 6.0
Freight Insurance 3.0 2.6 2.3 2.4 2.9 3.3
Life insurance 0.5 0.2 0.3 0.3 0.4 0.8
General Insurance 0.4 0.3 1.1 0.4 0.5 0.6
Re - Insurance 0.9 1.2 1.3 1.2 1.3 1.3
Insurance Agents Commission - - - - - -
Financial Services 0.0 0.0 0.0 0.0 0.0 -
Other Business Services 12.2 13.1 17.3 7.6 8.5 7.4
Construction and Engineering Services
0.5 1.7 0.9 0.8 0.3 0.5
Management and Consultancy Services
1.5 1.8 1.6 1.7 2.8 1.0
Computer And Information services - - - - - 0.0
Royalty And Licenses Fees 0.1 0.1 0.1 0.1 0.1 0.1
Other Services 10.1 9.5 14.7 4.9 5.2 5.8
Government Services 5.1 3.3 3.8 3.9 1.6 2.1
Resident Government 0.7 0.8 0.6 0.8 0.6 0.6
Foreign Government - - - - - -
Other 4.3 2.5 3.1 3.1 1.0 1.5
TABLE 3.5.2: VALUE OF DOMINICA'S PAYMENT OF SERVICES: 2000 - 2005
101
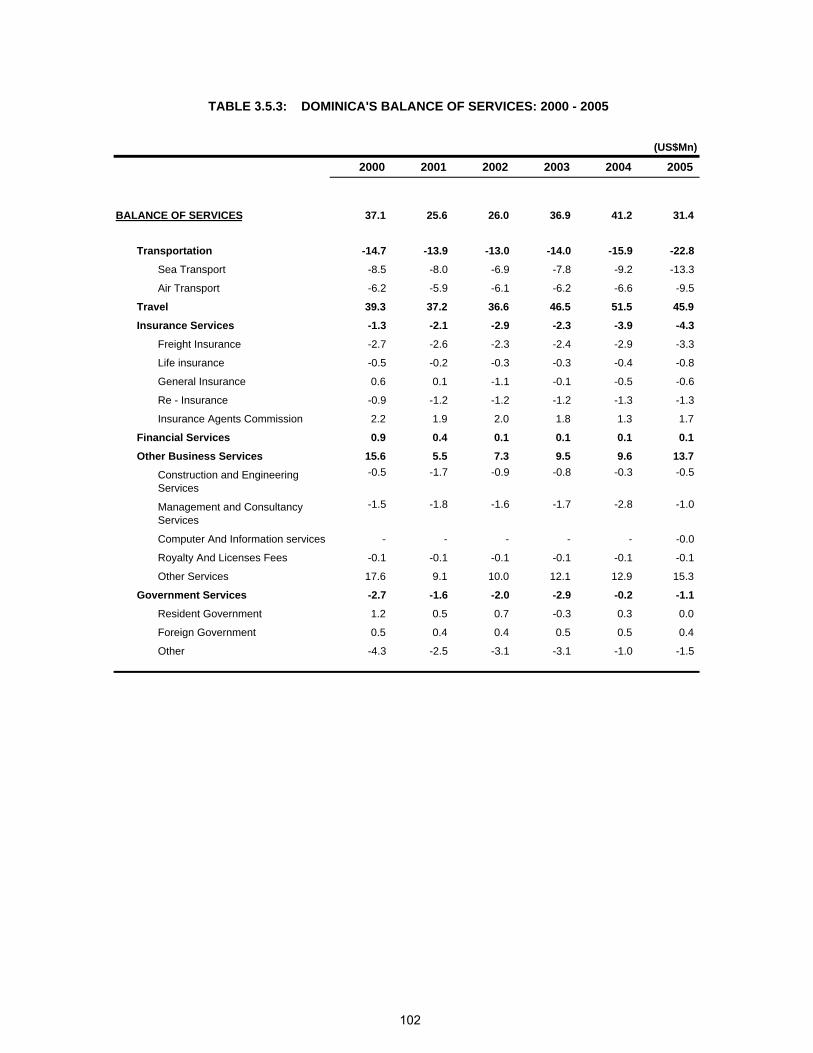
(US$Mn)
2000 2001 2002 2003 2004 2005
BALANCE OF SERVICES 37.1 25.6 26.0 36.9 41.2 31.4
Transportation -14.7 -13.9 -13.0 -14.0 -15.9 -22.8
Sea Transport -8.5 -8.0 -6.9 -7.8 -9.2 -13.3
Air Transport -6.2 -5.9 -6.1 -6.2 -6.6 -9.5
Travel 39.3 37.2 36.6 46.5 51.5 45.9
Insurance Services -1.3 -2.1 -2.9 -2.3 -3.9 -4.3
Freight Insurance -2.7 -2.6 -2.3 -2.4 -2.9 -3.3
Life insurance -0.5 -0.2 -0.3 -0.3 -0.4 -0.8
General Insurance 0.6 0.1 -1.1 -0.1 -0.5 -0.6
Re - Insurance -0.9 -1.2 -1.2 -1.2 -1.3 -1.3
Insurance Agents Commission 2.2 1.9 2.0 1.8 1.3 1.7
Financial Services 0.9 0.4 0.1 0.1 0.1 0.1
Other Business Services 15.6 5.5 7.3 9.5 9.6 13.7
Construction and Engineering Services
-0.5 -1.7 -0.9 -0.8 -0.3 -0.5
Management and Consultancy Services
-1.5 -1.8 -1.6 -1.7 -2.8 -1.0
Computer And Information services - - - - - -0.0
Royalty And Licenses Fees -0.1 -0.1 -0.1 -0.1 -0.1 -0.1
Other Services 17.6 9.1 10.0 12.1 12.9 15.3
Government Services -2.7 -1.6 -2.0 -2.9 -0.2 -1.1
Resident Government 1.2 0.5 0.7 -0.3 0.3 0.0
Foreign Government 0.5 0.4 0.4 0.5 0.5 0.4
Other -4.3 -2.5 -3.1 -3.1 -1.0 -1.5
TABLE 3.5.3: DOMINICA'S BALANCE OF SERVICES: 2000 - 2005
102
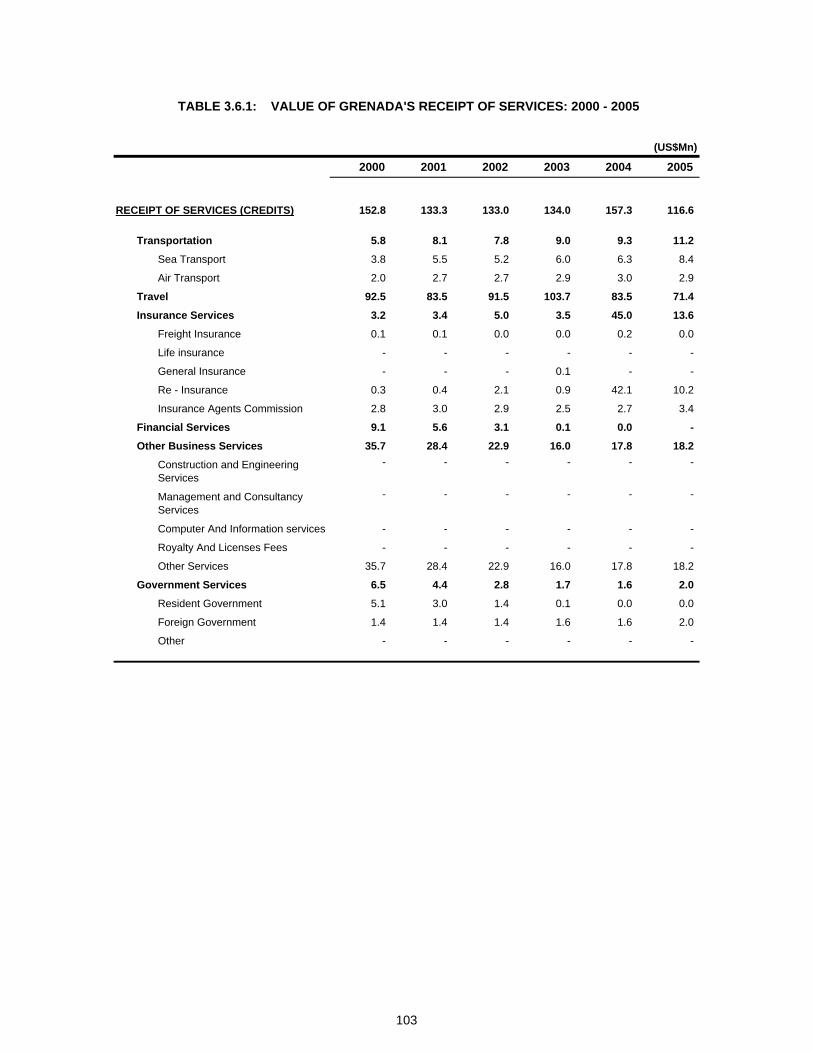
(US$Mn)
2000 2001 2002 2003 2004 2005
RECEIPT OF SERVICES (CREDITS) 152.8 133.3 133.0 134.0 157.3 116.6
Transportation 5.8 8.1 7.8 9.0 9.3 11.2
Sea Transport 3.8 5.5 5.2 6.0 6.3 8.4
Air Transport 2.0 2.7 2.7 2.9 3.0 2.9
Travel 92.5 83.5 91.5 103.7 83.5 71.4
Insurance Services 3.2 3.4 5.0 3.5 45.0 13.6
Freight Insurance 0.1 0.1 0.0 0.0 0.2 0.0
Life insurance - - - - - -
General Insurance - - - 0.1 - -
Re - Insurance 0.3 0.4 2.1 0.9 42.1 10.2
Insurance Agents Commission 2.8 3.0 2.9 2.5 2.7 3.4
Financial Services 9.1 5.6 3.1 0.1 0.0 -
Other Business Services 35.7 28.4 22.9 16.0 17.8 18.2
Construction and Engineering Services
- - - - - -
Management and Consultancy Services
- - - - - -
Computer And Information services - - - - - -
Royalty And Licenses Fees - - - - - -
Other Services 35.7 28.4 22.9 16.0 17.8 18.2
Government Services 6.5 4.4 2.8 1.7 1.6 2.0
Resident Government 5.1 3.0 1.4 0.1 0.0 0.0
Foreign Government 1.4 1.4 1.4 1.6 1.6 2.0
Other - - - - - -
TABLE 3.6.1: VALUE OF GRENADA'S RECEIPT OF SERVICES: 2000 - 2005
103

(US$Mn)
2000 2001 2002 2003 2004 2005
PAYMENT OF SERVICES (DEBITS) 89.2 84.9 91.8 83.0 94.2 92.8
Transportation 34.3 32.9 30.5 39.2 41.1 45.3
Sea Transport 24.6 21.9 20.2 25.4 26.5 31.9
Air Transport 9.7 10.9 10.3 13.7 14.6 13.4
Travel 7.7 7.6 7.8 8.4 9.4 10.0
Insurance Services 8.2 8.0 8.1 9.0 9.5 12.2
Freight Insurance 4.9 4.4 4.0 5.1 5.3 6.4
Life insurance 0.9 0.6 0.9 0.7 0.7 0.9
General Insurance 0.4 0.4 0.4 0.5 0.4 0.7
Re - Insurance 2.1 2.6 2.7 2.6 3.1 4.3
Insurance Agents Commission - - - - - -
Financial Services 0.5 0.0 4.2 0.0 - -
Other Business Services 34.5 32.6 36.9 20.6 21.4 17.4
Construction and Engineering Services
1.8 3.2 3.4 4.9 3.0 4.1
Management and Consultancy Services
2.5 2.6 2.6 2.8 3.4 3.1
Computer And Information services - - - - - -
Royalty And Licenses Fees 0.6 0.7 0.4 0.6 0.8 0.9
Other Services 29.5 26.1 30.4 12.4 14.2 9.3
Government Services 4.0 3.9 4.5 5.8 12.8 7.9
Resident Government 1.4 1.5 1.5 1.5 1.8 1.9
Foreign Government - - - - - -
Other 2.6 2.4 2.9 4.3 11.0 5.9
TABLE 3.6.2: VALUE OF GRENADA'S PAYMENT OF SERVICES: 2000 - 2005
104

(US$Mn)
2000 2001 2002 2003 2004 2005
BALANCE OF SERVICES 63.6 48.4 41.2 51.0 63.0 23.8
Transportation -28.5 -24.7 -22.6 -30.2 -31.8 -34.0
Sea Transport -20.8 -16.5 -15.0 -19.4 -20.3 -23.5
Air Transport -7.7 -8.3 -7.6 -10.8 -11.5 -10.5
Travel 84.8 75.9 83.7 95.3 74.1 61.4
Insurance Services -5.0 -4.6 -3.1 -5.5 35.5 1.4
Freight Insurance -4.9 -4.3 -4.0 -5.1 -5.1 -6.4
Life insurance -0.9 -0.6 -0.9 -0.7 -0.7 -0.9
General Insurance -0.4 -0.4 -0.4 -0.5 -0.4 -0.7
Re - Insurance -1.7 -2.2 -0.7 -1.7 39.0 5.9
Insurance Agents Commission 2.8 3.0 2.9 2.5 2.7 3.4
Financial Services 8.6 5.5 -1.1 0.1 0.0 -
Other Business Services 1.2 -4.2 -14.0 -4.6 -3.6 0.8
Construction and Engineering Services
-1.8 -3.2 -3.4 -4.9 -3.0 -4.1
Management and Consultancy Services
-2.5 -2.6 -2.6 -2.8 -3.4 -3.1
Computer And Information services - - - - - -
Royalty And Licenses Fees -0.6 -0.7 -0.4 -0.6 -0.8 -0.9
Other Services 6.2 2.3 -7.5 3.6 3.6 8.9
Government Services 2.4 0.5 -1.6 -4.1 -11.1 -5.8
Resident Government 3.7 1.5 -0.1 -1.4 -1.7 -1.9
Foreign Government 1.4 1.4 1.4 1.6 1.6 2.0
Other -2.6 -2.4 -2.9 -4.3 -11.0 -5.9
TABLE 3.6.3: VALUE OF GRENADA'S BALANCE OF SERVICES: 2000 - 2005
105

(US$Mn)
2000 2001 2002 2003 2004 2005
RECEIPT OF SERVICES (CREDITS) 169.3 172.0 172.3 156.8 162.8 147.1
Transportation 7.2 9.2 9.3 6.7 7.2 7.6
Sea Transport … … … … … …
Air Transport … … … … … …
Travel 75.1 60.5 49.3 25.8 27.1 35.1
Communication 37.7 39.3 25.8 26.4 27.7 29.1
Insurance Services 8.2 8.5 5.1 6.4 6.7 7.0
Freight Insurance … … … … … …
Life insurance … … … … … …
General Insurance … … … … … …
Re - Insurance … … … … … …
Insurance Agents Commission … … … … … …
Financial Services 7.0 6.7 6.6 7.8 9.1 9.1
Other Business Services 34.1 47.8 76.2 83.7 85.0 59.2
Construction and Engineering Services - - - - - -
Management and Consultancy Services - - - - - -
Computer And Information services 0.5 1.8 4.3 4.1 4.4 4.7
Royalty And Licenses Fees 14.8 23.1 34.4 32.1 33.7 35.4
Other Services 18.8 22.9 37.5 47.5 46.9 19.1
Government Services - - - - - -
Resident Government - - - - - -
Foreign Government - - - - - -
Other - - - - - -
TABLE 3.7.1: VALUE OF GUYANA'S RECEIPT OF SERVICES: 2000 - 2005
106
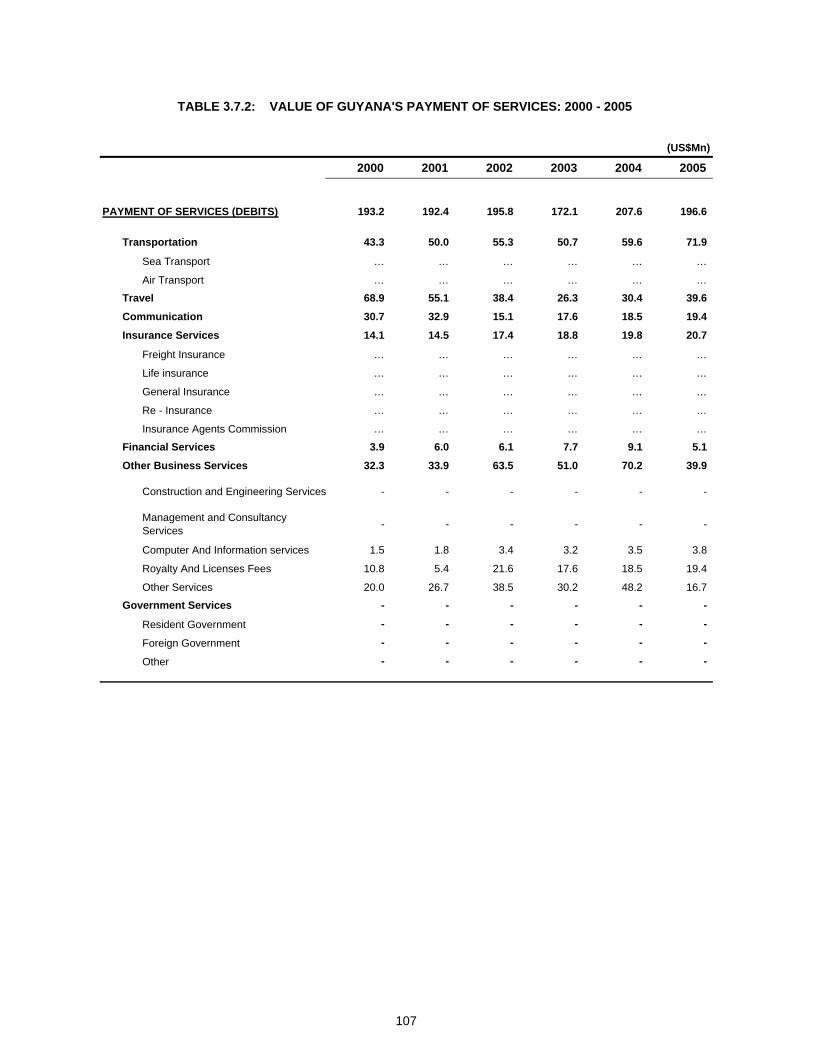
(US$Mn)
2000 2001 2002 2003 2004 2005
PAYMENT OF SERVICES (DEBITS) 193.2 192.4 195.8 172.1 207.6 196.6
Transportation 43.3 50.0 55.3 50.7 59.6 71.9
Sea Transport … … … … … …
Air Transport … … … … … …
Travel 68.9 55.1 38.4 26.3 30.4 39.6
Communication 30.7 32.9 15.1 17.6 18.5 19.4
Insurance Services 14.1 14.5 17.4 18.8 19.8 20.7
Freight Insurance … … … … … …
Life insurance … … … … … …
General Insurance … … … … … …
Re - Insurance … … … … … …
Insurance Agents Commission … … … … … …
Financial Services 3.9 6.0 6.1 7.7 9.1 5.1
Other Business Services 32.3 33.9 63.5 51.0 70.2 39.9
Construction and Engineering Services - - - - - -
Management and Consultancy Services - - - - - -
Computer And Information services 1.5 1.8 3.4 3.2 3.5 3.8
Royalty And Licenses Fees 10.8 5.4 21.6 17.6 18.5 19.4
Other Services 20.0 26.7 38.5 30.2 48.2 16.7
Government Services - - - - - -
Resident Government - - - - - -
Foreign Government - - - - - -
Other - - - - - -
TABLE 3.7.2: VALUE OF GUYANA'S PAYMENT OF SERVICES: 2000 - 2005
107
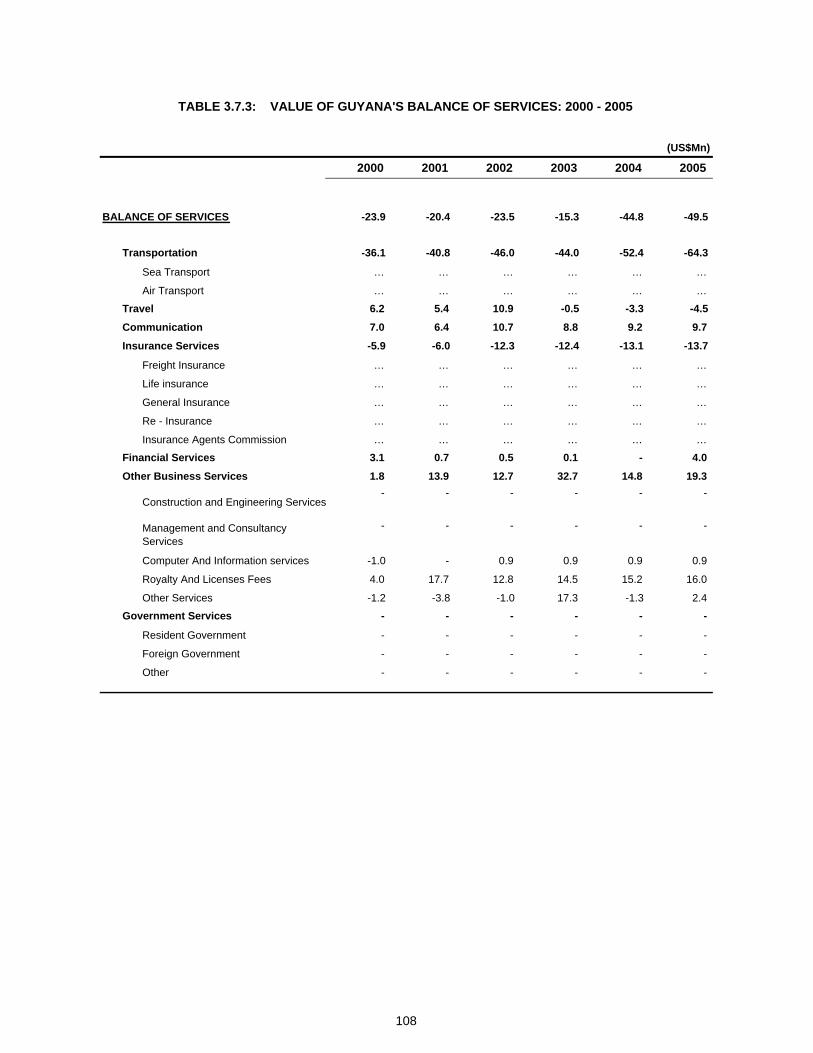
(US$Mn)
2000 2001 2002 2003 2004 2005
BALANCE OF SERVICES -23.9 -20.4 -23.5 -15.3 -44.8 -49.5
Transportation -36.1 -40.8 -46.0 -44.0 -52.4 -64.3
Sea Transport … … … … … …
Air Transport … … … … … …
Travel 6.2 5.4 10.9 -0.5 -3.3 -4.5
Communication 7.0 6.4 10.7 8.8 9.2 9.7
Insurance Services -5.9 -6.0 -12.3 -12.4 -13.1 -13.7
Freight Insurance … … … … … …
Life insurance … … … … … …
General Insurance … … … … … …
Re - Insurance … … … … … …
Insurance Agents Commission … … … … … …
Financial Services 3.1 0.7 0.5 0.1 - 4.0
Other Business Services 1.8 13.9 12.7 32.7 14.8 19.3
Construction and Engineering Services- - - - - -
Management and Consultancy Services
- - - - - -
Computer And Information services -1.0 - 0.9 0.9 0.9 0.9
Royalty And Licenses Fees 4.0 17.7 12.8 14.5 15.2 16.0
Other Services -1.2 -3.8 -1.0 17.3 -1.3 2.4
Government Services - - - - - -
Resident Government - - - - - -
Foreign Government - - - - - -
Other - - - - - -
TABLE 3.7.3: VALUE OF GUYANA'S BALANCE OF SERVICES: 2000 - 2005
108

(US$Mn)
2000 2001 2002 2003 2004 2005
RECEIPT OF SERVICES (CREDITS) 2,025.7 1,897.0 1,912.2 2,138.3 2,297.1 2,329.5
Transportation 328.6 350.5 368.7 474.3 497.3 451.1
Passenger Fares 243.7 261.6 272.8 266.2 295.2 …
Freight 6.5 6.9 6.9 3.6 7.6 …
Port Disbursement … … … … … …
Other 78.4 82.0 89.0 204.5 194.5 …
Travel 1,332.6 1,232.2 1,208.7 1,355.1 1,438.0 1,545.1
Insurance Services 12.1 11.9 15.4 8.4 9.1 14.2
Freight Insurance … … … … … …
Non-Merchandise Insurance … … … … … …
Financial Services 12.6 15.8 22.4 26.3 27.7 50.4
Other Business Services 302.2 256.9 265.7 239.4 290.4 234.8
Communication Services 209.4 164.7 171.1 144.6 192.8 148.4
Construction Services 0.0 0.0 0.0 0.0 0.0 -
Computer And Information services 40.4 36.6 34.1 36.0 33.1 34.5
Royalty And Licenses Fees 6.4 5.9 6.1 12.0 9.7 12.7
Other Business Services 36.4 40.7 45.2 26.4 26.4 9.6
Personal, Cultural and Recreation Services
9.6 9.0 9.2 20.4 28.4 29.6
Government Services 37.6 29.7 31.3 34.8 34.6 34.1
TABLE 3.8.1 VALUE OF JAMAICA'S RECEIPT OF SERVICES: 2000 - 2005
109

(US$Mn)
2000 2001 2002 2003 2004 2005
PAYMENT OF SERVICES (DEBITS) 1,422.5 1,513.9 1,597.5 1,585.9 1,725.4 1,729.4
Transportation 585.2 606.7 614.3 617.9 647.6 724.9
Passenger Fares 28.5 20.9 15.8 17.4 31.7 …
Freight 431.4 457.3 464.8 467.1 506.2 …
Port Disbursement … … … … … …
Other 125.3 128.5 133.7 133.4 109.7 …
Travel 208.7 206.0 258.4 252.4 286.5 249.5
Insurance Services 87.2 94.1 118.4 97.1 124.3 133.8
Freight Insurance … … … … … …
Non-Merchandise Insurance … … … … … …
Financial Services 18.4 29.7 17.7 16.3 31.9 34.2
Other Business Services 491.0 543.4 542.9 553.8 586.8 540.6
Communication Services 31.8 50.1 52.9 45.9 48.3 47.2
Construction Services 10.2 10.0 5.9 4.8 4.7 4.8
Computer And Information services 7.1 13.8 11.6 20.4 75.0 17.2
Royalty And Licenses Fees 41.0 38.3 32.1 10.8 9.0 11.0
Other Business Services 396.8 427.2 436.4 469.5 447.2 458.5
Personal, Cultural and Recreation Services
4.1 4.0 4.0 2.4 2.4 2.0
Government Services 32.0 34.0 45.8 48.4 48.1 46.4
TABLE 3.8.2: VALUE OF JAMAICA'S PAYMENT OF SERVICES: 2000 - 2005
110
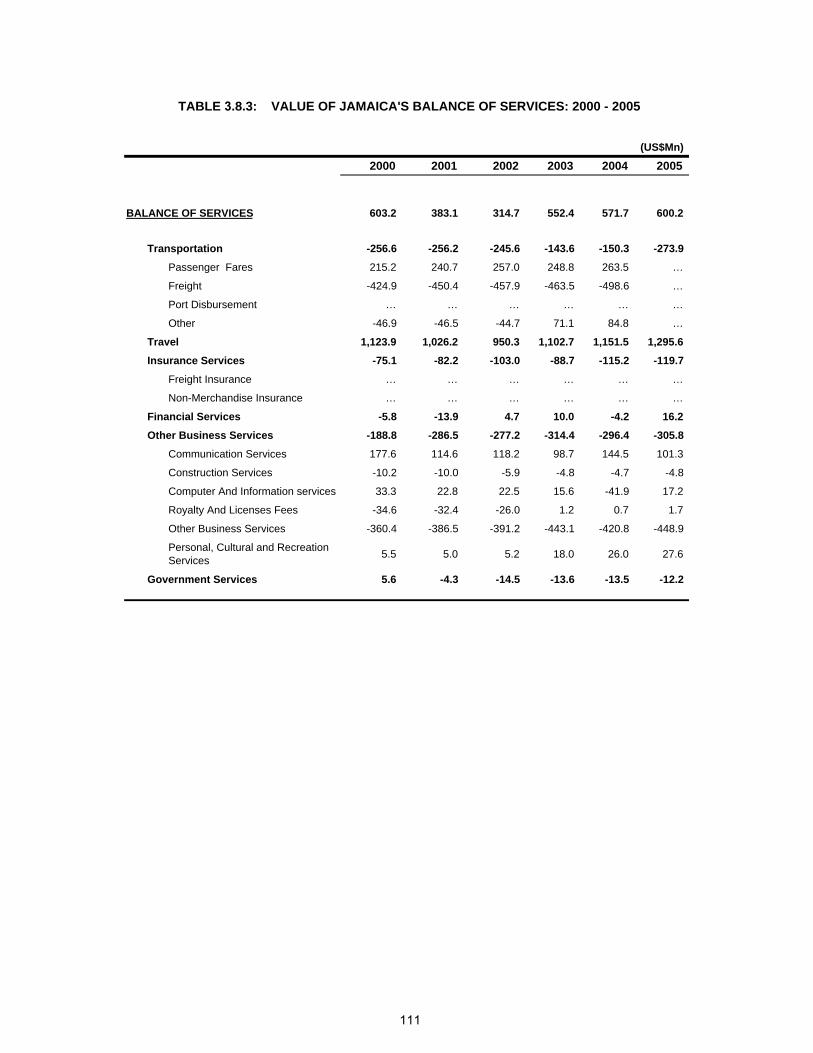
(US$Mn)
2000 2001 2002 2003 2004 2005
BALANCE OF SERVICES 603.2 383.1 314.7 552.4 571.7 600.2
Transportation -256.6 -256.2 -245.6 -143.6 -150.3 -273.9
Passenger Fares 215.2 240.7 257.0 248.8 263.5 …
Freight -424.9 -450.4 -457.9 -463.5 -498.6 …
Port Disbursement … … … … … …
Other -46.9 -46.5 -44.7 71.1 84.8 …
Travel 1,123.9 1,026.2 950.3 1,102.7 1,151.5 1,295.6
Insurance Services -75.1 -82.2 -103.0 -88.7 -115.2 -119.7
Freight Insurance … … … … … …
Non-Merchandise Insurance … … … … … …
Financial Services -5.8 -13.9 4.7 10.0 -4.2 16.2
Other Business Services -188.8 -286.5 -277.2 -314.4 -296.4 -305.8
Communication Services 177.6 114.6 118.2 98.7 144.5 101.3
Construction Services -10.2 -10.0 -5.9 -4.8 -4.7 -4.8
Computer And Information services 33.3 22.8 22.5 15.6 -41.9 17.2
Royalty And Licenses Fees -34.6 -32.4 -26.0 1.2 0.7 1.7
Other Business Services -360.4 -386.5 -391.2 -443.1 -420.8 -448.9
Personal, Cultural and Recreation Services 5.5 5.0 5.2 18.0 26.0 27.6
Government Services 5.6 -4.3 -14.5 -13.6 -13.5 -12.2
TABLE 3.8.3: VALUE OF JAMAICA'S BALANCE OF SERVICES: 2000 - 2005
111

(US$Mn)
2000 2001 2002 2003 2004 2005
RECEIPT OF SERVICES (CREDITS) 16.2 14.7 13.9 12.1 14.9 14.8
Transportation 1.2 1.3 1.4 1.4 1.4 1.4
Sea Transport 1.1 1.2 1.3 1.3 1.3 1.2
Air Transport 0.1 0.1 0.1 0.1 0.1 0.1
Travel 9.0 8.5 8.7 7.3 9.2 9.0
Insurance Services 0.2 0.2 0.3 0.3 0.4 0.6
Freight Insurance - - - - - -
Life insurance - - - - - -
General Insurance - - - - - -
Re - Insurance - - - - - -
Insurance Agents Commission 0.2 0.2 0.3 0.3 0.4 0.6
Financial Services 0.4 0.5 0.6 0.8 0.6 0.5
Other Business Services 5.3 4.0 2.8 2.0 3.1 3.1
Construction and Engineering Services
- - - - - -
Management and Consultancy Services
- - - - - -
Computer And Information services - - - - - -
Royalty And Licenses Fees - - - - - -
Other Services 5.3 4.0 2.8 2.0 3.1 3.1
Government Services 0.2 0.2 0.2 0.2 0.2 0.3
Resident Government 0.2 0.2 0.2 0.2 0.2 0.3
Foreign Government - - - - - -
Other - - - - - -
TABLE 3.9.1: VALUE OF MONTSERRAT'S RECEIPT OF SERVICES: 2000 - 2005
112

(US$Mn)
2000 2001 2002 2003 2004 2005
PAYMENT OF SERVICES (DEBITS) 22.4 20.8 15.6 16.5 23.2 25.6
Transportation 3.7 3.5 4.2 4.5 4.7 4.8
Sea Transport 2.2 1.9 2.5 2.8 2.9 3.0
Air Transport 1.5 1.5 1.6 1.7 1.8 1.8
Travel 1.8 1.8 1.9 1.9 2.1 2.6
Insurance Services 0.6 0.5 0.6 0.7 0.8 1.0
Freight Insurance 0.4 0.4 0.5 0.6 0.6 0.6
Life insurance 0.1 0.0 0.0 0.0 0.0 0.1
General Insurance 0.1 0.1 0.1 0.1 0.2 0.3
Re - Insurance - - - - - -
Insurance Agents Commission - - - - - -
Financial Services - - - - - -
Other Business Services 4.6 5.2 4.1 4.4 9.1 7.9
Construction and Engineering Services
0.1 0.1 0.0 0.4 3.6 2.9
Management and Consultancy Services
0.4 0.7 0.7 0.6 0.8 0.5
Computer And Information services - - 0.1 0.1 0.1 0.0
Royalty And Licenses Fees 0.0 0.0 0.0 0.1 0.1 0.1
Other Services 4.1 4.4 3.2 3.2 4.6 4.4
Government Services 11.7 9.7 4.9 5.0 6.5 9.3
Resident Government 0.4 0.4 0.6 0.4 0.1 0.3
Foreign Government - - - - - -
Other 11.3 9.4 4.4 4.6 6.4 9.0
TABLE 3.9.2: VALUE OF MONTSERRAT'S PAYMENT OF SERVICES: 2000 - 2005
113

(US$Mn)
2000 2001 2002 2003 2004 2005
BALANCE OF SERVICES -6.15 -6.07 -1.71 -4.44 -8.33 -10.81
Transportation -2.5 -2.1 -2.8 -3.0 -3.3 -3.4
Sea Transport -1.1 -0.7 -1.3 -1.4 -1.6 -1.8
Air Transport -1.4 -1.4 -1.5 -1.6 -1.7 -1.7
Travel 7.2 6.7 6.8 5.4 7.1 6.4
Insurance Services -0.4 -0.3 -0.3 -0.4 -0.4 -0.4
Freight Insurance -0.4 -0.4 -0.5 -0.6 -0.6 -0.6
Life insurance -0.1 -0.0 -0.0 -0.0 -0.0 -0.1
General Insurance -0.1 -0.1 -0.1 -0.1 -0.2 -0.3
Re - Insurance - - - - - -
Insurance Agents Commission 0.2 0.2 0.3 0.3 0.4 0.6
Financial Services 0.4 0.5 0.6 0.8 0.6 0.5
Other Business Services 0.7 -1.2 -1.3 -2.4 -6.0 -4.8
Construction and Engineering Services
-0.1 -0.1 -0.0 -0.4 -3.6 -2.9
Management and Consultancy Services
-0.4 -0.7 -0.7 -0.6 -0.8 -0.5
Computer And Information services - - -0.1 -0.1 -0.1 -0.0
Royalty And Licenses Fees -0.0 -0.0 -0.0 -0.1 -0.1 -0.1
Other Services 1.2 -0.4 -0.4 -1.2 -1.5 -1.3
Government Services -11.5 -9.6 -4.7 -4.8 -6.3 -9.0
Resident Government -0.2 -0.2 -0.4 -0.2 0.0 0.0
Foreign Government - - - - - -
Other -11.3 -9.4 -4.4 -4.6 -6.4 -9.0
TABLE 3.9.3: VALUE OF MONTSERRAT'S BALANCE OF SERVICES: 2000 - 2005
114

(US$Mn)
2000 2001 2002 2003 2004 2005
RECEIPT OF SERVICES (CREDITS) 98.5 97.9 90.2 107.2 136.1 147.7
Transportation 10.5 11.4 10.0 9.3 9.8 10.3
Sea Transport 7.4 7.6 7.6 7.1 7.5 7.9
Air Transport 3.2 3.8 2.5 2.3 2.2 2.5
Travel 58.4 61.9 57.1 75.3 103.4 110.2
Insurance Services 3.2 2.1 2.2 1.9 1.9 2.0
Freight Insurance 0.0 - 0.0 - - -
Life insurance - - - - - -
General Insurance 0.0 0.0 0.0 0.0 0.0 0.0
Re - Insurance 1.3 0.1 0.3 0.0 0.0 0.0
Insurance Agents Commission 1.9 1.9 1.9 1.9 1.9 2.0
Financial Services 6.8 6.2 4.9 5.0 6.1 7.5
Other Business Services 16.1 12.2 11.7 11.3 10.8 13.0
Construction and Engineering Services
1.6 1.6 1.8 0.1 0.2 0.4
Management and Consultancy Services
0.0 0.0 0.1 0.1 0.1 0.1
Computer And Information services - - - - - -
Royalty And Licenses Fees - - - 0.1 - -
Other Services 14.5 10.5 9.7 11.1 10.4 12.5
Government Services 3.5 4.2 4.2 4.2 4.1 4.6
Resident Government 2.9 3.6 3.6 3.4 3.7 4.2
Foreign Government 0.6 0.6 0.6 0.8 0.4 0.4
Other - - - - - -
TABLE 3.10.1: VALUE OF ST. KITTS AND NEVIS' RECEIPT OF SERVICES: 2000 - 2005
115
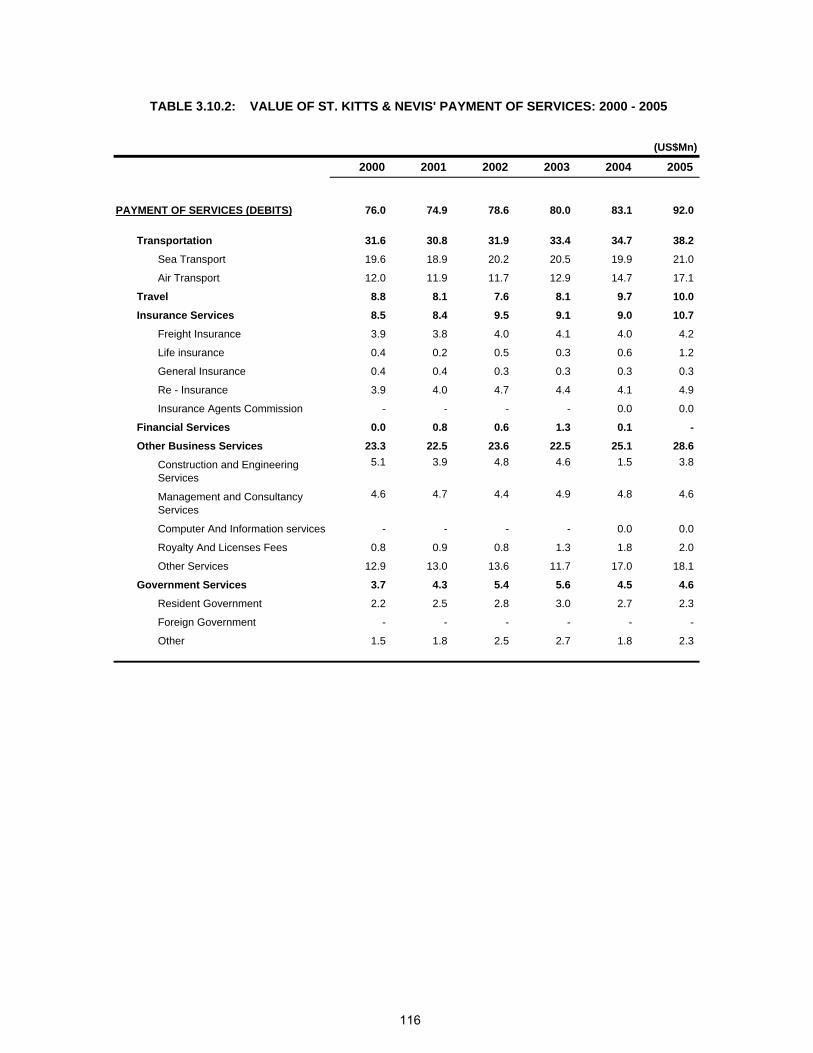
(US$Mn)
2000 2001 2002 2003 2004 2005
PAYMENT OF SERVICES (DEBITS) 76.0 74.9 78.6 80.0 83.1 92.0
Transportation 31.6 30.8 31.9 33.4 34.7 38.2
Sea Transport 19.6 18.9 20.2 20.5 19.9 21.0
Air Transport 12.0 11.9 11.7 12.9 14.7 17.1
Travel 8.8 8.1 7.6 8.1 9.7 10.0
Insurance Services 8.5 8.4 9.5 9.1 9.0 10.7
Freight Insurance 3.9 3.8 4.0 4.1 4.0 4.2
Life insurance 0.4 0.2 0.5 0.3 0.6 1.2
General Insurance 0.4 0.4 0.3 0.3 0.3 0.3
Re - Insurance 3.9 4.0 4.7 4.4 4.1 4.9
Insurance Agents Commission - - - - 0.0 0.0
Financial Services 0.0 0.8 0.6 1.3 0.1 -
Other Business Services 23.3 22.5 23.6 22.5 25.1 28.6
Construction and Engineering Services
5.1 3.9 4.8 4.6 1.5 3.8
Management and Consultancy Services
4.6 4.7 4.4 4.9 4.8 4.6
Computer And Information services - - - - 0.0 0.0
Royalty And Licenses Fees 0.8 0.9 0.8 1.3 1.8 2.0
Other Services 12.9 13.0 13.6 11.7 17.0 18.1
Government Services 3.7 4.3 5.4 5.6 4.5 4.6
Resident Government 2.2 2.5 2.8 3.0 2.7 2.3
Foreign Government - - - - - -
Other 1.5 1.8 2.5 2.7 1.8 2.3
TABLE 3.10.2: VALUE OF ST. KITTS & NEVIS' PAYMENT OF SERVICES: 2000 - 2005
116
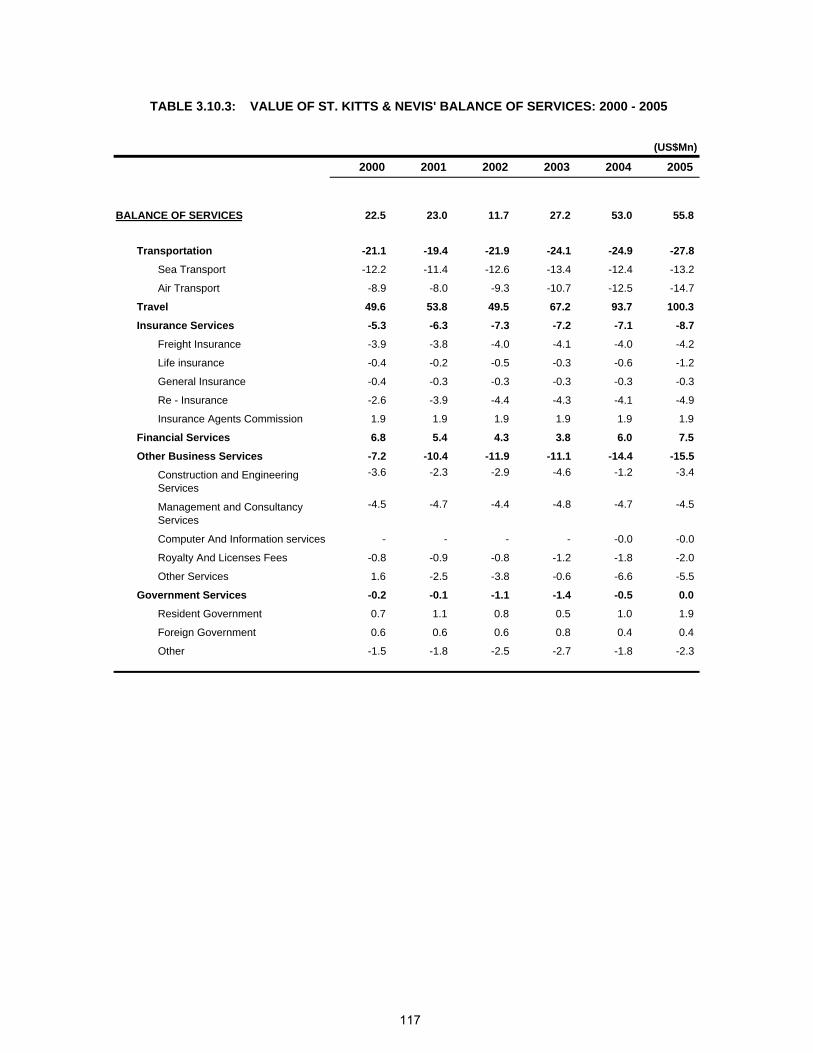
(US$Mn)
2000 2001 2002 2003 2004 2005
BALANCE OF SERVICES 22.5 23.0 11.7 27.2 53.0 55.8
Transportation -21.1 -19.4 -21.9 -24.1 -24.9 -27.8
Sea Transport -12.2 -11.4 -12.6 -13.4 -12.4 -13.2
Air Transport -8.9 -8.0 -9.3 -10.7 -12.5 -14.7
Travel 49.6 53.8 49.5 67.2 93.7 100.3
Insurance Services -5.3 -6.3 -7.3 -7.2 -7.1 -8.7
Freight Insurance -3.9 -3.8 -4.0 -4.1 -4.0 -4.2
Life insurance -0.4 -0.2 -0.5 -0.3 -0.6 -1.2
General Insurance -0.4 -0.3 -0.3 -0.3 -0.3 -0.3
Re - Insurance -2.6 -3.9 -4.4 -4.3 -4.1 -4.9
Insurance Agents Commission 1.9 1.9 1.9 1.9 1.9 1.9
Financial Services 6.8 5.4 4.3 3.8 6.0 7.5
Other Business Services -7.2 -10.4 -11.9 -11.1 -14.4 -15.5
Construction and Engineering Services
-3.6 -2.3 -2.9 -4.6 -1.2 -3.4
Management and Consultancy Services
-4.5 -4.7 -4.4 -4.8 -4.7 -4.5
Computer And Information services - - - - -0.0 -0.0
Royalty And Licenses Fees -0.8 -0.9 -0.8 -1.2 -1.8 -2.0
Other Services 1.6 -2.5 -3.8 -0.6 -6.6 -5.5
Government Services -0.2 -0.1 -1.1 -1.4 -0.5 0.0
Resident Government 0.7 1.1 0.8 0.5 1.0 1.9
Foreign Government 0.6 0.6 0.6 0.8 0.4 0.4
Other -1.5 -1.8 -2.5 -2.7 -1.8 -2.3
TABLE 3.10.3: VALUE OF ST. KITTS & NEVIS' BALANCE OF SERVICES: 2000 - 2005
117
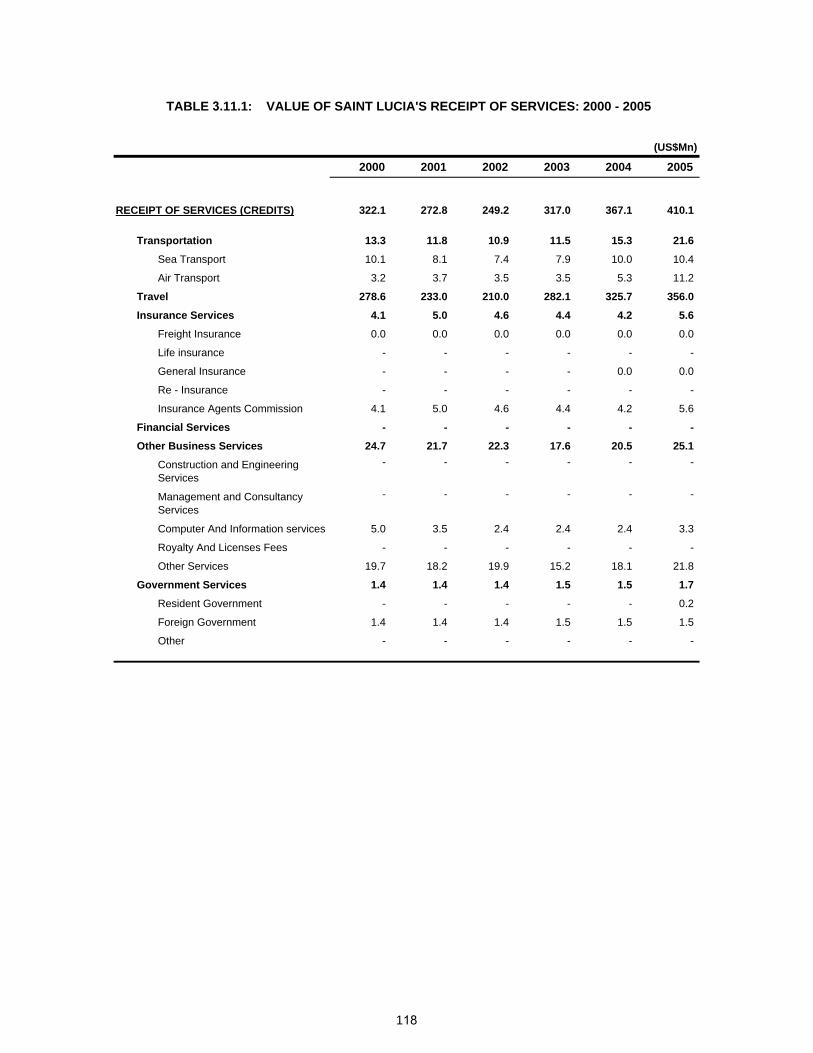
(US$Mn)
2000 2001 2002 2003 2004 2005
RECEIPT OF SERVICES (CREDITS) 322.1 272.8 249.2 317.0 367.1 410.1
Transportation 13.3 11.8 10.9 11.5 15.3 21.6
Sea Transport 10.1 8.1 7.4 7.9 10.0 10.4
Air Transport 3.2 3.7 3.5 3.5 5.3 11.2
Travel 278.6 233.0 210.0 282.1 325.7 356.0
Insurance Services 4.1 5.0 4.6 4.4 4.2 5.6
Freight Insurance 0.0 0.0 0.0 0.0 0.0 0.0
Life insurance - - - - - -
General Insurance - - - - 0.0 0.0
Re - Insurance - - - - - -
Insurance Agents Commission 4.1 5.0 4.6 4.4 4.2 5.6
Financial Services - - - - - -
Other Business Services 24.7 21.7 22.3 17.6 20.5 25.1
Construction and Engineering Services
- - - - - -
Management and Consultancy Services
- - - - - -
Computer And Information services 5.0 3.5 2.4 2.4 2.4 3.3
Royalty And Licenses Fees - - - - - -
Other Services 19.7 18.2 19.9 15.2 18.1 21.8
Government Services 1.4 1.4 1.4 1.5 1.5 1.7
Resident Government - - - - - 0.2
Foreign Government 1.4 1.4 1.4 1.5 1.5 1.5
Other - - - - - -
TABLE 3.11.1: VALUE OF SAINT LUCIA'S RECEIPT OF SERVICES: 2000 - 2005
118
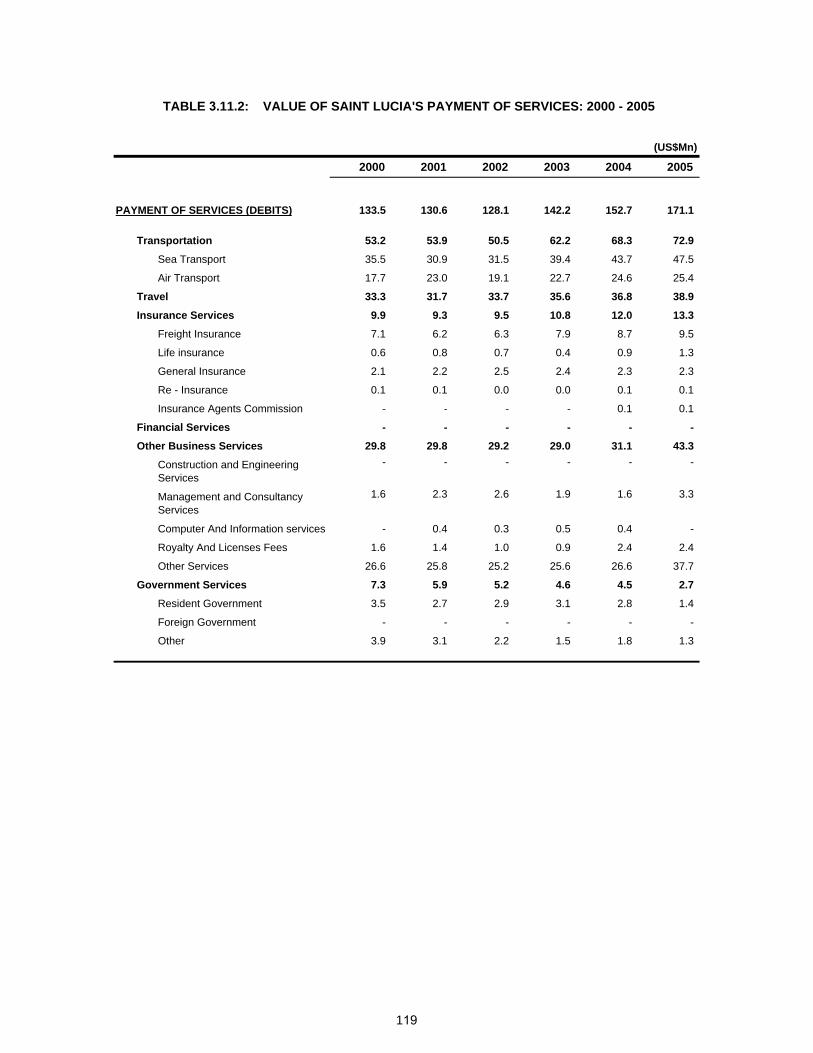
(US$Mn)
2000 2001 2002 2003 2004 2005
PAYMENT OF SERVICES (DEBITS) 133.5 130.6 128.1 142.2 152.7 171.1
Transportation 53.2 53.9 50.5 62.2 68.3 72.9
Sea Transport 35.5 30.9 31.5 39.4 43.7 47.5
Air Transport 17.7 23.0 19.1 22.7 24.6 25.4
Travel 33.3 31.7 33.7 35.6 36.8 38.9
Insurance Services 9.9 9.3 9.5 10.8 12.0 13.3
Freight Insurance 7.1 6.2 6.3 7.9 8.7 9.5
Life insurance 0.6 0.8 0.7 0.4 0.9 1.3
General Insurance 2.1 2.2 2.5 2.4 2.3 2.3
Re - Insurance 0.1 0.1 0.0 0.0 0.1 0.1
Insurance Agents Commission - - - - 0.1 0.1
Financial Services - - - - - -
Other Business Services 29.8 29.8 29.2 29.0 31.1 43.3
Construction and Engineering Services
- - - - - -
Management and Consultancy Services
1.6 2.3 2.6 1.9 1.6 3.3
Computer And Information services - 0.4 0.3 0.5 0.4 -
Royalty And Licenses Fees 1.6 1.4 1.0 0.9 2.4 2.4
Other Services 26.6 25.8 25.2 25.6 26.6 37.7
Government Services 7.3 5.9 5.2 4.6 4.5 2.7
Resident Government 3.5 2.7 2.9 3.1 2.8 1.4
Foreign Government - - - - - -
Other 3.9 3.1 2.2 1.5 1.8 1.3
TABLE 3.11.2: VALUE OF SAINT LUCIA'S PAYMENT OF SERVICES: 2000 - 2005
119

(US$Mn)
2000 2001 2002 2003 2004 2005
BALANCE OF SERVICES 188.6 142.2 121.1 174.8 214.4 239.0
Transportation -39.9 -42.1 -39.6 -50.7 -53.0 -51.2
Sea Transport -25.4 -22.9 -24.0 -31.5 -33.7 -37.1
Air Transport -14.5 -19.3 -15.6 -19.2 -19.3 -14.2
Travel 245.3 201.3 176.3 246.4 288.8 317.1
Insurance Services -5.8 -4.3 -5.0 -6.4 -7.8 -7.7
Freight Insurance -7.1 -6.2 -6.3 -7.9 -8.7 -9.5
Life insurance -0.6 -0.8 -0.7 -0.4 -0.9 -1.3
General Insurance -2.1 -2.2 -2.5 -2.4 -2.3 -2.3
Re - Insurance -0.1 -0.1 -0.0 -0.0 -0.1 -0.1
Insurance Agents Commission 4.1 5.0 4.6 4.4 4.1 5.6
Financial Services - - - - - -
Other Business Services -5.1 -8.2 -6.9 -11.4 -10.6 -18.2
Construction and Engineering Services
- - - - - -
Management and Consultancy Services
-1.6 -2.3 -2.6 -1.9 -1.6 -3.3
Computer And Information services 5.0 3.1 2.1 1.9 2.0 3.3
Royalty And Licenses Fees -1.6 -1.4 -1.0 -0.9 -2.4 -2.4
Other Services -6.9 -7.6 -5.3 -10.5 -8.6 -15.9
Government Services -6.0 -4.5 -3.7 -3.2 -3.0 -1.0
Resident Government -3.5 -2.7 -2.9 -3.1 -2.8 -1.2
Foreign Government 1.4 1.4 1.4 1.5 1.5 1.5
Other -3.9 -3.1 -2.2 -1.5 -1.8 -1.3
TABLE 3.11.3: VALUE OF SAINT LUCIA'S BALANCE OF SERVICES: 2000 - 2005
120

(US$Mn)
2000 2001 2002 2003 2004
RECEIPT OF SERVICES (CREDITS) 91.0 59.4 38.5 59.5 141.3
Transportation 37.2 18.9 23.2 26.3 49.4 Sea Transport - - - - -
Passenger - - - - -
Freight - - - - -
Other - - - - -
Air Transport 37.2 18.9 23.2 26.3 49.4 Passenger 26.1 12.0 13.5 14.2 34.9
Freight 1.9 0.5 3.6 0.5 3.0
Other 9.2 6.4 6.1 11.6 11.5
Other Transport - - - - - Passenger - - - - -
Freight - - - - -
Other - - - - -
Travel 15.8 14.4 3.4 3.9 17.0 Business - - - - - Personal 15.8 14.4 3.4 3.9 17.0
Insurance Services 0.2 0.1 0.4 0.1 0.3 Freight Insurance 0.2 0.1 0.4 0.1 0.3 Life Insurance and Pension Funds - - - - - Other - - - - -
Financial Services - - - - - Other Services 32.1 22.8 8.2 21.7 62.3
Business Services - - 8.2 21.7 62.3 Communication ServicesConstruction and Engineering Service - - - - - Management Fees - - - - - Computer and Information services - - - - - Royalty And Licenses Fees - - - - - Other Business Services - - 8.2 21.7 62.3
Merchanting and Other Trade-Related - - - - -
Operational Leasing - - - - -
Miscellaneous Business - - 8.2 21.7 62.3
Personal, Cultural and Recreational - - - - -
Miscellaneous - - - - -
Government Services 5.7 3.2 3.3 7.6 12.3 Embassies and consulates - - - - - Military units and agencies - - - - -
Other 5.7 3.2 3.3 7.6 12.3
TABLE 3.12.1: VALUE OF SURINAME'S RECEIPT OF SERVICES: 2000 - 2004
121
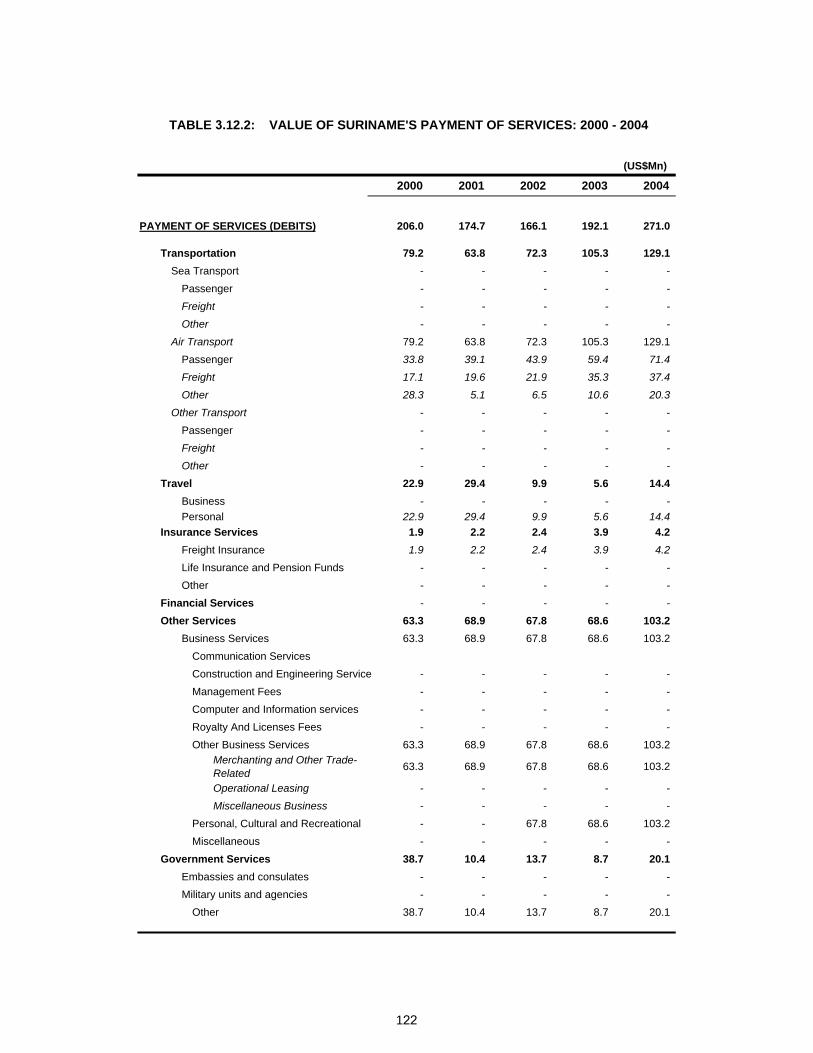
(US$Mn)
2000 2001 2002 2003 2004
PAYMENT OF SERVICES (DEBITS) 206.0 174.7 166.1 192.1 271.0
Transportation 79.2 63.8 72.3 105.3 129.1 Sea Transport - - - - -
Passenger - - - - -
Freight - - - - -
Other - - - - -
Air Transport 79.2 63.8 72.3 105.3 129.1 Passenger 33.8 39.1 43.9 59.4 71.4
Freight 17.1 19.6 21.9 35.3 37.4
Other 28.3 5.1 6.5 10.6 20.3
Other Transport - - - - - Passenger - - - - -
Freight - - - - -
Other - - - - -
Travel 22.9 29.4 9.9 5.6 14.4 Business - - - - - Personal 22.9 29.4 9.9 5.6 14.4
Insurance Services 1.9 2.2 2.4 3.9 4.2 Freight Insurance 1.9 2.2 2.4 3.9 4.2
Life Insurance and Pension Funds - - - - -
Other - - - - -
Financial Services - - - - -
Other Services 63.3 68.9 67.8 68.6 103.2 Business Services 63.3 68.9 67.8 68.6 103.2
Communication ServicesConstruction and Engineering Service - - - - - Management Fees - - - - - Computer and Information services - - - - - Royalty And Licenses Fees - - - - - Other Business Services 63.3 68.9 67.8 68.6 103.2
Merchanting and Other Trade-Related 63.3 68.9 67.8 68.6 103.2
Operational Leasing - - - - - Miscellaneous Business - - - - -
Personal, Cultural and Recreational - - 67.8 68.6 103.2 Miscellaneous - - - - -
Government Services 38.7 10.4 13.7 8.7 20.1 Embassies and consulates - - - - - Military units and agencies - - - - -
Other 38.7 10.4 13.7 8.7 20.1
TABLE 3.12.2: VALUE OF SURINAME'S PAYMENT OF SERVICES: 2000 - 2004
122

(US$Mn)
2000 2001 2002 2003 2004
BALANCE OF SERVICES -115.0 -115.3 -127.6 -132.6 -129.7
Transportation -42.0 -44.9 -49.1 -79.0 -79.8 Passenger Services - - - - -
Sea Transport - - - - -
Air Transport - - - - -
Other Transport - - - - -
Freight -42.0 -44.9 -49.1 -79.0 -79.8 Sea Transport -7.7 -27.1 -30.4 -45.2 -36.5
Air Transport -15.2 -19.1 -18.3 -34.8 -34.5
Other Transport -19.1 1.3 -0.4 1.0 -8.8
Other - - - - - Sea Transport - - - - -
Air Transport - - - - -
Other Transport - - - - -
Travel -7.1 -15.0 -6.5 -1.7 2.6 Business - - - - - Personal -7.1 -15.0 -6.5 -1.7 2.6
Insurance Services -1.7 -2.1 -2.0 -3.9 -3.8 Freight Insurance -1.7 -2.1 -2.0 -3.9 -3.8
Life Insurance and Pension Funds - - - - -
Other - - - - -
Financial Services - - - - - Other Services -31.2 -46.1 -59.6 -46.9 -40.9
Business Services -63.3 -68.9 -59.6 -46.9 -40.9
Communication Services - - - - -
Construction Services - - - - -
Management Fees - - - - -
Computer and Information services - - - - -
Royalty And Licenses Fees - - - - -
Other Business Services -63.3 -68.9 -59.6 -46.9 -40.9 Merchanting and Other Trade-Related -63.3 -68.9 -67.8 -68.6 -103.2
Operational Leasing - - - - -
Miscellaneous Business - - 8.2 21.7 62.3
Personal, Cultural and Recreational - - -67.8 -68.6 -103.2
Miscellaneous - - - - -
Government Services -33.0 -7.2 -10.4 -1.1 -7.8 Embassies and consulates - - - - -
Military units and agencies - - - - -
Other -33.0 -7.2 -10.4 -1.1 -7.8
TABLE 3.12.3: VALUE OF SURINAME'S BALANCE OF SERVICES: 2000 - 2004
123
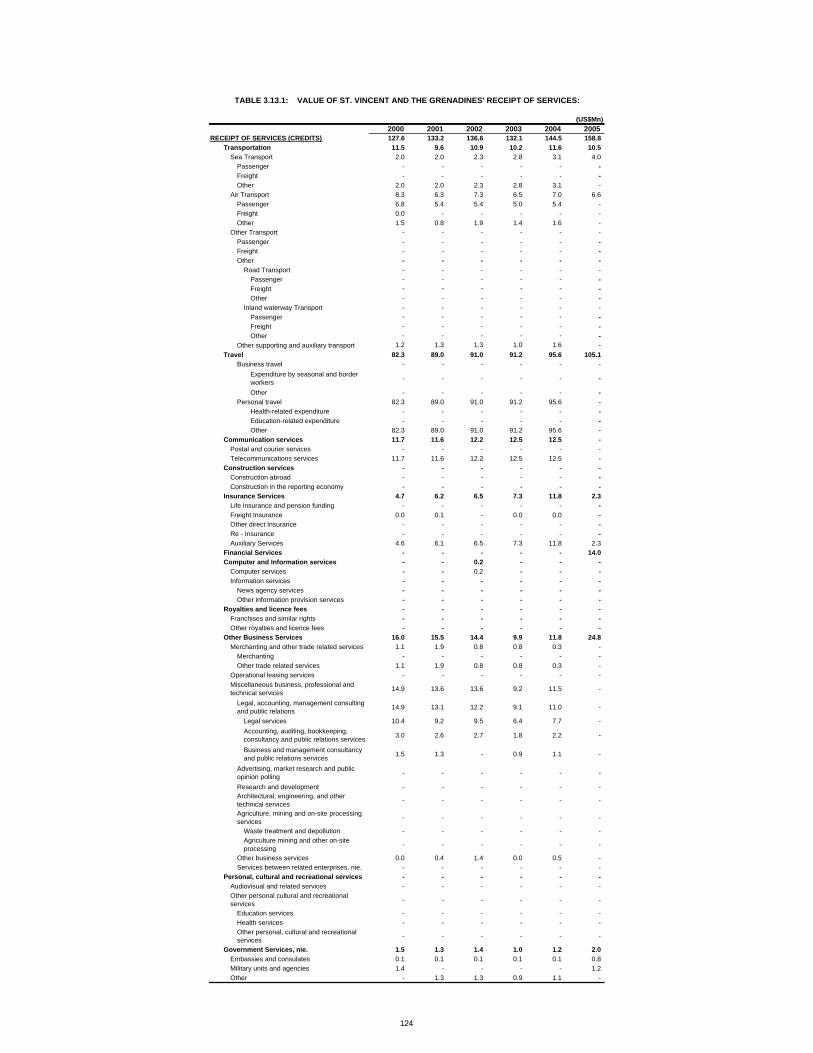
(US$Mn)2000 2001 2002 2003 2004 2005
RECEIPT OF SERVICES (CREDITS) 127.6 133.2 136.6 132.1 144.5 158.8 Transportation 11.5 9.6 10.9 10.2 11.6 10.5
Sea Transport 2.0 2.0 2.3 2.8 3.1 4.0 Passenger - - - - - - Freight - - - - - - Other 2.0 2.0 2.3 2.8 3.1 -
Air Transport 8.3 6.3 7.3 6.5 7.0 6.6 Passenger 6.8 5.4 5.4 5.0 5.4 - Freight 0.0 - - - - - Other 1.5 0.8 1.9 1.4 1.6 -
Other Transport - - - - - - Passenger - - - - - - Freight - - - - - - Other - - - - - -
Road Transport - - - - - - Passenger - - - - - - Freight - - - - - - Other - - - - - -
Inland waterway Transport - - - - - - Passenger - - - - - - Freight - - - - - - Other - - - - - -
Other supporting and auxiliary transport 1.2 1.3 1.3 1.0 1.6 - Travel 82.3 89.0 91.0 91.2 95.6 105.1
Business travel - - - - - - Expenditure by seasonal and border workers - - - - - -
Other - - - - - - Personal travel 82.3 89.0 91.0 91.2 95.6 -
Health-related expenditure - - - - - - Education-related expenditure - - - - - - Other 82.3 89.0 91.0 91.2 95.6 -
Communication services 11.7 11.6 12.2 12.5 12.5 - Postal and courier services - - - - - - Telecommunications services 11.7 11.6 12.2 12.5 12.5 -
Construction services - - - - - - Construction abroad - - - - - - Construction in the reporting economy - - - - - -
Insurance Services 4.7 6.2 6.5 7.3 11.8 2.3 Life insurance and pension funding - - - - - - Freight Insurance 0.0 0.1 - 0.0 0.0 - Other direct Insurance - - - - - - Re - Insurance - - - - - - Auxiliary Services 4.6 6.1 6.5 7.3 11.8 2.3
Financial Services - - - - - 14.0 Computer and Information services - - 0.2 - - -
Computer services - - 0.2 - - - Information services - - - - - -
News agency services - - - - - - Other information provision services - - - - - -
Royalties and licence fees - - - - - -Franchises and similar rights - - - - - - Other royalties and licence fees - - - - - -
Other Business Services 16.0 15.5 14.4 9.9 11.8 24.8 Merchanting and other trade related services 1.1 1.9 0.8 0.8 0.3 -
Merchanting - - - - - - Other trade related services 1.1 1.9 0.8 0.8 0.3 -
Operational leasing services - - - - - - Miscellaneous business, professional and technical services 14.9 13.6 13.6 9.2 11.5 -
Legal, accounting, management consulting and public relations 14.9 13.1 12.2 9.1 11.0 -
Legal services 10.4 9.2 9.5 6.4 7.7 - Accounting, auditing, bookkeeping, consultancy and public relations services 3.0 2.6 2.7 1.8 2.2 -
Business and management consultancy and public relations services 1.5 1.3 - 0.9 1.1 -
Advertising, market research and public opinion polling - - - - - -
Research and development - - - - - - Architectural, engineering, and other technical services - - - - - -
Agriculture, mining and on-site processing services - - - - - -
Waste treatment and depollution - - - - - - Agriculture mining and other on-site processing - - - - - -
Other business services 0.0 0.4 1.4 0.0 0.5 - Services between related enterprises, nie. - - - - - -
Personal, cultural and recreational services - - - - - - Audiovisual and related services - - - - - - Other personal cultural and recreational services - - - - - -
Education services - - - - - - Health services - - - - - - Other personal, cultural and recreational services - - - - - -
Government Services, nie. 1.5 1.3 1.4 1.0 1.2 2.0 Embassies and consulates 0.1 0.1 0.1 0.1 0.1 0.8 Military units and agencies 1.4 - - - - 1.2 Other - 1.3 1.3 0.9 1.1 -
TABLE 3.13.1: VALUE OF ST. VINCENT AND THE GRENADINES' RECEIPT OF SERVICES:
124
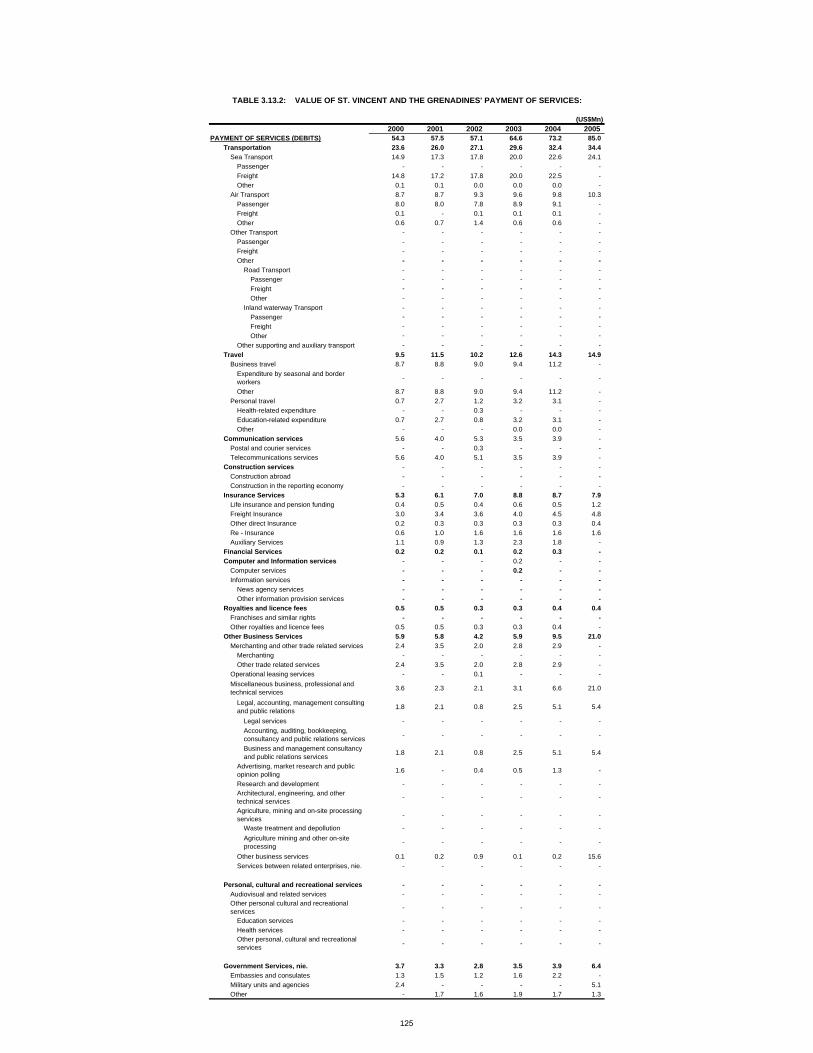
(US$Mn)2000 2001 2002 2003 2004 2005
PAYMENT OF SERVICES (DEBITS) 54.3 57.5 57.1 64.6 73.2 85.0 Transportation 23.6 26.0 27.1 29.6 32.4 34.4
Sea Transport 14.9 17.3 17.8 20.0 22.6 24.1 Passenger - - - - - - Freight 14.8 17.2 17.8 20.0 22.5 - Other 0.1 0.1 0.0 0.0 0.0 -
Air Transport 8.7 8.7 9.3 9.6 9.8 10.3 Passenger 8.0 8.0 7.8 8.9 9.1 - Freight 0.1 - 0.1 0.1 0.1 - Other 0.6 0.7 1.4 0.6 0.6 -
Other Transport - - - - - - Passenger - - - - - - Freight - - - - - - Other - - - - - -
Road Transport - - - - - - Passenger - - - - - - Freight - - - - - - Other - - - - - -
Inland waterway Transport - - - - - - Passenger - - - - - - Freight - - - - - - Other - - - - - -
Other supporting and auxiliary transport - - - - - - Travel 9.5 11.5 10.2 12.6 14.3 14.9
Business travel 8.7 8.8 9.0 9.4 11.2 - Expenditure by seasonal and border workers - - - - - -
Other 8.7 8.8 9.0 9.4 11.2 - Personal travel 0.7 2.7 1.2 3.2 3.1 -
Health-related expenditure - - 0.3 - - - Education-related expenditure 0.7 2.7 0.8 3.2 3.1 - Other - - - 0.0 0.0 -
Communication services 5.6 4.0 5.3 3.5 3.9 - Postal and courier services - - 0.3 - - - Telecommunications services 5.6 4.0 5.1 3.5 3.9 -
Construction services - - - - - - Construction abroad - - - - - - Construction in the reporting economy - - - - - -
Insurance Services 5.3 6.1 7.0 8.8 8.7 7.9 Life insurance and pension funding 0.4 0.5 0.4 0.6 0.5 1.2 Freight Insurance 3.0 3.4 3.6 4.0 4.5 4.8 Other direct Insurance 0.2 0.3 0.3 0.3 0.3 0.4 Re - Insurance 0.6 1.0 1.6 1.6 1.6 1.6 Auxiliary Services 1.1 0.9 1.3 2.3 1.8 -
Financial Services 0.2 0.2 0.1 0.2 0.3 -Computer and Information services - - - 0.2 - -
Computer services - - - 0.2 - - Information services - - - - - -
News agency services - - - - - - Other information provision services - - - - - -
Royalties and licence fees 0.5 0.5 0.3 0.3 0.4 0.4 Franchises and similar rights - - - - - - Other royalties and licence fees 0.5 0.5 0.3 0.3 0.4 -
Other Business Services 5.9 5.8 4.2 5.9 9.5 21.0 Merchanting and other trade related services 2.4 3.5 2.0 2.8 2.9 -
Merchanting - - - - - - Other trade related services 2.4 3.5 2.0 2.8 2.9 -
Operational leasing services - - 0.1 - - - Miscellaneous business, professional and technical services 3.6 2.3 2.1 3.1 6.6 21.0
Legal, accounting, management consulting and public relations 1.8 2.1 0.8 2.5 5.1 5.4
Legal services - - - - - - Accounting, auditing, bookkeeping, consultancy and public relations services - - - - - -
Business and management consultancy and public relations services 1.8 2.1 0.8 2.5 5.1 5.4
Advertising, market research and public opinion polling 1.6 - 0.4 0.5 1.3 -
Research and development - - - - - - Architectural, engineering, and other technical services - - - - - -
Agriculture, mining and on-site processing services - - - - - -
Waste treatment and depollution - - - - - - Agriculture mining and other on-site processing - - - - - -
Other business services 0.1 0.2 0.9 0.1 0.2 15.6 Services between related enterprises, nie. - - - - - -
Personal, cultural and recreational services - - - - - - Audiovisual and related services - - - - - - Other personal cultural and recreational services - - - - - -
Education services - - - - - - Health services - - - - - - Other personal, cultural and recreational services - - - - - -
Government Services, nie. 3.7 3.3 2.8 3.5 3.9 6.4 Embassies and consulates 1.3 1.5 1.2 1.6 2.2 -Military units and agencies 2.4 - - - - 5.1 Other - 1.7 1.6 1.9 1.7 1.3
TABLE 3.13.2: VALUE OF ST. VINCENT AND THE GRENADINES' PAYMENT OF SERVICES:
125
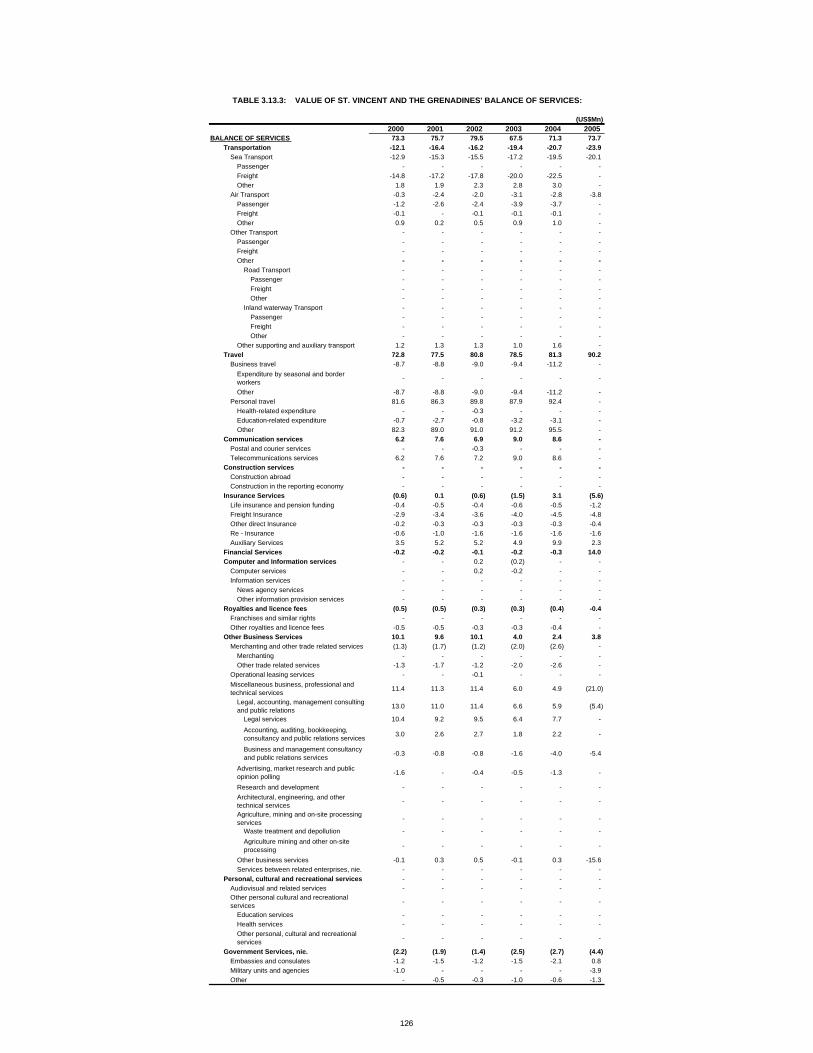
(US$Mn)2000 2001 2002 2003 2004 2005
BALANCE OF SERVICES 73.3 75.7 79.5 67.5 71.3 73.7 Transportation -12.1 -16.4 -16.2 -19.4 -20.7 -23.9
Sea Transport -12.9 -15.3 -15.5 -17.2 -19.5 -20.1 Passenger - - - - - - Freight -14.8 -17.2 -17.8 -20.0 -22.5 - Other 1.8 1.9 2.3 2.8 3.0 -
Air Transport -0.3 -2.4 -2.0 -3.1 -2.8 -3.8 Passenger -1.2 -2.6 -2.4 -3.9 -3.7 - Freight -0.1 - -0.1 -0.1 -0.1 - Other 0.9 0.2 0.5 0.9 1.0 -
Other Transport - - - - - - Passenger - - - - - - Freight - - - - - - Other - - - - - -
Road Transport - - - - - - Passenger - - - - - - Freight - - - - - - Other - - - - - -
Inland waterway Transport - - - - - - Passenger - - - - - - Freight - - - - - - Other - - - - - -
Other supporting and auxiliary transport 1.2 1.3 1.3 1.0 1.6 - Travel 72.8 77.5 80.8 78.5 81.3 90.2
Business travel -8.7 -8.8 -9.0 -9.4 -11.2 - Expenditure by seasonal and border workers - - - - - -
Other -8.7 -8.8 -9.0 -9.4 -11.2 - Personal travel 81.6 86.3 89.8 87.9 92.4 -
Health-related expenditure - - -0.3 - - - Education-related expenditure -0.7 -2.7 -0.8 -3.2 -3.1 - Other 82.3 89.0 91.0 91.2 95.5 -
Communication services 6.2 7.6 6.9 9.0 8.6 - Postal and courier services - - -0.3 - - - Telecommunications services 6.2 7.6 7.2 9.0 8.6 -
Construction services - - - - - - Construction abroad - - - - - - Construction in the reporting economy - - - - - -
Insurance Services (0.6) 0.1 (0.6) (1.5) 3.1 (5.6) Life insurance and pension funding -0.4 -0.5 -0.4 -0.6 -0.5 -1.2 Freight Insurance -2.9 -3.4 -3.6 -4.0 -4.5 -4.8 Other direct Insurance -0.2 -0.3 -0.3 -0.3 -0.3 -0.4 Re - Insurance -0.6 -1.0 -1.6 -1.6 -1.6 -1.6 Auxiliary Services 3.5 5.2 5.2 4.9 9.9 2.3
Financial Services -0.2 -0.2 -0.1 -0.2 -0.3 14.0 Computer and Information services - - 0.2 (0.2) - -
Computer services - - 0.2 -0.2 - - Information services - - - - - -
News agency services - - - - - - Other information provision services - - - - - -
Royalties and licence fees (0.5) (0.5) (0.3) (0.3) (0.4) -0.4 Franchises and similar rights - - - - - - Other royalties and licence fees -0.5 -0.5 -0.3 -0.3 -0.4 -
Other Business Services 10.1 9.6 10.1 4.0 2.4 3.8 Merchanting and other trade related services (1.3) (1.7) (1.2) (2.0) (2.6) -
Merchanting - - - - - - Other trade related services -1.3 -1.7 -1.2 -2.0 -2.6 -
Operational leasing services - - -0.1 - - - Miscellaneous business, professional and technical services 11.4 11.3 11.4 6.0 4.9 (21.0)
Legal, accounting, management consulting and public relations 13.0 11.0 11.4 6.6 5.9 (5.4)
Legal services 10.4 9.2 9.5 6.4 7.7 - Accounting, auditing, bookkeeping, consultancy and public relations services 3.0 2.6 2.7 1.8 2.2 -
Business and management consultancy and public relations services -0.3 -0.8 -0.8 -1.6 -4.0 -5.4
Advertising, market research and public opinion polling -1.6 - -0.4 -0.5 -1.3 -
Research and development - - - - - - Architectural, engineering, and other technical services - - - - - -
Agriculture, mining and on-site processing services - - - - - -
Waste treatment and depollution - - - - - - Agriculture mining and other on-site processing - - - - - -
Other business services -0.1 0.3 0.5 -0.1 0.3 -15.6 Services between related enterprises, nie. - - - - - -
Personal, cultural and recreational services - - - - - - Audiovisual and related services - - - - - - Other personal cultural and recreational services - - - - - -
Education services - - - - - - Health services - - - - - - Other personal, cultural and recreational services - - - - - -
Government Services, nie. (2.2) (1.9) (1.4) (2.5) (2.7) (4.4) Embassies and consulates -1.2 -1.5 -1.2 -1.5 -2.1 0.8 Military units and agencies -1.0 - - - - -3.9 Other - -0.5 -0.3 -1.0 -0.6 -1.3
TABLE 3.13.3: VALUE OF ST. VINCENT AND THE GRENADINES' BALANCE OF SERVICES:
126

(US$Mn)
2000 2001 2002 2003 2004 2005
EXPORTS OF SERVICES (CREDITS) 554.70 603.6 637.0 685.2 850.8 882.6
Transportation 207.5 207.3 202.5 246.5 294.7 215.2
Passenger Fares 158.2 160.2 159.8 187.6 227.4 139.9
Port Disbursements 43.3 40.8 36.6 50.9 58.0 63.6
Port Charges 8.4 5.2 5.0 6.7 4.2 4.4
Airport Charges 1.8 2.3 2.2 1.6 1.9 4.7
Pilotage 1.1 1.1 1.0 1.0 0.7 0.7
Cargo Charges 31.8 28.1 28.3 38.7 50.9 53.4
Other Port Disbursements 0.2 4.1 0.1 2.9 0.3 0.4
Sale of Consignment Notes 4.7 4.7 4.7 6.7 8.4 11.3 Sale of Consignment Notes on behalf of foreign airlines
0.2 0.2 0.2 0.4 0.4 -
Other Miscellaneous Receipts 1.1 1.4 1.2 0.9 0.5 0.4
Mail 0.4 0.4 0.4 0.3 0.3 -
Other 0.7 1.0 0.8 0.6 0.2 0.4
Travel 212.8 200.9 242.0 248.9 341.5 453.0
Hotel visitors 39.4 35.3 37.9 26.4 66.3 41.7
Business visitors 49.8 46.9 46.8 68.1 41.6 88.6
Private home and others 107.1 102.8 142.7 138.6 218.6 308.2
Students 15.3 14.8 13.7 14.7 13.9 13.7
Advances to crew 1.2 1.1 0.9 1.1 1.1 0.8
Communication 36.3 29.8 29.9 39.5 45.3 45.3
Insurance Services 45.8 78.6 99.8 108.2 113.2 113.2
Other Business Services 40.7 46.6 23.9 28.8 42.9 41.9
Advertising 2.9 3.8 3.1 2.2 8.9 9.1
Agent Fees 7.1 6.0 7.7 9.1 11.5 11.8
Oil processing fees 1.0 1.0 1.1 0.7 2.0 2.0
Charter Hire 0.0 - - - - -
Other 29.7 35.8 12.0 16.8 20.5 19.0
Other Government 10.6 40.4 38.9 13.3 13.2 14.0
Receipts from International Institutions 8.8 8.7 12.9 11.5 11.4 12.2
Receipts from Foreign Diplomatic Agencies 1.8 1.9 1.9 1.8 1.8 1.8
Signature Bonuses 0.0 29.8 24.1 - - -
TABLE 3.14.1: VALUE OF TRINIDAD AND TOBAGO'S RECEIPT OF SERVICES: 2000 - 2005
127

(US$Mn)
2000 2001 2002 2003 2004 2005
PAYMENT OF SERVICES (DEBITS) 387.7 370.0 373.0 371.4 371.3 499.8
Transportation 173.2 116.6 117.4 161.3 162.3 191.4
Passenger Fares 42.8 21.0 21.8 35.7 45.0 54.2
Port Disbursements 83.1 60.9 60.6 93.1 86.9 89.8
Other Miscellaneous Payments 47.3 34.7 35.0 32.5 30.4 47.4
Travel 147.1 151.0 186.3 107.2 95.9 180.0
Advances to crew 8.7 8.8 8.6 7.5 2.9 0.1
Business travellers* … - - - - -
Students 38.3 9.0 6.5 6.4 3.6 3.4
Government officials 1.0 0.9 0.3 0.4 0.2 0.3
Tourist and other travellers 99.1 132.3 170.9 92.9 89.2 176.2
Communication 5.5 5.6 5.4 3.5 5.8 5.8
Insurance Services 0.1 8.1 0.2 0.1 0.2 0.2
Other Business Services 37.3 57.8 31.0 62.9 49.9 52.5
Personal Income 1.5 1.5 1.5 1.8 1.9 1.4
Management Fees 0.7 1.0 0.1 1.5 0.1 0.2
Professional and Technical fees … … - - - -
Commissions 1.8 1.8 1.8 1.7 1.7 1.7
Royalties, Patents and similar fees 0.3 0.1 0.1 3.2 1.3 1.5
Advertising 1.1 1.1 1.1 0.8 3.5 5.7
Rentals 0.9 1.0 0.9 1.7 1.6 0.8
Charter Hire 0.3 0.3 0.4 0.1 0.1 0.1
Other Miscellaneous Payments 30.7 51.0 25.1 52.1 39.7 41.1
Other Government 24.5 30.9 32.7 36.4 57.2 69.9
Central Government-Diplomatic and Other Foreign Expenditures 20.4 23.6 26.2 30.9 51.6 64.0
Payments to International Institutions 4.1 7.3 6.5 5.5 5.6 5.9
TABLE 3.14.2: VALUE OF TRINIDAD AND TOBAGO'S PAYMENT OF SERVICES: 2000 - 2005
128
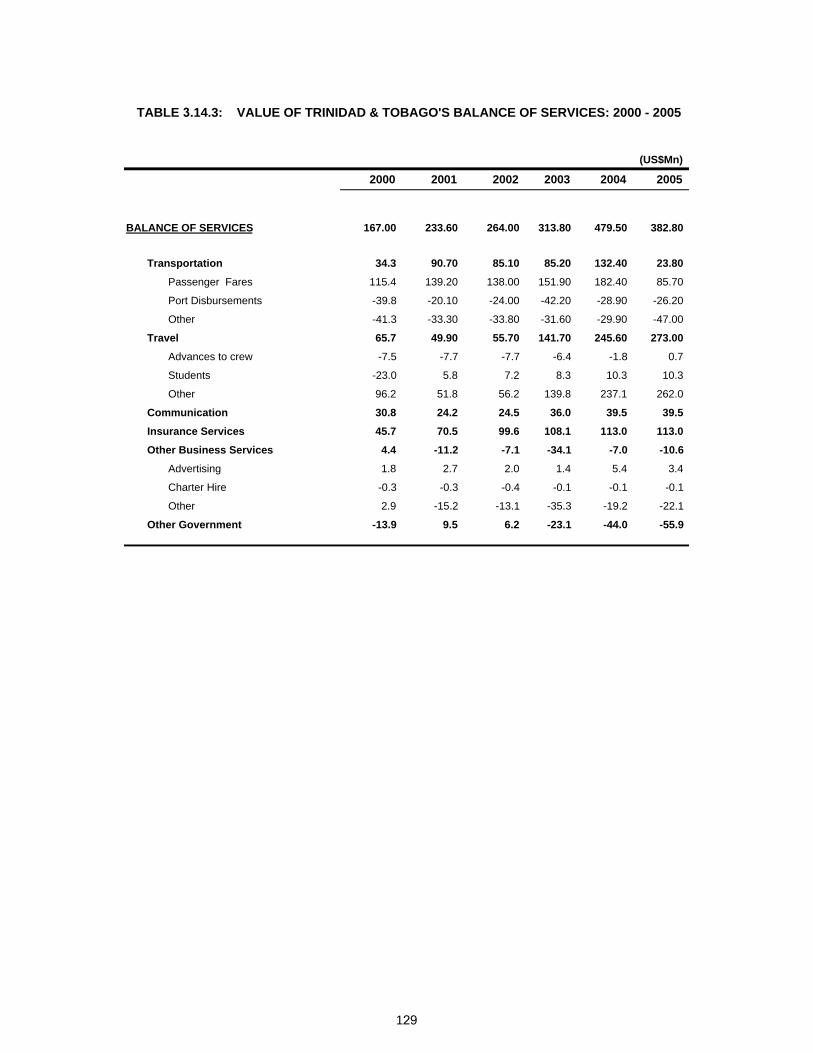
(US$Mn)
2000 2001 2002 2003 2004 2005
BALANCE OF SERVICES 167.00 233.60 264.00 313.80 479.50 382.80
Transportation 34.3 90.70 85.10 85.20 132.40 23.80
Passenger Fares 115.4 139.20 138.00 151.90 182.40 85.70
Port Disbursements -39.8 -20.10 -24.00 -42.20 -28.90 -26.20
Other -41.3 -33.30 -33.80 -31.60 -29.90 -47.00
Travel 65.7 49.90 55.70 141.70 245.60 273.00
Advances to crew -7.5 -7.7 -7.7 -6.4 -1.8 0.7
Students -23.0 5.8 7.2 8.3 10.3 10.3
Other 96.2 51.8 56.2 139.8 237.1 262.0
Communication 30.8 24.2 24.5 36.0 39.5 39.5
Insurance Services 45.7 70.5 99.6 108.1 113.0 113.0
Other Business Services 4.4 -11.2 -7.1 -34.1 -7.0 -10.6
Advertising 1.8 2.7 2.0 1.4 5.4 3.4
Charter Hire -0.3 -0.3 -0.4 -0.1 -0.1 -0.1
Other 2.9 -15.2 -13.1 -35.3 -19.2 -22.1
Other Government -13.9 9.5 6.2 -23.1 -44.0 -55.9
TABLE 3.14.3: VALUE OF TRINIDAD & TOBAGO'S BALANCE OF SERVICES: 2000 - 2005
129

Section 4
CARICOM Member States’ Production of Services

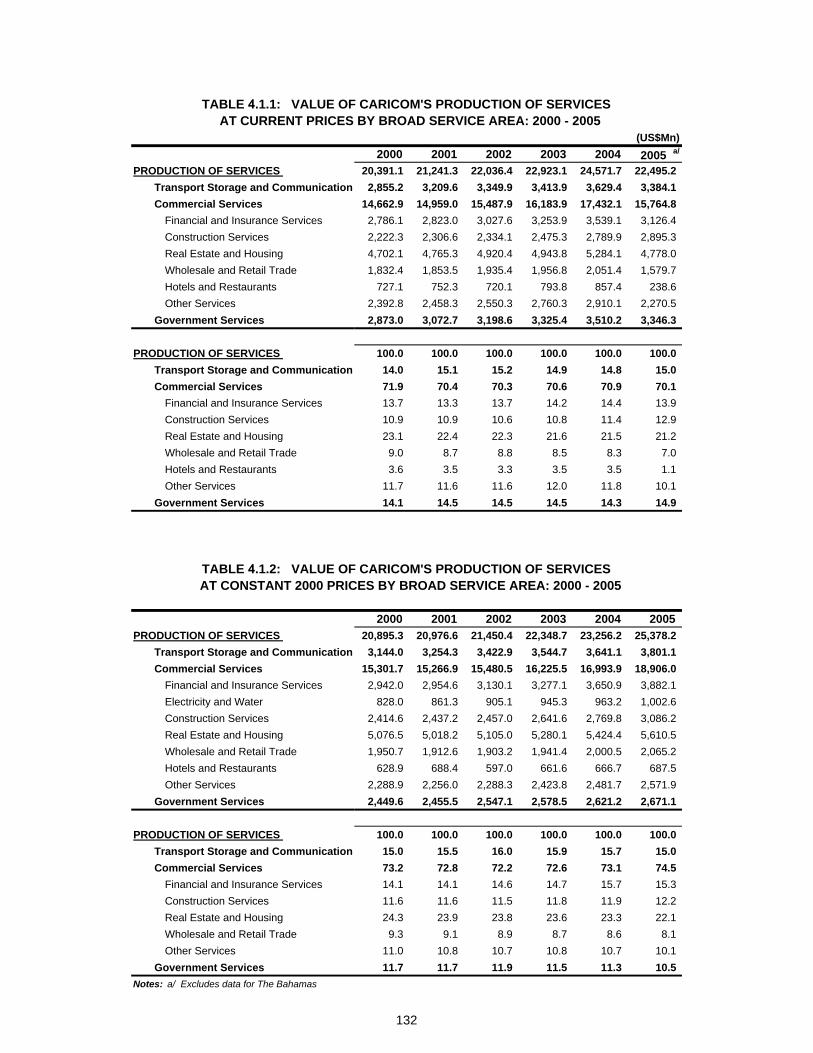
(US$Mn)2000 2001 2002 2003 2004 2005 a/
PRODUCTION OF SERVICES 20,391.1 21,241.3 22,036.4 22,923.1 24,571.7 22,495.2 Transport Storage and Communication 2,855.2 3,209.6 3,349.9 3,413.9 3,629.4 3,384.1 Commercial Services 14,662.9 14,959.0 15,487.9 16,183.9 17,432.1 15,764.8
Financial and Insurance Services 2,786.1 2,823.0 3,027.6 3,253.9 3,539.1 3,126.4 Construction Services 2,222.3 2,306.6 2,334.1 2,475.3 2,789.9 2,895.3 Real Estate and Housing 4,702.1 4,765.3 4,920.4 4,943.8 5,284.1 4,778.0 Wholesale and Retail Trade 1,832.4 1,853.5 1,935.4 1,956.8 2,051.4 1,579.7 Hotels and Restaurants 727.1 752.3 720.1 793.8 857.4 238.6 Other Services 2,392.8 2,458.3 2,550.3 2,760.3 2,910.1 2,270.5
Government Services 2,873.0 3,072.7 3,198.6 3,325.4 3,510.2 3,346.3
PRODUCTION OF SERVICES 100.0 100.0 100.0 100.0 100.0 100.0 Transport Storage and Communication 14.0 15.1 15.2 14.9 14.8 15.0 Commercial Services 71.9 70.4 70.3 70.6 70.9 70.1
Financial and Insurance Services 13.7 13.3 13.7 14.2 14.4 13.9 Construction Services 10.9 10.9 10.6 10.8 11.4 12.9 Real Estate and Housing 23.1 22.4 22.3 21.6 21.5 21.2 Wholesale and Retail Trade 9.0 8.7 8.8 8.5 8.3 7.0 Hotels and Restaurants 3.6 3.5 3.3 3.5 3.5 1.1 Other Services 11.7 11.6 11.6 12.0 11.8 10.1
Government Services 14.1 14.5 14.5 14.5 14.3 14.9
2000 2001 2002 2003 2004 2005PRODUCTION OF SERVICES 20,895.3 20,976.6 21,450.4 22,348.7 23,256.2 25,378.2
Transport Storage and Communication 3,144.0 3,254.3 3,422.9 3,544.7 3,641.1 3,801.1 Commercial Services 15,301.7 15,266.9 15,480.5 16,225.5 16,993.9 18,906.0
Financial and Insurance Services 2,942.0 2,954.6 3,130.1 3,277.1 3,650.9 3,882.1 Electricity and Water 828.0 861.3 905.1 945.3 963.2 1,002.6 Construction Services 2,414.6 2,437.2 2,457.0 2,641.6 2,769.8 3,086.2 Real Estate and Housing 5,076.5 5,018.2 5,105.0 5,280.1 5,424.4 5,610.5 Wholesale and Retail Trade 1,950.7 1,912.6 1,903.2 1,941.4 2,000.5 2,065.2 Hotels and Restaurants 628.9 688.4 597.0 661.6 666.7 687.5 Other Services 2,288.9 2,256.0 2,288.3 2,423.8 2,481.7 2,571.9
Government Services 2,449.6 2,455.5 2,547.1 2,578.5 2,621.2 2,671.1
PRODUCTION OF SERVICES 100.0 100.0 100.0 100.0 100.0 100.0 Transport Storage and Communication 15.0 15.5 16.0 15.9 15.7 15.0 Commercial Services 73.2 72.8 72.2 72.6 73.1 74.5
Financial and Insurance Services 14.1 14.1 14.6 14.7 15.7 15.3 Construction Services 11.6 11.6 11.5 11.8 11.9 12.2 Real Estate and Housing 24.3 23.9 23.8 23.6 23.3 22.1 Wholesale and Retail Trade 9.3 9.1 8.9 8.7 8.6 8.1 Other Services 11.0 10.8 10.7 10.8 10.7 10.1
Government Services 11.7 11.7 11.9 11.5 11.3 10.5 Notes: a/ Excludes data for The Bahamas
AT CURRENT PRICES BY BROAD SERVICE AREA: 2000 - 2005TABLE 4.1.1: VALUE OF CARICOM'S PRODUCTION OF SERVICES
AT CONSTANT 2000 PRICES BY BROAD SERVICE AREA: 2000 - 2005TABLE 4.1.2: VALUE OF CARICOM'S PRODUCTION OF SERVICES
132

(US$Mn)2000 2001 2002 2003 2004 2005
PRODUCTION OF SERVICES 559.4 569.0 588.4 618.0 661.6 711.6 Transport 69.9 70.1 71.5 79.6 93.7 92.5 Communications 48.3 50.9 51.1 51.9 53.9 58.2 Commercial Services 340.7 343.7 355.5 372.9 395.3 438.6
Banks and Insurance 53.8 53.1 59.8 58.8 64.5 70.4 Construction Services 73.8 80.2 84.7 90.3 94.4 118.5 Real Estate and Housing 40.3 42.7 44.7 46.9 49.5 52.3 Wholesale and Retail Trade 62.9 62.6 62.0 65.7 68.8 73.0 Hotels and Restaurants 66.2 61.0 58.3 64.2 68.6 71.9 Other Services 43.7 44.2 46.2 46.9 49.5 52.6
Government Services 100.6 104.4 110.3 113.5 118.7 122.2 (Percent)
PRODUCTION OF SERVICES 100.0 100.0 100.0 100.0 100.0 100.0 Transport 12.5 12.3 12.2 12.9 14.2 13.0 Communications 8.6 8.9 8.7 8.4 8.1 8.2 Commercial Services 60.9 60.4 60.4 60.3 59.7 61.6
Banks and Insurance 9.6 9.3 10.2 9.5 9.7 9.9 Construction Services 13.2 14.1 14.4 14.6 14.3 16.7 Real Estate and Housing 7.2 7.5 7.6 7.6 7.5 7.3 Wholesale and Retail Trade 11.2 11.0 10.5 10.6 10.4 10.3 Hotels and Restaurants 11.8 10.7 9.9 10.4 10.4 10.1 Other Services 7.8 7.8 7.9 7.6 7.5 7.4
Government Services 18.0 18.3 18.7 18.4 17.9 17.2
(US$Mn)2000 2001 2002 2003 2004 2005
PRODUCTION OF SERVICES 567.9 566.5 582.4 610.5 646.3 681.5 Transport 66.1 63.6 61.6 70.6 80.9 79.0 Communications 62.1 65.3 65.6 66.5 68.5 74.0 Commercial Services 347.0 341.4 353.6 368.8 387.4 415.9
Banks and Insurance 61.8 58.2 65.0 63.5 70.4 77.2 Construction Services 77.2 80.3 83.1 88.7 90.9 108.6 Real Estate and Housing 41.6 43.0 44.3 45.7 47.3 48.9 Wholesale and Retail Trade 55.3 54.2 52.7 54.6 56.2 58.4 Hotels and Restaurants 73.4 67.7 69.1 76.2 81.3 80.5 Other Services 37.6 38.0 39.4 40.2 41.4 42.3
Government Services 92.7 96.2 101.7 104.7 109.5 112.7 (Percent)
PRODUCTION OF SERVICES 100.0 100.0 100.0 100.0 100.0 100.0 Transport 11.6 11.2 10.6 11.6 12.5 11.6 Communications 10.9 11.5 11.3 10.9 10.6 10.9 Commercial Services 61.1 60.3 60.7 60.4 59.9 61.0
Banks and Insurance 10.9 10.3 11.2 10.4 10.9 11.3 Construction Services 13.6 14.2 14.3 14.5 14.1 15.9 Real Estate and Housing 7.3 7.6 7.6 7.5 7.3 7.2 Wholesale and Retail Trade 9.7 9.6 9.0 8.9 8.7 8.6 Other Services 6.6 6.7 6.8 6.6 6.4 6.2
Government Services 16.3 17.0 17.5 17.1 16.9 16.5
AT CONSTANT 2000 PRICES BY BROAD SERVICE AREA: 2000 - 2005TABLE 4.2.2: VALUE OF ANTIGUA & BARBUDA'S PRODUCTION OF SERVICES
AT CURRENT PRICES BY BROAD SERVICE AREA: 2000 - 2005TABLE 4.2.1: VALUE OF ANTIGUA & BARBUDA'S PRODUCTION OF SERVICES
133
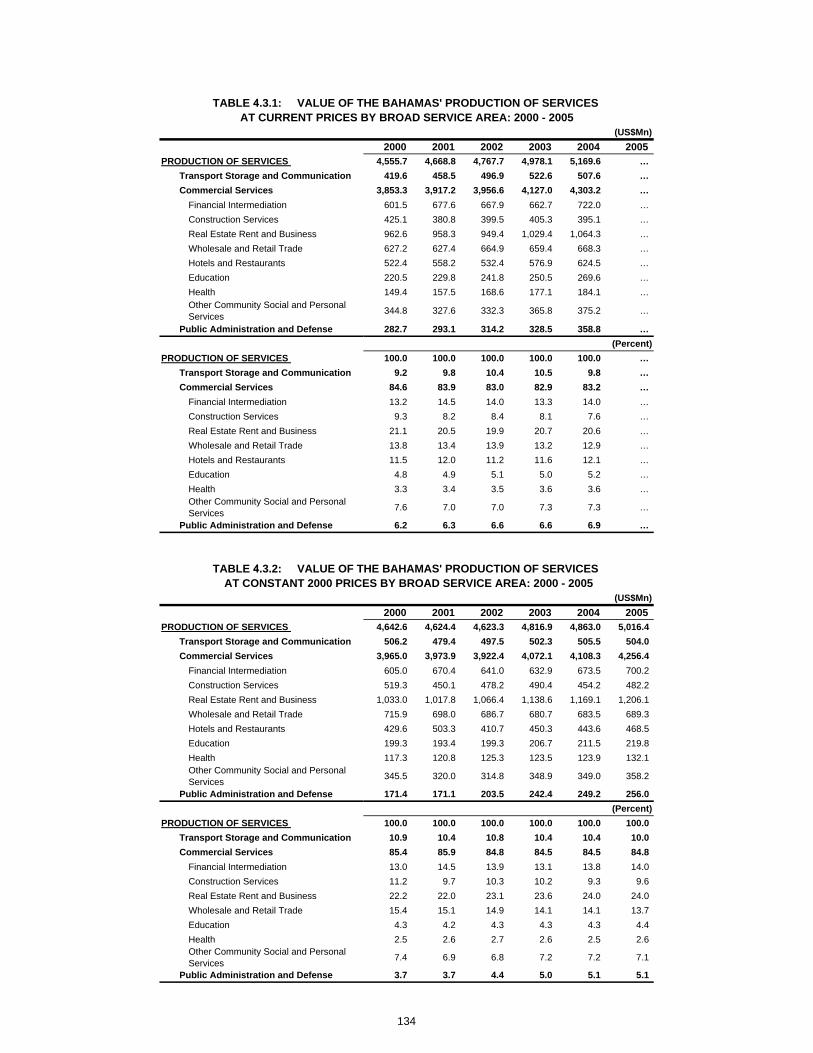
(US$Mn)2000 2001 2002 2003 2004 2005
PRODUCTION OF SERVICES 4,555.7 4,668.8 4,767.7 4,978.1 5,169.6 …Transport Storage and Communication 419.6 458.5 496.9 522.6 507.6 …Commercial Services 3,853.3 3,917.2 3,956.6 4,127.0 4,303.2 …
Financial Intermediation 601.5 677.6 667.9 662.7 722.0 …Construction Services 425.1 380.8 399.5 405.3 395.1 …Real Estate Rent and Business 962.6 958.3 949.4 1,029.4 1,064.3 …Wholesale and Retail Trade 627.2 627.4 664.9 659.4 668.3 …Hotels and Restaurants 522.4 558.2 532.4 576.9 624.5 …Education 220.5 229.8 241.8 250.5 269.6 …Health 149.4 157.5 168.6 177.1 184.1 …Other Community Social and Personal Services 344.8 327.6 332.3 365.8 375.2 …
Public Administration and Defense 282.7 293.1 314.2 328.5 358.8 …(Percent)
PRODUCTION OF SERVICES 100.0 100.0 100.0 100.0 100.0 …Transport Storage and Communication 9.2 9.8 10.4 10.5 9.8 …Commercial Services 84.6 83.9 83.0 82.9 83.2 …
Financial Intermediation 13.2 14.5 14.0 13.3 14.0 …Construction Services 9.3 8.2 8.4 8.1 7.6 …Real Estate Rent and Business 21.1 20.5 19.9 20.7 20.6 …Wholesale and Retail Trade 13.8 13.4 13.9 13.2 12.9 …Hotels and Restaurants 11.5 12.0 11.2 11.6 12.1 …Education 4.8 4.9 5.1 5.0 5.2 …Health 3.3 3.4 3.5 3.6 3.6 …Other Community Social and Personal Services 7.6 7.0 7.0 7.3 7.3 …
Public Administration and Defense 6.2 6.3 6.6 6.6 6.9 …
(US$Mn)2000 2001 2002 2003 2004 2005
PRODUCTION OF SERVICES 4,642.6 4,624.4 4,623.3 4,816.9 4,863.0 5,016.4 Transport Storage and Communication 506.2 479.4 497.5 502.3 505.5 504.0 Commercial Services 3,965.0 3,973.9 3,922.4 4,072.1 4,108.3 4,256.4
Financial Intermediation 605.0 670.4 641.0 632.9 673.5 700.2 Construction Services 519.3 450.1 478.2 490.4 454.2 482.2 Real Estate Rent and Business 1,033.0 1,017.8 1,066.4 1,138.6 1,169.1 1,206.1 Wholesale and Retail Trade 715.9 698.0 686.7 680.7 683.5 689.3 Hotels and Restaurants 429.6 503.3 410.7 450.3 443.6 468.5 Education 199.3 193.4 199.3 206.7 211.5 219.8 Health 117.3 120.8 125.3 123.5 123.9 132.1 Other Community Social and Personal Services 345.5 320.0 314.8 348.9 349.0 358.2
Public Administration and Defense 171.4 171.1 203.5 242.4 249.2 256.0 (Percent)
PRODUCTION OF SERVICES 100.0 100.0 100.0 100.0 100.0 100.0 Transport Storage and Communication 10.9 10.4 10.8 10.4 10.4 10.0 Commercial Services 85.4 85.9 84.8 84.5 84.5 84.8
Financial Intermediation 13.0 14.5 13.9 13.1 13.8 14.0 Construction Services 11.2 9.7 10.3 10.2 9.3 9.6 Real Estate Rent and Business 22.2 22.0 23.1 23.6 24.0 24.0 Wholesale and Retail Trade 15.4 15.1 14.9 14.1 14.1 13.7 Education 4.3 4.2 4.3 4.3 4.3 4.4 Health 2.5 2.6 2.7 2.6 2.5 2.6 Other Community Social and Personal Services 7.4 6.9 6.8 7.2 7.2 7.1
Public Administration and Defense 3.7 3.7 4.4 5.0 5.1 5.1
AT CONSTANT 2000 PRICES BY BROAD SERVICE AREA: 2000 - 2005TABLE 4.3.2: VALUE OF THE BAHAMAS' PRODUCTION OF SERVICES
AT CURRENT PRICES BY BROAD SERVICE AREA: 2000 - 2005TABLE 4.3.1: VALUE OF THE BAHAMAS' PRODUCTION OF SERVICES
134
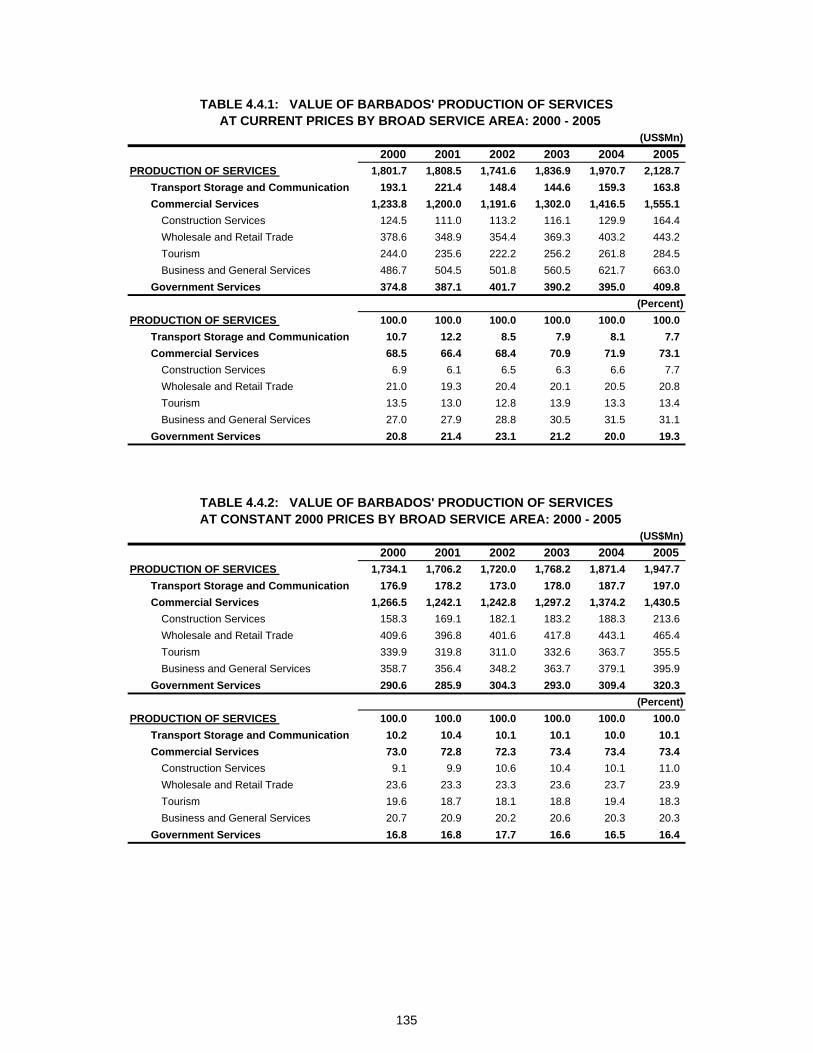
(US$Mn)2000 2001 2002 2003 2004 2005
PRODUCTION OF SERVICES 1,801.7 1,808.5 1,741.6 1,836.9 1,970.7 2,128.7 Transport Storage and Communication 193.1 221.4 148.4 144.6 159.3 163.8 Commercial Services 1,233.8 1,200.0 1,191.6 1,302.0 1,416.5 1,555.1
Construction Services 124.5 111.0 113.2 116.1 129.9 164.4 Wholesale and Retail Trade 378.6 348.9 354.4 369.3 403.2 443.2 Tourism 244.0 235.6 222.2 256.2 261.8 284.5 Business and General Services 486.7 504.5 501.8 560.5 621.7 663.0
Government Services 374.8 387.1 401.7 390.2 395.0 409.8 (Percent)
PRODUCTION OF SERVICES 100.0 100.0 100.0 100.0 100.0 100.0 Transport Storage and Communication 10.7 12.2 8.5 7.9 8.1 7.7 Commercial Services 68.5 66.4 68.4 70.9 71.9 73.1
Construction Services 6.9 6.1 6.5 6.3 6.6 7.7 Wholesale and Retail Trade 21.0 19.3 20.4 20.1 20.5 20.8 Tourism 13.5 13.0 12.8 13.9 13.3 13.4 Business and General Services 27.0 27.9 28.8 30.5 31.5 31.1
Government Services 20.8 21.4 23.1 21.2 20.0 19.3
(US$Mn)2000 2001 2002 2003 2004 2005
PRODUCTION OF SERVICES 1,734.1 1,706.2 1,720.0 1,768.2 1,871.4 1,947.7 Transport Storage and Communication 176.9 178.2 173.0 178.0 187.7 197.0 Commercial Services 1,266.5 1,242.1 1,242.8 1,297.2 1,374.2 1,430.5
Construction Services 158.3 169.1 182.1 183.2 188.3 213.6 Wholesale and Retail Trade 409.6 396.8 401.6 417.8 443.1 465.4 Tourism 339.9 319.8 311.0 332.6 363.7 355.5 Business and General Services 358.7 356.4 348.2 363.7 379.1 395.9
Government Services 290.6 285.9 304.3 293.0 309.4 320.3 (Percent)
PRODUCTION OF SERVICES 100.0 100.0 100.0 100.0 100.0 100.0 Transport Storage and Communication 10.2 10.4 10.1 10.1 10.0 10.1 Commercial Services 73.0 72.8 72.3 73.4 73.4 73.4
Construction Services 9.1 9.9 10.6 10.4 10.1 11.0 Wholesale and Retail Trade 23.6 23.3 23.3 23.6 23.7 23.9 Tourism 19.6 18.7 18.1 18.8 19.4 18.3 Business and General Services 20.7 20.9 20.2 20.6 20.3 20.3
Government Services 16.8 16.8 17.7 16.6 16.5 16.4
AT CONSTANT 2000 PRICES BY BROAD SERVICE AREA: 2000 - 2005
TABLE 4.4.1: VALUE OF BARBADOS' PRODUCTION OF SERVICES AT CURRENT PRICES BY BROAD SERVICE AREA: 2000 - 2005
TABLE 4.4.2: VALUE OF BARBADOS' PRODUCTION OF SERVICES
135

(US$Mn)2000 2001 2002 2003 2004 2005
PRODUCTION OF SERVICES 510.6 553.9 605.6 644.1 688.2 741.8 Transport and Communications 70.9 82.8 99.6 102.3 112.8 123.7 Commercial Services 357.3 384.1 412.2 438.7 468.0 503.0
Finance and Insurance 52.0 55.9 66.7 81.9 86.6 90.7 Construction Services 41.4 41.9 44.3 37.7 41.2 41.2 Trade, Hotels and Restaurants 164.5 177.6 185.1 194.4 201.1 215.6 Real Estate and Business Services 49.1 56.1 62.5 64.7 70.8 80.5 Community and Other Services 50.4 52.7 53.7 60.2 68.4 75.1
Public Administration 82.4 87.1 93.9 103.1 107.5 115.1 (Percent)
PRODUCTION OF SERVICES 100.0 100.0 100.0 100.0 100.0 100.0 Transport Storage and Communication 13.9 14.9 16.4 15.9 16.4 16.7 Commercial Services 70.0 69.3 68.1 68.1 68.0 67.8
Finance and Insurance 10.2 10.1 11.0 12.7 12.6 12.2 Construction Services 8.1 7.6 7.3 5.8 6.0 5.5 Trade, Hotels and Restaurants 32.2 32.1 30.6 30.2 29.2 29.1 Real Estate and Business Services 9.6 10.1 10.3 10.0 10.3 10.9 Community and Other Services 9.9 9.5 8.9 9.3 9.9 10.1
Public Administration 16.1 15.7 15.5 16.0 15.6 15.5
(US$Mn)2000 2001 2002 2003 2004 2005
PRODUCTION OF SERVICES 510.6 545.2 586.7 623.3 644.3 678.0 Transport and Communications 70.9 79.3 88.2 95.8 100.6 109.4 Commercial Services 357.3 378.7 407.9 431.2 446.1 469.6
Finance and Insurance 52.0 51.9 65.6 86.3 90.9 96.0 Electricity and Water 29.2 29.3 30.1 32.7 32.2 32.0 Construction Services 41.4 42.0 43.5 35.8 37.4 36.0 Trade, Hotels and Restaurants 164.5 178.3 184.9 192.0 195.0 205.4 Real Estate and Business Services 49.1 55.5 60.9 61.5 65.0 71.5 Community and Other Services 50.4 51.1 53.1 55.8 57.9 60.8
Public Administration 82.4 87.2 90.6 96.4 97.7 99.0 (Percent)
PRODUCTION OF SERVICES 100.0 100.0 100.0 100.0 100.0 100.0 Transport and Communications 13.9 14.5 15.0 15.4 15.6 16.1 Commercial Services 70.0 69.5 69.5 69.2 69.2 69.3
Finance and Insurance 10.2 9.5 11.2 13.8 14.1 14.2 Construction Services 8.1 7.7 7.4 5.7 5.8 5.3 Trade, Hotels and Restaurants 32.2 32.7 31.5 30.8 30.3 30.3 Real Estate and Business Services 9.6 10.2 10.4 9.9 10.1 10.5 Community and Other Services 9.9 9.4 9.1 8.9 9.0 9.0
Public Administration 16.1 16.0 15.4 15.5 15.2 14.6
AT CONSTANT 2000 PRICES BY BROAD SERVICE AREA: 2000 - 2005TABLE 4.5.2: VALUE OF BELIZE'S PRODUCTION OF SERVICES
TABLE 4.5.1: VALUE OF THE BELIZE'S PRODUCTION OF SERVICES AT CURRENT PRICES BY BROAD SERVICE AREA: 2000 - 2005
136
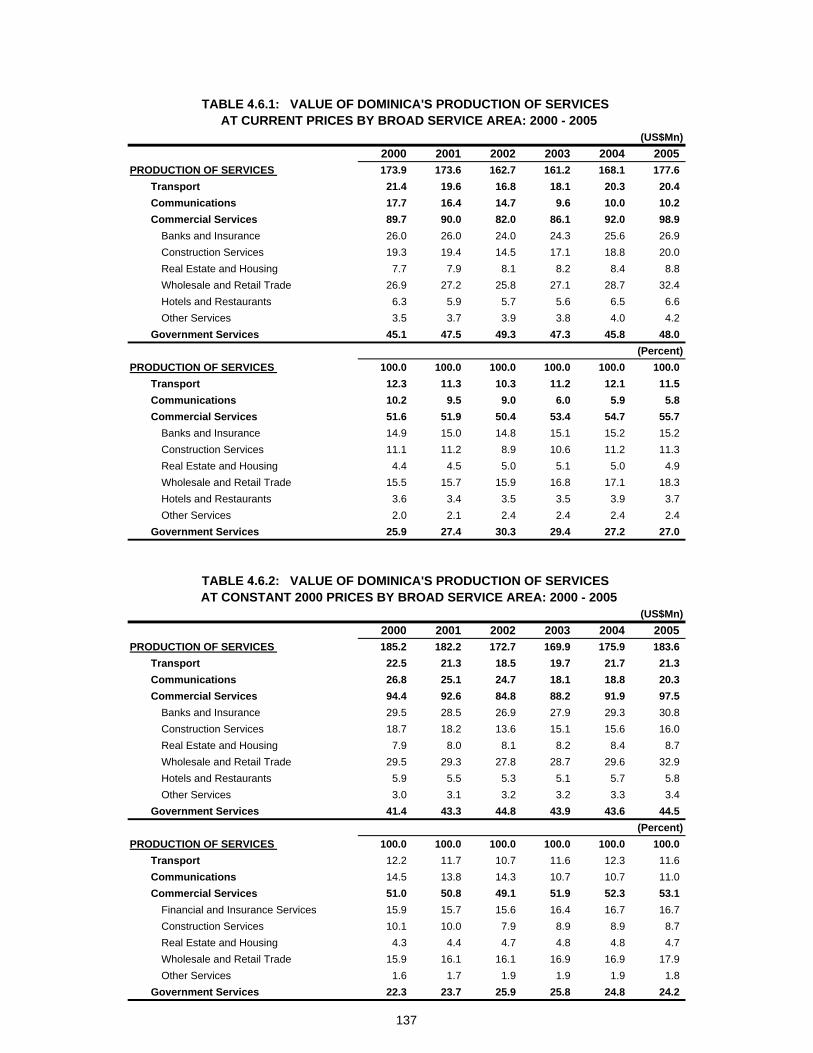
(US$Mn)2000 2001 2002 2003 2004 2005
PRODUCTION OF SERVICES 173.9 173.6 162.7 161.2 168.1 177.6 Transport 21.4 19.6 16.8 18.1 20.3 20.4 Communications 17.7 16.4 14.7 9.6 10.0 10.2 Commercial Services 89.7 90.0 82.0 86.1 92.0 98.9
Banks and Insurance 26.0 26.0 24.0 24.3 25.6 26.9 Construction Services 19.3 19.4 14.5 17.1 18.8 20.0 Real Estate and Housing 7.7 7.9 8.1 8.2 8.4 8.8 Wholesale and Retail Trade 26.9 27.2 25.8 27.1 28.7 32.4 Hotels and Restaurants 6.3 5.9 5.7 5.6 6.5 6.6 Other Services 3.5 3.7 3.9 3.8 4.0 4.2
Government Services 45.1 47.5 49.3 47.3 45.8 48.0 (Percent)
PRODUCTION OF SERVICES 100.0 100.0 100.0 100.0 100.0 100.0 Transport 12.3 11.3 10.3 11.2 12.1 11.5 Communications 10.2 9.5 9.0 6.0 5.9 5.8 Commercial Services 51.6 51.9 50.4 53.4 54.7 55.7
Banks and Insurance 14.9 15.0 14.8 15.1 15.2 15.2 Construction Services 11.1 11.2 8.9 10.6 11.2 11.3 Real Estate and Housing 4.4 4.5 5.0 5.1 5.0 4.9 Wholesale and Retail Trade 15.5 15.7 15.9 16.8 17.1 18.3 Hotels and Restaurants 3.6 3.4 3.5 3.5 3.9 3.7 Other Services 2.0 2.1 2.4 2.4 2.4 2.4
Government Services 25.9 27.4 30.3 29.4 27.2 27.0
(US$Mn)2000 2001 2002 2003 2004 2005
PRODUCTION OF SERVICES 185.2 182.2 172.7 169.9 175.9 183.6 Transport 22.5 21.3 18.5 19.7 21.7 21.3 Communications 26.8 25.1 24.7 18.1 18.8 20.3 Commercial Services 94.4 92.6 84.8 88.2 91.9 97.5
Banks and Insurance 29.5 28.5 26.9 27.9 29.3 30.8 Construction Services 18.7 18.2 13.6 15.1 15.6 16.0 Real Estate and Housing 7.9 8.0 8.1 8.2 8.4 8.7 Wholesale and Retail Trade 29.5 29.3 27.8 28.7 29.6 32.9 Hotels and Restaurants 5.9 5.5 5.3 5.1 5.7 5.8 Other Services 3.0 3.1 3.2 3.2 3.3 3.4
Government Services 41.4 43.3 44.8 43.9 43.6 44.5 (Percent)
PRODUCTION OF SERVICES 100.0 100.0 100.0 100.0 100.0 100.0 Transport 12.2 11.7 10.7 11.6 12.3 11.6 Communications 14.5 13.8 14.3 10.7 10.7 11.0 Commercial Services 51.0 50.8 49.1 51.9 52.3 53.1
Financial and Insurance Services 15.9 15.7 15.6 16.4 16.7 16.7 Construction Services 10.1 10.0 7.9 8.9 8.9 8.7 Real Estate and Housing 4.3 4.4 4.7 4.8 4.8 4.7 Wholesale and Retail Trade 15.9 16.1 16.1 16.9 16.9 17.9 Other Services 1.6 1.7 1.9 1.9 1.9 1.8
Government Services 22.3 23.7 25.9 25.8 24.8 24.2
AT CONSTANT 2000 PRICES BY BROAD SERVICE AREA: 2000 - 2005
TABLE 4.6.1: VALUE OF DOMINICA'S PRODUCTION OF SERVICES AT CURRENT PRICES BY BROAD SERVICE AREA: 2000 - 2005
TABLE 4.6.2: VALUE OF DOMINICA'S PRODUCTION OF SERVICES
137

(US$Mn)2000 2001 2002 2003 2004 2005
PRODUCTION OF SERVICES 289.8 281.7 280.9 307.7 307.4 370.8 Transport 50.5 46.0 45.5 49.1 53.1 64.8 Communications 29.0 28.0 24.1 23.2 21.8 28.5 Commercial Services 157.1 152.6 153.0 175.6 163.8 210.3
Banks and Insurance 33.2 34.7 37.0 42.8 43.2 42.5 Construction Services 35.8 29.5 30.0 37.7 39.0 86.7 Real Estate and Housing 11.2 11.7 12.1 12.5 11.3 11.1 Wholesale and Retail Trade 35.7 35.7 36.4 39.9 32.7 43.2 Hotels and Restaurants 30.3 29.0 27.2 31.6 28.1 16.7 Other Services 10.9 12.0 10.5 10.9 9.4 10.1
Government Services 53.2 55.1 58.3 59.8 68.7 67.2 (Percent)
PRODUCTION OF SERVICES 100.0 100.0 100.0 100.0 100.0 100.0 Transport 17.4 16.3 16.2 16.0 17.3 17.5 Communications 10.0 9.9 8.6 7.5 7.1 7.7 Commercial Services 54.2 54.2 54.5 57.0 53.3 56.7
Banks and Insurance 11.5 12.3 13.2 13.9 14.1 11.5 Construction Services 12.4 10.5 10.7 12.3 12.7 23.4 Real Estate and Housing 3.9 4.2 4.3 4.1 3.7 3.0 Wholesale and Retail Trade 12.3 12.7 12.9 13.0 10.6 11.7 Hotels and Restaurants 10.4 10.3 9.7 10.3 9.2 4.5 Other Services 3.8 4.3 3.7 3.6 3.1 2.7
Government Services 18.4 19.6 20.8 19.4 22.4 18.1
(US$Mn)2000 2001 2002 2003 2004 2005
PRODUCTION OF SERVICES 286.2 275.6 275.8 296.4 282.8 329.4 Transport 45.5 41.4 42.1 45.3 48.1 59.6 Communications 47.0 45.3 40.1 40.9 36.0 47.0 Commercial Services 150.9 146.3 148.8 165.2 152.1 179.2
Banks and Insurance 33.5 35.5 37.7 40.7 41.1 40.5 Construction Services 31.3 25.3 25.6 32.3 33.3 63.6 Real Estate and Housing 13.2 13.4 13.6 13.8 12.4 11.9 Wholesale and Retail Trade 37.3 36.1 36.3 39.0 31.2 39.8 Hotels and Restaurants 24.9 24.5 25.8 29.4 25.6 14.7 Other Services 10.7 11.5 9.8 10.1 8.5 8.8
Government Services 42.8 42.5 44.7 45.0 46.6 43.6 (Percent)
PRODUCTION OF SERVICES 100.0 100.0 100.0 100.0 100.0 100.0 Transport 15.9 15.0 15.3 15.3 17.0 18.1 Communications 16.4 16.4 14.5 13.8 12.7 14.3 Commercial Services 52.7 53.1 54.0 55.7 53.8 54.4
Financial and Insurance Services 11.7 12.9 13.7 13.7 14.5 12.3 Construction Services 10.9 9.2 9.3 10.9 11.8 19.3 Real Estate and Housing 4.6 4.9 4.9 4.7 4.4 3.6 Wholesale and Retail Trade 13.0 13.1 13.2 13.1 11.0 12.1 Other Services 3.7 4.2 3.6 3.4 3.0 2.7
Government Services 15.0 15.4 16.2 15.2 16.5 13.2
AT CONSTANT 2000 PRICES BY BROAD SERVICE AREA: 2000 - 2005
TABLE 4.7.1: VALUE OF GRENADA'S PRODUCTION OF SERVICES AT CURRENT PRICES BY BROAD SERVICE AREA: 2000 - 2005
TABLE 4.7.2: VALUE OF GRENADA'S PRODUCTION OF SERVICES
138

(US$Mn)2000 2001 2002 2003 2004 2005
PRODUCTION OF SERVICES 267.6 274.4 280.0 292.8 306.8 354.8 Transport Storage and Communication 46.4 51.3 54.7 58.9 63.2 76.1 Commercial Services 113.1 112.8 112.8 117.1 124.3 150.9
Financial Services 23.1 21.6 21.8 22.5 23.6 27.4 Construction and Engineering 29.5 29.9 29.3 31.7 34.2 42.0 Distribution 26.3 26.3 26.4 25.6 27.1 35.2 Rental of Dwellings 24.1 24.4 24.7 26.0 27.6 32.0
Other Services 1/ 10.2 10.6 10.7 11.3 11.9 14.5
Government 2/ 108.1 110.3 112.5 116.8 119.3 127.7 (Percent)
PRODUCTION OF SERVICES 100.0 100.0 100.0 100.0 100.0 100.0 Transport Storage and Communication 17.3 18.7 19.5 20.1 20.6 21.5 Commercial Services 42.3 41.1 40.3 40.0 40.5 42.5
Financial Services 8.6 7.9 7.8 7.7 7.7 7.7 Construction and Engineering 11.0 10.9 10.5 10.8 11.2 11.8 Distribution 9.8 9.6 9.4 8.7 8.8 9.9 Rental of Dwellings 9.0 8.9 8.8 8.9 9.0 9.0
Other Services 1/ 3.8 3.9 3.8 3.8 3.9 4.1
Government 2/ 40.4 40.2 40.2 39.9 38.9 36.0
(US$Mn)2000 2001 2002 2003 2004 2005
PRODUCTION OF SERVICES 295.0 298.3 297.3 303.6 310.5 331.9 Transport Storage and Communication 53.5 56.5 59.0 62.0 64.1 70.2 Commercial Services 164.6 165.0 162.2 165.1 169.0 182.7
Financial Services 34.4 32.7 32.4 32.7 33.0 35.2 Construction and Engineering 50.4 51.4 49.4 52.3 54.3 59.5 Distribution 47.4 47.6 47.1 46.0 46.9 50.9 Rental of Dwellings 10.2 10.5 10.5 10.8 11.0 11.5
Other Services 1/ 22.1 22.8 22.8 23.4 23.8 25.7
Government 2/ 76.9 76.9 76.1 76.6 77.4 79.0 (Percent)
PRODUCTION OF SERVICES 100.0 100.0 100.0 100.0 100.0 100.0 Transport Storage and Communication 18.1 18.9 19.8 20.4 20.6 21.2 Commercial Services 55.8 55.3 54.6 54.4 54.4 55.1
Financial Services 11.7 11.0 10.9 10.8 10.6 10.6 Construction and Engineering 17.1 17.2 16.6 17.2 17.5 17.9 Distribution 16.1 16.0 15.9 15.1 15.1 15.3 Rental of Dwellings 3.5 3.5 3.5 3.5 3.5 3.5
Other Services 1/ 7.5 7.6 7.7 7.7 7.7 7.7
Government 2/ 26.1 25.8 25.6 25.2 24.9 23.8 Notes :
1/ Includes electricity, gas, water, business activities, real estate amd any other service not mentioned elsewhere.2/ This is not the same as Social Security but is more a subset of this group.
AT CONSTANT 2000 PRICES BY BROAD SERVICE AREA: 2000 - 2005
TABLE 4.8.1: VALUE OF GUYANA'S PRODUCTION OF SERVICES AT CURRENT PRICES BY BROAD SERVICE AREA: 2000 - 2005
TABLE 4.8.2: VALUE OF GUYANA'S PRODUCTION OF SERVICES
139

(US$Mn)2000 2001 2002 2003 2004 2005
PRODUCTION OF SERVICES 5,703.1 5,791.5 6,113.7 5,903.1 6,334.6 6,944.4 Transport, Storage and Communication 856.0 941.6 1,062.8 970.8 1,017.5 1,095.6 Commercial Services 3,917.6 3,893.5 4,005.7 3,968.5 4,306.9 4,800.8
Finance and Insurance Services 604.3 504.8 462.1 615.3 568.5 616.5 Construction and Installation 717.9 764.1 804.6 755.2 873.7 985.3 Distributive Trade 1,546.1 1,571.1 1,635.1 1,553.9 1,723.9 1,940.3 Real Estate and Business Services 447.9 467.0 505.3 467.0 513.1 578.5 Miscellaneous Services 558.0 544.2 554.9 540.5 589.5 635.4 Household and Private Non-Profit Institutions 43.3 42.3 43.6 36.7 38.3 44.7
Producers of Government Services 929.5 956.4 1,045.1 963.8 1,010.2 1,048.0 (Percent)
PRODUCTION OF SERVICES 100.0 100.0 100.0 100.0 100.0 100.0 Transport Storage and Communication 15.0 16.3 17.4 16.4 16.1 15.8 Commercial Services 68.7 67.2 65.5 67.2 68.0 69.1
Finance and Insurance Services 10.6 8.7 7.6 10.4 9.0 8.9 Construction and Installation 12.6 13.2 13.2 12.8 13.8 14.2 Distributive Trade 27.1 27.1 26.7 26.3 27.2 27.9 Real Estate and Business Services 7.9 8.1 8.3 7.9 8.1 8.3 Miscellaneous Services 9.8 9.4 9.1 9.2 9.3 9.1 Household and Private Non-Profit Institutions 0.8 0.7 0.7 0.6 0.6 0.6
Producers of Government Services 16.3 16.5 17.1 16.3 15.9 15.1
(US$Mn)2000 2001 2002 2003 2004 2005
PRODUCTION OF SERVICES 6,086.3 6,099.7 6,234.9 6,375.3 6,486.8 6,617.7 Transport, Storage and Communication 991.7 1,042.1 1,106.8 1,147.2 1,157.1 1,171.1 Commercial Services 4,283.4 4,241.7 4,308.4 4,406.6 4,506.1 4,620.6
Finance and Insurance Services 679.7 623.5 662.1 690.3 685.3 688.2 Construction and Installation 744.9 762.3 781.7 793.3 836.3 897.1 Distributive Trade 1,774.5 1,774.1 1,776.4 1,794.9 1,818.8 1,839.5 Real Estate and Business Services 404.7 409.3 412.2 419.6 428.4 436.8 Miscellaneous Services 644.1 636.9 640.2 672.7 701.4 723.2 Household and Private Non-Profit Institutions 35.5 35.6 35.7 35.8 35.8 35.9
Producers of Government Services 811.2 815.9 819.8 821.6 823.6 826.0 (Percent)
PRODUCTION OF SERVICES 100.0 100.0 100.0 100.0 100.0 100.0 Transport Storage and Communication 16.3 17.1 17.8 18.0 17.8 17.7 Commercial Services 70.4 69.5 69.1 69.1 69.5 69.8
Finance and Insurance Services 11.2 10.2 10.6 10.8 10.6 10.4 Construction and Installation 12.2 12.5 12.5 12.4 12.9 13.6 Distributive Trade 29.2 29.1 28.5 28.2 28.0 27.8 Real Estate and Business Services 6.6 6.7 6.6 6.6 6.6 6.6 Miscellaneous Services 10.6 10.4 10.3 10.6 10.8 10.9 Household and Private Non-Profit Institutions 0.6 0.6 0.6 0.6 0.6 0.5
Producers of Government Services 13.3 13.4 13.1 12.9 12.7 12.5
AT CONSTANT 2000 PRICES BY BROAD SERVICE AREA: 2000 - 2005TABLE 4.9.2: VALUE OF JAMAICA'S PRODUCTION OF SERVICES
AT CURRENT PRICES BY BROAD SERVICE AREA: 2000 - 2005TABLE 4.9.1: VALUE OF JAMAICA'S PRODUCTION OF SERVICES
140

(US$Mn)2000 2001 2002 2003 2004 2005
PRODUCTION OF SERVICES 28.7 28.6 32.2 32.6 34.6 36.8 Transport 2.2 2.3 2.4 2.7 2.9 3.0 Communications 1.9 1.3 1.4 1.4 1.4 1.3 Commercial Services 15.2 14.8 17.3 17.1 18.2 18.8
Banks and Insurance 3.2 2.5 3.0 3.4 3.7 3.9 Construction Services 4.3 4.1 5.4 4.7 4.9 4.7 Real Estate and Housing 3.7 4.0 4.3 4.5 4.8 5.0 Wholesale and Retail Trade 1.5 1.4 1.6 1.6 1.6 1.7 Hotels and Restaurants 0.3 0.4 0.4 0.3 0.3 0.5 Other Services 2.3 2.5 2.7 2.6 2.9 3.0
Government Services 9.3 10.2 11.1 11.5 12.1 13.7 (Percent)
PRODUCTION OF SERVICES 100.0 100.0 100.0 100.0 100.0 100.0 Transport 7.8 7.9 7.6 8.2 8.3 8.0 Communications 6.7 4.7 4.3 4.2 4.0 3.7 Commercial Services 53.1 51.8 53.8 52.3 52.7 51.0
Banks and Insurance 11.0 8.7 9.3 10.4 10.8 10.7 Construction Services 15.2 14.2 16.9 14.4 14.1 12.7 Real Estate and Housing 12.7 13.8 13.2 13.8 13.8 13.5 Wholesale and Retail Trade 5.1 5.0 5.0 4.8 4.7 4.7 Hotels and Restaurants 1.0 1.3 1.2 0.8 1.0 1.2 Other Services 8.1 8.9 8.3 8.1 8.3 8.2
Government Services 32.4 35.6 34.4 35.3 35.0 37.3
(US$Mn)2000 2001 2002 2003 2004 2005
PRODUCTION OF SERVICES 29.7 27.9 30.6 30.2 31.6 32.1 Transport 2.0 2.0 2.1 2.2 2.3 2.2 Communications 3.5 2.4 2.5 2.5 2.5 2.4 Commercial Services 15.0 14.1 16.5 15.6 16.4 16.7
Banks and Insurance 3.3 2.5 3.0 3.3 3.6 3.8 Construction Services 5.4 5.0 6.6 5.5 5.7 5.4 Real Estate and Housing 2.4 2.5 2.6 2.7 2.7 2.8 Wholesale and Retail Trade 1.5 1.3 1.5 1.4 1.4 1.5 Hotels and Restaurants 0.4 0.5 0.5 0.3 0.4 0.6 Other Services 2.1 2.2 2.4 2.3 2.5 2.7
Government Services 9.2 9.4 9.5 9.9 10.4 10.7 (Percent)
PRODUCTION OF SERVICES 100.0 100.0 100.0 100.0 100.0 100.0 Transport 6.7 7.3 6.8 7.3 7.2 7.0 Communications 11.7 8.7 8.1 8.1 7.9 7.6 Commercial Services 50.5 50.4 53.9 51.8 52.0 52.0
Financial and Insurance Services 10.9 9.1 9.9 11.0 11.5 11.9 Construction Services 18.2 17.9 21.5 18.3 17.9 16.8 Real Estate and Housing 8.1 8.9 8.4 8.9 8.7 8.7 Wholesale and Retail Trade 4.9 4.8 4.8 4.7 4.5 4.5 Other Services 7.2 8.0 7.7 7.7 8.0 8.3
Government Services 31.1 33.6 31.1 32.8 32.9 33.4
AT CONSTANT 2000 PRICES BY BROAD SERVICE AREA: 2000 - 2005
TABLE 4.10.1: VALUE OF MONTSERRAT'S PRODUCTION OF SERVICES AT CURRENT PRICES BY BROAD SERVICE AREA: 2000 - 2005
TABLE 4.10.2: VALUE OF MONTSERRAT'S PRODUCTION OF SERVICES
141
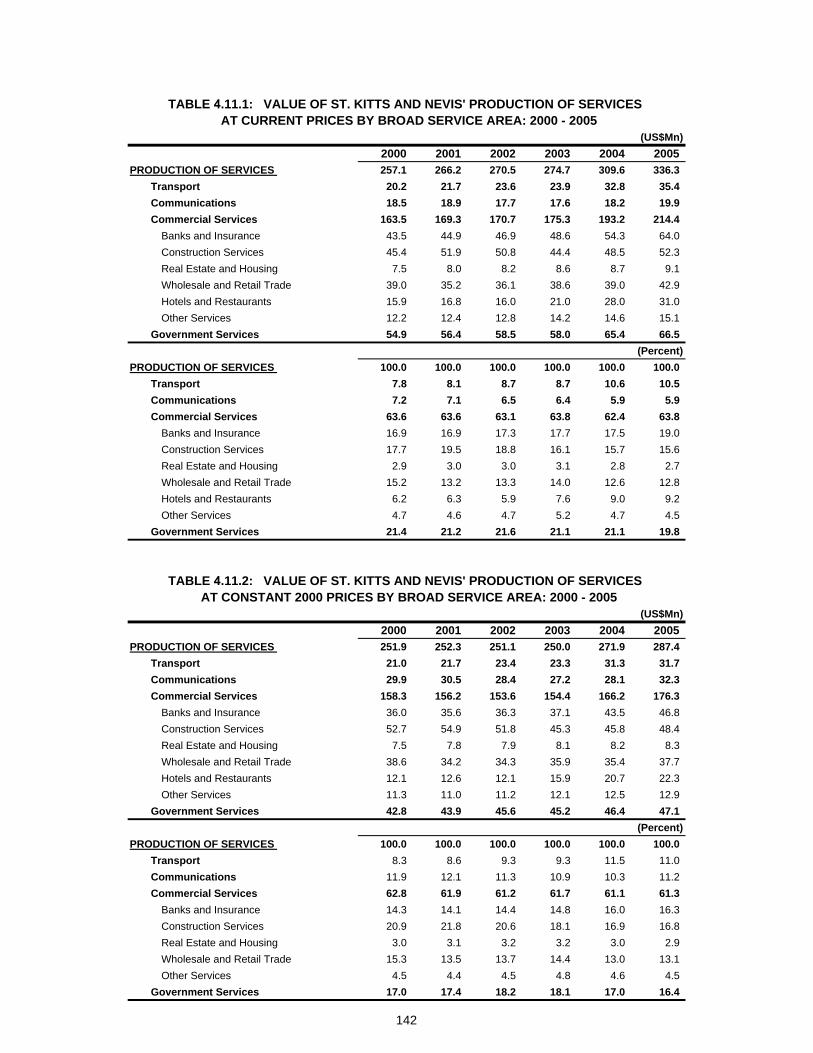
(US$Mn)2000 2001 2002 2003 2004 2005
PRODUCTION OF SERVICES 257.1 266.2 270.5 274.7 309.6 336.3 Transport 20.2 21.7 23.6 23.9 32.8 35.4 Communications 18.5 18.9 17.7 17.6 18.2 19.9 Commercial Services 163.5 169.3 170.7 175.3 193.2 214.4
Banks and Insurance 43.5 44.9 46.9 48.6 54.3 64.0 Construction Services 45.4 51.9 50.8 44.4 48.5 52.3 Real Estate and Housing 7.5 8.0 8.2 8.6 8.7 9.1 Wholesale and Retail Trade 39.0 35.2 36.1 38.6 39.0 42.9 Hotels and Restaurants 15.9 16.8 16.0 21.0 28.0 31.0 Other Services 12.2 12.4 12.8 14.2 14.6 15.1
Government Services 54.9 56.4 58.5 58.0 65.4 66.5 (Percent)
PRODUCTION OF SERVICES 100.0 100.0 100.0 100.0 100.0 100.0 Transport 7.8 8.1 8.7 8.7 10.6 10.5 Communications 7.2 7.1 6.5 6.4 5.9 5.9 Commercial Services 63.6 63.6 63.1 63.8 62.4 63.8
Banks and Insurance 16.9 16.9 17.3 17.7 17.5 19.0 Construction Services 17.7 19.5 18.8 16.1 15.7 15.6 Real Estate and Housing 2.9 3.0 3.0 3.1 2.8 2.7 Wholesale and Retail Trade 15.2 13.2 13.3 14.0 12.6 12.8 Hotels and Restaurants 6.2 6.3 5.9 7.6 9.0 9.2 Other Services 4.7 4.6 4.7 5.2 4.7 4.5
Government Services 21.4 21.2 21.6 21.1 21.1 19.8
(US$Mn)2000 2001 2002 2003 2004 2005
PRODUCTION OF SERVICES 251.9 252.3 251.1 250.0 271.9 287.4 Transport 21.0 21.7 23.4 23.3 31.3 31.7 Communications 29.9 30.5 28.4 27.2 28.1 32.3 Commercial Services 158.3 156.2 153.6 154.4 166.2 176.3
Banks and Insurance 36.0 35.6 36.3 37.1 43.5 46.8 Construction Services 52.7 54.9 51.8 45.3 45.8 48.4 Real Estate and Housing 7.5 7.8 7.9 8.1 8.2 8.3 Wholesale and Retail Trade 38.6 34.2 34.3 35.9 35.4 37.7 Hotels and Restaurants 12.1 12.6 12.1 15.9 20.7 22.3 Other Services 11.3 11.0 11.2 12.1 12.5 12.9
Government Services 42.8 43.9 45.6 45.2 46.4 47.1 (Percent)
PRODUCTION OF SERVICES 100.0 100.0 100.0 100.0 100.0 100.0 Transport 8.3 8.6 9.3 9.3 11.5 11.0 Communications 11.9 12.1 11.3 10.9 10.3 11.2 Commercial Services 62.8 61.9 61.2 61.7 61.1 61.3
Banks and Insurance 14.3 14.1 14.4 14.8 16.0 16.3 Construction Services 20.9 21.8 20.6 18.1 16.9 16.8 Real Estate and Housing 3.0 3.1 3.2 3.2 3.0 2.9 Wholesale and Retail Trade 15.3 13.5 13.7 14.4 13.0 13.1 Other Services 4.5 4.4 4.5 4.8 4.6 4.5
Government Services 17.0 17.4 18.2 18.1 17.0 16.4
AT CONSTANT 2000 PRICES BY BROAD SERVICE AREA: 2000 - 2005
TABLE 4.11.1: VALUE OF ST. KITTS AND NEVIS' PRODUCTION OF SERVICES AT CURRENT PRICES BY BROAD SERVICE AREA: 2000 - 2005
TABLE 4.11.2: VALUE OF ST. KITTS AND NEVIS' PRODUCTION OF SERVICES
142
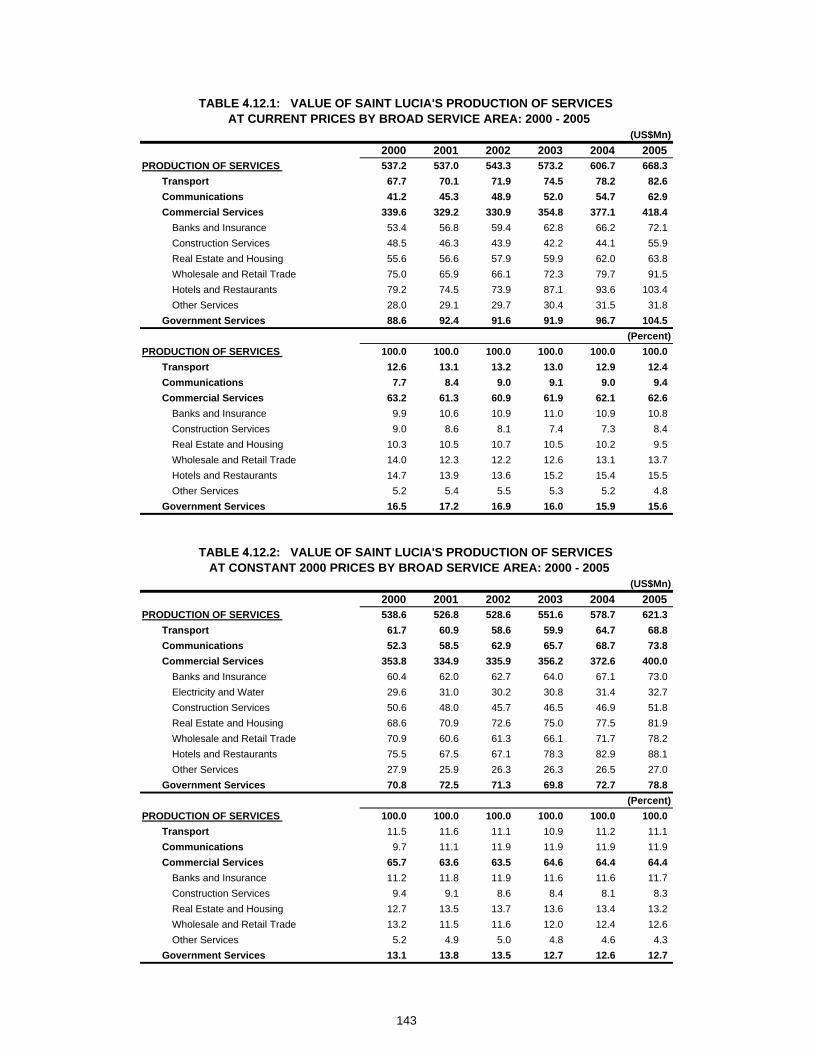
(US$Mn)2000 2001 2002 2003 2004 2005
PRODUCTION OF SERVICES 537.2 537.0 543.3 573.2 606.7 668.3 Transport 67.7 70.1 71.9 74.5 78.2 82.6 Communications 41.2 45.3 48.9 52.0 54.7 62.9 Commercial Services 339.6 329.2 330.9 354.8 377.1 418.4
Banks and Insurance 53.4 56.8 59.4 62.8 66.2 72.1 Construction Services 48.5 46.3 43.9 42.2 44.1 55.9 Real Estate and Housing 55.6 56.6 57.9 59.9 62.0 63.8 Wholesale and Retail Trade 75.0 65.9 66.1 72.3 79.7 91.5 Hotels and Restaurants 79.2 74.5 73.9 87.1 93.6 103.4 Other Services 28.0 29.1 29.7 30.4 31.5 31.8
Government Services 88.6 92.4 91.6 91.9 96.7 104.5 (Percent)
PRODUCTION OF SERVICES 100.0 100.0 100.0 100.0 100.0 100.0 Transport 12.6 13.1 13.2 13.0 12.9 12.4 Communications 7.7 8.4 9.0 9.1 9.0 9.4 Commercial Services 63.2 61.3 60.9 61.9 62.1 62.6
Banks and Insurance 9.9 10.6 10.9 11.0 10.9 10.8 Construction Services 9.0 8.6 8.1 7.4 7.3 8.4 Real Estate and Housing 10.3 10.5 10.7 10.5 10.2 9.5 Wholesale and Retail Trade 14.0 12.3 12.2 12.6 13.1 13.7 Hotels and Restaurants 14.7 13.9 13.6 15.2 15.4 15.5 Other Services 5.2 5.4 5.5 5.3 5.2 4.8
Government Services 16.5 17.2 16.9 16.0 15.9 15.6
(US$Mn)2000 2001 2002 2003 2004 2005
PRODUCTION OF SERVICES 538.6 526.8 528.6 551.6 578.7 621.3 Transport 61.7 60.9 58.6 59.9 64.7 68.8 Communications 52.3 58.5 62.9 65.7 68.7 73.8 Commercial Services 353.8 334.9 335.9 356.2 372.6 400.0
Banks and Insurance 60.4 62.0 62.7 64.0 67.1 73.0 Electricity and Water 29.6 31.0 30.2 30.8 31.4 32.7 Construction Services 50.6 48.0 45.7 46.5 46.9 51.8 Real Estate and Housing 68.6 70.9 72.6 75.0 77.5 81.9 Wholesale and Retail Trade 70.9 60.6 61.3 66.1 71.7 78.2 Hotels and Restaurants 75.5 67.5 67.1 78.3 82.9 88.1 Other Services 27.9 25.9 26.3 26.3 26.5 27.0
Government Services 70.8 72.5 71.3 69.8 72.7 78.8 (Percent)
PRODUCTION OF SERVICES 100.0 100.0 100.0 100.0 100.0 100.0 Transport 11.5 11.6 11.1 10.9 11.2 11.1 Communications 9.7 11.1 11.9 11.9 11.9 11.9 Commercial Services 65.7 63.6 63.5 64.6 64.4 64.4
Banks and Insurance 11.2 11.8 11.9 11.6 11.6 11.7 Construction Services 9.4 9.1 8.6 8.4 8.1 8.3 Real Estate and Housing 12.7 13.5 13.7 13.6 13.4 13.2 Wholesale and Retail Trade 13.2 11.5 11.6 12.0 12.4 12.6 Other Services 5.2 4.9 5.0 4.8 4.6 4.3
Government Services 13.1 13.8 13.5 12.7 12.6 12.7
AT CONSTANT 2000 PRICES BY BROAD SERVICE AREA: 2000 - 2005
TABLE 4.12.1: VALUE OF SAINT LUCIA'S PRODUCTION OF SERVICES AT CURRENT PRICES BY BROAD SERVICE AREA: 2000 - 2005
TABLE 4.12.2: VALUE OF SAINT LUCIA'S PRODUCTION OF SERVICES
143
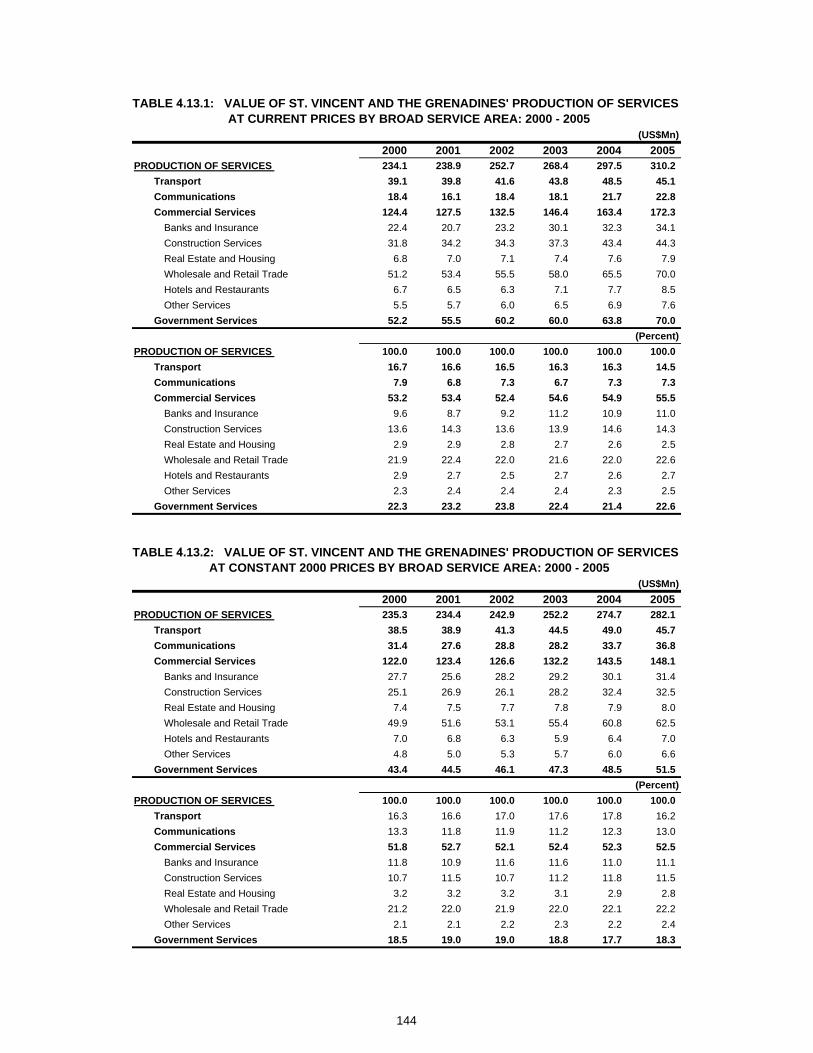
(US$Mn)2000 2001 2002 2003 2004 2005
PRODUCTION OF SERVICES 234.1 238.9 252.7 268.4 297.5 310.2 Transport 39.1 39.8 41.6 43.8 48.5 45.1 Communications 18.4 16.1 18.4 18.1 21.7 22.8 Commercial Services 124.4 127.5 132.5 146.4 163.4 172.3
Banks and Insurance 22.4 20.7 23.2 30.1 32.3 34.1 Construction Services 31.8 34.2 34.3 37.3 43.4 44.3 Real Estate and Housing 6.8 7.0 7.1 7.4 7.6 7.9 Wholesale and Retail Trade 51.2 53.4 55.5 58.0 65.5 70.0 Hotels and Restaurants 6.7 6.5 6.3 7.1 7.7 8.5 Other Services 5.5 5.7 6.0 6.5 6.9 7.6
Government Services 52.2 55.5 60.2 60.0 63.8 70.0 (Percent)
PRODUCTION OF SERVICES 100.0 100.0 100.0 100.0 100.0 100.0 Transport 16.7 16.6 16.5 16.3 16.3 14.5 Communications 7.9 6.8 7.3 6.7 7.3 7.3 Commercial Services 53.2 53.4 52.4 54.6 54.9 55.5
Banks and Insurance 9.6 8.7 9.2 11.2 10.9 11.0 Construction Services 13.6 14.3 13.6 13.9 14.6 14.3 Real Estate and Housing 2.9 2.9 2.8 2.7 2.6 2.5 Wholesale and Retail Trade 21.9 22.4 22.0 21.6 22.0 22.6 Hotels and Restaurants 2.9 2.7 2.5 2.7 2.6 2.7 Other Services 2.3 2.4 2.4 2.4 2.3 2.5
Government Services 22.3 23.2 23.8 22.4 21.4 22.6
(US$Mn)2000 2001 2002 2003 2004 2005
PRODUCTION OF SERVICES 235.3 234.4 242.9 252.2 274.7 282.1 Transport 38.5 38.9 41.3 44.5 49.0 45.7 Communications 31.4 27.6 28.8 28.2 33.7 36.8 Commercial Services 122.0 123.4 126.6 132.2 143.5 148.1
Banks and Insurance 27.7 25.6 28.2 29.2 30.1 31.4 Construction Services 25.1 26.9 26.1 28.2 32.4 32.5 Real Estate and Housing 7.4 7.5 7.7 7.8 7.9 8.0 Wholesale and Retail Trade 49.9 51.6 53.1 55.4 60.8 62.5 Hotels and Restaurants 7.0 6.8 6.3 5.9 6.4 7.0 Other Services 4.8 5.0 5.3 5.7 6.0 6.6
Government Services 43.4 44.5 46.1 47.3 48.5 51.5 (Percent)
PRODUCTION OF SERVICES 100.0 100.0 100.0 100.0 100.0 100.0 Transport 16.3 16.6 17.0 17.6 17.8 16.2 Communications 13.3 11.8 11.9 11.2 12.3 13.0 Commercial Services 51.8 52.7 52.1 52.4 52.3 52.5
Banks and Insurance 11.8 10.9 11.6 11.6 11.0 11.1 Construction Services 10.7 11.5 10.7 11.2 11.8 11.5 Real Estate and Housing 3.2 3.2 3.2 3.1 2.9 2.8 Wholesale and Retail Trade 21.2 22.0 21.9 22.0 22.1 22.2 Other Services 2.1 2.1 2.2 2.3 2.2 2.4
Government Services 18.5 19.0 19.0 18.8 17.7 18.3
AT CONSTANT 2000 PRICES BY BROAD SERVICE AREA: 2000 - 2005
TABLE 4.13.1: VALUE OF ST. VINCENT AND THE GRENADINES' PRODUCTION OF SERVICES AT CURRENT PRICES BY BROAD SERVICE AREA: 2000 - 2005
TABLE 4.13.2: VALUE OF ST. VINCENT AND THE GRENADINES' PRODUCTION OF SERVICES
144

(US$Mn)2000 2001 2002 2003 2004 2005
PRODUCTION OF SERVICES 444.8 376.0 505.2 570.7 650.0 790.7 Transport Storage and Communication 65.6 52.2 85.2 94.0 108.0 123.1 Commercial Services 306.9 266.7 325.6 383.6 444.7 554.2
Financial and Business Services 105.9 113.8 124.6 134.7 168.3 211.0 Construction 25.7 23.5 26.4 32.8 43.4 56.1 Trade, Restaurants and Hotels 105.2 75.9 88.9 131.0 145.3 191.5 Personal, Social and Other Community Services 70.0 53.5 85.7 85.1 87.8 95.6
Public Administration 72.2 57.0 94.4 93.2 97.3 113.4 (Percent)
PRODUCTION OF SERVICES 100.0 100.0 100.0 100.0 100.0 100.0 Transport Storage and Communication 14.8 13.9 16.9 16.5 16.6 15.6 Commercial Services 69.0 70.9 64.5 67.2 68.4 70.1
Financial and Business Services 23.8 30.3 24.7 23.6 25.9 26.7 Construction 5.8 6.2 5.2 5.7 6.7 7.1 Trade, Restaurants and Hotels 23.7 20.2 17.6 23.0 22.3 24.2 Personal, Social and Other Community Services 15.7 14.2 17.0 14.9 13.5 12.1
Public Administration 16.2 15.2 18.7 16.3 15.0 14.3
(US$Mn)2000 2001 2002 2003 2004 2005
PRODUCTION OF SERVICES 498.6 508.6 536.6 583.6 614.2 653.7 Transport Storage and Communication 77.3 99.4 112.0 115.0 123.5 133.8 Commercial Services 366.9 353.3 368.1 412.2 434.6 460.5
Financial and Business Services 154.6 154.8 160.7 164.7 173.4 181.0 Construction 34.5 36.1 36.3 42.4 46.7 50.7 Trade, Restaurants and Hotels 112.9 96.5 104.6 138.2 146.4 158.3 Personal, Social and Other Community Services 64.9 65.9 66.6 66.9 68.1 70.6
Public Administration 54.5 55.8 56.5 56.3 56.1 59.4 (Percent)
PRODUCTION OF SERVICES 100.0 100.0 100.0 100.0 100.0 100.0 Transport Storage and Communication 15.5 19.6 20.9 19.7 20.1 20.5 Commercial Services 73.6 69.5 68.6 70.6 70.8 70.4
Financial and Business Services 31.0 30.4 29.9 28.2 28.2 27.7 Construction 6.9 7.1 6.8 7.3 7.6 7.8 Trade, Restaurants and Hotels 22.6 19.0 19.5 23.7 23.8 24.2 Personal, Social and Other Community Services 13.0 13.0 12.4 11.5 11.1 10.8
Public Administration 10.9 11.0 10.5 9.7 9.1 9.1
AT CURRENT PRICES BY BROAD SERVICE AREA: 2000 - 2005TABLE 4.14.1: VALUE OF SURINAME'S PRODUCTION OF SERVICES
TABLE 4.14.2: VALUE OF SURINAME'S PRODUCTION OF SERVICES AT CONSTANT 2000 PRICES BY BROAD SERVICE AREA: 2000 - 2005
145

(US$Mn)2000 2001 2002 2003 2004 2005
PRODUCTION OF SERVICES 5,027.5 5,673.2 5,891.8 6,461.6 7,066.3 8,047.1 Transport, Storage and Communication 757.4 955.4 952.8 1,055.2 1,149.9 1,254.2 Commercial Services 3,650.6 3,957.5 4,241.4 4,518.7 4,965.5 5,752.8
Finance, Insurance, Real Estate and Business Services 1,164.2 1,210.7 1,431.4 1,466.0 1,680.4 1,866.9
Construction 599.1 689.8 653.3 822.9 979.2 1,224.1 Distribution Services 1,386.0 1,469.2 1,538.8 1,492.3 1,567.0 1,794.4 Hotels, Guest Houses and Restaurants 147.9 161.7 172.4 180.2 193.9 249.4 Education, Culture and Community Services 224.9 282.1 291.5 365.3 345.3 407.9
Personal Services 128.5 143.9 154.0 192.0 199.6 210.1 General Government 619.5 760.4 697.6 887.7 950.9 1,040.1
(Percent)PRODUCTION OF SERVICES 100.0 100.0 100.0 100.0 100.0 100.0
Transport Storage and Communication 15.1 16.8 16.2 16.3 16.3 15.6 Commercial Services 72.6 69.8 72.0 69.9 70.3 71.5
Finance, Insurance, Real Estate and Business Services 23.2 21.3 24.3 22.7 23.8 23.2
Construction 11.9 12.2 11.1 12.7 13.9 15.2 Distribution Services 27.6 25.9 26.1 23.1 22.2 22.3 Hotels, Guest Houses and Restaurants 2.9 2.9 2.9 2.8 2.7 3.1 Education, Culture and Community Services 4.5 5.0 4.9 5.7 4.9 5.1
Personal Services 2.6 2.5 2.6 3.0 2.8 2.6 General Government 12.3 13.4 11.8 13.7 13.5 12.9
(US$Mn)2000 2001 2002 2003 2004 2005
PRODUCTION OF SERVICES 5,033.4 5,128.5 5,367.6 5,717.0 6,204.2 6,712.8 Transport, Storage and Communication 757.3 814.9 885.9 930.0 948.5 1,020.8 Commercial Services 3,656.5 3,703.3 3,849.0 4,160.5 4,625.4 5,049.4
Finance, Insurance, Real Estate and Business Services 1,164.2 1,173.2 1,308.6 1,404.6 1,709.6 1,878.3
Construction 605.0 667.5 633.3 782.8 881.9 1,020.6 Distribution Services 1,386.0 1,353.8 1,367.3 1,391.5 1,440.7 1,514.7 Hotels, Guest Houses and Restaurants 147.9 152.3 155.1 155.3 162.5 189.6 Education, Culture and Community Services 224.9 224.6 240.6 246.0 245.2 246.1
Personal Services 128.5 131.7 144.2 180.3 185.4 200.1 General Government 619.5 610.3 632.6 626.5 630.3 642.6
(Percent)PRODUCTION OF SERVICES 100.0 100.0 100.0 100.0 100.0 100.0
Transport Storage and Communication 15.0 15.9 16.5 16.3 15.3 15.2 Commercial Services 72.6 72.2 71.7 72.8 74.6 75.2
Finance, Insurance, Real Estate and Business Services 23.1 22.9 24.4 24.6 27.6 28.0
Construction 12.0 13.0 11.8 13.7 14.2 15.2 Distribution Services 27.5 26.4 25.5 24.3 23.2 22.6 Hotels, Guest Houses and Restaurants 2.9 3.0 2.9 2.7 2.6 2.8 Education, Culture and Community Services 4.5 4.4 4.5 4.3 4.0 3.7
Personal Services 2.6 2.6 2.7 3.2 3.0 3.0 General Government 12.3 11.9 11.8 11.0 10.2 9.6
AT CURRENT PRICES BY BROAD SERVICE AREA: 2000 - 2005TABLE 4.15.1: VALUE OF TRINIDAD AND TOBAGO'S PRODUCTION OF SERVICES
AT CONSTANT 2000 PRICES BY BROAD SERVICE AREA: 2000 - 2005TABLE 4.15.2: VALUE OF TRINIDAD AND TOBAGO'S PRODUCTION OF SERVICES
146


Section 5
CARICOM Member States’ Employment of Services


Total Employment of
Services
Transportation, Storage and
Communication
Financial, Insurance and
Real Estate Services
Construction Commerce
Community, Social and Personal Services
Government Services Other Services
CARIBBEAN COMMUNITY 1,733,593 146,104 146,454 243,560 525,136 538,910 113,858 4,419 The Bahamas 137,665 10,865 16,330 17,455 47,440 45,575 … …
CARIBBEAN COMMON MKT. 1,595,928 135,239 130,124 226,105 477,696 493,335 113,858 4,419 MDCs 1,409,105 117,465 115,612 195,750 410,443 470,506 84,177 …
Barbados 112,000 5,900 10,500 14,200 32,500 22,900 26,000 …Guyana 137,310 16,954 10,541 16,220 43,508 34,995 15,092 …Jamaica 679,192 60,600 46,400 80,500 214,700 261,900 15,092 …Suriname 114,703 8,711 9,071 14,030 29,835 9,911 27,993 15,152 Trinidad & Tobago 365,900 25,300 39,100 70,800 89,900 140,800 … …
LDCs 186,823 17,774 14,512 30,355 67,253 22,829 29,681 4,419 Belize 58,330 3,490 3,097 7,387 22,537 12,384 6,723 2,712
OECS 128,493 14,284 11,415 22,968 44,716 10,445 22,958 1,707 Antigua & Barbuda 20,885 2,281 2,075 2,597 8,164 2,207 3,561 …Dominica 17,009 1,558 1,144 2,420 5,120 2,615 2,445 1,707 Grenada 18,121 3,098 1,821 7,809 5,393 … … …Montserrat 1,477 133 111 214 252 105 662 …St. Kitts & Nevis 11,552 1,077 1,462 1,815 3,186 837 3,175 …Saint Lucia 34,824 3,543 2,897 4,454 14,330 1,879 7,721 …St. Vincent and the Grenadines 24,625 2,594 1,905 3,659 8,271 2,802 5,394 …
2001
TABLE 5.1.1: VALUE OF CARICOM'S EMPLOYMENT OF SERVICES, BY BROAD INDUSTRY AREA : 2001
CARIBBEAN COUNTRIES
Figure 4.1: Distribution of CARICOM's Employment ofServices, By Broad Industrial Area: 2001
Commerce30%
Transportation, Storage and
Communication9% Financial,
Insurance and Real Estate Services
9%
Construction 14%
Community, Social and Personal
Services31%
Government Services
7%
Other Services0%
Transportation, Storage and CommunicationFinancial, Insurance and Real Estate ServicesConstruction CommerceCommunity, Social and Personal ServicesGovernment ServicesOth S i
151

Section 6
Selected Economic Indicators

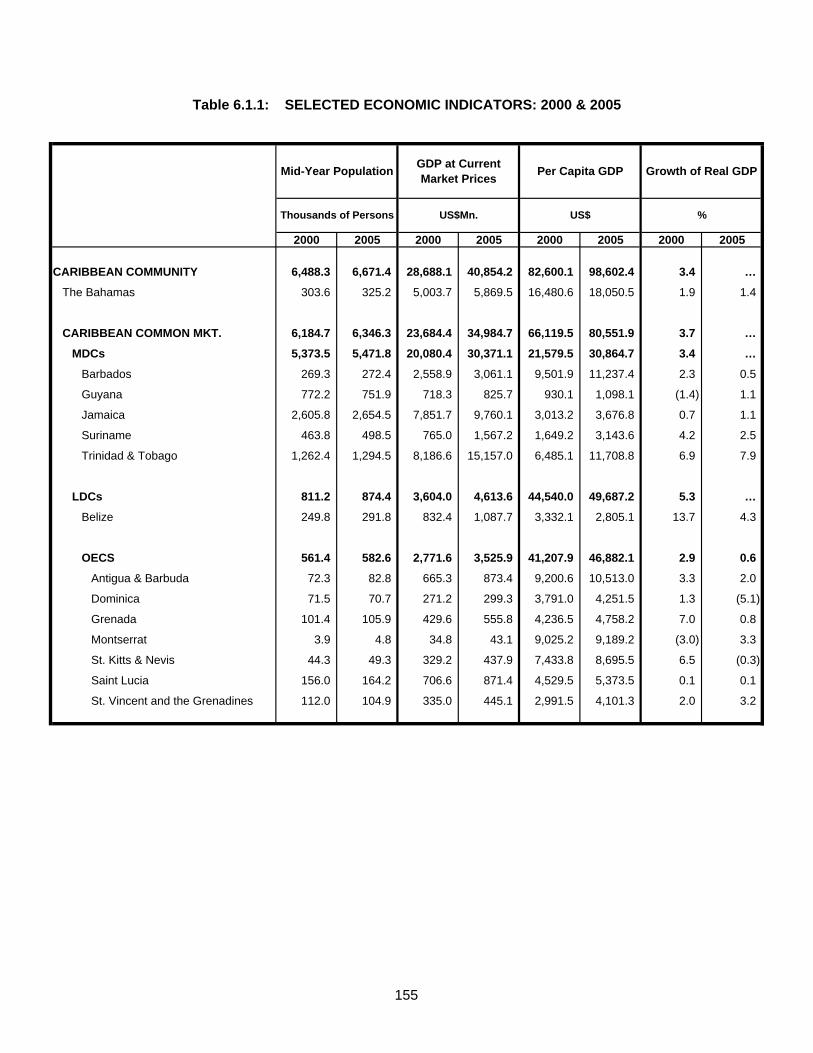
2000 2005 2000 2005 2000 2005 2000 2005
CARIBBEAN COMMUNITY 6,488.3 6,671.4 28,688.1 40,854.2 82,600.1 98,602.4 3.4 …
The Bahamas 303.6 325.2 5,003.7 5,869.5 16,480.6 18,050.5 1.9 1.4
CARIBBEAN COMMON MKT. 6,184.7 6,346.3 23,684.4 34,984.7 66,119.5 80,551.9 3.7 …
MDCs 5,373.5 5,471.8 20,080.4 30,371.1 21,579.5 30,864.7 3.4 …
Barbados 269.3 272.4 2,558.9 3,061.1 9,501.9 11,237.4 2.3 0.5
Guyana 772.2 751.9 718.3 825.7 930.1 1,098.1 (1.4) 1.1
Jamaica 2,605.8 2,654.5 7,851.7 9,760.1 3,013.2 3,676.8 0.7 1.1
Suriname 463.8 498.5 765.0 1,567.2 1,649.2 3,143.6 4.2 2.5
Trinidad & Tobago 1,262.4 1,294.5 8,186.6 15,157.0 6,485.1 11,708.8 6.9 7.9
LDCs 811.2 874.4 3,604.0 4,613.6 44,540.0 49,687.2 5.3 …
Belize 249.8 291.8 832.4 1,087.7 3,332.1 2,805.1 13.7 4.3
OECS 561.4 582.6 2,771.6 3,525.9 41,207.9 46,882.1 2.9 0.6
Antigua & Barbuda 72.3 82.8 665.3 873.4 9,200.6 10,513.0 3.3 2.0
Dominica 71.5 70.7 271.2 299.3 3,791.0 4,251.5 1.3 (5.1)
Grenada 101.4 105.9 429.6 555.8 4,236.5 4,758.2 7.0 0.8
Montserrat 3.9 4.8 34.8 43.1 9,025.2 9,189.2 (3.0) 3.3
St. Kitts & Nevis 44.3 49.3 329.2 437.9 7,433.8 8,695.5 6.5 (0.3)
Saint Lucia 156.0 164.2 706.6 871.4 4,529.5 5,373.5 0.1 0.1
St. Vincent and the Grenadines 112.0 104.9 335.0 445.1 2,991.5 4,101.3 2.0 3.2
Table 6.1.1: SELECTED ECONOMIC INDICATORS: 2000 & 2005
GDP at Current Market Prices
US$Mn.
Growth of Real GDPPer Capita GDP
US$
Mid-Year Population
Thousands of Persons %
155
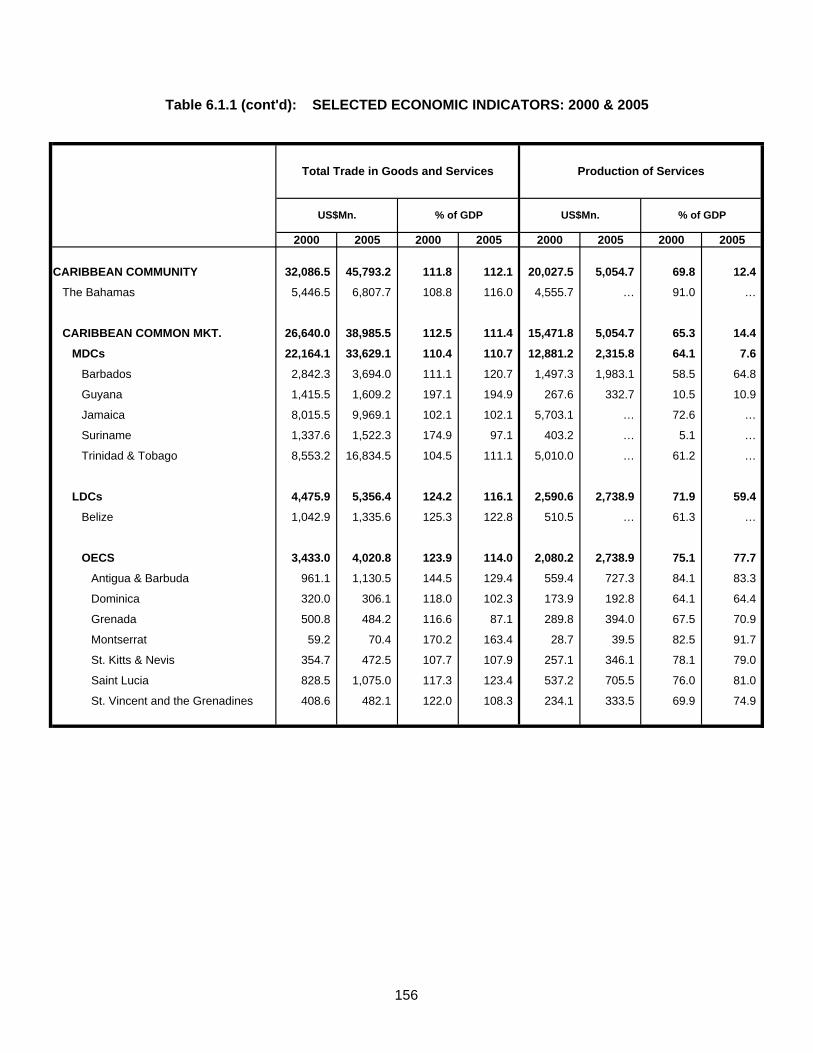
2000 2005 2000 2005 2000 2005 2000 2005
CARIBBEAN COMMUNITY 32,086.5 45,793.2 111.8 112.1 20,027.5 5,054.7 69.8 12.4
The Bahamas 5,446.5 6,807.7 108.8 116.0 4,555.7 … 91.0 …
CARIBBEAN COMMON MKT. 26,640.0 38,985.5 112.5 111.4 15,471.8 5,054.7 65.3 14.4
MDCs 22,164.1 33,629.1 110.4 110.7 12,881.2 2,315.8 64.1 7.6
Barbados 2,842.3 3,694.0 111.1 120.7 1,497.3 1,983.1 58.5 64.8
Guyana 1,415.5 1,609.2 197.1 194.9 267.6 332.7 10.5 10.9
Jamaica 8,015.5 9,969.1 102.1 102.1 5,703.1 … 72.6 …
Suriname 1,337.6 1,522.3 174.9 97.1 403.2 … 5.1 …
Trinidad & Tobago 8,553.2 16,834.5 104.5 111.1 5,010.0 … 61.2 …
LDCs 4,475.9 5,356.4 124.2 116.1 2,590.6 2,738.9 71.9 59.4
Belize 1,042.9 1,335.6 125.3 122.8 510.5 … 61.3 …
OECS 3,433.0 4,020.8 123.9 114.0 2,080.2 2,738.9 75.1 77.7
Antigua & Barbuda 961.1 1,130.5 144.5 129.4 559.4 727.3 84.1 83.3
Dominica 320.0 306.1 118.0 102.3 173.9 192.8 64.1 64.4
Grenada 500.8 484.2 116.6 87.1 289.8 394.0 67.5 70.9
Montserrat 59.2 70.4 170.2 163.4 28.7 39.5 82.5 91.7
St. Kitts & Nevis 354.7 472.5 107.7 107.9 257.1 346.1 78.1 79.0
Saint Lucia 828.5 1,075.0 117.3 123.4 537.2 705.5 76.0 81.0
St. Vincent and the Grenadines 408.6 482.1 122.0 108.3 234.1 333.5 69.9 74.9
Table 6.1.1 (cont'd): SELECTED ECONOMIC INDICATORS: 2000 & 2005
US$Mn. % of GDP US$Mn.
Production of Services
% of GDP
Total Trade in Goods and Services
156
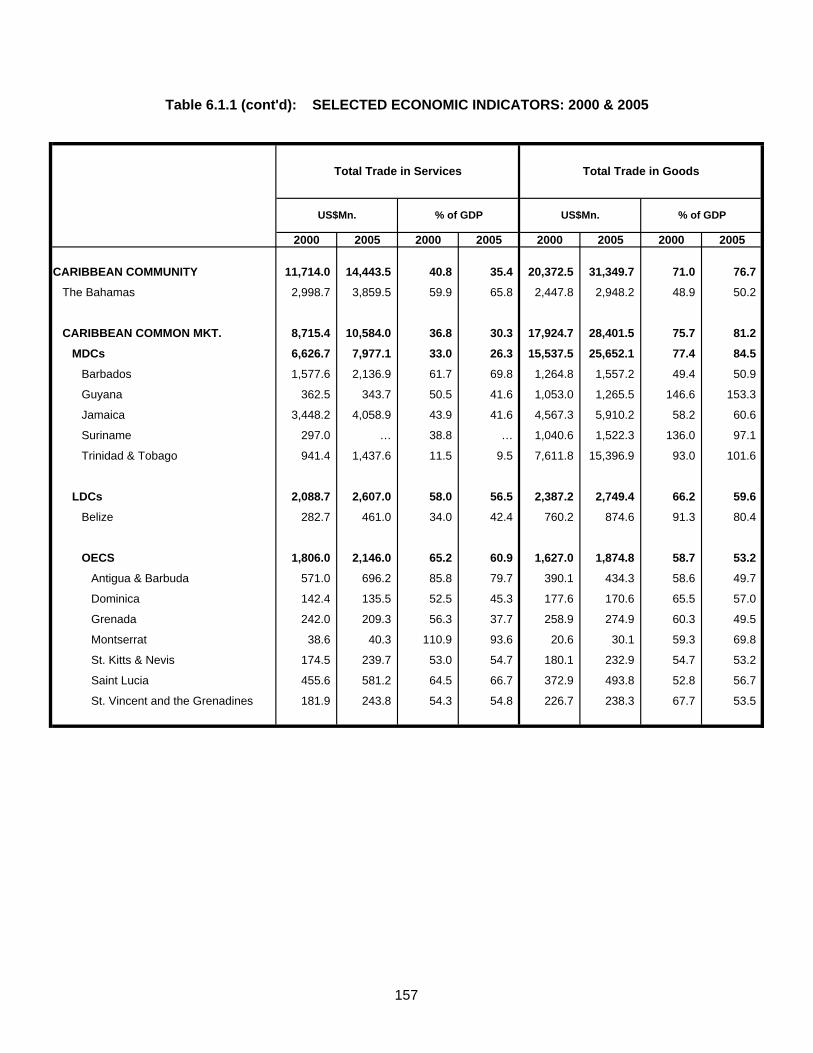
2000 2005 2000 2005 2000 2005 2000 2005
CARIBBEAN COMMUNITY 11,714.0 14,443.5 40.8 35.4 20,372.5 31,349.7 71.0 76.7
The Bahamas 2,998.7 3,859.5 59.9 65.8 2,447.8 2,948.2 48.9 50.2
CARIBBEAN COMMON MKT. 8,715.4 10,584.0 36.8 30.3 17,924.7 28,401.5 75.7 81.2
MDCs 6,626.7 7,977.1 33.0 26.3 15,537.5 25,652.1 77.4 84.5
Barbados 1,577.6 2,136.9 61.7 69.8 1,264.8 1,557.2 49.4 50.9
Guyana 362.5 343.7 50.5 41.6 1,053.0 1,265.5 146.6 153.3
Jamaica 3,448.2 4,058.9 43.9 41.6 4,567.3 5,910.2 58.2 60.6
Suriname 297.0 … 38.8 … 1,040.6 1,522.3 136.0 97.1
Trinidad & Tobago 941.4 1,437.6 11.5 9.5 7,611.8 15,396.9 93.0 101.6
LDCs 2,088.7 2,607.0 58.0 56.5 2,387.2 2,749.4 66.2 59.6
Belize 282.7 461.0 34.0 42.4 760.2 874.6 91.3 80.4
OECS 1,806.0 2,146.0 65.2 60.9 1,627.0 1,874.8 58.7 53.2
Antigua & Barbuda 571.0 696.2 85.8 79.7 390.1 434.3 58.6 49.7
Dominica 142.4 135.5 52.5 45.3 177.6 170.6 65.5 57.0
Grenada 242.0 209.3 56.3 37.7 258.9 274.9 60.3 49.5
Montserrat 38.6 40.3 110.9 93.6 20.6 30.1 59.3 69.8
St. Kitts & Nevis 174.5 239.7 53.0 54.7 180.1 232.9 54.7 53.2
Saint Lucia 455.6 581.2 64.5 66.7 372.9 493.8 52.8 56.7
St. Vincent and the Grenadines 181.9 243.8 54.3 54.8 226.7 238.3 67.7 53.5
Table 6.1.1 (cont'd): SELECTED ECONOMIC INDICATORS: 2000 & 2005
Total Trade in Goods
% of GDPUS$Mn.US$Mn.
Total Trade in Services
% of GDP
157
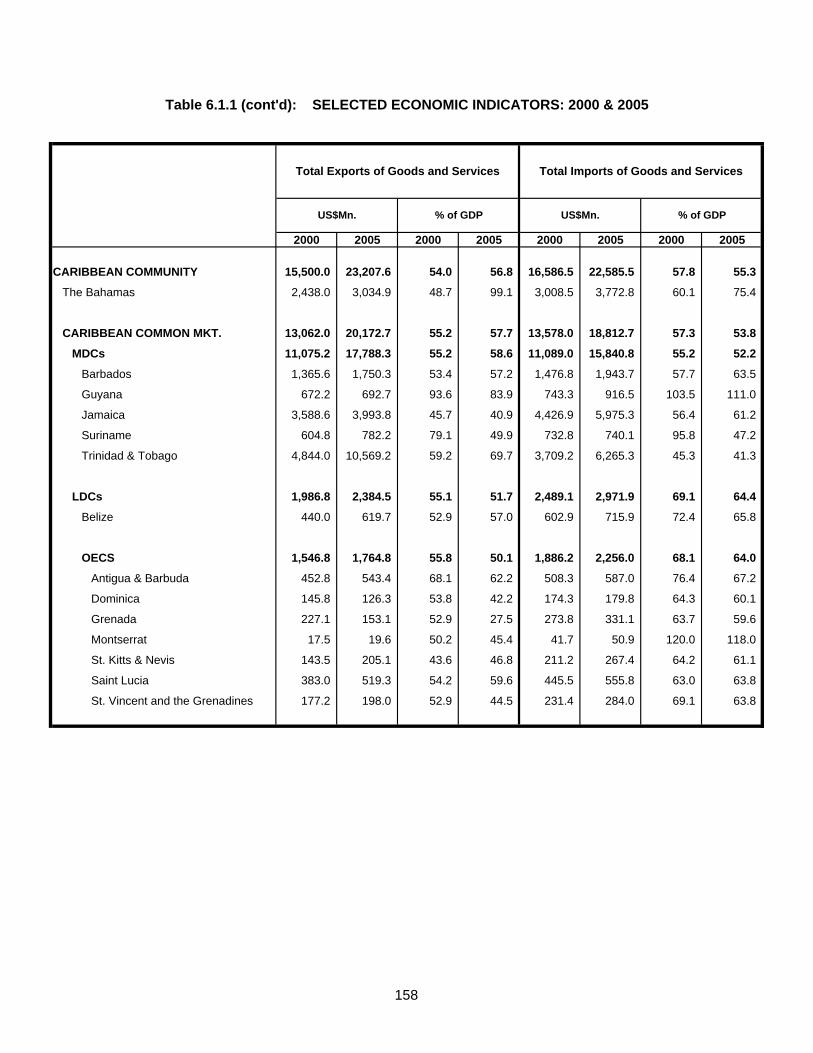
2000 2005 2000 2005 2000 2005 2000 2005
CARIBBEAN COMMUNITY 15,500.0 23,207.6 54.0 56.8 16,586.5 22,585.5 57.8 55.3
The Bahamas 2,438.0 3,034.9 48.7 99.1 3,008.5 3,772.8 60.1 75.4
CARIBBEAN COMMON MKT. 13,062.0 20,172.7 55.2 57.7 13,578.0 18,812.7 57.3 53.8
MDCs 11,075.2 17,788.3 55.2 58.6 11,089.0 15,840.8 55.2 52.2
Barbados 1,365.6 1,750.3 53.4 57.2 1,476.8 1,943.7 57.7 63.5
Guyana 672.2 692.7 93.6 83.9 743.3 916.5 103.5 111.0
Jamaica 3,588.6 3,993.8 45.7 40.9 4,426.9 5,975.3 56.4 61.2
Suriname 604.8 782.2 79.1 49.9 732.8 740.1 95.8 47.2
Trinidad & Tobago 4,844.0 10,569.2 59.2 69.7 3,709.2 6,265.3 45.3 41.3
LDCs 1,986.8 2,384.5 55.1 51.7 2,489.1 2,971.9 69.1 64.4
Belize 440.0 619.7 52.9 57.0 602.9 715.9 72.4 65.8
OECS 1,546.8 1,764.8 55.8 50.1 1,886.2 2,256.0 68.1 64.0
Antigua & Barbuda 452.8 543.4 68.1 62.2 508.3 587.0 76.4 67.2
Dominica 145.8 126.3 53.8 42.2 174.3 179.8 64.3 60.1
Grenada 227.1 153.1 52.9 27.5 273.8 331.1 63.7 59.6
Montserrat 17.5 19.6 50.2 45.4 41.7 50.9 120.0 118.0
St. Kitts & Nevis 143.5 205.1 43.6 46.8 211.2 267.4 64.2 61.1
Saint Lucia 383.0 519.3 54.2 59.6 445.5 555.8 63.0 63.8
St. Vincent and the Grenadines 177.2 198.0 52.9 44.5 231.4 284.0 69.1 63.8
% of GDPUS$Mn.% of GDPUS$Mn.
Table 6.1.1 (cont'd): SELECTED ECONOMIC INDICATORS: 2000 & 2005
Total Exports of Goods and Services Total Imports of Goods and Services
158

2000 2005 2000 2005 2000 2005 2000 2005
CARIBBEAN COMMUNITY 7,283.6 9,037.3 25.4 22.1 47.0 53.7 22.7 23.2
The Bahamas 1,973.2 2,485.9 39.4 … 80.9 100.2 36.2 42.4
CARIBBEAN COMMON MKT. 5,310.5 6,551.4 22.4 18.7 40.7 45.6 19.9 19.8
MDCs 3,929.9 4,830.8 19.6 15.9 35.5 39.1 17.7 17.1
Barbados 1,090.2 1,457.2 42.6 47.6 79.8 102.7 38.4 47.0
Guyana 169.3 147.1 23.6 17.8 25.2 22.1 12.0 9.5
Jamaica 2,025.7 2,329.5 25.8 23.9 56.4 66.1 25.3 25.4
Suriname 91.0 … 1.2 … 2.5 … 1.1 …
Trinidad & Tobago 553.7 896.9 6.8 … 11.4 15.2 6.5 7.2
LDCs 1,380.6 1,720.6 38.3 37.3 69.5 86.2 30.8 35.1
Belize 158.2 301.3 19.0 27.7 36.0 61.0 15.2 26.6
OECS 1,222.3 1,419.3 44.1 40.3 79.0 94.5 35.6 37.7
Antigua & Barbuda 415.4 488.0 62.4 55.9 91.7 106.4 43.2 45.8
Dominica 89.7 83.4 33.1 27.9 61.6 67.6 28.0 29.9
Grenada 152.8 116.6 35.6 21.0 67.3 66.2 30.5 22.3
Montserrat 16.2 14.8 46.6 34.3 92.8 105.4 27.4 22.7
St. Kitts & Nevis 98.5 147.7 29.9 33.7 68.7 86.8 27.8 32.3
Saint Lucia 322.1 410.1 45.6 47.1 84.1 106.2 38.9 43.7
St. Vincent and the Grenadines 127.6 158.8 38.1 35.7 72.0 91.6 31.2 36.5
% of Total Goods & Services
Exports of Services
Table 6.1.1 (cont'd): SELECTED ECONOMIC INDICATORS: 2000 & 2005
% of Total Exports of Goods & Services% of GDPUS$Mn.
159
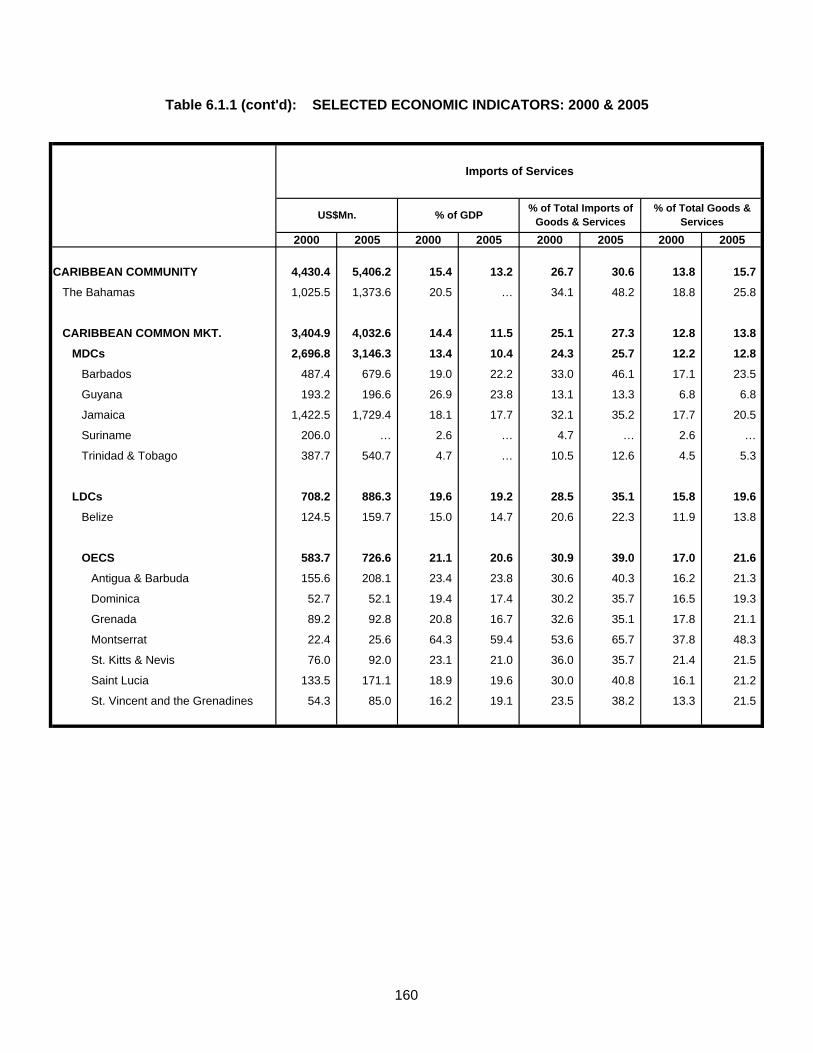
2000 2005 2000 2005 2000 2005 2000 2005
CARIBBEAN COMMUNITY 4,430.4 5,406.2 15.4 13.2 26.7 30.6 13.8 15.7
The Bahamas 1,025.5 1,373.6 20.5 … 34.1 48.2 18.8 25.8
CARIBBEAN COMMON MKT. 3,404.9 4,032.6 14.4 11.5 25.1 27.3 12.8 13.8
MDCs 2,696.8 3,146.3 13.4 10.4 24.3 25.7 12.2 12.8
Barbados 487.4 679.6 19.0 22.2 33.0 46.1 17.1 23.5
Guyana 193.2 196.6 26.9 23.8 13.1 13.3 6.8 6.8
Jamaica 1,422.5 1,729.4 18.1 17.7 32.1 35.2 17.7 20.5
Suriname 206.0 … 2.6 … 4.7 … 2.6 …
Trinidad & Tobago 387.7 540.7 4.7 … 10.5 12.6 4.5 5.3
LDCs 708.2 886.3 19.6 19.2 28.5 35.1 15.8 19.6
Belize 124.5 159.7 15.0 14.7 20.6 22.3 11.9 13.8
OECS 583.7 726.6 21.1 20.6 30.9 39.0 17.0 21.6
Antigua & Barbuda 155.6 208.1 23.4 23.8 30.6 40.3 16.2 21.3
Dominica 52.7 52.1 19.4 17.4 30.2 35.7 16.5 19.3
Grenada 89.2 92.8 20.8 16.7 32.6 35.1 17.8 21.1
Montserrat 22.4 25.6 64.3 59.4 53.6 65.7 37.8 48.3
St. Kitts & Nevis 76.0 92.0 23.1 21.0 36.0 35.7 21.4 21.5
Saint Lucia 133.5 171.1 18.9 19.6 30.0 40.8 16.1 21.2
St. Vincent and the Grenadines 54.3 85.0 16.2 19.1 23.5 38.2 13.3 21.5
US$Mn. % of GDP % of Total Imports of Goods & Services
Imports of Services
% of Total Goods & Services
Table 6.1.1 (cont'd): SELECTED ECONOMIC INDICATORS: 2000 & 2005
160

2000 2005 2000 2005 2000 2005 2000 2005
CARIBBEAN COMMUNITY 8,216.4 14,170.3 28.6 34.7 53.0 73.8 25.6 36.3
The Bahamas 464.8 549.0 9.3 … 19.1 20.2 8.5 9.4
CARIBBEAN COMMON MKT. 7,751.5 13,621.3 32.7 38.9 59.3 82.6 29.1 41.1
MDCs 7,145.3 12,957.5 35.6 42.7 64.5 90.6 32.2 45.8
Barbados 275.4 293.1 10.8 9.6 20.2 19.8 9.7 9.5
Guyana 502.9 545.6 70.0 66.1 74.8 73.1 35.5 35.1
Jamaica 1,562.9 1,664.3 19.9 17.1 43.6 42.7 19.5 18.1
Suriname 513.8 782.2 67.2 … 85.0 84.7 38.4 40.4
Trinidad & Tobago 4,290.3 9,672.3 52.4 … 88.6 133.3 50.2 77.3
LDCs 606.3 663.8 16.8 14.4 30.5 30.3 13.5 13.6
Belize 281.8 318.4 33.9 29.3 64.0 62.9 27.0 28.1
OECS 324.5 345.4 11.7 9.8 21.0 20.5 9.5 9.2
Antigua & Barbuda 37.4 55.4 5.6 6.3 8.3 10.6 3.9 5.2
Dominica 56.0 42.8 20.7 14.3 38.4 33.5 17.5 15.4
Grenada 74.3 36.5 17.3 6.6 32.7 18.0 14.8 7.0
Montserrat 1.3 4.8 3.6 11.1 7.2 27.9 2.1 7.4
St. Kitts & Nevis 45.0 57.4 13.7 13.1 31.3 29.7 12.7 12.6
Saint Lucia 60.9 109.2 8.6 12.5 15.9 24.9 7.4 11.6
St. Vincent and the Grenadines 49.6 39.3 14.8 8.8 28.0 21.3 12.1 9.0
% of Total Goods & Services
Table 6.1.1 (cont'd): SELECTED ECONOMIC INDICATORS: 2000 & 2005
US$Mn. % of GDP % of Total Exports of Goods & Services
Exports of Goods
161

2000 2005 2000 2005 2000 2005 2000 2005
CARIBBEAN COMMUNITY 12,156.1 17,179.3 42.4 42.1 73.3 76.1 37.9 44.0
The Bahamas 1,983.0 2,399.2 39.6 … 65.9 63.6 36.4 41.0
CARIBBEAN COMMON MKT. 10,173.1 14,780.1 43.0 42.2 74.9 78.6 38.2 44.6
MDCs 8,392.2 12,694.6 41.8 41.8 75.7 80.1 37.9 44.9
Barbados 989.4 1,264.1 38.7 41.3 67.0 65.0 34.8 40.8
Guyana 550.1 719.9 21.5 23.5 37.3 37.0 38.9 46.4
Jamaica 3,004.4 4,245.9 38.3 43.5 67.9 71.1 37.5 46.3
Suriname 526.8 740.1 68.9 … 71.9 100.0 39.4 38.3
Trinidad & Tobago 3,321.5 5,724.6 40.6 … 89.5 91.4 38.8 45.7
LDCs 1,780.9 2,085.6 49.4 45.2 71.5 70.2 39.8 42.6
Belize 478.4 556.2 57.5 51.1 79.4 77.7 45.9 49.1
OECS 1,302.5 1,529.4 47.0 43.4 69.1 67.8 37.9 40.6
Antigua & Barbuda 352.7 378.9 53.0 43.4 69.4 64.5 36.7 35.6
Dominica 121.6 127.7 44.8 42.7 69.8 71.0 38.0 45.8
Grenada 184.6 238.4 43.0 42.9 67.4 72.0 36.9 45.5
Montserrat 19.4 25.3 55.7 58.7 46.4 49.7 32.7 38.9
St. Kitts & Nevis 135.2 175.4 41.1 40.1 64.0 65.6 38.1 38.4
Saint Lucia 312.0 384.7 44.2 44.1 70.0 69.2 37.7 41.0
St. Vincent and the Grenadines 177.1 199.0 52.8 44.7 76.5 70.1 43.3 45.7
Imports of Goods
% of Total Goods & Services
% of Total Imports of Goods & Services% of GDP
Table 6.1.1 (cont'd): SELECTED ECONOMIC INDICATORS: 2000 & 2005
US$Mn.
162
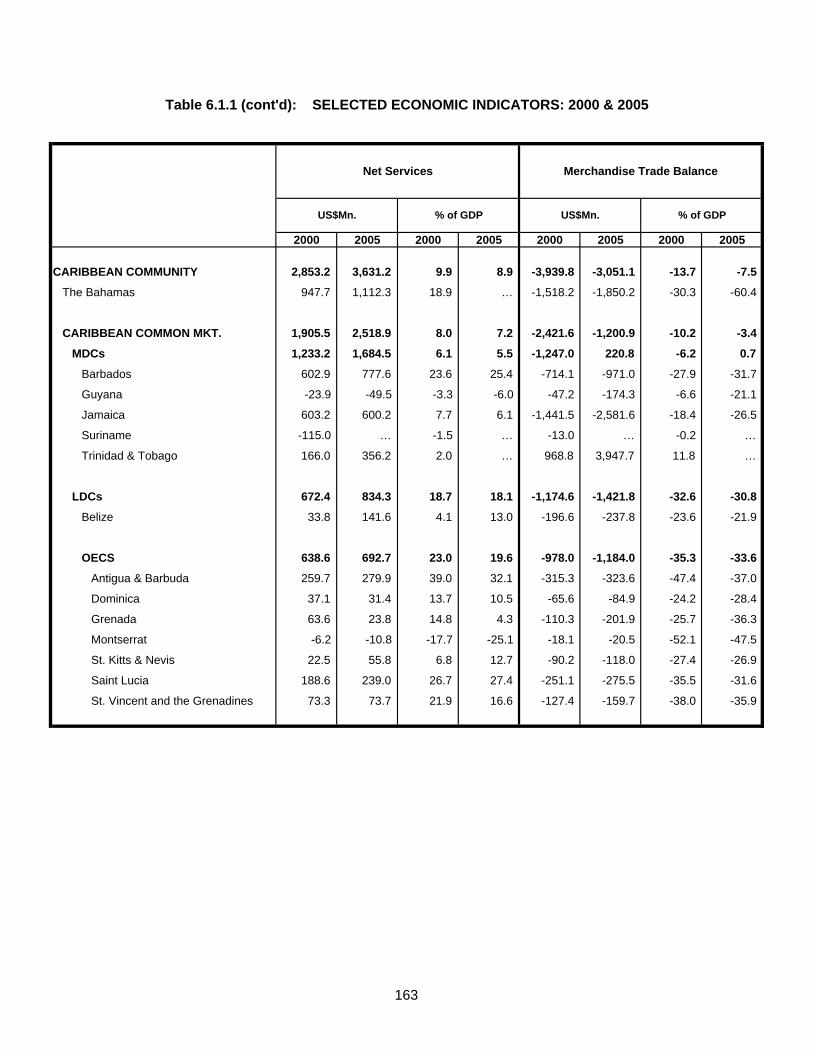
2000 2005 2000 2005 2000 2005 2000 2005
CARIBBEAN COMMUNITY 2,853.2 3,631.2 9.9 8.9 -3,939.8 -3,051.1 -13.7 -7.5
The Bahamas 947.7 1,112.3 18.9 … -1,518.2 -1,850.2 -30.3 -60.4
CARIBBEAN COMMON MKT. 1,905.5 2,518.9 8.0 7.2 -2,421.6 -1,200.9 -10.2 -3.4
MDCs 1,233.2 1,684.5 6.1 5.5 -1,247.0 220.8 -6.2 0.7
Barbados 602.9 777.6 23.6 25.4 -714.1 -971.0 -27.9 -31.7
Guyana -23.9 -49.5 -3.3 -6.0 -47.2 -174.3 -6.6 -21.1
Jamaica 603.2 600.2 7.7 6.1 -1,441.5 -2,581.6 -18.4 -26.5
Suriname -115.0 … -1.5 … -13.0 … -0.2 …
Trinidad & Tobago 166.0 356.2 2.0 … 968.8 3,947.7 11.8 …
LDCs 672.4 834.3 18.7 18.1 -1,174.6 -1,421.8 -32.6 -30.8
Belize 33.8 141.6 4.1 13.0 -196.6 -237.8 -23.6 -21.9
OECS 638.6 692.7 23.0 19.6 -978.0 -1,184.0 -35.3 -33.6
Antigua & Barbuda 259.7 279.9 39.0 32.1 -315.3 -323.6 -47.4 -37.0
Dominica 37.1 31.4 13.7 10.5 -65.6 -84.9 -24.2 -28.4
Grenada 63.6 23.8 14.8 4.3 -110.3 -201.9 -25.7 -36.3
Montserrat -6.2 -10.8 -17.7 -25.1 -18.1 -20.5 -52.1 -47.5
St. Kitts & Nevis 22.5 55.8 6.8 12.7 -90.2 -118.0 -27.4 -26.9
Saint Lucia 188.6 239.0 26.7 27.4 -251.1 -275.5 -35.5 -31.6
St. Vincent and the Grenadines 73.3 73.7 21.9 16.6 -127.4 -159.7 -38.0 -35.9
US$Mn.
Merchandise Trade Balance
% of GDP
Net Services
US$Mn. % of GDP
Table 6.1.1 (cont'd): SELECTED ECONOMIC INDICATORS: 2000 & 2005
163
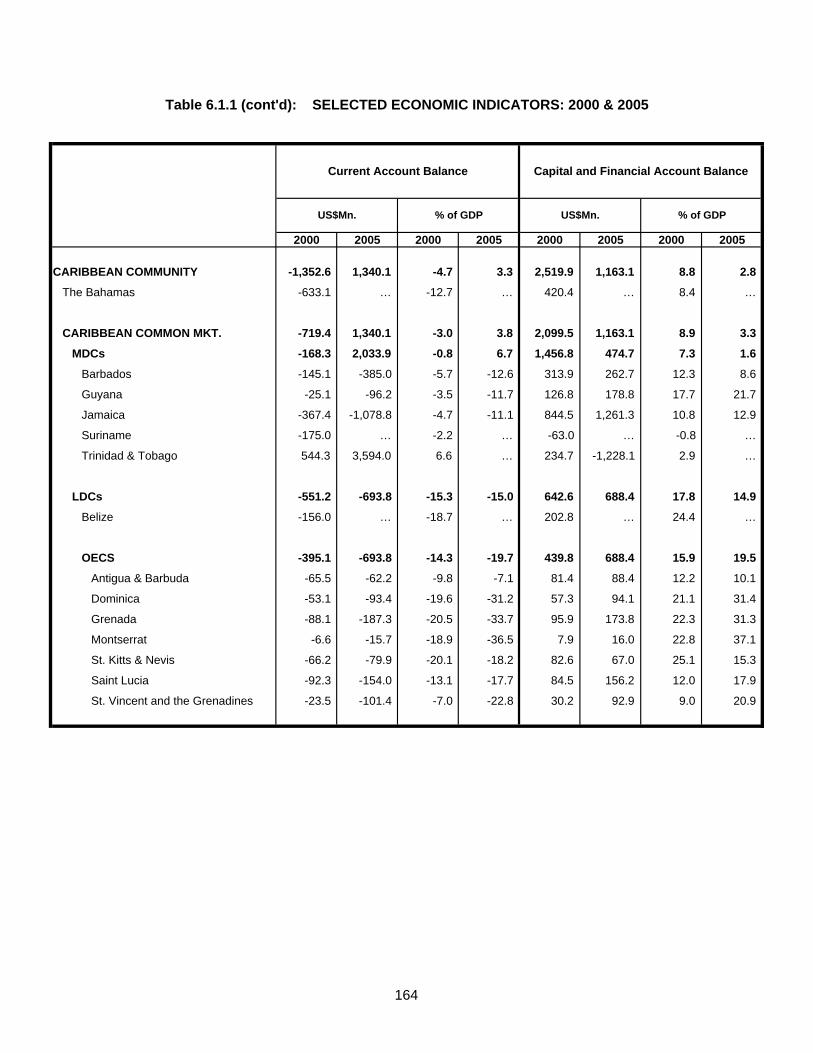
2000 2005 2000 2005 2000 2005 2000 2005
CARIBBEAN COMMUNITY -1,352.6 1,340.1 -4.7 3.3 2,519.9 1,163.1 8.8 2.8
The Bahamas -633.1 … -12.7 … 420.4 … 8.4 …
CARIBBEAN COMMON MKT. -719.4 1,340.1 -3.0 3.8 2,099.5 1,163.1 8.9 3.3
MDCs -168.3 2,033.9 -0.8 6.7 1,456.8 474.7 7.3 1.6
Barbados -145.1 -385.0 -5.7 -12.6 313.9 262.7 12.3 8.6
Guyana -25.1 -96.2 -3.5 -11.7 126.8 178.8 17.7 21.7
Jamaica -367.4 -1,078.8 -4.7 -11.1 844.5 1,261.3 10.8 12.9
Suriname -175.0 … -2.2 … -63.0 … -0.8 …
Trinidad & Tobago 544.3 3,594.0 6.6 … 234.7 -1,228.1 2.9 …
LDCs -551.2 -693.8 -15.3 -15.0 642.6 688.4 17.8 14.9
Belize -156.0 … -18.7 … 202.8 … 24.4 …
OECS -395.1 -693.8 -14.3 -19.7 439.8 688.4 15.9 19.5
Antigua & Barbuda -65.5 -62.2 -9.8 -7.1 81.4 88.4 12.2 10.1
Dominica -53.1 -93.4 -19.6 -31.2 57.3 94.1 21.1 31.4
Grenada -88.1 -187.3 -20.5 -33.7 95.9 173.8 22.3 31.3
Montserrat -6.6 -15.7 -18.9 -36.5 7.9 16.0 22.8 37.1
St. Kitts & Nevis -66.2 -79.9 -20.1 -18.2 82.6 67.0 25.1 15.3
Saint Lucia -92.3 -154.0 -13.1 -17.7 84.5 156.2 12.0 17.9
St. Vincent and the Grenadines -23.5 -101.4 -7.0 -22.8 30.2 92.9 9.0 20.9
% of GDPUS$Mn.
Table 6.1.1 (cont'd): SELECTED ECONOMIC INDICATORS: 2000 & 2005
Capital and Financial Account Balance
% of GDPUS$Mn.
Current Account Balance
164

2000 2005 2000 2005 2000 2005 2000 2005
CARIBBEAN COMMUNITY 1,780.1 … 87.0 … 1,693.1 … 5.9 …
The Bahamas 301.1 … 50.7 … 250.3 … 5.0 …
CARIBBEAN COMMON MKT. 1,479.1 … 36.3 … 1,442.8 … 6.1 …
MDCs 1,152.7 … 0.7 … 1,152.0 … 5.7 …
Barbados 17.4 … -1.3 … 18.7 … 0.7 …
Guyana - … - … - … - …
Jamaica 455.8 … 74.0 … 381.8 … 4.9 …
Suriname - … -97.2 … 97.2 … 12.7 …
Trinidad & Tobago 679.5 … 25.2 … 654.3 … 8.0 …
LDCs 326.4 … 35.6 … 290.9 … 8.1 …
Belize 23.3 … - … 23.3 … 2.8 …
OECS 303.1 … 35.6 … 267.5 … 9.7 …
Antigua & Barbuda 51.6 … 23.5 … 28.1 … 4.2 …
Dominica 13.6 … 2.8 … 10.8 … 4.0 …
Grenada 39.4 … 2.0 … 37.4 … 8.7 …
Montserrat 3.5 … 0.1 … 3.5 … 9.9 …
St. Kitts & Nevis 99.0 … 2.8 … 96.2 … 29.2 …
Saint Lucia 58.2 … 4.5 … 53.7 … 7.6 …
St. Vincent and the Grenadines 37.8 … 0.0 … 37.7 … 11.3 …
US$Mn.
Foreign Direct Investment
US$Mn.Debit
US$Mn.
Table 6.1.1 (cont'd): SELECTED ECONOMIC INDICATORS: 2000 & 2005
Net% of GDP
Credit
165
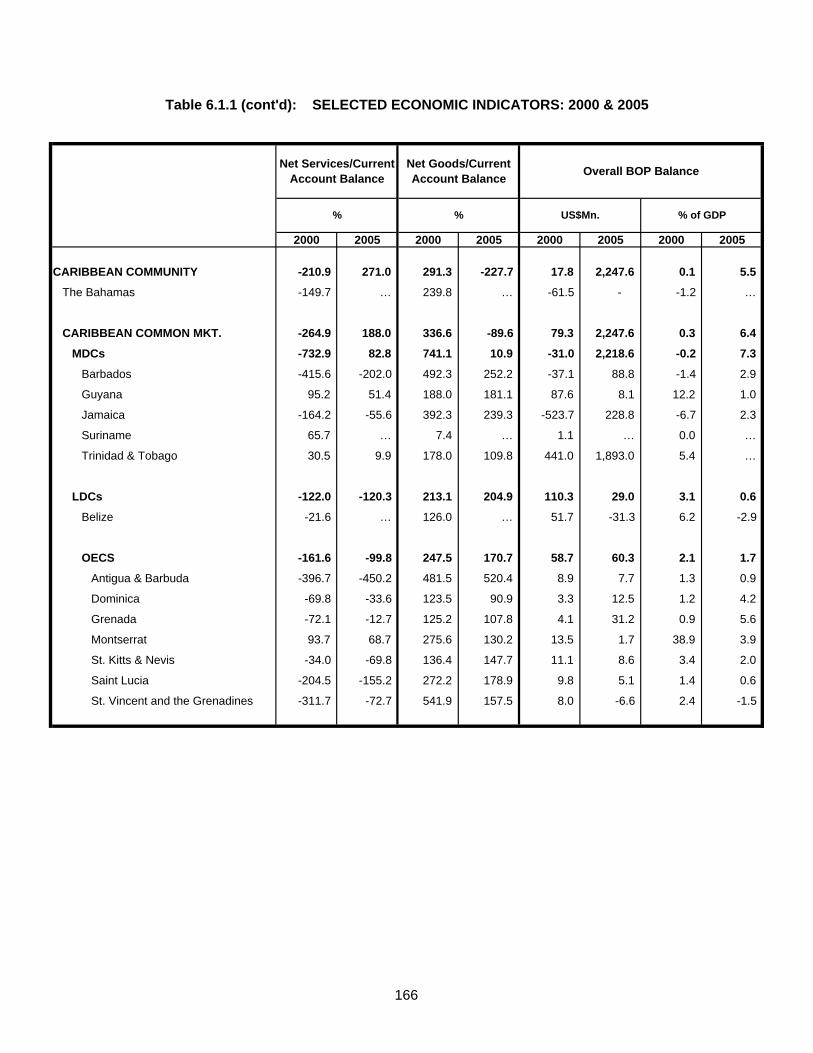
2000 2005 2000 2005 2000 2005 2000 2005
CARIBBEAN COMMUNITY -210.9 271.0 291.3 -227.7 17.8 2,247.6 0.1 5.5
The Bahamas -149.7 … 239.8 … -61.5 - -1.2 …
CARIBBEAN COMMON MKT. -264.9 188.0 336.6 -89.6 79.3 2,247.6 0.3 6.4
MDCs -732.9 82.8 741.1 10.9 -31.0 2,218.6 -0.2 7.3
Barbados -415.6 -202.0 492.3 252.2 -37.1 88.8 -1.4 2.9
Guyana 95.2 51.4 188.0 181.1 87.6 8.1 12.2 1.0
Jamaica -164.2 -55.6 392.3 239.3 -523.7 228.8 -6.7 2.3
Suriname 65.7 … 7.4 … 1.1 … 0.0 …
Trinidad & Tobago 30.5 9.9 178.0 109.8 441.0 1,893.0 5.4 …
LDCs -122.0 -120.3 213.1 204.9 110.3 29.0 3.1 0.6
Belize -21.6 … 126.0 … 51.7 -31.3 6.2 -2.9
OECS -161.6 -99.8 247.5 170.7 58.7 60.3 2.1 1.7
Antigua & Barbuda -396.7 -450.2 481.5 520.4 8.9 7.7 1.3 0.9
Dominica -69.8 -33.6 123.5 90.9 3.3 12.5 1.2 4.2
Grenada -72.1 -12.7 125.2 107.8 4.1 31.2 0.9 5.6
Montserrat 93.7 68.7 275.6 130.2 13.5 1.7 38.9 3.9
St. Kitts & Nevis -34.0 -69.8 136.4 147.7 11.1 8.6 3.4 2.0
Saint Lucia -204.5 -155.2 272.2 178.9 9.8 5.1 1.4 0.6
St. Vincent and the Grenadines -311.7 -72.7 541.9 157.5 8.0 -6.6 2.4 -1.5
Net Services/Current Account Balance
Net Goods/Current Account Balance
% % of GDPUS$Mn.%
Table 6.1.1 (cont'd): SELECTED ECONOMIC INDICATORS: 2000 & 2005
Overall BOP Balance
166

Annexes

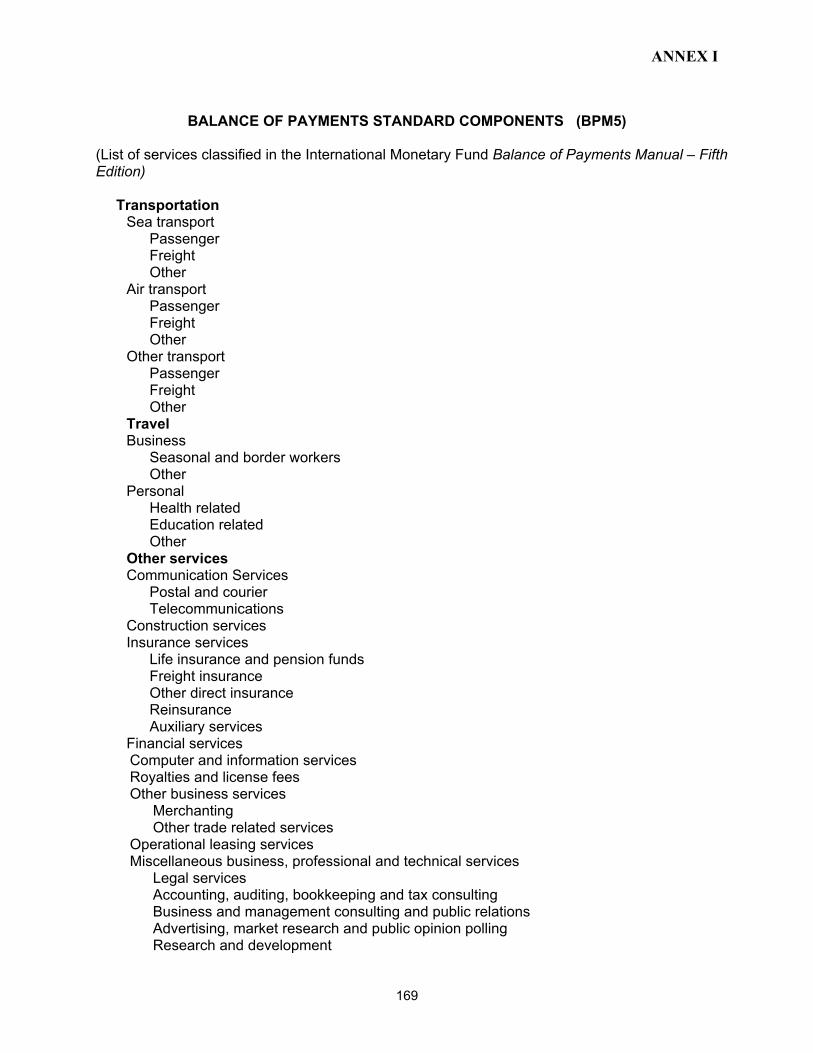
ANNEX I
169
BALANCE OF PAYMENTS STANDARD COMPONENTS (BPM5)
(List of services classified in the International Monetary Fund Balance of Payments Manual – Fifth Edition) Transportation
Sea transport Passenger Freight Other Air transport Passenger Freight Other Other transport Passenger Freight Other Travel Business Seasonal and border workers Other Personal Health related Education related Other Other services Communication Services Postal and courier Telecommunications Construction services Insurance services Life insurance and pension funds Freight insurance Other direct insurance Reinsurance Auxiliary services Financial services Computer and information services Royalties and license fees Other business services Merchanting Other trade related services Operational leasing services Miscellaneous business, professional and technical services Legal services Accounting, auditing, bookkeeping and tax consulting Business and management consulting and public relations Advertising, market research and public opinion polling Research and development
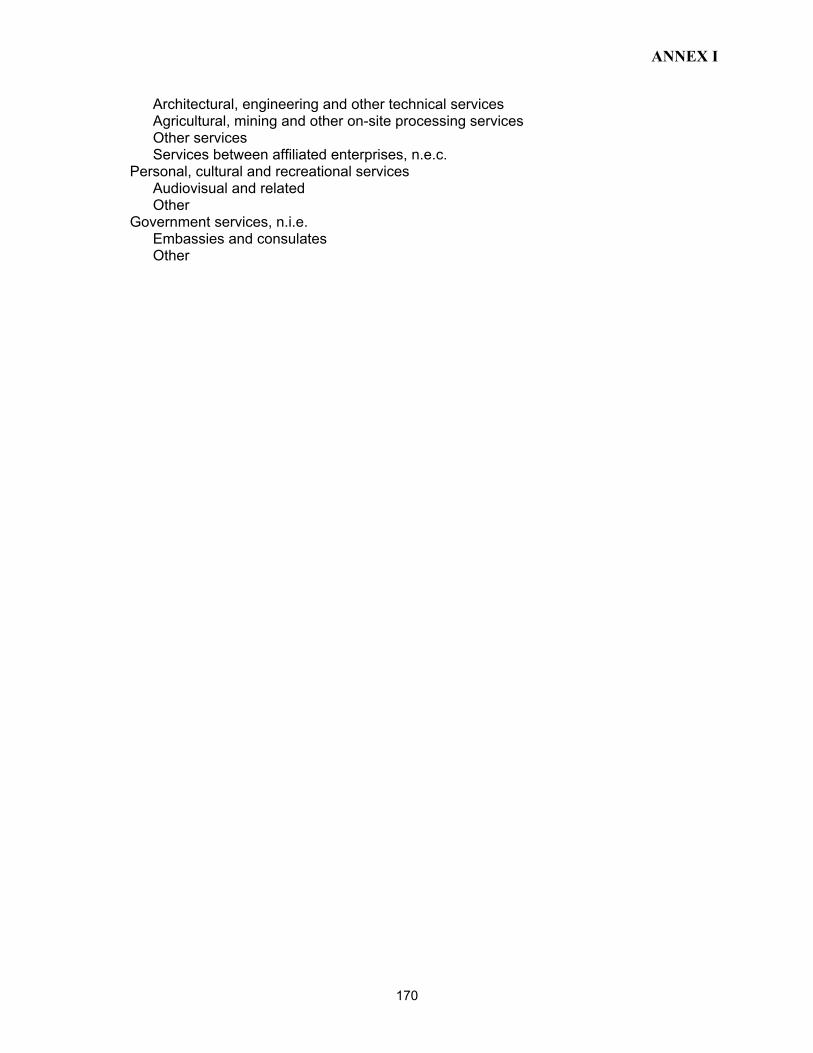
ANNEX I
170
Architectural, engineering and other technical services Agricultural, mining and other on-site processing services Other services Services between affiliated enterprises, n.e.c. Personal, cultural and recreational services Audiovisual and related Other Government services, n.i.e. Embassies and consulates Other
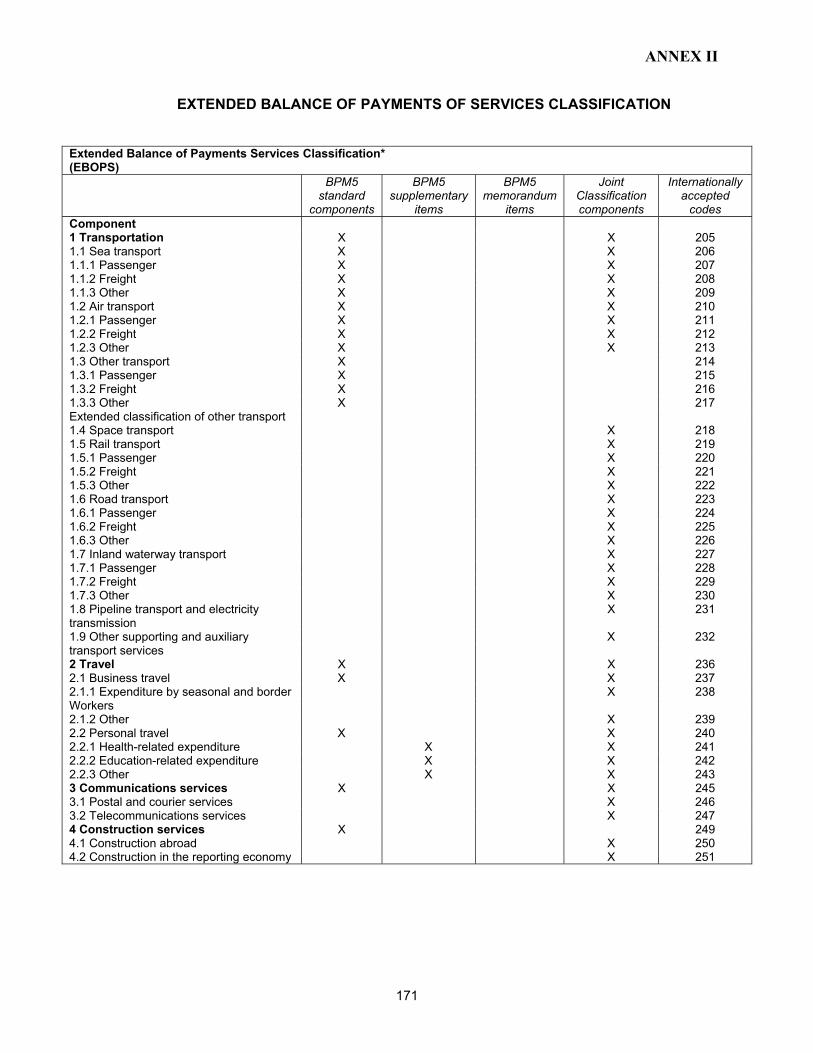
ANNEX II
171
EXTENDED BALANCE OF PAYMENTS OF SERVICES CLASSIFICATION
Extended Balance of Payments Services Classification* (EBOPS)
BPM5 standard
components
BPM5 supplementary
items
BPM5 memorandum
items
Joint Classification components
Internationally accepted
codes Component 1 Transportation X X 205 1.1 Sea transport X X 206 1.1.1 Passenger X X 207 1.1.2 Freight X X 208 1.1.3 Other X X 209 1.2 Air transport X X 210 1.2.1 Passenger X X 211 1.2.2 Freight X X 212 1.2.3 Other X X 213 1.3 Other transport X 214 1.3.1 Passenger X 215 1.3.2 Freight X 216 1.3.3 Other X 217 Extended classification of other transport 1.4 Space transport X 218 1.5 Rail transport X 219 1.5.1 Passenger X 220 1.5.2 Freight X 221 1.5.3 Other X 222 1.6 Road transport X 223 1.6.1 Passenger X 224 1.6.2 Freight X 225 1.6.3 Other X 226 1.7 Inland waterway transport X 227 1.7.1 Passenger X 228 1.7.2 Freight X 229 1.7.3 Other X 230 1.8 Pipeline transport and electricity transmission
X 231
1.9 Other supporting and auxiliary X 232 transport services 2 Travel X X 236 2.1 Business travel X X 237 2.1.1 Expenditure by seasonal and border X 238 Workers 2.1.2 Other X 239 2.2 Personal travel X X 240 2.2.1 Health-related expenditure X X 241 2.2.2 Education-related expenditure X X 242 2.2.3 Other X X 243 3 Communications services X X 245 3.1 Postal and courier services X 246 3.2 Telecommunications services X 247 4 Construction services X 249 4.1 Construction abroad X 250 4.2 Construction in the reporting economy X 251

ANNEX II
172
BPM5
standard components
BPM5 supplementary
items
BPM5 memorandum
items
Joint Classification components
Internationally accepted
codes 5 Insurance services X X 253 5.1 Life insurance and pension funding X 254 5.2 Freight insurance X 255 5.3 Other direct insurance X 256 5.4 Reinsurance X 257 5.5 Auxiliary services X 258 6 Financial services X X 260 7 Computer and information services X X 262 7.1 Computer services X 263 7.2 Information services X 264 7.2.1 News agency services 889 7.2.2 Other information provision services 890 8 Royalties and license fees X X 266 8.1 Franchises and similar rigbts 891 8.2 Other royalties and license fees 892 9 Other business services X X 268 9.1 Merchanting and other trade-related services
X X 269
9.1.1 Merchanting X 270 9.1.2 Other trade-related services X 271 9.2 Operational leasing services X X 272 9.3 Miscellaneous business, professional, and technical services
X X 273
9.3.1 Legal, accounting, management X X 274 consulting, and public relations 9.3.1.1 Legal services X 275 9.3.1.2 Accounting, auditing, X 276 bookkeeping, and tax consultancy services 9.3.1.3 Business and management X 277 consultancy and public relations services 9.3.2 Advertising, market research, X X 278 and public opinion polling 9.3.3 Research and development X X 279 9.3.4 Architectural, engineering, and other X X 280 technical services 9.3.5 Agriculture, mining, and on-site X X 281 processing services 9.3.5.1 Waste treatment and X 282 Depollution 9.3.5.2 Agriculture, mining, and X 283 other on-site processing 9.3.6 Other business services X X 284 9.3.7 Services between related enterprises, n.i.e.
X 285
10 Personal, cultural, and recreational services
X X 287
10.1 Audiovisual and related services X X 288 10.2 Other personal, cultural, and recreational services
X X 289
10.2.1 Education services 895 10.2.2 Health services 896 10.2.3 Other personal, cultural, and 897 recreational services 11 Government services, n.i.e. X X 291 11.1 Embassies and consulates X 292 11.2 Military units and agencies X 293 11.3 Other X 294
*Source: UN Draft Manual on Statistics of International Trade in Services (17 Nov 2000)

ANNEX II
173
Memorandum items
BPM5 standard
components
BPM5 supplementary
items
BPM5 memorandum
items
Joint Classification components
Internationally accepted
codes 1 Freight transportation on merchandise, valued on a transaction basis
X 853
1.1 Sea freight X 856 1.2 Air freight X 857 1.3 Other freight X 858 1.4 Space freight 862 1.5 Rail freight 863 1.6 Road freight X 864 1.7 Inland waterways freight 865 1.8 Pipeline freight 868 2 Travel 2.1 Expenditure on goods 2.2 Expenditure on accommodation and X restaurant services 2.3 All other travel expenditure 3 Gross insurance premiums X X 874 3.1 Gross premiums-life insurance 875 3.2 Gross premiums-freight insurance 876 3.3 Gross premiums-other direct insurance
877
4 Gross insurance claims X X 879 4.1 Gross claims-life insurance 880 4.2 Gross claims-freight insurance 881 4.3 Gross claims-other direct insurance 882 5 Financial intermediation services indirectly measured (FISIM)
887
6 Financial services including FISIM 888 7 Merchanting gross flows X 893 892 Audiovisual transactions 894
92 This item consists of a range of services and other transactions relating to audiovisual activities. Included are services that may be included in either audiovisual services or royalties and license fees, and also the acquisition and disposal of non-produced, non-financial assets relating to audiovisual activities, such as patents, copyrights, trademarks, and franchises.
MSITS Draft 17 November 2000
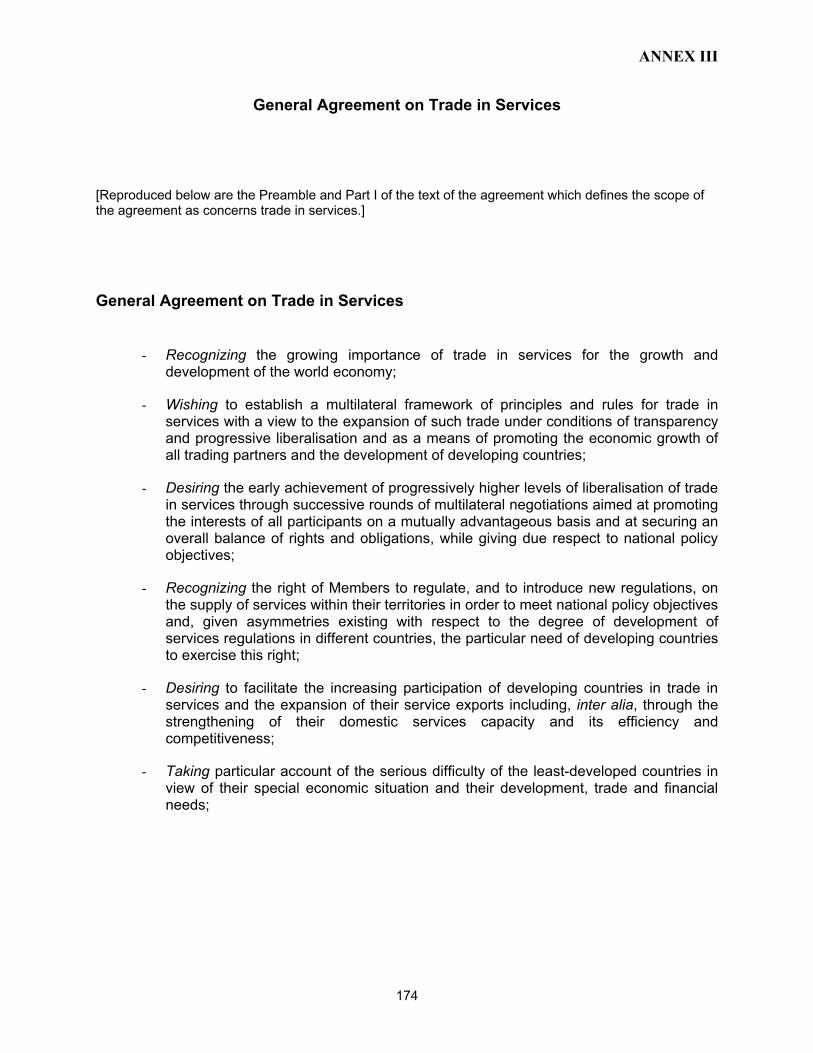
ANNEX III
174
General Agreement on Trade in Services [Reproduced below are the Preamble and Part I of the text of the agreement which defines the scope of the agreement as concerns trade in services.] General Agreement on Trade in Services
- Recognizing the growing importance of trade in services for the growth and development of the world economy;
- Wishing to establish a multilateral framework of principles and rules for trade in services with a view to the expansion of such trade under conditions of transparency and progressive liberalisation and as a means of promoting the economic growth of all trading partners and the development of developing countries;
- Desiring the early achievement of progressively higher levels of liberalisation of trade in services through successive rounds of multilateral negotiations aimed at promoting the interests of all participants on a mutually advantageous basis and at securing an overall balance of rights and obligations, while giving due respect to national policy objectives;
- Recognizing the right of Members to regulate, and to introduce new regulations, on the supply of services within their territories in order to meet national policy objectives and, given asymmetries existing with respect to the degree of development of services regulations in different countries, the particular need of developing countries to exercise this right;
- Desiring to facilitate the increasing participation of developing countries in trade in services and the expansion of their service exports including, inter alia, through the strengthening of their domestic services capacity and its efficiency and competitiveness;
- Taking particular account of the serious difficulty of the least-developed countries in view of their special economic situation and their development, trade and financial needs;
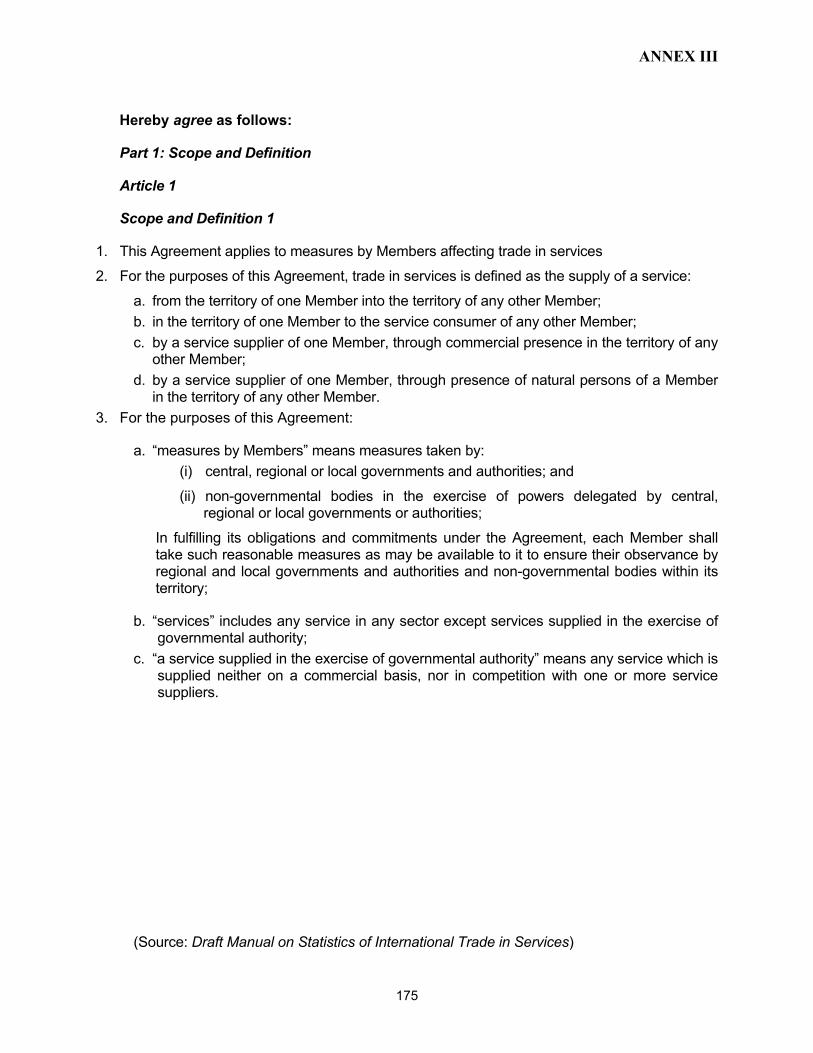
ANNEX III
175
Hereby agree as follows:
Part 1: Scope and Definition
Article 1
Scope and Definition 1
1. This Agreement applies to measures by Members affecting trade in services 2. For the purposes of this Agreement, trade in services is defined as the supply of a service:
a. from the territory of one Member into the territory of any other Member; b. in the territory of one Member to the service consumer of any other Member; c. by a service supplier of one Member, through commercial presence in the territory of any
other Member; d. by a service supplier of one Member, through presence of natural persons of a Member
in the territory of any other Member. 3. For the purposes of this Agreement:
a. “measures by Members” means measures taken by: (i) central, regional or local governments and authorities; and (ii) non-governmental bodies in the exercise of powers delegated by central,
regional or local governments or authorities; In fulfilling its obligations and commitments under the Agreement, each Member shall take such reasonable measures as may be available to it to ensure their observance by regional and local governments and authorities and non-governmental bodies within its territory;
b. “services” includes any service in any sector except services supplied in the exercise of governmental authority;
c. “a service supplied in the exercise of governmental authority” means any service which is supplied neither on a commercial basis, nor in competition with one or more service suppliers.
(Source: Draft Manual on Statistics of International Trade in Services)

ANNEX IV
176
GATS Services Sectoral Classification GNS/W/120 Sectors and sub-sectors Corresponding provisional CPC1 1. Business services A. Professional services a. Legal services 861 b. Accounting, auditing and book keeping services 862 c. Taxation services 863 d. Architectural services 8671 e. Engineering services 8672 f. Integrated engineering services 8673 g. Urban planning and landscape architectural services 8674 h. Medical and dental services 9312 i. Veterinary services 932
j. Services provided by midwives, nurses, physiotherapists and para-medical personnel 93191 k. Other B. Computer and related services a. Consultancy services related to the installation of computer hardware 841 b. Software implementation services 842 c. Data processing services 843 d. Data base services 844 e. Other 845+849 C. Research and development services a. R&D services on natural sciences 851 b. R&D services on social sciences and humanities 852 c. Interdisciplinary R&D services 853 D. Real estate services a. Involving own or leased property 821 b. On a fee or contract basis 822
1 The United Nations Statistics Division maintains a draft correspondence table between GNS/W/120, the Provisional CPC,
and CPC version 1.0, available at http://www.un.org/depts/unsd/class/class1.htm. These correspondences may be useful for statistical monitoring of trade in services agreements.
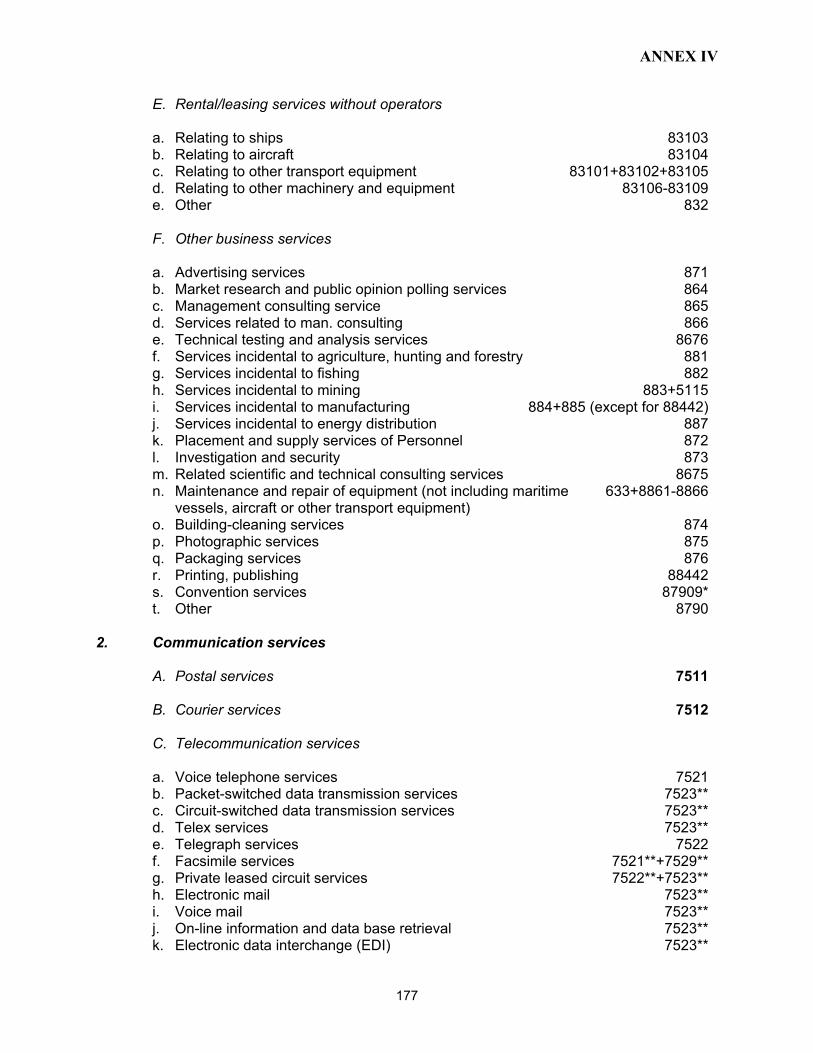
ANNEX IV
177
E. Rental/leasing services without operators a. Relating to ships 83103 b. Relating to aircraft 83104 c. Relating to other transport equipment 83101+83102+83105 d. Relating to other machinery and equipment 83106-83109 e. Other 832 F. Other business services a. Advertising services 871 b. Market research and public opinion polling services 864 c. Management consulting service 865 d. Services related to man. consulting 866 e. Technical testing and analysis services 8676 f. Services incidental to agriculture, hunting and forestry 881 g. Services incidental to fishing 882 h. Services incidental to mining 883+5115 i. Services incidental to manufacturing 884+885 (except for 88442) j. Services incidental to energy distribution 887 k. Placement and supply services of Personnel 872 l. Investigation and security 873 m. Related scientific and technical consulting services 8675 n. Maintenance and repair of equipment (not including maritime 633+8861-8866 vessels, aircraft or other transport equipment) o. Building-cleaning services 874 p. Photographic services 875 q. Packaging services 876 r. Printing, publishing 88442 s. Convention services 87909* t. Other 8790 2. Communication services A. Postal services 7511 B. Courier services 7512 C. Telecommunication services a. Voice telephone services 7521 b. Packet-switched data transmission services 7523** c. Circuit-switched data transmission services 7523** d. Telex services 7523** e. Telegraph services 7522 f. Facsimile services 7521**+7529** g. Private leased circuit services 7522**+7523** h. Electronic mail 7523** i. Voice mail 7523** j. On-line information and data base retrieval 7523** k. Electronic data interchange (EDI) 7523**
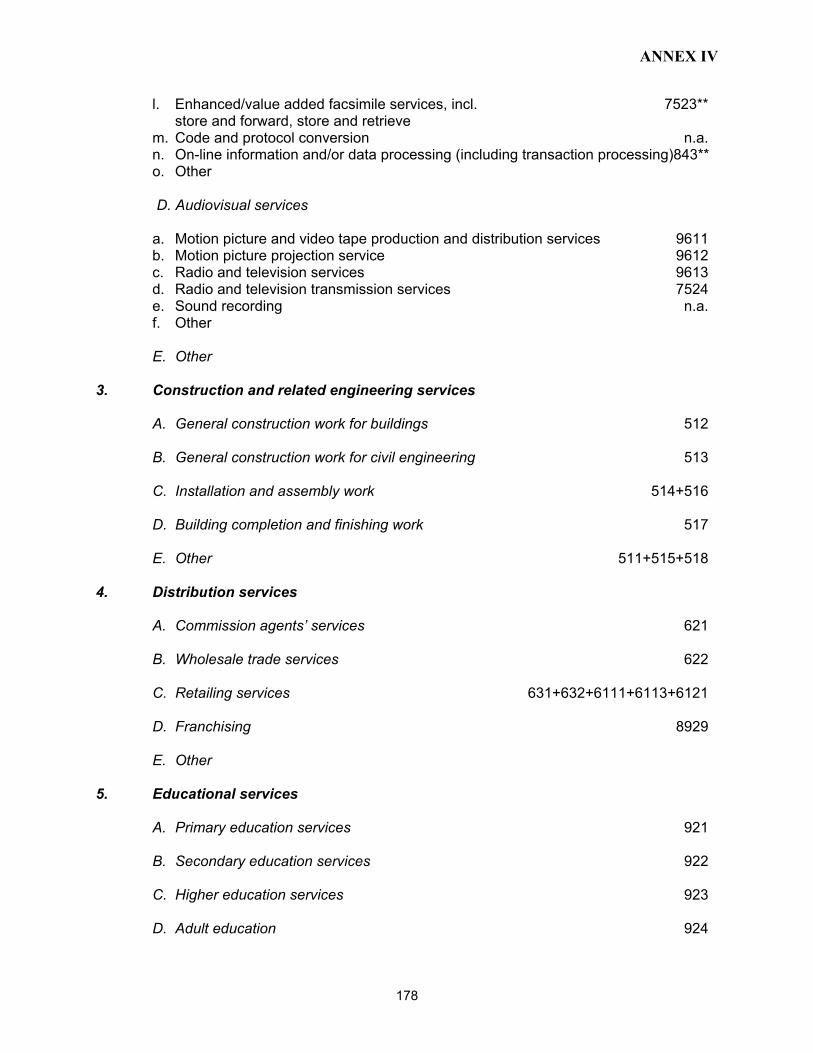
ANNEX IV
178
l. Enhanced/value added facsimile services, incl. 7523** store and forward, store and retrieve m. Code and protocol conversion n.a. n. On-line information and/or data processing (including transaction processing)843** o. Other
D. Audiovisual services
a. Motion picture and video tape production and distribution services 9611 b. Motion picture projection service 9612 c. Radio and television services 9613 d. Radio and television transmission services 7524 e. Sound recording n.a. f. Other E. Other 3. Construction and related engineering services A. General construction work for buildings 512 B. General construction work for civil engineering 513 C. Installation and assembly work 514+516 D. Building completion and finishing work 517 E. Other 511+515+518 4. Distribution services A. Commission agents’ services 621 B. Wholesale trade services 622 C. Retailing services 631+632+6111+6113+6121 D. Franchising 8929 E. Other 5. Educational services A. Primary education services 921 B. Secondary education services 922 C. Higher education services 923 D. Adult education 924

ANNEX IV
179
E. Other education services 929 6. Environmental services A. Sewage services 9401 B. Refuse disposal services 9402 C. Sanitation and similar services 9403 D. Other 7. Financial services A. All insurance and insurance-related services 812** a. Life, accident and health insurance services 8121 b. Non-life insurance services 8129 c. Reinsurance and retrocession 81299* d. Services auxiliary to insurance (including broking and agency services) 8140 B. Banking and other financial services (excluding insurance) a. Acceptance of deposits and other repayable funds from the public 81115-81119 b. Lending of all types, incl., inter alia, consumer credit, mortgage 8113 credit, factoring and financing of commercial transaction c. Financial leasing 8112 d. All payment and money transmission services 81339** e. Guarantees and commitments 81199** f. Trading for own account or for account of customers, whether on an exchange, in an over-the-counter market or otherwise, the following: - money market instruments (cheques, bills certificate of deposits, etc.) 81339** - foreign exchange 81333 - derivative products incl., but not limited to, futures and options 81339** - exchange rate and interest rate instruments, including products such 81339** as swaps, forward rate agreements, etc. - transferable securities 81321* - other negotiable instruments and financial assets, incl. bullion 81339** g. Participation in issues of all kinds of securities, incl. under-writing 8132 and placement as agent (whether publicly or privately) and provision of service related to such issues h. Money broking 81339** i. Asset management, such as cash or portfolio management, 8119+** all forms of collective investment management, pension fund 81323* management, custodial depository and trust services j. Settlement and clearing services for financial assets, incl. securities, 81339** derivative products, and other negotiable instruments or 81319**
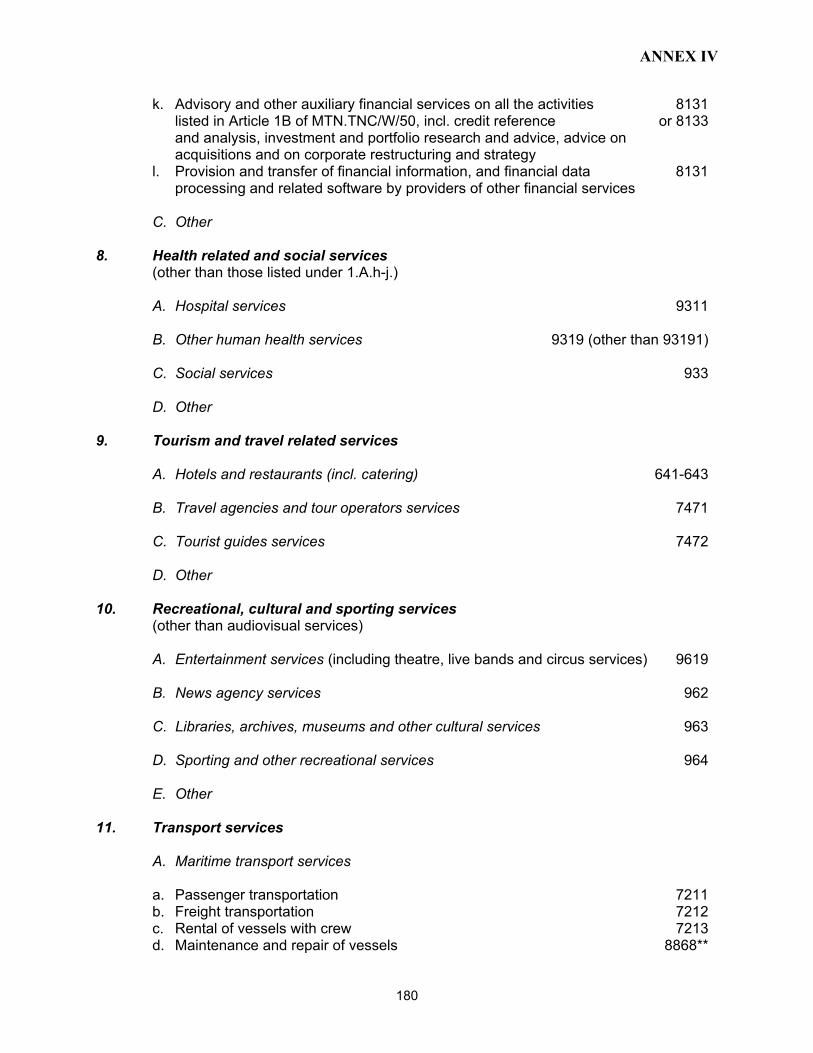
ANNEX IV
180
k. Advisory and other auxiliary financial services on all the activities 8131 listed in Article 1B of MTN.TNC/W/50, incl. credit reference or 8133 and analysis, investment and portfolio research and advice, advice on acquisitions and on corporate restructuring and strategy l. Provision and transfer of financial information, and financial data 8131 processing and related software by providers of other financial services C. Other 8. Health related and social services (other than those listed under 1.A.h-j.) A. Hospital services 9311 B. Other human health services 9319 (other than 93191) C. Social services 933 D. Other 9. Tourism and travel related services A. Hotels and restaurants (incl. catering) 641-643 B. Travel agencies and tour operators services 7471 C. Tourist guides services 7472 D. Other 10. Recreational, cultural and sporting services (other than audiovisual services) A. Entertainment services (including theatre, live bands and circus services) 9619 B. News agency services 962 C. Libraries, archives, museums and other cultural services 963 D. Sporting and other recreational services 964 E. Other 11. Transport services A. Maritime transport services a. Passenger transportation 7211 b. Freight transportation 7212 c. Rental of vessels with crew 7213 d. Maintenance and repair of vessels 8868**

ANNEX IV
181
e. Pushing and towing services 7214 f. Supporting services for maritime transport 745** B. Internal waterways transport a. Passenger transportation 7221 b. Freight transportation 7222 c. Rental of vessels with crew 7223 d. Maintenance and repair of vessels 8868** e. Pushing and towing services 7224 f. Supporting services for internal waterway transport 745** C. Air transport services a. Passenger transportation 731 b. Freight transportation 732 c. Rental of aircraft with crew 734 d. Maintenance and repair of aircraft 8868** e. Supporting services for air transport 746 D. Space transport 733 E. Rail transport services a. Passenger transportation 7111 b. Freight transportation 7112 c. Pushing and towing services 7113 d. Maintenance and repair of rail transport equipment 8868** e. Supporting services for rail transport services 743 F. Road transport services a. Passenger transportation 7121+7122 b. Freight transportation 7123 c. Rental of commercial vehicles with operator 7124 d. Maintenance and repair of road transport equipment 6112+8867 e. Supporting services for road transport services 744 G. Pipeline transport a. Transportation of fuels 7131 b. Transportation of other goods 7139 H. Services auxiliary to all modes of transport a. Cargo-handling services 741 b. Storage and warehouse services 742 c. Freight transport agency services 748 d. Other 749 I. Other transport services
ANNEX IV
182
12. Other services not included elsewhere 95+97+98+99 The (*) indicates that the service specified is a component of a more aggregated CPC item specified elsewhere in this classification list. The (**) indicates that the service specified constitutes only a part of the total range of activities covered by the CPC concordance (e.g. voice mail is only a component of CPC item 7523). Further subdivided into: (i) passenger; (ii) freight; and (iii) supporting, auxiliary and other services.
(Source: Draft Manual on Statistics of International Trade in Services)

ANNEX V
183
CPC VERSION 1.0: DETAILED STRUCTURE AND CORRESPONDENCE
(Financial Services excerpt)
Corresponding Group Class Subclass Title ISIC
SECTION 7 FINANCIAL AND RELATED SERVICES; REAL ESTATE SERVICES; AND RENTAL AND LEASING SERVICES
Division 71 FINANCIAL INTERMEDIATION, INSURANCE AND AUXILIARY SERVICES
711 Financial intermediation services, except investment banking, insurance services and pension services 7110 71100 Financial intermediation services, except investment 6511, 6519, 6591, banking, insurance services and pension services 6592
712 Investment banking services 7120 71200 Investment banking services 6599
713 Insurance and pension services (excluding reinsurance services), except compulsory social security services 7131 Life insurance and pension services (excluding reinsurance services) 71311 Life insurance and individual pension services 6601 71312 Group pension services 6602 7132 71320 Accident and health insurance services 6603 7133 Non-life insurance services (excluding reinsurance services) 71331 Motor vehicle insurance services 6603 71332 Marine, aviation, and other transport insurance services 6603 71333 Freight insurance services 6603 71334 Other property insurance services 6603 71335 General liability insurance services 6603 71336 Credit and surety insurance services 6603 71339 Other non-life insurance services 6603
714 Reinsurance services 7141 71410 Life reinsurance services 6601 7142 71420 Accident and health reinsurance services 6603 7143 71430 Other non-life reinsurance services 6603

ANNEX V
184
CPC VERSION 1.0: DETAILED STRUCTURE AND CORRESPONDENCE
(Financial Services excerpt)
Corresponding Group Class Subclass Title ISIC
715 Services auxiliary to financial intermediation other than to insurance and pensions 7151 Services related to investment banking 71511 Mergers and acquisition services 6599 71512 Corporate finance and venture capital services 6599 71519 Other services related to investment banking 6599 7152 Brokerage and related securities and commodities services 71521 Securities brokerage services 6712 71522 Commodity brokerage services 6712 71523 Processing and clearing services of securities 6712 7153 Portfolio management, trust and custody services 71531 Portfolio management services 6712 71532 Trust services 6712 71533 Custody services 6712 7154 Services related to the adminstration of financial markets 71541 Financial market operational services 6711 71542 Financial market regulatory services 6711 71549 Other financial market administration services 6711 7155 Other services auxiliary to financial intermediation 71551 Financial consultancy services 6719 71552 Foreign exchange services 6719 71553 Financial transactions processing and clearinghouse 6719 services 71559 Other services auxiliary to financial intermediation n.e.c. 6719
716 Services auxiliary to insurance and pensions 7161 71610 Insurance brokerage and agency services 6720 7162 71620 Insurance claims adjustment services 6720 7163 71630 Actuarial services 6720 7169 71690 Other services auxiliary to insurance and pensions 6720
Division 72 REAL ESTATE SERVICES 721 Real estate services involving own or leased property 7211 Renting or leasing services involving own or leased property 72111 Renting or leasing services involving own or leased 7010 residential property 72112 Renting or leasing services involving own or leased 7010 non-residential property

ANNEX V
185
CPC VERSION 1.0: DETAILED STRUCTURE AND CORRESPONDENCE (Financial Services excerpt)
Corresponding Group Class Subclass Title ISIC 7212 Trade services of buildings and associated land 72121 Trade services of residential buildings and associated land 7010 72122 Trade services of non-residential buildings and associated 7010 land 7213 72130 Trade services of vacant and subdivided land 7010
722 Real estate services on a fee or contract basis 7221 Property management services on a fee or contract basis 72211 Residential property management services on a fee or 7020 contract basis 72212 Non-residential property management services on a fee or 7020 contract basis 7222 Buildings and associated land sales on a fee or contract basis 72221 Residential buildings and associated land sales on a fee or 7020 contract basis 72222 Non-residential buildings and associated land sales on a 7020 fee or contract basis 7223 72230 Land sales on a fee or contract basis 7020
Division 73 LEASING OR RENTAL SERVICES WITHOUT OPERATOR
731 Leasing or rental services concerning machinery and equipment without operator 7311 Leasing or rental services concerning transport equipment without operator 73111 Leasing or rental services concerning cars and light vans 7111 without operator 73112 Leasing or rental services concerning goods transport 7111 motor vehicles without operator 73113 Leasing or rental services concerning railroad vehicles 7111 without operator 73114 Leasing or rental services concerning other land transport 7111 equipment without operator 73115 Leasing or rental services concerning vessels without 7112 operator 73116 Leasing or rental services concerning aircraft without 7113 operator 73117 Leasing or rental services of containers 7111 7312 Leasing or rental services concerning other machinery and equipment without operator 73121 Leasing or rental services concerning agricultural 7121 machinery and equipment without operator 73122 Leasing or rental services concerning construction 7122 machinery and equipment without operator
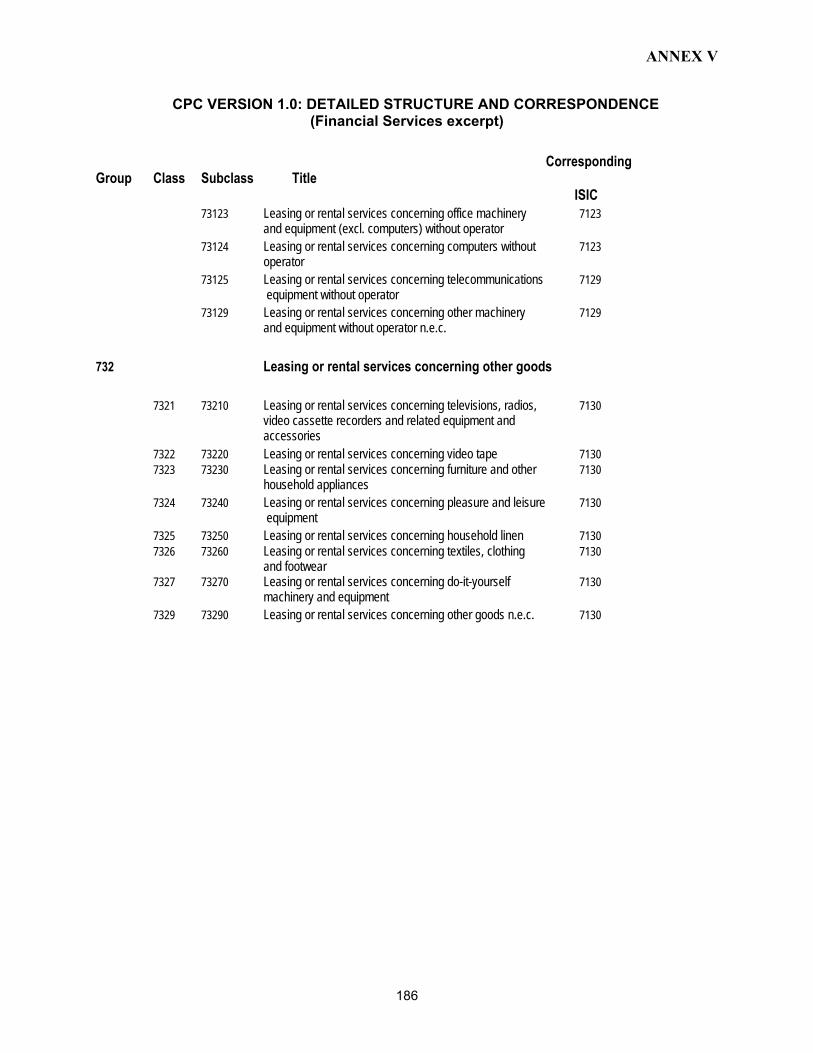
ANNEX V
186
CPC VERSION 1.0: DETAILED STRUCTURE AND CORRESPONDENCE (Financial Services excerpt)
Corresponding Group Class Subclass Title ISIC 73123 Leasing or rental services concerning office machinery 7123 and equipment (excl. computers) without operator 73124 Leasing or rental services concerning computers without 7123 operator 73125 Leasing or rental services concerning telecommunications 7129 equipment without operator 73129 Leasing or rental services concerning other machinery 7129 and equipment without operator n.e.c.
732 Leasing or rental services concerning other goods
7321 73210 Leasing or rental services concerning televisions, radios, 7130 video cassette recorders and related equipment and accessories 7322 73220 Leasing or rental services concerning video tape 7130 7323 73230 Leasing or rental services concerning furniture and other 7130 household appliances 7324 73240 Leasing or rental services concerning pleasure and leisure 7130 equipment 7325 73250 Leasing or rental services concerning household linen 7130 7326 73260 Leasing or rental services concerning textiles, clothing 7130 and footwear 7327 73270 Leasing or rental services concerning do-it-yourself 7130 machinery and equipment 7329 73290 Leasing or rental services concerning other goods n.e.c. 7130
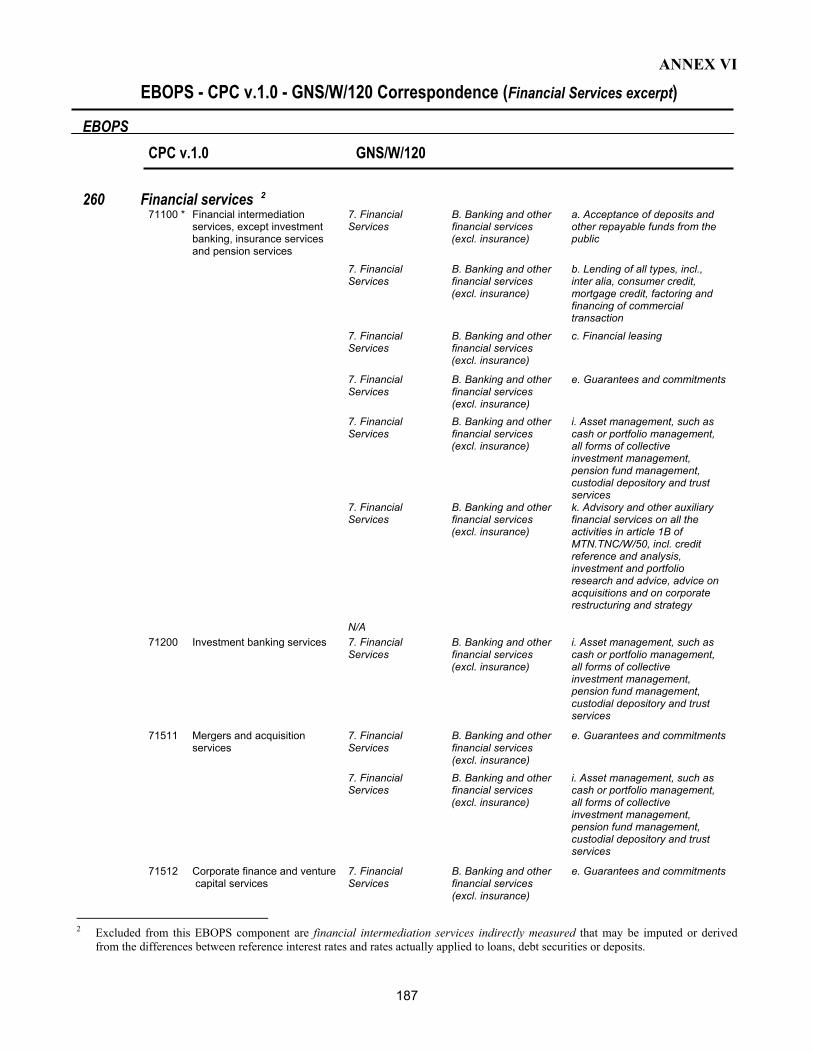
ANNEX VI
EBOPS - CPC v.1.0 - GNS/W/120 Correspondence (Financial Services excerpt) EBOPS CPC v.1.0 GNS/W/120
187
260 Financial services 2 71100 * Financial intermediation 7. Financial B. Banking and other a. Acceptance of deposits and services, except investment Services financial services other repayable funds from the banking, insurance services (excl. insurance) public and pension services 7. Financial B. Banking and other b. Lending of all types, incl., Services financial services inter alia, consumer credit, (excl. insurance) mortgage credit, factoring and financing of commercial transaction
7. Financial B. Banking and other c. Financial leasing Services financial services (excl. insurance) 7. Financial B. Banking and other e. Guarantees and commitments Services financial services (excl. insurance) 7. Financial B. Banking and other i. Asset management, such as Services financial services cash or portfolio management, (excl. insurance) all forms of collective investment management, pension fund management, custodial depository and trust services 7. Financial B. Banking and other k. Advisory and other auxiliary Services financial services financial services on all the (excl. insurance) activities in article 1B of MTN.TNC/W/50, incl. credit reference and analysis, investment and portfolio research and advice, advice on acquisitions and on corporate restructuring and strategy
N/A 71200 Investment banking services 7. Financial B. Banking and other i. Asset management, such as Services financial services cash or portfolio management, (excl. insurance) all forms of collective investment management, pension fund management, custodial depository and trust services 71511 Mergers and acquisition 7. Financial B. Banking and other e. Guarantees and commitments services Services financial services (excl. insurance) 7. Financial B. Banking and other i. Asset management, such as Services financial services cash or portfolio management, (excl. insurance) all forms of collective investment management, pension fund management, custodial depository and trust services 71512 Corporate finance and venture 7. Financial B. Banking and other e. Guarantees and commitments capital services Services financial services (excl. insurance)
2 Excluded from this EBOPS component are financial intermediation services indirectly measured that may be imputed or derived
from the differences between reference interest rates and rates actually applied to loans, debt securities or deposits.
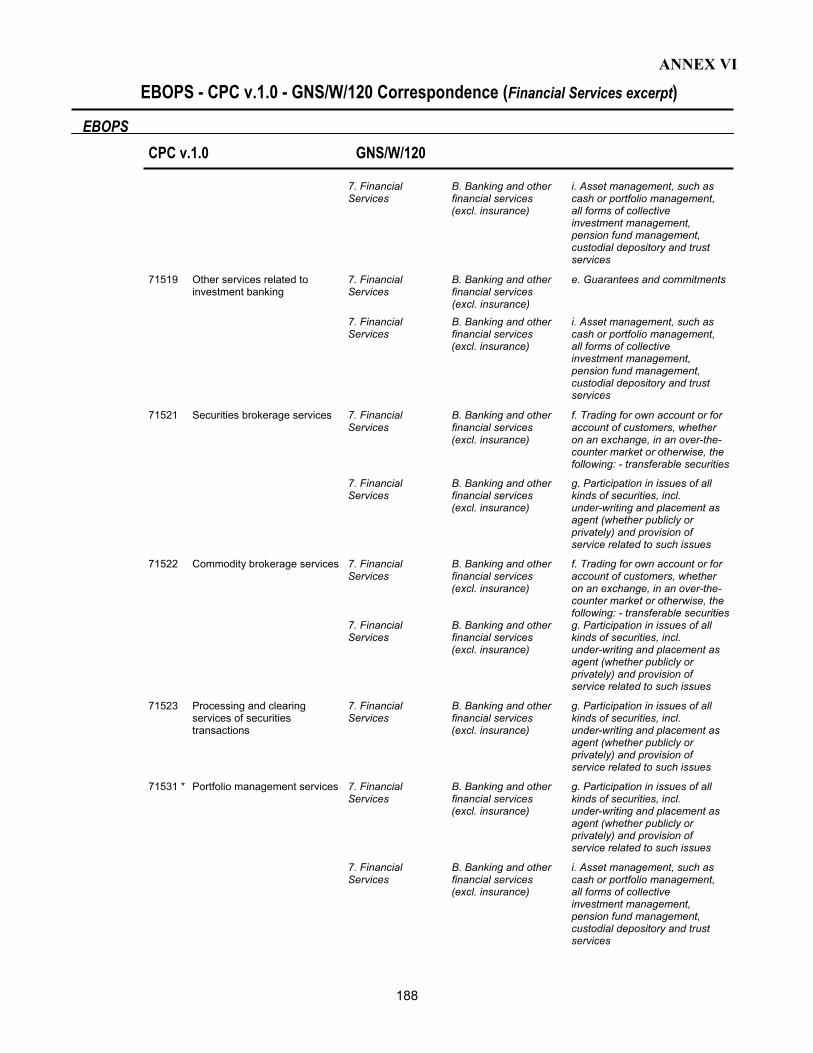
ANNEX VI
EBOPS - CPC v.1.0 - GNS/W/120 Correspondence (Financial Services excerpt) EBOPS CPC v.1.0 GNS/W/120
188
7. Financial B. Banking and other i. Asset management, such as Services financial services cash or portfolio management, (excl. insurance) all forms of collective investment management, pension fund management, custodial depository and trust services 71519 Other services related to 7. Financial B. Banking and other e. Guarantees and commitments investment banking Services financial services (excl. insurance) 7. Financial B. Banking and other i. Asset management, such as Services financial services cash or portfolio management, (excl. insurance) all forms of collective investment management, pension fund management, custodial depository and trust services 71521 Securities brokerage services 7. Financial B. Banking and other f. Trading for own account or for Services financial services account of customers, whether (excl. insurance) on an exchange, in an over-the- counter market or otherwise, the following: - transferable securities 7. Financial B. Banking and other g. Participation in issues of all Services financial services kinds of securities, incl. (excl. insurance) under-writing and placement as agent (whether publicly or privately) and provision of service related to such issues 71522 Commodity brokerage services 7. Financial B. Banking and other f. Trading for own account or for Services financial services account of customers, whether (excl. insurance) on an exchange, in an over-the- counter market or otherwise, the following: - transferable securities 7. Financial B. Banking and other g. Participation in issues of all Services financial services kinds of securities, incl. (excl. insurance) under-writing and placement as agent (whether publicly or privately) and provision of service related to such issues 71523 Processing and clearing 7. Financial B. Banking and other g. Participation in issues of all services of securities Services financial services kinds of securities, incl. transactions (excl. insurance) under-writing and placement as agent (whether publicly or privately) and provision of service related to such issues 71531 * Portfolio management services 7. Financial B. Banking and other g. Participation in issues of all Services financial services kinds of securities, incl. (excl. insurance) under-writing and placement as agent (whether publicly or privately) and provision of service related to such issues 7. Financial B. Banking and other i. Asset management, such as Services financial services cash or portfolio management, (excl. insurance) all forms of collective investment management, pension fund management, custodial depository and trust services
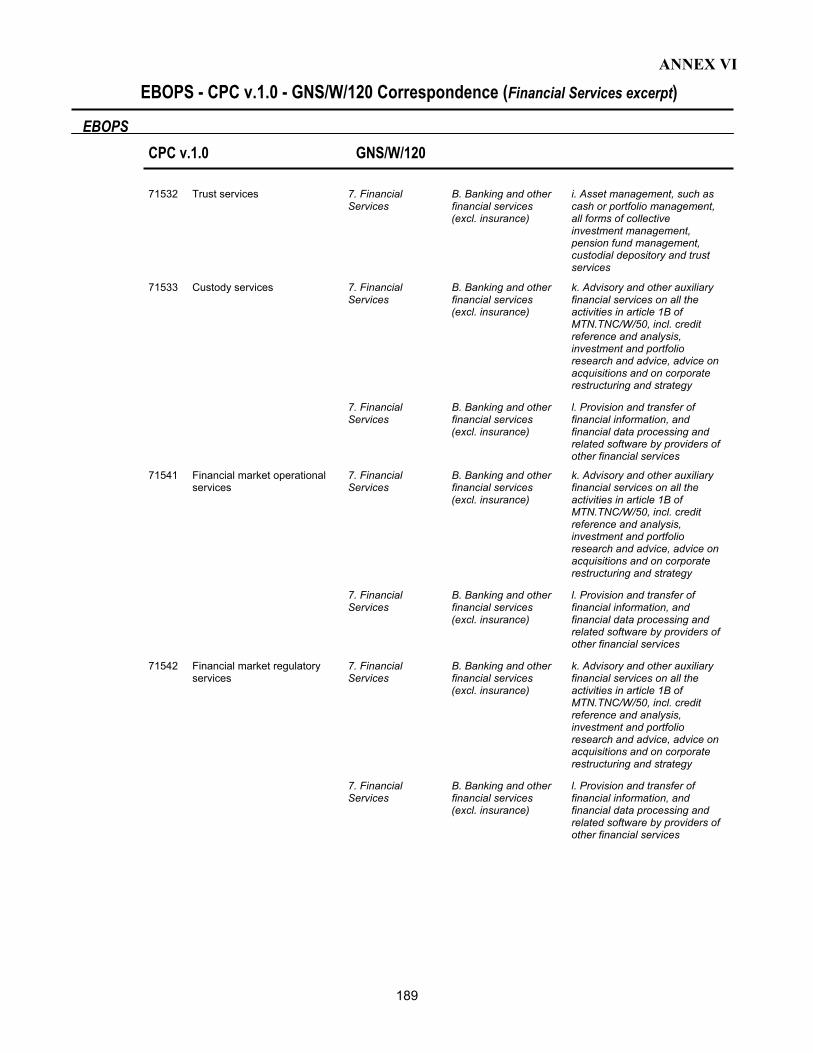
ANNEX VI
EBOPS - CPC v.1.0 - GNS/W/120 Correspondence (Financial Services excerpt) EBOPS CPC v.1.0 GNS/W/120
189
71532 Trust services 7. Financial B. Banking and other i. Asset management, such as Services financial services cash or portfolio management, (excl. insurance) all forms of collective investment management, pension fund management, custodial depository and trust services
71533 Custody services 7. Financial B. Banking and other k. Advisory and other auxiliary Services financial services financial services on all the (excl. insurance) activities in article 1B of MTN.TNC/W/50, incl. credit reference and analysis, investment and portfolio research and advice, advice on acquisitions and on corporate restructuring and strategy
7. Financial B. Banking and other l. Provision and transfer of Services financial services financial information, and (excl. insurance) financial data processing and related software by providers of other financial services 71541 Financial market operational 7. Financial B. Banking and other k. Advisory and other auxiliary services Services financial services financial services on all the (excl. insurance) activities in article 1B of MTN.TNC/W/50, incl. credit reference and analysis, investment and portfolio research and advice, advice on acquisitions and on corporate restructuring and strategy
7. Financial B. Banking and other l. Provision and transfer of Services financial services financial information, and (excl. insurance) financial data processing and related software by providers of other financial services
71542 Financial market regulatory 7. Financial B. Banking and other k. Advisory and other auxiliary services Services financial services financial services on all the (excl. insurance) activities in article 1B of MTN.TNC/W/50, incl. credit reference and analysis, investment and portfolio research and advice, advice on acquisitions and on corporate restructuring and strategy
7. Financial B. Banking and other l. Provision and transfer of Services financial services financial information, and (excl. insurance) financial data processing and related software by providers of other financial services

ANNEX VI
EBOPS - CPC v.1.0 - GNS/W/120 Correspondence (Financial Services excerpt) EBOPS CPC v.1.0 GNS/W/120
190
71549 Other financial market 7. Financial B. Banking and other k. Advisory and other auxiliary administration services Services financial services financial services on all the (excl. insurance) activities in article 1B of MTN.TNC/W/50, incl. credit reference and analysis, investment and portfolio research and advice, advice on acquisitions and on corporate restructuring and strategy
7. Financial B. Banking and other k. Advisory and other auxiliary Services financial services financial services on all the (excl. insurance) activities in article 1B of MTN.TNC/W/50, incl. credit reference and analysis, investment and portfolio research and advice, advice on acquisitions and on corporate restructuring and strategy 71551 Financial consultancy services 7. Financial B. Banking and other k. Advisory and other auxiliary Services financial services financial services on all the (excl. insurance) activities in article 1B of MTN.TNC/W/50, incl. credit reference and analysis, investment and portfolio research and advice, advice on acquisitions and on corporate restructuring and strategy
71552 Foreign exchange services 7. Financial B. Banking and other f. Trading for own account or for Services financial services account of customers, whether (excl. insurance) on an exchange, in an over-the- counter market or otherwise, the following: - foreign exchange 7. Financial B. Banking and other k. Advisory and other auxiliary Services financial services financial services on all the (excl. insurance) activities in article 1B of MTN.TNC/W/50, incl. credit reference and analysis, investment and portfolio research and advice, advice on acquisitions and on corporate restructuring and strategy
71553 Financial transactions 7. Financial B. Banking and other d. All payment and money processing and clearinghouse Services financial services transmission services services (excl. insurance) 7. Financial B. Banking and other f. Trading for own account or for Services financial services account of customers, whether (excl. insurance) on an exchange, in an over-the- counter market or otherwise, the
following: - money market instruments (cheques, bills, certificate of deposits, etc.),
- derivative products incl., but not limited to, futures and options, - exchange rate and interest rate instruments, including products such as swaps, forward rate
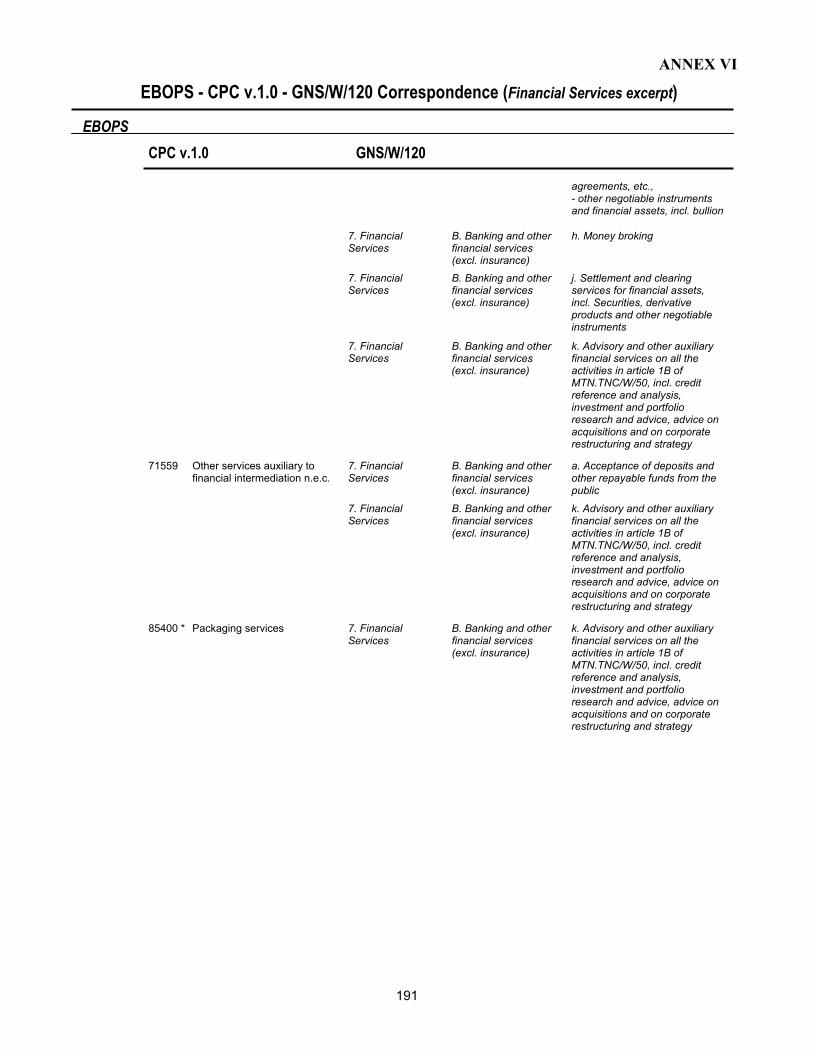
ANNEX VI
EBOPS - CPC v.1.0 - GNS/W/120 Correspondence (Financial Services excerpt) EBOPS CPC v.1.0 GNS/W/120
191
agreements, etc., - other negotiable instruments
and financial assets, incl. bullion
7. Financial B. Banking and other h. Money broking Services financial services (excl. insurance) 7. Financial B. Banking and other j. Settlement and clearing Services financial services services for financial assets, (excl. insurance) incl. Securities, derivative products and other negotiable instruments 7. Financial B. Banking and other k. Advisory and other auxiliary Services financial services financial services on all the (excl. insurance) activities in article 1B of MTN.TNC/W/50, incl. credit reference and analysis, investment and portfolio research and advice, advice on acquisitions and on corporate restructuring and strategy
71559 Other services auxiliary to 7. Financial B. Banking and other a. Acceptance of deposits and financial intermediation n.e.c. Services financial services other repayable funds from the (excl. insurance) public 7. Financial B. Banking and other k. Advisory and other auxiliary Services financial services financial services on all the (excl. insurance) activities in article 1B of MTN.TNC/W/50, incl. credit reference and analysis, investment and portfolio research and advice, advice on acquisitions and on corporate restructuring and strategy
85400 * Packaging services 7. Financial B. Banking and other k. Advisory and other auxiliary Services financial services financial services on all the (excl. insurance) activities in article 1B of MTN.TNC/W/50, incl. credit reference and analysis, investment and portfolio research and advice, advice on acquisitions and on corporate restructuring and strategy
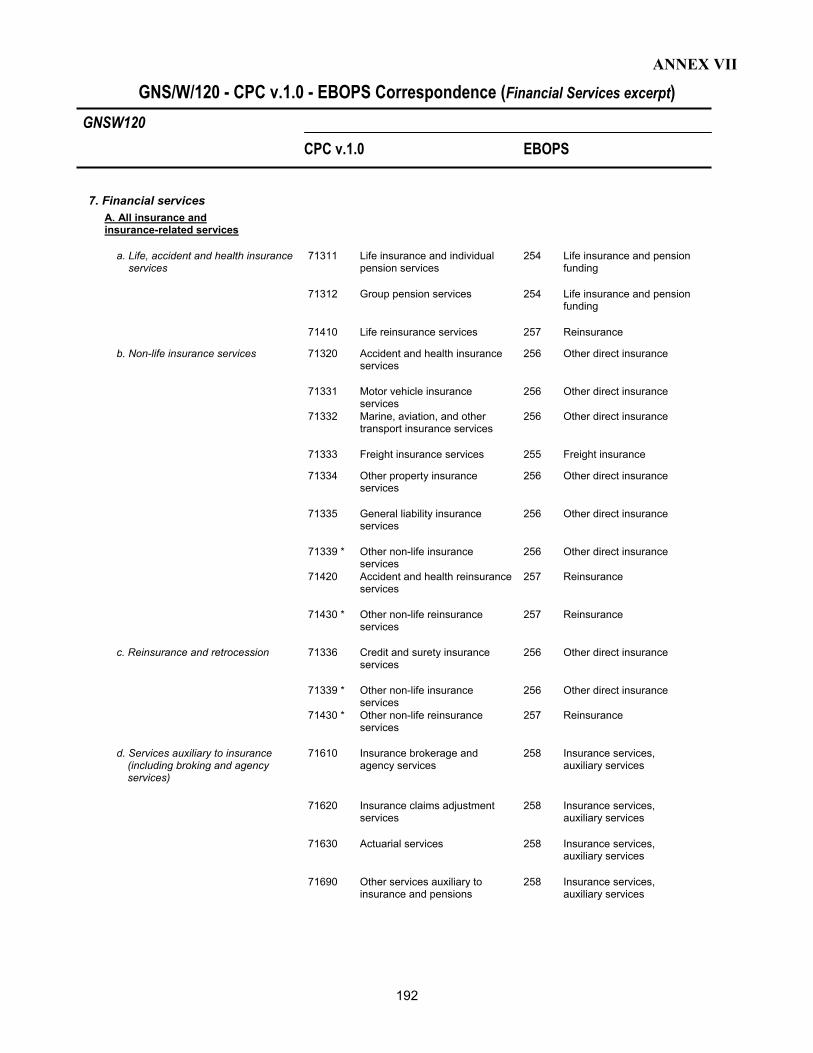
ANNEX VII
GNS/W/120 - CPC v.1.0 - EBOPS Correspondence (Financial Services excerpt) GNSW120 CPC v.1.0 EBOPS
192
7. Financial services A. All insurance and insurance-related services
a. Life, accident and health insurance 71311 Life insurance and individual 254 Life insurance and pension services pension services funding
71312 Group pension services 254 Life insurance and pension funding
71410 Life reinsurance services 257 Reinsurance
b. Non-life insurance services 71320 Accident and health insurance 256 Other direct insurance services
71331 Motor vehicle insurance 256 Other direct insurance services 71332 Marine, aviation, and other 256 Other direct insurance transport insurance services
71333 Freight insurance services 255 Freight insurance 71334 Other property insurance 256 Other direct insurance services
71335 General liability insurance 256 Other direct insurance services
71339 * Other non-life insurance 256 Other direct insurance services 71420 Accident and health reinsurance 257 Reinsurance services
71430 * Other non-life reinsurance 257 Reinsurance services
c. Reinsurance and retrocession 71336 Credit and surety insurance 256 Other direct insurance services
71339 * Other non-life insurance 256 Other direct insurance services 71430 * Other non-life reinsurance 257 Reinsurance services
d. Services auxiliary to insurance 71610 Insurance brokerage and 258 Insurance services, (including broking and agency agency services auxiliary services services)
71620 Insurance claims adjustment 258 Insurance services, services auxiliary services
71630 Actuarial services 258 Insurance services, auxiliary services
71690 Other services auxiliary to 258 Insurance services, insurance and pensions auxiliary services
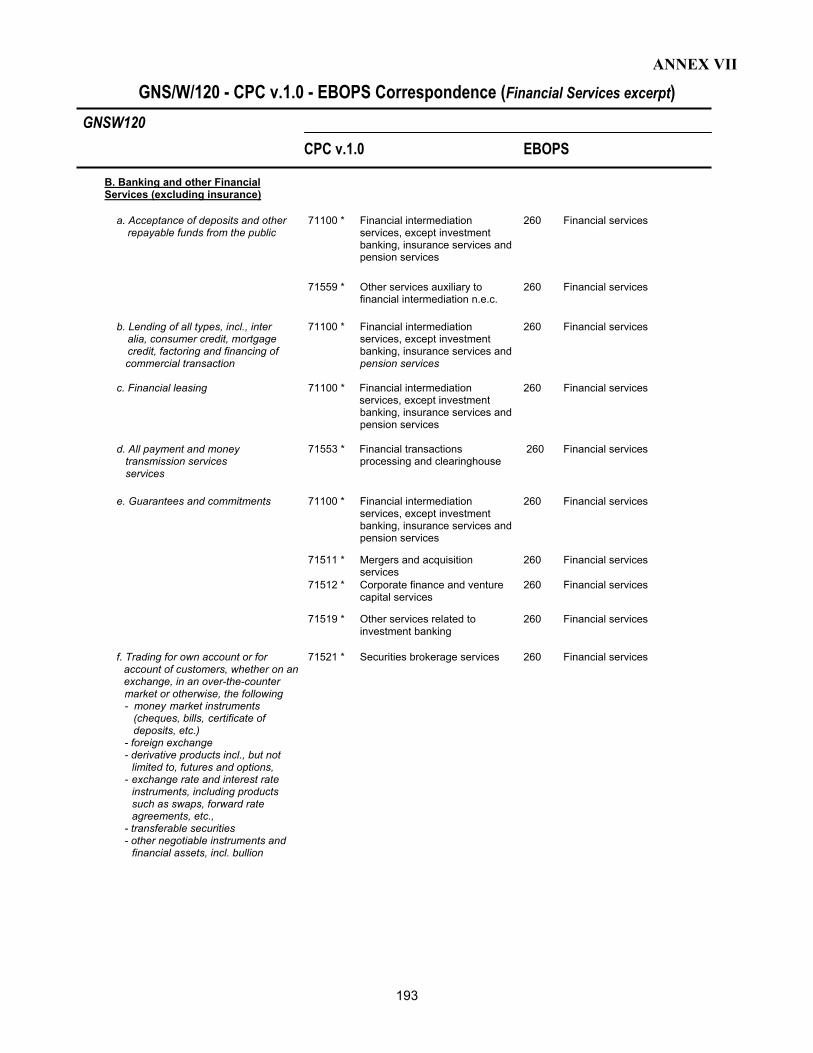
ANNEX VII
GNS/W/120 - CPC v.1.0 - EBOPS Correspondence (Financial Services excerpt) GNSW120 CPC v.1.0 EBOPS
193
B. Banking and other Financial Services (excluding insurance)
a. Acceptance of deposits and other 71100 * Financial intermediation 260 Financial services repayable funds from the public services, except investment banking, insurance services and pension services
71559 * Other services auxiliary to 260 Financial services financial intermediation n.e.c. b. Lending of all types, incl., inter 71100 * Financial intermediation 260 Financial services alia, consumer credit, mortgage services, except investment credit, factoring and financing of banking, insurance services and commercial transaction pension services c. Financial leasing 71100 * Financial intermediation 260 Financial services services, except investment banking, insurance services and pension services d. All payment and money 71553 * Financial transactions 260 Financial services transmission services processing and clearinghouse services
e. Guarantees and commitments 71100 * Financial intermediation 260 Financial services services, except investment banking, insurance services and pension services
71511 * Mergers and acquisition 260 Financial services services 71512 * Corporate finance and venture 260 Financial services capital services
71519 * Other services related to 260 Financial services investment banking
f. Trading for own account or for 71521 * Securities brokerage services 260 Financial services account of customers, whether on an exchange, in an over-the-counter
market or otherwise, the following - money market instruments (cheques, bills, certificate of deposits, etc.)
- foreign exchange - derivative products incl., but not limited to, futures and options, - exchange rate and interest rate instruments, including products such as swaps, forward rate agreements, etc., - transferable securities - other negotiable instruments and financial assets, incl. bullion

ANNEX VII
GNS/W/120 - CPC v.1.0 - EBOPS Correspondence (Financial Services excerpt) GNSW120 CPC v.1.0 EBOPS
194
71522 * Commodity brokerage services 260 Financial services 71552 * Foreign exchange services 260 Financial services
71553 * Financial transactions 260 Financial services processing and clearinghouse services
g. Participation in issues of all kinds 71521 * Securities brokerage services 260 Financial services of securities, incl. under-writing and placement as agent (whether publicly or privately) and provision of service related to such issues 71522 * Commodity brokerage services 260 Financial services 71523 Processing and clearing 260 Financial services services of securities transactions 71531 * Portfolio management services 254 Life insurance and pension funding
256 Other direct insurance
260 Financial services h. Money broking 71553 * Financial transactions 260 Financial services processing and clearinghouse services
i. Asset management, such as cash 71100 * Financial intermediation 260 Financial services or portfolio management, all forms of services, except investment collective investment management, banking, insurance services and pension fund management, custodial pension services depository and trust services 71200 Investment banking services 260 Financial services 71511 * Mergers and acquisition 260 Financial services services 71512 * Corporate finance and venture 260 Financial services capital services
71519 * Other services related to 260 Financial services investment banking
71531 * Portfolio management services 254 Life insurance and pension funding
256 Other direct insurance
260 Financial services
71532 Trust services 260 Financial services
j. Settlement and clearing services for 71553 * Financial transactions 260 Financial services financial assets, incl. securities, processing and clearinghouse derivative products, and other services negotiable instruments
k. Advisory and other auxiliary 71100 * Financial intermediation 260 Financial services financial services on all the activities services, except investment in article 1B of MTN.TNC/W/50, incl. banking, insurance services and credit reference and analysis, pension services investment and portfolio research and advice, advice on acquisitions and
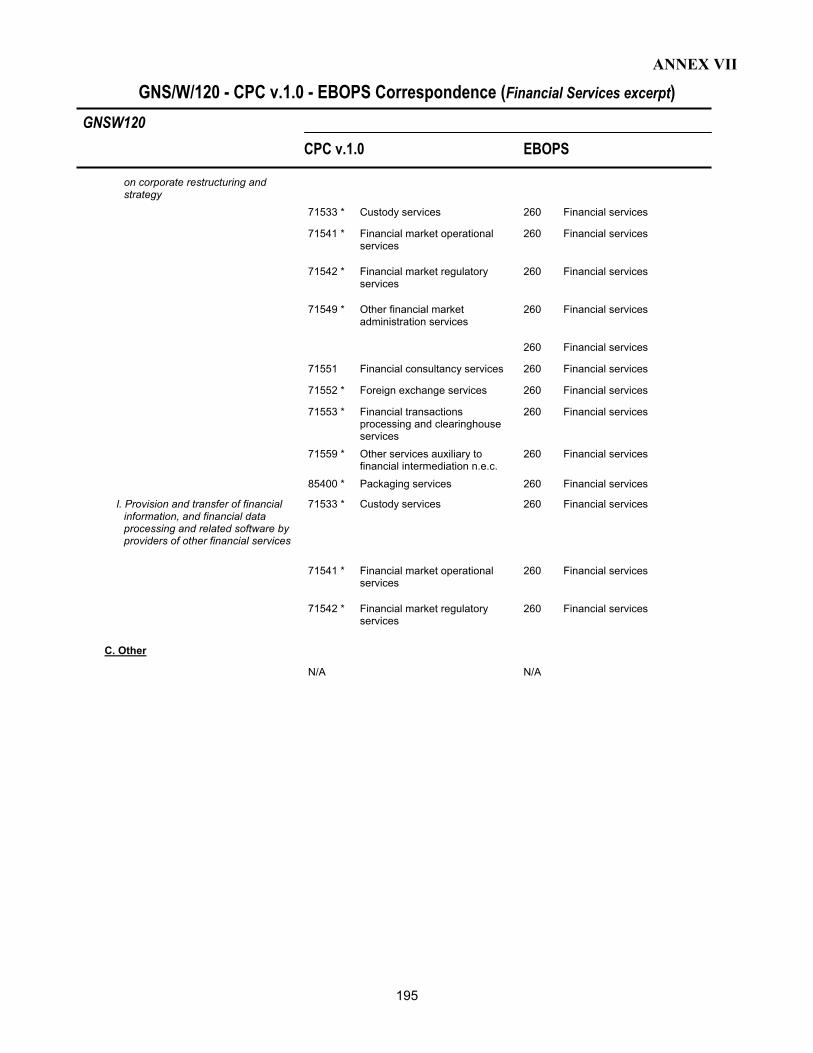
ANNEX VII
GNS/W/120 - CPC v.1.0 - EBOPS Correspondence (Financial Services excerpt) GNSW120 CPC v.1.0 EBOPS
195
on corporate restructuring and strategy 71533 * Custody services 260 Financial services 71541 * Financial market operational 260 Financial services services
71542 * Financial market regulatory 260 Financial services services
71549 * Other financial market 260 Financial services administration services
260 Financial services
71551 Financial consultancy services 260 Financial services
71552 * Foreign exchange services 260 Financial services
71553 * Financial transactions 260 Financial services processing and clearinghouse services 71559 * Other services auxiliary to 260 Financial services financial intermediation n.e.c. 85400 * Packaging services 260 Financial services l. Provision and transfer of financial 71533 * Custody services 260 Financial services information, and financial data processing and related software by providers of other financial services
71541 * Financial market operational 260 Financial services services
71542 * Financial market regulatory 260 Financial services services
C. Other N/A N/A
ANNEX VIII
196
The Manual and Tourism Satellite Accounts 1. This Annex briefly outlines the nature and purpose of the Tourism Satellite Account: Methodological
References (TSA), which has been jointly developed by Eurostat, OECD, the United Nations, and the World Tourism Organization and describes the relationship between the travel component of the EBOPS classification included in this Manual and the concept of tourism as included in the TSA. It also discusses breakdowns of tourism expenditure and their potential relevance to trade agreements. In the context of this Manual, the TSA, provides an alternative potential source of data that might be used to estimate a more detailed breakdown of travel services as defined in Chapter III herein.
Tourism Satellite Account: An overview
2. This section, which draws from the introduction to the TSA, provides a brief overview of the nature and
purpose of a tourism satellite account, which is much broader than any measurement of international tourism that may be derived from the balance of payments.
3. Tourism has grown substantially over the last quarter of a century as an economic and social phenomenon.
However, statistical information on the nature, progress, and consequences of tourism has often been based on arrivals and overnight stay statistics as well as other balance of payments information that do not fully capture the whole economic phenomenon of tourism. Consequently, governments, businesses, and citizens may not receive the accurate information necessary for effective public policies and efficient business operations. The TSA states that information on the role tourism plays in national economies throughout the world is deficient, and more credible data concerning the scale and significance of tourism is needed.
4. In the past, the description of tourism focused on the characteristics of visitors, the conditions in which they
travelled and stayed, the purpose of visit, and so forth. Now there is an increasing awareness of the role that tourism is playing and can play, directly, indirectly, or through induced effects in the economy in terms of generation of value added, employment, personal income, and government income. This awareness has led to the development of techniques for measuring tourism’s economic impact. These developments have now been pulled together in the internationally comparable framework of the TSA.
5. The 1993 SNA provides concepts, definitions, classifications, accounting rules, accounts, and tables to
present a comprehensive, integrated framework for the estimation of production, consumption, capital investment, income, stocks, flows of financial and non-financial wealth, and other related economic variables.
6. Within this framework, a detailed analysis of a specific type of demand such as that related to tourism can
be presented in an interface with the supply of these goods and services within an economy. 7. The TSA focuses on the concept of the visitor and on measuring his or her demand for goods and services.
However, visitor consumption is not restricted to a set of predefined goods and services produced by a predefined set of industries. What makes tourism special is not so much what is acquired, but the temporary situation in which the consumer finds him- or herself: the visitor is outside his or her usual environment, and this is the characteristic that identifies a visitor as different from any other consumer. This characteristic of the visitor cannot be found within the central framework of National Accounts, where the transactors are classified according to (relatively) permanent characteristics, one of them being the country or place of residence.
8. To deal with such situations, the 1993 SNA105 suggests the use of a Satellite Account that is annexed to the
core of the System of National Accounts and that to a greater or lesser extent shares with this core system its basic concepts, definitions, and classifications.
105 SNA 1993, Chapter XXI “Satellite analysis and accounts.”
ANNEX VIII
197
9. As a consequence, the fundamental structure of the TSA is based on the general balance existing within an economy between demand of goods and services generated by tourism and their supply. The demand generated by tourism encompasses a great variety of goods and services, where transportation, accommodation, and food services play a major role. The idea behind the construction of the TSA is to analyse in detail all the aspects of demand for goods and services that might be associated with tourism within the economy, to observe the operational interface with the supply of such goods and services within the same economy of reference, and to describe how this supply interacts with other economic activities.
10. A complete tourism satellite account for a country will provide:
a. macroeconomic aggregates to describe the size and the economic importance of tourism, such as tourism value added and tourism GDP, consistent with similar aggregates for the total economy and for other productive activities and functional areas of interest;
b. detailed data on visitor consumption and how this consumption is met by domestic supply and
imports, integrated within tables derived from general supply and use tables of the national accounts, at both current and constant prices;
c. detailed production accounts of the tourism industries including data on employment, linkages with
other productive economic activities, and capital formation;
d. basic information required for the development of models of the economic impact of tourism (at the national and supranational levels), for the preparation, for example, of tourism market oriented analysis; and
e. a link between economic data and other non-monetary information on tourism, such as number of
trips, duration of the stay, purpose of the trip, or modes of transport. 11. The TSA is to be seen from two different perspectives:
• as a new statistical tool including concepts, definitions, aggregates, classifications, and tables compatible with international national accounting guidelines, which will allow for valid comparisons between regions, countries, or groups of countries, and also make these estimates comparable with other internationally recognised macroeconomic aggregates and compilations; and
• as a building process to guide countries in the development of their own system of tourism statistics,
the main objective being the completion of a national tourism satellite account, which could be viewed as a synthesis of such a system.
The relationship between travel in the EBOPS and tourism in the TSA 12. In this Manual (and in BPM5), the travel component covers those transactions that take place between
residents and non-residents of an economy in relation to travel. A traveller is a person who stays for less than one year in an economy of which that person is not a resident for any purpose other than (i) being stationed on a military base or being an employee (including diplomats and other embassy and consulate personnel) of an agency of his or her government, or (ii) being an accompanying dependent of an individual mentioned under (i). This one-year guideline does not apply to students or to patients receiving health care abroad, who remain residents of their economies of origin even if the length of stay in another economy is greater than one year.
13. The TSA identifies tourism as “the activities of persons travelling to and staying in places outside their usual
environment for not more than one consecutive year for leisure, business, and other purposes not related to the exercise of an activity remunerated from within the place visited,” where usual environment generally “corresponds to the geographical boundaries within which an individual displaces himself/herself within his/her regular routine of life, except for leisure and recreation.” Similarly, a visitor is “any person travelling to

ANNEX VIII
198
a place other than of his/her usual environment for less than twelve months and whose main purpose of trip is other than the exercise of an activity remunerated from within the place visited.” Visitors are further classified in two ways:
a. either tourists, who stay for at least one night in the place visited, or same-day visitors, who visit a
place for less than one day; and b. either international visitors, whose country of residence is different from the country visited, or
domestic visitors, whose country of residence is the country visited. 14. For comparison with the concepts of travel and traveller as used in this Manual, the focus is on international
visitors. The TSA definitions exclude military personnel on active duty and diplomats and their entourages in the same way as does this Manual. The areas where this Manual differs from the TSA definitions are the following:
a. The TSA regards students and medical patients in the same way as other visitors. In contrast BPM5
and this Manual regard them as residents of their home economies, even when they are in another country for one year or more.
b. The TSA excludes from the definition of visitors all individuals who move to another economy primarily
for the purpose of earning income, whereas this Manual recommends that the “one year guideline” be followed––that is, if an individual moves to another economy for less than one year, then that individual is regarded as a traveller, regardless of the purpose of the travel. Thus, while this Manual includes the expenditure of border and seasonal workers in travel, the TSA excludes such individuals from their definition of visitor.
Breakdowns of tourism expenditure and the GATS
15. An information need of trade negotiators and trade policy makers concerns the identification and
quantification of product breakdowns of trade in services. Insofar as implementation of the TSA identifies product breakdowns of tourist expenditure-particularly a breakdown between expenditure on goods and expenditure on services, with a further, more detailed breakdown of expenditure on services beyond what is available from EBOPS memorandum items-then that is relevant information.
16. Annex 1 of the TSA lists tourism characteristic products and tourism connected products in terms of the
CPC. These are defined as follows:
• Tourism characteristic products : “those, which, in most countries, it is considered, would cease to exist in meaningful quantity or those for which the level of consumption would be significantly reduced in the absence of visitors, and for which statistical information seems possible to obtain.”
• Tourism connected products : “a residual category including those that have been identified as tourism specific in a given country, but for which this attribute has not been acknowledged on a worldwide basis.”
Tourism specific products are the sum of the above two categories.
(Source: Draft Manual on Statistics of International Trade in Services)
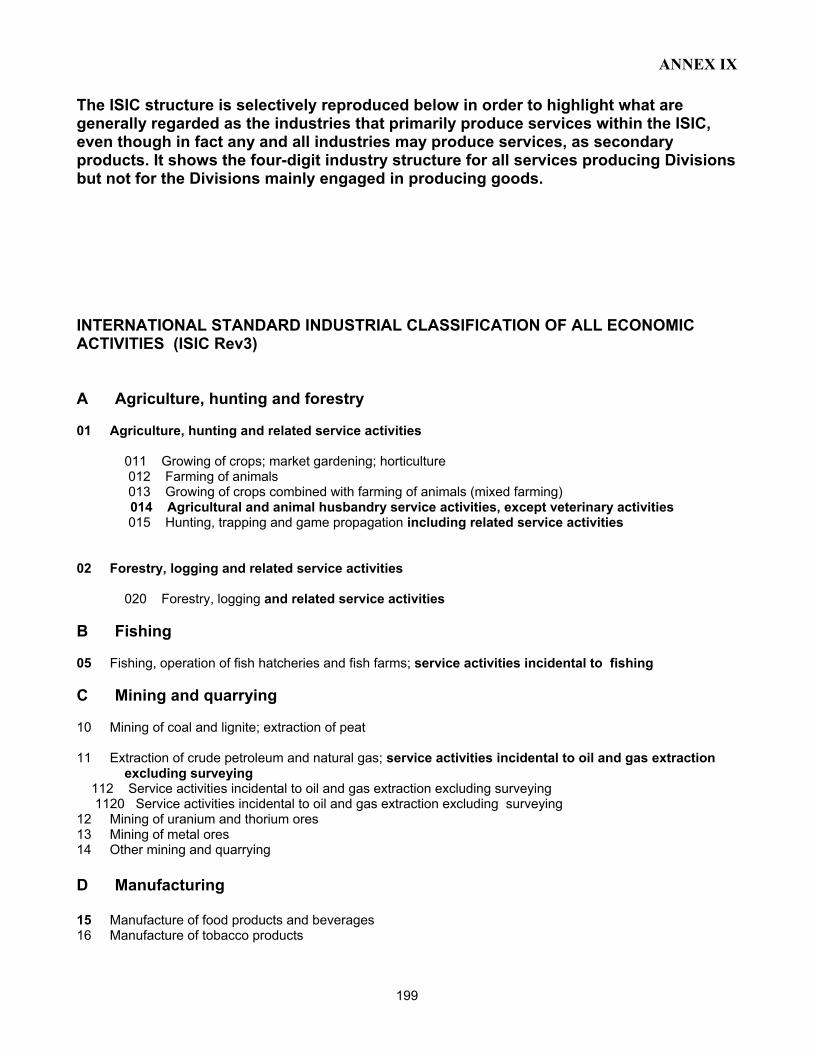
ANNEX IX
199
The ISIC structure is selectively reproduced below in order to highlight what are generally regarded as the industries that primarily produce services within the ISIC, even though in fact any and all industries may produce services, as secondary products. It shows the four-digit industry structure for all services producing Divisions but not for the Divisions mainly engaged in producing goods. INTERNATIONAL STANDARD INDUSTRIAL CLASSIFICATION OF ALL ECONOMIC ACTIVITIES (ISIC Rev3) A Agriculture, hunting and forestry 01 Agriculture, hunting and related service activities
011 Growing of crops; market gardening; horticulture 012 Farming of animals 013 Growing of crops combined with farming of animals (mixed farming)
014 Agricultural and animal husbandry service activities, except veterinary activities 015 Hunting, trapping and game propagation including related service activities 02 Forestry, logging and related service activities 020 Forestry, logging and related service activities B Fishing 05 Fishing, operation of fish hatcheries and fish farms; service activities incidental to fishing C Mining and quarrying 10 Mining of coal and lignite; extraction of peat 11 Extraction of crude petroleum and natural gas; service activities incidental to oil and gas extraction
excluding surveying 112 Service activities incidental to oil and gas extraction excluding surveying 1120 Service activities incidental to oil and gas extraction excluding surveying 12 Mining of uranium and thorium ores 13 Mining of metal ores 14 Other mining and quarrying D Manufacturing 15 Manufacture of food products and beverages 16 Manufacture of tobacco products

ANNEX IX
200
17 Manufacture of textiles 18 Manufacture of wearing apparel; dressing and dyeing of fur 19 Tanning and dressing of leather; manufacture of luggage, handbags, saddlery, harness and footwear 20 Manufacture of wood and of products of wood and cork, except furniture; manufacture of articles of straw
and plaiting materials 21 Manufacture of paper and paper products 22 Publishing, printing and reproduction of recorded media 23 Manufacture of coke, refined petroleum products and nuclear fuel 24 Manufacture of chemicals and chemical products 25 Manufacture of rubber and plastics products 26 Manufacture of other non-metallic mineral products 27 Manufacture of basic metals 28 Manufacture of fabricated metal products, except machinery and equipment 29 Manufacture of machinery and equipment n.e.c. 30 Manufacture of office, accounting and computing machinery 31 Manufacture of electrical machinery and apparatus n.e.c. 32 Manufacture of radio, television and communication equipment and apparatus 33 Manufacture of medical, precision and optical instruments, watches and clocks 34 Manufacture of motor vehicles, trailers and semi-trailers 35 Manufacture of other transport equipment 36 Manufacture of furniture; manufacturing n.e.c. 37 Recycling E Electricity, gas and water supply 40 Electricity, gas, steam and hot water supply 41 Collection, purification and distribution of water F Construction 45 Construction 451 Site preparation 4510 Site preparation 452 Building of complete constructions or parts thereof; civil engineering 4520 Building of complete constructions or parts thereof; civil engineering 453 Building installation 4530 Building installation 454 Building completion 4540 Building completion 455 Renting of construction or demolition equipment with operator 4550 Renting of construction or demolition equipment with operator G Wholesale and retail trade; repair of motor vehicles, motorcycles and personal
and household goods 50 Sale, maintenance and repair of motor vehicles and motorcycles; retail sale of automotive fuel 501 Sale of motor vehicles 5010 Sale of motor vehicles 502 Maintenance and repair of motor vehicles 5020 Maintenance and repair of motor vehicles 503 Sale of motor vehicle parts and accessories 5030 Sale of motor vehicle parts and accessories 504 Sale, maintenance and repair of motorcycles and related parts and accessories 5040 Sale, maintenance and repair of motorcycles and related parts and accessories 505 Retail sale of automotive fuel

ANNEX IX
201
5050 Retail sale of automotive fuel 51 Wholesale trade and commission trade, except of motor vehicles and motorcycles 511 Wholesale on a fee or contract basis 5110 Wholesale on a fee or contract basis 512 Wholesale of agricultural raw materials, live animals, food, beverages and tobacco 5121 Wholesale of agricultural raw materials and live animals 5122 Wholesale of food, beverages and tobacco 513 Wholesale of household goods 5131 Wholesale of textiles, clothing and footwear 5139 Wholesale of other household goods 514 Wholesale of non-agricultural intermediate products, waste and scrap 5141 Wholesale of solid, liquid and gaseous fuels and related products 5142 Wholesale of metals and metal ores 5143 Wholesale of construction materials, hardware, plumbing and heating equipment and supplies 5149 Wholesale of other intermediate products, waste and scrap 515 Wholesale of machinery, equipment and supplies 5150 Wholesale of machinery, equipment and supplies 519 Other wholesale 5190 Other wholesale 52 Retail trade, except of motor vehicles and motorcycles; repair of personal and household goods 521 Non-specialized retail trade in stores 5211 Retail sale in non-specialized stores with food, beverages or tobacco predominating 5219 Other retail sale in non-specialized stores 522 Retail sale of food, beverages and tobacco in specialized stores 5220 Retail sale of food, beverages and tobacco in specialized stores 523 Other retail trade of new goods in specialized stores 5231 Retail sale of pharmaceutical and medical goods, cosmetic and toilet articles 5232 Retail sale of textiles, clothing, footwear and leather goods 5233 Retail sale of household appliances, articles and equipment 5234 Retail sale of hardware, paint and glass 5239 Other retail sale in specialized stores 524 Retail sale of second-hand goods in stores 5240 Retail sale of second-hand goods in stores 525 Retail trade not in stores 5251 Retail sale via mail order houses 5252 Retail sale via stalls and markets 5259 Other non-store retail sale 526 Repair of personal and household goods 5260 Repair of personal and household goods H Hotels and restaurants 55 Hotels and restaurants 551 Hotels; camping sites and other provision of short-stay accommodation 5510 Hotels; camping sites and other provision of short-stay accommodation 552 Restaurants, bars and canteens 5520 Restaurants, bars and canteens I Transport, storage and communications 60 Land transport; transport via pipelines 601 Transport via railways 6010 Transport via railways 602 Other land transport 6021 Other scheduled passenger land transport
ANNEX IX
202
6022 Other non-scheduled passenger land transport 6023 Freight transport by road 603 Transport via pipelines 6030 Transport via pipelines 61 Water transport 611 Sea and coastal water transport 6110 Sea and coastal water transport 612 Inland water transport 6120 Inland water transport 62 Air transport 621 Scheduled air transport 6210 Scheduled air transport 622 Non-scheduled air transport 6220 Non-scheduled air transport 63 Supporting and auxiliary transport activities; activities of travel agencies 630 Supporting and auxiliary transport activities; activities of travel agencies 6301 Cargo handling 6302 Storage and warehousing 6303 Other supporting transport activities 6304 Activities of travel agencies and tour operators; tourist assistance activities n.e.c. 6309 Activities of other transport agencies 64 Post and telecommunications 641 Post and courier activities 6411 National post activities 6412 Courier activities other than national post activities 642 Telecommunications 6420 Telecommunications J Financial intermediation 65 Financial intermediation, except insurance and pension funding 651 Monetary intermediation 6511 Central banking 6519 Other monetary intermediation 659 Other financial intermediation 6591 Financial leasing 6592 Other credit granting 6599 Other financial intermediation n.e.c. 66 Insurance and pension funding, except compulsory social security 660 Insurance and pension funding, except compulsory social security 6601 Life insurance 6602 Pension funding 6603 Non-life insurance 67 Activities auxiliary to financial intermediation 671 Activities auxiliary to financial intermediation, except insurance and pension funding 6711 Administration of financial markets 6712 Security dealing activities 6719 Activities auxiliary to financial intermediation n.e.c. 672 Activities auxiliary to insurance and pension funding 6720 Activities auxiliary to insurance and pension funding K Real estate, renting and business activities 70 Real estate activities 701 Real estate activities with own or leased property

ANNEX IX
203
7010 Real estate activities with own or leased property 702 Real estate activities on a fee or contract basis 7020 Real estate activities on a fee or contract basis 71 Renting of machinery and equipment without operator and of personal and household goods 711 Renting of transport equipment 7111 Renting of land transport equipment 7112 Renting of water transport equipment 7113 Renting of air transport equipment 712 Renting of other machinery and equipment 7121 Renting of agricultural machinery and equipment 7122 Renting of construction and civil engineering machinery and equipment 7123 Renting of office machinery and equipment (including computers) 7129 Renting of other machinery and equipment n.e.c. 713 Renting of personal and household goods n.e.c. 7130 Renting of personal and household goods n.e.c. 72 Computer and related activities 721 Hardware consultancy 7210 Hardware consultancy 722 Software consultancy and supply 7220 Software consultancy and supply 723 Data processing 7230 Data processing 724 Data base activities 7240 Data base activities 725 Maintenance and repair of office, accounting and computing machinery 7250 Maintenance and repair of office, accounting and computing machinery 729 Other computer related activities 7290 Other computer related activities 73 Research and development 731 Research and experimental development on natural sciences and engineering (NSE) 7310 Research and experimental development on natural sciences and engineering (NSE) 732 Research and experimental development on social sciences and humanities (SSH) 7320 Research and experimental development on social sciences and humanities (SSH) 74 Other business activities 741 Legal, accounting, book-keeping and auditing activities; tax consultancy; market research and public
opinion polling; business and management consultancy 7411 Legal activities 7412 Accounting, book-keeping and auditing activities; tax consultancy 7413 Market research and public opinion polling 7414 Business and management consultancy activities 742 Architectural, engineering and other technical activities 7421 Architectural and engineering activities and related technical consultancy 7422 Technical testing and analysis 743 Advertising 7430 Advertising 749 Business activities n.e.c. 7491 Labour recruitment and provision of personnel 7492 Investigation and security activities 7493 Building-cleaning activities 7494 Photographic activities 7495 Packaging activities 7499 Other business activities n.e.c.

ANNEX IX
204
L Public administration and defence; compulsory social security 75 Public administration and defence; compulsory social security 751 Administration of the State and the economic and social policy of the community 7511 General (Over-all) public service activities 7512 Regulation of the activities of agencies that provide health care, education, cultural services and other
social services excluding social security 7513 Regulation of and contribution to more efficient operation of business 7514 Ancillary service activities for the government as a whole 752 Provision of services to the community as a whole 7521 Foreign affairs 7522 Defence activities 7523 Public order and safety activities 753 Compulsory social security activities 7530 Compulsory social security activities M Education 80 Education 801 Primary education 8010 Primary education 802 Secondary education 8021 General secondary education 8022 Technical and vocational secondary education 803 Higher education 8030 Higher education 809 Adult and other education 8090 Adult and other education N Health and social work 85 Health and social work 851 Human health activities 8511 Hospital activities 8512 Medical and dental practice activities 8519 Other human health activities 852 Veterinary activities 8520 Veterinary activities 853 Social work activities 8531 Social work with accommodation 8532 Social work without accommodation O Other community, social and personal service activities 90 Sewage and refuse disposal, sanitation and similar activities 900 Sewage and refuse disposal, sanitation and similar activities 9000 Sewage and refuse disposal, sanitation and similar activities 91 Activities of membership organizations n.e.c. 911 Activities of business, employers and professional organizations 9111 Activities of business and employers organizations 9112 Activities of professional organizations 912 Activities of trade unions 9120 Activities of trade unions 919 Activities of other membership organizations 9191 Activities of religious organizations 9192 Activities of political organizations
ANNEX IX
205
9199 Activities of other membership organizations n.e.c. 92 Recreational, cultural and sporting activities 921 Motion picture, radio, television and other entertainment activities 9211 Motion picture and video production and distribution 9212 Motion picture projection 9213 Radio and television activities 9214 Dramatic arts, music and other arts activities 9219 Other entertainment activities n.e.c. 922 News agency activities 9220 News agency activities 923 Library, archives, museums and other cultural activities 9231 Library and archives activities 9232 Museums activities and preservation of historical sites and buildings 9233 Botanical and zoological gardens and nature reserves activities 924 Sporting and other recreational activities 9241 Sporting activities 9249 Other recreational activities 93 Other service activities 930 Other service activities 9301 Washing, and (dry-) cleaning of textile and fur products 9302 Hairdressing and other beauty treatment 9303 Funeral and related activities 9309 Other service activities n.e.c. P Private households with employed persons 95 Private households with employed persons 950 Private households with employed persons 9500 Private households with employed persons Q Extra-territorial organizations and bodies 99 Extra-territorial organizations and bodies 990 Extra-territorial organizations and bodies
9900 Extra-territorial organizations and bodies
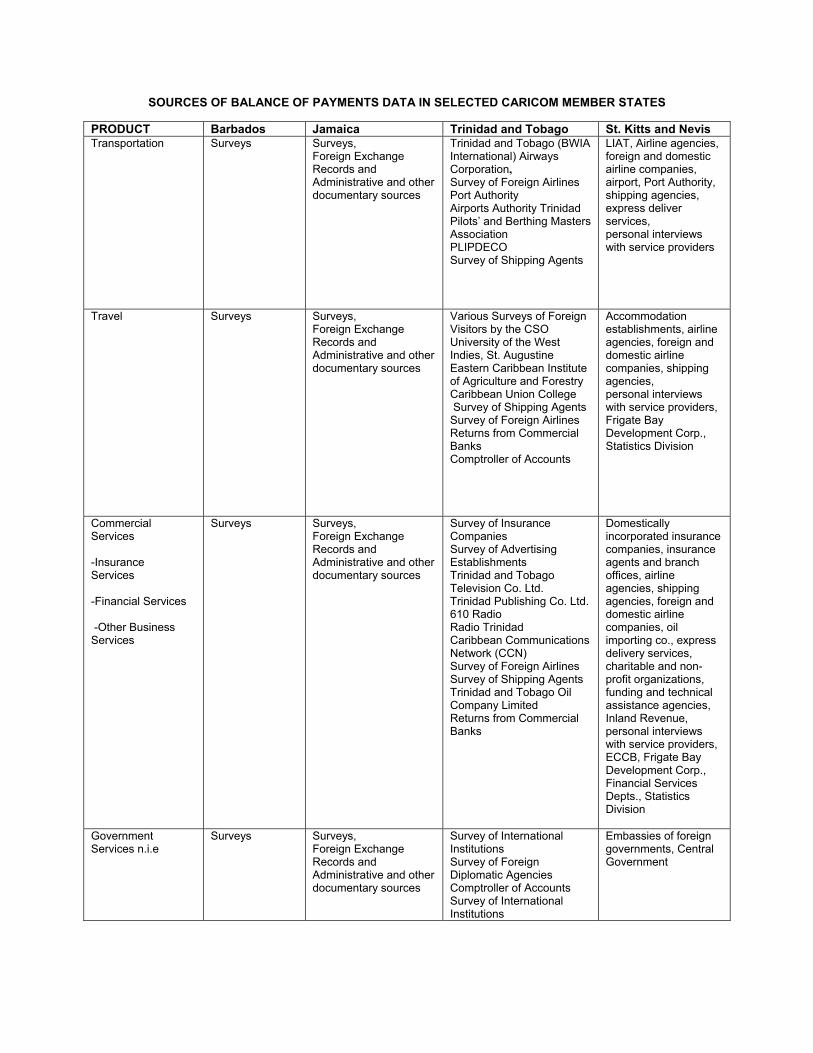
SOURCES OF BALANCE OF PAYMENTS DATA IN SELECTED CARICOM MEMBER STATES
PRODUCT Barbados Jamaica Trinidad and Tobago St. Kitts and Nevis Transportation Surveys Surveys,
Foreign Exchange Records and Administrative and other documentary sources
Trinidad and Tobago (BWIA International) Airways Corporation, Survey of Foreign Airlines Port Authority Airports Authority Trinidad Pilots’ and Berthing Masters Association PLIPDECO Survey of Shipping Agents
LIAT, Airline agencies, foreign and domestic airline companies, airport, Port Authority, shipping agencies, express deliver services, personal interviews with service providers
Travel Surveys Surveys, Foreign Exchange Records and Administrative and other documentary sources
Various Surveys of Foreign Visitors by the CSO University of the West Indies, St. Augustine Eastern Caribbean Institute of Agriculture and Forestry Caribbean Union College Survey of Shipping Agents Survey of Foreign Airlines Returns from Commercial Banks Comptroller of Accounts
Accommodation establishments, airline agencies, foreign and domestic airline companies, shipping agencies, personal interviews with service providers, Frigate Bay Development Corp., Statistics Division
Commercial Services -Insurance Services -Financial Services -Other Business Services
Surveys Surveys, Foreign Exchange Records and Administrative and other documentary sources
Survey of Insurance Companies Survey of Advertising Establishments Trinidad and Tobago Television Co. Ltd. Trinidad Publishing Co. Ltd. 610 Radio Radio Trinidad Caribbean Communications Network (CCN) Survey of Foreign Airlines Survey of Shipping Agents Trinidad and Tobago Oil Company Limited Returns from Commercial Banks
Domestically incorporated insurance companies, insurance agents and branch offices, airline agencies, shipping agencies, foreign and domestic airline companies, oil importing co., express delivery services, charitable and non-profit organizations, funding and technical assistance agencies, Inland Revenue, personal interviews with service providers, ECCB, Frigate Bay Development Corp., Financial Services Depts., Statistics Division
Government Services n.i.e
Surveys Surveys, Foreign Exchange Records and Administrative and other documentary sources
Survey of International Institutions Survey of Foreign Diplomatic Agencies Comptroller of Accounts Survey of International Institutions
Embassies of foreign governments, Central Government

CARICOM
Regional Statistics Sub-ProgrammeCaribbean Community (CARICOM) Secretariat
Related Documents