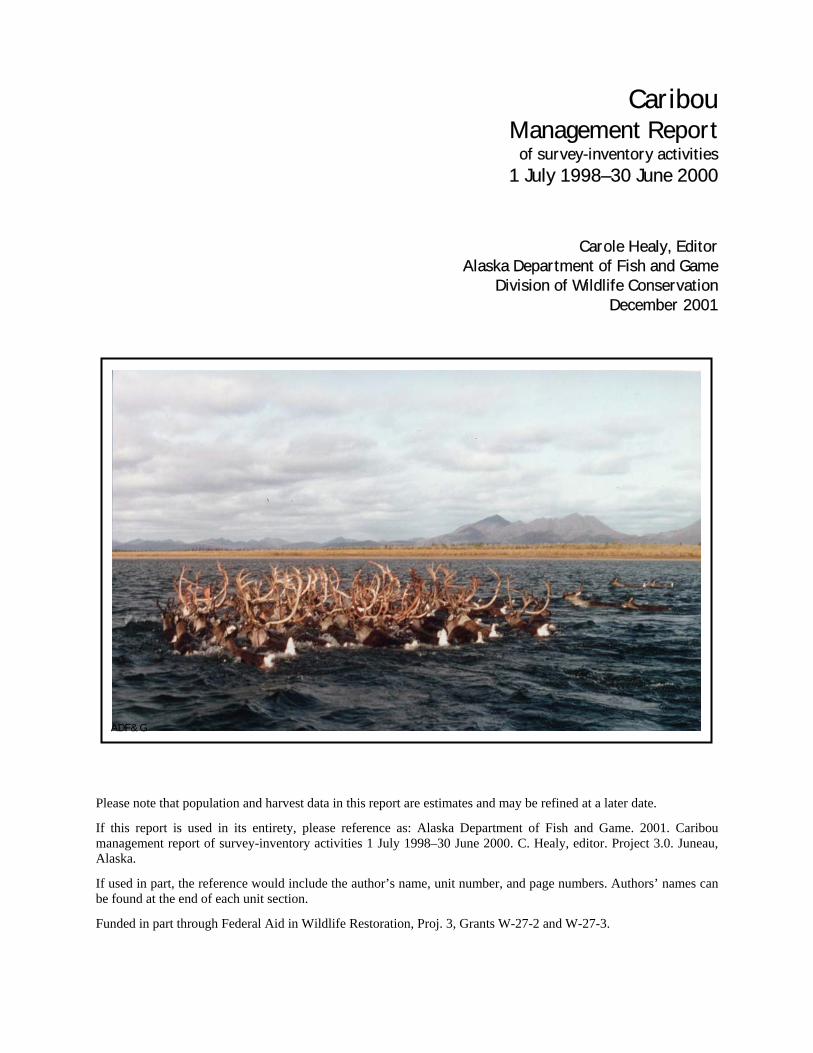
Caribou Management Report of survey-inventory activities 1 July 1998–30 June 2000 Carole Healy, Editor Alaska Department of Fish and Game Division of Wildlife Conservation December 2001 Please note that population and harvest data in this report are estimates and may be refined at a later date. If this report is used in its entirety, please reference as: Alaska Department of Fish and Game. 2001. Caribou management report of survey-inventory activities 1 July 1998–30 June 2000. C. Healy, editor. Project 3.0. Juneau, Alaska. If used in part, the reference would include the author’s name, unit number, and page numbers. Authors’ names can be found at the end of each unit section. Funded in part through Federal Aid in Wildlife Restoration, Proj. 3, Grants W-27-2 and W-27-3. ADF&G

Welcome message from author
This document is posted to help you gain knowledge. Please leave a comment to let me know what you think about it! Share it to your friends and learn new things together.
Transcript
Caribou Management Report
of survey-inventory activities 1 July 1998–30 June 2000
Carole Healy, Editor
Alaska Department of Fish and Game Division of Wildlife Conservation
December 2001
Please note that population and harvest data in this report are estimates and may be refined at a later date.
If this report is used in its entirety, please reference as: Alaska Department of Fish and Game. 2001. Caribou management report of survey-inventory activities 1 July 1998–30 June 2000. C. Healy, editor. Project 3.0. Juneau, Alaska.
If used in part, the reference would include the author’s name, unit number, and page numbers. Authors’ names can be found at the end of each unit section.
Funded in part through Federal Aid in Wildlife Restoration, Proj. 3, Grants W-27-2 and W-27-3.
ADF&G

Alaska’s Game Management Units Caribou Herds in Alaska

SPECIES Alaska Department of Fish and GameDivision of Wildlife Conservation
MANAGEMENT REPORT (907) 465-4190 PO BOX 25526 JUNEAU, AK 99802-5526
1
CARIBOU MANAGEMENT REPORT
From: 1 July 1998 To: 30 June 2000
LOCATION
GAME MANAGEMENT UNITS: 7 and 15 (8,397 mi2)
HERDS: Kenai Mountains, Kenai Lowlands, Killey River, Twin Lakes and Fox River
GEOGRAPHIC DESCRIPTION: Kenai Peninsula
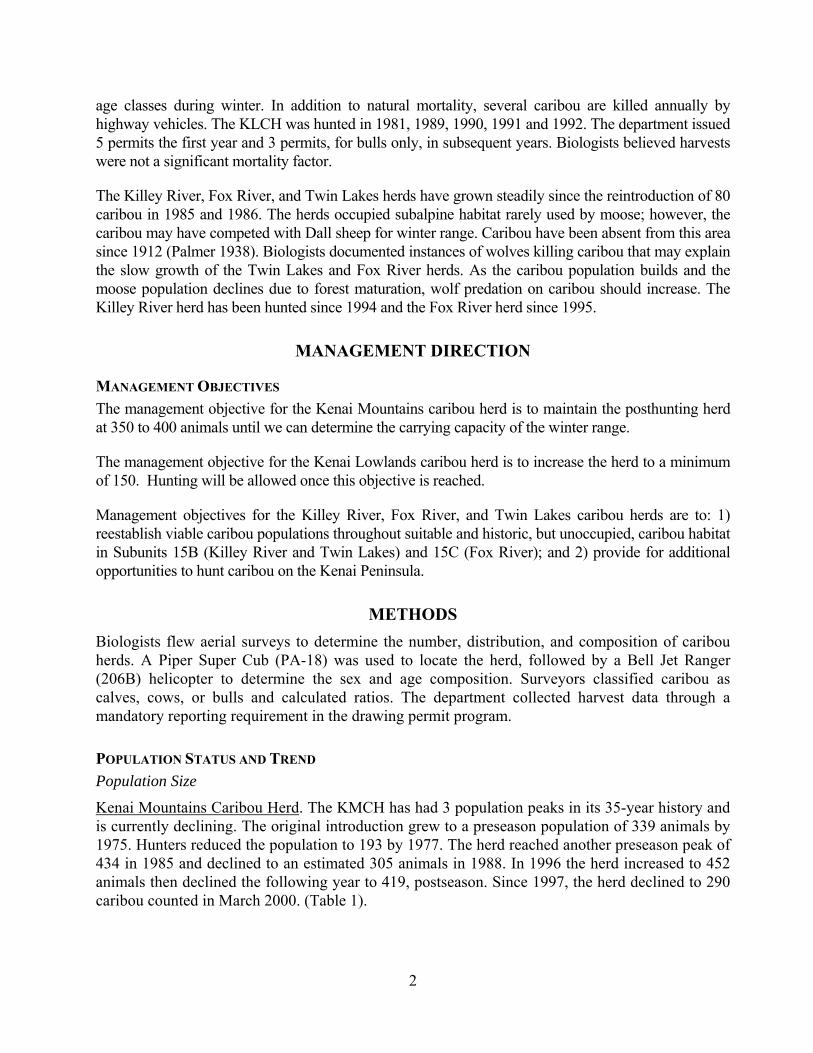
BACKGROUND There are 5 small caribou herds on Kenai Peninsula following reintroductions in 1965-66 and 1985-86. The Kenai Mountains caribou herd (KMCH) occupies that portion of Unit 7 drained by Chickaloon River, Big Indian Creek, and Resurrection Creek. The Kenai Lowlands caribou herd (KLCH) summers in Subunit 15A north of the Kenai airport to the Swanson River and in the extreme western portion of 15B; the herd winters on the lower Moose River to the outlet of Skilak Lake and the area around Brown’s Lake in Subunit 15B. The Killey River caribou herd (KRCH) inhabits the upper drainages of Funny and Killey rivers in Subunit 15B. The Fox River caribou herd (FRCH) occupies the area between upper Fox River and Truuli Creek in Subunit 15C. The Twin Lakes caribou herd (TLCH) occupies the area drained by Benjamin Creek in Subunit 15B. The 1990/00 estimated population sizes of the KMCH, KLCH, KRCH, FRCH and TLCH were 325, 140, 600, 70, and 65 caribou, respectively.
The KMCH has been hunted annually since 1972. The number of permits issued and animals harvested sharply increased, as hunters became aware of the KMCH. From 1972 to 1976, the department issued an unlimited number of registration permits and the season was closed by emergency order when necessary. In 1977, a limited permit system was initiated and remains in use. Following the 1985 peak in population numbers, the KMCH began to decline for unknown reasons. The department reduced harvest from 1987 to 1990. Biologists surveyed the herd in fall 1992 and tallied 390 caribou, however, calf recruitment was only 14%. A March 1996 survey revealed the herd had grown to at least 425 animals, with a slightly increased calf percentage of 17%. Beginning in 1996 this herd showed a steady decline with 290 caribou counted on March 5, 2000. Population trends correlated with harvest data collected since the early 1970s suggested the carrying capacity for this herd's range was 350 to 400 caribou. During the past 5 years the mean annual success rate was 22%.
The Kenai Lowlands herd has grown slowly compared to the other 4 Kenai Peninsula herds and is currently at its largest population size. Growth has been limited by predation rather than by habitat. Free-ranging domestic dogs and coyotes probably killed calves in summer, and wolves preyed on all
2
age classes during winter. In addition to natural mortality, several caribou are killed annually by highway vehicles. The KLCH was hunted in 1981, 1989, 1990, 1991 and 1992. The department issued 5 permits the first year and 3 permits, for bulls only, in subsequent years. Biologists believed harvests were not a significant mortality factor.
The Killey River, Fox River, and Twin Lakes herds have grown steadily since the reintroduction of 80 caribou in 1985 and 1986. The herds occupied subalpine habitat rarely used by moose; however, the caribou may have competed with Dall sheep for winter range. Caribou have been absent from this area since 1912 (Palmer 1938). Biologists documented instances of wolves killing caribou that may explain the slow growth of the Twin Lakes and Fox River herds. As the caribou population builds and the moose population declines due to forest maturation, wolf predation on caribou should increase. The Killey River herd has been hunted since 1994 and the Fox River herd since 1995.
MANAGEMENT DIRECTION
MANAGEMENT OBJECTIVES The management objective for the Kenai Mountains caribou herd is to maintain the posthunting herd at 350 to 400 animals until we can determine the carrying capacity of the winter range.
The management objective for the Kenai Lowlands caribou herd is to increase the herd to a minimum of 150. Hunting will be allowed once this objective is reached.
Management objectives for the Killey River, Fox River, and Twin Lakes caribou herds are to: 1) reestablish viable caribou populations throughout suitable and historic, but unoccupied, caribou habitat in Subunits 15B (Killey River and Twin Lakes) and 15C (Fox River); and 2) provide for additional opportunities to hunt caribou on the Kenai Peninsula.
METHODS Biologists flew aerial surveys to determine the number, distribution, and composition of caribou herds. A Piper Super Cub (PA-18) was used to locate the herd, followed by a Bell Jet Ranger (206B) helicopter to determine the sex and age composition. Surveyors classified caribou as calves, cows, or bulls and calculated ratios. The department collected harvest data through a mandatory reporting requirement in the drawing permit program.
POPULATION STATUS AND TREND Population Size Kenai Mountains Caribou Herd. The KMCH has had 3 population peaks in its 35-year history and is currently declining. The original introduction grew to a preseason population of 339 animals by 1975. Hunters reduced the population to 193 by 1977. The herd reached another preseason peak of 434 in 1985 and declined to an estimated 305 animals in 1988. In 1996 the herd increased to 452 animals then declined the following year to 419, postseason. Since 1997, the herd declined to 290 caribou counted in March 2000. (Table 1).

3
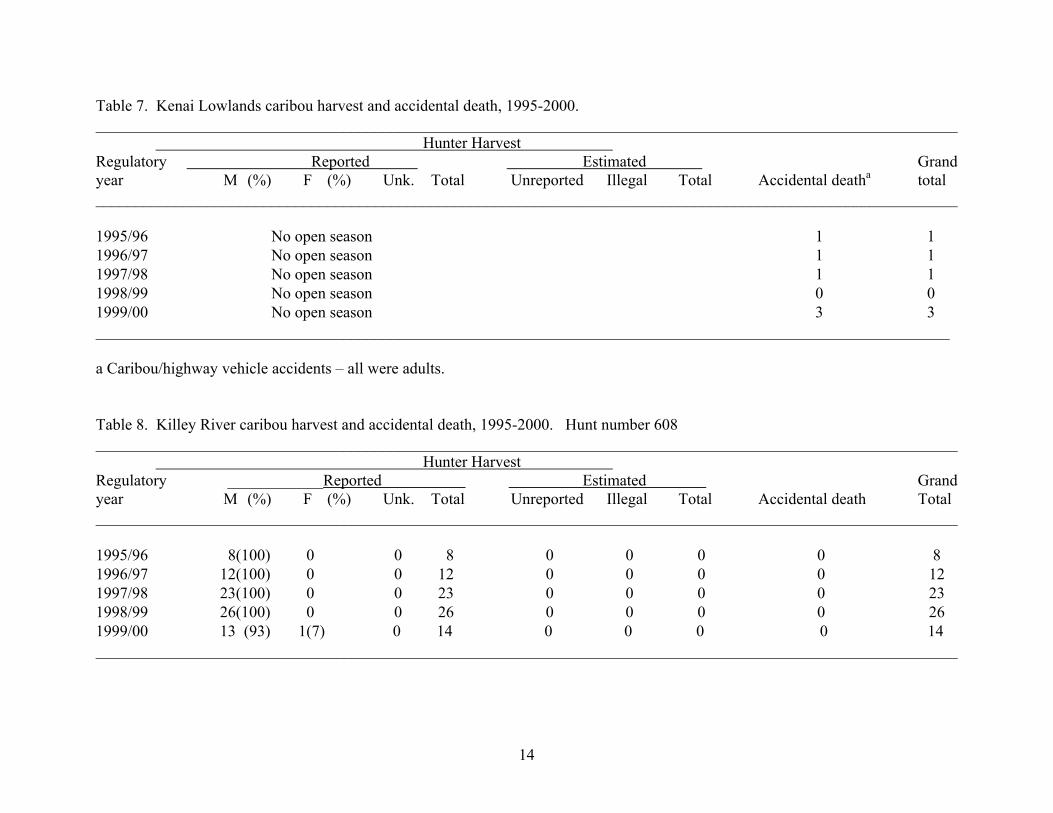
Kenai Lowlands Caribou Herd. The KLCH increased steadily from 96 animals in 1995/96 to a peak of 140 caribou counted during spring 1999. The population declined slightly the following year to 131 (Table 2). The primary management concern was low recruitment caused by predation.
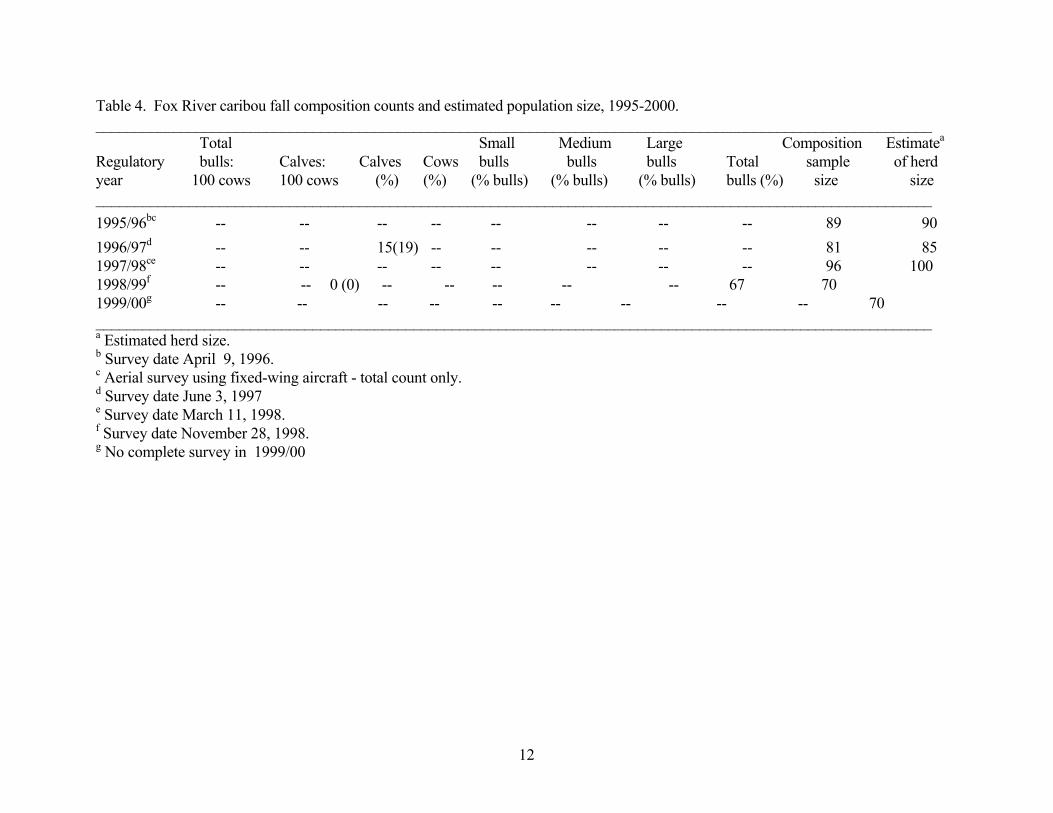
Killey River, Fox River and Twin Lakes Caribou Herds. The KRCH (Table 3) has grown steadily since their introductions in the mid-1980s. The KRCH increased at a mean annual rate of increase of 22% (range = 13-31%) between fall 1991 and 1993. The herd remained stable over the next 2 years at about 300 animals then increased to 400 in 1997. The January 1999 survey conducted by the Fish and Wildlife Service only revealed 380 caribou; however, animals were widely scattered and it is believed the count did not accurately assess the herd’s size, since 546 animals were counted in June 1999. Fox River Caribou Herd. The FRCH (Table 4) mean annual rate of increase was 29% (range = 14-49%) between fall 1991 and 1994 and only increased 9% by spring 1996. The herd declined by 9% the following spring then increased 16% by spring 1998. Predation by wolves and brown bears was the suspected cause of a reduction in herd size to 67 by the fall of 1998, when a survey revealed there were no calves in the herd. A survey was not completed in 1999/00.
Twin Lakes Caribou Herd. The TLCH (Table 5) herd followed a similar growth pattern with a mean annual increase of 25% between fall 1992 and 1994 and remained stable in 1995. In spring 1997 the herd increased again, followed by a 9% decline in January 1998. These growth rates appeared normal for recently introduced herds on excellent range; however, the KRCH has been difficult to survey and may have been larger during fall surveys. Over the past five years this herd has declined from a high of 75 in 1996/97 to approximately 65 in 1999/00. The indication that this herd is declining suggests predation rather than insufficient range.
Population Composition Kenai Mountains Caribou Herd. There were 29 calves:100 cows and 41 bulls:100 cows in March 1996. Calves composed 17% of the herd. We did not collect herd composition data from 1996 to 1999 due to limited budgets, however, annual surveys were completed to determine population size. Data from fall 1992 were included for comparisons. Herd composition for 1992 was 24 calves:100 cows and 43 bulls:100 cows; calves composed 14% of the caribou observed. Calf recruitment increased slightly between fall 1992 and March 1996. The mean percentage of calves in the herd between 1990 and 1995 was 17%, with a high of 20% in 1990. The ratio of bulls to cows remained relatively stable from 1990 to 1995 with a mean of 41:100 (range = 39-43:100). Observations during the 1996 to 1999 surveys indicated the calf to cow ratio was still low.
Kenai Lowlands Caribou Herd. Biologists only surveyed the KLCH during spring because of poor fall survey conditions. The area where this herd aggregated during the fall rutting period was heavily timbered making it difficult to locate and classify caribou. Data collected from 1996 to 2000 indicated the mean June calf percentage was 21 %, (range = 17 to 29%) (Table 2). Surveyors counted a low of 17 calves in 1997 compared to a high of 29 young in 1999. The population increased from 96 to 140 caribou during the same period. Because fall surveys were not conducted, bull to cow ratios were not available. Incidental observations suggested the ratio was probably stable and at a minimum of 35 bulls per 100 cows.

4
Killey River Caribou Herd. Biologists surveyed the KRCH during fall 1993 and tallied the following ratios: 44 calves:100 cows and 56 bulls:100 cows; calves composed 22% of the 281 caribou observed. Although surveyors did not classify bulls as small, medium, or large, field notes indicated many bulls were in the medium to large category. Composition surveys were not conducted in fall of 1994 or 1995. In 1996 calves comprised 23% of the 376 caribou counted, and the bull to cow ratio remained stable. The January 1998 survey revealed a decline of 36 caribou when compared to the June 1997 count. Although this count may reflect predation and mortality due to hunting, it is believed the 1997 count of 376 and the 1998 counts were low. A composition survey of 509 of 546 caribou observed on June 23, 1999 revealed the following ratios: 25 calves:100 cows, 36 bulls:100 cows and calves comprised 16 percent of the total classified. Although a survey was not completed in 1999/00 the herd is believed to have increased again, and was estimated at 600 animals (Table 3).
Fox River Caribou Herd. Biologists completed composition surveys on the FRCH in fall of 1993. They counted 57 caribou in 1993 with the following ratios: 23 calves:100 cows and 61 bulls:100 cows; calves composed 22% of the caribou observed. Composition surveys were not conducted in 1994 and 1995. In 1996, we counted 81 caribou and 19% were calves. Only aerial surveys to assess the herd’s population size were completed in 1997. These data indicated the herd increased from 57 caribou in 1993 to 96 in 1997. A survey in November 1998 revealed a decline to 67 caribou, and no calves were observed in the herd (Table 4).
Twin Lakes Caribou Herd. A fall composition count was completed on the Twin Lakes caribou herd in the fall of 1993. The following ratios were observed: 26 calves and 30 bulls:100 cows. Calves composed 17% of the 36 animals classified. In 1994 and 1995 we conducted only aerial surveys revealing 45 and 48 animals, respectively. Seventy-three caribou were counted in 1996, 19% were calves. An aerial survey completed in 1997 indicated that the herd declined by 10% to 66 animals then declined 18% in 1998 to 54 (Table 5). In June 1999 the herd was composed of 11(20%) calves, 37 (69%) cows and 6 (11%) bulls.
MORTALITY Harvest Season and Bag Limits.
Kenai Mountains Caribou Herd Open season for resident and nonresident hunters in Unit 7 north of the Sterling Highway and west of the Seward Highway was Aug. 10 to Sept. 30 between 1993 and 1996. In 1997 and 1998, the season was Aug. 10 to Sept. 30 and Nov. 10 to Dec. 10. In 1999, the season was extended to Aug. 10 to Dec. 31. The bag limit was 1 caribou by drawing permit only and up to 250 permits could be issued.
Kenai Lowlands Caribou Herd Open season for resident and nonresident hunters in the portion of the Kenai National Wildlife Refuge of Subunit 15A was 1 to 20 Sept. The bag limit was 1 bull caribou by drawing permit only, and up to 3 permits could be issued. The season was closed beginning fall 1993.

5
Killey River Caribou Herd Open season for resident and nonresident hunters in Subunits 15B south and west of Killey River in the Kenai National Wildlife Refuge was Aug. 10 to Sept. 20. The bag limit was 1 caribou by drawing permit only; up to 150 permits could be issued. In 1999, two drawing permit cow hunts were opened from Aug. 10 to Sept.10 (hunt 610) and Sept. 15 to Oct. 10 (hunt 612). Twenty permits, each for two caribou, were issued for each hunt for a total of 80 permits.
Fox River Caribou Herd Open season for resident and nonresident hunters in Subunits 15C, that portion north of Fox River and east of Windy Lake, was Aug. 10 to Sept. 20. The bag limit was 1 caribou by drawing permit only, and no more than 30 permits could be issued.
Twin Lakes Caribou Herd The Board of Game has not authorized hunting on this herd.
Board of Game Actions and Emergency Orders.
The Board of Game extended the season for the KMCH during this reporting period.
Permit Hunts.
Kenai Mountains Caribou Herd Hunting of this small introduced population was regulated by registration or drawing permit. Number of permits issued was unlimited between 1972 and 1976. Since 1977, permits have been limited in number and issued through a drawing. The department received 1348 applications for 250 permits in 1998, and 1451 applications for 250 permits in 1999. The mean annual harvest for the past 5 years was 23 caribou (range = 18–27), and bulls averaged 51% of the harvest (Tables 6 and 10). Permittees harvested 17 bulls and 8 cows in 1998 and 11 bulls and 13 cows during 1999.
Kenai Lowlands Caribou Herd The season was closed during this reporting period.
Killey River Caribou Herd The department received 412 applications in 1998 for the 50 permits and 353 applications in 1999 for the 25 permits issued to hunt the KRCH. Permittees harvested 26 bulls in 1998, and 13 bulls and 1 cow in 1999 (Tables 8 and 12).
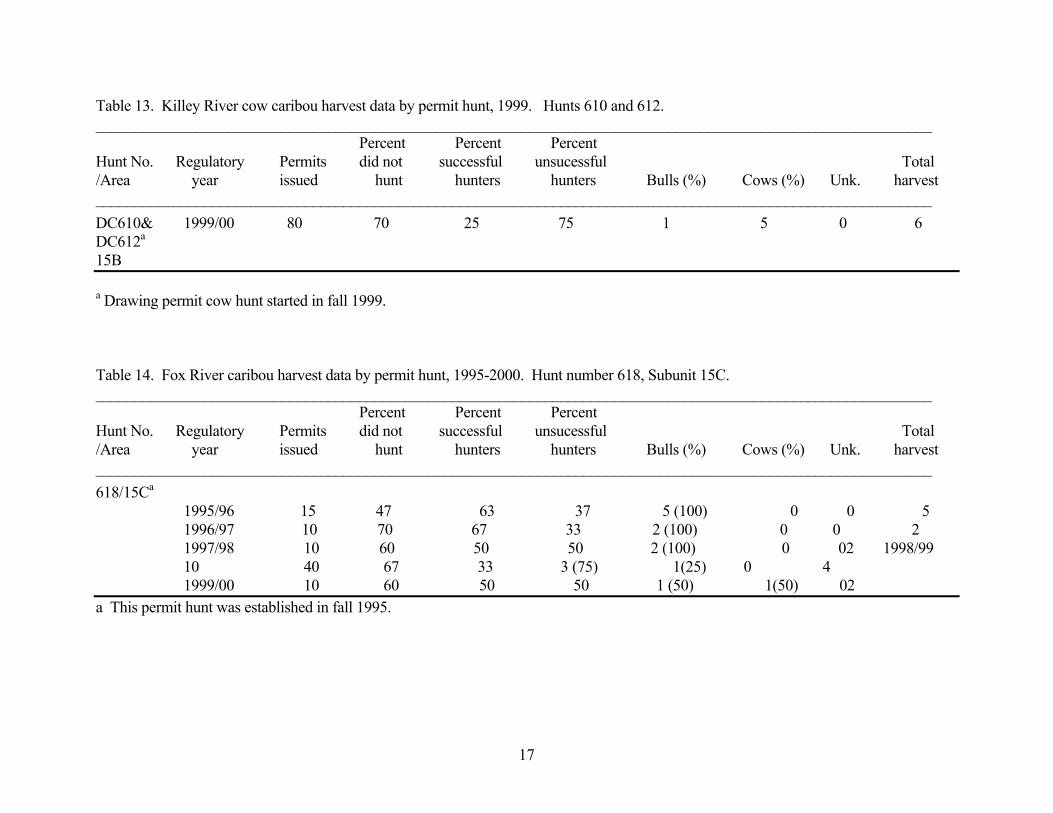
In 1999, a total of 80 permits were issued to 40 hunters, allowing the harvest of cow caribou. Thirty percent of the permittees hunted, and 1 bull and 5 cows were harvested (Table 13).
Fox River Caribou Herd The department received 144 applications in 1998 and 77 in 1999 for the 10 permits issued to hunt the FRCH. Permittees harvested 3 bulls and 1 cow in 1998, and 1 bull and 1 cow in 1999 (Tables 9 and 14).
Twin Lakes Caribou Herd The TLCH was not open to hunting during this reporting period.
Hunter Residency and Success.
Kenai Mountains Caribou Herd Sixty percent of permittees reported they did not hunt in 1998, while 50% did not go afield in 1999 (Table 10). Twenty-five (25%) of the 101 hunters in 1998 were successful and 24 (19%) of the 124 hunters in 1999 were successful (Tables 10 and 15).

6
Local residents harvested 3 caribou, nonlocal residents harvested 20 caribou and nonresidents harvested 2 caribou in 1998 (Table 15). In 1999, local residents took 2 caribou, and nonlocal residents harvested 22 animals. Unsuccessful hunters comprised 1 local resident and 74 nonlocal residents and 1 nonresident in 1998. In 1999, 3 nonresidents hunted unsuccessfully, compared to 7 local and 90 nonlocal residents.
Kenai Lowlands Caribou Herd This herd was not hunted during this reporting period.
Killey River Caribou Herd The department issued 50 permits in 1998 and 25 in 1999 for hunt 608. Forty percent of the permittees in 1998 and 24 % in 1999 did not hunt (Table 12). Hunters harvested 26 caribou in 1998 and 14 in 1999. Hunter success rate was 87% in 1998 and 74% in 1999. Nineteen local, 6 nonlocal residents, and 1 nonresident were successful in 1998, compared to 10 local, 4 nonlocal residents, and no nonresidents in 1999 (Table 16).
Eighty permits were issued in 1999 for hunts 610 and 612, combined, resulting in the harvest of 1 bull (illegal) and 5 cows. Local residents harvested 4 caribou and nonlocals harvested 2. Hunter success rate was 25%.
Fox River Caribou Herd The department issued 10 permits in 1998 and 1999. Six (60%) permittees hunted in 1998 and harvested 3 bulls and 1 cow. Hunter success rate was 67%. In 1999, 4 permittees hunted and harvested 1 bull and 1 cow. Hunter success was 50%. All hunters in 1998 and 1999 were local residents (Table 17).
Harvest Chronology.
Kenai Mountains Caribou Herd The harvest chronology was similar in 1998 and 1999, showing the most effort early in the season. In both years, hunting pressure was highest during the first hunting period (Table 18). In the past 5 years (combined), hunters have harvested 62% of the take in August, 38% in September and less than 1 percent after September.
Kenai Lowlands Caribou Herd The Kenai Lowland Caribou herd was not hunted during this reporting period.
Killey River Caribou Herd Hunting effort in 1998 was distributed over the first three hunting periods with the highest harvest (39%) between September 1 and 15. The harvest chronology for 1999 was similar to the previous year (Table 19).
Fox River Caribou Herd In 1998 and 1999 (combined) hunters reported harvesting 2 caribou during the last two weeks of August and 4 caribou during the first two weeks of September (Table 20).
Transport Methods.
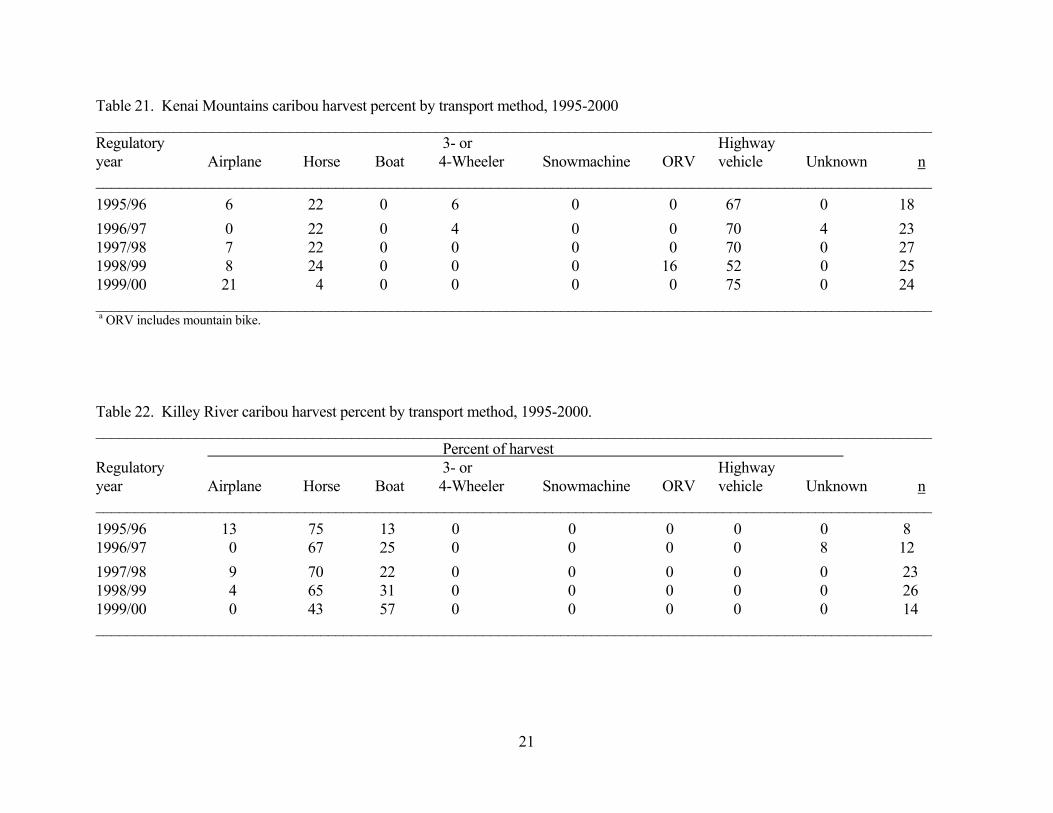
Kenai Mountains Caribou Herd In 1998 and 1999 most successful hunters used highway vehicles for access and then hiked into the areas they hunted (Table 21). In 1998, 13 (52%) successful hunters walked, while 6 (24%) used horses, 4 (16%) used mountain bikes and 2 (8%)
7
used aircraft. The following year 18 (75%) successful hunters walked, 1 (4%) relied on horses, and 5 (21%) used aircraft. Unsuccessful hunters followed a similar pattern of reliance on foot travel.
Kenai Lowlands Caribou Herd The Kenai Lowland Caribou herd was not hunted during this reporting period.
Killey River Caribou Herd In 1998 and 1999 hunters used 2 primary methods to access their hunting areas: boat across Tustumena Lake and walk to the hunting area or boat across the lake and use horses to pack into the hunt area. Sixty-five percent of the hunters in 1998 used horses, compared to 43% the next year. In 1998 31% of hunters used boats, compared to 57% in 1999. One successful hunter used aircraft in 1998 and none in 1999 (Table 22).
In 1999, 4 successful hunters used horses and 2 used boats to access the area they hunted in hunts DC610 and DC612.
Fox River Caribou Herd Five of the six successful hunters used a boat and one used horses to access the hunting area in 1998 and 1999 combined.
HABITAT Assessment Biologists have not thoroughly investigated the habitat components of the Kenai Mountains herd. There are approximately 1407 km2 (563 mi.2) within the known range of the KMCH. Winter range was approximately 532 km2 of the total identified range. The department initially discussed habitat concerns during the mid-1980s when the herd started to decline. Between 1980 and 1984 the KMCH had high calf:cow ratios and the herd was growing. Subsequent declines in the calf:cow ratios and herd size between 1985 and 1990 raised concerns over habitat adequacy. Hunting mortalities probably became additive around 1985; while hunting may have accelerated the decline, it provided some habitat protection. The herd declined to 300 animals by 1988 and remained at that size until 1990. The calf:cow ratio improved with 34:100 in fall 1990. As the herd increased, the percentage of calves observed declined from 20% in 1990 to 14% in fall 1992. A March 14, 1996 composition survey revealed the herd size had continued to increase since 1992. We observed 425 caribou and classified 403. Classification indicated the bull:cow ratio has remained relatively unchanged at about 41:100 since 1990 and the calf:cow ratio has increased slightly from 14:100 in 1992 to 17:100 in 1996. Composition surveys were not completed from 1997 to 1999, however, we did conduct surveys to determine population size. The observation of 452 caribou on 14 March 1997 indicated the herd had reached its highest number and began a downward trend. Four hundred nineteen caribou were counted on 27 February 1998, 380 on 7 January 1999 and 290 on 5 March 2000. This has been the typical pattern of the Kenai Mountains Caribou herd over the past 3 decades. The KMCH appeared more productive when stabilized around 350 to 400 caribou.
Although the Kenai Lowlands herd has increased steadily this reporting period, hunting is still not justifiable. The opportunity for viewing by locals and tourists is also increasing. Moderate calf mortality during summer and moderate adult mortality in winter were factors in the population increase. The primary predators are wolves during winter and free-ranging domestic dogs and coyotes during summer.

8
Although some caribou in the KLCH have been observed south and east of Kalifornsky Beach Road in Unit 15B in winter, most of the herd migrates east to winter on the Kenai National Wildlife Refuge along Moose River to the outlet of Skilak Lake and south to Brown’s Lake. Unlike ranges for other herds on the Kenai Peninsula, summer and winter ranges were separate for the KLCH. The summer range was 254 km2 (101 mi.2), compared to 925 km2 (370 mi.2) for the winter. This herd occupies a large range, and habitat is not limiting the growth of the KLCH at this time.
In 1996, 1998 and 2000 female calves were captured in the Killey River and Kenai Mountains Caribou herds in March and April to compare weights as an indicator of range quality. In 1996 the Kenai Mountain mean calf weights were 127 pounds compared to a mean weight of 145 in the Killey River herd. In 1998 Kenai Mountains calves averaged 122 pounds compared to 141 recorded for the Killey River calves. In 2000 Kenai Mountains calves averaged 120 pounds compared to 130 recorded for the Killey River calves. We also recorded morphometric measurements.
A comparison of the mean weights for calves indicates Killey River calves were larger than calves from Kenai Mountains herd in all years. The estimated 325 caribou currently in the Kenai Mountains herd occupy a 1407 km2 area, a density of 0.2 animals/km2. The 600 Killey River caribou currently occupy about 516 km2, a density of 1.2 animals/km2. It is interesting to note that the Killey River herd density is over five times the density of Kenai Mountains but their calves are larger. We will assess calf weight again in April 2002.
The fact that mean calf weight of Killey River calves appears to be the highest in the known herds of the state is interesting; however, several influencing factors need to be reported to make these findings applicable to future capture efforts. Calves captured in 1996 were born following one of the most severe winters on record for the Kenai Peninsula. The severe winter of 1994–95 was also followed by one of the best growing seasons due to warm days with a record amount of rain. The winter of 1995–96 was, in contrast, one of the mildest on record. As a result, although these weights seem appropriate for the range conditions, they are probably the highest mean weights one could expect from these herds and may not represent an average calf weight following a normal summer growing season and winter. The winter of 1997/98 was normal for the Kenai. Similar environmental conditions should be noted for the Kenai Mountains herd.
Department and Kenai National Wildlife Refuge biologists conducted preliminary habitat assessments for the Killey and Fox River herds before reintroduction in the mid 1980s. These results, published in the Kenai Peninsula Caribou Management Plan and revised in 2001, indicated the KRCH's range (516 km2) should sustain a herd of 400 to 500 caribou, the FRCH (85 km2) could sustain approximately 80, and the TLCH range of 216 km2 could support 200 animals. Calf recruitment for these herds has been moderately low, and insufficient habitat may now be limiting the growth of the Killey River, Fox River and Kenai Mountains Herds.
CONCLUSIONS AND RECOMMENDATIONS Recent survey and harvest data indicate the department is below the KMCH post-season population objective of 350 to 400 caribou. Limited habitat, inclement weather, predation, and human harvests are plausible explanations for the herd's decline from 452 in 1996 to 290 animals in 2000. Reductions in harvests during the early 1990s allowed the herd to increase, reaching a record high of 450 caribou
9
before the 1996 season. Because a survey conducted after this reporting period in the fall of 2000 indicated the herd increased to 378 caribou, I suggest we not make changes to the current season and bag limit. The allowable annual harvest will be set to maintain the population between 350 and 400 (post-season) until we identify factors influencing calf recruitment.
The KLCH has slowly increased over the past 5 years from 1993 to 2000. Low calf recruitment is still the primary management concern for this herd. Department and FWS biologists suspect predation coupled with insufficient annual recruitment to offset the aging trend is limiting herd growth, rather than available range. If the herd continues to increase, I recommend not allowing harvest until the herd increases to approximately 150 animals.
The Killey River herd has increased significantly (632 counted on November 1, 2000), and it was over the projected density in 2000. Reduced annual recruitment and declining mean weight of female calves indicates this herd may now becoming habitat-limited. A secondary management objective is to allow hunting as this herd increases. I recommend the department continue harvesting caribou in this herd to decrease the herd's growth rate. In addition to drawing permits for bulls, an unlimited number of registration permits should be issued to harvest only cows in the Killey River herd. A decreased rate of growth in this herd will allow biologists time to determine the optimum density for these herds. Because of limited access few hunters are expected to take advantage of these permits, however, several years of assessing hunters' success may be necessary to properly manage annual harvests.
The Fox River caribou herd has declined in recent years probably due to increased predation by wolves and bears or emigration into the Killey River herd. Observations by staff and hunters indicate that a pack of at least 6 wolves, several brown bears and numerous black bears commonly use this small area. Although a harvest of 2 cows and 4 bulls over the past two years is not suspected to cause the current decline, if the herd declines below 60 animals, hunting should be restricted to bulls only.
The Twin Lakes caribou herd increased steadily between 1993 and 1996 and decreased its growth in 1997 and 1998. Because this herd has the habitat potential to increase to about 200 animals, I recommend we monitor the herd annually to determine if this population decline is a trend caused by unknown limiting factors or we under estimated the herd’s size. I recommend we propose a limited permit hunt for this herd when its density reaches 0.5 caribou per km2. Initiating a controlled hunt before the herd reaches its habitat potential will allow biologists time to evaluate the herd’s health and still allow for growth.
LITERATURE CITED PALMER, L. J. 1938. Management of moose herds on the Kenai Peninsula. Restoration Project
Report March, April, and May 1938. Unpublished manuscript. Kenai National Wildlife Refuge files, Soldotna. AK. 40pp.
PREPARED BY: SUBMITTED BY: Ted H. Spraker Michael G. McDonald Wildlife Biologist Assistant Management Coordinator

10
Table 1. Kenai Mountains caribou fall composition counts and estimated population size, 1995-2000. ____________________________________________________________________________________________________________ Total Small Medium Large Composition Estimatea Regulatory bulls: Calves: bulls bulls bulls Total sample of herd year 100 cows 100 cows Calves (%) (% bulls) (% bulls) (% bulls) bulls (%) size size ____________________________________________________________________________________________________________ 1995/96b 41 29 17 59 -- -- -- 403 450 1996/97c -- -- -- -- -- -- -- 452 500 1997/98d -- -- -- -- -- -- -- 419 475 1998/99e -- -- -- -- -- -- -- 380 425 1999/00f -- -- -- -- -- -- -- 290 325 ___________________________________________________________________________________________________________
a. Estimated herd size postseason. b. Survey date - March 14, 1996. c. Survey date – March 14, 1997. d. Survey date – February 27, 1998. e. Survey date – January 7, 1999. f. Survey date – March 5, 2000.
Table 2. Kenai Lowlands caribou composition counts and estimated population size, 1995-2000. ____________________________________________________________________________________________________________ Total Small Medium Large Composition Estimatea Regulatory bulls: Calves: bulls bulls bulls Total sample of herd year 100 cows 100 cows Calves (%) (% bulls) (% bulls) (% bulls) bulls (%) size size ____________________________________________________________________________________________________________ 1995/96b -- -- 28(29) -- -- -- -- 96 100 1996/97c -- -- 17(17) -- -- -- -- 98 105 1997/98d -- -- 24(19) -- -- -- -- 124 135 1998/99e -- -- 29(21) -- -- -- -- 140 150 1999/00f -- -- 25(19) -- -- -- -- 131 140 ____________________________________________________________________________________________________________ a Estimated herd size in June. d Survey date June 20, 98. b Survey date June 6, 96. e Survey date June 22, 99. c Survey date June 8, 97. f Survey date June 20, 00.

11
Table 3. Killey River caribou composition counts and estimated population size, 1995-2000. ____________________________________________________________________________________________________________ Total Small Medium Large Composition Estimatea Regulatory bulls: Calves: Calves Cows bulls bulls bulls Total sample of herd year 100 cows 100 cows (%) (%) (% bulls) (% bulls) (% bulls) bulls (%) size size ____________________________________________________________________________________________________________ 1995/96b -- -- -- -- -- -- -- -- 261 300 1996/97c -- -- -- -- -- -- -- -- 376 400 1997/98d -- -- -- -- -- -- -- -- 340 380 1998/99e 36 25 77(16) 318(63) -- -- -- 114(22) 509 546 1999/00f -- -- -- -- -- -- -- -- -- 600 ____________________________________________________________________________________________________________ a Estimated fall herd size. b survey date Nov. 28, 1995 c survey date June 11, 1997 d survey date January 13, 1998 e survey date June 23, 99.
12
Table 4. Fox River caribou fall composition counts and estimated population size, 1995-2000. ____________________________________________________________________________________________________________ Total Small Medium Large Composition Estimatea Regulatory bulls: Calves: Calves Cows bulls bulls bulls Total sample of herd year 100 cows 100 cows (%) (%) (% bulls) (% bulls) (% bulls) bulls (%) size size ____________________________________________________________________________________________________________ 1995/96bc -- -- -- -- -- -- -- -- 89 90 1996/97d -- -- 15(19) -- -- -- -- -- 81 85 1997/98ce -- -- -- -- -- -- -- -- 96 100 1998/99f -- -- 0 (0) -- -- -- -- -- 67 70 1999/00g -- -- -- -- -- -- -- -- -- 70 ____________________________________________________________________________________________________________ a Estimated herd size. b Survey date April 9, 1996. c Aerial survey using fixed-wing aircraft - total count only. d Survey date June 3, 1997 e Survey date March 11, 1998. f Survey date November 28, 1998. g No complete survey in 1999/00

13
Table 5. Twin Lakes caribou fall composition counts and estimated population size, 1995-2000. ____________________________________________________________________________________________________________ Total Small Medium Large Composition Estimatea Regulatory bulls: Calves: Calves Cows bulls bulls bulls Total sample of herd year 100 cows 100 cows (%) (%) (% bulls) (% bulls) (% bulls) bulls (%) size size 1995/96 -- -- -- -- -- -- -- -- 48 50 1996/97b -- -- 14(19) -- -- -- -- -- 73 75 1997/98 -- -- -- -- -- -- -- -- 66 70 1998/99c 16 30 11(21) 37(69) -- -- -- 6 54 65 1999/00 -- -- -- -- -- -- -- -- -- 65 ____________________________________________________________________________________________________________ aEstimated fall herd size. b Surveyed on June 11, 1997. c Surveyed on June 23, 1999. Table 6. Kenai Mountains caribou harvest and accidental death, 1995-2000. ____________________________________________________________________________________________________________ Hunter Harvest Regulatory Reported _____ __ Estimated ___ Grand year M (%) F (%) Unk. Total Unreported Illegal Total Accidental death Total ____________________________________________________________________________________________________________ 1995/96 10(56) 8(44) 0 18 -- -- -- -- 18 1996/97 10(44) 13(56) 0 23 -- -- -- -- 23 1997/98 12(46) 14(54) 1 27 -- -- -- -- 27 1998/99 17(68) 8(32) 0 25 -- -- -- -- 25 1999/00 11(46) 13(54) 0 24 -- -- -- -- 24 ____________________________________________________________________________________________________________
14
Table 7. Kenai Lowlands caribou harvest and accidental death, 1995-2000. ____________________________________________________________________________________________________________ Hunter Harvest Regulatory Reported Estimated Grand year M (%) F (%) Unk. Total Unreported Illegal Total Accidental deatha total ____________________________________________________________________________________________________________ 1995/96 No open season 1 1 1996/97 No open season 1 1 1997/98 No open season 1 1 1998/99 No open season 0 0 1999/00 No open season 3 3 ___________________________________________________________________________________________________________ a Caribou/highway vehicle accidents – all were adults. Table 8. Killey River caribou harvest and accidental death, 1995-2000. Hunt number 608 ____________________________________________________________________________________________________________ Hunter Harvest Regulatory ____________Reported Estimated Grand year M (%) F (%) Unk. Total Unreported Illegal Total Accidental death Total ____________________________________________________________________________________________________________ 1995/96 8(100) 0 0 8 0 0 0 0 8 1996/97 12(100) 0 0 12 0 0 0 0 12 1997/98 23(100) 0 0 23 0 0 0 0 23 1998/99 26(100) 0 0 26 0 0 0 0 26 1999/00 13 (93) 1(7) 0 14 0 0 0 0 14 ____________________________________________________________________________________________________________

15
Table 9. Fox River caribou harvest and accidental death, 1996-2000. ____________________________________________________________________________________________________________ Hunter Harvest Regulatory Reported Estimated Grand year M (%) F (%) Unk. Total Unreported Illegal Total Accidental death total ____________________________________________________________________________________________________________ 1995/96 5 (100) 0 0 5 0 0 0 0 5 1996/97 2 (100) 0 0 2 0 0 0 0 2 1997/98 2 (100) 0 0 2 0 0 0 0 2 1998/99 3 (75) 1 (25) 0 4 0 0 0 0 4 1999/00 1 (50) 1 (50) 0 2 0 0 0 0 2 ____________________________________________________________________________________________________________ Table 10. Kenai Mountains caribou harvest data by permit hunt, 1993-2000. Hunt number 001. ____________________________________________________________________________________________________________ Percent Percent Percent Hunt No. Regulatory Permits did not successful unsuccessful Total /Area year issued hunt hunters hunters Bulls (%) Cows (%) Unk. harvest ____________________________________________________________________________________________________________ 001/07 1993/94 200 47 27 73 66 34 -- 29 1994/95 200 42 24 76 61 39 -- 28 1995/96 200 47 19 81 56 44 -- 18 1996/97 250 49 18 82 44 56 -- 23 1997/98 250 52 23 78 46 54 -- 27 1998/99 250 60 25 75 68 32 -- 25 1999/00 250 50 19 81 46 54 -- 24

16
Table 11. Kenai Lowlands caribou harvest data by permit hunt, 1995-2000. Hunt number 506, Subunit 15A. ____________________________________________________________________________________________________________ Percent Percent Percent Hunt No. Regulatory Permits did not successful unsuccessful Total /Area year issued hunt hunters hunters Bulls (%) Cows (%) Unk. harvest ____________________________________________________________________________________________________________ 506/15A 1995- 2000 NO OPEN SEASON 0 _____________________________________________________________________________________________________________ Table 12. Killey River caribou harvest data by permit hunt, 1994-2000. Hunt number 608, Subunit 15B. ____________________________________________________________________________________________________________ Percent Percent Percent Hunt No. Regulatory Permits did not successful unsucessful Total /Area year issued hunt hunters hunters Bulls (%) Cows (%) Unk. harvest ____________________________________________________________________________________________________________ 608/15B 1994/95a 25 40 73 27 10(91) 1(9) 0 11 1995/96 25 52 67 33 8(100) 0 0 8 1996/97 25 36 75 25 12(100) 0 0 12 1997/98 50 46 85 13 23(100) 0 0 23 1998/99 50 40 87 13 26(100) 0 026 1999/00 25 24 74 26 13(93) 1(7) 0 14 a This permit hunt was established in fall 1994.
17
Table 13. Killey River cow caribou harvest data by permit hunt, 1999. Hunts 610 and 612. ____________________________________________________________________________________________________________ Percent Percent Percent Hunt No. Regulatory Permits did not successful unsucessful Total /Area year issued hunt hunters hunters Bulls (%) Cows (%) Unk. harvest ____________________________________________________________________________________________________________ DC610& 1999/00 80 70 25 75 1 5 0 6 DC612a 15B a Drawing permit cow hunt started in fall 1999. Table 14. Fox River caribou harvest data by permit hunt, 1995-2000. Hunt number 618, Subunit 15C. ____________________________________________________________________________________________________________ Percent Percent Percent Hunt No. Regulatory Permits did not successful unsucessful Total /Area year issued hunt hunters hunters Bulls (%) Cows (%) Unk. harvest ____________________________________________________________________________________________________________ 618/15Ca 1995/96 15 47 63 37 5 (100) 0 0 5 1996/97 10 70 67 33 2 (100) 0 0 2 1997/98 10 60 50 50 2 (100) 0 02 1998/99 10 40 67 33 3 (75) 1(25) 0 4 1999/00 10 60 50 50 1 (50) 1(50) 02 a This permit hunt was established in fall 1995.

18
Table 15. Kenai Mountains caribou annual hunter residency and success, 1995-2000. ____________________________________________________________________________________________________________ Successful ____ Unsuccessful Regulatory Locala Nonlocal Locala Nonlocal Total year resident resident Nonresident Total b (%) resident resident Nonresident Total b (%) hunters ____________________________________________________________________________________________________________ 1995/96 2 16 0 18 (17) 6 79 3 88 (84) 105 1996/97 2 20 1 23 (18) 16 86 3 105 (82) 128 1997/98 3 22 0 27 (23) 7 82 4 93 (78) 120 1998/99 3 20 2 25 (25) 1 74 1 76 (75) 101 1999/00 2 22 0 24 (19) 7 90 3 100 (81) 124 ____________________________________________________________________________________________________________ a Local resident resides in Unit 7. b Total includes hunters of unknown residence. Table 16. Killey River caribou annual hunter residency and success, 1995-2000. Hunt number 608. ____________________________________________________________________________________________________________ Successful _____________Unsuccessful________________ Regulatory Locala Nonlocal Locala Nonlocal Total year resident resident Nonresident Total (%) resident resident Nonresident Total (%) hunters ____________________________________________________________________________________________________________ 1995/96 7 1 0 8 (67) 3 1 0 4 (33) 12 1996/97 7 3 2 12 (75) 3 1 0 4 (25) 16 1997/98 17 5 1 23 (85) 3 1 0 4 (15) 27 1998/99 19 6 1 26 (87) 3 1 0 4 (13) 30 1999/00 10 4 0 14 (74) 4 1 0 5 (26) 19 ____________________________________________________________________________________________________________ a Local resident resides in Unit 7 or 15. b Herd not hunted.

19
Table 17. Fox River caribou annual hunter residency and success, 1995-2000. Hunt DC618. ____________________________________________________________________________________________________________ Successful Unsuccessful Regulatory Locala Nonlocal Locala Nonlocal Total year resident resident Nonresident Total (%) resident resident Nonresident Total (%) hunters ____________________________________________________________________________________________________________ 1995/96 3 1 1 5 (63) 3 0 0 3 (38) 8 1996/97 1 0 1 2 (67) 1 0 0 1 (33) 3 1997/98 2 0 0 2 (50) 2 0 0 2 (50) 4 1998/99 4 0 0 4 (67) 2 0 0 2 (33) 6 1999/00 2 0 0 2 (50) 2 0 0 2 (50) 4 ____________________________________________________________________________________________________________ a Local resident resides in Unit 7 or 15. Table 18. Kenai Mountains caribou annual harvest chronology percent by time period, 1995-2000. ____________________________________________________________________________________________________________ Regulatory Harvest periods year 8/10-8/31 9/01-9/30 10/01-10/31 11/01-12/31 n ____________________________________________________________________________________________________________ 1995/96 9 9 0 0 18 1996/97 18 5 0 0 23 1997/98 15 12 0 0 27 1998/99 15 10 0 0 25 1999/00 15 8 1 0 24 ___________________________________________________________________________________________________________ a One hunter failed to report harvest chronology.

20
Table 19. Killey River caribou annual harvest chronology percent by time period, 1995-2000. ____________________________________________________________________________________________________________ Regulatory Harvest periods year 8/10-8/15 8/16-8/31 9/1-9/15 9/16-9/30 Unk. n ____________________________________________________________________________________________________________ 1995/96 0 2 4 2 0 8 1996/97 3 0 5 3 1 12 1997/98 3 10 9 1 0 23 1998/99 6 9 10 1 0 26 1999/00 5 1 8 1 1 15 _____________________________________________________________________________________________________________ Table 20. Fox River caribou annual harvest chronology percent by time period, 1995-2000. ____________________________________________________________________________________________________________ Regulatory Harvest periods year 8/10-8/15 8/16-8/31 9/1-9/15 9/16-9/30 n ____________________________________________________________________________________________________________ 1995/96 0 2 1 2 5 1996/97 0 0 2 0 2 1997/98 0 0 1 1 2 1998/99 0 1 3 0 4 1999/00 0 1 1 0 2 ____________________________________________________________________________________________________________
21
Table 21. Kenai Mountains caribou harvest percent by transport method, 1995-2000 ____________________________________________________________________________________________________________ Regulatory 3- or Highway year Airplane Horse Boat 4-Wheeler Snowmachine ORV vehicle Unknown n ____________________________________________________________________________________________________________ 1995/96 6 22 0 6 0 0 67 0 18 1996/97 0 22 0 4 0 0 70 4 23 1997/98 7 22 0 0 0 0 70 0 27 1998/99 8 24 0 0 0 16 52 0 25 1999/00 21 4 0 0 0 0 75 0 24 ____________________________________________________________________________________________________________ a ORV includes mountain bike. Table 22. Killey River caribou harvest percent by transport method, 1995-2000. ____________________________________________________________________________________________________________ Percent of harvest Regulatory 3- or Highway year Airplane Horse Boat 4-Wheeler Snowmachine ORV vehicle Unknown n ____________________________________________________________________________________________________________ 1995/96 13 75 13 0 0 0 0 0 8 1996/97 0 67 25 0 0 0 0 8 12 1997/98 9 70 22 0 0 0 0 0 23 1998/99 4 65 31 0 0 0 0 0 26 1999/00 0 43 57 0 0 0 0 0 14 ____________________________________________________________________________________________________________

22
Table 23. Fox River caribou harvest percent by transport method, 1995-2000. ____________________________________________________________________________________________________________ Percent of harvest Regulatory 3- or Highway year Airplane Horse Boat 4-Wheeler Snowmachine ORV vehicle Unknown n ____________________________________________________________________________________________________________ 1995/96 0 40 60 0 0 0 0 0 5 1996/97 0 0 100 0 0 0 0 0 2 1997/98 0 0 100 0 0 0 0 0 2 1998/99 0 25 75 0 0 0 0 0 4 1999/00 0 0 100 0 0 0 0 0 2 ____________________________________________________________________________________________________________
SPECIES Alaska Department of Fish and GameDivision of Wildlife Conservation
MANAGEMENT REPORT (907) 465-4190 PO BOX 25526 JUNEAU, AK 99802-5526
23
CARIBOU MANAGEMENT REPORT
From: 1 July 1998 To: 30 June 2000
LOCATION
GAME MANAGEMENT UNITS: 9B, 17, 18 south, 19A, and 19B (60,000 mi2)
HERD: Mulchatna
GEOGRAPHIC DESCRIPTION: Drainages into northern Bristol Bay and Kuskokwim River
BACKGROUND There is little objective information available on the Mulchatna caribou herd (MCH) before 1973. The first historical accounts of caribou in the area are contained in the journals of agents of the Russian-American Fur Company (Van Stone 1988). In 1818, while traveling through areas now included in Game Management Units 17A and 17C, Petr Korsakovskiy noted that caribou were “plentiful” along Nushagak Bay and there were “considerable” numbers of caribou in the Togiak Valley. Another agent, Ivan Vasilev, wrote that his hunters brought “plenty of caribou” throughout his journey up the Nushagak River and into the Tikchik Basin in 1829. Skoog (1968) hypothesized that the caribou population at that time extended from Bristol Bay to Norton Sound, including the lower Yukon and Kuskokwim River drainages as far inland as Innoko River and Taylor Mountains. This herd apparently reached peak numbers in the 1860s and began declining in the 1870s. By the 1880s, the large migrations of caribou across the Lower Kuskokwim and Yukon Rivers had ceased.
Caribou numbers in the Mulchatna River area began to increase again in the early 1930s (Alaska Game Commission Reports, 1925–39), remaining relatively stable throughout that decade. There were indications that the herd began declining in the late 1930s (Skoog 1968); however, no substantive information was collected between 1940 and 1950 to support this theory.
Reindeer were brought into the northern Bristol Bay area during the early part of the 20th century to supplement the local economy and food resources. Documentation of the numbers and fate of these animals are scarce, but many local residents remember a widespread thriving reindeer industry before the 1940s. Herds ranged from the Togiak to the Mulchatna River drainages, with individual herders following small groups throughout the year. Suspected reasons for the demise of the reindeer herds include wolf predation and the expansion of the commercial fishing industry. Local residents also suggest that many reindeer interbred with Mulchatna caribou and eventually joined the herd.
Aerial surveys of the MCH range were first conducted in 1949, when the population was estimated at 1000 caribou (ADF&G files 1974). The population increased to approximately 5000

24
by 1965 (Skoog 1968). In 1966 and 1972 relatively small migrations across the Kvichak River were recorded; however, no major movements of this herd were observed until recently. An estimated 6030 caribou were observed during a survey in June 1973. In June 1974 a major effort was made to accurately census this herd. That census yielded 13,079 caribou, providing a basis for an October estimate in 1974 of 14,231 caribou.
We used photocensusing to monitor the herd as it declined in size through the 1970s. Seasons and bag limits were reduced continuously during that decade. Locating caribou during surveys was a problem, and biologists often underestimated the herd size. Twenty radio transmitters were attached to MCH caribou in 1981, providing assistance in finding postcalving aggregations. During a photocensus on 30 June 1981, 18,599 caribou were counted providing an extrapolated estimate of 20,618 caribou. Photocensus estimates of the MCH since then have been used to document population size. The aerial photocensus in 1996 provided a minimum estimate of 192,818 caribou in the MCH. Counts from the last aerial photocensus, in July 1999, indicated an estimated population of 175,000.
MANAGEMENT DIRECTION
MANAGEMENT OBJECTIVES To maintain a minimum population of 25,000 adults with a minimum bull:cow ratio of 35:100.
Additional objectives include:
Manage the MCH for maximum opportunity to hunt caribou
Manage the MCH in a manner that encourages range expansion west and north of the Nushagak River
METHODS We have conducted a photocensus of the MCH during the postcalving aggregation period in late June or early July in most years from 1980–1992. In recent years, the censuses have been scheduled on alternate years, occurring in even years. The photocensus planned for 1998 did not occur because of poor weather, and a photocensus was conducted July 1999. The department coordinates censuses out of the Dillingham area office in cooperation with personnel from Togiak National Wildlife Refuge (TNWR), Yukon Delta National Wildlife Refuge (YDNWR), and Lake Clark National Park (LACL). Biologists, using fixed-wing aircraft, radiotrack and survey the herd’s range, estimate the number of caribou observed, and photograph discrete groups using hand-held 35-mm cameras. Since 1994 we have photographed large aggregations with an aerial mapping camera mounted in a DeHavilland Beaver (DH-2) aircraft flown by department staff from Fairbanks. We estimate herd size by adding: 1) the number of caribou counted in photographs; 2) an estimate of caribou observed but not photographed; and, 3) the estimated number of caribou represented by radiocollared caribou not located during the census.
We conducted aerial surveys to estimate the sex and age composition of the herd with a Cessna 185 and Robinson R-44 helicopter in October. We captured and radiocollared MCH caribou in most years from 1980 to 1992. Beginning in 1992, collaring programs were scheduled for
25
alternating years, occurring in even years. Beginning in 1997, capture and radiocollaring efforts occurred only when funding was made available. Female calf caribou are captured using a helicopter and either net guns or drug-filled darts. These are usually cooperative efforts between the department and TNWR. During November 1998, YDNWR staff attempted to capture and radio-collar caribou when large numbers of the MCH occupied areas of Unit 18. Nine caribou were radiocollared during those efforts. In April 2000, eleven 10-month old female calves were darted and radiocollared west of Iliamna Lake.
Beginning in May 2000, intensive radiotracking surveys during calving were flown to determine the proportion of adult females calving. A fixed-winged aircraft was used to find calving concentrations and locate individual radiocollared adult females. Daily flights to relocate these individuals occurred until we could determine whether they had calved.
We conducted periodic radiotracking flights throughout this reporting period to continue the demographics study that began in 1981. Supplemental funding from the Bureau of Land Management (BLM) and U.S. Fish and Wildlife Service allowed us to schedule bi-monthly flights. Staff from BLM and USFWS enter radiotracking data from these flights into a statewide interagency GIS database.
We monitored the harvest and assisted Fish and Wildlife Protection in enforcement during late August and throughout September, when hunting pressure was most intense. Harvest data are collected from statewide harvest reports. Hunter "overlay" information prior to the 1998–99 season have not been entered into the statewide harvest information system. Beginning with the 1998-99 regulatory year, reminder letters have been sent to hunters who failed to report their caribou hunting activity.
RESULTS AND DISCUSSION
POPULATION STATUS AND TREND Between 1981 and 1996, the MCH increased at an annual rate of 17%. From 1992–1994, the annual rate of increase appeared to be 28%, but this was probably an artifact of more precise survey techniques. The dramatic growth of the herd is attributed to a succession of mild winters, movements on to previously unused range, relatively low predation rates, and an estimated annual harvest rate of less than 5% of the population since the late 1970s. From 1996 though 1999 no herd size information was available. The summer 1999 photocensus indicated the herd had declined from the peak, which probably occurred in 1996.
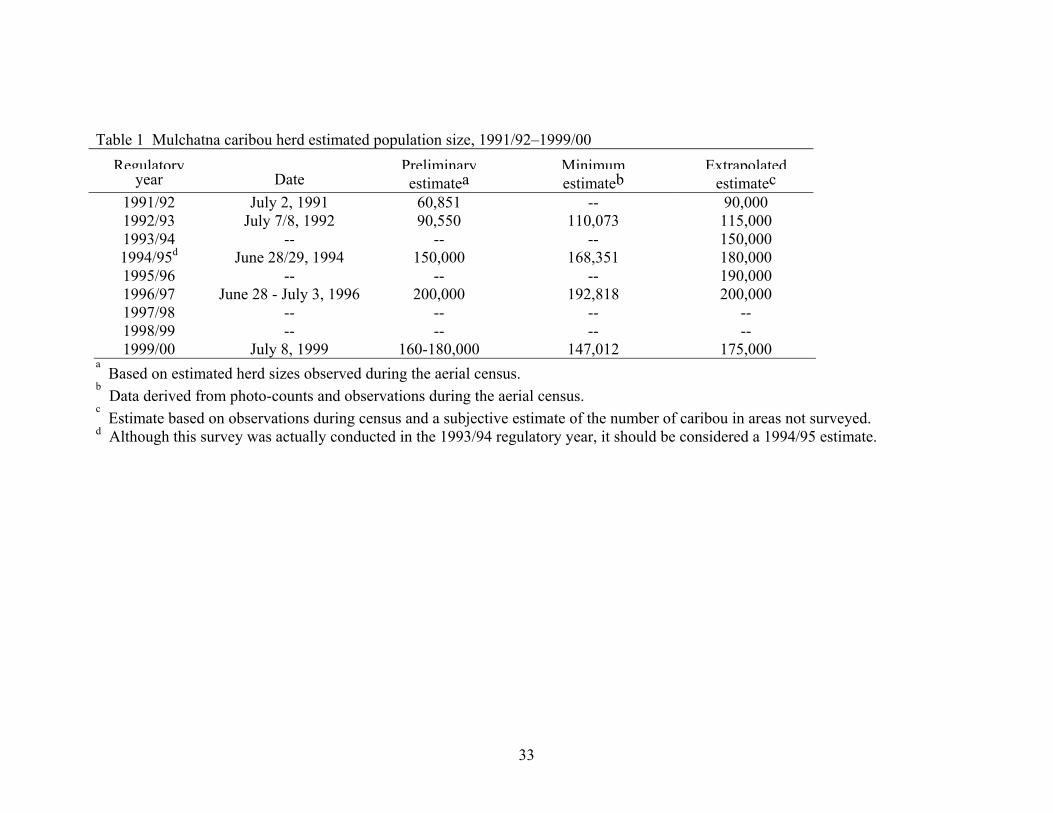
Population Size We conducted a photocensus of the MCH on 8 July 1999. Based on results of that survey, the population estimate for the MCH was 175,000 (Table 1). No aerial photocensus was conducted during the postcalving aggregation in June/July 2000. The MCH has probably declined as indicated by the 1999 estimate, but at the same time caribou distribution during the summers has become more widespread. It is possible that MCH caribou in other parts of southwest Alaska were not included in the 1999 census.
26
Population Composition We conducted a sex and age composition survey in the middle Nushagak River drainage on October 2, 1998. In 1999, composition surveys were conducted in the headwaters of the Kanektok and Goodnews Rivers (in GMU 18) on October 12 and in the middle Nushagak River drainage (GMU 17B&C) on October 20. Composition data from the 1999 surveys were pooled. (Table 2).
The fall bull:cow ratio consistently remained greater than the minimum objective of 35:100 until 1999 (Table 2). During the fall 1999 surveys, 52.3 bulls:100 cows were counted in the sample of 1,865 caribou in GMU 18. Only 19.1 bulls:100 cows were observed in the sample of 2,866 caribou in GMU 17B&C. The 1999 survey in GMU 17 occurred on October 20, and bulls were observed separate from the large groups. It is likely that the rut was already over by then, and only a minimum count of bulls obtained. The caribou located in GMU 17 were also subject to heavier hunting pressure during fall 1999 than the caribou in GMU 18, which could have contributed to the decreased bull:cow ratio.
The fall calf:cow ratio remained consistently greater than 30:100 until 1999 (Table 2). Unlike the 1999 survey results for the bull:cow ratio, the proportion of calves in both the GMU 18 sample (16.9 calves:100 cows) and GMU 17 sample (14.1 calves:100 cows) were similar.
Productivity Surveys Productivity surveys were flown during May 2000. A total of 23 radiocollared cow caribou that were of calf-bearing age, five 2-year old females (radioed as calves in October 1998), and nine 1-year old females (radioed as calves in April 2000) were located. Of the 23 adult cows, 16 were accompanied by calves, 5 had hard antlers but no calves, one had no antlers and no calf, and one cow was not visually observed. Presence of hard antlers during calving is generally considered evidence that the adult cow is pregnant. It appears that 21 of 22 radiocollared adult cow caribou in the MCH produced calves in May 2000.
Distribution and Movements The MCH has continued to increase its range even after its apparent peak in population size in 1996. To follow the movements of the herd, we had 52 caribou with radio collars that were active in July 2000. These included collars deployed in the Kilbuck caribou herd range when large numbers of Mulchatna caribou were in that area.
Wintering Areas. The most significant wintering area for the MCH during the 1980s and early 1990s was along the west side of Iliamna Lake, north of the Kvichak River. While there, MCH animals appeared to intermingle with caribou from the Northern Alaska Peninsula Caribou Herd (NAPCH). Analysis of radiotelemetry data indicated that the MCH had been moving its winter range to the south and west during most of the late 1980s and early 1990s (Van Daele and Boudreau 1992). Starting in the mid-1990s, caribou from the MCH began wintering in GMU 18 southwestern GMU 19B in increasing numbers.
The MCH did not move into the above described traditional wintering areas en mass during this reporting period but scattered throughout their range and beyond into previously unused land. During the falls of 1998 and 1999, large numbers of Mulchatna caribou traveled through

27
northwestern GMU 17A and southwestern GMU 19B, into the Kuskokwim Mountains, and eventually into GMU 17A and GMU 18. The greatest part of the herd wintered in GMU 18, south of the Kuskokwim River. Movement into these nontraditional wintering areas has probably decreased pressure on the forage supply in the more typical wintering areas. Another 10-20,000 caribou spent most of the winter of 1999/2000 in southern GMU 9B and southeastern GMU 17B, near the traditional wintering area.
Calving Areas. The MCH has changed its calving areas in recent years. Taylor (1988) noted the main calving area for the MCH included the upper reaches of the Mulchatna River and the Bonanza Hills. Small groups were also observed in the Jack Rabbit and Koktuli Hills, Mosquito River, and the Kilbuck Mountains. In 1992 only 10,000–15,000 adult female caribou were along the upper Mulchatna River, and fewer than 1000 were in the Bonanza Hills area. During that year, the Mosquito River drainages contained about 20,000 calving females, and an estimated 20,000 adult females were located near Harris Creek, northeast of the village of Koliganek. In 1994 most of the MCH females started using the area between the upper Nushagak River and upper Tikchik lakes for calving. In May 1996, 1997, and 1998, most of the cows from the MCH calved in the drainages of the King Salmon River and Klutuspak Creek of the upper Nushagak River. In May 1999, the drainages of the King Salmon River and Klutuspak Creek were still covered with snow, and the caribou continued to move south to the edge of the snow, between Klutuspak Creek and the Nuyakuk River. Most of the calving during 1999 occurred in an area within a 50-mile radius of the village of Koliganek. Calving during spring 2000 occurred in two distinct areas. An estimated 40-50,000 caribou in the lower Nushagak River, and an additional 60-70,000 caribou in the headwaters of the South Fork of the Hoholitna River.
Seasonal Movements. In May 1998 most of the cows in the MCH had once again returned from being scattered throughout western Alaska to calve in the area drained by the King Salmon River and Klutuspak Creek. By late June, most of the herd had moved eastward through the Nushagak Hills, through the Mosquito River drainage, and northeast up the Mulchatna River to the Bonanza Hills. On July 6, 1998 almost the entire herd was in the Snipe Lake-Twin Lakes–Telaquana Lake area. From mid-July through early August 1998, most of the MCH moved from the area east of the Mulchatna River, southeast into the lower drainage of the Nushagak River. By mid-August 1998, caribou were moving northward from the lower Nushagak River area and scattering throughout GMU 17B. Large numbers of caribou had also moved westward, into GMU 18 by mid-September. During fall and winter of 1998, Mulchatna caribou were scattered throughout northern GMU 17 and in GMU 18 south of the Kuskokwim River. By mid-April 1999, Mulchatna caribou started moving toward the calving area for that year, in southern GMU 17B and northern 17C. During mid-June most of the MCH moved through the Nushagak Hills, and by early July were in the Snipe Lake-Twin Lakes–Telaquana Lake area. The summer 1999 photocensus occurred while most of the herd was northeast of Lake Clark. Similar to the previous year, most of the caribou moved down into the lower Nushagak River drainage by late July 1999, and then northward throughout August. Mulchatna caribou were widely scattered throughout northern GMU 17, southern GMU 19B, and central GMU 18 during fall 1999. Most of the herd had moved over into GMU 18 by mid-October 1999, though there were at least 50,000 south of the village of Koliganek in GMU 17B. Some caribou wintered north and west of Iliamna Lake, but the major part of the herd spent winter 1999-2000 in GMU 18 south of the Kuskokwim River and GMU 17A. During mid-April 2000, large numbers of Mulchatna caribou traveled eastward from GMU 18, through the Wood River-Tikchik Lakes system to the calving

28
areas in the lower Nushagak River in GMU 17C and headwaters of the South Fork of the Hoholitna River in southern GMU 19B. By mid-summer 2000, most of the herd had moved through the Nushagak Hills and were heading eastward towards the Alaska Range north of Lake Clark.
Several peripheral groups appear to be independent from the main MCH. A group of about 1300 caribou resides between Portage Creek and Etolin Point. Caribou in the Kilbuck Mountains and in Rainy Pass seem distinct from the MCH, but there is overlap during the year. Radiotelemetry data confirmed another group that resides in the upper Stuyahok and Koktuli River drainages (Van Daele and Boudreau 1992, Van Daele 1994). These subherds periodically intermingle with the main herd, but they typically remain within their traditional ranges.
MORTALITY Harvest Season and Bag Limit. The hunting season for caribou in the area used by the MCH is August 1 through April 15 in Units 9B, 17B, 17C (east of the Wood River and Wood River lakes), 19A (south of the Kuskokwim River), and 19B. The bag limit for resident hunters is 5 caribou; however, no more than 2 can be bulls in Units 19A and 19B, and no more than 2 can be bulls from October 1 through November 30 in Units 9B, 17B, and 17C. The bag limit for nonresidents is 2 caribou. Unit 17A, the western portion of Unit 17C, and Unit 18 south of the Yukon River may be opened by emergency order when sufficient numbers of Mulchatna caribou enter those areas. Hunters may take caribou the same day they have been airborne from January 1 through April 15 in Units 9B, 17B, and that portion of Unit 17C east of the Nushagak River.
Board of Game Actions and Emergency Orders. During their spring 1999 meeting, the Alaska Board of Game added the MCH to the list of caribou herds considered important for high levels of human consumptive use for intensive management purposes. Three Emergency Orders for hunting Mulchatna caribou were issued during the 1998-99 regulatory year. An Emergency Order effective September 5, 1998 through March 31, 1999 opened caribou hunting in GMU 18 south of the Yukon River. An Emergency Order effective November 10 through December 15, 1999 opened caribou hunting in GMU 19D (excluding the Nixon Fork drainage). An Emergency Order effective November 14, 1998 through March 31, 1999 opened caribou hunting in GMU 17A west of the Togiak River and north of Pungokepuk Creek. One Emergency Order was issued in 1999, effective September 17, 1999 through March 31, 2000 opening caribou hunting in GMU 17A west of the Togiak River and north of Pungokepuk Creek, and in GMU 18 south of the Yukon River.
Hunter Harvest. The reported harvest from the MCH was 4,770 caribou during the 1998/99 hunting season and 4,467 during 1999/00 (Table 3). These totals and the number of hunters reporting hunting Mulchatna caribou increased from the previous several years, however 1998/99 was the first year reminder letters were sent to caribou hunters who had not returned harvest report cards. Distribution of the caribou during falls of 1998 and 1999 made hunting more difficult than in previous years. Several air taxi operations reported they informed hunters that caribou were not readily accessible from their base of operations and returned deposits. As in previous years, males composed most of the harvest each year (82% and 76%).

29
The unreported harvest for each year during this reporting period was estimated at an additional 5,000. This number should be viewed with some caution though. While reminder letters were sent to caribou hunters these years, caribou distribution likely resulted in increased hunting effort by village residents of GMU 18, who might be less likely to use harvest cards.
Most of the unreported harvest was attributed to local and other Alaska residents. Subsistence Division household surveys conducted in local villages from 1983 to 1989 indicated an estimated annual harvest of 1318 caribou (P. Coiley, ADFG-Subsistence, Dillingham). The number of caribou harvested by local residents has undoubtedly increased since the subsistence surveys because of increases in the range of the herd and number of people living in the surrounding villages. Unreported harvest by other Alaska residents is more difficult to quantify.
From the early 1980s through 1995, there was a steady increase in the number of caribou hunters in the range of the MCH during the fall season, yet reported harvest levels remained less than 5% of the total population. Harvests did not appear to be limiting herd growth or range expansion. In the mid-1990s, unpredictable caribou distribution caused decreased hunting effort in the areas traditionally considered used by the MCH. Increased reported hunting effort during this reporting period is probably the result of better reporting by hunters as well as an actual increase in hunting activity due to public knowledge of the size of the herd and widespread distribution.
Hunter Residency and Success. Nonresidents made up 56% of the reporting hunters during the 1998/99 season and 56% of the reporting hunters during 1999/00. Nonlocal Alaska residents accounted for 36% and local residents 8% of the hunters who returned harvest reports for 1998/99. In 1999/00 nonlocal Alaska residents accounted for 36%, and local residents 7% of hunters who returned harvest reports. Of the reporting hunters, 78% successfully harvested at least 1 caribou in 1998/99, and in 1999/00 72% were successful (Table 4).
Harvest Chronology. Most (80%) of the reported harvest in 1998/99 occurred during August and September, as did 76% in 1999/00. March was also an important month for harvesting caribou, accounting for 7% in 1998/99 and 8% in 1999/00 of the reported harvest and a large portion of the local unreported harvest. These data are comparable to the harvest chronology reported for previous years (Table 5).
Transport Methods. Aircraft were the most common means of hunter transport during the 1998/99 (82%) and 1999/00 (85%) hunting seasons (Table 6). Boats and snowmachines were other important means of transportation and were the main transportation methods for local hunters. These transport methods were probably underreported in our harvest data.
Other Mortality There were several observations and reports of wolf and brown bear predation on caribou during this reporting period. Predation rates on MCH have traditionally been low, but are probably increasing. Many local residents report increasing wolf numbers. A growing number of hunters along the Nushagak and Mulchatna Rivers reported having encounters with brown bears, including bears on fresh kills, on hunter-killed carcasses, and on raids in hunting camps. It appeared that individual bears were learning to capitalize on a newly abundant autumn food source. During fall 1998, reports of limping and dead caribou in the Mulchatna River drainage were received. Four caribou were collected and samples submitted for laboratory analysis. The

30
Washington State University Veterinary Pathology Lab was able to culture Fusobacterium necrophorum from tissue submitted. This bacterium causes necrobacillosis, or foot rot. An unknown number of caribou undoubtedly died during this short-lived outbreak of footrot, but the overall effect on the herd was probably negligible. No similar outbreak was reported the following year. The reason for the marked decline in the fall 1999 calf:cow ratio is unknown. A subjective estimate during June 1999 indicated calf numbers and proportions similar to previous years. The survey conducted in October 1999 resulted in the lowest calf:cow ratio observed in this herd to date.
HABITAT Assessment We have not objectively assessed the condition of the MCH winter range. Taylor (1989) reported the carrying capacity of traditional wintering areas had been surpassed by 1986/87, and it was necessary for the MCH to utilize other winter range to continue its growth. The herd has been using different areas at an increasing rate since that time.
Portions of the range are showing overt signs of heavy use. Extensive trailing is evident along migration routes. Some of the summer/fall range near the Tikchik Lakes is trampled and heavily grazed. Traditional winter range on the north and west sides of Iliamna Lake is also showing signs of heavy use. Many of the areas that the MCH is moving into have not been used by caribou for over 100 years, or reindeer for over 50 years. These areas appear to have vast quantities of essentially virgin lichen communities.
CONCLUSIONS AND RECOMMENDATIONS The minimum postcalving population estimates increased from 18,599 in 1981 to 192,818 in 1996, and declined to 175,000 in 1999. In 1994 the herd surpassed the Porcupine caribou herd in size, making the MCH the second largest caribou herd in the state. Distribution of this herd continued to expand throughout this period. Fall composition counts in 1998 indicated good calf production, while counts in fall 1999 indicated poor calf production or survival.
The total reported harvest and the number of hunters afield steadily increased through 1995, while annual harvests remained at less than 5% of the population. Decreases in the reported number of hunters during the preceding reporting period indicated an even smaller percent harvest. Increased reported hunting effort during this reporting period indicates that harvests remained at less than 6% of the herd. However, a better assessment of unreported harvest would be important if the herd begins to decline substantially. The MCH is an important source of meat and recreation for hunters throughout southcentral and southwest Alaska. Establishment of the 5 caribou bag limit, coupled with the reputation for large antler and body sizes, has made this herd increasingly popular with hunters. However, the mobility of the herd and the inaccessibility of much of its range to hunters make hunting logistics challenging.
During the past 15 years, the MCH has made dramatic changes in its range. In the early 1980s, the herd spent most of the year east of the Mulchatna River between the Bonanza Hills and Iliamna Lake. Their range now encompasses more than 60,000 mi.2, and large portions of the herd are pioneering new winter and summer ranges in good to excellent caribou habitat. There is

31
some evidence of localized overuse of habitat in some portions of the range, but most of the areas used by the MCH seem to be in good condition.
The tremendous growth rate of this herd continued to at least 1996, then the population experienced an apparent decline. Sign of stress in this herd might include the outbreak of footrot in 1998 and/or the decreased calf:cow ratios in fall 1999. Caribou in the adjacent NAPCH had a high incidence of lungworms in 1995 and 1996. We should continue to monitor the herd closely to watch for indications of continued population decline. Hunting regulations in most of the MCH range should remain liberal to take advantage of the meat resource available from this herd. The department should continue to assist hunters and air taxi operators by providing up-to-date information on the herd dynamics and distributing educational materials on caring for caribou meat while in the field.
Increased harvest pressure on the MCH is also affecting other big game populations in the area. Moose populations near villages are experiencing less pressure, and illegal moose harvests may be decreasing as local hunters increase their use of caribou meat. However, the increased number of caribou has also attracted more nonlocal hunters interested in "combination hunts." Consequently, the overall moose harvest in Unit 17 has doubled in the past 10 years. The Board of Game addressed this issue by imposing stricter bag limits on moose hunters in Unit 17 in an effort to divert hunting pressure away from the moose and onto caribou.
The MCH presents new management challenges as its size and range change. Since the main portion of the herd is migratory, using areas from the western slopes of the Alaska Range to the Kuskokwim and Yukon Rivers, it seasonally occupies ranges used by smaller resident caribou herds. These subherds, and new ones that establish themselves, may be the key to a quicker recovery from any future crash of the MCH. The MCH also overlaps with larger, more established herds as they move into the southern fringes of the Western Arctic caribou herd range and the northern portion of the NAPCH range. We should strive to recognize the impacts on these potentially unique demographic components when setting management objectives and proposing regulatory formulas.
Recommended management actions for the next few years include:
1 Conduct a biannual photocensus of the MCH during postcalving aggregations;
2 Conduct composition surveys annually during October. Sample sizes should be at least 5% of the estimated herd size and at least 2 distinct areas should be sampled;
3 Collect a sample of at least 10 yearling female caribou from the main winter range of the MCH each October or April to investigate body condition;
4 Conduct calving surveys in May of each year;
5 Monitor the movements of the MCH by locating radiocollared caribou at least 6 times each year;
6 Maintain at least 1 active radio collar per 2000 caribou in the MCH;
32
7 Develop an improved method of collecting harvest data, including unreported harvest;
8 Continue to work with other land and resource management agencies and landowners on MCH management activities and directions; and,
9 Work with local advisory committees and the state and federal boards to coordinate MCH hunting regulations with those for adjacent herds and develop contingency plans for managing the herd when the population begins to decline to low levels.
LITERATURE CITED ALASKA GAME COMMISSION. 1925–1939. Annual reports of the Alaska Game Commission to
the Secretary of the Interior. U.S. Fish and Wildlife Service, Juneau, Alaska.
SKOOG, R.O. 1968. Ecology of the Caribou (Rangifer tarandus granti) in Alaska. Ph.D. Thesis. University of California, Berkeley. 699pp.
TAYLOR, K.P. 1988. Mulchatna caribou survey and inventory report. Pages 3–6 in S. Morgan, ed. Annual report of survey-inventory activities. Vol. XVIII. Part XI. Progress Report, Project W-22-6. Job 3.0. Juneau. 73pp.
———. 1989. Mulchatna caribou survey and inventory report. Pages 8–16 in S. Morgan, Ed. Annual report of survey-inventory activities. Vol. XIX. Part XI. Progress Report, Project W-23-1. Job 3.0. Juneau. 173pp.
VAN DAELE, L.J. 1994. Status and seasonal movements of caribou near the Cominco Pebble Copper Mine Site, southwest Alaska, 1992–1993. Unpublished report to Cominco Exploration-Alaska by Alaska Department of Fish and Game. Dillingham. 36pp.
———, AND BOUDREAU, T. 1992. Caribou use of the proposed Cominco Pebble Copper Mine Site, Iliamna Lake, Alaska. Unpublished report to Cominco Exploration-Alaska by Alaska Department of Fish and Game. Dillingham. 19pp.
VAN STONE, J.W. 1988. Russian exploration in southwest Alaska: The travels journals of Petr Korsakovskiy (1818) and Ivan Ya. Vasilev (1829). The Rasmuson Library Historical Translation Series. Volume IV. Univ. Alaska Press. Fairbanks. 120pp.
PREPARED BY: SUBMITTED BY: James D. Woolington Steven Machida Wildlife Biologist Regional Management Coordinator
33
Table 1 Mulchatna caribou herd estimated population size, 1991/92–1999/00 Regulatory Preliminary Minimum Extrapolated
year Date estimatea estimateb estimatec 1991/92 July 2, 1991 60,851 -- 90,000 1992/93 July 7/8, 1992 90,550 110,073 115,000 1993/94 -- -- -- 150,000 1994/95d June 28/29, 1994 150,000 168,351 180,000 1995/96 -- -- -- 190,000 1996/97 June 28 - July 3, 1996 200,000 192,818 200,000 1997/98 1998/99 1999/00
-- --
July 8, 1999
-- --
160-180,000
-- --
147,012
-- --
175,000 a Based on estimated herd sizes observed during the aerial census.
b Data derived from photo-counts and observations during the aerial census.
c Estimate based on observations during census and a subjective estimate of the number of caribou in areas not surveyed.
d Although this survey was actually conducted in the 1993/94 regulatory year, it should be considered a 1994/95 estimate.
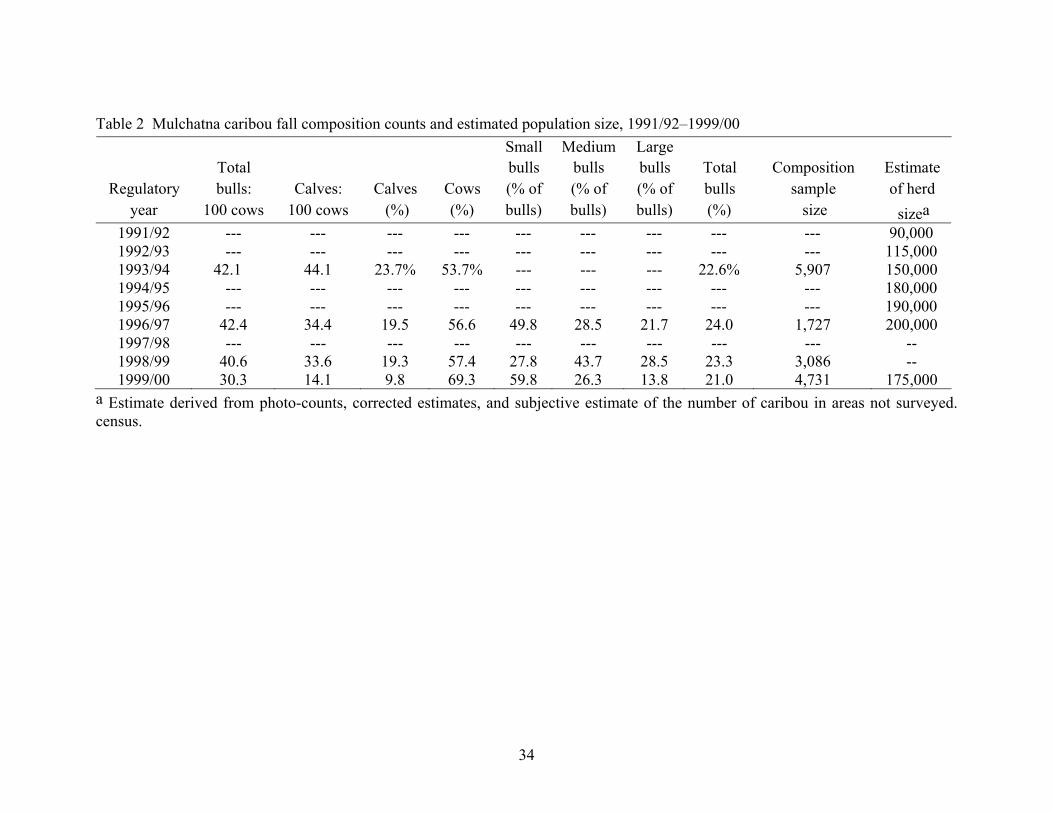
34
Table 2 Mulchatna caribou fall composition counts and estimated population size, 1991/92–1999/00
Small Medium Large Total bulls bulls bulls Total Composition Estimate
Regulatory bulls: Calves: Calves Cows (% of (% of (% of bulls sample of herd year 100 cows 100 cows (%) (%) bulls) bulls) bulls) (%) size sizea
1991/92 --- --- --- --- --- --- --- --- --- 90,000 1992/93 --- --- --- --- --- --- --- --- --- 115,000 1993/94 42.1 44.1 23.7% 53.7% --- --- --- 22.6% 5,907 150,000 1994/95 --- --- --- --- --- --- --- --- --- 180,000 1995/96 --- --- --- --- --- --- --- --- --- 190,000 1996/97 42.4 34.4 19.5 56.6 49.8 28.5 21.7 24.0 1,727 200,000 1997/98 --- --- --- --- --- --- --- --- --- -- 1998/99 1999/00
40.6 30.3
33.6 14.1
19.3 9.8
57.4 69.3
27.8 59.8
43.7 26.3
28.5 13.8
23.3 21.0
3,086 4,731
-- 175,000
a Estimate derived from photo-counts, corrected estimates, and subjective estimate of the number of caribou in areas not surveyed. census.

35
Table 3 Mulchatna caribou harvest and accidental death, 1991/92–1999/00 Hunter Harvest Regulatory Reported Estimated Total
year M (%) F(%) Unk. Totala Unreported Illegal Total Accidental death caribou 1991/92 86% 13% 1.1% 1,573 1,700 -- 1,700 -- 3,273 1992/93 74% 9% 17% 1,602 1,800 -- 1,800 -- 3,402 1993/94 80% 20% 0.4% 2,804 2,000 -- 2,000 -- 4,804 1994/95 78% 21% 0.7% 3,301 2,700 -- 2,700 -- 6,001 1995/96 75% 24% 0.6% 4,449 2,800 -- 2,800 -- 7,249 1996/97 78% 21% 1.0% 2,366 2,200 -- 2,200 -- 4,566 1997/98 1998/99b 1999/00
84% 82% 76%
15% 17% 23%
0.6% 1.0% 1.0%
2,704 4,770 4,467
2,400 5,000c 5,000c
-- -- --
2,400 5,000 5,000
-- -- --
5,104 9,770 9,467
a Includes only reported harvest from harvest cards b First year that reminder letters were sent to caribou hunters c Also includes minimum suspected unreported harvest from GMU 18

36
Table 4 Mulchatna caribou annual hunter residency and success, 1991/92–1999/00 Successful Unsuccessful
Regulatory Local Nonlocal Total Local Nonlocal Total Total year resident resident Nonresident (%) resident resident Nonresident (%) huntersa
1991/92 89c 562 599 85% 9 136 69 15% 1,464 1992/93 82c 542 651 91% 12 82 26 9% 1,391 1993/94 47c 718 725 86% 5 171 77 14% 2,394 1994/95 61
b 812 896 85% 11 227 124 15% 2,954
1995/96 52c 1,035 928 87% 15 188 86 13% 3,127
1996/97 56c 647 824 85% 25 139 101 15% 1,822 1997/98 1998/99 1999/00
85c
178c
174c
564 1,130 1,024
1,277 1,877 1,697
84% 78% 72%
33 142 120
178 320 453
152 414 553
16% 22% 28%
2,301 4,131 4,140
a Includes hunters of unknown residency, and hunters who reported harvesting more than one caribou. b Includes residents of Game Management Unit 17.
c Includes residents of communities within the range of the Mulchatna Caribou Herd.
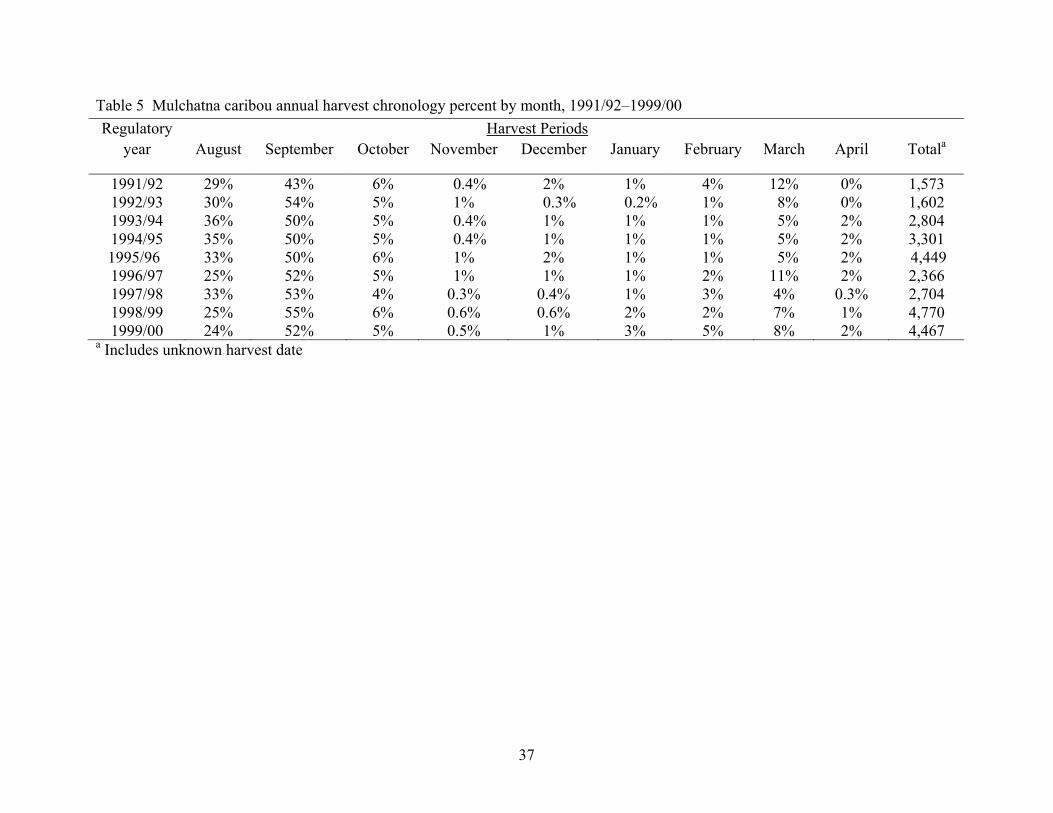
37
Table 5 Mulchatna caribou annual harvest chronology percent by month, 1991/92–1999/00 Regulatory Harvest Periods
year August September October November December January February March April Totala
1991/92 29% 43% 6% 0.4% 2% 1% 4% 12% 0% 1,573 1992/93 30% 54% 5% 1% 0.3% 0.2% 1% 8% 0% 1,602 1993/94 36% 50% 5% 0.4% 1% 1% 1% 5% 2% 2,804 1994/95 35% 50% 5% 0.4% 1% 1% 1% 5% 2% 3,301
1995/96 33% 50% 6% 1% 2% 1% 1% 5% 2% 4,449 1996/97 25% 52% 5% 1% 1% 1% 2% 11% 2% 2,366 1997/98 1998/99 1999/00
33% 25% 24%
53% 55% 52%
4% 6% 5%
0.3% 0.6% 0.5%
0.4% 0.6% 1%
1% 2% 3%
3% 2% 5%
4% 7% 8%
0.3% 1% 2%
2,704 4,770 4,467
a Includes unknown harvest date
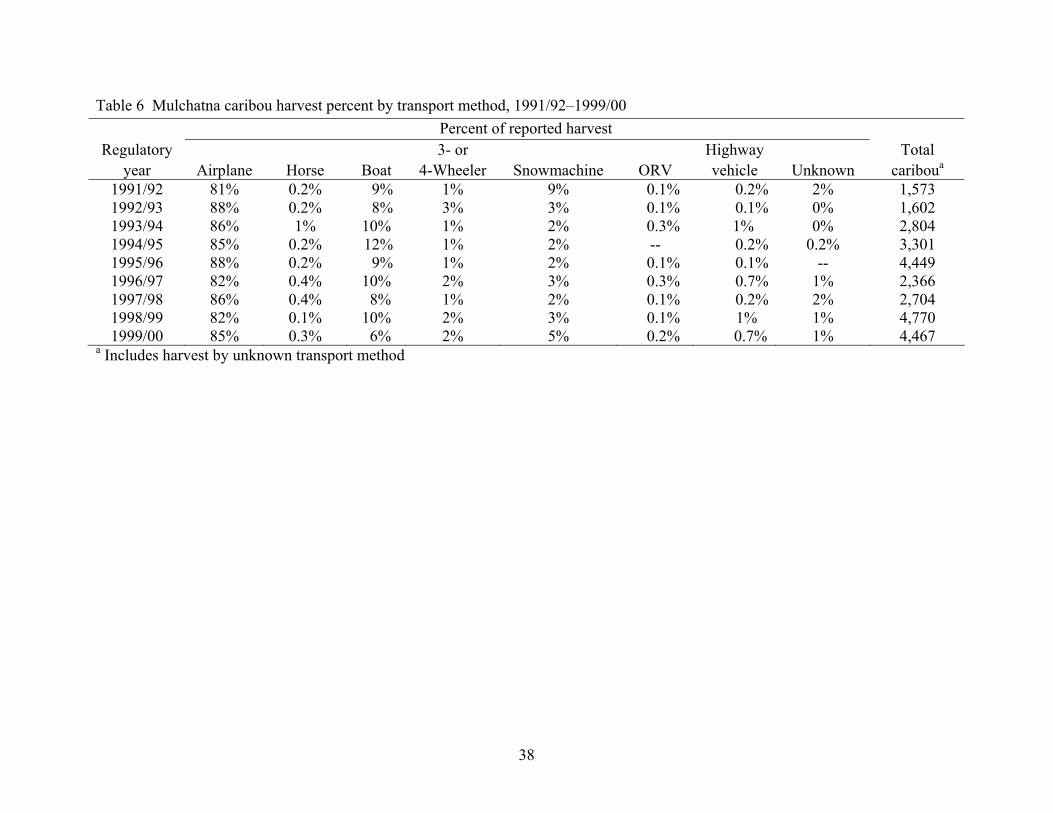
38
Table 6 Mulchatna caribou harvest percent by transport method, 1991/92–1999/00 Percent of reported harvest
Regulatory 3- or Highway Total year Airplane Horse Boat 4-Wheeler Snowmachine ORV vehicle Unknown cariboua
1991/92 81% 0.2% 9% 1% 9% 0.1% 0.2% 2% 1,573 1992/93 88% 0.2% 8% 3% 3% 0.1% 0.1% 0% 1,602 1993/94 86% 1% 10% 1% 2% 0.3% 1% 0% 2,804 1994/95 85% 0.2% 12% 1% 2% -- 0.2% 0.2% 3,301 1995/96 88% 0.2% 9% 1% 2% 0.1% 0.1% -- 4,449 1996/97 82% 0.4% 10% 2% 3% 0.3% 0.7% 1% 2,366 1997/98 1998/99 1999/00
86% 82% 85%
0.4% 0.1% 0.3%
8% 10% 6%
1% 2% 2%
2% 3% 5%
0.1% 0.1% 0.2%
0.2% 1%
0.7%
2% 1% 1%
2,704 4,770 4,467
a Includes harvest by unknown transport method
SPECIES Alaska Department of Fish and GameDivision of Wildlife Conservation
MANAGEMENT REPORT (907) 465-4190 PO BOX 25526 JUNEAU, AK 99802-5526
39
CARIBOU MANAGEMENT REPORT
From: 1 July 1998 To: 30 June 2000
LOCATION
GAME MANAGEMENT UNIT: 9C and 9E (19,560 mi2)
Herd: Northern Alaska Peninsula
GEOGRAPHIC DESCRIPTION: Alaska Peninsula
BACKGROUND The Northern Alaska Peninsula caribou herd (NAPCH) ranges throughout Subunits 9C and 9E. Historically, the size of this population has fluctuated widely, reaching peaks at the turn of this century and again in the early 1940s (i.e., 20,000 caribou). The last population low was during the late 1940s (i.e., 2000 caribou), by 1963 the herd had increased to over 10,000 animals (Skoog 1968). The first radiotelemetry-aided census in 1981 estimated 16,000 caribou; by 1984 the herd had increased to 20,000.
During the next several years, indicators such as the noticeable depletion of lichens and movements across the Naknek River were evidence that the traditional wintering area was overgrazed. In 1986 significant numbers of NAPCH animals began wintering between the Naknek River and Lake Iliamna, and there was reason to believe that excellent forage conditions in this region would sustain the NAPCH within the population objective of 15,000–20,000. However, up to 50,000 Mulchatna caribou also began using this area at about the same time. As both herds intermingled near Naknek and King Salmon, winter hunting pressure along the road system grew rapidly, and it became impossible to apportion the reported harvest between the 2 herds. Given this change in winter distribution of both herds and the increasing competition for winter forage, by the late 1980s it was decided that the NAPCH should be maintained at the lower end of the management objective (i.e., 15,000). During 1992–93 and 1993–94, harvests along the King Salmon road and trail system peaked, and many local residents complained about problems (wounded animals, gut piles, etc.) associated with a multiple bag limit hunt on the road system. Despite these problems, we viewed the large harvests as beneficial to reduce the NAPCH herd to 15,000 and to utilize the Mulchatna animals in the area. During 1993–94, the record harvest of 1345 caribou and natural mortality estimated at >30% combined to reduce the NAPCH to 12,500 by June 1994. The herd has continued to decline through this reporting period.
40
MANAGEMENT DIRECTION
MANAGEMENT OBJECTIVES Based on the history of this herd and the long-term objective of trying to maintain the NAPCH at a relatively stable level, we recommend reducing the midsummer population objective of 15,000–20,000 caribou to 10,000–12,000 with an October sex ratio of at least 25 bulls: 100 cows.
METHODS
POPULATION SIZE In late June 1997, 1998, and 1999 we used an R-22 helicopter and fixed-winged aircraft to conduct radiotelemetry-aided aerial photocensuses on postcalving concentrations. We took oblique 35mm photos of large groups to allow accurate enumeration. In addition, the Fish and Wildlife Service (FWS) surveyed peripheral areas along the Aleutian Mountains and Pacific coast. We determined the percent calves by direct enumeration or close-up photos of larger herds taken from the helicopter. We weighted the results by herd size to estimate total productivity.
POPULATION COMPOSITION We conducted sex and age composition surveys with a helicopter in October and classified caribou throughout their entire distribution between the Naknek River and Port Moller. Caribou were classified as calves, cows, small bulls, medium bulls, and large bulls.
PARTURITION SURVEYS During 31 May–1 June 1997 and 1998 and 3–5 June 1999, we used an R-22 or R-44 helicopter to classify caribou on the calving grounds as parturient cow (with calf, hard antlers or distended utter), nonparturient cow, yearling, or bull (Whitten 1995). We also observed radiocollared females to document their age-specific pregnancy rate. During 29 May–30 June 1998, we conducted a study on natality and early calf mortality (Sellers et al. 1998a).
RADIOTELEMETRY DATA We scheduled capture operations to maintain 25–30 functioning radio collars in the NAPCH. In April 1997 we used an R-22 helicopter to dart 14 female calves and 4 female yearlings. In October 1998, in a cooperative project with the FWS, we fitted 19 female calves and 2 female yearlings with standard radio collars (Sellers et al. 1998b). We also captured 6 adult females just north of Port Moller and fitted them with satellite collars. In October 1999 we captured 11 female calves (10 were fitted with standard radio collars) and 1 adult female (fitted with a satellite collar). We recorded standardized measurements, took blood samples, and radiocollared the calves. We periodically conducted radiotelemetry flights to monitor herd movement and survival rates of collared caribou.

41
HERD CONDITION In addition to weights and measurements of captured caribou, we collected 10 female calves in October 1996, 1997, and 1998 to obtain measurements and samples to assess body condition (Valkenburg et al. 1996, Valkenburg et al. in press). We noticed “pinhead” hemoragic lesions on a majority of lungs, so we collected several samples for submittal to a veterinary pathology lab. In late June 1998, we found and dispatched 2 debilitated calves in the Ilnik calving area and found 1 other that had recently died. All 3 were sent to the Washington Animal Disease Diagnostic Laboratory at Washington State University for necropsy.
MORTALITY The harvest was monitored by harvest ticket reports through 1998/99 and by Tier II permits during 1999/00. A cooperative (FWS; ADF&G, Subsistence Division; and Bristol Bay Native Association) harvest survey was conducted in villages in 9C and 9E for the 1994/95 through 1996/97 hunting seasons.
Survival rates of radiocollared females were estimated with the Kaplan-Meier method (Pollock et al. 1989)
RESULTS AND DISCUSSION
POPULATION STATUS AND TREND Minimum counts from photocensuses during 1981–1993 ranged between 15,000 and 19,000 caribou. Annual variations in counts were caused by actual changes in herd size and/or sampling error (restricted coverage due to poor weather or errors in visual estimates). Because of concerns regarding winter range quality, in the late 1980s we decided to keep the herd at the lower end of the management objective. The actual postcalving count dropped from a minimum of 16,500 in 1992 to 15,000 in 1993. The 1994 postcalving count, which involved extended coverage of fringe areas, only tallied 12,000 caribou. The herd began a decline in 1992, although at first the decline was not viewed with alarm because the herd was at the desired level. We anticipated that harvest pressure would decline due to liberalized regulations for the growing Mulchatna herd and closure of the King Salmon Air Force Base. Despite a series of hunting restrictions implemented starting in 1994 which did significantly reduce harvests, the herd has continued a gradual decline.
Population Size Over the past 14 years, the size of the NAPCH has been reported in 2 ways: the actual number of caribou counted during the postcalving photocensus, rounded to the nearest 100, and an estimated total herd size which included 1000 to 1500 "uncounted" caribou believed to be in fringe areas. Since 1995, staff of the Alaska Peninsula/Becharof Refuge have covered portions of the Aleutian Mountains and Pacific drainages. This area had not been counted since the early 1980s, so counts after 1995 represent a more complete "minimum count" than obtained from photocensuses in previous years. The same cooperative counts were conducted in 1997, 1998, 1999, and 2000, with total estimates of 10,000, 9,200, 8,600, and 7,200 (Table 1), respectively.
42
Population Composition During 1970–80 when the NAPCH was growing, the average fall ratio was 50 calves:100 cows (range = 45–56). During 1981–94, the fall ratio varied from 27 to 52 calves:100 cows and averaged 39. During 1995-98 the ratio averaged 30 (range = 24–38) calves:100 cows. During 1999 and 2000 we only counted 21 and 18 calves:100 cows (Table 1).
From 1990 to 1997, the bull:cow ratio averaged 42:100 (range 34–38); but since 1998 the ratio has dropped to an average of 36 bulls:100 cows (Table 1).
Distribution and Movements The NAPCH's primary calving grounds are in the Bering Sea flats between the Cinder and Bear Rivers. Traditionally, this herd wintered between the Ugashik and Naknek Rivers. Beginning in 1986 many caribou wintered between the Naknek River and the Alagnak River. They even went as far north as Big Mountain and upper Kaskanak Creek on both sides of Lake Iliamna, where they have intermingled with a portion of the Mulchatna herd. During the 1999–2000 winter, a substantial number of the NAPCH wintered north of the Naknek River, but few Mulchatna animals moved into the Naknek drainage.
MORTALITY Harvest Season and Bag Limits. The 1996–97 and 1997–98 resident seasons in Unit 9C were 10 August to 31 March with a bag limit of 4 caribou, not to include more than 1 cow. Seasonal limits were not more than 2 from 10–31 August, 1 during September–November and only by a hunter who had not previously taken a caribou, and after November 30 not more than 1 caribou could be taken per calendar month. In Unit 9E the resident bag limit was also 4 caribou, not to include more than 1 cow. Within the Pacific drainages of 9E southwest of Seal Cape, which opened on July 1, the bag limit was 2 bulls until August 10, after which either sex could be taken. In all of 9E the bag limit was 1 caribou during September–November. From 1–30 April the limit was 2 caribou. The 1996–97 and 1997–98 nonresident seasons in both 9C and 9E were 10 August to 31 October with a 1 bull limit.
Board of Game Actions and Emergency Orders. In response to the results of the 1998 post-calving census that indicated a continuing decline in the NAPCH, the department and the Naknek/Kvichak Fish and Game Advisory Committee requested an emergency meeting of the Board of Game in August. Other communities in 9E soon joined the call for reductions in the upcoming season. During a teleconference meeting on 11 August 1998, the Board curtailed the seasons and bag limits as follows: The resident bag limit was reduced to bulls only in both 9C and 9E. The nonresident season was closed in both 9C and 9E during 5–20 September, and in 9E the nonresident season was closed during October.
In March 1999 the Board of Game reviewed the status of the NAPCH and, with considerable public involvement, decided to institute a Tier II hunt with a 1 bull bag limit for the Naknek drainage portion of 9C and all of 9E. The Tier II hunt dates were August 10–September 20 and November 15–February 28 (in the Naknek Drainage) and November 1–April 30 in 9E.

43
Hunter Harvest. The 1998–99 reported harvest was 490 caribou, comprising 94% males, despite the bull-only bag limit. We believe that the emergency action by the Board of Game to reduce the nonresident harvest (see below) and the extra effort to apprise village residents of the herd’s decline has increased the level of reporting by all hunters. If correct, this change in reporting compliance makes extrapolating the total harvest problematic. Based on the lower availability of caribou to villages and reduced effort by nonlocal hunters, the harvest probably did not exceed 1000 caribou. During the 1999/2000 season, Tier II hunters reported killing 147 males and 8 illegal females (Table 2).
Hunter Residency and Success. The Board of Game’s emergency action curtailing the nonresident season in 1998 created a major change in distribution of reported harvest among users for 1998–99 compared to previous years. Nonresidents and nonlocal residents only accounted for 29% and 28% of the reported harvest (Table 3). When unreported harvest is factored in, it is likely that local residents accounted for 70% of the harvest. Under the Tier II hunt in 1999–2000, 68% of those that reported hunting were successful, and local hunters took 97% of the reported harvest.
Harvest Chronology. September has historically been the most important month, especially for nonresidents, because of the combination of relatively good weather conditions, the best chance to harvest a trophy bull, and relatively easy access by boat and aircraft. The subsistence harvest has been primarily opportunistic, and chronology of harvests varies between villages depending upon caribou availability.
In 1998–99 a higher percentage of the harvest was taken during winter due to restrictions in the fall nonresident season and favorable travel conditions during that winter (Table 4). Under the 1999–2000 Tier II permit hunt, September still accounted for the highest harvest, but by a far smaller margin than in previous years.
Transportation Methods. Prior to 1999 airplanes were the most important method of transportation reported from harvest tickets (Table 5). The emergency curtailment of the fall 1998 season reduced the proportion of reported harvest attributed to aircraft transportation. Under the Tier II hunt in 1999, the importance aircraft dropped dramatically. The level of snowmachine use varies annually depending on snow conditions.
Other Mortality The radio collars placed on the NAPCH cows were designed to facilitate annual postcalving photocensuses, so mortality censors were not used in some transmitters. Telemetry flights were sporadic. These 2 factors preclude precise dating of natural mortalities or determining the cause of death. There appears to be a higher rate of natural mortality of adult females in recent years. From October 1980 through March 1984, the average annual mortality rate was approximately 7%. During the next 4 years the annual mortality rate averaged 18%. Annual mortality rates, using modified Kaplan–Meier procedures, from 1992 to 1998 were 29%, 35%, 20%, 19%, 20%, and 24%, respectively. In October 1998, 19 calves and 2 yearlings were collared throughout the range of the NAPCH, and by June 1999 71% were dead. Because radio collars were not retrieved until June 1999, evidence of the cause of death was scant, but most deaths from the NAPCH were on winter range, ruling out bear predation in most cases. Evidence of wolf activity was

44
present at several carcasses, but we could not confirm whether predation or merely scavenging occurred. Seven of 8 (87%) calves collared in October 1999 died during the following year. Only 2 of 9 (22%) collared caribou older than calves died during the same period.
We reported the results of a calf mortality study conducted during June 1998 in Sellers et al. 1998a. During the first month of life, 35% of radiocollared calves (n = 37) died. Predators, primarily brown bears (Ursus arctos), bald eagles (Haliaeetus leucocephalus), and wolves (Canis lupus) caused most of the mortality of calves <2 weeks old, but disease apparently was an important mortality factor in calves >3 weeks old.
HABITAT AND ANIMAL CONDITION Assessment Little quantitative data are available to assess range conditions. Visual assessment of winter range condition based on the abundance of lichens in the early 1980s clearly noted a difference between the traditional range south of the Naknek River and areas between the Naknek River and Lake Iliamna. This difference was confirmed in a reconnaissance survey comparing lichen abundance in several areas on the traditional range with areas close to the King Salmon-Naknek road that still receives minimal use by caribou (R. Squibb, FWS, King Salmon pers commun).
Based on our preliminary analysis of data (i.e., weights and body size) from the caribou translocated in 1988 and from animals captured in April 1990, 1992, 1994, NAPCH adult females are intermediate in body size and condition between the Southern Alaska Peninsula herd (SAPCH) and Mulchatna herd animals (Pitcher et al. 1990). Progeny of the translocated caribou on the Nushagak Peninsula are larger than animals from the parent NAPCH (ADF&G unpublished data and Hinks and VanDeale 1994).
Weights of neonate calves captured in 1998 and 1999 averaged 8.4 and 7.2 kg for males and females, respectively. These weights are intermediate compared to other herds in the state.
During 1995–98 we captured female calves and collected female calves every October to further assess body condition, looking for differences over time and to make comparisons with other herds. Weights and percent bone marrow fat of female calves collected in October are also intermediate, but a high percentage of these caribou showed lesions from lungworms. In October 1999 11 captured female calves weighted an average of 114.2pounds.
Age-specific productivity has also been monitored since 1997. This work has been reported by Valkenburg et al. (1996 and in press) and Sellers et al. (1998a, 1998b, 1999 and 2000). Overall, this work demonstrates that the NAPCH is under moderate nutritional stress. No 2-year-old females have produced calves (n = 25) and only 33% of 3-year-olds (n = 18) have been pregnant. Overall pregnancy rates are relatively low at less than 80%.
NONREGULATORY MANAGEMENT PROBLEMS/NEEDS A panel of caribou biologists chose this herd for experimental management because the NAPCH has been relatively stable for the past 30 years at a moderately high density and because of its importance to a variety of hunters. The panel proposed maintaining the population at 15,000–

45
20,000 indefinitely and closely monitoring the herd, including population composition, distribution, and animal condition.
Recent advances in monitoring the condition of caribou herds (P. Valkenburg, memo dated 4 January 1995) include collecting or radiocollaring only female calves. The rationale for handling female calves is that they better reflect range quality and weather stress because their body condition is more sensitive and is not influenced by maternal status as are adult cows. Additionally, collared female calves will provide data on age at first parturition, which has proven to be a good indicator of nutritional status. In conjunction with determining the age of first reproduction for radiocollared calves, parturition surveys conducted just before peak calving (K. R. Whitten, memo dated 3 January 1995) provide a measure of natality rate. These procedures were implemented for the NAPCH in 1995 and will be followed in the future.
During routine postcalving counts in 1995 and 1996, several recently dead calves were located and necropsied. Pneumonia, as evidenced by purulent abscesses in the lungs, was the apparent cause of death and was confirmed as bacterial bronchopneumonia by a diagnostic lab (R. Zarnke, pers commun). When we collected calves in October 1995–98, most calves exhibited numerous small pinhead hemorrhagic spots on the lungs. A veterinary pathology lab identified these as consistent with lungworm-induced pneumonia.
Given the potential for marginal nutrition and possible linkage to disease, it will be important to monitor the condition of NAPCH animals. Any indication of declining productivity should be detected immediately.
CONCLUSIONS AND RECOMMENDATIONS The NAPCH has continued to decline below the population objectives, and further significant declines are an ongoing concern. Harvests and population parameters need to be monitored closely. The NAPCH has been designated a population important for high levels of human consumption. Governed by the state’s Intensive Management law, a review of intensive management options was triggered in March 1999 when the Board of Game significantly reduced harvest under a Tier II permit hunt. This review occurred in October of 1999. A new long-term population objective of 12,000 to 15,000 animals has been recommended to the Board of Game. To minimize the ongoing decline of this herd, harvests, particularly of cows, must be reduced. The number of Tier II permits was reduced from 600 in 1999 to 400 in 2000. Additional cuts in the number of these permits may be necessary depending on estimates of herd size, productivity and the bull:cow ratio.
LITERATURE CITED HINKS, M. T. AND L. J. VANDAELE. 1994. Population growth and status of the Nushagak
Peninsula caribou herd following reintroduction, southwest Alaska, 1988–93. Submitted. Proceedings of 6th North American Caribou Workshop.
PITCHER, K., C. DAU, D. JOHNSON, R. SELLERS, R. WEST. 1990. Causes of low calf recruitment in the Southern Alaska Peninsula caribou herd and recent herd history. Research Progress Report. Alaska Dept. of Fish and Game, Juneau. 22pp.
46
POLLOCK, K.H., S.R. WITERSTEIN, and C.M. BUNCK. 1989. Survival analysis in telemetry studies: the staggered entry design. Journal of Wildlife Management 53:7-15.
SELLERS, R.A., P. VALKENBURG, R.L. ZARNKE, R.C. SQUIBB. 1998a. Natality and early calf mortality of Northern Alaska Peninsula Caribou. Final Report. Cooperative Agreement 98–079.
———, ———, ———, ———, M. ROY. 1998b. Fall sex/age composition, body condition, disease screening and collaring of Northern and Southern Alaska Peninsula caribou Herds, 1998. Final Report. Cooperative Agreement 99–014.
———, ———, R. SQUIBB, M. ROY, B. DALE. 1999. Survival, natality, and calf weights of caribou on the Alaska Peninsula. 1998–99. Final Report. Cooperative Agreement 99–017
———, ———, B DALE, R. SQUIBB, M. ROY. 2000. Fall sex/age composition, genetic screening and collaring of Northern and Southern Alaska Peninsula Caribou Herds. Final Report. Cooperative Agreement 00–020.
SKOOG, R. O. 1968. Ecology of caribou (Rangifer tarandus granti) in Alaska. Ph.D. Thesis. Univ. of California, Berkeley, CA. 699pp.
VALKENBURG, P., VERHOEF, J. M., AND ZARNKE, R. L. 1996. Investigation and improvement of techniques for monitoring recruitment, population trend, and nutritional status in the Western Arctic Caribou Herd. Alaska Department of Fish and Game. Federal Aid in Wildlife Restoration Final Report. Project W-24-1, W-24-2, W-24-3, W-24-4. Juneau. 53 pp.
WHITTEN, K. R. 1995. Antler loss and udder distention in relation to parturition in caribou. Journal of Wildlife Management 59(2): 273–277.
PREPARED BY: SUBMITTED BY: Richard A. Sellers Michael G. McDonald Wildlife Biologist Assistant Management Coordinator
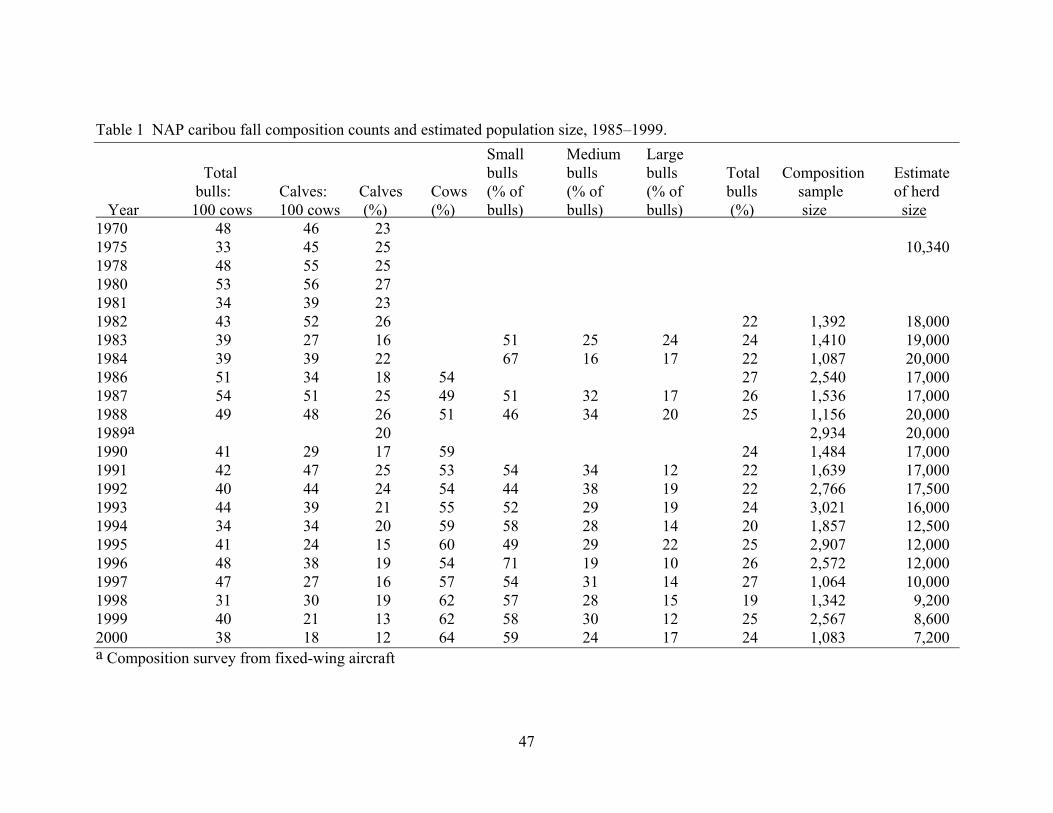
47
Table 1 NAP caribou fall composition counts and estimated population size, 1985–1999. Small Medium Large Total bulls bulls bulls Total Composition Estimate bulls: Calves: Calves Cows (% of (% of (% of bulls sample of herd Year 100 cows 100 cows (%) (%) bulls) bulls) bulls) (%) size size 1970 48 46 23 1975 33 45 25 10,340 1978 48 55 25 1980 53 56 27 1981 34 39 23 1982 43 52 26 22 1,392 18,000 1983 39 27 16 51 25 24 24 1,410 19,000 1984 39 39 22 67 16 17 22 1,087 20,000 1986 51 34 18 54 27 2,540 17,000 1987 54 51 25 49 51 32 17 26 1,536 17,000 1988 49 48 26 51 46 34 20 25 1,156 20,000 1989a 20 2,934 20,000 1990 41 29 17 59 24 1,484 17,000 1991 42 47 25 53 54 34 12 22 1,639 17,000 1992 40 44 24 54 44 38 19 22 2,766 17,500 1993 44 39 21 55 52 29 19 24 3,021 16,000 1994 34 34 20 59 58 28 14 20 1,857 12,500 1995 41 24 15 60 49 29 22 25 2,907 12,000 1996 48 38 19 54 71 19 10 26 2,572 12,000 1997 47 27 16 57 54 31 14 27 1,064 10,000 1998 31 30 19 62 57 28 15 19 1,342 9,200 1999 40 21 13 62 58 30 12 25 2,567 8,600 2000 38 18 12 64 59 24 17 24 1,083 7,200 a Composition survey from fixed-wing aircraft
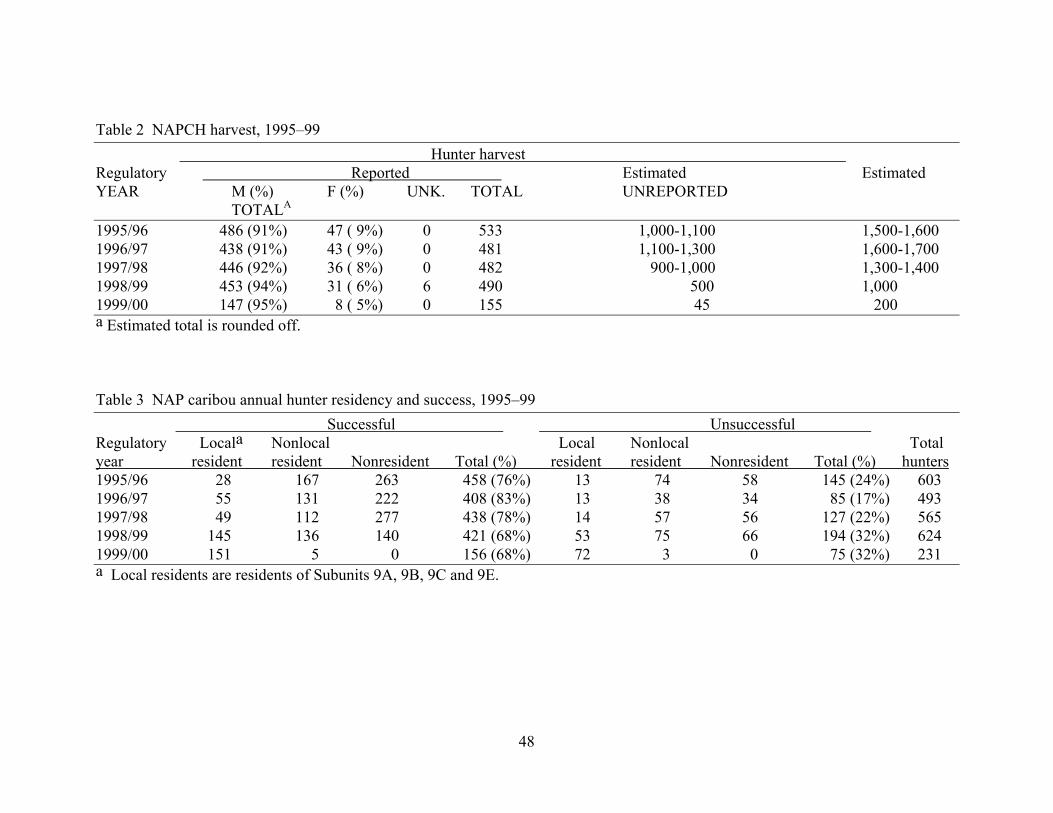
48
Table 2 NAPCH harvest, 1995–99 Hunter harvest Regulatory Reported Estimated Estimated YEAR M (%) F (%) UNK. TOTAL UNREPORTED TOTALA 1995/96 486 (91%) 47 ( 9%) 0 533 1,000-1,100 1,500-1,600 1996/97 438 (91%) 43 ( 9%) 0 481 1,100-1,300 1,600-1,700 1997/98 446 (92%) 36 ( 8%) 0 482 900-1,000 1,300-1,400 1998/99 453 (94%) 31 ( 6%) 6 490 500 1,000 1999/00 147 (95%) 8 ( 5%) 0 155 45 200 a Estimated total is rounded off. Table 3 NAP caribou annual hunter residency and success, 1995–99 Successful Unsuccessful Regulatory Locala Nonlocal Local Nonlocal Total year resident resident Nonresident Total (%) resident resident Nonresident Total (%) hunters 1995/96 28 167 263 458 (76%) 13 74 58 145 (24%) 603 1996/97 55 131 222 408 (83%) 13 38 34 85 (17%) 493 1997/98 49 112 277 438 (78%) 14 57 56 127 (22%) 565 1998/99 145 136 140 421 (68%) 53 75 66 194 (32%) 624 1999/00 151 5 0 156 (68%) 72 3 0 75 (32%) 231 a Local residents are residents of Subunits 9A, 9B, 9C and 9E.

49
Table 4 NAP caribou annual harvest chronology percent by month 1995–99 Regulatory Harvest periods year August September October November December January February March April n 1995/96 18 43 23 4 4 2 1 1 0 533 1996/97 19 36 21 4 5 6 3 4 0 477 1997/98 11 50 23 1 5 4 4 2 0 454 1998/99 16 31 12 6 8 8 8 6 1 490 1999/00 14 23 0 8 13 19 16 6 0 124 Table 5 NAP caribou harvest percent by transport method, 1995–99 Percent of harvest Regulatory 3- or Highway year Airplane Horse Boat 4-Wheeler Snowmachine ORV vehicle 1995/96 57 0 19 13 0 1 9 1996/97 46 0 22 16 3 3 10 1997/98 53 0 21 15 4 2 5 1998/99 33 0 21 25 10 1 9 1999/00 3 0 15 52 19 2 10
SPECIES Alaska Department of Fish and GameDivision of Wildlife Conservation
MANAGEMENT REPORT (907) 465-4190 PO BOX 25526 JUNEAU, AK 99802-5526
50
CARIBOU MANAGEMENT REPORT
From: 1 July 1998 To: 30 June 2000
LOCATION
GAME MANAGEMENT UNITS: 9D and 10 (Unimak Island) (6,435 mi2)
HERD: Southern Alaska Peninsula
GEOGRAPHIC DESCRIPTION: Southern Alaska Peninsula and Unimak Island
BACKGROUND The range of the Southern Alaska Peninsula caribou herd (SAPCH) includes the Alaska Peninsula southwest of Port Moller and Unimak Island. There have been numerous reports of caribou moving between Unimak Island and the mainland, including what may have been a substantial emigration in 1976. Historically, the size of the SAPCH has varied widely, ranging from 500 to over 10,000. Skoog (1968) speculated that the Alaska Peninsula was marginal habitat for sustaining large caribou populations because of severe icing conditions and ash from frequent volcanic activity affecting food supply and availability. Recent herd history includes growth from 1975 to 1983 and decline from 1983 to 1996. Numbers of caribou on Unimak Island have also varied substantially, ranging from 5000 in 1975 to 300 during the 1980s.
Harvest of the SAPCH was fairly high from 1980–1985, probably exceeding 1000 in several years. Starting in 1986 restrictive regulations reduced harvests as the herd continued to decline. By 1993 the herd was below 2500 and all hunting was closed. Poor nutrition appears to have played a major role in the decline of the SAPCH. Predation by wolves and brown bears and human harvest may also have contributed to the decline (Pitcher et al. 1990).
MANAGEMENT DIRECTION
MANAGEMENT OBJECTIVES A cooperative, interagency (the Department and the U.S. Fish and Wildlife Service [FWS]) management plan was adopted in April 1994. This plan sets the following population and management objectives:
1 Sustain a total population of 4000–5000 animals
2 Maintain a fall bull:cow ratio of 20–40:100
3 Discontinue harvest when the herd is below 2500 animals

51
4 Provide limited harvest of bulls when the herd exceeds 2500 animals as long as there are at least 20 bulls:100 cows
5 Phase in cow harvests when the population reaches 3500. If the population reaches 4000, harvests will be increased to prevent further growth.
METHODS In most years since 1984, we conducted a postcalving aerial radiotelemetry survey in late June or early July. We periodically conduct fall sex and age composition surveys with a helicopter in October. Occasional radiotracking flights are used to monitor herd distribution. Staff of the Izembek National Wildlife Refuge (INWR) periodically conduct winter aerial counts along systematic transects. A study of causes of low calf recruitment in the SAPCH was completed during 1989–1990 (Pitcher et al. 1990), and range conditions were studied in 1991 and 1992 (Post and Klein 1999). We began parturition surveys in June 1997. In April 1997 and October 1998, in cooperative projects with the FWS, we captured and radiocollared females calves. In October 1998 we also captured 8 adult females in northeastern 9D and fitted them with satellite radio collars. During 1999, with substantial funding from the FWS, we conducted a study of caribou productivity and calf survival (Sellers et al. 1999).
RESULTS AND DISCUSSION
POPULATION STATUS AND TREND Following a peak of over 10,000 caribou in 1983, the SAPCH began a precipitous decline. By 1993 the herd was below the 2500 threshold for which a cooperative department and FWS management plan specified all hunting was to be closed. The population appeared to stabilize during the mid 1990s, and then began to grow slowly through 1999.
Population Size In February 1998 the FWS counted 3127 caribou within the core area in Unit 9D. No postcalving count was attempted in summer 1998. During 26–29 June 1999 I completed an expanded postcalving photo count of the SAPCH and counted 3612 caribou in Unit 9D. During 27–28 June 2000 I only counted 2,857 caribou despite locating all the functioning radiocollars.
On January 17, 1997 the FWS counted 603 caribou on Unimak Island. This has been the only comprehensive survey of Unimak Island in over 2 decades. On May 22, 2000 Rod Schuh, a registered guide who has hunter on Unimak for several years, counted 983 caribou on the north and west sides of Unimak Island. That count and the number classified during the October 2000 fall composition surveys suggest that there are over 1000 caribou on Unimak.
Population Composition
During the June 1997 postcalving count, approximately 15% of the 1844 caribou were calves. The fall helicopter survey in 1997 showed 12% (n = 686) calves (Table 1). Ratios were 42 bulls
52
and 19 calves per 100 cows. During June 1998 the FWS classified 518 caribou from a single herd estimated at 900 caribou at Black Hill and found 21% were calves. Considering that typically the caribou using the Caribou River Flats (CRF) are more productive than those near Black Hill/Trader Mountain (BHTM) (Pitcher et. al 1990, Sellers 1993, 1995), calf production in 1998 was higher than in most recent years. This was confirmed in October 1998 when a sample of 987 caribou was classified with ratios of 35 calves and 32 bulls per 100 cows.
Calves composed 26% of all caribou seen during the 1999 postcalving count. In June 2000, calves composed 28% of caribou seen on the Caribou River Flats (n = 1077) and 22% of 1780 caribou found elsewhere.
Fall composition surveys in 1999 showed a ratio of 25 claves:100 cows in 9D (Table 1). Productivity was higher on Unimak Island (46 calves:100 cows), but we only classified 126 caribou.
Distribution and Movements Data from radiotracking surveys conducted by staff from both INWR and the department indicate that the SAPCH calves were in 2 main subgroups in separate areas (Pitcher et al. 1990). Approximately 25% of the herd calves on the CRF. Many of these animals are relatively sedentary and remain in the area throughout winter. However, some have been located during the winter near Cold Bay. The remainder of the herd calves in the BHTM area and winters around Cold Bay. Further radiotelemetry studies will be needed to clarify the discreteness of the 2 major calving components of this population. Additionally, a few caribou calve in the mountains east of the CRF.
Since the early 1980s, caribou in Unit 9D have been presumed to be part of the SAPCH, and all caribou in Unit 9E have been counted as part of the Northern Alaska Peninsula caribou herd (NAPCH). During recent deliberations over whether a special federal subsistence hunt should be granted, local residents were skeptical about the fate of the SAPCH. Two general opinions, not withstanding the obvious contradiction, were voiced about why both our postcalving counts and the INWR winter surveys show a steady decline. Some members of the public contended that the herd had not declined at all and that the caribou were now using numerous valleys on the Pacific side of the Peninsula. The distribution of radiocollared cows does not support that claim. Conversely, other local residents claimed that the “missing” caribou simply migrated north into the range of the NAPCH. This theory does not explain how the NAPCH could have absorbed a significant number of SAPCH animals during a period when the NAPCH was declining. No radiocollared SAPCH animals have been located north of Unit 9D, but empirical evidence of this distinction has been scant because of the difficulty in collaring and following caribou in this remote part of the Alaska Peninsula.
In October 1998, 6 caribou in the extreme southeastern corner of Unit 9E and 8 caribou in the northeastern portion of Unit 9D were fitted with satellite collars to further investigate whether interchange between herds occurred in this area. As of June 2000, none of these caribou has moved from the unit where captured. Further tracking of these caribou is planned. Genetic testing for interbreeding among caribou in 9E, 9D, and Unimak Island is planned. Exchange of caribou between Unimak Island and the mainland has not been documented in recent years.
53
MORTALITY Harvest Season and Bag Limits. There was no state hunt in Unit 9D or Unimak Island during 1993–98. In 1999 a state hunt was resumed in 9D with a resident season from 1–20 September and 15 November–31 March, with a 1 caribou limit. A registration permit hunt was set for nonresident during 5–25 September, with a quota of 50 bulls.
Board of Game Actions and Emergency Orders. The Board of Game took no action during 1995–98. At the spring 1999 meeting, they reinstituted a state hunt for the 1999–00 season.
Federal Subsistence Board Actions. In 1997, following the FWS count of 3243 caribou in Unit 9D and 603 on Unimak Island, the Federal Subsistence Board (FSB) approved a special action request from the Kodiak–Aleutian Federal Regional Subsistence Advisory Council. They established a federal registration permit hunt for bull caribou, with a total of 100 permits distributed among villages in 9D (35 permits to King Cove, 35 to Sand Point, 15 to Cold Bay, and 15 to Nelson Lagoon) and 60 permits available in False Pass on Unimak Island. The 1997 season dates were set as 10 August to 31 March on Unimak Island and 10 November to 31 March in 9D. The department supported the hunt on Unimak but opposed the hunt in 9D because of continued low productivity, high natural mortality, the inexplicable jump in counts from 1995 and 1996 to the April 1997 survey, and the discrepancy between the April survey and 2 summer counts in 1997. The hunt proceeded, but due to poor weather and other factors, harvests by some villages were low. On 31 March 1998, King Cove made a Special Action Request to extend the season by an additional month. The FSB approved this request with no objection from the department.
During summer 1998, the FSB again considered and approved a Special Action Request to expand the federal subsistence hunt in 9D and on Unimak Island from 1 August through 31 March. The number of available permits was expanded for 9D and Unimak to 235.
Following the Board of Game’s action in March 1999 to establish a general resident state season, the FSB dropped the federal subsistence hunt in 9D and later opened federal lands to nonlocal hunters.
Hunter Harvest. The reported harvests from the 1997-98 and 1998-99 federal subsistence registration hunts were 32 and 23, respectively, but the reporting rate averaged 60% for both years. No data is available for the number of caribou taken on Unimak Island under federal hunts during 1997-99. In 1999 under state regulations for 9D, 17 nonresidents obtained registration permits and killed 12 bulls. Local residents reported killing 28 caribou, including 24 bulls, and nonlocal hunters took 15 bulls and 4 cows in 9D.
Other Mortality Annual survivorship of radiocollared adult females from the SAPCH was estimated at 0.61 from 1987–90, which was extremely low compared to other Alaska caribou herds (Pitcher et al. 1990). Causes of death were not determined, although predation by wolves and bears was suspected. Both predators were relatively abundant on the SAPCH range. During 1990–94 average annual survival rate of radiocollared caribou increased to approximately 0.86. This apparent reduction in
54
mortality may have reflected a younger average age of the collared caribou and reduced abundance of wolves after the 1990 rabies outbreak. Annual survival rates were 0.71 from June 1994 through May 1995 and 0.87 from June 1995 through May 1996. The survival rate for 13 calves and 1 yearling from October 1998 through June 1999 was 93%.
During June–August 1999, 66% of 49 radiocollared calves died of natural causes (Sellers et al. 1999). Wolves (Canis lupus) and brown bears (Ursus arctos) killed most of the calves for which the cause of death was determined.
HABITAT Assessment Observations before 1990 indicated that lichens were scarce throughout the range of the SAPCH and that spring phenology was later in Unit 9D than within the calving areas of the NAPCH in Unit 9E.
A preliminary analysis of fecal pellets showed very high use of mosses (Pitcher et al. 1990), possibly indicating poor range condition. Pitcher et al. (1990) reported that adult female caribou from the SAPCH were smaller and weighed less than cows from either the NAPCH or Mulchatna herds.
Caribou productivity appears higher on the Caribou River flats than within the Black Hills. Post and Klein (1999) rejected the hypothesis that this difference in productivity was related to winter range because caribou wintering on the Caribou River flats had similar diets to those caribou wintering nearer to Cold Bay. They concluded that earlier spring green-up and more abundant grasses, sedges, and forbs accounted for the higher calf production.
Female calves captured in October 1998 weighed about the same (117.8 lbs, SD = 9.2, n = 13) as calves from the NAPCH (115.8, SD = 12.2, n = 19). During June 1999 we weighed 54 neonatal calves from the SAPCH and 44 from the NAPCH. Male calves from the NAPCH sample were slightly heavier than males from the SAPCH (P = 0.09), but there was no difference for females (P = 0.36). Weights of calves from the SAPCH were significantly heavier (P = 0.09 for males and 0.01 for females) in 1999 than recorded in 1989 (Pitcher et al. 1990). There was no difference in average weights of SAPCH males or females from the CRF and the BHTM calving areas (P = 0.19 for males and 0.47 for females).
During early June 1989, 1997, and 1999, we conducted parturition surveys of the SAPCH. In all 3 years there was no difference in pregnancy rates between caribou located on the CRF and the BHTM areas. However, peak of calving occurred earlier on the CRF, where 30% of the parturient cows were accompanied by calves on 4 June, compared to 21% with calves on the BHTM area. Pregnancy rates were slightly higher in 1997 and 1999 than in 1989 when the herd was declining (Table 2).
Three-year-old radiocollared cows from the SAPCH were significantly more productive in 1999 (11 of 12 were pregnant and 9 were accompanied by calves) than were 3-year-olds from the NAPCH in 1998 and 1999. The high proportion of 3-year-olds in the SAPCH now producing
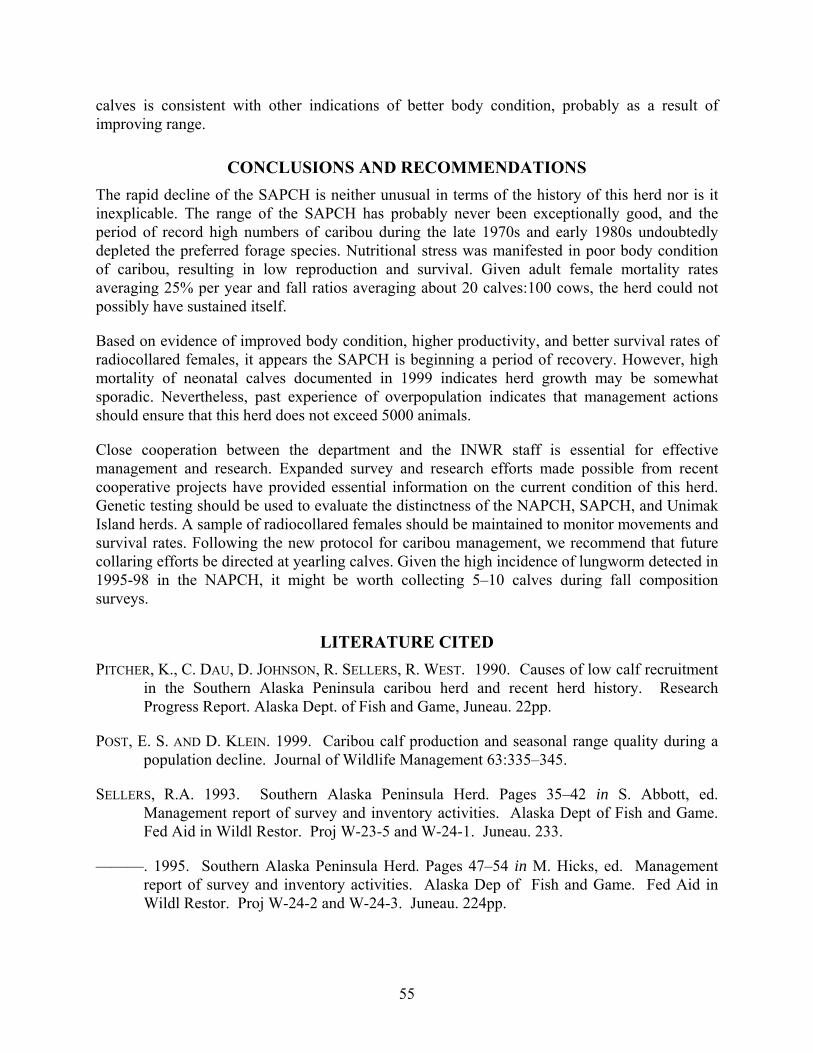
55
calves is consistent with other indications of better body condition, probably as a result of improving range.
CONCLUSIONS AND RECOMMENDATIONS The rapid decline of the SAPCH is neither unusual in terms of the history of this herd nor is it inexplicable. The range of the SAPCH has probably never been exceptionally good, and the period of record high numbers of caribou during the late 1970s and early 1980s undoubtedly depleted the preferred forage species. Nutritional stress was manifested in poor body condition of caribou, resulting in low reproduction and survival. Given adult female mortality rates averaging 25% per year and fall ratios averaging about 20 calves:100 cows, the herd could not possibly have sustained itself.
Based on evidence of improved body condition, higher productivity, and better survival rates of radiocollared females, it appears the SAPCH is beginning a period of recovery. However, high mortality of neonatal calves documented in 1999 indicates herd growth may be somewhat sporadic. Nevertheless, past experience of overpopulation indicates that management actions should ensure that this herd does not exceed 5000 animals.
Close cooperation between the department and the INWR staff is essential for effective management and research. Expanded survey and research efforts made possible from recent cooperative projects have provided essential information on the current condition of this herd. Genetic testing should be used to evaluate the distinctness of the NAPCH, SAPCH, and Unimak Island herds. A sample of radiocollared females should be maintained to monitor movements and survival rates. Following the new protocol for caribou management, we recommend that future collaring efforts be directed at yearling calves. Given the high incidence of lungworm detected in 1995-98 in the NAPCH, it might be worth collecting 5–10 calves during fall composition surveys.
LITERATURE CITED PITCHER, K., C. DAU, D. JOHNSON, R. SELLERS, R. WEST. 1990. Causes of low calf recruitment
in the Southern Alaska Peninsula caribou herd and recent herd history. Research Progress Report. Alaska Dept. of Fish and Game, Juneau. 22pp.
POST, E. S. AND D. KLEIN. 1999. Caribou calf production and seasonal range quality during a population decline. Journal of Wildlife Management 63:335–345.
SELLERS, R.A. 1993. Southern Alaska Peninsula Herd. Pages 35–42 in S. Abbott, ed. Management report of survey and inventory activities. Alaska Dept of Fish and Game. Fed Aid in Wildl Restor. Proj W-23-5 and W-24-1. Juneau. 233.
———. 1995. Southern Alaska Peninsula Herd. Pages 47–54 in M. Hicks, ed. Management report of survey and inventory activities. Alaska Dep of Fish and Game. Fed Aid in Wildl Restor. Proj W-24-2 and W-24-3. Juneau. 224pp.

56
———, P. Valkenburg, R. C. Squibb, M. Roy, and B. Dale. 1999. Survival, natality, and calf weights of caribou on the Alaska Peninsula, 1998–99. Final Report. Cooperative Agreement 99-017.
SKOOG, R. O. 1968. Ecology of caribou (Rangifer tarandus granti) in Alaska. Ph.D. Thesis. Univ. of California, Berkeley, CA. 699pp.
PREPARED BY: SUBMITTED BY:
Richard A. Sellers Michael G. McDonald Wildlife Biologist Assistant Management Coordinator
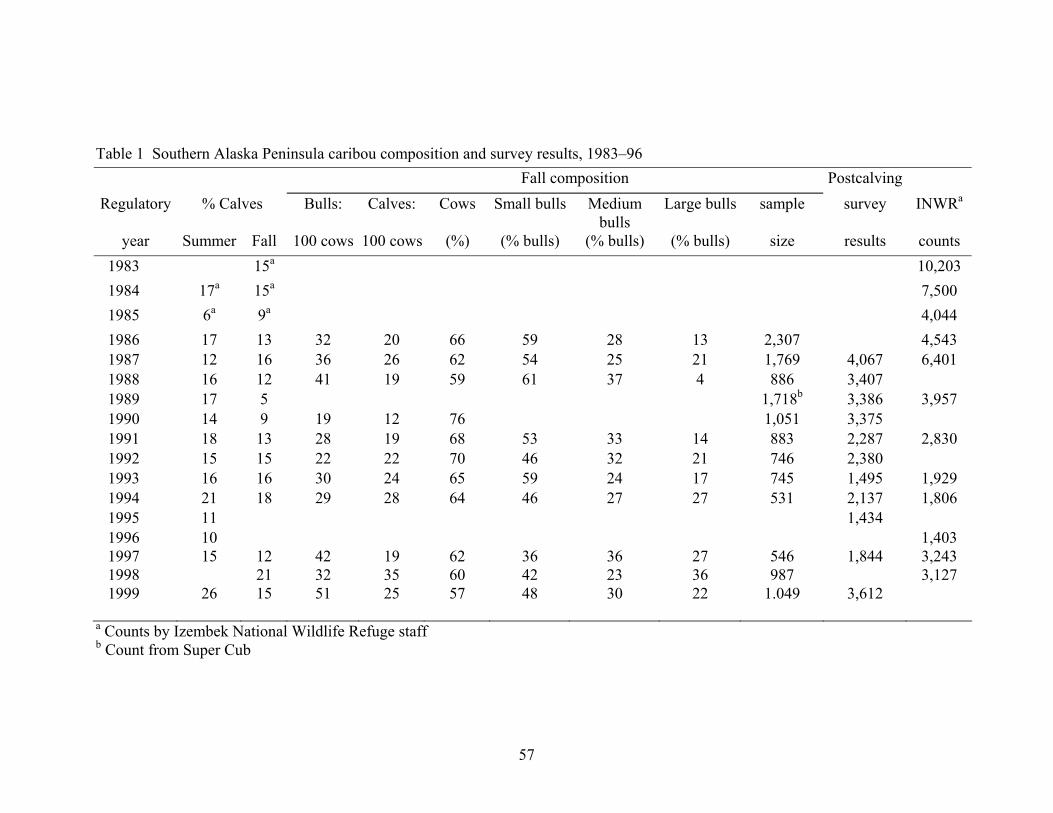
57
Table 1 Southern Alaska Peninsula caribou composition and survey results, 1983–96 Fall composition Postcalving
Regulatory % Calves Bulls: Calves: Cows Small bulls Medium bulls
Large bulls sample survey INWRa
year Summer Fall 100 cows 100 cows (%) (% bulls) (% bulls) (% bulls) size results counts 1983 15a 10,203 1984 17a 15a 7,500 1985 6a 9a 4,044 1986 17 13 32 20 66 59 28 13 2,307 4,543 1987 12 16 36 26 62 54 25 21 1,769 4,067 6,401 1988 16 12 41 19 59 61 37 4 886 3,407 1989 17 5 1,718b 3,386 3,957 1990 14 9 19 12 76 1,051 3,375 1991 18 13 28 19 68 53 33 14 883 2,287 2,830 1992 15 15 22 22 70 46 32 21 746 2,380 1993 16 16 30 24 65 59 24 17 745 1,495 1,929 1994 21 18 29 28 64 46 27 27 531 2,137 1,806 1995 11 1,434 1996 1997 1998 1999
10 15
26
12 21 15
42 32 51
19 35 25
62 60 57
36 42 48
36 23 30
27 36 22
546 987
1.049
1,844
3,612
1,403 3,243 3,127
a Counts by Izembek National Wildlife Refuge staff b Count from Super Cub

58
Table 2. Parturition rates for caribou in the Black Hill/Trader Mountain (BHTM), Caribou River Flats (CRF), and Unimak areas of the Southern Alaska Peninsula caribou herd, 1989-99.
Pregnancy indicator Percent Year Area (date) With
Calf Distended utter Hard antlers parturient Not pregnant (%) Yearlings
1989a BHTM (9 Jun) 32 152 73 69 (27) CRF (8 Jun) 38 20 73 21 (27) 1997 BHTM (1 Jun) 30 44 156 78 65 (22) 48 CRF (1 Jun) 110 39 76 82 49 (18) 59 1999 BHTM 40 20 129 96 7 (4) 57 CRF 39 20 70 88 17 (12) 65 Unimak 17 3 8 67 14 (33) 39 a Pitcher et al. 1990

SPECIES Alaska Department of Fish and GameDivision of Wildlife Conservation
MANAGEMENT REPORT (907) 465-4190 PO BOX 25526 JUNEAU, AK 99802-5526
106
CARIBOU MANAGEMENT REPORT
From: 1 July 1998 To: 30 June 2000
LOCATION GAME MANAGEMENT UNIT: 18 (41,159 mi2)
HERDS: Kilbuck Mountain and Mulchatna
GEOGRAPHIC DESCRIPTION: Yukon–Kuskokwim Delta
BACKGROUND Historically, caribou ranged throughout the Yukon–Kuskokwim Delta, including Nunivak Island, and populations probably peaked during the 1860s (Skoog 1968). By the early 1900s few caribou were in the lowlands of the Delta. Before 1994, only 1 small herd, the Kilbuck Caribou Herd (KCH) or Qavilnguut Herd, was resident in Unit 18. This herd was located in the Kilbuck and Kuskokwim mountains southeast of Bethel. Kilbuck caribou calved on high ridges in the western portion of the Kuskokwim Mountains, summered in alpine meadows, and wintered in valleys and on wind-blown slopes further west and south. Their range included the eastern portion of Unit 18, encompassing the edge of the lowlands of the Delta and the montane western border of Units 19B and 17B. Conservative management techniques were used to protect this small, discrete, resident herd. Since 1994 and through this reporting period, large numbers of caribou from the Mulchatna Herd (MCH) have seasonally invaded the entire range of the KCH. The mixing of Kilbuck and Mulchatna caribou has severely restricted data collection for the KCH and has increased the complexity of caribou management in Unit 18.
Since 1985, the Department and Fish and Wildlife Service (FWS) have cooperated to study the KCH and more recently the MCH in Unit 18. We deployed radiocollars and completed numerous aerial surveys and radiotelemetry flights during this study.
We initiated cooperative management planning for the KCH in 1990. The department joined with local residents and FWS to develop the Kilbuck Caribou Herd Cooperative Management Plan. The Cooperative Planning Group continues to provide an instrumental forum to discuss caribou management with local residents in Unit 18.
MANAGEMENT DIRECTION
MANAGEMENT GOALS The caribou management goals for Unit 18 are:

107
• Increase the numbers caribou
• Identify the status and size of the KCH
• Improve compliance with caribou hunting regulations
• Better understand the interaction between the KCH and the MCH
MANAGEMENT OBJECTIVES Specific management objectives outlined in the Qavilnguut (Kilbuck) Caribou Herd Cooperative Management Plan include the following actions:
1. Change the harvest in response to population size of the KCH as follows:
No harvest allowed when the population is <1000 animals.
Allow a 5% harvest when the population ranges between 1000–3000 animals.
Allow a 7.5% harvest when the population ranges between 3000–5000 animals.
Reevaluate the harvest and strategy when the population exceeds 5000 animals.
2. Gather accurate harvest information for the KCH.
3. Increase compliance with caribou hunting regulations.
We are no longer following these KCH harvest guidelines. The presence of overwhelming numbers of Mulchatna caribou within the range of the KCH in Unit 18 has changed our management focus. We now leave the season closed until sufficient numbers of Mulchatna caribou arrive to dilute the harvest of Kilbuck caribou.
METHODS We met with representatives from local villages and other agencies from December 1990 through November 1999. We described the need to determine the status of the KCH during the most recent meeting and received local support for maintaining 20 radiocollared Kilbuck caribou. We have maintained formal and informal contact with meeting participants throughout this reporting period.
We continued the cooperative KCH study. During the first week of June 2000, Department and FWS staff deployed 9 radiocollars on yearling female caribou that were associated with calving groups in traditional KCH calving areas (7 of these remain active). We completed multiple radiotracking flights using fixed-wing aircraft. Near the end of this reporting period, we monitored 30 radiocollars in both the Kilbuck and Mulchatna herds. We mapped radiocollar locations using Global Positioning System (GPS) equipment. Detailed methodology for the Kilbuck caribou study is available in Hinkes (1989) and Ernst (1993).

108
We conducted composition counts in the Kilbuck Mountains during October 1999 and October 2000 after large numbers of Mulchatna caribou had arrived. Two observers and a pilot used an R44 helicopter to sample caribou for composition. A fixed wing Cessna 185 aircraft equipped with radiotelemetry equipment assisted by locating groups of caribou throughout the area.
In recent years harvest reporting for the KCH has been minimal and deficient. In 1999–2000, we began an incentive program to increase compliance with harvest reporting requirements by offering drawing prizes to hunters who properly filled out their harvest reports as entry into the prize drawing program. To encourage hunter participation in the drawing program, several local businesses donated up to $200 worth of prizes and the department also purchased prizes. The total prize value was approximately $2000 and over 50 hunters received awards.
We did not direct any effort toward caribou north of the Yukon River.
RESULTS AND DISCUSSION
POPULATION STATUS AND TREND Population Size Before 1994, the KCH was small but growing and was expanding its range when approximately 35,000 Mulchatna caribou overran it in September/October 1994. A second influx of approximately 36,000 Mulchatna caribou occurred during the fall of 1995. There have been annual influxes of approximately 15,000 to 40,000 Mulchatna caribou since 1995.
We estimated that less than 150 adult cow caribou calved in the Kilbuck Mountains during early June 2000. Only one calving group was discovered during an intensive search. If this group represents the entire KCH, we estimate the herd is smaller than 500.
Population Composition We conducted composition counts of caribou in the Kilbuck Mountains during October of 1999 and 2000 (Table 1). The overwhelming majority of these caribou were from the MCH. These data will be reported in the MCH caribou management report.
Distribution and Movements Since 1994 and continuing through this reporting period, approximately 15,000 to 40,000 Mulchatna caribou entered Unit 18 from the east, generally during mid-August to mid-September. They wintered throughout lower Kuskokwim River drainages, extending from the Whitefish Lake area near Aniak to the Goodnews River drainage in southernmost Unit 18. They shared ranges with the KCH until late March when they moved westward into Units 17A, 17B, and 19B.
The routes used by Mulchatna caribou to leave Unit 18 in late winter are obvious from trails. Former calving areas such as those near Kisaralik Lake and others have major trails through them. We could not find any calving caribou in June 2000 in any of the former KCH calving areas that had major trails nearby. We found only one group of calving caribou near Heart Lake.

109
Occasionally, caribou are reported west of the Kuskokwim River. These reports are sporadic and no long-term presence of caribou west of the Kuskokwim River has been established.
Caribou from the Western Arctic Caribou herd (WACH) occasionally use portions of Unit 18 north of the Yukon River. The number of WACH caribou using this area is small relative to the size of the entire herd. Unit 18 is on the periphery of the WACH's range and use of this area is occasional and intermittent.
MORTALITY Harvest Season and Bag Limit Units and Bag Limits
Resident Open Season (Subsistence and General Hunts)
Nonresident Open Season
Unit 18, north of the Yukon River. RESIDENT AND NONRESIDENT HUNTERS: 1 caribou per day Bulls Any Caribou
16 May–30 Jun 1 Jul–15 May
16 May–30 Jun 1 Jul–15 May
Unit 18, south of the Yukon River. RESIDENT HUNTERS: Up to 5 caribou
Season to be
announced by emergency order
NONRESIDENT HUNTERS: No open season. Board of Game Actions and Emergency Orders. To minimize the harvest of Kilbuck caribou, we open the season by emergency order only when enough Mulchatna caribou are present in Unit 18 to overwhelm the Kilbuck herd. The 1998–1999 season was open from 5 September–31 March and the 1999–2000 season was open from 17 September–31 March. The bag limit was 5 caribou during both seasons. We coordinated with federal managers when we announced these openings and federal and state seasons and bag limits were aligned.
Hunter Harvest. In 1998–1999, 116 hunters reported killing 214 caribou including 177 bulls and 37 cows. In 1999–2000, 208 hunters reported killing 368 caribou including 238 bulls and 130 cows.
Harvest reporting improved between 1998–1999 and 1999–2000. This may be due to the initiation of the harvest report prize drawing incentive. However, the value of these data is still limited. Coffing, et al (2000) report that residents of the village of Akiachak (population of 560) harvested 374 caribou during the 1998 calendar year. If we apply a similar harvest rate to approximately 10,000 residents having similar access to caribou in Unit 18 (4792 people in 13

110
villages and 5449 people in Bethel), we can clearly see the harvest of caribou is grossly under-reported.
Hunter Residency and Success. All caribou hunters in Unit 18 are residents since there is no open season for nonresidents. In 1998–1999, 84% of the hunters who reported were successful taking at least one caribou. In 1999–2000, 77% reported taking at least one caribou.
Harvest Chronology. Harvest occurs throughout the season. During 1998–1999 and 1999–2000, most of the reported harvest occurred during February and March.
Harvest is largely dependant on travel conditions and accessibility of caribou. During November 1998, travel conditions were poor and only 6 caribou were reported harvested. During November 1999, travel conditions were good and 65 caribou were reported harvested.
Transport Methods. During September and October of this reporting period, most hunters used boats to access hunting areas. Airplanes were only used during September by a small number of hunters. The large majority of hunters used snowmachines after snow conditions improved enough to permit safe travel. Other transportation methods are rarely used.
Other Mortality Little direct information is available regarding other mortality of caribou in Unit 18. Caribou are an important prey species for wolves and predation by wolves has probably increased in recent years. The reported wolf harvest has increased more than tenfold in the last decade. Further, most of the wolves harvested in Unit 18 are taken opportunistically by caribou hunters.
Another source of mortality is predation by brown bears. We found evidence that brown bears killed two radiocollared caribou. However, we do not have an estimate of predation rates on caribou in Unit 18.
HABITAT Assessment The lichen ranges in the Kilbuck and southern Kuskokwim Mountains are in excellent condition. Before the influx of Mulchatna caribou into the KCH range, neither the Andreafsky nor the Kilbuck Mountains had been substantially grazed by caribou or reindeer for over 65 years (Calista Professional Services and Orutsararmuit Native Council, 1984). The tundra areas between the Yukon and Kuskokwim Rivers have not been grazed by caribou for over 100 years, and not by reindeer for over 60 years. We believe the range in Unit 18 could support many more caribou.
Enhancement The existing caribou habitat in Unit 18 is underutilized. Enhancement is not being considered.
111
NONREGULATORY MANAGEMENT PROBLEMS/NEEDS
COOPERATIVE MANAGEMENT PLAN The KCH Cooperative Management Plan was developed and finalized in 1994, after extensive agency and public input over a 5-year period. It was revised in 1995 and again in 1997. The plan provides guidelines for management of the KCH. Even though the distinctiveness of the KCH has become uncertain as it mixes with Mulchatna caribou in Unit 18, the Cooperative Planning Group provides a forum for discussion of caribou management within the unit.
CONCLUSIONS AND RECOMMENDATIONS Since 1986 the FWS and the Department have cooperatively studied the KCH. Estimated at a minimum of 4220 animals in 1994, the KCH comprised a distinct herd resident in the Kilbuck and southern Kuskokwim Mountains. We observed these caribou calving for 12 consecutive years on high ridges near Kisaralik Lake, east and north of Greenstone Ridge, ridge tops on the southern edge of the Kilbuck Mountains, and the southwest edge of the Kuskokwim Mountains. The herd continued to grow and extend its range until it was engulfed by large numbers of Mulchatna caribou beginning in late October 1994. By June 2000, the area around Heart Lake was the only area where we could find any groups of caribou calving in the Kilbuck Mountains. Radiocollar locations of Kilbuck caribou and heavy trailing through former calving areas show that Kilbuck caribou mix with Mulchatna caribou and Kilbuck caribou have regularly left their ‘traditional’ range.
The integrity of the KCH is still being investigated. Prior to 1994, radiocollars deployed on Unit 18 caribou were certainly deployed on Kilbuck caribou. Radiocollars deployed after that we deployed on Kilbuck and Mulchatna caribou. Until these caribou returned to calve, it was uncertain which herd was represented. In June 2000 we were reasonably confident that we deployed radiocollars on Kilbuck caribou. Tracking the movements of these recently collared Kilbuck caribou should remain a priority.
We should continue to gather composition information on Mulchatna caribou in Unit 18. The number of Mulchatna caribou using Unit 18 is not only large, but represents a large proportion of the MCH. Any measure of MCH composition should include data from Unit 18.
We need to improve harvest reporting. The harvest report prize drawing incentive has increased interest and reporting has improved. This incentive should be continued for several more years and then it should be reevaluated.
LITERATURE CITED CALISTA PROFESSIONAL SERVICES AND ORUTSARARMUIT NATIVE COUNCIL. 1984. Prospects for
reviving the reindeer industry in the Yukon–Kuskokwim region. 178pp.
COFFING, M, ML BROWN, G JENNINGS, AND CJ UTERMOHLE. 2000. Subsistence Harvest and Use of Wild Resources in Akiachak, 1998. Technical Paper No. 258. (draft) Alaska Department of Fish and Game. Division of Subsistence. Juneau, Alaska.

112
ERNST RD. 1993. Populations, movements, and seasonal distribution of the Kilbuck caribou herd, Southwest Alaska. Unpublished report (incomplete draft). Cooperative study between US Fish and Wildlife Service (Yukon Delta National Wildlife Refuge) and the Alaska Department of Fish and Game, Bethel, Alaska. 48pp (and appendices).
HINKES MT. 1989. Populations, movements, and seasonal distribution of the Kilbuck caribou herd, Southwest Alaska. Unpublished report Cooperative study between US Fish and Wildlife Service, Yukon Delta National Wildlife Refuge and the Alaska Department of Fish and Game, Bethel, Alaska. 17pp (and appendices).
SKOOG RO. 1968. Ecology of the Caribou (Rangifer tarandus granti) in Alaska. PhD Thesis. University of California, Berkeley. 699pp.
PREPARED BY: SUBMITTED BY:
Roger Seavoy Peter J. Bente Wildlife Biologist III Survey-Inventory Coordinator

113
Table 1 Composition of caribou from the Mulchatna Caribou herd (MCH) in Unit 18, 1999-2000.
Bulls
Year Cows Calves Small Medium Large Total
1999 3277 462 594 261 137 4731
2000 1439 350 329 168 140 2426
Related Documents