Welcome message from author
This document is posted to help you gain knowledge. Please leave a comment to let me know what you think about it! Share it to your friends and learn new things together.
Transcript
884 La Revue de Santé de la Méditerranée orientale, Vol. 9, No 5/6, 2003
Cardiovascular risk factors in SaudiArabian and non-Saudi Arabiandiabetic patients in Saudi ArabiaD.H. Akbar,1 M.M. Ahmed1 and A.A. Algamdi1
1Department of Medicine, King Abdulaziz University Hospital, Jeddah, Saudi Arabia.Received: 26/03/02; accepted: 31/03/03
ABSTRACT To determine frequency of cardiovascular risk factors in Saudi and non-Saudi diabetics, westudied patients attending King Abdulaziz University Hospital for follow-up in the period January 1997 toDecember 2001. Cardiovascular risk factors, including hypertension, hyperlipidaemia, obesity and smoking,were studied as well as degree of blood glucose control. Of 1122 patients in the study, 48% were Saudis and52% non-Saudis. No statistically significant difference was found for prevalence of cardiovascular riskfactors between the two groups. Correlation of each of the risk factors to patient’s age showed significantcorrelation to hypertension and smoking.
Les facteurs de risque cardio-vasculaire chez des patients diabétiques saoudiens et non saou-diens en Arabie saouditeRESUME Afin de déterminer la fréquence des facteurs de risque cardio-vasculaire chez des diabétiquessaoudiens et non saoudiens, nous avons étudié les patients qui sont venus à l’Hôpital universitaire KingAbdulaziz en consultation de suivi durant la période janvier 1997-décembre 2001. Les facteurs de risquecardio-vasculaire, comprenant l’hypertension, l’hyperlipidémie, l’obésité et le tabagisme, ainsi que le degréde contrôle de la glycémie, ont été étudiés. Parmi les 1122 patients de l’étude, 48 % étaient des Saoudienset 52 % des non-Saoudiens. Aucune différence statistiquement significative n’a été constatée entre les deuxgroupes pour la prévalence des facteurs de risque cardio-vasculaire. La corrélation de chacun des facteursde risque à l’âge du patient montrait une corrélation significative avec l’hypertension et le tabagisme.
01 Cardiovascular risk factors.pmd 3/3/2005, 12:10 AM884
Eastern Mediterranean Health Journal, Vol. 9, Nos 5/6, 2003 885
IntroductionCardiovascular disease (CVD) is the lead-ing cause of morbidity and death [1,2]. Di-abetes mellitus (DM) is closely associatedwith ischaemic heart disease and patientswith DM and no previous history of is-chaemic heart disease have the same riskfor cardiac events as patients with previousmyocardial infarction [3,4]. This fact ledthe American national cholesterol educationprogramme to state that, in terms of car-diovascular risk, DM was equivalent tohaving ischaemic heart disease [3]. Peoplewith diabetes have a 2–4 fold increase inthe risk of dying from the complications ofCVD [5]. Hyperlipidaemia, hypertension,smoking and obesity are well known, mod-ifiable, cardiovascular risk factors in bothdiabetics and non-diabetics [6–10]. Rith-Najarian et al. have reported regional varia-tion in CVD risk factors among AmericanIndians and Alaskan natives with DM [11].We aim in our work to study the prevalenceof CVD risk factors in diabetics in two dif-ferent groups, Saudi Arabians and non-Saudi Arabians.
MethodsThe study was conducted at King Abdu-laziz University Hospital, a teaching hospi-tal in the Western Province of Saudi Arabia.Patients seen in our hospital include mainlySaudis as well as patients from neighbour-ing Asian and African countries. The studygroup comprised 1155 diabetic patients, allthose attending the hospital for follow-upfrom January 1997 to December 2001.Thirty-three (3%) were excluded as someof their data were missing. The remaining1122 were included in the study; 541(48%) were Saudis, with male:female ratioof 1.3:1 and 581 were non-Saudis (52%),with male:female ratio 1.1:1 (P = 0.3).
CVD risk factors included hypertension(patient previously diagnosed or has 2 con-secutive readings > 130 mm Hg systolicblood pressure, 85 mm Hg diastolic bloodpressure), hyperlipidaemia (if the patienthas been previously diagnosed or has lowdensity lipoprotein > 2.6 mmol/L, triglycer-ide > 2.3 mmol/L, high density lipoprotein< 0.9 mmol/L for males and 1.0 mmol/L forfemales), obesity [defined as body mass in-dex (BMI) > 30 kg/m2], smoking history(either active or less than 5 years since ces-sation of smoking) were recorded from themedical records of the study group. In ad-dition, participant’s age, sex, nationality,degree of blood glucose control (poorblood glucose control defined as mean ofthe two most recent HbA1c readings> 9%), type and duration of DM were alsorecorded. The study group was dividedinto 2 groups according to nationality, Sau-di or non-Saudi, and a comparative analysiswas done regarding the prevalence of CVDrisk factors and degree of blood glucosecontrol. The group was also analysed ac-cording to age group, < 45 years or ≥ 45years.
Statistical analysis was performed usingSPSS software. Mean ± standard deviationwas determined for quantitative data, andfrequency for categorical variables. Chi-squared was used to analyse group differ-ence for categorical variables. Forcontinuous variables, t-test was used whencomparing two groups. Pearson correla-tion was used to study the correlation ofdifferent cardiovascular risk factors to age.P < 0.05 was considered significant.
ResultsType 2 diabetes was the most prevalenttype recorded in both Saudis and non-Sau-dis, 454 of 541 (84%) and 471 of 581
01 Cardiovascular risk factors.pmd 3/3/2005, 12:10 AM885
886 La Revue de Santé de la Méditerranée orientale, Vol. 9, No 5/6, 2003
(81%) respectively (P = 0.4). Mean dura-tion of diabetes was 8.9 ± 7.3 years in Sau-dis versus 8.8 ± 7.2 years in non-Saudis(P = 0.2). There were 406 of 541 (75%)Saudis aged 45 years or over and 407 of581 (70%) non-Saudis (P = 0.06).
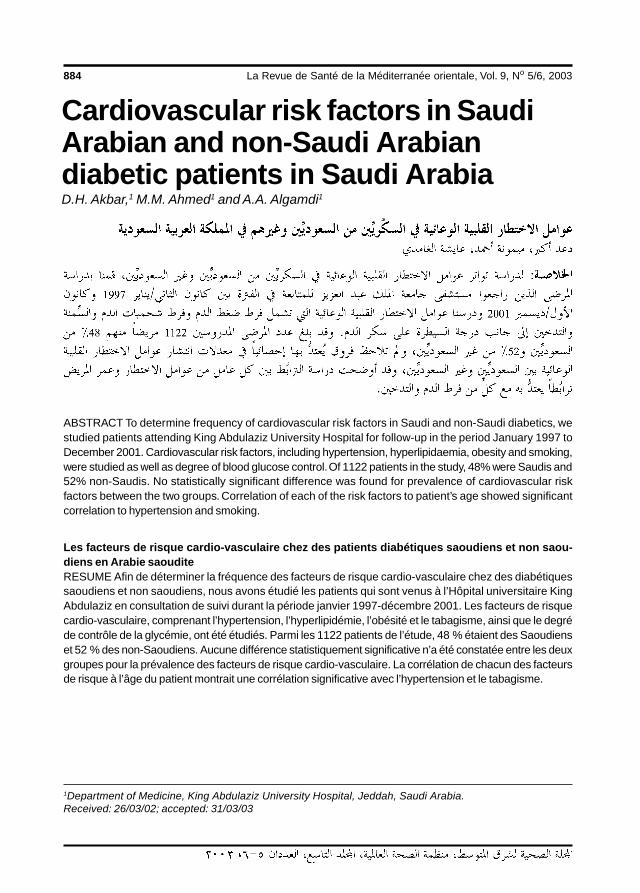
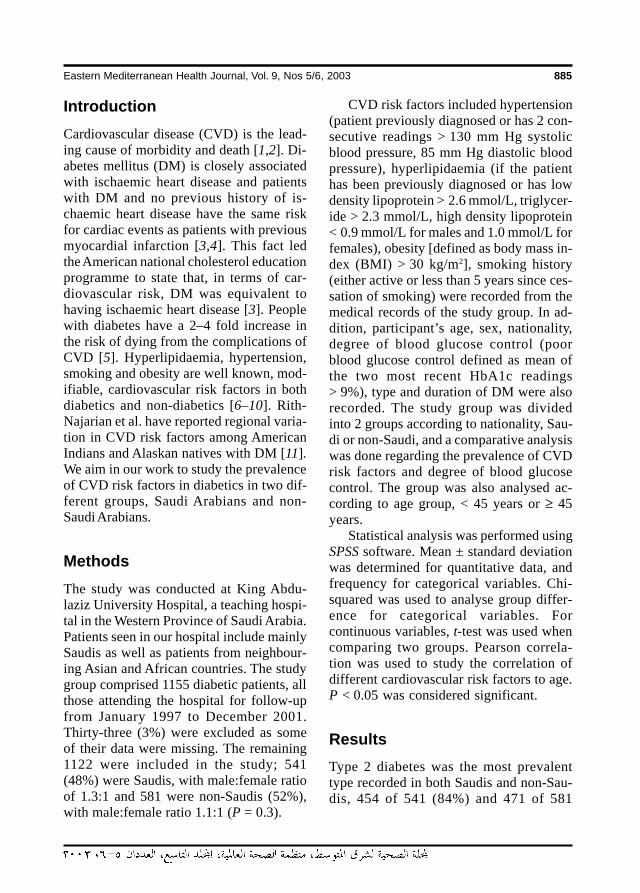
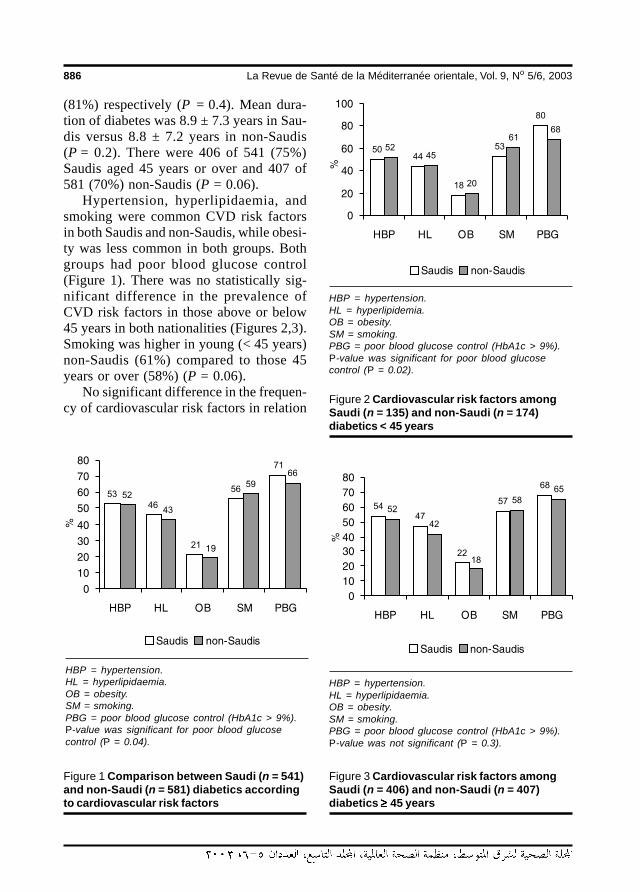
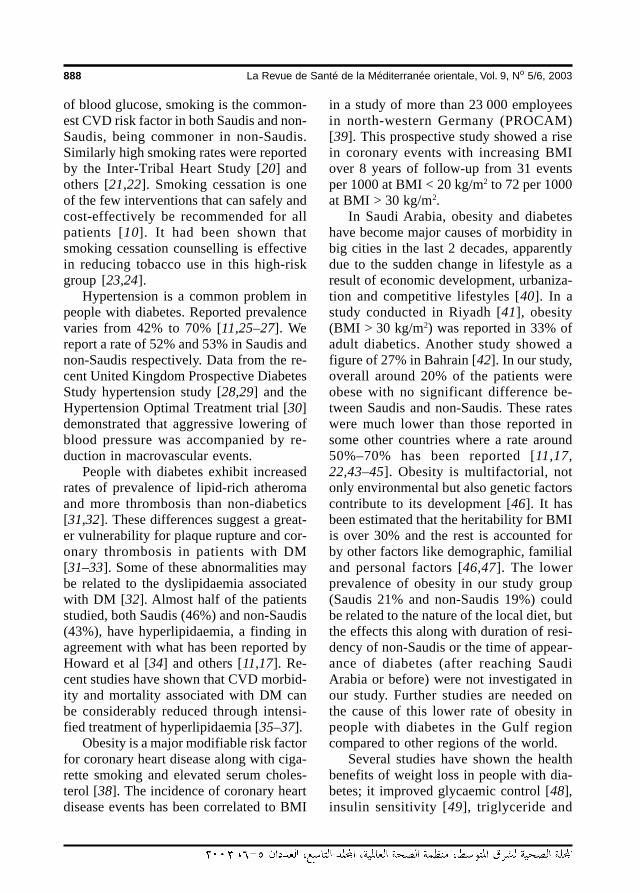
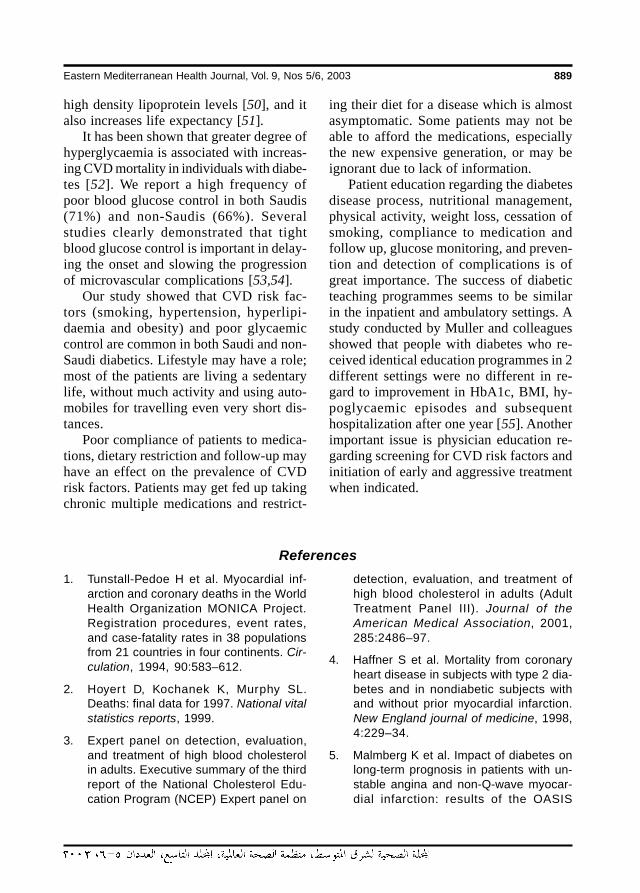
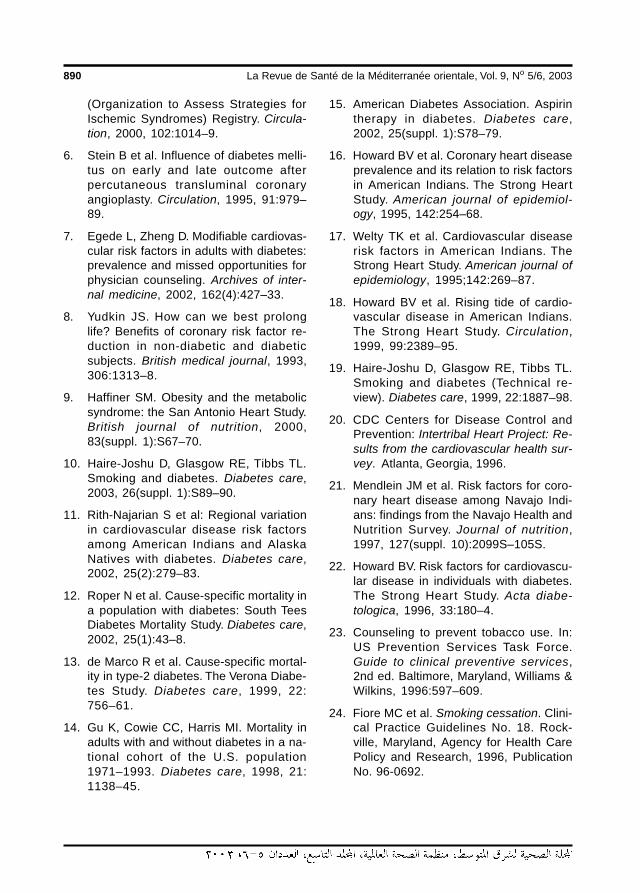
Hypertension, hyperlipidaemia, andsmoking were common CVD risk factorsin both Saudis and non-Saudis, while obesi-ty was less common in both groups. Bothgroups had poor blood glucose control(Figure 1). There was no statistically sig-nificant difference in the prevalence ofCVD risk factors in those above or below45 years in both nationalities (Figures 2,3).Smoking was higher in young (< 45 years)non-Saudis (61%) compared to those 45years or over (58%) (P = 0.06).
No significant difference in the frequen-cy of cardiovascular risk factors in relation
HBP = hypertension.HL = hyperlipidaemia.OB = obesity.SM = smoking.PBG = poor blood glucose control (HbA1c > 9%).P-value was significant for poor blood glucosecontrol (P = 0.04).
Figure 1 Comparison between Saudi (n = 541)and non-Saudi (n = 581) diabetics accordingto cardiovascular risk factors
HBP = hypertension.HL = hyperlipidemia.OB = obesity.SM = smoking.PBG = poor blood glucose control (HbA1c > 9%).P-value was significant for poor blood glucosecontrol (P = 0.02).
Figure 2 Cardiovascular risk factors amongSaudi (n = 135) and non-Saudi (n = 174)diabetics < 45 years
HBP = hypertension.HL = hyperlipidaemia.OB = obesity.SM = smoking.PBG = poor blood glucose control (HbA1c > 9%).P-value was not significant (P = 0.3).
Figure 3 Cardiovascular risk factors amongSaudi (n = 406) and non-Saudi (n = 407)diabetics ≥≥≥≥≥ 45 years
01 Cardiovascular risk factors.pmd 3/3/2005, 12:10 AM886
Eastern Mediterranean Health Journal, Vol. 9, Nos 5/6, 2003 887
to age was found between Saudis and non-Saudis in 3 age groups (< 30 years, 30–60years and > 60 years) (Table 1). Correla-tion of each of the risk factors to patient’sage showed significant correlation to hy-pertension and smoking (P < 0.001).
DiscussionCVD complications are the leading cause ofdeath and disability in people with diabetes.People with diabetes have significantlyhigher cardiovascular mortality rates com-pared to people without diabetes [12–14].Age is considered a risk factor for CVD inpeople with diabetes [15]. Howard et al
[16] and others [17,18] have found that di-abetes is the strongest CVD risk factoramong individuals aged 45–74 years. Thegreat majority of patients in our study, Sau-dis (70%) or non-Saudis (75%), were 45years and over.
A large body of evidence from epidemi-ological, case–control, and cohort studiesprovides convincing documentation of thecausal link between cigarette smoking andhealth risks [10]. Studies of individualswith diabetes consistently found a high riskof morbidity and premature death associat-ed with the development of macrovascularcomplications among smokers [19]. Ourstudy showed that, apart from poor control
Table 1. Prevalence of cardiovascular risk factors in Saudi and non-Saudi diabetics for three different age groups
Cardiovascular Age group Patients having risk factor (%) Prisk factor (years) Saudi Non-Saudi
Hypertension < 30 8 6 0.1
30–60 39 38> 60 57 47
Hyperlipidaemia < 30 34 32 0.4
30–60 56 52
> 60 52 58
Obesity < 30 24 14 0.2
30–60 40 39
> 60 43 36
Smoking < 30 26 33 0.2
30–60 40 42
> 60 51 53
HbA1c > 9% < 30 4 6 0.9
30–60 20 18
> 60 6 8
< 30 years, Saudis (n = 54) (10%), non-Saudis (n = 41) (7%).30–60 years, Saudis (n = 281) (52%), non-Saudis (n = 366) (63%).> 60 years Saudis (n = 206) (38%), non-Saudis (n = 174) (30%).
01 Cardiovascular risk factors.pmd 3/3/2005, 12:10 AM887
888 La Revue de Santé de la Méditerranée orientale, Vol. 9, No 5/6, 2003
of blood glucose, smoking is the common-est CVD risk factor in both Saudis and non-Saudis, being commoner in non-Saudis.Similarly high smoking rates were reportedby the Inter-Tribal Heart Study [20] andothers [21,22]. Smoking cessation is oneof the few interventions that can safely andcost-effectively be recommended for allpatients [10]. It had been shown thatsmoking cessation counselling is effectivein reducing tobacco use in this high-riskgroup [23,24].
Hypertension is a common problem inpeople with diabetes. Reported prevalencevaries from 42% to 70% [11,25–27]. Wereport a rate of 52% and 53% in Saudis andnon-Saudis respectively. Data from the re-cent United Kingdom Prospective DiabetesStudy hypertension study [28,29] and theHypertension Optimal Treatment trial [30]demonstrated that aggressive lowering ofblood pressure was accompanied by re-duction in macrovascular events.
People with diabetes exhibit increasedrates of prevalence of lipid-rich atheromaand more thrombosis than non-diabetics[31,32]. These differences suggest a great-er vulnerability for plaque rupture and cor-onary thrombosis in patients with DM[31–33]. Some of these abnormalities maybe related to the dyslipidaemia associatedwith DM [32]. Almost half of the patientsstudied, both Saudis (46%) and non-Saudis(43%), have hyperlipidaemia, a finding inagreement with what has been reported byHoward et al [34] and others [11,17]. Re-cent studies have shown that CVD morbid-ity and mortality associated with DM canbe considerably reduced through intensi-fied treatment of hyperlipidaemia [35–37].
Obesity is a major modifiable risk factorfor coronary heart disease along with ciga-rette smoking and elevated serum choles-terol [38]. The incidence of coronary heartdisease events has been correlated to BMI
in a study of more than 23 000 employeesin north-western Germany (PROCAM)[39]. This prospective study showed a risein coronary events with increasing BMIover 8 years of follow-up from 31 eventsper 1000 at BMI < 20 kg/m2 to 72 per 1000at BMI > 30 kg/m2.
In Saudi Arabia, obesity and diabeteshave become major causes of morbidity inbig cities in the last 2 decades, apparentlydue to the sudden change in lifestyle as aresult of economic development, urbaniza-tion and competitive lifestyles [40]. In astudy conducted in Riyadh [41], obesity(BMI > 30 kg/m2) was reported in 33% ofadult diabetics. Another study showed afigure of 27% in Bahrain [42]. In our study,overall around 20% of the patients wereobese with no significant difference be-tween Saudis and non-Saudis. These rateswere much lower than those reported insome other countries where a rate around50%–70% has been reported [11,17,22,43–45]. Obesity is multifactorial, notonly environmental but also genetic factorscontribute to its development [46]. It hasbeen estimated that the heritability for BMIis over 30% and the rest is accounted forby other factors like demographic, familialand personal factors [46,47]. The lowerprevalence of obesity in our study group(Saudis 21% and non-Saudis 19%) couldbe related to the nature of the local diet, butthe effects this along with duration of resi-dency of non-Saudis or the time of appear-ance of diabetes (after reaching SaudiArabia or before) were not investigated inour study. Further studies are needed onthe cause of this lower rate of obesity inpeople with diabetes in the Gulf regioncompared to other regions of the world.
Several studies have shown the healthbenefits of weight loss in people with dia-betes; it improved glycaemic control [48],insulin sensitivity [49], triglyceride and
01 Cardiovascular risk factors.pmd 3/3/2005, 12:10 AM888
Eastern Mediterranean Health Journal, Vol. 9, Nos 5/6, 2003 889
high density lipoprotein levels [50], and italso increases life expectancy [51].
It has been shown that greater degree ofhyperglycaemia is associated with increas-ing CVD mortality in individuals with diabe-tes [52]. We report a high frequency ofpoor blood glucose control in both Saudis(71%) and non-Saudis (66%). Severalstudies clearly demonstrated that tightblood glucose control is important in delay-ing the onset and slowing the progressionof microvascular complications [53,54].
Our study showed that CVD risk fac-tors (smoking, hypertension, hyperlipi-daemia and obesity) and poor glycaemiccontrol are common in both Saudi and non-Saudi diabetics. Lifestyle may have a role;most of the patients are living a sedentarylife, without much activity and using auto-mobiles for travelling even very short dis-tances.
Poor compliance of patients to medica-tions, dietary restriction and follow-up mayhave an effect on the prevalence of CVDrisk factors. Patients may get fed up takingchronic multiple medications and restrict-
ing their diet for a disease which is almostasymptomatic. Some patients may not beable to afford the medications, especiallythe new expensive generation, or may beignorant due to lack of information.
Patient education regarding the diabetesdisease process, nutritional management,physical activity, weight loss, cessation ofsmoking, compliance to medication andfollow up, glucose monitoring, and preven-tion and detection of complications is ofgreat importance. The success of diabeticteaching programmes seems to be similarin the inpatient and ambulatory settings. Astudy conducted by Muller and colleaguesshowed that people with diabetes who re-ceived identical education programmes in 2different settings were no different in re-gard to improvement in HbA1c, BMI, hy-poglycaemic episodes and subsequenthospitalization after one year [55]. Anotherimportant issue is physician education re-garding screening for CVD risk factors andinitiation of early and aggressive treatmentwhen indicated.
References
1. Tunstall-Pedoe H et al. Myocardial inf-arction and coronary deaths in the WorldHealth Organization MONICA Project.Registration procedures, event rates,and case-fatality rates in 38 populationsfrom 21 countries in four continents. Cir-culation, 1994, 90:583–612.
2. Hoyert D, Kochanek K, Murphy SL.Deaths: final data for 1997. National vitalstatistics reports, 1999.
3. Expert panel on detection, evaluation,and treatment of high blood cholesterolin adults. Executive summary of the thirdreport of the National Cholesterol Edu-cation Program (NCEP) Expert panel on
detection, evaluation, and treatment ofhigh blood cholesterol in adults (AdultTreatment Panel III). Journal of theAmerican Medical Association, 2001,285:2486–97.
4. Haffner S et al. Mortality from coronaryheart disease in subjects with type 2 dia-betes and in nondiabetic subjects withand without prior myocardial infarction.New England journal of medicine, 1998,4:229–34.
5. Malmberg K et al. Impact of diabetes onlong-term prognosis in patients with un-stable angina and non-Q-wave myocar-dial infarction: results of the OASIS
01 Cardiovascular risk factors.pmd 3/3/2005, 12:10 AM889
890 La Revue de Santé de la Méditerranée orientale, Vol. 9, No 5/6, 2003
(Organization to Assess Strategies forIschemic Syndromes) Registry. Circula-tion, 2000, 102:1014–9.
6. Stein B et al. Influence of diabetes melli-tus on early and late outcome afterpercutaneous transluminal coronaryangioplasty. Circulation, 1995, 91:979–89.
7. Egede L, Zheng D. Modifiable cardiovas-cular risk factors in adults with diabetes:prevalence and missed opportunities forphysician counseling. Archives of inter-nal medicine, 2002, 162(4):427–33.
8. Yudkin JS. How can we best prolonglife? Benefits of coronary risk factor re-duction in non-diabetic and diabeticsubjects. British medical journal, 1993,306:1313–8.
9. Haffiner SM. Obesity and the metabolicsyndrome: the San Antonio Heart Study.British journal of nutrition, 2000,83(suppl. 1):S67–70.
10. Haire-Joshu D, Glasgow RE, Tibbs TL.Smoking and diabetes. Diabetes care,2003, 26(suppl. 1):S89–90.
11. Rith-Najarian S et al: Regional variationin cardiovascular disease risk factorsamong American Indians and AlaskaNatives with diabetes. Diabetes care,2002, 25(2):279–83.
12. Roper N et al. Cause-specific mortality ina population with diabetes: South TeesDiabetes Mortality Study. Diabetes care,2002, 25(1):43–8.
13. de Marco R et al. Cause-specific mortal-ity in type-2 diabetes. The Verona Diabe-tes Study. Diabetes care, 1999, 22:756–61.
14. Gu K, Cowie CC, Harris MI. Mortality inadults with and without diabetes in a na-tional cohort of the U.S. population1971–1993. Diabetes care, 1998, 21:1138–45.
15. American Diabetes Association. Aspirintherapy in diabetes. Diabetes care,2002, 25(suppl. 1):S78–79.
16. Howard BV et al. Coronary heart diseaseprevalence and its relation to risk factorsin American Indians. The Strong HeartStudy. American journal of epidemiol-ogy, 1995, 142:254–68.
17. Welty TK et al. Cardiovascular diseaserisk factors in American Indians. TheStrong Heart Study. American journal ofepidemiology, 1995;142:269–87.
18. Howard BV et al. Rising tide of cardio-vascular disease in American Indians.The Strong Heart Study. Circulation,1999, 99:2389–95.
19. Haire-Joshu D, Glasgow RE, Tibbs TL.Smoking and diabetes (Technical re-view). Diabetes care, 1999, 22:1887–98.
20. CDC Centers for Disease Control andPrevention: Intertribal Heart Project: Re-sults from the cardiovascular health sur-vey. Atlanta, Georgia, 1996.
21. Mendlein JM et al. Risk factors for coro-nary heart disease among Navajo Indi-ans: findings from the Navajo Health andNutrition Survey. Journal of nutrition,1997, 127(suppl. 10):2099S–105S.
22. Howard BV. Risk factors for cardiovascu-lar disease in individuals with diabetes.The Strong Heart Study. Acta diabe-tologica, 1996, 33:180–4.
23. Counseling to prevent tobacco use. In:US Prevention Services Task Force.Guide to clinical preventive services,2nd ed. Baltimore, Maryland, Williams &Wilkins, 1996:597–609.
24. Fiore MC et al. Smoking cessation. Clini-cal Practice Guidelines No. 18. Rock-ville, Maryland, Agency for Health CarePolicy and Research, 1996, PublicationNo. 96-0692.
01 Cardiovascular risk factors.pmd 3/3/2005, 12:10 AM890
Eastern Mediterranean Health Journal, Vol. 9, Nos 5/6, 2003 891
25. Wokoma FS. Hypertension in non-insu-lin dependent diabetic Nigerians: a com-parative analysis of normotensive andhypertensive subgroups. Diabetes inter-national, 1999, 9:57–8.
26. Akbar D. Is hypertension common in hos-pitalized type-2 diabetic patients? Saudimedical journal, 2001, 2:139–41.
27. Haupt E et al. The KID Study VI: diabeticcomplications and associated diseasein younger type 2 diabetics still perform-ing a profession. Prevalence and corre-lation with duration of diabetic state, BMI,and C-peptide. Experimental and clinicalendocrinology & diabetes, 1999, 7:435–41.
28. Tight blood pressure control and risk ofmacrovascular and microvascular com-plications in type 2 diabetes: UKPDS 38.UK Prospective Diabetes Study Group.British medical journal, 1998, 317:703–13.
29. Efficacy of atenolol and captopril in re-ducing risk of macrovascular and mi-crovascular complication in type-2diabetes: UKPDS 39 UK ProspectiveDiabetes Study Group. British medicaljournal, 1998, 317:713–20.
30. Hansson L et al. Effect of intensive bloodpressure lowering and low dose aspirinin patients with hypertension: principalresults of the Hypertension OptimalTreatment (HOT) randomised trial. HOTStudy Group. Lancet, 1998, 351:1755–62.
31. Moreno PR et al. Coronary compositionand macrophage infiltration in athe-rectomy specimens from patients withdiabetes mellitus. Circulation, 2000,102:2180–4.
32. Papadakis JA et al. Treating dyslipi-daemia in non-insulin-dependent diabe-tes mellitus – a special reference tostatins. Journal of diabetes and its com-plications, 2001, 15:211–26.
33. Malmberg K et al. Impact of diabetes onlong-term prognosis in patients with un-stable angina and non-Q-wave myocar-dial infarction: results of the OASIS(Organization to assess strategies for is-chemic syndromes) registry. Circulation,2000, 102:1014–9.
34. Howard BV et al. Plasma and lipoproteincholesterol and triglyceride concentra-tions in the Pima Indians: distributionsdiffering from those of Caucasians. Cir-culation, 1983, 68:714–24.
35. Pyorala K et al. Cholesterol loweringwith simvastatin improves prognosis ofdiabetic patients with coronary heart dis-ease. A subgroup analysis of the Scandi-navian Simvastatin Survival Study (4S).Diabetes care, 1997, 20:614–20.
36. Goldberg RB et al. Cardiovascularevents and their reduction withpravastatin in diabetic and glucose intol-erant myocardial infarction survivorswith average cholesterol levels: sub-group analyses in the cholesterol andrecurrent events (CARE) trial. The CareInvestigators. Circulation, 1998, 98:2513–9.
37. Prevention of cardiovascular events anddeath with pravastatin in patients withcoronary heart disease and a broadrange of initial cholesterol level. TheLong-Term Intervention with Pravastatinin Ischaemic Disease (LIPID) StudyGroup. New England journal of medi-cine, 1998, 339:1349–57.
38. Eckel RH, Krauss RM. American HeartAssociation call to action: obesity as amajor risk factor for coronary heart dis-ease. AHA Nutrition Committee. Circula-tion, 1998, 97:2099–100.
39. Schulte H, Cullen P, Assmann G. Obesity,mortality and cardiovascular disease inthe Münster Heart Study (PROCAM).Atherosclerosis. 1999, 144:199–209.
01 Cardiovascular risk factors.pmd 3/3/2005, 12:10 AM891
892 La Revue de Santé de la Méditerranée orientale, Vol. 9, No 5/6, 2003
40. Seba ZA. Health in Saudi Arabia, 1st ed.Riyadh, Tihama Publications, 1985:16.
41. El Hazmi MA, Warsy AS. Prevalence ofoverweight and obesity in diabetic andnon-diabetic Saudis. Eastern Mediterra-nean health journal, 2000, 6(2–3):276–82.
42. Zurba FI. Characteristics and pattern ofcare of diabetes in primary health carecentres in Bahrain. Bulletin of the ArabGroup for Study of Diabetes, 1994, 3(1):9–18.
43. Denny CH, Holtzman D. Health behav-iors of American Indians and Alaska Na-tives: findings from the behavioral riskfactor surveillance system, 1993–1996.Atlanta, Georgia, Centers for DiseaseControl, 1999.
44. Williams G. Management of non-insulin-dependent diabetes mellitus. Lancet,1994, 343:95–100.
45. Walia M et al. Prevalence of coronaryrisk factors in non-insulin dependent(type 2) diabetics. Journal of the Asso-ciation of Physicians of India, 1999,47(11):1051–5.
46. Bouchard C. Genetic aspects of humanobesity. In: Bjorntorp P, Brodoff BN, eds.Obesity. Philadelphia, JB Lippincott,1992:343–51.
47. Epstein FH, Higgin M. Epidemiology ofobesity, In: Bjorntorp P, Brodoff BN, eds.Obesity. Philadelphia, JB Lippincott,1992:330–42.
48. Goldstein DJ. Beneficial health effects ofmodest weight loss. International journalof obesity and related metabolic disor-ders, 1992, 16:397–415.
49. Friedman JE et al. Restoration of insulinresponsiveness in skeletal muscles ofmorbidly obese patients after weightloss: effect on muscle glucose transportand glucose transporter GLUT4. Journalof clinical investigation, 1992, 89:701–5.
50. Wing RR et al. Long term effects of mod-est weight loss in type II diabetic patients.Archives of internal medicine, 1987,147:1749–53.
51. Lean ME et al. Obesity, weight loss andprognosis in type 2 diabetes. Diabeticmedicine, 1990, 7:228–33.
52. Sievers MI, Bennett PH, Nelson RG. Ef-fect of glycemia on mortality in Pima Indi-ans with type 2 diabetes. Diabetes,1999, 48:896–902.
53. Intensive blood glucose control withsulphonylureas or insulin comparedwith conventional treatment and risk ofcomplications in patients with type 2 dia-betes (UKPDS 33). UK Prospective Dia-betes Study (UKPDS) Group. Lancet,1998, 352:837–53.
54. Ohkubo Y et al. Intensive insulin therapyprevents the progression of diabetic mi-crovascular complications in Japanesepatients with non-insulin-dependent dia-betes mellitus: a randomized prospec-tive 6-years study. Diabetes researchand clinical practice, 1995, 28:103–17.
55. Muller UA et al. Should insulin therapy intype 2 diabetes be started on out- or in-patient basis? Results of a prospectivecontrolled trial using the same treatmentand teaching programme in ambulatorycare and a university hospital. Diabetes& metabolism, 1998, 24:251–5.
01 Cardiovascular risk factors.pmd 3/3/2005, 12:10 AM892
Eastern Mediterranean Health Journal, Vol. 9, Nos 5/6, 2003 893
Clustering of cardiovascular riskfactors among Omani adultsA.A. Al Riyami1 and M. Afifi1
1Department of Research and Studies, Ministry of Health, Oman.Received: 02/04/02; accepted: 18/08/02
ABSTRACT To determine the distribution and correlates of clustering of cardiovascular disease (CVD) riskfactors, data from the Oman National Health Survey, 2000 were analysed. Based on demographic data(blood pressure, fasting blood glucose, serum cholesterol, weight, height, waist and hip measurements),5660 subjects were grouped according to how many of four CVD risk factors (hypertension, high cholester-ol, diabetes, overweight/obesity) they had. We found that 72% of subjects had less than one risk factor and2% had all four. Older age exacerbated risk, while living in rural areas or being single was protective.Metabolic cardiovascular syndrome is a public health problem in Oman. Increasing awareness in healthcareproviders and the wider population by comprehensive dissemination of the survey results is crucial.
Association des facteurs de risque cardio-vasculaire chez des adultes omanaisRESUME Les données provenant de l’enquête nationale sur la santé réalisée à Oman en 2000 ont étéanalysées pour déterminer la distribution et les corrélats de l’association des facteurs de risque des mala-dies cardio-vasculaires. Sur la base des données démographiques (tension artérielle, glycémie à jeun,cholestérol sérique, mesures du poids, de la taille, du tour de taille et de hanches), 5660 sujets ont étégroupés en fonction du nombre de facteurs de risque de maladie cardio-vasculaire qu’ils avaient parmi lesquatre suivants : hypertension, cholestérol élevé, diabète, surcharge pondérale/obésité. Nous avons cons-taté que 72 % des sujets présentaient au moins un facteur de risque et que 2 % présentaient les quatre. L’âgeavancé exacerbait le risque, tandis que le fait de vivre en milieu rural ou d’être célibataire constituait uneprotection. Le syndrome métabolique cardio-vasculaire est un problème de santé publique à Oman. Lasensibilisation des prestataires de soins de santé et de la population générale par la large diffusion desrésultats de l’enquête est cruciale.
02 Clustering of cardiovascular risk.pmd 3/3/2005, 12:10 AM893
894 La Revue de Santé de la Méditerranée orientale, Vol. 9, No 5/6, 2003
IntroductionSocial advances in Oman since 1970 havebeen accompanied by cultural changes, areduction in the prevalence of communica-ble diseases, increased life expectancy,changes in nutritional habits and habitualphysical activity and increased prevalenceof noncommunicable diseases such as hy-pertension and diabetes [1]. Environmentaland behavioural changes such as the adop-tion of new dietary habits and a sedentarylifestyle, and the stress of urbanization andof working conditions have all contributedto the rise in cardiovascular disease (CVD)risk factors [2]. The primary risk factorsfor CVD are hypertension, high cholester-ol, diabetes, overweight, cigarette smokingand physical inactivity. The first 4 of thesemay cluster in some persons and have beenidentified as components of a syndromeknown as metabolic cardiovascular syn-drome, or the “deadly quartet” [3].
Approximately 50% of hypertensivepeople can be considered to have insulinresistance and hyperinsulinaemia. It ap-pears likely that insulin resistance and hy-perinsulinaemia predispose to, rather thanresult from, hypertension. Insulin resis-tance is associated with abnormalities in li-poprotein metabolism, hypercoagulability,and endothelial function, which probablyaccount in part for the increased cardiovas-cular risk among hypertensive patients [4].Patients with at least 1 component of themetabolic syndrome have been found to beobese, hyperinsulinaemic, insulin resistant,hyperglycaemic, hypertensive, and dyslipi-daemic [5].
The association between hyperinsuli-naemia and cardiovascular risk factors hasbeen investigated in Gulf countries. In theUnited Arab Emirates, Bener et al. examinedthe association between acanthosis negri-cans, hyperinsulinaemia and cardiovascularrisk factors [6]. They found that patients
with acanthosis negricans had a high prev-alence of abnormal glucose tolerance andhyperinsulinaemia. In addition, euglycaem-ic patients with hyperinsulinaemia had acluster of risk factors for CVD. In Bahrain,Musaiger and al-Roomi found that obesity,hypertension and diabetes were highlyprevalent and significantly more frequentlyreported among women than men, with79.6% of women overweight or obese,compared to 56% of men [7]. They alsorecommended the need for a national healthpolicy to prevent and control CVD. InEgypt, Ibrahim et al. studied the clusteringof CVD risk factors in hypertensive pa-tients. They found that obesity was preva-lent in 33% of hypertensive men and 47%of hypertensive women [8]. After adjustingfor age, hypertensive men had significantlyhigher total cholesterol, fasting blood sug-ar, body mass index (BMI) and waist-hipratio than their normotensive counterparts.In addition, hypertensive women had high-er low-density lipoprotein (LDL) cholester-ol.
Using World Health Organization crite-ria (WHO) [9], the Oman National HealthSurvey, 2000 identified the prevalence ofhypertension, high cholesterol, diabetes,overweight and obesity among Omaniadults. The National Health Survey was across-sectional community-based study in-volving all 10 regions of Oman. The aim ofour study was to examine the aggregationor clustering of these CVD risk factors andthe correlates of this clustering amongthose Omani subjects aged ≥ 20 years whohad been included in the National HealthSurvey.
MethodsSample design and participantsThe sample for the survey was selected tobe representative of the whole nation. The
02 Clustering of cardiovascular risk.pmd 3/3/2005, 12:10 AM894
Eastern Mediterranean Health Journal, Vol. 9, Nos 5/6, 2003 895
survey adopted a multistage stratified prob-ability sampling design. All 10 regions ofthe country were sampled proportionally.Depending on the size of the population foreach region, one or more wilayat (districts)were randomly chosen from that region,with 16 wilayat selected for the surveyfrom a national total of 59. Each wilayatwas stratified into urban or rural (villages/remote areas), resulting in an urban:ruralratio of 2:1, similar to that of the 1993 na-tional census. Within each of these strata,enumeration areas (EAs, census units usedduring the 1993 population census, eachcontaining approximately 80 households)were randomly selected. Households with-in each of the EAs were then randomly se-lected. Maps of the selected EAs wereupdated, and a comprehensive listing of allOmani households in each EA was made toobtain the sampling frame.
All individuals aged ≥ 20 years (n =7011) in the selected households (n = 1968)were invited to participate in the survey.The response rate varied from 81% to91%, according to the type of measure-ment or laboratory investigation completed.Of the 7011 eligible participants, 5660(81%) completed the questionnaire, hadtheir blood taken to measure fasting bloodglucose and completed the other necessarymeasurements and laboratory investiga-tions in order to have their data analysed.
Questionnaire and measurementsThe Household Health Status questionnairecovered demographic data such as age andsex, and marital, education and employ-ment status, as well as self-reporting fordiabetes mellitus and hypertension. Educa-tion status was classified into 3 groups: illi-terate; those who could read and write andhad completed either primary or preparato-ry school, or had spent some years in sec-ondary school; and those who had
completed secondary school, college, uni-versity or postgraduate tertiary studies.
Blood pressure (BP) was measuredmanually. This measure, together with datafor weight, height, waist and hip circum-ference, was registered in the question-naire. Waist-hip ratio was not considered asa variable in this analysis. WHO procedureswere used to obtain the measurements [9].The results of laboratory investigations tak-en for fasting blood glucose and serumcholesterol were also entered on the ques-tionnaire. Certain important biochemicalmeasurements related to CVD risk factors,such as high-density lipoprotein (HDL)cholesterol, LDL cholesterol, triglycerideor microalbuminuria levels were not col-lected during the survey.
Specimen collection and analysisFor specimen collection and analysis, 25teams were assembled and trained in themethodology of the survey for 2 weeks.Each team consisted of a nurse to takemeasurements, a laboratory technician todraw samples, a health educator to inter-view subjects, a health inspector to trans-port laboratory samples and a fieldsupervisor (statistician) to supervise andreview the questionnaires in the field.
Eligible members of the selected house-holds were requested to commence fasting1–2 hours before midnight the night beforethey were to be visited by the survey team.At 07.00 the following morning, householdmembers were interviewed, had their mea-surements taken and venous fasting bloodglucose samples collected. Fasting bloodsamples for glucose were collected in sodi-um fluoride potassium oxalate tubes, la-belled and transferred immediately in coldboxes, along with laboratory forms, to thelaboratory at the wilayat hospital. Sampleswere immediately centrifuged, the plasmaseparated and fasting plasma glucose deter-
02 Clustering of cardiovascular risk.pmd 3/3/2005, 12:10 AM895
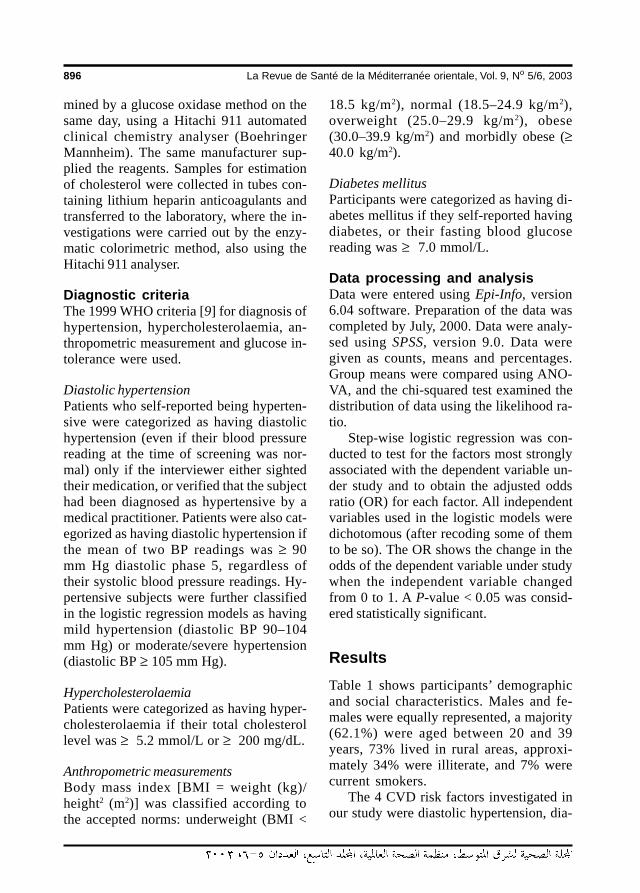
896 La Revue de Santé de la Méditerranée orientale, Vol. 9, No 5/6, 2003
mined by a glucose oxidase method on thesame day, using a Hitachi 911 automatedclinical chemistry analyser (BoehringerMannheim). The same manufacturer sup-plied the reagents. Samples for estimationof cholesterol were collected in tubes con-taining lithium heparin anticoagulants andtransferred to the laboratory, where the in-vestigations were carried out by the enzy-matic colorimetric method, also using theHitachi 911 analyser.
Diagnostic criteriaThe 1999 WHO criteria [9] for diagnosis ofhypertension, hypercholesterolaemia, an-thropometric measurement and glucose in-tolerance were used.
Diastolic hypertensionPatients who self-reported being hyperten-sive were categorized as having diastolichypertension (even if their blood pressurereading at the time of screening was nor-mal) only if the interviewer either sightedtheir medication, or verified that the subjecthad been diagnosed as hypertensive by amedical practitioner. Patients were also cat-egorized as having diastolic hypertension ifthe mean of two BP readings was ≥ 90mm Hg diastolic phase 5, regardless oftheir systolic blood pressure readings. Hy-pertensive subjects were further classifiedin the logistic regression models as havingmild hypertension (diastolic BP 90–104mm Hg) or moderate/severe hypertension(diastolic BP ≥ 105 mm Hg).
HypercholesterolaemiaPatients were categorized as having hyper-cholesterolaemia if their total cholesterollevel was ≥ 5.2 mmol/L or ≥ 200 mg/dL.
Anthropometric measurementsBody mass index [BMI = weight (kg)/height2 (m2)] was classified according tothe accepted norms: underweight (BMI <
18.5 kg/m2), normal (18.5–24.9 kg/m2),overweight (25.0–29.9 kg/m2), obese(30.0–39.9 kg/m2) and morbidly obese (≥40.0 kg/m2).
Diabetes mellitusParticipants were categorized as having di-abetes mellitus if they self-reported havingdiabetes, or their fasting blood glucosereading was ≥ 7.0 mmol/L.
Data processing and analysisData were entered using Epi-Info, version6.04 software. Preparation of the data wascompleted by July, 2000. Data were analy-sed using SPSS, version 9.0. Data weregiven as counts, means and percentages.Group means were compared using ANO-VA, and the chi-squared test examined thedistribution of data using the likelihood ra-tio.
Step-wise logistic regression was con-ducted to test for the factors most stronglyassociated with the dependent variable un-der study and to obtain the adjusted oddsratio (OR) for each factor. All independentvariables used in the logistic models weredichotomous (after recoding some of themto be so). The OR shows the change in theodds of the dependent variable under studywhen the independent variable changedfrom 0 to 1. A P-value < 0.05 was consid-ered statistically significant.
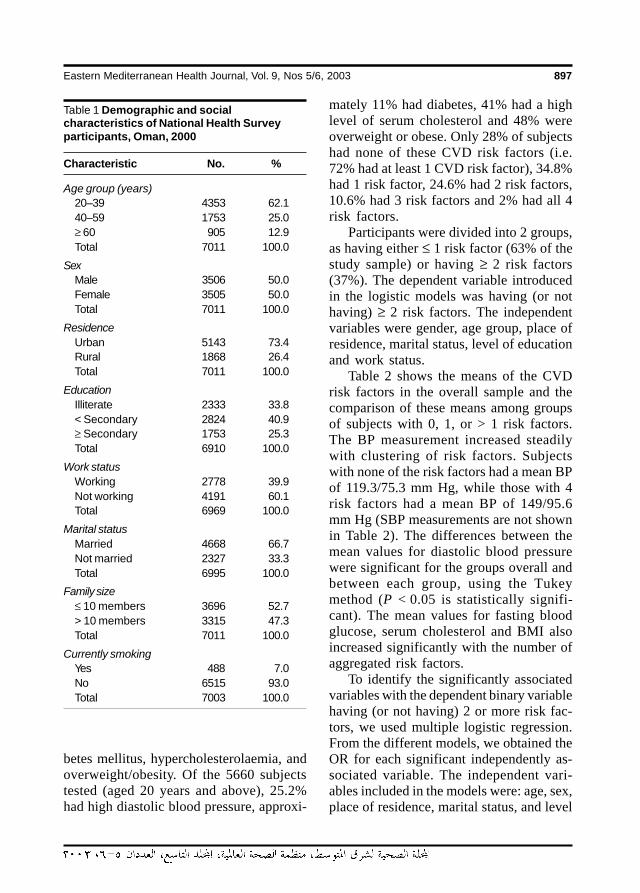
ResultsTable 1 shows participants’ demographicand social characteristics. Males and fe-males were equally represented, a majority(62.1%) were aged between 20 and 39years, 73% lived in rural areas, approxi-mately 34% were illiterate, and 7% werecurrent smokers.
The 4 CVD risk factors investigated inour study were diastolic hypertension, dia-
02 Clustering of cardiovascular risk.pmd 3/3/2005, 12:10 AM896
Eastern Mediterranean Health Journal, Vol. 9, Nos 5/6, 2003 897
betes mellitus, hypercholesterolaemia, andoverweight/obesity. Of the 5660 subjectstested (aged 20 years and above), 25.2%had high diastolic blood pressure, approxi-
mately 11% had diabetes, 41% had a highlevel of serum cholesterol and 48% wereoverweight or obese. Only 28% of subjectshad none of these CVD risk factors (i.e.72% had at least 1 CVD risk factor), 34.8%had 1 risk factor, 24.6% had 2 risk factors,10.6% had 3 risk factors and 2% had all 4risk factors.
Participants were divided into 2 groups,as having either ≤ 1 risk factor (63% of thestudy sample) or having ≥ 2 risk factors(37%). The dependent variable introducedin the logistic models was having (or nothaving) ≥ 2 risk factors. The independentvariables were gender, age group, place ofresidence, marital status, level of educationand work status.
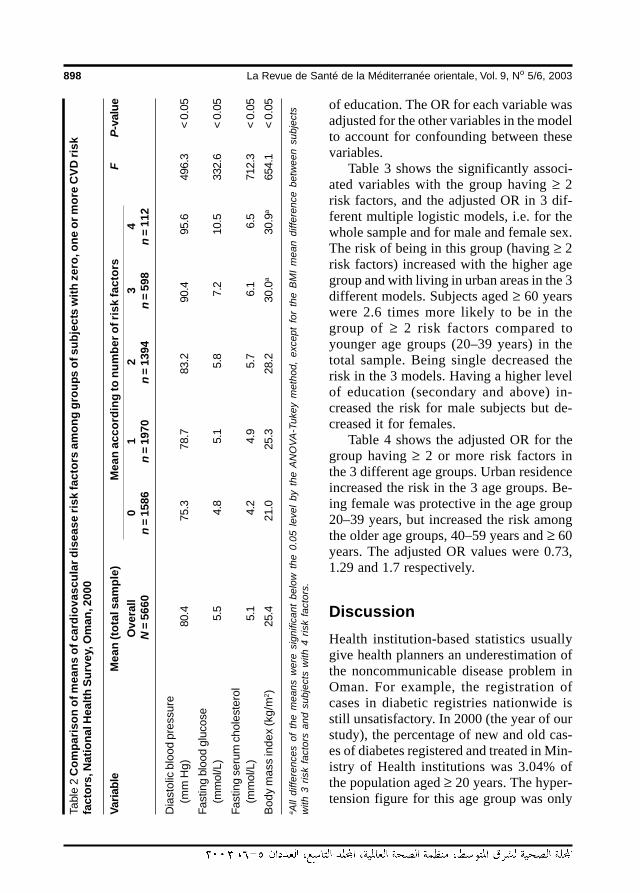
Table 2 shows the means of the CVDrisk factors in the overall sample and thecomparison of these means among groupsof subjects with 0, 1, or > 1 risk factors.The BP measurement increased steadilywith clustering of risk factors. Subjectswith none of the risk factors had a mean BPof 119.3/75.3 mm Hg, while those with 4risk factors had a mean BP of 149/95.6mm Hg (SBP measurements are not shownin Table 2). The differences between themean values for diastolic blood pressurewere significant for the groups overall andbetween each group, using the Tukeymethod (P < 0.05 is statistically signifi-cant). The mean values for fasting bloodglucose, serum cholesterol and BMI alsoincreased significantly with the number ofaggregated risk factors.
To identify the significantly associatedvariables with the dependent binary variablehaving (or not having) 2 or more risk fac-tors, we used multiple logistic regression.From the different models, we obtained theOR for each significant independently as-sociated variable. The independent vari-ables included in the models were: age, sex,place of residence, marital status, and level
Table 1 Demographic and socialcharacteristics of National Health Surveyparticipants, Oman, 2000
Characteristic No. %
Age group (years)20–39 4353 62.140–59 1753 25.0≥ 60 905 12.9Total 7011 100.0
SexMale 3506 50.0Female 3505 50.0Total 7011 100.0
ResidenceUrban 5143 73.4Rural 1868 26.4Total 7011 100.0
EducationIlliterate 2333 33.8< Secondary 2824 40.9≥ Secondary 1753 25.3Total 6910 100.0
Work statusWorking 2778 39.9Not working 4191 60.1Total 6969 100.0
Marital statusMarried 4668 66.7Not married 2327 33.3Total 6995 100.0
Family size≤ 10 members 3696 52.7> 10 members 3315 47.3Total 7011 100.0
Currently smoking Yes 488 7.0No 6515 93.0Total 7003 100.0
02 Clustering of cardiovascular risk.pmd 3/3/2005, 12:10 AM897
898 La Revue de Santé de la Méditerranée orientale, Vol. 9, No 5/6, 2003
of education. The OR for each variable wasadjusted for the other variables in the modelto account for confounding between thesevariables.
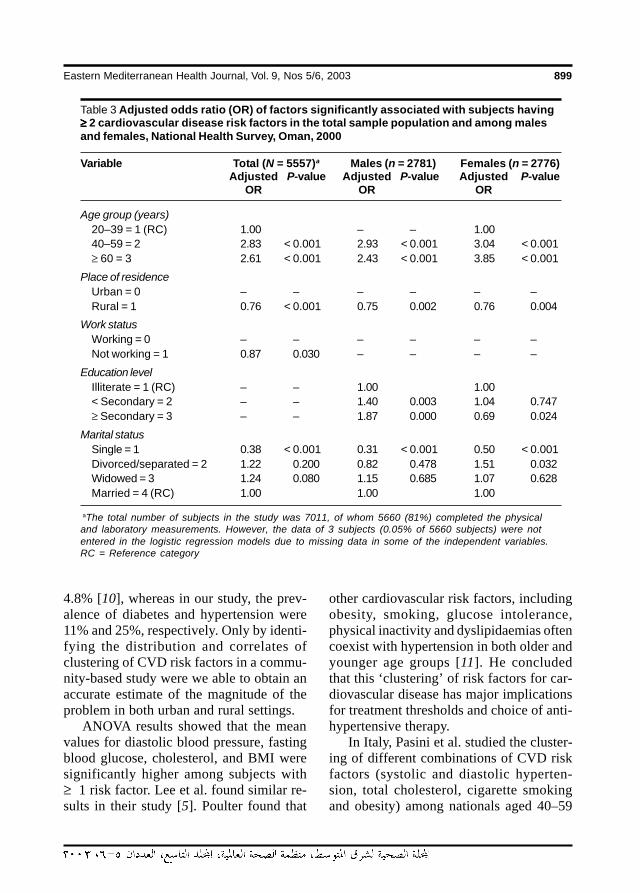
Table 3 shows the significantly associ-ated variables with the group having ≥ 2risk factors, and the adjusted OR in 3 dif-ferent multiple logistic models, i.e. for thewhole sample and for male and female sex.The risk of being in this group (having ≥ 2risk factors) increased with the higher agegroup and with living in urban areas in the 3different models. Subjects aged ≥ 60 yearswere 2.6 times more likely to be in thegroup of ≥ 2 risk factors compared toyounger age groups (20–39 years) in thetotal sample. Being single decreased therisk in the 3 models. Having a higher levelof education (secondary and above) in-creased the risk for male subjects but de-creased it for females.
Table 4 shows the adjusted OR for thegroup having ≥ 2 or more risk factors inthe 3 different age groups. Urban residenceincreased the risk in the 3 age groups. Be-ing female was protective in the age group20–39 years, but increased the risk amongthe older age groups, 40–59 years and ≥ 60years. The adjusted OR values were 0.73,1.29 and 1.7 respectively.
DiscussionHealth institution-based statistics usuallygive health planners an underestimation ofthe noncommunicable disease problem inOman. For example, the registration ofcases in diabetic registries nationwide isstill unsatisfactory. In 2000 (the year of ourstudy), the percentage of new and old cas-es of diabetes registered and treated in Min-istry of Health institutions was 3.04% ofthe population aged ≥ 20 years. The hyper-tension figure for this age group was only
Tabl
e 2
Com
paris
on o
f mea
ns o
f car
diov
ascu
lar d
isea
se ri
sk fa
ctor
s am
ong
grou
ps o
f sub
ject
s w
ith z
ero,
one
or m
ore
CVD
risk
fact
ors,
Nat
iona
l Hea
lth S
urve
y, O
man
, 200
0
Varia
ble
Mea
n (to
tal s
ampl
e)M
ean
acco
rdin
g to
num
ber o
f ris
k fa
ctor
sF
P-v
alue
Ove
rall
01
23
4 N
= 5
660
n =
158
6n
= 1
970
n =
139
4n
= 5
98n
= 1
12
Dia
stol
ic b
lood
pre
ssur
e(m
m H
g)80
.475
.378
.783
.290
.495
.649
6.3
< 0.
05
Fast
ing
bloo
d gl
ucos
e(m
mol
/L)
5.5
4.8
5.1
5.8
7.2
10.5
332.
6<
0.05
Fast
ing
seru
m c
hole
ster
ol(m
mol
/L)
5.1
4.2
4.9
5.7
6.1
6.5
712.
3<
0.05
Bod
y m
ass
inde
x (k
g/m
2 )25
.421
.025
.328
.230
.0a
30.9
a65
4.1
< 0.
05
a All
diffe
renc
es o
f th
e m
eans
wer
e si
gnifi
cant
bel
ow t
he 0
.05
leve
l by
the
AN
OVA
-Tuk
ey m
etho
d, e
xcep
t fo
r th
e B
MI
mea
n di
ffere
nce
betw
een
subj
ects
with
3 r
isk
fact
ors
and
subj
ects
with
4 r
isk
fact
ors.
02 Clustering of cardiovascular risk.pmd 3/3/2005, 12:10 AM898
Eastern Mediterranean Health Journal, Vol. 9, Nos 5/6, 2003 899
4.8% [10], whereas in our study, the prev-alence of diabetes and hypertension were11% and 25%, respectively. Only by identi-fying the distribution and correlates ofclustering of CVD risk factors in a commu-nity-based study were we able to obtain anaccurate estimate of the magnitude of theproblem in both urban and rural settings.
ANOVA results showed that the meanvalues for diastolic blood pressure, fastingblood glucose, cholesterol, and BMI weresignificantly higher among subjects with≥ 1 risk factor. Lee et al. found similar re-sults in their study [5]. Poulter found that
other cardiovascular risk factors, includingobesity, smoking, glucose intolerance,physical inactivity and dyslipidaemias oftencoexist with hypertension in both older andyounger age groups [11]. He concludedthat this ‘clustering’ of risk factors for car-diovascular disease has major implicationsfor treatment thresholds and choice of anti-hypertensive therapy.
In Italy, Pasini et al. studied the cluster-ing of different combinations of CVD riskfactors (systolic and diastolic hyperten-sion, total cholesterol, cigarette smokingand obesity) among nationals aged 40–59
Table 3 Adjusted odds ratio (OR) of factors significantly associated with subjects having≥≥≥≥≥ 2 cardiovascular disease risk factors in the total sample population and among malesand females, National Health Survey, Oman, 2000
Variable Total (N = 5557)a Males (n = 2781) Females (n = 2776)Adjusted P-value Adjusted P-value Adjusted P-value
OR OR OR
Age group (years)20–39 = 1 (RC) 1.00 – – 1.0040–59 = 2 2.83 < 0.001 2.93 < 0.001 3.04 < 0.001≥ 60 = 3 2.61 < 0.001 2.43 < 0.001 3.85 < 0.001
Place of residenceUrban = 0 – – – – – –Rural = 1 0.76 < 0.001 0.75 0.002 0.76 0.004
Work statusWorking = 0 – – – – – –Not working = 1 0.87 0.030 – – – –
Education levelIlliterate = 1 (RC) – – 1.00 1.00< Secondary = 2 – – 1.40 0.003 1.04 0.747≥ Secondary = 3 – – 1.87 0.000 0.69 0.024
Marital statusSingle = 1 0.38 < 0.001 0.31 < 0.001 0.50 < 0.001Divorced/separated = 2 1.22 0.200 0.82 0.478 1.51 0.032Widowed = 3 1.24 0.080 1.15 0.685 1.07 0.628Married = 4 (RC) 1.00 1.00 1.00
aThe total number of subjects in the study was 7011, of whom 5660 (81%) completed the physicaland laboratory measurements. However, the data of 3 subjects (0.05% of 5660 subjects) were notentered in the logistic regression models due to missing data in some of the independent variables.RC = Reference category
02 Clustering of cardiovascular risk.pmd 3/3/2005, 12:10 AM899
900 La Revue de Santé de la Méditerranée orientale, Vol. 9, No 5/6, 2003
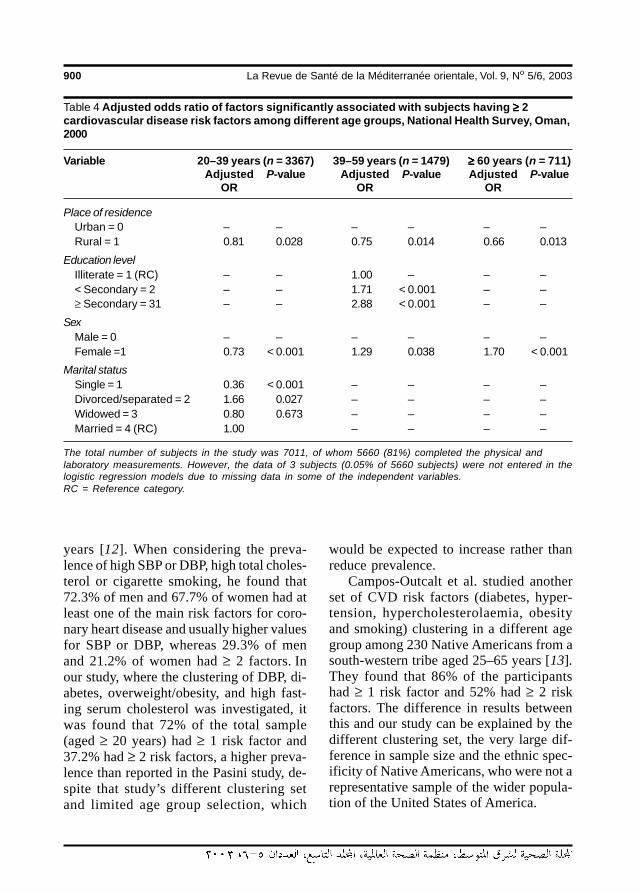
years [12]. When considering the preva-lence of high SBP or DBP, high total choles-terol or cigarette smoking, he found that72.3% of men and 67.7% of women had atleast one of the main risk factors for coro-nary heart disease and usually higher valuesfor SBP or DBP, whereas 29.3% of menand 21.2% of women had ≥ 2 factors. Inour study, where the clustering of DBP, di-abetes, overweight/obesity, and high fast-ing serum cholesterol was investigated, itwas found that 72% of the total sample(aged ≥ 20 years) had ≥ 1 risk factor and37.2% had ≥ 2 risk factors, a higher preva-lence than reported in the Pasini study, de-spite that study’s different clustering setand limited age group selection, which
would be expected to increase rather thanreduce prevalence.
Campos-Outcalt et al. studied anotherset of CVD risk factors (diabetes, hyper-tension, hypercholesterolaemia, obesityand smoking) clustering in a different agegroup among 230 Native Americans from asouth-western tribe aged 25–65 years [13].They found that 86% of the participantshad ≥ 1 risk factor and 52% had ≥ 2 riskfactors. The difference in results betweenthis and our study can be explained by thedifferent clustering set, the very large dif-ference in sample size and the ethnic spec-ificity of Native Americans, who were not arepresentative sample of the wider popula-tion of the United States of America.
Table 4 Adjusted odds ratio of factors significantly associated with subjects having ≥≥≥≥≥ 2cardiovascular disease risk factors among different age groups, National Health Survey, Oman,2000
Variable 20–39 years (n = 3367) 39–59 years (n = 1479) ≥≥≥≥≥ 60 years (n = 711)Adjusted P-value Adjusted P-value Adjusted P-value
OR OR OR
Place of residenceUrban = 0 – – – – – –Rural = 1 0.81 0.028 0.75 0.014 0.66 0.013
Education levelIlliterate = 1 (RC) – – 1.00 – – –< Secondary = 2 – – 1.71 < 0.001 – –≥ Secondary = 31 – – 2.88 < 0.001 – –
SexMale = 0 – – – – – –Female =1 0.73 < 0.001 1.29 0.038 1.70 < 0.001
Marital statusSingle = 1 0.36 < 0.001 – – – –Divorced/separated = 2 1.66 0.027 – – – –Widowed = 3 0.80 0.673 – – – –Married = 4 (RC) 1.00 – – – –
The total number of subjects in the study was 7011, of whom 5660 (81%) completed the physical andlaboratory measurements. However, the data of 3 subjects (0.05% of 5660 subjects) were not entered in thelogistic regression models due to missing data in some of the independent variables.RC = Reference category.
02 Clustering of cardiovascular risk.pmd 3/3/2005, 12:10 AM900
Eastern Mediterranean Health Journal, Vol. 9, Nos 5/6, 2003 901
Because of the importance of the clus-tering of CVD risk factors, Mancia con-cluded that the established major riskfactors for CVD, hypertension, hypercho-lesterolaemia and smoking, are present, of-ten in combination, in populations aroundthe world [14]. He added that these factorshave been found to interact in a synergisticmanner to increase the risk of coronaryheart disease. Mancia therefore, suggestedthat traditional antihypertensive treatmentsoffered little protection against coronaryheart disease, perhaps because antihyper-tensive drugs tend to be prescribed to re-duce BP without taking account of thepresence of other risk factors. However, itshould be borne in mind that the Manciastudy was conducted over 15 years ago(1988), and newer antihypertensive medi-cations are increasingly targeting the co-occurrence of hypertension and other CVDrisk factors.
Phillips et al. concluded that diabetic pa-tients have a higher prevalence of CVD riskfactors than those without diabetes, there-fore requiring improved vigilance of diabet-ic patients and interventions to modify theassociated risk factors [15]. Bog-Hansen etal. similarly reported a strong coexistenceof hypertension and type 2 diabetes [16].
Regarding the demographic and socialfactors significantly associated with clus-tering in the present study, smoking wasnot significantly associated and is notshown in the logistic regression models inTable 3 and Table 4. Salgado-Sales foundresults similar to those in our study. Hefound that in Acapulco, Mexico, among1011 women and 1001 men aged ≥ 20years, the average levels of serum choles-terol were higher in older, overweight, hy-pertensive individuals and that thedifferences were statistically significant,but there was no difference in the choles-
terol levels of individuals with tobaccosmoking habits [17].
In our study, urban residence was sig-nificantly associated with clustering ofCVD risk factors in the overall sample, inthe male and female subsamples and in thedifferent age group sub-samples, althoughthis association was not statistically signifi-cant with each of the individual risk factorsper se (data not shown). This is not neces-sarily contradictory. As el Mugamer et al.have previously observed for the UnitedArab Emirates, which has a similar cultureto that of Oman, as socioeconomic devel-opment in the region intensifies, the differ-ence in lifestyles between urban and ruralresidents is becoming increasingly blurred[18]. Abdul-Rahim et al. concluded that al-though no significant differences werefound in the prevalence of hypertensionand diabetes between urban and rural popu-lations, other components of metabolicsyndrome, namely elevated triglycerides,low HDL cholesterol and overall obesitywere more prevalent in the urban popula-tion [19].
While being female gender was a pro-tective factor in the younger 20–39-year-old age group (OR = 0.73, P < 0.05), itincreased the clustering risk in the higherage groups, i.e. the 40–59-year-olds andthose aged ≥ 60 years, where femaleswere 1.3 and 1.7 times respectively morelikely to have clustering than males in theseage groups. This may be explained by theprotective role of female sex hormones be-fore the age of 40 years.
Having attained a higher level of educa-tion was protective for the female sub-sample (OR = 0.698, P < 0.05), whilemales who had attained a secondary educa-tion or above were 1.87 times more likelyto have aggregated risk factors. This can-not be explained by the relatively young ageof highly educated females in Oman, as the
02 Clustering of cardiovascular risk.pmd 3/3/2005, 12:10 AM901
902 La Revue de Santé de la Méditerranée orientale, Vol. 9, No 5/6, 2003
OR was already age-adjusted for both gen-ders. It could be explained by other psy-chosocial factors that should be addressedin future studies.
Conclusion andrecommendationsBoth diabetes mellitus and hypertension areimportant public health problems in Oman.There needs to be a heightening of the levelof awareness among primary care physi-cians to be alert to the possible presence ofthese pathologies among their patients.General community awareness also needsto be raised about individual risk factors fordiabetes and hypertension, and about theiraggregated effect in the development ofCVD.
Improving understanding and aware-ness among physicians and the generalcommunity will aid prevention, diagnosisand management of both diabetes and hy-pertension, and in turn CVD, and canpotentially lead to a reduction in complica-tions arising from these chronic conditions.Disseminating to physicians the resultsshown in the logistic regression models ofthose factors significantly associated withclustering will aid in their ability to predictthe presence of clustering and prompt them
to more closely monitor patients at risk.This will lead to more efficient registrationand management of chronic diseases at theprimary care level.
Medical practitioners should alwayssuspect clustering of CVD risk factors inpatients who are aged ≥ 40 years, marriedand living in an urban setting. Having anurban place of residence was a commonrisk factor in all models used in this study.
Improving community awareness ofthe problem by health education campaignsis essential if the prevalence of CVD riskfactors and the burden of CVD in the gen-eral population are to be reduced. Patienteducation and a coordinated approach byphysicians, nurses and other healthcareproviders in a multidisciplinary approach tothe treatment of obese patients are also offundamental importance to reduce theprevalence of CVD in the population. Ab-dominal obesity is the earliest symptom ofmetabolic cardiovascular syndrome. Pre-vention or early treatment of such obesitycan prevent or delay the onset of diseasesassociated with the syndrome. Vigilanceand effecting positive behavioural change,not always easily achieved, are key factorsin the prevention, early diagnosis, and re-duced complications of risk factors leadingto CVD.
References
1. Asfour AG et al. Diabetes mellitus in theSultanate of Oman. Diabetic medicine,1991, 8:76–80.
2. Ghannem H, Fredj AH. Prevalence ofcardiovascular risk factors in the urbanpopulation of Soussa in Tunisia. Journalof public health medicine, 1997, 19:392–6.
3. Prevalence of cardiovascular diseaserisk-factor clustering among persons
aged > or = 45 years – Louisiana, 1991-1995. Morbidity and mortality weekly re-port, 1997, 46:585–8.
4. McLaughlin T, Reaven G. Insulin resis-tance and hypertension. Patients indouble jeopardy for cardiovascular dis-ease. Geriatrics, 2000, 55:28–32, 35.
5. Lee ZS et al. Obesity is the key determi-nant of cardiovascular risk factors in theHong Kong Chinese population: cross-
02 Clustering of cardiovascular risk.pmd 3/3/2005, 12:10 AM902
Eastern Mediterranean Health Journal, Vol. 9, Nos 5/6, 2003 903
sectional clinic-based study. Hong Kongmedical journal, 2000, 6:13–23.
6. Bener A et al. Acanthosis nigricans,hyperinsulinaemia and risk factors forcardiovascular disease. Eastern Medi-terranean health journal, 2000, 6:416–24.
7. Musaiger AO, al-Roomi KA. Prevalenceof risk factors for cardiovascular dis-eases among men and women in anArab Gulf community. Nutrition andhealth, 1997, 11:149–57.
8. Ibrahim MM et al. Cardiovascular riskfactors in normotensive and hyperten-sive Egyptians. Journal of hypertension,2001, 9:1933–40.
9. Definition, diagnosis and classificationof diabetes mellitus and its complica-tions. Part 1: Diagnosis and classificationof diabetes mellitus, a report of a WHOconsultation. Geneva, World Health Or-ganization, Department of Noncommu-nicable Disease Surveillance, 1999.
10. Annual Health Report, 2000. Muscat,Oman Ministry of Health, 2001:9–61.
11. Poulter NR. Risk factors for cardiovascu-lar disease: ‘clustering’ in the older hy-pertensive man. British journal of clinicalpractice, 1994, 74(suppl.):4–7.
12. Pasini GF et al. Prevalence of risk factorsfor coronary heart disease in a mountaincommunity in northern Italy. GiornaleItaliano di cardiologia, 1999, 29:891–7.
13. Campos-Outcalt D et al. Prevalence ofcardiovascular disease risk factors in asouthwestern Native American tribe.Public health reports, 1995, 110:742–8.
14. Mancia G. The need to manage risk fac-tors of coronary heart disease. Americanheart journal, 1988, 115:240–2.
15. Phillips P et al. Cardiovascular risk fac-tors in South Australians with diabetes.Australian journal of public health, 1994,18:445–9.
16. Bog-Hansen E et al. Risk factor cluster-ing in patients with hypertension andnon-insulin-dependent diabetes melli-tus. The Skaraborg HypertensionProject. Journal of internal medicine,1998, 243:223–32.
17. Salgado-Sales P. Estudio epidemio-logico de colesterol en poblacion deAcapulco, Mexico. [An epidemiologicalstudy of cholesterol in the population ofAcapulco, Mexico]. Salud publica diMexico, 1992, 34:653–9.
18. el Mugamer IT et al. Diabetes, obesityand hypertension in urban and ruralpeople of bedouin origin in the UnitedArab Emirates. Journal of tropical medi-cine and hygiene, 1995, 98:407–15.
19. Abdul-Rahim HF. The metabolic syn-drome in the West Bank population: anurban-rural comparison. Diabetes care,2001, 24:275–9.
02 Clustering of cardiovascular risk.pmd 3/3/2005, 12:10 AM903
904 La Revue de Santé de la Méditerranée orientale, Vol. 9, No 5/6, 2003
Burden of coronary heart disease onthe Iranian oil industry (1999–2000)B. Larijani,1 H. Fakhrzadeh,1 M. Mohaghegh,2 R. Pourebrahim1 and M.R. Akhlaghi1
1Endocrine and Metabolism Research Centre, Doctor Shariati Hospital, Tehran University, Tehran, IslamicRepublic of Iran.2Health Research and Education Unit, Healthcare Organization, National Iranian Oil Corporation, Tehran,Islamic Republic of Iran.Received: 30/07/02; accepted: 27/03/03
ABSTRACT To estimate the direct cost of coronary heart disease (CHD) to the Iranian oil industry, wecalculated the cost of essential services for 1253 CHD patients admitted to the National Iranian Oil Corpora-tion (NIOC) Central Hospital. The direct cost of CHD at the Hospital was 10 940 million rials (US$ 1 = 8000rials), or 8.7 million rials per patient. The direct cost of CHD to the Iranian oil industry was estimated at 22 770million rials. Working days lost to workers hospitalized for CHD amounted to 62 832. The heavy burden ofCHD on the Iranian oil industry necessitates the introduction of an industry-wide prevention programme.
Charge imposée par les coronaropathies sur l’industrie pétrolière iranienne (1999-2000)RESUME Afin d’estimer le coût direct des coronaropathies pour l’industrie pétrolière iranienne, nous avonscalculé le coût des services essentiels pour 1253 patients souffrant de coronaropathie admis à l’hôpitalcentral de la National Iranian Oil Corporation. Le coût direct des coronaropathies dans cet hôpital centrals’élevait à 10 940 millions de rials (USD 1 = 8000 rials), soit 8,7 millions de rials par patient. On estime que lecoût direct des coronaropathies pour l’industrie pétrolière iranienne s’élevait à 22 770 millions de rials. Il y aeu 62 832 journées de travail de perdues pour les ouvriers hospitalisés pour coronaropathie. La lourdecharge imposée par les coronaropathies sur l’industrie pétrolière iranienne rend nécessaire l’introductiond’un programme sectoriel de prévention des coronaropathies.
03 Burden of coronary heart.pmd 3/3/2005, 12:10 AM904
Eastern Mediterranean Health Journal, Vol. 9, Nos 5/6, 2003 905
IntroductionThe restructuring of communities acrossAsia has been accompanied by an alarmingincrease in the incidence of coronary heartdisease (CHD) [1]. Modern technology, in-creasing urbanization, rapid economicgrowth and lifestyle changes have made asignificant contribution to the rising inci-dence of CHD in these communities. Mor-tality figures for Asian countries show arising tide of CHD similar to that experi-enced by the industrialized West in the1950s and 1960s [2].
The results of the World Health Organi-zation Multinational Monitoring of Trendsand Determinants in Cardiovascular Dis-ease (MONICA) Project have shown thatcardiovascular disease causes between25%–45% of all deaths worldwide and isthe leading cause of death in a majority ofcountries [3,4]. More than half of thesedeaths occur in developing countries [5].
Although not traditionally consideredprevalent, CHD and cerebrovascular acci-dents, or strokes, have now become theleading causes of death in China [6,7]. InSoutheast Asia too, the prevalence of CHDis on a steep upward curve. Cardiovasculardisorders, primarily CHD, have also be-come a leading cause of death in India[8,9]. It has been estimated that the numberof deaths due to CHD will have doubledthere between 1985 and 2015, at whichtime CHD will displace infectious diseasesas the leading cause of death [10].
The heavy economic burden of cardio-vascular disease strains the imagination. Inthe United States of America, the cost ofCHD in the year 2000 has been estimated atmore than US$ 118 000 million [11]. In1996–1997, the cost of patients with myo-cardial infarctions in the Islamic Republicof Iran was estimated at 170 000 millionrials (US$ 1 = 8000 Iranian rials) [12].
To estimate the economic cost of coro-nary artery disease to the Iranian oil indus-try in 1999, the Research and EducationUnit of the Healthcare Organization of theNational Iranian Oil Corporation (NIOC)calculated total hospitalization costs ofCHD patients admitted to the NIOC CentralHospital in Tehran in that year and then es-timated the total burden imposed by CHDon the Iranian oil industry.
MethodsFor this cross-sectional study, we obtaineda list from the records office of the NIOCCentral Hospital, Tehran, of all patients ad-mitted between 21 March 1999 and 20March 2000 because of coronary arterydisease (International Classification of Dis-eases, 9th revision, codes 410–414). Weestimated the overall cost using a pricelistof essential goods and services based onthe tariffs set by the Healthcare Departmentof the NIOC Healthcare Organization. Thefinal cost of hospitalized patients was cal-culated according to the following linearequation [13]:
Total cost = Σ (Unit price of each service ×Number of units of service delivered)
At the same time NIOC-dependenthealthcare centres throughout the countrywere requested to provide the study teamwith a statement of the cost of CHD pa-tients in their care during the study interval.
Direct costs were defined as costs di-rectly attributable to the production or de-livery of a service, e.g. coronaryangioplasty. Indirect costs were the socialcosts attributable to such items as loss ofproductivity, absenteeism and loss of man-ufacturing manpower.
03 Burden of coronary heart.pmd 3/3/2005, 12:10 AM905
906 La Revue de Santé de la Méditerranée orientale, Vol. 9, No 5/6, 2003
We only assessed the cost of patientshospitalized with coronary events, i.e. angi-na pectoris, myocardial infraction and sud-den cardiac death. We excluded the cost ofoutpatient services delivered during thestudy interval. Likewise, indirect costs dueto structural wear and tear, use of diagnos-tic equipment and water and electric utili-ties that were not attributable to anyspecific function or action were not calcu-lated as part of this study.
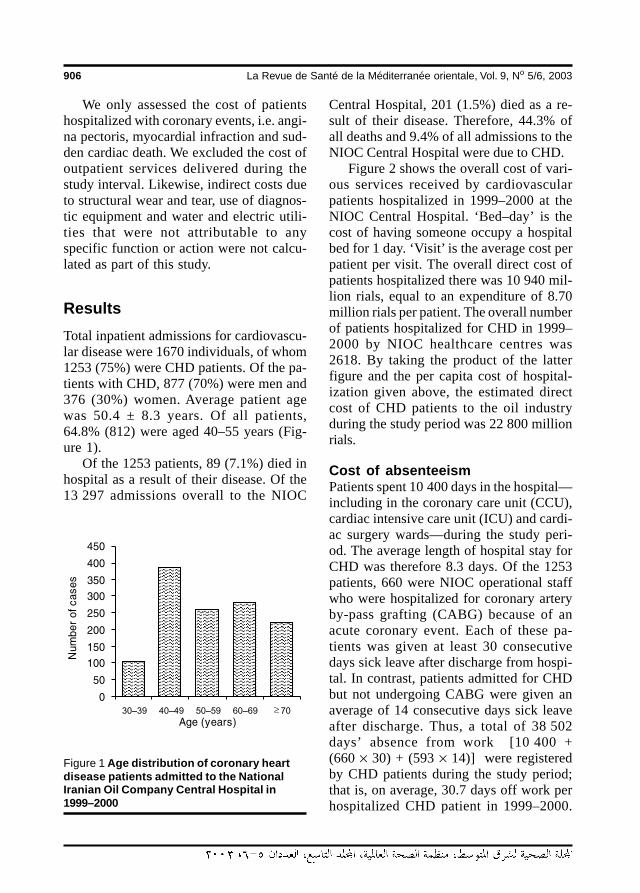
ResultsTotal inpatient admissions for cardiovascu-lar disease were 1670 individuals, of whom1253 (75%) were CHD patients. Of the pa-tients with CHD, 877 (70%) were men and376 (30%) women. Average patient agewas 50.4 ± 8.3 years. Of all patients,64.8% (812) were aged 40–55 years (Fig-ure 1).
Of the 1253 patients, 89 (7.1%) died inhospital as a result of their disease. Of the13 297 admissions overall to the NIOC
Central Hospital, 201 (1.5%) died as a re-sult of their disease. Therefore, 44.3% ofall deaths and 9.4% of all admissions to theNIOC Central Hospital were due to CHD.
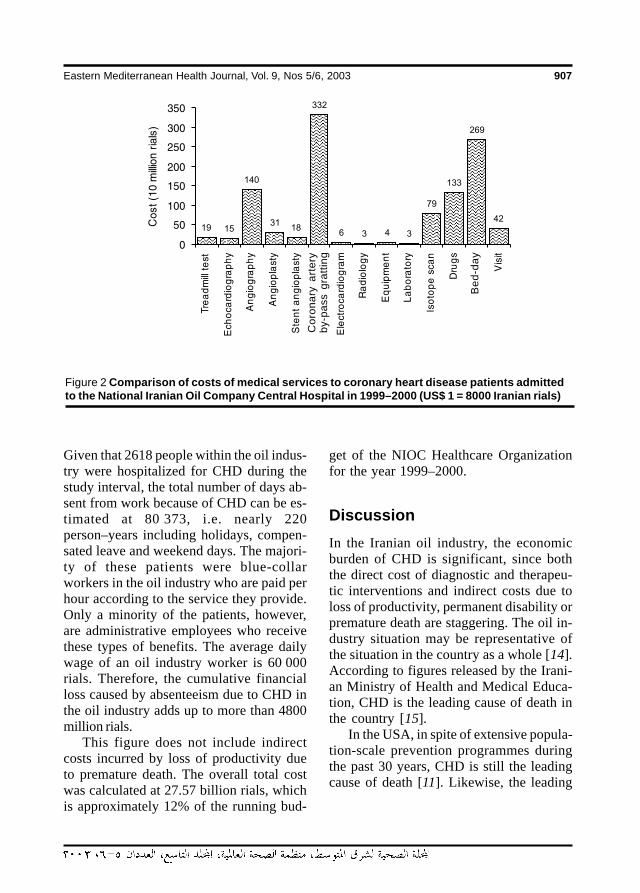
Figure 2 shows the overall cost of vari-ous services received by cardiovascularpatients hospitalized in 1999–2000 at theNIOC Central Hospital. ‘Bed–day’ is thecost of having someone occupy a hospitalbed for 1 day. ‘Visit’ is the average cost perpatient per visit. The overall direct cost ofpatients hospitalized there was 10 940 mil-lion rials, equal to an expenditure of 8.70million rials per patient. The overall numberof patients hospitalized for CHD in 1999–2000 by NIOC healthcare centres was2618. By taking the product of the latterfigure and the per capita cost of hospital-ization given above, the estimated directcost of CHD patients to the oil industryduring the study period was 22 800 millionrials.
Cost of absenteeismPatients spent 10 400 days in the hospital—including in the coronary care unit (CCU),cardiac intensive care unit (ICU) and cardi-ac surgery wards—during the study peri-od. The average length of hospital stay forCHD was therefore 8.3 days. Of the 1253patients, 660 were NIOC operational staffwho were hospitalized for coronary arteryby-pass grafting (CABG) because of anacute coronary event. Each of these pa-tients was given at least 30 consecutivedays sick leave after discharge from hospi-tal. In contrast, patients admitted for CHDbut not undergoing CABG were given anaverage of 14 consecutive days sick leaveafter discharge. Thus, a total of 38 502days’ absence from work [10 400 +(660 × 30) + (593 × 14)] were registeredby CHD patients during the study period;that is, on average, 30.7 days off work perhospitalized CHD patient in 1999–2000.
Figure 1 Age distribution of coronary heartdisease patients admitted to the NationalIranian Oil Company Central Hospital in1999–2000
03 Burden of coronary heart.pmd 3/3/2005, 12:10 AM906
Eastern Mediterranean Health Journal, Vol. 9, Nos 5/6, 2003 907
Given that 2618 people within the oil indus-try were hospitalized for CHD during thestudy interval, the total number of days ab-sent from work because of CHD can be es-timated at 80 373, i.e. nearly 220person–years including holidays, compen-sated leave and weekend days. The majori-ty of these patients were blue-collarworkers in the oil industry who are paid perhour according to the service they provide.Only a minority of the patients, however,are administrative employees who receivethese types of benefits. The average dailywage of an oil industry worker is 60 000rials. Therefore, the cumulative financialloss caused by absenteeism due to CHD inthe oil industry adds up to more than 4800million rials.
This figure does not include indirectcosts incurred by loss of productivity dueto premature death. The overall total costwas calculated at 27.57 billion rials, whichis approximately 12% of the running bud-
get of the NIOC Healthcare Organizationfor the year 1999–2000.
DiscussionIn the Iranian oil industry, the economicburden of CHD is significant, since boththe direct cost of diagnostic and therapeu-tic interventions and indirect costs due toloss of productivity, permanent disability orpremature death are staggering. The oil in-dustry situation may be representative ofthe situation in the country as a whole [14].According to figures released by the Irani-an Ministry of Health and Medical Educa-tion, CHD is the leading cause of death inthe country [15].
In the USA, in spite of extensive popula-tion-scale prevention programmes duringthe past 30 years, CHD is still the leadingcause of death [11]. Likewise, the leading
Figure 2 Comparison of costs of medical services to coronary heart disease patients admittedto the National Iranian Oil Company Central Hospital in 1999–2000 (US$ 1 = 8000 Iranian rials)
Be
d-d
ay
Co
ron
ary
art
ery
by-
pa
ss g
ratt
ing
03 Burden of coronary heart.pmd 3/3/2005, 12:10 AM907
908 La Revue de Santé de la Méditerranée orientale, Vol. 9, No 5/6, 2003
cause of early and permanent disability inthe USA is CHD [11].
A recent study estimated direct and indi-rect costs of CHD in Germany to be DM39 000 million and DM 73 000 million re-spectively, or a total burden of DM 112 bil-lion [16]. In 1993 the direct cost of CHD inNew Zealand was estimated at NZ$ 200million [17]. In Switzerland during thesame year, US$ 21 million was spent onevery 100 000 patients with heart disease[18]. The financial burden imposed by theloss of productivity due to CHD death inthe state of California in 1991 was estimat-ed at US$ 5300 million [19]; the 5–10 yearcumulative direct costs in 1995 dollars forall patients with CHD were estimated to beUS$ 71.5 billion and US$ 126.6 billion re-spectively [20]. In the USA as a whole, thecalculated overall cost of cardiovasculardisease in the year 2000 was US$ 326.6 bil-lion (US$ 185.8 billion direct and US$140.8 billion indirect) [11].
The economic cost of coronary heartdisease is so heavy that even a small reduc-tion in incidence of CHD will produce re-markable savings. In Finland over the past20 years widespread preventive measureshave reduced cardiovascular mortality by50%, accompanied by a 40% reduction inper capita cost of treating CHD in the 35–64 year-old age group [21]. This emphasiz-es the large-scale cost-effectiveness ofpreventive measures and policies and riskfactor modifications [22].
In the wake of studies instituted by theUSA National Institutes of Health, preven-tive programmes have become a fixture ofhealth policy planning over the last 30years. The USA government will providethe Centers for Disease Control and Pre-vention with US$ 25 million to furtherstrengthen its cardiovascular preventionprogrammes in 18 states where CHD prev-alence is highest.
The oil industry is the Islamic Republicof Iran’s main source of income. Preven-tion of economic damage from CHD is ofparamount importance in order to preservea productive workforce. Tragically, 65%of those with acute CHD admitted to theNIOC Central Hospital in 1999–2000 wereaged between 40 and 55 years, which areusually the most fruitful years of a person’slife and career.
The diagnostic and therapeutic costs ofCHD patients in our study were estimatedwith the heavily subsidized care and equip-ment offered by the NIOC Central Hospital,e.g. angioplasty balloons, stents and cathe-ters. If we were to include in our calcula-tions the costs of subsidies, outpatientservices and indirect costs from structuraland instrumental wear and tear and loss ofmanufacturing output and productivity dueto premature coronary death and disability,we would have a figure far higher than26 770 million rials for 1999–2000.
There is little choice for the oil industrybut to institute a CHD prevention plan inorder to preserve a healthy workforce andto maintain output and productivity. This isa tall order, which requires collaborationbetween senior management within the in-dustry and healthcare medical and para-medical staff.
AcknowledgementsThe authors acknowledge the help given bythe Medical Records Office and Cardiolo-gy, Coronary Care and Cardiac SurgeryUnits of the NIOC Central Hospital. Theauthors also wish to thank Ms MandanaFatani, IT assistant, and Ms Mojgan Shari-fi, for her secretarial skills.
03 Burden of coronary heart.pmd 3/3/2005, 12:10 AM908
Eastern Mediterranean Health Journal, Vol. 9, Nos 5/6, 2003 909
References
1. Janus ED et al. The modulation of Asia:Implications for coronary heart disease.Circulation, 1996, 94:2671–3.
2. Reddy KS, Yusuf S. Emerging epidemicof cardiovascular disease in developingcountries. Circulation, 1988, 97:596–601.
3. World Health Organization MultinationalMonitoring of Trends and Determinantsin Cardiovascular Disease (MONICA)Project: A worldwide monitoring systemfor cardiovascular disease. World healthstatistics annual, 1982, 27:149.
4. World Health Organization MultinationalMonitoring of Trends and Determinantsin Cardiovascular Disease (MONICA)Project: Myocardial infarction and coro-nary deaths in the World Health Organi-zation. Circulation, 1994, 90:583–612.
5. Pearson TA, Jamison DT, Trego-Gutierrez Y. Cardiovascular disease. In:Jamison DT, ed. Disease control priori-ties in developing countries. New York,Oxford Medical Publications, 1993.
6. Tao S et al. Coronary heart disease andits risk factors in the People’s Republic ofChina. International journal of epidemi-ology, 1989, 18(S1):S159–63.
7. People’s Republic of China–UnitedStates Cardiovascular and Cardiopul-monary Epidemiology Research Group.An epidemiological study of cardiovas-cular and cardiopulmonary risk factors infour populations in the People’s Repub-lic of China. Baseline report from thePRC–USA collaborative study. Circula-tion, 1992, 85:1083–96.
8. Reddy KS. Cardiovascular disease in In-dia. World Health Organization statisticsquarterly, 1993, 46:101–7.
9. Gupta R, Gupta VR. Meta-analysis ofcoronary heart disease prevalence in In-dia. Indian heart journal, 1996, 48:241–5.
10. Gupta R, Singhal S. Coronary heart dis-ease in India. Circulation, 1997, 96:3785.
11. Heart and stroke statistical update. Dal-las, American Heart Association, 2000.
12. Habibi HR et al. Costs of acute myocar-dial infarction and its consequences inIran. Medical journal of the Islamic Re-public of Iran, 1997, 11(S1):S126.
13. Mark DB. Medical economics ofinterventional cardiology. In: Toppi EJ ed.Textbook of interventional cardiology.Philadelphia, WB Saunders, 1999.
14. Sarrafzadegan N et al. Priorities in car-diovascular disease prevention in Iran.Iranian heart journal, 1998, suppl.:131.
15. Ministry of Health and Medical Educa-tion. Report of the 3rd evaluation ofhealth-for-all strategies up to 2000.Tehran, Ministry of Health and MedicalEducation, 2000.
16. Klever-Deichert G et al. Kostenkoronarer Herzkrankheiten uber dieverbleibende Lebenszeit von KHK-Fallen—Eine Analyse des aktuellenBestandes an KHK-Fallen in Deutsch-land aus gesellschaftlicher Perspektive.[Costs of coronary heart diseases overthe remaining life time in coronary heartdisease cases—Analysis of the coro-nary heart disease cases in Germanyfrom the social perspective.] Zeitschriftfür Kardiologie, 1999, 88: 991–1000.
17. Scott WG, White HD, Scott HM. Cost ofcoronary heart disease in New Zealand.New Zealand medical journal, 1993,106(962):347–9.
18. Sagmeister M et al. An economic analy-sis of ischaemic heart disease in Swit-zerland. European heart journal, 1997,18(7):1102–9.
03 Burden of coronary heart.pmd 3/3/2005, 12:10 AM909
910 La Revue de Santé de la Méditerranée orientale, Vol. 9, No 5/6, 2003
19. Fox P et al. The economic costs of cardio-vascular disease mortality in California,1991. Journal of public health policy,1996, 17(4):442–59.
20. Russell MW et al. Direct medical costs ofcoronary artery disease in the UnitedStates. American journal of cardiology,1998, 81:1110–5.
21. Kiiskinen U et al. Does prevention of car-diovascular disease lead to decreasedcost of illness? Twenty years experienceform Finland. Preventive medicine,1997, 26(2):220–6.
22. Store NJ. The clinical and economic sig-nificance of atherosclerosis. Americanjournal of medicine, 1996, 101(4A):6S.
WHO CVD-risk management package for low- and medium-resource settings
The WHO CVD-Risk Management package contains a variety of com-ponents to guide healthcare providers and health systems, eventhose with very minimal resources, to more effective CVD risk man-agement through easy-to-follow risk-assessment and risk-manage-ment algorithms; lifestyle counselling protocols; drug treatmentprotocols; referral pathways; and follow-up schedules. The packagehas been designed primarily for the management of cardiovascularrisk in individuals detected to have hypertension through opportun-istic screening. However, it could be adapted for use with diabetesor smoking as entry points. The package is meant to be imple-mented in a range of health-care facilities in low- and medium-resource settings, in both industrialized and developing countries.The document can be obtained from Marketing and Dissemination,World Health Organization,20 Avenue Appia, 1211 Geneva 27, Swit-zerland (tel: +41 22 791 2476; fax: +41 22 791 4857; email:[email protected]). It is also available free on line at: http://whqlibdoc.who.int/publications/2002/9241545852.pdf
03 Burden of coronary heart.pmd 3/3/2005, 12:10 AM910
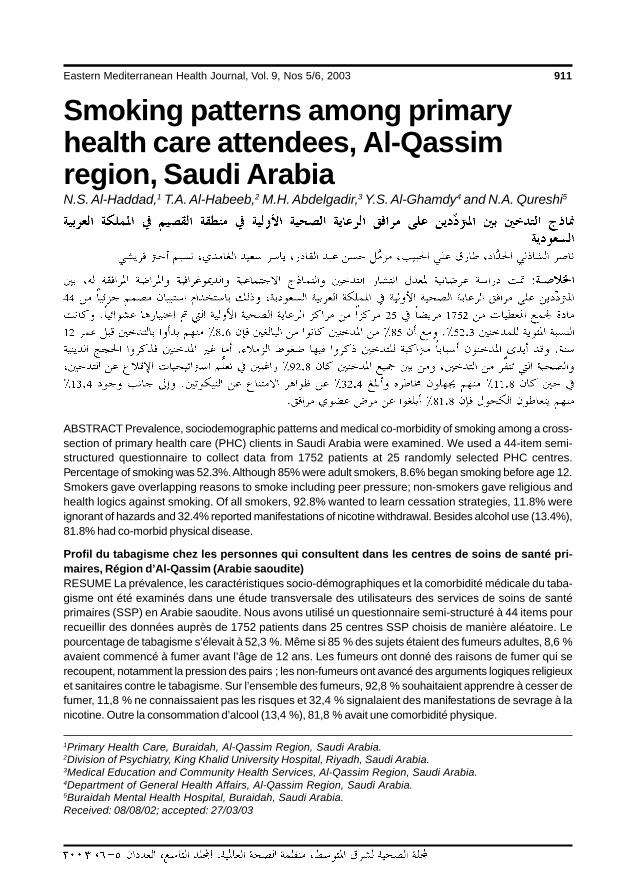
Eastern Mediterranean Health Journal, Vol. 9, Nos 5/6, 2003 911
Smoking patterns among primaryhealth care attendees, Al-Qassimregion, Saudi ArabiaN.S. Al-Haddad,1 T.A. Al-Habeeb,2 M.H. Abdelgadir,3 Y.S. Al-Ghamdy4 and N.A. Qureshi5
1Primary Health Care, Buraidah, Al-Qassim Region, Saudi Arabia.2Division of Psychiatry, King Khalid University Hospital, Riyadh, Saudi Arabia.3Medical Education and Community Health Services, Al-Qassim Region, Saudi Arabia.4Department of General Health Affairs, Al-Qassim Region, Saudi Arabia.5Buraidah Mental Health Hospital, Buraidah, Saudi Arabia.Received: 08/08/02; accepted: 27/03/03
Profil du tabagisme chez les personnes qui consultent dans les centres de soins de santé pri-maires, Région d’Al-Qassim (Arabie saoudite)RESUME La prévalence, les caractéristiques socio-démographiques et la comorbidité médicale du taba-gisme ont été examinés dans une étude transversale des utilisateurs des services de soins de santéprimaires (SSP) en Arabie saoudite. Nous avons utilisé un questionnaire semi-structuré à 44 items pourrecueillir des données auprès de 1752 patients dans 25 centres SSP choisis de manière aléatoire. Lepourcentage de tabagisme s’élevait à 52,3 %. Même si 85 % des sujets étaient des fumeurs adultes, 8,6 %avaient commencé à fumer avant l’âge de 12 ans. Les fumeurs ont donné des raisons de fumer qui serecoupent, notamment la pression des pairs ; les non-fumeurs ont avancé des arguments logiques religieuxet sanitaires contre le tabagisme. Sur l’ensemble des fumeurs, 92,8 % souhaitaient apprendre à cesser defumer, 11,8 % ne connaissaient pas les risques et 32,4 % signalaient des manifestations de sevrage à lanicotine. Outre la consommation d’alcool (13,4 %), 81,8 % avait une comorbidité physique.
ABSTRACT Prevalence, sociodemographic patterns and medical co-morbidity of smoking among a cross-section of primary health care (PHC) clients in Saudi Arabia were examined. We used a 44-item semi-structured questionnaire to collect data from 1752 patients at 25 randomly selected PHC centres.Percentage of smoking was 52.3%. Although 85% were adult smokers, 8.6% began smoking before age 12.Smokers gave overlapping reasons to smoke including peer pressure; non-smokers gave religious andhealth logics against smoking. Of all smokers, 92.8% wanted to learn cessation strategies, 11.8% wereignorant of hazards and 32.4% reported manifestations of nicotine withdrawal. Besides alcohol use (13.4%),81.8% had co-morbid physical disease.
04 Smoking patterns among primary.pmd 3/3/2005, 12:11 AM911
912 La Revue de Santé de la Méditerranée orientale, Vol. 9, No 5/6, 2003
IntroductionEvidence-based data robustly suggest theetiological role of smoking in physical andneuropsychiatric disorders among both ac-tive and passive smokers [1–3]. Moreover,tobacco smoking has been officially recog-nized as a substance use disorder that hasepidemiological, etiological, phenomeno-logical, pathophysiological, co-morbid, di-agnostic, therapeutic, prognostic andoutcome domains [4]. It is a major publichealth problem that causes millions of pre-mature deaths and huge economic lossesglobally every year [3]. Despite substantialprogress including enforced restrictions onsmoking in workplaces, the public still re-mains misinformed about its health risks[5–6]. Furthermore, adolescents, who arethe most vulnerable, receive vague messag-es about smoking [7]. Therefore, con-cerned authorities have started global ‘quitsmoking’ campaigns and have also devel-oped antismoking clinics, cessation strate-gies, drug therapies and rehabilitationprogrammes for smokers [4,8].
There is a tremendous amount of litera-ture on smoking patterns in the Westernworld compared with what is available fordeveloping countries. A review of smokingdata in the Gulf countries found only 17studies that primarily examined prevalence,predictors and patterns of smoking amonghealthy populations and provided strategiesand recommendations for prevention,treatment and further research. Smokingamong male psychiatric outpatients in Sau-di Arabia has been examined, but to ourknowledge, few studies have addressedsmoking patterns in primary health care(PHC) settings [9–13]. Our cross-sectionalstudy therefore aimed to explore preva-lence, sociodemographics, medical co-morbidity and patterns of smoking in arelatively large PHC population. We hy-
pothesized that the prevalence of smokingwould be higher than reported in healthypopulations and that the smoking habits ofPHC consumers would not differ muchfrom studies in both the Gulf countries andthe industrialized nations.
MethodsTo achieve these objectives, 25 of the 142PHC centres that are uniformly distributedthroughout the Al-Qassim region of SaudiArabia were selected randomly. The select-ed PHC centres were classified as eitherurban or rural by matching them to a previ-ous categorization of each PHC centre [12–13]. Then 25 senior general practitioners(GPs) from the selected PHC centres werebriefed and trained via telephone to admin-ister the semi-structured questionnaire. Inaddition to clarification of immediate que-ries, GPs were informed that if they hadany problems completing the form, theycould contact the research team by tele-phone. Following this, 100 copies of thequestionnaire were sent to each selectedPHC centre. GPs were advised to select bynon-systematic randomization only newmale patients for personal interviews tocomplete the 100 questionnaires within 3months. This was to be done without inter-fering with the regular delivery of adminis-trative, technical and health services toPHC clients. Each questionnaire took ap-proximately 30–45 minutes to complete.
A semi-structured questionnaire with 44items that was used in our previous re-search on smoking among psychiatric out-patients was slightly modified for thecurrent study [9]. In the final question-naire, 2 questions were changed to accom-modate the different focus of the currentstudy; the phrase ‘mental illness’ was sub-stituted with ‘physical disorder’ in 2 ques-
04 Smoking patterns among primary.pmd 3/3/2005, 12:11 AM912
Eastern Mediterranean Health Journal, Vol. 9, Nos 5/6, 2003 913
tions and the diagnosis of all diseases wassought.
During the first week of the study, GPswere briefed and were advised to read andunderstand the questionnaire. Most (96%)did not experience difficulty in completingit. A minority (4%) raised some queries,which were: 1) if the patient is a non-smok-er, is the entire questionnaire to be complet-ed? GPs were advised to complete only thedemographic part and the reasons for notsmoking. They were also requested to notetheir diagnosis plus any additional informa-tion about smoking the patient would like tooffer. 2) If the patient is an ex-smoker thatcompletely stopped smoking 6 months pri-or to our study, is the entire questionnaireto be completed? GPs were told to com-plete the demographic portion of the ques-tionnaire plus reasons for quitting, date ofquitting, use of treatments for smokingcessation and diagnosis along with any ad-ditional information about smoking. Our re-sponses to these queries were disseminatedto all participating GPs.
Current smokers were broadly definedas those who smoke regularly or occasion-ally on a daily, weekly or monthly basis.Non-smokers were defined as those whonever smoked. Thus, the sociodemograph-ics and diagnosis of all clients—smokers,ex-smokers and non-smokers—were re-corded. The demographic data (11 items)included name, sex, file number, date, age,level of education, marital status, resi-dence, occupation, family type and approx-imate monthly income. Family type wascategorized as: 1) nuclear, consisting ofonly one married couple living with unmar-ried children or 2) joint or extended, that isa married couple living with married chil-dren. The questionnaire also comprised 32items about smoking patterns and 1 itemfor diagnosis.
Frequency distributions and chi-squared test were used to determine asso-
ciations among categorical variables be-tween smokers and non-smokers. Studentt-test was used to determine differencesamong continuous variables. P-value of ≤0.05 was significant. SPSS version 10.0 forWindows was used for data analysis.
ResultsThis study took place from July 1999 toJuly 2000 and 1752 PHC patients were in-cluded in our final analysis. Approximately15% of participants had grossly incompleteresponses and another 15% refused to par-ticipate; hence, only 70% (1752) of theoriginal 2500 questionnaires were used inthe final analysis. Nonetheless no statisti-cally significant demographic differenceswere observed between participants andnon-participants. The one-year study peri-od included planning, briefing, data collec-tion and analysis. Furthermore, the GPs,100% of whom were expatriates, regularlytook 45 days annual vacation, attendedmultiple training courses within and outsidethe region and attended regional meetingsand conferences that were held duringworking hours. An audit is needed to deter-mine the number of patients, new as well asrepeat, attending each urban and rural PHCcentre. The daily census of PHC clientswas impressively high and differed be-tween rural and urban settings. Although nofemales were included in this study, 4.7%–16% of women smoke cigarettes in Riyadh[11,12].
Sociodemographic parametersOf 1752 PHC clients, 917 (52.3%) werecurrent smokers. The mean age and stan-dard deviation of PHC patients was 35.5± 11.5 years with 95% confidence interval(CI) 35–36. No significant age differencewas observed between smokers (mean age± SD = 35.43 ± 11.6 years) and non-
04 Smoking patterns among primary.pmd 3/3/2005, 12:11 AM913
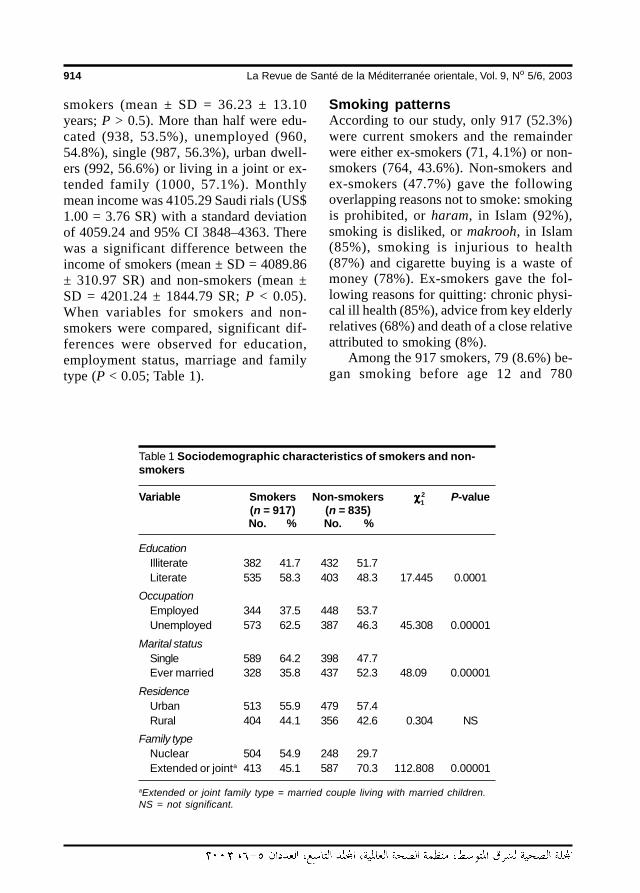
914 La Revue de Santé de la Méditerranée orientale, Vol. 9, No 5/6, 2003
smokers (mean ± SD = 36.23 ± 13.10years; P > 0.5). More than half were edu-cated (938, 53.5%), unemployed (960,54.8%), single (987, 56.3%), urban dwell-ers (992, 56.6%) or living in a joint or ex-tended family (1000, 57.1%). Monthlymean income was 4105.29 Saudi rials (US$1.00 = 3.76 SR) with a standard deviationof 4059.24 and 95% CI 3848–4363. Therewas a significant difference between theincome of smokers (mean ± SD = 4089.86± 310.97 SR) and non-smokers (mean ±SD = 4201.24 ± 1844.79 SR; P < 0.05).When variables for smokers and non-smokers were compared, significant dif-ferences were observed for education,employment status, marriage and familytype (P < 0.05; Table 1).
Smoking patternsAccording to our study, only 917 (52.3%)were current smokers and the remainderwere either ex-smokers (71, 4.1%) or non-smokers (764, 43.6%). Non-smokers andex-smokers (47.7%) gave the followingoverlapping reasons not to smoke: smokingis prohibited, or haram, in Islam (92%),smoking is disliked, or makrooh, in Islam(85%), smoking is injurious to health(87%) and cigarette buying is a waste ofmoney (78%). Ex-smokers gave the fol-lowing reasons for quitting: chronic physi-cal ill health (85%), advice from key elderlyrelatives (68%) and death of a close relativeattributed to smoking (8%).
Among the 917 smokers, 79 (8.6%) be-gan smoking before age 12 and 780
Table 1 Sociodemographic characteristics of smokers and non-smokers
Variable Smokers Non-smokers χχχχχ2 P-value(n = 917) (n = 835)No. % No. %
EducationIlliterate 382 41.7 432 51.7Literate 535 58.3 403 48.3 17.445 0.0001
OccupationEmployed 344 37.5 448 53.7Unemployed 573 62.5 387 46.3 45.308 0.00001
Marital statusSingle 589 64.2 398 47.7Ever married 328 35.8 437 52.3 48.09 0.00001
ResidenceUrban 513 55.9 479 57.4Rural 404 44.1 356 42.6 0.304 NS
Family typeNuclear 504 54.9 248 29.7Extended or jointa 413 45.1 587 70.3 112.808 0.00001
aExtended or joint family type = married couple living with married children.NS = not significant.
1
04 Smoking patterns among primary.pmd 3/3/2005, 12:11 AM914
Eastern Mediterranean Health Journal, Vol. 9, Nos 5/6, 2003 915
(85.1%) began smoking at a young age(13–30 years). No reason for smoking wasgiven by 499 (54.4%) whereas 418(45.6%) smoked because they were eitherunhappy or anxious or had experiencedpeer pressure prior to smoking. Approxi-mately half (517, 56.4%) smoked 20 ormore cigarettes daily. More than half (521,56.8%) used Marlboro Reds and the rea-sons for their preferences were: first expe-rience was with Marlboro Red, quick push/effect, more nicotine and no rapid effectwith other brands. The majority (790,86.2%) smoked any time during the day. Aminor proportion of smokers (95, 10.4%)were also using sheesha, cigars and pipes.Approximately 71.6% of smokers (657)smoked anywhere they chose to.
Approximately 57.3% of smokers (525)reported positive family history of smok-ing. The majority of smokers (809, 88.2%)knew the injurious effects of smoking onhealth, whereas 11.8% (108) were igno-rant. Several sources of information werereported, including television (192,20.9%), magazines (631, 68.8%) and othermedia. Approximately 10.3% of smokers(94) had no access to any source of infor-mation about the ill-health effects of smok-ing. A minority of smokers (83, 9.1%) gavea positive family history of death attributedto smoking. Most smokers (681, 74.3%)reported that their family members wereaware of their smoking and the majorityhad family members (707, 77.1%) who ad-vised them not to smoke. Only 22.9%(210) reported that their families toleratedtheir smoking. More than half of the smok-ers (622, 67.8%) felt stressed, guilty andashamed buying cigarettes.
Approximately 34.2% of smokers (314)reported considerable increases in smokingfor a variety of reasons, including maritaldiscord, job problems, financial difficultiesand residential difficulties. Among smok-ers, 78% (715) had made attempts to quit.
Of all smokers, 32.4% (297) reportedsymptoms including dizziness, craving, ir-ritability, inattention, tiredness, headache,anxiety, weight gain and loneliness. Amongsmokers, 80.5% (738) expressed a desireto quit smoking. The majority (602,65.6%) reported guilt, shame, anger, fear,anxiety, social embarrassment and minorquarrels during smoking. Only 13.4% ofsmokers (123) reported using alcohol. A lit-tle less than half (425, 46.3%) stated thatthey preferred taking either tea or Arabiccoffee, or qahwa, while smoking. About43.8% of smokers started smoking beforedeveloping physical problems or diseaseswhereas 11.5% began smoking after suchillnesses. The majority of smokers (812,88.5%) responded that smoking neither im-proves their ability to pay attention or fo-cus, nor helps to quickly finish the job athand. In response to additional informationabout smoking, the majority of smokers(851, 92.8%) reported that they need spe-cific strategies for stopping smoking. PHCconsumers with strong religious back-grounds, as reflected in their views relatedto ‘additional comments’, smoked consid-erably less (P < 0.05; Table 2).
Medical disorders and smokingOf all PHC attendees, 18.2% (318 of 1752)had no medical disorders and more thanhalf of these (213, 67%) were non-smok-ers. Table 3 shows that the specific medicaldiseases significantly associated withsmoking were chest, musculoskeletal, al-lergic, dental and cardiac diseases (P <0.05) while central nervous system andsurgical diseases were significantly associ-ated with non-smokers (P < 0.05). The dis-tribution of medical disorders as a whole bysmoking status (Table 4) revealed thatmedical diseases were significantly associ-ated with smoking (P < 0.05).
04 Smoking patterns among primary.pmd 3/3/2005, 12:11 AM915
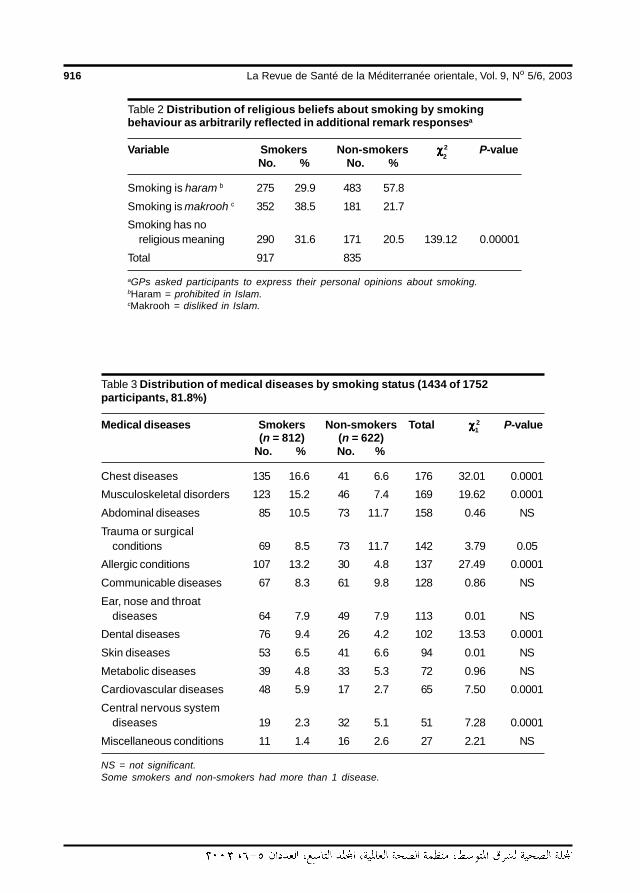
916 La Revue de Santé de la Méditerranée orientale, Vol. 9, No 5/6, 2003
Table 2 Distribution of religious beliefs about smoking by smokingbehaviour as arbitrarily reflected in additional remark responsesa
Variable Smokers Non-smokers χχχχχ2 P-valueNo. % No. %
Smoking is haram b 275 29.9 483 57.8
Smoking is makrooh c 352 38.5 181 21.7
Smoking has noreligious meaning 290 31.6 171 20.5 139.12 0.00001
Total 917 835
aGPs asked participants to express their personal opinions about smoking.bHaram = prohibited in Islam.cMakrooh = disliked in Islam.
Table 3 Distribution of medical diseases by smoking status (1434 of 1752participants, 81.8%)
Medical diseases Smokers Non-smokers Total χχχχχ 2 P-value(n = 812) (n = 622)
No. % No. %
Chest diseases 135 16.6 41 6.6 176 32.01 0.0001
Musculoskeletal disorders 123 15.2 46 7.4 169 19.62 0.0001
Abdominal diseases 85 10.5 73 11.7 158 0.46 NS
Trauma or surgicalconditions 69 8.5 73 11.7 142 3.79 0.05
Allergic conditions 107 13.2 30 4.8 137 27.49 0.0001
Communicable diseases 67 8.3 61 9.8 128 0.86 NS
Ear, nose and throatdiseases 64 7.9 49 7.9 113 0.01 NS
Dental diseases 76 9.4 26 4.2 102 13.53 0.0001
Skin diseases 53 6.5 41 6.6 94 0.01 NS
Metabolic diseases 39 4.8 33 5.3 72 0.96 NS
Cardiovascular diseases 48 5.9 17 2.7 65 7.50 0.0001
Central nervous systemdiseases 19 2.3 32 5.1 51 7.28 0.0001
Miscellaneous conditions 11 1.4 16 2.6 27 2.21 NS
NS = not significant.Some smokers and non-smokers had more than 1 disease.
2
1
04 Smoking patterns among primary.pmd 3/3/2005, 12:11 AM916
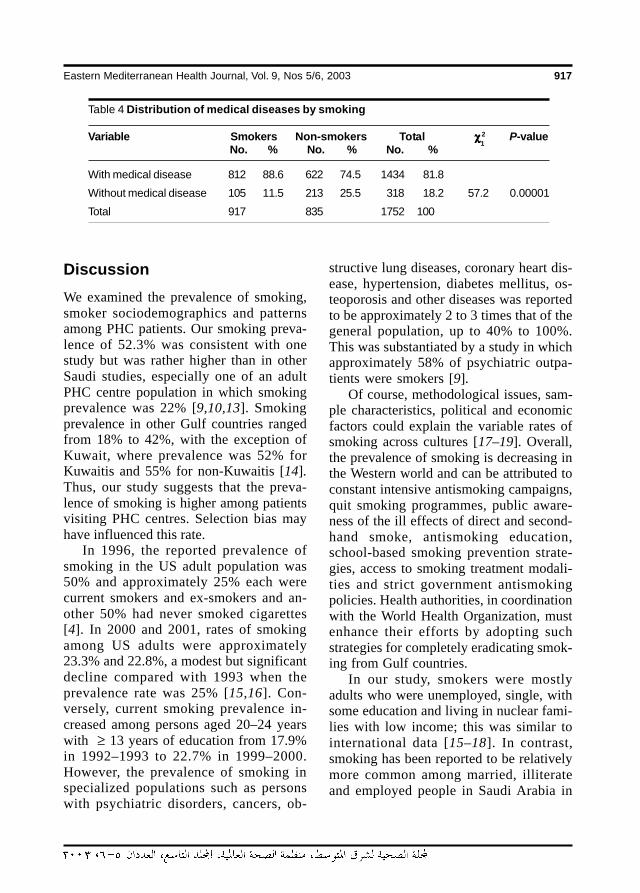
Eastern Mediterranean Health Journal, Vol. 9, Nos 5/6, 2003 917
DiscussionWe examined the prevalence of smoking,smoker sociodemographics and patternsamong PHC patients. Our smoking preva-lence of 52.3% was consistent with onestudy but was rather higher than in otherSaudi studies, especially one of an adultPHC centre population in which smokingprevalence was 22% [9,10,13]. Smokingprevalence in other Gulf countries rangedfrom 18% to 42%, with the exception ofKuwait, where prevalence was 52% forKuwaitis and 55% for non-Kuwaitis [14].Thus, our study suggests that the preva-lence of smoking is higher among patientsvisiting PHC centres. Selection bias mayhave influenced this rate.
In 1996, the reported prevalence ofsmoking in the US adult population was50% and approximately 25% each werecurrent smokers and ex-smokers and an-other 50% had never smoked cigarettes[4]. In 2000 and 2001, rates of smokingamong US adults were approximately23.3% and 22.8%, a modest but significantdecline compared with 1993 when theprevalence rate was 25% [15,16]. Con-versely, current smoking prevalence in-creased among persons aged 20–24 yearswith ≥ 13 years of education from 17.9%in 1992–1993 to 22.7% in 1999–2000.However, the prevalence of smoking inspecialized populations such as personswith psychiatric disorders, cancers, ob-
structive lung diseases, coronary heart dis-ease, hypertension, diabetes mellitus, os-teoporosis and other diseases was reportedto be approximately 2 to 3 times that of thegeneral population, up to 40% to 100%.This was substantiated by a study in whichapproximately 58% of psychiatric outpa-tients were smokers [9].
Of course, methodological issues, sam-ple characteristics, political and economicfactors could explain the variable rates ofsmoking across cultures [17–19]. Overall,the prevalence of smoking is decreasing inthe Western world and can be attributed toconstant intensive antismoking campaigns,quit smoking programmes, public aware-ness of the ill effects of direct and second-hand smoke, antismoking education,school-based smoking prevention strate-gies, access to smoking treatment modali-ties and strict government antismokingpolicies. Health authorities, in coordinationwith the World Health Organization, mustenhance their efforts by adopting suchstrategies for completely eradicating smok-ing from Gulf countries.
In our study, smokers were mostlyadults who were unemployed, single, withsome education and living in nuclear fami-lies with low income; this was similar tointernational data [15–18]. In contrast,smoking has been reported to be relativelymore common among married, illiterateand employed people in Saudi Arabia in
Table 4 Distribution of medical diseases by smoking
Variable Smokers Non-smokers Total χχχχχ2 P-valueNo. % No. % No. %
With medical disease 812 88.6 622 74.5 1434 81.8
Without medical disease 105 11.5 213 25.5 318 18.2 57.2 0.00001
Total 917 835 1752 100
1
04 Smoking patterns among primary.pmd 3/3/2005, 12:11 AM917
918 La Revue de Santé de la Méditerranée orientale, Vol. 9, No 5/6, 2003
1999 [20]. A US smoking survey suggestedthat smoking was relatively more commonamong people with General EducationalDevelopment diplomas, i.e. certification ofthe equivalent of 12 years of education pro-ficiency, as compared with highly educatedpersons [15]. Researchers have questionedwhether people with less formal educationare more vulnerable to excessive smokingand to the variety of mass media campaignsthat disseminate vague messages about un-healthy aspects of smoking [6,7]. Anti-smoking messages therefore should beclear, culture-specific and gender-specificand should target the illiterate [7].
We did not find any significant associa-tion between smoking and place of resi-dence, unlike a study of female students inRiyadh; this might be attributed to sampledifferences and to the nature of co-morbiddisorders [11]. However, early smokingbehaviours and poverty along with ruralresidence have been strongly associated[17,19]. Unlike in fragmented nuclear fam-ilies, joint families are a source of strongsocial support and a network that can ab-sorb stresses linked to smoking and canhelp reduce smoking among teenagers andadults.
In our study, one-tenth of smokerswere teenagers. These teenagers are likelyto progressively develop nicotine addictionand medical diseases and, therefore, are inneed of early school-based antismoking ed-ucation and other relevant programmes[3,17,18].
Heavy smokers were more than 50% ofour study population. They are probablyless motivated to quit and are more harmfulto others by spewing second-hand smokeinto the air surrounding them. Heavy smok-ers have more psychomedical diseases likedepression, anxiety disorders and psycho-ses comorbid with medical diseases and,
by inference, require intensive smokingcessation help [2–4,21].
Of all our smokers, 72% smoked any-where, suggesting that homes, work andpublic places are plagued with the second-hand smoke associated with multiple healthhazards among passive smokers [2,5,21].By implication, restrictive policies meant todiscourage smoking, including increasedcigarette taxes and prices, need immediateenforcement [17,22].
We considered whether smoking, likealcoholism, has an inheritable component.In our study, 57% of family members werealso smokers. In 1999, a review of smok-ing research indicated that data from fami-ly, adoption and twin studies supported asubstantial genetic influence on the initia-tion and maintenance of smoking [22].
Gulf countries should produce televi-sion programmes similar to those used ineffective mass media campaigns that edu-cate viewers about the harmful effects ofsmoking and its prevention and treatmentstrategies [23]. In our study, 10% to 12%of smokers did not know of the injuriouseffects of smoking and had no access tomedia. The number of smokers in ourstudy who unsuccessfully attempted toquit smoking was approximately 2 timeshigher than in a Canadian report [24]. Theymay need formal smoking cessation pro-grammes, cognitive-behavioural therapiesor counselling to motivate them and pro-vide social support and suitable pharmaco-therapies [4,5,8]. Most smokers expresseda desire to quit, and a great majority wantedto know more about smoking preventionand treatment strategies. A summary ofpharmacological and psychosocial thera-pies is provided in Tables 5 and 6 to informnurses, GPs, administrators and physicianswho want to offer smoking cessation ser-vices to smokers [4,8,25].
04 Smoking patterns among primary.pmd 3/3/2005, 12:11 AM918
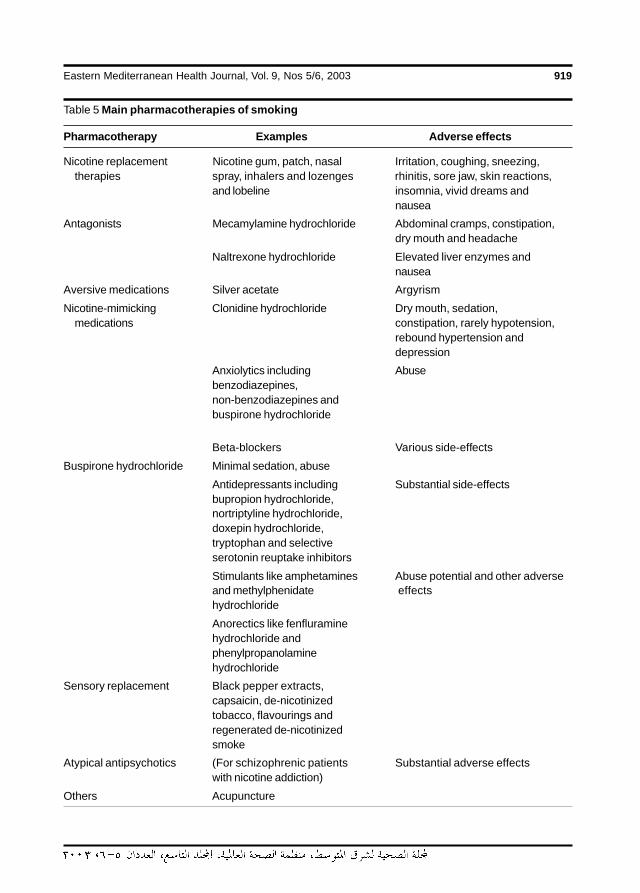
Eastern Mediterranean Health Journal, Vol. 9, Nos 5/6, 2003 919
Table 5 Main pharmacotherapies of smoking
Pharmacotherapy Examples Adverse effects
Nicotine replacement Nicotine gum, patch, nasal Irritation, coughing, sneezing,therapies spray, inhalers and lozenges rhinitis, sore jaw, skin reactions,
and lobeline insomnia, vivid dreams andnausea
Antagonists Mecamylamine hydrochloride Abdominal cramps, constipation,dry mouth and headache
Naltrexone hydrochloride Elevated liver enzymes andnausea
Aversive medications Silver acetate Argyrism
Nicotine-mimicking Clonidine hydrochloride Dry mouth, sedation,medications constipation, rarely hypotension,
rebound hypertension anddepression
Anxiolytics including Abusebenzodiazepines,non-benzodiazepines andbuspirone hydrochloride
Beta-blockers Various side-effects
Buspirone hydrochloride Minimal sedation, abuse
Antidepressants including Substantial side-effectsbupropion hydrochloride,nortriptyline hydrochloride,doxepin hydrochloride,tryptophan and selectiveserotonin reuptake inhibitors
Stimulants like amphetamines Abuse potential and other adverseand methylphenidate effectshydrochloride
Anorectics like fenfluraminehydrochloride andphenylpropanolaminehydrochloride
Sensory replacement Black pepper extracts,capsaicin, de-nicotinizedtobacco, flavourings andregenerated de-nicotinizedsmoke
Atypical antipsychotics (For schizophrenic patients Substantial adverse effectswith nicotine addiction)
Others Acupuncture
04 Smoking patterns among primary.pmd 3/3/2005, 12:11 AM919
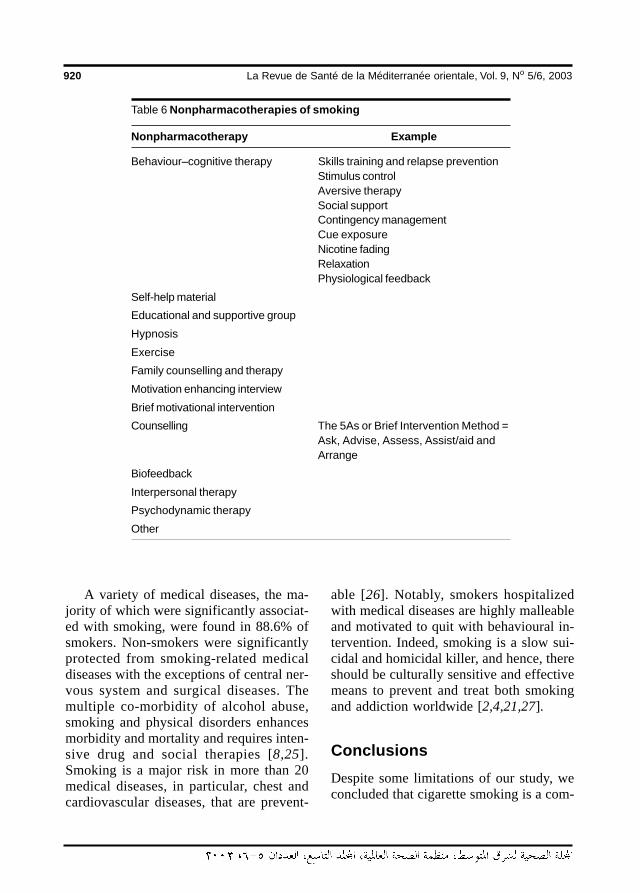
920 La Revue de Santé de la Méditerranée orientale, Vol. 9, No 5/6, 2003
Table 6 Nonpharmacotherapies of smoking
Nonpharmacotherapy Example
Behaviour–cognitive therapy Skills training and relapse preventionStimulus controlAversive therapySocial supportContingency managementCue exposureNicotine fadingRelaxationPhysiological feedback
Self-help material
Educational and supportive group
Hypnosis
Exercise
Family counselling and therapy
Motivation enhancing interview
Brief motivational intervention
Counselling The 5As or Brief Intervention Method =Ask, Advise, Assess, Assist/aid andArrange
Biofeedback
Interpersonal therapy
Psychodynamic therapy
Other
A variety of medical diseases, the ma-jority of which were significantly associat-ed with smoking, were found in 88.6% ofsmokers. Non-smokers were significantlyprotected from smoking-related medicaldiseases with the exceptions of central ner-vous system and surgical diseases. Themultiple co-morbidity of alcohol abuse,smoking and physical disorders enhancesmorbidity and mortality and requires inten-sive drug and social therapies [8,25].Smoking is a major risk in more than 20medical diseases, in particular, chest andcardiovascular diseases, that are prevent-
able [26]. Notably, smokers hospitalizedwith medical diseases are highly malleableand motivated to quit with behavioural in-tervention. Indeed, smoking is a slow sui-cidal and homicidal killer, and hence, thereshould be culturally sensitive and effectivemeans to prevent and treat both smokingand addiction worldwide [2,4,21,27].
ConclusionsDespite some limitations of our study, weconcluded that cigarette smoking is a com-
04 Smoking patterns among primary.pmd 3/3/2005, 12:11 AM920
Eastern Mediterranean Health Journal, Vol. 9, Nos 5/6, 2003 921
mon problem among PHC clients. Clientswere characterized by certain sociodemo-graphics, co-morbid diseases and patternsof smoking that were somewhat similar tonational and international research. Al-though our study did not directly addresswhat the primary care team of nurses andGPs can do for PHC clients, their roles insmoking prevention and treatment are es-sentially unequivocal. Besides establishingantismoking clinics in PHC centres, GPsand nurses should offer condensed trainingcourses on smoking prevention and treat-ment. Finally, in addition to identifying the
underlying risk factors in community-based studies, future intervention researchshould explore the role of psychosocial anddrug therapies in the management of tobac-co addiction.
AcknowledgementsAcknowledgements are due to the primarycare doctors for data collection and to DrMohammed Khalil, Research Unit, KingFahd Specialist Hospital, for statisticalconsultations.
References
1. England LJ et al. Measures of maternaltobacco exposure and infant birth weightat term. American journal of epidemiol-ogy, 2001, 153:954–60.
2. Dierker LC et al. Smoking and depres-sion: An examination of mechanisms ofcomorbidity. American journal of psy-chiatry, 2002, 159:947–53.
3. Carter CL et al. Contemporary perspec-tives in tobacco cessation: whatoncologists need to know. The oncolo-gist, 2001, 6:496–505.
4. American Psychiatric Association. Prac-tice guidelines for the treatment of pa-tients with nicotine dependence.American journal of psychiatry, 1996,153(10 suppl):1–31.
5. Brownson RC, Hopkins DP, WakefieldMA. Effects of smoking restrictions in theworkplace. Annual review of publichealth, 2002, 23:333–48.
6. Cummings KM, Morley CP, Hyland A.Failed promises of the cigarette industryand its effect on consumer misper-ceptions about the health risks of smok-ing. Tobacco control, 2002, 11: 110–7.
7. Crawford MA. Cigarette smoking andadolescents: messages they see andhear. Public health reports, 2001, 116:203–15.
8. Luty J. Nicotine addiction and smokingcessation treatments. Advances in psy-chiatric treatment, 2002, 8:42–8.
9. Al-Habeeb TA, Qureshi NA. Smokingamong male psychiatric outpatients inSaudi Arabia. Annals of Saudi medicine,2000, 20:218–23.
10. Al-Dawood K, Elzubier AG. Knowledgeand smoking pattern among adults at-tending primary health centres in Al-Khobar City, Saudi Arabia. Bulletin of theHigh Institute of Public Health, 1995,25:361–8.
11. Al-Faris EA, Al-Rajhi M, Al-Nour MAB.Smoking among females attending ahealth centre in Riyadh. Annals of Saudimedicine, 1995, 15:525–8.
12. Felimban FM. The smoking practicesand attitudes towards smoking of femaleuniversity students in Riyadh. Saudimedical journal, 1993, 14:220–4.
04 Smoking patterns among primary.pmd 3/3/2005, 12:11 AM921
922 La Revue de Santé de la Méditerranée orientale, Vol. 9, No 5/6, 2003
13. Al-Bedah AM. Smoking pattern in Al-Baha region antismoking program [Dis-sertation]. Dammam, King Faisal Univer-sity, 1989.
14. Hamadeh RR. Smoking in the Gulf Co-operation Council (GCC) Countries.Bahrain medical bulletin, 1998, 20:91–4.
15. Centers for Disease Prevention andControl. Cigarette smoking amongadults-United States, 2000. Morbidityand mortality weekly report, 2002, 51:642–5.
16. Early release of selected estimates fromthe National Health and Interview Sur-vey (NHIS). Atlanta, Georgia, Centers forDisease Prevention and Control, 2002(http://www.cdc.gov/nchs/about/major/nhis/released200207/about.htm, ac-cessed 24 March 2003).
17. Shimkhada R, Peabody JW. Tobaccocontrol in India. Bulletin of the WorldHealth Organization, 2003, 81:48–52.
18. Hollis JF et al. Tobacco use patterns andattitudes among teens being seen forroutine primary care. American journal ofhealth promotion, 2003, 17:231–9.
19. Beech BM, Scarinci IC. Smoking atti-tudes and practices among low-incomeAfrican-Americans: qualitative assess-ment of contributing factors. Americanjournal of health promotion, 2003, 17:240–8.
20. Jarallah JS et al. Prevalence and deter-minants of smoking in three regions of
Saudi Arabia. Tobacco control, 1999,8:53–6.
21. Laughlin NT. Selected secondhandsmoke research: summary and com-ment. Journal of addictive diseases,2000, 19:25–33.
22. Sullivan PF, Kendler KS. The genetic epi-demiology of smoking. Nicotine & to-bacco research, 1999, 1 (suppl. 2):S51–7.
23. Friend K, Levy DT. Reduction in smokingprevalence and cigarette consumptionassociated with mass-media campaigns.Health education research, 2002, 17:85–98.
24. Stephens M, Siroonian J. Smokingprevalence, quit attempts and suc-cesses. Health reports/statistics Cana-da, Canadian Centre for Health Infor-mation, 1998, 9:31–7.
25. Hurt RD, Patten CA. Treatment of tobaccodependence in alcoholics. Recent de-velopments in alcoholism, 2003, 16:335–59.
26. Van Schayck CP, Chavannes NH. Detec-tion of asthma and chronic obstructivepulmonary disease in primary care. Eu-ropean respiratory journal, 2003, 39(suppl.):16–22.
27. Hameed A et al. Role of Islam in preven-tion of smoking. Journal of Ayub MedicalCollege, 2002, 14:23–5.
04 Smoking patterns among primary.pmd 3/3/2005, 12:11 AM922
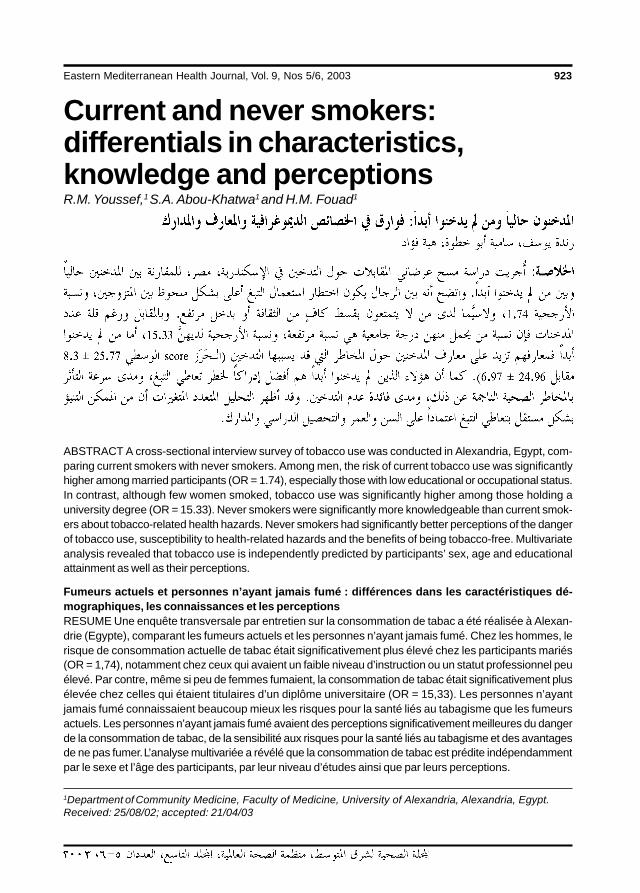
Eastern Mediterranean Health Journal, Vol. 9, Nos 5/6, 2003 923
Current and never smokers:differentials in characteristics,knowledge and perceptionsR.M. Youssef,1 S.A. Abou-Khatwa1 and H.M. Fouad1
1Department of Community Medicine, Faculty of Medicine, University of Alexandria, Alexandria, Egypt.Received: 25/08/02; accepted: 21/04/03
ABSTRACT A cross-sectional interview survey of tobacco use was conducted in Alexandria, Egypt, com-paring current smokers with never smokers. Among men, the risk of current tobacco use was significantlyhigher among married participants (OR = 1.74), especially those with low educational or occupational status.In contrast, although few women smoked, tobacco use was significantly higher among those holding auniversity degree (OR = 15.33). Never smokers were significantly more knowledgeable than current smok-ers about tobacco-related health hazards. Never smokers had significantly better perceptions of the dangerof tobacco use, susceptibility to health-related hazards and the benefits of being tobacco-free. Multivariateanalysis revealed that tobacco use is independently predicted by participants’ sex, age and educationalattainment as well as their perceptions.
Fumeurs actuels et personnes n’ayant jamais fumé : différences dans les caractéristiques dé-mographiques, les connaissances et les perceptionsRESUME Une enquête transversale par entretien sur la consommation de tabac a été réalisée à Alexan-drie (Egypte), comparant les fumeurs actuels et les personnes n’ayant jamais fumé. Chez les hommes, lerisque de consommation actuelle de tabac était significativement plus élevé chez les participants mariés(OR = 1,74), notamment chez ceux qui avaient un faible niveau d’instruction ou un statut professionnel peuélevé. Par contre, même si peu de femmes fumaient, la consommation de tabac était significativement plusélevée chez celles qui étaient titulaires d’un diplôme universitaire (OR = 15,33). Les personnes n’ayantjamais fumé connaissaient beaucoup mieux les risques pour la santé liés au tabagisme que les fumeursactuels. Les personnes n’ayant jamais fumé avaient des perceptions significativement meilleures du dangerde la consommation de tabac, de la sensibilité aux risques pour la santé liés au tabagisme et des avantagesde ne pas fumer. L’analyse multivariée a révélé que la consommation de tabac est prédite indépendammentpar le sexe et l’âge des participants, par leur niveau d’études ainsi que par leurs perceptions.
05 Current and never.pmd 3/3/2005, 12:11 AM923
924 La Revue de Santé de la Méditerranée orientale, Vol. 9, No 5/6, 2003
IntroductionIn many industrialized countries, tobaccouse and cigarette consumption have beendeclining [1]. However, data reported bythe Eastern Mediterranean Region of theWorld Health Organization indicated that, incontrast to the other 5 regions, cigaretteconsumption was not declining in any ofthe member countries, and in fact the greatmajority of countries showed a trend to-wards increasing consumption [2].
An Egyptian survey conducted in 1977revealed that 32.5% of men and 1.5% ofwomen were tobacco users [3]. In a sur-vey in Cairo in 1982, the prevalence amongmen had increased to 39.8% while that ofwomen remained low at 1.0% [3]. In fact,Egyptians’ demand for tobacco is stronglyincreasing as tobacco sales grow at a rateof 5% to 10% per year [4]. Simultaneously,the average annual per capita cigarette con-sumption by those aged 15 years and overrose from 730 in 1972 to 1210 in 1992 [2].Expenditure on tobacco imports, whichrepresent 1% of Egypt’s total imports, isrelatively large and poses a significant bur-den on the country’s economic develop-ment [2,5].
Public surveys illustrating patterns oftobacco use and laying emphasis on factorsinfluencing smoking behaviour have beenidentified as areas of research priority fordeveloping countries and an importantcomponent of the global health researchagenda [6]. These tobacco surveys shouldbe conducted at a minimum of 5-year inter-vals to illustrate trends over time [7]. Sur-veys that include broad sectors of thepopulation as well as different age groupscan identify populations at risk. Moreover,the assessment of public knowledge andperceptions in respect to tobacco use andits adverse consequences will help in thedevelopment of targeted health educationprogrammes. For this purpose, a commu-
nity-based survey was conducted in Alex-andria, Egypt’s second largest city andmain port, with a population of 3 339 076in 1996. A previous paper from this surveyhas reported on the prevalence and age ofinitiation of smoking among this population[8]. This paper compares current smokerswith never smokers in respect to demo-graphic characteristics, knowledge of to-bacco-associated morbidity and percep-tions of tobacco-related health risks, aswell as the benefits of staying tobacco-free.
MethodsA community-based survey using clustersampling was conducted in Alexandria citybetween May and August 2000, including2120 subjects aged 15 years and over. Fur-ther details of the sampling methods are re-ported in an earlier paper [8].
QuestionnaireData were collected using a pre-tested, pre-coded interview questionnaire. Section Irecorded the participants’ characteristics(age, sex, education, occupation, and mar-ital status), chronic health problems (in-cluding hypertension, diabetes, bronchialasthma, ischaemic heart disease and rheu-matic heart disease) and level of physicalactivity. Physical activity was classifiedinto ‘sedentary’ for absence of any physi-cal activity, ‘light’ for walking during usualactivities, ‘moderate’ for brisk walking and‘vigorous’ if the participant played a sport.
Section II used the WHO core ques-tions for tobacco surveys [7] to classifythe smoking status of participants as: cur-rent smokers, never smokers or eversmokers.
Section III assessed participants’knowledge of tobacco-associated morbidi-ty using 14 questions based on a review of
05 Current and never.pmd 3/3/2005, 12:11 AM924
Eastern Mediterranean Health Journal, Vol. 9, Nos 5/6, 2003 925
(OR) and the corresponding 95% confi-dence interval (CI) were computed. Thechi-squared and the Student t-test wereused to test the significance of the results.Tobacco use was modelled as a function ofparticipants’ characteristics as well as theirknowledge and perceptions.
ResultsThe total sample was 1162 men and 958women. Among the men, 48.5% (95% CI:45.63–51.37) were current smokers com-pared with 1.5% (95% CI: 0.74–2.26) ofwomen. Current smokers had maintainedtheir habit for nearly 20 years (mean 21.1 ±1.3 years) with an average daily consump-tion of 23.2 ± 12.5 cigarettes.
Table 1 shows the demographic charac-teristics of current smokers compared withthose who never smoked. In the surveyedcommunity, men were 71 times more likelyto be current tobacco users than werewomen. A significant linear association wasobserved between age and current tobaccouse (P < 0.001). Relative to the youngestage group (15–24 years), the likelihood ofcurrent tobacco use increased steadily withincreasing age and was nearly 3 times high-er among those aged 35 years and older.
A statistically significant association be-tween educational level and tobacco usewas observed for both men (χ2
= 47.87, P< 0.001) and women (χ2
= 18.50, P <
0.001). Among men, a significantly higherpercentage of current smokers were illiter-ate or just able to read and write (51.6%)compared with never smokers (32.1%)(Table 1). Relative to university graduates,those who were illiterate or just able to readand write were 2.62 times more likely to betobacco users. The risk decreased amongthose who had accomplished basic (OR =1.59) or high school education (OR =
the literature. Participants were first re-quested to nominate problems without be-ing prompted, and were then prompted totest their recall. Answers were scored asfollows: problem mentioned without beingprompted (score 2), problem recalled whenprompted (1) and problem neither men-tioned nor recalled (0). The total scoreranged from 0–28 with higher scores indi-cating better knowledge (α-reliability =0.91). Participants were asked to state theirsource of knowledge about tobacco-relatedconditions.
Section IV assessed participants’ per-ceptions of tobacco-related risks with a to-tal of 19 questions covering 3 areas ofperceptions: danger, susceptibility and ben-efits. For each question, responses werescored as follows: strongly agree (score 2),somewhat agree (1) and don’t agree (0).There were 7 questions about the hazardsassociated with tobacco use (range ofscores 0–14); higher scores indicated astronger perception of danger (α-reliability= 0.92). Five questions were about the sus-ceptibility of tobacco users to tobacco-associated illnesses (range 0–10); higherscores indicated stronger perception ofsusceptibility (α-reliability = 0.90). Sevenquestions asked about the benefits associ-ated with refraining from tobacco use(range 0–14); higher scores on this scaleindicated stronger perception of benefits(α-reliability = 0.93).
Data analysisThe data were analysed using SPSS, ver-sion 8.0 and Epi-Info, version 6.04. Datagathered from the cross-sectional surveywere analysed using the case–control ap-proach where current smokers representedthe cases and never smokers the controlswith the aim of identifying risk factors un-derlying continuing use of tobacco. Themean ± standard deviation (s), odds ratio
3
3
05 Current and never.pmd 3/3/2005, 12:11 AM925
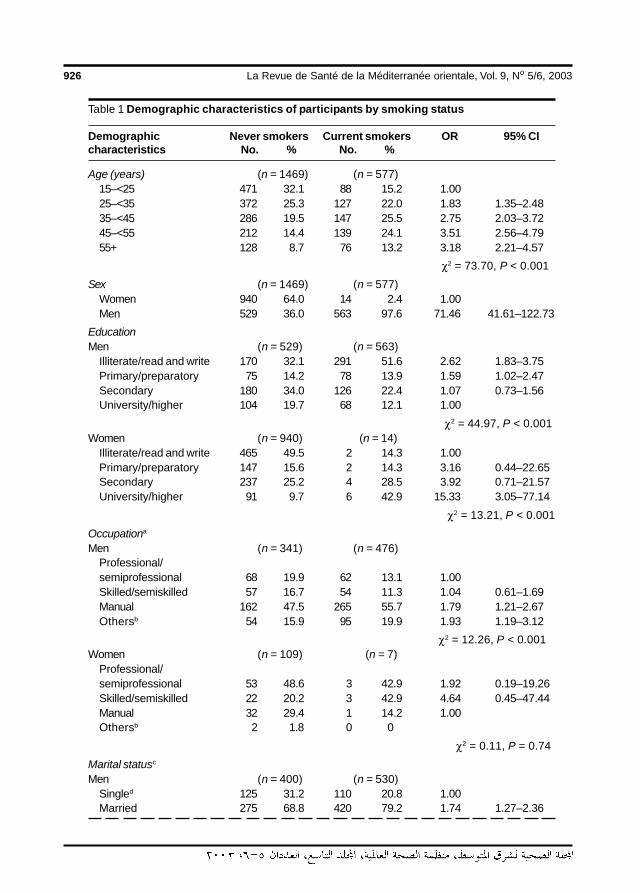
926 La Revue de Santé de la Méditerranée orientale, Vol. 9, No 5/6, 2003
Table 1 Demographic characteristics of participants by smoking status
Demographic Never smokers Current smokers OR 95% CIcharacteristics No. % No. %
Age (years) (n = 1469) (n = 577)15–<25 471 32.1 88 15.2 1.0025–<35 372 25.3 127 22.0 1.83 1.35–2.4835–<45 286 19.5 147 25.5 2.75 2.03–3.7245–<55 212 14.4 139 24.1 3.51 2.56–4.7955+ 128 8.7 76 13.2 3.18 2.21–4.57
χ2 = 73.70, P < 0.001
Sex (n = 1469) (n = 577)Women 940 64.0 14 2.4 1.00Men 529 36.0 563 97.6 71.46 41.61–122.73
EducationMen (n = 529) (n = 563)
Illiterate/read and write 170 32.1 291 51.6 2.62 1.83–3.75Primary/preparatory 75 14.2 78 13.9 1.59 1.02–2.47Secondary 180 34.0 126 22.4 1.07 0.73–1.56University/higher 104 19.7 68 12.1 1.00
χ2 = 44.97, P < 0.001Women (n = 940) (n = 14)
Illiterate/read and write 465 49.5 2 14.3 1.00Primary/preparatory 147 15.6 2 14.3 3.16 0.44–22.65Secondary 237 25.2 4 28.5 3.92 0.71–21.57University/higher 91 9.7 6 42.9 15.33 3.05–77.14
χ2 = 13.21, P < 0.001
Occupationa
Men (n = 341) (n = 476)Professional/semiprofessional 68 19.9 62 13.1 1.00Skilled/semiskilled 57 16.7 54 11.3 1.04 0.61–1.69Manual 162 47.5 265 55.7 1.79 1.21–2.67Othersb 54 15.9 95 19.9 1.93 1.19–3.12
χ2 = 12.26, P < 0.001Women (n = 109) (n = 7)
Professional/semiprofessional 53 48.6 3 42.9 1.92 0.19–19.26Skilled/semiskilled 22 20.2 3 42.9 4.64 0.45–47.44Manual 32 29.4 1 14.2 1.00Othersb 2 1.8 0 0
χ2 = 0.11, P = 0.74
Marital statusc
Men (n = 400) (n = 530)Singled 125 31.2 110 20.8 1.00Married 275 68.8 420 79.2 1.74 1.27–2.36
05 Current and never.pmd 3/3/2005, 12:11 AM926
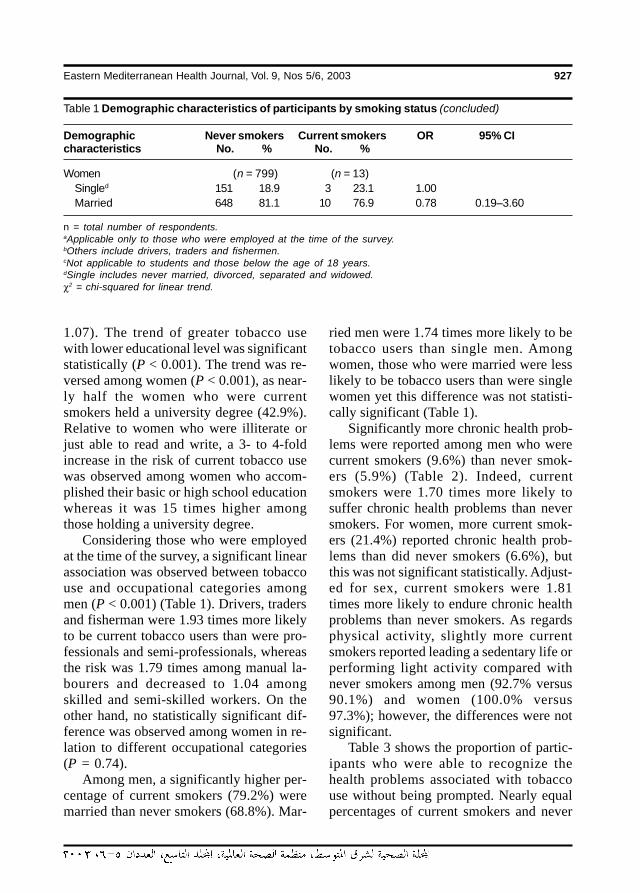
Eastern Mediterranean Health Journal, Vol. 9, Nos 5/6, 2003 927
1.07). The trend of greater tobacco usewith lower educational level was significantstatistically (P < 0.001). The trend was re-versed among women (P < 0.001), as near-ly half the women who were currentsmokers held a university degree (42.9%).Relative to women who were illiterate orjust able to read and write, a 3- to 4-foldincrease in the risk of current tobacco usewas observed among women who accom-plished their basic or high school educationwhereas it was 15 times higher amongthose holding a university degree.
Considering those who were employedat the time of the survey, a significant linearassociation was observed between tobaccouse and occupational categories amongmen (P < 0.001) (Table 1). Drivers, tradersand fisherman were 1.93 times more likelyto be current tobacco users than were pro-fessionals and semi-professionals, whereasthe risk was 1.79 times among manual la-bourers and decreased to 1.04 amongskilled and semi-skilled workers. On theother hand, no statistically significant dif-ference was observed among women in re-lation to different occupational categories(P = 0.74).
Among men, a significantly higher per-centage of current smokers (79.2%) weremarried than never smokers (68.8%). Mar-
ried men were 1.74 times more likely to betobacco users than single men. Amongwomen, those who were married were lesslikely to be tobacco users than were singlewomen yet this difference was not statisti-cally significant (Table 1).
Significantly more chronic health prob-lems were reported among men who werecurrent smokers (9.6%) than never smok-ers (5.9%) (Table 2). Indeed, currentsmokers were 1.70 times more likely tosuffer chronic health problems than neversmokers. For women, more current smok-ers (21.4%) reported chronic health prob-lems than did never smokers (6.6%), butthis was not significant statistically. Adjust-ed for sex, current smokers were 1.81times more likely to endure chronic healthproblems than never smokers. As regardsphysical activity, slightly more currentsmokers reported leading a sedentary life orperforming light activity compared withnever smokers among men (92.7% versus90.1%) and women (100.0% versus97.3%); however, the differences were notsignificant.
Table 3 shows the proportion of partic-ipants who were able to recognize thehealth problems associated with tobaccouse without being prompted. Nearly equalpercentages of current smokers and never
Table 1 Demographic characteristics of participants by smoking status (concluded)
Demographic Never smokers Current smokers OR 95% CIcharacteristics No. % No. %
Women (n = 799) (n = 13)Singled 151 18.9 3 23.1 1.00Married 648 81.1 10 76.9 0.78 0.19–3.60
n = total number of respondents.aApplicable only to those who were employed at the time of the survey.bOthers include drivers, traders and fishermen.cNot applicable to students and those below the age of 18 years.dSingle includes never married, divorced, separated and widowed.χ2 = chi-squared for linear trend.
05 Current and never.pmd 3/3/2005, 12:11 AM927
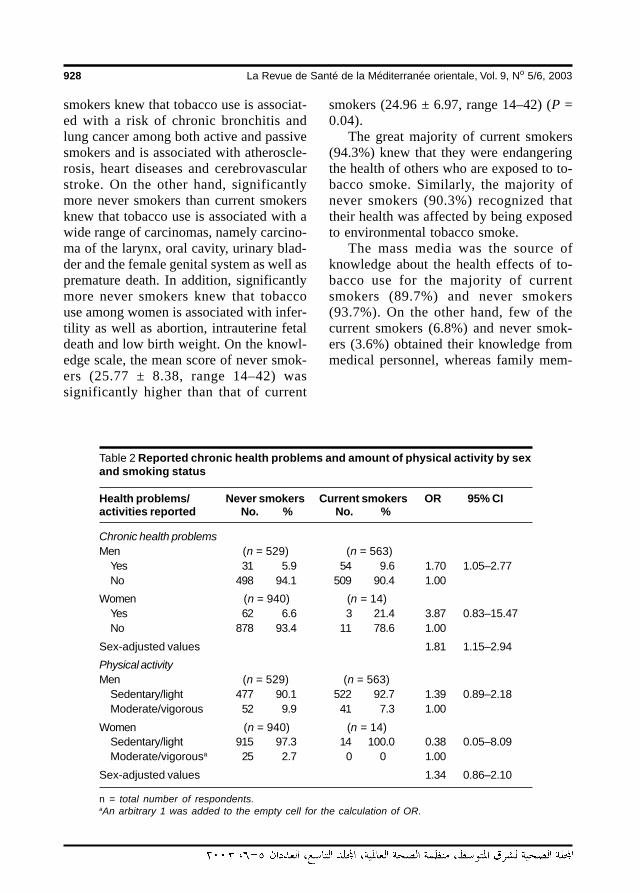
928 La Revue de Santé de la Méditerranée orientale, Vol. 9, No 5/6, 2003
smokers knew that tobacco use is associat-ed with a risk of chronic bronchitis andlung cancer among both active and passivesmokers and is associated with atheroscle-rosis, heart diseases and cerebrovascularstroke. On the other hand, significantlymore never smokers than current smokersknew that tobacco use is associated with awide range of carcinomas, namely carcino-ma of the larynx, oral cavity, urinary blad-der and the female genital system as well aspremature death. In addition, significantlymore never smokers knew that tobaccouse among women is associated with infer-tility as well as abortion, intrauterine fetaldeath and low birth weight. On the knowl-edge scale, the mean score of never smok-ers (25.77 ± 8.38, range 14–42) wassignificantly higher than that of current
smokers (24.96 ± 6.97, range 14–42) (P =0.04).
The great majority of current smokers(94.3%) knew that they were endangeringthe health of others who are exposed to to-bacco smoke. Similarly, the majority ofnever smokers (90.3%) recognized thattheir health was affected by being exposedto environmental tobacco smoke.
The mass media was the source ofknowledge about the health effects of to-bacco use for the majority of currentsmokers (89.7%) and never smokers(93.7%). On the other hand, few of thecurrent smokers (6.8%) and never smok-ers (3.6%) obtained their knowledge frommedical personnel, whereas family mem-
Table 2 Reported chronic health problems and amount of physical activity by sexand smoking status
Health problems/ Never smokers Current smokers OR 95% CIactivities reported No. % No. %
Chronic health problemsMen (n = 529) (n = 563)
Yes 31 5.9 54 9.6 1.70 1.05–2.77No 498 94.1 509 90.4 1.00
Women (n = 940) (n = 14)Yes 62 6.6 3 21.4 3.87 0.83–15.47No 878 93.4 11 78.6 1.00
Sex-adjusted values 1.81 1.15–2.94
Physical activityMen (n = 529) (n = 563)
Sedentary/light 477 90.1 522 92.7 1.39 0.89–2.18Moderate/vigorous 52 9.9 41 7.3 1.00
Women (n = 940) (n = 14)Sedentary/light 915 97.3 14 100.0 0.38 0.05–8.09Moderate/vigorousa 25 2.7 0 0 1.00
Sex-adjusted values 1.34 0.86–2.10
n = total number of respondents.aAn arbitrary 1 was added to the empty cell for the calculation of OR.
05 Current and never.pmd 3/3/2005, 12:11 AM928
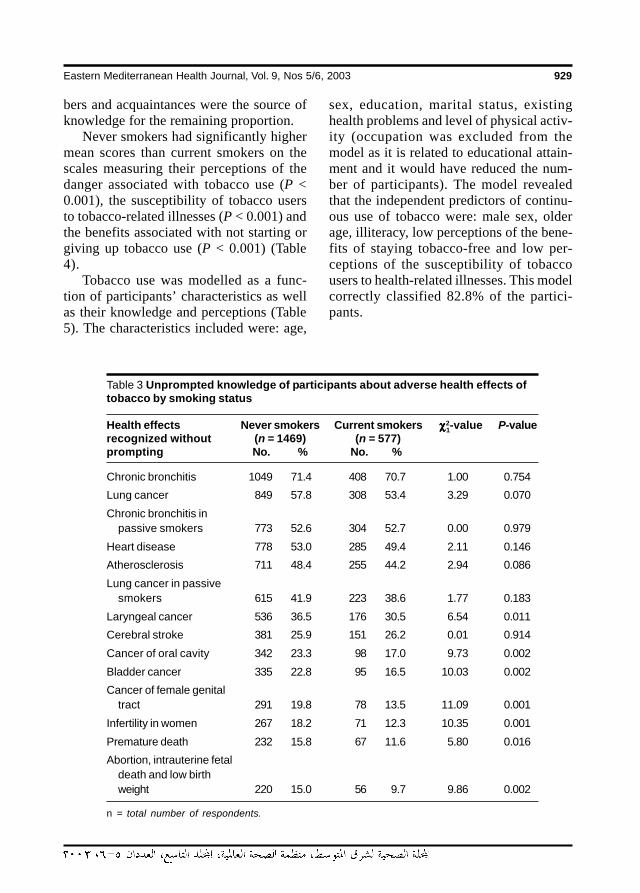
Eastern Mediterranean Health Journal, Vol. 9, Nos 5/6, 2003 929
bers and acquaintances were the source ofknowledge for the remaining proportion.
Never smokers had significantly highermean scores than current smokers on thescales measuring their perceptions of thedanger associated with tobacco use (P <0.001), the susceptibility of tobacco usersto tobacco-related illnesses (P < 0.001) andthe benefits associated with not starting orgiving up tobacco use (P < 0.001) (Table4).
Tobacco use was modelled as a func-tion of participants’ characteristics as wellas their knowledge and perceptions (Table5). The characteristics included were: age,
sex, education, marital status, existinghealth problems and level of physical activ-ity (occupation was excluded from themodel as it is related to educational attain-ment and it would have reduced the num-ber of participants). The model revealedthat the independent predictors of continu-ous use of tobacco were: male sex, olderage, illiteracy, low perceptions of the bene-fits of staying tobacco-free and low per-ceptions of the susceptibility of tobaccousers to health-related illnesses. This modelcorrectly classified 82.8% of the partici-pants.
Table 3 Unprompted knowledge of participants about adverse health effects oftobacco by smoking status
Health effects Never smokers Current smokers χχχχχ2-value P-valuerecognized without (n = 1469) (n = 577)prompting No. % No. %
Chronic bronchitis 1049 71.4 408 70.7 1.00 0.754
Lung cancer 849 57.8 308 53.4 3.29 0.070
Chronic bronchitis inpassive smokers 773 52.6 304 52.7 0.00 0.979
Heart disease 778 53.0 285 49.4 2.11 0.146
Atherosclerosis 711 48.4 255 44.2 2.94 0.086
Lung cancer in passivesmokers 615 41.9 223 38.6 1.77 0.183
Laryngeal cancer 536 36.5 176 30.5 6.54 0.011
Cerebral stroke 381 25.9 151 26.2 0.01 0.914
Cancer of oral cavity 342 23.3 98 17.0 9.73 0.002
Bladder cancer 335 22.8 95 16.5 10.03 0.002
Cancer of female genitaltract 291 19.8 78 13.5 11.09 0.001
Infertility in women 267 18.2 71 12.3 10.35 0.001
Premature death 232 15.8 67 11.6 5.80 0.016
Abortion, intrauterine fetaldeath and low birthweight 220 15.0 56 9.7 9.86 0.002
n = total number of respondents.
1
05 Current and never.pmd 3/3/2005, 12:11 AM929
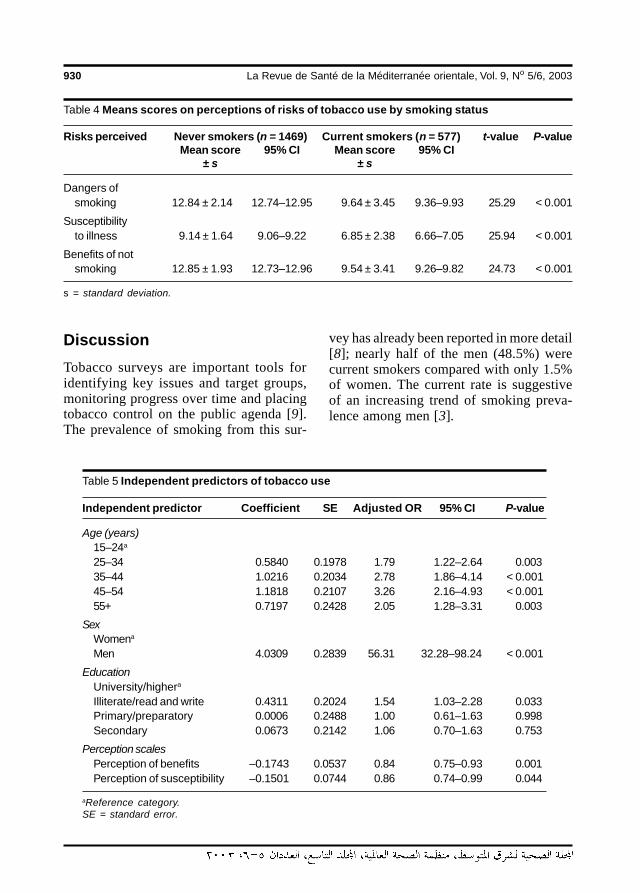
930 La Revue de Santé de la Méditerranée orientale, Vol. 9, No 5/6, 2003
Table 5 Independent predictors of tobacco use
Independent predictor Coefficient SE Adjusted OR 95% CI P-value
Age (years)15–24a
25–34 0.5840 0.1978 1.79 1.22–2.64 0.00335–44 1.0216 0.2034 2.78 1.86–4.14 < 0.00145–54 1.1818 0.2107 3.26 2.16–4.93 < 0.00155+ 0.7197 0.2428 2.05 1.28–3.31 0.003
SexWomena
Men 4.0309 0.2839 56.31 32.28–98.24 < 0.001
EducationUniversity/highera
Illiterate/read and write 0.4311 0.2024 1.54 1.03–2.28 0.033Primary/preparatory 0.0006 0.2488 1.00 0.61–1.63 0.998Secondary 0.0673 0.2142 1.06 0.70–1.63 0.753
Perception scalesPerception of benefits –0.1743 0.0537 0.84 0.75–0.93 0.001Perception of susceptibility –0.1501 0.0744 0.86 0.74–0.99 0.044
aReference category.SE = standard error.
DiscussionTobacco surveys are important tools foridentifying key issues and target groups,monitoring progress over time and placingtobacco control on the public agenda [9].The prevalence of smoking from this sur-
vey has already been reported in more detail[8]; nearly half of the men (48.5%) werecurrent smokers compared with only 1.5%of women. The current rate is suggestiveof an increasing trend of smoking preva-lence among men [3].
Table 4 Means scores on perceptions of risks of tobacco use by smoking status
Risks perceived Never smokers (n = 1469) Current smokers (n = 577) t-value P-valueMean score 95% CI Mean score 95% CI
± s ± s
Dangers ofsmoking 12.84 ± 2.14 12.74–12.95 9.64 ± 3.45 9.36–9.93 25.29 < 0.001
Susceptibilityto illness 9.14 ± 1.64 9.06–9.22 6.85 ± 2.38 6.66–7.05 25.94 < 0.001
Benefits of notsmoking 12.85 ± 1.93 12.73–12.96 9.54 ± 3.41 9.26–9.82 24.73 < 0.001
s = standard deviation.
05 Current and never.pmd 3/3/2005, 12:11 AM930
Eastern Mediterranean Health Journal, Vol. 9, Nos 5/6, 2003 931
This study as well as others [10–12]has shown higher tobacco use among menwho are currently married. Tobacco use byparents or future parents increases the riskof smoking among children as their atti-tudes towards smoking are influenced bytheir parents’ behaviour [13–15]. More im-portantly, exposure to smoking is a hazardto all household inhabitants as it increasesthe risk of acute respiratory diseases andasthma among children [1,16,17] as well aslung cancer, late asthma and ischaemicheart diseases among adults [18,19].
Social class, measured by participants’educational attainment and occupationalcategory, significantly predicted current to-bacco use. Among men, the risk of currenttobacco use increased progressively withdecreasing occupational rank and educa-tional attainment. Eisner et al. pointed toeducational attainment as the most potentpredictor of smoking among the generalpopulation [20]. Similar associations be-tween educational attainment and smokingprevalence were reported from Europe[21,22], the USA [16] and Mauritius [23]while a reversed association was reportedfrom Saudi Arabia [10,11]. It has been ob-served that when antismoking campaignstake effect, prevalence rates tend to fallamong the better educated, resulting in ahigher prevalence among the lower socio-economic groups, with a widening gapover time [7]. The fact that tobacco use bywomen is mostly among the highly educat-ed matches with the evolution of tobaccouse in industrialized societies. At the begin-ning of the epidemic, when the overallprevalence among women was low, as inthe present case, the habit was first adopt-ed by the more affluent and educated, usu-ally in large cities [13].
The fact that tobacco use starts duringadolescence is undisputed [13,24], yet ourfindings provide substantial evidence thatincreasing current age of participants inde-
pendently predicts continuing use. It is like-ly that after many years of smoking, usersbecome strongly dependent on their drug[9]. Also, many long-term smokers maylack the motive to quit because they maybelieve that they are no longer susceptibleto the risk of tobacco-related disease aftersurviving smoking for many years, where-as others may believe that any damage thatmay have accrued is irreversible [17]. Inthis study, more current tobacco users thannever smokers reported chronic ailmentsthat may have been caused by smoking.However, those who are disease-free canstill benefit by giving up the habit as thebenefits of cessation extend to quittingeven at older ages [17].
Surveys of public knowledge about to-bacco use and the associated health haz-ards are essential for revealing gaps inknowledge and are important tools for theplanning and evaluation of educationalcampaigns. In this respect, both promptedawareness and unprompted knowledgewere verified. Prompted responses that re-flect recognition may be useful for testingthe impact of new education or communi-cation campaigns whereas unprompted re-sponses reflect knowledge that is morelikely to influence behaviour [9]. Previousknowledge surveys [13,25,26] have dem-onstrated that users of tobacco productsare less knowledgeable about the healthrisks of smoking than those who remaintobacco-free and our survey is no excep-tion to these findings. Both current smok-ers and never smokers recognized the riskof cardiovascular and cerebrovascular ac-cidents as well as respiratory illnesses.This is expected, as these are the majorhealth issues commonly addressed by anti-smoking educational activities. In contrast,current smokers were much less awarethat the adverse effects of tobacco use ex-tend to malignancy in other organs, prema-
05 Current and never.pmd 3/3/2005, 12:11 AM931
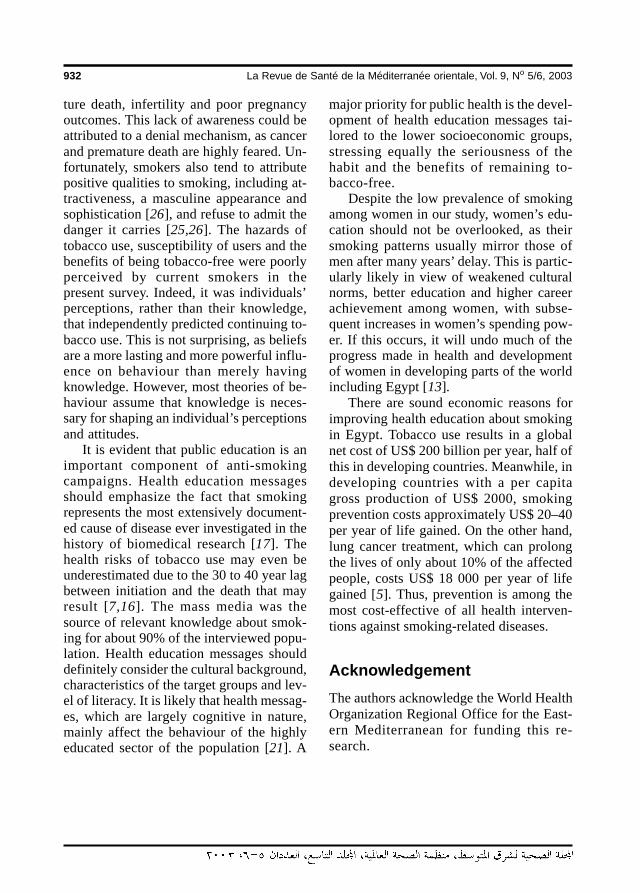
932 La Revue de Santé de la Méditerranée orientale, Vol. 9, No 5/6, 2003
ture death, infertility and poor pregnancyoutcomes. This lack of awareness could beattributed to a denial mechanism, as cancerand premature death are highly feared. Un-fortunately, smokers also tend to attributepositive qualities to smoking, including at-tractiveness, a masculine appearance andsophistication [26], and refuse to admit thedanger it carries [25,26]. The hazards oftobacco use, susceptibility of users and thebenefits of being tobacco-free were poorlyperceived by current smokers in thepresent survey. Indeed, it was individuals’perceptions, rather than their knowledge,that independently predicted continuing to-bacco use. This is not surprising, as beliefsare a more lasting and more powerful influ-ence on behaviour than merely havingknowledge. However, most theories of be-haviour assume that knowledge is neces-sary for shaping an individual’s perceptionsand attitudes.
It is evident that public education is animportant component of anti-smokingcampaigns. Health education messagesshould emphasize the fact that smokingrepresents the most extensively document-ed cause of disease ever investigated in thehistory of biomedical research [17]. Thehealth risks of tobacco use may even beunderestimated due to the 30 to 40 year lagbetween initiation and the death that mayresult [7,16]. The mass media was thesource of relevant knowledge about smok-ing for about 90% of the interviewed popu-lation. Health education messages shoulddefinitely consider the cultural background,characteristics of the target groups and lev-el of literacy. It is likely that health messag-es, which are largely cognitive in nature,mainly affect the behaviour of the highlyeducated sector of the population [21]. A
major priority for public health is the devel-opment of health education messages tai-lored to the lower socioeconomic groups,stressing equally the seriousness of thehabit and the benefits of remaining to-bacco-free.
Despite the low prevalence of smokingamong women in our study, women’s edu-cation should not be overlooked, as theirsmoking patterns usually mirror those ofmen after many years’ delay. This is partic-ularly likely in view of weakened culturalnorms, better education and higher careerachievement among women, with subse-quent increases in women’s spending pow-er. If this occurs, it will undo much of theprogress made in health and developmentof women in developing parts of the worldincluding Egypt [13].
There are sound economic reasons forimproving health education about smokingin Egypt. Tobacco use results in a globalnet cost of US$ 200 billion per year, half ofthis in developing countries. Meanwhile, indeveloping countries with a per capitagross production of US$ 2000, smokingprevention costs approximately US$ 20–40per year of life gained. On the other hand,lung cancer treatment, which can prolongthe lives of only about 10% of the affectedpeople, costs US$ 18 000 per year of lifegained [5]. Thus, prevention is among themost cost-effective of all health interven-tions against smoking-related diseases.
AcknowledgementThe authors acknowledge the World HealthOrganization Regional Office for the East-ern Mediterranean for funding this re-search.
05 Current and never.pmd 3/3/2005, 12:11 AM932
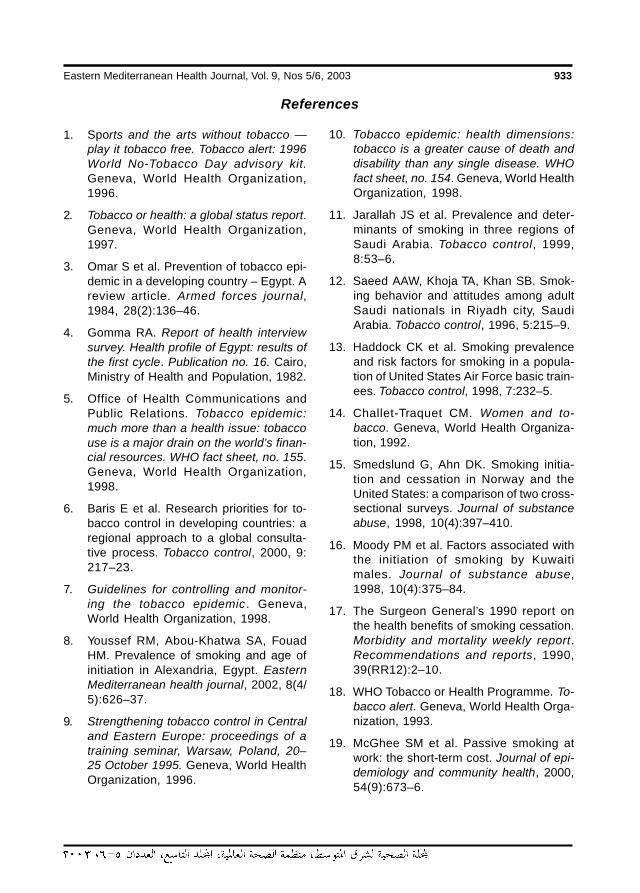
Eastern Mediterranean Health Journal, Vol. 9, Nos 5/6, 2003 933
References
1. Sports and the arts without tobacco —play it tobacco free. Tobacco alert: 1996World No-Tobacco Day advisory kit.Geneva, World Health Organization,1996.
2. Tobacco or health: a global status report.Geneva, World Health Organization,1997.
3. Omar S et al. Prevention of tobacco epi-demic in a developing country – Egypt. Areview article. Armed forces journal,1984, 28(2):136–46.
4. Gomma RA. Report of health interviewsurvey. Health profile of Egypt: results ofthe first cycle. Publication no. 16. Cairo,Ministry of Health and Population, 1982.
5. Office of Health Communications andPublic Relations. Tobacco epidemic:much more than a health issue: tobaccouse is a major drain on the world’s finan-cial resources. WHO fact sheet, no. 155.Geneva, World Health Organization,1998.
6. Baris E et al. Research priorities for to-bacco control in developing countries: aregional approach to a global consulta-tive process. Tobacco control, 2000, 9:217–23.
7. Guidelines for controlling and monitor-ing the tobacco epidemic. Geneva,World Health Organization, 1998.
8. Youssef RM, Abou-Khatwa SA, FouadHM. Prevalence of smoking and age ofinitiation in Alexandria, Egypt. EasternMediterranean health journal, 2002, 8(4/5):626–37.
9. Strengthening tobacco control in Centraland Eastern Europe: proceedings of atraining seminar, Warsaw, Poland, 20–25 October 1995. Geneva, World HealthOrganization, 1996.
10. Tobacco epidemic: health dimensions:tobacco is a greater cause of death anddisability than any single disease. WHOfact sheet, no. 154. Geneva, World HealthOrganization, 1998.
11. Jarallah JS et al. Prevalence and deter-minants of smoking in three regions ofSaudi Arabia. Tobacco control, 1999,8:53–6.
12. Saeed AAW, Khoja TA, Khan SB. Smok-ing behavior and attitudes among adultSaudi nationals in Riyadh city, SaudiArabia. Tobacco control, 1996, 5:215–9.
13. Haddock CK et al. Smoking prevalenceand risk factors for smoking in a popula-tion of United States Air Force basic train-ees. Tobacco control, 1998, 7:232–5.
14. Challet-Traquet CM. Women and to-bacco. Geneva, World Health Organiza-tion, 1992.
15. Smedslund G, Ahn DK. Smoking initia-tion and cessation in Norway and theUnited States: a comparison of two cross-sectional surveys. Journal of substanceabuse, 1998, 10(4):397–410.
16. Moody PM et al. Factors associated withthe initiation of smoking by Kuwaitimales. Journal of substance abuse,1998, 10(4):375–84.
17. The Surgeon General’s 1990 report onthe health benefits of smoking cessation.Morbidity and mortality weekly report.Recommendations and reports, 1990,39(RR12):2–10.
18. WHO Tobacco or Health Programme. To-bacco alert. Geneva, World Health Orga-nization, 1993.
19. McGhee SM et al. Passive smoking atwork: the short-term cost. Journal of epi-demiology and community health, 2000,54(9):673–6.
05 Current and never.pmd 3/3/2005, 12:11 AM933
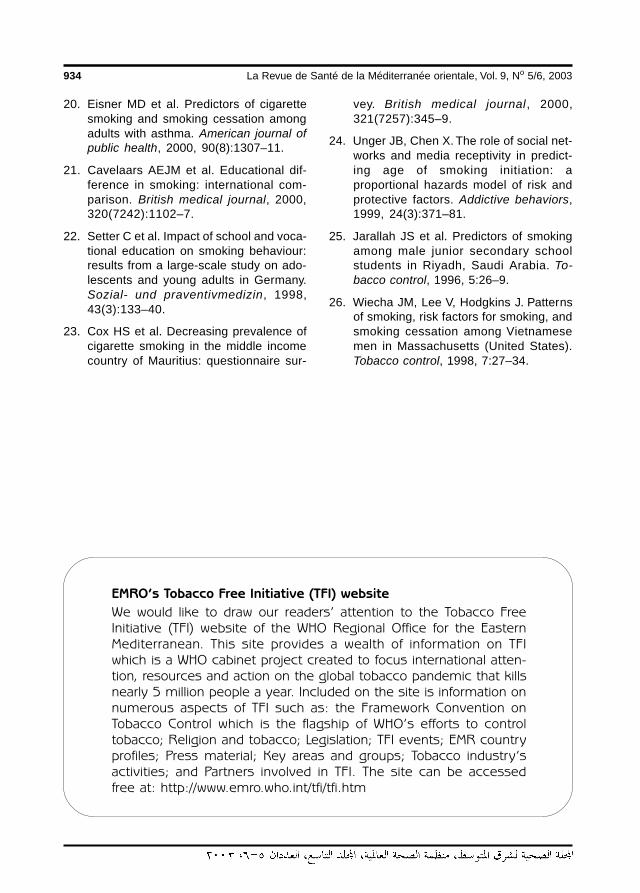
934 La Revue de Santé de la Méditerranée orientale, Vol. 9, No 5/6, 2003
20. Eisner MD et al. Predictors of cigarettesmoking and smoking cessation amongadults with asthma. American journal ofpublic health, 2000, 90(8):1307–11.
21. Cavelaars AEJM et al. Educational dif-ference in smoking: international com-parison. British medical journal, 2000,320(7242):1102–7.
22. Setter C et al. Impact of school and voca-tional education on smoking behaviour:results from a large-scale study on ado-lescents and young adults in Germany.Sozial- und praventivmedizin, 1998,43(3):133–40.
23. Cox HS et al. Decreasing prevalence ofcigarette smoking in the middle incomecountry of Mauritius: questionnaire sur-
vey. British medical journal, 2000,321(7257):345–9.
24. Unger JB, Chen X. The role of social net-works and media receptivity in predict-ing age of smoking initiation: aproportional hazards model of risk andprotective factors. Addictive behaviors,1999, 24(3):371–81.
25. Jarallah JS et al. Predictors of smokingamong male junior secondary schoolstudents in Riyadh, Saudi Arabia. To-bacco control, 1996, 5:26–9.
26. Wiecha JM, Lee V, Hodgkins J. Patternsof smoking, risk factors for smoking, andsmoking cessation among Vietnamesemen in Massachusetts (United States).Tobacco control, 1998, 7:27–34.
EMRO’s Tobacco Free Initiative (TFI) website
We would like to draw our readers’ attention to the Tobacco FreeInitiative (TFI) website of the WHO Regional Office for the EasternMediterranean. This site provides a wealth of information on TFIwhich is a WHO cabinet project created to focus international atten-tion, resources and action on the global tobacco pandemic that killsnearly 5 million people a year. Included on the site is information onnumerous aspects of TFI such as: the Framework Convention onTobacco Control which is the flagship of WHO’s efforts to controltobacco; Religion and tobacco; Legislation; TFI events; EMR countryprofiles; Press material; Key areas and groups; Tobacco industry’sactivities; and Partners involved in TFI. The site can be accessedfree at: http://www.emro.who.int/tfi/tfi.htm
05 Current and never.pmd 3/3/2005, 12:11 AM934
Eastern Mediterranean Health Journal, Vol. 9, Nos 5/6, 2003 935
Hyperhomocysteinaemia,hyperlipidaemia and risk of venousthromboembolism in ShirazA. Zamani,1 G.R. Omrani 2 and K.B. Lankarani1
1Department of Internal Medicine, Shiraz University of Medical Sciences, Shiraz, Islamic Republic of Iran.2Endocrine and Metabolism Research Centre, Nemazee Hospital, Shiraz, Islamic Republic of Iran.Received: 11/04/02; accepted: 02/02/03
ABSTRACT To assess the risk of venous thromboembolism (VTE) associated with hyperhomocystein-aemia (hyper-Hcy) and hyperlipidaemia, we performed a case–control study. Fasting total homocysteine(Hcy), triglyceride and cholesterol levels were assessed in 43 patients with VTE and 43 controls. Mean Hcylevel was significantly higher in the test group. Odds ratio (OR) for VTE in patients with hyper-Hcy was 2.7,with the association stronger in women and those under 50. The OR for those with both hypertriglycer-idaemia and hypercholesterolaemia was significantly greater in those under 50. Increased risk for venousthrombosis was found among those under 50 having both lipid abnormalities.
L’hyperhomocystéinémie, l’hyperlipidémie et le risque de thromboembolie veineuse à Chiraz (Ré-publique islamique d’Iran)RESUME Nous avons réalisé une étude cas-témoins afin d’évaluer le risque de thromboembolie veineuseassocié à l’hyperhomocystéinémie et à l’hyperlipidémie. Les taux d’homocystéine totale, de triglycérides etde cholestérol à jeun ont été mesurés chez 43 patients présentant une thromboembolie veineuse et chez43 témoins. Le taux moyen d’homocystéine était significativement plus élevé dans le groupe expérimental. Lerisque relatif de thromboembolie veineuse chez les patients atteints d’hyperhomocystéinémie était de 2,7 ;l’association était plus forte chez les femmes et les personnes de moins de 50 ans. Le risque relatif pour ceuxqui présentaient à la fois une hypertriglycéridémie et une hypercholestérolémie était significativement plusélevé chez les moins de 50 ans. Un risque accru de thrombose veineuse a été constaté chez les moins de50 ans porteurs des deux anomalies lipidiques.
06 Hyperhomocysteinaemia, hyperlipidaemia.pmd 3/3/2005, 12:11 AM935
936 La Revue de Santé de la Méditerranée orientale, Vol. 9, No 5/6, 2003
IntroductionMost case–control studies have suggestedthat hyperhomocysteinaemia (hyper-Hcy)is a risk factor for venous thromboembo-lism. Also, hyperlipidaemia is implicated inthe development of venous thrombosis. Toassess the risk of venous thromboembo-lism (VTE) associated with these factors inour population, we performed a case–con-trol study.
The development of venous thrombosisis a dynamic and multifactorial process.Conventional risk factors such as surgerydo not account for all cases, and only afraction of those with these risk factorsdevelop VTE [1–3]. There is considerableepidemiological evidence from retrospec-tive studies linking mild to moderate hyper-Hcy and VTE, however, no prospectivestudy has demonstrated such a relationshipexcept for idiopathic VTE in men [4]. Thecontroversy surrounding the role of hyper-lipidaemia in the development of VTE iseven more prominent [5], and may be relat-ed to the small number of studies that havebeen carried out up to now.
In our study, we evaluated the relation-ship between mild to moderate hyper-Hcyand VTE in hospitalized patients, consider-ing the possible genetic differences be-tween the general population of the IslamicRepublic of Iran and other populations. Wealso investigated the relationship betweenhyperlipidaemia and VTE.
MethodsIn a case–control study, all patients diag-nosed with VTE and subsequently admittedto hospitals affiliated to the University ofShiraz were invited to take part in thisstudy, which was conducted from May toSeptember 2001. Overt cancer, history ofatherosclerosis, known inherited or ac-
quired hypercoagulable states and abnor-mal renal function tests were exclusion cri-teria. None of the cases were using vitaminsupplements.
VTE was diagnosed by the followingmethods:• for deep vein thrombosis, duplex ultra-
sonography;• for pulmonary embolism, combination
of compatible medical presentation,echocardiography and ventilation-perfusion scan;
• for clot in the inferior vena cava, Dop-pler sonography or computed tomogra-phy with venous phase contrast.We matched each of the 43 cases in the
study group to one control according toboth sex and age within 5 years. Controlswere randomly selected from a large sam-ple of healthy adults who were participatingin an ongoing national osteoporosis risksurvey in Shiraz, Iran. No specific medicalhistory, including history of VTE or vitaminsupplementation was available for controls.After fasting for 10 hours, two separateblood samples were collected from eachsubject, one of them anticoagulated withEDTA. The plasma and serum were sepa-rated within one hour of venepuncture andfrozen and stored at –20 °C until time ofanalysis.
Plasma total homocysteine (Hcy) wasassessed by enzyme immunoassay (DRGInstruments GmbH, Marburg, Germany)essentially according to the method ofFrantzen et al [6]. Serum triglycerides andcholesterol were measured by an enzymat-ic colorimetric method [7,8].
We used the t-test for comparing themean values of plasma total Hcy, serumtriglycerides and cholesterol of patients andcontrols. A two-sided P-value of less than5% was considered statistically significant.The cut-off point for defining hyper-Hcy
06 Hyperhomocysteinaemia, hyperlipidaemia.pmd 3/3/2005, 12:11 AM936
Eastern Mediterranean Health Journal, Vol. 9, Nos 5/6, 2003 937
was the upper limit of the laboratory refer-ence range (15 µmol/L). Hypertriglycer-idaemia and hypercholesterolaemia aredefined as a fasting serum level ≥ 200 mg/dL [9]. Conditional and unconditional logis-tic regression analyses for matched and un-matched data respectively were used forcalculating the crude odds ratio (OR) asestimates of relative risk. Data were analy-sed using SPSS, version 9 and Egret soft-ware (Egret Software Corporation, Seattle,Washington).
ResultsThe characteristics of the patients and con-trols are shown in Table 1. The mean agesof the patients and the controls were 47.1(range 16–89) years and 45.2 (range 19–86) years respectively. Sex distribution wasequal in both groups.
Most cases had deep-vein thrombosisof the lower extremities (88.4%). A minor-ity of them had pulmonary embolism(4.7%), deep-vein thrombosis of upper ex-tremities (4.7%) or clot in the inferior venacava (2.3%). For the majority of cases(79.1%) we found one or more predispos-ing factors, including minor events such asa prolonged trip and minor surgery [10].
In the 43 cases, the mean (± standarddeviation) total Hcy level was significantlyhigher than for the controls (20.2 ± 6.3µmol/L versus 17.0 ± 5.7 µmol/L respec-tively, P = 0.015). The difference in meanserum triglyceride between cases and con-trols was not statistically significant (144.5±76.5 mg/dL versus 161.6 ± 90.5 mg/dLrespectively, P = 0.29). The cholesterollevel was significantly higher in the controlgroup compared with the patient group(205.3 ± 46.6 mg/dL versus 182.1 ± 55.1mg/dL respectively, P = 0.026) (Table 1).
Thirty-four patients (79.1%) had fast-ing total Hcy level above the cut-off pointof 15 µmol/L compared with 25 (58.1%) inthe control group (OR 2.70, 95% CI: 1.10–7.10). For patients aged below fifty yearsthe OR was 3.60 (95% CI: 1.10–11.25)while for those aged 50 and over it waslower (OR = 1.60, 95% CI: 0.20–11.30).The OR for women was higher than formen (4.20, 95% CI: 1.00–17.30 versus1.90, 95% CI: 0.50–6.97). The calculatedORs for these and other subgroups areshown in Table 2.
In the control group we determined the90th percentile of distribution of Hcy mea-surements as 24.2 µmol/L, and redefinedhyper-Hcy as anything above this. Fromthe analysis of data using this cut-off pointwe obtained an OR of 2.53 (95% CI: 0.73–9.14) (Table 2).
When we stratified the Hcy measure-ments of both patients and controls intoquartiles and calculated OR for thrombosisin the patients at the three highest levels ascompared with those at the lowest level[11], the risk of thrombosis increased grad-ually with increasing Hcy concentrations(Table 3).
Eleven (25.6%) patients had hypertrig-lyceridaemia compared with 9 (20.9%) inthe control group. The OR was 1.30 (95%CI: 0.47–3.55). Although the calculatedORs for women (2.46, 95% CI: 0.51–11.80) and those < 50 years (2.42, 95% CI:0.63–9.30) showed a trend toward in-creased risk, they were not statistically sig-nificant (Table 4).
Hypercholesterolaemia was seen in 16(37.2%) patients but in 23 (53.5%) con-trols. The computed OR was 0.52 (95%CI: 0.22–1.22). In subgroup analysis, nosignificantly increased risk was detected(Table 4).
06 Hyperhomocysteinaemia, hyperlipidaemia.pmd 3/3/2005, 12:11 AM937
938 La Revue de Santé de la Méditerranée orientale, Vol. 9, No 5/6, 2003
Table 1 Characteristics of cases and controls
Characteristic Cases (n = 43) Controls (n = 43)
Age, years (mean ± s) 47.1 ± 18.1 45.2 ± 16.9
Age range, years 16–89 19–86
Female:male ratio 24:19 24:19
Recurrent venous thromboembolism,No. (%) 7 (16.3) NA
Predisposing factors for venousthromboembolism, No. (%) 34 (79.1) NA
Trauma, No. (%) 7 (16.3) NA
Immobilization, No. (%) 9 (20.9) NA
Estrogen relateda, No. (%) 6 (14.0) NA
Recent surgery, No. (%) 1 (2.3) NA
Previous deep-vein thrombosis,No. (%) 2 (4.7) NA
Minor events,b No. (%) 9 (20.9) NA
Fasting plasma total homocysteine,µmol/L (mean ± s) 20.2 ± 6.3 17.0 ± 5.7
Fasting serum triglycerides, mg/dL(mean ± s) 144.5 ± 76.5 161.6 ± 90.5
Fasting serum cholesterol, mg/dL(mean ± s) 182.1 ± 55.1 205.3 ± 46.6
aUsing oral contraceptive pill or estrogen, pregnancy and postpartum period.bMinor surgery, prolonged trip or sitting.NA = not applicable.s = standard deviation.
Finally, 10 (23.3%) patients had bothabnormally high levels of triglyceride andcholesterol compared with 7 (16.3%) ofthe 43 controls with OR of 1.60 (95% CI:0.50–4.60). In subgroup analysis OR of5.30 (95% CI: 1.004–27.70) for those < 50years and 2.46 (95% CI: 0.50–11.80) forfemale patients were computed (Table 4).
DiscussionThis case–control study identified hyper-Hcy as a risk factor for VTE in the generalIranian population, a finding seen when we
used either the upper reference laboratoryvalue or the 90th percentile of the controlgroup as the cut-off point. The prevalenceof mild to moderate hyper-Hcy is estimatedto be 5%–7% in the general population [12–14] and even higher in the older population[15]. These facts, in addition to a highprevalence of VTE, its lethality and themagnitude of resources needed for detec-tion, treatment and prevention of VTE,make our finding (OR = 2.6–2.7) moreclinically significant.
In addition, we found a higher OR forthose in the younger age group compared
06 Hyperhomocysteinaemia, hyperlipidaemia.pmd 3/3/2005, 12:11 AM938
Eastern Mediterranean Health Journal, Vol. 9, Nos 5/6, 2003 939
Table 2 Odds ratios for thrombosis associated withhyperhomocysteinaemia, according to age and sex
Age group Odds ratio (95% CI)Hcy level > 15.00 µmol/La Hcy level > 24.20 µmol/Lb
< 50 yearsMen 1.87 (0.39–9.01) 1.64 (0.23–11.70)Women 7.50 (1.31–43.03) 1.65 (0.23–11.99)Both sexes 3.60 (1.10–11.25) 1.64 (0.40–6.63)
≥ 50 yearsMen 2.25 (0.20–29.77) NCWomen 1.00 (0.05–20.83) NCBoth sexes 1.60 (0.20–11.30) NC
All agesMen 1.90 (0.50–6.97) 2.89 (0.50–16.67)Women 4.20 (1.00–17.30) 2.27 (0.36–14.18)Both sexes 2.70 (1.10–7.10) 2.58 (0.73–9.14)
aUpper limit of laboratory reference range.b90th percentile of control distribution.CI = confidence interval.NC = could not be calculated due to missing data.
Table 3 Odds ratios for thrombosis according to plasmahomocysteine level
Homocysteine Cases Controls Odds ratiolevel (µmol/L) No. (n = 43) No. (n = 43) (95% CI)
< 15 9 18 1a
15–19 12 14 1.71 (0.56–5.20)
20–23 11 6 3.67 (1.02–13.10)
> 23 11 5 4.40 (1.17–16.57)
aReference category, odds ratio = 1.
with the older individuals. This was com-patible with observations of the other stud-ies generally [1], and specifically with thefact that homocystinuria presents with ear-ly onset thromboembolic events [12].
To explore the possibility of a dose–response relationship, we stratified the pa-tients and controls according to their Hcyconcentrations. An increasing OR with in-
creasing Hcy concentration was observed.As with cholesterol in the pathogenesis ofatherosclerosis, a graded response ratherthan a threshold effect may also be possiblefor hyper-Hcy in the genesis of arterial andvenous thrombosis, [16–19] although atleast one study showed a different infer-ence [20].
06 Hyperhomocysteinaemia, hyperlipidaemia.pmd 3/3/2005, 12:11 AM939
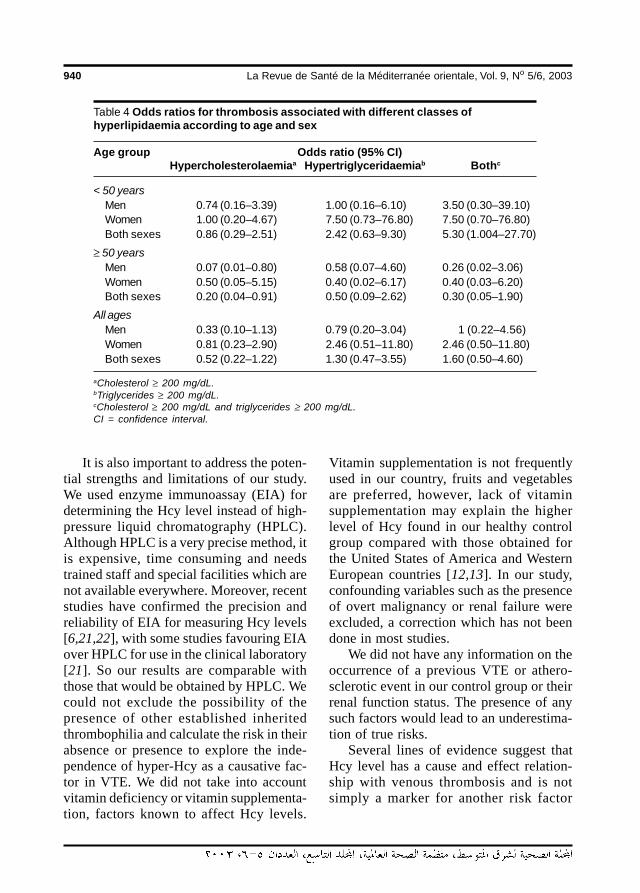
940 La Revue de Santé de la Méditerranée orientale, Vol. 9, No 5/6, 2003
It is also important to address the poten-tial strengths and limitations of our study.We used enzyme immunoassay (EIA) fordetermining the Hcy level instead of high-pressure liquid chromatography (HPLC).Although HPLC is a very precise method, itis expensive, time consuming and needstrained staff and special facilities which arenot available everywhere. Moreover, recentstudies have confirmed the precision andreliability of EIA for measuring Hcy levels[6,21,22], with some studies favouring EIAover HPLC for use in the clinical laboratory[21]. So our results are comparable withthose that would be obtained by HPLC. Wecould not exclude the possibility of thepresence of other established inheritedthrombophilia and calculate the risk in theirabsence or presence to explore the inde-pendence of hyper-Hcy as a causative fac-tor in VTE. We did not take into accountvitamin deficiency or vitamin supplementa-tion, factors known to affect Hcy levels.
Vitamin supplementation is not frequentlyused in our country, fruits and vegetablesare preferred, however, lack of vitaminsupplementation may explain the higherlevel of Hcy found in our healthy controlgroup compared with those obtained forthe United States of America and WesternEuropean countries [12,13]. In our study,confounding variables such as the presenceof overt malignancy or renal failure wereexcluded, a correction which has not beendone in most studies.
We did not have any information on theoccurrence of a previous VTE or athero-sclerotic event in our control group or theirrenal function status. The presence of anysuch factors would lead to an underestima-tion of true risks.
Several lines of evidence suggest thatHcy level has a cause and effect relation-ship with venous thrombosis and is notsimply a marker for another risk factor
Table 4 Odds ratios for thrombosis associated with different classes ofhyperlipidaemia according to age and sex
Age group Odds ratio (95% CI)Hypercholesterolaemiaa Hypertriglyceridaemiab Bothc
< 50 yearsMen 0.74 (0.16–3.39) 1.00 (0.16–6.10) 3.50 (0.30–39.10)Women 1.00 (0.20–4.67) 7.50 (0.73–76.80) 7.50 (0.70–76.80)Both sexes 0.86 (0.29–2.51) 2.42 (0.63–9.30) 5.30 (1.004–27.70)
≥ 50 yearsMen 0.07 (0.01–0.80) 0.58 (0.07–4.60) 0.26 (0.02–3.06)Women 0.50 (0.05–5.15) 0.40 (0.02–6.17) 0.40 (0.03–6.20)Both sexes 0.20 (0.04–0.91) 0.50 (0.09–2.62) 0.30 (0.05–1.90)
All agesMen 0.33 (0.10–1.13) 0.79 (0.20–3.04) 1 (0.22–4.56)Women 0.81 (0.23–2.90) 2.46 (0.51–11.80) 2.46 (0.50–11.80)Both sexes 0.52 (0.22–1.22) 1.30 (0.47–3.55) 1.60 (0.50–4.60)
aCholesterol ≥ 200 mg/dL.bTriglycerides ≥ 200 mg/dL.cCholesterol ≥ 200 mg/dL and triglycerides ≥ 200 mg/dL.CI = confidence interval.
06 Hyperhomocysteinaemia, hyperlipidaemia.pmd 3/3/2005, 12:11 AM940
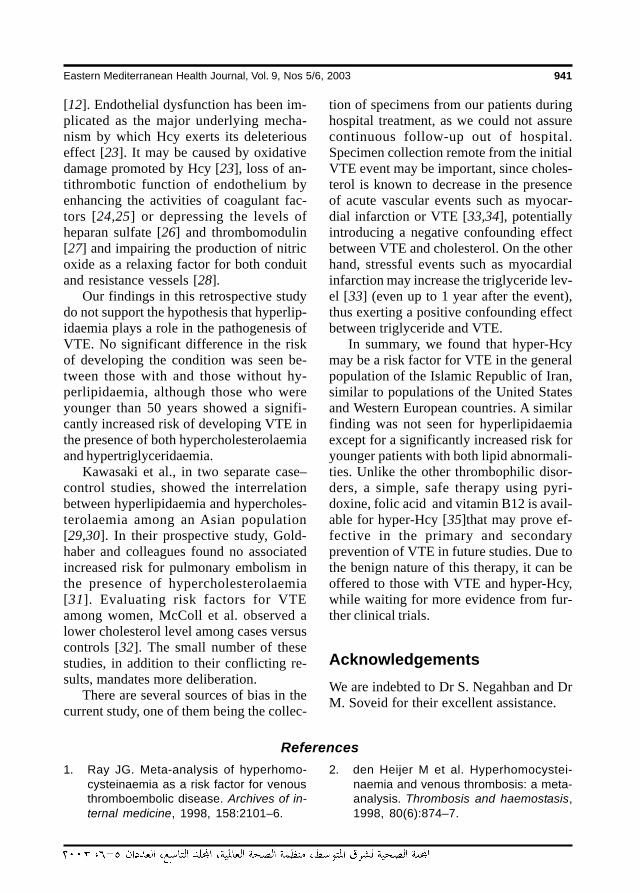
Eastern Mediterranean Health Journal, Vol. 9, Nos 5/6, 2003 941
[12]. Endothelial dysfunction has been im-plicated as the major underlying mecha-nism by which Hcy exerts its deleteriouseffect [23]. It may be caused by oxidativedamage promoted by Hcy [23], loss of an-tithrombotic function of endothelium byenhancing the activities of coagulant fac-tors [24,25] or depressing the levels ofheparan sulfate [26] and thrombomodulin[27] and impairing the production of nitricoxide as a relaxing factor for both conduitand resistance vessels [28].
Our findings in this retrospective studydo not support the hypothesis that hyperlip-idaemia plays a role in the pathogenesis ofVTE. No significant difference in the riskof developing the condition was seen be-tween those with and those without hy-perlipidaemia, although those who wereyounger than 50 years showed a signifi-cantly increased risk of developing VTE inthe presence of both hypercholesterolaemiaand hypertriglyceridaemia.
Kawasaki et al., in two separate case–control studies, showed the interrelationbetween hyperlipidaemia and hypercholes-terolaemia among an Asian population[29,30]. In their prospective study, Gold-haber and colleagues found no associatedincreased risk for pulmonary embolism inthe presence of hypercholesterolaemia[31]. Evaluating risk factors for VTEamong women, McColl et al. observed alower cholesterol level among cases versuscontrols [32]. The small number of thesestudies, in addition to their conflicting re-sults, mandates more deliberation.
There are several sources of bias in thecurrent study, one of them being the collec-
tion of specimens from our patients duringhospital treatment, as we could not assurecontinuous follow-up out of hospital.Specimen collection remote from the initialVTE event may be important, since choles-terol is known to decrease in the presenceof acute vascular events such as myocar-dial infarction or VTE [33,34], potentiallyintroducing a negative confounding effectbetween VTE and cholesterol. On the otherhand, stressful events such as myocardialinfarction may increase the triglyceride lev-el [33] (even up to 1 year after the event),thus exerting a positive confounding effectbetween triglyceride and VTE.
In summary, we found that hyper-Hcymay be a risk factor for VTE in the generalpopulation of the Islamic Republic of Iran,similar to populations of the United Statesand Western European countries. A similarfinding was not seen for hyperlipidaemiaexcept for a significantly increased risk foryounger patients with both lipid abnormali-ties. Unlike the other thrombophilic disor-ders, a simple, safe therapy using pyri-doxine, folic acid and vitamin B12 is avail-able for hyper-Hcy [35]that may prove ef-fective in the primary and secondaryprevention of VTE in future studies. Due tothe benign nature of this therapy, it can beoffered to those with VTE and hyper-Hcy,while waiting for more evidence from fur-ther clinical trials.
AcknowledgementsWe are indebted to Dr S. Negahban and DrM. Soveid for their excellent assistance.
References
1. Ray JG. Meta-analysis of hyperhomo-cysteinaemia as a risk factor for venousthromboembolic disease. Archives of in-ternal medicine, 1998, 158:2101–6.
2. den Heijer M et al. Hyperhomocystei-naemia and venous thrombosis: a meta-analysis. Thrombosis and haemostasis,1998, 80(6):874–7.
06 Hyperhomocysteinaemia, hyperlipidaemia.pmd 3/3/2005, 12:11 AM941
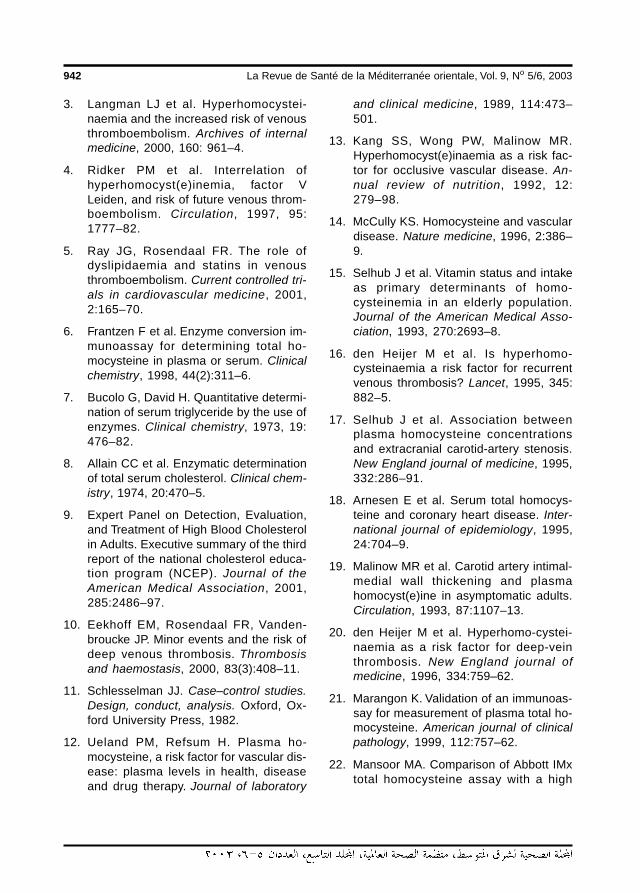
942 La Revue de Santé de la Méditerranée orientale, Vol. 9, No 5/6, 2003
3. Langman LJ et al. Hyperhomocystei-naemia and the increased risk of venousthromboembolism. Archives of internalmedicine, 2000, 160: 961–4.
4. Ridker PM et al. Interrelation ofhyperhomocyst(e)inemia, factor VLeiden, and risk of future venous throm-boembolism. Circulation, 1997, 95:1777–82.
5. Ray JG, Rosendaal FR. The role ofdyslipidaemia and statins in venousthromboembolism. Current controlled tri-als in cardiovascular medicine, 2001,2:165–70.
6. Frantzen F et al. Enzyme conversion im-munoassay for determining total ho-mocysteine in plasma or serum. Clinicalchemistry, 1998, 44(2):311–6.
7. Bucolo G, David H. Quantitative determi-nation of serum triglyceride by the use ofenzymes. Clinical chemistry, 1973, 19:476–82.
8. Allain CC et al. Enzymatic determinationof total serum cholesterol. Clinical chem-istry, 1974, 20:470–5.
9. Expert Panel on Detection, Evaluation,and Treatment of High Blood Cholesterolin Adults. Executive summary of the thirdreport of the national cholesterol educa-tion program (NCEP). Journal of theAmerican Medical Association, 2001,285:2486–97.
10. Eekhoff EM, Rosendaal FR, Vanden-broucke JP. Minor events and the risk ofdeep venous thrombosis. Thrombosisand haemostasis, 2000, 83(3):408–11.
11. Schlesselman JJ. Case–control studies.Design, conduct, analysis. Oxford, Ox-ford University Press, 1982.
12. Ueland PM, Refsum H. Plasma ho-mocysteine, a risk factor for vascular dis-ease: plasma levels in health, diseaseand drug therapy. Journal of laboratory
and clinical medicine, 1989, 114:473–501.
13. Kang SS, Wong PW, Malinow MR.Hyperhomocyst(e)inaemia as a risk fac-tor for occlusive vascular disease. An-nual review of nutrition, 1992, 12:279–98.
14. McCully KS. Homocysteine and vasculardisease. Nature medicine, 1996, 2:386–9.
15. Selhub J et al. Vitamin status and intakeas primary determinants of homo-cysteinemia in an elderly population.Journal of the American Medical Asso-ciation, 1993, 270:2693–8.
16. den Heijer M et al. Is hyperhomo-cysteinaemia a risk factor for recurrentvenous thrombosis? Lancet, 1995, 345:882–5.
17. Selhub J et al. Association betweenplasma homocysteine concentrationsand extracranial carotid-artery stenosis.New England journal of medicine, 1995,332:286–91.
18. Arnesen E et al. Serum total homocys-teine and coronary heart disease. Inter-national journal of epidemiology, 1995,24:704–9.
19. Malinow MR et al. Carotid artery intimal-medial wall thickening and plasmahomocyst(e)ine in asymptomatic adults.Circulation, 1993, 87:1107–13.
20. den Heijer M et al. Hyperhomo-cystei-naemia as a risk factor for deep-veinthrombosis. New England journal ofmedicine, 1996, 334:759–62.
21. Marangon K. Validation of an immunoas-say for measurement of plasma total ho-mocysteine. American journal of clinicalpathology, 1999, 112:757–62.
22. Mansoor MA. Comparison of Abbott IMxtotal homocysteine assay with a high
06 Hyperhomocysteinaemia, hyperlipidaemia.pmd 3/3/2005, 12:11 AM942
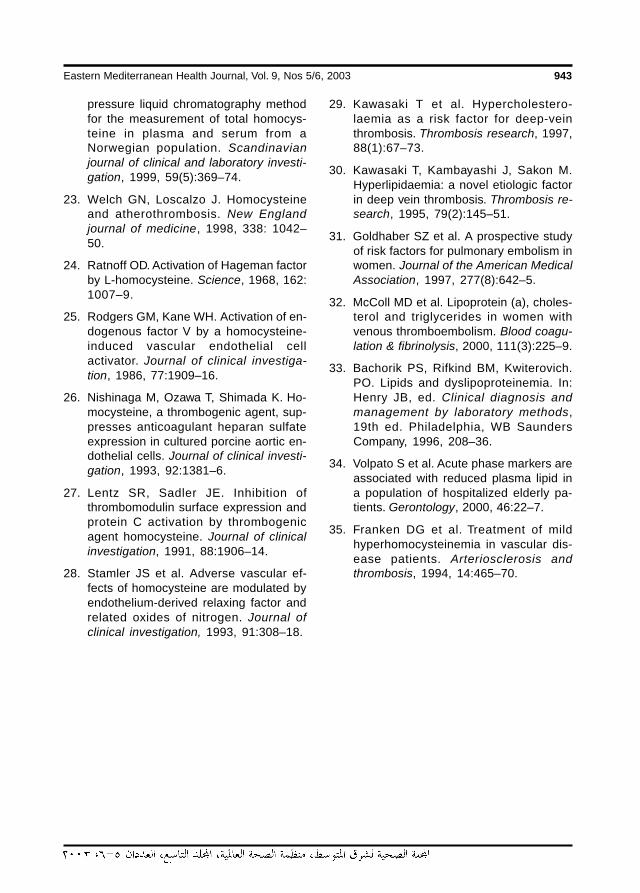
Eastern Mediterranean Health Journal, Vol. 9, Nos 5/6, 2003 943
pressure liquid chromatography methodfor the measurement of total homocys-teine in plasma and serum from aNorwegian population. Scandinavianjournal of clinical and laboratory investi-gation, 1999, 59(5):369–74.
23. Welch GN, Loscalzo J. Homocysteineand atherothrombosis. New Englandjournal of medicine, 1998, 338: 1042–50.
24. Ratnoff OD. Activation of Hageman factorby L-homocysteine. Science, 1968, 162:1007–9.
25. Rodgers GM, Kane WH. Activation of en-dogenous factor V by a homocysteine-induced vascular endothelial cellactivator. Journal of clinical investiga-tion, 1986, 77:1909–16.
26. Nishinaga M, Ozawa T, Shimada K. Ho-mocysteine, a thrombogenic agent, sup-presses anticoagulant heparan sulfateexpression in cultured porcine aortic en-dothelial cells. Journal of clinical investi-gation, 1993, 92:1381–6.
27. Lentz SR, Sadler JE. Inhibition ofthrombomodulin surface expression andprotein C activation by thrombogenicagent homocysteine. Journal of clinicalinvestigation, 1991, 88:1906–14.
28. Stamler JS et al. Adverse vascular ef-fects of homocysteine are modulated byendothelium-derived relaxing factor andrelated oxides of nitrogen. Journal ofclinical investigation, 1993, 91:308–18.
29. Kawasaki T et al. Hypercholestero-laemia as a risk factor for deep-veinthrombosis. Thrombosis research, 1997,88(1):67–73.
30. Kawasaki T, Kambayashi J, Sakon M.Hyperlipidaemia: a novel etiologic factorin deep vein thrombosis. Thrombosis re-search, 1995, 79(2):145–51.
31. Goldhaber SZ et al. A prospective studyof risk factors for pulmonary embolism inwomen. Journal of the American MedicalAssociation, 1997, 277(8):642–5.
32. McColl MD et al. Lipoprotein (a), choles-terol and triglycerides in women withvenous thromboembolism. Blood coagu-lation & fibrinolysis, 2000, 111(3):225–9.
33. Bachorik PS, Rifkind BM, Kwiterovich.PO. Lipids and dyslipoproteinemia. In:Henry JB, ed. Clinical diagnosis andmanagement by laboratory methods,19th ed. Philadelphia, WB SaundersCompany, 1996, 208–36.
34. Volpato S et al. Acute phase markers areassociated with reduced plasma lipid ina population of hospitalized elderly pa-tients. Gerontology, 2000, 46:22–7.
35. Franken DG et al. Treatment of mildhyperhomocysteinemia in vascular dis-ease patients. Arteriosclerosis andthrombosis, 1994, 14:465–70.
06 Hyperhomocysteinaemia, hyperlipidaemia.pmd 3/3/2005, 12:11 AM943
944 La Revue de Santé de la Méditerranée orientale, Vol. 9, No 5/6, 2003
Profile of acute poisoning casespresenting to health centres andhospitals in OmanS.B. Lall,1 S.S. Al-Wahaibi,1 M.M. Al-Riyami,1 and K. Al-Kharusi1
1Directorate of Environmental Health and Malaria Eradication, Ministry of Health, Muscat, Oman.Received: 23/09/01; accepted: 08/01/02
ABSTRACT A simple pro forma was used for a retrospective study of poisoning cases at 45 health institu-tions in Oman during January–December 2000. No deaths were recorded among 2009 cases of acutepoisoning. A quarter of all cases (55.8% of paediatric cases) were children aged 1–4 years. The largestcategory (59.5%) was animal bites and stings: 25.4% undiagnosed, 19.7% scorpion stings, 7.6% bee, spideror wasp stings and 6.8% snake bites. Next highest (38.5%) was ingestion of substances: 18.2% pharma-ceuticals, 8.2% food and 4.7% household products. Most drug-related cases were due to paracetamol.Suicide attempts were recorded for 6.0%. Collection of poisoning data through a central registry system isneeded for the implementation and future assessment of prevention programmes.
Profil des cas d’intoxication aiguë se présentant dans les centres de santé et les hôpitaux à OmanRESUME Un simple formulaire type a été utilisé pour une étude rétrospective des cas d’intoxication dans45 établissements de santé à Oman de janvier à décembre 2000. Aucun décès n’a été enregistré parmi les2009 cas d’intoxication aiguë. Un quart de tous les cas (55,8 % des cas pédiatriques) concernait des enfantsâgés de 1-4 ans. La catégorie la plus importante (59,5 %) était celle des morsures d’animaux et des piqûres :non diagnostiquées 25,4 %, piqûres de scorpions 19,7 %, piqûres d’abeilles, d’araignées ou de guêpes7,6 % et morsures de serpents 6,8 %. La catégorie qui venait tout de suite après (38,5 %) était l’ingestion desubstances : produits pharmaceutiques 18,2 %, denrées alimentaires 8,2 % et produits ménagers 4,7 %. Laplupart des cas d’intoxication associée à des médicaments étaient dus au paracétamol. Les tentatives desuicide concernaient 6,0 % des cas. Le recueil de données sur les intoxications au moyen d’un système deregistre central est nécessaire pour la mise en œuvre de programmes de prévention et leur évaluationfuture.
07 Profile of acute poisoning cases presenting.pmd 3/3/2005, 12:11 AM944
Eastern Mediterranean Health Journal, Vol. 9, Nos 5/6, 2003 945
IntroductionPoisoning is an important health problem inevery country of the world. Occupationalexposure to industrial chemicals and pesti-cides, accidental or intentional exposure tohousehold and pharmaceutical productsand poisoning due to venomous animals,toxic plants and food contamination, allcontribute to morbidity and mortality.However, the magnitude of the problem,the circumstances of exposure and thetypes of poisoning vary from country tocountry. The variables include the degreeof industrialization and urbanization, thetype of agricultural activities and the avail-able medical facilities and expertise to pre-vent and manage toxic exposures.
The health impact of chemical expo-sures and poisoning is well recognized inmost industrialized countries, where chem-ical safety and poison control programmesare established. The Toxic Exposure Sur-veillance System (TESS) data, compiled bythe American Association of Poison ControlCenters, for example, provides evidenceabout toxic exposures and subsequenthealth effects throughout the United States,and is utilized to identify emerging hazards,to focus prevention and education pro-grammes and to guide clinical research andtraining [1]. In contrast, most developingcountries have not yet fully recognized therisks posed by chemicals on human healthand the environment. One reason is the lackof sound national epidemiological data ontoxic exposures and poisoning. Some casestudies and hospital-based retrospectiveand prospective studies have documentedpoisoning-related morbidity and mortalityand the changing trend of chemical expo-sures [2–6]. However, such data remain in-sufficient to guide decision-makers indeveloping preventive and managementstrategies at country level.
The Sultanate of Oman, with a popula-tion of 2.4 million, has undergone a rapideconomic growth in the last 3 decades,with diversification from an oil-basedeconomy to other industries, agricultureand fishing. In the process, more chemi-cals and commercial products are beingimported and used, thus exposing the pop-ulation to the increased risk of occupation-al, accidental and intentional poisoning.This is in addition to the existing risks ofpoisoning from venomous animals, foodcontamination, pharmaceuticals and tradi-tional remedies. The data on clinical caseregistration, compiled in the Ministry ofHealth (MOH) based on the ICD-10 sys-tem, shows significant morbidity due topoisoning and toxic exposures in every re-gion of the country [7]. However, the cur-rent system of data collection is inadequateto provide complete epidemiological infor-mation. As poisoning is classified with inju-ries, the data accounts only for accidentalexposures. There is no information on thecircumstances of exposure, type of chemi-cals involved and severity of poisoning. Alarge number of exposures are due to un-known substances. The data do not allowfor an assessment of the available diagnos-tic and treatment facilities and expertise ateach health care level.
In view of the high incidence and mor-bidity due to toxic exposures and growingrisk of chemical accidents and environ-mental contamination in Oman, the countryplans to initiate chemical safety and poisoncontrol programmes. Sound epidemiologi-cal data on the toxic risks is essential forplanning the activities of the poison controlcentre in a rational way. This 1-year retro-spective study of poisoning cases was con-ducted to generate necessary data to help inevidence-based decision-making related to
07 Profile of acute poisoning cases presenting.pmd 3/3/2005, 12:11 AM945
946 La Revue de Santé de la Méditerranée orientale, Vol. 9, No 5/6, 2003
prevention and management of toxic expo-sures and poisoning in Oman.
MethodsThe Sultanate of Oman is administrativelydivided into 10 health regions with 59wilayat. Each health region has an upgrad-ed regional hospital and an office of the Di-rectorate General of Health Services tostrengthen decentralization of health ser-vices. Each region provides primary, sec-ondary and tertiary health care to thepopulation, through primary health centres,extended health centres and secondary andtertiary care hospitals. Four MOH referralhospitals catering to different specialtiesare located in Muscat, where patients arereferred from the regional hospitals. Eachwilayat hospital provides health services toabout 30 000–50 000 people in the region.They have 10–20 inpatient beds with poly-clinic facilities. These hospitals are wellconnected to the regional hospitals for re-ferral and administration. The local hospi-tals have more bed strength and extendedfacilities than wilayat hospitals. Extendedhealth centres (6/114 health centres) pro-vide 24-hour polyclinic facilities.
The director general of each region wascontacted by phone and informed about theaims and objectives of the study and theirrole in the project. The pro formas werethen faxed to the regional office, and fur-ther faxed to various health centres andhospitals in the region to supply the neces-sary information. The follow-up and col-lection of pro formas was carried out byrepresentative health workers or sanitaryinspectors from each region.
Forty-five health institutions were se-lected to cover primary, secondary and ter-tiary levels: 4 MOH referral hospitals inMuscat (Royal Hospital, Khoula Hospital,
Al Nahdha Hospital and Ibn Sina Hospital),7 regional hospitals, 3 wilayat hospitals, 16local hospitals, 10 health centres, 3 extend-ed health centres, and 2 other non-MOHreferral hospitals (Sultan Qaboos Universi-ty Hospital and the Armed Forces Hospital).
A simple 1-page database pro formawas prepared to collect information abouteach poisoning case treated at each institu-tion during the period January–December2000. The parameters included in the proforma were: name of the patient, age, sex,type of poison, mode and route of expo-sure, time since exposure, managementoutside hospital, presenting symptoms, ex-amination, investigations, treatment andoutcome.
The medical officers of all the hospitalswere contacted by telephone and were in-formed about the aims and objectives of thestudy, their role and responsibility in theproject and about the various terms used inthe pro forma. In addition, representativehealth workers or sanitary inspectors fromall 10 regions of the country were invited tothe Directorate of Environmental Healthand Malaria Eradication and were briefedabout the importance of data collection andthe terms used in the pro forma. Theseworkers helped in the follow-up and collec-tion of pro formas. Representatives at theRoyal (the main general referral hospital),Sultan Qaboos and the Armed Forces hos-pitals were personally contacted andbriefed about the study before the pro for-ma was handed over. A time period of 3months was allotted for sending back thecompleted pro formas. When there was noresponse or incomplete information re-minders were sent.
The pro formas received from individu-al hospitals were analysed and the data wasthen computed to provide region-wide andnationwide information on the incidence of
07 Profile of acute poisoning cases presenting.pmd 3/3/2005, 12:12 AM946
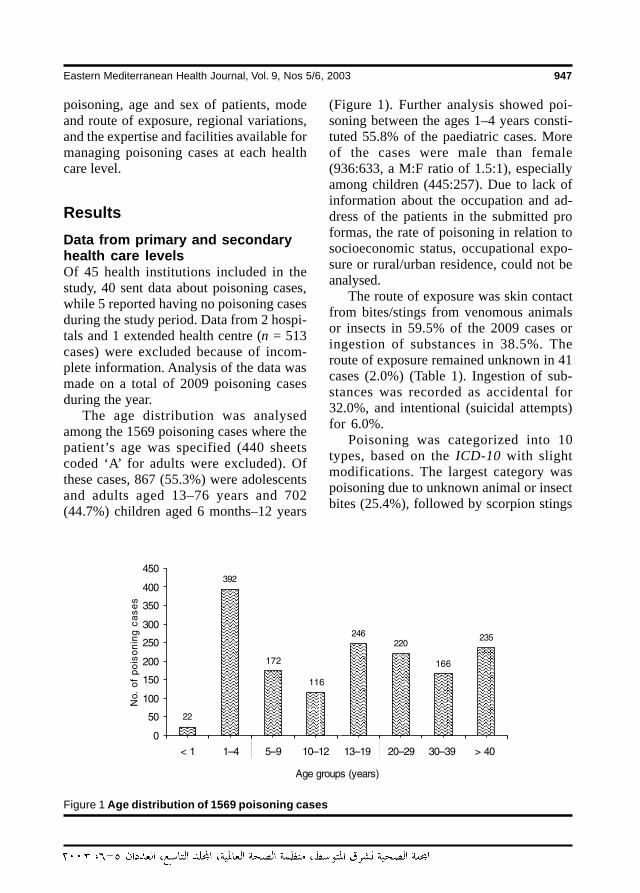
Eastern Mediterranean Health Journal, Vol. 9, Nos 5/6, 2003 947
poisoning, age and sex of patients, modeand route of exposure, regional variations,and the expertise and facilities available formanaging poisoning cases at each healthcare level.
ResultsData from primary and secondaryhealth care levelsOf 45 health institutions included in thestudy, 40 sent data about poisoning cases,while 5 reported having no poisoning casesduring the study period. Data from 2 hospi-tals and 1 extended health centre (n = 513cases) were excluded because of incom-plete information. Analysis of the data wasmade on a total of 2009 poisoning casesduring the year.
The age distribution was analysedamong the 1569 poisoning cases where thepatient’s age was specified (440 sheetscoded ‘A’ for adults were excluded). Ofthese cases, 867 (55.3%) were adolescentsand adults aged 13–76 years and 702(44.7%) children aged 6 months–12 years
(Figure 1). Further analysis showed poi-soning between the ages 1–4 years consti-tuted 55.8% of the paediatric cases. Moreof the cases were male than female(936:633, a M:F ratio of 1.5:1), especiallyamong children (445:257). Due to lack ofinformation about the occupation and ad-dress of the patients in the submitted proformas, the rate of poisoning in relation tosocioeconomic status, occupational expo-sure or rural/urban residence, could not beanalysed.
The route of exposure was skin contactfrom bites/stings from venomous animalsor insects in 59.5% of the 2009 cases oringestion of substances in 38.5%. Theroute of exposure remained unknown in 41cases (2.0%) (Table 1). Ingestion of sub-stances was recorded as accidental for32.0%, and intentional (suicidal attempts)for 6.0%.
Poisoning was categorized into 10types, based on the ICD-10 with slightmodifications. The largest category waspoisoning due to unknown animal or insectbites (25.4%), followed by scorpion stings
Figure 1 Age distribution of 1569 poisoning cases
07 Profile of acute poisoning cases presenting.pmd 3/3/2005, 12:12 AM947
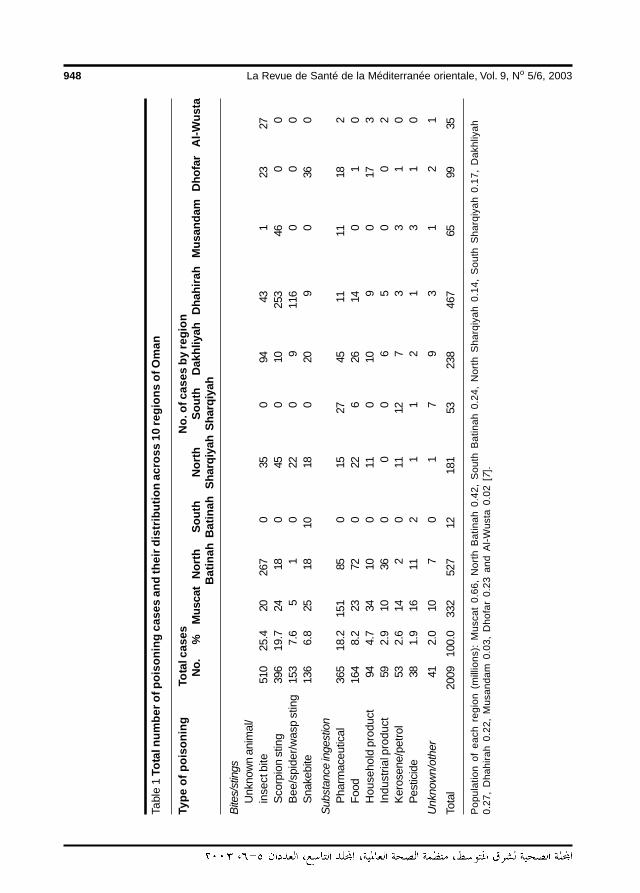
948 La Revue de Santé de la Méditerranée orientale, Vol. 9, No 5/6, 2003
Tabl
e 1
Tota
l num
ber o
f poi
soni
ng c
ases
and
thei
r dis
trib
utio
n ac
ross
10
regi
ons
of O
man
Type
of p
oiso
ning
Tota
l cas
esN
o. o
f cas
es b
y re
gion
No.
%M
usca
tN
orth
Sout
hN
orth
Sout
hD
akhl
iyah
Dha
hira
hM
usan
dam
Dho
far
Al-W
usta
Bat
inah
Bat
inah
Shar
qiya
hSh
arqi
yah
Bite
s/st
ings
Unk
now
n an
imal
/in
sect
bite
510
25.4
2026
70
350
9443
123
27S
corp
ion
stin
g39
619
.724
180
450
1025
346
00
Bee
/spi
der/
was
p st
ing
153
7.6
51
022
09
116
00
0S
nake
bite
136
6.8
2518
1018
020
90
360
Subs
tanc
e in
gest
ion
Pha
rmac
eutic
al36
518
.215
185
015
2745
1111
182
Foo
d16
48.
223
720
226
2614
01
0H
ouse
hold
pro
duct
944.
734
100
110
109
017
3In
dust
rial p
rodu
ct59
2.9
1036
00
06
50
02
Ker
osen
e/pe
trol
532.
614
20
1112
73
31
0P
estic
ide
381.
916
112
11
21
31
0
Unk
now
n/ot
her
412.
010
70
17
93
12
1
Tota
l20
0910
0.0
332
527
1218
153
238
467
6599
35
Pop
ulat
ion
of e
ach
regi
on (
mill
ions
): M
usca
t 0.
66,
Nor
th B
atin
ah 0
.42,
Sou
th B
atin
ah 0
.24,
Nor
th S
harq
iyah
0.1
4, S
outh
Sha
rqiy
ah
0.17
, D
akhl
iyah
0.27
, D
hahi
rah
0.22
, M
usan
dam
0.0
3, D
hofa
r 0.
23 a
nd A
l-W
usta
0.0
2 [7
].
07 Profile of acute poisoning cases presenting.pmd 3/3/2005, 12:12 AM948
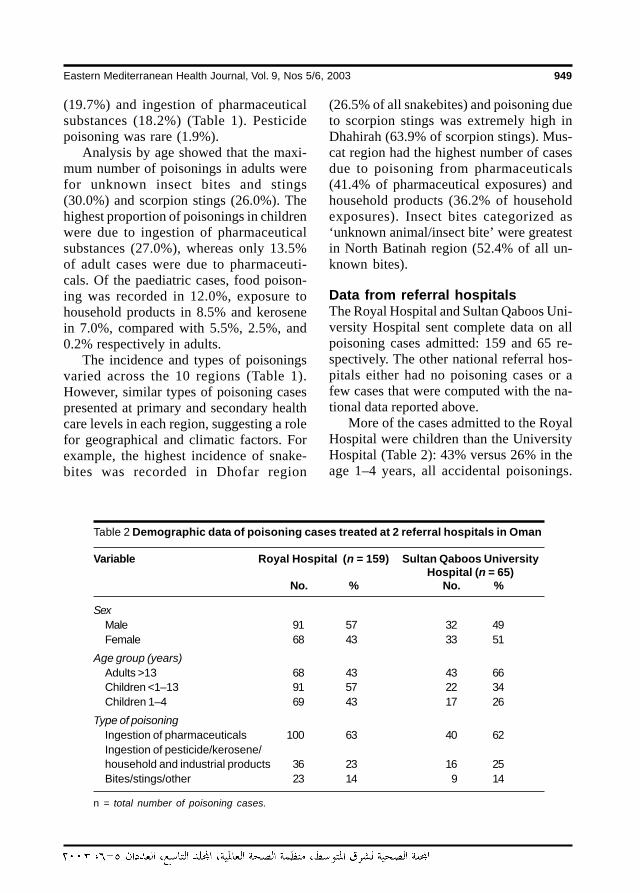
Eastern Mediterranean Health Journal, Vol. 9, Nos 5/6, 2003 949
(19.7%) and ingestion of pharmaceuticalsubstances (18.2%) (Table 1). Pesticidepoisoning was rare (1.9%).
Analysis by age showed that the maxi-mum number of poisonings in adults werefor unknown insect bites and stings(30.0%) and scorpion stings (26.0%). Thehighest proportion of poisonings in childrenwere due to ingestion of pharmaceuticalsubstances (27.0%), whereas only 13.5%of adult cases were due to pharmaceuti-cals. Of the paediatric cases, food poison-ing was recorded in 12.0%, exposure tohousehold products in 8.5% and kerosenein 7.0%, compared with 5.5%, 2.5%, and0.2% respectively in adults.
The incidence and types of poisoningsvaried across the 10 regions (Table 1).However, similar types of poisoning casespresented at primary and secondary healthcare levels in each region, suggesting a rolefor geographical and climatic factors. Forexample, the highest incidence of snake-bites was recorded in Dhofar region
(26.5% of all snakebites) and poisoning dueto scorpion stings was extremely high inDhahirah (63.9% of scorpion stings). Mus-cat region had the highest number of casesdue to poisoning from pharmaceuticals(41.4% of pharmaceutical exposures) andhousehold products (36.2% of householdexposures). Insect bites categorized as‘unknown animal/insect bite’ were greatestin North Batinah region (52.4% of all un-known bites).
Data from referral hospitalsThe Royal Hospital and Sultan Qaboos Uni-versity Hospital sent complete data on allpoisoning cases admitted: 159 and 65 re-spectively. The other national referral hos-pitals either had no poisoning cases or afew cases that were computed with the na-tional data reported above.
More of the cases admitted to the RoyalHospital were children than the UniversityHospital (Table 2): 43% versus 26% in theage 1–4 years, all accidental poisonings.
Table 2 Demographic data of poisoning cases treated at 2 referral hospitals in Oman
Variable Royal Hospital (n = 159) Sultan Qaboos UniversityHospital (n = 65)
No. % No. %
SexMale 91 57 32 49Female 68 43 33 51
Age group (years)Adults >13 68 43 43 66Children <1–13 91 57 22 34Children 1–4 69 43 17 26
Type of poisoningIngestion of pharmaceuticals 100 63 40 62Ingestion of pesticide/kerosene/household and industrial products 36 23 16 25Bites/stings/other 23 14 9 14
n = total number of poisoning cases.
07 Profile of acute poisoning cases presenting.pmd 3/3/2005, 12:12 AM949
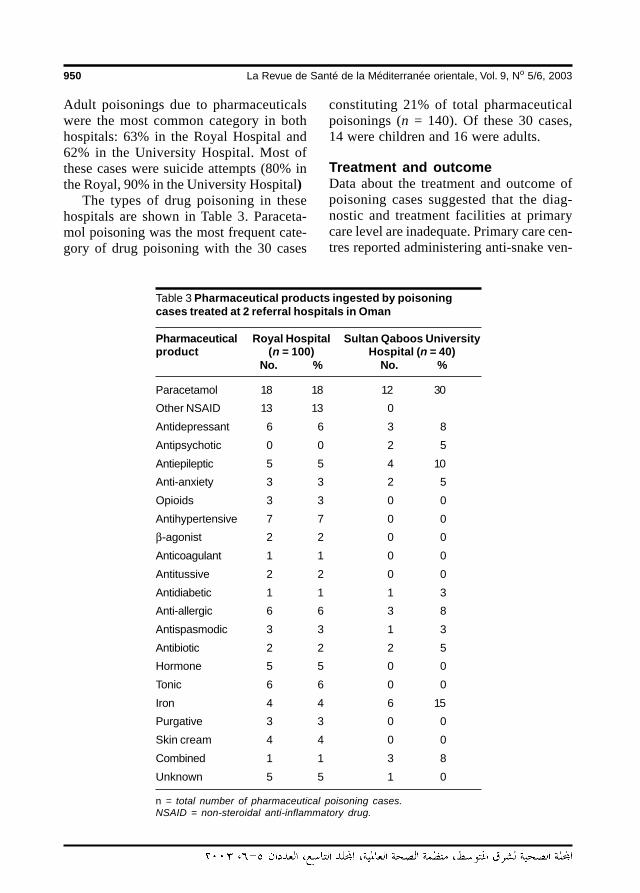
950 La Revue de Santé de la Méditerranée orientale, Vol. 9, No 5/6, 2003
Adult poisonings due to pharmaceuticalswere the most common category in bothhospitals: 63% in the Royal Hospital and62% in the University Hospital. Most ofthese cases were suicide attempts (80% inthe Royal, 90% in the University Hospital)
The types of drug poisoning in thesehospitals are shown in Table 3. Paraceta-mol poisoning was the most frequent cate-gory of drug poisoning with the 30 cases
constituting 21% of total pharmaceuticalpoisonings (n = 140). Of these 30 cases,14 were children and 16 were adults.
Treatment and outcomeData about the treatment and outcome ofpoisoning cases suggested that the diag-nostic and treatment facilities at primarycare level are inadequate. Primary care cen-tres reported administering anti-snake ven-
Table 3 Pharmaceutical products ingested by poisoningcases treated at 2 referral hospitals in Oman
Pharmaceutical Royal Hospital Sultan Qaboos Universityproduct (n = 100) Hospital (n = 40)
No. % No. %
Paracetamol 18 18 12 30
Other NSAID 13 13 0
Antidepressant 6 6 3 8
Antipsychotic 0 0 2 5
Antiepileptic 5 5 4 10
Anti-anxiety 3 3 2 5
Opioids 3 3 0 0
Antihypertensive 7 7 0 0
β-agonist 2 2 0 0
Anticoagulant 1 1 0 0
Antitussive 2 2 0 0
Antidiabetic 1 1 1 3
Anti-allergic 6 6 3 8
Antispasmodic 3 3 1 3
Antibiotic 2 2 2 5
Hormone 5 5 0 0
Tonic 6 6 0 0
Iron 4 4 6 15
Purgative 3 3 0 0
Skin cream 4 4 0 0
Combined 1 1 3 8
Unknown 5 5 1 0
n = total number of pharmaceutical poisoning cases.NSAID = non-steroidal anti-inflammatory drug.
07 Profile of acute poisoning cases presenting.pmd 3/3/2005, 12:12 AM950
Eastern Mediterranean Health Journal, Vol. 9, Nos 5/6, 2003 951
om and hydrocortisone injections in 90%of the snakebite cases even in the absenceof systemic symptoms and positive labora-tory findings. Though coagulation profilingwas done at some centres, renal functiontests were rarely done. The scorpion stingcases were treated by local infiltration ofxylocaine and oral administration of antihis-tamines and analgesics. Blood pressurewas rarely measured in these cases. Undi-agnosed cases of insect bites were treatedas scorpion stings.
Gastric lavage was carried out at bothprimary and secondary care levels for allcases of gastric poisoning, including kero-sene ingestion. Activated charcoal and anti-dotes were usually not available at primarycare level. Most of the drug and pesticidepoisonings presenting to primary care facil-ities were referred to secondary level hos-pitals, indicating inadequate facilities andexpertise to manage these patients. Never-theless, initial supportive care facilities areavailable in primary care. The secondarylevel hospitals have antidotes such asnaloxone, atropine, pralidoxime (2-PAM)and activated charcoal; however, the facili-ties for monitoring blood levels of drugsand some of the important antidotes suchas N-acetyl cysteine are not available.
No poisoning-related deaths were re-corded in any of the hospitals or health cen-tres over the 1-year period of the study.
Information from the Royal and Univer-sity Hospitals suggest that the experienceand facilities to manage poisoning cases areadequate in both referral hospitals.
DiscussionAcute poisoning is an important clinicalemergency and contributor to morbidityand mortality [8]. Early diagnosis, treat-ment and prevention is crucial in reducing
the burden of poisoning-related injury inany country. Baseline epidemiological datadepicting the susceptible groups in thecommunity, high-risk circumstances, toxicrisks, and the availability of diagnostic andtreatment facilities are essential to evolvestrategies for strengthening poisoning pre-vention and management at all health carelevels. The present study was undertakento generate such data for planning poisoncontrol activities in Oman.
The study recorded 2009 cases of acutepoisoning treated at primary, secondaryand tertiary health care institutions during a1-year period. The number is close to thenumber of inpatient cases of poisoning(2342) recorded by the Omani MOH in thesame year [7]. However, since not all insti-tutions participated in the study and somewere excluded for not submitting completeinformation, our data does not depict theactual countrywide incidence, whichwould in fact be much higher. Moreover,poisoning cases treated as outpatients werenot accounted for, as complete recordswere not available. The national health sta-tistics showed the number of outpatientstreated for poisoning in the same year was9646 [7]; these data are also unreliable asthere was overlap between inpatient andoutpatient numbers, a sampling methodwas used for outpatient data collection andpoisoning was classified with injuries. Nev-ertheless, all the data indicates that poison-ing and toxic exposures are a significanthealth problem in this country. Further-more, non-availability of records and in-complete information about the casessuggests the need for harmonized datasheets for collection of poisoning datathrough a central registry system, from in-patient, outpatient and emergency depart-ments of all hospitals and health centres inthe country.
07 Profile of acute poisoning cases presenting.pmd 3/3/2005, 12:12 AM951
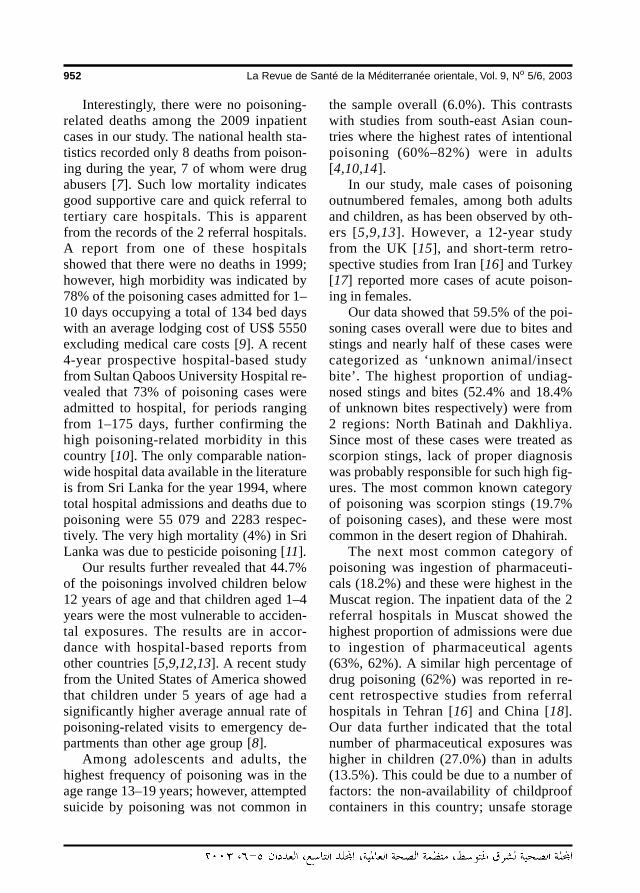
952 La Revue de Santé de la Méditerranée orientale, Vol. 9, No 5/6, 2003
Interestingly, there were no poisoning-related deaths among the 2009 inpatientcases in our study. The national health sta-tistics recorded only 8 deaths from poison-ing during the year, 7 of whom were drugabusers [7]. Such low mortality indicatesgood supportive care and quick referral totertiary care hospitals. This is apparentfrom the records of the 2 referral hospitals.A report from one of these hospitalsshowed that there were no deaths in 1999;however, high morbidity was indicated by78% of the poisoning cases admitted for 1–10 days occupying a total of 134 bed dayswith an average lodging cost of US$ 5550excluding medical care costs [9]. A recent4-year prospective hospital-based studyfrom Sultan Qaboos University Hospital re-vealed that 73% of poisoning cases wereadmitted to hospital, for periods rangingfrom 1–175 days, further confirming thehigh poisoning-related morbidity in thiscountry [10]. The only comparable nation-wide hospital data available in the literatureis from Sri Lanka for the year 1994, wheretotal hospital admissions and deaths due topoisoning were 55 079 and 2283 respec-tively. The very high mortality (4%) in SriLanka was due to pesticide poisoning [11].
Our results further revealed that 44.7%of the poisonings involved children below12 years of age and that children aged 1–4years were the most vulnerable to acciden-tal exposures. The results are in accor-dance with hospital-based reports fromother countries [5,9,12,13]. A recent studyfrom the United States of America showedthat children under 5 years of age had asignificantly higher average annual rate ofpoisoning-related visits to emergency de-partments than other age group [8].
Among adolescents and adults, thehighest frequency of poisoning was in theage range 13–19 years; however, attemptedsuicide by poisoning was not common in
the sample overall (6.0%). This contrastswith studies from south-east Asian coun-tries where the highest rates of intentionalpoisoning (60%–82%) were in adults[4,10,14].
In our study, male cases of poisoningoutnumbered females, among both adultsand children, as has been observed by oth-ers [5,9,13]. However, a 12-year studyfrom the UK [15], and short-term retro-spective studies from Iran [16] and Turkey[17] reported more cases of acute poison-ing in females.
Our data showed that 59.5% of the poi-soning cases overall were due to bites andstings and nearly half of these cases werecategorized as ‘unknown animal/insectbite’. The highest proportion of undiag-nosed stings and bites (52.4% and 18.4%of unknown bites respectively) were from2 regions: North Batinah and Dakhliya.Since most of these cases were treated asscorpion stings, lack of proper diagnosiswas probably responsible for such high fig-ures. The most common known categoryof poisoning was scorpion stings (19.7%of poisoning cases), and these were mostcommon in the desert region of Dhahirah.
The next most common category ofpoisoning was ingestion of pharmaceuti-cals (18.2%) and these were highest in theMuscat region. The inpatient data of the 2referral hospitals in Muscat showed thehighest proportion of admissions were dueto ingestion of pharmaceutical agents(63%, 62%). A similar high percentage ofdrug poisoning (62%) was reported in re-cent retrospective studies from referralhospitals in Tehran [16] and China [18].Our data further indicated that the totalnumber of pharmaceutical exposures washigher in children (27.0%) than in adults(13.5%). This could be due to a number offactors: the non-availability of childproofcontainers in this country; unsafe storage
07 Profile of acute poisoning cases presenting.pmd 3/3/2005, 12:12 AM952
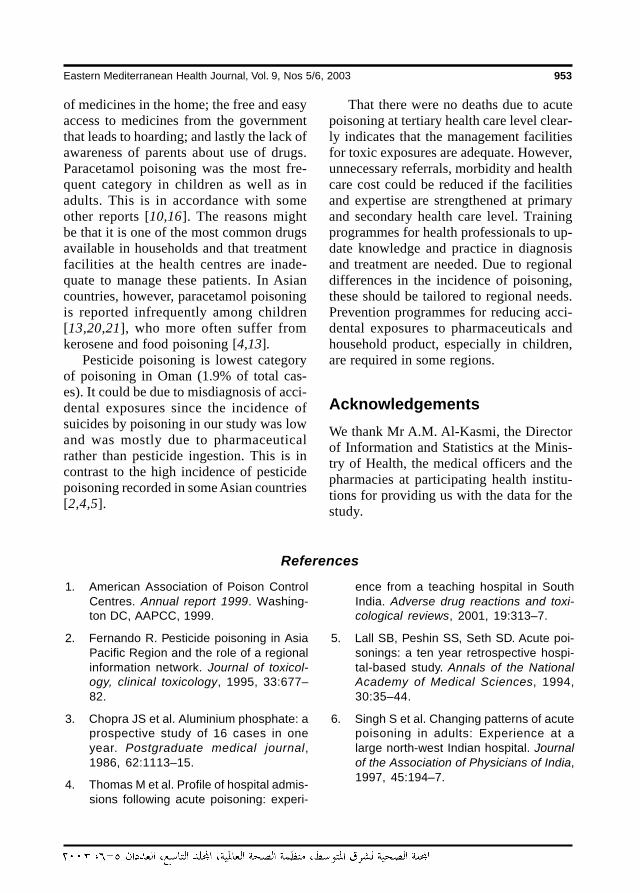
Eastern Mediterranean Health Journal, Vol. 9, Nos 5/6, 2003 953
of medicines in the home; the free and easyaccess to medicines from the governmentthat leads to hoarding; and lastly the lack ofawareness of parents about use of drugs.Paracetamol poisoning was the most fre-quent category in children as well as inadults. This is in accordance with someother reports [10,16]. The reasons mightbe that it is one of the most common drugsavailable in households and that treatmentfacilities at the health centres are inade-quate to manage these patients. In Asiancountries, however, paracetamol poisoningis reported infrequently among children[13,20,21], who more often suffer fromkerosene and food poisoning [4,13].
Pesticide poisoning is lowest categoryof poisoning in Oman (1.9% of total cas-es). It could be due to misdiagnosis of acci-dental exposures since the incidence ofsuicides by poisoning in our study was lowand was mostly due to pharmaceuticalrather than pesticide ingestion. This is incontrast to the high incidence of pesticidepoisoning recorded in some Asian countries[2,4,5].
That there were no deaths due to acutepoisoning at tertiary health care level clear-ly indicates that the management facilitiesfor toxic exposures are adequate. However,unnecessary referrals, morbidity and healthcare cost could be reduced if the facilitiesand expertise are strengthened at primaryand secondary health care level. Trainingprogrammes for health professionals to up-date knowledge and practice in diagnosisand treatment are needed. Due to regionaldifferences in the incidence of poisoning,these should be tailored to regional needs.Prevention programmes for reducing acci-dental exposures to pharmaceuticals andhousehold product, especially in children,are required in some regions.
AcknowledgementsWe thank Mr A.M. Al-Kasmi, the Directorof Information and Statistics at the Minis-try of Health, the medical officers and thepharmacies at participating health institu-tions for providing us with the data for thestudy.
References
1. American Association of Poison ControlCentres. Annual report 1999. Washing-ton DC, AAPCC, 1999.
2. Fernando R. Pesticide poisoning in AsiaPacific Region and the role of a regionalinformation network. Journal of toxicol-ogy, clinical toxicology, 1995, 33:677–82.
3. Chopra JS et al. Aluminium phosphate: aprospective study of 16 cases in oneyear. Postgraduate medical journal,1986, 62:1113–15.
4. Thomas M et al. Profile of hospital admis-sions following acute poisoning: experi-
ence from a teaching hospital in SouthIndia. Adverse drug reactions and toxi-cological reviews, 2001, 19:313–7.
5. Lall SB, Peshin SS, Seth SD. Acute poi-sonings: a ten year retrospective hospi-tal-based study. Annals of the NationalAcademy of Medical Sciences, 1994,30:35–44.
6. Singh S et al. Changing patterns of acutepoisoning in adults: Experience at alarge north-west Indian hospital. Journalof the Association of Physicians of India,1997, 45:194–7.
07 Profile of acute poisoning cases presenting.pmd 3/3/2005, 12:12 AM953
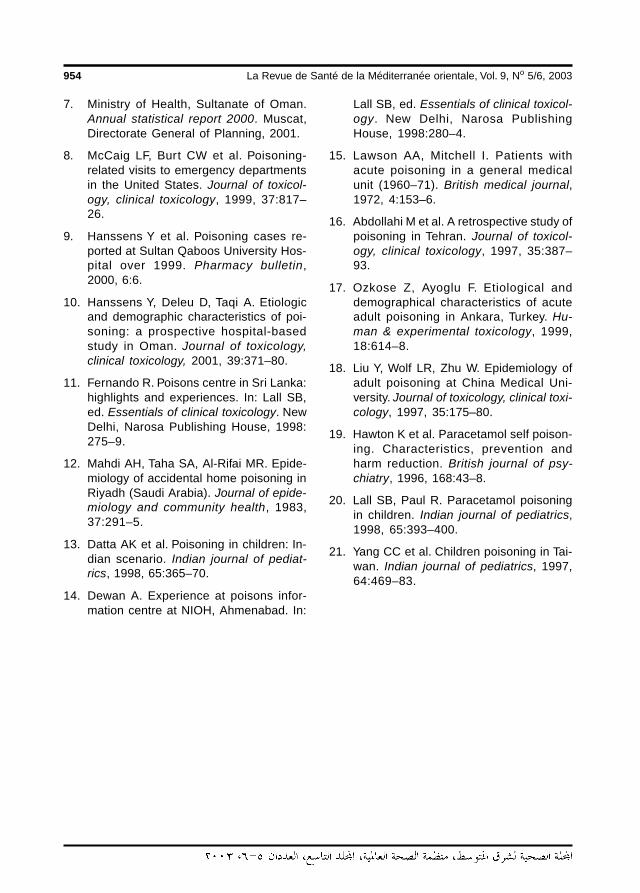
954 La Revue de Santé de la Méditerranée orientale, Vol. 9, No 5/6, 2003
7. Ministry of Health, Sultanate of Oman.Annual statistical report 2000. Muscat,Directorate General of Planning, 2001.
8. McCaig LF, Burt CW et al. Poisoning-related visits to emergency departmentsin the United States. Journal of toxicol-ogy, clinical toxicology, 1999, 37:817–26.
9. Hanssens Y et al. Poisoning cases re-ported at Sultan Qaboos University Hos-pital over 1999. Pharmacy bulletin,2000, 6:6.
10. Hanssens Y, Deleu D, Taqi A. Etiologicand demographic characteristics of poi-soning: a prospective hospital-basedstudy in Oman. Journal of toxicology,clinical toxicology, 2001, 39:371–80.
11. Fernando R. Poisons centre in Sri Lanka:highlights and experiences. In: Lall SB,ed. Essentials of clinical toxicology. NewDelhi, Narosa Publishing House, 1998:275–9.
12. Mahdi AH, Taha SA, Al-Rifai MR. Epide-miology of accidental home poisoning inRiyadh (Saudi Arabia). Journal of epide-miology and community health, 1983,37:291–5.
13. Datta AK et al. Poisoning in children: In-dian scenario. Indian journal of pediat-rics, 1998, 65:365–70.
14. Dewan A. Experience at poisons infor-mation centre at NIOH, Ahmenabad. In:
Lall SB, ed. Essentials of clinical toxicol-ogy. New Delhi, Narosa PublishingHouse, 1998:280–4.
15. Lawson AA, Mitchell I. Patients withacute poisoning in a general medicalunit (1960–71). British medical journal,1972, 4:153–6.
16. Abdollahi M et al. A retrospective study ofpoisoning in Tehran. Journal of toxicol-ogy, clinical toxicology, 1997, 35:387–93.
17. Ozkose Z, Ayoglu F. Etiological anddemographical characteristics of acuteadult poisoning in Ankara, Turkey. Hu-man & experimental toxicology, 1999,18:614–8.
18. Liu Y, Wolf LR, Zhu W. Epidemiology ofadult poisoning at China Medical Uni-versity. Journal of toxicology, clinical toxi-cology, 1997, 35:175–80.
19. Hawton K et al. Paracetamol self poison-ing. Characteristics, prevention andharm reduction. British journal of psy-chiatry, 1996, 168:43–8.
20. Lall SB, Paul R. Paracetamol poisoningin children. Indian journal of pediatrics,1998, 65:393–400.
21. Yang CC et al. Children poisoning in Tai-wan. Indian journal of pediatrics, 1997,64:469–83.
07 Profile of acute poisoning cases presenting.pmd 3/3/2005, 12:12 AM954
Eastern Mediterranean Health Journal, Vol. 9, Nos 5/6, 2003 955
Pregnancies past the estimated dateof confinement: labour and deliveryoutcomeM. Al-Taani1
Department of Obstetrics and Gynaecology, Queen Alia Military Hospital, Amman, Jordan.Received: 09/10/02; accepted: 26/02/03
ABSTRACT To compare labour and delivery outcomes in women undergoing induction and those havingspontaneous onset for pregnancies past the estimated date of delivery, a prospective study of 395 singleton,uncomplicated pregnancies was performed. Labour was induced in 175 women. Overall caesarean sectionrate was 9.4%, with no significant difference between the 2 groups. Overall rate of assisted vaginal deliverieswas 7%, higher in the induction group than the spontaneous onset group but the difference was not signifi-cant. There was no significant difference in occurrence of intrapartum meconium, nor for maternal morbidity.No neonate needed intubation. No perinatal deaths occurred. Perinatal mortality and morbidity are preven-table, and induction of labour before 42 weeks is justifiable to prevent adverse outcomes.
Grossesses prolongées : issue du travail et de l’accouchementRESUME Une étude prospective de 395 grossesses uniques sans complications a été réalisée afin decomparer l’issue du travail et de l’accouchement chez des femmes pour lesquelles le travail a été déclenchéet chez d’autres ayant eu un accouchement spontané pour les grossesses dont le terme est dépassé. Letravail a été déclenché chez 175 femmes. Le taux global de césariennes était de 9,4 %, sans différencestatistiquement significative entre les deux groupes. Le taux global d’accouchements par voie basse as-sistés était de 7 % ; il était plus élevé dans le groupe de l’accouchement déclenché que dans le groupe del’accouchement spontané, mais la différence n’était pas statistiquement significative. Il n’y avait aucunedifférence significative pour la survenue d’une émission de méconium pendant le travail, et il n’y en avait pasnon plus pour la morbidité maternelle. Aucun nouveau-né n’a eu besoin d’une intubation. Il n’y a eu aucundécès périnatal. La mortalité et la morbidité périnatales sont évitables, et une interruption de grossesse avant42 semaines est justifiable pour éviter les issues défavorables.
08 Pregnancies past the estimated.pmd 3/3/2005, 12:12 AM955
956 La Revue de Santé de la Méditerranée orientale, Vol. 9, No 5/6, 2003
IntroductionFetal loss in pregnancies that have passedthe estimated date of confinement is astressful experience for woman and physi-cian alike. In prolonged pregnancies, thereis a significantly greater chance of high-risk conditions developing, leading to a risein perinatal morbidity and mortality. Thepresumed pathogenesis of the complica-tions associated with postdate pregnanciesis related to progressive uteroplacental in-sufficiency, a condition, which leads to oli-gohydramnios, meconium aspiration, fetalasphyxia or dysmaturity, and in severe cas-es fetal central nervous system damage andeven death [1,2]. Furthermore, severalstudies have recognized the association be-tween macrosomia and adverse maternaland fetal outcome, with advancing gesta-tional age being the only contributing factorto increased morbidity and mortality [3–6].
This study was undertaken to explorethe preventability of the high incidence ofperinatal mortality and morbidity associatedwith advancing gestational age beyondterm. Labour and delivery outcomes werecompared for pregnancies which hadpassed the estimated date of confinement inwomen undergoing labour induction andthose having spontaneous onset of labour.Pregnancies become at risk at the end ofthe 41st week of amenorrhoea [7,8].
MethodsSix hundred and forty-four (644) pregnantwomen who had passed the estimated dateof confinement were admitted for deliveryat Queen Alia Military Hospital, Amman,between 1 January 2001 and 31 July 2002.Of these, 249 pregnancies were excludedbecause of nonvertex presentation (87), as-sociated medical or obstetric problems (31)and late antenatal booking (131). The final
study population comprised 395 uncompli-cated singleton pregnancies. Of these, 220were admitted having spontaneous onset oflabour (defined as the presence of painful,regular uterine contractions at least onceevery 5 minutes associated with at least80% cervical effacement, with or withoutspontaneous rupture of membranes). Theremaining 175 pregnancies were admittedfrom the outpatient clinic for induction oflabour.
Upon admission, estimated date of con-finement was assessed based on regularand good menstrual histories and earlyantenatal booking, where early datingexamination in early gestation was calculat-ed from the last menstrual period. This wasconfirmed by sonograms obtained in thefirst and second trimester, but before 20weeks gestational age. Full physical andpelvic examination was performed for allthe study population. Nonstress tests andliquor evaluation on sonogram were per-formed for all pregnancies in the inductiongroup. Intravenous access and baselinelaboratory tests were obtained.
Women admitted for induction (definedas the initiation of labour in woman withintact membranes and having no regularuterine contractions, but modified Bishopscore ≤ 6) had cervical priming, which wasdone by administering dinoprostone 3 mgvaginal pessaries inserted in the posteriorvaginal fornix. This was repeated after 6hours if indications of onset of labour hadnot been detected.
For both groups, amniotomy was per-formed within 1–2 hours of labour diagno-sis (or as soon as clinically feasible) unlessmembranes were spontaneously ruptured.Labour progress was monitored by pelvicexamination every 2 hours. If labour abnor-malities, as defined by Friedman’s criteria[9], were detected, oxytocin augmentationwas started and administered in the manner
08 Pregnancies past the estimated.pmd 3/3/2005, 12:12 AM956
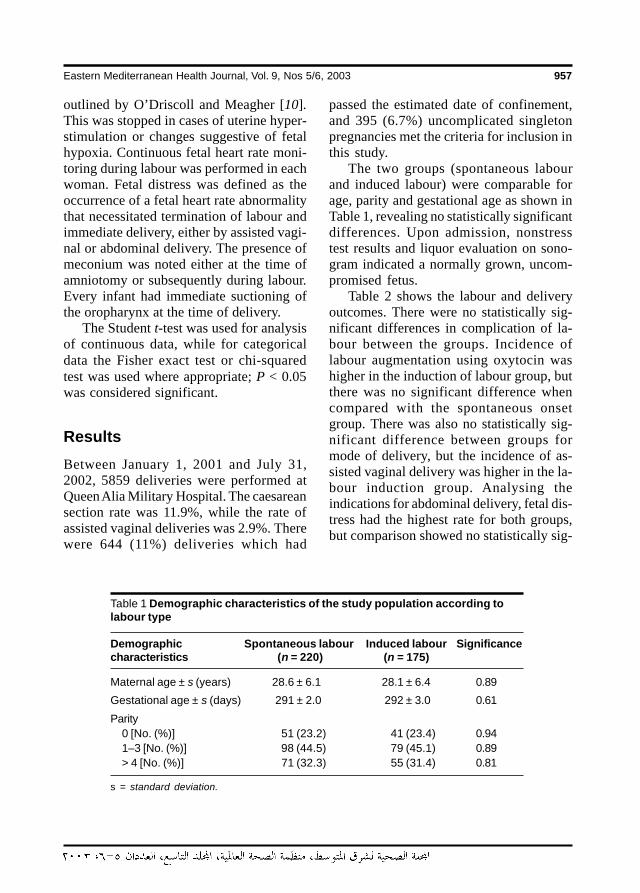
Eastern Mediterranean Health Journal, Vol. 9, Nos 5/6, 2003 957
outlined by O’Driscoll and Meagher [10].This was stopped in cases of uterine hyper-stimulation or changes suggestive of fetalhypoxia. Continuous fetal heart rate moni-toring during labour was performed in eachwoman. Fetal distress was defined as theoccurrence of a fetal heart rate abnormalitythat necessitated termination of labour andimmediate delivery, either by assisted vagi-nal or abdominal delivery. The presence ofmeconium was noted either at the time ofamniotomy or subsequently during labour.Every infant had immediate suctioning ofthe oropharynx at the time of delivery.
The Student t-test was used for analysisof continuous data, while for categoricaldata the Fisher exact test or chi-squaredtest was used where appropriate; P < 0.05was considered significant.
ResultsBetween January 1, 2001 and July 31,2002, 5859 deliveries were performed atQueen Alia Military Hospital. The caesareansection rate was 11.9%, while the rate ofassisted vaginal deliveries was 2.9%. Therewere 644 (11%) deliveries which had
passed the estimated date of confinement,and 395 (6.7%) uncomplicated singletonpregnancies met the criteria for inclusion inthis study.
The two groups (spontaneous labourand induced labour) were comparable forage, parity and gestational age as shown inTable 1, revealing no statistically significantdifferences. Upon admission, nonstresstest results and liquor evaluation on sono-gram indicated a normally grown, uncom-promised fetus.
Table 2 shows the labour and deliveryoutcomes. There were no statistically sig-nificant differences in complication of la-bour between the groups. Incidence oflabour augmentation using oxytocin washigher in the induction of labour group, butthere was no significant difference whencompared with the spontaneous onsetgroup. There was also no statistically sig-nificant difference between groups formode of delivery, but the incidence of as-sisted vaginal delivery was higher in the la-bour induction group. Analysing theindications for abdominal delivery, fetal dis-tress had the highest rate for both groups,but comparison showed no statistically sig-
Table 1 Demographic characteristics of the study population according tolabour type
Demographic Spontaneous labour Induced labour Significancecharacteristics (n = 220) (n = 175)
Maternal age ± s (years) 28.6 ± 6.1 28.1 ± 6.4 0.89
Gestational age ± s (days) 291 ± 2.0 292 ± 3.0 0.61
Parity0 [No. (%)] 51 (23.2) 41 (23.4) 0.941–3 [No. (%)] 98 (44.5) 79 (45.1) 0.89> 4 [No. (%)] 71 (32.3) 55 (31.4) 0.81
s = standard deviation.
08 Pregnancies past the estimated.pmd 3/3/2005, 12:12 AM957
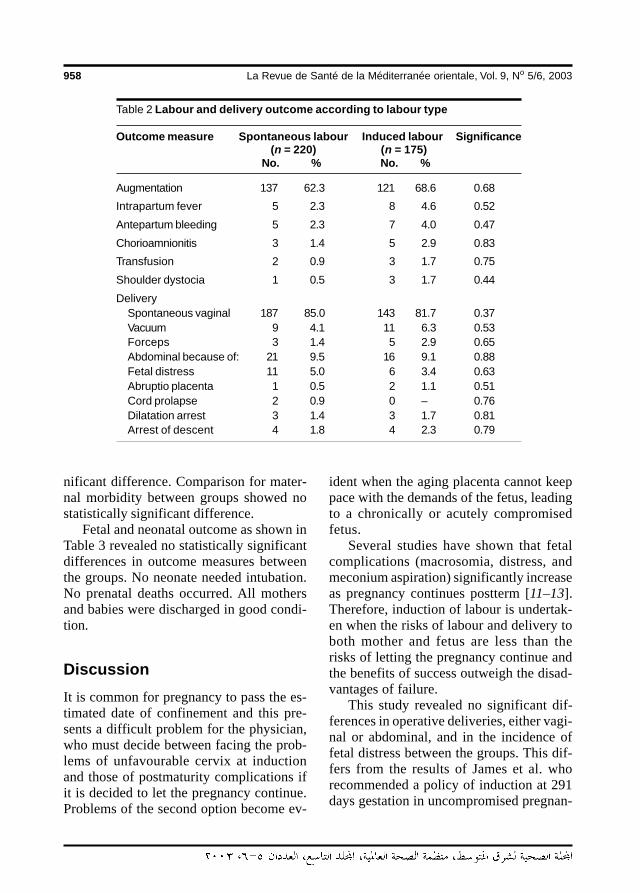
958 La Revue de Santé de la Méditerranée orientale, Vol. 9, No 5/6, 2003
nificant difference. Comparison for mater-nal morbidity between groups showed nostatistically significant difference.
Fetal and neonatal outcome as shown inTable 3 revealed no statistically significantdifferences in outcome measures betweenthe groups. No neonate needed intubation.No prenatal deaths occurred. All mothersand babies were discharged in good condi-tion.
DiscussionIt is common for pregnancy to pass the es-timated date of confinement and this pre-sents a difficult problem for the physician,who must decide between facing the prob-lems of unfavourable cervix at inductionand those of postmaturity complications ifit is decided to let the pregnancy continue.Problems of the second option become ev-
ident when the aging placenta cannot keeppace with the demands of the fetus, leadingto a chronically or acutely compromisedfetus.
Several studies have shown that fetalcomplications (macrosomia, distress, andmeconium aspiration) significantly increaseas pregnancy continues postterm [11–13].Therefore, induction of labour is undertak-en when the risks of labour and delivery toboth mother and fetus are less than therisks of letting the pregnancy continue andthe benefits of success outweigh the disad-vantages of failure.
This study revealed no significant dif-ferences in operative deliveries, either vagi-nal or abdominal, and in the incidence offetal distress between the groups. This dif-fers from the results of James et al. whorecommended a policy of induction at 291days gestation in uncompromised pregnan-
Table 2 Labour and delivery outcome according to labour type
Outcome measure Spontaneous labour Induced labour Significance(n = 220) (n = 175)
No. % No. %
Augmentation 137 62.3 121 68.6 0.68
Intrapartum fever 5 2.3 8 4.6 0.52
Antepartum bleeding 5 2.3 7 4.0 0.47
Chorioamnionitis 3 1.4 5 2.9 0.83
Transfusion 2 0.9 3 1.7 0.75
Shoulder dystocia 1 0.5 3 1.7 0.44
DeliverySpontaneous vaginal 187 85.0 143 81.7 0.37Vacuum 9 4.1 11 6.3 0.53Forceps 3 1.4 5 2.9 0.65Abdominal because of: 21 9.5 16 9.1 0.88Fetal distress 11 5.0 6 3.4 0.63Abruptio placenta 1 0.5 2 1.1 0.51Cord prolapse 2 0.9 0 – 0.76Dilatation arrest 3 1.4 3 1.7 0.81Arrest of descent 4 1.8 4 2.3 0.79
08 Pregnancies past the estimated.pmd 3/3/2005, 12:12 AM958
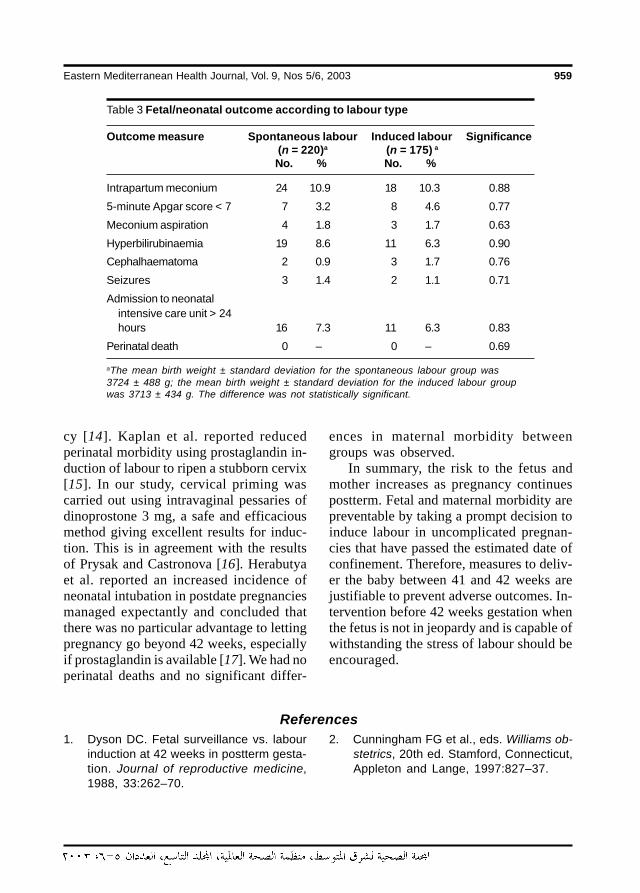
Eastern Mediterranean Health Journal, Vol. 9, Nos 5/6, 2003 959
cy [14]. Kaplan et al. reported reducedperinatal morbidity using prostaglandin in-duction of labour to ripen a stubborn cervix[15]. In our study, cervical priming wascarried out using intravaginal pessaries ofdinoprostone 3 mg, a safe and efficaciousmethod giving excellent results for induc-tion. This is in agreement with the resultsof Prysak and Castronova [16]. Herabutyaet al. reported an increased incidence ofneonatal intubation in postdate pregnanciesmanaged expectantly and concluded thatthere was no particular advantage to lettingpregnancy go beyond 42 weeks, especiallyif prostaglandin is available [17]. We had noperinatal deaths and no significant differ-
Table 3 Fetal/neonatal outcome according to labour type
Outcome measure Spontaneous labour Induced labour Significance(n = 220)a (n = 175) a
No. % No. %
Intrapartum meconium 24 10.9 18 10.3 0.88
5-minute Apgar score < 7 7 3.2 8 4.6 0.77
Meconium aspiration 4 1.8 3 1.7 0.63
Hyperbilirubinaemia 19 8.6 11 6.3 0.90
Cephalhaematoma 2 0.9 3 1.7 0.76
Seizures 3 1.4 2 1.1 0.71
Admission to neonatalintensive care unit > 24hours 16 7.3 11 6.3 0.83
Perinatal death 0 – 0 – 0.69
aThe mean birth weight ± standard deviation for the spontaneous labour group was3724 ± 488 g; the mean birth weight ± standard deviation for the induced labour groupwas 3713 ± 434 g. The difference was not statistically significant.
ences in maternal morbidity betweengroups was observed.
In summary, the risk to the fetus andmother increases as pregnancy continuespostterm. Fetal and maternal morbidity arepreventable by taking a prompt decision toinduce labour in uncomplicated pregnan-cies that have passed the estimated date ofconfinement. Therefore, measures to deliv-er the baby between 41 and 42 weeks arejustifiable to prevent adverse outcomes. In-tervention before 42 weeks gestation whenthe fetus is not in jeopardy and is capable ofwithstanding the stress of labour should beencouraged.
References1. Dyson DC. Fetal surveillance vs. labour
induction at 42 weeks in postterm gesta-tion. Journal of reproductive medicine,1988, 33:262–70.
2. Cunningham FG et al., eds. Williams ob-stetrics, 20th ed. Stamford, Connecticut,Appleton and Lange, 1997:827–37.
08 Pregnancies past the estimated.pmd 3/3/2005, 12:12 AM959
960 La Revue de Santé de la Méditerranée orientale, Vol. 9, No 5/6, 2003
3. Chervenak JL et al. Macrosomia in thepostdate pregnancy: is routine ultraso-nographic indicated? American journalof obstetrics and gynecology, 1989,161:753–6.
4. PolIak RN, Hauer-Pollak G, Divon MY.Macrosomia in postdates pregnancies:the accuracy of routine ultrasonographicscreening. American journal of obstet-rics and gynecology, 1992, 167:7–11.
5. Saito M et al. Time of ovulation and pro-longed pregnancy. American journal ofobstetrics and gynecology, 1972, 112:31–8.
6. Eden RD, Steifert L, Winegar A. Perinatalcharacteristics of uncomplicated post-date pregnancies. Obstetrics and gyne-cology, 1987, 53:721.
7. Guidetti DA, Divon MV, Langer O. Post-date fetal surveillance: Is 41 weeks tooearly? American journal of obstetricsand gynecology, 1989, 161:91–3.
8. Boisselier P, Guettier X. Le termedepasse. Revue de la literature. [Pro-longed pregnancy. Review of the litera-ture.] Journal de gynécologie, obstétri-que et biologie de la reproduction, 1995,24(7):739–46.
9. Friedman EA. The labour curve. Clinics inperinatology, 1981, 8:15–25.
10. O’Driscoll K, Meagher D. Active manage-ment of labour: the Dublin experience.2nd ed. London, Ballière Tindal, 1986.
11. Arias F. Predictability of complicationsassociated with prolongation of preg-nancy. Obstetrics and gynecology, 1987,70:101–6.
12. Divon MY et al. Fetal and neonatal mor-tality in the postterm pregnancy: the im-pact of gestational age and fetal growthrestriction. American journal of obstetricsand gynecology, 1998, 178:726–31.
13. Votta RA, Cibils LA. Active managementof prolonged pregnancy. American jour-nal of obstetrics and gynecology, 1993,168(2):557–63.
14. James C et al. Management of pro-longed pregnancy: a randomized trial ofinduction of labour and antepartum foe-tal monitoring. National medical journalof India, 2001, 14(5):270–3.
15. Kaplan B et al. The outcome of post-termpregnancy. A comparative study. Journalof perinatal medicine, 1995, 23(3):183–9.
16. Prysak M, Castronova FC. Elective in-duction versus spontaneous labor: acase–control analysis of safety and effi-cacy. Obstetrics and gynecology, 1998,92:47–52.
17. Herabutya et al. Prolonged pregnancy:the management dilemma. Internationaljournal of gynaecology and obstetrics,1992, 37(4):253–8.
08 Pregnancies past the estimated.pmd 3/3/2005, 12:12 AM960
Eastern Mediterranean Health Journal, Vol. 9, Nos 5/6, 2003 961
Breastfeeding indicators in DakahliaGovernorateA-H. El-Gilany1
1Department of Community Medicine, Faculty of Medicine, University of Mansoura, Mansoura, Egypt.Received: 26/08/01; accepted: 08/01/02
ABSTRACT This study was carried out in Dakahlia Governorate to assess current breastfeeding practicesusing the standardized breastfeeding indicators developed by the World Health Organization and to highlightthe impact of some socioeconomic and maternal factors on these indicators. An interview was carried outwith mothers of 1200 infants and children < 24 months during a poliomyelitis immunization campaign in urbanand rural areas. The findings indicate that 84.6% of infants aged 0–4 months are fully breastfed, with 42.5%and 42.1% of them exclusively and predominantly breastfed respectively. Rural infants are more likely to beexclusively breastfed, to continue breastfeeding for 1 year and to initiate breastfeeding early. Non-workingmothers are more likely to breastfeed exclusively and more likely to continue breastfeeding for 1 year.
Indicateurs relatifs à l’allaitement au sein dans la Gouvernorat de DakahliaRESUME Cette étude a été réalisée dans le Gouvernorat de Dakahlia afin d’évaluer les pratiques actuellesd’allaitement au sein à l’aide des indicateurs types de l’allaitement au sein établis par l’Organisation mondialede la Santé et de montrer l’impact de certains facteurs socioéconomiques et maternels sur ces indicateurs.Les mères de 1200 nourrissons et enfants de moins de 24 mois ont été interrogées durant une campagnede vaccination contre la poliomyélitique dans des localités urbaines et rurales. Les résultats indiquent que84,6 % des nourrissons âgés de 0-4 mois sont complètement allaités au sein, avec pour 42,5 % et 42,1 %d’entre eux un allaitement maternel exclusif et prédominant, respectivement. Les nourrissons des localitésrurales ont plus de chances d’être exclusivement allaités au sein, de continuer à être allaités au sein pendantune année et de commencer à être allaités au sein tôt. Les mères qui ne travaillent pas sont plus susceptiblesd’allaiter leur enfant au sein exclusivement et de poursuivre l’allaitement maternel pendant un an.
09 Breast feeding indicators in Dakahlia.pmd 3/3/2005, 12:12 AM961
962 La Revue de Santé de la Méditerranée orientale, Vol. 9, No 5/6, 2003
IntroductionBreastfeeding has been extensively investi-gated in numerous studies in developing aswell as industrialized countries. Egypt is noexception, but the surveys have been con-ducted in different parts of the country andamong special groups using different ques-tionnaires and methodologies and thereforelack uniformity. This has made comparisonof the results and assessment of the impactof intervention and promotional pro-grammes most difficult.
The World Health Organization (WHO),United Nations Children’s Fund (UNICEF),United States Agency for International De-velopment (USAID) and Swedish Interna-tional Development Cooperation Agency(SIDA) jointly sponsored a workshop thatdeveloped a standardized set of breastfeed-ing indicators and specific methodologiesfor their measurements that are simple,easy to measure and operationally feasible.They can be used for national and interna-tional comparisons, to monitor seculartrends and to assess the impact of interven-tion [1]. These indicators include:• Full breastfeeding rate: the proportion
of infants less than 4 months of agewho are either exclusively breastfed,i.e. without other liquids or solids ex-cept for drops or medicinal syrups (ex-clusive breastfeeding rate) or who arepredominantly breastfed, i.e. the infantmay also have received water and/orwater-based drink (predominant breast-feeding rate).
• Timely complementary feeding rate: theproportion of infants 6–9 months of agewho are receiving breast milk plus com-plementary solid or semi-solid food.
• Continued breastfeeding rate (1 year):the proportion of children 12–15months of age who are breastfeeding.
• Continued breastfeeding rate (2 year):the proportion of children 20–23months of age who are breastfeeding.
• Bottle-feeding rate: the proportion of in-fants less than 12 months who are re-ceiving any food or drink from a bottle.
• Time of first suckling rate: the propor-tion of infants less than 12 months whofirst suckled within 1 hour of birth.
• Ever breastfeeding rate: the proportionof infants less than 12 months of agewho were ever breastfed.In this research article the above-men-
tioned indicators were used to assessbreastfeeding practices and to study the in-fluence of different maternal and socioeco-nomic factors on them.
MethodsThis work was carried out in both urbanand rural areas of Dakahlia governorate.From urban localities, Mansoura andSherbin Health Offices were randomlychosen. From rural localities, 4 rural heathunits were randomly chosen from the vil-lages of Nikata, Ewish El-Hagar, Kafr El-Shenawie and El-Ahmadia. These belong toMansoura and Sherbin districts.
The target population was children be-low 2 years of age and their mothers. Dur-ing the first and second doses of apoliomyelitis vaccination campaign, the re-searcher carried out an exit interview withthe mothers and completed a structuredquestionnaire covering family socioeco-nomic status and maternal characteristicsas well as feeding practices during the pre-vious 24 hours. The social standard of thefamily was calculated according to Fahmyand El-Sherbini [2]. For 10 mother–childpairs in each completed month, up to theage of 12 months, as well as in the age
09 Breast feeding indicators in Dakahlia.pmd 3/3/2005, 12:12 AM962
Eastern Mediterranean Health Journal, Vol. 9, Nos 5/6, 2003 963
groups of 12–15 months and 20–23months, the mother was interviewed ineach health facility. The mother–child pairswere randomly chosen through systematicrandom sample. Thus a total of 1200 moth-er–child pairs were included in the study(60 in each target month of age). Thebreastfeeding indicators were based on thecurrent status data, i.e. the age and otherinformation for the 24 hours preceding theinterview as recommended by WHO [1].Age was ascertained by reviewing the birthcertificate, which was available in the ma-jority of cases.
Data analysisData entry, processing and statistical analy-sis were carried out using SPSS, version9.5. Because exclusive and predominantbreastfeeding rates are mutually exclusive,further analysis was restricted to exclusivebreastfeeding rate. Chi-squared and Fisherexact tests of significance were used tocompare different groups, as appropriate.P ≤ 0.05 was considered to be statisticallysignificant.
Because many co-factors affectingbreastfeeding practices are interrelated, lo-gistic regression analysis was undertakento gain insight into factors associated withthis practice. Factors that were found to besignificant on univariate analysis were in-cluded in the logistic regression model.
ResultsTable 1 shows breastfeeding rates in Da-kahlia governorate. Exclusive and predomi-nant breastfeeding rates were 42.5% and42.1% respectively. As these 2 rates aremutually exclusive, 84.6% of infants werecurrently fully breastfed at the time of theinterview. The timely complementary feed-ing rate was 44.2%. The continued breast-
feeding rates at 1 and 2 years of age were67.9% and 58.8% respectively. The bottle-feeding rate was 35.7%. The time of firstsuckling rate was 28.5% and the everbreastfeeding rate was 92.9%. The causesof never breastfeeding among infants less12 months of age were: no or insufficientmilk (51.0%), breast or nipple problems(27.5%), infant refusing to suck (15.7%),infant’s illness (9.8%) and maternal illness(9.8%).
Table 2 reveals that the exclusivebreastfeeding rate was significantly higheramong infants of rural residence, non-working mothers, less educated mothers,those having low social standards and shortinterpregnancy interval. The timely com-plementary feeding rate was significantlyhigher among infants of urban residence,working mothers, more educated mothers,those of high or middle social standardsand short interpregnancy interval.
Table 3 reveals that the continuedbreastfeeding rate at 1 year was significant-ly higher among rural children, children ofnon-working mothers, those of less edu-cated mothers, low social standards, sec-ond and third parity, long interpregnancyinterval and male infants. The continuedbreastfeeding rate at 2 years was signifi-cantly higher among rural children, chil-dren of non-working mothers, those of lesseducated mothers, low social standards,older age groups and long interpregnancyinterval.
Table 4 shows that the bottle-feedingrate was significantly higher among urbaninfants, those of working mothers, moreeducated mothers, high social standards,younger age groups, primipara and fourthpara or more and long interpregnancy inter-val. The ever breastfeeding rate was sig-nificantly higher among rural infants, thoseof less educated mothers, low social stan-
09 Breast feeding indicators in Dakahlia.pmd 3/3/2005, 12:12 AM963
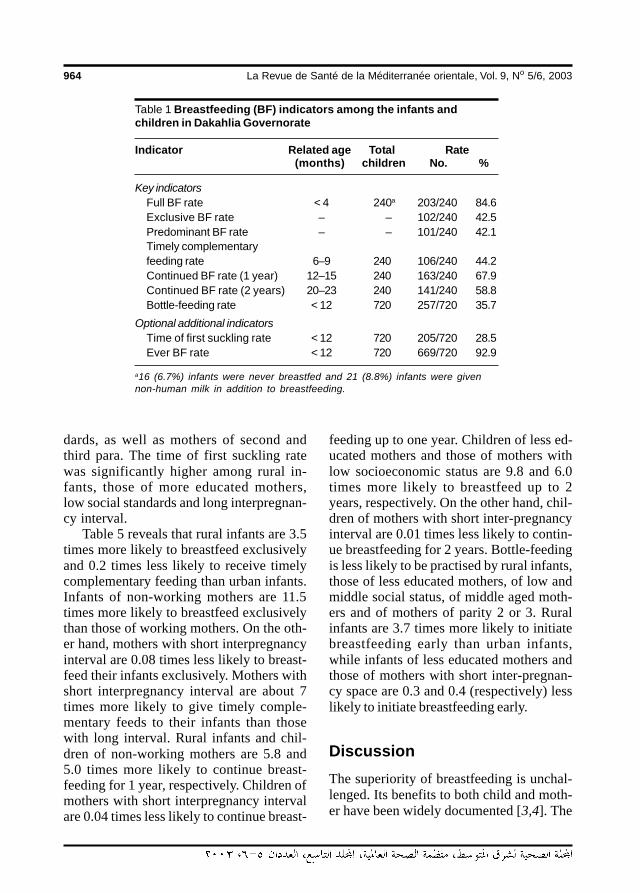
964 La Revue de Santé de la Méditerranée orientale, Vol. 9, No 5/6, 2003
dards, as well as mothers of second andthird para. The time of first suckling ratewas significantly higher among rural in-fants, those of more educated mothers,low social standards and long interpregnan-cy interval.
Table 5 reveals that rural infants are 3.5times more likely to breastfeed exclusivelyand 0.2 times less likely to receive timelycomplementary feeding than urban infants.Infants of non-working mothers are 11.5times more likely to breastfeed exclusivelythan those of working mothers. On the oth-er hand, mothers with short interpregnancyinterval are 0.08 times less likely to breast-feed their infants exclusively. Mothers withshort interpregnancy interval are about 7times more likely to give timely comple-mentary feeds to their infants than thosewith long interval. Rural infants and chil-dren of non-working mothers are 5.8 and5.0 times more likely to continue breast-feeding for 1 year, respectively. Children ofmothers with short interpregnancy intervalare 0.04 times less likely to continue breast-
feeding up to one year. Children of less ed-ucated mothers and those of mothers withlow socioeconomic status are 9.8 and 6.0times more likely to breastfeed up to 2years, respectively. On the other hand, chil-dren of mothers with short inter-pregnancyinterval are 0.01 times less likely to contin-ue breastfeeding for 2 years. Bottle-feedingis less likely to be practised by rural infants,those of less educated mothers, of low andmiddle social status, of middle aged moth-ers and of mothers of parity 2 or 3. Ruralinfants are 3.7 times more likely to initiatebreastfeeding early than urban infants,while infants of less educated mothers andthose of mothers with short inter-pregnan-cy space are 0.3 and 0.4 (respectively) lesslikely to initiate breastfeeding early.
DiscussionThe superiority of breastfeeding is unchal-lenged. Its benefits to both child and moth-er have been widely documented [3,4]. The
Table 1 Breastfeeding (BF) indicators among the infants andchildren in Dakahlia Governorate
Indicator Related age Total Rate(months) children No. %
Key indicatorsFull BF rate < 4 240a 203/240 84.6Exclusive BF rate – – 102/240 42.5Predominant BF rate – – 101/240 42.1Timely complementaryfeeding rate 6–9 240 106/240 44.2Continued BF rate (1 year) 12–15 240 163/240 67.9Continued BF rate (2 years) 20–23 240 141/240 58.8Bottle-feeding rate < 12 720 257/720 35.7
Optional additional indicatorsTime of first suckling rate < 12 720 205/720 28.5Ever BF rate < 12 720 669/720 92.9
a16 (6.7%) infants were never breastfed and 21 (8.8%) infants were givennon-human milk in addition to breastfeeding.
09 Breast feeding indicators in Dakahlia.pmd 3/3/2005, 12:12 AM964
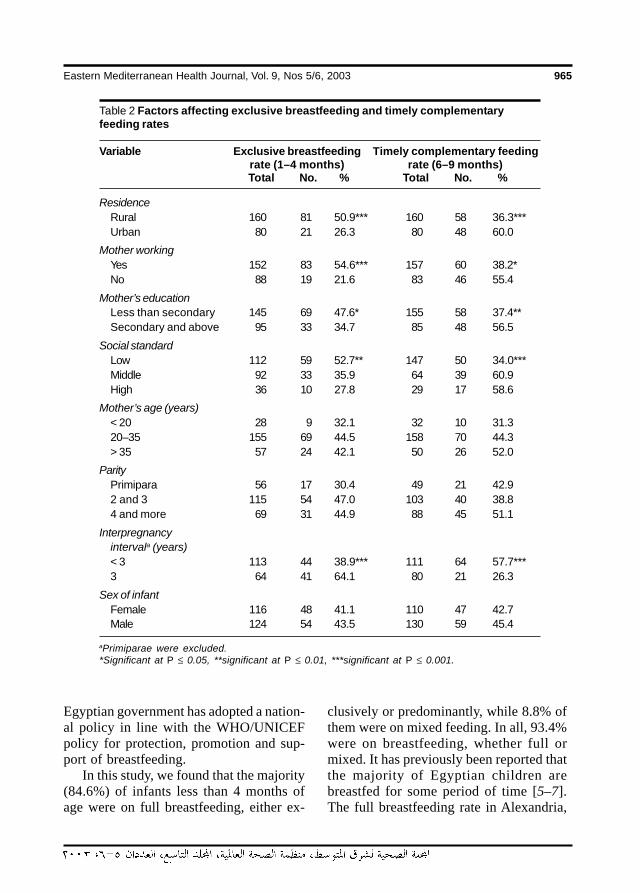
Eastern Mediterranean Health Journal, Vol. 9, Nos 5/6, 2003 965
Egyptian government has adopted a nation-al policy in line with the WHO/UNICEFpolicy for protection, promotion and sup-port of breastfeeding.
In this study, we found that the majority(84.6%) of infants less than 4 months ofage were on full breastfeeding, either ex-
clusively or predominantly, while 8.8% ofthem were on mixed feeding. In all, 93.4%were on breastfeeding, whether full ormixed. It has previously been reported thatthe majority of Egyptian children arebreastfed for some period of time [5–7].The full breastfeeding rate in Alexandria,
Table 2 Factors affecting exclusive breastfeeding and timely complementaryfeeding rates
Variable Exclusive breastfeeding Timely complementary feedingrate (1–4 months) rate (6–9 months)Total No. % Total No. %
ResidenceRural 160 81 50.9*** 160 58 36.3***Urban 80 21 26.3 80 48 60.0
Mother workingYes 152 83 54.6*** 157 60 38.2*No 88 19 21.6 83 46 55.4
Mother’s educationLess than secondary 145 69 47.6* 155 58 37.4**Secondary and above 95 33 34.7 85 48 56.5
Social standardLow 112 59 52.7** 147 50 34.0***Middle 92 33 35.9 64 39 60.9High 36 10 27.8 29 17 58.6
Mother’s age (years)< 20 28 9 32.1 32 10 31.320–35 155 69 44.5 158 70 44.3> 35 57 24 42.1 50 26 52.0
ParityPrimipara 56 17 30.4 49 21 42.92 and 3 115 54 47.0 103 40 38.84 and more 69 31 44.9 88 45 51.1
Interpregnancyintervala (years)< 3 113 44 38.9*** 111 64 57.7***3 64 41 64.1 80 21 26.3
Sex of infantFemale 116 48 41.1 110 47 42.7Male 124 54 43.5 130 59 45.4
aPrimiparae were excluded.*Significant at P ≤ 0.05, **significant at P ≤ 0.01, ***significant at P ≤ 0.001.
09 Breast feeding indicators in Dakahlia.pmd 3/3/2005, 12:12 AM965
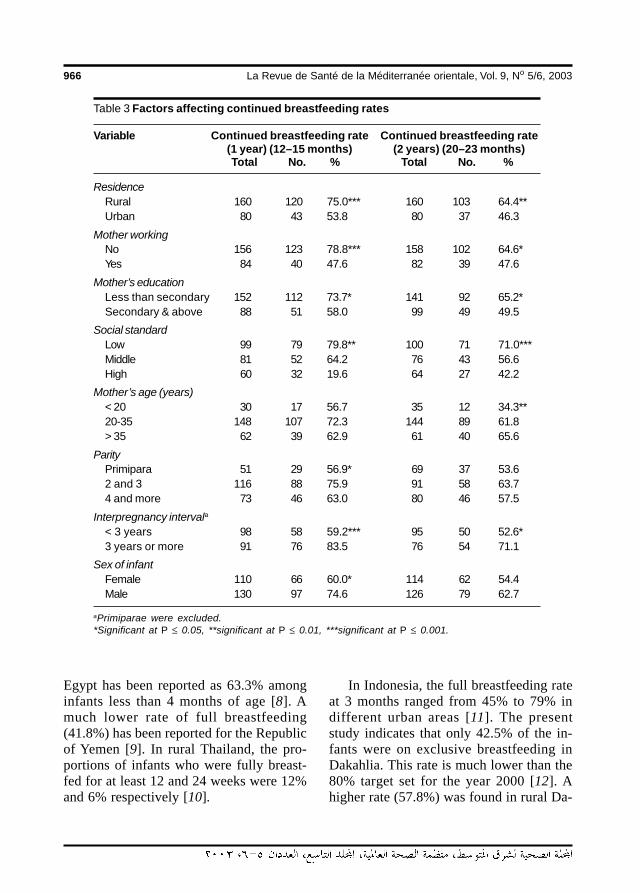
966 La Revue de Santé de la Méditerranée orientale, Vol. 9, No 5/6, 2003
Egypt has been reported as 63.3% amonginfants less than 4 months of age [8]. Amuch lower rate of full breastfeeding(41.8%) has been reported for the Republicof Yemen [9]. In rural Thailand, the pro-portions of infants who were fully breast-fed for at least 12 and 24 weeks were 12%and 6% respectively [10].
In Indonesia, the full breastfeeding rateat 3 months ranged from 45% to 79% indifferent urban areas [11]. The presentstudy indicates that only 42.5% of the in-fants were on exclusive breastfeeding inDakahlia. This rate is much lower than the80% target set for the year 2000 [12]. Ahigher rate (57.8%) was found in rural Da-
Table 3 Factors affecting continued breastfeeding rates
Variable Continued breastfeeding rate Continued breastfeeding rate(1 year) (12–15 months) (2 years) (20–23 months)Total No. % Total No. %
ResidenceRural 160 120 75.0*** 160 103 64.4**Urban 80 43 53.8 80 37 46.3
Mother workingNo 156 123 78.8*** 158 102 64.6*Yes 84 40 47.6 82 39 47.6
Mother’s educationLess than secondary 152 112 73.7* 141 92 65.2*Secondary & above 88 51 58.0 99 49 49.5
Social standardLow 99 79 79.8** 100 71 71.0***Middle 81 52 64.2 76 43 56.6High 60 32 19.6 64 27 42.2
Mother’s age (years)< 20 30 17 56.7 35 12 34.3**20-35 148 107 72.3 144 89 61.8> 35 62 39 62.9 61 40 65.6
ParityPrimipara 51 29 56.9* 69 37 53.62 and 3 116 88 75.9 91 58 63.74 and more 73 46 63.0 80 46 57.5
Interpregnancy intervala< 3 years 98 58 59.2*** 95 50 52.6*3 years or more 91 76 83.5 76 54 71.1
Sex of infantFemale 110 66 60.0* 114 62 54.4Male 130 97 74.6 126 79 62.7
aPrimiparae were excluded.*Significant at P ≤ 0.05, **significant at P ≤ 0.01, ***significant at P ≤ 0.001.
09 Breast feeding indicators in Dakahlia.pmd 3/3/2005, 12:12 AM966
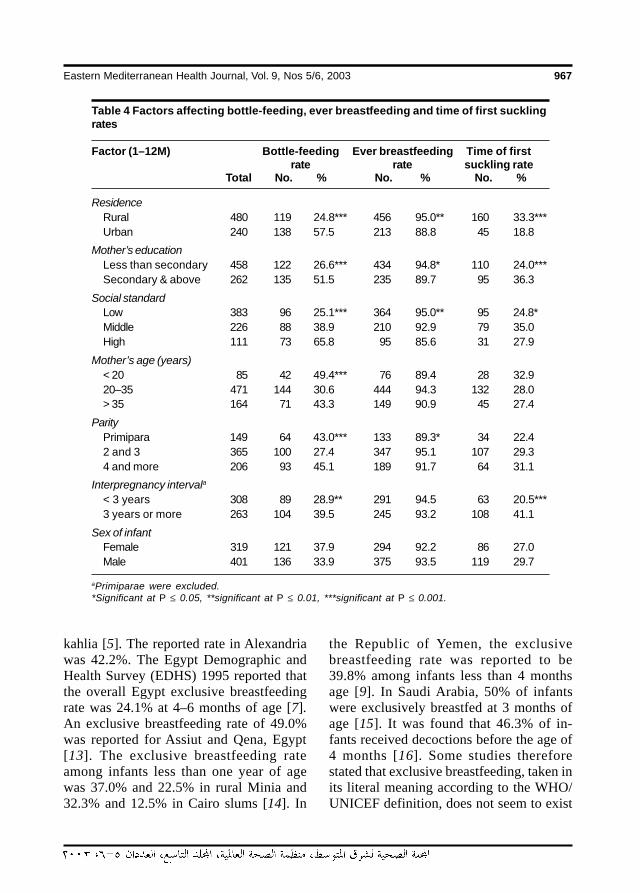
Eastern Mediterranean Health Journal, Vol. 9, Nos 5/6, 2003 967
kahlia [5]. The reported rate in Alexandriawas 42.2%. The Egypt Demographic andHealth Survey (EDHS) 1995 reported thatthe overall Egypt exclusive breastfeedingrate was 24.1% at 4–6 months of age [7].An exclusive breastfeeding rate of 49.0%was reported for Assiut and Qena, Egypt[13]. The exclusive breastfeeding rateamong infants less than one year of agewas 37.0% and 22.5% in rural Minia and32.3% and 12.5% in Cairo slums [14]. In
the Republic of Yemen, the exclusivebreastfeeding rate was reported to be39.8% among infants less than 4 monthsage [9]. In Saudi Arabia, 50% of infantswere exclusively breastfed at 3 months ofage [15]. It was found that 46.3% of in-fants received decoctions before the age of4 months [16]. Some studies thereforestated that exclusive breastfeeding, taken inits literal meaning according to the WHO/UNICEF definition, does not seem to exist
Table 4 Factors affecting bottle-feeding, ever breastfeeding and time of first sucklingrates
Factor (1–12M) Bottle-feeding Ever breastfeeding Time of firstrate rate suckling rate
Total No. % No. % No. %
ResidenceRural 480 119 24.8*** 456 95.0** 160 33.3***Urban 240 138 57.5 213 88.8 45 18.8
Mother’s educationLess than secondary 458 122 26.6*** 434 94.8* 110 24.0***Secondary & above 262 135 51.5 235 89.7 95 36.3
Social standardLow 383 96 25.1*** 364 95.0** 95 24.8*Middle 226 88 38.9 210 92.9 79 35.0High 111 73 65.8 95 85.6 31 27.9
Mother’s age (years)< 20 85 42 49.4*** 76 89.4 28 32.920–35 471 144 30.6 444 94.3 132 28.0> 35 164 71 43.3 149 90.9 45 27.4
ParityPrimipara 149 64 43.0*** 133 89.3* 34 22.42 and 3 365 100 27.4 347 95.1 107 29.34 and more 206 93 45.1 189 91.7 64 31.1
Interpregnancy intervala< 3 years 308 89 28.9** 291 94.5 63 20.5***3 years or more 263 104 39.5 245 93.2 108 41.1
Sex of infantFemale 319 121 37.9 294 92.2 86 27.0Male 401 136 33.9 375 93.5 119 29.7
aPrimiparae were excluded.*Significant at P ≤ 0.05, **significant at P ≤ 0.01, ***significant at P ≤ 0.001.
09 Breast feeding indicators in Dakahlia.pmd 3/3/2005, 12:12 AM967
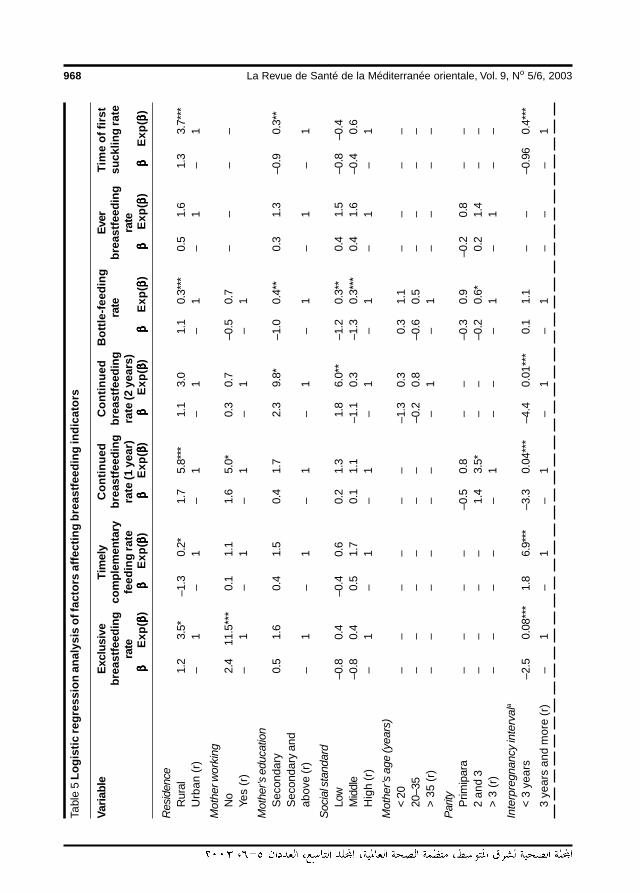
968 La Revue de Santé de la Méditerranée orientale, Vol. 9, No 5/6, 2003Ta
ble
5 Lo
gist
ic re
gres
sion
ana
lysi
s of
fact
ors
affe
ctin
g br
east
feed
ing
indi
cato
rs
Varia
ble
Excl
usiv
eTi
mel
yC
ontin
ued
Con
tinue
dB
ottle
-feed
ing
Ever
Tim
e of
firs
tbr
east
feed
ing
com
plem
enta
rybr
east
feed
ing
brea
stfe
edin
gra
tebr
east
feed
ing
suck
ling
rate
rate
feed
ing
rate
rate
(1 y
ear)
rate
(2 y
ears
)ra
teββββ β
Exp(
ββββ β)ββββ β
Exp(
ββββ β)ββββ β
Exp(
ββββ β)ββββ β
Exp(
ββββ β)ββββ β
Exp(
ββββ β)ββββ β
Exp(
ββββ β)ββββ β
Exp(
ββββ β)
Res
iden
ceR
ural
1.2
3.5*
–1.3
0.2*
1.7
5.8*
**1.
13.
01.
10.
3***
0.5
1.6
1.3
3.7*
**U
rban
(r)
–1
–1
–1
–1
–1
–1
–1
Mot
her w
orki
ngN
o2.
411
.5**
*0.
11.
11.
65.
0*0.
30.
7–0
.50.
7–
––
–Ye
s (r
)–
1–
1–
1–
1–
1
Mot
her’s
edu
catio
nS
econ
dary
0.5
1.6
0.4
1.5
0.4
1.7
2.3
9.8*
–1.0
0.4*
*0.
31.
3–0
.90.
3**
Sec
onda
ry a
ndab
ove
(r)
–1
–1
–1
–1
–1
–1
–1
Soci
al s
tand
ard
Low
–0.8
0.4
–0.4
0.6
0.2
1.3
1.8
6.0*
*–1
.20.
3**
0.4
1.5
–0.8
–0.4
Mid
dle
–0.8
0.4
0.5
1.7
0.1
1.1
–1.1
0.3
–1.3
0.3*
**0.
41.
6–0
.40.
6H
igh
(r)
–1
–1
–1
–1
–1
–1
–1
Mot
her’s
age
(yea
rs)
< 20
––
––
––
–1.3
0.3
0.3
1.1
––
––
20–3
5–
––
––
––0
.20.
8–0
.60.
5–
––
–>
35
(r)
––
––
––
–1
–1
––
––
Parit
yP
rimip
ara
––
––
–0.5
0.8
––
–0.3
0.9
–0.2
0.8
––
2 an
d 3
––
––
1.4
3.5*
––
–0.2
0.6*
0.2
1.4
––
> 3
(r)
––
––
–1
––
–1
–1
––
Inte
rpre
gnan
cy in
terv
ala
< 3
yea
rs–2
.50.
08**
*1.
86.
9***
–3.3
0.04
***
–4.4
0.01
***
0.1
1.1
––
–0.9
60.
4***
3 ye
ars
and
mor
e (r
)–
1–
1–
1–
1–
1–
––
1
09 Breast feeding indicators in Dakahlia.pmd 3/3/2005, 12:12 AM968
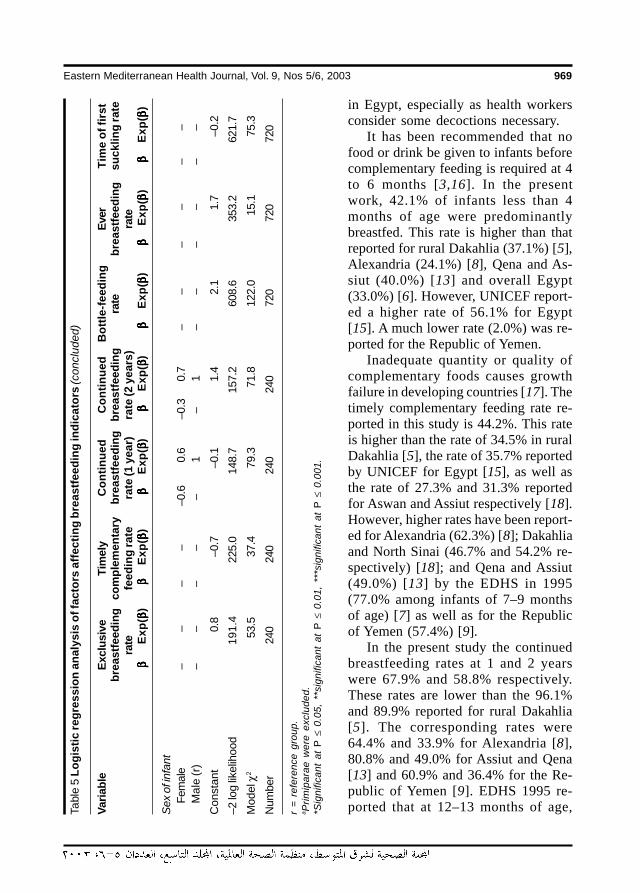
Eastern Mediterranean Health Journal, Vol. 9, Nos 5/6, 2003 969
in Egypt, especially as health workersconsider some decoctions necessary.
It has been recommended that nofood or drink be given to infants beforecomplementary feeding is required at 4to 6 months [3,16]. In the presentwork, 42.1% of infants less than 4months of age were predominantlybreastfed. This rate is higher than thatreported for rural Dakahlia (37.1%) [5],Alexandria (24.1%) [8], Qena and As-siut (40.0%) [13] and overall Egypt(33.0%) [6]. However, UNICEF report-ed a higher rate of 56.1% for Egypt[15]. A much lower rate (2.0%) was re-ported for the Republic of Yemen.
Inadequate quantity or quality ofcomplementary foods causes growthfailure in developing countries [17]. Thetimely complementary feeding rate re-ported in this study is 44.2%. This rateis higher than the rate of 34.5% in ruralDakahlia [5], the rate of 35.7% reportedby UNICEF for Egypt [15], as well asthe rate of 27.3% and 31.3% reportedfor Aswan and Assiut respectively [18].However, higher rates have been report-ed for Alexandria (62.3%) [8]; Dakahliaand North Sinai (46.7% and 54.2% re-spectively) [18]; and Qena and Assiut(49.0%) [13] by the EDHS in 1995(77.0% among infants of 7–9 monthsof age) [7] as well as for the Republicof Yemen (57.4%) [9].
In the present study the continuedbreastfeeding rates at 1 and 2 yearswere 67.9% and 58.8% respectively.These rates are lower than the 96.1%and 89.9% reported for rural Dakahlia[5]. The corresponding rates were64.4% and 33.9% for Alexandria [8],80.8% and 49.0% for Assiut and Qena[13] and 60.9% and 36.4% for the Re-public of Yemen [9]. EDHS 1995 re-ported that at 12–13 months of age,Ta
ble
5 Lo
gist
ic re
gres
sion
ana
lysi
s of
fact
ors
affe
ctin
g br
east
feed
ing
indi
cato
rs (c
oncl
uded
)
Varia
ble
Excl
usiv
eTi
mel
yC
ontin
ued
Con
tinue
dB
ottle
-feed
ing
Ever
Tim
e of
firs
tbr
east
feed
ing
com
plem
enta
rybr
east
feed
ing
brea
stfe
edin
gra
tebr
east
feed
ing
suck
ling
rate
rate
feed
ing
rate
rate
(1 y
ear)
rate
(2 y
ears
)ra
teββββ β
Exp(
ββββ β)ββββ β
Exp(
ββββ β)ββββ β
Exp(
ββββ β)ββββ β
Exp(
ββββ β)ββββ β
Exp(
ββββ β)ββββ β
Exp(
ββββ β)ββββ β
Exp(
ββββ β)
Sex
of in
fant
Fem
ale
––
––
–0.6
0.6
–0.3
0.7
––
––
––
Mal
e (r
)–
––
––
1–
1–
––
––
–
Con
stan
t0.
8–0
.7–0
.11.
42.
11.
7–0
.2
–2 lo
g lik
elih
ood
191
.422
5.0
148.
715
7.2
608.
635
3.2
621.
7
Mod
el χ
253
.537
.479
.371
.812
2.0
15.1
75.3
Num
ber
240
240
240
240
720
720
720
r =
refe
renc
e gr
oup.
a Prim
ipar
ae w
ere
excl
uded
.*S
igni
fican
t at
P ≤
0.0
5, *
*sig
nific
ant
at P
≤ 0
.01,
***
sign
ifica
nt a
t P
≤ 0
.001
.
09 Breast feeding indicators in Dakahlia.pmd 3/3/2005, 12:12 AM969
970 La Revue de Santé de la Méditerranée orientale, Vol. 9, No 5/6, 2003
79% of children are still being breastfedand more than half of children aged 18–19months continue to be breastfed [7]. InDakahlia, 20.0% and 53.3% of mothersstopped breastfeeding at 12–18 months and18–24 months respectively [18]. Dandashet al. reported that only 20.4% and 4.6% ofmothers breastfed their babies for morethan 12 and 24 months respectively [19].
Mothers should be encouraged to use acup and spoon for feeding rather than bot-tles because of the interference of bottleswith optimal breastfeeding practices [6,8].This study revealed that the bottle-feedingrate among infants less than 1 year was35.7%. This is higher than the rate of 27%reported for rural Dakahlia [5], the rate of25.6% reported by UNICEF for Egypt [15]and 25.1% for the Republic of Yemen [9].EDHS 1992 reported that nearly one-fifthof breastfed infants less than 8 months ofage were given the bottle with nipple [6].However, higher bottle-feeding rates werereported by Kamel et al. for Alexandria(44.3%) [8] and by the Egyptian Maternaland Child Health Survey (EMCHS) for ur-ban governorates (42%) [20].
Early suckling enhances lactation andencourages the psychological bonding be-tween mother and baby [21]. In manycountries there is a delay in initiation ofbreastfeeding until the second or third dayafter birth [22]. The present work revealedthat 28.5% of infants less than 12 monthsof age started breastfeeding within an hourof birth. EDHS 1995 reported that 40% ofchildren who were ever breastfed were putto the breast within an hour of delivery [7].In the Republic of Yemen, none of the in-fants less than 12 months of age startedsuckling within the first hour of birth [9].UNICEF in Egypt reported that in normaldeliveries, 20.3% and 35.3% of infantsbreastfeed within one half and 1–2 hours ofbirth respectively [15]. In Dakahlia, 69.7%
of infants started breastfeeding within 2hours of birth [23]. Saker reported that82% of Egyptian women believe that thebest time for starting breastfeeding is onthe third day after delivery [24]. Avoidanceof breastfeeding in the first three days ofbirth was practised in Aswan (59.4%), As-siut (57.7%) and Dakahlia (56.2%) [25]. Inmany countries, it is believed that colos-trum is unfit for the newborn. Therefore,mothers express it and throw it away untilthe “true” milk appears on the third day af-ter birth [26].
In this work, the ever breastfeeding ratewas 92.9% among infants less than 12months of age. This means that 7.1% ofthe infants were never breastfed. This fig-ure is comparable to the 5.7% to 7.3%rates reported for Dakahlia [5,23,27]. Thefrequency of never breastfeeding was2.5% in rural Thailand [10], 6%–19% inIndonesia [11] and 7%–11% in the Philip-pines [28]. The causes of never breastfeed-ing were comparable to those reportedfrom other studies [5,27,28,29].
The impact of different factors onbreastfeeding indicators was studied. Fac-tors found to have a significant effect onunivariate analysis were entered into multi-variate analysis. By logistic regression, itwas found that rural mothers are 3.5 timesmore likely to breastfeed exclusively, 5.8times more likely to continue breastfeedingfor 1 year and 3.7 times more likely to startbreastfeeding within one hour of deliverythan urban mothers. On the other hand,they are 0.2 times less likely to give timelycomplementary feeding than urban moth-ers.
This study revealed that maternal workoutside the home has a profound impact onthe exclusive breastfeeding rate and thecontinued breastfeeding rate for 1 year.Non-working mothers are 11.5 times morelikely to breastfeed exclusively and 5.0
09 Breast feeding indicators in Dakahlia.pmd 3/3/2005, 12:12 AM970
Eastern Mediterranean Health Journal, Vol. 9, Nos 5/6, 2003 971
times more likely to continue breastfeedingfor 1 year. A meta-analysis of 30 Egyptianstudies showed that working mothers tendto shift earlier than non-working mothersfrom exclusive breastfeeding to mixed(breast and formula) feeding. Earlier termi-nation of breastfeeding was also morecommon among working mothers. Thissuggests that maternal work is not the keydeterminant of infant feeding practices, andthat the local and temporal norms may bethe main factors determining infant feedingpractices. The reasons for successfulbreastfeeding are thought to be influencedby psychological, social and economic fac-tors [19,30,31]. El-Masry reported thatmaternal work has insignificant effect onever breastfeeding and continued breast-feeding for 1 and 2 years [32]. However,the exclusive breastfeeding rate was signif-icantly lower, while the timely complemen-tary feeding and bottle-feeding rates weresignificantly higher among working thannon-working mothers. In Egypt, all work-ing mothers receive only 3 months fullypaid maternal leave [19].
Less-educated mothers are 9.8 timesmore likely to continue breastfeeding for 1year, 0.4 times less likely to use bottle-feeding and 0.3 times less likely to startbreastfeeding at the proper time.
Mothers of low socioeconomic stan-dard are 6 times more likely to continuebreastfeeding for 2 years than those of highsocioeconomic standard. Also, mothers oflow and middle standard are 0.3 times lesslikely to use the bottle for infant feedingthan those of high standard. Mothers aged20–35 years and those with 2 and 3 chil-dren are 0.3 times less likely to use bottle-
feeding than older mothers and motherswith higher parity. Mothers of 2 and 3 paraare 3.5 times more likely to continuebreastfeeding for 1 year than mothers withhigher parity. Early initiation of breastfeed-ing has been reported to be significantlymore common among older mothers andmothers with 2 and 3 para [23].
Short interpregnancy interval has a neg-ative impact on most of the breastfeedingindicators. Mothers with short spacing (in-terval less than 3 years) are 0.08 times lesslikely to breastfeed exclusively up to theage of 4 months, 0.04 and 0.01 times lesslikely to continue breastfeeding for 1 and 2years, and 0.4 times less likely to startbreastfeeding early than mothers with ade-quate birth spacing. On the other hand,non-spacers are about 7 times more likelyto introduce complementary feeding at 6–9months of age.
To promote breastfeeding in our soci-ety, it is recommended that efforts be di-rected towards the appropriate targetgroups, such as working mothers, urbanmothers, non-spacers and more educatedmothers. Religious quotations that favourand emphasize the importance of providingbreast milk to infants should be used in ed-ucation campaigns to counteract the incor-rect beliefs that interfere with breast-feeding. The Quranic prescription tobreastfeed for 2 years has been found to begreatly honoured by the majority of moth-ers [18]. Family planning with adequatepregnancy spacing will also have a positiveimpact on breastfeeding practices. Finally,work legislation that extends the durationof fully paid maternity leave needs to beconsidered.
09 Breast feeding indicators in Dakahlia.pmd 3/3/2005, 12:12 AM971
972 La Revue de Santé de la Méditerranée orientale, Vol. 9, No 5/6, 2003
References
1. Indicators for assessing breast-feedingpractices: report of an informal meeting,11–12 June 1991, Geneva, Switzerland.Geneva, World Health Organization,1991:14.
2. Fahmy SI, El-Sherbini AF. Determiningsimple parameters for social classifica-tions for health research. Bulletin of theHigh Institute of Public Health, 1983,13(5):95–108.
3. Breastfeeding practice. Facts for actionfor health professionals. Baby andMother Friendly Hospital Initiative. Cairo,Egypt, Ministry of Health and Population,1993.
4. Breastfeeding and the use of humanmilk. American Academy of Pediatrics.Work Group on Breastfeeding. Pediat-rics, 1997, 6:1035–39.
5. Al-Gilany A, Settin AS. Standardized in-dicators of breast-feeding in ruralDakahlia, Egypt: possible influencingmaternal and sociobiological factors.Egyptian journal of paediatrics, 1997,14(1&2):117–28.
6. Egyptian Demographic and Health Sur-vey 1992. Cairo, National PopulationCouncil and Maryland, Macro Interna-tional Incorporated, 1993.
7. Egyptian Demographic and Health Sur-vey 1995. Cairo, National PopulationCouncil and Maryland, Macro Interna-tional Incorporated, 1996.
8. Kamel NM et al. Current status ofbreastfeeding in Alexandria governor-ate: a community-based study. EasternMediterranean health journal, 1997,3(3):511–18.
9. Abuluhum TS et al. Breastfeeding prac-tice in Dammar, Republic of Yemen [Let-ter to the Editor]. Middle East paediatrics,1999, 4(1):11–13.
10. Kamnuansilpa P, Knodel J. Mortality,health and infant feeding practices in theNortheast of Thailand. Methodologicalissues and substantive results. Bangkok,National Institute of Development Ad-ministration, 1985.
11. Hull VJ et al. Breast-feeding and healthprofessionals: a study in hospitals in In-donesia. Social science & medicine,1989, 28(4):355–64.
12. National achievements and challenges.Mid-decade goals, Cairo, Egypt, Ministryof Local Administration and United Na-tions Children’s Fund, 1996.
13. Combined Control of Diarrheal Dis-eases and Acute Respiratory InfectionsHousehold Survey (CCDD/ARI). Cairo,Egypt, Ministry of Health and Population,1996.
14. Hegazy IS et al. Maternal health profile. Acomparative study between rural Miniaand Cairo slums 1997. Egyptian journalof community medicine, 1999, 17(1):57–65.
15. Pre- and post-implementation. Multi-center Baby Friendly Hospital Initiative(BFHI) studies in Egypt, Cairo, Egypt,United Nations Children’s Fund, 1993.
16. Feachem RG, Koblinsky MA. Interven-tions for the control of diarrhoeal dis-eases among young children: promotionof breastfeeding. Bulletin of the WorldHealth Organization, 1984, 62(2):271–91.
17. Rivera J, Martorel LR. Nutrition, infectionand growth. Part I. Effects of infection ongrowth. Clinical nutrition, 1998, 7:156–62.
18. Hassanyn SAM. Complementary feed-ing and weaning practices in four gover-norates in Egypt. Eastern Mediterraneanhealth journal. 1998, 4(1):173–7.
09 Breast feeding indicators in Dakahlia.pmd 3/3/2005, 12:12 AM972
Eastern Mediterranean Health Journal, Vol. 9, Nos 5/6, 2003 973
19. Dandash BK et al. Factors associatedwith duration of breast-feeding practice.Egyptian journal of community medi-cine, 1993, 11(1):19–26.
20. Abdel-Azeem F et al. Breast-feeding andweaning practices. Egyptian Maternaland Child Health Survey (EMCHS)1991, Cairo, Egypt, Pan Arab Project forChild Development, League of ArabStates, 1991.
21. Labbok MH, Krasovec K, eds. Guide-lines for breast-feeding in child survivaland family programs. Washington DC,Georgetown University, InternationalStudies in Natural Family Planning,1989.
22. Green CP. Media promotion of breast-feeding. A decade experience. Washing-ton DC, Academy for EducationalDevelopment, 1989:33.
23. Abdel-Wahab F et al. Factors affectingbreast-feeding initiation. Egyptian jour-nal of community medicine, 1993, 11(1):9–17.
24. Saker E. KAP. Study in rural Egypt aboutbreastfeeding. Fertility care bulletin,1984, 22–23:9.
25. Hassanyn SA. Beliefs and practices as-sociated with breast-feeding. Bulletin ofthe Nutrition Institute, 1995, 15(1):1–6.
26. Fishman C et al. Warm bodies, cool milk:conflicts in post-partum food choice for
Indochinese women in California. Socialscience & medicine, 1988, 26:1125–32.
27. Khafagy MN. Study on breastfeeding[MSc Thesis in Public Health]. Mansoura,Egypt, Faculty of Medicine, University ofMansoura, 1990.
28. Williamson NE. Breast-feeding trendsand the breast-feeding program in thePhilippines. International journal ofgynaeco-logy and obstetrics, 1990,31(suppl.):35–41.
29. Al-Sekait M. A study of the factors influ-encing breast-feeding pattern in SaudiArabia. Saudi medical journal, 1988,9:596.
30. El-Sayed HF, Waheeb Y, Mehana S.Breast-feeding among working mothersin Egypt. A systemic review of the litera-ture. San Diego, WellStart International:1–62.
31. Simopolous AP, Gave GD. Factors asso-ciated with the choice and duration of in-fant feeding practice. Pediatrics, 1984,74(suppl.):603-–14.
32. El-Masry RSA. Breastfeeding and mater-nal employment in the University ofMansoura [MSc Thesis in Public Health].Mansoura, Egypt, Faculty of Medicine,University of Mansoura, 2000.
09 Breast feeding indicators in Dakahlia.pmd 3/3/2005, 12:12 AM973
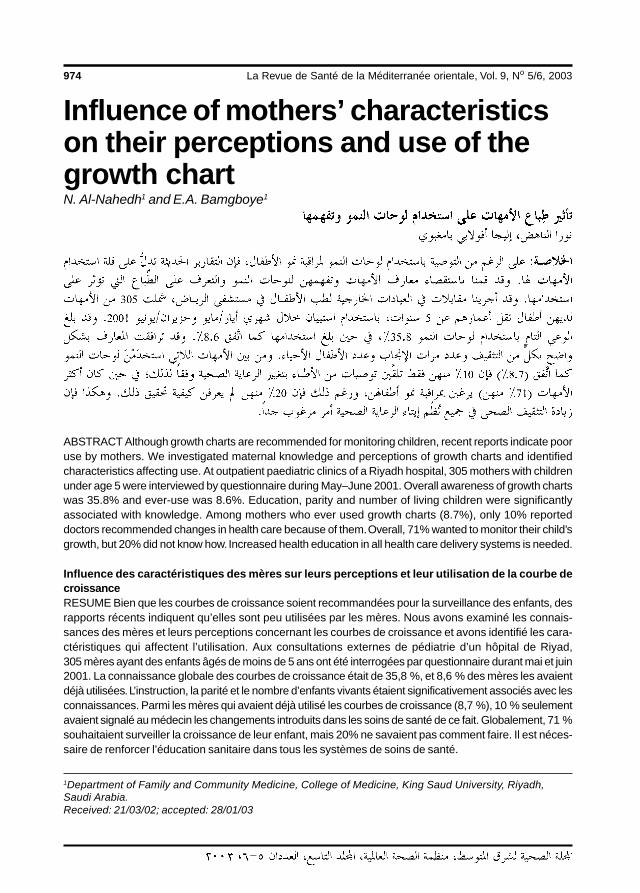
974 La Revue de Santé de la Méditerranée orientale, Vol. 9, No 5/6, 2003
Influence of mothers’ characteristicson their perceptions and use of thegrowth chartN. Al-Nahedh1 and E.A. Bamgboye1
1Department of Family and Community Medicine, College of Medicine, King Saud University, Riyadh,Saudi Arabia.Received: 21/03/02; accepted: 28/01/03
ABSTRACT Although growth charts are recommended for monitoring children, recent reports indicate pooruse by mothers. We investigated maternal knowledge and perceptions of growth charts and identifiedcharacteristics affecting use. At outpatient paediatric clinics of a Riyadh hospital, 305 mothers with childrenunder age 5 were interviewed by questionnaire during May–June 2001. Overall awareness of growth chartswas 35.8% and ever-use was 8.6%. Education, parity and number of living children were significantlyassociated with knowledge. Among mothers who ever used growth charts (8.7%), only 10% reporteddoctors recommended changes in health care because of them. Overall, 71% wanted to monitor their child’sgrowth, but 20% did not know how. Increased health education in all health care delivery systems is needed.
Influence des caractéristiques des mères sur leurs perceptions et leur utilisation de la courbe decroissanceRESUME Bien que les courbes de croissance soient recommandées pour la surveillance des enfants, desrapports récents indiquent qu’elles sont peu utilisées par les mères. Nous avons examiné les connais-sances des mères et leurs perceptions concernant les courbes de croissance et avons identifié les cara-ctéristiques qui affectent l’utilisation. Aux consultations externes de pédiatrie d’un hôpital de Riyad,305 mères ayant des enfants âgés de moins de 5 ans ont été interrogées par questionnaire durant mai et juin2001. La connaissance globale des courbes de croissance était de 35,8 %, et 8,6 % des mères les avaientdéjà utilisées. L’instruction, la parité et le nombre d’enfants vivants étaient significativement associés avec lesconnaissances. Parmi les mères qui avaient déjà utilisé les courbes de croissance (8,7 %), 10 % seulementavaient signalé au médecin les changements introduits dans les soins de santé de ce fait. Globalement, 71 %souhaitaient surveiller la croissance de leur enfant, mais 20% ne savaient pas comment faire. Il est néces-saire de renforcer l’éducation sanitaire dans tous les systèmes de soins de santé.
10 Influence of mothers� characteristics.pmd 3/3/2005, 12:12 AM974
Eastern Mediterranean Health Journal, Vol. 9, Nos 5/6, 2003 975
IntroductionAdverse changes in anthropometric mea-surements are indicators of childhood mor-bidity. Reference growth charts havetherefore been assembled and the WorldHealth Organization has recommendedtheir use for the close monitoring of chil-dren’s growth [1,2]. Studies of childhoodgrowth have revealed that early detectionof faltering growth is valuable as it facili-tates quick intervention by mothers anddoctors through better health care and ap-propriate nutritional changes [2].
The availability of this tool does not au-tomatically translate to its use. Knowledgeof its meaning and usefulness and its ac-ceptance by the mothers who are directlyin charge of childcare is necessary. Wideuse of the growth chart suggests thatmothers accept full responsibility for theirchildren’s care [3].
Many specific factors could be determi-nants of growth chart use. In Nigeria, forexample, maternal age, education and pari-ty were significantly influential factors ingrowth chart use [4].
Saudi Arabian health authorities areaware of the benefits of the successful im-plementation of a growth-monitoring pro-gramme. Accordingly, this concept wasintroduced in all primary health care (PHC)centres in the country in the last 10 years.Each child has a health booklet that is keptwith the mother and a growth chart kept inthe family’s health folder in the PHC centre[5]. Recent reports, however, have indicat-ed very poor use of the growth charts. Thereasons for this are not fully understoodand so remain a subject of interest to allmaternal and child health workers [6].
Against this background our study wascarried out with the main objectives of de-termining the level of knowledge and theperceptions of mothers about the growth
charts and identifying maternal characteris-tics affecting use.
MethodsThe study took place in the paediatric out-patient clinics of a teaching hospital in Riy-adh, Saudi Arabia. For 6 weeks (May–June2001) a structured questionnaire was com-pleted for every third mother attendingthese clinics if her youngest child was agedless than 5 years. The items of informationin the questionnaire included demographiccharacteristics of the mother, fertility his-tory, anthropometric characteristics of theindex child under 5 years, knowledge andawareness of growth charts, use of growthcharts by mothers and doctors, effects ofthe use of growth charts on child care andthe frequency of the child’s admission tohospital. The questionnaire was pre-codedand trained research assistants conductedinterviews with the mothers and recordedthe information. Clarification of the term‘growth chart’ was provided for those whoneeded it as ‘child growth tables’ (as theyare called in Arabic) in which a doctorrecords a child’s weight at each visit to seeif the child is growing as he or she should.
Data was analysed with SPSS version10 to produce frequency distributions of allvariables. Descriptive statistics were usedfor qualitative and quantitative variables.Mothers’ characteristics were cross-tabu-lated with maternal knowledge and percep-tion of growth charts. Chi-squared testwas used to investigate the significance ofassociations between any 2 categoricalvariables.
ResultsData collection was completed for 305mothers during the study period. Table 1
10 Influence of mothers� characteristics.pmd 3/3/2005, 12:12 AM975
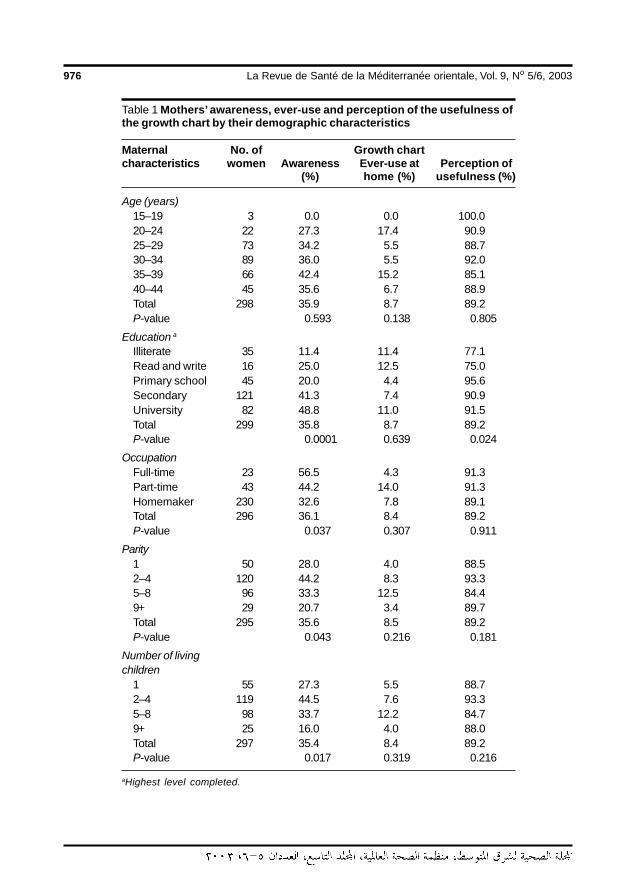
976 La Revue de Santé de la Méditerranée orientale, Vol. 9, No 5/6, 2003
Table 1 Mothers’ awareness, ever-use and perception of the usefulness ofthe growth chart by their demographic characteristics
Maternal No. of Growth chartcharacteristics women Awareness Ever-use at Perception of
(%) home (%) usefulness (%)
Age (years)15–19 3 0.0 0.0 100.020–24 22 27.3 17.4 90.925–29 73 34.2 5.5 88.730–34 89 36.0 5.5 92.035–39 66 42.4 15.2 85.140–44 45 35.6 6.7 88.9Total 298 35.9 8.7 89.2P-value 0.593 0.138 0.805
Education aIlliterate 35 11.4 11.4 77.1Read and write 16 25.0 12.5 75.0Primary school 45 20.0 4.4 95.6Secondary 121 41.3 7.4 90.9University 82 48.8 11.0 91.5Total 299 35.8 8.7 89.2P-value 0.0001 0.639 0.024
OccupationFull-time 23 56.5 4.3 91.3Part-time 43 44.2 14.0 91.3Homemaker 230 32.6 7.8 89.1Total 296 36.1 8.4 89.2P-value 0.037 0.307 0.911
Parity1 50 28.0 4.0 88.52–4 120 44.2 8.3 93.35–8 96 33.3 12.5 84.49+ 29 20.7 3.4 89.7Total 295 35.6 8.5 89.2P-value 0.043 0.216 0.181
Number of livingchildren
1 55 27.3 5.5 88.72–4 119 44.5 7.6 93.35–8 98 33.7 12.2 84.79+ 25 16.0 4.0 88.0Total 297 35.4 8.4 89.2P-value 0.017 0.319 0.216
aHighest level completed.
10 Influence of mothers� characteristics.pmd 3/3/2005, 12:12 AM976
Eastern Mediterranean Health Journal, Vol. 9, Nos 5/6, 2003 977
shows the demographic characteristics ofthese mothers by their awareness of thegrowth chart, their ever-use of it in thehome and their perceptions of its useful-ness. Table 1 shows that the response rateto the question on knowledge, or aware-ness, of the growth chart was 98% (7mothers did not respond). Overall aware-ness and ever-use of the monitoringgrowth chart were generally poor (35.8%,95% CI: 30.4%–41.2% and 8.6%, 95% CI:5.4%–11.8% respectively).
Many mothers (76.5%) were aged be-tween 25 and 39 years. Only 1.0% ofmothers were younger than 20 years and15.1% were older than 39 years. Therewere no statistically significant differencesby age in the proportion of mothers withawareness, ever-use or good perceptionsof the growth chart (P > 0.1).
Maternal education was statistically sig-nificant in association with awareness ofthe growth chart (P < 0.05). The propor-tion of mothers who were aware of thegrowth chart increased from 11.4% for il-literate mothers to 48.8% for mothers withmore than secondary education.
Overall, the majority of mothers(89.2%) perceived the growth chart as auseful monitoring tool for child health anddevelopment. This perception increasedsignificantly from 77.1% of illiterate moth-ers to more than 90% of those with at leastprimary education.
Only 8.7% reported ever using thegrowth chart and there was no statisticallysignificant age differential. The trend ofuse was inconsistent across age groups;however, those aged between 35 and 39years were more likely to use the growthchart than other mothers.
The mother’s occupation was also sta-tistically significant in association with themother’s knowledge of the growth chart(P < 0.05; Table 1). Mothers engaged infull-time work were more aware of the
growth chart than those with part-time jobsor those who were not employed outsidethe home (56.5%, 44.2% and 32.6% re-spectively).
We examined total parity and total num-ber of living children as maternal variablesrelated to growth chart use and percep-tions. Both variables were statistically sig-nificant in association with mother’sknowledge of the growth chart (P < 0.05;Table 1). Multiparous women were lessaware of the growth chart than were wom-en with parity 2–4. A greater proportion ofwomen with 2–4 living children were alsomore aware of the growth chart than wom-en with either more or fewer children. Al-though only 25 women had 9 or more livingchildren, these women were least likely toknow of or to have ever used the growthchart. Neither parity nor number of livingchildren was statistically significant in as-sociation with mothers’ use of growthchart or perception of its usefulness.
The child’s age, sex and recent illnesswere not statistically significant in associa-tion with the mother’s awareness, ever-useor perception of the usefulness of thegrowth chart (Table 2). Mother’s aware-ness and perception of the usefulness ofthe growth chart were not statistically as-sociated with child’s birth weight. Howev-er, a greater proportion of mothers ofhigh-birth-weight babies reported use ofthe growth chart than did their counter-parts with smaller birth-weight babies (P <0.05). A significantly greater proportion ofmothers of children who were not recentlyhospitalized were aware of the growthchart (39.5% versus 14.6%, P < 0.01).
Almost 80% of mothers reported doc-tor’s use of the growth chart at least occa-sionally. In almost 67% of these cases,doctors did not interfere with nutrition orhealth care of the child based upon the in-formation recorded in the growth chart.Among mothers who ever used the growth
10 Influence of mothers� characteristics.pmd 3/3/2005, 12:12 AM977
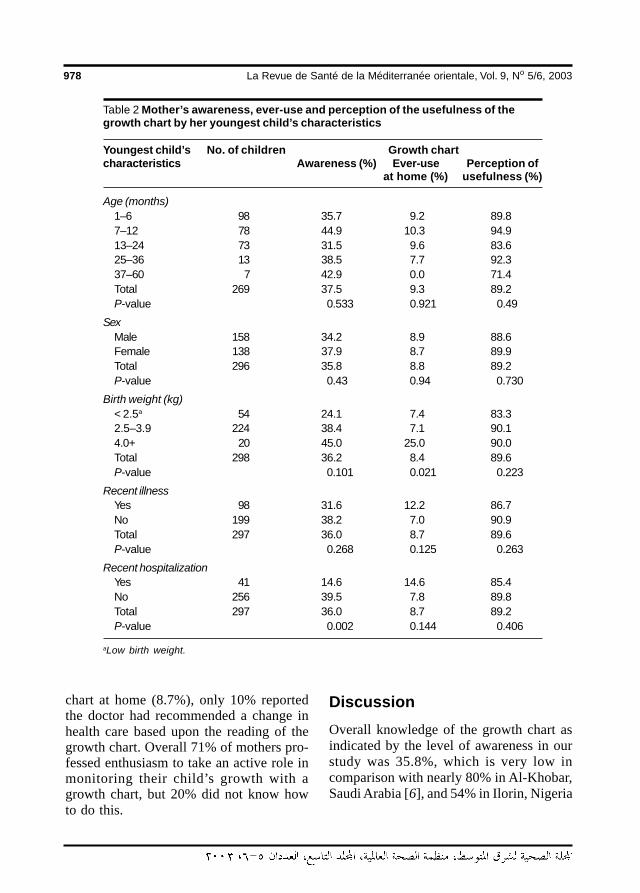
978 La Revue de Santé de la Méditerranée orientale, Vol. 9, No 5/6, 2003
Table 2 Mother’s awareness, ever-use and perception of the usefulness of thegrowth chart by her youngest child’s characteristics
Youngest child’s No. of children Growth chartcharacteristics Awareness (%) Ever-use Perception of
at home (%) usefulness (%)
Age (months)1–6 98 35.7 9.2 89.87–12 78 44.9 10.3 94.913–24 73 31.5 9.6 83.625–36 13 38.5 7.7 92.337–60 7 42.9 0.0 71.4Total 269 37.5 9.3 89.2P-value 0.533 0.921 0.49
SexMale 158 34.2 8.9 88.6Female 138 37.9 8.7 89.9Total 296 35.8 8.8 89.2P-value 0.43 0.94 0.730
Birth weight (kg)< 2.5a 54 24.1 7.4 83.32.5–3.9 224 38.4 7.1 90.14.0+ 20 45.0 25.0 90.0Total 298 36.2 8.4 89.6P-value 0.101 0.021 0.223
Recent illnessYes 98 31.6 12.2 86.7No 199 38.2 7.0 90.9Total 297 36.0 8.7 89.6P-value 0.268 0.125 0.263
Recent hospitalizationYes 41 14.6 14.6 85.4No 256 39.5 7.8 89.8Total 297 36.0 8.7 89.2P-value 0.002 0.144 0.406
aLow birth weight.
chart at home (8.7%), only 10% reportedthe doctor had recommended a change inhealth care based upon the reading of thegrowth chart. Overall 71% of mothers pro-fessed enthusiasm to take an active role inmonitoring their child’s growth with agrowth chart, but 20% did not know howto do this.
DiscussionOverall knowledge of the growth chart asindicated by the level of awareness in ourstudy was 35.8%, which is very low incomparison with nearly 80% in Al-Khobar,Saudi Arabia [6], and 54% in Ilorin, Nigeria
10 Influence of mothers� characteristics.pmd 3/3/2005, 12:12 AM978
Eastern Mediterranean Health Journal, Vol. 9, Nos 5/6, 2003 979
[4]. This suggests a need for related healtheducation in PHC settings, maternity cen-tres and other health care delivery systemsin the country. Knowledge of the growthchart would encourage mothers to use it athome and to be completely in charge ofmonitoring their children’s growth [7].
The significant influence of the moth-er’s education, job, parity and number ofliving children on her awareness of thegrowth chart is consistent with a previousreport [4]. This may not be surprising aseducation buys awareness and the moreeducated a mother is, the more likely she isto appreciate the need to monitor her chil-dren’s growth. The educated mother un-derstands the consequences of anyfaltering of growth in her children. Suchknowledge also makes the mother an activeparticipant in decisions regarding the diet,feeding and child health practices needed toachieve normal growth.
Because more than 70% of mothers ex-pressed a desire to record their child’s an-thropometric measurements at home, aneffort should be made to teach and activelyinvolve mothers in this activity. Each PHCcentre in the country should have a quali-fied health educator and the health educa-
tion content of the growth chart should bereviewed regularly to ensure the mother’sunderstanding [8].
The frequency of cases in which doc-tors made changes in childcare based uponthe mother’s report of her use of thegrowth chart was low. In some of thesecases, the doctors may have chosen to waitand re-examine the child before makingchanges in care. That mothers were able toread the growth chart and sound a note ofwarning about the child’s poor growth,however, is an achievement towards theobjective of the growth monitoring system.
Maternal age influenced awareness andperception of the growth chart in previousstudies but was not significant in thisstudy. It was, however, indirectly involvedin the effect of education, parity and num-ber of living children. Future studies areexpected to throw more light on the aware-ness and the perception of mothers aboutthe use of the growth chart and whether ornot proper use and modification of healthcare actually occurs based upon readingsof it.
Physician compliance and its impact onmothers should not be underestimated andtherefore should be encouraged.
References
1. A growth chart for international use inmaternal and child health care: Guide-lines for primary health care personnel.Geneva, World Health Organization,1978.
2. Jelliffe DB, Jelliffe EFP. Using growthcharts to improve nutrition. Geneva,World Health Organization, 1985.
3. Grant K, Stone T. Maternal comprehen-sion of a home-based growth chart andits effect on growth. Journal of tropicalpediatrics, 1986, 32:253–7.
4. Fagbule DO, Olaosebikan A, ParakoyiDB. Community awareness and utiliza-tion of growth charts in a semi-urban Ni-gerian community. East African medicaljournal, 1990, 67:69–74.
5. Sebai ZA. Primary health care in the dis-trict of Al-Asiah. In: Sebai ZA, ed. Com-munity health in Saudi Arabia. Jeddah,Tihama Publications, 1984:71–6.
6. Rasheed P et al. The growth chart—itsuse and perception among mothers vis-iting primary health care centres of Al-
10 Influence of mothers� characteristics.pmd 3/3/2005, 12:13 AM979
980 La Revue de Santé de la Méditerranée orientale, Vol. 9, No 5/6, 2003
Khobar, Saudi Arabia. Saudi medicaljournal, 1996, 17(2):195–204.
7. Brown R, Morley D. A controlled trialweighing with the Direct RecordingScale by mothers in a village basedgrowth monitoring programme in Ghana.
Journal of tropical pediatrics, 1993, 39:55–8.
8. Kumar V, Datta N. Home-based mothers’health records. World health forum,1988, 9:107–10.
WHO Global Database on Child Growth and Malnutrition
The Global Database on Child Growth and Malnutrition is a dynamiccatalogue of representative population-based nutrition data that arecollected and assessed in a standardized manner. Its primary focusis undernutrition among infants and children under 5 years of agecomputed on the basis of weight-for-age (underweight), weight-for-height (wasting), and height-for-age (stunting), although informa-tion on the prevalence of overweight in children is also included.The database currently covers about 510 million children, or 95% ofthe total population of under-5-year-olds. These figures reflect onlynationally representative surveys. Additional data are available forsome countries from surveys conducted at regional, provincial,state, district, or local levels. The database also provides countrytrend analyses from 1980 onwards.
The Global Database on Child Growth and Malnutrition provides deci-sion-makers and health workers alike with baseline information. Thisinformation takes the forms of maps, tables, graphs, and data inelectronic formats, which are needed to plan, implement, and moni-tor and evaluate intervention programmes aimed at promotinghealthy child growth, nutrition, and development. The database isavailable free on line at: http://www.who.int/nutgrowthdb/
10 Influence of mothers� characteristics.pmd 3/3/2005, 12:13 AM980
Eastern Mediterranean Health Journal, Vol. 9, Nos 5/6, 2003 981
Acute rheumatic fever in JordanianchildrenI. Khriesat,1 A. Najada,2 F. Al-Hakim1 and A. Abu-Haweleh1
1Queen Alia Heart Institute, Paediatric Cardiology Division, Amman, Jordan.2Department of Paediatrics, King Hussein Medical Centre, Amman, Jordan.Received: 30/06/02; accepted: 17/02/03
ABSTRACT Rheumatic fever remains a significant health problem in Jordan. We retrospectively reviewedmedical charts of 28 boys and 22 girls (mean age at presentation 10.5 ± 2.6 years) with confirmed diagnosisbased on modified Jones criteria at Queen Alia Heart Institute from February 1999 to February 2002. Arthritiswas the commonest major manifestation (88%; 68% migratory), carditis was second commonest (48%; 8%silent carditis) and chorea was seen in 6%. None had subcutaneous nodules or erythema marginatum. Themitral valve was most commonly affected (80%); both mitral and aortic valves were affected in 25%.Pericarditis was seen in 12.5% and acute congestive heart failure in 4%. Practitioners should be aware ofdiverse clinical presentations and emphasize strict adherence to prophylaxis guidelines.
Le rhumatisme articulaire aigu chez des enfants jordaniensRESUME Le rhumatisme articulaire demeure un important problème de santé en Jordanie. Nous avonsprocédé à une étude rétrospective des dossiers médicaux de 28 garçons et 22 filles (âge moyen lors de lasurvenue 10,5 ± 2,6 ans), chez lesquels le diagnostic avait été confirmé sur la base des critères de Jonesrévisés, à l’Institut cardiologique de la reine Alia de février 1999 à février 2002. L’arthrite était la manifestationmajeure la plus fréquente (88 % ; 68 % migratrice) suivie par la cardite (48 % ; 8 % cardite silencieuse) et lachorée était observée chez 6 % des patients. Aucun n’avait de nodules sous-cutanés ou d’érythèmemarginé. La valve mitrale était le plus fréquemment atteinte (80 %) ; les valves mitrales et aortiques étaienttoutes deux atteintes chez 25 % des sujets. Une péricardite était observée chez 12,5 % et une insuffisancecardiaque congestive aiguë chez 4 % des sujets. Les praticiens devraient connaître les diverses présenta-tions cliniques et souligner l’importance du respect strict des directives pour la prophylaxie.
11 Acute rheumatic fever.pmd 3/3/2005, 12:13 AM981
982 La Revue de Santé de la Méditerranée orientale, Vol. 9, No 5/6, 2003
IntroductionAcute rheumatic fever is a common andserious public health problem in developingcountries [1,2]. At the end of the 20th cen-tury, after an apparent decline, acute rheu-matic fever constitutes a great challenge toindustrialized and developing countries [3–6]. In the 1980s and early 1990s whenmany clinicians were hoping that it was adisease of the past, anxieties were renewedwhen outbreaks were reported in severalareas around the United States [7].
Rheumatic valvular heart disease, animportant sequel to rheumatic fever, is themost common acquired heart diseaseworldwide and is the major cause of car-diovascular death during the first 5 decadesof life in developing countries [2,8,9].
Rheumatic valvular heart diseases areassociated with severe, incapacitating hae-modynamic disturbances in young adultsand children [1,10]. Many patients are seenwith established rheumatic heart disease attheir first visit [10]. Acute rheumatic fevercan mimic many other diseases and be-cause the diagnosis is based on clinical cri-teria, it is still under-diagnosed or over-diagnosed in different settings [3]. Preven-tion of chronic rheumatic heart disease isfeasible and cost effective if secondaryprophylaxis is started and maintained regu-larly [11,12].
These facts emphasize the importanceof accurate diagnosis, prompt treatmentand secondary prophylaxis. In the presentstudy we retrospectively describe the clini-cal profile of acute rheumatic fever in Jor-danian children to increase the awarenessof practitioners involved in the health careof young children.
MethodsMedical charts of children with acute rheu-matic fever seen at Queen Alia Heart Insti-
tute between February 1999 and February2002 were retrospectively reviewed. Datawere obtained and where further informa-tion was needed the patient was clinicallyreviewed and/or echocardiography wasperformed. The age of the study populationranged from 6 to 15 years. Diagnosis ofacute rheumatic fever was based on the1992 update of the Jones criteria [4].
Data obtained included clinical profileand standard laboratory investigations in-cluding complete blood count, sedimenta-tion rate, C reactive protein level,antistreptolysin O titre, throat swab cul-ture, chest radiography and electrocardio-graphy.
Cross-section echocardiography andcolour Doppler evaluation were performedwithin 2–3 days of presentation and after2–3 weeks. Multiple cross-section viewswere usually taken from parasternal apicaland subcostal positions according to therecommendations of the American Societyof Echocardiography. Criteria for patholog-ical valvular regurgitation agreed upon bythe operators included:• colour jet seen in at least 2 planes• mosaic colour jet• length of the colour jet ≥ 1 cm.
ResultsOf the 50 patients in the study, 28 weremale and 22 were female (male to femaleratio 1.3:1).
The mean age of the study populationwas 10.5 ± 2.6 years. Arthritis was themost common presenting feature (88% oftotal) and was migratory in 30 and monoar-ticular in 14 (68% and 32% respectively ofthose with arthritis). Carditis with bothauscultatory and echo evidence was seen in24 (48% of total) and silent carditis with noauscultatory findings was seen in 4 (8% of
11 Acute rheumatic fever.pmd 3/3/2005, 12:13 AM982
Eastern Mediterranean Health Journal, Vol. 9, Nos 5/6, 2003 983
total). Chorea was seen in 3 patients, withevidence of carditis in 2 patients (Table 1).Cardiac features at presentation and 2–3weeks later are shown in Table 2.
Table 3 shows results of laboratory in-vestigations. Throat swabs were requestedfor 20 patients and were positive for groupA streptococcus in only 8%. Antistreptol-ysin O titres ranged from 350–1250 IUwith mean (standard deviation) of 520(320). Erythrocyte sedimentation rate waselevated in 74% with a range of 65–125mm in the first hour and C reactive proteinwas positive in 75% with a titre range of74–104 IU.
DiscussionRheumatic fever continues to be a majorhealth problem in developing and industrial-ized countries, especially since the recentoutbreaks that emphasized the need forpractitioners to remain vigilant and to main-tain prevention efforts [13]. Although the
Table 1 Clinical features of the 28 boys and 22girls aged 6–15 years with diagnosed acuterheumatic fever
Features No. %
SexMale 28 56Female 22 44
Arthritis 44 88Migratory 30 68Monoarthritis 14 32
Carditis 24 48
Chorea 3 6
Erythema marginatum 0 0
Subcutaneous nodules 0 0
Mean age ± standard deviation of the patients =10.5 ± 2.6 years.
criteria for diagnosis are well known, theclinical symptoms needed to diagnose donot always appear concurrently and the ini-tial illness may be mild or short-lived anddiagnosis may be missed.
The Jones criteria were introduced in1944 as a set of clinical guidelines for thediagnosis of rheumatic fever [4,14]. Themanifestations of rheumatic fever were di-vided into major and minor categories in theJones criteria. Major manifestations wereleast likely to lead to an improper diagnosisand included carditis, joint symptoms, sub-cutaneous nodules and chorea. History ofrheumatic fever or rheumatic heart diseasewas also a major manifestation. Minormanifestations were suggestive of rheu-matic fever, but were not sufficient for di-agnosis and included clinical signs such asfever and erythema marginatum and labo-ratory markers of inflammation. The pres-ence of 2 major or 1 major and 2 minormanifestations provided reasonable evi-dence of rheumatic activity. However, be-cause previous history of definiterheumatic fever or rheumatic heart diseasewas a major criterion, the presence of aminor manifestation was sufficient to es-tablish the diagnosis of rheumatic fever re-currence.
To improve specificity, these guidelineshave been periodically modified [15–18]. Inthe first modification [17], objectively iden-tifiable arthritis replaced joint symptoms asa major manifestation and arthralgia wasassigned to the category of minor manifes-tations. History of previous rheumatic fe-ver or rheumatic heart disease wasdowngraded to the minor category, andtherefore, documentation of a major mani-festation became necessary for the diagno-sis of recurrence of rheumatic fever.Meanwhile, erythema marginatum wasrecommended as a major criterion. Mostimportantly, the evidence of preceding
11 Acute rheumatic fever.pmd 3/3/2005, 12:13 AM983
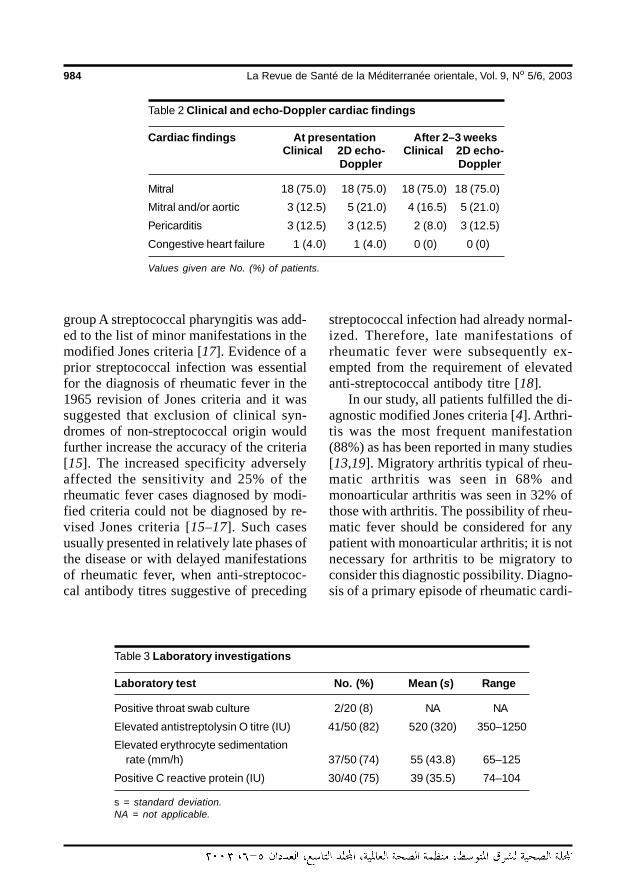
984 La Revue de Santé de la Méditerranée orientale, Vol. 9, No 5/6, 2003
group A streptococcal pharyngitis was add-ed to the list of minor manifestations in themodified Jones criteria [17]. Evidence of aprior streptococcal infection was essentialfor the diagnosis of rheumatic fever in the1965 revision of Jones criteria and it wassuggested that exclusion of clinical syn-dromes of non-streptococcal origin wouldfurther increase the accuracy of the criteria[15]. The increased specificity adverselyaffected the sensitivity and 25% of therheumatic fever cases diagnosed by modi-fied criteria could not be diagnosed by re-vised Jones criteria [15–17]. Such casesusually presented in relatively late phases ofthe disease or with delayed manifestationsof rheumatic fever, when anti-streptococ-cal antibody titres suggestive of preceding
streptococcal infection had already normal-ized. Therefore, late manifestations ofrheumatic fever were subsequently ex-empted from the requirement of elevatedanti-streptococcal antibody titre [18].
In our study, all patients fulfilled the di-agnostic modified Jones criteria [4]. Arthri-tis was the most frequent manifestation(88%) as has been reported in many studies[13,19]. Migratory arthritis typical of rheu-matic arthritis was seen in 68% andmonoarticular arthritis was seen in 32% ofthose with arthritis. The possibility of rheu-matic fever should be considered for anypatient with monoarticular arthritis; it is notnecessary for arthritis to be migratory toconsider this diagnostic possibility. Diagno-sis of a primary episode of rheumatic cardi-
Table 3 Laboratory investigations
Laboratory test No. (%) Mean (s) Range
Positive throat swab culture 2/20 (8) NA NA
Elevated antistreptolysin O titre (IU) 41/50 (82) 520 (320) 350–1250
Elevated erythrocyte sedimentationrate (mm/h) 37/50 (74) 55 (43.8) 65–125
Positive C reactive protein (IU) 30/40 (75) 39 (35.5) 74–104
s = standard deviation.NA = not applicable.
Table 2 Clinical and echo-Doppler cardiac findings
Cardiac findings At presentation After 2–3 weeksClinical 2D echo- Clinical 2D echo-
Doppler Doppler
Mitral 18 (75.0) 18 (75.0) 18 (75.0) 18 (75.0)
Mitral and/or aortic 3 (12.5) 5 (21.0) 4 (16.5) 5 (21.0)
Pericarditis 3 (12.5) 3 (12.5) 2 (8.0) 3 (12.5)
Congestive heart failure 1 (4.0) 1 (4.0) 0 (0) 0 (0)
Values given are No. (%) of patients.
11 Acute rheumatic fever.pmd 3/3/2005, 12:13 AM984
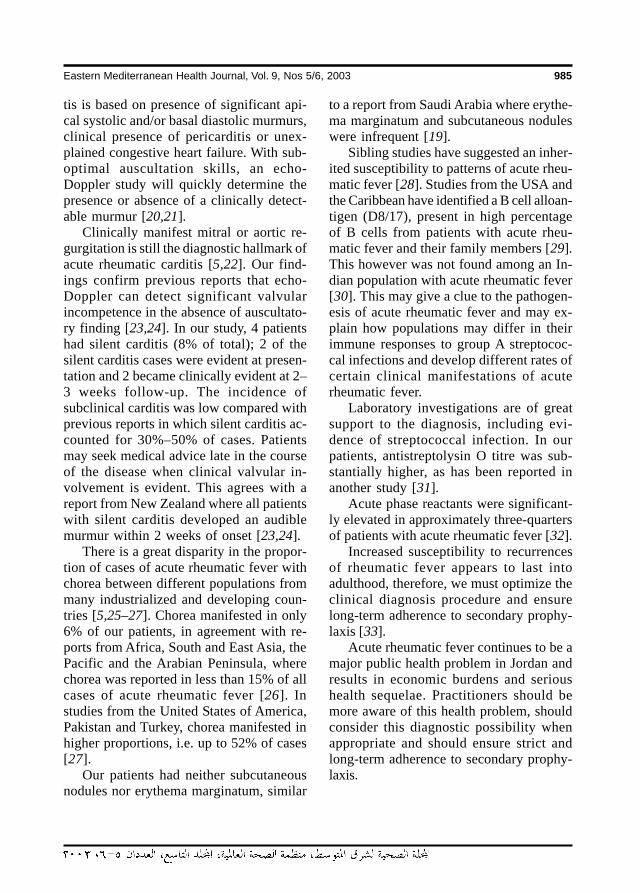
Eastern Mediterranean Health Journal, Vol. 9, Nos 5/6, 2003 985
tis is based on presence of significant api-cal systolic and/or basal diastolic murmurs,clinical presence of pericarditis or unex-plained congestive heart failure. With sub-optimal auscultation skills, an echo-Doppler study will quickly determine thepresence or absence of a clinically detect-able murmur [20,21].
Clinically manifest mitral or aortic re-gurgitation is still the diagnostic hallmark ofacute rheumatic carditis [5,22]. Our find-ings confirm previous reports that echo-Doppler can detect significant valvularincompetence in the absence of auscultato-ry finding [23,24]. In our study, 4 patientshad silent carditis (8% of total); 2 of thesilent carditis cases were evident at presen-tation and 2 became clinically evident at 2–3 weeks follow-up. The incidence ofsubclinical carditis was low compared withprevious reports in which silent carditis ac-counted for 30%–50% of cases. Patientsmay seek medical advice late in the courseof the disease when clinical valvular in-volvement is evident. This agrees with areport from New Zealand where all patientswith silent carditis developed an audiblemurmur within 2 weeks of onset [23,24].
There is a great disparity in the propor-tion of cases of acute rheumatic fever withchorea between different populations frommany industrialized and developing coun-tries [5,25–27]. Chorea manifested in only6% of our patients, in agreement with re-ports from Africa, South and East Asia, thePacific and the Arabian Peninsula, wherechorea was reported in less than 15% of allcases of acute rheumatic fever [26]. Instudies from the United States of America,Pakistan and Turkey, chorea manifested inhigher proportions, i.e. up to 52% of cases[27].
Our patients had neither subcutaneousnodules nor erythema marginatum, similar
to a report from Saudi Arabia where erythe-ma marginatum and subcutaneous noduleswere infrequent [19].
Sibling studies have suggested an inher-ited susceptibility to patterns of acute rheu-matic fever [28]. Studies from the USA andthe Caribbean have identified a B cell alloan-tigen (D8/17), present in high percentageof B cells from patients with acute rheu-matic fever and their family members [29].This however was not found among an In-dian population with acute rheumatic fever[30]. This may give a clue to the pathogen-esis of acute rheumatic fever and may ex-plain how populations may differ in theirimmune responses to group A streptococ-cal infections and develop different rates ofcertain clinical manifestations of acuterheumatic fever.
Laboratory investigations are of greatsupport to the diagnosis, including evi-dence of streptococcal infection. In ourpatients, antistreptolysin O titre was sub-stantially higher, as has been reported inanother study [31].
Acute phase reactants were significant-ly elevated in approximately three-quartersof patients with acute rheumatic fever [32].
Increased susceptibility to recurrencesof rheumatic fever appears to last intoadulthood, therefore, we must optimize theclinical diagnosis procedure and ensurelong-term adherence to secondary prophy-laxis [33].
Acute rheumatic fever continues to be amajor public health problem in Jordan andresults in economic burdens and serioushealth sequelae. Practitioners should bemore aware of this health problem, shouldconsider this diagnostic possibility whenappropriate and should ensure strict andlong-term adherence to secondary prophy-laxis.
11 Acute rheumatic fever.pmd 3/3/2005, 12:13 AM985
986 La Revue de Santé de la Méditerranée orientale, Vol. 9, No 5/6, 2003
References
10. Haffejee IE. Rheumatic fever. Bailliere’sclinical rheumatology, 1995, 9(1):11–20.
11. Tampkins DG, Boxerbaum B, Liebman J.Long-term prognosis of rheumatic feverpatients receiving regular intramuscularbenzathin penicillin. Circulation, 1972,45:543–51.
12. Nordet P. World Health Organizationprogramme for the prevention of rheu-matic fever/rheumatic heart disease in16 developing countries: report fromphase I (1986–90). Bulletin of the WorldHealth Organization, 1992, 70:213–8.
13. David L. Diagnosis and treatment ofrheumatic fever. Archives of pediatrics,1998, 5(6):681–6.
14. Jones TD. Diagnosis of rheumatic fever.Journal of the American Medical Asso-ciation, 1994, 126:481–4.
15. Stollerman GH et al. Report of the AdhocCommittee on Rheumatic Fever andCongenital Heart Disease of AmericanHeart Association: Jones Criteria (re-vised) for guidance in the diagnosis ofrheumatic fever. Circulation, 1965, 32:664–8.
16. Okuni M. Problems in clinical applicationof revised Jones diagnostic criteria forrheumatic fever. Japanese heart journal,1971, 12:436–41.
17. Rutstein DD et al. Report of the Commit-tee on Standards and Criteria for Pro-grams of Care of the Council ofRheumatic Fever and Congenital HeartDisease of American Heart Association.Jones criteria (modified) for guidance inthe diagnosis of rheumatic fever. Circula-tion, 1956, 13:617–20.
18. Shulman ST et al. Committee on Rheu-matic Fever, Endocarditis and KawasakiDisease of the American Heart Associa-
1. Bavdekar SB, Soloman R, Kamat JR.Rheumatic fever in children. Journal ofthe Indian Medical Association, 1999,97(12):489–92.
2. Nordet P. World Health Organization/In-ternational Society and Federation ofCardiology Global Programme for thePrevention and Control of RheumaticFever/Rheumatic Heart Disease. Heart-beat, 1993, 3:4–5.
3. Da Silva NA, Pereira BA. Acute rheu-matic fever. Still a challenge. Rheumaticdiseases clinics of North America, 1997,23(3):545–68.
4. Dajani AS et al. Guidelines for the diag-nosis of rheumatic fever: Jones criteria,updated 1992. Journal of the AmericanMedical Association, 1992, 268:2069–73.
5. Veasy LG, Tani L, Hill H. Persistence ofacute rheumatic fever in the intermoun-tain area of the United States. Journal ofpediatrics, 1994, 124:9–16.
6. Zangwill KM, Wald ER, Londino A. Acuterheumatic fever in Western Pennsylva-nia: a persistent problem into the 1990s.Journal of pediatrics, 1991, 118:561–3.
7. Taubert KA, Rawley AH, Shulman ST.Seven year national survey of Kawasakidisease and acute rheumatic fever. Pedi-atric infectious disease journal, 1994,13:704–8.
8. Eisenberg MJ. Rheumatic heart diseasein the developing world: Prevalence,prevention and control. European heartjournal, 1993, 14:122–8.
9. Haffejee I. Rheumatic fever and rheu-matic heart disease: the current status ofits immunology, diagnostic criteria andprophylaxis. Quarterly journal of medi-cine, 1992, 84:641–58.
11 Acute rheumatic fever.pmd 3/3/2005, 12:13 AM986
Eastern Mediterranean Health Journal, Vol. 9, Nos 5/6, 2003 987
tion. Jones Criteria (Revised) for guid-ance in the diagnosis of rheumatic fever.Circulation, 1984, 70:204A–48A.
19. Abbag F et al. Acute rheumatic fever inSouthern Saudi Arabia. East Africanmedical journal, 1998, 75(5):279–81.
20. St. Clair EW et al. Assessing house staffdiagnostic skills using a cardiology pa-tient simulator. Annals of internal medi-cine, 1992, 117:751–6.
21. Mangione S et al. The teaching and prac-tice of cardiac auscultation during inter-nal medicine and cardiology training.Annals of internal medicine, 1993, 119:47–54.
22. Dajani AS, Allen HD, Taubert KA.Echocardiography for diagnosis andmanagement of rheumatic fever [letter].Journal of the American Medical Asso-ciation, 1993, 269:2084.
23. Folger GM et al. Occurrence of valvarheart disease in acute rheumatic feverwithout evident carditis: Colour-flowDoppler identification. British heart jour-nal, 1992, 67:434–8.
24. Abernethy M et al. Doppler echocardio-graphy and early diagnosis of carditis inacute rheumatic fever. Australia andNew Zealand journal of medicine, 1994,24:530–5.
25. Lue HC et al. The natural history of rheu-matic fever and rheumatic heart diseasein the Orient. Japanese heart journal,1979, 20:237–52.
26. Lahiri K, Rane HS, Desai AG. Clinicalprofile of rheumatic fever: a study of 168
cases. Journal of tropical pediatrics,1985, 31:273–5.
27. Pilapil VR, Watson DG. Rheumatic feverin Mississippi: 104 cases seen over a de-cade. Journal of the American MedicalAssociation, 1971, 215:1626–30.
28. Spagnuolo M, Taranta A. Rheumatic fe-ver in siblings: similarity in its clinicalmanifestations. New England journal ofmedicine, 1968, 278:1843–8.
29. Khanna AK et al. Presence of a non-HLAB cell antigen in rheumatic fever patientsand their families defined by a mono-clonal antibody. Journal of clinical inves-tigation, 1989, 83:1710–6.
30. Kaur S et al. Ethnic differences in expres-sion of susceptibility marker(s) in rheu-matic fever/rheumatic heart diseasepatients. International journal of cardiol-ogy, 1998, 64:9–14.
31. Taranta A, Stollerman GH. The relation-ship of Sydenhams chorea to infectionwith group A streptococci. Americanjournal of medicine, 1956, 20:170–5.
32. Taranta A et al. Determination of C-reac-tive protein in serum as a guide to thetreatment and management of rheumaticfever. American journal of medicine,1953, 15:645–55.
33. Johnson EE, Stollerman GH, GrossmanBJ. Rheumatic recurrence in patients notreceiving continuous prophylaxis. Jour-nal of the American Medical Association,1964, 190:407–13.
11 Acute rheumatic fever.pmd 3/3/2005, 12:13 AM987
988 La Revue de Santé de la Méditerranée orientale, Vol. 9, No 5/6, 2003
Co-morbidity and treatment ofattention deficit hyperactivity disorderin Saudi ArabiaF.A. Al-Haidar1
1Department of Psychiatry, King Khalid University Hospital, Riyadh, Saudi Arabia.Received: 21/11/02; accepted: 22/04/03
ABSTRACT To review the experience of a child psychiatric clinic regarding co-morbidity and treatmentcharacteristics of children with attention deficit hyperactivity disorder (ADHD), a retrospective study wasdone on patients under 19 years who were attending the clinic and were diagnosed with ADHD. Co-morbidityand treatment characteristics were also studied. ADHD was diagnosed in 25.5% of the patients. Of these,28.3% had coexistent expressive language disorder and 38.7% coexistent mild mental retardation. A psy-chostimulant (methylphenidate) was prescribed to 23.6% while antidepressants (primarily imipramine) wereprescribed to 35.9%. Behavioural therapy was the most commonly offered psychotherapy. Antidepressantswere used more than psychostimulants. Psychotropics had a more beneficial effect than psychotherapy.
Comorbidité et traitement du trouble d’hyperactivité avec déficit de l’attention en Arabie saouditeRESUME Afin d’examiner l’expérience d’une clinique de pédopsychiatrie en ce qui concerne la comorbiditéet les caractéristiques du traitement des enfants souffrant d’hyperactivité avec déficit de l’attention (HADA),une étude rétrospective a été réalisée auprès des patients de moins de 19 ans qui consultaient à la cliniqueet chez lesquels un diagnostic de HADA avait été posé. La comorbidité et les caractéristiques du traitementont également été étudiées. Une hyperactivité avec déficit de l’attention a été diagnostiquée chez 25,5 % despatients. Parmi ces patients, 28,3 % avaient des troubles expressifs du langage coexistants et 38,7 %avaient une légère arriération mentale coexistante. Un psychostimulant (méthylphénidate) a été prescrit à23,6 % des patients tandis que des antidépresseurs (principalement l’imipramine) ont été prescrits à 35,9 %.La thérapie comportementale était la psychothérapie la plus fréquemment offerte. Les antidépresseursétaient davantage utilisés que les psychostimulants et les psychotropes ont montré un effet plus bénéfiqueque la psychothérapie.
12 Co-morbidity and treatment.pmd 3/3/2005, 12:13 AM988
Eastern Mediterranean Health Journal, Vol. 9, Nos 5/6, 2003 989
IntroductionAttention deficit hyperactivity disorder(ADHD) is a disorder of childhood and ad-olescence characterized by a pattern of ex-treme pervasive, persistent and debilitatinginattention, overactivity and impulsivity[1]. It is believed to be one of the mostcommon reasons for mental health refer-rals to family physicians, paediatricians,paediatric neurologists and child and ado-lescent psychiatrists [2,3].
Although originally thought to remitduring childhood, the symptoms of ADHDhave also been shown to persist in patientsthrough adolescence and into adulthood[4]. The disorder is often chronic, with onethird to one half of those affected retainingthe condition into adulthood [5–7].
It interferes with many areas of normaldevelopment and functioning in a child’slife [2]. Children with ADHD are more like-ly than their peers to experience educationalunderachievement, social isolation and anti-social behaviour during the school years[8] and to go on to have significant difficul-ties in the post-school years [9,10].
The aim of this study is to review theexperience of a child psychiatric clinicregarding co-morbidity and treatmentcharacteristics of children with ADHD.Evaluating our current clinical experiencewith ADHD and comparing it with otherswill allow us to offer better service to ourpatients in the future.
MethodsThe case records of all patients (416) up to18 years of age who attended the child psy-chiatric outpatient clinic at King Khalid Uni-versity Hospital, Riyadh, Saudi Arabia overa period of 10 years (July 1990 to July2000) were examined. Those who werediagnosed as having ADHD (106) were re-
trospectively reviewed with regard to co-morbidity, prescribed psychotropic medi-cation and type of psychotherapy offered.
The diagnosis of ADHD and co-morbiddisorders was based on the Diagnostic sta-tistical manual of mental disorders [1].
The psychological tests used to deter-mine the degree of mental retardation in-cluded the Wechsler Intelligence Scale forChildren, the Stanford-Binet IntelligenceScale and the Vinland Adaptive BehavioralScale.
Psychotherapy offered included behav-ioural therapy and family counselling. Inbehavioural therapy, parents were givenstrategies to modify their children’s behav-iour (e.g. point/token reward system andtime-out). In family counselling, parentshad the opportunity to establish a positiverelationship within the family and relieveguilt feelings through an external attributionof the cause and difficulties.
ResultsCase records of 416 patients were re-viewed; 106 (25.5%) were diagnosed ashaving ADHD, either as the only diagnosis,53 (12.7%), or in combination with otherpsychiatric disorders, 53 (12.7%).
Demographic data are shown in Table1. Boys accounted for 77.4% and girls22.6%, a ratio of 3.4 males to 1 female.Adolescents accounted for only 3.7% ofthe boys and none of the girls.
The majority (93.4%) of the groupwere Saudi Arabian nationals. Most of thepatients had not attended school (63.2%),while 30.2% had had some sort of educa-tion that varied from kindergarten to highschool, and 6.6% were attending a specialschool for children with mental disabilities.
Table 2 lists the co-morbid psychiatricdisorders. Half of the sample (53.0%) did
12 Co-morbidity and treatment.pmd 3/3/2005, 12:13 AM989
990 La Revue de Santé de la Méditerranée orientale, Vol. 9, No 5/6, 2003
not show any co-morbid psychiatric disor-der, the commonest associated disorderwas expressive language disorder (28.3%)followed by nocturnal enuresis (10.4%).
A review of the co-morbidity of ADHDand mental retardation shows that nearlyhalf of the sample (47.2%) did not showany degree of mental retardation while
38.7% had mild, 12.3% had moderate and1.9% had severe mental retardation.
The prescribed psychotropic medica-tions are listed in Table 3. Methylphenidatewas the only psychostimulant given andwas the most commonly prescribed drug.Imipramine was the most commonly pre-scribed antidepressant and the second mostcommonly prescribed psychotropic. Halo-peridol was the most commonly prescribedantipsychotic and the third most commonlyprescribed psychotropic. Only 6.6% of thegroup did not receive any form of medica-tion.
The duration of medication use variedfrom 1 month to 60 months, with a meanof 17 months. Regular follow-ups wereperformed in 34.0% of patients, while66.0% had irregular follow-ups. There wasno significant report of side-effects that wecould use for analysis.
Behavioural therapy was the most com-monly offered type of psychotherapy (44patients, 46.2%). Only 4 patients (3.8%)had family counselling, 9 patients (8.5%)
Table 1 Demographic data for patients in two age groups
Variable 0–12 years 13–18 years Total (n = 106)(n = 103) (n = 3)No. (%) No. (%) No. (%)
SexMale 79 (76.7) 3 (100.0) 82 (77.4)Female 24 (76.7) 0 (0.0) 24 (22.6)
NationalitySaudi Arabian 96 (93.2) 3 (100.0) 99 (93.4)Non-Saudi Arabian 7 (6.8) 0 (0.0) 7 (6.6)
EducationNot educated 67 (65.0) 0 (0.0) 67 (63.2)Educated 29 (28.2) 3 (100.0) 32 (30.2)School for children withmental disability 7 (6.8) 0 (0.0) 7 (6.6)
Table 2 Attention deficit hyperactivitydisorder and co-morbid psychiatricdiagnosis
Diagnosis No. (n = 106) %
None 53 50.0
Expressive languagedisorder (ELD) 30 28.3
Nocturnal enuresis (NE) 11 10.4
ELD + NE 5 4.7
ELD + NE + encopresis 4 3.8
NE + encopresis 2 1.9
Stuttering 1 0.9
12 Co-morbidity and treatment.pmd 3/3/2005, 12:13 AM990
Eastern Mediterranean Health Journal, Vol. 9, Nos 5/6, 2003 991
had both therapies and 44 (41.5%) did notreceive any formal psychotherapy.
Table 4 shows a comparison of the out-come for those patients who received psy-chotropic drugs, psychotherapy or both(assessment of the outcome was basedonly on the reported information in the clin-ical records). All 106 patients receivedsome sort of intervention; the majority(52.8%) received both, while 38.7% re-ceived drugs only and 8.5% received psy-chotherapy alone. Among those whoshowed improvement, predominantly thiswas only partial improvement. Patientswho received drugs showed the greatestimprovement, while those who receivedboth drugs and psychotherapy mostlyshowed partial improvement. Those whoreceived psychotherapy alone did not showmuch improvement.
Discussion The common heterogeneous disorderADHD is conservatively estimated to affect3%–5% of school-age children [11]. Whenthe diagnosis of ADHD is made with stan-dardized structured interview to parents orteachers however, then the prevalence hasbeen reported as reaching 19% in primaryschool age boys [12], with a much higherprevalence (30% to 50%) in those attend-ing child and adolescent psychiatric outpa-tient clinics [1,13]. This study wasconducted in an outpatient psychiatric clin-ic, so a prevalence of 25.5% is in agree-ment with the results of previous studies ofsamples from similar populations.
In one study conducted in the UnitedStates of America (USA) using DSM IV,22%–40% of referred children were diag-
Table 3 Attention deficit hyperactivity disorder andprescribed psychotropic medications
Type of drug Drug No. (n = 106) %
Stimulants Methylphenidate 25 23.6
Antidepressants Imipramine 23 21.7
Amitriptyline 4 3.8
Fluoxetine 6 5.7
Citalopram 4 3.8
Paroxetine 1 0.9
Antipsychotics Haloperidol 17 16.0
Zuclopentixol 4 3.8
Thioridazine 9 8.5
Trifluperazine 2 1.9
Risperidone 1 0.9
Anticonvulsants Carbamazepine 2 1.9
Sodium valproate 1 0.9
None None 7 6.6
12 Co-morbidity and treatment.pmd 3/3/2005, 12:13 AM991
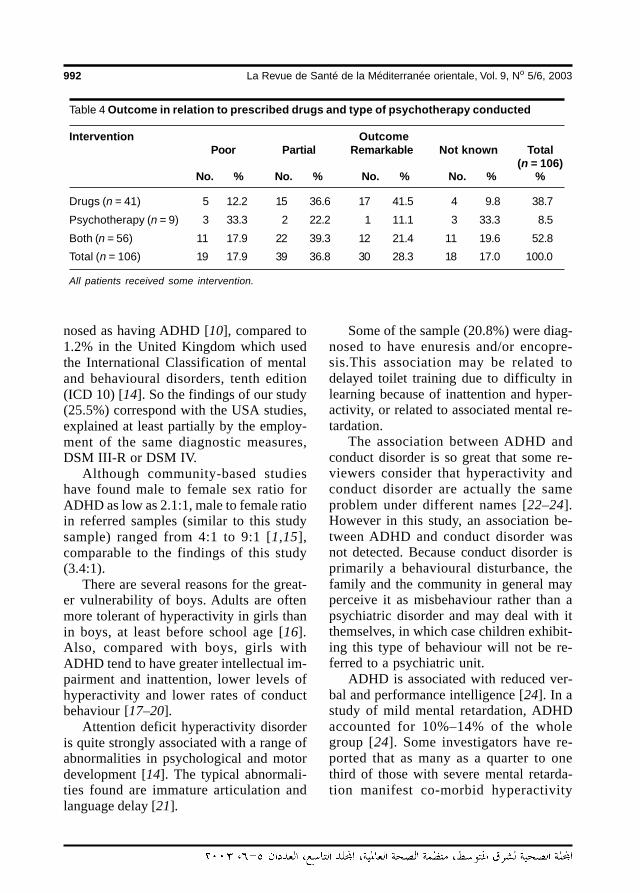
992 La Revue de Santé de la Méditerranée orientale, Vol. 9, No 5/6, 2003
nosed as having ADHD [10], compared to1.2% in the United Kingdom which usedthe International Classification of mentaland behavioural disorders, tenth edition(ICD 10) [14]. So the findings of our study(25.5%) correspond with the USA studies,explained at least partially by the employ-ment of the same diagnostic measures,DSM III-R or DSM IV.
Although community-based studieshave found male to female sex ratio forADHD as low as 2.1:1, male to female ratioin referred samples (similar to this studysample) ranged from 4:1 to 9:1 [1,15],comparable to the findings of this study(3.4:1).
There are several reasons for the great-er vulnerability of boys. Adults are oftenmore tolerant of hyperactivity in girls thanin boys, at least before school age [16].Also, compared with boys, girls withADHD tend to have greater intellectual im-pairment and inattention, lower levels ofhyperactivity and lower rates of conductbehaviour [17–20].
Attention deficit hyperactivity disorderis quite strongly associated with a range ofabnormalities in psychological and motordevelopment [14]. The typical abnormali-ties found are immature articulation andlanguage delay [21].
Some of the sample (20.8%) were diag-nosed to have enuresis and/or encopre-sis.This association may be related todelayed toilet training due to difficulty inlearning because of inattention and hyper-activity, or related to associated mental re-tardation.
The association between ADHD andconduct disorder is so great that some re-viewers consider that hyperactivity andconduct disorder are actually the sameproblem under different names [22–24].However in this study, an association be-tween ADHD and conduct disorder wasnot detected. Because conduct disorder isprimarily a behavioural disturbance, thefamily and the community in general mayperceive it as misbehaviour rather than apsychiatric disorder and may deal with itthemselves, in which case children exhibit-ing this type of behaviour will not be re-ferred to a psychiatric unit.
ADHD is associated with reduced ver-bal and performance intelligence [24]. In astudy of mild mental retardation, ADHDaccounted for 10%–14% of the wholegroup [24]. Some investigators have re-ported that as many as a quarter to onethird of those with severe mental retarda-tion manifest co-morbid hyperactivity
Table 4 Outcome in relation to prescribed drugs and type of psychotherapy conducted
Intervention OutcomePoor Partial Remarkable Not known Total
(n = 106)No. % No. % No. % No. % %
Drugs (n = 41) 5 12.2 15 36.6 17 41.5 4 9.8 38.7
Psychotherapy (n = 9) 3 33.3 2 22.2 1 11.1 3 33.3 8.5
Both (n = 56) 11 17.9 22 39.3 12 21.4 11 19.6 52.8
Total (n = 106) 19 17.9 39 36.8 30 28.3 18 17.0 100.0
All patients received some intervention.
12 Co-morbidity and treatment.pmd 3/3/2005, 12:13 AM992
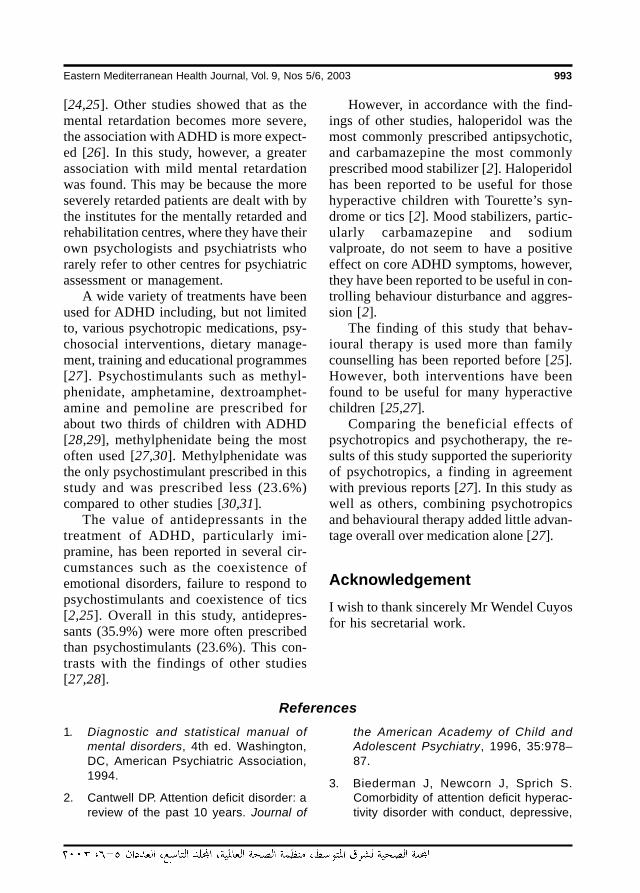
Eastern Mediterranean Health Journal, Vol. 9, Nos 5/6, 2003 993
[24,25]. Other studies showed that as themental retardation becomes more severe,the association with ADHD is more expect-ed [26]. In this study, however, a greaterassociation with mild mental retardationwas found. This may be because the moreseverely retarded patients are dealt with bythe institutes for the mentally retarded andrehabilitation centres, where they have theirown psychologists and psychiatrists whorarely refer to other centres for psychiatricassessment or management.
A wide variety of treatments have beenused for ADHD including, but not limitedto, various psychotropic medications, psy-chosocial interventions, dietary manage-ment, training and educational programmes[27]. Psychostimulants such as methyl-phenidate, amphetamine, dextroamphet-amine and pemoline are prescribed forabout two thirds of children with ADHD[28,29], methylphenidate being the mostoften used [27,30]. Methylphenidate wasthe only psychostimulant prescribed in thisstudy and was prescribed less (23.6%)compared to other studies [30,31].
The value of antidepressants in thetreatment of ADHD, particularly imi-pramine, has been reported in several cir-cumstances such as the coexistence ofemotional disorders, failure to respond topsychostimulants and coexistence of tics[2,25]. Overall in this study, antidepres-sants (35.9%) were more often prescribedthan psychostimulants (23.6%). This con-trasts with the findings of other studies[27,28].
However, in accordance with the find-ings of other studies, haloperidol was themost commonly prescribed antipsychotic,and carbamazepine the most commonlyprescribed mood stabilizer [2]. Haloperidolhas been reported to be useful for thosehyperactive children with Tourette’s syn-drome or tics [2]. Mood stabilizers, partic-ularly carbamazepine and sodiumvalproate, do not seem to have a positiveeffect on core ADHD symptoms, however,they have been reported to be useful in con-trolling behaviour disturbance and aggres-sion [2].
The finding of this study that behav-ioural therapy is used more than familycounselling has been reported before [25].However, both interventions have beenfound to be useful for many hyperactivechildren [25,27].
Comparing the beneficial effects ofpsychotropics and psychotherapy, the re-sults of this study supported the superiorityof psychotropics, a finding in agreementwith previous reports [27]. In this study aswell as others, combining psychotropicsand behavioural therapy added little advan-tage overall over medication alone [27].
AcknowledgementI wish to thank sincerely Mr Wendel Cuyosfor his secretarial work.
References
1. Diagnostic and statistical manual ofmental disorders, 4th ed. Washington,DC, American Psychiatric Association,1994.
2. Cantwell DP. Attention deficit disorder: areview of the past 10 years. Journal of
the American Academy of Child andAdolescent Psychiatry, 1996, 35:978–87.
3. Biederman J, Newcorn J, Sprich S.Comorbidity of attention deficit hyperac-tivity disorder with conduct, depressive,
12 Co-morbidity and treatment.pmd 3/3/2005, 12:13 AM993
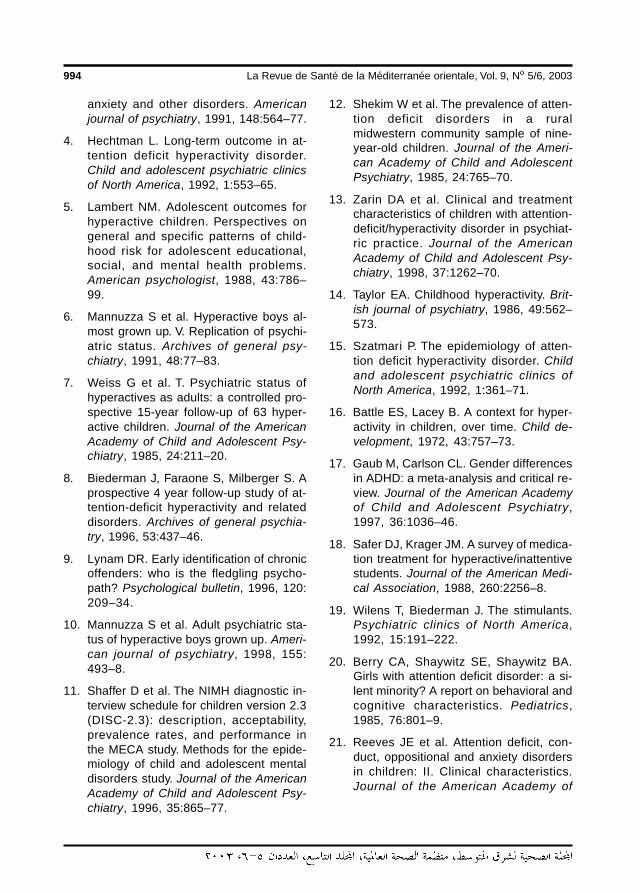
994 La Revue de Santé de la Méditerranée orientale, Vol. 9, No 5/6, 2003
anxiety and other disorders. Americanjournal of psychiatry, 1991, 148:564–77.
4. Hechtman L. Long-term outcome in at-tention deficit hyperactivity disorder.Child and adolescent psychiatric clinicsof North America, 1992, 1:553–65.
5. Lambert NM. Adolescent outcomes forhyperactive children. Perspectives ongeneral and specific patterns of child-hood risk for adolescent educational,social, and mental health problems.American psychologist, 1988, 43:786–99.
6. Mannuzza S et al. Hyperactive boys al-most grown up. V. Replication of psychi-atric status. Archives of general psy-chiatry, 1991, 48:77–83.
7. Weiss G et al. T. Psychiatric status ofhyperactives as adults: a controlled pro-spective 15-year follow-up of 63 hyper-active children. Journal of the AmericanAcademy of Child and Adolescent Psy-chiatry, 1985, 24:211–20.
8. Biederman J, Faraone S, Milberger S. Aprospective 4 year follow-up study of at-tention-deficit hyperactivity and relateddisorders. Archives of general psychia-try, 1996, 53:437–46.
9. Lynam DR. Early identification of chronicoffenders: who is the fledgling psycho-path? Psychological bulletin, 1996, 120:209–34.
10. Mannuzza S et al. Adult psychiatric sta-tus of hyperactive boys grown up. Ameri-can journal of psychiatry, 1998, 155:493–8.
11. Shaffer D et al. The NIMH diagnostic in-terview schedule for children version 2.3(DISC-2.3): description, acceptability,prevalence rates, and performance inthe MECA study. Methods for the epide-miology of child and adolescent mentaldisorders study. Journal of the AmericanAcademy of Child and Adolescent Psy-chiatry, 1996, 35:865–77.
12. Shekim W et al. The prevalence of atten-tion deficit disorders in a ruralmidwestern community sample of nine-year-old children. Journal of the Ameri-can Academy of Child and AdolescentPsychiatry, 1985, 24:765–70.
13. Zarin DA et al. Clinical and treatmentcharacteristics of children with attention-deficit/hyperactivity disorder in psychiat-ric practice. Journal of the AmericanAcademy of Child and Adolescent Psy-chiatry, 1998, 37:1262–70.
14. Taylor EA. Childhood hyperactivity. Brit-ish journal of psychiatry, 1986, 49:562–573.
15. Szatmari P. The epidemiology of atten-tion deficit hyperactivity disorder. Childand adolescent psychiatric clinics ofNorth America, 1992, 1:361–71.
16. Battle ES, Lacey B. A context for hyper-activity in children, over time. Child de-velopment, 1972, 43:757–73.
17. Gaub M, Carlson CL. Gender differencesin ADHD: a meta-analysis and critical re-view. Journal of the American Academyof Child and Adolescent Psychiatry,1997, 36:1036–46.
18. Safer DJ, Krager JM. A survey of medica-tion treatment for hyperactive/inattentivestudents. Journal of the American Medi-cal Association, 1988, 260:2256–8.
19. Wilens T, Biederman J. The stimulants.Psychiatric clinics of North America,1992, 15:191–222.
20. Berry CA, Shaywitz SE, Shaywitz BA.Girls with attention deficit disorder: a si-lent minority? A report on behavioral andcognitive characteristics. Pediatrics,1985, 76:801–9.
21. Reeves JE et al. Attention deficit, con-duct, oppositional and anxiety disordersin children: II. Clinical characteristics.Journal of the American Academy of
12 Co-morbidity and treatment.pmd 3/3/2005, 12:13 AM994
Eastern Mediterranean Health Journal, Vol. 9, Nos 5/6, 2003 995
Child and Adolescent Psychiatry, 1987,26: 144–55.
22. Shaffer D, Greenhill L. A critical note onthe predictive validity of “the hyperkineticsyndrome”. Journal of child psychologyand psychiatry, 1979, 20:61–72.
23. Prior M, Sanson A. Attention deficit disor-der with hyperactivity: a critique. Journalof child psychology and psychiatry,1988, 27:307–19.
24. Bird H, Gould M, Staghezza-Jaramillo B.The comorbidity of ADHD in a commu-nity sample of children aged 6 through16 years. Journal of child and familystudies, 1994, 3:365–78.
25. Taylor E. Syndromes of attention deficitand overactivity. In: Rutter M, Taylor E,Hersov L, eds. Child and adolescent psy-chiatry, 3rd ed. London, Blackwell Sci-ence, 1994:285–307.
26. Gillberg C et al. Psychiatric disorder inmildly and severely mentally retardedurban children and adolescents: epide-miological aspects. British journal of psy-chiatry, 1986, 149:68–74.
27. National Institutes of Health ConsensusDevelopment Conference Statement: di-
agnosis and treatment of attention-defi-cit/hyperactivity disorder (ADHD). Jour-nal of the American Academy of Childand Adolescent Psychiatry, 2000,39:182–93.
28. James RS et al. Double-blind placebo-controlled study of single-dose amphet-amine formulation in ADHD. Journal ofthe American Academy of Child andAdolescent Psychiatry, 2001, 40:1268–76.
29. Hoagwood K et al. Treatment services forchildren with ADHD: a national perspec-tive. Journal of the American Academy ofChild and Adolescent Psychiatry, 2000,39:198–206.
30. Swanson J et al. Effect of stimulant medi-cation on children with attention deficitdisorder: a “review of reviews”. Excep-tional children, 1993, 60:154–62.
31. Spencer T et al. Pharmacotherapy of at-tention-deficit hyperactivity disorderacross the life cycle. Journal of theAmerican Academy of Child and Adoles-cent Psychiatry, 1996, 35:409–32.
12 Co-morbidity and treatment.pmd 3/3/2005, 12:13 AM995
996 La Revue de Santé de la Méditerranée orientale, Vol. 9, No 5/6, 2003
Inpatient child and adolescentpsychiatric referrals in Saudi Arabia:clinical profiles and treatmentF.A. Al-Haidar1
1Division of Psychiatry, King Khalid University Hospital, Riyadh, Saudi Arabia.Received: 08/10/02; accepted: 22/04/03
ABSTRACT A retrospective review was made of the case records of inpatients referred to the psychiatricconsultation–liaison service of King Khalid University Hospital, Saudi Arabia over a 6-year period. For the 109patients under 18 years old, the study noted both the medical or surgical diseases diagnosed as well aspsychiatric disorders and the treatment approaches used by psychiatrists. Depressive and adjustmentdisorders were the most often diagnosed psychiatric illnesses. The most common medical diagnoses wereepilepsy, drug overdose, ambiguous genitalia, orthopaedic injuries and diabetes mellitus. Young people withthese medical problems are in real need of psychological assessment and intervention.
Orientation vers un service psychiatrique des enfants et des adolescents hospitalisés en Arabiesaoudite : profils cliniques et traitementRESUME On a procédé à une analyse rétrospective des dossiers de patients hospitalisés orientés vers leservice de consultation-liaison psychiatrique de l’Hôpital universitaire King Khaled (Arabie saoudite) sur unepériode de six ans. Pour les 109 patients de moins de 18 ans, l’étude a relevé les maladies médicales ouchirurgicales diagnostiquées ainsi que les troubles psychiatriques et les approches thérapeutiques utiliséespar les psychiatres. Les troubles dépressifs et les troubles de l’adaptation étaient les troubles psychiatriquesles plus fréquemment diagnostiqués. Les diagnostics médicaux les plus fréquemment posés étaientl’épilepsie, la surdose, l’ambiguïté sexuelle, les traumatismes orthopédiques et le diabète sucré. Les jeunestouchés par ces problèmes médicaux ont réellement besoin d’une évaluation psychologique et d’une inter-vention.
13 Inpatient child and adolescent.pmd 3/3/2005, 12:13 AM996
Eastern Mediterranean Health Journal, Vol. 9, Nos 5/6, 2003 997
IntroductionSetting up a psychiatric consultation–liaison service in a hospital not onlyaddresses the need for psychological inputin medical wards but it may also improvethe clinical course of many patients’illnesses by decreasing the length of theirhospitalization. As a result, it may also becost-effective [1–3].
For children, the indications for referralto the psychiatric consultation–liaison ser-vices include: obvious disturbances of be-haviour and emotions; physical symptomsfor which no organic explanation can befound; poor adjustment to chronic or re-current ill-health; evidence of significantparental or family pathology; known, orsuspected, abuse or neglect [4,5].
High psychological disturbance rateshave been observed in children admitted tohospital paediatric wards [1,6,7]. This isnot surprising when medical illnesses inchildhood and adolescence, especiallywhen chronic, are increasingly thought tocontribute to psychiatric disturbances[1,4]. Although emotional problems fre-quently cause illness in childhood, and cancomplicate the management of organic dis-eases [1,8–10], paediatricians often fail torecognize psychiatric disorders [11].
The purpose of this paper was to recordwhat medical diseases were associatedwith referral of young people to the childand adolescent consultation–liaison psychi-atric team in a Saudi Arabian hospital, whatpsychiatric disorders were found and whattreatment approaches were used by thepsychiatrist.
MethodsA retrospective review was made of thecase records of all inpatients aged under 18years who had been referred to the child
and adolescent psychiatric consultation–liaison team at King Khalid University Hos-pital. The review covered a period of 6years between July 1992 and July 1998.King Khalid University Hospital is a teach-ing general hospital that primarily offersteaching to under- and postgraduate stu-dents in different branches of medicine aspart of King Saud University. The hospitalservices cover Riyadh and the surroundingarea and are available to all Saudi and non-Saudi Arabians provided they are teachingcases.
A note was made of any medical or sur-gical diseases diagnosed, psychiatric disor-ders diagnosed and the drugs andpsychotherapeutic approaches used by thepsychiatric team. Psychiatric disorderswere classified according to the Diagnosticand statistical manual of mental disorders,DSM3R and later DSM4 [12,13].
ResultsA total of 2060 cases were referred to thepsychiatric consultation–liaison team: 145(7.0%) were below the age of 18 years.Data were not available for 36 patients.Thus 109 cases were included in this study:46 (42.2%) children under 12 years old and63 (57.8%) adolescents aged 12–18 years.
Table 1 shows the medical diagnosesrecorded for this group of young peoplereferred to the psychiatrist. The most com-monly encountered diagnoses were epilep-sy, drug overdose, ambiguous genitalia,orthopaedic injuries and diabetes mellitus.For about 18% of psychiatric referrals nodiagnosed of a medical illness could befound.
Table 2 shows the psychiatric disordersamong the referrals. About 29% of thesample had no psychiatric illness diag-nosed. The most common diagnoses were
13 Inpatient child and adolescent.pmd 3/3/2005, 12:13 AM997
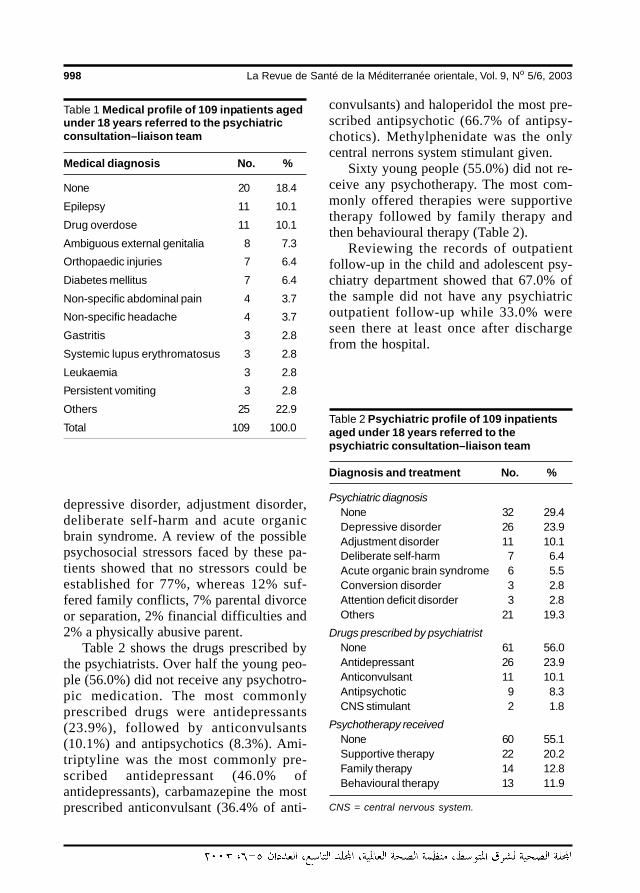
998 La Revue de Santé de la Méditerranée orientale, Vol. 9, No 5/6, 2003
depressive disorder, adjustment disorder,deliberate self-harm and acute organicbrain syndrome. A review of the possiblepsychosocial stressors faced by these pa-tients showed that no stressors could beestablished for 77%, whereas 12% suf-fered family conflicts, 7% parental divorceor separation, 2% financial difficulties and2% a physically abusive parent.
Table 2 shows the drugs prescribed bythe psychiatrists. Over half the young peo-ple (56.0%) did not receive any psychotro-pic medication. The most commonlyprescribed drugs were antidepressants(23.9%), followed by anticonvulsants(10.1%) and antipsychotics (8.3%). Ami-triptyline was the most commonly pre-scribed antidepressant (46.0% ofantidepressants), carbamazepine the mostprescribed anticonvulsant (36.4% of anti-
convulsants) and haloperidol the most pre-scribed antipsychotic (66.7% of antipsy-chotics). Methylphenidate was the onlycentral nerrons system stimulant given.
Sixty young people (55.0%) did not re-ceive any psychotherapy. The most com-monly offered therapies were supportivetherapy followed by family therapy andthen behavioural therapy (Table 2).
Reviewing the records of outpatientfollow-up in the child and adolescent psy-chiatry department showed that 67.0% ofthe sample did not have any psychiatricoutpatient follow-up while 33.0% wereseen there at least once after dischargefrom the hospital.
Table 1 Medical profile of 109 inpatients agedunder 18 years referred to the psychiatricconsultation–liaison team
Medical diagnosis No. %
None 20 18.4
Epilepsy 11 10.1
Drug overdose 11 10.1
Ambiguous external genitalia 8 7.3
Orthopaedic injuries 7 6.4
Diabetes mellitus 7 6.4
Non-specific abdominal pain 4 3.7
Non-specific headache 4 3.7
Gastritis 3 2.8
Systemic lupus erythromatosus 3 2.8
Leukaemia 3 2.8
Persistent vomiting 3 2.8
Others 25 22.9
Total 109 100.0Table 2 Psychiatric profile of 109 inpatientsaged under 18 years referred to thepsychiatric consultation–liaison team
Diagnosis and treatment No. %
Psychiatric diagnosisNone 32 29.4Depressive disorder 26 23.9Adjustment disorder 11 10.1Deliberate self-harm 7 6.4Acute organic brain syndrome 6 5.5Conversion disorder 3 2.8Attention deficit disorder 3 2.8Others 21 19.3
Drugs prescribed by psychiatristNone 61 56.0Antidepressant 26 23.9Anticonvulsant 11 10.1Antipsychotic 9 8.3CNS stimulant 2 1.8
Psychotherapy receivedNone 60 55.1Supportive therapy 22 20.2Family therapy 14 12.8Behavioural therapy 13 11.9
CNS = central nervous system.
13 Inpatient child and adolescent.pmd 3/3/2005, 12:13 AM998
Eastern Mediterranean Health Journal, Vol. 9, Nos 5/6, 2003 999
DiscussionOther studies have consistently noted highrates of psychopathology in children admit-ted to hospital. For example, Stocking et al.reported that almost two-thirds of childrenadmitted to a paediatric ward would havebenefited from consultation with a childpsychiatrist [4].
Some studies have found that there is astrong relationship between neurologicaldiseases, particularly epilepsy, and psychi-atric disturbance [14,15]. In this study, ep-ilepsy formed one-tenth of referrals to thechild and adolescent psychiatry team.
Drug overdose for self-poisoning com-prised another one-tenth of referrals in thisstudy. An increasing trend of self-poisoningamong young people has been recorded inother studies [16,17]. It has been estimatedthat there are at least 100 000 cases of self-poisoning in the United Kingdom each year;most patients were in their late teens andearly twenties, and it was the most com-mon cause of emergency admission to amedical ward for young women [17].
King Khalid University Hospital is a ter-tiary centre accepting cases of ambiguousgenitalia from other hospitals for bettermedical, surgical and psychological inter-vention. So it is not surprising that 7.3% ofthe sample in this study were referred ascases of ambiguous genitalia. Relationaland behavioural difficulties and depressivereactions have been noted in children withambiguous genitalia who were admitted tohospital for reassignment of sex [18]. Theyneed to be referred to psychiatry for inten-sive psychotherapy and parental counsel-ling [19].
The next most common category of re-ferral was the 6.4% of the sample referredto psychiatry from the orthopaedic wardwith diagnoses of orthopaedic injuries. Astudy of children with orthopaedic injuries
showed that 41% had behavioural distur-bance and 35% of parents reported distressin the child that would indicate psychiatricreferral [20].
There were also a number of patientswith diabetes (6.4%) referred to the childand adolescent psychiatry team. An associ-ation between poor emotional adjustmentand poor control of diabetes has long beennoted [14,21]. The most common psychi-atric diagnoses noted among diabeticyoung people were depression, anxiety anddisruptive behaviour [21].
In this study, 3.7% of young people re-ferred for psychiatry had recurrent abdom-inal pain and another 3.7% hadnon-specific headache. These findings areconsistent with the findings of other stud-ies. For example, Campo and Fritch foundthat medically unexplained physical symp-toms are common, including headache, re-current abdominal pain, limb pain, chestpain and fatigue [22]. Children with recur-rent abdominal pain have significantly high-er levels of anxiety and depression [23].Significant association has been found be-tween headache and depression and anxietydisorders [24].
No psychiatric disorders could be con-firmed in 29.4% of children referred. Thismaybe because the presence of a medicallyunexplained physical complaint combinedwith the limited tolerance of paediatric staffto the behavioural problems of some chil-dren in an open ward may lead to unwar-ranted referrals for psychiatric evaluation.
The high rates of depressive disorder(23.9%) and adjustment disorder (10.1%)in this study are consistent with the find-ings of a study from Japan [25]. Nishiokaet al. also reported acute organic brain syn-drome among 4.9% of their referred sam-ple, a percentage that is similar to our study(5.5%) [25].
13 Inpatient child and adolescent.pmd 3/3/2005, 12:13 AM999
1000 La Revue de Santé de la Méditerranée orientale, Vol. 9, No 5/6, 2003
No psychosocial stressors were estab-lished for over three-quarters of the chil-dren and adolescents referred. Thisprobably reflects inadequate data in therecords rather than representing reality.The most reported stressor in this reviewwas family conflicts. However, a wide va-riety of psychosocial stressors for childrenhave been identified in other studies, in-cluding marital conflict, separation or di-vorce of parents, parental illness or poverty[5,26].
More than half of the young people re-ferred (56.0%) did not receive any psycho-tropic medication. This percentage isconsistent with the fact that 29.4% of pa-tients had no psychiatric disturbance diag-nosed and the rest had received some sortof psychotherapy that may have satisfiedthe need of these patients. Antidepressantswere the most commonly prescribeddrugs, as the largest number of diagnoseswere for depression or adjustment disor-der.
The psychiatric team did not offer anypsychotherapy for 55.1% of referrals. Thisis probably because the physical conditionof some patients did not allow for immedi-ate psychological intervention or becausethe paediatric ward was not suitable forconducting some programmes, so theymay have been postponed until after dis-charge. Many of the admitted children(20.2%) required supportive psychothera-py for better adjustment to the hospital en-vironment. Some of them had chronic
illnesses that indicated further need forsupport. Behavioural therapy was given to11.9% of children to modify behaviouraldisturbances observed in the ward. How-ever, literature reviews show that psycho-therapy is not enough and patient andfamily educational programmes are nowregarded as the first stage in the treatmentof many chronic or recurrent physical ill-nesses [27].
Two-thirds of referred patients did notattend a psychiatric outpatient clinic afterdischarge. This is partly because 29.4%has no psychiatric illness. In addition, itseems likely that some families are reluc-tant to bring their child to a psychiatric clin-ic as they think that their child’s problemsare medical rather than psychological. Fur-thermore, some physicians initiate a psy-chiatric consultation but then are not keento follow it up.
The results of this study cannot be gen-eralized widely as it is a retrospective studywith a small number of patients and it wasconducted in a single teaching hospital.However, we conclude that depression andadjustment disorder are commonly en-countered in medically ill children and ado-lescents. Those who are admitted withepilepsy, self-poisoning, orthopaedic inju-ries and diabetes mellitus are in real need ofpsychological assessment and intervention.Improving the paediatrician’s awareness ofpsychiatric disorders and the psychologicalaspects of medical diseases is important.
References
1. Ortiz P. General principles in child liaisonconsultation service: a literature review.European child and adolescent psychia-try, 1997, 6:1–6.
2. Gustafsson PA, Svedin CG. Cost effec-tiveness: family therapy in a pediatric
setting. Family systems medicine, 1988,6:162–75.
3. Thompson TL 2nd. Some advantages ofconsultation–liaison (medical–surgical)psychiatry becoming an added qualifi-
13 Inpatient child and adolescent.pmd 3/3/2005, 12:13 AM1000
Eastern Mediterranean Health Journal, Vol. 9, Nos 5/6, 2003 1001
cation subspecialty. Psychosomatics,1993, 34:343–9.
4. Lask B. Paediatric liaison work. In: RutterM, Taylor E, Herson L, eds. Child andadolescent psychiatry, 3rd ed. Oxford,Blackwell, 1994:996–1005.
5. Knapp PK, Harris ES. Consultation–liai-son in child psychiatry: a review of thepast 10 years. Part I: Clinical findings.Journal of the American Academy ofChild and Adolescent Psychiatry, 1998,37:17–25.
6. Awad GA, Poznanski EO. Psychiatricconsultations in a pediatric hospital.American journal of psychiatry, 1975,132:915–8.
7. Stocking M et al. Psychopathology in thepediatric hospital—implications for com-munity health. American journal of publichealth, 1972, 62:551–6.
8. Bingley L et al. The comprehensive man-agement of children in a paediatric ward:a family approach. Archives of disease inchildhood, 1980, 55:555–61.
9. Josse JD, Challener J. Liaison psycho-therapy in a hospital paediatric diabeticclinic. Archives of disease in childhood,1987, 62:518–22.
10. Tomm KM, McArthur R, Leahey M. Psy-chologic management of children withdiabetes mellitus. Clinical pediatrics,1977, 16:1151–5.
11. Guggenheim FG. A marketplace modelof consultation psychiatry in the generalhospital. American journal of psychiatry,1978, 135:1380–3.
12. Diagnostic and statistical manual ofmental disorders, 3rd ed. revised (DSMIIIR). Washington, USA, American Psy-chiatric Association, 1987.
13. Diagnostic and statistical manual ofmental disorders, 4th ed. (DSM IV).Washington, USA, American PsychiatricAssociation, 1994.
14. Kaplan H, Sadock BJ, Grebb J. The brainand behaviour. In: Sadock BJ, SadockVA, eds. Kaplan and Sadock’s synopsisof psychiatry, 7th ed. Baltimore, USA, Wil-liams and Wilkins, 1994:87–156.
15. Kaplan H, Sadock BJ, Grebb J. Delirium,dementia, amnesic and other cognitivedisorders and mental disorders due to ageneral medical condition. In: SadockBJ, Sadock VA, eds. Kaplan andSadock’s synopsis of psychiatry, 7th ed.Baltimore, USA, Williams and Wilkins1994:336–73.
16. O’Brien JP. Increase in suicide attemptsby drug ingestion. The Boston experi-ence, 1964–1974. Archives of generalpsychiatry, 1977, 34:1165–9.
17. Jones DI. Self-poisoning with drugs: thepast 20 years in Sheffield. British medi-cal journal, 1977, 1:28–9.
18. de Carmoy R. Anxiety and reconstructivesurgery in children and adolescents [inFrench]. Psychiatrie de l’enfant, 1995,38:141–202.
19. Slijper FM et al. Long-term psychologicalevaluation of intersex children. Archivesof sexual behavior, 1998, 27:125–44.
20. Stancin T et al. Acute psychosocial im-pact of pediatric orthopedic trauma withand without accompanying brain inju-ries. Journal of trauma, 1998, 45:1031–8.
21. Liss DS et al. Psychiatric illness and fam-ily support in children and adolescentswith diabetic ketoacidosis: a controlledstudy. Journal of the American Academyof Child and Adolescent Psychiatry,1998, 37:536–44.
22. Campo JV, Fritsch SL. Somatization inchildren and adolescents. Journal of theAmerican Academy of Child and Adoles-cent Psychiatry, 1994, 33:1223–35.
23. Leslie SA. Paediatric liaison. Archives ofdisease in childhood, 1992, 67:1046–9.
13 Inpatient child and adolescent.pmd 3/3/2005, 12:13 AM1001

1002 La Revue de Santé de la Méditerranée orientale, Vol. 9, No 5/6, 2003
24. Egger HL, Angold A, Costello EJ. Head-aches and psychopathology in childrenand adolescents. Journal of the Ameri-can Academy of Child and AdolescentPsychiatry, 1998, 37:951–8.
25. Nishioka Y, Nishizono M, Yamamoto J.The distribution of mental illness foundby DIS (Diagnostic Interview Schedule)among internal and orthopedic patients.Japanese journal of psychiatry and neu-rology, 1990, 44:33–54.
26. Dulcan MK. The pediatrician as gate-keeper to mental health care for children:
do parents’ concerns open the gate?Journal of the American Academy ofChild and Adolescent Psychiatry, 1990,29:453–8.
27. Godding V, Kruth M, Jamart J. Joint con-sultation for high-risk asthmatic childrenand their families, with pediatrician andchild psychiatrist as co-therapists: modeland evaluation. Family process, 1997,36:265–80.
Caring for children and adolescents with mental disorders: SettingWHO directions
Throughout the history of the WHO Mental Health Programme theattention dedicated to children and adolescents has not been com-mensurate with that dedicated to adults and the elderly. Yet, fromboth demographic and epidemiological perspectives – as well asfrom the burden of disease – mental disorders of children and ado-lescents represent a key area of concern. Hence WHO convened ameeting on Caring for Children and Adolescents with Mental Disor-ders: Setting WHO Directions from January 31 and February 1, 2002.The meeting brought together leaders in the care of children andadolescents with mental disorders from around the world. The focusof the meeting was on the care of children and adolescents withmental disorders with special emphasis on emerging issues impact-ing developing countries. Caring for children and adolescents withmental disorders: Setting WHO directions presents updated informa-tion useful for the formulation of a Child and Adolescent MentalHealth Care Plan, based on findings which emerged during theabove-mentioned meeting, as well as from other sources. The re-port can be obtained from Marketing and Dissemination, WorldHealth Organization, 20 Avenue Appia, 1211 Geneva 27, Switzerland(tel: +41 22 791 2476; fax: +41 22 791 4857; email:[email protected]). It is also available free on line at: http://www.who.int/mental_health/media/en/785.pdf
13 Inpatient child and adolescent.pmd 3/3/2005, 12:13 AM1002
Eastern Mediterranean Health Journal, Vol. 9, Nos 5/6, 2003 1003
Adolescent abuse in a communitysample in Beni Suef, Egypt:prevalence and risk factorsZ.E.M. Afifi,1 M.I. El-Lawindi,1 S.A. Ahmed2 and W.W. Basily 3
1Department of Public Health; 2Department of Psychiatry, Faculty of Medicine, Kasr El-Aini University,Cairo, Egypt.3Ministry of Health and Population, Cairo, Egypt.Received: 04/04/02; accepted: 01/10/02
ABSTRACT Adolescent abuse was studied in 555 school students (mean age 15.6 ± 1.5 years) selected bymultistage random sampling in Beni Suef in 1998. Each student received a general physical examination anda pre-coded questionnaire to identify determinants of abuse. Prevalence of abuse was 36.6%. Emotional,physical, sexual and combined abuse prevalence was 12.3%, 7.6%, 7.0% and 9.7% respectively. Significantpredictors of sexual abuse were hyperactive child, disabled child, disinterested mother, low birth order childor wasted child. For physical abuse, significant predictors were maternal disinterest, maternal education andinjuries. Significant predictors of emotional abuse were overcrowding, disease and mistreatment by a tea-cher. Violent behaviour was reported for more than 20% of the emotionally and the sexually abused.
La maltraitance des adolescents dans un échantillon communautaire à Beni Suef (Egypte) : préva-lence et facteurs de risqueRESUME La maltraitance des adolescents a été étudiée chez 555 lycéens (âge moyen 15,6 ± 1,5 ans)sélectionnés par échantillonnage aléatoire à plusieurs niveaux à Beni Suef durant l’année 1998. Chaqueadolescent a subi un examen physique général et a reçu un questionnaire précodé pour identifier lesdéterminants de la maltraitance. La prévalence de la maltraitance des adolescents était de 36,6 %. Laprévalence de la violence psychologique, physique, sexuelle et multiple était de 12,3 %, 7,6 %, 7,0 % et9,7 % respectivement. Les facteurs prédictifs significatifs de la violence sexuelle étaient l’hyperactivité del’enfant, le handicap de l’enfant, le désintérêt de la mère, le rang de naissance de l’enfant ou l’émaciation. Pourla violence physique, les facteurs prédictifs significatifs étaient le désintérêt de la mère, l’instruction de lamère et les traumatismes. Les facteurs prédictifs significatifs de la violence psychologique étaient la promis-cuité, la maladie et les mauvais traitements infligés par un enseignant. Un comportement violent était signalépour plus de 20 % des enfants ayant subi une violence psychologique et sexuelle.
14 Adolescent abuse in a community.pmd 3/3/2005, 12:13 AM1003
1004 La Revue de Santé de la Méditerranée orientale, Vol. 9, No 5/6, 2003
IntroductionChildren have been abused throughout hu-man history, but only recently has childabuse come to be seen as a major socialproblem and as a primary cause of personalproblems [1]. Child abuse has been definedas any maltreatment of a child or an adoles-cent by a guardian or caretaker [2]. Morerecently, it has also been defined as any in-jury, sexual abuse, malnutrition, physical oremotional suffering or even neglect of achild under 18 years of age inflicted by aperson responsible for that child’s welfare[3]. Abused children are prone to psychiat-ric problems, medical ailments, chronic fa-tigue, suicidal tendencies, delinquency andlow IQ [4–8]. They may develop serioussequelae that can lead to permanent disabil-ity or even death [9].
Child abuse is a major paediatric prob-lem in many countries. In 1993, approxi-mately 3 million reports of child abuse andneglect were made to child protective ser-vices agencies in the United States ofAmerica; 35% of these cases were con-firmed [10]. Incidence increased to 11.8/1000 in 1999 [11]. In a Canadian study ofreported child abuse and neglect, the annualincidence rate was 21.52 investigations ofchild abuse and neglect per 1000 children;45% of those were substantiated, 22% re-mained suspected but unconfirmed and33% were unsubstantiated [12]. Furtherevidence was provided by a 1997 Britishsurvey in which it was estimated that eachyear at least 1 child per 1000 children underthe age of 4 years suffered physical abuse[13].
In developing countries it is likely thatmost doctors working with children seecases of physical abuse and that these arejust a small portion of the total. Studiesfrom Nigeria, South Africa and the Carib-bean island of Dominica indicate the extentof the problem [14–16].
In Egypt, few studies have investigatedthe problem of child abuse. In most ofthese studies, the cases were from emer-gency or clinical departments, social wel-fare or criminal records or autopsies[8,9,17–20]. In 1994 and 1999, child abuseamong Egyptian primary-school childrenwas studied, but no data were collected re-garding the prevalence of abuse among old-er preparatory-school and secondary-school children [21,22]. Therefore, in ourstudy, we investigated child abuse in anEgyptian rural community to identify un-derlying risk factors and to detect the phys-ical and emotional consequences of childabuse.
MethodsDuring 1998, a sample of 555 adolescentsfrom preparatory schools and secondaryschools in Ihnasya El-Medina, Beni SuefGovernorate, Egypt, were selected by ran-dom cluster sampling for our study. At thattime, child abuse prevalence data wereavailable only for primary-school children[4,21]. From these data we calculated theoverall prevalence of abuse for primary-school children to be 30%. As the preva-lence of abuse is lower among olderchildren and decreases with age, we as-sumed that this figure would be halvedamong our older students [11–13,23]. Ac-cordingly the size of the sample was calcu-lated using Epi-info software, version 5,assuming 15% expected frequency with95% confidence interval. The samplingfraction was 6% of the preparatory-schooland secondary-school child population.Each of the 7 schools in Ihnasya—3 prepa-ratory and 4 secondary (1 general, 1 indus-trial, 1 technical and 1 trade)—representeda cluster from which 1 or 2 classes wererandomly selected according to the re-
14 Adolescent abuse in a community.pmd 3/3/2005, 12:13 AM1004
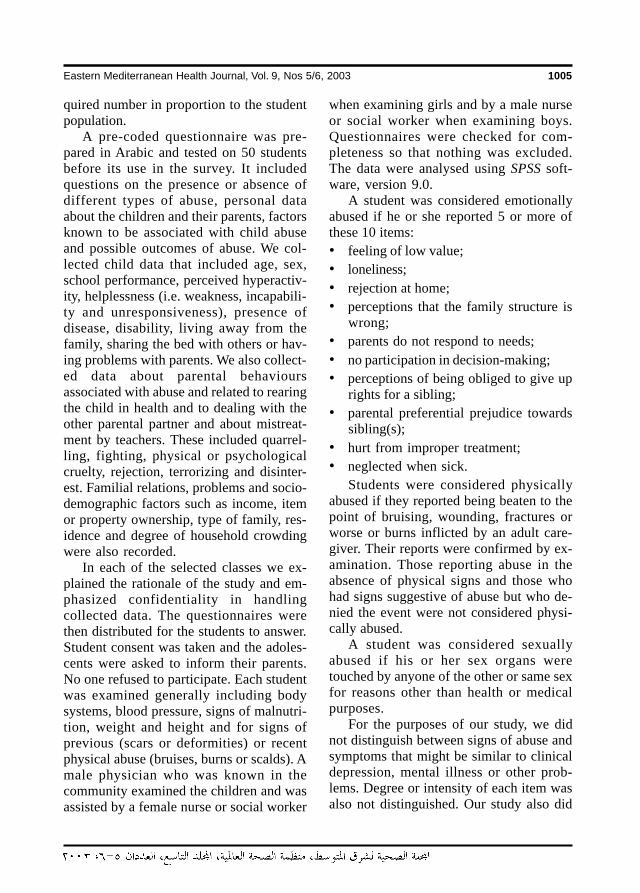
Eastern Mediterranean Health Journal, Vol. 9, Nos 5/6, 2003 1005
quired number in proportion to the studentpopulation.
A pre-coded questionnaire was pre-pared in Arabic and tested on 50 studentsbefore its use in the survey. It includedquestions on the presence or absence ofdifferent types of abuse, personal dataabout the children and their parents, factorsknown to be associated with child abuseand possible outcomes of abuse. We col-lected child data that included age, sex,school performance, perceived hyperactiv-ity, helplessness (i.e. weakness, incapabili-ty and unresponsiveness), presence ofdisease, disability, living away from thefamily, sharing the bed with others or hav-ing problems with parents. We also collect-ed data about parental behavioursassociated with abuse and related to rearingthe child in health and to dealing with theother parental partner and about mistreat-ment by teachers. These included quarrel-ling, fighting, physical or psychologicalcruelty, rejection, terrorizing and disinter-est. Familial relations, problems and socio-demographic factors such as income, itemor property ownership, type of family, res-idence and degree of household crowdingwere also recorded.
In each of the selected classes we ex-plained the rationale of the study and em-phasized confidentiality in handlingcollected data. The questionnaires werethen distributed for the students to answer.Student consent was taken and the adoles-cents were asked to inform their parents.No one refused to participate. Each studentwas examined generally including bodysystems, blood pressure, signs of malnutri-tion, weight and height and for signs ofprevious (scars or deformities) or recentphysical abuse (bruises, burns or scalds). Amale physician who was known in thecommunity examined the children and wasassisted by a female nurse or social worker
when examining girls and by a male nurseor social worker when examining boys.Questionnaires were checked for com-pleteness so that nothing was excluded.The data were analysed using SPSS soft-ware, version 9.0.
A student was considered emotionallyabused if he or she reported 5 or more ofthese 10 items:• feeling of low value;• loneliness;• rejection at home;• perceptions that the family structure is
wrong;• parents do not respond to needs;• no participation in decision-making;• perceptions of being obliged to give up
rights for a sibling;• parental preferential prejudice towards
sibling(s);• hurt from improper treatment;• neglected when sick.
Students were considered physicallyabused if they reported being beaten to thepoint of bruising, wounding, fractures orworse or burns inflicted by an adult care-giver. Their reports were confirmed by ex-amination. Those reporting abuse in theabsence of physical signs and those whohad signs suggestive of abuse but who de-nied the event were not considered physi-cally abused.
A student was considered sexuallyabused if his or her sex organs weretouched by anyone of the other or same sexfor reasons other than health or medicalpurposes.
For the purposes of our study, we didnot distinguish between signs of abuse andsymptoms that might be similar to clinicaldepression, mental illness or other prob-lems. Degree or intensity of each item wasalso not distinguished. Our study also did
14 Adolescent abuse in a community.pmd 3/3/2005, 12:13 AM1005
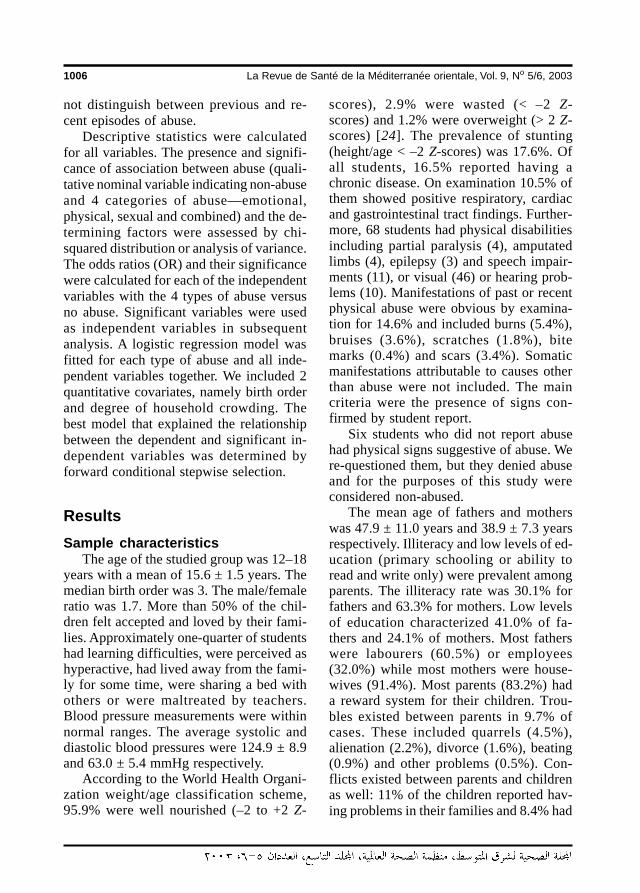
1006 La Revue de Santé de la Méditerranée orientale, Vol. 9, No 5/6, 2003
not distinguish between previous and re-cent episodes of abuse.
Descriptive statistics were calculatedfor all variables. The presence and signifi-cance of association between abuse (quali-tative nominal variable indicating non-abuseand 4 categories of abuse—emotional,physical, sexual and combined) and the de-termining factors were assessed by chi-squared distribution or analysis of variance.The odds ratios (OR) and their significancewere calculated for each of the independentvariables with the 4 types of abuse versusno abuse. Significant variables were usedas independent variables in subsequentanalysis. A logistic regression model wasfitted for each type of abuse and all inde-pendent variables together. We included 2quantitative covariates, namely birth orderand degree of household crowding. Thebest model that explained the relationshipbetween the dependent and significant in-dependent variables was determined byforward conditional stepwise selection.
ResultsSample characteristics
The age of the studied group was 12–18years with a mean of 15.6 ± 1.5 years. Themedian birth order was 3. The male/femaleratio was 1.7. More than 50% of the chil-dren felt accepted and loved by their fami-lies. Approximately one-quarter of studentshad learning difficulties, were perceived ashyperactive, had lived away from the fami-ly for some time, were sharing a bed withothers or were maltreated by teachers.Blood pressure measurements were withinnormal ranges. The average systolic anddiastolic blood pressures were 124.9 ± 8.9and 63.0 ± 5.4 mmHg respectively.
According to the World Health Organi-zation weight/age classification scheme,95.9% were well nourished (–2 to +2 Z-
scores), 2.9% were wasted (< –2 Z-scores) and 1.2% were overweight (> 2 Z-scores) [24]. The prevalence of stunting(height/age < –2 Z-scores) was 17.6%. Ofall students, 16.5% reported having achronic disease. On examination 10.5% ofthem showed positive respiratory, cardiacand gastrointestinal tract findings. Further-more, 68 students had physical disabilitiesincluding partial paralysis (4), amputatedlimbs (4), epilepsy (3) and speech impair-ments (11), or visual (46) or hearing prob-lems (10). Manifestations of past or recentphysical abuse were obvious by examina-tion for 14.6% and included burns (5.4%),bruises (3.6%), scratches (1.8%), bitemarks (0.4%) and scars (3.4%). Somaticmanifestations attributable to causes otherthan abuse were not included. The maincriteria were the presence of signs con-firmed by student report.
Six students who did not report abusehad physical signs suggestive of abuse. Were-questioned them, but they denied abuseand for the purposes of this study wereconsidered non-abused.
The mean age of fathers and motherswas 47.9 ± 11.0 years and 38.9 ± 7.3 yearsrespectively. Illiteracy and low levels of ed-ucation (primary schooling or ability toread and write only) were prevalent amongparents. The illiteracy rate was 30.1% forfathers and 63.3% for mothers. Low levelsof education characterized 41.0% of fa-thers and 24.1% of mothers. Most fatherswere labourers (60.5%) or employees(32.0%) while most mothers were house-wives (91.4%). Most parents (83.2%) hada reward system for their children. Trou-bles existed between parents in 9.7% ofcases. These included quarrels (4.5%),alienation (2.2%), divorce (1.6%), beating(0.9%) and other problems (0.5%). Con-flicts existed between parents and childrenas well: 11% of the children reported hav-ing problems in their families and 8.4% had
14 Adolescent abuse in a community.pmd 3/3/2005, 12:13 AM1006
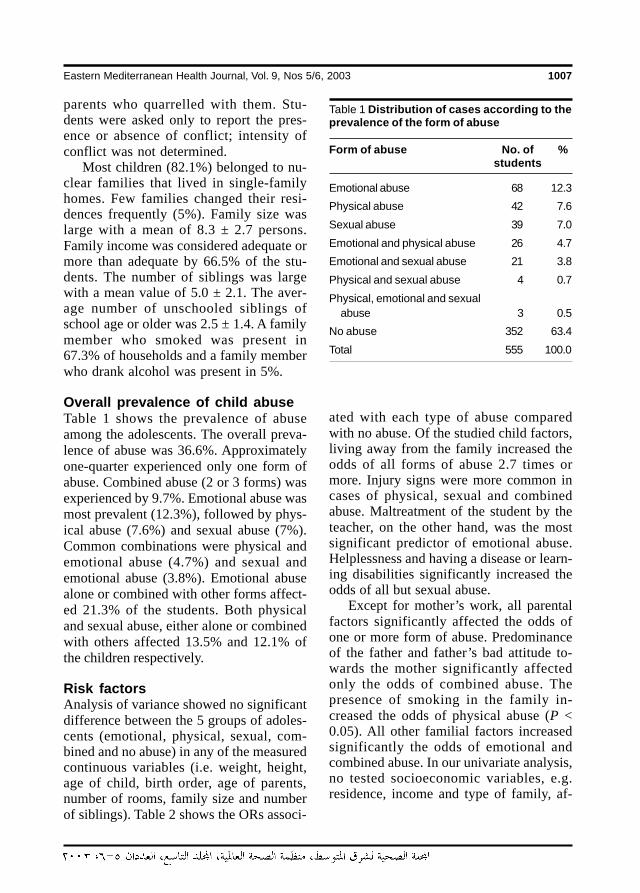
Eastern Mediterranean Health Journal, Vol. 9, Nos 5/6, 2003 1007
parents who quarrelled with them. Stu-dents were asked only to report the pres-ence or absence of conflict; intensity ofconflict was not determined.
Most children (82.1%) belonged to nu-clear families that lived in single-familyhomes. Few families changed their resi-dences frequently (5%). Family size waslarge with a mean of 8.3 ± 2.7 persons.Family income was considered adequate ormore than adequate by 66.5% of the stu-dents. The number of siblings was largewith a mean value of 5.0 ± 2.1. The aver-age number of unschooled siblings ofschool age or older was 2.5 ± 1.4. A familymember who smoked was present in67.3% of households and a family memberwho drank alcohol was present in 5%.
Overall prevalence of child abuseTable 1 shows the prevalence of abuseamong the adolescents. The overall preva-lence of abuse was 36.6%. Approximatelyone-quarter experienced only one form ofabuse. Combined abuse (2 or 3 forms) wasexperienced by 9.7%. Emotional abuse wasmost prevalent (12.3%), followed by phys-ical abuse (7.6%) and sexual abuse (7%).Common combinations were physical andemotional abuse (4.7%) and sexual andemotional abuse (3.8%). Emotional abusealone or combined with other forms affect-ed 21.3% of the students. Both physicaland sexual abuse, either alone or combinedwith others affected 13.5% and 12.1% ofthe children respectively.
Risk factorsAnalysis of variance showed no significantdifference between the 5 groups of adoles-cents (emotional, physical, sexual, com-bined and no abuse) in any of the measuredcontinuous variables (i.e. weight, height,age of child, birth order, age of parents,number of rooms, family size and numberof siblings). Table 2 shows the ORs associ-
Table 1 Distribution of cases according to theprevalence of the form of abuse
Form of abuse No. of %students
Emotional abuse 68 12.3
Physical abuse 42 7.6
Sexual abuse 39 7.0
Emotional and physical abuse 26 4.7
Emotional and sexual abuse 21 3.8
Physical and sexual abuse 4 0.7
Physical, emotional and sexualabuse 3 0.5
No abuse 352 63.4
Total 555 100.0
ated with each type of abuse comparedwith no abuse. Of the studied child factors,living away from the family increased theodds of all forms of abuse 2.7 times ormore. Injury signs were more common incases of physical, sexual and combinedabuse. Maltreatment of the student by theteacher, on the other hand, was the mostsignificant predictor of emotional abuse.Helplessness and having a disease or learn-ing disabilities significantly increased theodds of all but sexual abuse.
Except for mother’s work, all parentalfactors significantly affected the odds ofone or more form of abuse. Predominanceof the father and father’s bad attitude to-wards the mother significantly affectedonly the odds of combined abuse. Thepresence of smoking in the family in-creased the odds of physical abuse (P <0.05). All other familial factors increasedsignificantly the odds of emotional andcombined abuse. In our univariate analysis,no tested socioeconomic variables, e.g.residence, income and type of family, af-
14 Adolescent abuse in a community.pmd 3/3/2005, 12:13 AM1007
1008 La Revue de Santé de la Méditerranée orientale, Vol. 9, No 5/6, 2003
fected the occurrence of abuse significant-ly.
Table 3 shows the final logistic regres-sion models fitted with all significant vari-ables using a forward stepwise selection
procedure. Conditioning on all other vari-ables, the significant predictors of emotion-al abuse were crowding in the house,sickness of the child and teacher maltreat-ment; the estimated odds of abuse (Exp (β)
Table 2 Odds ratios of risk factors associated with each type ofabuse
Risk factors Emotional Physical Sexual Combined
Child factorsSex (male) 1.4 1.5 2.3* 1.2Helplessness 3.3** 2.9* 2.4 3.8**Hyperactivity 2.1* 1.4 3.1** 2.1*Wasting 2.6 3.0 6.6** 0.01Having disease 2.9** 2.9* 0.6 3.3**Having disability 1.4 2.6* 1.5 1.6Having learning difficulty 3.4** 2.4* 1.8 2.6**Living away from family 2.7** 4.0** 3.0** 2.9**Sharing bed with others 1.6 1.1 1.6 3.1**Injury signs 1.6 145.4** 1.8* 29.5**Mistreated by teacher 4.0** 1.3 1.4 3.3**
Parental factorsMother
Education (high) 1.6 6.4* 0.0 2.0Work 1.6 1.2 2.0 0.3Disease 2.0 1.7 2.5* 6.9**Cruelty 2.3 1.5 0.4 3.4**Disinterest 3.0* 2.2 5.7** 5.3**
FatherEducation (middle) 0.8 2.3* 1.4 0.5Disease 2.1* 2.2* 1.9 4.9**Cruelty 1.5 1.2 0.5 0.5*Disinterest 0.8 1.4 4.0** 2.0Prison 2.6 1.3 4.8** 3.2*
Familial factorsPredominance (father) 0.8 1.6 1.2 0.5*Father has bad attitudetowards mother 2.1 0.0 1.0 3.1*Parents quarrel with child 3.3* 1.3 1.1 3.4**Trouble between parents 3.3** 1.8 1.9 6.5**Problems in the family 2.6** 1.8 1.4 2.3*Smoking 1.3 2.7* 1.0 1.3Reward system 0.2** 0.9 0.3 0.2**
*P < 0.05, **P < 0.01.
14 Adolescent abuse in a community.pmd 3/3/2005, 12:13 AM1008
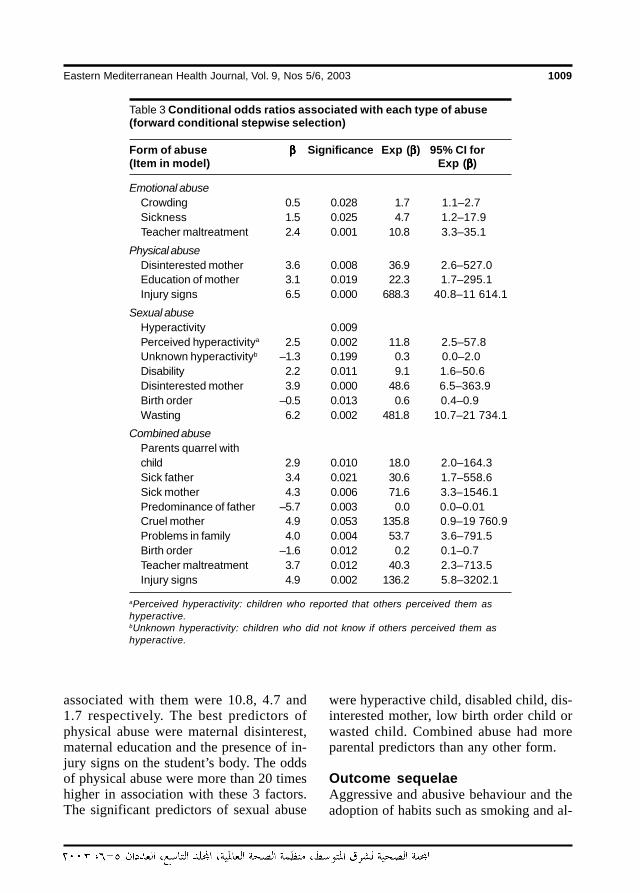
Eastern Mediterranean Health Journal, Vol. 9, Nos 5/6, 2003 1009
associated with them were 10.8, 4.7 and1.7 respectively. The best predictors ofphysical abuse were maternal disinterest,maternal education and the presence of in-jury signs on the student’s body. The oddsof physical abuse were more than 20 timeshigher in association with these 3 factors.The significant predictors of sexual abuse
were hyperactive child, disabled child, dis-interested mother, low birth order child orwasted child. Combined abuse had moreparental predictors than any other form.
Outcome sequelaeAggressive and abusive behaviour and theadoption of habits such as smoking and al-
Table 3 Conditional odds ratios associated with each type of abuse(forward conditional stepwise selection)
Form of abuse βββββ Significance Exp (βββββ) 95% CI for(Item in model) Exp (βββββ)
Emotional abuseCrowding 0.5 0.028 1.7 1.1–2.7Sickness 1.5 0.025 4.7 1.2–17.9Teacher maltreatment 2.4 0.001 10.8 3.3–35.1
Physical abuseDisinterested mother 3.6 0.008 36.9 2.6–527.0Education of mother 3.1 0.019 22.3 1.7–295.1Injury signs 6.5 0.000 688.3 40.8–11 614.1
Sexual abuseHyperactivity 0.009Perceived hyperactivitya 2.5 0.002 11.8 2.5–57.8Unknown hyperactivityb –1.3 0.199 0.3 0.0–2.0Disability 2.2 0.011 9.1 1.6–50.6Disinterested mother 3.9 0.000 48.6 6.5–363.9Birth order –0.5 0.013 0.6 0.4–0.9Wasting 6.2 0.002 481.8 10.7–21 734.1
Combined abuseParents quarrel withchild 2.9 0.010 18.0 2.0–164.3Sick father 3.4 0.021 30.6 1.7–558.6Sick mother 4.3 0.006 71.6 3.3–1546.1Predominance of father –5.7 0.003 0.0 0.0–0.01Cruel mother 4.9 0.053 135.8 0.9–19 760.9Problems in family 4.0 0.004 53.7 3.6–791.5Birth order –1.6 0.012 0.2 0.1–0.7Teacher maltreatment 3.7 0.012 40.3 2.3–713.5Injury signs 4.9 0.002 136.2 5.8–3202.1
aPerceived hyperactivity: children who reported that others perceived them ashyperactive.bUnknown hyperactivity: children who did not know if others perceived them ashyperactive.
14 Adolescent abuse in a community.pmd 3/3/2005, 12:13 AM1009
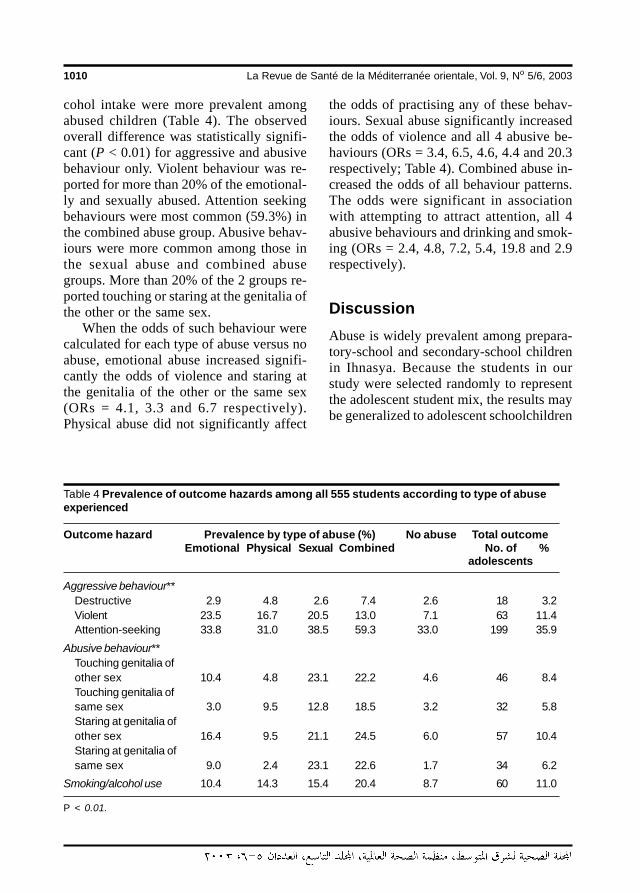
1010 La Revue de Santé de la Méditerranée orientale, Vol. 9, No 5/6, 2003
cohol intake were more prevalent amongabused children (Table 4). The observedoverall difference was statistically signifi-cant (P < 0.01) for aggressive and abusivebehaviour only. Violent behaviour was re-ported for more than 20% of the emotional-ly and sexually abused. Attention seekingbehaviours were most common (59.3%) inthe combined abuse group. Abusive behav-iours were more common among those inthe sexual abuse and combined abusegroups. More than 20% of the 2 groups re-ported touching or staring at the genitalia ofthe other or the same sex.
When the odds of such behaviour werecalculated for each type of abuse versus noabuse, emotional abuse increased signifi-cantly the odds of violence and staring atthe genitalia of the other or the same sex(ORs = 4.1, 3.3 and 6.7 respectively).Physical abuse did not significantly affect
the odds of practising any of these behav-iours. Sexual abuse significantly increasedthe odds of violence and all 4 abusive be-haviours (ORs = 3.4, 6.5, 4.6, 4.4 and 20.3respectively; Table 4). Combined abuse in-creased the odds of all behaviour patterns.The odds were significant in associationwith attempting to attract attention, all 4abusive behaviours and drinking and smok-ing (ORs = 2.4, 4.8, 7.2, 5.4, 19.8 and 2.9respectively).
DiscussionAbuse is widely prevalent among prepara-tory-school and secondary-school childrenin Ihnasya. Because the students in ourstudy were selected randomly to representthe adolescent student mix, the results maybe generalized to adolescent schoolchildren
Table 4 Prevalence of outcome hazards among all 555 students according to type of abuseexperienced
Outcome hazard Prevalence by type of abuse (%) No abuse Total outcomeEmotional Physical Sexual Combined No. of %
adolescents
Aggressive behaviour**Destructive 2.9 4.8 2.6 7.4 2.6 18 3.2Violent 23.5 16.7 20.5 13.0 7.1 63 11.4Attention-seeking 33.8 31.0 38.5 59.3 33.0 199 35.9
Abusive behaviour**Touching genitalia ofother sex 10.4 4.8 23.1 22.2 4.6 46 8.4Touching genitalia ofsame sex 3.0 9.5 12.8 18.5 3.2 32 5.8Staring at genitalia ofother sex 16.4 9.5 21.1 24.5 6.0 57 10.4Staring at genitalia ofsame sex 9.0 2.4 23.1 22.6 1.7 34 6.2
Smoking/alcohol use 10.4 14.3 15.4 20.4 8.7 60 11.0
P < 0.01.
14 Adolescent abuse in a community.pmd 3/3/2005, 12:14 AM1010
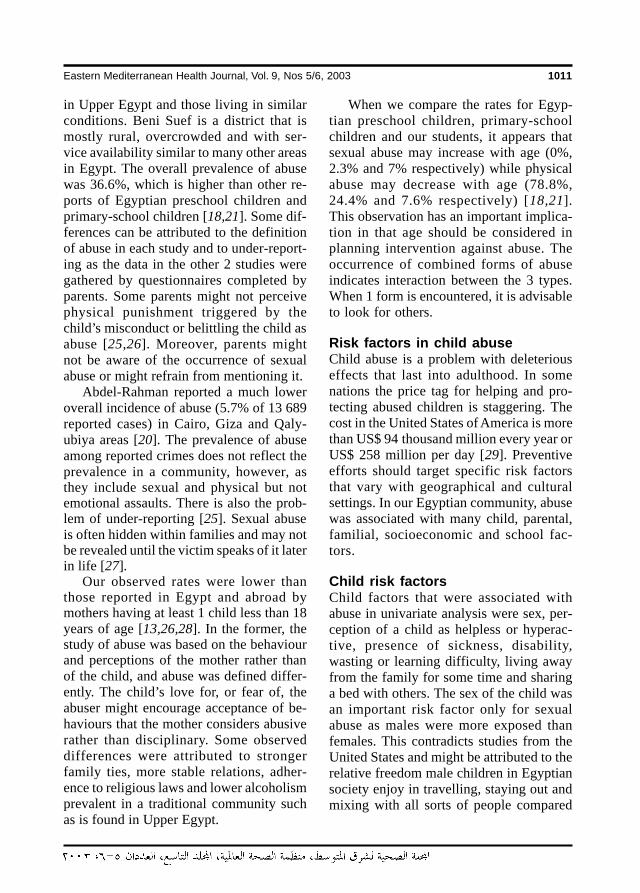
Eastern Mediterranean Health Journal, Vol. 9, Nos 5/6, 2003 1011
in Upper Egypt and those living in similarconditions. Beni Suef is a district that ismostly rural, overcrowded and with ser-vice availability similar to many other areasin Egypt. The overall prevalence of abusewas 36.6%, which is higher than other re-ports of Egyptian preschool children andprimary-school children [18,21]. Some dif-ferences can be attributed to the definitionof abuse in each study and to under-report-ing as the data in the other 2 studies weregathered by questionnaires completed byparents. Some parents might not perceivephysical punishment triggered by thechild’s misconduct or belittling the child asabuse [25,26]. Moreover, parents mightnot be aware of the occurrence of sexualabuse or might refrain from mentioning it.
Abdel-Rahman reported a much loweroverall incidence of abuse (5.7% of 13 689reported cases) in Cairo, Giza and Qaly-ubiya areas [20]. The prevalence of abuseamong reported crimes does not reflect theprevalence in a community, however, asthey include sexual and physical but notemotional assaults. There is also the prob-lem of under-reporting [25]. Sexual abuseis often hidden within families and may notbe revealed until the victim speaks of it laterin life [27].
Our observed rates were lower thanthose reported in Egypt and abroad bymothers having at least 1 child less than 18years of age [13,26,28]. In the former, thestudy of abuse was based on the behaviourand perceptions of the mother rather thanof the child, and abuse was defined differ-ently. The child’s love for, or fear of, theabuser might encourage acceptance of be-haviours that the mother considers abusiverather than disciplinary. Some observeddifferences were attributed to strongerfamily ties, more stable relations, adher-ence to religious laws and lower alcoholismprevalent in a traditional community suchas is found in Upper Egypt.
When we compare the rates for Egyp-tian preschool children, primary-schoolchildren and our students, it appears thatsexual abuse may increase with age (0%,2.3% and 7% respectively) while physicalabuse may decrease with age (78.8%,24.4% and 7.6% respectively) [18,21].This observation has an important implica-tion in that age should be considered inplanning intervention against abuse. Theoccurrence of combined forms of abuseindicates interaction between the 3 types.When 1 form is encountered, it is advisableto look for others.
Risk factors in child abuseChild abuse is a problem with deleteriouseffects that last into adulthood. In somenations the price tag for helping and pro-tecting abused children is staggering. Thecost in the United States of America is morethan US$ 94 thousand million every year orUS$ 258 million per day [29]. Preventiveefforts should target specific risk factorsthat vary with geographical and culturalsettings. In our Egyptian community, abusewas associated with many child, parental,familial, socioeconomic and school fac-tors.
Child risk factorsChild factors that were associated withabuse in univariate analysis were sex, per-ception of a child as helpless or hyperac-tive, presence of sickness, disability,wasting or learning difficulty, living awayfrom the family for some time and sharinga bed with others. The sex of the child wasan important risk factor only for sexualabuse as males were more exposed thanfemales. This contradicts studies from theUnited States and might be attributed to therelative freedom male children in Egyptiansociety enjoy in travelling, staying out andmixing with all sorts of people compared
14 Adolescent abuse in a community.pmd 3/3/2005, 12:14 AM1011
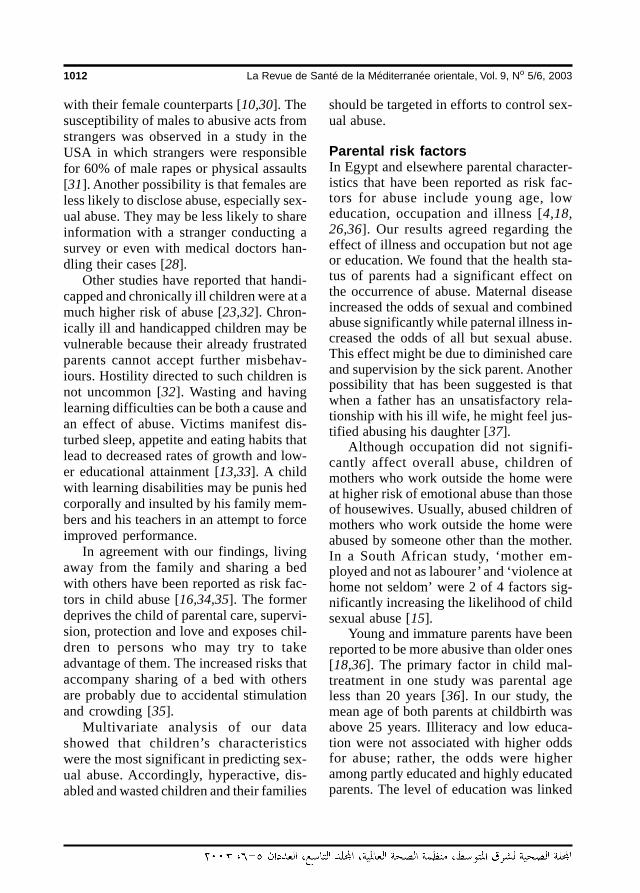
1012 La Revue de Santé de la Méditerranée orientale, Vol. 9, No 5/6, 2003
with their female counterparts [10,30]. Thesusceptibility of males to abusive acts fromstrangers was observed in a study in theUSA in which strangers were responsiblefor 60% of male rapes or physical assaults[31]. Another possibility is that females areless likely to disclose abuse, especially sex-ual abuse. They may be less likely to shareinformation with a stranger conducting asurvey or even with medical doctors han-dling their cases [28].
Other studies have reported that handi-capped and chronically ill children were at amuch higher risk of abuse [23,32]. Chron-ically ill and handicapped children may bevulnerable because their already frustratedparents cannot accept further misbehav-iours. Hostility directed to such children isnot uncommon [32]. Wasting and havinglearning difficulties can be both a cause andan effect of abuse. Victims manifest dis-turbed sleep, appetite and eating habits thatlead to decreased rates of growth and low-er educational attainment [13,33]. A childwith learning disabilities may be punis hedcorporally and insulted by his family mem-bers and his teachers in an attempt to forceimproved performance.
In agreement with our findings, livingaway from the family and sharing a bedwith others have been reported as risk fac-tors in child abuse [16,34,35]. The formerdeprives the child of parental care, supervi-sion, protection and love and exposes chil-dren to persons who may try to takeadvantage of them. The increased risks thataccompany sharing of a bed with othersare probably due to accidental stimulationand crowding [35].
Multivariate analysis of our datashowed that children’s characteristicswere the most significant in predicting sex-ual abuse. Accordingly, hyperactive, dis-abled and wasted children and their families
should be targeted in efforts to control sex-ual abuse.
Parental risk factorsIn Egypt and elsewhere parental character-istics that have been reported as risk fac-tors for abuse include young age, loweducation, occupation and illness [4,18,26,36]. Our results agreed regarding theeffect of illness and occupation but not ageor education. We found that the health sta-tus of parents had a significant effect onthe occurrence of abuse. Maternal diseaseincreased the odds of sexual and combinedabuse significantly while paternal illness in-creased the odds of all but sexual abuse.This effect might be due to diminished careand supervision by the sick parent. Anotherpossibility that has been suggested is thatwhen a father has an unsatisfactory rela-tionship with his ill wife, he might feel jus-tified abusing his daughter [37].
Although occupation did not signifi-cantly affect overall abuse, children ofmothers who work outside the home wereat higher risk of emotional abuse than thoseof housewives. Usually, abused children ofmothers who work outside the home wereabused by someone other than the mother.In a South African study, ‘mother em-ployed and not as labourer’ and ‘violence athome not seldom’ were 2 of 4 factors sig-nificantly increasing the likelihood of childsexual abuse [15].
Young and immature parents have beenreported to be more abusive than older ones[18,36]. The primary factor in child mal-treatment in one study was parental ageless than 20 years [36]. In our study, themean age of both parents at childbirth wasabove 25 years. Illiteracy and low educa-tion were not associated with higher oddsfor abuse; rather, the odds were higheramong partly educated and highly educatedparents. The level of education was linked
14 Adolescent abuse in a community.pmd 3/3/2005, 12:14 AM1012
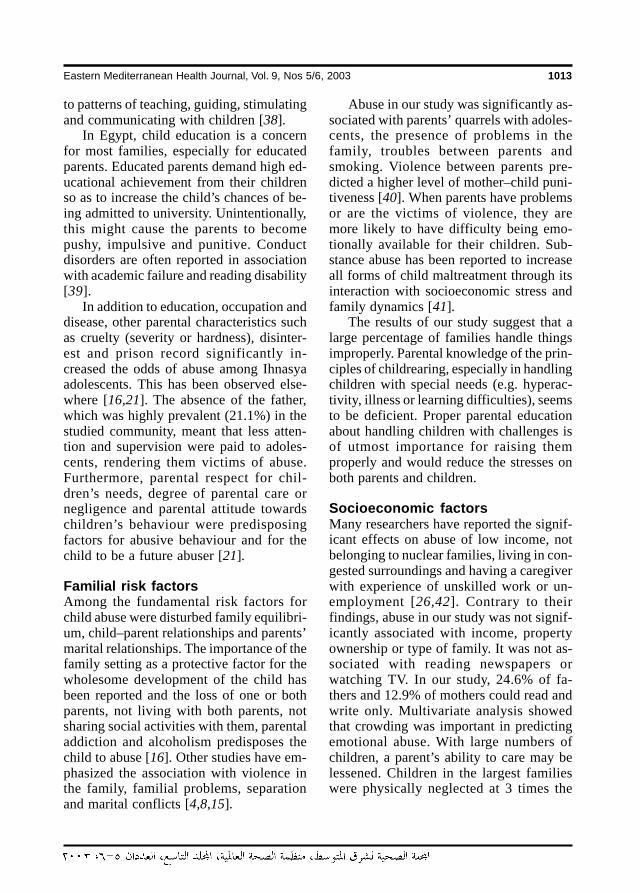
Eastern Mediterranean Health Journal, Vol. 9, Nos 5/6, 2003 1013
to patterns of teaching, guiding, stimulatingand communicating with children [38].
In Egypt, child education is a concernfor most families, especially for educatedparents. Educated parents demand high ed-ucational achievement from their childrenso as to increase the child’s chances of be-ing admitted to university. Unintentionally,this might cause the parents to becomepushy, impulsive and punitive. Conductdisorders are often reported in associationwith academic failure and reading disability[39].
In addition to education, occupation anddisease, other parental characteristics suchas cruelty (severity or hardness), disinter-est and prison record significantly in-creased the odds of abuse among Ihnasyaadolescents. This has been observed else-where [16,21]. The absence of the father,which was highly prevalent (21.1%) in thestudied community, meant that less atten-tion and supervision were paid to adoles-cents, rendering them victims of abuse.Furthermore, parental respect for chil-dren’s needs, degree of parental care ornegligence and parental attitude towardschildren’s behaviour were predisposingfactors for abusive behaviour and for thechild to be a future abuser [21].
Familial risk factorsAmong the fundamental risk factors forchild abuse were disturbed family equilibri-um, child–parent relationships and parents’marital relationships. The importance of thefamily setting as a protective factor for thewholesome development of the child hasbeen reported and the loss of one or bothparents, not living with both parents, notsharing social activities with them, parentaladdiction and alcoholism predisposes thechild to abuse [16]. Other studies have em-phasized the association with violence inthe family, familial problems, separationand marital conflicts [4,8,15].
Abuse in our study was significantly as-sociated with parents’ quarrels with adoles-cents, the presence of problems in thefamily, troubles between parents andsmoking. Violence between parents pre-dicted a higher level of mother–child puni-tiveness [40]. When parents have problemsor are the victims of violence, they aremore likely to have difficulty being emo-tionally available for their children. Sub-stance abuse has been reported to increaseall forms of child maltreatment through itsinteraction with socioeconomic stress andfamily dynamics [41].
The results of our study suggest that alarge percentage of families handle thingsimproperly. Parental knowledge of the prin-ciples of childrearing, especially in handlingchildren with special needs (e.g. hyperac-tivity, illness or learning difficulties), seemsto be deficient. Proper parental educationabout handling children with challenges isof utmost importance for raising themproperly and would reduce the stresses onboth parents and children.
Socioeconomic factorsMany researchers have reported the signif-icant effects on abuse of low income, notbelonging to nuclear families, living in con-gested surroundings and having a caregiverwith experience of unskilled work or un-employment [26,42]. Contrary to theirfindings, abuse in our study was not signif-icantly associated with income, propertyownership or type of family. It was not as-sociated with reading newspapers orwatching TV. In our study, 24.6% of fa-thers and 12.9% of mothers could read andwrite only. Multivariate analysis showedthat crowding was important in predictingemotional abuse. With large numbers ofchildren, a parent’s ability to care may belessened. Children in the largest familieswere physically neglected at 3 times the
14 Adolescent abuse in a community.pmd 3/3/2005, 12:14 AM1013
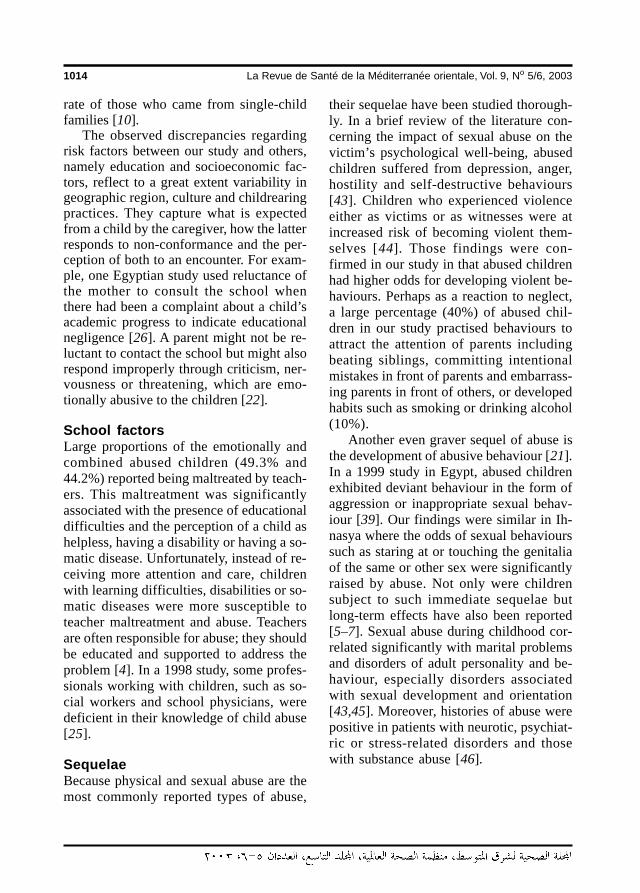
1014 La Revue de Santé de la Méditerranée orientale, Vol. 9, No 5/6, 2003
rate of those who came from single-childfamilies [10].
The observed discrepancies regardingrisk factors between our study and others,namely education and socioeconomic fac-tors, reflect to a great extent variability ingeographic region, culture and childrearingpractices. They capture what is expectedfrom a child by the caregiver, how the latterresponds to non-conformance and the per-ception of both to an encounter. For exam-ple, one Egyptian study used reluctance ofthe mother to consult the school whenthere had been a complaint about a child’sacademic progress to indicate educationalnegligence [26]. A parent might not be re-luctant to contact the school but might alsorespond improperly through criticism, ner-vousness or threatening, which are emo-tionally abusive to the children [22].
School factorsLarge proportions of the emotionally andcombined abused children (49.3% and44.2%) reported being maltreated by teach-ers. This maltreatment was significantlyassociated with the presence of educationaldifficulties and the perception of a child ashelpless, having a disability or having a so-matic disease. Unfortunately, instead of re-ceiving more attention and care, childrenwith learning difficulties, disabilities or so-matic diseases were more susceptible toteacher maltreatment and abuse. Teachersare often responsible for abuse; they shouldbe educated and supported to address theproblem [4]. In a 1998 study, some profes-sionals working with children, such as so-cial workers and school physicians, weredeficient in their knowledge of child abuse[25].
SequelaeBecause physical and sexual abuse are themost commonly reported types of abuse,
their sequelae have been studied thorough-ly. In a brief review of the literature con-cerning the impact of sexual abuse on thevictim’s psychological well-being, abusedchildren suffered from depression, anger,hostility and self-destructive behaviours[43]. Children who experienced violenceeither as victims or as witnesses were atincreased risk of becoming violent them-selves [44]. Those findings were con-firmed in our study in that abused childrenhad higher odds for developing violent be-haviours. Perhaps as a reaction to neglect,a large percentage (40%) of abused chil-dren in our study practised behaviours toattract the attention of parents includingbeating siblings, committing intentionalmistakes in front of parents and embarrass-ing parents in front of others, or developedhabits such as smoking or drinking alcohol(10%).
Another even graver sequel of abuse isthe development of abusive behaviour [21].In a 1999 study in Egypt, abused childrenexhibited deviant behaviour in the form ofaggression or inappropriate sexual behav-iour [39]. Our findings were similar in Ih-nasya where the odds of sexual behaviourssuch as staring at or touching the genitaliaof the same or other sex were significantlyraised by abuse. Not only were childrensubject to such immediate sequelae butlong-term effects have also been reported[5–7]. Sexual abuse during childhood cor-related significantly with marital problemsand disorders of adult personality and be-haviour, especially disorders associatedwith sexual development and orientation[43,45]. Moreover, histories of abuse werepositive in patients with neurotic, psychiat-ric or stress-related disorders and thosewith substance abuse [46].
14 Adolescent abuse in a community.pmd 3/3/2005, 12:14 AM1014
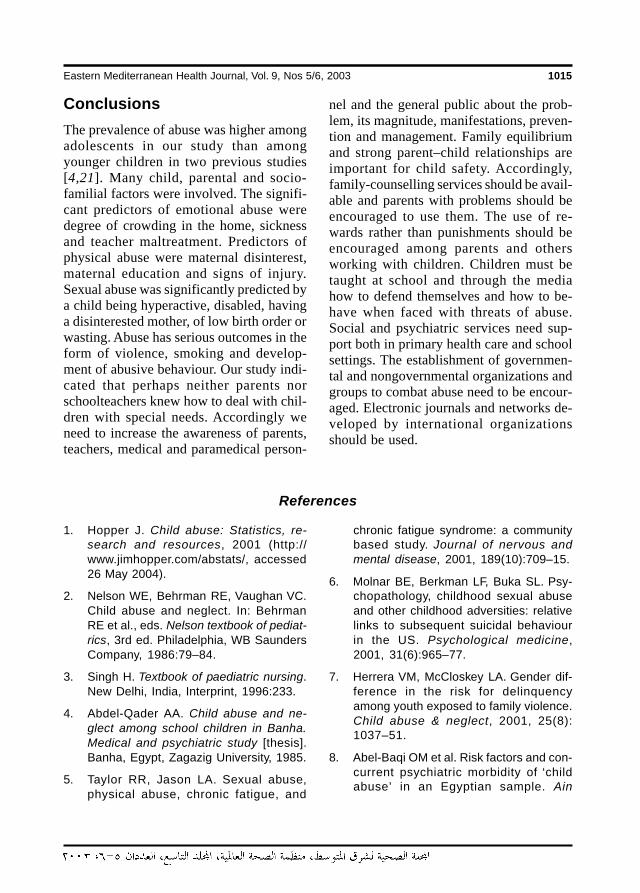
Eastern Mediterranean Health Journal, Vol. 9, Nos 5/6, 2003 1015
ConclusionsThe prevalence of abuse was higher amongadolescents in our study than amongyounger children in two previous studies[4,21]. Many child, parental and socio-familial factors were involved. The signifi-cant predictors of emotional abuse weredegree of crowding in the home, sicknessand teacher maltreatment. Predictors ofphysical abuse were maternal disinterest,maternal education and signs of injury.Sexual abuse was significantly predicted bya child being hyperactive, disabled, havinga disinterested mother, of low birth order orwasting. Abuse has serious outcomes in theform of violence, smoking and develop-ment of abusive behaviour. Our study indi-cated that perhaps neither parents norschoolteachers knew how to deal with chil-dren with special needs. Accordingly weneed to increase the awareness of parents,teachers, medical and paramedical person-
nel and the general public about the prob-lem, its magnitude, manifestations, preven-tion and management. Family equilibriumand strong parent–child relationships areimportant for child safety. Accordingly,family-counselling services should be avail-able and parents with problems should beencouraged to use them. The use of re-wards rather than punishments should beencouraged among parents and othersworking with children. Children must betaught at school and through the mediahow to defend themselves and how to be-have when faced with threats of abuse.Social and psychiatric services need sup-port both in primary health care and schoolsettings. The establishment of governmen-tal and nongovernmental organizations andgroups to combat abuse need to be encour-aged. Electronic journals and networks de-veloped by international organizationsshould be used.
References
1. Hopper J. Child abuse: Statistics, re-search and resources, 2001 (http://www.jimhopper.com/abstats/, accessed26 May 2004).
2. Nelson WE, Behrman RE, Vaughan VC.Child abuse and neglect. In: BehrmanRE et al., eds. Nelson textbook of pediat-rics, 3rd ed. Philadelphia, WB SaundersCompany, 1986:79–84.
3. Singh H. Textbook of paediatric nursing.New Delhi, India, Interprint, 1996:233.
4. Abdel-Qader AA. Child abuse and ne-glect among school children in Banha.Medical and psychiatric study [thesis].Banha, Egypt, Zagazig University, 1985.
5. Taylor RR, Jason LA. Sexual abuse,physical abuse, chronic fatigue, and
chronic fatigue syndrome: a communitybased study. Journal of nervous andmental disease, 2001, 189(10):709–15.
6. Molnar BE, Berkman LF, Buka SL. Psy-chopathology, childhood sexual abuseand other childhood adversities: relativelinks to subsequent suicidal behaviourin the US. Psychological medicine,2001, 31(6):965–77.
7. Herrera VM, McCloskey LA. Gender dif-ference in the risk for delinquencyamong youth exposed to family violence.Child abuse & neglect, 2001, 25(8):1037–51.
8. Abel-Baqi OM et al. Risk factors and con-current psychiatric morbidity of ‘childabuse’ in an Egyptian sample. Ain
14 Adolescent abuse in a community.pmd 3/3/2005, 12:14 AM1015
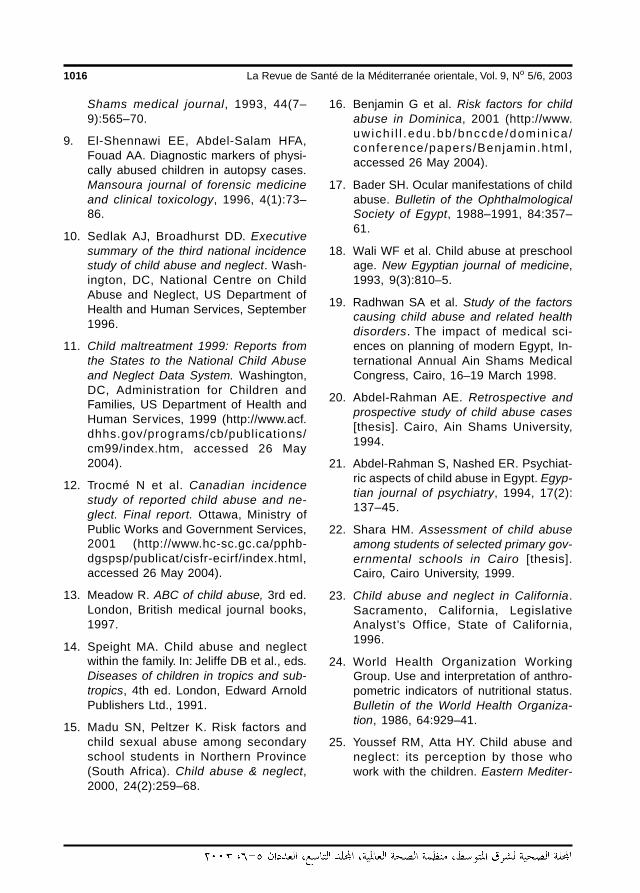
1016 La Revue de Santé de la Méditerranée orientale, Vol. 9, No 5/6, 2003
Shams medical journal, 1993, 44(7–9):565–70.
9. El-Shennawi EE, Abdel-Salam HFA,Fouad AA. Diagnostic markers of physi-cally abused children in autopsy cases.Mansoura journal of forensic medicineand clinical toxicology, 1996, 4(1):73–86.
10. Sedlak AJ, Broadhurst DD. Executivesummary of the third national incidencestudy of child abuse and neglect. Wash-ington, DC, National Centre on ChildAbuse and Neglect, US Department ofHealth and Human Services, September1996.
11. Child maltreatment 1999: Reports fromthe States to the National Child Abuseand Neglect Data System. Washington,DC, Administration for Children andFamilies, US Department of Health andHuman Services, 1999 (http://www.acf.dhhs.gov/programs/cb/publications/cm99/index.htm, accessed 26 May2004).
12. Trocmé N et al. Canadian incidencestudy of reported child abuse and ne-glect. Final report. Ottawa, Ministry ofPublic Works and Government Services,2001 (http://www.hc-sc.gc.ca/pphb-dgspsp/publicat/cisfr-ecirf/index.html,accessed 26 May 2004).
13. Meadow R. ABC of child abuse, 3rd ed.London, British medical journal books,1997.
14. Speight MA. Child abuse and neglectwithin the family. In: Jeliffe DB et al., eds.Diseases of children in tropics and sub-tropics, 4th ed. London, Edward ArnoldPublishers Ltd., 1991.
15. Madu SN, Peltzer K. Risk factors andchild sexual abuse among secondaryschool students in Northern Province(South Africa). Child abuse & neglect,2000, 24(2):259–68.
16. Benjamin G et al. Risk factors for childabuse in Dominica, 2001 (http://www.uwich i l l .edu.bb/bnccde/domin ica /conference/papers/Benjamin.html,accessed 26 May 2004).
17. Bader SH. Ocular manifestations of childabuse. Bulletin of the OphthalmologicalSociety of Egypt, 1988–1991, 84:357–61.
18. Wali WF et al. Child abuse at preschoolage. New Egyptian journal of medicine,1993, 9(3):810–5.
19. Radhwan SA et al. Study of the factorscausing child abuse and related healthdisorders. The impact of medical sci-ences on planning of modern Egypt, In-ternational Annual Ain Shams MedicalCongress, Cairo, 16–19 March 1998.
20. Abdel-Rahman AE. Retrospective andprospective study of child abuse cases[thesis]. Cairo, Ain Shams University,1994.
21. Abdel-Rahman S, Nashed ER. Psychiat-ric aspects of child abuse in Egypt. Egyp-tian journal of psychiatry, 1994, 17(2):137–45.
22. Shara HM. Assessment of child abuseamong students of selected primary gov-ernmental schools in Cairo [thesis].Cairo, Cairo University, 1999.
23. Child abuse and neglect in California.Sacramento, California, LegislativeAnalyst’s Office, State of California,1996.
24. World Health Organization WorkingGroup. Use and interpretation of anthro-pometric indicators of nutritional status.Bulletin of the World Health Organiza-tion, 1986, 64:929–41.
25. Youssef RM, Atta HY. Child abuse andneglect: its perception by those whowork with the children. Eastern Mediter-
14 Adolescent abuse in a community.pmd 3/3/2005, 12:14 AM1016
Eastern Mediterranean Health Journal, Vol. 9, Nos 5/6, 2003 1017
ranean health journal, 1998, 4(2):276–92.
26. Atta HY, Youssef RM. Child abuse andneglect: mothers’ behaviour and percep-tions. Eastern Mediterranean healthjournal, 1998, 4(3):502–12.
27. Barker P, Barker P. Basic child psychiatry,5th ed. Oxford, Blackwell Scientific,1988.
28. Mazza D, Dennerstein L, Ryan V. Physi-cal, sexual and emotional violenceagainst women: a general practice–based prevalence study. Medical journalof Australia, 1996, 164(1):14–7.
29. Fromm S. Total estimated cost of childabuse and neglect in the United States:statistical evidence. Chicago, Illinois,National Center on Child Abuse Preven-tion Research, 2001 (http://www.preventchi ldabuse.org/learn_more/research_docs/cost_analysis.pdf, ac-cessed 26 May 2004).
30. Anderson J et al. Prevalence of child-hood sexual abuse experience in a com-munity sample of women. Journal of theAmerican Academy of Child and Adoles-cent Psychiatry, 1993, 32:911–9.
31. Tijaden P, Thoennes N. Prevalence, inci-dence and consequences of violenceagainst women: findings from the Na-tional Violence Against Women Survey.Washington DC, National Institute ofJustice, and Atlanta, Georgia, Centersfor Disease Control and Prevention,1998.
32. Walker LS, Garber J, Van Slyke DA. Doparents excuse the misbehavior of thechildren with physical and emotionalsymptoms? An investigation of the pedi-atric sick role. Journal of pediatric psy-chology, 1995, 20(3):329–45.
33. Osofsky JD. Addressing youth victimiza-tion. Washington, DC, Office of JuvenileJustice and Delinquency Prevention, US
Department of Justice, 2001 (http://w w w . n c j r s . o r g / h t m l / o j j d p /a c t i o n _ p l a n _ u p d a t e _ 2 0 0 1 _ 1 0 /index.html, accessed 26 May 2004).
34. Flanagan CA. Change in family work sta-tus: effects on parent–adolescent deci-sion making. Child development, 1990,61:163–77.
35. Sumba RO, Bwibo NO. Child battering inNairobi, Kenya. East African medicaljournal, 1993, 70(11):688–92.
36. Sidebotham P et al. Avon LongitudinalStudy of Parents and Children. Childmaltreatment in the ‘children of the nine-ties’: a longitudinal study of parental riskfactors. Child abuse & neglect, 2001,25(9):1177–200.
37. Trusedell D, Deschner J, McNeil J. Inci-dence of wife abuse in incestuous fami-lies. Social work journal, 1986, 31(2):138–40.
38. Herrenkohl EC et al. Risk factors for be-havioral dysfunction: the relative impactof maltreatment, SES, physical healthproblems, cognitive ability, and quality ofparent–child interaction. Child abuse &neglect, 1995, 19(2):191–203.
39. Saif MA. Deviant behaviour in children[thesis]. Cairo, Ain Shams University,1999.
40. Miller BA, Smyth NJ, Mudar PJ. Mothers’alcohol and other drug problems andtheir punitiveness toward their children.Journal of studies on alcohol, 1999,60(5):632–42.
41. Sheridan MJ. A proposed interge-nerational model of substance abuse.Family functioning and abuse/neglect.Child abuse & neglect, 1995, 19(5):519–30.
42. Isaranurug S et al. Factors relating to theaggressive behaviour of primary care-giver toward a child. Journal of the Medi-
14 Adolescent abuse in a community.pmd 3/3/2005, 12:14 AM1017
1018 La Revue de Santé de la Méditerranée orientale, Vol. 9, No 5/6, 2003
cal Association of Thailand, 2001,84(10):1481–9.
43. Foss M. The calculation of damages insexual abuse cases. The expert witnessnewsletter, 1999, 4(3) (http://www.economica.ca/ew43p1.htm, accessed26 May 2004).
44. Marans S, Berkman JD. Child develop-ment-community policing: partnership ina climate of violence. Washington DC,Office of Juvenile Justice and Delin-
quency Prevention, US Department ofJustice, March 1997.
45. Sayed YH, Ali S, El-Bakery A. Late psy-chiatric sequelae of childhood sexualabuse [thesis]. Cairo, Cairo University,1998.
46. Gil-Rivas V et al. Sexual and physicalabuse: do they compromise drug treat-ment outcomes? Journal of substanceabuse treatment, 1997, 14(4):351–8.
Child and Adolescent Mental Health Initiatives of the Departmentof Mental Health and Substance Abuse
For the past two years the Department has supported the develop-ment of a coordinated child and adolescent mental health pro-gramme. The programme has fostered a recognition throughoutWHO and in the WHO Regions that child and adolescent mentalhealth is a necessary priority for the healthy development of socie-ties. WHO’s Department of Mental Health and Substance Abuse hasinitiated three programmes which together form a coordinated effortto address global child and adolescent mental health problems. Theprogramme at its very core appreciates the global interdependenceof societies. The three programme elements include 1) a campaignon the stigma associated with mental illness among youth, 2) a glo-bal policy initiative that will equip ministries of health to developcoordinated, responsive programmes where child and adolescentmental health will be integrated into overall health care, and 3) aprogramme to assess the global treatment gap associated withmental illness. Further information can be obtained on line at: http://www.who.int/mental_health/prevention/childado/en/
14 Adolescent abuse in a community.pmd 3/3/2005, 12:14 AM1018
Eastern Mediterranean Health Journal, Vol. 9, Nos 5/6, 2003 1019
Knowledge of and attitudes towardsfamily planning by male teachers inthe Islamic Republic of IranR. Tavakoli1 and H. Rashidi-Jahan1
1Health Education Department, Faculty of Health, Baghyatallah University of Medical Sciences, Tehran,Islamic Republic of Iran.Received: 24/04/02; accepted: 10/12/02
ABSTRACT A cross-sectional study was carried out on knowledge of and attitudes to family planning in maleteachers working in the education system in Teheran. We found that 65% of the study population hadacceptable knowledge regarding the issue. More than 95% of respondents reported having a favourableattitude towards the implementation of family planning programmes and about 90% believed that decision-making regarding use of contraceptives should be a joint process. To improve the planning and administra-tion of family planning programmes, the main variables identified in this study should be further investigatedin different population groups. Addressing men in family planning programmes may improve their successand lead to increased contraceptive use.
Connaissances et attitudes des enseignants de sexe masculin concernant la planification familialeen République islamique d’IranRESUME Une étude transversale a été réalisée sur les connaissances et attitudes à l’égard de la planifica-tion familiale des enseignants de sexe masculin travaillant dans le système éducatif à Téhéran. Nous avonsconstaté que 65 % de la population de l’étude avait des connaissances acceptables dans ce domaine. Plusde 95 % des répondants déclaraient avoir une attitude favorable à l’égard de la mise en œuvre des pro-grammes de planification familiale et environ 90 % pensaient que les décisions concernant l’utilisation decontraceptifs devraient être prises en commun. Pour améliorer la planification et l’administration des pro-grammes de planification familiale, les principales variables identifiées dans cette étude devraient faire l’objetd’une étude plus poussée dans différents groupes de population. La prise en compte des hommes dans lesprogrammes de planification familiale peut améliorer le succès de ces programmes et permettre un plusgrand recours à la contraception.
15 Knowledge of and attitudes.pmd 3/3/2005, 12:14 AM1019
1020 La Revue de Santé de la Méditerranée orientale, Vol. 9, No 5/6, 2003
IntroductionThe most important problem of human be-ings today is not infectious diseases butpopulation. The world population now ishigher than at any time in its history. Themain problem is the rate of population in-crease. Statistics show that the populationof the world was about 1 billion in 1850.Eighty years later, in 1930, the populationhad doubled (2 billion). Only 46 years afterthat, in 1976, it had doubled again [1]. To-day, it is more than 6 billion. Increase inpopulation has been deemed the most im-portant socioeconomic and cultural phe-nomenon in recent decades.
The ramifications of population in-crease constitute a serious threat; a countrywith a population greater than its socioeco-nomic resources can support would befaced with many problems, both culturaland socioeconomic, which in turn wouldinfluence its independence.
Examining the population records ofour country (Islamic Republic of Iran), itcan be seen that over a period of about acentury, from 1900 onward, the populationincreased 6-fold (from 10 million to 60 mil-lion). The last doubling of the populationoccurred over a period of only 20 years,1979–1999 [2]. This increase in populationaffects many aspects of society, includingliving conditions, basic needs, employmentstatus and the health system. Because ofthe great effect population size has on so-cioeconomic status, education and healthplanning, a full understanding of this phe-nomenon and the major factors governingit is essential.
The results of earlier studies have indi-cated that in order to have a successfulprogramme in the domain of populationcontrol and family planning, beliefs, atti-tudes, behaviour and the viewpoints of thepublic regarding reproduction should be
taken into account [3]. Practising familyplanning is influenced by various social,cultural, economic and political factors.Most research into family planning and re-productive health services targets women,particularly ever married women of repro-ductive age. Consequently, these services,as well as the research, have not addresseda large number of issues concerning men(S. Basnayak, S. Thapa, unpublished re-port, 1985).
It needs to be recognized that women,particularly in developing economies, areoften economically and emotionally depen-dent on their male partners (G. Gordon, C.Kanstrup, unpublished report, 1995). Theneed to encourage and enable men to takeresponsibility for their sexual and repro-ductive behaviour and their social and fam-ily roles was also stressed during theInternational Conference on Population andDevelopment (Cairo, Egypt, 1994) [4].
The behavioural and psychosocial as-pects of reproductive health issues con-cerning men revolve around theirinvolvement in contraceptive programmes,assuming a greater responsibility for andparticipation in all matters related to conju-gal relations, and promoting a greater un-derstanding of male sexual health problemsand their management.
Very few studies have actually lookedinto men’s attitudes about contraception,pregnancy and child rearing or into the pos-sible ways of changing their possible resis-tance towards family planning, especiallyto the use of contraception (PopulationCouncil, unpublished data, 1994).
A study conducted in Sudan on maleviewpoints on the issue of family planningindicated that there is a positive associationbetween male involvement and the successof family planning programmes [5]. Ourpaper examines knowledge of and attitudesto family planning programmes by Iranian
15 Knowledge of and attitudes.pmd 3/3/2005, 12:14 AM1020
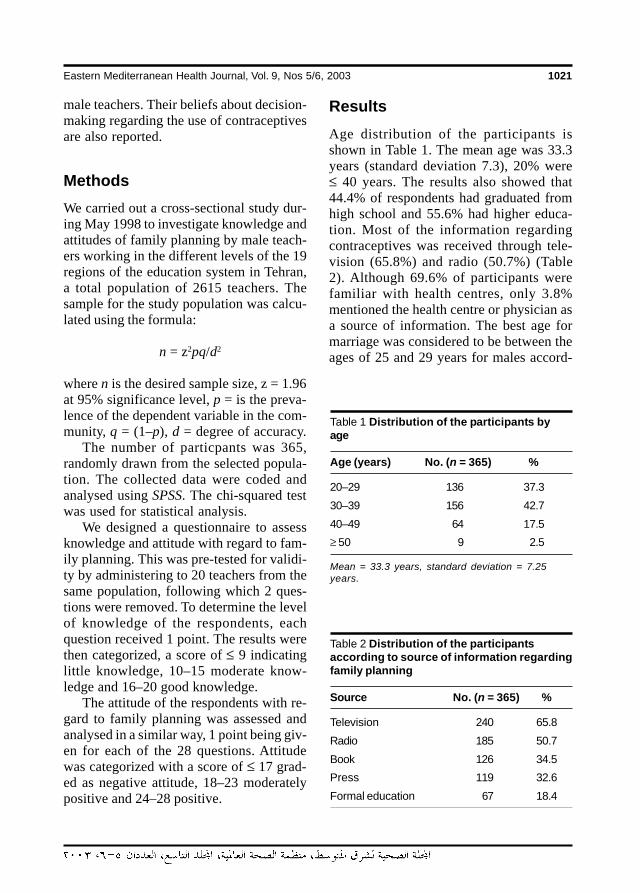
Eastern Mediterranean Health Journal, Vol. 9, Nos 5/6, 2003 1021
male teachers. Their beliefs about decision-making regarding the use of contraceptivesare also reported.
MethodsWe carried out a cross-sectional study dur-ing May 1998 to investigate knowledge andattitudes of family planning by male teach-ers working in the different levels of the 19regions of the education system in Tehran,a total population of 2615 teachers. Thesample for the study population was calcu-lated using the formula:
n = z2pq/d2
where n is the desired sample size, z = 1.96at 95% significance level, p = is the preva-lence of the dependent variable in the com-munity, q = (1–p), d = degree of accuracy.
The number of particpants was 365,randomly drawn from the selected popula-tion. The collected data were coded andanalysed using SPSS. The chi-squared testwas used for statistical analysis.
We designed a questionnaire to assessknowledge and attitude with regard to fam-ily planning. This was pre-tested for validi-ty by administering to 20 teachers from thesame population, following which 2 ques-tions were removed. To determine the levelof knowledge of the respondents, eachquestion received 1 point. The results werethen categorized, a score of ≤ 9 indicatinglittle knowledge, 10–15 moderate know-ledge and 16–20 good knowledge.
The attitude of the respondents with re-gard to family planning was assessed andanalysed in a similar way, 1 point being giv-en for each of the 28 questions. Attitudewas categorized with a score of ≤ 17 grad-ed as negative attitude, 18–23 moderatelypositive and 24–28 positive.
ResultsAge distribution of the participants isshown in Table 1. The mean age was 33.3years (standard deviation 7.3), 20% were≤ 40 years. The results also showed that44.4% of respondents had graduated fromhigh school and 55.6% had higher educa-tion. Most of the information regardingcontraceptives was received through tele-vision (65.8%) and radio (50.7%) (Table2). Although 69.6% of participants werefamiliar with health centres, only 3.8%mentioned the health centre or physician asa source of information. The best age formarriage was considered to be between theages of 25 and 29 years for males accord-
Table 1 Distribution of the participants byage
Age (years) No. (n = 365) %
20–29 136 37.3
30–39 156 42.7
40–49 64 17.5
≥ 50 9 2.5
Mean = 33.3 years, standard deviation = 7.25years.
Table 2 Distribution of the participantsaccording to source of information regardingfamily planning
Source No. (n = 365) %
Television 240 65.8
Radio 185 50.7
Book 126 34.5
Press 119 32.6
Formal education 67 18.4
15 Knowledge of and attitudes.pmd 3/3/2005, 12:14 AM1021
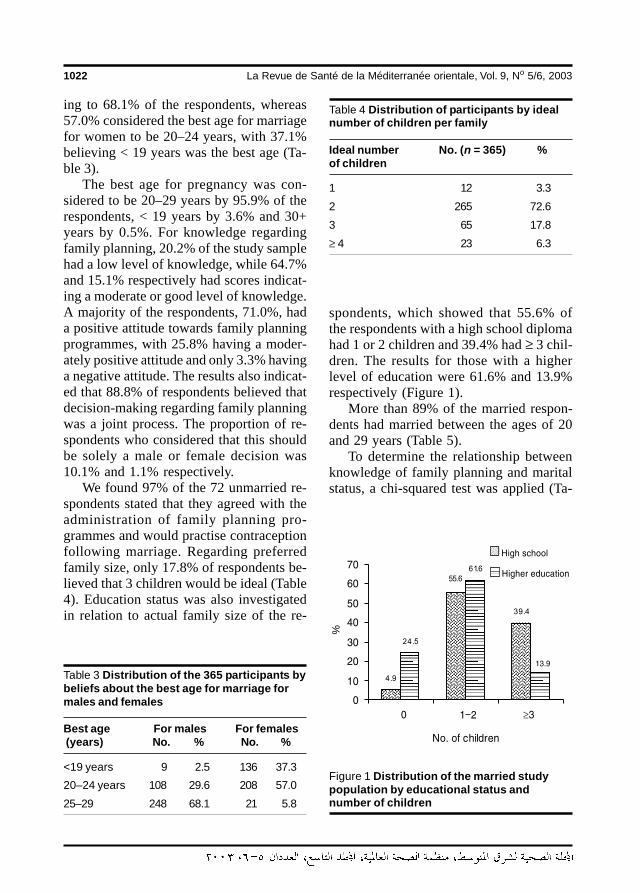
1022 La Revue de Santé de la Méditerranée orientale, Vol. 9, No 5/6, 2003
ing to 68.1% of the respondents, whereas57.0% considered the best age for marriagefor women to be 20–24 years, with 37.1%believing < 19 years was the best age (Ta-ble 3).
The best age for pregnancy was con-sidered to be 20–29 years by 95.9% of therespondents, < 19 years by 3.6% and 30+years by 0.5%. For knowledge regardingfamily planning, 20.2% of the study samplehad a low level of knowledge, while 64.7%and 15.1% respectively had scores indicat-ing a moderate or good level of knowledge.A majority of the respondents, 71.0%, hada positive attitude towards family planningprogrammes, with 25.8% having a moder-ately positive attitude and only 3.3% havinga negative attitude. The results also indicat-ed that 88.8% of respondents believed thatdecision-making regarding family planningwas a joint process. The proportion of re-spondents who considered that this shouldbe solely a male or female decision was10.1% and 1.1% respectively.
We found 97% of the 72 unmarried re-spondents stated that they agreed with theadministration of family planning pro-grammes and would practise contraceptionfollowing marriage. Regarding preferredfamily size, only 17.8% of respondents be-lieved that 3 children would be ideal (Table4). Education status was also investigatedin relation to actual family size of the re-
spondents, which showed that 55.6% ofthe respondents with a high school diplomahad 1 or 2 children and 39.4% had ≥ 3 chil-dren. The results for those with a higherlevel of education were 61.6% and 13.9%respectively (Figure 1).
More than 89% of the married respon-dents had married between the ages of 20and 29 years (Table 5).
To determine the relationship betweenknowledge of family planning and maritalstatus, a chi-squared test was applied (Ta-
Table 3 Distribution of the 365 participants bybeliefs about the best age for marriage formales and females
Best age For males For females (years) No. % No. %
<19 years 9 2.5 136 37.3
20–24 years 108 29.6 208 57.0
25–29 248 68.1 21 5.8
Table 4 Distribution of participants by idealnumber of children per family
Ideal number No. (n = 365) %of children
1 12 3.3
2 265 72.6
3 65 17.8
≥ 4 23 6.3
Figure 1 Distribution of the married studypopulation by educational status andnumber of children
���������
���������
%
15 Knowledge of and attitudes.pmd 3/3/2005, 12:14 AM1022
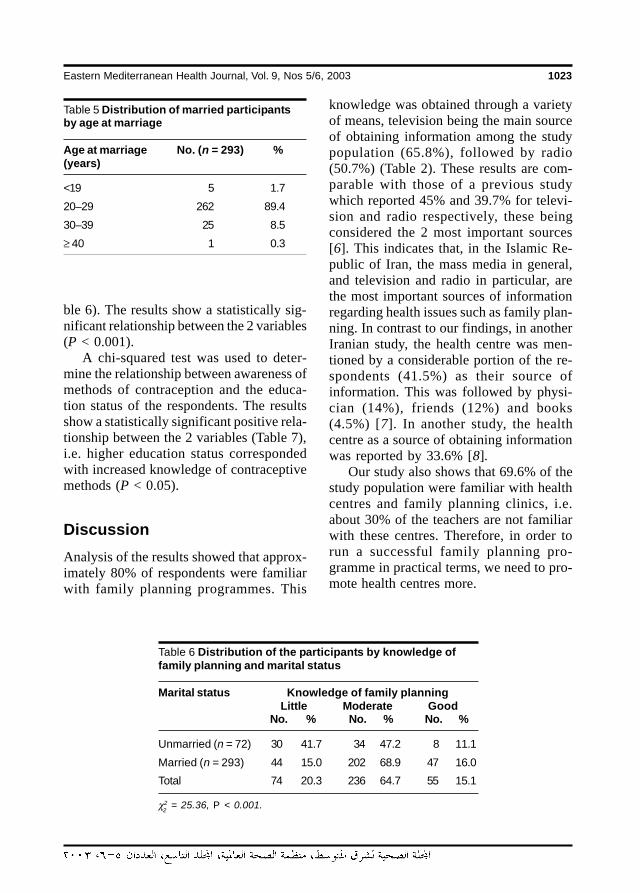
Eastern Mediterranean Health Journal, Vol. 9, Nos 5/6, 2003 1023
ble 6). The results show a statistically sig-nificant relationship between the 2 variables(P < 0.001).
A chi-squared test was used to deter-mine the relationship between awareness ofmethods of contraception and the educa-tion status of the respondents. The resultsshow a statistically significant positive rela-tionship between the 2 variables (Table 7),i.e. higher education status correspondedwith increased knowledge of contraceptivemethods (P < 0.05).
DiscussionAnalysis of the results showed that approx-imately 80% of respondents were familiarwith family planning programmes. This
knowledge was obtained through a varietyof means, television being the main sourceof obtaining information among the studypopulation (65.8%), followed by radio(50.7%) (Table 2). These results are com-parable with those of a previous studywhich reported 45% and 39.7% for televi-sion and radio respectively, these beingconsidered the 2 most important sources[6]. This indicates that, in the Islamic Re-public of Iran, the mass media in general,and television and radio in particular, arethe most important sources of informationregarding health issues such as family plan-ning. In contrast to our findings, in anotherIranian study, the health centre was men-tioned by a considerable portion of the re-spondents (41.5%) as their source ofinformation. This was followed by physi-cian (14%), friends (12%) and books(4.5%) [7]. In another study, the healthcentre as a source of obtaining informationwas reported by 33.6% [8].
Our study also shows that 69.6% of thestudy population were familiar with healthcentres and family planning clinics, i.e.about 30% of the teachers are not familiarwith these centres. Therefore, in order torun a successful family planning pro-gramme in practical terms, we need to pro-mote health centres more.
Table 5 Distribution of married participantsby age at marriage
Age at marriage No. (n = 293) %(years)
<19 5 1.7
20–29 262 89.4
30–39 25 8.5
≥ 40 1 0.3
Table 6 Distribution of the participants by knowledge offamily planning and marital status
Marital status Knowledge of family planningLittle Moderate Good
No. % No. % No. %
Unmarried (n = 72) 30 41.7 34 47.2 8 11.1
Married (n = 293) 44 15.0 202 68.9 47 16.0
Total 74 20.3 236 64.7 55 15.1
χ2 = 25.36, P < 0.001.2
15 Knowledge of and attitudes.pmd 3/3/2005, 12:14 AM1023
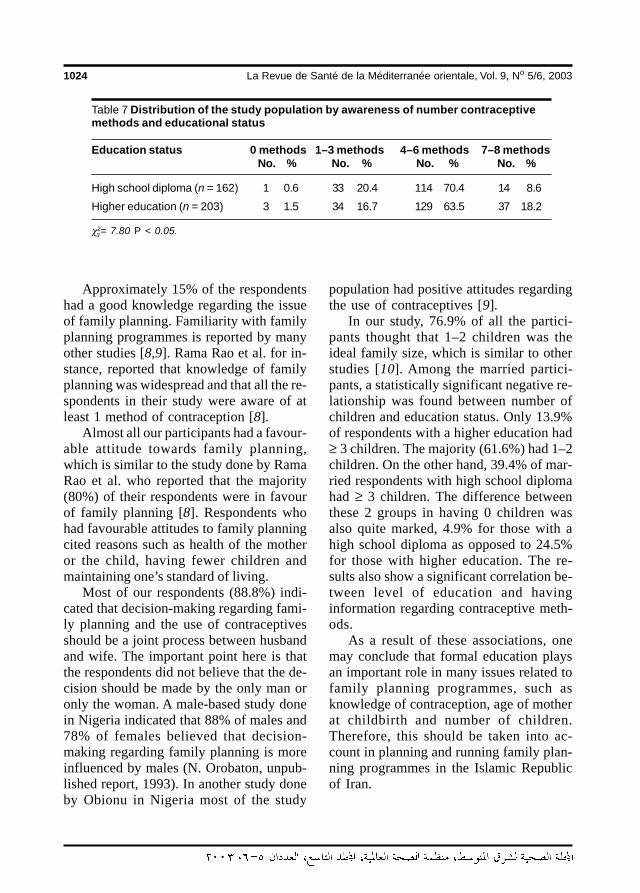
1024 La Revue de Santé de la Méditerranée orientale, Vol. 9, No 5/6, 2003
Approximately 15% of the respondentshad a good knowledge regarding the issueof family planning. Familiarity with familyplanning programmes is reported by manyother studies [8,9]. Rama Rao et al. for in-stance, reported that knowledge of familyplanning was widespread and that all the re-spondents in their study were aware of atleast 1 method of contraception [8].
Almost all our participants had a favour-able attitude towards family planning,which is similar to the study done by RamaRao et al. who reported that the majority(80%) of their respondents were in favourof family planning [8]. Respondents whohad favourable attitudes to family planningcited reasons such as health of the motheror the child, having fewer children andmaintaining one’s standard of living.
Most of our respondents (88.8%) indi-cated that decision-making regarding fami-ly planning and the use of contraceptivesshould be a joint process between husbandand wife. The important point here is thatthe respondents did not believe that the de-cision should be made by the only man oronly the woman. A male-based study donein Nigeria indicated that 88% of males and78% of females believed that decision-making regarding family planning is moreinfluenced by males (N. Orobaton, unpub-lished report, 1993). In another study doneby Obionu in Nigeria most of the study
Table 7 Distribution of the study population by awareness of number contraceptivemethods and educational status
Education status 0 methods 1–3 methods 4–6 methods 7–8 methodsNo. % No. % No. % No. %
High school diploma (n = 162) 1 0.6 33 20.4 114 70.4 14 8.6
Higher education (n = 203) 3 1.5 34 16.7 129 63.5 37 18.2
χ2= 7.80 P < 0.05.
population had positive attitudes regardingthe use of contraceptives [9].
In our study, 76.9% of all the partici-pants thought that 1–2 children was theideal family size, which is similar to otherstudies [10]. Among the married partici-pants, a statistically significant negative re-lationship was found between number ofchildren and education status. Only 13.9%of respondents with a higher education had≥ 3 children. The majority (61.6%) had 1–2children. On the other hand, 39.4% of mar-ried respondents with high school diplomahad ≥ 3 children. The difference betweenthese 2 groups in having 0 children wasalso quite marked, 4.9% for those with ahigh school diploma as opposed to 24.5%for those with higher education. The re-sults also show a significant correlation be-tween level of education and havinginformation regarding contraceptive meth-ods.
As a result of these associations, onemay conclude that formal education playsan important role in many issues related tofamily planning programmes, such asknowledge of contraception, age of motherat childbirth and number of children.Therefore, this should be taken into ac-count in planning and running family plan-ning programmes in the Islamic Republicof Iran.
3
15 Knowledge of and attitudes.pmd 3/3/2005, 12:14 AM1024
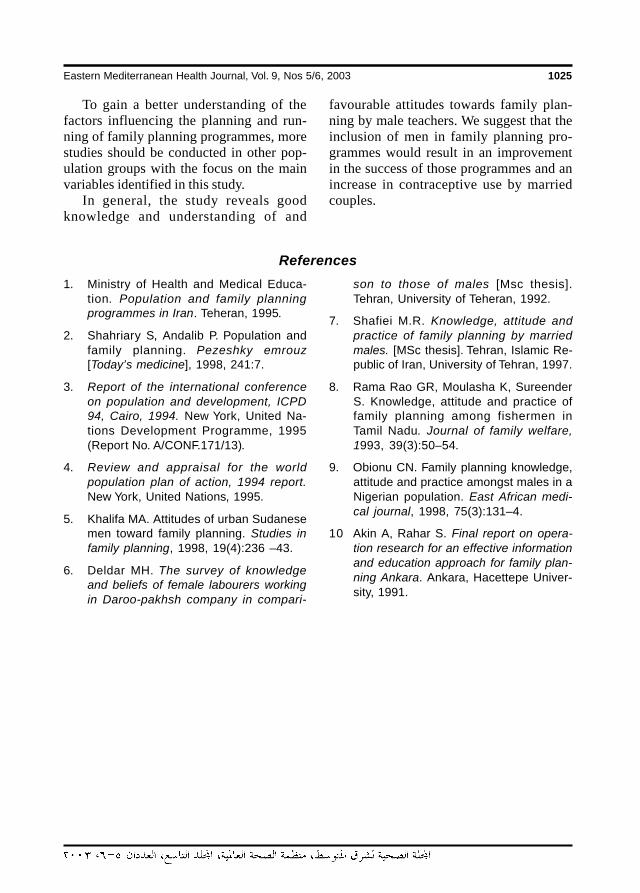
Eastern Mediterranean Health Journal, Vol. 9, Nos 5/6, 2003 1025
To gain a better understanding of thefactors influencing the planning and run-ning of family planning programmes, morestudies should be conducted in other pop-ulation groups with the focus on the mainvariables identified in this study.
In general, the study reveals goodknowledge and understanding of and
favourable attitudes towards family plan-ning by male teachers. We suggest that theinclusion of men in family planning pro-grammes would result in an improvementin the success of those programmes and anincrease in contraceptive use by marriedcouples.
References
1. Ministry of Health and Medical Educa-tion. Population and family planningprogrammes in Iran. Teheran, 1995.
2. Shahriary S, Andalib P. Population andfamily planning. Pezeshky emrouz[Today’s medicine], 1998, 241:7.
3. Report of the international conferenceon population and development, ICPD94, Cairo, 1994. New York, United Na-tions Development Programme, 1995(Report No. A/CONF.171/13).
4. Review and appraisal for the worldpopulation plan of action, 1994 report.New York, United Nations, 1995.
5. Khalifa MA. Attitudes of urban Sudanesemen toward family planning. Studies infamily planning, 1998, 19(4):236 –43.
6. Deldar MH. The survey of knowledgeand beliefs of female labourers workingin Daroo-pakhsh company in compari-
son to those of males [Msc thesis].Tehran, University of Teheran, 1992.
7. Shafiei M.R. Knowledge, attitude andpractice of family planning by marriedmales. [MSc thesis]. Tehran, Islamic Re-public of Iran, University of Tehran, 1997.
8. Rama Rao GR, Moulasha K, SureenderS. Knowledge, attitude and practice offamily planning among fishermen inTamil Nadu. Journal of family welfare,1993, 39(3):50–54.
9. Obionu CN. Family planning knowledge,attitude and practice amongst males in aNigerian population. East African medi-cal journal, 1998, 75(3):131–4.
10 Akin A, Rahar S. Final report on opera-tion research for an effective informationand education approach for family plan-ning Ankara. Ankara, Hacettepe Univer-sity, 1991.
15 Knowledge of and attitudes.pmd 3/3/2005, 12:14 AM1025
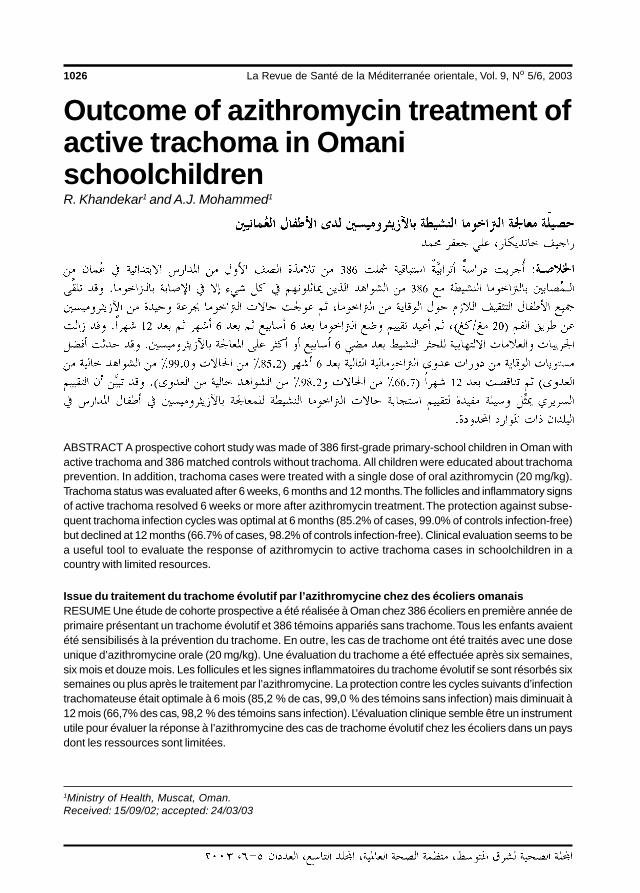
1026 La Revue de Santé de la Méditerranée orientale, Vol. 9, No 5/6, 2003
Outcome of azithromycin treatment ofactive trachoma in OmanischoolchildrenR. Khandekar1 and A.J. Mohammed1
1Ministry of Health, Muscat, Oman.Received: 15/09/02; accepted: 24/03/03
ABSTRACT A prospective cohort study was made of 386 first-grade primary-school children in Oman withactive trachoma and 386 matched controls without trachoma. All children were educated about trachomaprevention. In addition, trachoma cases were treated with a single dose of oral azithromycin (20 mg/kg).Trachoma status was evaluated after 6 weeks, 6 months and 12 months. The follicles and inflammatory signsof active trachoma resolved 6 weeks or more after azithromycin treatment. The protection against subse-quent trachoma infection cycles was optimal at 6 months (85.2% of cases, 99.0% of controls infection-free)but declined at 12 months (66.7% of cases, 98.2% of controls infection-free). Clinical evaluation seems to bea useful tool to evaluate the response of azithromycin to active trachoma cases in schoolchildren in acountry with limited resources.
Issue du traitement du trachome évolutif par l’azithromycine chez des écoliers omanaisRESUME Une étude de cohorte prospective a été réalisée à Oman chez 386 écoliers en première année deprimaire présentant un trachome évolutif et 386 témoins appariés sans trachome. Tous les enfants avaientété sensibilisés à la prévention du trachome. En outre, les cas de trachome ont été traités avec une doseunique d’azithromycine orale (20 mg/kg). Une évaluation du trachome a été effectuée après six semaines,six mois et douze mois. Les follicules et les signes inflammatoires du trachome évolutif se sont résorbés sixsemaines ou plus après le traitement par l’azithromycine. La protection contre les cycles suivants d’infectiontrachomateuse était optimale à 6 mois (85,2 % de cas, 99,0 % des témoins sans infection) mais diminuait à12 mois (66,7% des cas, 98,2 % des témoins sans infection). L’évaluation clinique semble être un instrumentutile pour évaluer la réponse à l’azithromycine des cas de trachome évolutif chez les écoliers dans un paysdont les ressources sont limitées.
16 Outcome of azithromycin.pmd 3/3/2005, 12:14 AM1026
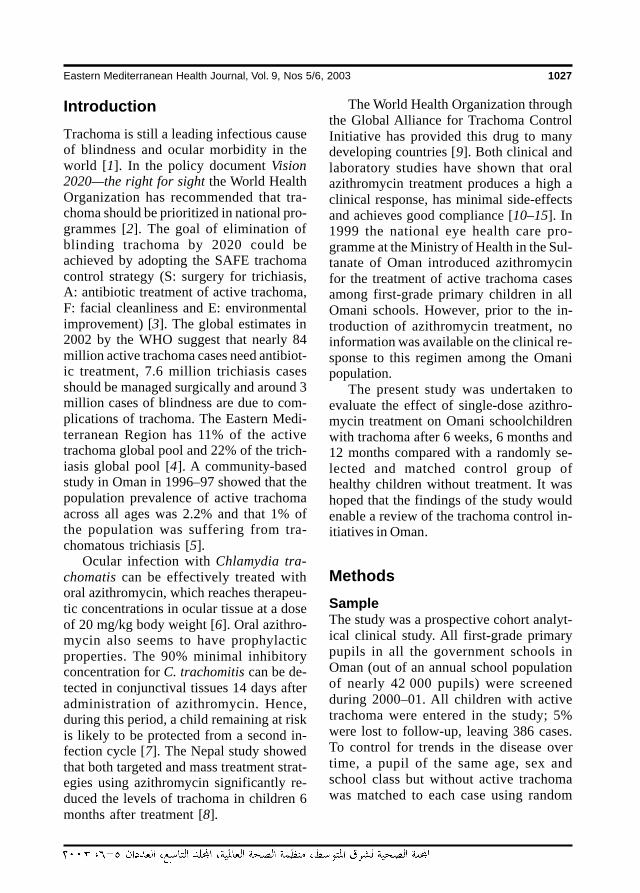
Eastern Mediterranean Health Journal, Vol. 9, Nos 5/6, 2003 1027
IntroductionTrachoma is still a leading infectious causeof blindness and ocular morbidity in theworld [1]. In the policy document Vision2020—the right for sight the World HealthOrganization has recommended that tra-choma should be prioritized in national pro-grammes [2]. The goal of elimination ofblinding trachoma by 2020 could beachieved by adopting the SAFE trachomacontrol strategy (S: surgery for trichiasis,A: antibiotic treatment of active trachoma,F: facial cleanliness and E: environmentalimprovement) [3]. The global estimates in2002 by the WHO suggest that nearly 84million active trachoma cases need antibiot-ic treatment, 7.6 million trichiasis casesshould be managed surgically and around 3million cases of blindness are due to com-plications of trachoma. The Eastern Medi-terranean Region has 11% of the activetrachoma global pool and 22% of the trich-iasis global pool [4]. A community-basedstudy in Oman in 1996–97 showed that thepopulation prevalence of active trachomaacross all ages was 2.2% and that 1% ofthe population was suffering from tra-chomatous trichiasis [5].
Ocular infection with Chlamydia tra-chomatis can be effectively treated withoral azithromycin, which reaches therapeu-tic concentrations in ocular tissue at a doseof 20 mg/kg body weight [6]. Oral azithro-mycin also seems to have prophylacticproperties. The 90% minimal inhibitoryconcentration for C. trachomitis can be de-tected in conjunctival tissues 14 days afteradministration of azithromycin. Hence,during this period, a child remaining at riskis likely to be protected from a second in-fection cycle [7]. The Nepal study showedthat both targeted and mass treatment strat-egies using azithromycin significantly re-duced the levels of trachoma in children 6months after treatment [8].
The World Health Organization throughthe Global Alliance for Trachoma ControlInitiative has provided this drug to manydeveloping countries [9]. Both clinical andlaboratory studies have shown that oralazithromycin treatment produces a high aclinical response, has minimal side-effectsand achieves good compliance [10–15]. In1999 the national eye health care pro-gramme at the Ministry of Health in the Sul-tanate of Oman introduced azithromycinfor the treatment of active trachoma casesamong first-grade primary children in allOmani schools. However, prior to the in-troduction of azithromycin treatment, noinformation was available on the clinical re-sponse to this regimen among the Omanipopulation.
The present study was undertaken toevaluate the effect of single-dose azithro-mycin treatment on Omani schoolchildrenwith trachoma after 6 weeks, 6 months and12 months compared with a randomly se-lected and matched control group ofhealthy children without treatment. It washoped that the findings of the study wouldenable a review of the trachoma control in-itiatives in Oman.
MethodsSampleThe study was a prospective cohort analyt-ical clinical study. All first-grade primarypupils in all the government schools inOman (out of an annual school populationof nearly 42 000 pupils) were screenedduring 2000–01. All children with activetrachoma were entered in the study; 5%were lost to follow-up, leaving 386 cases.To control for trends in the disease overtime, a pupil of the same age, sex andschool class but without active trachomawas matched to each case using random
16 Outcome of azithromycin.pmd 3/3/2005, 12:14 AM1027
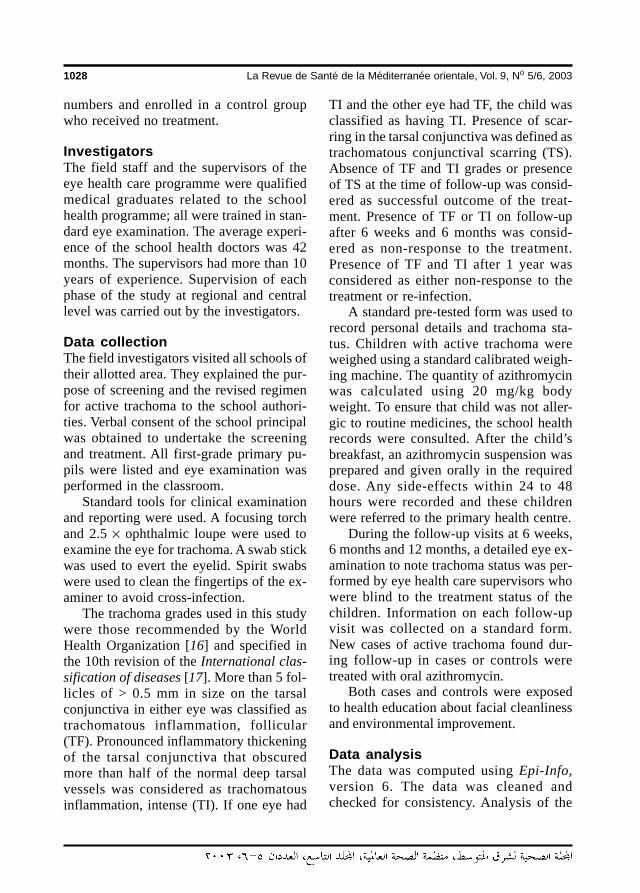
1028 La Revue de Santé de la Méditerranée orientale, Vol. 9, No 5/6, 2003
numbers and enrolled in a control groupwho received no treatment.
InvestigatorsThe field staff and the supervisors of theeye health care programme were qualifiedmedical graduates related to the schoolhealth programme; all were trained in stan-dard eye examination. The average experi-ence of the school health doctors was 42months. The supervisors had more than 10years of experience. Supervision of eachphase of the study at regional and centrallevel was carried out by the investigators.
Data collectionThe field investigators visited all schools oftheir allotted area. They explained the pur-pose of screening and the revised regimenfor active trachoma to the school authori-ties. Verbal consent of the school principalwas obtained to undertake the screeningand treatment. All first-grade primary pu-pils were listed and eye examination wasperformed in the classroom.
Standard tools for clinical examinationand reporting were used. A focusing torchand 2.5 × ophthalmic loupe were used toexamine the eye for trachoma. A swab stickwas used to evert the eyelid. Spirit swabswere used to clean the fingertips of the ex-aminer to avoid cross-infection.
The trachoma grades used in this studywere those recommended by the WorldHealth Organization [16] and specified inthe 10th revision of the International clas-sification of diseases [17]. More than 5 fol-licles of > 0.5 mm in size on the tarsalconjunctiva in either eye was classified astrachomatous inflammation, follicular(TF). Pronounced inflammatory thickeningof the tarsal conjunctiva that obscuredmore than half of the normal deep tarsalvessels was considered as trachomatousinflammation, intense (TI). If one eye had
TI and the other eye had TF, the child wasclassified as having TI. Presence of scar-ring in the tarsal conjunctiva was defined astrachomatous conjunctival scarring (TS).Absence of TF and TI grades or presenceof TS at the time of follow-up was consid-ered as successful outcome of the treat-ment. Presence of TF or TI on follow-upafter 6 weeks and 6 months was consid-ered as non-response to the treatment.Presence of TF and TI after 1 year wasconsidered as either non-response to thetreatment or re-infection.
A standard pre-tested form was used torecord personal details and trachoma sta-tus. Children with active trachoma wereweighed using a standard calibrated weigh-ing machine. The quantity of azithromycinwas calculated using 20 mg/kg bodyweight. To ensure that child was not aller-gic to routine medicines, the school healthrecords were consulted. After the child’sbreakfast, an azithromycin suspension wasprepared and given orally in the requireddose. Any side-effects within 24 to 48hours were recorded and these childrenwere referred to the primary health centre.
During the follow-up visits at 6 weeks,6 months and 12 months, a detailed eye ex-amination to note trachoma status was per-formed by eye health care supervisors whowere blind to the treatment status of thechildren. Information on each follow-upvisit was collected on a standard form.New cases of active trachoma found dur-ing follow-up in cases or controls weretreated with oral azithromycin.
Both cases and controls were exposedto health education about facial cleanlinessand environmental improvement.
Data analysisThe data was computed using Epi-Info,version 6. The data was cleaned andchecked for consistency. Analysis of the
16 Outcome of azithromycin.pmd 3/3/2005, 12:14 AM1028
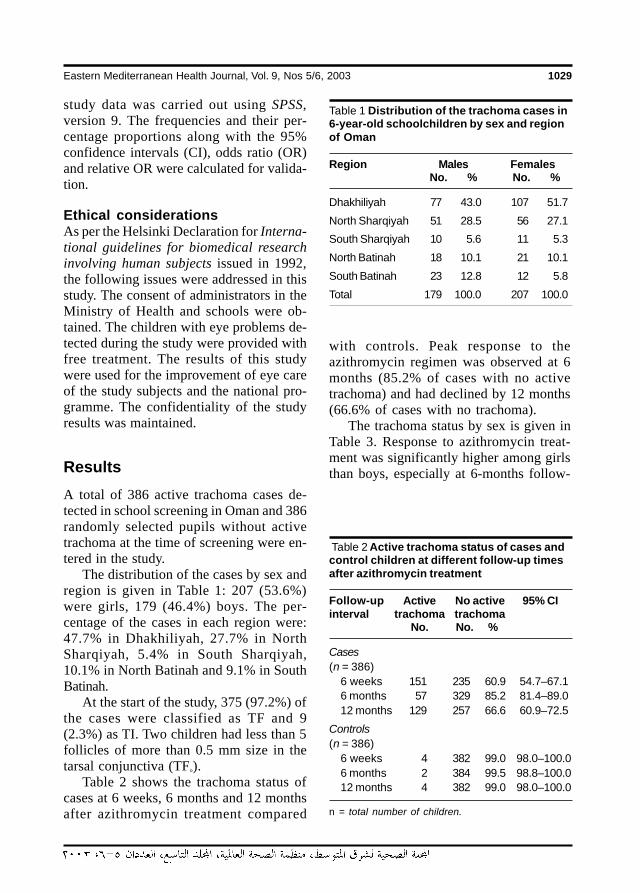
Eastern Mediterranean Health Journal, Vol. 9, Nos 5/6, 2003 1029
study data was carried out using SPSS,version 9. The frequencies and their per-centage proportions along with the 95%confidence intervals (CI), odds ratio (OR)and relative OR were calculated for valida-tion.
Ethical considerationsAs per the Helsinki Declaration for Interna-tional guidelines for biomedical researchinvolving human subjects issued in 1992,the following issues were addressed in thisstudy. The consent of administrators in theMinistry of Health and schools were ob-tained. The children with eye problems de-tected during the study were provided withfree treatment. The results of this studywere used for the improvement of eye careof the study subjects and the national pro-gramme. The confidentiality of the studyresults was maintained.
ResultsA total of 386 active trachoma cases de-tected in school screening in Oman and 386randomly selected pupils without activetrachoma at the time of screening were en-tered in the study.
The distribution of the cases by sex andregion is given in Table 1: 207 (53.6%)were girls, 179 (46.4%) boys. The per-centage of the cases in each region were:47.7% in Dhakhiliyah, 27.7% in NorthSharqiyah, 5.4% in South Sharqiyah,10.1% in North Batinah and 9.1% in SouthBatinah.
At the start of the study, 375 (97.2%) ofthe cases were classified as TF and 9(2.3%) as TI. Two children had less than 5follicles of more than 0.5 mm size in thetarsal conjunctiva (TF°).
Table 2 shows the trachoma status ofcases at 6 weeks, 6 months and 12 monthsafter azithromycin treatment compared
with controls. Peak response to theazithromycin regimen was observed at 6months (85.2% of cases with no activetrachoma) and had declined by 12 months(66.6% of cases with no trachoma).
The trachoma status by sex is given inTable 3. Response to azithromycin treat-ment was significantly higher among girlsthan boys, especially at 6-months follow-
Table 1 Distribution of the trachoma cases in6-year-old schoolchildren by sex and regionof Oman
Region Males FemalesNo. % No. %
Dhakhiliyah 77 43.0 107 51.7
North Sharqiyah 51 28.5 56 27.1
South Sharqiyah 10 5.6 11 5.3
North Batinah 18 10.1 21 10.1
South Batinah 23 12.8 12 5.8
Total 179 100.0 207 100.0
Table 2 Active trachoma status of cases andcontrol children at different follow-up timesafter azithromycin treatment
Follow-up Active No active 95% CIinterval trachoma trachoma
No. No. %
Cases(n = 386)
6 weeks 151 235 60.9 54.7–67.16 months 57 329 85.2 81.4–89.012 months 129 257 66.6 60.9–72.5
Controls(n = 386)
6 weeks 4 382 99.0 98.0–100.06 months 2 384 99.5 98.8–100.012 months 4 382 99.0 98.0–100.0
n = total number of children.
16 Outcome of azithromycin.pmd 3/3/2005, 12:14 AM1029
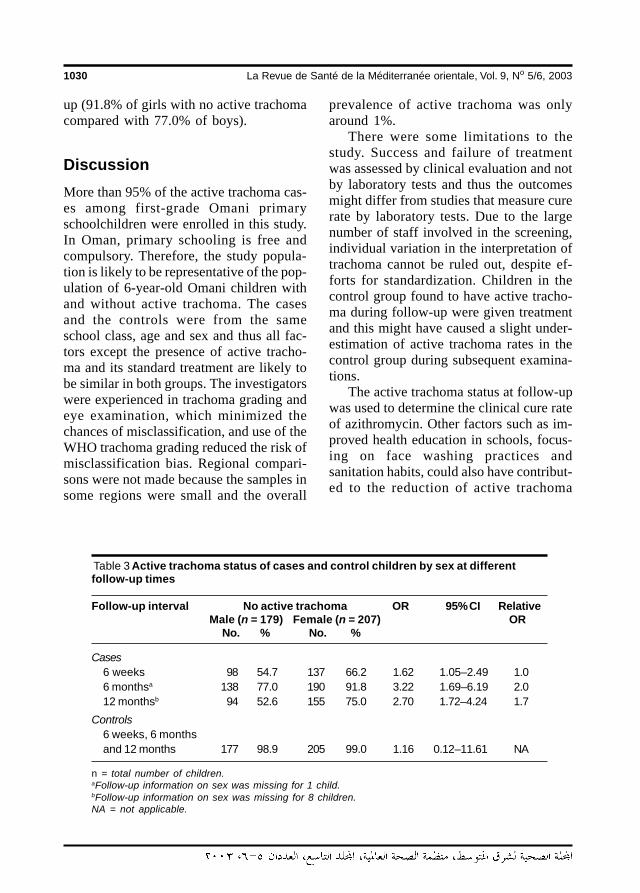
1030 La Revue de Santé de la Méditerranée orientale, Vol. 9, No 5/6, 2003
up (91.8% of girls with no active trachomacompared with 77.0% of boys).
DiscussionMore than 95% of the active trachoma cas-es among first-grade Omani primaryschoolchildren were enrolled in this study.In Oman, primary schooling is free andcompulsory. Therefore, the study popula-tion is likely to be representative of the pop-ulation of 6-year-old Omani children withand without active trachoma. The casesand the controls were from the sameschool class, age and sex and thus all fac-tors except the presence of active tracho-ma and its standard treatment are likely tobe similar in both groups. The investigatorswere experienced in trachoma grading andeye examination, which minimized thechances of misclassification, and use of theWHO trachoma grading reduced the risk ofmisclassification bias. Regional compari-sons were not made because the samples insome regions were small and the overall
prevalence of active trachoma was onlyaround 1%.
There were some limitations to thestudy. Success and failure of treatmentwas assessed by clinical evaluation and notby laboratory tests and thus the outcomesmight differ from studies that measure curerate by laboratory tests. Due to the largenumber of staff involved in the screening,individual variation in the interpretation oftrachoma cannot be ruled out, despite ef-forts for standardization. Children in thecontrol group found to have active tracho-ma during follow-up were given treatmentand this might have caused a slight under-estimation of active trachoma rates in thecontrol group during subsequent examina-tions.
The active trachoma status at follow-upwas used to determine the clinical cure rateof azithromycin. Other factors such as im-proved health education in schools, focus-ing on face washing practices andsanitation habits, could also have contribut-ed to the reduction of active trachoma
Table 3 Active trachoma status of cases and control children by sex at differentfollow-up times
Follow-up interval No active trachoma OR 95% CI RelativeMale (n = 179) Female (n = 207) OR
No. % No. %
Cases6 weeks 98 54.7 137 66.2 1.62 1.05–2.49 1.06 monthsa 138 77.0 190 91.8 3.22 1.69–6.19 2.012 monthsb 94 52.6 155 75.0 2.70 1.72–4.24 1.7
Controls6 weeks, 6 monthsand 12 months 177 98.9 205 99.0 1.16 0.12–11.61 NA
n = total number of children.aFollow-up information on sex was missing for 1 child.bFollow-up information on sex was missing for 8 children.NA = not applicable.
16 Outcome of azithromycin.pmd 3/3/2005, 12:14 AM1030
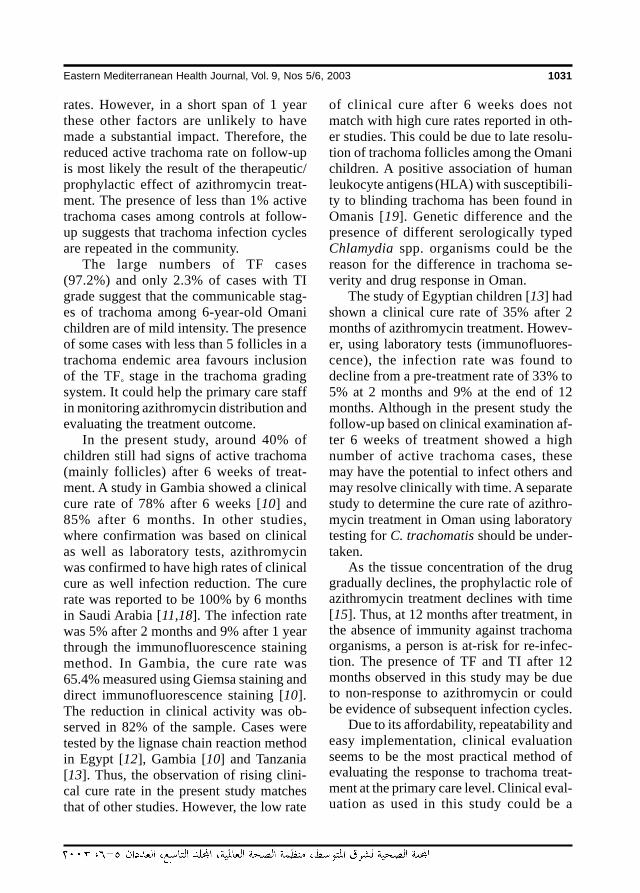
Eastern Mediterranean Health Journal, Vol. 9, Nos 5/6, 2003 1031
rates. However, in a short span of 1 yearthese other factors are unlikely to havemade a substantial impact. Therefore, thereduced active trachoma rate on follow-upis most likely the result of the therapeutic/prophylactic effect of azithromycin treat-ment. The presence of less than 1% activetrachoma cases among controls at follow-up suggests that trachoma infection cyclesare repeated in the community.
The large numbers of TF cases(97.2%) and only 2.3% of cases with TIgrade suggest that the communicable stag-es of trachoma among 6-year-old Omanichildren are of mild intensity. The presenceof some cases with less than 5 follicles in atrachoma endemic area favours inclusionof the TF° stage in the trachoma gradingsystem. It could help the primary care staffin monitoring azithromycin distribution andevaluating the treatment outcome.
In the present study, around 40% ofchildren still had signs of active trachoma(mainly follicles) after 6 weeks of treat-ment. A study in Gambia showed a clinicalcure rate of 78% after 6 weeks [10] and85% after 6 months. In other studies,where confirmation was based on clinicalas well as laboratory tests, azithromycinwas confirmed to have high rates of clinicalcure as well infection reduction. The curerate was reported to be 100% by 6 monthsin Saudi Arabia [11,18]. The infection ratewas 5% after 2 months and 9% after 1 yearthrough the immunofluorescence stainingmethod. In Gambia, the cure rate was65.4% measured using Giemsa staining anddirect immunofluorescence staining [10].The reduction in clinical activity was ob-served in 82% of the sample. Cases weretested by the lignase chain reaction methodin Egypt [12], Gambia [10] and Tanzania[13]. Thus, the observation of rising clini-cal cure rate in the present study matchesthat of other studies. However, the low rate
of clinical cure after 6 weeks does notmatch with high cure rates reported in oth-er studies. This could be due to late resolu-tion of trachoma follicles among the Omanichildren. A positive association of humanleukocyte antigens (HLA) with susceptibili-ty to blinding trachoma has been found inOmanis [19]. Genetic difference and thepresence of different serologically typedChlamydia spp. organisms could be thereason for the difference in trachoma se-verity and drug response in Oman.
The study of Egyptian children [13] hadshown a clinical cure rate of 35% after 2months of azithromycin treatment. Howev-er, using laboratory tests (immunofluores-cence), the infection rate was found todecline from a pre-treatment rate of 33% to5% at 2 months and 9% at the end of 12months. Although in the present study thefollow-up based on clinical examination af-ter 6 weeks of treatment showed a highnumber of active trachoma cases, thesemay have the potential to infect others andmay resolve clinically with time. A separatestudy to determine the cure rate of azithro-mycin treatment in Oman using laboratorytesting for C. trachomatis should be under-taken.
As the tissue concentration of the druggradually declines, the prophylactic role ofazithromycin treatment declines with time[15]. Thus, at 12 months after treatment, inthe absence of immunity against trachomaorganisms, a person is at-risk for re-infec-tion. The presence of TF and TI after 12months observed in this study may be dueto non-response to azithromycin or couldbe evidence of subsequent infection cycles.
Due to its affordability, repeatability andeasy implementation, clinical evaluationseems to be the most practical method ofevaluating the response to trachoma treat-ment at the primary care level. Clinical eval-uation as used in this study could be a
16 Outcome of azithromycin.pmd 3/3/2005, 12:14 AM1031
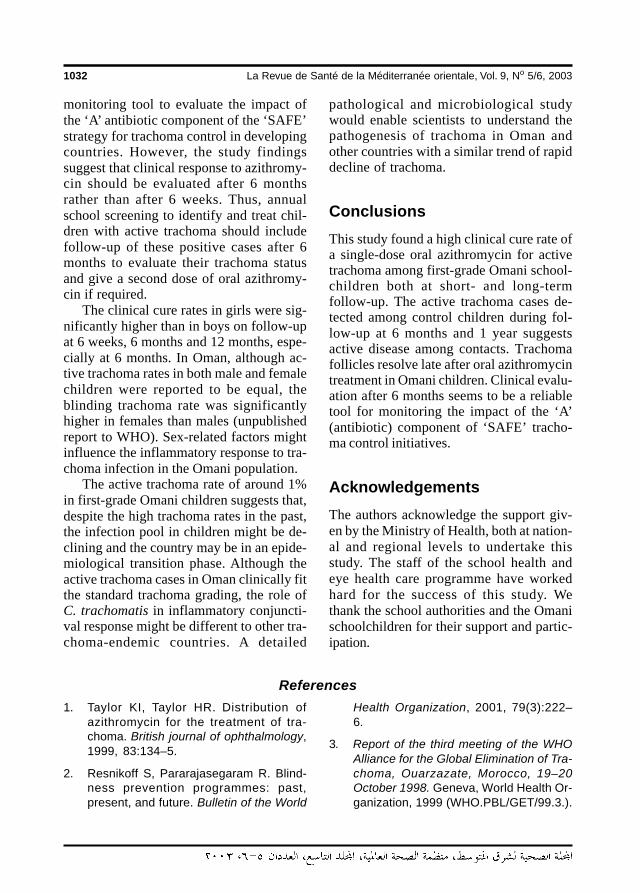
1032 La Revue de Santé de la Méditerranée orientale, Vol. 9, No 5/6, 2003
monitoring tool to evaluate the impact ofthe ‘A’ antibiotic component of the ‘SAFE’strategy for trachoma control in developingcountries. However, the study findingssuggest that clinical response to azithromy-cin should be evaluated after 6 monthsrather than after 6 weeks. Thus, annualschool screening to identify and treat chil-dren with active trachoma should includefollow-up of these positive cases after 6months to evaluate their trachoma statusand give a second dose of oral azithromy-cin if required.
The clinical cure rates in girls were sig-nificantly higher than in boys on follow-upat 6 weeks, 6 months and 12 months, espe-cially at 6 months. In Oman, although ac-tive trachoma rates in both male and femalechildren were reported to be equal, theblinding trachoma rate was significantlyhigher in females than males (unpublishedreport to WHO). Sex-related factors mightinfluence the inflammatory response to tra-choma infection in the Omani population.
The active trachoma rate of around 1%in first-grade Omani children suggests that,despite the high trachoma rates in the past,the infection pool in children might be de-clining and the country may be in an epide-miological transition phase. Although theactive trachoma cases in Oman clinically fitthe standard trachoma grading, the role ofC. trachomatis in inflammatory conjuncti-val response might be different to other tra-choma-endemic countries. A detailed
pathological and microbiological studywould enable scientists to understand thepathogenesis of trachoma in Oman andother countries with a similar trend of rapiddecline of trachoma.
ConclusionsThis study found a high clinical cure rate ofa single-dose oral azithromycin for activetrachoma among first-grade Omani school-children both at short- and long-termfollow-up. The active trachoma cases de-tected among control children during fol-low-up at 6 months and 1 year suggestsactive disease among contacts. Trachomafollicles resolve late after oral azithromycintreatment in Omani children. Clinical evalu-ation after 6 months seems to be a reliabletool for monitoring the impact of the ‘A’(antibiotic) component of ‘SAFE’ tracho-ma control initiatives.
AcknowledgementsThe authors acknowledge the support giv-en by the Ministry of Health, both at nation-al and regional levels to undertake thisstudy. The staff of the school health andeye health care programme have workedhard for the success of this study. Wethank the school authorities and the Omanischoolchildren for their support and partic-ipation.
References
1. Taylor KI, Taylor HR. Distribution ofazithromycin for the treatment of tra-choma. British journal of ophthalmology,1999, 83:134–5.
2. Resnikoff S, Pararajasegaram R. Blind-ness prevention programmes: past,present, and future. Bulletin of the World
Health Organization, 2001, 79(3):222–6.
3. Report of the third meeting of the WHOAlliance for the Global Elimination of Tra-choma, Ouarzazate, Morocco, 19–20October 1998. Geneva, World Health Or-ganization, 1999 (WHO.PBL/GET/99.3.).
16 Outcome of azithromycin.pmd 3/3/2005, 12:14 AM1032
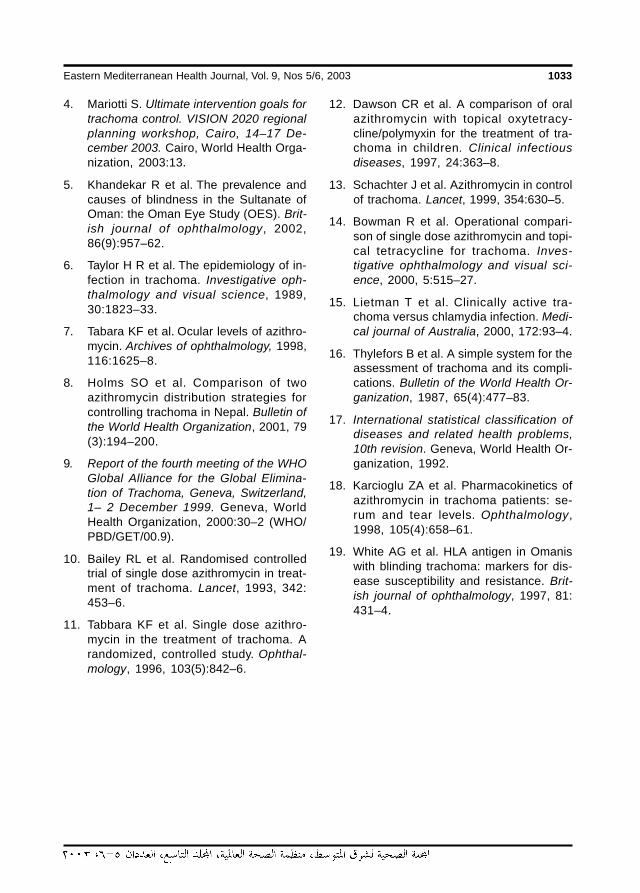
Eastern Mediterranean Health Journal, Vol. 9, Nos 5/6, 2003 1033
4. Mariotti S. Ultimate intervention goals fortrachoma control. VISION 2020 regionalplanning workshop, Cairo, 14–17 De-cember 2003. Cairo, World Health Orga-nization, 2003:13.
5. Khandekar R et al. The prevalence andcauses of blindness in the Sultanate ofOman: the Oman Eye Study (OES). Brit-ish journal of ophthalmology, 2002,86(9):957–62.
6. Taylor H R et al. The epidemiology of in-fection in trachoma. Investigative oph-thalmology and visual science, 1989,30:1823–33.
7. Tabara KF et al. Ocular levels of azithro-mycin. Archives of ophthalmology, 1998,116:1625–8.
8. Holms SO et al. Comparison of twoazithromycin distribution strategies forcontrolling trachoma in Nepal. Bulletin ofthe World Health Organization, 2001, 79(3):194–200.
9. Report of the fourth meeting of the WHOGlobal Alliance for the Global Elimina-tion of Trachoma, Geneva, Switzerland,1– 2 December 1999. Geneva, WorldHealth Organization, 2000:30–2 (WHO/PBD/GET/00.9).
10. Bailey RL et al. Randomised controlledtrial of single dose azithromycin in treat-ment of trachoma. Lancet, 1993, 342:453–6.
11. Tabbara KF et al. Single dose azithro-mycin in the treatment of trachoma. Arandomized, controlled study. Ophthal-mology, 1996, 103(5):842–6.
12. Dawson CR et al. A comparison of oralazithromycin with topical oxytetracy-cline/polymyxin for the treatment of tra-choma in children. Clinical infectiousdiseases, 1997, 24:363–8.
13. Schachter J et al. Azithromycin in controlof trachoma. Lancet, 1999, 354:630–5.
14. Bowman R et al. Operational compari-son of single dose azithromycin and topi-cal tetracycline for trachoma. Inves-tigative ophthalmology and visual sci-ence, 2000, 5:515–27.
15. Lietman T et al. Clinically active tra-choma versus chlamydia infection. Medi-cal journal of Australia, 2000, 172:93–4.
16. Thylefors B et al. A simple system for theassessment of trachoma and its compli-cations. Bulletin of the World Health Or-ganization, 1987, 65(4):477–83.
17. International statistical classification ofdiseases and related health problems,10th revision. Geneva, World Health Or-ganization, 1992.
18. Karcioglu ZA et al. Pharmacokinetics ofazithromycin in trachoma patients: se-rum and tear levels. Ophthalmology,1998, 105(4):658–61.
19. White AG et al. HLA antigen in Omaniswith blinding trachoma: markers for dis-ease susceptibility and resistance. Brit-ish journal of ophthalmology, 1997, 81:431–4.
16 Outcome of azithromycin.pmd 3/3/2005, 12:14 AM1033
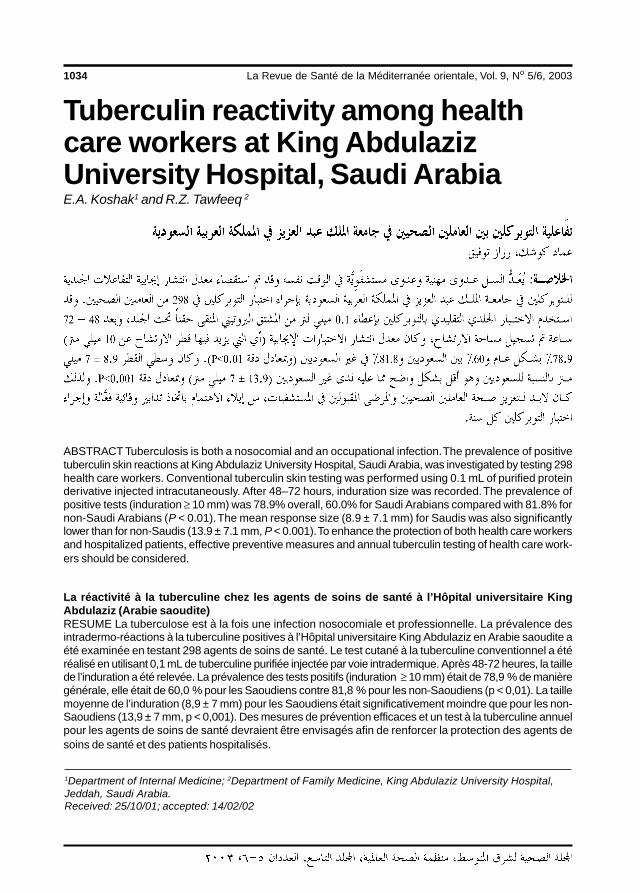
1034 La Revue de Santé de la Méditerranée orientale, Vol. 9, No 5/6, 2003
Tuberculin reactivity among healthcare workers at King AbdulazizUniversity Hospital, Saudi ArabiaE.A. Koshak1 and R.Z. Tawfeeq 2
1Department of Internal Medicine; 2Department of Family Medicine, King Abdulaziz University Hospital,Jeddah, Saudi Arabia.Received: 25/10/01; accepted: 14/02/02
ABSTRACT Tuberculosis is both a nosocomial and an occupational infection. The prevalence of positivetuberculin skin reactions at King Abdulaziz University Hospital, Saudi Arabia, was investigated by testing 298health care workers. Conventional tuberculin skin testing was performed using 0.1 mL of purified proteinderivative injected intracutaneously. After 48–72 hours, induration size was recorded. The prevalence ofpositive tests (induration ≥ 10 mm) was 78.9% overall, 60.0% for Saudi Arabians compared with 81.8% fornon-Saudi Arabians (P < 0.01). The mean response size (8.9 ± 7.1 mm) for Saudis was also significantlylower than for non-Saudis (13.9 ± 7.1 mm, P < 0.001). To enhance the protection of both health care workersand hospitalized patients, effective preventive measures and annual tuberculin testing of health care work-ers should be considered.
La réactivité à la tuberculine chez les agents de soins de santé à l’Hôpital universitaire KingAbdulaziz (Arabie saoudite)RESUME La tuberculose est à la fois une infection nosocomiale et professionnelle. La prévalence desintradermo-réactions à la tuberculine positives à l’Hôpital universitaire King Abdulaziz en Arabie saoudite aété examinée en testant 298 agents de soins de santé. Le test cutané à la tuberculine conventionnel a étéréalisé en utilisant 0,1 mL de tuberculine purifiée injectée par voie intradermique. Après 48-72 heures, la taillede l’induration a été relevée. La prévalence des tests positifs (induration ≥ 10 mm) était de 78,9 % de manièregénérale, elle était de 60,0 % pour les Saoudiens contre 81,8 % pour les non-Saoudiens (p < 0,01). La taillemoyenne de l’induration (8,9 ± 7 mm) pour les Saoudiens était significativement moindre que pour les non-Saoudiens (13,9 ± 7 mm, p < 0,001). Des mesures de prévention efficaces et un test à la tuberculine annuelpour les agents de soins de santé devraient être envisagés afin de renforcer la protection des agents desoins de santé et des patients hospitalisés.
17 Tuberculin reactivity among.pmd 3/3/2005, 12:14 AM1034
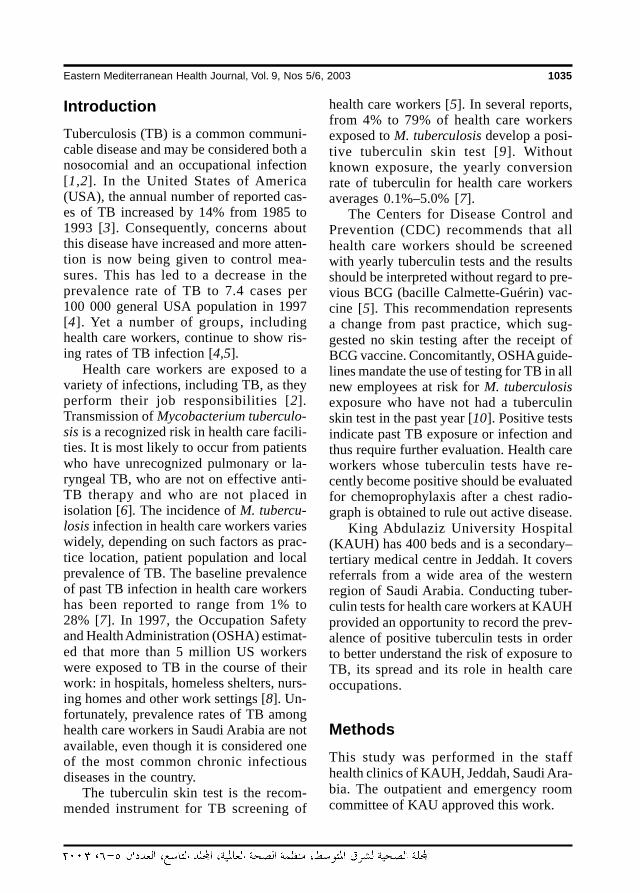
Eastern Mediterranean Health Journal, Vol. 9, Nos 5/6, 2003 1035
IntroductionTuberculosis (TB) is a common communi-cable disease and may be considered both anosocomial and an occupational infection[1,2]. In the United States of America(USA), the annual number of reported cas-es of TB increased by 14% from 1985 to1993 [3]. Consequently, concerns aboutthis disease have increased and more atten-tion is now being given to control mea-sures. This has led to a decrease in theprevalence rate of TB to 7.4 cases per100 000 general USA population in 1997[4]. Yet a number of groups, includinghealth care workers, continue to show ris-ing rates of TB infection [4,5].
Health care workers are exposed to avariety of infections, including TB, as theyperform their job responsibilities [2].Transmission of Mycobacterium tuberculo-sis is a recognized risk in health care facili-ties. It is most likely to occur from patientswho have unrecognized pulmonary or la-ryngeal TB, who are not on effective anti-TB therapy and who are not placed inisolation [6]. The incidence of M. tubercu-losis infection in health care workers varieswidely, depending on such factors as prac-tice location, patient population and localprevalence of TB. The baseline prevalenceof past TB infection in health care workershas been reported to range from 1% to28% [7]. In 1997, the Occupation Safetyand Health Administration (OSHA) estimat-ed that more than 5 million US workerswere exposed to TB in the course of theirwork: in hospitals, homeless shelters, nurs-ing homes and other work settings [8]. Un-fortunately, prevalence rates of TB amonghealth care workers in Saudi Arabia are notavailable, even though it is considered oneof the most common chronic infectiousdiseases in the country.
The tuberculin skin test is the recom-mended instrument for TB screening of
health care workers [5]. In several reports,from 4% to 79% of health care workersexposed to M. tuberculosis develop a posi-tive tuberculin skin test [9]. Withoutknown exposure, the yearly conversionrate of tuberculin for health care workersaverages 0.1%–5.0% [7].
The Centers for Disease Control andPrevention (CDC) recommends that allhealth care workers should be screenedwith yearly tuberculin tests and the resultsshould be interpreted without regard to pre-vious BCG (bacille Calmette-Guérin) vac-cine [5]. This recommendation representsa change from past practice, which sug-gested no skin testing after the receipt ofBCG vaccine. Concomitantly, OSHA guide-lines mandate the use of testing for TB in allnew employees at risk for M. tuberculosisexposure who have not had a tuberculinskin test in the past year [10]. Positive testsindicate past TB exposure or infection andthus require further evaluation. Health careworkers whose tuberculin tests have re-cently become positive should be evaluatedfor chemoprophylaxis after a chest radio-graph is obtained to rule out active disease.
King Abdulaziz University Hospital(KAUH) has 400 beds and is a secondary–tertiary medical centre in Jeddah. It coversreferrals from a wide area of the westernregion of Saudi Arabia. Conducting tuber-culin tests for health care workers at KAUHprovided an opportunity to record the prev-alence of positive tuberculin tests in orderto better understand the risk of exposure toTB, its spread and its role in health careoccupations.
MethodsThis study was performed in the staffhealth clinics of KAUH, Jeddah, Saudi Ara-bia. The outpatient and emergency roomcommittee of KAU approved this work.
17 Tuberculin reactivity among.pmd 3/3/2005, 12:14 AM1035
1036 La Revue de Santé de la Méditerranée orientale, Vol. 9, No 5/6, 2003
Participants in the present study werehealth care workers from all departmentsof KAUH. Between October 2000 and Feb-ruary 2001 they were invited to the staffhealth clinics for their tuberculin screeningtests by letter sent through the heads of de-partments. Staff who responded were in-cluded (300 out of 400, 75%). The medicalrecords of the participants were reviewedby the clinic doctors and participants wereinterviewed about chronic medical illnessand drug history. Participants were not suf-fering from any chronic illnesses (most ofthem are contract workers who can onlyobtain a work permit if they are medicallyfit) or taking regular medication (includingsteroids or immunosuppressants), and hadno previous active TB infection. All partici-pants had received BCG vaccination, sincethis is a compulsory vaccine in the countryand all workers, both Saudi Arabian andnon-Saudi Arabian, must provide a certifi-cate of vaccination.
Screening was conducted using theMantoux test (intracutaneous tuberculinunits manufactured by Aventis Pasteur,France). Purified protein derivative sup-plies were provided by the pharmacy ofKAUH. A nurse sterilized the forearm skinof the candidate with propylalcohol and,using a 26 gauge needle, introduced 0.1 mLof a commercially available purified proteinderivative tuberculin intracutaneously(equivalent to 5 tuberculin units), raising awheal 6–10 mm in diameter. The delayedskin test reactions were read by a physicianafter 48–72 hours, as convenient for theparticipants. The diameter of the erythema-tous induration was measured in mm andrecorded. A positive tuberculin test was di-agnosed if the wheal reaction was 10 mmor over. The conduct and interpretation oftuberculin skin tests were based on currentguidelines of the CDC Committee on La-tent Tuberculosis Infection [5,11].
The data were entered into a personalcomputer. Frequency tables and determina-tion of significant differences among vari-ables were performed by the chi-squaredtest and Student t-test using SPSS, version10.
ResultsOf the 300 health care workers recruited, 2did not attend at the appropriate time forthe test reading, leaving 298 participants inthe study. Their ages ranged between 21and 59 years with a mean ± standard devia-tion of 37.8 ± 7.9 years. Women were pre-dominant, comprising 80.5% of the studiedgroup. There were 60 participants from thelaboratories (20.1%), 26 from the neonatalintensive care unit (8.7%), 24 from thepaediatric medical ward (8.1%) and 188(63.1%) from other departments.
The prevalence of a positive skin test(induration ≥ 10 mm) in participants atKAUH was high, with 235 cases (78.9% ofthe studied group). The most common siz-es of skin test indurations were 20 mm(positive) for 47 participants (15.8%), 10mm (positive) for 46 (15.4%) and 0 mm(negative) for 27 (9.1%) (Figure 1). Themean values were 15.9 ± 5.5 mm for posi-tive reactions and 3.2 ± 3.1 mm for nega-tive reactions. Only a few participants, inparticular those who had large tuberculinreactions, complained of local discomfort.
The non-Saudi Arabians were predomi-nantly of Philippine (150 cases, 50.3%) andIndian nationalities (36 cases, 12.1%) (Ta-ble 1). The overall size of skin test reac-tions was significantly lower among SaudiArabian participants than among non-SaudiArabians (mean 8.9 ± 7.1 mm versus13.9 ± 7.1 mm) (t = 4.1, P < 0.001).
The distribution of positive skin test re-actions among the different nationalities of
17 Tuberculin reactivity among.pmd 3/3/2005, 12:14 AM1036
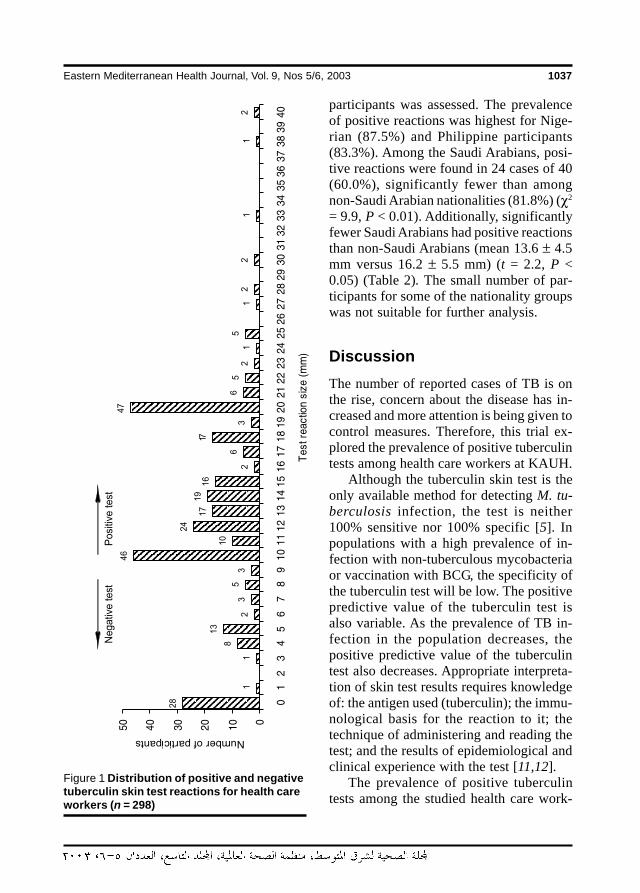
Eastern Mediterranean Health Journal, Vol. 9, Nos 5/6, 2003 1037
participants was assessed. The prevalenceof positive reactions was highest for Nige-rian (87.5%) and Philippine participants(83.3%). Among the Saudi Arabians, posi-tive reactions were found in 24 cases of 40(60.0%), significantly fewer than amongnon-Saudi Arabian nationalities (81.8%) (χ2
= 9.9, P < 0.01). Additionally, significantlyfewer Saudi Arabians had positive reactionsthan non-Saudi Arabians (mean 13.6 ± 4.5mm versus 16.2 ± 5.5 mm) (t = 2.2, P <0.05) (Table 2). The small number of par-ticipants for some of the nationality groupswas not suitable for further analysis.
DiscussionThe number of reported cases of TB is onthe rise, concern about the disease has in-creased and more attention is being given tocontrol measures. Therefore, this trial ex-plored the prevalence of positive tuberculintests among health care workers at KAUH.
Although the tuberculin skin test is theonly available method for detecting M. tu-berculosis infection, the test is neither100% sensitive nor 100% specific [5]. Inpopulations with a high prevalence of in-fection with non-tuberculous mycobacteriaor vaccination with BCG, the specificity ofthe tuberculin test will be low. The positivepredictive value of the tuberculin test isalso variable. As the prevalence of TB in-fection in the population decreases, thepositive predictive value of the tuberculintest also decreases. Appropriate interpreta-tion of skin test results requires knowledgeof: the antigen used (tuberculin); the immu-nological basis for the reaction to it; thetechnique of administering and reading thetest; and the results of epidemiological andclinical experience with the test [11,12].
The prevalence of positive tuberculintests among the studied health care work-
Figure 1 Distribution of positive and negativetuberculin skin test reactions for health careworkers (n = 298)
17 Tuberculin reactivity among.pmd 3/3/2005, 12:14 AM1037
1038 La Revue de Santé de la Méditerranée orientale, Vol. 9, No 5/6, 2003
ers at KAUH was high (79%). In compari-son to other studies, similar high prevalenc-es of positive tuberculin tests (79% and70%) were found among medical serviceworkers in Cote d’Ivoire and in a Mexicanhospital [13,14].
Interestingly, although positive tubercu-lin tests among health care workers holdingSaudi Arabian nationality were elevated
(60%), they were significantly lower inprevalence and reaction size than amongnon-Saudi Arabian nationalities. These dif-ferences could be attributed to variable so-cioeconomical factors and hygiene habits.However, the overall high prevalence ofpositive tuberculin tests among health careworkers at KAUH may reflect the increased
Table 1 Distribution of overall tuberculin skin testreactions among the different nationalities of health careworkers
Nationality Total Test reaction size (mm)No. % Range Mean ± s
Saudi Arabian 40 13.4 0–25 8.9 ± 7.1a
Non-Saudi Arabian 258 86.6 0–40 13.9 ± 7.1Philippine 150 50.3 0–40 13.8 ± 6.7Indian 36 12.1 0–30 13.8 ± 7.2Pakistani 31 10.4 0–40 14.5 ± 9.8Nigerian 24 8.1 0–28 15.3 ± 6.6Other 17 5.7 0–20 13.3 ± 5.4
Total 298 100.0 0–40 13.3 ± 7.3
at = 4.1, P < 0.001 Saudi versus non-Saudi participants.s = standard deviation.
Table 2 Distribution of positive tuberculin skin test reactions amongthe different nationalities of health care workers
Nationality Total Positive reaction Test reaction size (mm)No. No. % Range Mean ± s
Saudi Arabian 40 24 60.0a 10–25 13.6 ± 4.5b
Non-Saudi Arabian 258 211 81.8 10–40 16.2 ± 5.5Philippine 150 125 83.3 10–40 15.9 ± 5.2Indian 36 27 75.0 10–30 16.1 ± 5.9Pakistani 31 23 74.2 10–40 18.8 ± 7.1Nigerian 24 21 87.5 10–28 16.9 ± 5.1Other 17 15 88.2 10–20 14.5 ± 4.1
Total 298 235 78.9 10–40 15.9 ± 5.5
aχ2 = 9.9, P < 0.01 Saudi versus non-Saudi participants.bt = 2.2, P < 0.05 Saudi versus non-Saudi participants.s = standard deviation.
17 Tuberculin reactivity among.pmd 3/3/2005, 12:14 AM1038
Eastern Mediterranean Health Journal, Vol. 9, Nos 5/6, 2003 1039
prevalence of TB cases not only in most ofthe developing countries but also in theSaudi Arabian community. In the generalpopulation of south-western Saudi Arabia,for example, positive tuberculin tests werereported for 4% of those aged 5–14 yearsand was even higher for those aged 45–64years at up to 52% [15]. Positive tuberculintest rates have reached up to 20% amongchildren from the Western provinces andJeddah [16]. It is important to note that ap-proximately 50% of the patients of KAUHare of non-Saudi Arabian nationality andthat every year Jeddah receives over a mil-lion foreign pilgrims [16]. These factorsand the lack of preventive programmesmay be contributing issues in the increasedrisk of TB in Saudi Arabia.
Correlations between tuberculin test re-sults and the different departments of thesehealth care workers were investigated.Some authors found that the risk of posi-tive tuberculin tests was higher for thosewho perform bronchoscopy [9]. Othersfound relatively lower conversion ratesamong emergency health care workers[17]. Unfortunately, such analysis was notfeasible in the present study because of thesmall number of cases in some depart-ments of KAUH and the frequent inter-change of health care workers across thedifferent departments.
In order to protect health care workersand to reduce the risk of TB exposure, theCDC Advisory Council for the Eliminationof Tuberculosis recommends that healthcare facilities conduct a risk assessmentand perform tuberculin skin testing at leastannually and develop isolation proceduresfor potentially infectious TB patients inhospitals and in some outpatient settings[4,5]. Those whose tuberculin tests haverecently become positive should be evaluat-ed for chemo-prophylaxis, e.g. isoniazid,after a chest radiograph is obtained to ex-
clude active disease. Prophylactic therapyshould be considered because these pa-tients are at high risk for TB. In recenttimes, multiple drug resistant strains of M.tuberculosis have become an increasing oc-cupational concern among health careworkers. If a health care worker exposedto a drug-resistant strain of M. tuberculosishas a skin test conversion, the prophylacticregimen may need to be modified or sup-plemented with drugs to which the infect-ing organism is susceptible.
Even when properly placed and inter-preted, the tuberculin test may be associat-ed with false positive or false negativeresults [5]. Causes of false positive tuber-culin tests include error in administration,cross-reaction with non-tuberculous my-cobacterial antigens, previous BCG vacci-nation and the booster phenomenon. TheCDC recommends that, irrespective oftheir BCG vaccine status, health careworkers should be screened with a yearlytuberculin test. Skin test reactions relatedto BCG vaccine typically decline in severitywith time and the vaccine is not completelyeffective in preventing infection. If a tuber-culin test response increases in size duringyearly surveillance, a new infection is like-ly, rather than a reaction to previous BCGvaccination.
Some of the studied cases, particularlythose with large tuberculin reactions, com-plained of discomfort, and refused suchtesting in the future. Generally, apart fromlocal pain or discomfort, the tuberculin testis safe and valid even throughout pregnan-cy and has no known teratogenic effects[6]. There is no evidence that pregnancyaffects the accuracy of tuberculin testing.The skin test is contraindicated if the work-er has experienced a large necrotic reactionto past tuberculin testing.
OSHA guidelines recommend the use of2-stage testing for TB in all new employees
17 Tuberculin reactivity among.pmd 3/3/2005, 12:14 AM1039
1040 La Revue de Santé de la Méditerranée orientale, Vol. 9, No 5/6, 2003
at risk for TB exposure who have not had atuberculin test in the past year [10]. This 2-stage procedure given 1 to 3 weeks afterthe first test is used to detect a possible‘boosting’ effect that can occur when thefirst falsely negative tuberculin test leads toa ‘recall’ of the immune response. A posi-tive second test constitutes a true positive,indicates past TB exposure or infection andthus requires further evaluation. Boostingcan occur in 2%–10% of the general popu-lation [18,19]. The overall incidence ofboosting in health care workers is notknown. The CDC guidelines allow deci-sions about the use of 2-stage testing to bebased on institutional data concerning theincidence of boosting in the facility. In thisstudy, the 2-step test was not performedbecause of the high prevalence of positivetuberculin results.
Knowledge of the transmission of TBand infection control measures for TBamong health care workers has been foundto be incomplete [20]. Health administra-tors and infection control departments inhospitals are responsible for ensuring theimplementation of an effective TB controlprogramme. This requires education, riskassessment, early identification, isolation,
complete treatment of infectious TB pa-tients, effective engineering controls, anappropriate respiratory protection pro-gramme, counselling, screening and evalu-ation for health care workers.
A high prevalence of positive tuberculintests was found among a subset of healthcare workers at KAUH. This might indicatea high risk for future acquisition of TB in-fection for the health care workers andsubsequent spreading of disease. In orderto enhance the protection of both healthcare workers and hospitalized patients, ef-fective control and preventive measures forTB, including yearly tuberculin testing ofhealth care workers, should be considered.
AcknowledgementsThe researchers would like to acknowledgeDr S. Matboli from the health staff clinicsat King Abdulaziz University Hospital forher contribution in reading tuberculin tests.Additionally, the researchers acknowledgeDr W.A. Milaat from the Department ofCommunity Medicine at King AbdulazizUniversity for his helpful support and peerreview.
References
1. Rosenman KD, Hall N. Occupational riskfactors for developing tuberculosis.American journal of industrial medicine,1996, 30(2):148–54.
2. Swinker M. Occupational infections inhealth care workers: prevention and in-tervention. American family physician,1997, 56(9):2291–300.
3. McCray E et al. The epidemiology of tu-berculosis in the United States. Clinics inchest medicine, 1997, 18:99–113.
4. Tuberculosis morbidity—United States,1997. Morbidity and mortality weekly re-port, 1998, 47:253–6.
5. Screening for tuberculosis and tubercu-losis infection in high risk populations.Recommendations of the AdvisoryCouncil for the Elimination of Tuberculo-sis. Morbidity and mortality weekly re-port, 1995, 44:18–34.
6. Guidelines for preventing the transmis-sion of Mycobacterium tuberculosis in
17 Tuberculin reactivity among.pmd 3/3/2005, 12:14 AM1040
Eastern Mediterranean Health Journal, Vol. 9, Nos 5/6, 2003 1041
health care facilities, 1994. Centers forDisease Control and Prevention. Mor-bidity and mortality weekly report, 1994,43(RR-13):1–132.
7. Bowden K, McDiarmid M. Occupationallyacquired tuberculosis: what’s known.Journal of occupational medicine, 1994,36:320–5.
8. Occupational Safety and Health Admin-istration. Occupational exposure to tu-berculosis–proposed rule. WashingtonDC, US Department of Labor, 1977 (29CFR Part 1910, docket no. H-371, RIN1218-AB46:54160).
9. Sbarbaro JA. Tuberclosis: yesterday, to-day, and tomorrow [editorial]. Annals ofinternal medicine, 1995, 122:955–6.
10. Occupational Safety and Health Admin-istration. Enforcement procedures andscheduling for occupational exposure totuberculosis. Washington DC, US De-partment of Labor, Office of Health Com-pliance Assistance, 1996 (Directive no.CPL 2.106).
11. Jerant A, Bannon M, Ritteenhouse S.Identification and management of tuber-culosis. American family physician,2000, 61(9):2667–78.
12. American Thoracic Society, Medical Sec-tion of the American Lung Association.Diagnostic standards and classificationof tuberculosis. American review of res-piratory disease, 1990, 142(3):725–35.
13. Kassim S et al. Tuberculosis skin testingto assess the occupational risk of Myco-bacterium tuberculosis infection among
health care workers in Abidjan, Coted’Ivoire. International journal of tubercu-losis and lung disease, 2000, 4(4):321–6.
14. Gamboa MJ, Morales FI, Rosales PS.Prevalence of tuberculin reactivityamong healthcare workers from a Mexi-can hospital. Infectious control and hos-pital epidemiology, 1994, 15(5):319–20.
15. Bener A. Prevalence of tuberculosis in-fection in ABHA and BAHA. Europeanjournal of epidemiology, 1990, 6(4):376–81.
16. Al-Kassemi FA et al. Nationwide commu-nity survey of tuberculosis epidemiologyin Saudi Arabia. Tubercle and lung dis-ease, 1993, 74(4):254–60.
17. Prezant DJ et al. Tuberculosis skin testconversion rates in New York city emer-gency medical service health care work-ers. Annals of emergency medicine,1998, 32(2):208–13.
18. Menzies R et al. The booster effect intwo-step tuberculin testing amongyoung adults in Montreal. Annals of inter-nal medicine, 1994, 120:190–8.
19. Manusov EG, Bradshaw RD, Fogarty JP.Tuberculosis screening in medical stu-dents. Family medicine, 1996, 28:645–9.
20. Lai KK et al. Knowledge of the transmis-sion of tuberculosis and infection controlmeasures for tuberculosis amonghealthcare workers. Infectious controland hospital epidemiology, 1996, 17(3):168–70.
17 Tuberculin reactivity among.pmd 3/3/2005, 12:14 AM1041
1042 La Revue de Santé de la Méditerranée orientale, Vol. 9, No 5/6, 2003
Epidemiology of malaria in Al-Tameem province, Iraq, 1991–2000M.A.A. Kadir,1 A.K.M. Ismail2 and S.S. Tahir 3
1College of Medicine, Tikrit, Iraq.2Public Health Laboratory, Al-Tameem, Iraq.3Directorate of Health, Al-Tameem, Iraq.Received: 12/02/2002; accepted: 14/05/2002
ABSTRACT To determine the rates of malarial infection in different areas of Al-Tameem province, weconducted a cross-sectional study from 1991 to 2000. We found an overall infection rate of 0.76% byPlasmodium vivax. Infection rates were highest in Dibis district (1.12%), followed by infections from outsidethe province (0.93%) and in Hawija district (0.89%), Kirkuk (0.62%) and Dakok (0.17%). Rates of infectionvaried by year with the lowest rate in 1991 (0.02%) and the highest rate in 1996 (1.84%). All ages wererepresented, with the highest rate of infection among 21–30-year-olds. Males had a slightly higher rate ofinfection (0.78%) than females (0.73%).
Epidémiologie du paludisme dans la province d’Al-Tamim (Iraq), 1991-2000RESUME Afin de déterminer les taux d’infection paludéenne dans différentes zones de la province d’Al-Tamim, une étude transversale a été réalisée de 1991 à 2000. On a trouvé un taux global d’infection parl’espèce Plasmodium vivax de 0,76 %. Le taux d’infection était le plus élevé dans le district de Dibis (1,12 %)suivi par les infections provenant de l’extérieur de la province (0,93 %) et dans les districts de Hawija(0,89 %), de Kirkouk (0,62 %) et de Dakok (0,17 %). Les taux d’infection variaient selon l’année, avec le tauxle plus faible en 1991 (0,02 %) et le taux le plus élevé en 1996 (1,84 %). Tous les âges étaient représentés,le taux d’infection le plus élevé se trouvant dans le groupe d’âge des 21-30 ans. Les hommes avaient un tauxd’infection légèrement plus élevé (0,78 %) que les femmes (0,73 %).
18 Epidemiology of malaria.pmd 3/3/2005, 12:15 AM1042
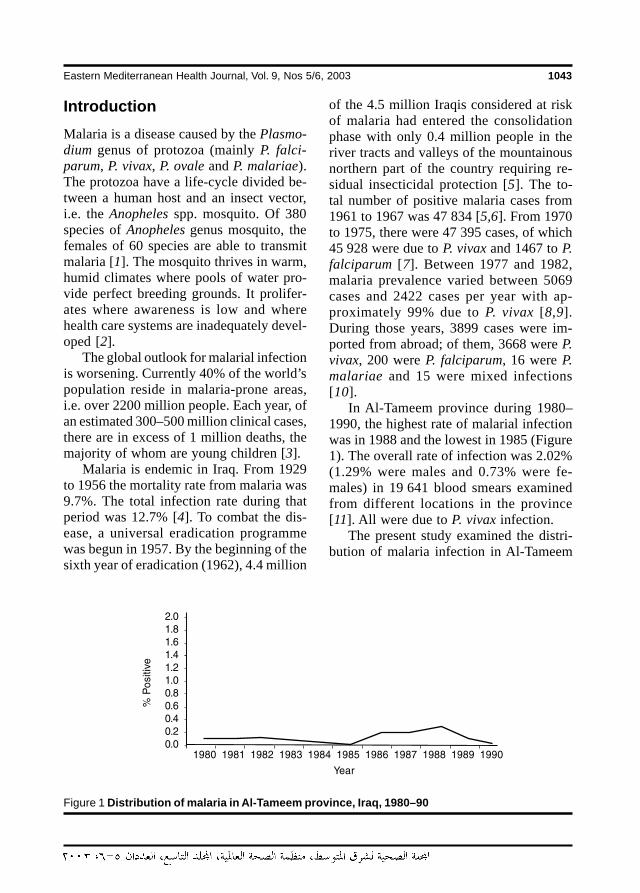
Eastern Mediterranean Health Journal, Vol. 9, Nos 5/6, 2003 1043
IntroductionMalaria is a disease caused by the Plasmo-dium genus of protozoa (mainly P. falci-parum, P. vivax, P. ovale and P. malariae).The protozoa have a life-cycle divided be-tween a human host and an insect vector,i.e. the Anopheles spp. mosquito. Of 380species of Anopheles genus mosquito, thefemales of 60 species are able to transmitmalaria [1]. The mosquito thrives in warm,humid climates where pools of water pro-vide perfect breeding grounds. It prolifer-ates where awareness is low and wherehealth care systems are inadequately devel-oped [2].
The global outlook for malarial infectionis worsening. Currently 40% of the world’spopulation reside in malaria-prone areas,i.e. over 2200 million people. Each year, ofan estimated 300–500 million clinical cases,there are in excess of 1 million deaths, themajority of whom are young children [3].
Malaria is endemic in Iraq. From 1929to 1956 the mortality rate from malaria was9.7%. The total infection rate during thatperiod was 12.7% [4]. To combat the dis-ease, a universal eradication programmewas begun in 1957. By the beginning of thesixth year of eradication (1962), 4.4 million
of the 4.5 million Iraqis considered at riskof malaria had entered the consolidationphase with only 0.4 million people in theriver tracts and valleys of the mountainousnorthern part of the country requiring re-sidual insecticidal protection [5]. The to-tal number of positive malaria cases from1961 to 1967 was 47 834 [5,6]. From 1970to 1975, there were 47 395 cases, of which45 928 were due to P. vivax and 1467 to P.falciparum [7]. Between 1977 and 1982,malaria prevalence varied between 5069cases and 2422 cases per year with ap-proximately 99% due to P. vivax [8,9].During those years, 3899 cases were im-ported from abroad; of them, 3668 were P.vivax, 200 were P. falciparum, 16 were P.malariae and 15 were mixed infections[10].
In Al-Tameem province during 1980–1990, the highest rate of malarial infectionwas in 1988 and the lowest in 1985 (Figure1). The overall rate of infection was 2.02%(1.29% were males and 0.73% were fe-males) in 19 641 blood smears examinedfrom different locations in the province[11]. All were due to P. vivax infection.
The present study examined the distri-bution of malaria infection in Al-Tameem
Figure 1 Distribution of malaria in Al-Tameem province, Iraq, 1980–90
18 Epidemiology of malaria.pmd 3/3/2005, 12:15 AM1043
1044 La Revue de Santé de la Méditerranée orientale, Vol. 9, No 5/6, 2003
province and the sex and age distribution ofinfected individuals in different locations ofthe province with the aim of supportingeradication efforts in the area.
MethodsThis cross-sectional study was conductedin Al-Tameem province, Iraq, during 1991–2000. Al-Tameem is in northern Iraq, bor-dered by the provinces of Arbil,Sulaimaniya, Nineveh, Salahaddin and Diy-ala. The study was conducted among pop-ulations in the different districts of theprovince, i.e. Kirkuk, Hawija, Dibis andDakok, as well as populations from otherprovinces including Salahaddin, Nineveh,Sulaimaniya, Arbil, Diyala, Najaf and Bagh-dad.
Samples were collected by the authorsby non-randomized technique from casesattending the Central Public Health Labora-tory in Kirkuk city and the primary healthcare centres in nearby districts and during asurvey in cooperation with the malaria teamof the Directory of Health, Al-Tameemprovince.
Both thin and thick blood smears werecollected from 261 763 individuals(165 721 males and 96 042 females; agerange: < 1–60 years). Blood smears wereexamined after staining with Giemsa stain[12] in the Central Public Health Laborato-ry, Kirkuk.
ResultsOf 261 763 blood smears examined, 2003(0.76%) were positive for P. vivax (Table1). The positive cases were from the Al-Tameem districts of Kirkuk (654), Hawija(537), Dibis (694) and Dakok (46). In addi-tion, 72 positive cases were from individu-als attending the Central Public Health
Laboratory and primary health centres butoriginating in the provinces of Salahaddin,Nineveh, Sulaimaniya, Arbil, Diyala, Najafand Baghdad. The infection rate was low-est in 1991 (0.02%), increased to 0.23% in1992, peaked in 1996 (1.84%), and thendeclined from 1997 (0.45%) to 2000(0.12%) (Figure 2).
Table 2 shows the sex and age distribu-tion of malarial infection. The rate of infec-tion in males (0.78%) was slightly higherthan in females (0.73%). The highest rateof infection was among the 21–30-year-oldage group, followed by 31–40 years, 11–20years, ≥ 40 years and ≤ 10 years respec-tively.
DiscussionOur study indicates that P. vivax infectionis still endemic in Al-Tameem province.The overall rate of infection (0.76%) waslower than reported in 1996 (2.24%) and in2001 (2.02%) in different areas of Al-Tameem, but higher than reported in 1966and in 1978 (0.001% and 0.05% respec-tively) [5,9,11,13,14].
The increase in the rate of infection dur-ing 1994–96 may be related to the econom-ic sanctions imposed on Iraq that resultedin a lack of suitable drugs, difficulties oftransportation to endemic areas and a lackof effective insecticides.
The decline in the rate of infection from1997 to 2000 may be attributed to the ef-forts of the Al-Tameem Health Authority incontrolling the rate of infection and the in-creased availability of drugs and insecti-cides from the United Nations oil-for-foodprogramme.
The distribution of malaria infection inAl-Tameem is province-wide. This may bedue to people from the city centres travel-ling to rural areas for farm work or by vis-
18 Epidemiology of malaria.pmd 3/3/2005, 12:15 AM1044
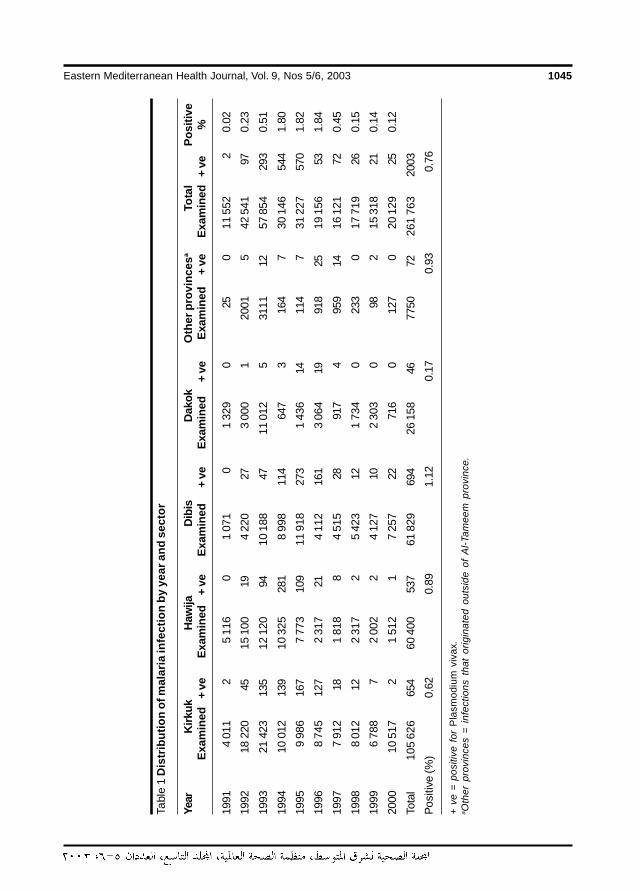
Eastern Mediterranean Health Journal, Vol. 9, Nos 5/6, 2003 1045
Tabl
e 1
Dis
trib
utio
n of
mal
aria
infe
ctio
n by
yea
r and
sec
tor
Year
Kirk
ukH
awija
Dib
isD
akok
Oth
er p
rovi
nces
aTo
tal
Posi
tive
Exam
ined
+ ve
Exam
ined
+ ve
Exam
ined
+ ve
Exam
ined
+ ve
Exam
ined
+ ve
Exam
ined
+ ve
%
1991
4 01
12
5 11
60
1 07
10
1 32
90
250
11 5
522
0.02
1992
18 2
2045
15 1
0019
4 22
027
3 00
01
2001
542
541
970.
23
1993
21 4
2313
512
120
9410
188
4711
012
531
1112
57 8
5429
30.
51
1994
10 0
1213
910
325
281
8 99
811
464
73
164
730
146
544
1.80
1995
9 98
616
77
773
109
11 9
1827
31
436
1411
47
31 2
2757
01.
82
1996
8 74
512
72
317
214
112
161
3 06
419
918
2519
156
531.
84
1997
7 91
218
1 81
88
4 51
528
917
495
914
16 1
2172
0.45
1998
8 01
212
2 31
72
5 42
312
1 73
40
233
017
719
260.
15
1999
6 78
87
2 00
22
4 12
710
2 30
30
982
15 3
1821
0.14
2000
10 5
172
1 51
21
7 25
722
716
012
70
20 1
2925
0.12
Tota
l10
5 62
665
460
400
537
61 8
2969
426
158
4677
5072
261
763
2003
Pos
itive
(%)
0.62
0.89
1.12
0.17
0.93
0.76
+ ve
= p
ositi
ve f
or P
lasm
odiu
m v
ivax
.a O
ther
pro
vinc
es =
inf
ectio
ns t
hat
orig
inat
ed o
utsi
de o
f A
l-Tam
eem
pro
vinc
e.
18 Epidemiology of malaria.pmd 3/3/2005, 12:15 AM1045
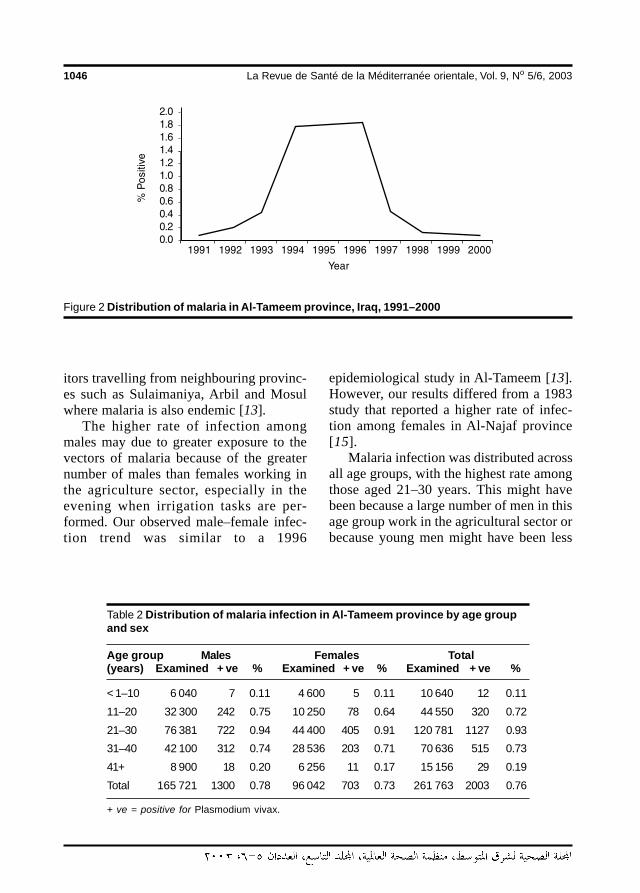
1046 La Revue de Santé de la Méditerranée orientale, Vol. 9, No 5/6, 2003
itors travelling from neighbouring provinc-es such as Sulaimaniya, Arbil and Mosulwhere malaria is also endemic [13].
The higher rate of infection amongmales may due to greater exposure to thevectors of malaria because of the greaternumber of males than females working inthe agriculture sector, especially in theevening when irrigation tasks are per-formed. Our observed male–female infec-tion trend was similar to a 1996
Table 2 Distribution of malaria infection in Al-Tameem province by age groupand sex
Age group Males Females Total(years) Examined + ve % Examined + ve % Examined + ve %
< 1–10 6 040 7 0.11 4 600 5 0.11 10 640 12 0.11
11–20 32 300 242 0.75 10 250 78 0.64 44 550 320 0.72
21–30 76 381 722 0.94 44 400 405 0.91 120 781 1127 0.93
31–40 42 100 312 0.74 28 536 203 0.71 70 636 515 0.73
41+ 8 900 18 0.20 6 256 11 0.17 15 156 29 0.19
Total 165 721 1300 0.78 96 042 703 0.73 261 763 2003 0.76
+ ve = positive for Plasmodium vivax.
Figure 2 Distribution of malaria in Al-Tameem province, Iraq, 1991–2000
epidemiological study in Al-Tameem [13].However, our results differed from a 1983study that reported a higher rate of infec-tion among females in Al-Najaf province[15].
Malaria infection was distributed acrossall age groups, with the highest rate amongthose aged 21–30 years. This might havebeen because a large number of men in thisage group work in the agricultural sector orbecause young men might have been less
18 Epidemiology of malaria.pmd 3/3/2005, 12:15 AM1046
Eastern Mediterranean Health Journal, Vol. 9, Nos 5/6, 2003 1047
likely to cover themselves adequately dur-ing the most at-risk times of day. This find-ing was similar to other reports from
1. Heyneman D. Medical parasitology. In:Brooks GF et al., eds. Jawetz, Melnickand Adelberg’s medical microbiology,20th ed. Norwalk, Connecticut, Appletonand Lange, 1995.
2. United Nations Children’s Fund. Malaria:prevention and treatment. The pre-scriber, 2000, 18:1–16.
3. Garcia LS, Bruckner DA. Diagnosticmedical parasitology, 2nd ed. Washing-ton, DC, American Society for Microbiol-ogy, 1993.
4. Der Hakobain M. The state of health inIraq over half a century, 1st ed. Baghdad,Dar Al-Rashid Publishers, 1982.
5. Ossi GT. Malaria eradication in Iraq1962. Bulletin of endemic diseases,1966, 7:71–90.
6. Ossi GT. Highlights on Malaria Eradica-tion Programme in Iraq, 1961. Bulletin ofendemic diseases, 1965, 7:1–12.
7. Ossi GT. Malaria Eradication Program-me in Iraq, 1970–1975. Bulletin of en-demic diseases, 1977, 18:13–33.
8. Ossi GT. Report on malaria eradicationin Iraq presented at the 16th meeting ofthe Inter-Country Malaria EradicationCoordination Board between Iraq, Jor-dan, Lebanon, Syria and Turkey. Dam-ascus, November 23–25, 1971. Bulletinof endemic diseases, 1973, 14:133–52.
9. Ossi GT. Progress report on the MalariaEradication Programme Iraq, 1978. Bul-letin of endemic diseases, 1982, 21:9–24.
10. Ali NA. The problem of malaria importedcases from abroad in Iraq. Bulletin of en-demic diseases, 1985, 26(1–4):5–11.
11. Al-Jebouri SH. Epidemiology of malariain Al-Tameem province, with a study ofsome biochemical changes in blood in-fected with Plasmodium vivax [MSc the-sis]. Tikrit, College of Medicine, TikritUniversity, 1997.
12. Basic malaria microscopy, Part 1.Learner’s guide. Geneva, World HealthOrganization, 1991.
13. Salman YG. A study of some aspects ofthe pathogenicity of P. vivax in Al-Tameem province, with a study of thecontinuous cultivation of the parasite invitro [Ph.D. thesis]. Baghdad, Al-Mustansiriyah University, 1996.
14. Kadir MA, Al-Jebouri SH, Salman YG.Prevalence of malaria in Al-Tameemprovince, Iraq. Iraqi journal of communitymedicine, 2001, 14:138–41.
15. Shihab KI, Dawah AH, Tarfa A. The elimi-nation of indigenous malaria from Al-Majadahia, Rumaitha district, Iraq.Bulletin of endemic diseases, 1984, 24–25(1–4):33–44.
16. Segal HE et al. Longitudinal malariastudies in rural north-east Thailand: de-mographic and temporal variables of in-fection. Bulletin of the World HealthOrganizaton, 1974, 50(6):505–12.
Al-Tameem province and from Thailand[11,13,16].
References
18 Epidemiology of malaria.pmd 3/3/2005, 12:15 AM1047
1048 La Revue de Santé de la Méditerranée orientale, Vol. 9, No 5/6, 2003
Malaria and intestinal parasitosisamong children presenting to thePaediatric Centre in Sana’a, YemenA.A. Azazy1 and Y.A. Raja’a2
1Department of Parasitology; 2Department of Community Medicine, Faculty of Medicine and HealthSciences, Sana’a,Yemen.Received: 14/08/02; accepted: 16/03/03
ABSTRACT We studied the profile of malaria and intestinal parasitosis among children presenting to thePaediatric Health Centre in Sana’a from January 1998 to December 2000. In stool samples from 9014children, Ascaris lumbricoides, Entamoeba histolytica, Giardia lamblia and Trichuris trichiura were the mostcommon. Infection with parasites of direct life-cycle were similar in boys and girls. Schistosome infection wassignificantly higher in boys than girls, but girls were more infected with ascariasis. The only species of malariaparasite found in blood samples from 753 children with suspected malaria was Plasmodium falciparum, withthe highest rates in April–June. The majority of positive cases were Yemeni children, but 10.8% wereSudanese or Ethiopian.
Le paludisme et la parasitose intestinale chez les enfants consultant au centre pédiatrique deSanaa (République du Yémen)RESUME Nous avons étudié le profil du paludisme et de la parasitose intestinale chez des enfants amenésen consultation au centre pédiatrique de Sanaa de janvier 1998 à décembre 2000. Ascaris lumbricoides,Entamoeba histolytica, Giardia lamblia et Trichuris trichiura étaient les parasites les plus courants. L’infestationpar des parasites qui ont un cycle de vie direct était similaire chez les garçons et les filles. L’infestation pardes schistosomes était significativement plus élevée chez les garçons que chez les filles, tandis que les fillesétaient davantage touchées par l’ascaridiase. Plasmodium falciparum était la seule espèce de parasite dupaludisme trouvée dans les échantillons sanguins de 753 enfants suspects de paludisme, les taux les plusélevés entre avril et juin. La majorité des cas positifs étaient des enfants yéménites, mais 10,8 % étaient desSoudanais ou des Ethiopiens.
19 Malaria and intestinal parasitosis.pmd 3/3/2005, 12:15 AM1048
Eastern Mediterranean Health Journal, Vol. 9, Nos 5/6, 2003 1049
IntroductionThe highest rates of protozoa and helminthinfections worldwide occur in the tropics.The distribution of these infections de-pends on conditions such as a suitable cli-mate and human activities such aspopulation movements and poor sanitation.
Malaria is the major public health prob-lem in Yemen [1], and has the typical afro-tropical pattern in which the predominantspecies is Plasmodium falciparum [2,3]. Aprevious study found that the incidence ofP. falciparum infection among Yemeni re-turnees in Al-Hodeidah governorate was13.9%, with some seasonal variations [3].
Transmission of ascariasis and trichuri-asis takes place throughout the year in re-gions with a temperate climate. Thesoil-transmitted parasites, mainly Ascarislumbricoides and Trichuris trichiura, areusually more prevalent where there isfavourable soil, warmth and moisture to-gether with poor sanitation. Studies in dif-ferent parts of Yemen have reportedprevalence rates of ascariasis ranging from16%–68% [4–6]. Meanwhile, trichuriasiswas reported, mostly from the same areas,in 1%–21% of the population [6,7].
Parasites with a direct life-cycle spreadmore easily among children and within thehousehold. Various studies in Yemen havebeen conducted on the different parasiteswith a direct life-cycle. For example, theprevalence of Entamoeba histolytica hasbeen reported to range from 1.7%–36%[4,7], while for Giardia lamblia it was9.0%–20.5% and for Hymenolepis nana2%–8.3% [6,8]. The lowest prevalencewas 0%-2% for Enterobius vermicularis[4,6].
The most prevalent water-borne para-site in Yemen is the schistosome. Schisto-somiasis is second to malaria in the list ofmajor public health problems in the country
[1] and intestinal schistosomiasis has beenreported in a number of different surveys[6–12]. Very low rates of infection havebeen reported for Fasciola hepatica, from0.5%–2.0% [4,7]. Low prevalence rates of0.1%–0.3% were reported for Taenia spp.[4,7].
With the exception of Farag’s study in1985 [4], all other published works fromYemen have focused on schoolchildren andchildren in the community. None of thestudies focused on children at the hospitallevel and none has investigated malariatransmission in Sana’a, the city capital ofthe country. The current study thereforeaimed to determine the profile of malariaand intestinal parasitic infections amongchildren attending the Paediatric HealthCentre in Sana’a.
MethodsThe Paediatric Health Centre in Sana’a pro-vides services to the community throughoutpatient clinics and admissions. The cen-tre receives patients from Sana’a city, sur-rounding areas and sometimes from othergovernorates, as well as referred casesfrom private clinics. Children with suspect-ed infections are referred to the laboratoryunit for investigation. In a record-based de-scriptive study, we reviewed the results of9014 stool samples from Yemeni childrenand 753 blood samples from Yemeni andother nationality children who had been re-ferred to the laboratory unit during the peri-od January 1998 to December 2000. Formalaria, additional questions about resi-dence, nationality and travel history toknown endemic areas were investigatedand recorded in the laboratory notes. Allstool and blood samples were examined inthe centre’s laboratory.
19 Malaria and intestinal parasitosis.pmd 3/3/2005, 12:15 AM1049
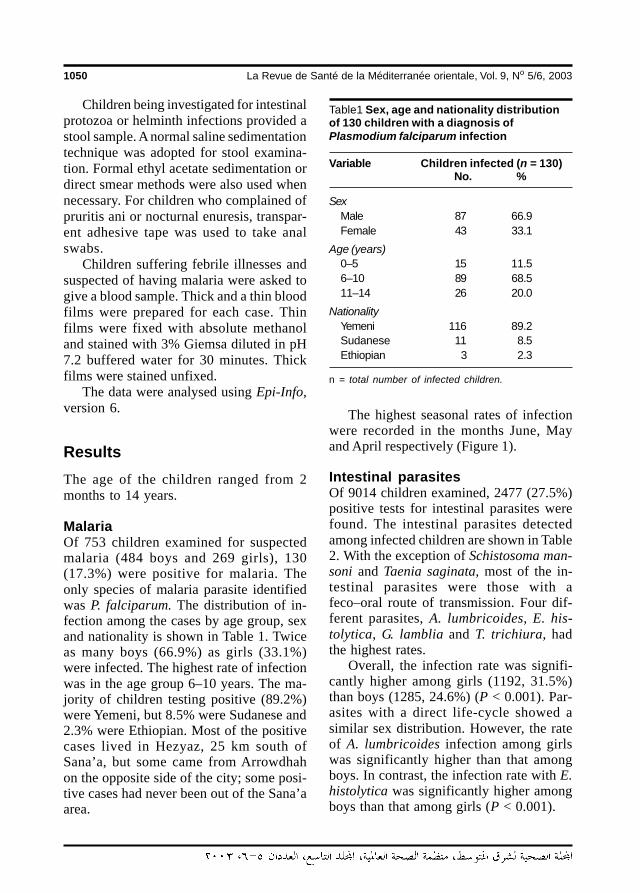
1050 La Revue de Santé de la Méditerranée orientale, Vol. 9, No 5/6, 2003
Children being investigated for intestinalprotozoa or helminth infections provided astool sample. A normal saline sedimentationtechnique was adopted for stool examina-tion. Formal ethyl acetate sedimentation ordirect smear methods were also used whennecessary. For children who complained ofpruritis ani or nocturnal enuresis, transpar-ent adhesive tape was used to take analswabs.
Children suffering febrile illnesses andsuspected of having malaria were asked togive a blood sample. Thick and a thin bloodfilms were prepared for each case. Thinfilms were fixed with absolute methanoland stained with 3% Giemsa diluted in pH7.2 buffered water for 30 minutes. Thickfilms were stained unfixed.
The data were analysed using Epi-Info,version 6.
ResultsThe age of the children ranged from 2months to 14 years.
MalariaOf 753 children examined for suspectedmalaria (484 boys and 269 girls), 130(17.3%) were positive for malaria. Theonly species of malaria parasite identifiedwas P. falciparum. The distribution of in-fection among the cases by age group, sexand nationality is shown in Table 1. Twiceas many boys (66.9%) as girls (33.1%)were infected. The highest rate of infectionwas in the age group 6–10 years. The ma-jority of children testing positive (89.2%)were Yemeni, but 8.5% were Sudanese and2.3% were Ethiopian. Most of the positivecases lived in Hezyaz, 25 km south ofSana’a, but some came from Arrowdhahon the opposite side of the city; some posi-tive cases had never been out of the Sana’aarea.
The highest seasonal rates of infectionwere recorded in the months June, Mayand April respectively (Figure 1).
Intestinal parasitesOf 9014 children examined, 2477 (27.5%)positive tests for intestinal parasites werefound. The intestinal parasites detectedamong infected children are shown in Table2. With the exception of Schistosoma man-soni and Taenia saginata, most of the in-testinal parasites were those with afeco–oral route of transmission. Four dif-ferent parasites, A. lumbricoides, E. his-tolytica, G. lamblia and T. trichiura, hadthe highest rates.
Overall, the infection rate was signifi-cantly higher among girls (1192, 31.5%)than boys (1285, 24.6%) (P < 0.001). Par-asites with a direct life-cycle showed asimilar sex distribution. However, the rateof A. lumbricoides infection among girlswas significantly higher than that amongboys. In contrast, the infection rate with E.histolytica was significantly higher amongboys than that among girls (P < 0.001).
Table1 Sex, age and nationality distributionof 130 children with a diagnosis ofPlasmodium falciparum infection
Variable Children infected (n = 130)No. %
SexMale 87 66.9Female 43 33.1
Age (years)0–5 15 11.56–10 89 68.511–14 26 20.0
NationalityYemeni 116 89.2Sudanese 11 8.5Ethiopian 3 2.3
n = total number of infected children.
19 Malaria and intestinal parasitosis.pmd 3/3/2005, 12:15 AM1050
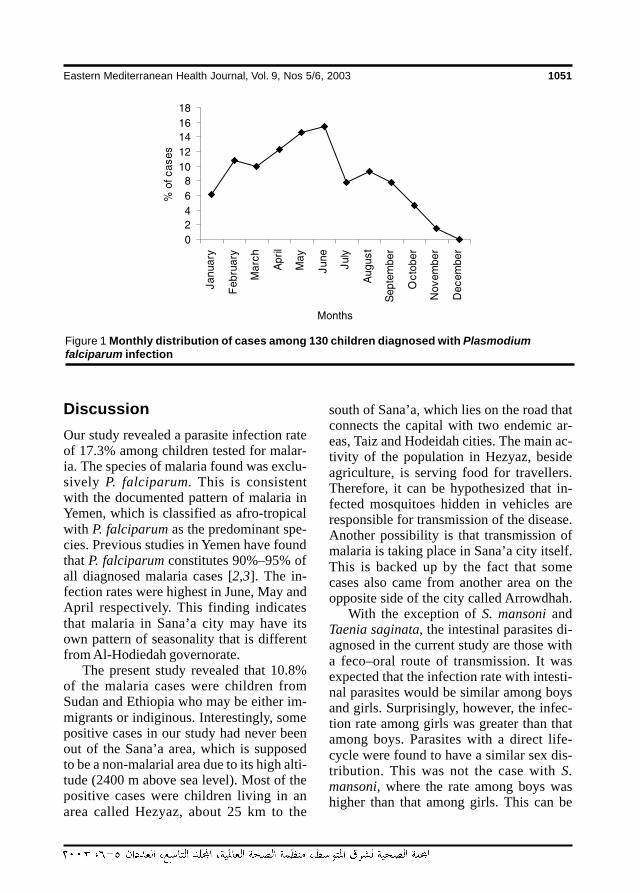
Eastern Mediterranean Health Journal, Vol. 9, Nos 5/6, 2003 1051
Figure 1 Monthly distribution of cases among 130 children diagnosed with Plasmodiumfalciparum infection
DiscussionOur study revealed a parasite infection rateof 17.3% among children tested for malar-ia. The species of malaria found was exclu-sively P. falciparum. This is consistentwith the documented pattern of malaria inYemen, which is classified as afro-tropicalwith P. falciparum as the predominant spe-cies. Previous studies in Yemen have foundthat P. falciparum constitutes 90%–95% ofall diagnosed malaria cases [2,3]. The in-fection rates were highest in June, May andApril respectively. This finding indicatesthat malaria in Sana’a city may have itsown pattern of seasonality that is differentfrom Al-Hodiedah governorate.
The present study revealed that 10.8%of the malaria cases were children fromSudan and Ethiopia who may be either im-migrants or indiginous. Interestingly, somepositive cases in our study had never beenout of the Sana’a area, which is supposedto be a non-malarial area due to its high alti-tude (2400 m above sea level). Most of thepositive cases were children living in anarea called Hezyaz, about 25 km to the
south of Sana’a, which lies on the road thatconnects the capital with two endemic ar-eas, Taiz and Hodeidah cities. The main ac-tivity of the population in Hezyaz, besideagriculture, is serving food for travellers.Therefore, it can be hypothesized that in-fected mosquitoes hidden in vehicles areresponsible for transmission of the disease.Another possibility is that transmission ofmalaria is taking place in Sana’a city itself.This is backed up by the fact that somecases also came from another area on theopposite side of the city called Arrowdhah.
With the exception of S. mansoni andTaenia saginata, the intestinal parasites di-agnosed in the current study are those witha feco–oral route of transmission. It wasexpected that the infection rate with intesti-nal parasites would be similar among boysand girls. Surprisingly, however, the infec-tion rate among girls was greater than thatamong boys. Parasites with a direct life-cycle were found to have a similar sex dis-tribution. This was not the case with S.mansoni, where the rate among boys washigher than that among girls. This can be
19 Malaria and intestinal parasitosis.pmd 3/3/2005, 12:15 AM1051
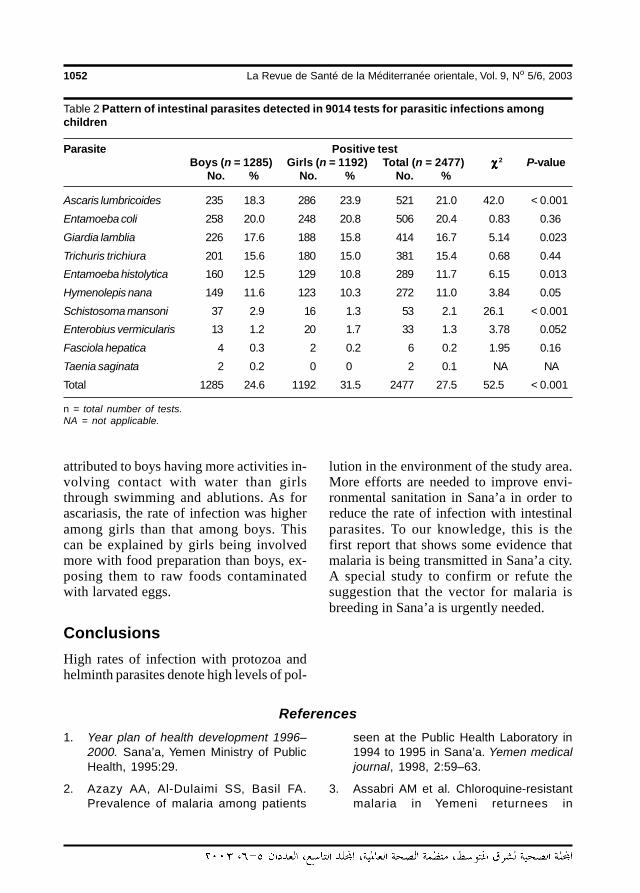
1052 La Revue de Santé de la Méditerranée orientale, Vol. 9, No 5/6, 2003
Table 2 Pattern of intestinal parasites detected in 9014 tests for parasitic infections amongchildren
Parasite Positive testBoys (n = 1285) Girls (n = 1192) Total (n = 2477) χχχχχ 2 P-value
No. % No. % No. %
Ascaris lumbricoides 235 18.3 286 23.9 521 21.0 42.0 < 0.001
Entamoeba coli 258 20.0 248 20.8 506 20.4 0.83 0.36
Giardia lamblia 226 17.6 188 15.8 414 16.7 5.14 0.023
Trichuris trichiura 201 15.6 180 15.0 381 15.4 0.68 0.44
Entamoeba histolytica 160 12.5 129 10.8 289 11.7 6.15 0.013
Hymenolepis nana 149 11.6 123 10.3 272 11.0 3.84 0.05
Schistosoma mansoni 37 2.9 16 1.3 53 2.1 26.1 < 0.001
Enterobius vermicularis 13 1.2 20 1.7 33 1.3 3.78 0.052
Fasciola hepatica 4 0.3 2 0.2 6 0.2 1.95 0.16
Taenia saginata 2 0.2 0 0 2 0.1 NA NA
Total 1285 24.6 1192 31.5 2477 27.5 52.5 < 0.001
n = total number of tests.NA = not applicable.
attributed to boys having more activities in-volving contact with water than girlsthrough swimming and ablutions. As forascariasis, the rate of infection was higheramong girls than that among boys. Thiscan be explained by girls being involvedmore with food preparation than boys, ex-posing them to raw foods contaminatedwith larvated eggs.
ConclusionsHigh rates of infection with protozoa andhelminth parasites denote high levels of pol-
lution in the environment of the study area.More efforts are needed to improve envi-ronmental sanitation in Sana’a in order toreduce the rate of infection with intestinalparasites. To our knowledge, this is thefirst report that shows some evidence thatmalaria is being transmitted in Sana’a city.A special study to confirm or refute thesuggestion that the vector for malaria isbreeding in Sana’a is urgently needed.
References
1. Year plan of health development 1996–2000. Sana’a, Yemen Ministry of PublicHealth, 1995:29.
2. Azazy AA, Al-Dulaimi SS, Basil FA.Prevalence of malaria among patients
seen at the Public Health Laboratory in1994 to 1995 in Sana’a. Yemen medicaljournal, 1998, 2:59–63.
3. Assabri AM et al. Chloroquine-resistantmalaria in Yemeni returnees in
19 Malaria and intestinal parasitosis.pmd 3/3/2005, 12:15 AM1052
Eastern Mediterranean Health Journal, Vol. 9, Nos 5/6, 2003 1053
Hodiedah, Republic of Yemen. Journal ofthe Arab Board of Medical Specializa-tions, 2001, 3:88–93.
4. Farag HF. Intestinal parasitosis in thepopulation of the Yemen Arab Republic.Tropical and geographical medicine,1985, 37:29–31.
5. Raja’a YA et al. Schistosomes infectionrate in relation to environmental factorsin schoolchildren. Saudi medical jour-nal, 2000, 21(7):635–8.
6. Azazy AA, Al-Taiar AS. A study survey onintestinal and blood parasites amongschoolchildren in Sana’a province,Yemen. Saudi medical journal, 1999,20(6):422–4.
7. Raja’a YA et al. Some aspects in the con-trol of schistosomosis and soil-transmit-ted helminthosis in Yemeni children.Saudi medical journal, 2001, 22(5):428–32.
8. Azazy AA, Al-Dullaimi SS. Prevalence ofintestinal parasites of pupils of an el-ementary school in Haja town, Yemen.Yemen medical journal, 1999, 3:66–8.
9. Hazza YA, Arfa’a F, Haggar M. Studies inSchistosomiasis in Taiz province, YemenArab Republic. American journal of tropi-cal medicine and hygiene, 1983, 32:1023–8.
10. Nagi MA, Molan AL. Schistosomiasisamong schoolchildren in Marib provinceof Republic of Yemen. International medi-cal journal, 1992:3212.
11. Al-Haddad AM, Assabri AM. Health im-pact of uncompleted sewerage project inMaitam valley, Ibb town, Republic ofYemen. Yemen medical journal, 1998,2:68–76.
12. Schaap HB, Den Dulk MO, PoldermanAM. Schistosomiasis in the Yemen ArabRepublic. Prevalence of Schistosomamansoni and S. haematobium infectionamong school children in the centralhighlands and their relation to altitude.Tropical and geographical medicine,1992, 44:19–22.
19 Malaria and intestinal parasitosis.pmd 3/3/2005, 12:15 AM1053
1054 La Revue de Santé de la Méditerranée orientale, Vol. 9, No 5/6, 2003
Selected epidemiological features ofhuman brucellosis in Yazd, IslamicRepublic of Iran: 1993–1998M.H. Salari,1 M.B. Khalili 2 and G.R. Hassanpour1
1Department of Pathobiology, School of Public Health and Institute of Public Health Research, TehranUniversity of Medical Sciences, Tehran, Islamic Republic of Iran.2Department of Microbiology, Shahid Sadoughi University of Medical Sciences, Yazd, Islamic Republic ofIran.Received: 27/12/01; accepted: 02/06/02
ABSTRACT Brucellosis is a significant health problem in countries where control of zoonoses is inadequate.During 1993–98, we analysed sera and cultures from 792 suspected brucellosis patients who presentedwith histories of fever, chills, night sweating, weakness, malaise and headache to the referral hospital in Yazd.Cases were investigated by tube agglutination test (TAT) and 2-mercaptoethanol test (2-MET) and a ques-tionnaire was completed for each. TAT titre was ≥ 1:160 for 745 patients (94.1%) and 2-MET was positive for42 (5.3%). Of 745 confirmed cases, 460 were from 1996–1997. Prevalence was highest in summer (39.5%)and more common males than among females. Prevalence was highest among those aged 10–19 years(27.7%). Most patients had a history of infected cheese, milk and milk product consumption (98%).
Quelques caractéristiques épidémiologiques de la brucellose humaine à Yazd (République is-lamique d’Iran) : 1993-1998RESUME La brucellose demeure un important problème de santé dans les pays où les mesures de luttecontre les zoonoses sont insuffisantes. Pendant la période 1993-1998, nous avons analysé les sérums etles cultures de 792 patients suspects de brucellose qui se sont présentés à l’hôpital de recours à Yazd avecdes antécédents de fièvre, de frissons, de sueurs nocturnes, de faiblesse, de malaises et de céphalées. Lescas ont été examinés en réalisant l’épreuve d’agglutination en tube et l’épreuve d’agglutination en présencede mercapto-2 éthanol ; un questionnaire a été rempli pour chacun des patients. Le titre pour l’épreuved’agglutination en tube était supérieur ou égal à 1:160 pour 745 patients (94,1 %) et l’examen au mercap-toéthanol était positif pour 42 patients (5,3 %). Sur les 745 cas confirmés, 460 remontaient à 1996-1997. Laprévalence était la plus élevée pendant l’été (39,5 %) et la fréquence était plus importante chez les hommesque chez les femmes. La prévalence était plus forte chez les sujets âgés de 10 à 19 ans (27,7 %). La plupartdes patients avaient consommé des fromages, du lait et des produits laitiers infectés (98 %).
20 Selected epidemiological features.pmd 3/3/2005, 12:15 AM1054
Eastern Mediterranean Health Journal, Vol. 9, Nos 5/6, 2003 1055
IntroductionBrucellosis is a major health and economicproblem in many areas of the world [1,2].It is mainly a contagious disease of domes-tic animals such as sheep, goats, cows,camels and dogs. Humans are commonlyinfected through ingestion of raw milk,cheese and meat or through direct contactwith infected animals [2–6]. The disease istransmitted from animals to humans bythree routes: direct contact of infected tis-sues, blood or lymph with conjunctive orbroken skin; ingestion of contaminatedmeat or dairy products; and inhalation ofinfectious aerosols. Brucellosis occurs onall continents and affects about 500 000 in-dividuals annually worldwide [6,7].
Diagnosis of human brucellosis relieson serological tests, such as the tube agglu-tination test (TAT), Coombs test, andenzyme-linked immunosorbent assay(ELISA). A single titre of 1:160 or greaterfor TAT is considered significant. In amodification of assay, the use of 2-mercap-toethanol (2-MET) in the assay disulfidebonds in IgM allow measurement of onlyIgG. IgG antibody typically appears withinweeks of infection and, in the absence ofinfection, usually persists. After cure, IgGmay be present for as long as 1 year. In thechronic stage of the disease, Brucella spp.antibodies persist for many years after in-fection; in most cases only 2-MET sensi-tive agglutinins persist [8–11].
This study had 2 main aims: first, toobtain data about epidemiological featuresof human brucellosis in Yazd, Islamic Re-public of Iran; second, to describe thecharacteristics and exposure to risk factorsfor brucellosis among cases.
MethodsThe city of Yazd in central Islamic Republicof Iran has an estimated population of ap-
proximately 388 171 (201 194 males and186 977 females). During the study period(1993–1998), all untreated suspected bru-cellosis patients (792 cases) with history offever, chills, night sweating, weakness,malaise and headache were referred toNicopour hospital, the Yazd referral hospi-tal, by Yazd health centres and physicians.A questionnaire was used to collect infor-mation about patients and also exposure torisk factors, and a blood sample was col-lected from each case.
For isolation and identification of Bru-cella spp., biphasic blood culture medium(Hemolin, Biomerieux, France), incubatedin an atmosphere of 5%–10% carbon diox-ide for 30 days, was used [12].
Serum specimens were analysed in 2phases, using suspension of B. abortus andB. melitensis (Wellcome Laboratories,UK). In the first phase, all specimens wereanalysed by the TAT. A titre of 1:160 orgreater was taken as an index of seroposi-tivity [8,10]. In the second phase, Brucellaspp. antibody of patients (IgG) was investi-gated by 2-MET. The serum dilutions wereprepard in 0.85% NaCl containing 0.05mol/L MET. Then agglutination reactionswas read after 48 h incubation at 37 ºC[11,13].
The collected data and the results oflaboratory tests were analysed by SPSS,version 6 and chi-squared test to determinevariables that were significantly associatedwith seropositivity to Brucella spp.
ResultsBrucellosis was more common among menthan among women (Table 1). There wereno significant differences between sexes(χ2 = 1.7, P < 0.1). The average annual rateof human brucellosis (TAT positive) was124 cases (Table 2). The highest averageannual rate of brucellosis was among age
1
20 Selected epidemiological features.pmd 3/3/2005, 12:15 AM1055
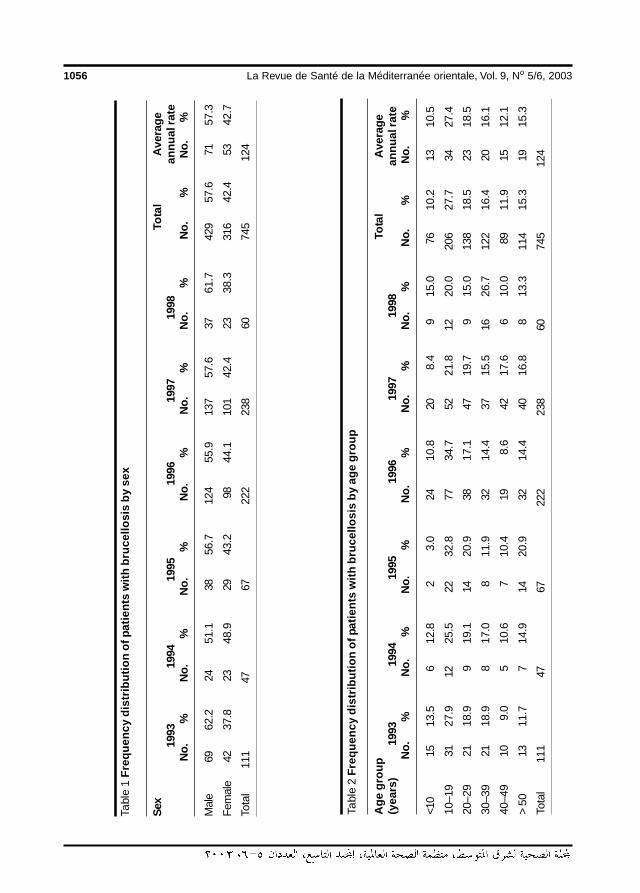
1056 La Revue de Santé de la Méditerranée orientale, Vol. 9, No 5/6, 2003
Tabl
e 2
Freq
uenc
y di
strib
utio
n of
pat
ient
s w
ith b
ruce
llosi
s by
age
gro
up
Age
gro
upTo
tal
Ave
rage
(yea
rs)
1993
1994
1995
1996
1997
1998
annu
al ra
teN
o.%
No.
%N
o.%
No.
%N
o.%
No.
%N
o.%
No.
%
<10
1513
.56
12.8
23.
024
10.8
208.
49
15.0
7610
.213
10.5
10–1
931
27.9
1225
.522
32.8
7734
.752
21.8
1220
.020
627
.734
27.4
20–2
921
18.9
919
.114
20.9
3817
.147
19.7
915
.013
818
.523
18.5
30–3
921
18.9
817
.08
11.9
3214
.437
15.5
1626
.712
216
.420
16.1
40–4
910
9.0
510
.67
10.4
198.
642
17.6
610
.089
11.9
1512
.1
> 50
1311
.77
14.9
1420
.932
14.4
4016
.88
13.3
114
15.3
1915
.3
Tota
l11
147
6722
223
860
745
124
Tabl
e 1
Freq
uenc
y di
strib
utio
n of
pat
ient
s w
ith b
ruce
llosi
s by
sex
Sex
Tota
lA
vera
ge19
9319
9419
9519
9619
9719
98an
nual
rate
No.
%N
o.%
No.
%N
o.%
No.
%N
o.%
No.
%N
o.%
Mal
e69
62.2
2451
.138
56.7
124
55.9
137
57.6
3761
.742
957
.671
57.3
Fem
ale
4237
.823
48.9
2943
.298
44.1
101
42.4
2338
.331
642
.453
42.7
Tota
l11
147
6722
223
860
745
124
20 Selected epidemiological features.pmd 3/3/2005, 12:15 AM1056
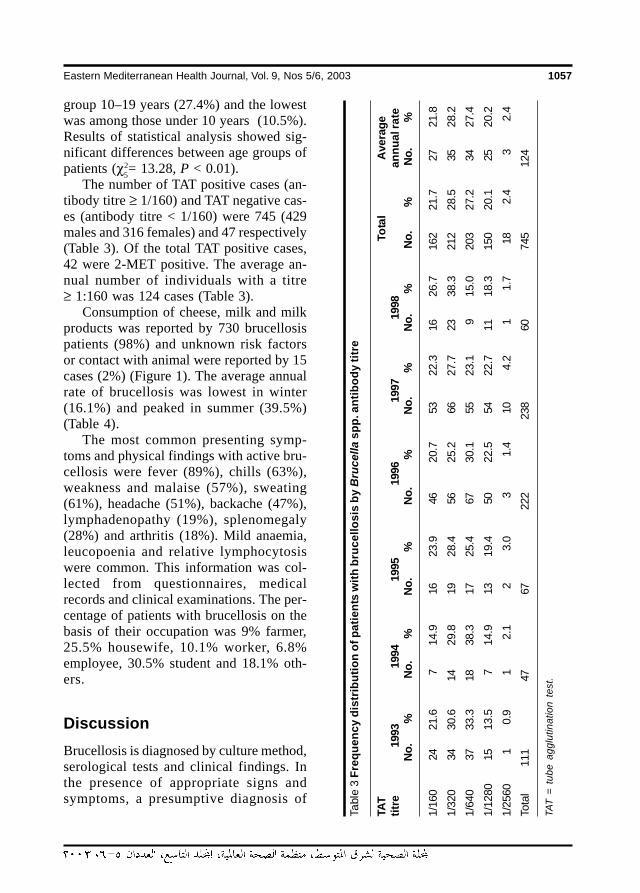
Eastern Mediterranean Health Journal, Vol. 9, Nos 5/6, 2003 1057
group 10–19 years (27.4%) and the lowestwas among those under 10 years (10.5%).Results of statistical analysis showed sig-nificant differences between age groups ofpatients (χ2= 13.28, P < 0.01).
The number of TAT positive cases (an-tibody titre ≥ 1/160) and TAT negative cas-es (antibody titre < 1/160) were 745 (429males and 316 females) and 47 respectively(Table 3). Of the total TAT positive cases,42 were 2-MET positive. The average an-nual number of individuals with a titre≥ 1:160 was 124 cases (Table 3).
Consumption of cheese, milk and milkproducts was reported by 730 brucellosispatients (98%) and unknown risk factorsor contact with animal were reported by 15cases (2%) (Figure 1). The average annualrate of brucellosis was lowest in winter(16.1%) and peaked in summer (39.5%)(Table 4).
The most common presenting symp-toms and physical findings with active bru-cellosis were fever (89%), chills (63%),weakness and malaise (57%), sweating(61%), headache (51%), backache (47%),lymphadenopathy (19%), splenomegaly(28%) and arthritis (18%). Mild anaemia,leucopoenia and relative lymphocytosiswere common. This information was col-lected from questionnaires, medicalrecords and clinical examinations. The per-centage of patients with brucellosis on thebasis of their occupation was 9% farmer,25.5% housewife, 10.1% worker, 6.8%employee, 30.5% student and 18.1% oth-ers.
DiscussionBrucellosis is diagnosed by culture method,serological tests and clinical findings. Inthe presence of appropriate signs andsymptoms, a presumptive diagnosis of
5
Tabl
e 3
Freq
uenc
y di
strib
utio
n of
pat
ient
s w
ith b
ruce
llosi
s by
Bru
cella
spp
. ant
ibod
y tit
re
TAT
Tota
lA
vera
getit
re19
9319
9419
9519
9619
9719
98an
nual
rate
No.
%N
o.%
No.
%N
o.%
No.
%N
o.%
No.
%N
o.%
1/16
024
21.6
714
.916
23.9
4620
.753
22.3
1626
.716
221
.727
21.8
1/32
034
30.6
1429
.819
28.4
5625
.266
27.7
2338
.321
228
.535
28.2
1/64
037
33.3
1838
.317
25.4
6730
.155
23.1
915
.020
327
.234
27.4
1/12
8015
13.5
714
.913
19.4
5022
.554
22.7
1118
.315
020
.125
20.2
1/25
601
0.9
12.
12
3.0
31.
410
4.2
11.
718
2.4
32.
4
Tota
l11
147
6722
223
860
745
124
TAT
= tu
be a
gglu
tinat
ion
test
.
20 Selected epidemiological features.pmd 3/3/2005, 12:15 AM1057
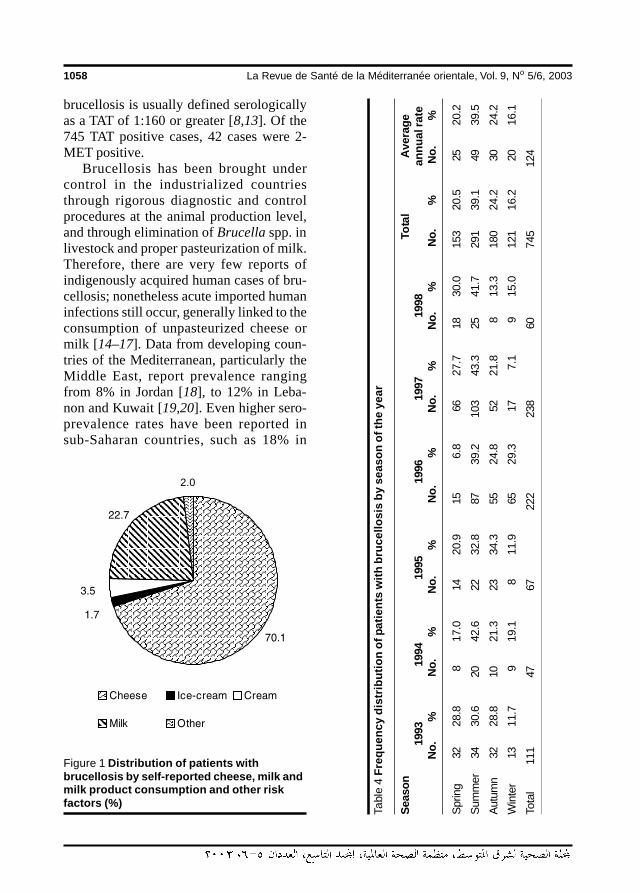
1058 La Revue de Santé de la Méditerranée orientale, Vol. 9, No 5/6, 2003
brucellosis is usually defined serologicallyas a TAT of 1:160 or greater [8,13]. Of the745 TAT positive cases, 42 cases were 2-MET positive.
Brucellosis has been brought undercontrol in the industrialized countriesthrough rigorous diagnostic and controlprocedures at the animal production level,and through elimination of Brucella spp. inlivestock and proper pasteurization of milk.Therefore, there are very few reports ofindigenously acquired human cases of bru-cellosis; nonetheless acute imported humaninfections still occur, generally linked to theconsumption of unpasteurized cheese ormilk [14–17]. Data from developing coun-tries of the Mediterranean, particularly theMiddle East, report prevalence rangingfrom 8% in Jordan [18], to 12% in Leba-non and Kuwait [19,20]. Even higher sero-prevalence rates have been reported insub-Saharan countries, such as 18% in
Figure 1 Distribution of patients withbrucellosis by self-reported cheese, milk andmilk product consumption and other riskfactors (%)
Tabl
e 4
Fre
quen
cy d
istr
ibut
ion
of p
atie
nts
with
bru
cello
sis
by s
easo
n of
the
year
Seas
onTo
tal
Ave
rage
1993
1994
1995
1996
1997
1998
annu
al ra
teN
o.%
No.
%N
o.%
No.
%N
o.%
No.
%N
o.%
No.
%
Spr
ing
3228
.88
17.0
1420
.915
6.8
6627
.718
30.0
153
20.5
2520
.2
Sum
mer
3430
.620
42.6
2232
.887
39.2
103
43.3
2541
.729
139
.149
39.5
Aut
umn
3228
.810
21.3
2334
.355
24.8
5221
.88
13.3
180
24.2
3024
.2
Win
ter
1311
.79
19.1
811
.965
29.3
177.
19
15.0
121
16.2
2016
.1
Tota
l11
147
6722
223
860
745
124
2.0
20 Selected epidemiological features.pmd 3/3/2005, 12:15 AM1058
Eastern Mediterranean Health Journal, Vol. 9, Nos 5/6, 2003 1059
Uganda [21] and 13% in Nigeria [22]. Ac-cording to the results of this study mostpatients had a history of infected cheeseand milk consumption. Prevalence of bru-cellosis in the Yazd population was muchlower than in the above-mentioned reports(31.9 cases per 100 000 population everyyear; 35.3/100 000 males and 28.3/100 000 females). The prevalence of bru-cellosis increases with age; this has beenobserved in the Islamic Republic of Iran,Jordan, Lebanon, and Kuwait [18,19,23–25]. Our findings show that the highestprevalence of the disease was in 1997, par-ticularly among ages 10–19 years (21.8%). Consumption of infected milk, milkproducts and contact with imported ani-mals with brucellosis were the most impor-tant sources of infection.
In an analysis of 104 cases of brucello-sis in Saudi Arabia and 1288 cases in UnitedStates, the most common symptoms andphysical findings reported were fever,chills, weakness, malaise, sweating, back-ache, headache, lymphadenopathy, sple-nomegaly and arthritis [26,27]. Theseresults are comparable to those for oursubjects.
The prevalence of brucellosis was leastin winter (16.2%) and peaked in summer
(39.5%) in our study. In Kuwait and someother countries, however, most cases oc-curred during the spring and early summer[24,28].
Control of brucellosis requires elimina-tion of infected animals and vaccination ofhealthy ones in order to reduce the risk forthose in regular contact with animals and tohave brucellosis-free animal products. Hu-man brucellosis acquired from milk is pre-ventable, and requires making pasteuri-zation of milk and dairy products obligato-ry. Nevertheless, public health education isimportant in preventing the transmission ofbrucellosis from animals to humans.
AcknowledgementsIt is with sincere appreciation that we ac-knowledge the assistance of Dr Moham-mad Reza Sharefi, Dr Mehran Karimi andMohammad Hassan Ahmadieh from ShahidSadoughi University of Medical Sciences,and Ali Asghar Sadrabadi, Mohammad Me-hdi Hakimian, Reza Bick, Ahmad Ali Hanafi-Bojd and Fatemah Fallah from the YazdTraining and Health Research Centre in thisstudy.
References
1. Matyas Z, Fujikura T. Brucellosis as aworld problem. Developments in biologi-cal standardization, 1984, 56:3–20.
2. Al-Eissa YA. Brucellosis in Saudi Arabia:past, present and future. Annals of Saudimedicine, 1999, 19(5):401–5.
3. Al-Eissa YA et al. Osteoarticular brucello-sis in children. Annals of the rheumaticdiseases, 1990, 49:896–900.
4. Al-Eissa YA. Probable breast-milk bornebrucellosis in a young infant. Annals oftropical paediatrics, 1990, 10:305–7.
5. Ruben B et al. Person-to-person trans-mission of Brucella melitensis. Lancet,1991, 337:14–5.
6. Corbel MJ. Brucellosis: An overview.Emerging infectious diseases, 1997,3:213–21.
7. Murray PR et al, eds. Manual of clinicalmicrobiology, 8th ed. Washington, DC,American Society for MicrobiologyPress, 2003:797–808.
8. Bettelheim KA et al. The use of themicroagglutination technique to deter-
20 Selected epidemiological features.pmd 3/3/2005, 12:15 AM1059
1060 La Revue de Santé de la Méditerranée orientale, Vol. 9, No 5/6, 2003
mine the antibody status of healthy NewZealanders to Brucella abortus. Journalof hygeine, 1984, 92:401–10.
9. Al-Aska et al. Epidemiological and im-munological studies in brucellosis. Re-port submitted to King Abdulaziz City forScience and Technology (KACST) for re-search grant AT-967, 1991.
10. Bettelheim KA, Maskill WJ, Pearce JL.Comparison of standard tube andmicroagglutination technique for deter-mining Brucella antibodies. Journal ofhygiene, 1983, 90:33–9.
11. Buchanan TM, Faber LC. 2-mercapto-ethanol Brucella agglutination test: use-fulness for predicting recovery from bru-cellosis. Journal of clincial microbiology,1980, 11:6–7.
12. Mahon CR, Manuselis G, eds. Textbookof diagnostic microbiology, 2nd ed.Philadelphia, WB Saunders, 2000:1070–2.
13. Rose NR et al. Manual of clinical labora-tory immunology, 5th ed. Washington,DC, American Society for MicrobiologyPress, 1997:608–17.
14. Madkour M, Gargani G. Epidemiologyaspects. In: Madkour M, ed. Brucellosis.London, Butterworths, 1985:11–28.
15. Taylor JP, Perdue JN. The changing epi-demiology of human brucellosis inTexas, 1977–1986. American journal ofepidemiology, 1989, 130:160–5.
16. Arnow PM, Smaron M, Ormiste V. Brucel-losis of a group of travelers to Spain. Thejournal of the American Medical Asso-ciation, 1984, 251:505–7.
17. Al-Sekait MA. Seroepidemiological sur-vey of brucellosis in Saudi Arabia. An-nals of Saudi medicine, 1999, 19:219–20.
18. Dajani YH, Masoud AA, Barakat HF. Epi-demiology and diagnosis of human bru-
cellosis in Jordan. Journal of tropicalmedicine and hygiene, 1989, 92:209–14.
19. Araj GF, Azzam RA. Seroprevalence ofantibodies among persons in high-riskoccupations in Lebanon. Epidemiologyand infection, 1996, 117:281–8.
20. Luhi AR et al. Human brucellosis in Ku-wait: a prospective study of 400 cases.Quarterly journal of medicine, 1998,66:39–44.
21. Ndyabahinduka DG, Chu IH. Brucellosisin Uganda. International journal of zoo-noses, 1984, 11:59–64.
22. Six W et al. Serological investigation inNigeria for an anthropozoonosis in hu-man sera. Journal of hygiene, epidemi-ology, microbiology, and immunology,1987, 31:493–5.
23. Makarem E, Karjoo R, Omidi A. Fre-quency of Brucella melitensis in south-ern Iran. Journal of tropical pediatrics,1982, 28:97–100.
24. Mousa A et al. The nature of human bru-cellosis in Kuwait: a study of 379 cases.Reviews of infectious diseases, 1998,10:211–7.
25. Sabbaghian H, Nadim A. Epidemiologyof human brucellosis in Isfahan, Iran.Journal of hygiene, 1974, 73:221–2.
26. Fox MD, Kaufman AF. Brucellosis in theUnited States, 1965–1974. Journal of in-fectious diseases, 1977, 153:122–5.
27. Malik GM. A clinical study of brucellosisin adults in the Asir region of southernSaudi Arabia. American journal of tropi-cal medicine and hygiene, 1997, 56:375–7.
28. Abdou AE. Brucellosis in the EasternMediterranean Region. Paper presentedat the Regional Conference on Emerg-ing Infectious Diseases, Cairo, Egypt,26–29 November 1995.
20 Selected epidemiological features.pmd 3/3/2005, 12:16 AM1060
Eastern Mediterranean Health Journal, Vol. 9, Nos 5/6, 2003 1061
Epidemiology of acute renal failure inhospitalized patients: experiencefrom southern Saudi ArabiaM. Al-Homrany1
1Department of Medicine, College of Medicine and Medical Sciences, King Khalid University, Abha, SaudiArabia.Received: 17/07/02; accepted: 16/03/03
ABSTRACT Despite advances in health care, morbidity and mortality associated with acute renal failure(ARF) remain high. This study determined the frequency and etiology of ARF in hospitalized patients in SaudiArabia over 2 years. Of the 150 cases of ARF, 38.0% were community-acquired and 62.0% hospital-acquired. The main cause was acute tubular necrosis (ATN) in 93 patients, due to sepsis (24.7%), ischaemia(12.7%), rhabdomyolysis (mainly from road traffic accidents) (10.7%), drugs (7.3%) and malaria and snake-bites (4.6%). Overall, 40% died, 48% made a full recovery and 1 patient (0.7%) became dialysis-dependant.Factors associated with poor prognosis were: age 60+ years, community-acquired ARF, peak blood ureanitrogen > 160 mg/dL, duration of ARF > 1 week, need for dialysis and associated chronic liver disease.
Epidémiologie de l’insuffisance rénale aiguë chez des patients hospitalisés : expérience en Arabiesaoudite méridionaleRESUME Malgré les progrès réalisés dans les soins de santé, la mortalité et la morbidité associées àl’insuffisance rénale aiguë demeurent élevées. Cette étude a permis de déterminer la fréquence et l’étiologiede l’insuffisance rénale aiguë chez des patients hospitalisés en Arabie saoudite sur une période de 2 ans.Parmi les 150 cas d’insuffisance rénale aiguë, 38,0 % étaient des cas communautaires et 62,0 % des casnosocomiaux. La principale cause était la nécrose tubulaire aiguë chez 93 patients, due à la septicémie(24,7 %), suivie par l’ischémie (12,7 %), la rhabdomyolyse (principalement due aux accidents de la route)(10,7 %), les médicaments (7,3 %) ainsi que le paludisme et les morsures de serpent (4,6 %). Globalement,40 % des sujets sont décédés, 48 % ont guéri complètement et seul un patient (0,7 %) est devenu dépen-dant de la dialyse. Les facteurs associés à un mauvais pronostic étaient l’âge avancé (plus de 60 ans),l’origine communautaire du cas d’insuffisance rénale aiguë, un pic élevé d’azote uréique dans le sang(> 160mg/dL), une insuffisance rénale aiguë de longue durée (> 1 semaine), la nécessité d’une dialyse et unemaladie hépatique chronique associée.
21 Epidemiology of acute renal.pmd 3/3/2005, 12:16 AM1061
1062 La Revue de Santé de la Méditerranée orientale, Vol. 9, No 5/6, 2003
IntroductionAcute renal failure (ARF) is a frequentcomplication in hospitalized patents. De-spite substantial advances in renal replace-ment therapy and health care delivery,morbidity and mortality rates associatedwith ARF have remained high [1–3]. Al-though reliable statistics on the prevalenceof ARF among different tropical countriesare not available, statistics based on refer-rals to dialysis units suggest that the condi-tion is more common in the tropics. Earlierreports from the Middle East have indicatedthat the incidence of ARF is several timeshigher in the region than elsewhere [4–6].
Snakebite, malaria, liver diseases androad traffic accidents are common healthproblems in Saudi Arabia [7–9], and thecontribution of these conditions to the de-velopment of ARF have not been studiedbefore. This report was undertaken tostudy the pattern of ARF in hospitalized pa-tients in southern Saudi Arabia.
MethodsA prospective study was made of all adultpatients (15 years and over) with ARF dur-ing a 2-year period (January 1999 to De-cember 2000) attending Asir CentralHospital, southern Saudi Arabia. Childrenwere not included.
The diagnosis of ARF was based on his-tory, physical examination, laboratory dataand clinical course. To select cases for thestudy, ARF was defined as a sudden deteri-oration in renal function presenting eitheras oliguria (urine volume ≤ 400 mL/day)for at least 48 hours or as a rise in serumcreatinine level of more than 50% and ≥ 2mg/dL. To ensure accurate diagnosis allcases were evaluated and followed up by anephrologist until their renal functions nor-malized, they were discharged from the
hospital or they died (average period 3weeks). Consent was obtained from pa-tients who required kidney biopsy.
Cases were divided into community-ac-quired ARF, defined as renal failure devel-oping outside the hospital, and hospital-acquired ARF, defined as renal failure thatdeveloped during hospitalization for non-renal-related problems in patients whoseserum creatinine level on admission wasnormal.
The data were studied and coded. Anal-ysis was carried out using SPSS, version10. The chi-squared test, Student t-test andFisher exact test were used as tests of sig-nificance at the 5% level of significance.Multivariate logistic regression analysiswas carried out to study potential factorsthat might affect survival of acute renalfailure. Age, peak blood urea nitrogen(BUN), acquiring ARF during hospitaliza-tion, duration of renal failure and havingconcomitant liver disease were includedin the logistic regression model. Serumplasma urea was tested using enzymaticmethods and serum creatinine using spec-trophotometry.
ResultsThere were 150 patients with ARF in thisstudy: 58.7% males and 41.3% females.The mean age of patients was 58.9 ± 22.5years and 57.3% were 60 years or over(Table 1). Total admissions to the hospitalduring the study period were 26 000 pa-tients, giving an incidence of ARF amonghospitalized patients of 0.6%.
The mean duration of ARF was 10.7 ±9.2 days (range 1–46 days). One-fifth ofpatients (21.3%) required dialysis while78.7% did not require dialysis intervention.The mean duration of dialysis treatmentwas 6.1 ± 6.9 days (range 1–40 days).
21 Epidemiology of acute renal.pmd 3/3/2005, 12:16 AM1062
Eastern Mediterranean Health Journal, Vol. 9, Nos 5/6, 2003 1063
A majority of patients (93, 62.0%) ac-quired ARF in hospital after admission forother reasons, while the other 57 patients(38.0%) were admitted primarily due toARF (Table 2). Associated medical diseaseswere cardiac problems in 16.0% of pa-tients, diabetes in 15.3% and hepatic prob-lems in 10.7% (Table 2).
The commonest cause of ARF wasacute tubular necrosis (ATN) in 93 (62.5%)of the patients (Table 2). Sepsis was theleading cause of ATN (37/93 cases), fol-lowed by ischaemia (19/93) and rhab-domyolysis of different etiologies (16/93);10 of the rhabdomyolysis cases were trau-matic following road traffic accidents. ARFwas drug-induced in 11 cases due toaminoglycoside antibacterials. Snakebiteand malaria comprised 7 cases.
The outcome of renal failure is seen inTable 3. Overall, 60 (40.0%) ARF patientsdied, 72 (48.0%) achieved full recoveryand only 1 patient (0.7%) became dialysis-dependant. Uncontrolled sepsis and multi-organ failure was the leading cause of death(39/60 cases); other major causes of deathwere hepatic failure (6/60) and myocardialinfarction (6/60). All patients with chronicliver diseases who developed ARF duringhospitalization died.
Table 4 shows a comparison of hospi-tal- and community-acquired ARF cases.Mortality was significantly more frequentin hospital-acquired ARF than community-acquired ARF. On the other hand, full re-covery was significantly more frequent incommunity-acquired ARF than hospital-acquired ARF.
Table 1 Distribution of acute renal failurecases by age and sex
Age group Male Female Total(years) No. % No. % No. %
< 20 5 5.7 1 1.6 6 4.0
20–44 26 29.5 13 21.0 39 26.0
45–59 12 13.6 7 11.3 19 12.7
60+ 45 51.1 41 66.1 86 57.3
Total 88 58.7 62 41.3 150 100.0
Table 2 Profile of acute renal failure (ARF)cases by associated medical diseases, placeof initiation and primary cause
Variable No. of %cases (n = 150)
Associated diseaseNone 87 58.0Cardiac 24 16.0Diabetes 23 15.3Hepatic 16 10.7
Place of initiationHospital 93 62.0
Medical ward (40) (26.7)Surgical ward (26) (17.3)Intensive care unit (23) (15.3)Burns unit (4) (2.7)
Community 57 38.0
Primary cause of ARFAcute tubular necrosis 93 62.5
Sepsis (37) (24.7)Ischaemia (19) (12.7)Rhabdomyolysis (16) (10.7)Drugs (aminoglycosides) (11) (7.3)Malaria (5) (3.3)Snakebite (2) (1.3)Other (3) (2.0)
Pre-renal failure 36 23.3Glomerulonephritis 10 6.7Obstructive uropathy 4 2.7Interstitial nephritis 5 3.4Vascular lesions 2 1.4Total 150 100.0
n = total number of cases.
21 Epidemiology of acute renal.pmd 3/3/2005, 12:16 AM1063
1064 La Revue de Santé de la Méditerranée orientale, Vol. 9, No 5/6, 2003
Factors that determined the survival ofour study population are shown in Table 5.Age less than 60 years, low peak BUN,hospital-acquired ARF, short duration ofARF, no concomitant liver disease and no
intervention with dialysis were good prog-nostic factors for better patient survival.
DiscussionIn recent years, improvements in socioeco-nomic conditions, rapid industrialization,expanding medical facilities and develop-ments in prevention have led to a near era-dication of ARF due to infection andobstetric accident. ARF in industrialized so-cieties is now largely a consequence ofroad traffic and industrial accidents, car-diovascular surgery, drugs, multi-organfailure and renal transplant rejection [10].The patterns of ARF encountered in thetropics have shown changes similar tothose in the industrialized countries, al-though at a slower pace [11]. Among themedical causes of ARF, etiological factorsleading to ARF in tropical countries are dif-ferent from those seen in the industrializedworld. Diarrhoeal diseases, intravascularhaemolysis due to glucose-6-phosphate de-
Table 3 Outcome of acute renal failure
Outcome No. of %cases (n = 150)
Full recovery 72 48.0
Partial recovery 17 11.3
Dialysis-dependent 1 0.7
Death 60 40.0Sepsis and multi-organfailure (39) (26.0)Myocardial infarction (6) (4.0)Hepatic failure (6) (4.0)Gastrointestinal bleeding (4) (2.7)Cerebral haemorrhage (3) (2.0)Arrhythmia (2) (1.3)
Total 150 100.0
n = total number of cases.
Table 4 Distribution of cases: comparison of hospital- andcommunity-acquired acute renal failure (ARF)
Factor Hospital- Community- P-valueacquired ARF acquired ARF
(n = 93) (n = 57)
Primary Acute tubular Glomerulo-cause necrosis nephritis
Mortality (%) 51.6 21.1 < 0.05
Need for dialysis (%) 19.4 24.6 NS
Full recovery (%) 37.6 64.9 < 0.05
Mean age ± s (years) 61.25 ± 22.18 55.1 ± 22.78 NS
Male (%) 55.9 63.2 NS
Female (%) 44.1 36.8 NS
s = standard deviation.n = total number of cases.NS = not significant.
21 Epidemiology of acute renal.pmd 3/3/2005, 12:16 AM1064
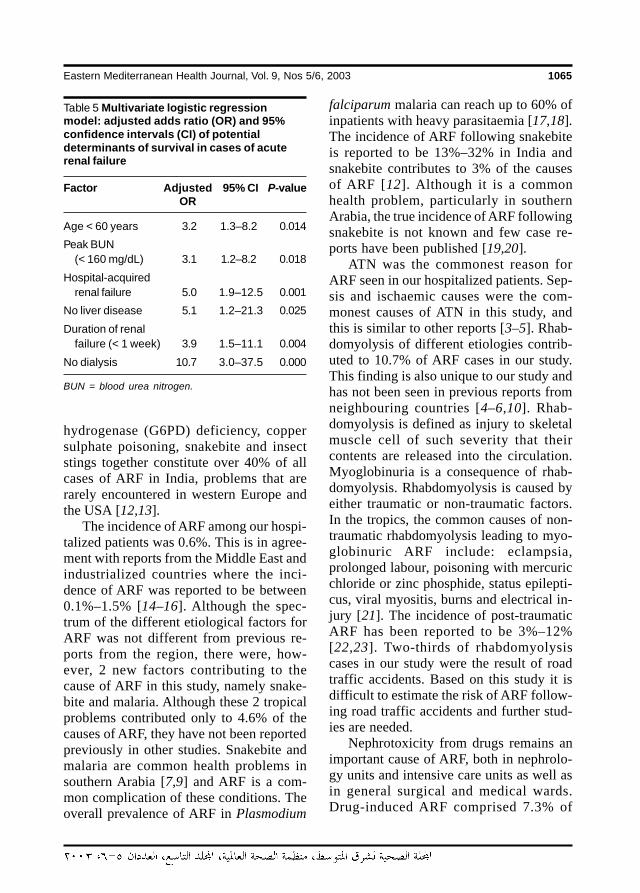
Eastern Mediterranean Health Journal, Vol. 9, Nos 5/6, 2003 1065
hydrogenase (G6PD) deficiency, coppersulphate poisoning, snakebite and insectstings together constitute over 40% of allcases of ARF in India, problems that arerarely encountered in western Europe andthe USA [12,13].
The incidence of ARF among our hospi-talized patients was 0.6%. This is in agree-ment with reports from the Middle East andindustrialized countries where the inci-dence of ARF was reported to be between0.1%–1.5% [14–16]. Although the spec-trum of the different etiological factors forARF was not different from previous re-ports from the region, there were, how-ever, 2 new factors contributing to thecause of ARF in this study, namely snake-bite and malaria. Although these 2 tropicalproblems contributed only to 4.6% of thecauses of ARF, they have not been reportedpreviously in other studies. Snakebite andmalaria are common health problems insouthern Arabia [7,9] and ARF is a com-mon complication of these conditions. Theoverall prevalence of ARF in Plasmodium
falciparum malaria can reach up to 60% ofinpatients with heavy parasitaemia [17,18].The incidence of ARF following snakebiteis reported to be 13%–32% in India andsnakebite contributes to 3% of the causesof ARF [12]. Although it is a commonhealth problem, particularly in southernArabia, the true incidence of ARF followingsnakebite is not known and few case re-ports have been published [19,20].
ATN was the commonest reason forARF seen in our hospitalized patients. Sep-sis and ischaemic causes were the com-monest causes of ATN in this study, andthis is similar to other reports [3–5]. Rhab-domyolysis of different etiologies contrib-uted to 10.7% of ARF cases in our study.This finding is also unique to our study andhas not been seen in previous reports fromneighbouring countries [4–6,10]. Rhab-domyolysis is defined as injury to skeletalmuscle cell of such severity that theircontents are released into the circulation.Myoglobinuria is a consequence of rhab-domyolysis. Rhabdomyolysis is caused byeither traumatic or non-traumatic factors.In the tropics, the common causes of non-traumatic rhabdomyolysis leading to myo-globinuric ARF include: eclampsia,prolonged labour, poisoning with mercuricchloride or zinc phosphide, status epilepti-cus, viral myositis, burns and electrical in-jury [21]. The incidence of post-traumaticARF has been reported to be 3%–12%[22,23]. Two-thirds of rhabdomyolysiscases in our study were the result of roadtraffic accidents. Based on this study it isdifficult to estimate the risk of ARF follow-ing road traffic accidents and further stud-ies are needed.
Nephrotoxicity from drugs remains animportant cause of ARF, both in nephrolo-gy units and intensive care units as well asin general surgical and medical wards.Drug-induced ARF comprised 7.3% of
Table 5 Multivariate logistic regressionmodel: adjusted adds ratio (OR) and 95%confidence intervals (CI) of potentialdeterminants of survival in cases of acuterenal failure
Factor Adjusted 95% CI P-valueOR
Age < 60 years 3.2 1.3–8.2 0.014
Peak BUN(< 160 mg/dL) 3.1 1.2–8.2 0.018
Hospital-acquiredrenal failure 5.0 1.9–12.5 0.001
No liver disease 5.1 1.2–21.3 0.025
Duration of renalfailure (< 1 week) 3.9 1.5–11.1 0.004
No dialysis 10.7 3.0–37.5 0.000
BUN = blood urea nitrogen.
21 Epidemiology of acute renal.pmd 3/3/2005, 12:16 AM1065
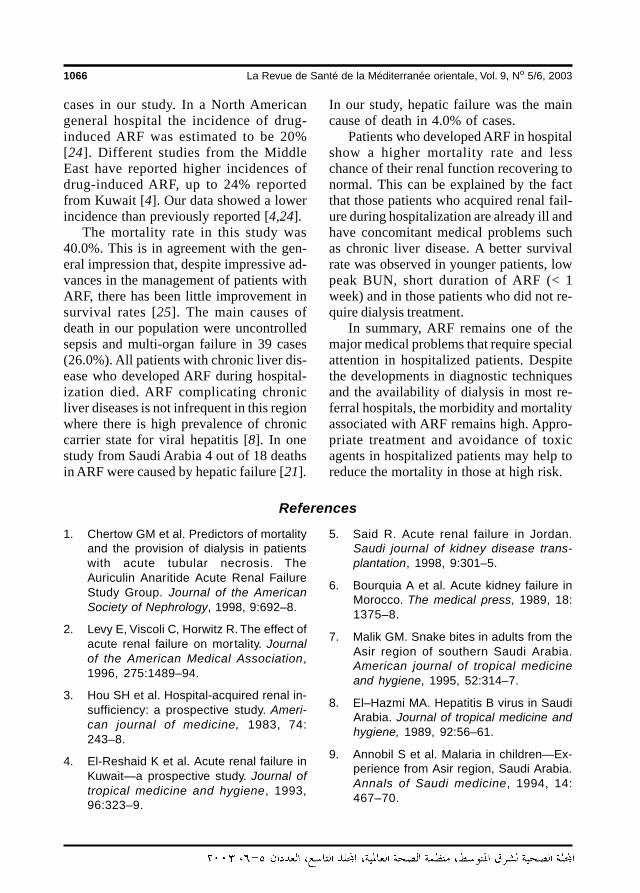
1066 La Revue de Santé de la Méditerranée orientale, Vol. 9, No 5/6, 2003
cases in our study. In a North Americangeneral hospital the incidence of drug-induced ARF was estimated to be 20%[24]. Different studies from the MiddleEast have reported higher incidences ofdrug-induced ARF, up to 24% reportedfrom Kuwait [4]. Our data showed a lowerincidence than previously reported [4,24].
The mortality rate in this study was40.0%. This is in agreement with the gen-eral impression that, despite impressive ad-vances in the management of patients withARF, there has been little improvement insurvival rates [25]. The main causes ofdeath in our population were uncontrolledsepsis and multi-organ failure in 39 cases(26.0%). All patients with chronic liver dis-ease who developed ARF during hospital-ization died. ARF complicating chronicliver diseases is not infrequent in this regionwhere there is high prevalence of chroniccarrier state for viral hepatitis [8]. In onestudy from Saudi Arabia 4 out of 18 deathsin ARF were caused by hepatic failure [21].
In our study, hepatic failure was the maincause of death in 4.0% of cases.
Patients who developed ARF in hospitalshow a higher mortality rate and lesschance of their renal function recovering tonormal. This can be explained by the factthat those patients who acquired renal fail-ure during hospitalization are already ill andhave concomitant medical problems suchas chronic liver disease. A better survivalrate was observed in younger patients, lowpeak BUN, short duration of ARF (< 1week) and in those patients who did not re-quire dialysis treatment.
In summary, ARF remains one of themajor medical problems that require specialattention in hospitalized patients. Despitethe developments in diagnostic techniquesand the availability of dialysis in most re-ferral hospitals, the morbidity and mortalityassociated with ARF remains high. Appro-priate treatment and avoidance of toxicagents in hospitalized patients may help toreduce the mortality in those at high risk.
References
1. Chertow GM et al. Predictors of mortalityand the provision of dialysis in patientswith acute tubular necrosis. TheAuriculin Anaritide Acute Renal FailureStudy Group. Journal of the AmericanSociety of Nephrology, 1998, 9:692–8.
2. Levy E, Viscoli C, Horwitz R. The effect ofacute renal failure on mortality. Journalof the American Medical Association,1996, 275:1489–94.
3. Hou SH et al. Hospital-acquired renal in-sufficiency: a prospective study. Ameri-can journal of medicine, 1983, 74:243–8.
4. El-Reshaid K et al. Acute renal failure inKuwait—a prospective study. Journal oftropical medicine and hygiene, 1993,96:323–9.
5. Said R. Acute renal failure in Jordan.Saudi journal of kidney disease trans-plantation, 1998, 9:301–5.
6. Bourquia A et al. Acute kidney failure inMorocco. The medical press, 1989, 18:1375–8.
7. Malik GM. Snake bites in adults from theAsir region of southern Saudi Arabia.American journal of tropical medicineand hygiene, 1995, 52:314–7.
8. El–Hazmi MA. Hepatitis B virus in SaudiArabia. Journal of tropical medicine andhygiene, 1989, 92:56–61.
9. Annobil S et al. Malaria in children—Ex-perience from Asir region, Saudi Arabia.Annals of Saudi medicine, 1994, 14:467–70.
21 Epidemiology of acute renal.pmd 3/3/2005, 12:16 AM1066
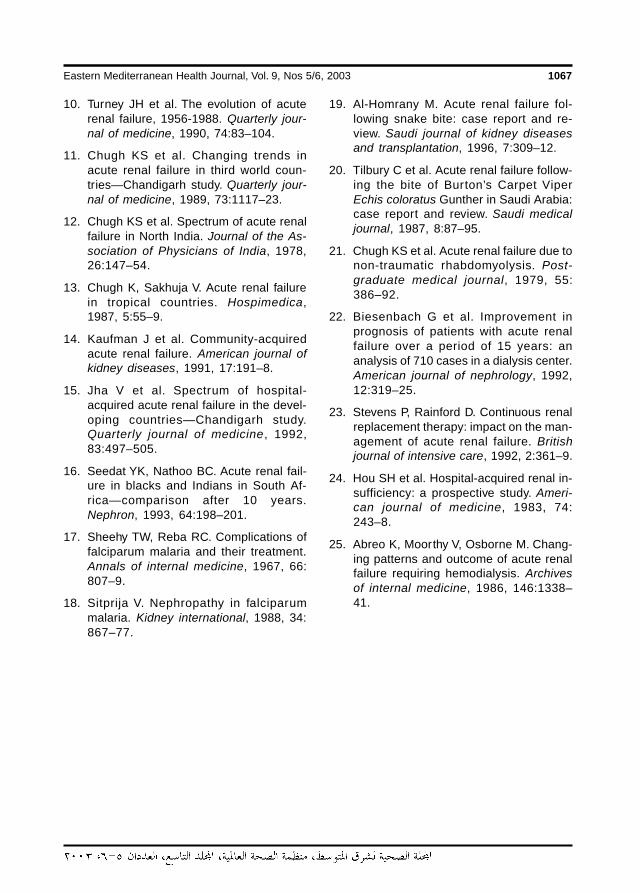
Eastern Mediterranean Health Journal, Vol. 9, Nos 5/6, 2003 1067
10. Turney JH et al. The evolution of acuterenal failure, 1956-1988. Quarterly jour-nal of medicine, 1990, 74:83–104.
11. Chugh KS et al. Changing trends inacute renal failure in third world coun-tries—Chandigarh study. Quarterly jour-nal of medicine, 1989, 73:1117–23.
12. Chugh KS et al. Spectrum of acute renalfailure in North India. Journal of the As-sociation of Physicians of India, 1978,26:147–54.
13. Chugh K, Sakhuja V. Acute renal failurein tropical countries. Hospimedica,1987, 5:55–9.
14. Kaufman J et al. Community-acquiredacute renal failure. American journal ofkidney diseases, 1991, 17:191–8.
15. Jha V et al. Spectrum of hospital-acquired acute renal failure in the devel-oping countries—Chandigarh study.Quarterly journal of medicine, 1992,83:497–505.
16. Seedat YK, Nathoo BC. Acute renal fail-ure in blacks and Indians in South Af-rica—comparison after 10 years.Nephron, 1993, 64:198–201.
17. Sheehy TW, Reba RC. Complications offalciparum malaria and their treatment.Annals of internal medicine, 1967, 66:807–9.
18. Sitprija V. Nephropathy in falciparummalaria. Kidney international, 1988, 34:867–77.
19. Al-Homrany M. Acute renal failure fol-lowing snake bite: case report and re-view. Saudi journal of kidney diseasesand transplantation, 1996, 7:309–12.
20. Tilbury C et al. Acute renal failure follow-ing the bite of Burton’s Carpet ViperEchis coloratus Gunther in Saudi Arabia:case report and review. Saudi medicaljournal, 1987, 8:87–95.
21. Chugh KS et al. Acute renal failure due tonon-traumatic rhabdomyolysis. Post-graduate medical journal, 1979, 55:386–92.
22. Biesenbach G et al. Improvement inprognosis of patients with acute renalfailure over a period of 15 years: ananalysis of 710 cases in a dialysis center.American journal of nephrology, 1992,12:319–25.
23. Stevens P, Rainford D. Continuous renalreplacement therapy: impact on the man-agement of acute renal failure. Britishjournal of intensive care, 1992, 2:361–9.
24. Hou SH et al. Hospital-acquired renal in-sufficiency: a prospective study. Ameri-can journal of medicine, 1983, 74:243–8.
25. Abreo K, Moorthy V, Osborne M. Chang-ing patterns and outcome of acute renalfailure requiring hemodialysis. Archivesof internal medicine, 1986, 146:1338–41.
21 Epidemiology of acute renal.pmd 3/3/2005, 12:16 AM1067
1068 La Revue de Santé de la Méditerranée orientale, Vol. 9, No 5/6, 2003
Microbiology of wound infection aftercaesarean section in a JordanianhospitalN.M. Kaplan,1 A.A. Smadi,2 M.I. Al-Taani3 and M.A. El-Qudah3
1Department of Pathology, 2Department of Radiology; 3Department of Gynaecology and Obstetrics,Queen Alia Military Hospital, Amman, Jordan.Received: 31/07/02; accepted: 26/02/03
ABSTRACT To determine the microbiology of wound infection following caesarean section and to evaluatethe use of Gram stain for the predicton of subsequent microbiological culture results, 1319 surgical woundswere followed up. We did Gram stains and cultures on exudates from open wounds and on aspirates if thewounds had demonstrable fluid collection. Incidence of post-caesarean wound infection was 8.1%. Ninety-three (86.9%) of 107 infected wounds were culture positive, with Staphylococcus aureus the most frequentlyfound organism (42%). Organisms seen by Gram stain yielded a sensitivity of 96.6%, specificity of 88.9%,positive predictive value of 97.7% and negative predictive value of 84.2% when used to predict positiveculture results for bacterial wound infection.
Microbiologie de l’infection de la plaie après césarienne dans un hôpital jordanienRESUME Afin de déterminer la microbiologie de l’infection de la plaie après une césarienne et d’évaluerl’utilisation de la coloration de Gram pour prévoir les résultats des cultures microbiologiques ultérieures,1319 plaies chirurgicales ont fait l’objet d’un suivi. Nous avons procédé à une coloration de Gram et à descultures sur des exsudats de plaies ouvertes et des échantillons prélevés par aspiration si la plaie avait uneaccumulation de fluides manifeste. L’incidence de l’infection de la plaie après césarienne s’élevait à 8,1 %.Quatre-vingt-treize (86,9 %) des 107 plaies infectées avaient des cultures positives, Staphylococcus aureusétant le micro-organisme le plus fréquemment trouvé (42 %). Les micro-organismes mis en évidence parcoloration de Gram ont donné une sensibilité de 96,6 %, une spécificité de 88,9 %, une valeur prédictivepositive de 97,7 % et une valeur prédictive négative de 84,2 % lorsqu’ils étaient utilisés pour prévoir lesrésultats de culture positifs pour les infections bactériennes des plaies.
22 Microbiology of wound infection.pmd 3/3/2005, 12:16 AM1068
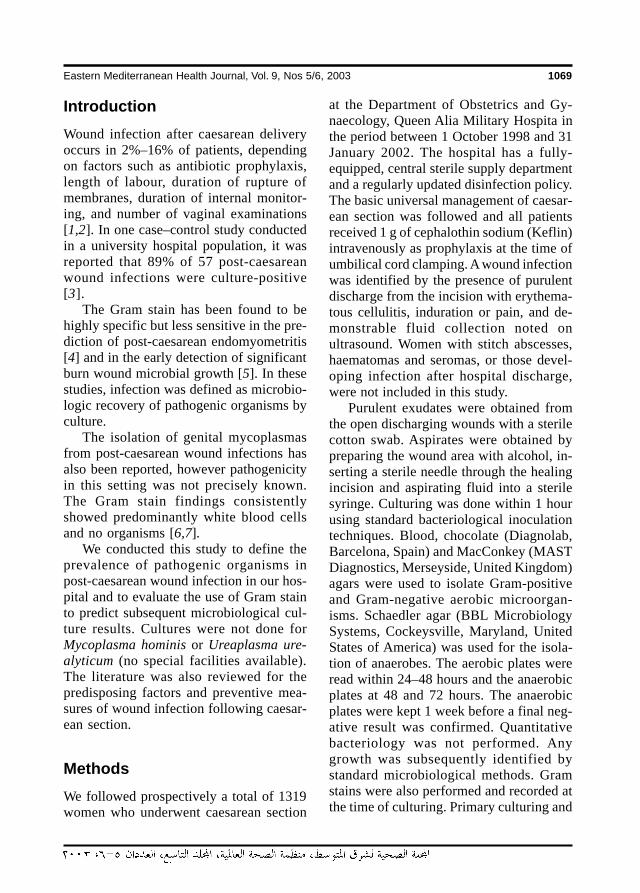
Eastern Mediterranean Health Journal, Vol. 9, Nos 5/6, 2003 1069
IntroductionWound infection after caesarean deliveryoccurs in 2%–16% of patients, dependingon factors such as antibiotic prophylaxis,length of labour, duration of rupture ofmembranes, duration of internal monitor-ing, and number of vaginal examinations[1,2]. In one case–control study conductedin a university hospital population, it wasreported that 89% of 57 post-caesareanwound infections were culture-positive[3].
The Gram stain has been found to behighly specific but less sensitive in the pre-diction of post-caesarean endomyometritis[4] and in the early detection of significantburn wound microbial growth [5]. In thesestudies, infection was defined as microbio-logic recovery of pathogenic organisms byculture.
The isolation of genital mycoplasmasfrom post-caesarean wound infections hasalso been reported, however pathogenicityin this setting was not precisely known.The Gram stain findings consistentlyshowed predominantly white blood cellsand no organisms [6,7].
We conducted this study to define theprevalence of pathogenic organisms inpost-caesarean wound infection in our hos-pital and to evaluate the use of Gram stainto predict subsequent microbiological cul-ture results. Cultures were not done forMycoplasma hominis or Ureaplasma ure-alyticum (no special facilities available).The literature was also reviewed for thepredisposing factors and preventive mea-sures of wound infection following caesar-ean section.
MethodsWe followed prospectively a total of 1319women who underwent caesarean section
at the Department of Obstetrics and Gy-naecology, Queen Alia Military Hospita inthe period between 1 October 1998 and 31January 2002. The hospital has a fully-equipped, central sterile supply departmentand a regularly updated disinfection policy.The basic universal management of caesar-ean section was followed and all patientsreceived 1 g of cephalothin sodium (Keflin)intravenously as prophylaxis at the time ofumbilical cord clamping. A wound infectionwas identified by the presence of purulentdischarge from the incision with erythema-tous cellulitis, induration or pain, and de-monstrable fluid collection noted onultrasound. Women with stitch abscesses,haematomas and seromas, or those devel-oping infection after hospital discharge,were not included in this study.
Purulent exudates were obtained fromthe open discharging wounds with a sterilecotton swab. Aspirates were obtained bypreparing the wound area with alcohol, in-serting a sterile needle through the healingincision and aspirating fluid into a sterilesyringe. Culturing was done within 1 hourusing standard bacteriological inoculationtechniques. Blood, chocolate (Diagnolab,Barcelona, Spain) and MacConkey (MASTDiagnostics, Merseyside, United Kingdom)agars were used to isolate Gram-positiveand Gram-negative aerobic microorgan-isms. Schaedler agar (BBL MicrobiologySystems, Cockeysville, Maryland, UnitedStates of America) was used for the isola-tion of anaerobes. The aerobic plates wereread within 24–48 hours and the anaerobicplates at 48 and 72 hours. The anaerobicplates were kept 1 week before a final neg-ative result was confirmed. Quantitativebacteriology was not performed. Anygrowth was subsequently identified bystandard microbiological methods. Gramstains were also performed and recorded atthe time of culturing. Primary culturing and
22 Microbiology of wound infection.pmd 3/3/2005, 12:16 AM1069
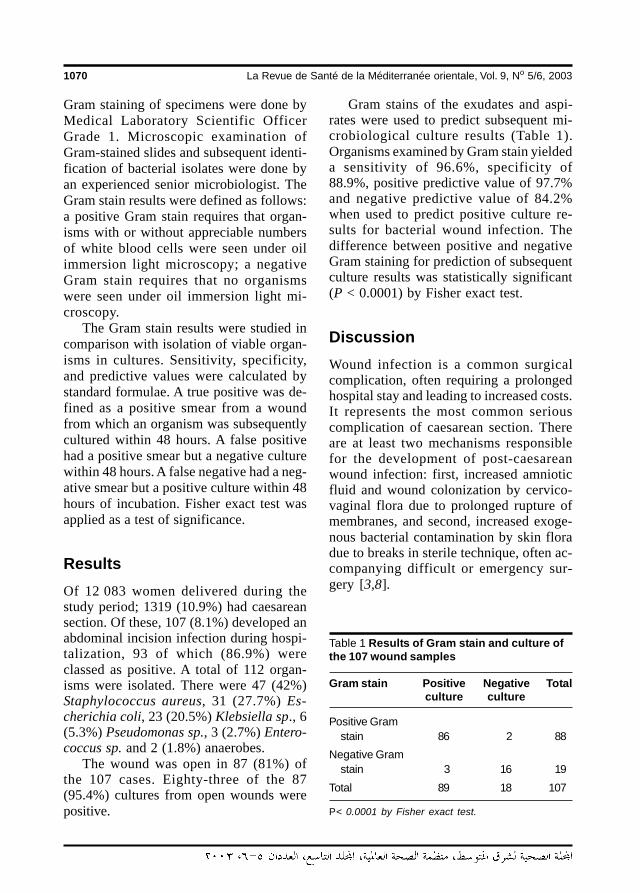
1070 La Revue de Santé de la Méditerranée orientale, Vol. 9, No 5/6, 2003
Gram staining of specimens were done byMedical Laboratory Scientific OfficerGrade 1. Microscopic examination ofGram-stained slides and subsequent identi-fication of bacterial isolates were done byan experienced senior microbiologist. TheGram stain results were defined as follows:a positive Gram stain requires that organ-isms with or without appreciable numbersof white blood cells were seen under oilimmersion light microscopy; a negativeGram stain requires that no organismswere seen under oil immersion light mi-croscopy.
The Gram stain results were studied incomparison with isolation of viable organ-isms in cultures. Sensitivity, specificity,and predictive values were calculated bystandard formulae. A true positive was de-fined as a positive smear from a woundfrom which an organism was subsequentlycultured within 48 hours. A false positivehad a positive smear but a negative culturewithin 48 hours. A false negative had a neg-ative smear but a positive culture within 48hours of incubation. Fisher exact test wasapplied as a test of significance.
ResultsOf 12 083 women delivered during thestudy period; 1319 (10.9%) had caesareansection. Of these, 107 (8.1%) developed anabdominal incision infection during hospi-talization, 93 of which (86.9%) wereclassed as positive. A total of 112 organ-isms were isolated. There were 47 (42%)Staphylococcus aureus, 31 (27.7%) Es-cherichia coli, 23 (20.5%) Klebsiella sp., 6(5.3%) Pseudomonas sp., 3 (2.7%) Entero-coccus sp. and 2 (1.8%) anaerobes.
The wound was open in 87 (81%) ofthe 107 cases. Eighty-three of the 87(95.4%) cultures from open wounds werepositive.
Gram stains of the exudates and aspi-rates were used to predict subsequent mi-crobiological culture results (Table 1).Organisms examined by Gram stain yieldeda sensitivity of 96.6%, specificity of88.9%, positive predictive value of 97.7%and negative predictive value of 84.2%when used to predict positive culture re-sults for bacterial wound infection. Thedifference between positive and negativeGram staining for prediction of subsequentculture results was statistically significant(P < 0.0001) by Fisher exact test.
DiscussionWound infection is a common surgicalcomplication, often requiring a prolongedhospital stay and leading to increased costs.It represents the most common seriouscomplication of caesarean section. Thereare at least two mechanisms responsiblefor the development of post-caesareanwound infection: first, increased amnioticfluid and wound colonization by cervico-vaginal flora due to prolonged rupture ofmembranes, and second, increased exoge-nous bacterial contamination by skin floradue to breaks in sterile technique, often ac-companying difficult or emergency sur-gery [3,8].
Table 1 Results of Gram stain and culture ofthe 107 wound samples
Gram stain Positive Negative Totalculture culture
Positive Gramstain 86 2 88
Negative Gramstain 3 16 19
Total 89 18 107
P< 0.0001 by Fisher exact test.
22 Microbiology of wound infection.pmd 3/3/2005, 12:16 AM1070
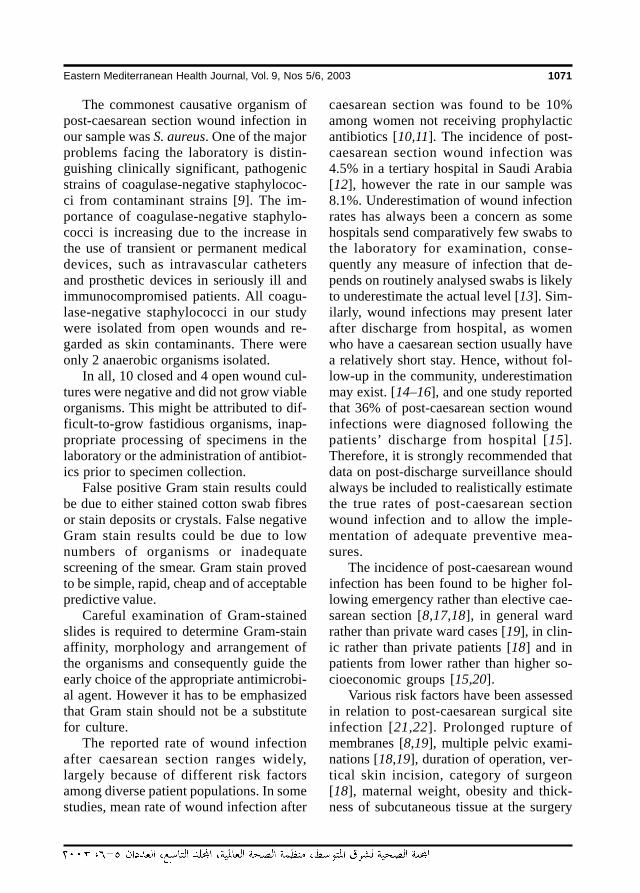
Eastern Mediterranean Health Journal, Vol. 9, Nos 5/6, 2003 1071
The commonest causative organism ofpost-caesarean section wound infection inour sample was S. aureus. One of the majorproblems facing the laboratory is distin-guishing clinically significant, pathogenicstrains of coagulase-negative staphylococ-ci from contaminant strains [9]. The im-portance of coagulase-negative staphylo-cocci is increasing due to the increase inthe use of transient or permanent medicaldevices, such as intravascular cathetersand prosthetic devices in seriously ill andimmunocompromised patients. All coagu-lase-negative staphylococci in our studywere isolated from open wounds and re-garded as skin contaminants. There wereonly 2 anaerobic organisms isolated.
In all, 10 closed and 4 open wound cul-tures were negative and did not grow viableorganisms. This might be attributed to dif-ficult-to-grow fastidious organisms, inap-propriate processing of specimens in thelaboratory or the administration of antibiot-ics prior to specimen collection.
False positive Gram stain results couldbe due to either stained cotton swab fibresor stain deposits or crystals. False negativeGram stain results could be due to lownumbers of organisms or inadequatescreening of the smear. Gram stain provedto be simple, rapid, cheap and of acceptablepredictive value.
Careful examination of Gram-stainedslides is required to determine Gram-stainaffinity, morphology and arrangement ofthe organisms and consequently guide theearly choice of the appropriate antimicrobi-al agent. However it has to be emphasizedthat Gram stain should not be a substitutefor culture.
The reported rate of wound infectionafter caesarean section ranges widely,largely because of different risk factorsamong diverse patient populations. In somestudies, mean rate of wound infection after
caesarean section was found to be 10%among women not receiving prophylacticantibiotics [10,11]. The incidence of post-caesarean section wound infection was4.5% in a tertiary hospital in Saudi Arabia[12], however the rate in our sample was8.1%. Underestimation of wound infectionrates has always been a concern as somehospitals send comparatively few swabs tothe laboratory for examination, conse-quently any measure of infection that de-pends on routinely analysed swabs is likelyto underestimate the actual level [13]. Sim-ilarly, wound infections may present laterafter discharge from hospital, as womenwho have a caesarean section usually havea relatively short stay. Hence, without fol-low-up in the community, underestimationmay exist. [14–16], and one study reportedthat 36% of post-caesarean section woundinfections were diagnosed following thepatients’ discharge from hospital [15].Therefore, it is strongly recommended thatdata on post-discharge surveillance shouldalways be included to realistically estimatethe true rates of post-caesarean sectionwound infection and to allow the imple-mentation of adequate preventive mea-sures.
The incidence of post-caesarean woundinfection has been found to be higher fol-lowing emergency rather than elective cae-sarean section [8,17,18], in general wardrather than private ward cases [19], in clin-ic rather than private patients [18] and inpatients from lower rather than higher so-cioeconomic groups [15,20].
Various risk factors have been assessedin relation to post-caesarean surgical siteinfection [21,22]. Prolonged rupture ofmembranes [8,19], multiple pelvic exami-nations [18,19], duration of operation, ver-tical skin incision, category of surgeon[18], maternal weight, obesity and thick-ness of subcutaneous tissue at the surgery
22 Microbiology of wound infection.pmd 3/3/2005, 12:16 AM1071
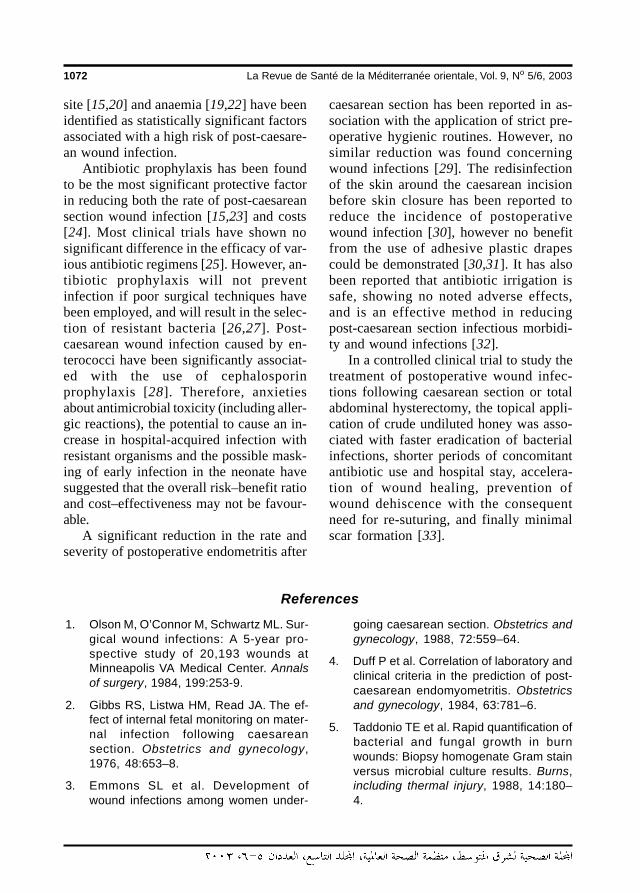
1072 La Revue de Santé de la Méditerranée orientale, Vol. 9, No 5/6, 2003
site [15,20] and anaemia [19,22] have beenidentified as statistically significant factorsassociated with a high risk of post-caesare-an wound infection.
Antibiotic prophylaxis has been foundto be the most significant protective factorin reducing both the rate of post-caesareansection wound infection [15,23] and costs[24]. Most clinical trials have shown nosignificant difference in the efficacy of var-ious antibiotic regimens [25]. However, an-tibiotic prophylaxis will not preventinfection if poor surgical techniques havebeen employed, and will result in the selec-tion of resistant bacteria [26,27]. Post-caesarean wound infection caused by en-terococci have been significantly associat-ed with the use of cephalosporinprophylaxis [28]. Therefore, anxietiesabout antimicrobial toxicity (including aller-gic reactions), the potential to cause an in-crease in hospital-acquired infection withresistant organisms and the possible mask-ing of early infection in the neonate havesuggested that the overall risk–benefit ratioand cost–effectiveness may not be favour-able.
A significant reduction in the rate andseverity of postoperative endometritis after
caesarean section has been reported in as-sociation with the application of strict pre-operative hygienic routines. However, nosimilar reduction was found concerningwound infections [29]. The redisinfectionof the skin around the caesarean incisionbefore skin closure has been reported toreduce the incidence of postoperativewound infection [30], however no benefitfrom the use of adhesive plastic drapescould be demonstrated [30,31]. It has alsobeen reported that antibiotic irrigation issafe, showing no noted adverse effects,and is an effective method in reducingpost-caesarean section infectious morbidi-ty and wound infections [32].
In a controlled clinical trial to study thetreatment of postoperative wound infec-tions following caesarean section or totalabdominal hysterectomy, the topical appli-cation of crude undiluted honey was asso-ciated with faster eradication of bacterialinfections, shorter periods of concomitantantibiotic use and hospital stay, accelera-tion of wound healing, prevention ofwound dehiscence with the consequentneed for re-suturing, and finally minimalscar formation [33].
References
1. Olson M, O’Connor M, Schwartz ML. Sur-gical wound infections: A 5-year pro-spective study of 20,193 wounds atMinneapolis VA Medical Center. Annalsof surgery, 1984, 199:253-9.
2. Gibbs RS, Listwa HM, Read JA. The ef-fect of internal fetal monitoring on mater-nal infection following caesareansection. Obstetrics and gynecology,1976, 48:653–8.
3. Emmons SL et al. Development ofwound infections among women under-
going caesarean section. Obstetrics andgynecology, 1988, 72:559–64.
4. Duff P et al. Correlation of laboratory andclinical criteria in the prediction of post-caesarean endomyometritis. Obstetricsand gynecology, 1984, 63:781–6.
5. Taddonio TE et al. Rapid quantification ofbacterial and fungal growth in burnwounds: Biopsy homogenate Gram stainversus microbial culture results. Burns,including thermal injury, 1988, 14:180–4.
22 Microbiology of wound infection.pmd 3/3/2005, 12:16 AM1072
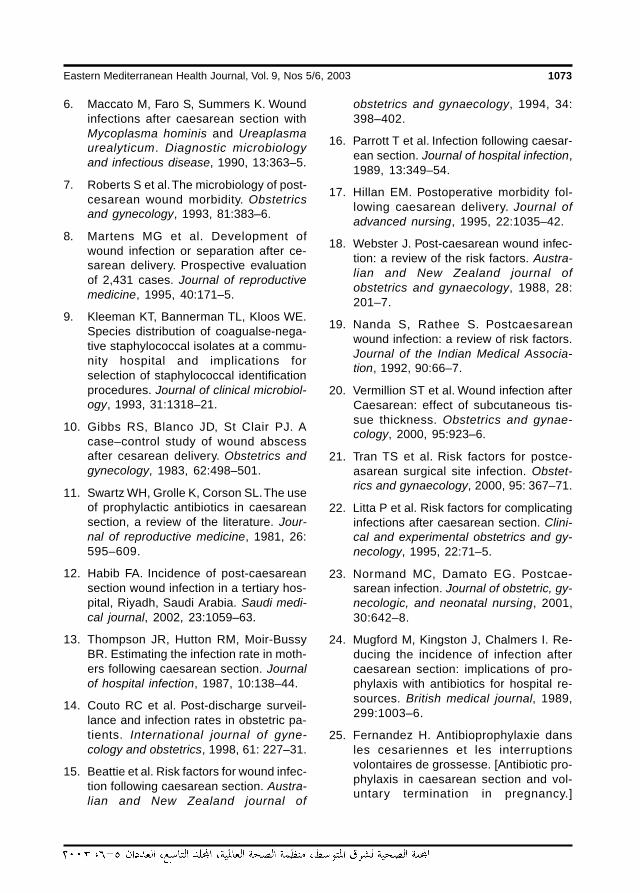
Eastern Mediterranean Health Journal, Vol. 9, Nos 5/6, 2003 1073
6. Maccato M, Faro S, Summers K. Woundinfections after caesarean section withMycoplasma hominis and Ureaplasmaurealyticum. Diagnostic microbiologyand infectious disease, 1990, 13:363–5.
7. Roberts S et al. The microbiology of post-cesarean wound morbidity. Obstetricsand gynecology, 1993, 81:383–6.
8. Martens MG et al. Development ofwound infection or separation after ce-sarean delivery. Prospective evaluationof 2,431 cases. Journal of reproductivemedicine, 1995, 40:171–5.
9. Kleeman KT, Bannerman TL, Kloos WE.Species distribution of coagualse-nega-tive staphylococcal isolates at a commu-nity hospital and implications forselection of staphylococcal identificationprocedures. Journal of clinical microbiol-ogy, 1993, 31:1318–21.
10. Gibbs RS, Blanco JD, St Clair PJ. Acase–control study of wound abscessafter cesarean delivery. Obstetrics andgynecology, 1983, 62:498–501.
11. Swartz WH, Grolle K, Corson SL. The useof prophylactic antibiotics in caesareansection, a review of the literature. Jour-nal of reproductive medicine, 1981, 26:595–609.
12. Habib FA. Incidence of post-caesareansection wound infection in a tertiary hos-pital, Riyadh, Saudi Arabia. Saudi medi-cal journal, 2002, 23:1059–63.
13. Thompson JR, Hutton RM, Moir-BussyBR. Estimating the infection rate in moth-ers following caesarean section. Journalof hospital infection, 1987, 10:138–44.
14. Couto RC et al. Post-discharge surveil-lance and infection rates in obstetric pa-tients. International journal of gyne-cology and obstetrics, 1998, 61: 227–31.
15. Beattie et al. Risk factors for wound infec-tion following caesarean section. Austra-lian and New Zealand journal of
obstetrics and gynaecology, 1994, 34:398–402.
16. Parrott T et al. Infection following caesar-ean section. Journal of hospital infection,1989, 13:349–54.
17. Hillan EM. Postoperative morbidity fol-lowing caesarean delivery. Journal ofadvanced nursing, 1995, 22:1035–42.
18. Webster J. Post-caesarean wound infec-tion: a review of the risk factors. Austra-lian and New Zealand journal ofobstetrics and gynaecology, 1988, 28:201–7.
19. Nanda S, Rathee S. Postcaesareanwound infection: a review of risk factors.Journal of the Indian Medical Associa-tion, 1992, 90:66–7.
20. Vermillion ST et al. Wound infection afterCaesarean: effect of subcutaneous tis-sue thickness. Obstetrics and gynae-cology, 2000, 95:923–6.
21. Tran TS et al. Risk factors for postce-asarean surgical site infection. Obstet-rics and gynaecology, 2000, 95: 367–71.
22. Litta P et al. Risk factors for complicatinginfections after caesarean section. Clini-cal and experimental obstetrics and gy-necology, 1995, 22:71–5.
23. Normand MC, Damato EG. Postcae-sarean infection. Journal of obstetric, gy-necologic, and neonatal nursing, 2001,30:642–8.
24. Mugford M, Kingston J, Chalmers I. Re-ducing the incidence of infection aftercaesarean section: implications of pro-phylaxis with antibiotics for hospital re-sources. British medical journal, 1989,299:1003–6.
25. Fernandez H. Antibioprophylaxie dansles cesariennes et les interruptionsvolontaires de grossesse. [Antibiotic pro-phylaxis in caesarean section and vol-untary termination in pregnancy.]
22 Microbiology of wound infection.pmd 3/3/2005, 12:16 AM1073
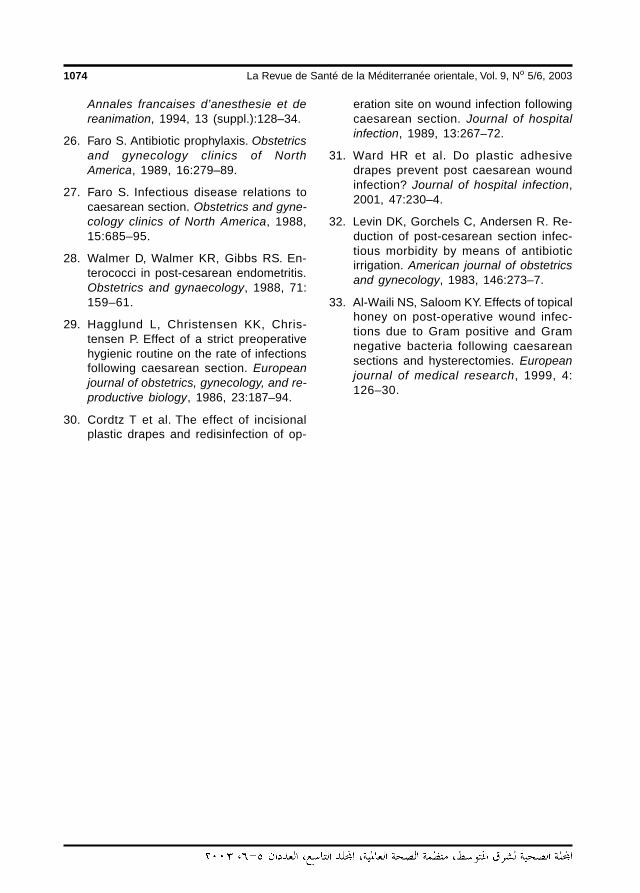
1074 La Revue de Santé de la Méditerranée orientale, Vol. 9, No 5/6, 2003
Annales francaises d’anesthesie et dereanimation, 1994, 13 (suppl.):128–34.
26. Faro S. Antibiotic prophylaxis. Obstetricsand gynecology clinics of NorthAmerica, 1989, 16:279–89.
27. Faro S. Infectious disease relations tocaesarean section. Obstetrics and gyne-cology clinics of North America, 1988,15:685–95.
28. Walmer D, Walmer KR, Gibbs RS. En-terococci in post-cesarean endometritis.Obstetrics and gynaecology, 1988, 71:159–61.
29. Hagglund L, Christensen KK, Chris-tensen P. Effect of a strict preoperativehygienic routine on the rate of infectionsfollowing caesarean section. Europeanjournal of obstetrics, gynecology, and re-productive biology, 1986, 23:187–94.
30. Cordtz T et al. The effect of incisionalplastic drapes and redisinfection of op-
eration site on wound infection followingcaesarean section. Journal of hospitalinfection, 1989, 13:267–72.
31. Ward HR et al. Do plastic adhesivedrapes prevent post caesarean woundinfection? Journal of hospital infection,2001, 47:230–4.
32. Levin DK, Gorchels C, Andersen R. Re-duction of post-cesarean section infec-tious morbidity by means of antibioticirrigation. American journal of obstetricsand gynecology, 1983, 146:273–7.
33. Al-Waili NS, Saloom KY. Effects of topicalhoney on post-operative wound infec-tions due to Gram positive and Gramnegative bacteria following caesareansections and hysterectomies. Europeanjournal of medical research, 1999, 4:126–30.
22 Microbiology of wound infection.pmd 3/3/2005, 12:16 AM1074
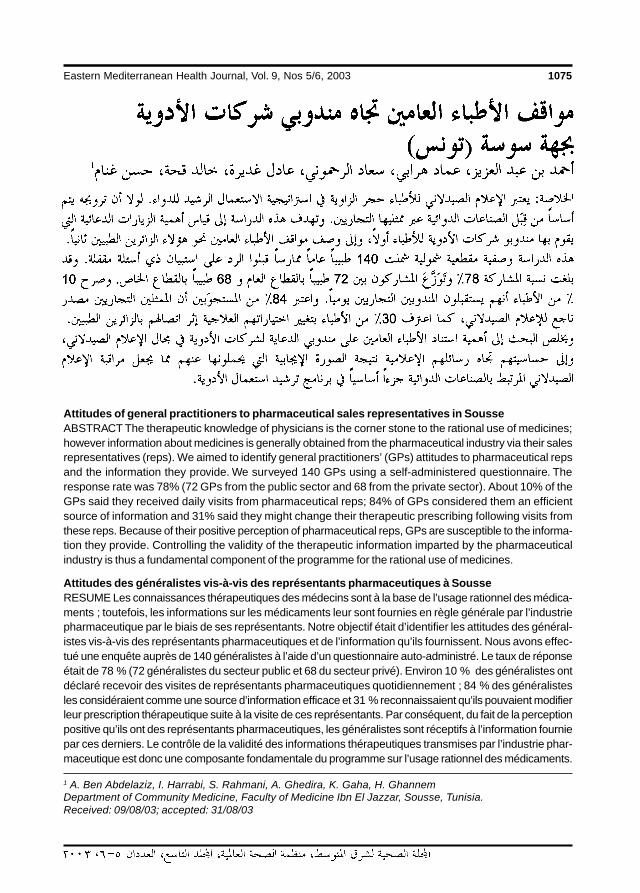
Eastern Mediterranean Health Journal, Vol. 9, Nos 5/6, 2003 1075
Attitudes of general practitioners to pharmaceutical sales representatives in SousseABSTRACT The therapeutic knowledge of physicians is the corner stone to the rational use of medicines;however information about medicines is generally obtained from the pharmaceutical industry via their salesrepresentatives (reps). We aimed to identify general practitioners’ (GPs) attitudes to pharmaceutical repsand the information they provide. We surveyed 140 GPs using a self-administered questionnaire. Theresponse rate was 78% (72 GPs from the public sector and 68 from the private sector). About 10% of theGPs said they received daily visits from pharmaceutical reps; 84% of GPs considered them an efficientsource of information and 31% said they might change their therapeutic prescribing following visits fromthese reps. Because of their positive perception of pharmaceutical reps, GPs are susceptible to the informa-tion they provide. Controlling the validity of the therapeutic information imparted by the pharmaceuticalindustry is thus a fundamental component of the programme for the rational use of medicines.
Attitudes des généralistes vis-à-vis des représentants pharmaceutiques à SousseRESUME Les connaissances thérapeutiques des médecins sont à la base de l’usage rationnel des médica-ments ; toutefois, les informations sur les médicaments leur sont fournies en règle générale par l’industriepharmaceutique par le biais de ses représentants. Notre objectif était d’identifier les attitudes des général-istes vis-à-vis des représentants pharmaceutiques et de l’information qu’ils fournissent. Nous avons effec-tué une enquête auprès de 140 généralistes à l’aide d’un questionnaire auto-administré. Le taux de réponseétait de 78 % (72 généralistes du secteur public et 68 du secteur privé). Environ 10 % des généralistes ontdéclaré recevoir des visites de représentants pharmaceutiques quotidiennement ; 84 % des généralistesles considéraient comme une source d’information efficace et 31 % reconnaissaient qu’ils pouvaient modifierleur prescription thérapeutique suite à la visite de ces représentants. Par conséquent, du fait de la perceptionpositive qu’ils ont des représentants pharmaceutiques, les généralistes sont réceptifs à l’information fourniepar ces derniers. Le contrôle de la validité des informations thérapeutiques transmises par l’industrie phar-maceutique est donc une composante fondamentale du programme sur l’usage rationnel des médicaments.
1 A. Ben Abdelaziz, I. Harrabi, S. Rahmani, A. Ghedira, K. Gaha, H. GhannemDepartment of Community Medicine, Faculty of Medicine Ibn El Jazzar, Sousse, Tunisia.Received: 09/08/03; accepted: 31/08/03
23 Attitudesbof general practitioners (Arabic).pmd 3/3/2005, 12:16 AM1075
1076 La Revue de Santé de la Méditerranée orientale, Vol. 9, No 5/6, 2003
23 Attitudesbof general practitioners (Arabic).pmd 3/3/2005, 12:16 AM1076
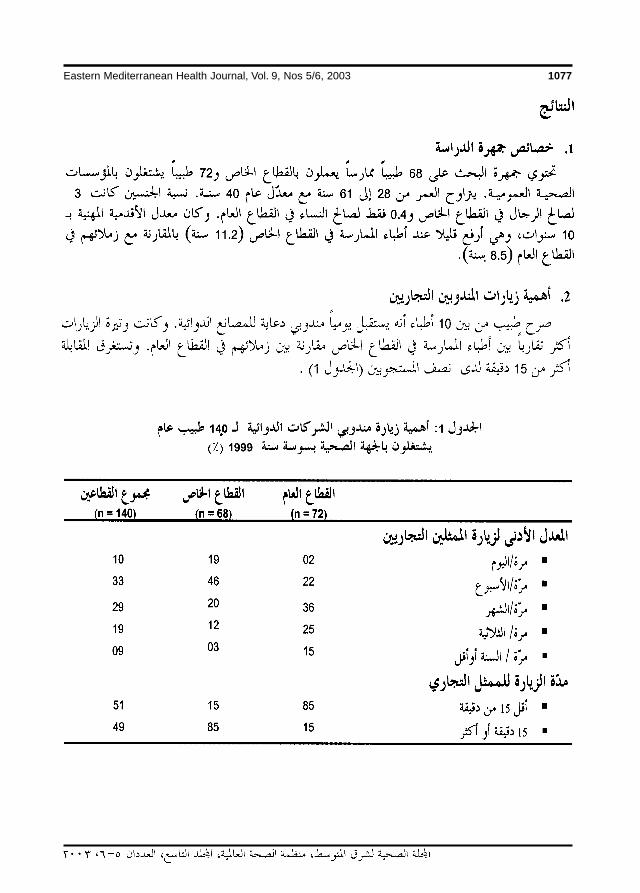
Eastern Mediterranean Health Journal, Vol. 9, Nos 5/6, 2003 1077
23 Attitudesbof general practitioners (Arabic).pmd 3/3/2005, 12:16 AM1077
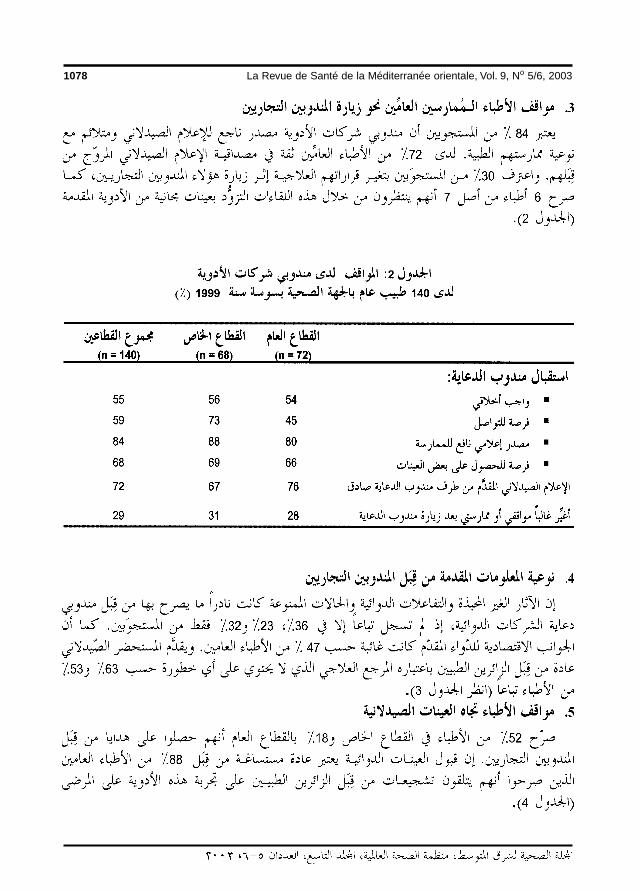
1078 La Revue de Santé de la Méditerranée orientale, Vol. 9, No 5/6, 2003
23 Attitudesbof general practitioners (Arabic).pmd 3/3/2005, 12:16 AM1078
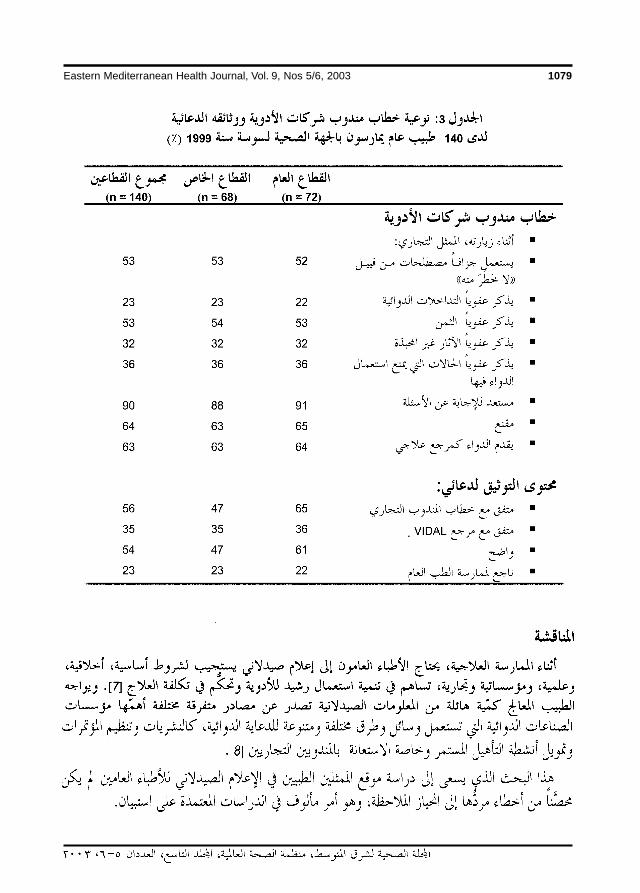
Eastern Mediterranean Health Journal, Vol. 9, Nos 5/6, 2003 1079
23 Attitudesbof general practitioners (Arabic).pmd 3/3/2005, 12:17 AM1079
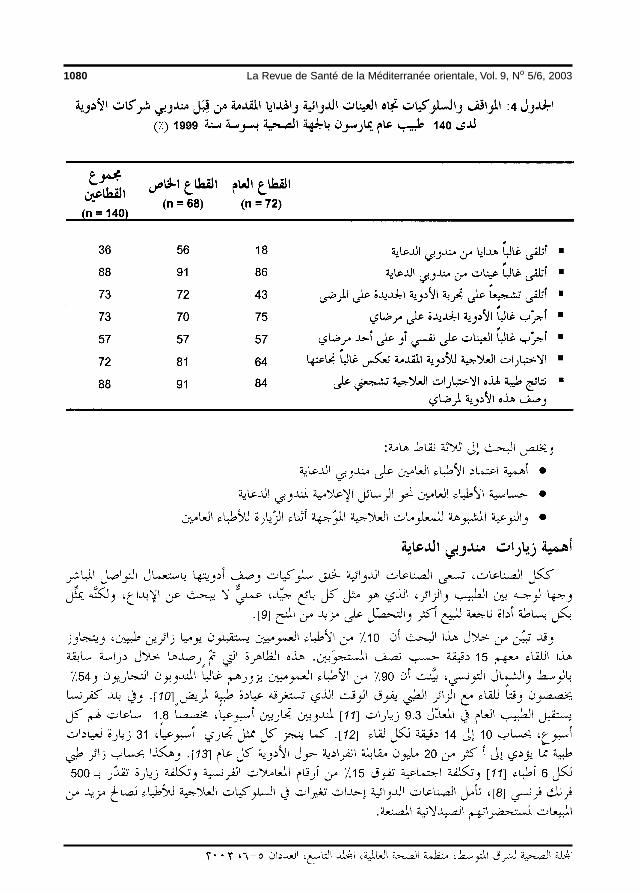
1080 La Revue de Santé de la Méditerranée orientale, Vol. 9, No 5/6, 2003
23 Attitudesbof general practitioners (Arabic).pmd 3/3/2005, 12:17 AM1080
Eastern Mediterranean Health Journal, Vol. 9, Nos 5/6, 2003 1081
23 Attitudesbof general practitioners (Arabic).pmd 3/3/2005, 12:17 AM1081
1082 La Revue de Santé de la Méditerranée orientale, Vol. 9, No 5/6, 2003
References
6. Quick JD, Hume ML, O’Connor RW, eds.Bien gérer les médicaments : la sélec-tion, l’ acquisition, la distribution et l’ utili-sation des produits pharmaceutiquesdans les soins de santé primaries. Bos-ton, Management Sciences for Health,1984.
7. Boisel JP, Ferry S. L’information sur lemédicament en France : approche sub-jective. La Revue du pracitien, 1983,33(1–2):37–44.
8. Chabrun RC. L’industrie pharmaceu-tique entre mondialisation et assurancemaladie. Concours médical, 1997, 119–35.
9. Harboun C. Le marketing pharmaceu-tique. Paris, Eska, 1995.
10. Salaheddine R. L’information pharmacothérapeutique [thèse]. Sousse, Facultéde médecine Ibn El Jazzar, 1991.
1. The world health report: 1998. Life in the21st century: a vision for all. Report of theDirector-General. Geneva, World HealthOrganization, 1998.
2. The rational use of drugs: report of theConference of Experts, Nairobi, 25–29November 1985. Geneva, World HealthOrganization, 1987.
3. Zarrad O. Evaluation de la prescriptiondes antibiotiques dans les centres desanté de base de la région de Sousse[thèse]. Sousse, Faculté de MédecineIbn El Jazzar, 1999.
4. Boissel JP. L’information thérapeuti-que:comment transmettre les donnéesactuelles de la science. GroupeVALIDATA. Therapie, 1994, 49:299–311.
5. Gueyffier F, Boissel JP, Cucherat M. Mes-sage intégrable : problème central decommunication pour l’information théra-peutique. Therapie, 1996, 51:240–5.
23 Attitudesbof general practitioners (Arabic).pmd 3/3/2005, 12:17 AM1082
Eastern Mediterranean Health Journal, Vol. 9, Nos 5/6, 2003 1083
11. Bader JP. Réflexions sur le bon usage dumédicament III. Concours médical,1995, 117–24.
12. Kobryner A. Le médecin généraliste et laprescription médicamenteuse [thèse].Nancy, Faculté de Médecine, 1993.
13. Deghaye D. Visite médicale et aspectséconomiques du médicament. Paris,John Libbey Eurotext, 1993.
14. Schwartz RK, Soumerai SB, Avorn J.Physician motivations for nonscientificdrug prescribing. Social science & medi-cine, 1989, 28(6):577–82.
15. Reveilleau S, Boissel JP, Alamercery Y.Do prescribers know the results of keyclinical trials? GEP (Groupe d’etude dela Prescription). Fundamental & clinicalpharmacology, 1991, 5(4):265–73.
16. Figon G, Boissel JP, Peyrieux JC. Doc-tors’ perception of pertinent information.Results of a survey of a random sampleof French general practitioners. GEP(Groupe d’Etude de la Prescription). Eu-ropean journal of clinical pharmacology,1992, 4(2):113–6.
17. Courant F. Les trois quarts desgénéralistes jugent essentiel le rôle desvisiteurs médicaux. Quotidien du méde-cin, 1987, 3819–25.
18. Schilliger P. Nécessité de l’indépen-dance : quelle indépendance ? Thera-pie, 1996, 51:290–1.
19. Lexchin J. What information do physi-cians receive from pharmaceutical rep-resentatives?. Canadian family physi-cian, Médecin de famille canadien,1997, 43:941–5.
20. Visite médicale: le bilan accablant duréseau d’observation de la revue pres-
crire. Revue prescrire, 1999, 19(193):226–31.
21. Gourdouze C. La visite médicale enmédecine générale de la théorie à lapratique [thèse]. Paris Ouest, Faculté demédecine, 1995.
22. Lucien C. L’apport des visiteurs médi-caux dans l’information médicale:un and’expérience à l’hôpital Antoine Charial[thèse]. Lyon, Faculté de Pharmacie,1996.
23. Ben Abdelaziz A et al. Les moyensd’informations pharmaceutique desmédecins généralistes dans la régionsanitaire de Sousse (Tunisie). Therapie,2002, 57(3):229–35.
24. Ben Abdelaziz A et al. Les besoins enformation médicale continue desmédecins généralistes de la régionsanitaire de Sousse (Tunisie). Cahierssanté, 2002, 12:393–7.
25. Zeigler MG. The accuracy of drug infor-mation from pharmaceutical sales repre-sentative. Journal of the AmericanMedical Association, 1995, 273(16):1296–8.
26. Caudill TS et al. Physicians, pharmaceu-tical sales representatives, and the costof prescribing. Archives of family medi-cine, 1996, 5(4):201–6.
27. Ben Abdelaziz A et al. Typologie de laprescription médicamenteuse dans lesstructures publiques de première ligneau centre tunisien. Annales pharma-ceutiques françaises, 2004, 62(1):57–104.
23 Attitudesbof general practitioners (Arabic).pmd 3/3/2005, 12:17 AM1083
1084 La Revue de Santé de la Méditerranée orientale, Vol. 9, No 5/6, 2003
Innovative learning approaches in anestablished medical school: theexperience at JUST in JordanI. Beni Hani,1 K. Al Saudi2 and A. Alkafajei3
1Faculty of Medicine, Jordan University of Science and Technology, Irbid, Jordan.2Department of Pharmacology; 3Department of Public Health, Faculty of Medicine, Jordan University ofScience and Technology, Irbid, Jordan.Received: 01/05/02; accepted: 26/02/03
ABSTRACT The Faculty of Medicine at Jordan University of Science and Technology was established in1986. Innovative changes were introduced to the traditional subject-based, hospital-oriented curriculum in1999, the objectives of which were to integrate student learning, emphasize student-centred learning,develop training in a community setting, and introduce elective learning packages. To evaluate the integratedlearning in the new curriculum, we assessed the validity and reliability of students’ scores. The scores for theintegrated ‘modules’ were compared with those in general subjects studied in the traditional way. Our studyshowed that results of tests taken on the new ‘modules’ are both valid and reliable measures of students’performance.
Approches didactiques novatrices dans une école de médicine bien établie : l’expérience del’Université jordanienne des sciences et de la technologieRESUME La Faculté de médecine de l’Université jordanienne des sciences et de la technologie a été crééeen 1986. Des changements novateurs ont été introduits en 1999 dans le programme traditionnel d’études parmatières à orientation hospitalière ; ces changements avaient pour objectifs d’intégrer l’apprentissage desétudiants, de faire une large place à l’apprentissage centré sur l’étudiant, de développer la formation au seinde la communauté, et d’introduire des modules d’apprentissage optionnels. Pour évaluer l’apprentissageintégré dans le nouveau programme, nous avons déterminé la validité et la fiabilité des scores des étudiants.Les scores pour les modules intégrés ont été comparés avec ceux obtenus dans les disciplines généralesétudiées de manière traditionnelle. Notre étude montre que les résultats des tests passés sur les nouveaux« modules » sont des mesures valables et fiables de la performance des étudiants.
24 Innovative learning approaches.pmd 3/3/2005, 12:17 AM1084
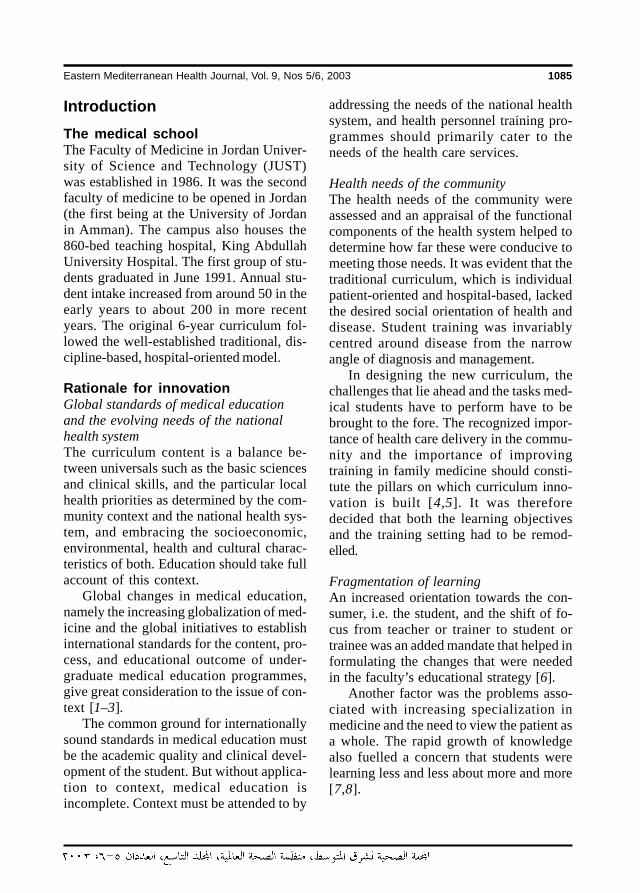
Eastern Mediterranean Health Journal, Vol. 9, Nos 5/6, 2003 1085
IntroductionThe medical schoolThe Faculty of Medicine in Jordan Univer-sity of Science and Technology (JUST)was established in 1986. It was the secondfaculty of medicine to be opened in Jordan(the first being at the University of Jordanin Amman). The campus also houses the860-bed teaching hospital, King AbdullahUniversity Hospital. The first group of stu-dents graduated in June 1991. Annual stu-dent intake increased from around 50 in theearly years to about 200 in more recentyears. The original 6-year curriculum fol-lowed the well-established traditional, dis-cipline-based, hospital-oriented model.
Rationale for innovationGlobal standards of medical educationand the evolving needs of the nationalhealth systemThe curriculum content is a balance be-tween universals such as the basic sciencesand clinical skills, and the particular localhealth priorities as determined by the com-munity context and the national health sys-tem, and embracing the socioeconomic,environmental, health and cultural charac-teristics of both. Education should take fullaccount of this context.
Global changes in medical education,namely the increasing globalization of med-icine and the global initiatives to establishinternational standards for the content, pro-cess, and educational outcome of under-graduate medical education programmes,give great consideration to the issue of con-text [1–3].
The common ground for internationallysound standards in medical education mustbe the academic quality and clinical devel-opment of the student. But without applica-tion to context, medical education isincomplete. Context must be attended to by
addressing the needs of the national healthsystem, and health personnel training pro-grammes should primarily cater to theneeds of the health care services.
Health needs of the communityThe health needs of the community wereassessed and an appraisal of the functionalcomponents of the health system helped todetermine how far these were conducive tomeeting those needs. It was evident that thetraditional curriculum, which is individualpatient-oriented and hospital-based, lackedthe desired social orientation of health anddisease. Student training was invariablycentred around disease from the narrowangle of diagnosis and management.
In designing the new curriculum, thechallenges that lie ahead and the tasks med-ical students have to perform have to bebrought to the fore. The recognized impor-tance of health care delivery in the commu-nity and the importance of improvingtraining in family medicine should consti-tute the pillars on which curriculum inno-vation is built [4,5]. It was thereforedecided that both the learning objectivesand the training setting had to be remod-elled.
Fragmentation of learningAn increased orientation towards the con-sumer, i.e. the student, and the shift of fo-cus from teacher or trainer to student ortrainee was an added mandate that helped informulating the changes that were neededin the faculty’s educational strategy [6].
Another factor was the problems asso-ciated with increasing specialization inmedicine and the need to view the patient asa whole. The rapid growth of knowledgealso fuelled a concern that students werelearning less and less about more and more[7,8].
24 Innovative learning approaches.pmd 3/3/2005, 12:17 AM1085
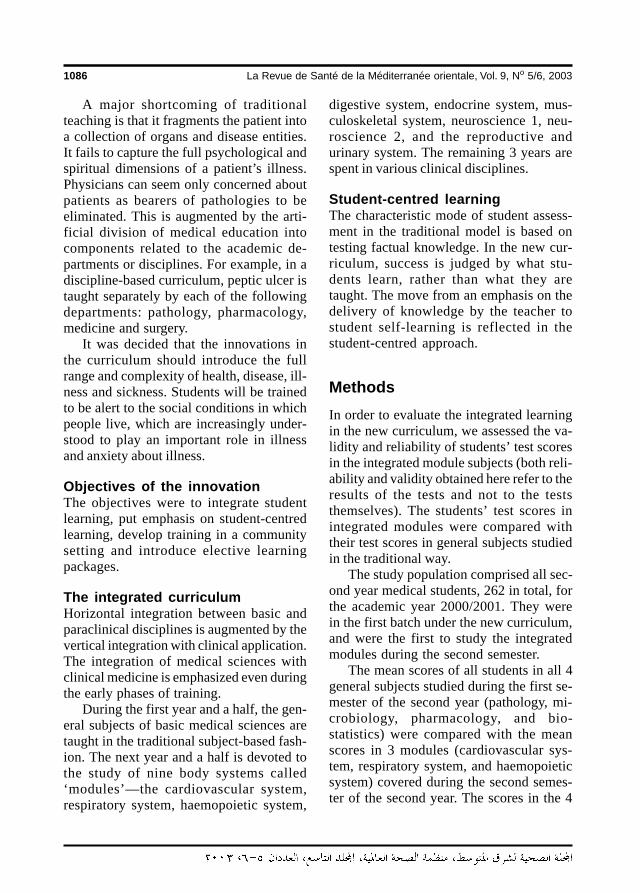
1086 La Revue de Santé de la Méditerranée orientale, Vol. 9, No 5/6, 2003
A major shortcoming of traditionalteaching is that it fragments the patient intoa collection of organs and disease entities.It fails to capture the full psychological andspiritual dimensions of a patient’s illness.Physicians can seem only concerned aboutpatients as bearers of pathologies to beeliminated. This is augmented by the arti-ficial division of medical education intocomponents related to the academic de-partments or disciplines. For example, in adiscipline-based curriculum, peptic ulcer istaught separately by each of the followingdepartments: pathology, pharmacology,medicine and surgery.
It was decided that the innovations inthe curriculum should introduce the fullrange and complexity of health, disease, ill-ness and sickness. Students will be trainedto be alert to the social conditions in whichpeople live, which are increasingly under-stood to play an important role in illnessand anxiety about illness.
Objectives of the innovationThe objectives were to integrate studentlearning, put emphasis on student-centredlearning, develop training in a communitysetting and introduce elective learningpackages.
The integrated curriculumHorizontal integration between basic andparaclinical disciplines is augmented by thevertical integration with clinical application.The integration of medical sciences withclinical medicine is emphasized even duringthe early phases of training.
During the first year and a half, the gen-eral subjects of basic medical sciences aretaught in the traditional subject-based fash-ion. The next year and a half is devoted tothe study of nine body systems called‘modules’—the cardiovascular system,respiratory system, haemopoietic system,
digestive system, endocrine system, mus-culoskeletal system, neuroscience 1, neu-roscience 2, and the reproductive andurinary system. The remaining 3 years arespent in various clinical disciplines.
Student-centred learningThe characteristic mode of student assess-ment in the traditional model is based ontesting factual knowledge. In the new cur-riculum, success is judged by what stu-dents learn, rather than what they aretaught. The move from an emphasis on thedelivery of knowledge by the teacher tostudent self-learning is reflected in thestudent-centred approach.
MethodsIn order to evaluate the integrated learningin the new curriculum, we assessed the va-lidity and reliability of students’ test scoresin the integrated module subjects (both reli-ability and validity obtained here refer to theresults of the tests and not to the teststhemselves). The students’ test scores inintegrated modules were compared withtheir test scores in general subjects studiedin the traditional way.
The study population comprised all sec-ond year medical students, 262 in total, forthe academic year 2000/2001. They werein the first batch under the new curriculum,and were the first to study the integratedmodules during the second semester.
The mean scores of all students in all 4general subjects studied during the first se-mester of the second year (pathology, mi-crobiology, pharmacology, and bio-statistics) were compared with the meanscores in 3 modules (cardiovascular sys-tem, respiratory system, and haemopoieticsystem) covered during the second semes-ter of the second year. The scores in the 4
24 Innovative learning approaches.pmd 3/3/2005, 12:17 AM1086
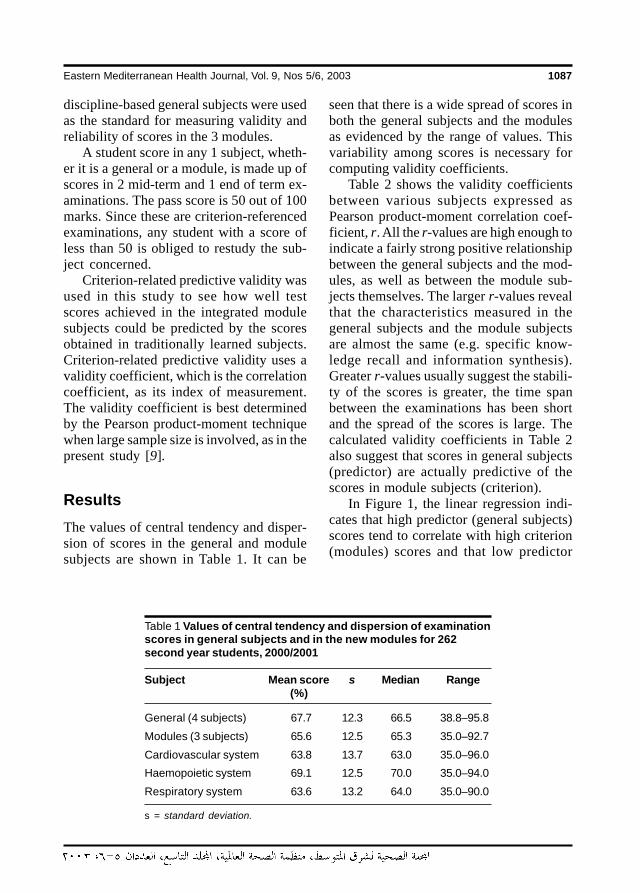
Eastern Mediterranean Health Journal, Vol. 9, Nos 5/6, 2003 1087
discipline-based general subjects were usedas the standard for measuring validity andreliability of scores in the 3 modules.
A student score in any 1 subject, wheth-er it is a general or a module, is made up ofscores in 2 mid-term and 1 end of term ex-aminations. The pass score is 50 out of 100marks. Since these are criterion-referencedexaminations, any student with a score ofless than 50 is obliged to restudy the sub-ject concerned.
Criterion-related predictive validity wasused in this study to see how well testscores achieved in the integrated modulesubjects could be predicted by the scoresobtained in traditionally learned subjects.Criterion-related predictive validity uses avalidity coefficient, which is the correlationcoefficient, as its index of measurement.The validity coefficient is best determinedby the Pearson product-moment techniquewhen large sample size is involved, as in thepresent study [9].
ResultsThe values of central tendency and disper-sion of scores in the general and modulesubjects are shown in Table 1. It can be
seen that there is a wide spread of scores inboth the general subjects and the modulesas evidenced by the range of values. Thisvariability among scores is necessary forcomputing validity coefficients.
Table 2 shows the validity coefficientsbetween various subjects expressed asPearson product-moment correlation coef-ficient, r. All the r-values are high enough toindicate a fairly strong positive relationshipbetween the general subjects and the mod-ules, as well as between the module sub-jects themselves. The larger r-values revealthat the characteristics measured in thegeneral subjects and the module subjectsare almost the same (e.g. specific know-ledge recall and information synthesis).Greater r-values usually suggest the stabili-ty of the scores is greater, the time spanbetween the examinations has been shortand the spread of the scores is large. Thecalculated validity coefficients in Table 2also suggest that scores in general subjects(predictor) are actually predictive of thescores in module subjects (criterion).
In Figure 1, the linear regression indi-cates that high predictor (general subjects)scores tend to correlate with high criterion(modules) scores and that low predictor
Table 1 Values of central tendency and dispersion of examinationscores in general subjects and in the new modules for 262second year students, 2000/2001
Subject Mean score s Median Range(%)
General (4 subjects) 67.7 12.3 66.5 38.8–95.8
Modules (3 subjects) 65.6 12.5 65.3 35.0–92.7
Cardiovascular system 63.8 13.7 63.0 35.0–96.0
Haemopoietic system 69.1 12.5 70.0 35.0–94.0
Respiratory system 63.6 13.2 64.0 35.0–90.0
s = standard deviation.
24 Innovative learning approaches.pmd 3/3/2005, 12:17 AM1087
1088 La Revue de Santé de la Méditerranée orientale, Vol. 9, No 5/6, 2003
scores tend to correlate with low criterionscores, the coefficients of determination(R2) being high in the 4 regression lines.
Table 3 shows that the linear regressionlines between scores of the general sub-jects and those of the modules illustrated inFigure 1 provide good fit to the data (statis-tically significant).
Again, since these tests are criterion-referenced tests, the reliability of scoresobtained in both the general and the modulesubjects can best be determined by com-puting the percentage of consistent deci-sions over any 2 tests. For example, allstudents obtaining a score of 80 or higheron tests in both general and module sub-jects are classified as masters in both sub-jects. All students obtaining a score of lessthan 80 on both tests are classified as non-masters on both tests. The remaining stu-dents are classified as master on 1 test andnonmaster on the other. If this latter groupof reversals is relatively large, the tests areinconsistent in classifying students. Con-sistency (reliability) is determined as thesum of masters and nonmasters in bothtests divided by the total number of stu-dents.
Table 4 displays the consistency of ex-amination scores in general subjects withthose in the new modules, using different
cut-off points for masters. The students’scores reveal higher consistency for the 2extreme cut-off points, 50 and 80. The to-tal agreement between scores in generalsubjects with those in module subjects is inthe order of 9 out of 10 students at cut-offpoints 50 and 80. However, the majority ofthose students are classed as masters whenthe 50 cut-off point is considered, whilemany of them are classed as nonmasterswhen 80 is the cut-off point.
DiscussionThe important qualities to consider whenevaluating innovative instructional methodsare validity and reliability of the results oftests measuring students’ achievements inthe innovative programme. Testing stu-dents’ achievements provides informationthat is used in educational decisions. Evalu-ation of tests done after the introduction ofa new instructional strategy is essential fordescribing changes in students’ perfor-mance as well as for judging the desirabilityof the innovative programme itself.
Measuring the validity of the integratedmodules in the present study could best bedone by determining the extent to whichstudents achieved the intended objectives
Table 2 Pearson correlation coefficient (r) between examination scores invarious subjects
General Modules Cardiovascular Haemopoieticsystem system
Modules 0.797
Cardiovascular system 0.873 0.846
Haemopoietic system 0.881 0.832 0.885
Respiratory system 0.776 0.956 0.781 0.765
All r-values are statistically significant, P < 0.001.Using t-test, t = r√ [(n – 2)/(1 – r²)].
24 Innovative learning approaches.pmd 3/3/2005, 12:17 AM1088
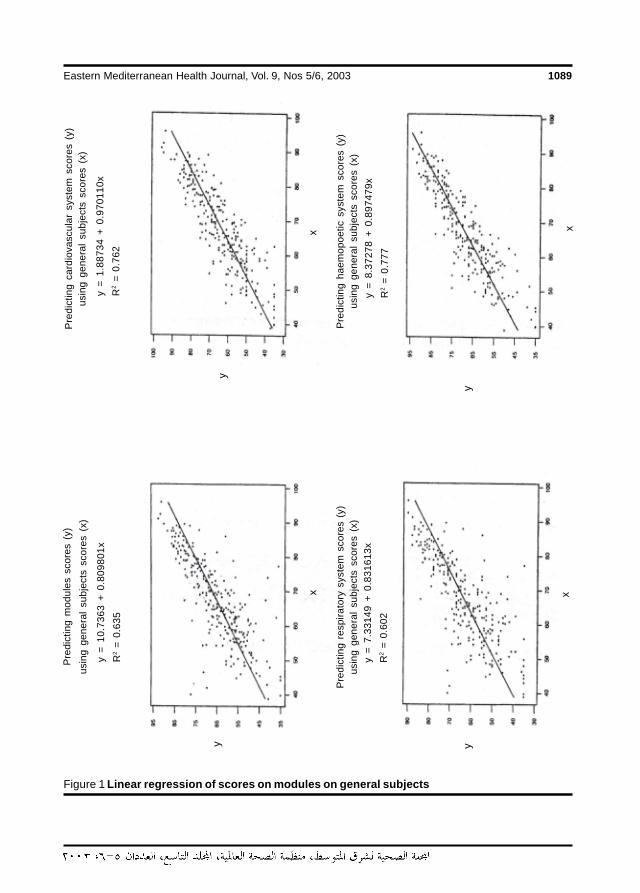
Eastern Mediterranean Health Journal, Vol. 9, Nos 5/6, 2003 1089
Figure 1 Linear regression of scores on modules on general subjects
y =
10.
7363
+ 0
.809
801x
R2
= 0
.635
y =
7.3
3149
+ 0
.831
613x
R2
= 0
.602
y =
1.8
8734
+ 0
.970
110x
R2
= 0
.762
y =
8.3
7278
+ 0
.897
479x
R2
= 0
.777
Pre
dict
ing
mod
ules
sco
res
(y)
usin
g ge
nera
l su
bjec
ts s
core
s (x
)P
redi
ctin
g ca
rdio
vasc
ular
sys
tem
sco
res
(y)
usin
g ge
nera
l su
bjec
ts s
core
s (x
)
Pre
dict
ing
resp
irato
ry s
yste
m s
core
s (y
)us
ing
gene
ral
subj
ects
sco
res
(x)
Pre
dict
ing
haem
opoe
tic s
yste
m s
core
s (y
)us
ing
gene
ral
subj
ects
sco
res
(x)
x
y
x
y
x
y
x
y
24 Innovative learning approaches.pmd 3/3/2005, 12:17 AM1089
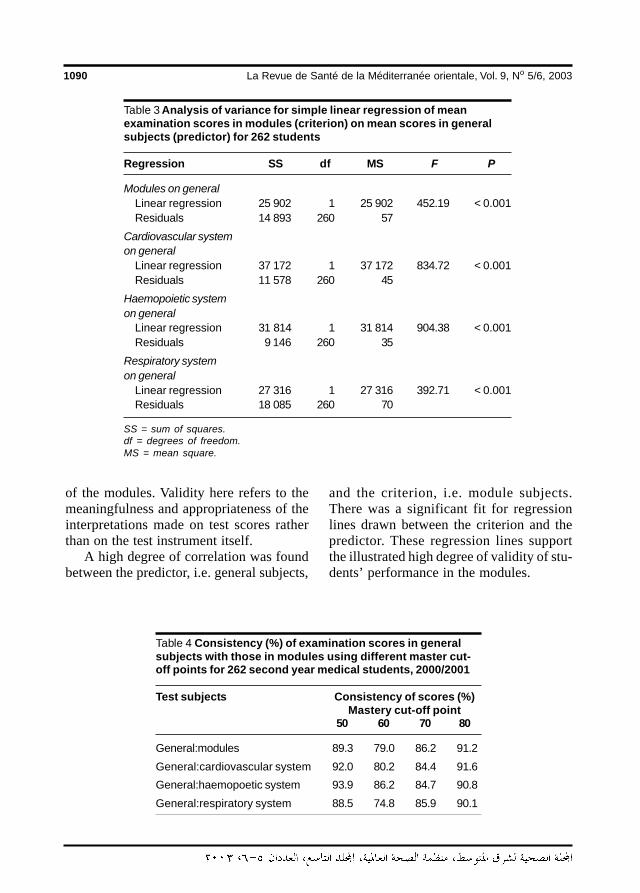
1090 La Revue de Santé de la Méditerranée orientale, Vol. 9, No 5/6, 2003
of the modules. Validity here refers to themeaningfulness and appropriateness of theinterpretations made on test scores ratherthan on the test instrument itself.
A high degree of correlation was foundbetween the predictor, i.e. general subjects,
and the criterion, i.e. module subjects.There was a significant fit for regressionlines drawn between the criterion and thepredictor. These regression lines supportthe illustrated high degree of validity of stu-dents’ performance in the modules.
Table 4 Consistency (%) of examination scores in generalsubjects with those in modules using different master cut-off points for 262 second year medical students, 2000/2001
Test subjects Consistency of scores (%)Mastery cut-off point
50 60 70 80
General:modules 89.3 79.0 86.2 91.2
General:cardiovascular system 92.0 80.2 84.4 91.6
General:haemopoetic system 93.9 86.2 84.7 90.8
General:respiratory system 88.5 74.8 85.9 90.1
Table 3 Analysis of variance for simple linear regression of meanexamination scores in modules (criterion) on mean scores in generalsubjects (predictor) for 262 students
Regression SS df MS F P
Modules on generalLinear regression 25 902 1 25 902 452.19 < 0.001Residuals 14 893 260 57
Cardiovascular systemon general
Linear regression 37 172 1 37 172 834.72 < 0.001Residuals 11 578 260 45
Haemopoietic systemon general
Linear regression 31 814 1 31 814 904.38 < 0.001Residuals 9 146 260 35
Respiratory systemon general
Linear regression 27 316 1 27 316 392.71 < 0.001Residuals 18 085 260 70
SS = sum of squares.df = degrees of freedom.MS = mean square.
24 Innovative learning approaches.pmd 3/3/2005, 12:17 AM1090
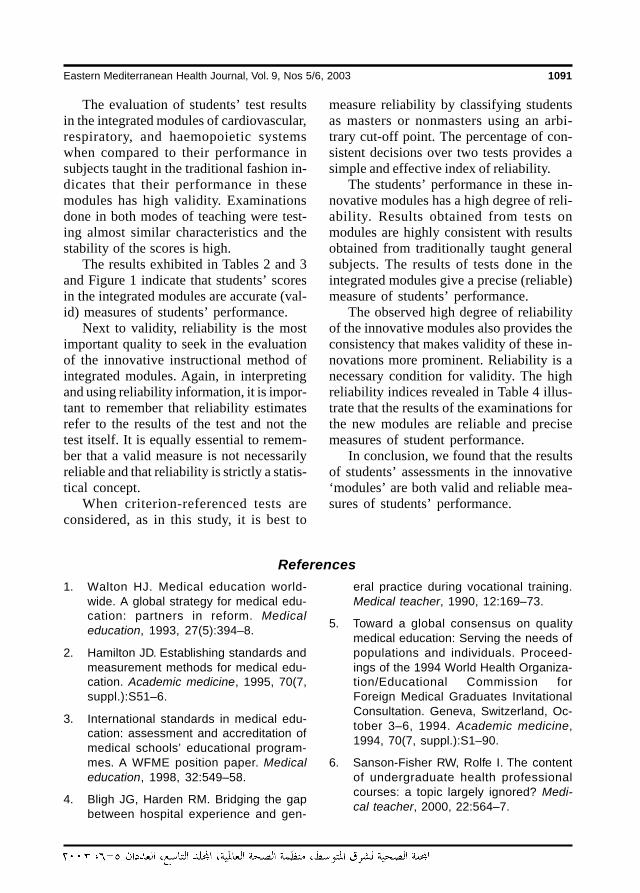
Eastern Mediterranean Health Journal, Vol. 9, Nos 5/6, 2003 1091
The evaluation of students’ test resultsin the integrated modules of cardiovascular,respiratory, and haemopoietic systemswhen compared to their performance insubjects taught in the traditional fashion in-dicates that their performance in thesemodules has high validity. Examinationsdone in both modes of teaching were test-ing almost similar characteristics and thestability of the scores is high.
The results exhibited in Tables 2 and 3and Figure 1 indicate that students’ scoresin the integrated modules are accurate (val-id) measures of students’ performance.
Next to validity, reliability is the mostimportant quality to seek in the evaluationof the innovative instructional method ofintegrated modules. Again, in interpretingand using reliability information, it is impor-tant to remember that reliability estimatesrefer to the results of the test and not thetest itself. It is equally essential to remem-ber that a valid measure is not necessarilyreliable and that reliability is strictly a statis-tical concept.
When criterion-referenced tests areconsidered, as in this study, it is best to
measure reliability by classifying studentsas masters or nonmasters using an arbi-trary cut-off point. The percentage of con-sistent decisions over two tests provides asimple and effective index of reliability.
The students’ performance in these in-novative modules has a high degree of reli-ability. Results obtained from tests onmodules are highly consistent with resultsobtained from traditionally taught generalsubjects. The results of tests done in theintegrated modules give a precise (reliable)measure of students’ performance.
The observed high degree of reliabilityof the innovative modules also provides theconsistency that makes validity of these in-novations more prominent. Reliability is anecessary condition for validity. The highreliability indices revealed in Table 4 illus-trate that the results of the examinations forthe new modules are reliable and precisemeasures of student performance.
In conclusion, we found that the resultsof students’ assessments in the innovative‘modules’ are both valid and reliable mea-sures of students’ performance.
References
1. Walton HJ. Medical education world-wide. A global strategy for medical edu-cation: partners in reform. Medicaleducation, 1993, 27(5):394–8.
2. Hamilton JD. Establishing standards andmeasurement methods for medical edu-cation. Academic medicine, 1995, 70(7,suppl.):S51–6.
3. International standards in medical edu-cation: assessment and accreditation ofmedical schools’ educational program-mes. A WFME position paper. Medicaleducation, 1998, 32:549–58.
4. Bligh JG, Harden RM. Bridging the gapbetween hospital experience and gen-
eral practice during vocational training.Medical teacher, 1990, 12:169–73.
5. Toward a global consensus on qualitymedical education: Serving the needs ofpopulations and individuals. Proceed-ings of the 1994 World Health Organiza-tion/Educational Commission forForeign Medical Graduates InvitationalConsultation. Geneva, Switzerland, Oc-tober 3–6, 1994. Academic medicine,1994, 70(7, suppl.):S1–90.
6. Sanson-Fisher RW, Rolfe I. The contentof undergraduate health professionalcourses: a topic largely ignored? Medi-cal teacher, 2000, 22:564–7.
24 Innovative learning approaches.pmd 3/3/2005, 12:17 AM1091
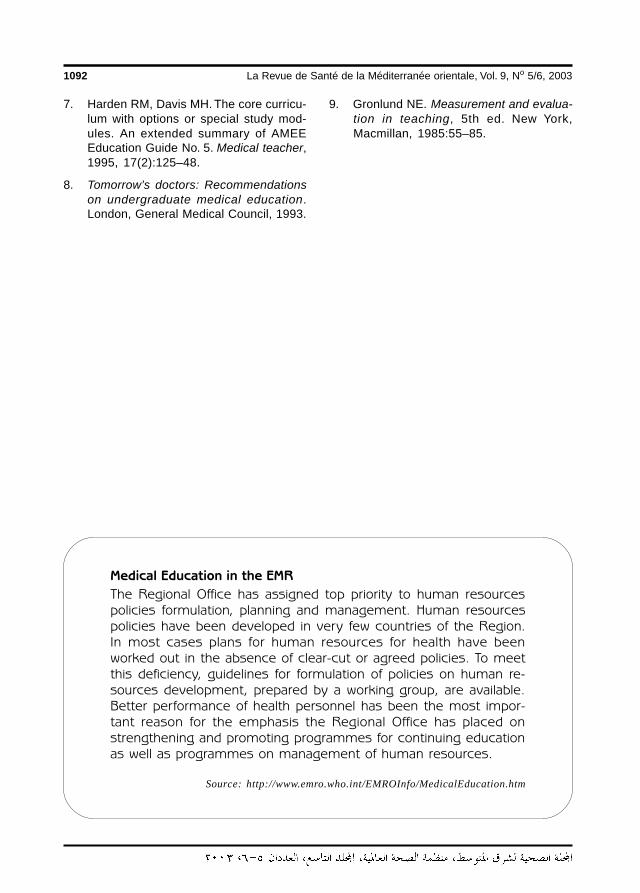
1092 La Revue de Santé de la Méditerranée orientale, Vol. 9, No 5/6, 2003
7. Harden RM, Davis MH. The core curricu-lum with options or special study mod-ules. An extended summary of AMEEEducation Guide No. 5. Medical teacher,1995, 17(2):125–48.
8. Tomorrow’s doctors: Recommendationson undergraduate medical education.London, General Medical Council, 1993.
9. Gronlund NE. Measurement and evalua-tion in teaching, 5th ed. New York,Macmillan, 1985:55–85.
Medical Education in the EMR
The Regional Office has assigned top priority to human resourcespolicies formulation, planning and management. Human resourcespolicies have been developed in very few countries of the Region.In most cases plans for human resources for health have beenworked out in the absence of clear-cut or agreed policies. To meetthis deficiency, guidelines for formulation of policies on human re-sources development, prepared by a working group, are available.Better performance of health personnel has been the most impor-tant reason for the emphasis the Regional Office has placed onstrengthening and promoting programmes for continuing educationas well as programmes on management of human resources.
Source: http://www.emro.who.int/EMROInfo/MedicalEducation.htm
24 Innovative learning approaches.pmd 3/3/2005, 12:17 AM1092
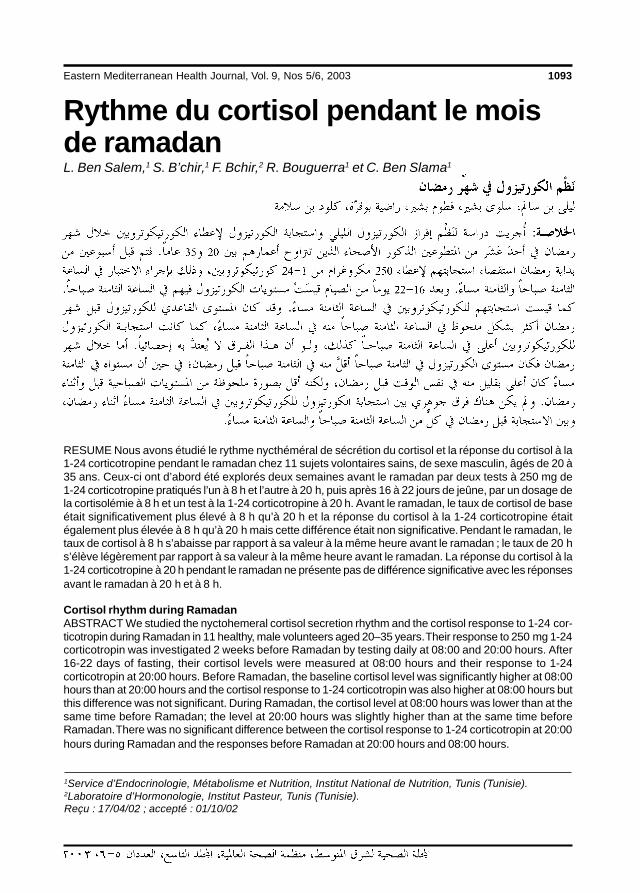
Eastern Mediterranean Health Journal, Vol. 9, Nos 5/6, 2003 1093
Rythme du cortisol pendant le moisde ramadanL. Ben Salem,1 S. B’chir,1 F. Bchir,2 R. Bouguerra1 et C. Ben Slama1
1Service d’Endocrinologie, Métabolisme et Nutrition, Institut National de Nutrition, Tunis (Tunisie).2Laboratoire d’Hormonologie, Institut Pasteur, Tunis (Tunisie).Reçu : 17/04/02 ; accepté : 01/10/02
RESUME Nous avons étudié le rythme nycthéméral de sécrétion du cortisol et la réponse du cortisol à la1-24 corticotropine pendant le ramadan chez 11 sujets volontaires sains, de sexe masculin, âgés de 20 à35 ans. Ceux-ci ont d’abord été explorés deux semaines avant le ramadan par deux tests à 250 mg de1-24 corticotropine pratiqués l’un à 8 h et l’autre à 20 h, puis après 16 à 22 jours de jeûne, par un dosage dela cortisolémie à 8 h et un test à la 1-24 corticotropine à 20 h. Avant le ramadan, le taux de cortisol de baseétait significativement plus élevé à 8 h qu’à 20 h et la réponse du cortisol à la 1-24 corticotropine étaitégalement plus élevée à 8 h qu’à 20 h mais cette différence était non significative. Pendant le ramadan, letaux de cortisol à 8 h s’abaisse par rapport à sa valeur à la même heure avant le ramadan ; le taux de 20 hs’élève légèrement par rapport à sa valeur à la même heure avant le ramadan. La réponse du cortisol à la1-24 corticotropine à 20 h pendant le ramadan ne présente pas de différence significative avec les réponsesavant le ramadan à 20 h et à 8 h.
Cortisol rhythm during RamadanABSTRACT We studied the nyctohemeral cortisol secretion rhythm and the cortisol response to 1-24 cor-ticotropin during Ramadan in 11 healthy, male volunteers aged 20–35 years. Their response to 250 mg 1-24corticotropin was investigated 2 weeks before Ramadan by testing daily at 08:00 and 20:00 hours. After16-22 days of fasting, their cortisol levels were measured at 08:00 hours and their response to 1-24corticotropin at 20:00 hours. Before Ramadan, the baseline cortisol level was significantly higher at 08:00hours than at 20:00 hours and the cortisol response to 1-24 corticotropin was also higher at 08:00 hours butthis difference was not significant. During Ramadan, the cortisol level at 08:00 hours was lower than at thesame time before Ramadan; the level at 20:00 hours was slightly higher than at the same time beforeRamadan. There was no significant difference between the cortisol response to 1-24 corticotropin at 20:00hours during Ramadan and the responses before Ramadan at 20:00 hours and 08:00 hours.
25 Rythme du cortisol pendant.pmd 3/3/2005, 12:17 AM1093
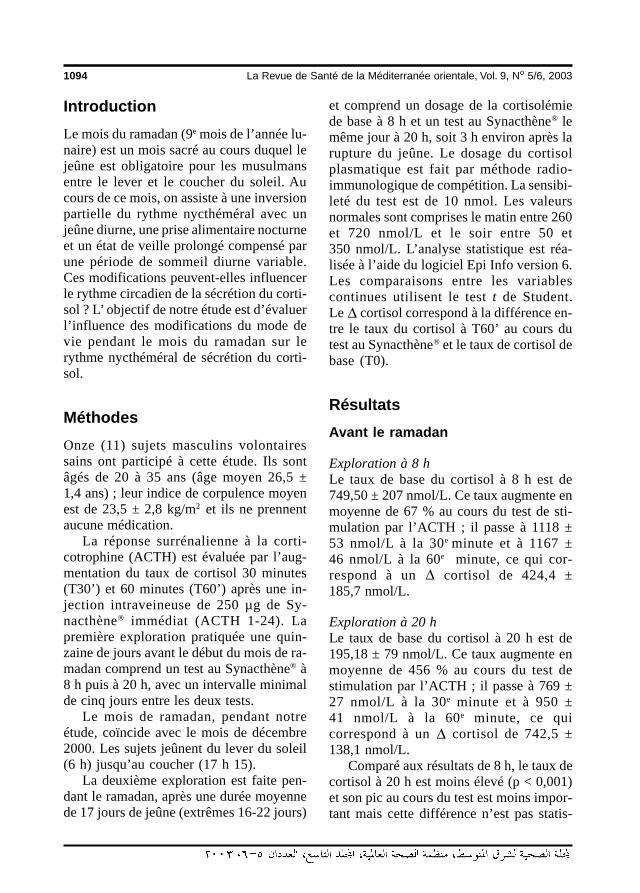
1094 La Revue de Santé de la Méditerranée orientale, Vol. 9, No 5/6, 2003
IntroductionLe mois du ramadan (9e mois de l’année lu-naire) est un mois sacré au cours duquel lejeûne est obligatoire pour les musulmansentre le lever et le coucher du soleil. Aucours de ce mois, on assiste à une inversionpartielle du rythme nycthéméral avec unjeûne diurne, une prise alimentaire nocturneet un état de veille prolongé compensé parune période de sommeil diurne variable.Ces modifications peuvent-elles influencerle rythme circadien de la sécrétion du corti-sol ? L’ objectif de notre étude est d’évaluerl’influence des modifications du mode devie pendant le mois du ramadan sur lerythme nycthéméral de sécrétion du corti-sol.
MéthodesOnze (11) sujets masculins volontairessains ont participé à cette étude. Ils sontâgés de 20 à 35 ans (âge moyen 26,5 ±1,4 ans) ; leur indice de corpulence moyenest de 23,5 ± 2,8 kg/m2 et ils ne prennentaucune médication.
La réponse surrénalienne à la corti-cotrophine (ACTH) est évaluée par l’aug-mentation du taux de cortisol 30 minutes(T30’) et 60 minutes (T60’) après une in-jection intraveineuse de 250 µg de Sy-nacthène® immédiat (ACTH 1-24). Lapremière exploration pratiquée une quin-zaine de jours avant le début du mois de ra-madan comprend un test au Synacthène® à8 h puis à 20 h, avec un intervalle minimalde cinq jours entre les deux tests.
Le mois de ramadan, pendant notreétude, coïncide avec le mois de décembre2000. Les sujets jeûnent du lever du soleil(6 h) jusqu’au coucher (17 h 15).
La deuxième exploration est faite pen-dant le ramadan, après une durée moyennede 17 jours de jeûne (extrêmes 16-22 jours)
et comprend un dosage de la cortisolémiede base à 8 h et un test au Synacthène® lemême jour à 20 h, soit 3 h environ après larupture du jeûne. Le dosage du cortisolplasmatique est fait par méthode radio-immunologique de compétition. La sensibi-leté du test est de 10 nmol. Les valeursnormales sont comprises le matin entre 260et 720 nmol/L et le soir entre 50 et350 nmol/L. L’analyse statistique est réa-lisée à l’aide du logiciel Epi Info version 6.Les comparaisons entre les variablescontinues utilisent le test t de Student.Le Ñ cortisol correspond à la différence en-tre le taux du cortisol à T60’ au cours dutest au Synacthène® et le taux de cortisol debase (T0).
Résultats Avant le ramadan
Exploration à 8 hLe taux de base du cortisol à 8 h est de749,50 ± 207 nmol/L. Ce taux augmente enmoyenne de 67 % au cours du test de sti-mulation par l’ACTH ; il passe à 1118 ±53 nmol/L à la 30e minute et à 1167 ±46 nmol/L à la 60e minute, ce qui cor-respond à un Ñ cortisol de 424,4 ±185,7 nmol/L.
Exploration à 20 hLe taux de base du cortisol à 20 h est de195,18 ± 79 nmol/L. Ce taux augmente enmoyenne de 456 % au cours du test destimulation par l’ACTH ; il passe à 769 ±27 nmol/L à la 30e minute et à 950 ±41 nmol/L à la 60e minute, ce quicorrespond à un Ñ cortisol de 742,5 ±138,1 nmol/L.
Comparé aux résultats de 8 h, le taux decortisol à 20 h est moins élevé (p < 0,001)et son pic au cours du test est moins impor-tant mais cette différence n’est pas statis-
∇
∇
∇
25 Rythme du cortisol pendant.pmd 3/3/2005, 12:17 AM1094
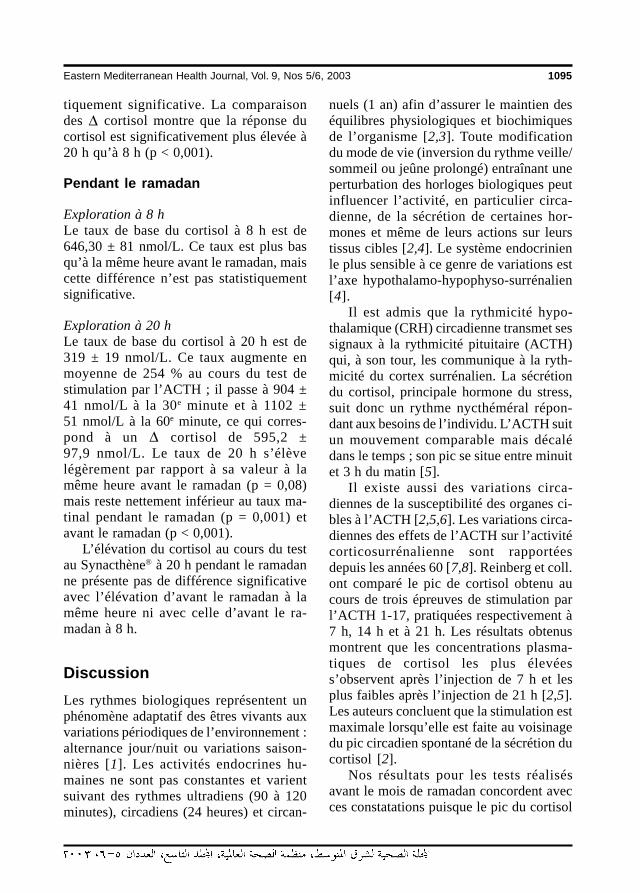
Eastern Mediterranean Health Journal, Vol. 9, Nos 5/6, 2003 1095
tiquement significative. La comparaisondes Ñ cortisol montre que la réponse ducortisol est significativement plus élevée à20 h qu’à 8 h (p < 0,001).
Pendant le ramadan
Exploration à 8 hLe taux de base du cortisol à 8 h est de646,30 ± 81 nmol/L. Ce taux est plus basqu’à la même heure avant le ramadan, maiscette différence n’est pas statistiquementsignificative.
Exploration à 20 hLe taux de base du cortisol à 20 h est de319 ± 19 nmol/L. Ce taux augmente enmoyenne de 254 % au cours du test destimulation par l’ACTH ; il passe à 904 ±41 nmol/L à la 30e minute et à 1102 ±51 nmol/L à la 60e minute, ce qui corres-pond à un Ñ cortisol de 595,2 ±97,9 nmol/L. Le taux de 20 h s’élèvelégèrement par rapport à sa valeur à lamême heure avant le ramadan (p = 0,08)mais reste nettement inférieur au taux ma-tinal pendant le ramadan (p = 0,001) etavant le ramadan (p < 0,001).
L’élévation du cortisol au cours du testau Synacthène® à 20 h pendant le ramadanne présente pas de différence significativeavec l’élévation d’avant le ramadan à lamême heure ni avec celle d’avant le ra-madan à 8 h.
DiscussionLes rythmes biologiques représentent unphénomène adaptatif des êtres vivants auxvariations périodiques de l’environnement :alternance jour/nuit ou variations saison-nières [1]. Les activités endocrines hu-maines ne sont pas constantes et varientsuivant des rythmes ultradiens (90 à 120minutes), circadiens (24 heures) et circan-
nuels (1 an) afin d’assurer le maintien deséquilibres physiologiques et biochimiquesde l’organisme [2,3]. Toute modificationdu mode de vie (inversion du rythme veille/sommeil ou jeûne prolongé) entraînant uneperturbation des horloges biologiques peutinfluencer l’activité, en particulier circa-dienne, de la sécrétion de certaines hor-mones et même de leurs actions sur leurstissus cibles [2,4]. Le système endocrinienle plus sensible à ce genre de variations estl’axe hypothalamo-hypophyso-surrénalien[4].
Il est admis que la rythmicité hypo-thalamique (CRH) circadienne transmet sessignaux à la rythmicité pituitaire (ACTH)qui, à son tour, les communique à la ryth-micité du cortex surrénalien. La sécrétiondu cortisol, principale hormone du stress,suit donc un rythme nycthéméral répon-dant aux besoins de l’individu. L’ACTH suitun mouvement comparable mais décalédans le temps ; son pic se situe entre minuitet 3 h du matin [5].
Il existe aussi des variations circa-diennes de la susceptibilité des organes ci-bles à l’ACTH [2,5,6]. Les variations circa-diennes des effets de l’ACTH sur l’activitécorticosurrénalienne sont rapportéesdepuis les années 60 [7,8]. Reinberg et coll.ont comparé le pic de cortisol obtenu aucours de trois épreuves de stimulation parl’ACTH 1-17, pratiquées respectivement à7 h, 14 h et à 21 h. Les résultats obtenusmontrent que les concentrations plasma-tiques de cortisol les plus élevéess’observent après l’injection de 7 h et lesplus faibles après l’injection de 21 h [2,5].Les auteurs concluent que la stimulation estmaximale lorsqu’elle est faite au voisinagedu pic circadien spontané de la sécrétion ducortisol [2].
Nos résultats pour les tests réalisésavant le mois de ramadan concordent avecces constatations puisque le pic du cortisol
∇
∇
25 Rythme du cortisol pendant.pmd 3/3/2005, 12:17 AM1095
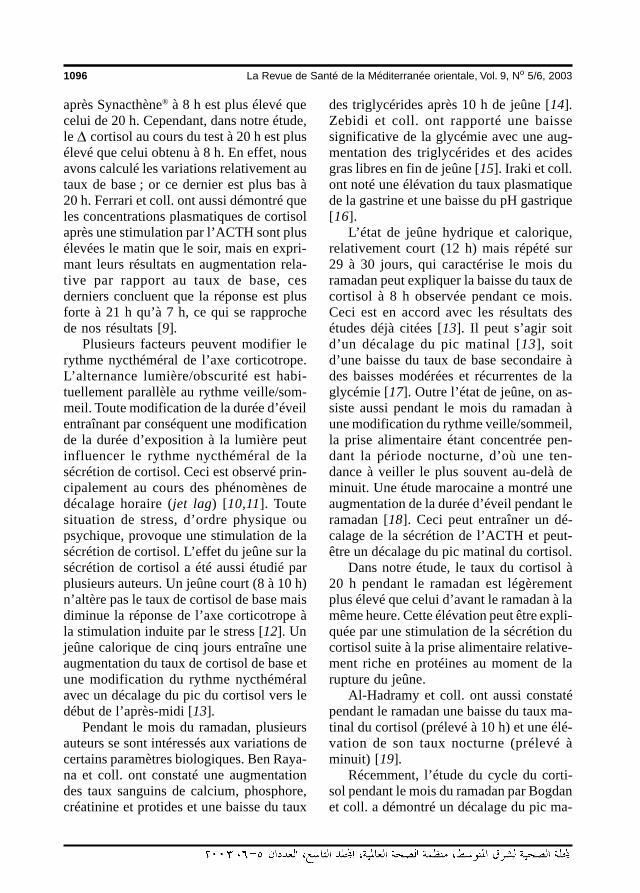
1096 La Revue de Santé de la Méditerranée orientale, Vol. 9, No 5/6, 2003
après Synacthène® à 8 h est plus élevé quecelui de 20 h. Cependant, dans notre étude,le Ñ cortisol au cours du test à 20 h est plusélevé que celui obtenu à 8 h. En effet, nousavons calculé les variations relativement autaux de base ; or ce dernier est plus bas à20 h. Ferrari et coll. ont aussi démontré queles concentrations plasmatiques de cortisolaprès une stimulation par l’ACTH sont plusélevées le matin que le soir, mais en expri-mant leurs résultats en augmentation rela-tive par rapport au taux de base, cesderniers concluent que la réponse est plusforte à 21 h qu’à 7 h, ce qui se rapprochede nos résultats [9].
Plusieurs facteurs peuvent modifier lerythme nycthéméral de l’axe corticotrope.L’alternance lumière/obscurité est habi-tuellement parallèle au rythme veille/som-meil. Toute modification de la durée d’éveilentraînant par conséquent une modificationde la durée d’exposition à la lumière peutinfluencer le rythme nycthéméral de lasécrétion de cortisol. Ceci est observé prin-cipalement au cours des phénomènes dedécalage horaire (jet lag) [10,11]. Toutesituation de stress, d’ordre physique oupsychique, provoque une stimulation de lasécrétion de cortisol. L’effet du jeûne sur lasécrétion de cortisol a été aussi étudié parplusieurs auteurs. Un jeûne court (8 à 10 h)n’altère pas le taux de cortisol de base maisdiminue la réponse de l’axe corticotrope àla stimulation induite par le stress [12]. Unjeûne calorique de cinq jours entraîne uneaugmentation du taux de cortisol de base etune modification du rythme nycthéméralavec un décalage du pic du cortisol vers ledébut de l’après-midi [13].
Pendant le mois du ramadan, plusieursauteurs se sont intéressés aux variations decertains paramètres biologiques. Ben Raya-na et coll. ont constaté une augmentationdes taux sanguins de calcium, phosphore,créatinine et protides et une baisse du taux
des triglycérides après 10 h de jeûne [14].Zebidi et coll. ont rapporté une baissesignificative de la glycémie avec une aug-mentation des triglycérides et des acidesgras libres en fin de jeûne [15]. Iraki et coll.ont noté une élévation du taux plasmatiquede la gastrine et une baisse du pH gastrique[16].
L’état de jeûne hydrique et calorique,relativement court (12 h) mais répété sur29 à 30 jours, qui caractérise le mois duramadan peut expliquer la baisse du taux decortisol à 8 h observée pendant ce mois.Ceci est en accord avec les résultats desétudes déjà citées [13]. Il peut s’agir soitd’un décalage du pic matinal [13], soitd’une baisse du taux de base secondaire àdes baisses modérées et récurrentes de laglycémie [17]. Outre l’état de jeûne, on as-siste aussi pendant le mois du ramadan àune modification du rythme veille/sommeil,la prise alimentaire étant concentrée pen-dant la période nocturne, d’où une ten-dance à veiller le plus souvent au-delà deminuit. Une étude marocaine a montré uneaugmentation de la durée d’éveil pendant leramadan [18]. Ceci peut entraîner un dé-calage de la sécrétion de l’ACTH et peut-être un décalage du pic matinal du cortisol.
Dans notre étude, le taux du cortisol à20 h pendant le ramadan est légèrementplus élevé que celui d’avant le ramadan à lamême heure. Cette élévation peut être expli-quée par une stimulation de la sécrétion ducortisol suite à la prise alimentaire relative-ment riche en protéines au moment de larupture du jeûne.
Al-Hadramy et coll. ont aussi constatépendant le ramadan une baisse du taux ma-tinal du cortisol (prélevé à 10 h) et une élé-vation de son taux nocturne (prélevé àminuit) [19].
Récemment, l’étude du cycle du corti-sol pendant le mois du ramadan par Bogdanet coll. a démontré un décalage du pic ma-
∇
25 Rythme du cortisol pendant.pmd 3/3/2005, 12:17 AM1096
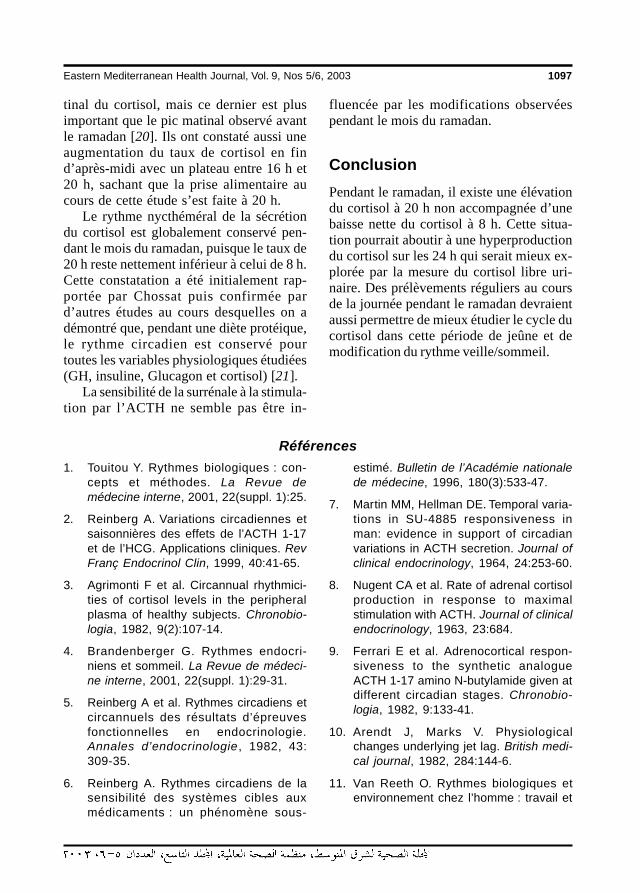
Eastern Mediterranean Health Journal, Vol. 9, Nos 5/6, 2003 1097
tinal du cortisol, mais ce dernier est plusimportant que le pic matinal observé avantle ramadan [20]. Ils ont constaté aussi uneaugmentation du taux de cortisol en find’après-midi avec un plateau entre 16 h et20 h, sachant que la prise alimentaire aucours de cette étude s’est faite à 20 h.
Le rythme nycthéméral de la sécrétiondu cortisol est globalement conservé pen-dant le mois du ramadan, puisque le taux de20 h reste nettement inférieur à celui de 8 h.Cette constatation a été initialement rap-portée par Chossat puis confirmée pard’autres études au cours desquelles on adémontré que, pendant une diète protéique,le rythme circadien est conservé pourtoutes les variables physiologiques étudiées(GH, insuline, Glucagon et cortisol) [21].
La sensibilité de la surrénale à la stimula-tion par l’ACTH ne semble pas être in-
fluencée par les modifications observéespendant le mois du ramadan.
ConclusionPendant le ramadan, il existe une élévationdu cortisol à 20 h non accompagnée d’unebaisse nette du cortisol à 8 h. Cette situa-tion pourrait aboutir à une hyperproductiondu cortisol sur les 24 h qui serait mieux ex-plorée par la mesure du cortisol libre uri-naire. Des prélèvements réguliers au coursde la journée pendant le ramadan devraientaussi permettre de mieux étudier le cycle ducortisol dans cette période de jeûne et demodification du rythme veille/sommeil.
Références
1. Touitou Y. Rythmes biologiques : con-cepts et méthodes. La Revue demédecine interne, 2001, 22(suppl. 1):25.
2. Reinberg A. Variations circadiennes etsaisonnières des effets de l’ACTH 1-17et de l’HCG. Applications cliniques. RevFranç Endocrinol Clin, 1999, 40:41-65.
3. Agrimonti F et al. Circannual rhythmici-ties of cortisol levels in the peripheralplasma of healthy subjects. Chronobio-logia, 1982, 9(2):107-14.
4. Brandenberger G. Rythmes endocri-niens et sommeil. La Revue de médeci-ne interne, 2001, 22(suppl. 1):29-31.
5. Reinberg A et al. Rythmes circadiens etcircannuels des résultats d’épreuvesfonctionnelles en endocrinologie.Annales d’endocrinologie , 1982, 43:309-35.
6. Reinberg A. Rythmes circadiens de lasensibilité des systèmes cibles auxmédicaments : un phénomène sous-
estimé. Bulletin de l’Académie nationalede médecine, 1996, 180(3):533-47.
7. Martin MM, Hellman DE. Temporal varia-tions in SU-4885 responsiveness inman: evidence in support of circadianvariations in ACTH secretion. Journal ofclinical endocrinology, 1964, 24:253-60.
8. Nugent CA et al. Rate of adrenal cortisolproduction in response to maximalstimulation with ACTH. Journal of clinicalendocrinology, 1963, 23:684.
9. Ferrari E et al. Adrenocortical respon-siveness to the synthetic analogueACTH 1-17 amino N-butylamide given atdifferent circadian stages. Chronobio-logia, 1982, 9:133-41.
10. Arendt J, Marks V. Physiologicalchanges underlying jet lag. British medi-cal journal, 1982, 284:144-6.
11. Van Reeth O. Rythmes biologiques etenvironnement chez l’homme : travail et
25 Rythme du cortisol pendant.pmd 3/3/2005, 12:17 AM1097
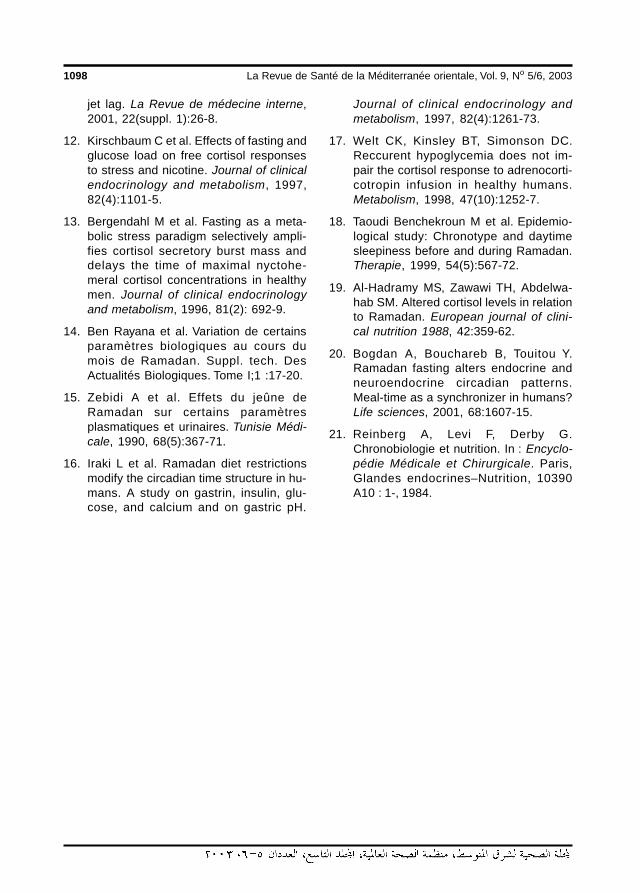
1098 La Revue de Santé de la Méditerranée orientale, Vol. 9, No 5/6, 2003
jet lag. La Revue de médecine interne,2001, 22(suppl. 1):26-8.
12. Kirschbaum C et al. Effects of fasting andglucose load on free cortisol responsesto stress and nicotine. Journal of clinicalendocrinology and metabolism, 1997,82(4):1101-5.
13. Bergendahl M et al. Fasting as a meta-bolic stress paradigm selectively ampli-fies cortisol secretory burst mass anddelays the time of maximal nyctohe-meral cortisol concentrations in healthymen. Journal of clinical endocrinologyand metabolism, 1996, 81(2): 692-9.
14. Ben Rayana et al. Variation de certainsparamètres biologiques au cours dumois de Ramadan. Suppl. tech. DesActualités Biologiques. Tome I;1 :17-20.
15. Zebidi A et al. Effets du jeûne deRamadan sur certains paramètresplasmatiques et urinaires. Tunisie Médi-cale, 1990, 68(5):367-71.
16. Iraki L et al. Ramadan diet restrictionsmodify the circadian time structure in hu-mans. A study on gastrin, insulin, glu-cose, and calcium and on gastric pH.
Journal of clinical endocrinology andmetabolism, 1997, 82(4):1261-73.
17. Welt CK, Kinsley BT, Simonson DC.Reccurent hypoglycemia does not im-pair the cortisol response to adrenocorti-cotropin infusion in healthy humans.Metabolism, 1998, 47(10):1252-7.
18. Taoudi Benchekroun M et al. Epidemio-logical study: Chronotype and daytimesleepiness before and during Ramadan.Therapie, 1999, 54(5):567-72.
19. Al-Hadramy MS, Zawawi TH, Abdelwa-hab SM. Altered cortisol levels in relationto Ramadan. European journal of clini-cal nutrition 1988, 42:359-62.
20. Bogdan A, Bouchareb B, Touitou Y.Ramadan fasting alters endocrine andneuroendocrine circadian patterns.Meal-time as a synchronizer in humans?Life sciences, 2001, 68:1607-15.
21. Reinberg A, Levi F, Derby G.Chronobiologie et nutrition. In : Encyclo-pédie Médicale et Chirurgicale. Paris,Glandes endocrines–Nutrition, 10390A10 : 1-, 1984.
25 Rythme du cortisol pendant.pmd 3/3/2005, 12:17 AM1098
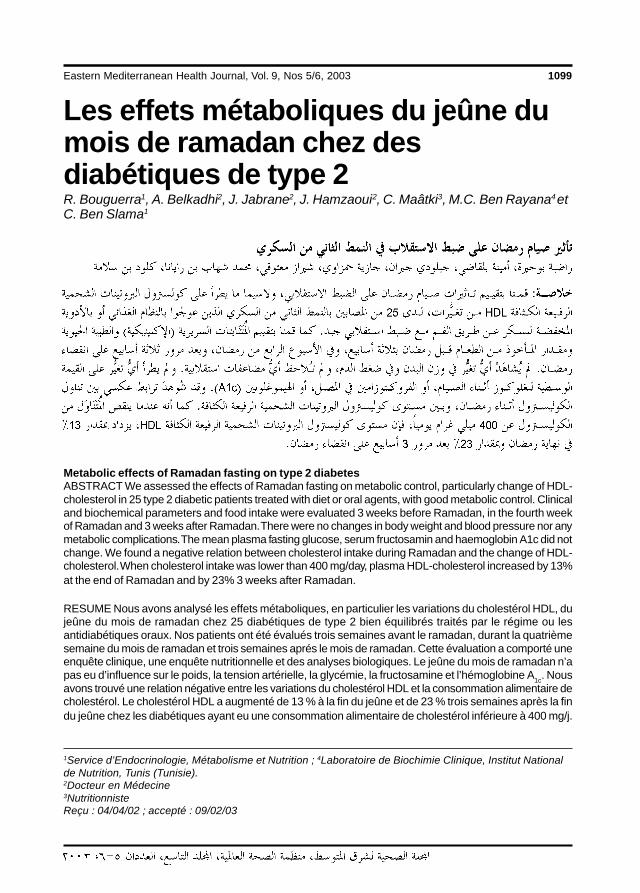
Eastern Mediterranean Health Journal, Vol. 9, Nos 5/6, 2003 1099
Les effets métaboliques du jeûne dumois de ramadan chez desdiabétiques de type 2R. Bouguerra1, A. Belkadhi2, J. Jabrane2, J. Hamzaoui2, C. Maâtki3, M.C. Ben Rayana4 etC. Ben Slama1
1Service d’Endocrinologie, Métabolisme et Nutrition ; 4Laboratoire de Biochimie Clinique, Institut Nationalde Nutrition, Tunis (Tunisie).2Docteur en Médecine3NutritionnisteReçu : 04/04/02 ; accepté : 09/02/03
Metabolic effects of Ramadan fasting on type 2 diabetesABSTRACT We assessed the effects of Ramadan fasting on metabolic control, particularly change of HDL-cholesterol in 25 type 2 diabetic patients treated with diet or oral agents, with good metabolic control. Clinicaland biochemical parameters and food intake were evaluated 3 weeks before Ramadan, in the fourth weekof Ramadan and 3 weeks after Ramadan. There were no changes in body weight and blood pressure nor anymetabolic complications. The mean plasma fasting glucose, serum fructosamin and haemoglobin A1c did notchange. We found a negative relation between cholesterol intake during Ramadan and the change of HDL-cholesterol. When cholesterol intake was lower than 400 mg/day, plasma HDL-cholesterol increased by 13%at the end of Ramadan and by 23% 3 weeks after Ramadan.
RESUME Nous avons analysé les effets métaboliques, en particulier les variations du cholestérol HDL, dujeûne du mois de ramadan chez 25 diabétiques de type 2 bien équilibrés traités par le régime ou lesantidiabétiques oraux. Nos patients ont été évalués trois semaines avant le ramadan, durant la quatrièmesemaine du mois de ramadan et trois semaines aprés le mois de ramadan. Cette évaluation a comporté uneenquête clinique, une enquête nutritionnelle et des analyses biologiques. Le jeûne du mois de ramadan n’apas eu d’influence sur le poids, la tension artérielle, la glycémie, la fructosamine et l’hémoglobine A1c. Nousavons trouvé une relation négative entre les variations du cholestérol HDL et la consommation alimentaire decholestérol. Le cholestérol HDL a augmenté de 13 % à la fin du jeûne et de 23 % trois semaines après la findu jeûne chez les diabétiques ayant eu une consommation alimentaire de cholestérol inférieure à 400 mg/j.
26 Les effets mÈtaboliques.pmd 3/3/2005, 12:17 AM1099
1100 La Revue de Santé de la Méditerranée orientale, Vol. 9, No 5/6, 2003
IntroductionIl existe plusieurs types de jeûne, desjeûnes de courte durée supprimant un oudeux repas, des jeûnes prolongés se limitantà l’absorption d’eau durant plusieurs jourset des jeûnes sélectifs qui suppriment unecatégorie d’aliments : matières grasses,protides, glucides. Ces jeûnes entraînentune restriction partielle, totale ou sélectivedes aliments pour une durée variable.
Le jeûne religieux a une finalité et unesignification différentes du jeûne médical.Le jeûne est une prescription religieuse quiremonte loin dans l’histoire de l’humanité.Le mois de ramadan est le 9e mois del’année lunaire. C’est un mois sacré où lesmusulmans sont assignés à jeûner de l’aubejusqu’au coucher du soleil. Quand le jeûnepeut altérer de façon significative la santédu jeûneur ou quand celui-ci est malade,l’islam le dispense du jeûne. « Allah cher-che à vous faciliter l’accomplissement de larègle, il ne cherche pas à vous la rendre dif-ficile ». Sourate 2, La Génisse , verset 185[1].
Le diabète étant une maladie chronique,le non-accomplissement du jeûne est au-torisé par la religion. Le plus souvent, lesdiabétiques traités à l’insuline acceptentfacilement de ne pas jeûner alors que lesdiabétiques traités par le régime seul ou/etpar les antidiabétiques oraux sont souventréticents et décident de jeûner [1-3].
Le jeûne pratiqué par les musulmans aucours du mois de ramadan se caractérisepar une privation aussi bien hydriquequ’énergétique concomitante dont la duréen’excède pas 14 heures par jour, répétéependant un mois. Il diffère du jeûne phy-siologique normal par sa position dans lecycle nycthéméral puisqu’il correspond à lapériode où l’organisme est habitué à êtreravitaillé en énergie et/ou ses besoins sontles plus forts et il diffère donc du jeûne de
longue durée par sa périodicité et sa courtedurée.
Les apports alimentaires sont exclu-sivement nocturnes et caractérisés par unrepas copieux à la rupture du jeûne avec unrepas léger à l’aube à base de sucres lents[3,4]. Ces modifications du comportementalimentaire sont accompagnées de change-ments du rythme de vie et de perturbationsdu cycle du sommeil. En effet, au cours dumois de ramadan, le début du sommeil estdécalé à 0 ± 1 heure alors qu’il a lieu vers22 h en dehors du ramadan, et le réveil ma-tinal est retardé de 2 heures en moyenne[5]. Peu d’études ont été publiées sur leseffets du jeûne et sa tolérance chez lesdiabétiques de type 2, et en particulier leseffets du jeûne sur les modifications deslipides plasmatiques et sur les habitudes etla consommation alimentaire [2,6-8].
Les objectifs de notre étude sontd’analyser les conséquences du jeûne dumois de ramadan sur le poids, la tensionartérielle, le contrôle glycémique et les lipo-protéines plasmatiques chez des diabé-tiques de type 2 bien équilibrés sousantidiabétiques oraux, et d’étudier les mo-difications qualitatives et quantitatives desapports alimentaires et leur influence surles lipoprotéines, en particulier sur lecholestérol HDL.
MéthodesC’est une étude descriptive comparative in-cluant 25 diabétiques de type 2 ayant décidéde jeûner le mois de ramadan et accepté dese soumettre à notre protocole. Tous lespatients ont observé le jeûne pendant tout lemois de ramadan, qui a coïncidé avec lapériode allant du 10 décembre 1999 au10 janvier 2000. Le jeûne débutait alors en-tre 5 h et 5 h 30 le matin et finissait vers 17h 30, soit une durée moyenne de 12 heures.
26 Les effets mÈtaboliques.pmd 3/3/2005, 12:17 AM1100
Eastern Mediterranean Health Journal, Vol. 9, Nos 5/6, 2003 1101
Les critères d’inclusion concernent desdiabétiques de type 2 traités par régime et/ou traitement oral (glycémie à jeun< 10 mmol/L et glycémie post-prandiale< 11 mmol/L), d’âge inférieur à 60 ans etindemnes de complications dégénérativesgraves.
Les critères d’exclusion sont un mau-vais équilibre du diabète, la présence d’unehypertension artérielle et/ou d’une hyperli-poprotéinémie, et le risque d’hypoglycémiegrave.
Nos patients sont évalués sur trois pé-riodes différentes : la première période(T0), 20 à 30 jours avant le début du moisde ramadan ; la 2e période (T1), entre le 25e
et le 27e jour du mois de ramadan ; et la 3e
période (T2), 20 jours après la fin du moisde ramadan.
L’adhésion au protocole : les patientssont recrutés 30 jours avant le début dumois de ramadan et le protocole estprésenté et discuté avec chaque patient. Lerecrutement a concerné 25 patients ayantaccepté de se soumettre aux différentesphases du protocole. Ces patients habitentdans le district de la ville de Tunis. Dix-huit(18) patients (8 femmes et 10 hommes)seulement ont participé aux 3 phases duprotocole et ont rempli soigneusement lesenquêtes alimentaires du point de vuequalitatif et quantitatif. L’âge moyen est de46,4 ± 8 ans et l’indice de masse corporellede 27,1 ± 3 kg/m². Seize (16) de nospatients sont traités par les antidiabétiquesoraux (89 %) et 2 par régime seul (11 %).La durée connue du diabète est de 6 ± 2ans ; la pression artérielle systolique est enmoyenne 129 ± 16 mmHg et la pressionartérielle diastolique est en moyenne de76 ± 8 mmHg. Le poids moyen est de70,5 ± 17,7 kg.
Le jeûne pratiqué par les musulmans aucours du mois de ramadan se caractérisepar une privation aussi bien hydrique
qu’énergétique concomitante dont la duréeest de 12 heures en moyenne par jour,répétée pendant un mois.
Au cours du mois de ramadan, les médi-caments sont pris soit le soir, soit en fin denuit à l’aube au moment du souhour quiconsiste en une collation à base de glucideslents. La posologie habituelle des bi-guanides est répartie en 2 prises,au souhour et à la rupture du jeûne. Pour lessulfamides, la dose habituelle du soir estmaintenue juste avant la rupture du jeûne, ladose habituelle du matin est priseau souhour, la dose de midi est supprimée.
L’examen clinique a précisé le poids, lapression artérielle systolique et diastoliqueavec la recherche de corps cétoniques dansles urines et des signes d’hypoglycémie parle même médecin au cours des troispériodes. Tous ces paramètres ont éténotés sur une fiche clinique aux différentstemps de l’étude.
L’enquête nutritionnelle utilise la mé-thode du semainier. Les patients ont répon-du aux 3 enquêtes alimentaires à T0, T1 etT2 en enregistrant eux-mêmes par écrit etde façon minutieuse pendant 3 jours con-sécutifs la nature et la quantité des alimentsingérés ainsi que l’horaire de prise des re-pas. Chaque enregistrement a été validé parla même diététicienne et le bilan nutritionnelest traité grâce au logiciel Bilnut [©Nu-trisoft].
Les paramètres biologiques étudiés sontla glycémie, l’hémoglobine A1c, la fruc-tosamine, l’uricémie, la créatininémie, laprotidémie et les paramètres lipidiques :cholestérol total, triglycérides, cholestérolHDL, cholestérol LDL, apolipoprotéinesAI, apolipoprotéines B. Ils ont été réalisésau cours des 3 périodes. Les prélèvementssont tous réalisés après un jeûne d’aumoins 12 heures. Au cours du mois de ra-madan, le souhour, qui représente la der-
26 Les effets mÈtaboliques.pmd 3/3/2005, 12:17 AM1101
1102 La Revue de Santé de la Méditerranée orientale, Vol. 9, No 5/6, 2003
nière prise alimentaire, est consomméobligatoirement à minuit la veille du prélève-ment pour pouvoir pratiquer les analyses lelendemain à midi en respectant les 12 heu-res de jeûne.
Le dosage de la glycémie est fait par laméthode enzymatique à la glucose oxydase(Kit Hycel sur analyseur LISA-HYCEL).L’hémoglobine A1c a été déterminée parchromatographie échangeuse d’ions surdes microcolonnes Biosystem.
La fructosamine a été dosée par laméthode cinétique colorimétrique deJohnson (Kit Biosystem adapté sur analy-seur LISA-HYCEL).
La créatinine a été dosée par méthodecinétique colorimétrique de Jaffé (Kit Hycel– analyseur LISA-HYCEL).
L’acide urique, le cholestérol total et lestriglycérides ont été dosés par méthodesenzymatiques (Kits Hycel adaptés sur ana-lyseur LISA-HYCEL).
Le cholestérol HDL a été dosé parprécipitation sélective (Kit Randox) et lecholestérol LDL a été calculé selon la for-mule de Friedwald. Les apolipoprotéines AIet B ont été dosées par immunoturbidimé-trie (Kit Hycel adapté sur analyseur LISA-HYCEL).
Les différents paramètres sont saisis àl’aide d’un logiciel Epi Info et exprimés enmoyenne ± écart-type. On a utilisél’analyse de variance (ANOVA) et les testsnon paramétriques de Kruskal-Wallis pourla comparaison des moyennes et le test dukhi-carré pour la comparaison desfréquences.
RésultatsParamètres cliniques Le jeûne du mois de ramadan n’a pas eud’influence statistiquement significative surle poids, sur la pression artérielle systolique(PAS) et diastolique (PAD). Ces constantes
sont restées stables au cours du jeûne et3 semaines après la fin du mois de ramadan(Tableau 1).
Contrôle glycémique Aucun incident ni accident n’a été signalépar les patients au cours du jeûne du moisde ramadan ; la glycémie à jeun est restéestable accompagnée d’une légère augmen-tation du taux de fructosamine et del’hémoglobine A1c pendant ramadan maiscette différence n’est pas statistiquementsignificative (Tableau 2).
L’analyse de l’équilibre glycémiqueselon le type de traitement ne montre pas devariations de la glycémie à jeun et del’hémoglobine A1c selon le type de traite-ment.
Paramètres lipidiques Les taux de cholestérol total et des trigly-cérides n’ont pas significativement changépendant le mois de ramadan.
Le cholestérol total est de 4,24 ±1 mmol/L à T0 , 4,45 ± 1 mmol/L à T1 et4,30 ± 1 mmol/L à T2. Le cholestérol HDLa subi une légère augmentation (Tableau 3).
L’étude des variations en pourcentagedes lipoprotéines montre une augmentationde + 8,3 % du taux de cholestérol HDL à lafin du mois de ramadan (T1 - T0), qui se
Tableau 1 Evolution des paramètres cliniques
Paramètres T0 T1 T2cliniques
Poids (kg) 70,5 ± 17 70 ± 17 70 ±18
PAS (mmHg) 129 ± 16 131 ± 17 131 ± 18
PAD (mmHg) 76 ± 8 68 ± 7 79 ± 7
IMC (kg/m²) 27,12 ± 8,76) 27,0 ± 8 27,0 ± 8
T0 : 3 semaines avant ramadan ; T1 : 25e-27e jourdu ramadan ; T2 : 20 jours après la fin duramadan.
26 Les effets mÈtaboliques.pmd 3/3/2005, 12:17 AM1102
Eastern Mediterranean Health Journal, Vol. 9, Nos 5/6, 2003 1103
maintient 20 jours après la fin du jeûne àplus de 13 % (T2 - T0). Le cholestérol LDLa augmenté de 3 % au cours du mois deramadan (T1 - T0) et a diminué de 2 % 20jours après la fin du jeûne (T2 - T0) sansmodification significative du cholestérol to-tal. Ces modifications ne sont pas statis-tiquement significatives (Tableau 4).
Evolution des apportsalimentaires L’apport calorique total pendant le mois deramadan diminue de façon substantielle et
passe de 2084 ± 515 calories par jour à T0,à 1981 ± 464 calories par jour à T1 et à2183 ± 485 calories à T2 ; mais cette mo-dification n’est pas statistiquement signifi-cative et ne s’accompagne pas de variationdu poids.
Cette diminution de l’apport caloriques’accompagne d’une diminution de lafréquence des prises alimentaires, qui estpassée de 4,5 ± 0,8/j à 2,8 ± 0,5/j. La plusgrande part de la ration énergétique totaleest consommée au moment même de larupture du jeûne. Concernant l’évolution del’apport des différents nutriments, on nenote pas de variation pour les glucides(229,8 ± 65 g ; 231,8 g ± 62 g et 249 ±67 g respectivement avant, pendant etaprès ramadan). De même, les lipides et lesprotides n’ont pas subi de variation.
L’apport protidique est de 75,72 ± 17 gavant ramadan et de 73,9 ± 17 g au coursdu mois de ramadan et passe à 78,9 ± 18 gaprès ramadan mais il se produit une netteaugmentation de l’apport en protéines ani-males par rapport aux protéines végétalespendant ramadan avec un rapport protéinesanimales/protéines végétales qui passe de1,87 avant ramadan à 2,07 au cours dumois de ramadan. L’apport alimentaire encholestérol a augmenté en moyenne de40 % au cours du jeûne. Il est passé de301 mg/j à 435 mg/j (Tableau 5) alors que
Tableau 2 Evolution des paramètresmétaboliques
Paramètres T0 T1 T2métaboliques
Glycémie à jeun(mmol/L) 9,6 ± 3 9,8 ± 3 8,5 ± 3
HbA1c (%) 9,2 ± 2,4 10,7 ± 1,2 8,5 ± 2,3
Fructosamine(µmol/L) 288,7 ± 50 303 ± 60 291 ± 75
Créatinine(µmol/L) 66 ± 13 67 ± 11 73 ± 13
Acide urique(µmol/L) 254 ± 64 252 ± 66 280 ± 68
T0 : 3 semaines avant ramadan ;T1 : 25e-27e jourdu ramadan ; T2 : 20 jours après la fin duramadan.
Tableau 3 Modifications des paramètres lipidiques
Paramètres lipidiques T0 T1 T2
Cholestérol (mmol/L) Total 4,24 ± 1 4,45 ± 1 4,30 ± 1
HDL 1,05 ± 0,3 1,11 ± 0,2 1,16 ± 0,4
LDL 2,81 ± 1 2,89 ± 0,8 2,76 ± 0,9
Apolipoprotéines (g/L) A I 1,54 ± 0,3 1,58 ± 0,3 1,52 ± 0,3
B 1,22 ± 0,2 1,33 ± 0,3 1,18 ± 0,3
Triglycérides (mmol/L) 0,83 ± 0,5 0,82 ± 0,5 0,87 ± 0,5
26 Les effets mÈtaboliques.pmd 3/3/2005, 12:17 AM1103
1104 La Revue de Santé de la Méditerranée orientale, Vol. 9, No 5/6, 2003
l’apport lipidique a diminué au cours dumois de ramadan ; il est de 85 ± 22 g/j pen-dant ramadan alors qu’il était de 95,5 g ± 31g/j avant le mois de ramadan.
Apports alimentaires encholestérol et variation ducholestérol HDLDans le groupe consommant moins de400 mg/j de cholestérol pendant ramadan,le taux moyen de cholestérol HDL avant ra-madan est de 1,12 ± 0,37 mmol/L et passerespectivement à 1,22 ± 0,27 mmol/L à lafin du mois de ramadan (soit 13,5 %d’augmentation) et à 1,36 ± 0,45 mmol/L20 jours après la fin du mois de ramadan(20 % d’augmentation). Le groupe des pa-tients consommant plus de 400 mg/j decholestérol (Tableaux 6 et 7) n’ont pasbénéficié de cette augmentation du taux de
Tableau 4 Variation en pourcentage deslipoprotéines
Lipoprotéines T1-T0 (%) T2-T0 (%)
Cholestérol HDL + 8,3 ± 17,7 + 13 ± 22
Cholestérol LDL + 3 - 2
T0 : 3 semaines avant ramadan ; T1 : 25e-27e jourdu ramadan ; T2 : 20 jours après la fin duramadan.
Tableau 5 Evolution de l’apport calorique global et desdifférents nutriments
Nutriments T0 T1 T2
Fréquence des repas 4,5 ± 0,8 2,8 ± 0,5 3,8 ±0,9
Apport caloriqueglobal (kcal/j) 2084 ± 515 1981 ± 464 2183 ± 485
Glucides (%) 41 ± 7 39 ± 5 40 ± 7
Glucides (g/j) 229,8 ± 65 231,8 ± 62 249,6 ± 67
Protides (%) 15 ± 2 15 ± 2 14 ± 2
Protides (g/j) 75,72 ± 17 73,9 ± 17 78,9 ± 18
Rapport protéinesanimales/végétales 1,87 ± 0,6 2,07 ± 0,68 1,77 ± 0,66
Lipides totaux (g/j) 95,5 ± 31 85,0 ± 22 96,6 ± 30
Lipides totaux (%) 44 46 46
AGS g/j (%) 28,1 (29) 25,3 (30) 28,4 (29)
AGM g/j (%) 45,1 (48) 40 (47) 45,3 (47)
AGP g/j (%) 21,1 (23) 19,8 (23) 23 (24)
Cholestérol alimentaire(mg/j) 301 ± 138 435 ± 204 320 ±159
T0 : 3 semaines avant ramadan ; T1 : 25e-27e jour du ramadan ;T2 : 20 jours après la fin du ramadan.AGS : acides gras saturés.AGM : acides gras monoinsaturés.AGP : acides polyinsaturés.
26 Les effets mÈtaboliques.pmd 3/3/2005, 12:17 AM1104
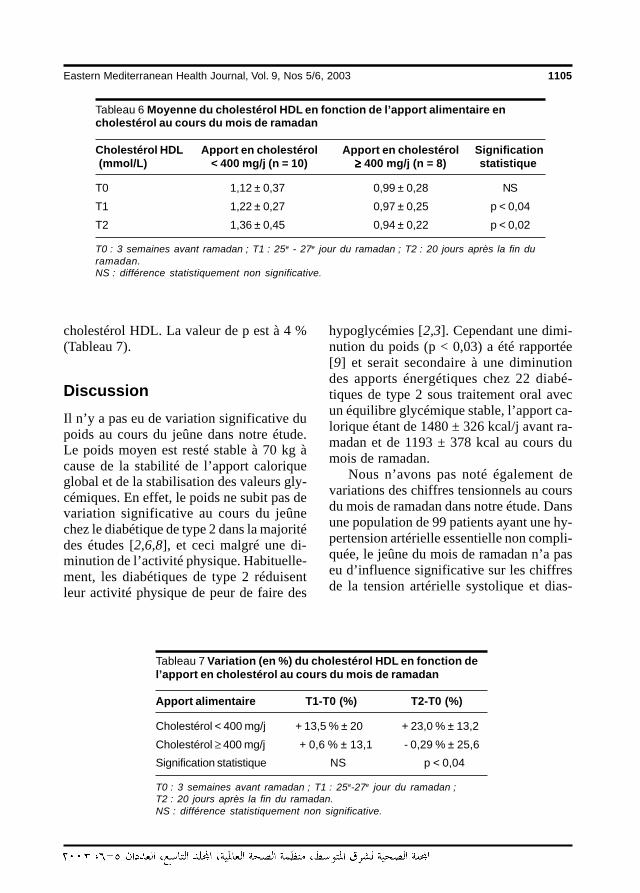
Eastern Mediterranean Health Journal, Vol. 9, Nos 5/6, 2003 1105
cholestérol HDL. La valeur de p est à 4 %(Tableau 7).
Discussion Il n’y a pas eu de variation significative dupoids au cours du jeûne dans notre étude.Le poids moyen est resté stable à 70 kg àcause de la stabilité de l’apport caloriqueglobal et de la stabilisation des valeurs gly-cémiques. En effet, le poids ne subit pas devariation significative au cours du jeûnechez le diabétique de type 2 dans la majoritédes études [2,6,8], et ceci malgré une di-minution de l’activité physique. Habituelle-ment, les diabétiques de type 2 réduisentleur activité physique de peur de faire des
hypoglycémies [2,3]. Cependant une dimi-nution du poids (p < 0,03) a été rapportée[9] et serait secondaire à une diminutiondes apports énergétiques chez 22 diabé-tiques de type 2 sous traitement oral avecun équilibre glycémique stable, l’apport ca-lorique étant de 1480 ± 326 kcal/j avant ra-madan et de 1193 ± 378 kcal au cours dumois de ramadan.
Nous n’avons pas noté également devariations des chiffres tensionnels au coursdu mois de ramadan dans notre étude. Dansune population de 99 patients ayant une hy-pertension artérielle essentielle non compli-quée, le jeûne du mois de ramadan n’a paseu d’influence significative sur les chiffresde la tension artérielle systolique et dias-
Tableau 7 Variation (en %) du cholestérol HDL en fonction del’apport en cholestérol au cours du mois de ramadan
Apport alimentaire T1-T0 (%) T2-T0 (%)
Cholestérol < 400 mg/j + 13,5 % ± 20 + 23,0 % ± 13,2
Cholestérol ≥ 400 mg/j + 0,6 % ± 13,1 - 0,29 % ± 25,6
Signification statistique NS p < 0,04
T0 : 3 semaines avant ramadan ; T1 : 25e-27e jour du ramadan ;T2 : 20 jours après la fin du ramadan.NS : différence statistiquement non significative.
Tableau 6 Moyenne du cholestérol HDL en fonction de l’apport alimentaire encholestérol au cours du mois de ramadan
Cholestérol HDL Apport en cholestérol Apport en cholestérol Signification (mmol/L) < 400 mg/j (n = 10) ≥≥≥≥≥ 400 mg/j (n = 8) statistique
T0 1,12 ± 0,37 0,99 ± 0,28 NS
T1 1,22 ± 0,27 0,97 ± 0,25 p < 0,04
T2 1,36 ± 0,45 0,94 ± 0,22 p < 0,02
T0 : 3 semaines avant ramadan ; T1 : 25e - 27e jour du ramadan ; T2 : 20 jours après la fin duramadan.NS : différence statistiquement non significative.
26 Les effets mÈtaboliques.pmd 3/3/2005, 12:17 AM1105
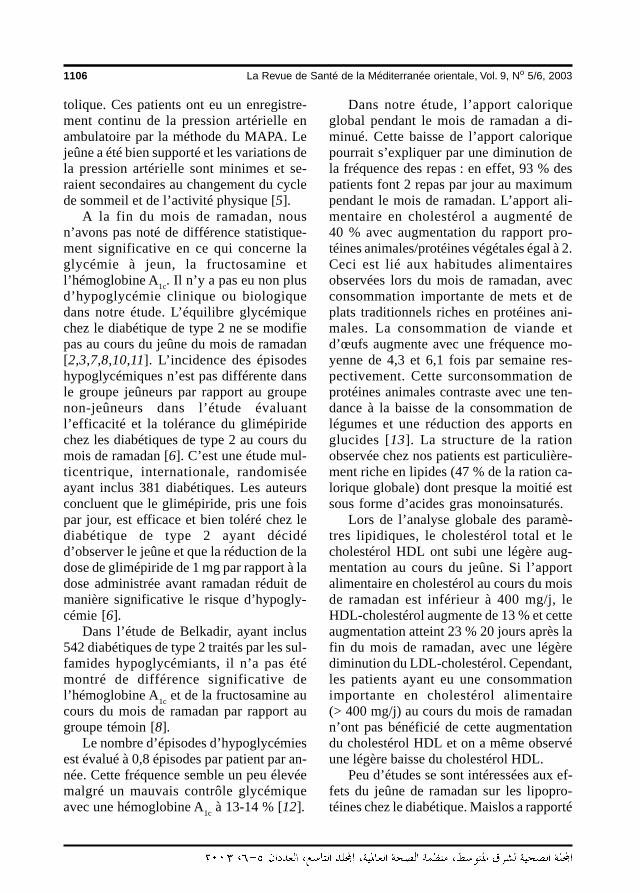
1106 La Revue de Santé de la Méditerranée orientale, Vol. 9, No 5/6, 2003
tolique. Ces patients ont eu un enregistre-ment continu de la pression artérielle enambulatoire par la méthode du MAPA. Lejeûne a été bien supporté et les variations dela pression artérielle sont minimes et se-raient secondaires au changement du cyclede sommeil et de l’activité physique [5].
A la fin du mois de ramadan, nousn’avons pas noté de différence statistique-ment significative en ce qui concerne laglycémie à jeun, la fructosamine etl’hémoglobine A1c. Il n’y a pas eu non plusd’hypoglycémie clinique ou biologiquedans notre étude. L’équilibre glycémiquechez le diabétique de type 2 ne se modifiepas au cours du jeûne du mois de ramadan[2,3,7,8,10,11]. L’incidence des épisodeshypoglycémiques n’est pas différente dansle groupe jeûneurs par rapport au groupenon-jeûneurs dans l’étude évaluantl’efficacité et la tolérance du glimépiridechez les diabétiques de type 2 au cours dumois de ramadan [6]. C’est une étude mul-ticentrique, internationale, randomiséeayant inclus 381 diabétiques. Les auteursconcluent que le glimépiride, pris une foispar jour, est efficace et bien toléré chez lediabétique de type 2 ayant décidéd’observer le jeûne et que la réduction de ladose de glimépiride de 1 mg par rapport à ladose administrée avant ramadan réduit demanière significative le risque d’hypogly-cémie [6].
Dans l’étude de Belkadir, ayant inclus542 diabétiques de type 2 traités par les sul-famides hypoglycémiants, il n’a pas étémontré de différence significative del’hémoglobine A1c et de la fructosamine aucours du mois de ramadan par rapport augroupe témoin [8].
Le nombre d’épisodes d’hypoglycémiesest évalué à 0,8 épisodes par patient par an-née. Cette fréquence semble un peu élevéemalgré un mauvais contrôle glycémiqueavec une hémoglobine A1c à 13-14 % [12].
Dans notre étude, l’apport caloriqueglobal pendant le mois de ramadan a di-minué. Cette baisse de l’apport caloriquepourrait s’expliquer par une diminution dela fréquence des repas : en effet, 93 % despatients font 2 repas par jour au maximumpendant le mois de ramadan. L’apport ali-mentaire en cholestérol a augmenté de40 % avec augmentation du rapport pro-téines animales/protéines végétales égal à 2.Ceci est lié aux habitudes alimentairesobservées lors du mois de ramadan, avecconsommation importante de mets et deplats traditionnels riches en protéines ani-males. La consommation de viande etd’œufs augmente avec une fréquence mo-yenne de 4,3 et 6,1 fois par semaine res-pectivement. Cette surconsommation deprotéines animales contraste avec une ten-dance à la baisse de la consommation delégumes et une réduction des apports englucides [13]. La structure de la rationobservée chez nos patients est particulière-ment riche en lipides (47 % de la ration ca-lorique globale) dont presque la moitié estsous forme d’acides gras monoinsaturés.
Lors de l’analyse globale des paramè-tres lipidiques, le cholestérol total et lecholestérol HDL ont subi une légère aug-mentation au cours du jeûne. Si l’apportalimentaire en cholestérol au cours du moisde ramadan est inférieur à 400 mg/j, leHDL-cholestérol augmente de 13 % et cetteaugmentation atteint 23 % 20 jours après lafin du mois de ramadan, avec une légèrediminution du LDL-cholestérol. Cependant,les patients ayant eu une consommationimportante en cholestérol alimentaire(> 400 mg/j) au cours du mois de ramadann’ont pas bénéficié de cette augmentationdu cholestérol HDL et on a même observéune légère baisse du cholestérol HDL.
Peu d’études se sont intéressées aux ef-fets du jeûne de ramadan sur les lipopro-téines chez le diabétique. Maislos a rapporté
26 Les effets mÈtaboliques.pmd 3/3/2005, 12:17 AM1106
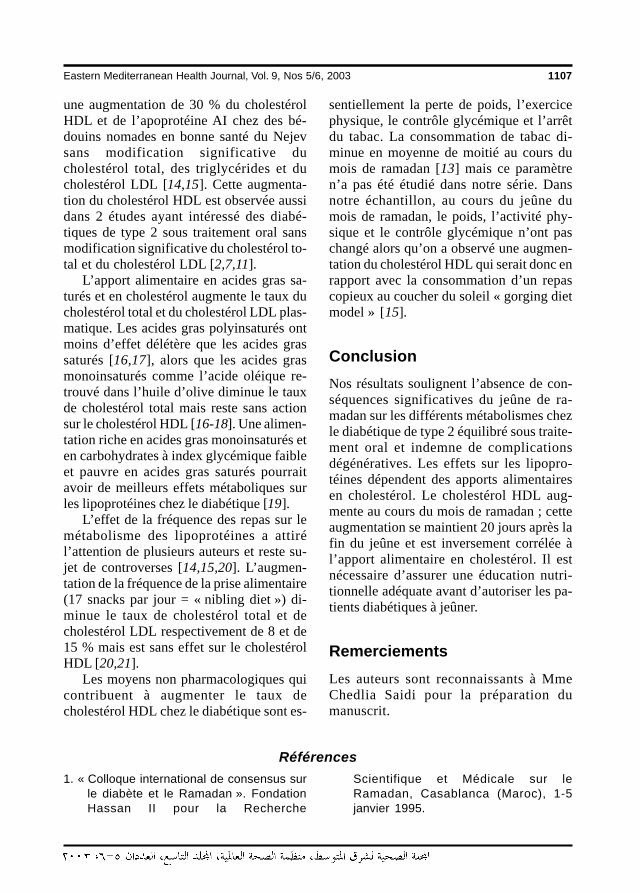
Eastern Mediterranean Health Journal, Vol. 9, Nos 5/6, 2003 1107
une augmentation de 30 % du cholestérolHDL et de l’apoprotéine AI chez des bé-douins nomades en bonne santé du Nejevsans modification significative ducholestérol total, des triglycérides et ducholestérol LDL [14,15]. Cette augmenta-tion du cholestérol HDL est observée aussidans 2 études ayant intéressé des diabé-tiques de type 2 sous traitement oral sansmodification significative du cholestérol to-tal et du cholestérol LDL [2,7,11].
L’apport alimentaire en acides gras sa-turés et en cholestérol augmente le taux ducholestérol total et du cholestérol LDL plas-matique. Les acides gras polyinsaturés ontmoins d’effet délétère que les acides grassaturés [16,17], alors que les acides grasmonoinsaturés comme l’acide oléique re-trouvé dans l’huile d’olive diminue le tauxde cholestérol total mais reste sans actionsur le cholestérol HDL [16-18]. Une alimen-tation riche en acides gras monoinsaturés eten carbohydrates à index glycémique faibleet pauvre en acides gras saturés pourraitavoir de meilleurs effets métaboliques surles lipoprotéines chez le diabétique [19].
L’effet de la fréquence des repas sur lemétabolisme des lipoprotéines a attirél’attention de plusieurs auteurs et reste su-jet de controverses [14,15,20]. L’augmen-tation de la fréquence de la prise alimentaire(17 snacks par jour = « nibling diet ») di-minue le taux de cholestérol total et decholestérol LDL respectivement de 8 et de15 % mais est sans effet sur le cholestérolHDL [20,21].
Les moyens non pharmacologiques quicontribuent à augmenter le taux decholestérol HDL chez le diabétique sont es-
sentiellement la perte de poids, l’exercicephysique, le contrôle glycémique et l’arrêtdu tabac. La consommation de tabac di-minue en moyenne de moitié au cours dumois de ramadan [13] mais ce paramètren’a pas été étudié dans notre série. Dansnotre échantillon, au cours du jeûne dumois de ramadan, le poids, l’activité phy-sique et le contrôle glycémique n’ont paschangé alors qu’on a observé une augmen-tation du cholestérol HDL qui serait donc enrapport avec la consommation d’un repascopieux au coucher du soleil « gorging dietmodel » [15].
ConclusionNos résultats soulignent l’absence de con-séquences significatives du jeûne de ra-madan sur les différents métabolismes chezle diabétique de type 2 équilibré sous traite-ment oral et indemne de complicationsdégénératives. Les effets sur les lipopro-téines dépendent des apports alimentairesen cholestérol. Le cholestérol HDL aug-mente au cours du mois de ramadan ; cetteaugmentation se maintient 20 jours après lafin du jeûne et est inversement corrélée àl’apport alimentaire en cholestérol. Il estnécessaire d’assurer une éducation nutri-tionnelle adéquate avant d’autoriser les pa-tients diabétiques à jeûner.
RemerciementsLes auteurs sont reconnaissants à MmeChedlia Saidi pour la préparation dumanuscrit.
Références
1. « Colloque international de consensus surle diabète et le Ramadan ». FondationHassan II pour la Recherche
Scientifique et Médicale sur leRamadan, Casablanca (Maroc), 1-5janvier 1995.
26 Les effets mÈtaboliques.pmd 3/3/2005, 12:17 AM1107
1108 La Revue de Santé de la Méditerranée orientale, Vol. 9, No 5/6, 2003
2. Azizi F, Siahkolah B. Ramadan fastingand diabetes mellitus. International jour-nal of Ramadan fasting research, 1998,2:8–17.
3. Sulimani RA, Famuyiwa FO, Laajam MA.Diabetes mellitus and Ramadan fasting:the need for a critical appraisal. Diabeticmedicine, 1988, 5:589–91.
4. Nomani MZA. Diet during Ramadan. In-ternational journal of Ramadan fastingresearch, 1999, 3:1–6.
5. Habbal R et al. Variations of blood pres-sure during the month of Ramadan. Ar-chives des Maladies Cœur et Vaisseaux,1998, 91(8):995–8.
6. Ababou R et al. Evaluation de l’efficacitéet de la tolérance du glimépiride chezdes diabétiques de type 2 en période dejeûne au cours du mois de Ramadan.Abstract : Congrès Panarabe d’Endocri-nologie et Diabétologie, 20 octobre1999, Beyrouth (Liban).
7. Farad-Bensenouci S, Maillot F, Lamisse F.Les risques du Ramadan chez les sujetssains et les patients diabétiques.Cahiers de Nutrition et de Diététique,2002, 37:96–103.
8. Belkhadir J, El Ghomari H, Kloiker N.Muslims with non insulin-dependent dia-betes fasting during Ramadan: treat-ment with Glibenclamide. British medicaljournal, 1993, 307:292–5.
9. Mafausy M et al. A study of the fastingdiabetic patients during the month ofRamadan. Medical journal of Malaya,1990, 45:14–7.
10. Davidson JC. Muslims, Ramadan anddiabetes mellitus. British medical jour-nal, 1979, 2:1511–2.
11. Uysal AR, Erdogan MF, Sahin G. Clinicaland metabolic effects of fasting in 41type 2 diabetic patients during Ra-madan. Diabetes care, 1998, 21(11):2033–4.
12. Gold A, Macleold K, Frier B. Drug treat-ment during Ramadan: don’t be compla-cent about diabetes. British medicaljournal, 1993, 307:800–1.
13. Ennigrou S. Ramadan et habitudes devie : Enquête auprès de 84 adultesrésidant dans le district de Tunis. LaTunisie Médicale, 2001, 79 (10):508–14.
14. Maislos M, Khamaysi N, Assali A.Marked increase in plasma high-den-sity-lipoprotein cholesterol after pro-longed fasting during Ramadan. Ame-rican journal of clinical nutrition, 1993,57:640–2.
15. Maislos M et al. Gorging and plasmaHDL-cholesterol – the Ramadan model.European journal of clinical nutrition,1998, 52(2):127–30.
16. Mahley RW, Weisgraber KH, Farese RV.Disorders of lipid metabolism. In: WilsonJD, ed. Williams textbook of endocrinol-ogy. Philadelphia, WB Saunders Com-pany, 1998:1138–44.
17. Hegsted M.D, Kritchevsky D. Diet andserum lipid concentrations: where arewe? American journal of clinical nutri-tion, 1997, 65:1983.
18. Nomani MZA. Dietary fat, blood choles-terol and uric acid levels duringRamadan fasting. International journalof Ramadan fasting research, 1997,1(1):1–6.
19. American Diabetes Association. Manage-ment of dyslipidemia in adults with dia-betes. Diabetes care, 2000, 23(suppl.1):S57–60.
20. Jenkins et al. Effect of nibbling versusgorging on cardiovascular risk factor se-rum uric acid and blood lipids. Metabo-lism, 1995, 44(4):549–55.
21. Jenkins AL et al. Nibbling versus gorg-ing: metabolic advantages of increasedmeal frequency. New England journal ofmedicine, 1989, 321:929–34.
26 Les effets mÈtaboliques.pmd 3/3/2005, 12:17 AM1108
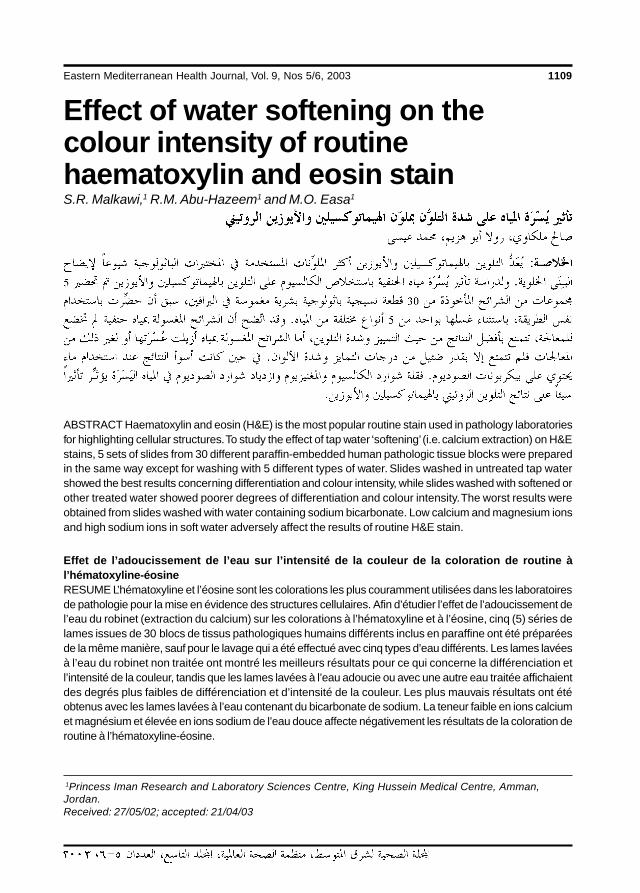
Eastern Mediterranean Health Journal, Vol. 9, Nos 5/6, 2003 1109
Effect of water softening on thecolour intensity of routinehaematoxylin and eosin stainS.R. Malkawi,1 R.M. Abu-Hazeem1 and M.O. Easa1
1Princess Iman Research and Laboratory Sciences Centre, King Hussein Medical Centre, Amman,Jordan.Received: 27/05/02; accepted: 21/04/03
ABSTRACT Haematoxylin and eosin (H&E) is the most popular routine stain used in pathology laboratoriesfor highlighting cellular structures. To study the effect of tap water ‘softening’ (i.e. calcium extraction) on H&Estains, 5 sets of slides from 30 different paraffin-embedded human pathologic tissue blocks were preparedin the same way except for washing with 5 different types of water. Slides washed in untreated tap watershowed the best results concerning differentiation and colour intensity, while slides washed with softened orother treated water showed poorer degrees of differentiation and colour intensity. The worst results wereobtained from slides washed with water containing sodium bicarbonate. Low calcium and magnesium ionsand high sodium ions in soft water adversely affect the results of routine H&E stain.
Effet de l’adoucissement de l’eau sur l’intensité de la couleur de la coloration de routine àl’hématoxyline-éosineRESUME L’hématoxyline et l’éosine sont les colorations les plus couramment utilisées dans les laboratoiresde pathologie pour la mise en évidence des structures cellulaires. Afin d’étudier l’effet de l’adoucissement del’eau du robinet (extraction du calcium) sur les colorations à l’hématoxyline et à l’éosine, cinq (5) séries delames issues de 30 blocs de tissus pathologiques humains différents inclus en paraffine ont été préparéesde la même manière, sauf pour le lavage qui a été effectué avec cinq types d’eau différents. Les lames lavéesà l’eau du robinet non traitée ont montré les meilleurs résultats pour ce qui concerne la différenciation etl’intensité de la couleur, tandis que les lames lavées à l’eau adoucie ou avec une autre eau traitée affichaientdes degrés plus faibles de différenciation et d’intensité de la couleur. Les plus mauvais résultats ont étéobtenus avec les lames lavées à l’eau contenant du bicarbonate de sodium. La teneur faible en ions calciumet magnésium et élevée en ions sodium de l’eau douce affecte négativement les résultats de la coloration deroutine à l’hématoxyline-éosine.
27 Effect of water softening.pmd 3/3/2005, 12:17 AM1109
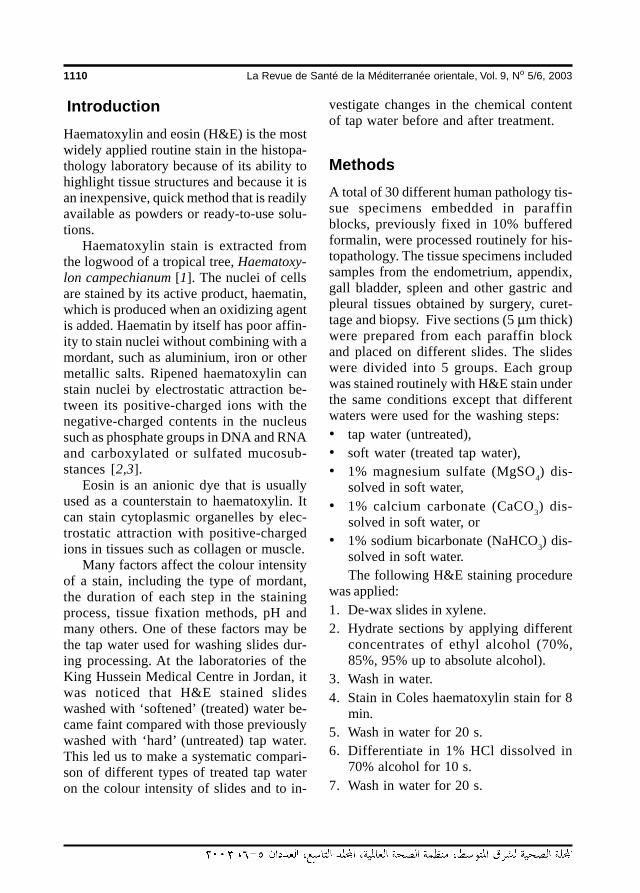
1110 La Revue de Santé de la Méditerranée orientale, Vol. 9, No 5/6, 2003
IntroductionHaematoxylin and eosin (H&E) is the mostwidely applied routine stain in the histopa-thology laboratory because of its ability tohighlight tissue structures and because it isan inexpensive, quick method that is readilyavailable as powders or ready-to-use solu-tions.
Haematoxylin stain is extracted fromthe logwood of a tropical tree, Haematoxy-lon campechianum [1]. The nuclei of cellsare stained by its active product, haematin,which is produced when an oxidizing agentis added. Haematin by itself has poor affin-ity to stain nuclei without combining with amordant, such as aluminium, iron or othermetallic salts. Ripened haematoxylin canstain nuclei by electrostatic attraction be-tween its positive-charged ions with thenegative-charged contents in the nucleussuch as phosphate groups in DNA and RNAand carboxylated or sulfated mucosub-stances [2,3].
Eosin is an anionic dye that is usuallyused as a counterstain to haematoxylin. Itcan stain cytoplasmic organelles by elec-trostatic attraction with positive-chargedions in tissues such as collagen or muscle.
Many factors affect the colour intensityof a stain, including the type of mordant,the duration of each step in the stainingprocess, tissue fixation methods, pH andmany others. One of these factors may bethe tap water used for washing slides dur-ing processing. At the laboratories of theKing Hussein Medical Centre in Jordan, itwas noticed that H&E stained slideswashed with ‘softened’ (treated) water be-came faint compared with those previouslywashed with ‘hard’ (untreated) tap water.This led us to make a systematic compari-son of different types of treated tap wateron the colour intensity of slides and to in-
vestigate changes in the chemical contentof tap water before and after treatment.
MethodsA total of 30 different human pathology tis-sue specimens embedded in paraffinblocks, previously fixed in 10% bufferedformalin, were processed routinely for his-topathology. The tissue specimens includedsamples from the endometrium, appendix,gall bladder, spleen and other gastric andpleural tissues obtained by surgery, curet-tage and biopsy. Five sections (5 µm thick)were prepared from each paraffin blockand placed on different slides. The slideswere divided into 5 groups. Each groupwas stained routinely with H&E stain underthe same conditions except that differentwaters were used for the washing steps:• tap water (untreated),• soft water (treated tap water),• 1% magnesium sulfate (MgSO4) dis-
solved in soft water,• 1% calcium carbonate (CaCO3) dis-
solved in soft water, or• 1% sodium bicarbonate (NaHCO3) dis-
solved in soft water.The following H&E staining procedure
was applied:1. De-wax slides in xylene.2. Hydrate sections by applying different
concentrates of ethyl alcohol (70%,85%, 95% up to absolute alcohol).
3. Wash in water.4. Stain in Coles haematoxylin stain for 8
min.5. Wash in water for 20 s.6. Differentiate in 1% HCl dissolved in
70% alcohol for 10 s.7. Wash in water for 20 s.
27 Effect of water softening.pmd 3/3/2005, 12:17 AM1110
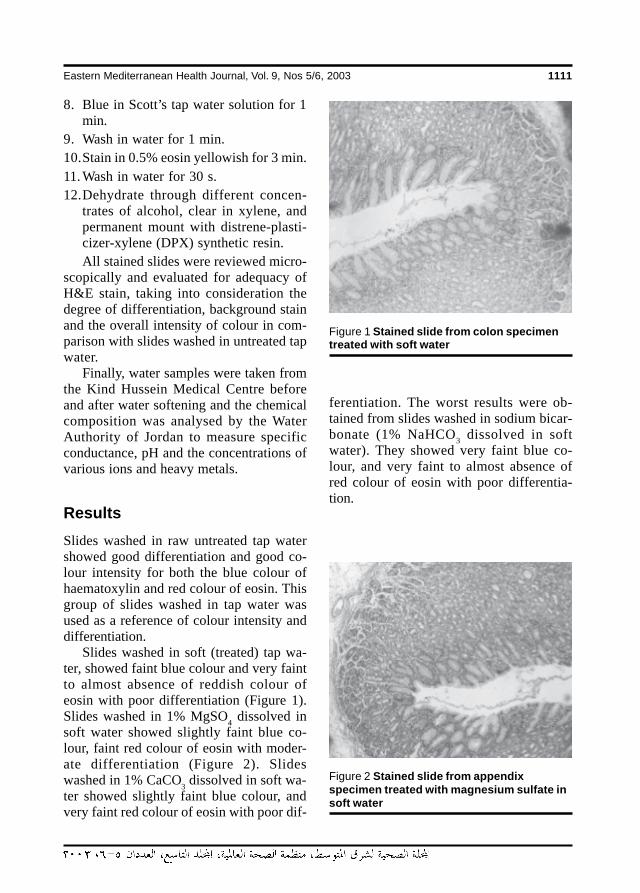
Eastern Mediterranean Health Journal, Vol. 9, Nos 5/6, 2003 1111
8. Blue in Scott’s tap water solution for 1min.
9. Wash in water for 1 min.10.Stain in 0.5% eosin yellowish for 3 min.11. Wash in water for 30 s.12.Dehydrate through different concen-
trates of alcohol, clear in xylene, andpermanent mount with distrene-plasti-cizer-xylene (DPX) synthetic resin.All stained slides were reviewed micro-
scopically and evaluated for adequacy ofH&E stain, taking into consideration thedegree of differentiation, background stainand the overall intensity of colour in com-parison with slides washed in untreated tapwater.
Finally, water samples were taken fromthe Kind Hussein Medical Centre beforeand after water softening and the chemicalcomposition was analysed by the WaterAuthority of Jordan to measure specificconductance, pH and the concentrations ofvarious ions and heavy metals.
ResultsSlides washed in raw untreated tap watershowed good differentiation and good co-lour intensity for both the blue colour ofhaematoxylin and red colour of eosin. Thisgroup of slides washed in tap water wasused as a reference of colour intensity anddifferentiation.
Slides washed in soft (treated) tap wa-ter, showed faint blue colour and very faintto almost absence of reddish colour ofeosin with poor differentiation (Figure 1).Slides washed in 1% MgSO4 dissolved insoft water showed slightly faint blue co-lour, faint red colour of eosin with moder-ate differentiation (Figure 2). Slideswashed in 1% CaCO3 dissolved in soft wa-ter showed slightly faint blue colour, andvery faint red colour of eosin with poor dif-
ferentiation. The worst results were ob-tained from slides washed in sodium bicar-bonate (1% NaHCO3 dissolved in softwater). They showed very faint blue co-lour, and very faint to almost absence ofred colour of eosin with poor differentia-tion.
Figure 1 Stained slide from colon specimentreated with soft water
Figure 2 Stained slide from appendixspecimen treated with magnesium sulfate insoft water
27 Effect of water softening.pmd 3/3/2005, 12:17 AM1111
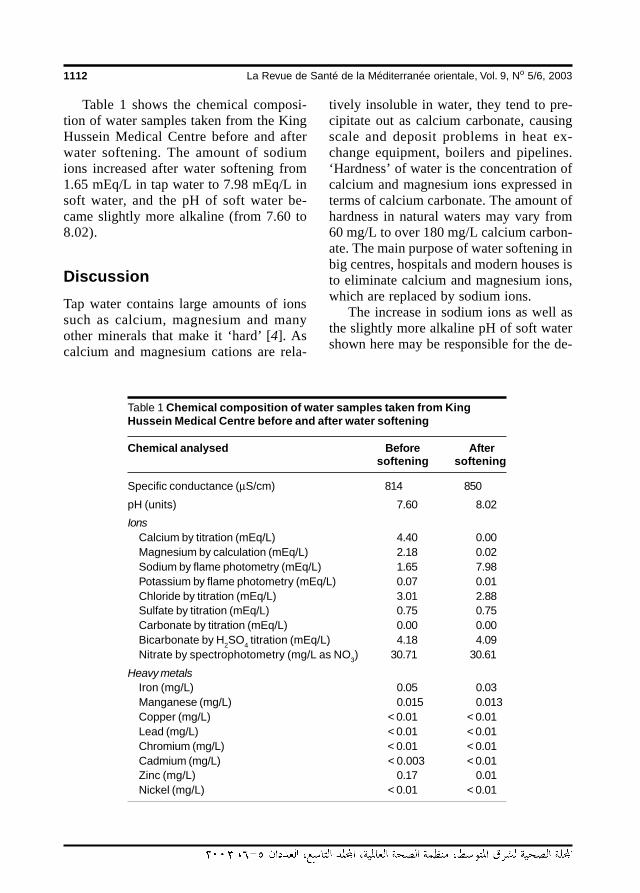
1112 La Revue de Santé de la Méditerranée orientale, Vol. 9, No 5/6, 2003
Table 1 shows the chemical composi-tion of water samples taken from the KingHussein Medical Centre before and afterwater softening. The amount of sodiumions increased after water softening from1.65 mEq/L in tap water to 7.98 mEq/L insoft water, and the pH of soft water be-came slightly more alkaline (from 7.60 to8.02).
DiscussionTap water contains large amounts of ionssuch as calcium, magnesium and manyother minerals that make it ‘hard’ [4]. Ascalcium and magnesium cations are rela-
Table 1 Chemical composition of water samples taken from KingHussein Medical Centre before and after water softening
Chemical analysed Before Aftersoftening softening
Specific conductance (µS/cm) 814 850
pH (units) 7.60 8.02
IonsCalcium by titration (mEq/L) 4.40 0.00Magnesium by calculation (mEq/L) 2.18 0.02Sodium by flame photometry (mEq/L) 1.65 7.98Potassium by flame photometry (mEq/L) 0.07 0.01Chloride by titration (mEq/L) 3.01 2.88Sulfate by titration (mEq/L) 0.75 0.75Carbonate by titration (mEq/L) 0.00 0.00Bicarbonate by H2SO4 titration (mEq/L) 4.18 4.09Nitrate by spectrophotometry (mg/L as NO3) 30.71 30.61
Heavy metalsIron (mg/L) 0.05 0.03Manganese (mg/L) 0.015 0.013Copper (mg/L) < 0.01 < 0.01Lead (mg/L) < 0.01 < 0.01Chromium (mg/L) < 0.01 < 0.01Cadmium (mg/L) < 0.003 < 0.01Zinc (mg/L) 0.17 0.01Nickel (mg/L) < 0.01 < 0.01
tively insoluble in water, they tend to pre-cipitate out as calcium carbonate, causingscale and deposit problems in heat ex-change equipment, boilers and pipelines.‘Hardness’ of water is the concentration ofcalcium and magnesium ions expressed interms of calcium carbonate. The amount ofhardness in natural waters may vary from60 mg/L to over 180 mg/L calcium carbon-ate. The main purpose of water softening inbig centres, hospitals and modern houses isto eliminate calcium and magnesium ions,which are replaced by sodium ions.
The increase in sodium ions as well asthe slightly more alkaline pH of soft watershown here may be responsible for the de-
27 Effect of water softening.pmd 3/3/2005, 12:17 AM1112
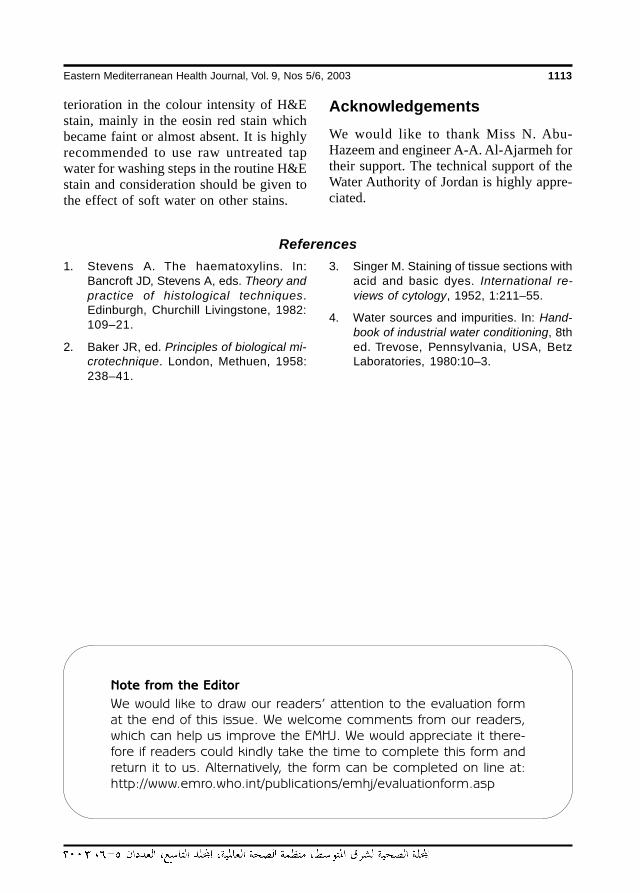
Eastern Mediterranean Health Journal, Vol. 9, Nos 5/6, 2003 1113
terioration in the colour intensity of H&Estain, mainly in the eosin red stain whichbecame faint or almost absent. It is highlyrecommended to use raw untreated tapwater for washing steps in the routine H&Estain and consideration should be given tothe effect of soft water on other stains.
AcknowledgementsWe would like to thank Miss N. Abu-Hazeem and engineer A-A. Al-Ajarmeh fortheir support. The technical support of theWater Authority of Jordan is highly appre-ciated.
References
1. Stevens A. The haematoxylins. In:Bancroft JD, Stevens A, eds. Theory andpractice of histological techniques.Edinburgh, Churchill Livingstone, 1982:109–21.
2. Baker JR, ed. Principles of biological mi-crotechnique. London, Methuen, 1958:238–41.
3. Singer M. Staining of tissue sections withacid and basic dyes. International re-views of cytology, 1952, 1:211–55.
4. Water sources and impurities. In: Hand-book of industrial water conditioning, 8thed. Trevose, Pennsylvania, USA, BetzLaboratories, 1980:10–3.
Note from the Editor
We would like to draw our readers’ attention to the evaluation format the end of this issue. We welcome comments from our readers,which can help us improve the EMHJ. We would appreciate it there-fore if readers could kindly take the time to complete this form andreturn it to us. Alternatively, the form can be completed on line at:http://www.emro.who.int/publications/emhj/evaluationform.asp
27 Effect of water softening.pmd 3/3/2005, 12:17 AM1113
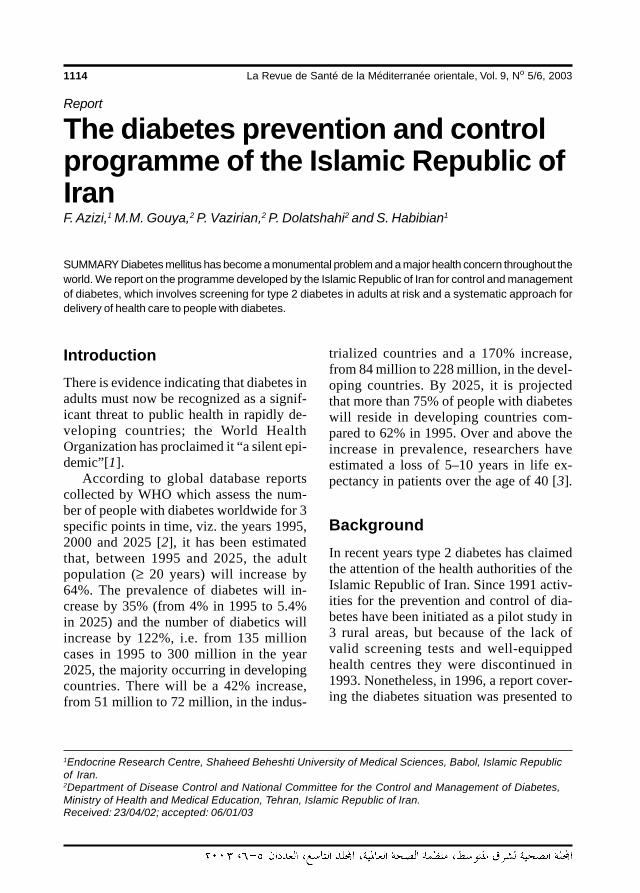
1114 La Revue de Santé de la Méditerranée orientale, Vol. 9, No 5/6, 2003
Report
The diabetes prevention and controlprogramme of the Islamic Republic ofIranF. Azizi,1 M.M. Gouya,2 P. Vazirian,2 P. Dolatshahi2 and S. Habibian1
1Endocrine Research Centre, Shaheed Beheshti University of Medical Sciences, Babol, Islamic Republicof Iran.2Department of Disease Control and National Committee for the Control and Management of Diabetes,Ministry of Health and Medical Education, Tehran, Islamic Republic of Iran.Received: 23/04/02; accepted: 06/01/03
SUMMARY Diabetes mellitus has become a monumental problem and a major health concern throughout theworld. We report on the programme developed by the Islamic Republic of Iran for control and managementof diabetes, which involves screening for type 2 diabetes in adults at risk and a systematic approach fordelivery of health care to people with diabetes.
IntroductionThere is evidence indicating that diabetes inadults must now be recognized as a signif-icant threat to public health in rapidly de-veloping countries; the World HealthOrganization has proclaimed it “a silent epi-demic”[1].
According to global database reportscollected by WHO which assess the num-ber of people with diabetes worldwide for 3specific points in time, viz. the years 1995,2000 and 2025 [2], it has been estimatedthat, between 1995 and 2025, the adultpopulation (≥ 20 years) will increase by64%. The prevalence of diabetes will in-crease by 35% (from 4% in 1995 to 5.4%in 2025) and the number of diabetics willincrease by 122%, i.e. from 135 millioncases in 1995 to 300 million in the year2025, the majority occurring in developingcountries. There will be a 42% increase,from 51 million to 72 million, in the indus-
trialized countries and a 170% increase,from 84 million to 228 million, in the devel-oping countries. By 2025, it is projectedthat more than 75% of people with diabeteswill reside in developing countries com-pared to 62% in 1995. Over and above theincrease in prevalence, researchers haveestimated a loss of 5–10 years in life ex-pectancy in patients over the age of 40 [3].
BackgroundIn recent years type 2 diabetes has claimedthe attention of the health authorities of theIslamic Republic of Iran. Since 1991 activ-ities for the prevention and control of dia-betes have been initiated as a pilot study in3 rural areas, but because of the lack ofvalid screening tests and well-equippedhealth centres they were discontinued in1993. Nonetheless, in 1996, a report cover-ing the diabetes situation was presented to
28 The diabetes prevention.pmd 3/3/2005, 12:18 AM1114
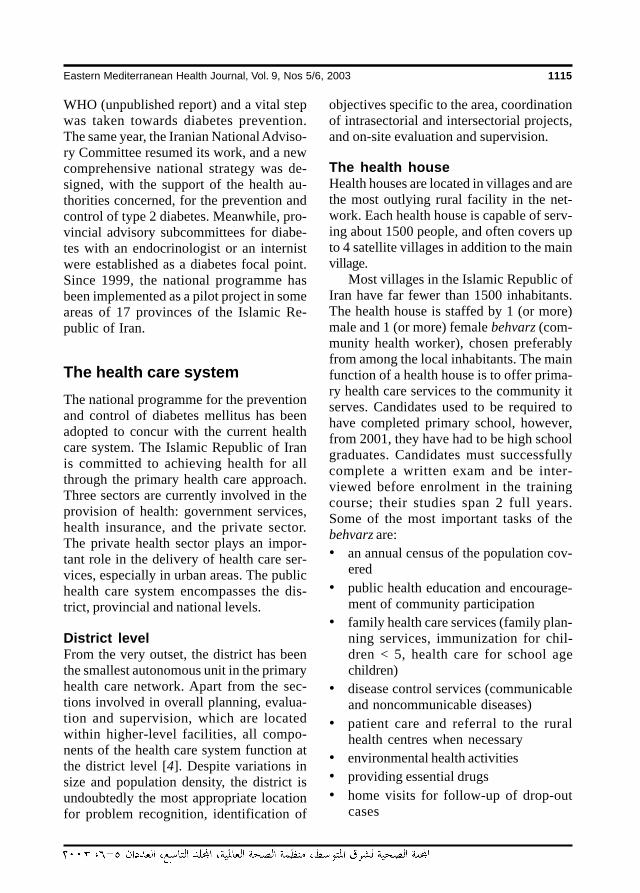
Eastern Mediterranean Health Journal, Vol. 9, Nos 5/6, 2003 1115
WHO (unpublished report) and a vital stepwas taken towards diabetes prevention.The same year, the Iranian National Adviso-ry Committee resumed its work, and a newcomprehensive national strategy was de-signed, with the support of the health au-thorities concerned, for the prevention andcontrol of type 2 diabetes. Meanwhile, pro-vincial advisory subcommittees for diabe-tes with an endocrinologist or an internistwere established as a diabetes focal point.Since 1999, the national programme hasbeen implemented as a pilot project in someareas of 17 provinces of the Islamic Re-public of Iran.
The health care systemThe national programme for the preventionand control of diabetes mellitus has beenadopted to concur with the current healthcare system. The Islamic Republic of Iranis committed to achieving health for allthrough the primary health care approach.Three sectors are currently involved in theprovision of health: government services,health insurance, and the private sector.The private health sector plays an impor-tant role in the delivery of health care ser-vices, especially in urban areas. The publichealth care system encompasses the dis-trict, provincial and national levels.
District levelFrom the very outset, the district has beenthe smallest autonomous unit in the primaryhealth care network. Apart from the sec-tions involved in overall planning, evalua-tion and supervision, which are locatedwithin higher-level facilities, all compo-nents of the health care system function atthe district level [4]. Despite variations insize and population density, the district isundoubtedly the most appropriate locationfor problem recognition, identification of
objectives specific to the area, coordinationof intrasectorial and intersectorial projects,and on-site evaluation and supervision.
The health houseHealth houses are located in villages and arethe most outlying rural facility in the net-work. Each health house is capable of serv-ing about 1500 people, and often covers upto 4 satellite villages in addition to the mainvillage.
Most villages in the Islamic Republic ofIran have far fewer than 1500 inhabitants.The health house is staffed by 1 (or more)male and 1 (or more) female behvarz (com-munity health worker), chosen preferablyfrom among the local inhabitants. The mainfunction of a health house is to offer prima-ry health care services to the community itserves. Candidates used to be required tohave completed primary school, however,from 2001, they have had to be high schoolgraduates. Candidates must successfullycomplete a written exam and be inter-viewed before enrolment in the trainingcourse; their studies span 2 full years.Some of the most important tasks of thebehvarz are:• an annual census of the population cov-
ered• public health education and encourage-
ment of community participation• family health care services (family plan-
ning services, immunization for chil-dren < 5, health care for school agechildren)
• disease control services (communicableand noncommunicable diseases)
• patient care and referral to the ruralhealth centres when necessary
• environmental health activities• providing essential drugs• home visits for follow-up of drop-out
cases
28 The diabetes prevention.pmd 3/3/2005, 12:18 AM1115
1116 La Revue de Santé de la Méditerranée orientale, Vol. 9, No 5/6, 2003
• data collection, documentation, andregular reporting.Currently, over 22 000 behvarz in
14 924 health houses give coverage toabout 20 million people.
The rural health centreThe rural health centre is a village-basedfacility which supervises the health housein its own village and usually 4 other healthhouses in neighbouring villages. Each ruralhealth centre covers an average of 90 000people. Apart from the general physician, afully established rural health centre includeson its staff at least 1 person trained in eachof the following fields: family health, dis-ease control, environmental health, oralhealth, laboratory technology, nursing as-sistance and administration. The physiciansupervises the staff. The rural health cen-tre’s main responsibilities are:• monitoring supervising, and supporting
3–5 health houses• providing outpatient care and screening
of individuals referred to the healthhouse
• providing oral health services• performing basic laboratory tests
(some)• providing maternity facilities (some)• environmental health services• data collection and regular reporting.
At present, 2243 rural health centres areoperational.
National programme for theprevention and control ofdiabetes mellitusHistory of the programmeThe Islamic Republic of Iran is one of thefirst countries to have responded to “a call
for action” from the Eastern MediterraneanRegional Office of the World Health Orga-nization for the prevention and control ofdiabetes mellitus [5]
The National Advisory Committee, es-tablished in 1992, despite having been inac-tive for years, finally resumed itsoperations with new members in 1996. Thenational programme for the prevention andcontrol of type 2 diabetes was designed inthe same year.
The aim of this programme is primary,secondary, and tertiary prevention, throughcommunity and high-risk screening, andthe integration of diabetes care into the pri-mary healthcare network. The Ministry ofHealth and Medical Education, with the co-ordination of the National Diabetes Adviso-ry Committee, launched 6 comprehensiveworkshops about diabetes for physicians,nurses and nutritionists in 1997 and 1998,in which about 60 physicians, 60 nursesand 60 nutritionists participated each year.
Objectives of the programmeGeneral objectivesPrevention and control of type 2 diabetesand its complications in the Islamic Repub-lic of Iran.
Specific objectivesPrimary prevention is a specific objectiveand aims to reduce the prevalence and inci-dence of type 2 diabetes and also to reducethe prevalence and incidence of modifiablepredisposing factors to the condition (obe-sity, physical inactivity, unhealthy diet,etc).
Strategies for achieving these objectivesare to:• modify life-styles in high-risk Iranian
populations• control and reduce the predisposing
factors of diabetes
28 The diabetes prevention.pmd 3/3/2005, 12:18 AM1116
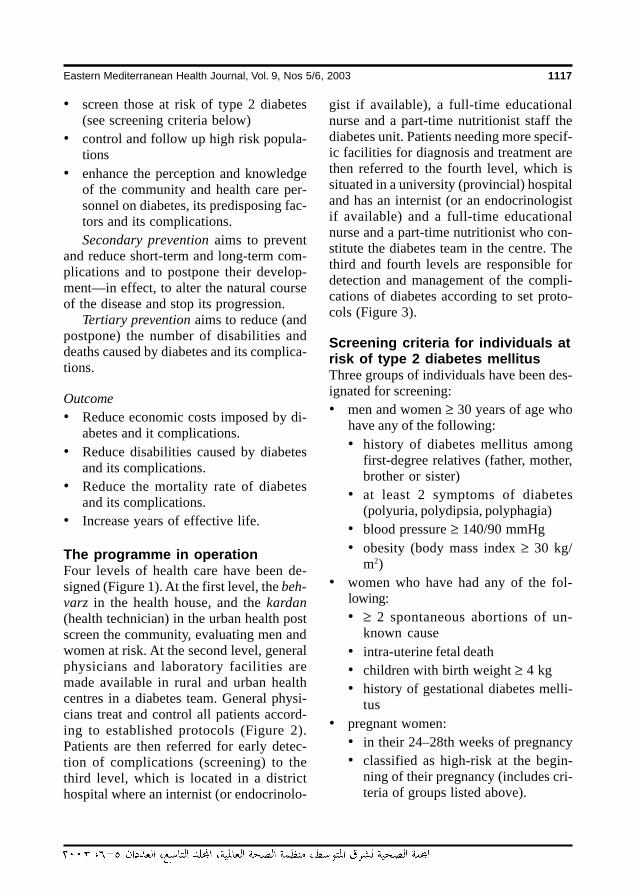
Eastern Mediterranean Health Journal, Vol. 9, Nos 5/6, 2003 1117
• screen those at risk of type 2 diabetes(see screening criteria below)
• control and follow up high risk popula-tions
• enhance the perception and knowledgeof the community and health care per-sonnel on diabetes, its predisposing fac-tors and its complications.Secondary prevention aims to prevent
and reduce short-term and long-term com-plications and to postpone their develop-ment—in effect, to alter the natural courseof the disease and stop its progression.
Tertiary prevention aims to reduce (andpostpone) the number of disabilities anddeaths caused by diabetes and its complica-tions.
Outcome• Reduce economic costs imposed by di-
abetes and it complications.• Reduce disabilities caused by diabetes
and its complications.• Reduce the mortality rate of diabetes
and its complications.• Increase years of effective life.
The programme in operationFour levels of health care have been de-signed (Figure 1). At the first level, the beh-varz in the health house, and the kardan(health technician) in the urban health postscreen the community, evaluating men andwomen at risk. At the second level, generalphysicians and laboratory facilities aremade available in rural and urban healthcentres in a diabetes team. General physi-cians treat and control all patients accord-ing to established protocols (Figure 2).Patients are then referred for early detec-tion of complications (screening) to thethird level, which is located in a districthospital where an internist (or endocrinolo-
gist if available), a full-time educationalnurse and a part-time nutritionist staff thediabetes unit. Patients needing more specif-ic facilities for diagnosis and treatment arethen referred to the fourth level, which issituated in a university (provincial) hospitaland has an internist (or an endocrinologistif available) and a full-time educationalnurse and a part-time nutritionist who con-stitute the diabetes team in the centre. Thethird and fourth levels are responsible fordetection and management of the compli-cations of diabetes according to set proto-cols (Figure 3).
Screening criteria for individuals atrisk of type 2 diabetes mellitusThree groups of individuals have been des-ignated for screening:• men and women ≥ 30 years of age who
have any of the following:• history of diabetes mellitus among
first-degree relatives (father, mother,brother or sister)
• at least 2 symptoms of diabetes(polyuria, polydipsia, polyphagia)
• blood pressure ≥ 140/90 mmHg• obesity (body mass index ≥ 30 kg/
m2)• women who have had any of the fol-
lowing:• ≥ 2 spontaneous abortions of un-
known cause• intra-uterine fetal death• children with birth weight ≥ 4 kg• history of gestational diabetes melli-
tus• pregnant women:
• in their 24–28th weeks of pregnancy• classified as high-risk at the begin-
ning of their pregnancy (includes cri-teria of groups listed above).
28 The diabetes prevention.pmd 3/3/2005, 12:18 AM1117
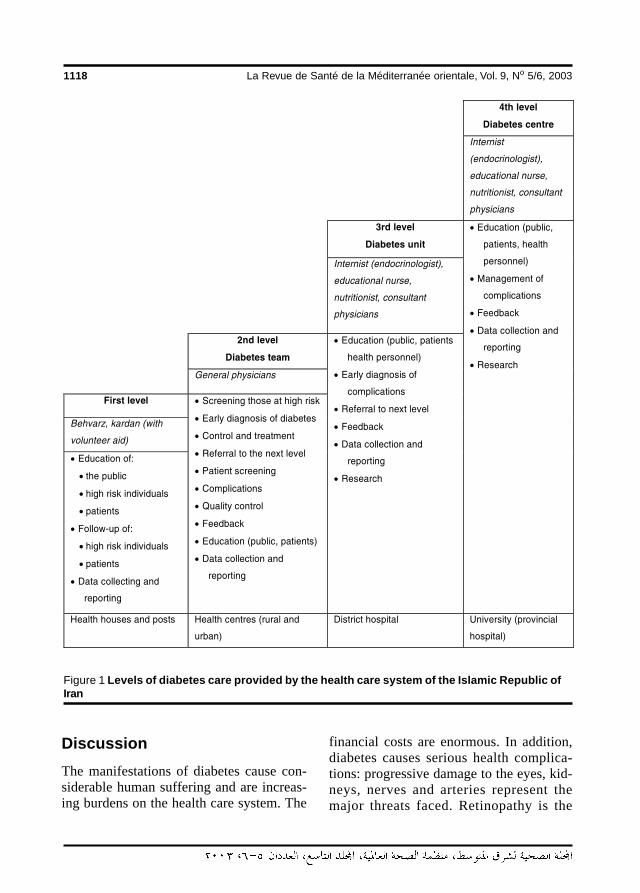
1118 La Revue de Santé de la Méditerranée orientale, Vol. 9, No 5/6, 2003
Figure 1 Levels of diabetes care provided by the health care system of the Islamic Republic ofIran
DiscussionThe manifestations of diabetes cause con-siderable human suffering and are increas-ing burdens on the health care system. The
financial costs are enormous. In addition,diabetes causes serious health complica-tions: progressive damage to the eyes, kid-neys, nerves and arteries represent themajor threats faced. Retinopathy is the
28 The diabetes prevention.pmd 3/3/2005, 12:18 AM1118
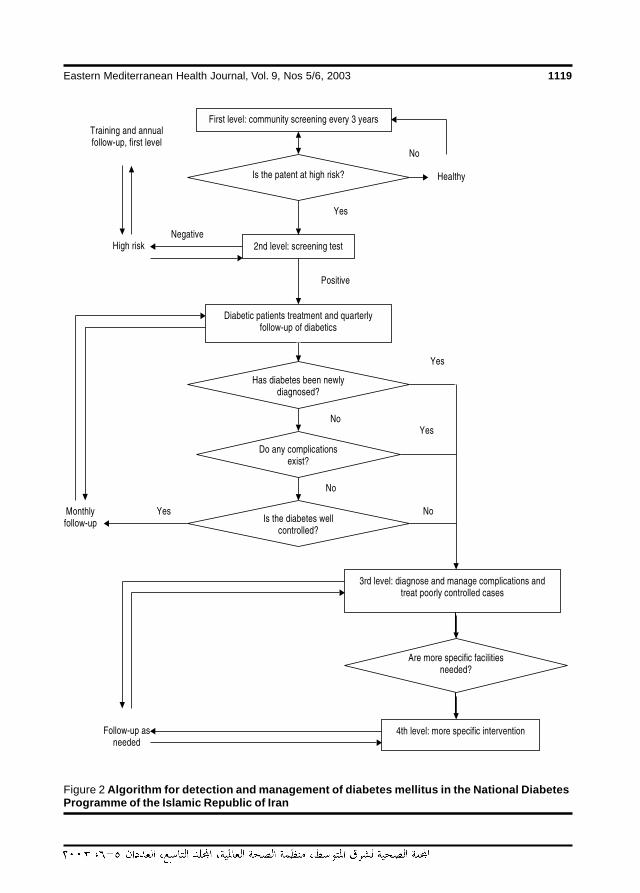
Eastern Mediterranean Health Journal, Vol. 9, Nos 5/6, 2003 1119
Figure 2 Algorithm for detection and management of diabetes mellitus in the National DiabetesProgramme of the Islamic Republic of Iran
28 The diabetes prevention.pmd 3/3/2005, 12:18 AM1119
1120 La Revue de Santé de la Méditerranée orientale, Vol. 9, No 5/6, 2003
Fig
ure
3 A
lgor
ithm
for e
arly
det
ectio
n an
d m
anag
emen
t of c
ompl
icat
ions
of d
iabe
tes
28 The diabetes prevention.pmd 3/3/2005, 12:18 AM1120
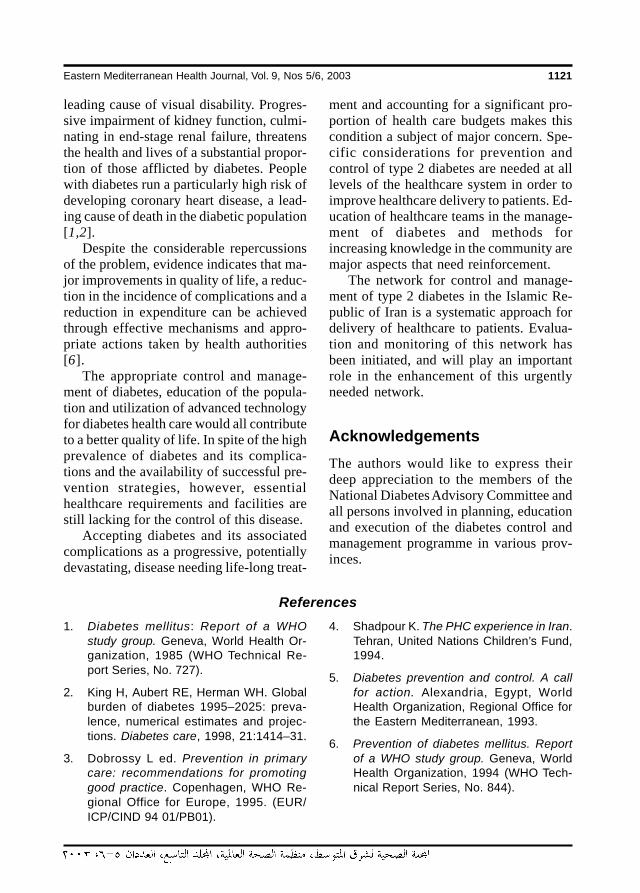
Eastern Mediterranean Health Journal, Vol. 9, Nos 5/6, 2003 1121
leading cause of visual disability. Progres-sive impairment of kidney function, culmi-nating in end-stage renal failure, threatensthe health and lives of a substantial propor-tion of those afflicted by diabetes. Peoplewith diabetes run a particularly high risk ofdeveloping coronary heart disease, a lead-ing cause of death in the diabetic population[1,2].
Despite the considerable repercussionsof the problem, evidence indicates that ma-jor improvements in quality of life, a reduc-tion in the incidence of complications and areduction in expenditure can be achievedthrough effective mechanisms and appro-priate actions taken by health authorities[6].
The appropriate control and manage-ment of diabetes, education of the popula-tion and utilization of advanced technologyfor diabetes health care would all contributeto a better quality of life. In spite of the highprevalence of diabetes and its complica-tions and the availability of successful pre-vention strategies, however, essentialhealthcare requirements and facilities arestill lacking for the control of this disease.
Accepting diabetes and its associatedcomplications as a progressive, potentiallydevastating, disease needing life-long treat-
ment and accounting for a significant pro-portion of health care budgets makes thiscondition a subject of major concern. Spe-cific considerations for prevention andcontrol of type 2 diabetes are needed at alllevels of the healthcare system in order toimprove healthcare delivery to patients. Ed-ucation of healthcare teams in the manage-ment of diabetes and methods forincreasing knowledge in the community aremajor aspects that need reinforcement.
The network for control and manage-ment of type 2 diabetes in the Islamic Re-public of Iran is a systematic approach fordelivery of healthcare to patients. Evalua-tion and monitoring of this network hasbeen initiated, and will play an importantrole in the enhancement of this urgentlyneeded network.
AcknowledgementsThe authors would like to express theirdeep appreciation to the members of theNational Diabetes Advisory Committee andall persons involved in planning, educationand execution of the diabetes control andmanagement programme in various prov-inces.
References
1. Diabetes mellitus: Report of a WHOstudy group. Geneva, World Health Or-ganization, 1985 (WHO Technical Re-port Series, No. 727).
2. King H, Aubert RE, Herman WH. Globalburden of diabetes 1995–2025: preva-lence, numerical estimates and projec-tions. Diabetes care, 1998, 21:1414–31.
3. Dobrossy L ed. Prevention in primarycare: recommendations for promotinggood practice. Copenhagen, WHO Re-gional Office for Europe, 1995. (EUR/ICP/CIND 94 01/PB01).
4. Shadpour K. The PHC experience in Iran.Tehran, United Nations Children’s Fund,1994.
5. Diabetes prevention and control. A callfor action. Alexandria, Egypt, WorldHealth Organization, Regional Office forthe Eastern Mediterranean, 1993.
6. Prevention of diabetes mellitus. Reportof a WHO study group. Geneva, WorldHealth Organization, 1994 (WHO Tech-nical Report Series, No. 844).
28 The diabetes prevention.pmd 3/3/2005, 12:18 AM1121
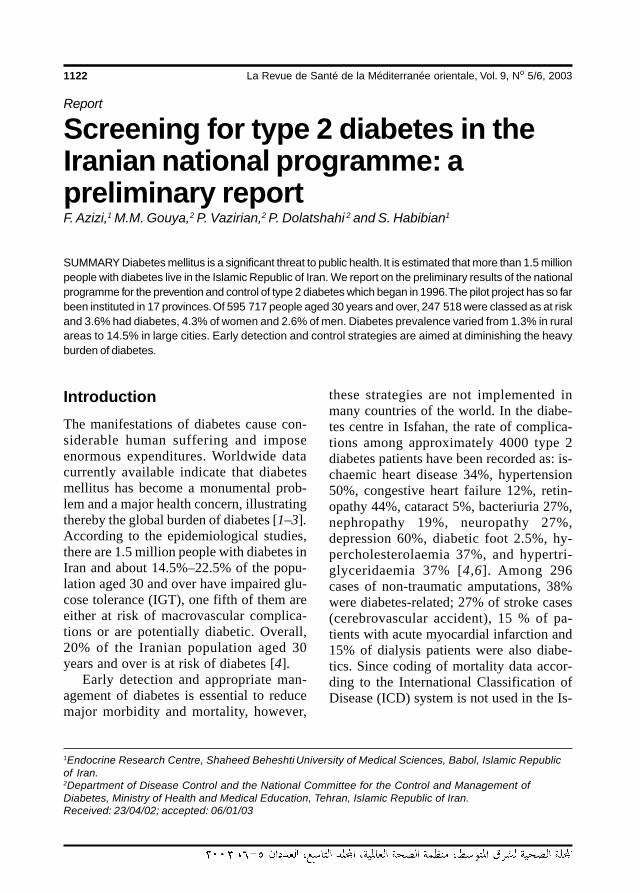
1122 La Revue de Santé de la Méditerranée orientale, Vol. 9, No 5/6, 2003
Report
Screening for type 2 diabetes in theIranian national programme: apreliminary reportF. Azizi,1 M.M. Gouya,2 P. Vazirian,2 P. Dolatshahi 2 and S. Habibian1
1Endocrine Research Centre, Shaheed Beheshti University of Medical Sciences, Babol, Islamic Republicof Iran.2Department of Disease Control and the National Committee for the Control and Management ofDiabetes, Ministry of Health and Medical Education, Tehran, Islamic Republic of Iran.Received: 23/04/02; accepted: 06/01/03
SUMMARY Diabetes mellitus is a significant threat to public health. It is estimated that more than 1.5 millionpeople with diabetes live in the Islamic Republic of Iran. We report on the preliminary results of the nationalprogramme for the prevention and control of type 2 diabetes which began in 1996. The pilot project has so farbeen instituted in 17 provinces. Of 595 717 people aged 30 years and over, 247 518 were classed as at riskand 3.6% had diabetes, 4.3% of women and 2.6% of men. Diabetes prevalence varied from 1.3% in ruralareas to 14.5% in large cities. Early detection and control strategies are aimed at diminishing the heavyburden of diabetes.
IntroductionThe manifestations of diabetes cause con-siderable human suffering and imposeenormous expenditures. Worldwide datacurrently available indicate that diabetesmellitus has become a monumental prob-lem and a major health concern, illustratingthereby the global burden of diabetes [1–3].According to the epidemiological studies,there are 1.5 million people with diabetes inIran and about 14.5%–22.5% of the popu-lation aged 30 and over have impaired glu-cose tolerance (IGT), one fifth of them areeither at risk of macrovascular complica-tions or are potentially diabetic. Overall,20% of the Iranian population aged 30years and over is at risk of diabetes [4].
Early detection and appropriate man-agement of diabetes is essential to reducemajor morbidity and mortality, however,
these strategies are not implemented inmany countries of the world. In the diabe-tes centre in Isfahan, the rate of complica-tions among approximately 4000 type 2diabetes patients have been recorded as: is-chaemic heart disease 34%, hypertension50%, congestive heart failure 12%, retin-opathy 44%, cataract 5%, bacteriuria 27%,nephropathy 19%, neuropathy 27%,depression 60%, diabetic foot 2.5%, hy-percholesterolaemia 37%, and hypertri-glyceridaemia 37% [4,6]. Among 296cases of non-traumatic amputations, 38%were diabetes-related; 27% of stroke cases(cerebrovascular accident), 15 % of pa-tients with acute myocardial infarction and15% of dialysis patients were also diabe-tics. Since coding of mortality data accor-ding to the International Classification ofDisease (ICD) system is not used in the Is-
29 Screening for type 2 diabetes.pmd 3/3/2005, 12:18 AM1122
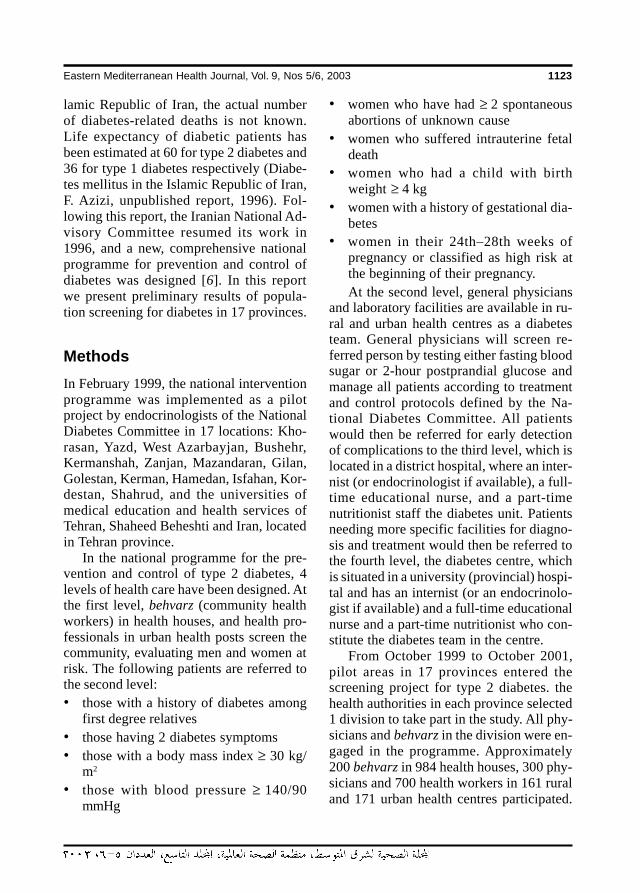
Eastern Mediterranean Health Journal, Vol. 9, Nos 5/6, 2003 1123
lamic Republic of Iran, the actual numberof diabetes-related deaths is not known.Life expectancy of diabetic patients hasbeen estimated at 60 for type 2 diabetes and36 for type 1 diabetes respectively (Diabe-tes mellitus in the Islamic Republic of Iran,F. Azizi, unpublished report, 1996). Fol-lowing this report, the Iranian National Ad-visory Committee resumed its work in1996, and a new, comprehensive nationalprogramme for prevention and control ofdiabetes was designed [6]. In this reportwe present preliminary results of popula-tion screening for diabetes in 17 provinces.
MethodsIn February 1999, the national interventionprogramme was implemented as a pilotproject by endocrinologists of the NationalDiabetes Committee in 17 locations: Kho-rasan, Yazd, West Azarbayjan, Bushehr,Kermanshah, Zanjan, Mazandaran, Gilan,Golestan, Kerman, Hamedan, Isfahan, Kor-destan, Shahrud, and the universities ofmedical education and health services ofTehran, Shaheed Beheshti and Iran, locatedin Tehran province.
In the national programme for the pre-vention and control of type 2 diabetes, 4levels of health care have been designed. Atthe first level, behvarz (community healthworkers) in health houses, and health pro-fessionals in urban health posts screen thecommunity, evaluating men and women atrisk. The following patients are referred tothe second level:• those with a history of diabetes among
first degree relatives• those having 2 diabetes symptoms• those with a body mass index ≥ 30 kg/
m2
• those with blood pressure ≥ 140/90mmHg
• women who have had ≥ 2 spontaneousabortions of unknown cause
• women who suffered intrauterine fetaldeath
• women who had a child with birthweight ≥ 4 kg
• women with a history of gestational dia-betes
• women in their 24th–28th weeks ofpregnancy or classified as high risk atthe beginning of their pregnancy.At the second level, general physicians
and laboratory facilities are available in ru-ral and urban health centres as a diabetesteam. General physicians will screen re-ferred person by testing either fasting bloodsugar or 2-hour postprandial glucose andmanage all patients according to treatmentand control protocols defined by the Na-tional Diabetes Committee. All patientswould then be referred for early detectionof complications to the third level, which islocated in a district hospital, where an inter-nist (or endocrinologist if available), a full-time educational nurse, and a part-timenutritionist staff the diabetes unit. Patientsneeding more specific facilities for diagno-sis and treatment would then be referred tothe fourth level, the diabetes centre, whichis situated in a university (provincial) hospi-tal and has an internist (or an endocrinolo-gist if available) and a full-time educationalnurse and a part-time nutritionist who con-stitute the diabetes team in the centre.
From October 1999 to October 2001,pilot areas in 17 provinces entered thescreening project for type 2 diabetes. thehealth authorities in each province selected1 division to take part in the study. All phy-sicians and behvarz in the division were en-gaged in the programme. Approximately200 behvarz in 984 health houses, 300 phy-sicians and 700 health workers in 161 ruraland 171 urban health centres participated.
29 Screening for type 2 diabetes.pmd 3/3/2005, 12:18 AM1123
1124 La Revue de Santé de la Méditerranée orientale, Vol. 9, No 5/6, 2003
All those in the selected division aged 30years and over were screened (cut-off ageselected by the National Diabetes Commit-tee). Diagnostic criteria were based onfasting blood sugar ≥ 126 mg/dL or 2-hourpostprandial blood glucose ≥ 200 mg/dL.
ResultsDuring the 2 years of this study, 3.5 millionpeople were screened, of whom 998 237individuals were aged 30 years or over.During this time a total of 595 717 peoplewithin this age range were initially screenedby behvarz in the screening programme.Those found to have risk factors were re-ferred for confirmation and blood testing.More women were screened than men:347 501 (57.5%) versus 248 217 (42.5%),mainly because during the mornings, whenmost of the screenings were done, men at-tended to agricultural work and other busi-ness.
The age distribution of the study popu-lation is shown in Table 1. In total, 21 637diabetics, 15 091 women and 6547 men,were detected. Table 2 shows the preva-lence of known and newly discovered dia-betic patients in the screened population.Overall, 3.6% of the subjects were diabet-ic, of whom 58.3% were known and41.7% were newly discovered. The preva-lence of risk factors for diabetes in people
screened is given in Table 3. Obesity, hy-pertension, family history of diabetes, andin females history of ≥ 2 abortions and hav-ing a baby ≥ 4 kg birth weight were moreprevalent than other risk factors.
Table 4 shows the prevalence of diabe-tes in 11 provinces, the lowest being 1.3%in the rural areas of Kordestan and Kho-rasan, and the highest 10.7% and 14.5% intwo urban areas in Tehran.
DiscussionThis study shows the results of screeningprocedures for the detection of type 2 dia-betes in more than half a million at-riskadults in 17 provinces of the Islamic Re-public of Iran.
Epidemiological studies on the preva-lence of diabetes have been carried out insome parts of the country in the last de-cade—there are now an estimated 1.5 mil-lion people with diabetes. Since 1976, somestudies have been done among children,government employees, and factory work-ers [7,8], but because of their invalid meth-odology, the results are not reliable. Asystematic approach to epidemiologicalstudies was initiated in 1993. The Endo-crine Research Centre and the Institute ofNutrition of Shaheed Beheshti University ofMedical Sciences conducted the first sys-tematic population study in Iran and report-ed a prevalence of diabetes of 7.6 % forfemales, 7.1% for males, while 14.9% offemales and 8.9% of males had IGT of2033 individuals aged 30 years and above,selected by random sampling in Islamshahr(population 244 000) [9]. They also foundthat, of people aged 30 years and over liv-ing in rural areas of Tehran province, 7.3%had diabetes and 7.2% had IGT [10]. A re-port covering 2800 inhabitants aged 30years and over in Tehran city with a mean
Table 1 Study population displayedproportionally by age group and sex
Sex No. Age group (years)screened 30–39 40–49 50–59 ≥≥≥≥≥ 60
Female 347 501 39 27 16 18
Male 248 216 34 23 16 27
Total 595 717 37 25 16 22
29 Screening for type 2 diabetes.pmd 3/3/2005, 12:18 AM1124
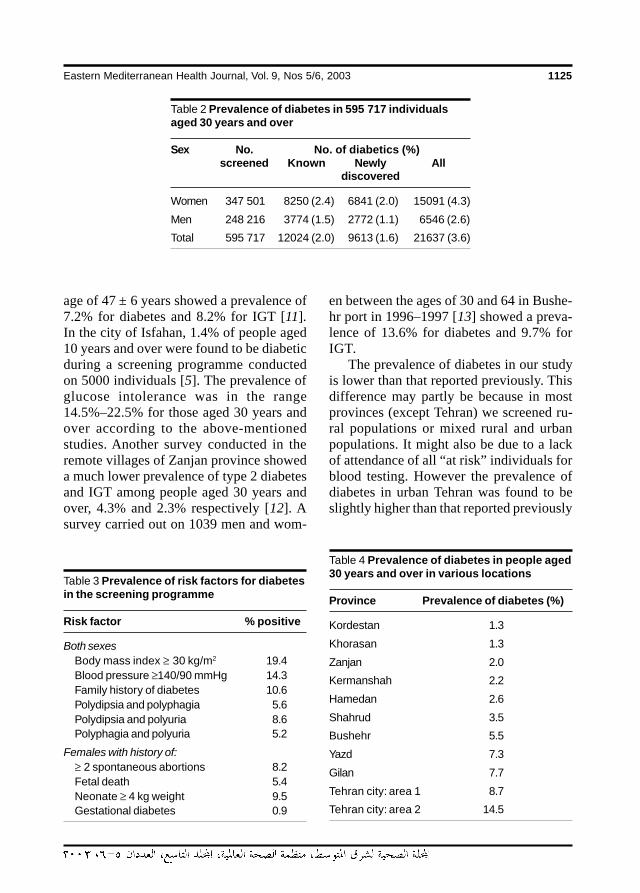
Eastern Mediterranean Health Journal, Vol. 9, Nos 5/6, 2003 1125
age of 47 ± 6 years showed a prevalence of7.2% for diabetes and 8.2% for IGT [11].In the city of Isfahan, 1.4% of people aged10 years and over were found to be diabeticduring a screening programme conductedon 5000 individuals [5]. The prevalence ofglucose intolerance was in the range14.5%–22.5% for those aged 30 years andover according to the above-mentionedstudies. Another survey conducted in theremote villages of Zanjan province showeda much lower prevalence of type 2 diabetesand IGT among people aged 30 years andover, 4.3% and 2.3% respectively [12]. Asurvey carried out on 1039 men and wom-
en between the ages of 30 and 64 in Bushe-hr port in 1996–1997 [13] showed a preva-lence of 13.6% for diabetes and 9.7% forIGT.
The prevalence of diabetes in our studyis lower than that reported previously. Thisdifference may partly be because in mostprovinces (except Tehran) we screened ru-ral populations or mixed rural and urbanpopulations. It might also be due to a lackof attendance of all “at risk” individuals forblood testing. However the prevalence ofdiabetes in urban Tehran was found to beslightly higher than that reported previously
Table 2 Prevalence of diabetes in 595 717 individualsaged 30 years and over
Sex No. No. of diabetics (%)screened Known Newly All
discovered
Women 347 501 8250 (2.4) 6841 (2.0) 15091 (4.3)
Men 248 216 3774 (1.5) 2772 (1.1) 6546 (2.6)
Total 595 717 12024 (2.0) 9613 (1.6) 21637 (3.6)
Table 3 Prevalence of risk factors for diabetesin the screening programme
Risk factor % positive
Both sexesBody mass index ≥ 30 kg/m2 19.4Blood pressure ≥140/90 mmHg 14.3Family history of diabetes 10.6Polydipsia and polyphagia 5.6Polydipsia and polyuria 8.6Polyphagia and polyuria 5.2
Females with history of:≥ 2 spontaneous abortions 8.2Fetal death 5.4Neonate ≥ 4 kg weight 9.5Gestational diabetes 0.9
Table 4 Prevalence of diabetes in people aged30 years and over in various locations
Province Prevalence of diabetes (%)
Kordestan 1.3
Khorasan 1.3
Zanjan 2.0
Kermanshah 2.2
Hamedan 2.6
Shahrud 3.5
Bushehr 5.5
Yazd 7.3
Gilan 7.7
Tehran city: area 1 8.7
Tehran city: area 2 14.5
29 Screening for type 2 diabetes.pmd 3/3/2005, 12:18 AM1125
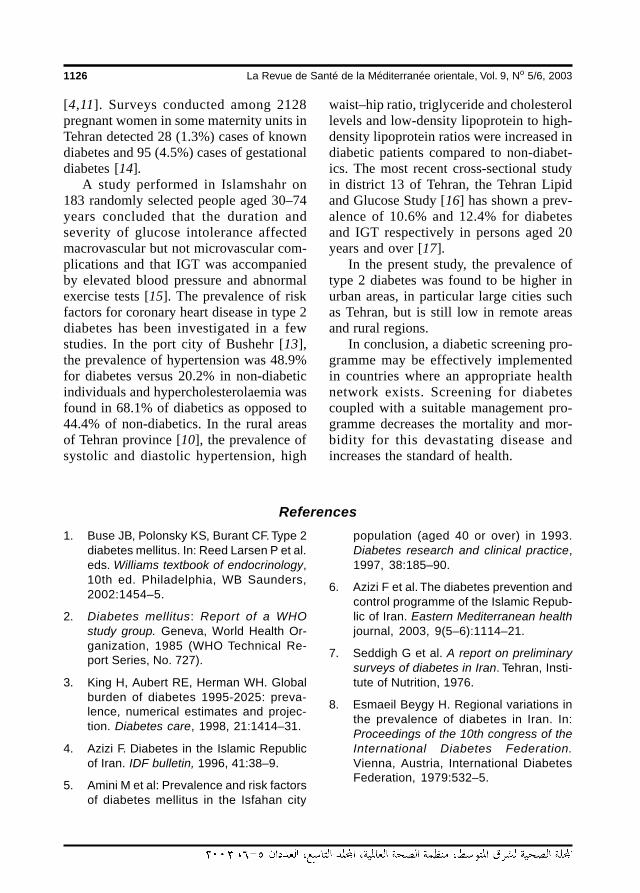
1126 La Revue de Santé de la Méditerranée orientale, Vol. 9, No 5/6, 2003
[4,11]. Surveys conducted among 2128pregnant women in some maternity units inTehran detected 28 (1.3%) cases of knowndiabetes and 95 (4.5%) cases of gestationaldiabetes [14].
A study performed in Islamshahr on183 randomly selected people aged 30–74years concluded that the duration andseverity of glucose intolerance affectedmacrovascular but not microvascular com-plications and that IGT was accompaniedby elevated blood pressure and abnormalexercise tests [15]. The prevalence of riskfactors for coronary heart disease in type 2diabetes has been investigated in a fewstudies. In the port city of Bushehr [13],the prevalence of hypertension was 48.9%for diabetes versus 20.2% in non-diabeticindividuals and hypercholesterolaemia wasfound in 68.1% of diabetics as opposed to44.4% of non-diabetics. In the rural areasof Tehran province [10], the prevalence ofsystolic and diastolic hypertension, high
waist–hip ratio, triglyceride and cholesterollevels and low-density lipoprotein to high-density lipoprotein ratios were increased indiabetic patients compared to non-diabet-ics. The most recent cross-sectional studyin district 13 of Tehran, the Tehran Lipidand Glucose Study [16] has shown a prev-alence of 10.6% and 12.4% for diabetesand IGT respectively in persons aged 20years and over [17].
In the present study, the prevalence oftype 2 diabetes was found to be higher inurban areas, in particular large cities suchas Tehran, but is still low in remote areasand rural regions.
In conclusion, a diabetic screening pro-gramme may be effectively implementedin countries where an appropriate healthnetwork exists. Screening for diabetescoupled with a suitable management pro-gramme decreases the mortality and mor-bidity for this devastating disease andincreases the standard of health.
References
1. Buse JB, Polonsky KS, Burant CF. Type 2diabetes mellitus. In: Reed Larsen P et al.eds. Williams textbook of endocrinology,10th ed. Philadelphia, WB Saunders,2002:1454–5.
2. Diabetes mellitus: Report of a WHOstudy group. Geneva, World Health Or-ganization, 1985 (WHO Technical Re-port Series, No. 727).
3. King H, Aubert RE, Herman WH. Globalburden of diabetes 1995-2025: preva-lence, numerical estimates and projec-tion. Diabetes care, 1998, 21:1414–31.
4. Azizi F. Diabetes in the Islamic Republicof Iran. IDF bulletin, 1996, 41:38–9.
5. Amini M et al: Prevalence and risk factorsof diabetes mellitus in the Isfahan city
population (aged 40 or over) in 1993.Diabetes research and clinical practice,1997, 38:185–90.
6. Azizi F et al. The diabetes prevention andcontrol programme of the Islamic Repub-lic of Iran. Eastern Mediterranean healthjournal, 2003, 9(5–6):1114–21.
7. Seddigh G et al. A report on preliminarysurveys of diabetes in Iran. Tehran, Insti-tute of Nutrition, 1976.
8. Esmaeil Beygy H. Regional variations inthe prevalence of diabetes in Iran. In:Proceedings of the 10th congress of theInternational Diabetes Federation.Vienna, Austria, International DiabetesFederation, 1979:532–5.
29 Screening for type 2 diabetes.pmd 3/3/2005, 12:18 AM1126
Eastern Mediterranean Health Journal, Vol. 9, Nos 5/6, 2003 1127
9. Navai L et al. [Prevalence of NIDDM andIGT in Islamshahr]. In: Proceedings of the1st Iranian congress on diabetes. Yazd,Yazd University of Medical Sciences,1993 (in Farsi).
10. Navai L, Azizi F. [Prevalence of gesta-tional diabetes in rural areas of Tehranprovince.] Research in medicine, 2002,26:217–23 (in Farsi).
11. Larijani B et al. Prevalence of NIDDM inTehran. In: Proceedings of the 3rd inter-national congress on endocrine disor-ders. Tehran, Endocrine ResearchCentre, Shaheed Beheshti University ofMedical Sciences, 1995.
12. Sharifi F, Azizi F. Prevalence of diabetesand IGT in rural areas of Zanjan provincein a population above 30 years of age.Research in medicine, 1998, 1:55–64(in Farsi).
13. Osfouri E et al. [Diabetes type 2 and IGTin 30–64 year olds of Bushehr port.] Tebbjonoub, 2001, 1:209–16 (in Farsi).
14. Larijani B et al: Prevalence of gestationaldiabetes in 2128 pregnant women in Te-hran. In: Proceedings of the 3rd interna-tional congress on endocrine disorders.Tehran, Endocrine Research Centre,Shaheed Beheshti University of MedicalSciences, 1995.
15. Moeini S et al. Prevalence of micro andmacro vascular complications of diabe-tes. In: Proceedings of the 10th Asia–Oceania congress of endocrinology.Beijing, Asia–Oceania congress of en-docrinology, 1994.
16. Azizi F et al: Tehran lipid and glucosestudy (TLGS): Rationale and design.CVD prevention, 2000, 3:50–3.
17. Azizi F. Tehran lipid and glucose study:Study methodology and summarizedfindings. Tehran, Endocrine ResearchCentre, 2001.
29 Screening for type 2 diabetes.pmd 3/3/2005, 12:18 AM1127
1128 La Revue de Santé de la Méditerranée orientale, Vol. 9, No 5/6, 2003
Eastern Mediterranean health journalreviewers’ panel, 20031
1Arranged in alphabetical order according to the family name
Dr Abdel Hamid Omar AbazaProfessor Dr Hilmy AbazaProfessor Dr Abd El-Gawad M. Abd
El-GawadProfessor Momtaz M. Abd El-WahabProfessor Dr Salwa Abdel AzimProfessor Dr Laila A.M. Abdel MegidProfessor Mohamed Abdel RahmanProfessor Asmaa Mahmoud Abdel-AzizProfessor Dr Mona A. Abdel-MesiehProfessor M. Yosry Abdel-MohsenProfessor Dr Mohammad Abdel-SabourProfessor Dr Ekram Abdel-SalamProfessor Dr Siham Mustafa Abdul RehimDr Yousef AbdulrazzaqProfessor Mostafa A.AbolfotouhProfessor Laila Mahmoud Abou BashaDr Ahmed Gamal M. Abou El-AzayemDr Samia Abou-KhatwaProfessor Dr Abdel Rahim AdasProfessor Ahmed Awad Abdel-
Hameed AdeelDr Ahmed Abdulla AhmedProfessor Dr Mohamed Abdel
Salam AhmedProfessor Dr Mekkawy AkelDr Tasleem AkhterDr Salah Al AwaidyDr Suleiman Mohamed Al BusaidyMs Deena AlasfoorDr Sadika A. Al-AwadiProfessor Dr Mohamed AlbarDr Abdullah Ben Mohamed Al-Bedah
Dr Tarek Al-DosokyProfessor Dr Abdulrahman S. Al-FrayhDr Tariq Al-HabeebDr Nasser Al-HaddadDr Zuhair Al-HassnanDr Ahmed Ali Al-JarallahProfessor Ahmed M.B. AlkafajeiDr Hazem Al-KhawashkiDr Sulaiman Mohammed Al-MayoufDr Batool Ali Al-MuhandisProfessor Faisal Abdul Latif AlnasirProfessor Dr Khaldoun Al-RoomiDr Qasim Mohamad Al-ShboulDr Iman H. Al-SheikhProfessor Naila Hassan AmerProfessor Ezzat Khamis AmineDr Walid AmmarDr Michael AngastiniotisProfessor Hossam El-Din Hassan AnisProfessor Dr Medhat AnwarProfessor Morsi Mohamed ArabDr Abdul Ghani ArafehProfessor Galal Hussein ArefDr Ray R. ArthurProfessor Dr Ibrahim AshmawyDr Yousef AsiriMr Sadok AtallahProfessor Helen Nashed AwadallaProfessor Dr Magda El-Sayed AzabProfessor Dr Ensaf Abdel-Gawad
M. AzaziProfessor Dr Taha BaasherProfessor Yousria Badawy
The Eastern Mediterranean health journal thanks the following experts for their kind assis-tance in the review of papers considered for publication during the year 2003.
30 reviewers panel.pmd 3/3/2005, 12:18 AM1128
Eastern Mediterranean Health Journal, Vol. 9, Nos 5/6, 2003 1129
Professor Dr Mohamed Ramadan BaddarDr Omneya Mostafa Badr El-DinDr Ahmed Abdulatief Ahmed BahnassyDr Mohamed Hassan BaldoDr Andrew Lee BallProfessor Rasheda BarakatProfessor Nick BarberProfessor Dr Rashad Sami BarsoumDr Hyam BashourProfessor Dr Hassan Kamel BassiounyProfessor Mohamed Ibrahim BassyouniDr Anwar BatiehaDr Saleh A.O. BawazirProfessor Dr Dorreya M.BayoumiProfessor Dr Ramez BedwaniMs Veronica BekoeDr Andre E.BeljaevProfessor Dr Laila M.BoulesDr Denis M.BourgeoisProfessor Dr Nilufer Rached ChafikDr Noureddine ChaoukiProfessor T.D.ChughProfessor Fan ChungDr Filippo CurtaleDr Yankum DadzieProfessor Adekunle DawoduDr Vasantha De SilvaProfesseur André DeomProfessor Dr Zeinab DeyabDr Bassel DoughanDr Nabil DowidarProfessor Gholam-Hossein EdrissianProfessor Omar El Farouk El AzzouniProfessor Mohamed Abbas El BarrawyProfessor Abdel-Ghany El- KholiProfessor Dr Dawlat El MiligyProfessor Dr Mervat El RafieProfessor Mohsen Saleh ElalfyProfessor Dr Adel El-BeheiryProfessor Hatem El-BeyaliProfessor Hesham El-DarieProfessor Ezzeddin Saeed Mohammad
El-DensharyDr Suzan El-FikiDr Shawky El-Fiky
Professor Dr Ibrahim Sadek El-GendyProfessor Ebtisam Fathi El-GhazzawiEl-Gohary Professor Ahmed M.Professor Dr Zenab El-GothamyProfessor Mohsen A. F. El-HazmiProfessor Mohamed Hassan El-HefnawiProfessor Anissa Mahmoud El-HefnyProfessor Dr Zoheir Hassan El-HoshyProfessor Mohamed Hassan El-HoshyProfessor Dr Mohamed El-KaliobyProfessor Dr Ahmed R.A. El-KashmiriProfessor Dr Abla Mostafa El-MishadProfessor Mohammed El-RifaiProfessor Dr Ahmad ElsadrDr Fikrat El-SahnProfessor Dr Mohamed Fathi El-SahnProfessor Dr Ihab Hafez El-SawyProfessor Dr Mohammed El-SawyProfessor Nawal El-SayedProfessor Tarek Mostafa Mohamed El-SharkawyProfessor Mohamed El-SherbiniProfessor Hanem Mohamed El-TahanProfessor Samia El-TemtamyDr Abdul Rahman Ebrahim FakhroProfessor Dr Omar FaragProfessor Hoda Fahmy FaragDr Nader Abdel-Monem FaseehDr Bahaa El-Din Abdel Hamid FatehaProfessor Dr Mahmoud FathallaProfessor Dr Ahmad FattouhProfessor Dr Mohamed Farouk FikriProfesseur Noureddine Fikri-BenbrahimProfessor Dr Alexander T.FlorenceProfessor Dr Eldesouki F.FoudaDr Abdel-Razek GaafarProfessor Zahira Metwalli GadDr Marie-Claude Georges-CourbotDr Antonio GerbaseProfessor Abbas GhaderiProfesseur Hassen GhannemDr Massima GhidinelliProfessor Dr Mohammed A.GhoneimDr Yassin A.A.GinawiDr Talaat Girgis
30 reviewers panel.pmd 3/3/2005, 12:18 AM1129
1130 La Revue de Santé de la Méditerranée orientale, Vol. 9, No 5/6, 2003
Professor Ahmed Sherif HafezDr Rana A.HajjehProfessor George HalabiProfessor Dr Andrew J.HallProfessor Hanan HamamyProfessor Hossam HamdyProfessor Hammam Mohammed HammamDr Ralph E. HarbachDr Jalil HaririProfessor Dr Ali Abdel-Halim HasabDr Hoda A.HassanProfessor Dr Ezzeldin Osman HassanDr Salwa Al-Saied M. HassanynDr Hassan HathoutDr Mohammed HayatyProfessor Samia Abdel Razzak HemedaDr Bradley Stuart HershProfessor Dr Ahmad Hassan HusseinProfessor Dr Abdel Wahab M.IbrahimProfessor Dr Afaf Gaber IbrahimProfessor Dr M. Mohsen IbrahimProfessor Dr Mohamed Salah IbrahimProfessor Dr Kameel Girgis IskanderProfessor Dr Hanaa M. IsmailProfessor Moustafa Kamel IsmailProfessor Dr Abdo JurjusDr Anders KallnerDr Kassem M.KassakProfessor Dr Hasan KayaliProfessor Dr Medhat KhafagyProfessor Aly Elyan KhalafallaProfessor Nawal Mohamed KhalafallahProfessor Dr M.M.KhalifaProfessor Refaat Mohamed Ahmed
KhalifaProfessor Karima Ahmed KhalikProfessor Dr Omar KhashabMrs Zahra KhatamiProfessor Dr Adel KhattabDr Abdel Karim KhawaldehProfessor Dr Mohamed Taky El Din
KhayyalProfessor Mustafa KhogaliDr Tawfik KhojaMr Sang Jae Kim
Dr Marina KleanthousDr Nabil KronfolDr Wesam I.KurdiProfessor Dr Taha Mohamed A.LabibDr Yvonne-Marie LintonDr Hans Oluf LyonDr Haifa MadiProfessor Hisham Mohamed MahabaDr Sawsan Majali MahasnehProfessor Dr Ahmed A.R.MahfouzProfessor Dr Maghazy Ali MahgoubProfessor El-Sheikh MahgoubDr Jaouad MahjourProfessor Dr Ahmed Mohamed MandourProfessor Dr Aly Abdel Hady MassoudProfessor Dr Boussaina MassoudProfessor Dr Mohamed Nabil MawsoufProfessor Omer Ahmed MirghaniProfessor Dr Mahmoud Radwan
MohamedProfessor Dr Ali MonisDr Antonio MontresorDr Khairya MoosaDr Robert E.MorrisProfessor Dr Tosson Aly MorsyProfessor Farouk MouradProfessor Malik H.MubbasharProfessor Dr Abu-Salim MustafaDr Ziad NajjarDr Tawfeeq Ali NaseebDr Nabil T.NassarProfessor Dr Shafika NasserProfessor Dr Mona A.B.NayelDr Francis J.NdowaProfessor Dr Laila H.NofalProfessor Stephen Abimbola OdusanyaProfessor Tarek A.OkashaDr Salah-Eddine OttmaniDr Pinar Tevfik OzandDr David PayneDr Joseph Hubert PerriensDr Gilles PoumerolDr Shamim QaziProfessor Dr Hamed RabieProfessor Hashem Mohamed Rashwan
30 reviewers panel.pmd 3/3/2005, 12:18 AM1130
Eastern Mediterranean Health Journal, Vol. 9, Nos 5/6, 2003 1131
Dr Hamayun R.RathorDr Mario RaviglioneDr Lesley ReesDr Hans ReinauerDr J. RemmeProfessor Mohamed Abdel-Aziz RizkDr Mark RowlandDr Hamid RushwanProfessor Dr Yasser Saad-EldinProfessor Dr Sherif SabryDr Adel SadekProfessor Refat Abdel Samie SadeqDr Khalid SaeedProfessor Mohamed Sami Abdel-Hamid
SaidDr Nadia SakatiProfessor Dr Atef Atalla SaklaDr Osama Eisa SalamaProfessor Hosny Mohamed SalamaDr M. H.SalariProfessor Samira SalehDr Philip Adib SalemProfessor Dr Aziza SalemProfessor Ibrahim SaltiDr A.SeimenisDr Gamal I.SerourDr Mostafa ShafikDr Uzma Shah
Professor Mounir Mahmoud ShalabyProfessor Samia Abd El Fattah SharafProfessor Asem ShehabiProfessor Dr Youssef M.ShetaDr Felicity SmithProfessor Dr Mohamed Moselhi SolimanProfessor Dr Taher SolimanDr Rima Afifi SoweidDr Adrian David StephensDr R.H.TangermannProfessor Dr Hassan Nabil TawfikDr Mohammed Adnane TaziProfessor Dr Mokhtar Khairy ToppozadaProfessor Amor ToumiDr Salah TumsahProfessor Sayenna Abdulkareem UdumanDr Catherine J.WattProfessor Walther Helmut WernsdorferDr Mirghani A. Rahman YousifProfessor Dr Salwa Mohamed YoussefDr Salah Rafik Abbas ZaherDr Anita ZaidiDr Adel ZakiProfessor Dr Magdy ZedanProfessor Assem Abd El-Rahman ZeyadaDr Xiaorui ZhangDr Tony ZreikProfessor Ahmed Zribi
Note of appreciation
The scientific integrity and standard of the information disseminatedthrough EMHJ depends greatly on the critical judgement of our review-ers listed above. We would like to extend our sincere thanks and grati-tude to them all for giving voluntarily of their time so willingly.
30 reviewers panel.pmd 3/3/2005, 12:18 AM1131

Related Documents