
Welcome message from author
This document is posted to help you gain knowledge. Please leave a comment to let me know what you think about it! Share it to your friends and learn new things together.
Transcript
J Rodney Levick DSc DPhil MA MRCP BM BCh (Oxon)
Professor of Physiology St George’s Hospital Medical School University of London, UK
CardiovascularPhysiologyQuestions for Self Assessment
With Illustrated Answers
First published in Great Britain in 2010 by
Hodder Arnold, an imprint of Hodder Education, an Hachette UK company,
338 Euston Road, London NW1 3BH
http://www.hodderarnold.com
© 2010 J Rodney Levick
All rights reserved. Apart from any use permitted under UK copyright law, this publication may only be reproduced,
stored or transmitted, in any form, or by any means with prior permission in writing of the publishers or in the case of
reprographic production in accordance with the terms of licences issued by the Copyright Licensing Agency. In the
United Kingdom such licences are issued by the Copyright Licensing Agency: Saffon House, 6-10 Kirby Street, London
EC1N 8TS.
Hachette’s policy is to use papers that are natural, renewable and recyclable products and made from wood grown in
sustainable forests. The logging and manufacturing processes are expected to conform to the environmental regulations
of the country of origin.
Whilst the advice and information in this book are believed to be true and accurate at the date of going to press, neither
the author nor the publisher can accept any legal responsibility or liability for any errors or omissions that may be made.
In particular (but without limiting the generality of the preceding disclaimer) every effort has been made to check drug
dosages; however it is still possible that errors have been missed. Furthermore, dosage schedules are constantly being
revised and new side-effects recognized. For these reasons the reader is strongly urged to consult the drug companies’
printed instructions before administering any of the drugs recommended in this book.
British Library Cataloguing in Publication Data
A catalogue record for this book is available from the British Library
Library of Congress Cataloging-in-Publication Data
A catalog record for this book is available from the Library of Congress
ISBN 978 0 340 985 113
1 2 3 4 5 6 7 8 9 10
Publisher: Joanna Koster
Project Editor: Francesca Naish
Editorial Assistant: Stephen Clausard
Production Controller: Karen Dyer
Cover Designer: Amina Dudhia
Indexer: Laurence Errington
Cover image © Science Photo Library
Typeset in 10.5/12 pt Bembo by MPS Limited, A Macmillan Company, Chennai, India
Printed and bound in Europe for Hodder Arnold, an Hachette UK Company
What do you think about this book? Or any other Hodder Arnold title?
Please visit our website: www.hodderarnold.com
Introduction v
1 Overview of the cardiovascular system 12 The cardiac cycle 63 Cardiac myocyte excitation and contraction 134 Initiation and nervous control of heart beat 195 Electrocardiography and arrhythmias 266 Control of stroke volume and cardiac output 307 Assessment of cardiac output and peripheral pulse 388 Haemodynamics: flow, pressure and resistance 429 The endothelial cell 54
10 The microcirculation and solute exchange 5911 Circulation of fluid between plasma, interstitium and lymph 6512 Vascular smooth muscle: excitation, contraction and relaxation 7513 Control of blood vessels: I. Intrinsic control 8214 Control of blood vessels: II. Extrinsic control by nerves and hormones 8915 Specialization in individual circulations 9616 Cardiovascular receptors, reflexes and central control 10817 Co-ordinated cardiovascular responses 11518 Cardiovascular responses in pathological situations 123
Figures and Tables 133Figures 135Figure acknowledgements 244Tables 252Index 258
Contents

This page intentionally left blank
The questions in this little book are intended primarily as an accompaniment to the fifth edition of thetextbook, An Introduction to Cardiovascular Physiology ( JR Levick, Hodder Arnold, 2010) – though theexplanations and the numerous diagrams should help make this a useful ‘stand-alone’ volume if desired.The companion volume has a small, ‘taster’ selection of the questions on its website.The aim of thiscollection of over 230 questions is to offer students an element of self-assessment, as they progressthrough the companion book or revise for examinations. Lecturers may find some of the questionsuseful as a template when setting questions of their own, but should note that the questions areprimarily educational in intent; their discriminatory power has not been tested. The questionsare grouped under the same headings as the chapters of the companion textbook, so they becomeprogressively more advanced (see Contents). Occasional statements call for information from laterchapters. Medically relevant questions are introduced wherever they are appropriate. I have set at leastone question on each learning objective given at the start of the chapter in the companion volume, tohelp you assess your achievement of the learning objectives. Some questions require you to integrateinformation from other chapters too.The questions aim to test basic understanding, fundamentalprinciples and medical relevance. Hopefully they avoid excessive detail – always the examiner’s easyoption!
The questions. Most of the questions are multiple choice questions (MCQs), generally with fivetrue/false statements, but occasionally more or less than five. Although some ‘educationalists’ nowdemand single correct answer questions (SAQs, one correct answer out of four or five options), thesetest less knowledge, so the MCQ style has been retained here.To add variety, there is a sprinkling ofother styles of question, such as ‘extended matching questions’ (i.e. choose the best answer from a list),data interpretation problems, and little numerical problems that test reasoning power and ability to dosimple calculations.
The answers. Each answer is accompanied by a brief explanation, and very often an illustrativefigure, which should help if you got the answer wrong. Most of the figures are from the accompanyingtextbook, but there are also new, explanatory diagrams after some questions. It is sometimes difficult toavoid ambiguity in MCQ questions; so use your common sense – choose the answer that will be rightmost of the time, rather than a remote, rare possibility. Nevertheless, if you disagree with the ‘official’answer, do let me know.
Introduction
Your score. What score represents a good performance? There are roughly equal numbers ofT and F answers.Therefore, if �1 is allotted for each correct answer and none subtracted for a wronganswer, a score of 50% could be achieved simply by responding True (or False) to every question.Around 65% (two-thirds) correct answers would probably be a ‘pass’ under this marking scheme. Manyuniversities use a negative marking scheme, namely �1 for an incorrect answer, 0 for no answerand �1 for a correct answer. On this scheme, guessing True (or False) for every answer would scoreroughly zero, and the pass mark is therefore usually set at a little below 50%. Over 60% would be good,and over 70% excellent. Good luck!
Rodney LevickPhysiology
St George’s Hospital Medical School,University of London, UK
vi Introduction
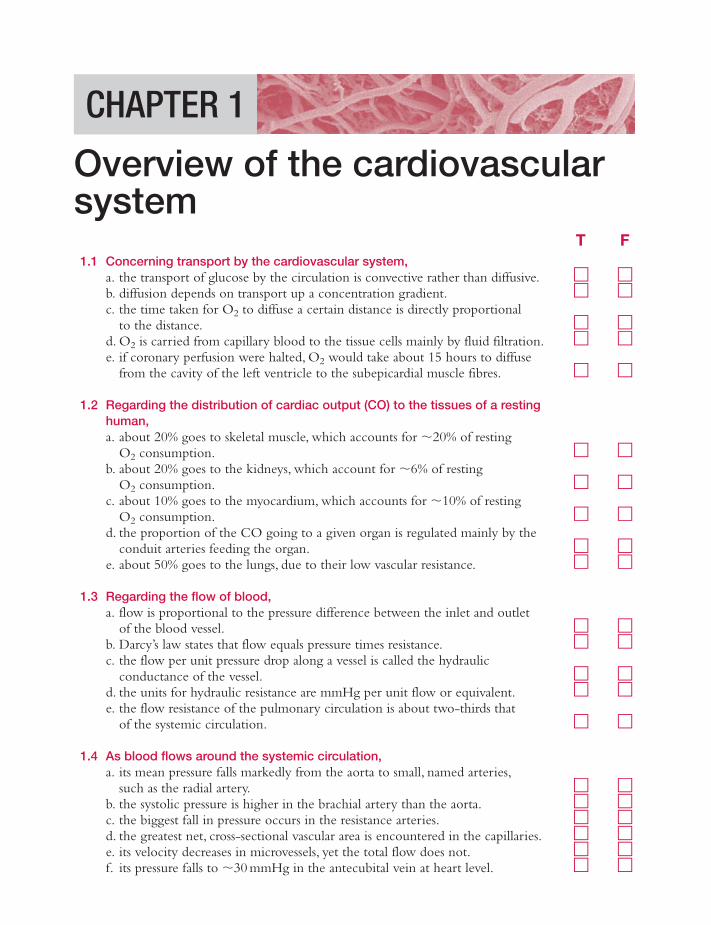
T F1.1 Concerning transport by the cardiovascular system,
a. the transport of glucose by the circulation is convective rather than diffusive. � �b. diffusion depends on transport up a concentration gradient. � �c. the time taken for O2 to diffuse a certain distance is directly proportional
to the distance. � �d. O2 is carried from capillary blood to the tissue cells mainly by fluid filtration. � �e. if coronary perfusion were halted, O2 would take about 15 hours to diffuse
from the cavity of the left ventricle to the subepicardial muscle fibres. � �
1.2 Regarding the distribution of cardiac output (CO) to the tissues of a restinghuman,a. about 20% goes to skeletal muscle, which accounts for �20% of resting
O2 consumption. � �b. about 20% goes to the kidneys, which account for �6% of resting
O2 consumption. � �c. about 10% goes to the myocardium, which accounts for �10% of resting
O2 consumption. � �d. the proportion of the CO going to a given organ is regulated mainly by the
conduit arteries feeding the organ. � �e. about 50% goes to the lungs, due to their low vascular resistance. � �
1.3 Regarding the flow of blood,a. flow is proportional to the pressure difference between the inlet and outlet
of the blood vessel. � �b. Darcy’s law states that flow equals pressure times resistance. � �c. the flow per unit pressure drop along a vessel is called the hydraulic
conductance of the vessel. � �d. the units for hydraulic resistance are mmHg per unit flow or equivalent. � �e. the flow resistance of the pulmonary circulation is about two-thirds that
of the systemic circulation. � �
1.4 As blood flows around the systemic circulation,a. its mean pressure falls markedly from the aorta to small, named arteries,
such as the radial artery. � �b. the systolic pressure is higher in the brachial artery than the aorta. � �c. the biggest fall in pressure occurs in the resistance arteries. � �d. the greatest net, cross-sectional vascular area is encountered in the capillaries. � �e. its velocity decreases in microvessels, yet the total flow does not. � �f. its pressure falls to �30 mmHg in the antecubital vein at heart level. � �
CHAPTER 1
Overview of the cardiovascularsystem
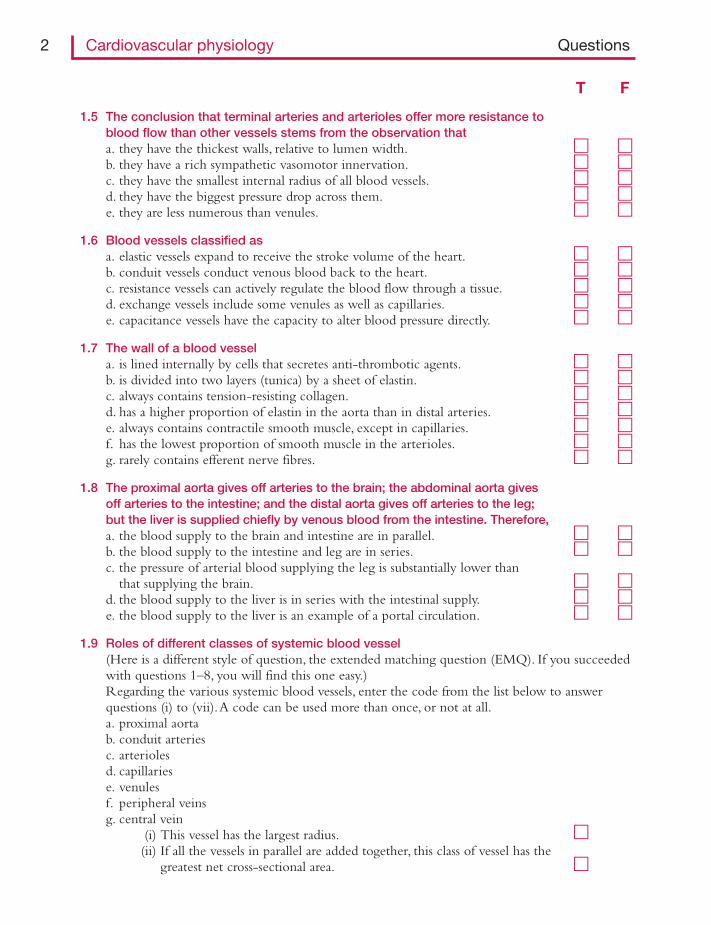
1.5 The conclusion that terminal arteries and arterioles offer more resistance toblood flow than other vessels stems from the observation thata. they have the thickest walls, relative to lumen width. � �b. they have a rich sympathetic vasomotor innervation. � �c. they have the smallest internal radius of all blood vessels. � �d. they have the biggest pressure drop across them. � �e. they are less numerous than venules. � �
1.6 Blood vessels classified asa. elastic vessels expand to receive the stroke volume of the heart. � �b. conduit vessels conduct venous blood back to the heart. � �c. resistance vessels can actively regulate the blood flow through a tissue. � �d. exchange vessels include some venules as well as capillaries. � �e. capacitance vessels have the capacity to alter blood pressure directly. � �
1.7 The wall of a blood vessela. is lined internally by cells that secretes anti-thrombotic agents. � �b. is divided into two layers (tunica) by a sheet of elastin. � �c. always contains tension-resisting collagen. � �d. has a higher proportion of elastin in the aorta than in distal arteries. � �e. always contains contractile smooth muscle, except in capillaries. � �f. has the lowest proportion of smooth muscle in the arterioles. � �g. rarely contains efferent nerve fibres. � �
1.8 The proximal aorta gives off arteries to the brain; the abdominal aorta givesoff arteries to the intestine; and the distal aorta gives off arteries to the leg;but the liver is supplied chiefly by venous blood from the intestine. Therefore,a. the blood supply to the brain and intestine are in parallel. � �b. the blood supply to the intestine and leg are in series. � �c. the pressure of arterial blood supplying the leg is substantially lower than
that supplying the brain. � �d. the blood supply to the liver is in series with the intestinal supply. � �e. the blood supply to the liver is an example of a portal circulation. � �
1.9 Roles of different classes of systemic blood vessel(Here is a different style of question, the extended matching question (EMQ). If you succeededwith questions 1–8, you will find this one easy.)Regarding the various systemic blood vessels, enter the code from the list below to answerquestions (i) to (vii).A code can be used more than once, or not at all.a. proximal aortab. conduit arteriesc. arteriolesd. capillariese. venulesf. peripheral veinsg. central vein
(i) This vessel has the largest radius. �(ii) If all the vessels in parallel are added together, this class of vessel has the
greatest net cross-sectional area. �
2 Cardiovascular physiology Questions
T F
(iii) This vessel has the slowest velocity of blood flow. �(iv) This vessel has the highest velocity of blood flow. �(v) This category of vessel has the greatest pressure drop across it. �(vi) These three types of vessel together contain around two-thirds of the
circulating blood volume. �(vii) This vessel actively regulates the blood flow through a tissue. �
Overview of the cardiovascular system Questions 3
Answers
1.1 a. T – The circulation evolved because convective transport (wash-along) is faster than diffusionover long distances.
b. F – Diffusion is a passive transport process down a concentration gradient (Figure 1.1).c. F – Einstein showed that the time increases as the square of distance.This is why diffusion is
so slow over distances of over a millimetre (Table 1.1).d. F – Transport from blood to tissue is by passive diffusion down the concentration gradient,
not fluid filtration down a pressure gradient (Figure 1.2).e. T – This is why the coronary circulation evolved (Table 1.1).
1.2 a. T – Organ blood flow is, as a broad generalization, related to the organ’s O2 consumption(Figure 1.3).
b. T – The high flow is ‘excessive’ relative to renal O2 demand, but is needed for adequate renalexcretion and urine production (Figure 1.3).
c. F – The myocardium receives only �4% of the cardiac output, despite the fact that itconsumes 10% of the oxygen (Figure 1.3).
d. F – It is not the wide, low-resistance conduit arteries that primarily regulate blood flow. It isthe fine arterioles and terminal arterial twigs – the resistance vessels. Dilatation of conduitarteries prevents their resistance becoming a flow-limiting factor during exercise.
e. F – What a silly question! The lungs of course receive the entire cardiac output of the rightventricle (Figure 1.4).
1.3 a. T – The difference in pressure,ΔP, provides the energy gradient driving the flow.b. F – Darcy’s law states the flow Q· equals pressure difference, divided by resistance; Q· � ΔP/R,
or equivalently Q· � ΔP � conductance K (Figure 1.5).c. T – From Darcy’s law, conductance K is Q· /ΔP (Figure 1.5).d. T – From Darcy’s law, resistance R is ΔP/Q· ; so the units of resistance are pressure difference
required to drive unit flow.e. F – The pulmonary circulation has a much lower resistance, namely �15% of systemic
resistance.This is proved by the low pulmonary artery pressure required to drive thecardiac output through the lungs.
1.4 a. F – Mean pressure falls by only a few mmHg in the named arteries, because they are wideand offer little resistance to flow.This is evident from the pressure profile of thecirculation (Figure 1.6).
b. T – Although the mean brachial arterial pressure is slightly lower than mean aortic pressure,brachial artery systolic pressure is actually higher than aortic systolic pressure, because theshape of the pressure wave changes as it travels distally (Figure 1.6).
c. T – Darcy’s law tell us that resistance is pressure drop per unit flow.The resistance vessels arethe terminal arteries and arterioles, as is evident from the large pressure drop across them(Figure 1.6).
d. T – Though narrow individually, there are millions of capillaries in parallel.This creates a verylarge total cross-sectional area, much bigger than that of the aorta (Figure 1.6).
e. T – The entire cardiac output (cm3/min) flows through the microcirculation, but its velocity(cm/min) is slowed by the very large, net cross-sectional area (cm2) of the microvessels(Figure 1.6). Note that velocity (cm/min) � flow (cm3/min) / area cm2.
f. F – Peripheral venous pressure at heart level is much lower, namely �8–10 mmHg(Figure 1.6).
4 Cardiovascular physiology Answers
1.5 a. F – The high wall/lumen ratio is true, but this does not prove that resistance is high.Resistance is pressure drop required to produce unit flow.
b. F – Again, the fact is true but it does not prove that resistance is high.c. F – Capillaries are even narrower, �5μm wide.d. T – Resistance is by definition the pressure drop required to produce unit flow (Darcy’s law).
The biggest pressure drop is across the terminal arteries and arterioles (Figure 1.6).e. F – Again the fact is true, but it does not prove their high resistance.
1.6 a. T – The aorta and major branches are elastin rich and expand to accommodate the strokevolume (Figure 1.7).
b. F – Conduit vessels are arteries with abundant smooth muscle that conduct blood to thetissues. Examples include the coronary arteries, cerebral arteries and popliteal artery.
c. T – Dilatation reduces their resistance and thus increases local perfusion (blood flow).Contraction increases resistance and thus reduces local blood flow.
d. T – Post-capillary venules, as well as capillaries, are permeable to water and respiratory gases.e. F – Capacitance vessels are veins.They serve as contractile, adjustable blood reservoirs.Any
effect on blood pressure is mediated indirectly, by changing the volume of blood in theheart (Starling’s law of the heart).
1.7 a. T – The endothelium secretes the anti-thrombotic agents nitric oxide and prostaglandins.b. F – There are three layers (tunica intima, tunica media, tunica adventitia), as defined by two
elastin sheets, the internal and external elastic laminae (Figure 1.8).c. T – Even the capillary has collagen (type IV) in its basal lamina; all other vessels also have
type I-III collagen fibrils throughout the wall.d. T – See Table 1.2. Elastin allows the aorta to stretch readily to accommodate the stroke
volume of the left ventricle.e. T – Smooth muscle makes up most of the tunica media in most vessels (Figure 1.8).f. F – Arterioles have the highest proportion of smooth muscle (Table 1.2).This enables them
to act as contractile ‘taps’ that regulate local blood flow and blood pressure.g. F – Most blood vessels, except capillaries, are innervated by sympathetic vasoconstrictor fibres
(Figure 1.8). Some also have afferent fibres, e.g. nociceptor (pain) fibres.
1.8 a. T – The plumbing is ‘in parallel’, by analogy with electrical circuits (Figure 1.4).b. F – These two circulations are again in parallel, as are most circulations (Figure 1.4).c. F – The arterial pressure is virtually identical in all parallel arteries, so the tissues are all
perfused by the same pressure head and receive blood with the same O2 content.This isthe big advantage of parallel plumbing.
d. T – Almost three-quarters of the liver’s blood supply comes from the portal vein, whichdrains the intestine (Figure 1.4).
e. T – A portal circulation delivers material directly from one organ to another without mixingin the general circulation.
1.9 (i) g (ii) d (iii) d (iv) a (v) c (vi) e, f, g. (vii) c
Overview of the cardiovascular system Answers 5
T F2.1 During cardiac development in the fetus,
a. the ductus arteriosus shunts blood from the aorta into pulmonary trunk. � �b. the foramen ovale remains open until birth. � �c. the coronary sinus does not open until birth. � �d. failure of the atrial or ventricular septum to close causes cyanosis after birth. � �e. transposition of the major vessels occurs in Fallot’s tetralogy. � �
2.2 During the cardiac cycle of a human adult,a. pressure is higher in the left atrium than right atrium. � �b. ventricular filling depends mainly on atrial contraction. � �c. the ventricle fills fastest during early diastole. � �d. the atria and ventricles contract simultaneously during systole. � �e. systole is initiated in the left atrium. � �
2.3 With reference to the cardiac cycle,a. right atrial pressure is typically 3–5 mmHg. � �b. the work of the right ventricle is greater than the work of the left ventricle. � �c. the first heart sound occurs at the end of the isovolumetric contraction phase. � �d. two-thirds of the blood in the ventricle is ejected during systole in a resting
human. � �e. the QRS complex of the ECG immediately precedes the isovolumetric
contraction phase. � �
2.4 Ventricular fillinga. begins as soon as the aortic valve closes. � �b. is increasingly dependent on atrial contraction during exercise. � �c. can cause a third heart sound in some healthy people. � �d. is boosted initially by the elastic recoil of the ventricle wall. � �e. influences the force of the next heart beat. � �
2.5 The right ventriclea. receives blood through the mitral valve. � �b. ejects less blood than the left ventricle because its wall is thinner. � �c. blood has an O2 content which is approximately three-quarters that
of aortic blood in a resting human. � �d. raises pulmonary blood pressure to �100 mmHg during ejection. � �e. is connected to the left atrium by the ductus arteriosus before birth. � �
2.6. Isovolumetric contraction is closely associated witha. the first heart sound. � �b. the P wave of the ECG. � �
CHAPTER 2
The cardiac cycle
The cardiac cycle Questions 7
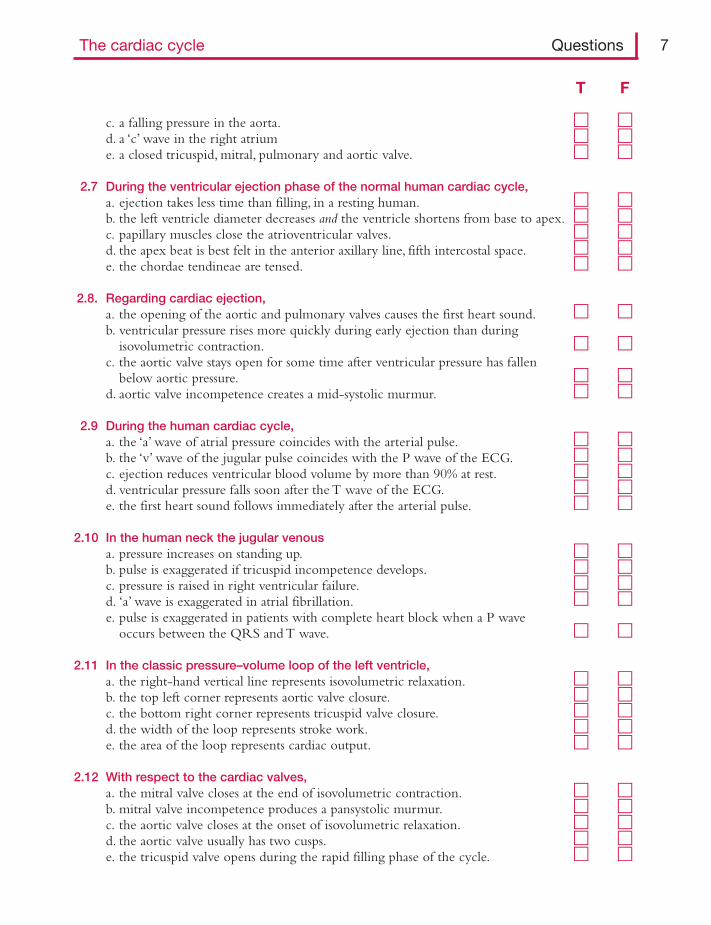
c. a falling pressure in the aorta. � �d. a ‘c’ wave in the right atrium � �e. a closed tricuspid, mitral, pulmonary and aortic valve. � �
2.7 During the ventricular ejection phase of the normal human cardiac cycle,a. ejection takes less time than filling, in a resting human. � �b. the left ventricle diameter decreases and the ventricle shortens from base to apex. � �c. papillary muscles close the atrioventricular valves. � �d. the apex beat is best felt in the anterior axillary line, fifth intercostal space. � �e. the chordae tendineae are tensed. � �
2.8. Regarding cardiac ejection,a. the opening of the aortic and pulmonary valves causes the first heart sound. � �b. ventricular pressure rises more quickly during early ejection than during
isovolumetric contraction. � �c. the aortic valve stays open for some time after ventricular pressure has fallen
below aortic pressure. � �d. aortic valve incompetence creates a mid-systolic murmur. � �
2.9 During the human cardiac cycle,a. the ‘a’ wave of atrial pressure coincides with the arterial pulse. � �b. the ‘v’ wave of the jugular pulse coincides with the P wave of the ECG. � �c. ejection reduces ventricular blood volume by more than 90% at rest. � �d. ventricular pressure falls soon after the T wave of the ECG. � �e. the first heart sound follows immediately after the arterial pulse. � �
2.10 In the human neck the jugular venousa. pressure increases on standing up. � �b. pulse is exaggerated if tricuspid incompetence develops. � �c. pressure is raised in right ventricular failure. � �d. ‘a’ wave is exaggerated in atrial fibrillation. � �e. pulse is exaggerated in patients with complete heart block when a P wave
occurs between the QRS and T wave. � �
2.11 In the classic pressure–volume loop of the left ventricle,a. the right-hand vertical line represents isovolumetric relaxation. � �b. the top left corner represents aortic valve closure. � �c. the bottom right corner represents tricuspid valve closure. � �d. the width of the loop represents stroke work. � �e. the area of the loop represents cardiac output. � �
2.12 With respect to the cardiac valves,a. the mitral valve closes at the end of isovolumetric contraction. � �b. mitral valve incompetence produces a pansystolic murmur. � �c. the aortic valve closes at the onset of isovolumetric relaxation. � �d. the aortic valve usually has two cusps. � �e. the tricuspid valve opens during the rapid filling phase of the cycle. � �
T F
8 Cardiovascular physiology Questions
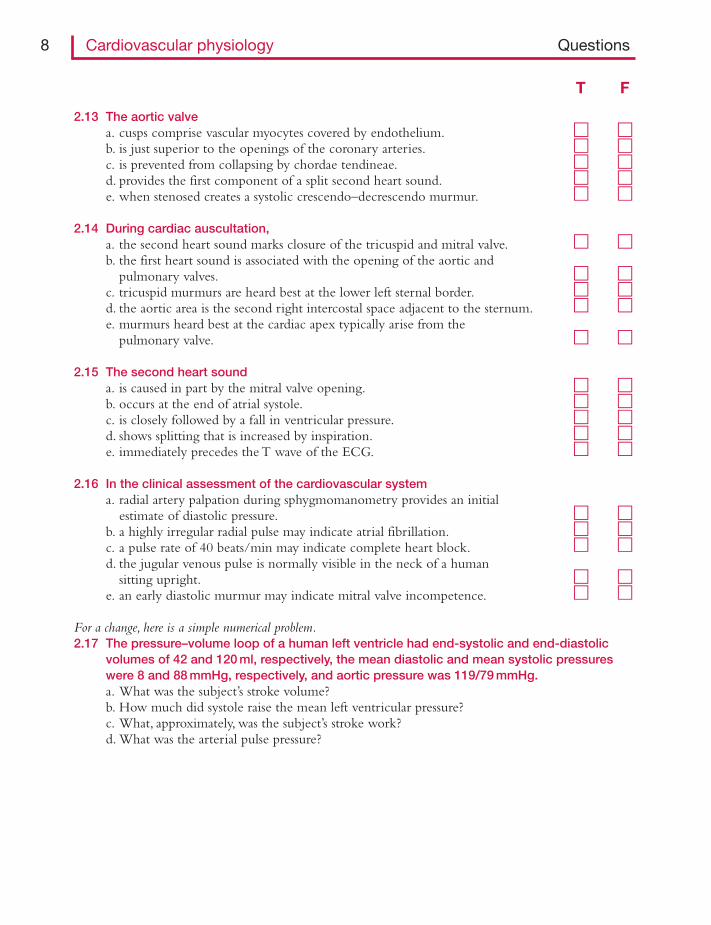
2.13 The aortic valvea. cusps comprise vascular myocytes covered by endothelium. � �b. is just superior to the openings of the coronary arteries. � �c. is prevented from collapsing by chordae tendineae. � �d. provides the first component of a split second heart sound. � �e. when stenosed creates a systolic crescendo–decrescendo murmur. � �
2.14 During cardiac auscultation,a. the second heart sound marks closure of the tricuspid and mitral valve. � �b. the first heart sound is associated with the opening of the aortic and
pulmonary valves. � �c. tricuspid murmurs are heard best at the lower left sternal border. � �d. the aortic area is the second right intercostal space adjacent to the sternum. � �e. murmurs heard best at the cardiac apex typically arise from the
pulmonary valve. � �
2.15 The second heart sounda. is caused in part by the mitral valve opening. � �b. occurs at the end of atrial systole. � �c. is closely followed by a fall in ventricular pressure. � �d. shows splitting that is increased by inspiration. � �e. immediately precedes the T wave of the ECG. � �
2.16 In the clinical assessment of the cardiovascular systema. radial artery palpation during sphygmomanometry provides an initial
estimate of diastolic pressure. � �b. a highly irregular radial pulse may indicate atrial fibrillation. � �c. a pulse rate of 40 beats/min may indicate complete heart block. � �d. the jugular venous pulse is normally visible in the neck of a human
sitting upright. � �e. an early diastolic murmur may indicate mitral valve incompetence. � �
For a change, here is a simple numerical problem.2.17 The pressure–volume loop of a human left ventricle had end-systolic and end-diastolic
volumes of 42 and 120 ml, respectively, the mean diastolic and mean systolic pressureswere 8 and 88 mmHg, respectively, and aortic pressure was 119/79 mmHg.a. What was the subject’s stroke volume?b. How much did systole raise the mean left ventricular pressure?c. What, approximately, was the subject’s stroke work?d. What was the arterial pulse pressure?
T F
The cardiac cycle Answers 9
Answers
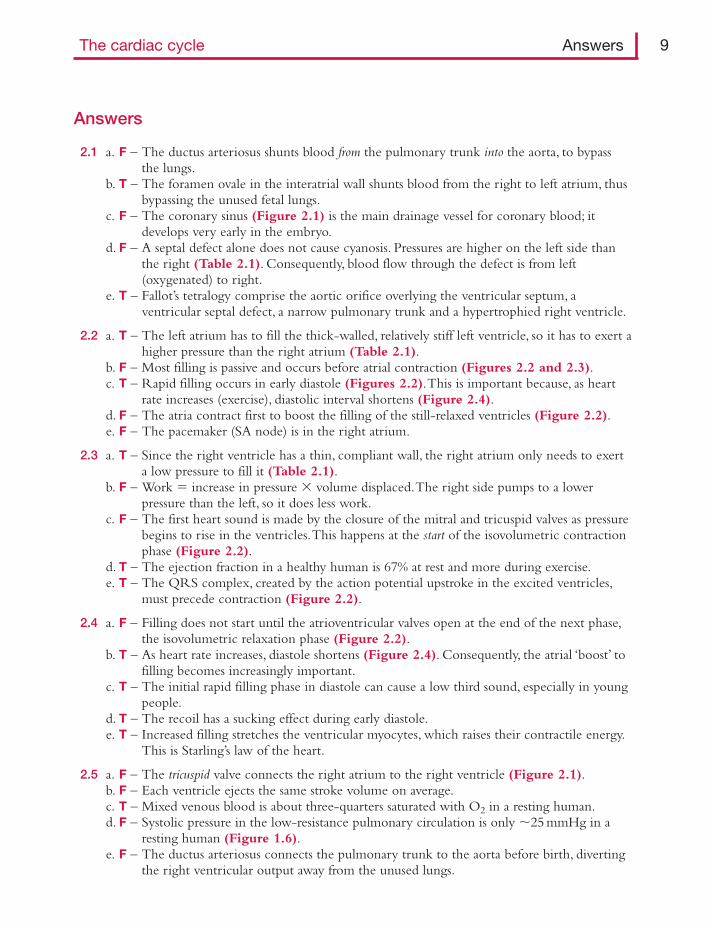
2.1 a. F – The ductus arteriosus shunts blood from the pulmonary trunk into the aorta, to bypassthe lungs.
b. T – The foramen ovale in the interatrial wall shunts blood from the right to left atrium, thusbypassing the unused fetal lungs.
c. F – The coronary sinus (Figure 2.1) is the main drainage vessel for coronary blood; itdevelops very early in the embryo.
d. F – A septal defect alone does not cause cyanosis. Pressures are higher on the left side thanthe right (Table 2.1). Consequently, blood flow through the defect is from left(oxygenated) to right.
e. T – Fallot’s tetralogy comprise the aortic orifice overlying the ventricular septum, aventricular septal defect, a narrow pulmonary trunk and a hypertrophied right ventricle.
2.2 a. T – The left atrium has to fill the thick-walled, relatively stiff left ventricle, so it has to exert ahigher pressure than the right atrium (Table 2.1).
b. F – Most filling is passive and occurs before atrial contraction (Figures 2.2 and 2.3).c. T – Rapid filling occurs in early diastole (Figures 2.2).This is important because, as heart
rate increases (exercise), diastolic interval shortens (Figure 2.4).d. F – The atria contract first to boost the filling of the still-relaxed ventricles (Figure 2.2).e. F – The pacemaker (SA node) is in the right atrium.
2.3 a. T – Since the right ventricle has a thin, compliant wall, the right atrium only needs to exerta low pressure to fill it (Table 2.1).
b. F – Work � increase in pressure � volume displaced.The right side pumps to a lowerpressure than the left, so it does less work.
c. F – The first heart sound is made by the closure of the mitral and tricuspid valves as pressurebegins to rise in the ventricles.This happens at the start of the isovolumetric contractionphase (Figure 2.2).
d. T – The ejection fraction in a healthy human is 67% at rest and more during exercise.e. T – The QRS complex, created by the action potential upstroke in the excited ventricles,
must precede contraction (Figure 2.2).
2.4 a. F – Filling does not start until the atrioventricular valves open at the end of the next phase,the isovolumetric relaxation phase (Figure 2.2).
b. T – As heart rate increases, diastole shortens (Figure 2.4). Consequently, the atrial ‘boost’ tofilling becomes increasingly important.
c. T – The initial rapid filling phase in diastole can cause a low third sound, especially in youngpeople.
d. T – The recoil has a sucking effect during early diastole.e. T – Increased filling stretches the ventricular myocytes, which raises their contractile energy.
This is Starling’s law of the heart.
2.5 a. F – The tricuspid valve connects the right atrium to the right ventricle (Figure 2.1).b. F – Each ventricle ejects the same stroke volume on average.c. T – Mixed venous blood is about three-quarters saturated with O2 in a resting human.d. F – Systolic pressure in the low-resistance pulmonary circulation is only �25 mmHg in a
resting human (Figure 1.6).e. F – The ductus arteriosus connects the pulmonary trunk to the aorta before birth, diverting
the right ventricular output away from the unused lungs.
10 Cardiovascular physiology Answers
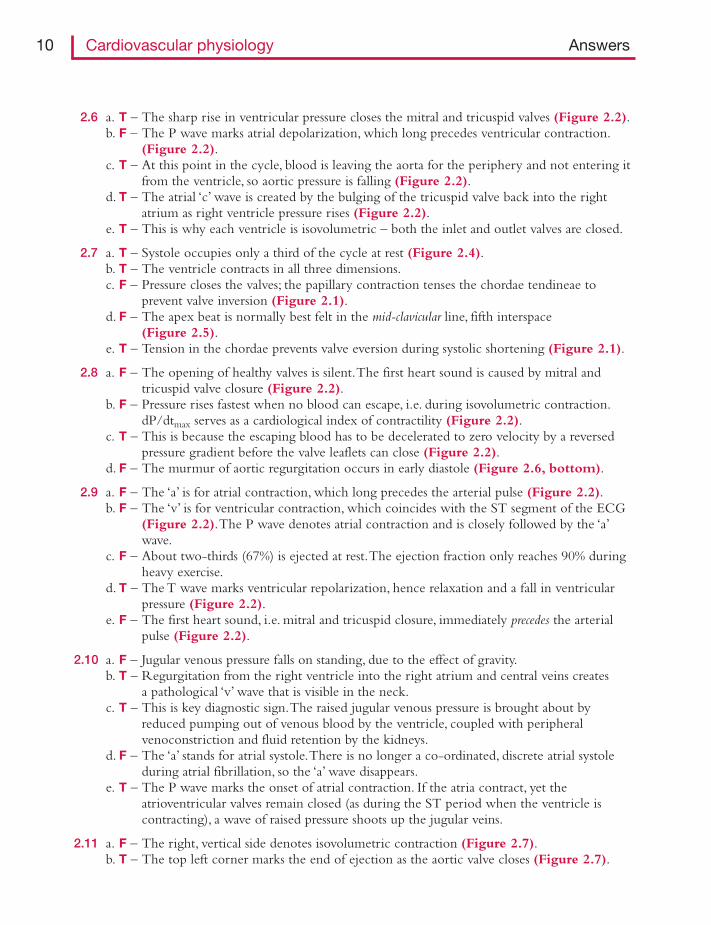
2.6 a. T – The sharp rise in ventricular pressure closes the mitral and tricuspid valves (Figure 2.2).b. F – The P wave marks atrial depolarization, which long precedes ventricular contraction.
(Figure 2.2).c. T – At this point in the cycle, blood is leaving the aorta for the periphery and not entering it
from the ventricle, so aortic pressure is falling (Figure 2.2).d. T – The atrial ‘c’ wave is created by the bulging of the tricuspid valve back into the right
atrium as right ventricle pressure rises (Figure 2.2).e. T – This is why each ventricle is isovolumetric – both the inlet and outlet valves are closed.
2.7 a. T – Systole occupies only a third of the cycle at rest (Figure 2.4).b. T – The ventricle contracts in all three dimensions.c. F – Pressure closes the valves; the papillary contraction tenses the chordae tendineae to
prevent valve inversion (Figure 2.1).d. F – The apex beat is normally best felt in the mid-clavicular line, fifth interspace
(Figure 2.5).e. T – Tension in the chordae prevents valve eversion during systolic shortening (Figure 2.1).
2.8 a. F – The opening of healthy valves is silent.The first heart sound is caused by mitral andtricuspid valve closure (Figure 2.2).
b. F – Pressure rises fastest when no blood can escape, i.e. during isovolumetric contraction.dP/dtmax serves as a cardiological index of contractility (Figure 2.2).
c. T – This is because the escaping blood has to be decelerated to zero velocity by a reversedpressure gradient before the valve leaflets can close (Figure 2.2).
d. F – The murmur of aortic regurgitation occurs in early diastole (Figure 2.6, bottom).
2.9 a. F – The ‘a’ is for atrial contraction, which long precedes the arterial pulse (Figure 2.2).b. F – The ‘v’ is for ventricular contraction, which coincides with the ST segment of the ECG
(Figure 2.2).The P wave denotes atrial contraction and is closely followed by the ‘a’wave.
c. F – About two-thirds (67%) is ejected at rest.The ejection fraction only reaches 90% duringheavy exercise.
d. T – The T wave marks ventricular repolarization, hence relaxation and a fall in ventricularpressure (Figure 2.2).
e. F – The first heart sound, i.e. mitral and tricuspid closure, immediately precedes the arterialpulse (Figure 2.2).
2.10 a. F – Jugular venous pressure falls on standing, due to the effect of gravity.b. T – Regurgitation from the right ventricle into the right atrium and central veins creates
a pathological ‘v’ wave that is visible in the neck.c. T – This is key diagnostic sign.The raised jugular venous pressure is brought about by
reduced pumping out of venous blood by the ventricle, coupled with peripheralvenoconstriction and fluid retention by the kidneys.
d. F – The ‘a’ stands for atrial systole.There is no longer a co-ordinated, discrete atrial systoleduring atrial fibrillation, so the ‘a’ wave disappears.
e. T – The P wave marks the onset of atrial contraction. If the atria contract, yet theatrioventricular valves remain closed (as during the ST period when the ventricle iscontracting), a wave of raised pressure shoots up the jugular veins.
2.11 a. F – The right, vertical side denotes isovolumetric contraction (Figure 2.7).b. T – The top left corner marks the end of ejection as the aortic valve closes (Figure 2.7).
The cardiac cycle Answers 11
c. F – The bottom right corner marks mitral valve closure, because the loop depicts the leftventricle.
d. F – The width of the loop equals the stroke volume (Figure 2.7).e. F – Cardiac output is heart rate � stroke volume.The area of the loop, pressure � volume,
is called the stroke work.
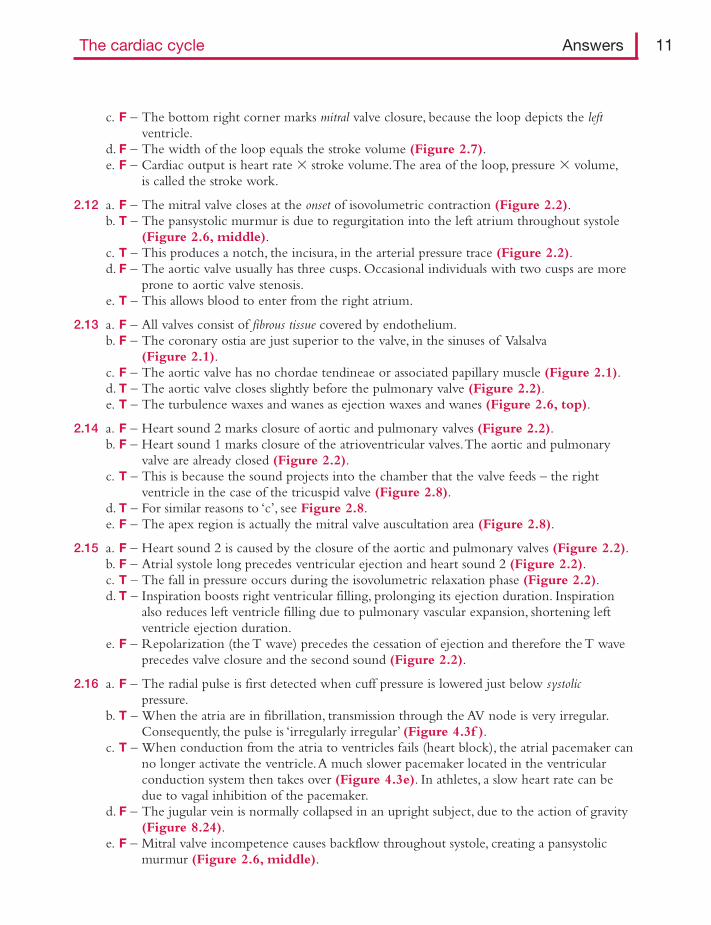
2.12 a. F – The mitral valve closes at the onset of isovolumetric contraction (Figure 2.2).b. T – The pansystolic murmur is due to regurgitation into the left atrium throughout systole
(Figure 2.6, middle).c. T – This produces a notch, the incisura, in the arterial pressure trace (Figure 2.2).d. F – The aortic valve usually has three cusps. Occasional individuals with two cusps are more
prone to aortic valve stenosis.e. T – This allows blood to enter from the right atrium.
2.13 a. F – All valves consist of fibrous tissue covered by endothelium.b. F – The coronary ostia are just superior to the valve, in the sinuses of Valsalva
(Figure 2.1).c. F – The aortic valve has no chordae tendineae or associated papillary muscle (Figure 2.1).d. T – The aortic valve closes slightly before the pulmonary valve (Figure 2.2).e. T – The turbulence waxes and wanes as ejection waxes and wanes (Figure 2.6, top).
2.14 a. F – Heart sound 2 marks closure of aortic and pulmonary valves (Figure 2.2).b. F – Heart sound 1 marks closure of the atrioventricular valves.The aortic and pulmonary
valve are already closed (Figure 2.2).c. T – This is because the sound projects into the chamber that the valve feeds – the right
ventricle in the case of the tricuspid valve (Figure 2.8).d. T – For similar reasons to ‘c’, see Figure 2.8.e. F – The apex region is actually the mitral valve auscultation area (Figure 2.8).
2.15 a. F – Heart sound 2 is caused by the closure of the aortic and pulmonary valves (Figure 2.2).b. F – Atrial systole long precedes ventricular ejection and heart sound 2 (Figure 2.2).c. T – The fall in pressure occurs during the isovolumetric relaxation phase (Figure 2.2).d. T – Inspiration boosts right ventricular filling, prolonging its ejection duration. Inspiration
also reduces left ventricle filling due to pulmonary vascular expansion, shortening leftventricle ejection duration.
e. F – Repolarization (the T wave) precedes the cessation of ejection and therefore the T waveprecedes valve closure and the second sound (Figure 2.2).
2.16 a. F – The radial pulse is first detected when cuff pressure is lowered just below systolicpressure.
b. T – When the atria are in fibrillation, transmission through the AV node is very irregular.Consequently, the pulse is ‘irregularly irregular’ (Figure 4.3f ).
c. T – When conduction from the atria to ventricles fails (heart block), the atrial pacemaker canno longer activate the ventricle.A much slower pacemaker located in the ventricularconduction system then takes over (Figure 4.3e). In athletes, a slow heart rate can bedue to vagal inhibition of the pacemaker.
d. F – The jugular vein is normally collapsed in an upright subject, due to the action of gravity(Figure 8.24).
e. F – Mitral valve incompetence causes backflow throughout systole, creating a pansystolicmurmur (Figure 2.6, middle).
2.17 a. 78 ml. Stroke volume is end-diastolic volume (120 ml) minus end-systolic volume (42 ml)(Figure 2.7).
b. 80 mmHg – i.e. mean systolic pressures 88 mmHg minus mean diastolic pressure 8 mmHg(Figure 2.7).
c. 6240 ml.mmHg. Stroke work is increase in pressure � volume ejected, i.e. 80 mmHg � 78 ml.Stroke work is the area inside the pressure–volume loop.
d. 40 mmHg. Pulse pressure is systolic pressure, 119 mmHg, minus diastolic pressure, 79 mmHg(Figure 8.7).
12 Cardiovascular physiology Answers
T F3.1 The myocardium
a. contains myocytes that depolarize spontaneously. � �b. contains myocytes that do not depolarize spontaneously. � �c. is excited fractionally earlier in the right atrium than the left atrium. � �d. conducts propagating currents directly from atrial to ventricular myocytes. � �e. exhibits the phenomenon of ‘dominance’. � �
3.2 Ventricular myocytesa. are non-striated muscle fibres. � �b. comprise approximately one-third mitochondria by volume, due to a
dependence on aerobic metabolism. � �c. are electrically insulated from one another by gap junctions. � �d. are bound together by cadherin molecules at desmosomes junctions. � �e. differ from skeletal muscle fibres by lacking a transverse tubular system. � �
3.3 Concerning myocardial contractile proteins,a. the thick filament is a polymer of actin molecules. � �b. the filaments between two Z lines make up a sarcomere. � �c. myosin-binding sites on actin are blocked during diastole by K� ions. � �d. myosin-binding sites on actin are indirectly activated in systole by Ca2� ions. � �e. the force of contraction is independent of the number of crossbridges formed. � �
3.4 The sarcoplasm of a resting cardiac myocytea. has a K� concentration 30–40 times higher than that of extracellular fluid. � �b. has a high Na� concentration, due to the sarcolemmal Na-K pump. � �c. has a low Ca2� concentration in diastole, due partly to a sarcolemmal
Na�–Ca2� exchanger. � �d. is in ionic equilibrium with the sarcoplasmic reticulum. � �e. has a raised Na� concentration in the presence of digoxin. � �
3.5 The resting membrane potential of a ventricular myocytea. is around �80 volts. � �b. is generated chiefly by the electrogenic effect of the 3Na�–2K� pump. � �c. is nearly, but not quite, a Nernst equilibrium potential for K�. � �d. is made less negative by a background inward current of Na� ions. � �e. is reduced by hyperkalaemia. � �
CHAPTER 3
Cardiac myocyte excitation and contraction
3.6 The action potential of a human ventricular myocytea. has a duration of 20–30 milliseconds. � �b. has a long duration due mainly to the prolonged activation of Na� channels. � �c. exhibits a plateau, during which the ventricle is already contracting. � �d. is associated with an early fall in sarcolemmal permeability to K+ ions. � �e. has a shorter duration in subepicardial than subendocardial myocytes. � �
3.7. The action potential of an atrial or ventricular myocytea. reaches �20–30 mV, due to the opening of voltage-sensitive sodium channels. � �b. is triggered by sympathetic nerve fibres. � �c. is associated with an influx of extracellular Ca2� ions into the myocyte. � �d. causes a release of Ca2� ions from a store within the myocyte. � �e. is prolonged by β1-adrenoceptor stimulation. � �
3.8. Concerning the excitation of a cardiac ventricular myocyte,a. Na� influx during the action potential raise the intracellular Na�
concentration by �10%. � �b. a very slow depolarization closes many Na� channels. � �c. the plateau inward current is increased by sympathetic stimulation. � �d. the absolute refractory period is approximately as long as active contraction. � �e. repolarization is brought about mainly by the 3Na�–2K� pump. � �
3.9 During cardiac excitation–contraction coupling,a. extracellular Ca2� entry triggers the contractile process. � �b. the contractile force is proportional to the amount of Ca2� released from the
sarcoplasmic reticulum. � �c. the re-uptake of Ca2� into the SR store is brought about chiefly
by the Na�–Ca2� exchanger. � �d. the sarcoplasmic store of Ca2� can be enhanced by sympathetic stimulation. � �e. the sarcoplasmic store of Ca2� can be reduced by digoxin. � �
3.10. The force of cardiac contraction can be raised bya. caffeine, which raises intracellular cyclic AMP. � �b. shortening the sarcomere during diastole. � �c. adrenaline, which increases sarcolemmal Ca2� channel activity. � �d. the phosphodiesterase inhibitor milrinone, which reduce intracellular
cyclic AMP. � �e. verapamil and diltiazem, which inhibit potassium channels. � �
3.11 A delayed after-depolarization (DAD) isa. a premature depolarization during repolarization (phase 3). � �b. often associated with a high cardiac sympathetic activity. � �c. triggered by a sudden uptake of Ca2� by the sarcoplasmic reticulum � �d. mediated by an increased turnover of the sarcolemmal Na�–Ca2� exchanger. � �e. a common trigger for arrhythmia in an ischaemic heart. � �
14 Cardiovascular physiology Questions
T F
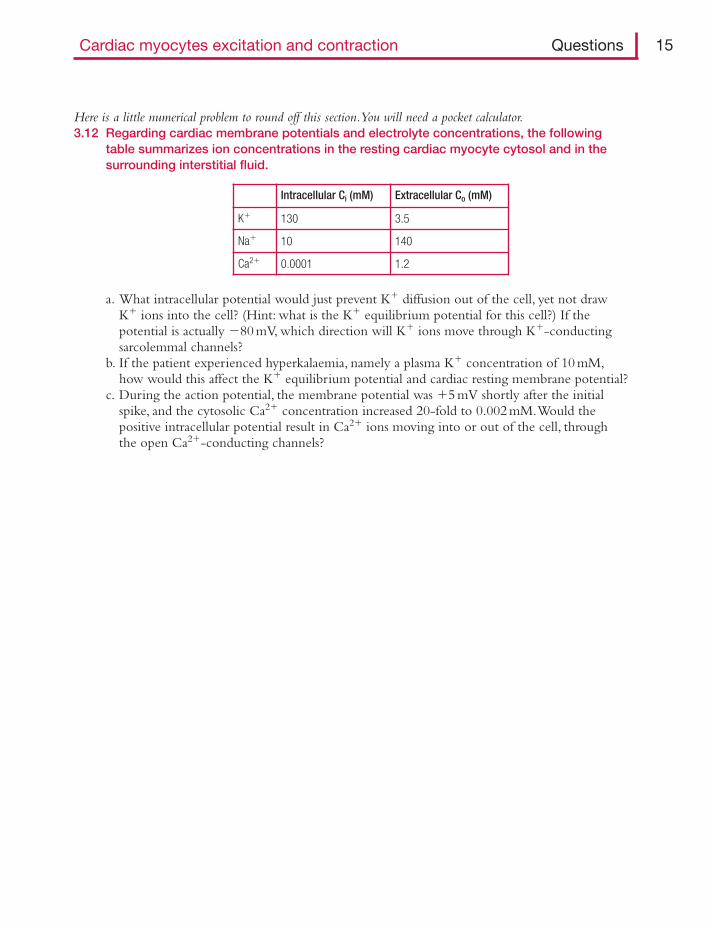
Here is a little numerical problem to round off this section.You will need a pocket calculator.3.12 Regarding cardiac membrane potentials and electrolyte concentrations, the following
table summarizes ion concentrations in the resting cardiac myocyte cytosol and in thesurrounding interstitial fluid.
Cardiac myocytes excitation and contraction Questions 15
Intracellular Ci (mM) Extracellular Co (mM)
K� 130 3.5
Na� 10 140
Ca2� 0.0001 1.2
a. What intracellular potential would just prevent K� diffusion out of the cell, yet not drawK� ions into the cell? (Hint: what is the K� equilibrium potential for this cell?) If thepotential is actually �80 mV, which direction will K� ions move through K�-conductingsarcolemmal channels?
b. If the patient experienced hyperkalaemia, namely a plasma K� concentration of 10 mM,how would this affect the K� equilibrium potential and cardiac resting membrane potential?
c. During the action potential, the membrane potential was �5 mV shortly after the initialspike, and the cytosolic Ca2� concentration increased 20-fold to 0.002 mM.Would thepositive intracellular potential result in Ca2� ions moving into or out of the cell, throughthe open Ca2�-conducting channels?
Answers
3.1 a. T – Pacemaker cells and Purkinje fibres (Figure 3.1) depolarize spontaneously albeit atdifferent rates. Both are specialized types of cardiac myocytes.
b. T – The vast majority of cardiac myocytes do not depolarize spontaneously.The ventricularmyocyte is an example (Figure 3.1).
c. T – The pacemaker (sino-atrial node) is in the right atrium, near the superior vena cavajunction (Figure 3.2). Consequently, the right atrial myocytes are activated earliest.
d. F – The fibrotendinous ring (annulus fibrosus) blocks direct conduction (Figure 2.5).The only electrically conductive connection is the bundle of His (Figure 3.2).
e. T – The SA pacemaker dominates myocytes with a lower depolarization rate, such as thePurkinje fibres.The slower pacemakers are revealed in heart block.
3.2 a. F – The sarcomeres are aligned in register by Z lines, so cardiac myocytes appear striated(Figure 3.3).
b. T – The abundance of mitochondria is shown in Figure 3.3. Myocyte contractility is tightlycoupled to mitochondrial ATP generation by oxidative phosphorylation.
c. F – Gap junctions are formed by connexons. Connexons link the cytoplasm of adjacentmyocytes. Consequently, myocardium behaves like an electrically continuous sheet – an‘electrical syncytium’ (Figure 3.3).
d. T – The desmosomes rivet the cells together in the intercalated disc (Figure 3.3).e. F – The invaginating, transverse tubular system is well developed in ventricular myocytes,
though not in atrial myocytes (Figure 3.3).
3.3 a. F – The thick filament consists of �400 myosin molecules (Figure 3.4).b. T – The thin actin filaments on either side of the thick filament are rooted in the Z lines,
making up a sarcomere (Figure 3.3).c. F – They are blocked by tropomyosin (Figure 3.4).d. T – The blocking tropomyosin is shifted out of the way when the troponin complex is
activated by Ca2� ions (Figure 3.4).e. F – Force is directly proportional to the number of crossbridges.
3.4 a. T – Intracellular [K�] is typically 140 mM, extracellular concentration is �4 mM K�, and theratio is �35 (Table 3.1).
b. F – The pump extrudes Na� from the cell, so intracellular Na� is only �10 mM, comparedwith 140 mM in extracellular fluid (Figure 3.5).
c. T – In its usual ‘forward’ mode, the exchanger transfers Ca2� outwards, driven by a Na�
influx down the Na� concentration gradient (Figure 3.5).d. F – The SR stores Ca2� at a far higher concentration (�1 mM) than in the sarcoplasm
(0.1μM at rest) (Figure 3.6).e. T – Digoxin’s primary action is to inhibit the Na�–K� pump.The resulting rise in
intracellular Na� reduces the Na� gradient driving the Na–Ca exchanger, so intracellularCa2� levels increase too (Figure 3.6).
3.5 a. F – Membrane potential is around �80 millivolts (Figure 3.1).b. F – The pump contributes only a few mV. The potential is set up mainly by the diffusion
of K� ions out of the cell through inward rectifier K� channels, Kir (Figure 3.5).c. T – At the Nernst equilibrium potential, the outward diffusion tendency is exactly offset
by the inward electrical attraction for the cation. For K�, this would happen ataround �94 mV.
16 Cardiovascular physiology Answers
d. T – An inward Na� ‘leak’ reduces the membrane potential to below the Nernst value(Figure 3.5).
e. T – Hyperkalaemia depolarizes the myocyte (Figure 3.7).This follows from the Nernstequation, which states that the potential depends on the logarithm of the ratio of ionconcentration inside and outside the membrane (Figure 3.8).The logarithm of 1(equal concentrations) is zero.
3.6 a. F – A cardiac action potential lasts much longer, 200–300 ms (Figure 3.1).b. F – The long plateau is caused by Ca2�-channel activation, and later the 3Na�–Ca2�
exchanger current.c. T – Contraction begins soon after the initial depolarization; ejection has already peaked by
the end of the plateau (Figure 3.9).d. T – The reduced open-state of the inward rectifier channel Kir reduces K� ion loss during
the long cardiac action potential (Figure 3.10).e. T – This determines the QT interval of an ECG and accounts for the fact that the T wave is
upright, even though repolarization is the reverse of depolarization (Figure 5.2).
3.7 a. T – The peak of the action potential approaches, but does not quite reach, the Nernst Na�
equilibrium potential of �70 mV (Figure 3.1).b. F – Unlike skeletal muscle, cardiac contraction is not initiated by external motor nerves. It is
initiated by an internal pacemaker, the SA node.c. T – Depolarization activates voltage-dependent L-type Ca2� channels in the T-tubules and
surface sarcolemma, allowing extracellular Ca2� ions to move down the steepconcentration gradient (Figure 3.6).
d. T – Although extracellular Ca2� influx accounts for 10–25% of the rise in intracellular Ca2�,three-quarters or more comes from the partial discharge of the sarcoplasmic reticulumstore, triggered by calcium-induced calcium release (Figure 3.6).
e. F – Sympathetic noradrenaline and circulating adrenaline activate β1-adrenoceptors on themyocytes.This shortens the action potential, so that more can be fitted into each minuteas the heart rate increases (Figure 3.11).
3.8 a. F – The number of Na� ions entering the cell per action potential is very small relative tothe number present – around 0.02% – so intracellular Na� concentration is notmaterially altered by a single action potential.
b. T – Although rapid depolarization activates voltage-gated Na� channels, slowdepolarization (e.g. by chronic hyperkalaemia) allows time for the inactivation gatesto close (Figure 3.12).
c. T – Beta-adrenergic stimulation increase the inward Ca2� current, leading to a dome-shapedplateau and increased contractility (Figure 3.11).
d. T – The absolute refractory period extends from the onset of depolarization to mid-repolarization, by which time relaxation is just beginning (Figure 3.9).
e. F – Repolarization is brought about mainly by a passive outward K� current through Kvand Kir channels (Figure 3.13).
3.9 a. T – Ca2� influx through L-type Ca2� channels activates Ca2�-release channels (ryanodinereceptors) on the sarcoplasmic reticulum.This raises cytosolic Ca2� concentrationsufficiently to initiate contraction (Figure 3.6).
b. T – The number of crossbridges formed is proportional to cytosolic Ca2� concentration.c. F – Ca2� re-uptake into the SR store is due chiefly to an energy-dependent Ca2�-ATPase
pump (Figure 3.6).
Cardiac myocytes excitation and contraction Answers 17
d. T – Beta-adrenoceptor activation by the sympathetic neurotransmitter noradrenaline(1) stimulates the SR Ca2� pump (by reducing the tonic inhibition of the pump byphospholamban) and (2) increases extracellular Ca2� influx through sarcolemmal L-typeCa2� channels (Figure 3.14).
e. F – Digoxin increases the SR Ca2� store and thus the size of the systolic Ca2� transient(Figure 3.15).The primary action of digoxin is to inhibit, partially, the sarcolemmalNa–K pump (Figure 3.6).The ensuing rise in intracellular Na� reduces the gradientdriving the sarcolemmal Na�–Ca2� exchanger, so less Ca2� is expelled from the cell.
3.10 a. T – Caffeine inhibits phosphodiesterase III, the enzyme that normally breaks down cAMP(Figure 3.14). Caffeine therefore raises cAMP, just like adrenaline and noradrenaline.
b. F – Stretch increases contractile force, by increasing the sensitivity of the actin-myosin toCa2�.This is the cellular basis of Starling’s law of the heart.
c. T – In addition, adrenaline disinhibits the SR Ca2� pump to increase store size(Figure 3.14).Adrenaline acts by activating the β-adrenoceptor-cAMP pathway.
d. F – Inhibitors of phosphodiesterase III (milrinone and amrinone) raise cAMP levels andhence contractile force (Figure 3.14).They are sometimes used to support the acutelyfailing heart.
e. F – These drugs are cardiac Ca2� channel blockers, so they weaken the heart beat.
3.11 a. F – This would be an early after-depolarization (EAD).A DAD occurs during diastole(Figure 3.16).
b. T – Excessive β-adrenoceptor stimulation by high sympathetic activity can overload the SRstore with Ca2�. Store release in diastole causes the DAD.
c. F – A DAD is initiated by a sudden spontaneous discharge of the SR Ca2� store(Figure 3.16).
d. T – The rise in sarcoplasmic Ca2� increases the forward-mode turnover of the 3Na�–Ca2�
exchanger to expel Ca2�.The turnover carries a net depolarizing positive charge (Na�)into the cell.
e. T – The DAD is a common cause of arrhythmia in chronic cardiac failure and heart attacks.
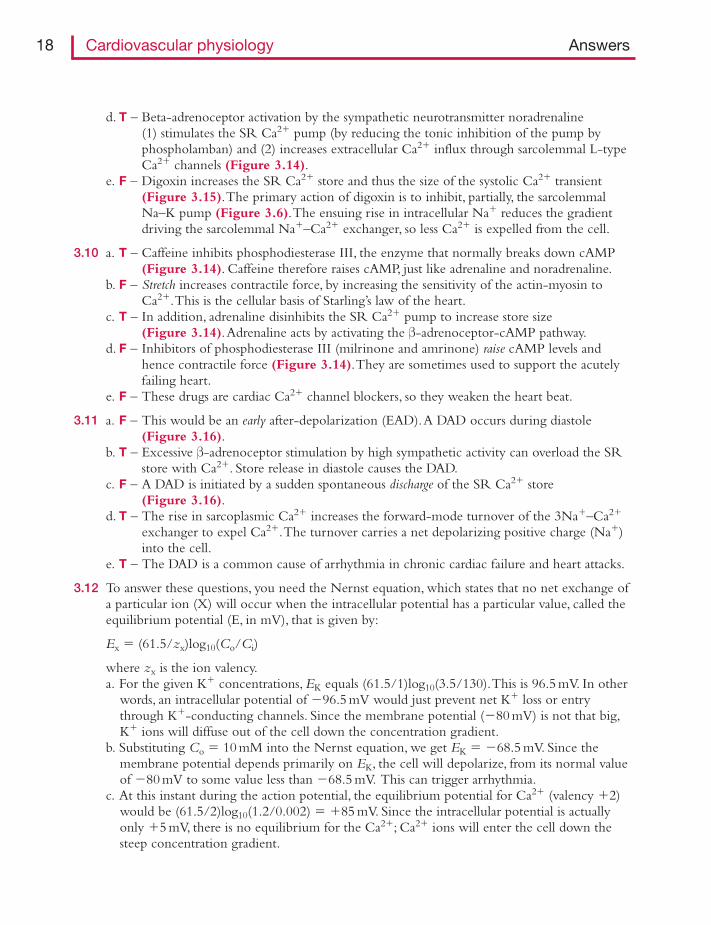
3.12 To answer these questions, you need the Nernst equation, which states that no net exchange ofa particular ion (X) will occur when the intracellular potential has a particular value, called theequilibrium potential (E, in mV), that is given by:
Ex � (61.5/zx)log10(Co/Ci)
where zx is the ion valency.a. For the given K� concentrations, EK equals (61.5/1)log10(3.5/130).This is 96.5 mV. In other
words, an intracellular potential of �96.5 mV would just prevent net K� loss or entrythrough K�-conducting channels. Since the membrane potential (�80 mV) is not that big,K� ions will diffuse out of the cell down the concentration gradient.
b. Substituting Co � 10 mM into the Nernst equation, we get EK � �68.5 mV. Since themembrane potential depends primarily on EK, the cell will depolarize, from its normal valueof �80 mV to some value less than �68.5 mV. This can trigger arrhythmia.
c. At this instant during the action potential, the equilibrium potential for Ca2� (valency �2)would be (61.5/2)log10(1.2/0.002) � �85 mV. Since the intracellular potential is actuallyonly �5 mV, there is no equilibrium for the Ca2�; Ca2� ions will enter the cell down thesteep concentration gradient.
18 Cardiovascular physiology Answers
T F4.1 The sino-atrial node
a. cells depolarize faster at 39�C than 37�C. � �b. is connected electrically to the AV node by Purkinje fibres. � �c. has a parasympathetic innervation whereas the AV node does not. � �d. cells depolarize faster in the presence of acetylcholine. � �e. is the only pacemaking tissue in the mammalian heart. � �
4.2 The membrane of a human sino-atrial node cell (pacemaker)a. has an intracellular potential of �80 to �90 mV during diastole. � �b. can be hyperpolarized by acetylcholine during diastole. � �c. has a greater permeability to Na� than to K� during diastole. � �d. is well endowed with β1-adrenoceptors. � �e. depolarizes spontaneously in under 1 second in most humans. � �
For a change, try this ‘choose the best answer’ style of question (extended matching question, EMQ).Any wordfrom the list can be used once, more than once, or not at all, to fill in the blanks in the text.4.3 Concerning the cardiac pacemaker,
The decay of the pacemaker potential is, in the early stages, due to decay in sarcolemmalpermeability to ______ as the ______ (Kv) slowly inactivates.This causes the polarizing current,______, to decay with time and allows several inward ______ currents to dominate. Manypacemaker cells have a specialized, inward current of ______ called the ______, which is peculiarin that it is activated by ______, not ______ – in contrast to the ______ of ventricularmycocytes. Since ______, a recently introduced if blocker, does not stop the pacemaker decaycompletely, there are clearly additional pacemaking currents. Two such ______-directed currentsare the ______ and, as the potential decays beyond �55 mV, an inward current of ______ passingthrough voltage operated ______ and ______.When the pacemaker potential reaches ______,it triggers an ______.The nodal action potential is small and sluggish, because the node has fewfunctional ______. The nodal action potential is generated solely by an inward ______, whichcan be inhibited by ______. Repolarization is brought about by an ______ current of ______through the ______, a voltage-gated channel that is activated very slowly by depolarization.
Choose from:
CHAPTER 4
Initiation and nervous controlof heart beat
sodium ions outward hyperpolarization voltage-operated Na� channels
potassium ions inward depolarization delayed rectifier K� channel
calcium ions outward current iK action potential chloride channels
‘funny’ current, if depolarizing threshold acetylcholine
Ca2� current hyperpolarizing verapamil T-type Ca2� channels
3Na � �1Ca2� exchanger current propanolol ivabradine L-type Ca2� channels
20 Cardiovascular physiology Questions
4.4 The atrioventricular nodea. is located in the upper interventricular septum. � �b. delays the transmission of electrical excitation to the ventricles. � �c. is connected to the left and right bundle branches via the bundle of His. � �d. is normally one of several electrical connections across the annulus fibrosus. � �e. transmits excitation more quickly during sympathetic stimulation. � �
4.5 The Purkinje fibres of the hearta. are nerve fibres that conduct excitation rapidly to the ventricles. � �b. are the narrowest cells in the ventricles. � �c. can conduct impulses as fast as some sensory nerves. � �d. excite the subendocardial myocytes before the subepicardial myocytes. � �e. excite the interventricular septum last. � �
4.6 The propagation of electrical excitation across the hearta. requires the transmission of intracellular ions from one myocyte into its
neighbour. � �b. generates the clinical electrocardiogram. � �c. is mediated by the desmosomes joining adjacent myocytes. � �d. is faster for rapidly depolarizing, large action potentials than for slowly
depolarizing, small action potentials. � �e. is speeded up by myocardial ischaemia. � �
4.7 An increase in the activity of cardiac sympathetic fibresa. increases the heart rate. � �b. reduces the slope of the pacemaker potential. � �c. lengthens the myocardial action potential. � �d. increases contractile force and stroke volume. � �e. increase the rate of relaxation during diastole. � �
4.8 The stimulation of cardiac β-adrenoceptors by sympathetic fibresa. inhibits adenylate cyclase via β1-receptor activated Gs protein. � �b. activates protein kinase A via a change in intracellular cAMP concentration. � �c. increases the plateau current carried by L-type Ca2� channels. � �d. cause early repolarization via phosphorylation of delayed rectifier K� channels. � �e. increases the sarcoplasmic reticulum Ca2� store by inhibiting phospholamban. � �
4.9 The rate of beating of the human hearta. is controlled by motor nerves innervating the ventricular muscle. � �b. increases when the bundle of His is blocked. � �c. commonly increases during inspiration in young people. � �d. is increased by atropine. � �e. can reach 250 beats per min during maximal exercise. � �
4.10 Increased activity of the postganglionic parasympathetic fibres to the hearta. causes bradycardia. � �b. stimulates myocardial nicotinic receptors. � �c. markedly weakens ventricular contraction. � �
T F
Initiation and nervous control of heart beat Questions 21
d. reduces the membrane potential of sino-atrial node cells. � �e. is a normal accompaniment to expiration. � �
4.11 Regarding the effect of the ionic composition of body fluids on the heart,a. hypocalcaemia weakens the heart beat. � �b. hyperkalaemia is a rise in plasma K� concentration above 3.5 mM. � �c. hyperkalaemia reduces the amplitude of the cardiac action potential. � �d. hyperkalaemia causes flattened T waves in the ECG. � �e. intracellular acidosis increases cardiac contractility. � �
4.12 Cardiac performance can be manipulated pharmacologically bya. propranolol and atenolol, which are β-blockers used to treat angina. � �b. verapamil and diltiazem, which have a positive inotropic effect. � �c. lignocaine, which is used as an anti-arrhythmia drug. � �d. adenosine, which slows the heart by activating nodal K� channels. � �e. ivabradine, which increases the heart rate. � �
T F
22 Cardiovascular physiology Answers
Answers
4.1 a. T – A fever causes a fast pulse rate.b. F – Atrial muscle conducts excitation from the pacemaker to the AV node. Purkinje fibres are
found in the ventricles (Figure 3.2).c. F – Both nodes have a parasympathetic vagal innervation and a sympathetic innervation
(Figure 4.1).d. F – Acetylcholine, the vagal parasympathetic neurotransmitter, slows the rate of pacemaker
depolarization, causing a bradycardia (Figure 4.2).e. F – Cells in the AV node, bundles and Purkinje system can all pacemake, but they do so at a
lower rate than the SA node.The SA node, therefore, dominates the slower pacemakersnormally, but the slower pacemakers keep the ventricles beating slowly during completeheart block (Figure 4.3e).
4.2 a. F – The SA node resting potential is relatively depolarized, namely �70 to �60 mV(Figure 4.4).This is because the cells lack inward rectifier K� channels, Kir. Kir areabundant in atrial and ventricular myocytes and are mainly responsible for their verynegative potentials, close to the Nernst equilibrium potential.
b. T – ACh, the vagal parasympathetic neurotransmitter, activates nodal KACh (KG) channels.This increases the membrane K� permeability, which shifts the potential closer to theNernst equilibrium potential of �94 mV.The resulting hyperpolarization causes asudden bradycardia (Figure 4.2).
c. F – A negative intracellular potential means that the cell is closer to the Nernst K�
equilibrium potential (�94 mV) than the Na� equilibrium potential (�70 mV).Thiscan only be the case if the membrane is more permeable to K� than Na�.
d. T –Beta1-adrenoceptors mediate the chronotropic effect of noradrenaline, the sympatheticneurotransmitter, and of circulating adrenaline.
e. T – The gradual diastolic depolarization is due initially to a ‘funny’ inward Na� current ifcoupled with a declining K� permeability due to Kv inactivation.A Ca2+ influxand 3Na�–1Ca2� exchanger current contribute to the later stages (Figure 4.4).When threshold is reached, the node action potential is triggered.The decayingdiastolic potential normally takes �1 s to reach the threshold, except in bradycardicathletes.
4.3 The decay of the pacemaker potential is at first due to decay in sarcolemmal permeability topotassium ions as the delayed rectifier K� channel (Kv) slowly inactivates.This causesthe polarizing current, , to decay with time and allows several inwarddepolarizing currents to dominate. Many pacemaker cells have a specialized inward currentof sodium ions called the , which is peculiar in that it is activated byhyperpolarization, not depolarization, in contrast to the voltage-operated Na� channelsof ventricular mycocytes. Since ivabradine, a recently introduced if blocker, does not stop thepacemaker decay completely, there are clearly additional pacemaking currents.Two such inwardcurrents are the 3Na–1Ca2� exchanger current and, as the potential decays beyond �55 mV,an inward current of calcium ions passing through voltage operated T-type Ca2� channelsand L-type Ca2� channels.When the pacemaker potential reaches threshold, it triggers anaction potential.The nodal action potential is small and sluggish, because the node has fewfunctional voltage-operated Na� _channels.The nodal action potential is generated solely by
‘funny’ current, if
outward current iK
Initiation and nervous control of heart beat Answers 23
an inward Ca2� current, which can be inhibited by verapamil. Repolarization is broughtabout by an outward current of potassium ions through the delayed rectifier K�_ channel,a voltage-gated channel that is activated very slowly by depolarization.
4.4 a. F – The AV node is located in the atrial septum, close to the top of the interventricularseptum (Figure 3.2).
b. T – The delay is vital, because it allows the atria time to contract before the ventricles, andthus boost ventricular filling.
c. T – The bundle of His provides a high-speed excitation pathway into the ventricles(Figure 3.2).
d. F – The AV node – His pathway is normally the sole electrical connection across the annulusfibrosus.
e. T – This is called the ‘dromotropic’ effect of sympathetic activity.
4.5 a. F – Purkinje fibres are specialized cardiac muscle fibres, not nerve fibres.b. F – Purkinje fibres are the widest cells in the heart, enabling them to conduct very rapidly.c. T – With a conduction velocity of 3–5 m s�1, Purkinje fibres actually conduct faster than
nociceptor C fibres (0.6–2.5 m s�1).d. T – This sequence of activation determines the shape of the QRS complex of the ECG.e. F – They excite the septum first.This influences the shape of the QRS complex.
4.6 a. T – Gap junction composed of connexons provide cytoplasmic continuity between adjacentmyocytes (Figures 3.3).This establishes the electrical circuit needed to transmitexcitation (Figure 4.5).
b. T – The ECG is an external recording of the wave of electrical excitation and repolarizationthat sweeps across the heart.
c. F – Desmosomes are the non-conducting ‘rivets’ that hold adjacent myocytes together at theintercalated junctions. Gap junctions composed of connexons provide the electricallyconducting pathway (Figure 3.3).
d. T – Large, rapid depolarizations create big currents that can extend well ahead of the activeregion (Figure 4.5). Hyperkalaemia causes a small, slow depolarization, and thereforeslow transmission of excitation (Figure 3.7).
e. F – Ischaemia slows conduction, because it reduces the size and rate of depolarization ofaction potentials. It does so partly by raising the local extracellular K� concentration.
4.7 a. T – The activation of β1-adrenoceptors by the sympathetic mediator, noradrenaline, increasesthe heart rate – the chronotropic effect (Figure 4.6).
b. F – The pacemaker slope is increased, so that threshold is reached in a shorter time (Figure 4.6).c. F – The action potential duration is shortened, so that more beats can be fitted into each
minute (Figure 3.11).d. T – This is called the positive inotropic effect (Figure 3.11).The mechanism involves the
β1-adrenoceptor – cAMP – protein kinase A pathway, which increases the size of theCa2� store and systolic Ca2� transient (Figure 3.14).
e. T – This effect is called the lusitropic effect (Figure 3.11). It is brought about by theβ-adrenoceptor–cAMP–PKA pathway, which phosphorylates phospholamban, andthereby disinhibits the SR Ca2� pump (Figure 3.14). Increased pump activity lowerscytosolic [Ca2�] faster.
24 Cardiovascular physiology Answers
4.8 a. F – Beta1-receptors activate Gs protein, which activates adenylate cyclase (Figure 3.14).b. T – cAMP is raised through the β1–Gs–adenylate cyclase pathway. cAMP in turn activates
PKA (Figure 3.14).c. T – The increase is brought about by the phosphorylation of L-type Ca2� channels by
protein kinase A (Figure 3.14).The increased Ca2� current causes a ‘humping’ of theplateau (Figure 3.11) and raises contractility.
d. T – The activated Gs – cAMP–PKA pathway phosphorylates the Kv channels (Figure 3.14).The resulting increase in repolarizing current shortens the action potential, e.g. duringexercise (Figure 3.11).
e. T – Phospholamban normally acts as a brake on the Ca2�-ATPase pump of the sarcoplasmicreticulum membrane.The inhibiting of phospholamban speeds up the pump(disinhibition, Figure 3.14).
4.9 a. F – The heart rate is controlled by the autonomic nerves that innervate the SA node.b. F – This condition, heart block, is associated with a very low heart rate, because a slow
pacemaker in the Purkinje system takes over the excitation of the ventricles(Figure 4.3e).
c. T – This is called sinus arrhythmia (Figure 4.3a). It is caused mainly by the activity ofinspiratory neurons in the brainstem, which inhibit the cardiac vagal neurons.
d. T – Atropine blocks muscarinic M2 receptors, so it abolishes the tonic inhibitory action ofthe vagal parasympathetic transmitter, acetylcholine, on the pacemaker (Figure 3.14).
e. F – The maximum normal human heart rate is �200 min�1. Higher rates constitute apathological tachycardia.They cause a decline in output, due to the curtailment of fillingtime as the cardiac cycle becomes excessively brief.
4.10 a. T – The parasympathetic neurotransmitter, acetylcholine, reduces the slope of the pacemakerpotential, and also hyperpolarizes it (Figure 4.2).These changes causes bradycardia – andcan even arrest the heart for many seconds at the onset of a faint (Figure 4.7).
b. F – Cardiac myocytes express muscarinic M2 receptors (Figure 3.14). Nicotinic receptorsoccur on the postganglionic sympathetic neurons in the sympathetic ganglia, whereneurotransmission is cholinergic.
c. F – The ventricles are only sparsely innervated by parasympathetic fibres (Figure 4.1).d. F – Acetylcholine rapidly hyperpolarizes the SA node cells, causing rapid-onset bradycardia
(Figure 4.2). Hyperpolarization is due to activation of a type of inward rectifier K�
channel called the KACh or KG channel.This channel is activated by Gi protein linked tothe M2 receptor (Figure 3.14).
e. T – Cardiac vagal neuron activity in the brainstem is modulated by the neurons controllingbreathing. Consequently, the heart rate slows during expiration (sinus arrhythmia,Figure 4.3a).
4.11 a. T – Hypocalcaemia reduces Ca2� influx, and thus weakens the heart beat, as discovered bySidney Ringer in 1883.
b. F – The normal range for human plasma [K�] is 3.5–5.5 mM.c. T – Hyperkalaemia reduces the Nernst potential (Figure 3.8).This reduces the resting
membrane potential, i.e. makes it less negative (Figure 3.7).The partial depolarizationlocks a fraction of the voltage-gated Na� channels in the inactivated phase of theircycle (Figure 3.12).As a result, the amplitude and rate of rise of the action potentialdecrease (Figure 3.7).
d. F – The T wave has an exaggerated, peaked or tent-like appearance.This is probably becausethe outward repolarizing K� current is increased, due to the activation of K� channelsby hyperkalaemia.
e. F – Acidosis weakens the heart beat.This is probably because the H� ions reduce the amountof Ca2� binding to troponin C, by competition for the binding site.
4.12 a. T – Beta-blockers reduce the effect of the tonic sympathetic activity on heart rate and strokevolume. Beta-blockers therefore reduce cardiac work and O2 demand.
b. F – Verapamil and diltiazem are Ca2�-channel inhibitors, so they have a negative inotropic(weakening) effect.They are sometimes used to treat hypertension or angina.
c. T – Lignocaine is a Na� channel inhibitor.d. T – Intravenously, adenosine is used to terminate supraventricular tachycardia.e. F – Ivabradine slows the heart rate (the clue is in the name!), by inhibiting the pacemaker
‘funny’ current if. Ivabradine can be used to treat angina.
Initiation and nervous control of heart beat Answers 25
T F5.1 In the electrocardiogram (ECG) of a healthy human,
a. the P wave is generated by the pacemaker current. � �b. the P–R interval is normally 0.3 seconds. � �c. the QRS complex coincides with ventricular depolarization. � �d. atrial repolarization generates the T wave. � �e. exercise shortens the ST interval. � �
5.2 In the typical lead II electrocardiogram of a resting human,a. the height of the QRS complex is approximately 100 mV. � �b. the P–P interval is typically about 100 milliseconds. � �c. the ST segment duration indicates, approximately, the duration of
ventricular systole. � �d. the T wave is upright because subendocardial action potentials last
longer than subepicardial action potentials. � �e. the T wave shortly precedes the second heart sound. � �
5.3 The cardiac dipole,a. is a vector representing the negative and positive external charges on the
heart during ventricular depolarization. � �b. rotates clockwise in the frontal plane, viewed from the front. � �c. at its maximum size, points along the electrical axis of the heart. � �d. is recorded in the horizontal plane by limb lead III. � �e. points in roughly the same direction during repolarization and depolarization. � �
5.4 In an ECG recording,a. lead aVR usually resembles a lead II recording turned upside down. � �b. shortening of the R–R interval during inspiration indicates sinus arrhythmia. � �c. a broad, slurred QRS complex is typical of a ventricular extrasystole. � �d. an R wave that is larger in lead II than leads I or III indicates left axis
deviation. � �e. regular P waves and regular QRS complexes can occur in complete
heart block. � �f. an R–R interval of about 2 seconds is associated with Stokes–Adams
attacks. � �
5.5 In patients with a cardiac arrhythmia,a. delayed after-depolarization can trigger a ventricular ectopic beat (extrasystole). � �b. a ventricular ectopic beat is accompanied by an unusually large pulse. � �
CHAPTER 5
Electrocardiography andarrhythmias
c. pathological ventricular tachycardia or fibrillation can be maintained by a circus pathway. � �
d. the PR interval is the ‘vulnerable period’ when a ventricular ectopic is most likely to trigger ventricular fibrillation. � �
e. atrial fibrillation causes loss of P waves and an irregularly irregular pulse. � �
5.6 In ischaemic heart disease,a. ST segment displacement is usually caused by injury current. � �b. a reversible elevation of the ST segment during exercise is typical of angina. � �c. reduced Q waves are typical of a full thickness (transmural) myocardial infarct. � �d. inverted T waves develop following a transmural infarct. � �e. the ECG changes caused by a heart attack (coronary artery thrombosis)
alter over the course of the first week. � �
For a change, here is a numerical problem, which will test your understanding of the cardiac dipole.You will need acalculator.5.7 The electrical axis of a patient’s heart.
An ECG recording showed an R wave 10.4 mm high in lead I and 6 mm high in lead aVF.a. Is the size difference indicative of cardiac disease?b. What angle in the frontal plane does a lead I recording represent?c. What angle in the frontal plane does a lead aVF recording represent?d. What angle is the patient’s cardiac electrical axis? (Hint: review Figure 5.3, and remember
Pythagorus from your schooldays!)e. Is this electrical axis typical of left ventricular hypertrophy?
Electrocardiography and arrhythmias Questions 27
T F
Answers
5.1 a. F – The pacemaker current is too small to register.The P wave is generated by atrial muscledepolarization (Figure 5.1).
b. F – The interval is due chiefly to slow transmission through the AV node, and should notexceed 0.2 s (Figure 5.1).An interval of 0.3 s indicates heart block (Figure 4.3c).
c. T – The ventricles represent a large mass of muscle fibres that depolarize almost synchronously.The depolarization current generates the large QRS complex (Figure 5.1).
d. F – The T wave is due to ventricular repolarization (Figure 5.1).Atrial repolarization doesnot produce a significant deflection of the ECG, as becomes obvious during completeheart block (Figure 4.3e).
e. T – The QT interval depends on the duration of the ventricular action potential.The latter isshortened by sympathetic stimulation during exercise (Figure 3.11).
5.2 a. F – The QRS complex is about 1 mV (Figure 5.1). Its small voltage is due to theattenuation of the signal as it passes from heart to skin.The skin potential difference is�1% of the 100 mV action potential.
b. F – P–P is the time between two heart beats, which is typically �1 s for a resting adult.At 100 ms (0.1 s) per cardiac cycle, the heart would be beating at 600 beats per minute!This may be OK for a shrew, but it would kill a human.
c. T – The ST segment represents the duration of the ventricle action potential.This is roughlythe same as the duration of ventricular systole (Figure 2.2).
d. T – The difference in duration is shown in Figure 5.1. How this gives rise to an uprightT wave is explained in Figure 5.2.
e. T – As the ventricle repolarizes (T wave), it relaxes, closely followed by the closure of theaortic and pulmonary valves (second heart sound) (Figure 2.2).
5.3 a. T – The concept of a dipole is illustrated in Figure 5.3.b. F – The dipole rotates anticlockwise during ventricular excitation (Figure 5.4).c. T – This is the definition of electrical axis. It is about 40� in Figure 5.4.d. F – Limb lead III is left arm to left leg; so it ‘looks’ at the dipole from an angle of 120� from
the horizontal (Figure 5.5).e. T – This is why the T wave is in the same direction as the R wave (Figure 5.2).
5.4 a. T – Lead aVR ‘looks’ at the heart from the opposite direction to lead II (Figure 5.5).b. T – Shortening of the R–R interval means that the heart rate has increased.This is normal
during inspiration (sinus arrhythmia, Figure 4.3a). It is caused by the withdrawal ofcardiac vagal inhibition during inspiration.
c. T – The QRS is broad and slurred (Figure 4.3b).This is because ventricular excitationspreads out from an abnormal point in the myocardium, not via the usual fast-conductingHis–Purkinje pathway.
d. F – Amongst the frontal leads, lead II has the biggest R wave in most normal subjects(Figure 5.5).This is because the electrical axis (direction of largest dipole in frontalplane) is typically �40–50� below the horizontal and lead II (right arm to left leg) ‘looks’at the heart from a similar angle, 60� (Figure 5.6). Left axis deviation would cause a largeR wave in lead aVL.
e. T – Each is regular but dissociated from the other, i.e. the QRS waves do not follow theP waves (Figure 4.3e).This is because atrial excitation is not transmitted to theventricles.A slow, emergent pacemaker in the ventricle maintains the regular,independent ventricular beat.
28 Cardiovascular physiology Answers
f. T – A Stokes–Adams attack is a sudden loss of consciousness due to the very low cardiacoutput caused by complete heart block.The ventricular rate is 30–40 min�1, driven byan emergent ventricular pacemaker (Figure 4.3e).
5.5 a. T – If the DAD reaches threshold, it triggers a premature action potential and contraction,i.e. a ventricular extrasystole (Figure 3.16).
b. F – The pulse is weak or undetectable, because the ventricle has not had time to fill properly(Figure 4.3b, upper trace).
c. T – The circular (circus) pathway causes the re-entry of excitation (Figure 5.7).d. F – The vulnerable period is the late part of the T wave (Figure 4.3g). Repolarization is
heterogeneous at this time point (some myocytes have repolarized, some not), creatingfavourable conditions for a circus pathway.
e. T – The transmission of excitation from a fibrillating atrium to the ventricles is very erratic,so the timing and volume of the pulse are wildly irregular (Figure 4.3f ).
5.6 a. T – The myocyte membrane potential is reduced in the affected, ischaemic region.Thepotential difference between these myocytes and those in healthier regions creates injurycurrents, which displace the ST segment (Figure 5.8A).
b. F – The ST segment is depressed by the transient myocardial ischaemia as increased myocardialO2 consumption exceeds supply (Figure 5.8A).The depression disappears onterminating the exercise.
c. F – Deep pathological Q waves appear a few days after a full thickness infarct, due to the‘electrical window’ created by cell death (Figure 5.8B).
d. T – T wave inversion is caused by the electrical window effect (Figure 5.8B).e. T – In the first few hours, the infarcted cells remain electrically active, leading to ST segment
elevation (Figure 5.8B). Pathological Q waves and T wave inversion appear later as cellsbecome electrically quiescent.
5.7 a. No, this is normal (Figure 5.5). Each lead detects the cardiac dipole from a different angle,and accordingly ‘sees’ more or less of the dipole (Figure 5.6).
b. Lead I is aligned horizontally, which by convention is taken to be zero degrees (Figure 5.5).c. Lead aVF is orientated 90� below the horizontal.The ‘F’ refers to Foot (Figure 5.5).d. Thirty degrees. Here’s how. Draw a horizontal arrowed line, pointing right, 10.4 mm long
(direction and size of the lead I record). Draw a second arrowed line from the same startingpoint, 6 mm long and pointing vertically down, i.e. at 90� to horizontal, to represent the signalrecorded by lead aVF. Complete the rectangle as in Figure 5.3.The dipole that created thesetwo R waves must be the diagonal d.The angle between the dipole and the horizontal is theelectrical axis (θ in Figure 5.3).You could measure this with a protractor or calculate it fromthe length of the sides.The dipole is the hypotenuse of a right angle triangle. Pythagorus’famous theorem tells us that the square of the hypotenuse equals the sum of the squares ofthe other two sides; so the dipole must be 12 mm long (122 � 10.42 � 62).The sine of angleθ is, by definition, opposite/hypotenuse, or 6/12.The angle whose sine is 0.5 is 30�.
e. The electrical axis is perfectly normal here. If he/she had left ventricular hypertrophy, theangle would be less than zero, i.e. negative.
Electrocardiography and arrhythmias Answers 29
T F6.1 Cardiac output is
a. typically 4–6 l/min in a resting adult. � �b. increased by a rise in central venous pressure. � �c. increased by a rise in arterial blood pressure. � �d. increased when circulating catecholamine concentration falls. � �e. regulated by both sympathetic and parasympathetic autonomic nerves. � �
6.2 When a myocardial muscle strip is stimulated to contract,a. its contractile force is increased if the muscle is first stretched by a ‘preload’. � �b. the contraction force has a similar sensitivity to resting sarcomere length
as in skeletal muscle. � �c. the development of tension without shortening is called ‘isotonic contraction’. � �d. stretch prior to stimulation reduces the actin–myosin sensitivity to
sarcoplasmic Ca2�. � �e. the degree of shortening declines if the afterload is raised. � �
6.3 Concerning the load experienced by ventricular muscle before and during a contraction,a. preload is the force per unit cross-sectional area of muscle during diastole. � �b. preload is increased by a rise in end-diastolic pressure. � �c. afterload is the ventricular wall stress after the aortic valve closes. � �d. afterload is influenced by the arterial blood pressure. � �e. preload and afterload are reduced by an increase in chamber radius. � �
6.4 The Frank–Starling mechanisma. is an increase in cardiac contractility brought about by an increase
in heart rate. � �b. is mediated by the autonomic nerve fibres innervating the heart. � �c. is triggered by stretch receptors in the aorta wall and carotid sinus. � �d. causes stroke volume to increase when the heart is distended. � �e. accounts for a reduction in arterial blood pressure following a haemorrhage. � �
6.5 Starling’s law of the hearta. helps equalize the outputs of the left and right ventricles. � �b. brings about a fall in cardiac output when a supine person stands up. � �c. accounts for most of the increase in cardiac output during exercise. � �d. mediates a rise in left ventricular stroke volume during inspiration. � �e. underlies the rise in arterial pressure that follows a blood transfusion. � �
CHAPTER 6
Control of stroke volume andcardiac output
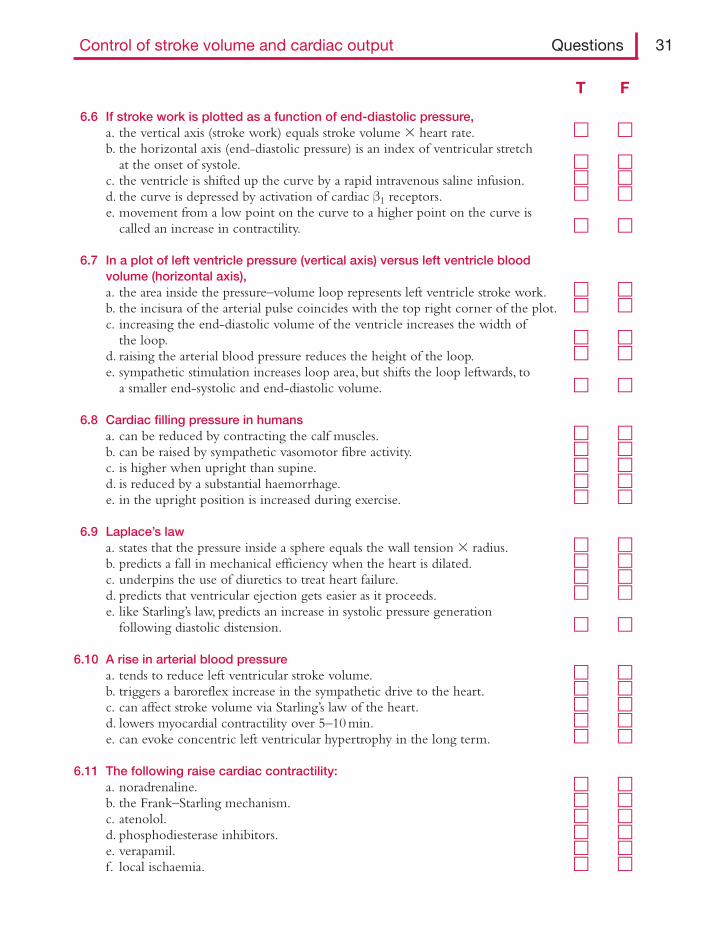
6.6 If stroke work is plotted as a function of end-diastolic pressure,a. the vertical axis (stroke work) equals stroke volume � heart rate. � �b. the horizontal axis (end-diastolic pressure) is an index of ventricular stretch
at the onset of systole. � �c. the ventricle is shifted up the curve by a rapid intravenous saline infusion. � �d. the curve is depressed by activation of cardiac β1 receptors. � �e. movement from a low point on the curve to a higher point on the curve is
called an increase in contractility. � �
6.7 In a plot of left ventricle pressure (vertical axis) versus left ventricle bloodvolume (horizontal axis),a. the area inside the pressure–volume loop represents left ventricle stroke work. � �b. the incisura of the arterial pulse coincides with the top right corner of the plot. � �c. increasing the end-diastolic volume of the ventricle increases the width of
the loop. � �d. raising the arterial blood pressure reduces the height of the loop. � �e. sympathetic stimulation increases loop area, but shifts the loop leftwards, to
a smaller end-systolic and end-diastolic volume. � �
6.8 Cardiac filling pressure in humansa. can be reduced by contracting the calf muscles. � �b. can be raised by sympathetic vasomotor fibre activity. � �c. is higher when upright than supine. � �d. is reduced by a substantial haemorrhage. � �e. in the upright position is increased during exercise. � �
6.9 Laplace’s lawa. states that the pressure inside a sphere equals the wall tension � radius. � �b. predicts a fall in mechanical efficiency when the heart is dilated. � �c. underpins the use of diuretics to treat heart failure. � �d. predicts that ventricular ejection gets easier as it proceeds. � �e. like Starling’s law, predicts an increase in systolic pressure generation
following diastolic distension. � �
6.10 A rise in arterial blood pressurea. tends to reduce left ventricular stroke volume. � �b. triggers a baroreflex increase in the sympathetic drive to the heart. � �c. can affect stroke volume via Starling’s law of the heart. � �d. lowers myocardial contractility over 5–10 min. � �e. can evoke concentric left ventricular hypertrophy in the long term. � �
6.11 The following raise cardiac contractility:a. noradrenaline. � �b. the Frank–Starling mechanism. � �c. atenolol. � �d. phosphodiesterase inhibitors. � �e. verapamil. � �f. local ischaemia. � �
Control of stroke volume and cardiac output Questions 31
T F
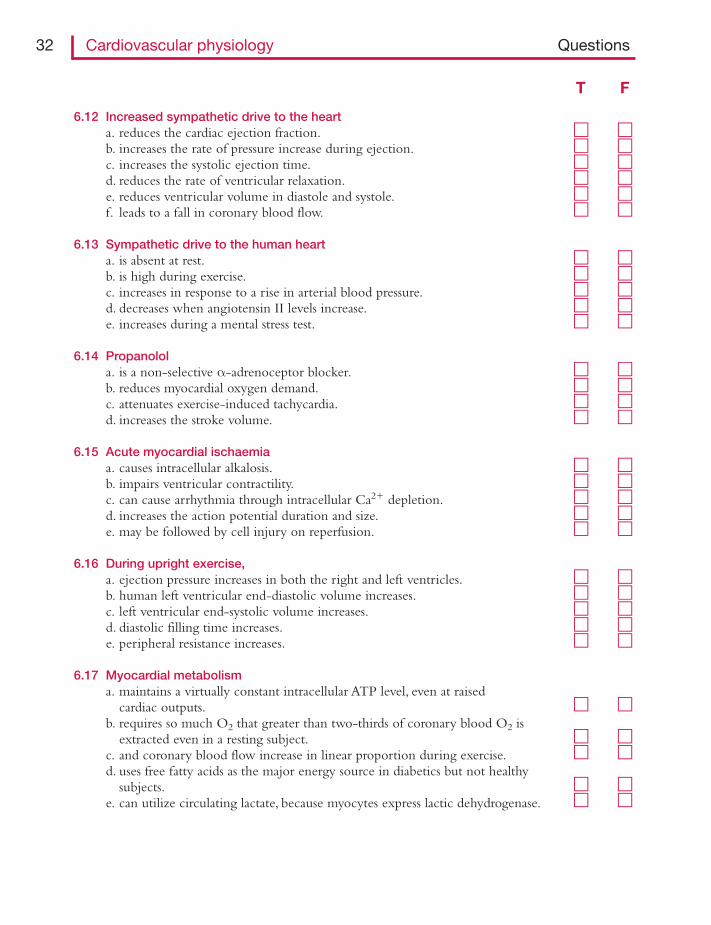
6.12 Increased sympathetic drive to the hearta. reduces the cardiac ejection fraction. � �b. increases the rate of pressure increase during ejection. � �c. increases the systolic ejection time. � �d. reduces the rate of ventricular relaxation. � �e. reduces ventricular volume in diastole and systole. � �f. leads to a fall in coronary blood flow. � �
6.13 Sympathetic drive to the human hearta. is absent at rest. � �b. is high during exercise. � �c. increases in response to a rise in arterial blood pressure. � �d. decreases when angiotensin II levels increase. � �e. increases during a mental stress test. � �
6.14 Propanolola. is a non-selective α-adrenoceptor blocker. � �b. reduces myocardial oxygen demand. � �c. attenuates exercise-induced tachycardia. � �d. increases the stroke volume. � �
6.15 Acute myocardial ischaemiaa. causes intracellular alkalosis. � �b. impairs ventricular contractility. � �c. can cause arrhythmia through intracellular Ca2� depletion. � �d. increases the action potential duration and size. � �e. may be followed by cell injury on reperfusion. � �
6.16 During upright exercise,a. ejection pressure increases in both the right and left ventricles. � �b. human left ventricular end-diastolic volume increases. � �c. left ventricular end-systolic volume increases. � �d. diastolic filling time increases. � �e. peripheral resistance increases. � �
6.17 Myocardial metabolisma. maintains a virtually constant intracellular ATP level, even at raised
cardiac outputs. � �b. requires so much O2 that greater than two-thirds of coronary blood O2 is
extracted even in a resting subject. � �c. and coronary blood flow increase in linear proportion during exercise. � �d. uses free fatty acids as the major energy source in diabetics but not healthy
subjects. � �e. can utilize circulating lactate, because myocytes express lactic dehydrogenase. � �
32 Cardiovascular physiology Questions
T F
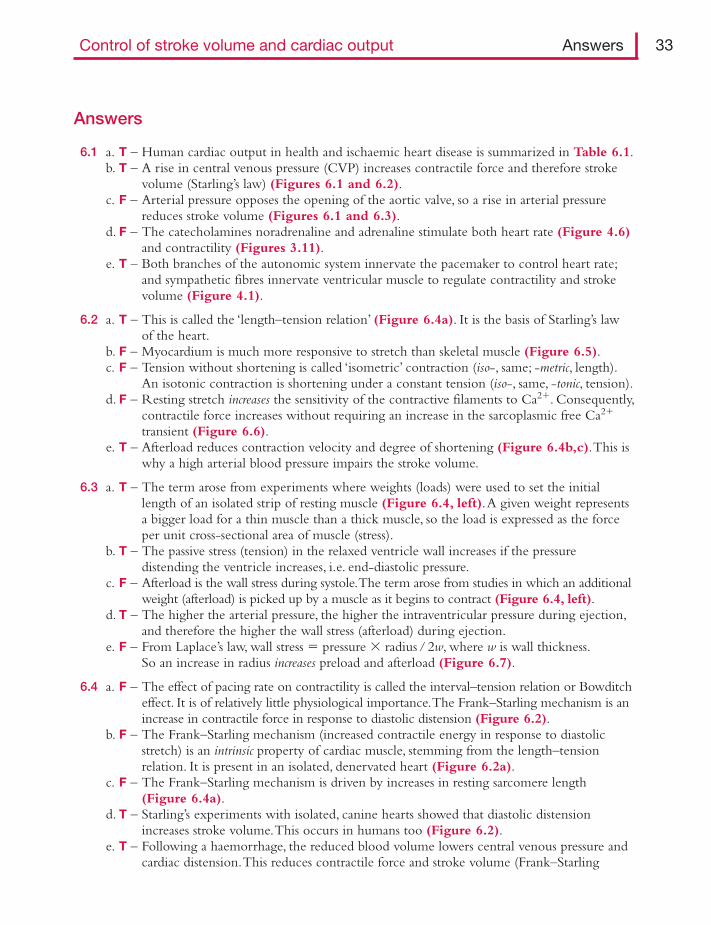
Answers
6.1 a. T – Human cardiac output in health and ischaemic heart disease is summarized in Table 6.1.b. T – A rise in central venous pressure (CVP) increases contractile force and therefore stroke
volume (Starling’s law) (Figures 6.1 and 6.2).c. F – Arterial pressure opposes the opening of the aortic valve, so a rise in arterial pressure
reduces stroke volume (Figures 6.1 and 6.3).d. F – The catecholamines noradrenaline and adrenaline stimulate both heart rate (Figure 4.6)
and contractility (Figures 3.11).e. T – Both branches of the autonomic system innervate the pacemaker to control heart rate;
and sympathetic fibres innervate ventricular muscle to regulate contractility and strokevolume (Figure 4.1).
6.2 a. T – This is called the ‘length–tension relation’ (Figure 6.4a). It is the basis of Starling’s lawof the heart.
b. F – Myocardium is much more responsive to stretch than skeletal muscle (Figure 6.5).c. F – Tension without shortening is called ‘isometric’ contraction (iso-, same; -metric, length).
An isotonic contraction is shortening under a constant tension (iso-, same, -tonic, tension).d. F – Resting stretch increases the sensitivity of the contractive filaments to Ca2�. Consequently,
contractile force increases without requiring an increase in the sarcoplasmic free Ca2�
transient (Figure 6.6).e. T – Afterload reduces contraction velocity and degree of shortening (Figure 6.4b,c).This is
why a high arterial blood pressure impairs the stroke volume.
6.3 a. T – The term arose from experiments where weights (loads) were used to set the initiallength of an isolated strip of resting muscle (Figure 6.4, left).A given weight representsa bigger load for a thin muscle than a thick muscle, so the load is expressed as the forceper unit cross-sectional area of muscle (stress).
b. T – The passive stress (tension) in the relaxed ventricle wall increases if the pressuredistending the ventricle increases, i.e. end-diastolic pressure.
c. F – Afterload is the wall stress during systole.The term arose from studies in which an additionalweight (afterload) is picked up by a muscle as it begins to contract (Figure 6.4, left).
d. T – The higher the arterial pressure, the higher the intraventricular pressure during ejection,and therefore the higher the wall stress (afterload) during ejection.
e. F – From Laplace’s law, wall stress � pressure � radius / 2w, where w is wall thickness.So an increase in radius increases preload and afterload (Figure 6.7).
6.4 a. F – The effect of pacing rate on contractility is called the interval–tension relation or Bowditcheffect. It is of relatively little physiological importance.The Frank–Starling mechanism is anincrease in contractile force in response to diastolic distension (Figure 6.2).
b. F – The Frank–Starling mechanism (increased contractile energy in response to diastolicstretch) is an intrinsic property of cardiac muscle, stemming from the length–tensionrelation. It is present in an isolated, denervated heart (Figure 6.2a).
c. F – The Frank–Starling mechanism is driven by increases in resting sarcomere length (Figure 6.4a).
d. T – Starling’s experiments with isolated, canine hearts showed that diastolic distensionincreases stroke volume.This occurs in humans too (Figure 6.2).
e. T – Following a haemorrhage, the reduced blood volume lowers central venous pressure andcardiac distension.This reduces contractile force and stroke volume (Frank–Starling
Control of stroke volume and cardiac output Answers 33
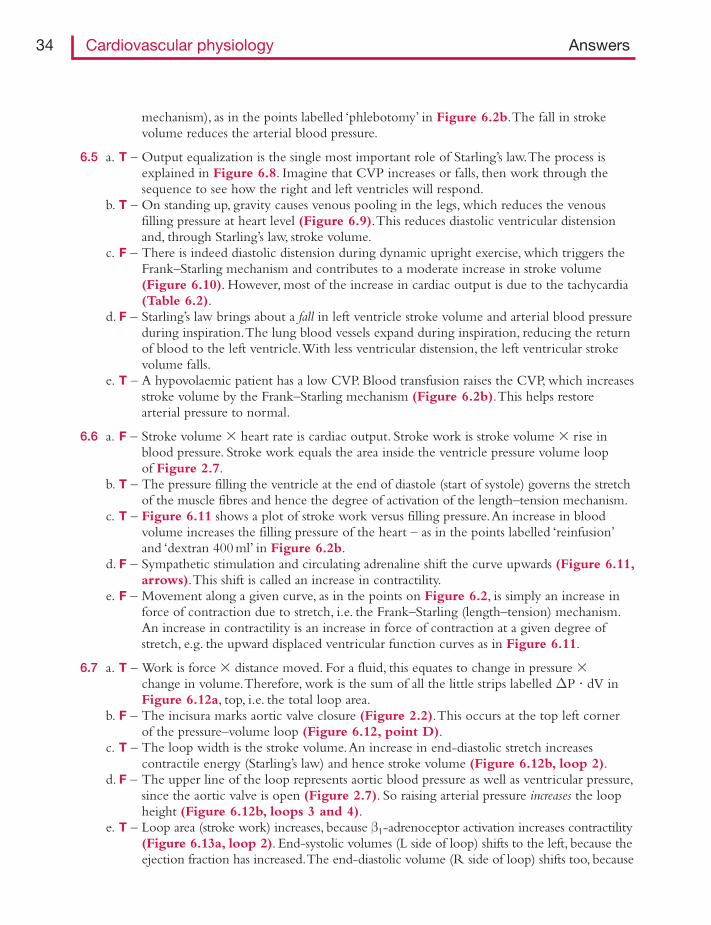
mechanism), as in the points labelled ‘phlebotomy’ in Figure 6.2b.The fall in strokevolume reduces the arterial blood pressure.
6.5 a. T – Output equalization is the single most important role of Starling’s law.The process isexplained in Figure 6.8. Imagine that CVP increases or falls, then work through thesequence to see how the right and left ventricles will respond.
b. T – On standing up, gravity causes venous pooling in the legs, which reduces the venousfilling pressure at heart level (Figure 6.9).This reduces diastolic ventricular distensionand, through Starling’s law, stroke volume.
c. F – There is indeed diastolic distension during dynamic upright exercise, which triggers theFrank–Starling mechanism and contributes to a moderate increase in stroke volume(Figure 6.10). However, most of the increase in cardiac output is due to the tachycardia(Table 6.2).
d. F – Starling’s law brings about a fall in left ventricle stroke volume and arterial blood pressureduring inspiration.The lung blood vessels expand during inspiration, reducing the returnof blood to the left ventricle.With less ventricular distension, the left ventricular strokevolume falls.
e. T – A hypovolaemic patient has a low CVP. Blood transfusion raises the CVP, which increasesstroke volume by the Frank–Starling mechanism (Figure 6.2b).This helps restorearterial pressure to normal.
6.6 a. F – Stroke volume � heart rate is cardiac output. Stroke work is stroke volume � rise inblood pressure. Stroke work equals the area inside the ventricle pressure volume loop of Figure 2.7.
b. T – The pressure filling the ventricle at the end of diastole (start of systole) governs the stretchof the muscle fibres and hence the degree of activation of the length–tension mechanism.
c. T – Figure 6.11 shows a plot of stroke work versus filling pressure.An increase in bloodvolume increases the filling pressure of the heart – as in the points labelled ‘reinfusion’and ‘dextran 400 ml’ in Figure 6.2b.
d. F – Sympathetic stimulation and circulating adrenaline shift the curve upwards (Figure 6.11,arrows).This shift is called an increase in contractility.
e. F – Movement along a given curve, as in the points on Figure 6.2, is simply an increase inforce of contraction due to stretch, i.e. the Frank–Starling (length–tension) mechanism.An increase in contractility is an increase in force of contraction at a given degree ofstretch, e.g. the upward displaced ventricular function curves as in Figure 6.11.
6.7 a. T – Work is force � distance moved. For a fluid, this equates to change in pressure �change in volume.Therefore, work is the sum of all the little strips labelled ΔP � dV inFigure 6.12a, top, i.e. the total loop area.
b. F – The incisura marks aortic valve closure (Figure 2.2).This occurs at the top left cornerof the pressure–volume loop (Figure 6.12, point D).
c. T – The loop width is the stroke volume.An increase in end-diastolic stretch increasescontractile energy (Starling’s law) and hence stroke volume (Figure 6.12b, loop 2).
d. F – The upper line of the loop represents aortic blood pressure as well as ventricular pressure,since the aortic valve is open (Figure 2.7). So raising arterial pressure increases the loopheight (Figure 6.12b, loops 3 and 4).
e. T – Loop area (stroke work) increases, because β1-adrenoceptor activation increases contractility(Figure 6.13a, loop 2). End-systolic volumes (L side of loop) shifts to the left, because theejection fraction has increased.The end-diastolic volume (R side of loop) shifts too, because
34 Cardiovascular physiology Answers
more blood is being pumped out of the central veins, reducing central venous pressure andvolume (Figure 6.14). During exercise, a fall in central venous pressure is prevented by thecalf muscle pump and peripheral venoconstriction (Figure 6.13b, loop 3).
6.8 a. F – The calf muscle pump shifts venous blood into the thorax, raising central filling pressure.b. T – Sympathetic venoconstriction in the renal, splanchnic and cutaneous circulations
(Figure 6.15) reduces peripheral venous blood volume.The displaced blood movesinto the central veins and thorax, raising cardiac filling pressure.
c. F – In the upright position, gravity distends the veins in the lower body, thereby shiftingblood out of the thorax and lowering CVP (Figure 6.9).
d. T – Blood volume is a major determinant of central venous pressure, because two-thirds ofthe blood is in the venous system.A fall in blood volume therefore reduces centralvenous pressure.
e. T – The calf muscle pump and peripheral venoconstriction together increase the centralblood volume, which increases the diastolic filling of the heart (Figure 6.10).
6.9 a. F – Pressure P is proportional to tension T, but inversely proportional to radius R. Laplace’slaw is P � 2T/R.
b. T – The greater the radius, the less the pressure generated by a given wall tension.This is becausethe angle of the tensile force become increasingly flat as radius increases (Figure 6.7).
c. T – Failing hearts are very dilated, due to a raised filling pressure (Figure 6.16). Diureticsreduce the plasma volume, which reduces the filling pressure and cardiac radius.Thisimproves the conversion of contractile tension into systolic pressure (Laplace’s law).
d. T – The radius of the ventricle falls as ejection proceeds, so a given systolic wall tensiongenerates more systolic pressure, facilitating the late phase of ejection.
e. F – Laplace’s biophysical law predicts a fall in systolic pressure as radius increases. Starling’sbiological law describes a rise in systolic pressure as radius increases (e.g. Figure 6.12b,loop 2). In normal hearts the Starling effect is bigger and ‘wins’. In dilated failing hearts,the Laplace effect is bigger.
6.10 a. T – More of the contractile energy goes into raising the intraventricular pressure highenough to open the aortic valve, leaving less energy for ejection.This is a fundamentalproperty of any pump, as depicted by the pump function curve (Figure 6.3).
b. F – A rise in arterial pressure triggers a baroreflex-mediated reduction in cardiac sympatheticnerve activity.This reduces cardiac output, so as to bring the arterial pressure back downto normal (Figure 6.17).
c. T – Stroke volume falls initially due to the rise in arterial pressure; but ventricular distensionthen increases, due to the returning blood.This increases contractile force (Starling’s law)and partly restores the reduced stroke volume (Figure 6.17).
d. F – The immediate Starling effect is followed by a rise in contractility over 5–10 min – theAnrep effect (Figure 6.17).The Anrep effect is due to the ‘slow force response’ to stretch(Figure 6.6).
e. T – Concentric hypertrophy, leading eventually to failure, is one of the complications ofclinical hypertension.
6.11 a. T – Beta1 adrenoceptor stimulation by noradrenaline, the sympathetic transmitter, increasesthe sarcoplasmic Ca2� transient (Figure 3.11).
b. F – An increase in contractility is defined as an increase in contractile force that is independentof length. It is thus a shift in the entire Starling curve (Figure 6.11). Movement along a
Control of stroke volume and cardiac output Answers 35
given Starling curve alters contractile force, but not contractility. Changes in contractilityrequire changes in the systolic Ca2� transient, the Starling effect does not.
c. F – Atenolol is a β1-blocker. Beta-blockers reduce the stimulatory effect of tonic sympatheticactivity on contractility, so they are negative inotropes (Figure 3.14).
d. T – Caffeine and milrinone inhibit the phosphodiesterase that breaks down cAMP, so theyraise intracellular cAMP (Figure 3.14). Consequently, they have a similar effect to β1adrenoceptor stimulation.The cAMP boosts contractility by activating protein kinase A.
e. F – Verapamil and diltiazem are L-type Ca2� channel inhibitors, so they reduce the plateauinward Ca2� current (Figure 3.14).This leads to a reduced sarcoplasmic Ca2� transientand reduced contractility.
f. F – Ischaemia causes intracellular acidosis and eventually ATP rundown, with negativeinotropic effects (Figure 6.18).
6.12 a. F – Ejection fraction is stroke volume divided by end-diastolic volume. Sympatheticstimulation increases the ejection fraction (normal 67%, maximum �90%) (Figures 6.13aloop 2, Figure 6.10).
b. T – The raised ventricular contractility increases dP/dtmax, which is one of several indices ofcontractility used by cardiologists (Figure 6.19a).
c. F – Ejection is faster during sympathetic stimulation (Figure 6.19a), so systole is shorter(Figure 2.4).
d. F – Sympathetic stimulation increases the rate of relaxation (Figure 6.19a).This is due tostimulation of the SR Ca2� uptake pump (Figure 3.14).
e. T – Diastolic and systolic volumes decrease (Figure 6.19b; Figure 6.13a loop 2).The fallin diastolic volume is caused by a fall in CVP, brought about by the increased rate oftransfer of blood out of the venous system (Figure 6.14).The increased ejection fractioncontributes further to the fall in end-systolic volume.
f. F – Coronary vessels do indeed have a sympathetic vasoconstrictor fibre innervation, yetcoronary blood flow increases upon sympathetic stimulation.This is because cardiac workincreases, eliciting a powerful metabolic vasodilatation of the coronary vessel (Figures 6.20).The metabolic vasodilatation overwhelms the sympathetic vasoconstrictor effect.
6.13 a. F – Sympathetic activity is tonic and present even at rest. It partially offsets the tonic vagal(parasympathetic) drive to the pacemaker. It also contributes to coronary resistancevessel tone.
b. T – Increased cardiac sympathetic activity accounts for much of the increase in heart rate andstroke volume during exercise.
c. F – A rise in arterial pressure activates the baroreflex, which elicits a reflex fall in cardiacsympathetic activity (Figure 6.21).The ensuing fall in heart rate and stroke volume helpreturn the arterial pressure to normal (Figure 6.17).
d. F – Angiotensin II increases sympathetic drive through multiple actions. It acts on thebrainstem, the postganglionic sympathetic neurons and the sympathetic terminalvaricosities to boost sympathetic activity and facilitate noradrenaline release.
e. T – The resulting increases in cardiac work can trigger angina in some patients with coronaryartery disease.
6.14 a. F – Propanolol is a non-selective β-adrenoceptor blocker (Figure 3.14).b. T – Beta-blockers reduce the effect of sympathetic noradrenaline on the pacemaker and
myocardium.They therefore reduce cardiac output and oxygen demand. Beta-blockersare therefore used to prevent attacks of angina.
36 Cardiovascular physiology Answers
c. T – Beta-blockers reduce the effect of sympathetic noradrenaline and circulating adrenalineon the pacemaker, so they reduce exercise-induced tachycardia.
d. F – Beta-blockers decrease stroke volume, by blocking the inotropic effect of the tonicsympathetic activity.
6.15 a. F – The switch to anaerobic metabolism leads to metabolic acidosis (Figure 6.18).b. T – Intracellular acidosis strongly impairs contractility – probably because H� ions interfere
with the activation of the troponin–tropomyosin complex by Ca2�.c. F – Ischaemia triggers increased sympathetic activity.This increases the plateau inward Ca2�
current (Figure 3.14) and reduces Na�–K�-ATPase pumping, leading to a fall in Ca2�
expulsion by the Na–Ca exchanger.These changes leads to Ca2� store overload(Figure 6.18). Discharge of the overloaded store creates a delayed after-depolarization(DAD), which can trigger arrhythmia (Figure 3.16).
d. F – The resting potential and the size of the action potential are both reduced by ischaemia(Figure 5.8). So too is action potential duration (Figure 3.13).The heterogeneouschanges in myocyte potential create suitable conditions for re-entry circuits to develop.Re-entry circuits maintain arrhythmias, such as fibrillation.
e. T – Ischaemia-reperfusion injury is caused by myocyte contracture and free oxygen radicaldamage.
6.16 a. T – A more rapid, forceful ventricular systole raises systolic pressure in both the systemiccirculation (Figures 6.22) and pulmonary circulation (Figure 6.23).
b. T – Human end-diastolic volume increases by �20 ml (Table 6.2), as shown byechocardiography (Figure 6.10).This expansion is due to increased venous fillingpressure, brought about by peripheral venoconstriction and the calf muscle pump.
c. F – End-systolic volume is reduced (Table 6.2).This is because the ejection fraction is raisedby the increased cardiac sympathetic activity.
d. F – The duration of diastole falls markedly, due to the shortened cycle duration(Figure 2.4).
e. F – Total peripheral resistance falls, due to the dilatation of resistance vessels in the activemuscles (Figure 6.22).This helps prevent an excessive rise in arterial pressure (afterload)as cardiac output rises.The responses of the heart and peripheral circulation are thuscoordinated during exercise.
6.17 a. T – The rate of mitochondrial oxidative phosphorylation closely matches the rate of ATPconsumption by myosin ATPase.This is called the ‘metabolic stability paradox’.
b. T – Coronary O2 extraction is higher than in most other tissue (Figure 6.24).The bloodsupply is only just adequate – perhaps surprisingly for such a vital organ.
c. T – Increased myocardial performance requires increased ATP production and thereforeincreased O2 supply.To meet this requirement, coronary blood flow increases in directproportion to myocardial metabolic rate over most of the range (Figure 6.20).
d. F – Free fatty acids are the normal heart’s favourite food and account for 50–65% of energyproduction.
e. T – Exercising skeletal muscle releases lactate into the circulation.The lactate is used as anenergy source by the myocardium. Release of myocyte lactic dehydrogenase into thecirculation from damaged myocardium serves as a biochemical test for a heart attack.
Control of stroke volume and cardiac output Answers 37
T F7.1 Human cardiac output
a. can be calculated from a subject’s O2 consumption and the O2 concentrationsin the radial artery and antecubital vein. � �
b. can be assessed by echocardiography. � �c. can be estimated using pulsed Doppler ultrasound directed at the aorta. � �d. can be calculated from blood temperature in the pulmonary artery following
a cold saline injection into the left ventricle. � �e. can be assessed from the pulse pressure and heart rate. � �
7.2 When cardiac output is measured using the Fick principle,a. pulmonary blood flow is equated with cardiac output. � �b. cardiac output is calculated as pulmonary O2 uptake (U) multiplied by the
difference between the O2 content of arterial blood (A) and the mixedvenous blood entering the lungs (V); CO � U(A � V). � �
c. cardiac catheterization is necessary. � �d. a six-fold increase in oxygen uptake indicates a six-fold increase in
cardiac output. � �e. the subject must be in a steady state. � �
7.3 When cardiac output is measured by the indicator dilution method,a. the measured flow is the combined outputs of the right and left ventricles. � �b. the key relation is that indicator concentration � cardiac output �
blood volume. � �c. it is essential to know the mass of indicator injected. � �d. the indicator recirculates via the coronary circulation in about 20 seconds. � �e. the indicator should ideally be confined to the circulation. � �
7.4 When cardiac output is estimated from the peripheral arterial pulse,a. the pulse pressure is calculated as diastolic pressure plus one-third of
systolic pressure. � �b. the pulse pressure serves as an index of the left ventricle stroke volume. � �c. the pulse pressure increases in direct proportion to arterial compliance. � �d. it is necessary to measure the heart rate too. � �e. the output may be underestimated, due to flow out of the arterial system
during ventricular ejection. � �
CHAPTER 7
Assessment of cardiac outputand peripheral pulse
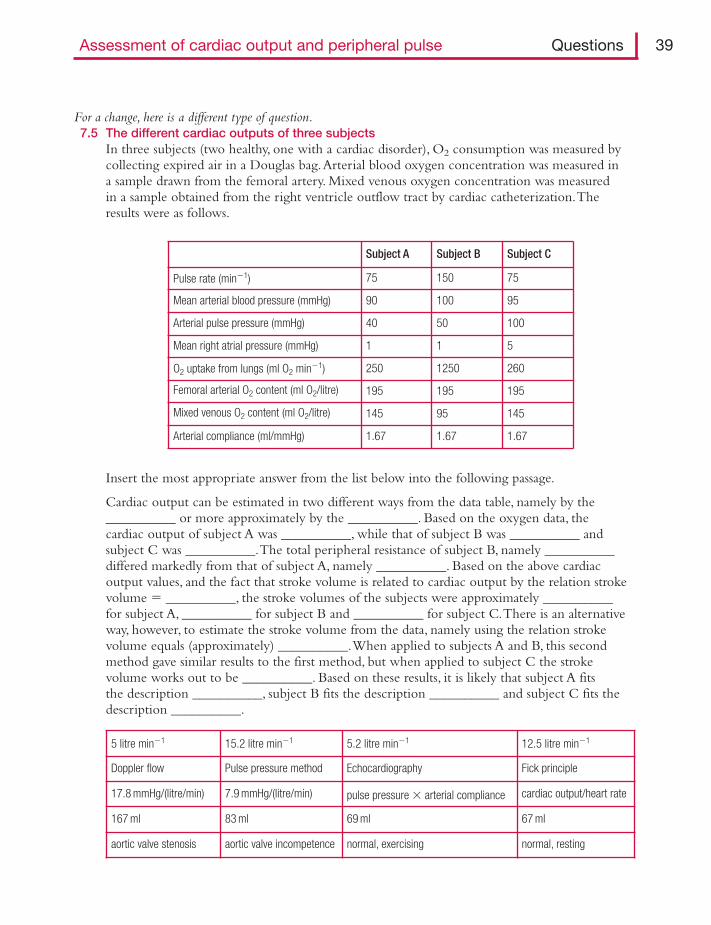
Assessment of cardiac output and peripheral pulse Questions 39
For a change, here is a different type of question.7.5 The different cardiac outputs of three subjects
In three subjects (two healthy, one with a cardiac disorder), O2 consumption was measured bycollecting expired air in a Douglas bag.Arterial blood oxygen concentration was measured ina sample drawn from the femoral artery. Mixed venous oxygen concentration was measuredin a sample obtained from the right ventricle outflow tract by cardiac catheterization.Theresults were as follows.
5 litre min�1 15.2 litre min�1 5.2 litre min�1 12.5 litre min�1
Doppler flow Pulse pressure method Echocardiography Fick principle
17.8 mmHg/(litre/min) 7.9 mmHg/(litre/min) pulse pressure � arterial compliance cardiac output/heart rate
167 ml 83 ml 69 ml 67 ml
aortic valve stenosis aortic valve incompetence normal, exercising normal, resting
Subject A Subject B Subject C
Pulse rate (min�1) 75 150 75
Mean arterial blood pressure (mmHg) 90 100 95
Arterial pulse pressure (mmHg) 40 50 100
Mean right atrial pressure (mmHg) 1 1 5
O2 uptake from lungs (ml O2 min�1) 250 1250 260
Femoral arterial O2 content (ml O2/litre) 195 195 195
Mixed venous O2 content (ml O2/litre) 145 95 145
Arterial compliance (ml/mmHg) 1.67 1.67 1.67
Insert the most appropriate answer from the list below into the following passage.
Cardiac output can be estimated in two different ways from the data table, namely by the__________ or more approximately by the __________. Based on the oxygen data, thecardiac output of subject A was __________, while that of subject B was __________ andsubject C was __________.The total peripheral resistance of subject B, namely __________differed markedly from that of subject A, namely __________. Based on the above cardiacoutput values, and the fact that stroke volume is related to cardiac output by the relation strokevolume � __________, the stroke volumes of the subjects were approximately __________for subject A, __________ for subject B and __________ for subject C.There is an alternativeway, however, to estimate the stroke volume from the data, namely using the relation strokevolume equals (approximately) __________.When applied to subjects A and B, this secondmethod gave similar results to the first method, but when applied to subject C the strokevolume works out to be __________. Based on these results, it is likely that subject A fitsthe description __________, subject B fits the description __________ and subject C fits thedescription __________.
Answers
7.1 a. F – A mixed venous sample must be taken from the right ventricle to calculate cardiacoutput by the Fick method.The antecubital venous O2 concentration does not representthe average venous O2 concentration for the whole body, i.e. pulmonary artery O2concentration.
b. T – Echocardiography records the separation of the ventricle walls in diastole and systole(Figure 6.10).This is converted into stroke volume, using assumptions about chambershape.Then stroke volume � heart rate � cardiac output.
c. T – The altered frequency of ultrasound reflected by red cells in the aorta is used to calculateaortic blood velocity (Figure 7.1).Aortic diameter too can be measured by ultrasound.Proximal aorta flow (cm3 s�1) � velocity (cm s�1) � cross-sectional area (cm2) � cardiacoutput � coronary blood flow. Coronary blood is drawn from the root of the aorta, atthe sinuses of Valsalva (Figure 2.1).
d. F – In the thermal dilution method cold saline is injected into the right ventricle or base ofthe pulmonary trunk.
e. T – The pulse pressure depends on stroke volume (Figure 7.2).This is the basis ofautomated cardiac output monitoring in intensive care units.
7.2 a. T – The entire output of the right ventricle passes through the lungs.b. F – The Fick principle states that U � CO (A � V). So CO � U/(A � V) (Figure 7.3).c. T – The right ventricle has to be catheterized to obtain a sample of mixed venous blood.d. F – During exercise the O2 uptake increases much more than the cardiac output, because the
venous O2 concentration (V) decreases (Figure 6.22).e. T – It takes several minutes to measure O2 consumption, so the cardiac output has to remain
steady over this time.
7.3 a. F – Cardiac output is always the output of a single ventricle.b. F – The key relation is that the arterial concentration of indicator, C, equals the mass of
indicator injected, m, divided by the volume of blood in which it is distributed VD.C � m/VD.The time that the indicator volume takes to flow past a given point isrecorded (Figure 7.4a).
c. T – The cardiac output (CO) is calculated as injected mass m divided by area in under thearterial concentration versus time plot, Ct. CO � m/Ct (Figure 7.4b).
d. T – This causes a hump in the arterial concentration time course beyond 20 s (Figure 7.4c).This limitation of the dye dilution method is circumvented in the thermal dilutionmethod, due to thermal equilibration of the blood in the tissues.
e. T – If the indicator escapes from the bloodstream between the injection point and thesampling point, the true intravascular mass of indicator is smaller than the known,injected mass, m.
7.4 a. F – Pulse pressure is systolic pressure minus diastolic pressure (Figure 7.2a).b. T – The rise in arterial pressure is caused by the temporary accommodation of most of the
stroke volume in the elastic arteries (Figure 7.2b).c. F – The bigger the arterial compliance (distensibility), the smaller the pulse pressure
generated by a given stroke volume. Pulse pressure is inversely proportional to compliance.Compliance is change in volume per unit change in pressure.
d. T – Cardiac output � heart rate � stroke volume.e. T – A volume of blood equal to 20–30% of the stroke volume flows out of the distal arteries
during the time taken for ventricular ejection.
40 Cardiovascular physiology Answers
Assessment of cardiac output and peripheral pulse Answers 41
7.5 Cardiac output can be estimated in two different ways from the data table, namely by theFick principle or more approximately by the pulse pressure method. Based on theoxygen data, the cardiac output of subject A was 5 litre min�1__, while that of subject B was12.5 litre min�1__ and subject C was 5.2 litre min�1__.The total peripheral resistance ofsubject B, namely 7.9mmHg/(litre/min), differed markedly from that of subject A, namely17.8mmHg/(litre/min). Based on the above cardiac output values, and the fact that strokevolume is related to cardiac output by the relation stroke volume � cardiac output/heartrate, the stroke volumes of the subjects were approximately 67ml for subject A, 83ml forsubject B and 69ml for subject C.There is an alternative way, however, to estimate the strokevolume from the data, namely using the relation stroke volume equals (approximately) pulsepressure � arterial compliance.When applied to subjects A and B, this second method gavesimilar results to the first method; but when applied to subject C the stroke volume works outto be 167ml. Based on these results, it is likely that subject A fits the description normal,resting, subject B fits the description normal, exercising and subject C fits the descriptionaortic valve incompetence.
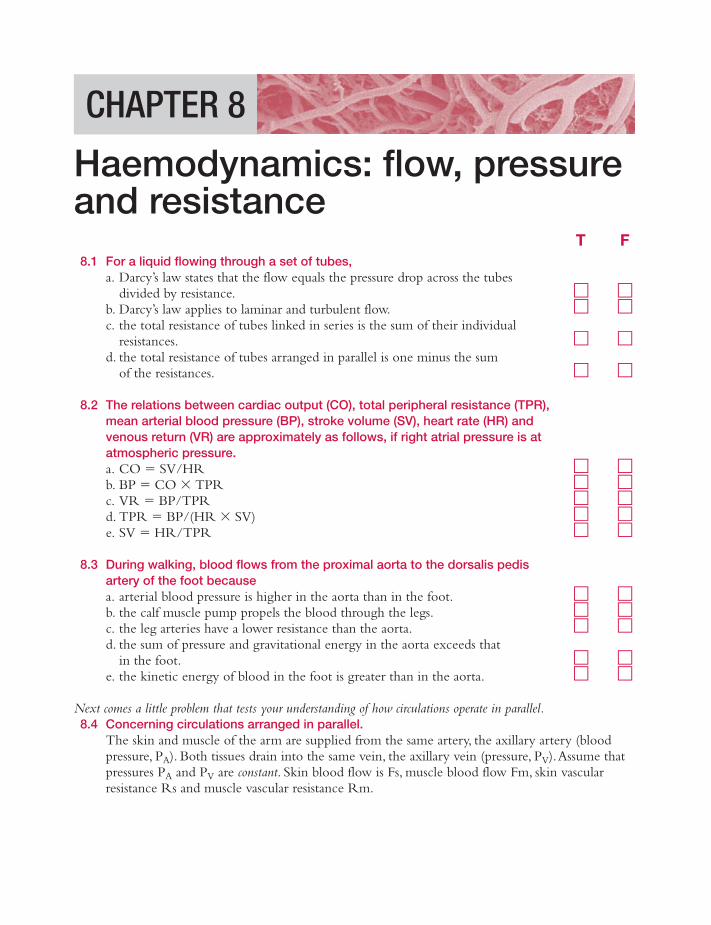
T F8.1 For a liquid flowing through a set of tubes,
a. Darcy’s law states that the flow equals the pressure drop across the tubes divided by resistance. � �
b. Darcy’s law applies to laminar and turbulent flow. � �c. the total resistance of tubes linked in series is the sum of their individual
resistances. � �d. the total resistance of tubes arranged in parallel is one minus the sum
of the resistances. � �
8.2 The relations between cardiac output (CO), total peripheral resistance (TPR),mean arterial blood pressure (BP), stroke volume (SV), heart rate (HR) andvenous return (VR) are approximately as follows, if right atrial pressure is atatmospheric pressure.a. CO � SV/HR � �b. BP � CO � TPR � �c. VR � BP/TPR � �d. TPR � BP/(HR � SV) � �e. SV � HR/TPR � �
8.3 During walking, blood flows from the proximal aorta to the dorsalis pedisartery of the foot becausea. arterial blood pressure is higher in the aorta than in the foot. � �b. the calf muscle pump propels the blood through the legs. � �c. the leg arteries have a lower resistance than the aorta. � �d. the sum of pressure and gravitational energy in the aorta exceeds that
in the foot. � �e. the kinetic energy of blood in the foot is greater than in the aorta. � �
Next comes a little problem that tests your understanding of how circulations operate in parallel.8.4 Concerning circulations arranged in parallel.
The skin and muscle of the arm are supplied from the same artery, the axillary artery (bloodpressure, PA). Both tissues drain into the same vein, the axillary vein (pressure, PV).Assume thatpressures PA and PV are constant. Skin blood flow is Fs, muscle blood flow Fm, skin vascularresistance Rs and muscle vascular resistance Rm.
CHAPTER 8
Haemodynamics: flow, pressureand resistance
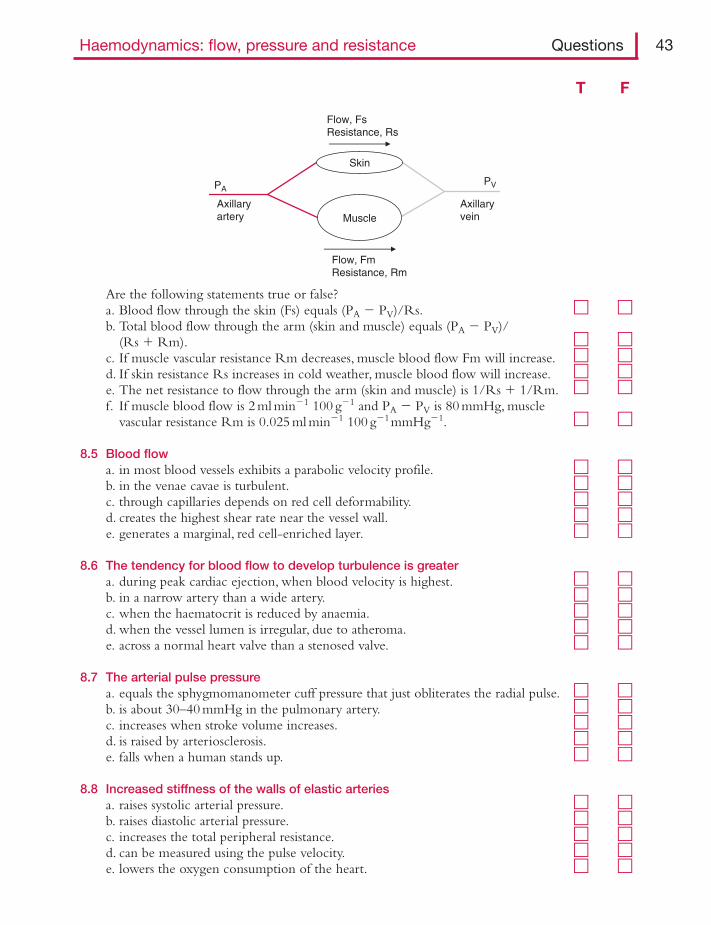
Haemodynamics: flow, pressure and resistance Questions 43
Are the following statements true or false?a. Blood flow through the skin (Fs) equals (PA � PV)/Rs. � �b. Total blood flow through the arm (skin and muscle) equals (PA � PV)/
(Rs � Rm). � �c. If muscle vascular resistance Rm decreases, muscle blood flow Fm will increase. � �d. If skin resistance Rs increases in cold weather, muscle blood flow will increase. � �e. The net resistance to flow through the arm (skin and muscle) is 1/Rs � 1/Rm. � �f. If muscle blood flow is 2 ml min�1 100 g�1 and PA � PV is 80 mmHg, muscle
vascular resistance Rm is 0.025 ml min�1 100 g�1mmHg�1. � �
8.5 Blood flowa. in most blood vessels exhibits a parabolic velocity profile. � �b. in the venae cavae is turbulent. � �c. through capillaries depends on red cell deformability. � �d. creates the highest shear rate near the vessel wall. � �e. generates a marginal, red cell-enriched layer. � �
8.6 The tendency for blood flow to develop turbulence is greatera. during peak cardiac ejection, when blood velocity is highest. � �b. in a narrow artery than a wide artery. � �c. when the haematocrit is reduced by anaemia. � �d. when the vessel lumen is irregular, due to atheroma. � �e. across a normal heart valve than a stenosed valve. � �
8.7 The arterial pulse pressurea. equals the sphygmomanometer cuff pressure that just obliterates the radial pulse. � �b. is about 30–40 mmHg in the pulmonary artery. � �c. increases when stroke volume increases. � �d. is raised by arteriosclerosis. � �e. falls when a human stands up. � �
8.8 Increased stiffness of the walls of elastic arteriesa. raises systolic arterial pressure. � �b. raises diastolic arterial pressure. � �c. increases the total peripheral resistance. � �d. can be measured using the pulse velocity. � �e. lowers the oxygen consumption of the heart. � �
Skin
PVPA
Axillaryartery
Axillaryvein
Flow, FsResistance, Rs
Flow, FmResistance, Rm
Muscle
T F
8.9 Arterial compliancea. is the increase in blood pressure required to distend the arterial system by 1 ml. � �b. decreases as arterial blood pressure is raised. � �c. increases with advancing age. � �d. is reduced when the rate of ventricular ejection increases. � �e. is reduced in patients with hypertension. � �
8.10 Arterial pulse pressure can be increased bya. a moderate haemorrhage. � �b. sympathetic stimulation of the heart. � �c. clinical hypertension. � �d. exercise. � �e. clinical shock. � �
8.11 The aortic pressure wave in a resting humana. rises quickly in systole, but falls only slowly in diastole. � �b. has a notch, the incisura, that marks opening of the aortic valve. � �c. is transmitted to the periphery faster than the stroke volume. � �d. is conducted more quickly in the young than the elderly. � �e. may show a late diastolic wave in young humans or during hypotension. � �f. may show an inflexion on the systolic upstroke in elderly humans
or hypertensives. � �
8.12 A systemic arterial pulsea. that gets palpably weaker during each inspiration is called pulsus alternans. � �b. that fluctuates greatly from beat to beat is typical of atrial fibrillation. � �c. with an abnormally large pulse pressure occurs in mitral valve stenosis. � �d. with a slowly rising systolic phase is associated with aortic valve stenosis. � �
8.13 In the measurement of blood pressure by the auscultatory method,a. the first Korotkov sound as cuff pressure is lowered indicates systolic pressure. � �b. the complete disappearance of sound is commonly taken to be diastolic
pressure. � �c. the estimate of systolic pressure tends to be lower than the true value. � �d. a wider-than-normal cuff is required for an obese arm. � �e. the upper arm should be raised above heart level. � �
8.14 Mean arterial blood pressurea. in the brachial artery is diastolic pressure plus systolic pressure divided by 2. � �b. is regulated by both peripheral resistance and cardiac output. � �c. is the sole determinant of the blood flow through an organ. � �d. can be increased by raising the blood volume. � �e. can be reduced by raising the blood haematocrit. � �f. when chronically raised, increases the risk of strokes. � �
8.15 Systolic blood pressure in the brachial arterya. is typically �120–125 mmHg in a healthy, resting 20-year-old man. � �b. is typically �105–110 mmHg in a 10-year-old child. � �
44 Cardiovascular physiology Questions
T F
Haemodynamics: flow, pressure and resistance Questions 45
T F
c. is reduced by exercise. � �d. can be raised by a visit to the doctor. � �e. is typically �200 mmHg at 70 years of age. � �
8.16 Mean systemic arterial blood pressure usually increases in response toa. stimulation of the carotid sinus baroreceptors. � �b. stimulation of peripheral chemoreceptors. � �c. brainstem compression/asphyxia. � �d. atropine. � �e. ganglionic blocking drugs. � �f. sleep. � �g. pregnancy. � �
8.17 The velocity of blooda. in the ascending aorta falls to nearly zero at the onset of diastole. � �b. becomes non-pulsatile in arterioles. � �c. is slower in capillaries than arteries. � �d. is slower in veins than capillaries. � �
8.18 According to Poiseuille’s law for flow along a cylindrical tube,a. flow is linearly proportion to the transmural pressure difference. � �b. resistance to flow is proportional to vessel length. � �c. flow increases two-fold if the vessel radius is doubled. � �d. polycythaemia increases the vascular resistance to flow. � �e. local vasoconstriction will reduce local blood flow. � �f. generalized systemic vasoconstriction will raise the blood pressure if the
cardiac output is held constant. � �
8.19 The effective viscosity of blooda. is raised in patients with iron deficiency. � �b. is lower in arterioles than in arteries. � �c. is lowered by cooling. � �d. is raised in climbers acclimatised to high altitudes. � �e. is increased by a raised plasma protein concentration in multiple myeloma. � �
8.20 Laplace’s law for tubes predicts thata. the wall tension is proportional to the transmural pressure difference. � �b. the wall tension is bigger in a small artery than a large artery. � �c. the wall stress increases as wall thickness increases. � �d. tension is increased in the wall of an abdominal aortic aneurysm. � �e. in capillaries the wall tension is low and wall stress is high. � �
8.21 After a healthy subject has changed position from supine to standing,a. the jugular veins become visible in the neck. � �b. arterial pressure is increased in the lower limbs. � �c. venous pressure is increased in the lower limbs. � �d. the drag of gravity slows the venous drainage from the legs. � �e. the volume of blood in the thorax decreases. � �
8.22 In the human jugular veins,a. the venous pulsation can be palpated in the neck when supine. � �b. the pressure is raised in right ventricular failure. � �c. the pulsation is exaggerated in atrial fibrillation. � �d. the pressure is reduced in patients with tricuspid valve incompetence. � �e. the pulse is exaggerated when the P wave of the ECG occurs during the
S–T interval in a patient with complete heart block. � �
8.23 The volume of blood in peripheral veinsa. is very sensitive to venous pressure, because veins can collapse. � �b. can be increased by activation of their sympathetic innervation. � �c. can be increased by the muscle pump. � �d. is about the same as the volume of blood in the arteries. � �
8.24 Venous blood pressurea. inside the thoracic cavity increases during inspiration. � �b. is about 20 mmHg in the venae cavae at heart level. � �c. is subatmospheric in the venous sinuses of the skull when standing. � �d. in the foot during standing is roughly equal to blood pressure in the
ascending aorta. � �e. in the foot is increased by walking. � �f. in the antecubital vein at heart level is �8–10 mmHg. � �g. in the hepatic portal vein is lower than in the inferior vena cava. � �
46 Cardiovascular physiology Questions
T F
Haemodynamics: flow, pressure and resistance Answers 47
Answers
8.1 a. T – Flow � pressure drop � conductance � pressure drop/resistance (Figure1.5).b. F – Darcy’s law applies only to laminar flow.When turbulence sets in, much of the increased
pressure energy is dissipated in cross-currents; further increases in flow are proportional tothe square root of the pressure difference (Figure 8.1).
c. T – If one tube has a resistance of 1 unit and the next in series has a resistance of 3 units (e.g.a terminal artery feeding an arteriole), the total resistance to flow is 4 units (Figure 8.2).
d. F – When tubes are connected in parallel (e.g. capillaries), their conductances add up(Figure 8.2). Conductance is 1/resistance.
8.2 a. F – Cardiac output equals stroke volume multiplied by heart rate. CO � SV � HR.b. T – This is Darcy’s law applied to the whole systemic circulation, for which the flow is the
cardiac output. Flow � pressure drop/resistance, so CO � BP/TPR, taking centralvenous pressure as zero mmHg above atmospheric pressure. Rearranging this,BP � CO � TPR.
c. T – Venous return equals cardiac output in the steady state. So this is again Darcy’s lawapplied to the whole systemic circulation. From (b), VR � CO � BP/TPR.
d. T – This again follows from the Darcy equation in (b), with HR � SV substituted for cardiacoutput; CO � HR � SV � BP/TPR. Rearranging,TPR � BP/(HR � SV).
e. F – Stroke volumes equal cardiac output divided by heart rate; SV � CO/HR.
8.3 a. F – Arterial pressure is actually higher in the foot in the upright position, due to the drag ofgravity (Figure 8.3).
b. F – The calf muscle pump propels blood up the venous system, not down the arterial system,because limb veins have valves, unlike arteries (Figure 8.4).
c. F – The aorta is the widest of all arteries, so it has the lowest resistance.d. T – Bernoulli’s theory states that total energy gradient drives flow, not pressure alone.Aortic
blood has more potential energy (gravitational energy) than blood in the foot, due to itsheight above the foot.
e. F – Kinetic energy is mass � velocity2.The mass and velocity of blood in the dorsalis pedisare smaller than in the aorta.
8.4 a. T – This is Darcy’s law of flow (Figure 1.5).b. F – Resistances in parallel do not summate. For the muscle, Fm � (PA � PV)/Rm.Total flow
in skin and muscle is Fs � Fm � (PA � PV)/Rs � (PA � PV)/Rm �(PA � PV)(1/Rs � 1/Rm). In parallel circuits the conductances 1/Rs and 1/Rmsummate (Figure 8.2). Conductance is 1/resistance.
c. T – Muscle perfusion � (PA � PV)/Rm, so if Rm decreases, as happens during exercise, themuscle perfusion increases.
d. F – Muscle blood flow is (PA � PV)/Rm; none of these terms have changed. Students oftenget this wrong, because they think there is a fixed flow going through the arm; they thenargue that, since less blood is going through the skin, more must be going through themuscle. But total arm blood flow is not fixed – it decreases when skin resistance increases.The driving pressure PA, on the other hand, is held relatively constant by the baroreflex.This example illustrates the virtue of circulations in parallel, namely that the flowthrough one tissue (muscle in this case) does not depend on what is happening in aparallel tissue (skin).
e. F – The parameter 1/Rs � 1/Rm is the net (combined) conductance of the two tissues.Conductances in parallel summate (Figure 8.2).The net resistance is 1/net conductance,or 1/(1/Rs � 1/Rm).
f. F – The stated value is flow per unit pressure gradient, so it is conductance. From Darcy’s law,resistance � pressure drop/flow, so its units are mmHg per unit flow. Here, it is 40 mmHgmin 100 g ml�1.
8.5 a. T – Blood moves fastest in the vessel centre and has zero velocity at the vessel wall duringlaminar flow (Figure 8.5a, top right).
b. F – Flow is laminar in healthy veins and arteries.c. T – Capillaries are narrower than red cells, so red cells have to deform to file through them
(bolus flow, Figure 8.5b). In sickle cell anaemia, stiffening of the red cells can impaircapillary perfusion, causing an ischaemic crisis.
d. T – Due to the parabolic velocity profile, the rate at which one layer slides (shears) over thenext is greatest at the wall (Figure 8.5a).This stimulates endothelium to secrete NO.If the wall is weak, the high shear stress can trigger a dissecting aortic aneurysm.
e. F – Laminar flow creates a marginal plasma stream that is deficient in red cells, andconsequently is of low viscosity (Figure 8.5a, right).This helps blood flow in narrowtubes, such as the arterioles (the Farheus–Lindquist effect, Figure 8.6).
8.6 a. T – When a high velocity raises the Reynold’s number above �2000, turbulence develops(Figure 8.1).The Reynold’s number is velocity � diameter � density/viscosity.Turbulence during peak ejection can cause an innocent systolic murmur.
b. F – The Reynold’s number tells us that turbulence is promoted by a wide diameter.c. T – Anaemia reduces viscosity, which raises the Reynold’s number. For this reason, an
innocent systolic ejection murmur is not uncommon during pregnancy.d. T – An atheromatous plaque can cause local turbulence.This may be audible through a
stethoscope (a ‘bruit’), and is sometimes even palpable (a ‘thrill’).e. F – The abrupt change in velocity and diameter across a stenosed valve creates turbulence,
producing a cardiac murmur (Figure 2.6 top).
8.7 a. F – Pulse pressure is the difference between systolic and diastolic pressure (Figure 8.7).The cuff pressure that just obliterates the pulse is systolic pressure (Figure 8.8).
b. F – Pulse pressure is only �13–16 mmHg in the low pressure pulmonary circulation(Figure 1.6).
c. T – The addition of a bigger stroke volume to the elastic arteries raises the arterial bloodpressure more (Figures 7.2 and 8.9, top).
d. T – Arteriosclerosis is a stiffening of the tunica media of elastic arteries (reduced compliance).Therefore, a greater rise in pressure is needed to stretch the walls sufficiently toaccommodate the stroke volume (Figure 8.9, bottom).
e. T – Standing up causes venous pooling in the lower limbs, which reduces central venouspressure (Figure 6.9).The fall in central venous pressure reduces stroke volume(Starling’s law of the heart) and therefore pulse pressure.
8.8 a. T – Stiffness (elastance) is 1/compliance (distensibility). In order to distend a stiff arterysufficiently to accommodate the stroke volume, a greater increase in pressure is required –so systolic pressure is raised (Figure 8.9, bottom).
b. F – If mean blood pressure is unchanged (because it is determined by peripheral resistanceand cardiac output), a rise in elastic artery stiffness would actually reduce diastolic pressure.
48 Cardiovascular physiology Answers
Haemodynamics: flow, pressure and resistance Answers 49
This is because pressure falls more sharply as blood drains out of a stiff vessel.Arterialstiffness determines the size of the oscillation in pressure (systolic–diastolic) around themean.
c. F – Elastic arteries make no significant contribution to peripheral resistance, as shown by thepressure profile of the circulation (Figure 1.6).
d. T – The speed with which the pulse spreads along the arterial tree depends on wall stiffness.The stiffer the vessels, the faster the pulse is transmitted from aorta to radial artery.
e. F – Stiffening of the aorta, which occurs with ageing and clinical hypertension, raises thesystolic pressure, which is the afterload on the left ventricle.This increases cardiac workand thus raises oxygen consumption.
8.9 a. F – Arterial compliance (distensibility) is the increase in arterial blood volume producedby 1 mmHg increase in blood pressure. Its reciprocal, the increase in pressure per mldistension, is called elastance (stiffness) (Figure 8.9, bottom).
b. T – The pressure–volume relation is a steepening curve, not a straight line. Its slope is theelastance (stiffness).This increases with stretch, as with a bicycle tyre. Compliance(1/elastance) therefore falls when pressure is raised (Figure 8.9, middle).
c. F – Elastic arteries get stiffer with age due to arteriosclerosis; so their compliance(distensibility) decreases.The stiff, ageing aorta is similar to the stiff, hypertensive aorta(Figure 8.10).
d. T – The artery wall is viscoelastic – meaning that its passive tension relaxes over time.If ejection is rapid, relaxation time is reduced and the wall becomes effectively stiffer;compliance is reduced.
e. T – The pressure–volume curve of the hypertensive aorta is steeper than normal, i.e.compliance is reduced (Figure 8.10).
8.10 a. F – A fall in blood volume reduces central venous pressure (CVP), which reduces strokevolume (Starling’s law) (Figure 6.2b, phlebotomy points).This reduces the pulsepressure (Figure 8.11).
b. T – The rise in stroke volume and the increased rate of ejection both raise the pulse pressure(Figures 6.13a, loop 2 and 6.19, left).
c. T – Pulse pressure (as opposed to mean pressure) increases in clinical hypertension for tworeasons. (1) Large artery compliance is reduced (stiffness increases, Figure 8.10).(2) Early return of the faster travelling reflected pressure wave augments the systolicpressure (Figure 8.12c).
d. T – Stroke volume and ejection rate increase during exercise, raising the pulse pressure.e. F – Clinical shock is a state of reduced stroke volume, so pulse pressure falls.
8.11 a. T – The pressure pulse is not a sine wave – contrary to drawings by some students! Systole isshorter than diastole in a resting human (Figure 8.7).
b. F – The incisura is caused by aortic valve closure (Figures 2.2).c. T – The stroke volume advances �20 cm along the aorta in 1 s, whereas the pulse travels at
4–15 m/s; it reaches the periphery in a fraction of a second (Figure 1.7).d. F – The elderly have stiffer arteries, due to arteriosclerosis, and conduction velocity increases
with wall stiffness.e. T – The low stiffness of the artery wall in young people slows the conduction velocity.
The slow reflected wave arrives back in the proximal aorta during diastole, creating a
diastolic wave (Figure 8.12a).The same effect occurs during hypotension, because theartery wall is slacker at the lower pressure.
f. T – The systolic inflection is caused by the rapid return of the reflected wave, due to fastconduction by the stiff arterial system (Figure 8.12c).
8.12 a. F – This phenomenon is called pulsus paradoxus – a sign of cardiac tamponade. Pulsusalternans is alternating strong and weak beats – a sign of severe cardiac failure.
b. T – When the atria are fibrillating, the filling time for the ventricle is irregular, so strokevolume is erratic (Figure 4.3f, radial pulse trace).
c. F – A large pulse pressure is the characteristic feature of aortic valve incompetence (Figure 8.7,top right inset). It can cause a crossed leg to bob markedly in time with pulse.
d. T – Blood is ejected slowly through the narrow valve (Figures 8.7, top left inset and 2.6).
8.13 a. T – Blood first starts to spurt under the cuff when cuff pressure is lowered just below systolicblood pressure, causing the onset of the Korotkov sounds (Figure 8.8).
b. T – When cuff pressure is less than diastolic pressure, flow through the brachial artery iscontinuous and laminar, so it is silent (Figure 8.8). (Nevertheless, the point of silencesoften underestimates true diastolic pressure by several mmHg.)
c. T – The estimate is actually about 10 mmHg below the true value.d. T – In a big arm, a wider cuff is needed to compress the deep brachial artery adequately.e. F – Arterial blood pressure falls in arteries raised above heart level, due to the drag of gravity
(Figure 8.3).
8.14 a. F – The time-averaged pressure of blood in the brachial artery is diastolic � one-thirdpulse pressure (Figures 8.7).This is due to the shape of the pressure wave, which istall but thin in the brachial artery. In the aorta, mean pressure is indeed close to(diastolic � systolic)/2.
b. T – Mean BP � cardiac output � peripheral resistance. Both components are regulated, viathe baroreflex control of sympathetic nerve activity to the heart and blood vessels.
c. F – Blood flow through an organ is regulated chiefly by changes in the local resistancevessels, in accordance with Darcy’s law; flow � pressure gradient/resistance. Blood flowthrough an exercising skeletal muscle can increase by 2000% (20�) yet blood pressureduring exercise increases by only �10%.
d. T – This is how saline or blood transfusions produce therapeutic benefit in hypovolaemicpatients.An increase in blood volume raises central venous pressure, which increasesstroke volume via Starling’s law of the heart (Figure 6.2b, point labelled‘reinfusion’).
e. F – Raising the haematocrit (e.g. polycythaemia) increases the blood viscosity (Figure 8.13),and therefore the resistance to flow. Peripheral resistance depends on fluid viscosity, aswell as vessel radius (Poiseuille’s law).
f. T – Strokes correlate particularly with systolic pressure elevation (systolic hypertension).This is a major reason for treating asymptomatic clinical hypertension.
8.15 a. T – See Figure 8.7.The pressure is slightly lower in a woman (Figure 8.14).b. T – Blood pressure is low in children and increases with age (Figures 8.14).c. F – The increase in stroke volume and ejection velocity during exercise raise the systolic
pressure, even if diastolic pressure falls (Figure 8.15).d. T – The effects of stress (adrenaline and increased sympathetic activity, raised cardiac output,
peripheral vasoconstriction) cause ‘white coat hypertension’.
50 Cardiovascular physiology Answers
Haemodynamics: flow, pressure and resistance Answers 51
e. F – Systolic pressure does indeed increase with age, but not this much (severehypertension).The average systolic pressure at 70 in the English population is�140 mmHg (Figure 8.14).
8.16 a. F – The baroreflex is a negative feedback loop that lowers blood pressure (Figure 8.16).b. T – Peripheral chemoreceptor activation activates sympathetic activity to support blood
pressure during a severe haemorrhage, and to increase cerebral blood flow duringasphyxia.
c. T – Cushing’s reflex is a reflex rise in blood pressure evoked by brainstem compression andasphyxia (Figure 8.17).This helps preserve local cerebral blood flow and oxygen supply.
d. T – Atropine blocks muscarinic M2 receptors for parasympathetic acetylcholine on thepacemaker (Figure 3.14).This raises the heart rate, and therefore cardiac output andblood pressure.
e. F – Blockers of the sympathetic ganglia inhibit postganglionic sympathetic activity.The fall in sympathetic vasoconstrictor fibre activity causes peripheral vasodilatation,lowering peripheral resistance and therefore blood pressure.
f. F – Pressure falls during sleep.g. F – Blood pressure falls during mid-pregnancy, because the fall in total peripheral resistance
(TPR) outweighs the concurrent increase in cardiac output.
8.17 a. T – Flow actually goes into reverse during closure of the aortic valve (Figure 8.18,bottom).
b. F – Flow is still pulsatile, even down to the level of arterial capillaries (Figure 1.6).c. T – The huge increase in the total cross-sectional area of the vascular bed at the level of
capillaries slows the velocity of the blood (Figure 1.6).Velocity (cm s�1) is the flow(i.e. the cardiac output, cm3 s�1) divided by total cross-sectional area (cm2).
d. F – As microvessels unite to form venules and then veins, the total cross-sectional area of thecirculation falls, so the blood velocity increases (Figure 1.6).
8.18 a. F – ‘Transmural’ (‘across-wall’) means the difference in pressure between the inside andoutside of the tube, whereas it is the internal pressure difference between the entry andexit of the tube that drives flow (Figure 8.19).Transmural pressure only affects flow if italters the tube width.
b. T – This is part of Poiseuille’s law (Figure 8.19).The shortness of the capillaries contributesto their low resistance to flow.
c. F – A key feature of Poiseuille’s law is that radius to the fourth power governs flow(Figure 8.19). If the radius increases 2-fold, conductance and flow increase 24 � 16-fold.
d. T – Polycythaemia raises blood viscosity (Figure 8.13).Viscosity is one of the three factorsdetermining resistance to flow through a tube (Figure 8.19).A comparison of the flowcurves for saline and blood through an organ highlights the effect of viscosity on flow(Figure 8.20).
e. T – Vasoconstriction reduces vessel radius, so flow falls markedly, due to the Poiseuille r4
effect; see Figure 8.20, curve labelled ‘Blood � noradrenaline’.f. T – Widespread vasoconstriction raises TPR and therefore arterial blood pressure
(Figure 8.21), BP � CO � TPR.An everyday example is the response to stress.
8.19 a. F – Iron deficiency causes anaemia, which reduces viscosity. Blood viscosity depends chieflyon haematocrit (Figure 18.13).
b. T – Effective blood viscosity varies with tube radius – the Fahreus–Lindqvist effect (Figure 8.6).The Fahreus–Lindqvist effect reduces the resistance of the microcirculation (Figure 8.13).
c. F – Blood viscosity is raised by cooling.This increases the resistance to flow through the skinin cold hands.
d. T – An adaptive polycythaemia raises blood viscosity.e. T – In multiple myeloma, which is a cancerous overproduction of plasma cells, excessive
globulin production increases the blood viscosity.
8.20 a. T – Laplace’s law states that wall tension � (Pinside � Poutside) � radius (Figure 8.22).b. F – The bigger the radius, the bigger the tension produced by a given pressure
(Figure 8.23). So the aorta has the highest wall tension.c. F – Stress is tension per unit cross-sectional area of wall.The thicker the wall, the less the
stress on each element in the wall.Thus, in clinical hypertension, increases in wallthickness in the resistance vessels and left ventricle help normalize wall stress.
d. T – An aneurysm has a bigger radius than the normal vessel, so a bigger wall tension.e. T – Wall tension is low in capillaries due to the tiny radius, but stress is high due to the
extreme thinness of the wall (Figure 8.23).This contributes to capillary fragility.
8.21 a. F – The jugular veins are normally visible only when recumbent or during forced expiration(Figure 8.24).This is because central venous pressure is only a few cmH2O.
b. T – The drag of gravity on the vertical column of arterial blood raises arterial pressure is thelegs (Figure 8.3).
c. T – The venous valves are open when standing still, since blood is flowing continuously upthe veins.The pull of gravity on the vertical column of venous blood raises venouspressure is the legs (Figures 8.3 and 6.9).
d. F – Gravity does not affect flow through a U tube (leg artery to leg vein).This is the siphonprinciple (Figure 8.25). Flow does in fact decrease, but for a different reason, namelypostural vasoconstriction of the resistance vessels in the legs.
e. T – The rise in lower limb venous pressure distends the veins, which results in a transfer ofblood from thorax to the lower limbs (Figure 6.9).This reduces the central venouspressure and therefore stroke volume (Starling’s law).
8.22 a. F – The magnitude of the venous pulse in only a few mmHg.This is too small to feel. Onlythe arterial pulse is palpable.
b. T – The jugular veins are connected via the superior vena cava to the right atrium, with nointervening valves. Right atrial and central venous pressure are raised during rightventricular failure.A raised jugular venous pressure (JVP) is an important clinical signof right heart failure.
c. F – When the atria do not contract in a co-ordinated manner, the ‘a’ wave of the jugularvenous pulse disappears.The normal jugular venous waveform is similar to that shown forthe atrium in Figure 2.2.
d. F – The ‘v’ wave of the jugular pulse becomes exaggerated, due to regurgitation from theright ventricle through the leaking valve during systole.
e. T – The first labelled P wave in Figure 4.3e shows a P-on-ST situation.The atria contractjust after the P wave. If the tricuspid valve is closed at this point, as it is during the S–Tinterval, an exaggerated ‘a’ wave occurs and is transmitted into the jugular veins.
8.23 a. T – Unsupported veins change from a circular cross-section to an elliptical and then figure-of-eight cross-section (i.e. they collapse), as pressure is lowered from �15 cmH2O to afew cmH2O below atmospheric (Figure 8.26).
52 Cardiovascular physiology Answers
b. F – Venous sympathetic fibres release noradrenaline and cause venoconstriction, reducingperipheral blood volume (Figures 8.26 and 6.15).
c. F – The intermittent squeezing of local veins by rhythmically contracting muscle groups(e.g. calf during walking) reduces local venous volume, which boosts central venouspressure (Figure 8.4).
d. F – The veins are the capacitance vessels and contain about two-thirds of the blood volume.
8.24 a. F – Inspiration lowers all intrathoracic pressures.b. F – Vena cava pressure is �3 mmHg, being close to that in the right atrium (Tables 2.1).
20 mmHg would indicate severe heart failure.c. T – The drag of gravity reduces pressures within the skull (Figure 8.3).A traumatic or
surgical breach in the venous sinuses in the upright position therefore carries the riskof air embolism.
d. T – Gravity greatly increases venous pressure in the foot during standing (Figures 8.3and 8.27).A breached dependent vein will therefore bleed profusely, unless raised toheart level.
e. F – The calf muscle pump reduces distal venous pressure (Figure 8.4).This increases the localarterio-venous pressure difference driving the blood flow (Figure 8.27). It also reducescapillary filtration pressure.
f. T – This is the most common site for venepuncture. Pressures are shown in Figure 1.6.g. F – Blood flows from the portal vein through the liver into the vena cava (Figure 1.4).
The pressure must, therefore, be higher in the portal vein than the vena cava.
Haemodynamics: flow, pressure and resistance Answers 53
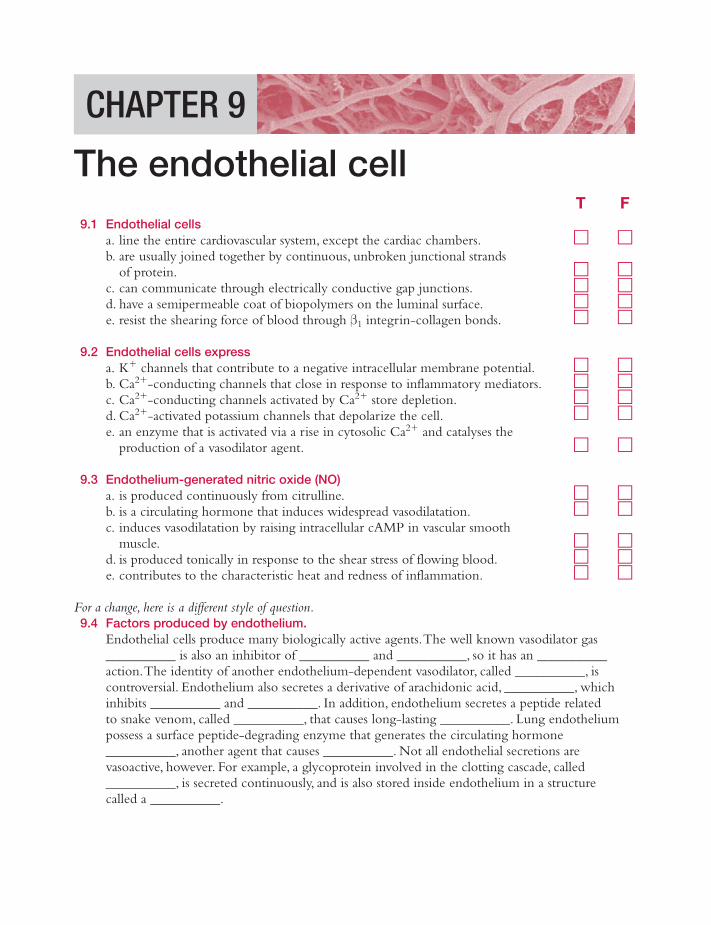
T F9.1 Endothelial cells
a. line the entire cardiovascular system, except the cardiac chambers. � �b. are usually joined together by continuous, unbroken junctional strands
of protein. � �c. can communicate through electrically conductive gap junctions. � �d. have a semipermeable coat of biopolymers on the luminal surface. � �e. resist the shearing force of blood through β1 integrin-collagen bonds. � �
9.2 Endothelial cells expressa. K� channels that contribute to a negative intracellular membrane potential. � �b. Ca2�-conducting channels that close in response to inflammatory mediators. � �c. Ca2�-conducting channels activated by Ca2� store depletion. � �d. Ca2�-activated potassium channels that depolarize the cell. � �e. an enzyme that is activated via a rise in cytosolic Ca2� and catalyses the
production of a vasodilator agent. � �
9.3 Endothelium-generated nitric oxide (NO) a. is produced continuously from citrulline. � �b. is a circulating hormone that induces widespread vasodilatation. � �c. induces vasodilatation by raising intracellular cAMP in vascular smooth
muscle. � �d. is produced tonically in response to the shear stress of flowing blood. � �e. contributes to the characteristic heat and redness of inflammation. � �
For a change, here is a different style of question.9.4 Factors produced by endothelium.
Endothelial cells produce many biologically active agents.The well known vasodilator gas__________ is also an inhibitor of __________ and __________, so it has an __________action.The identity of another endothelium-dependent vasodilator, called __________, iscontroversial. Endothelium also secretes a derivative of arachidonic acid, __________, whichinhibits __________ and __________. In addition, endothelium secretes a peptide relatedto snake venom, called __________, that causes long-lasting __________. Lung endotheliumpossess a surface peptide-degrading enzyme that generates the circulating hormone__________, another agent that causes __________. Not all endothelial secretions arevasoactive, however. For example, a glycoprotein involved in the clotting cascade, called__________, is secreted continuously, and is also stored inside endothelium in a structurecalled a __________.
CHAPTER 9
The endothelial cell
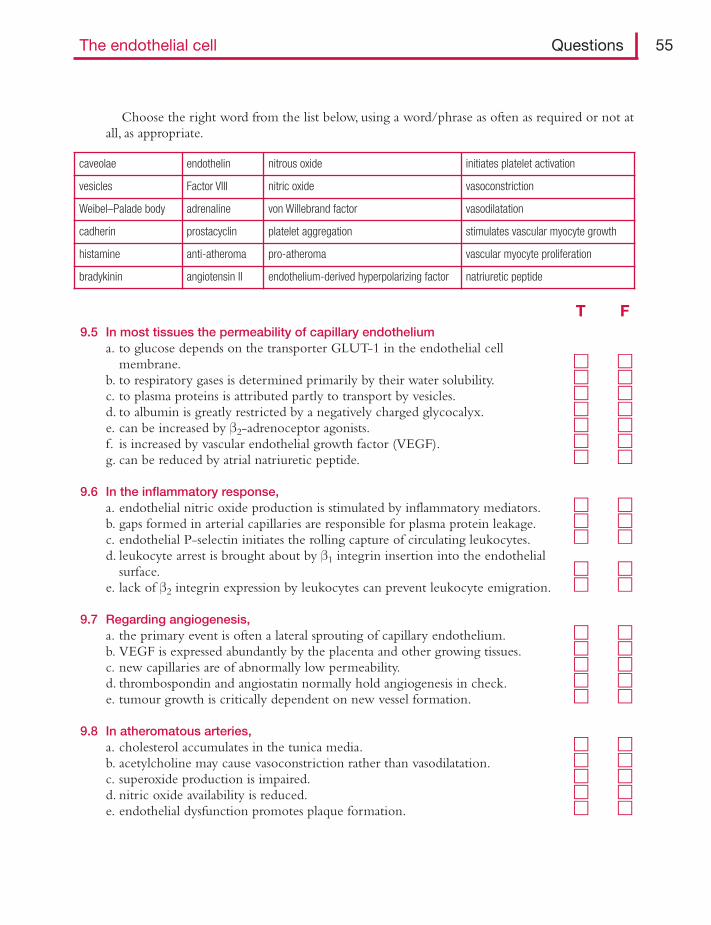
Choose the right word from the list below, using a word/phrase as often as required or not atall, as appropriate.
T F9.5 In most tissues the permeability of capillary endothelium
a. to glucose depends on the transporter GLUT-1 in the endothelial cell membrane. � �
b. to respiratory gases is determined primarily by their water solubility. � �c. to plasma proteins is attributed partly to transport by vesicles. � �d. to albumin is greatly restricted by a negatively charged glycocalyx. � �e. can be increased by β2-adrenoceptor agonists. � �f. is increased by vascular endothelial growth factor (VEGF). � �g. can be reduced by atrial natriuretic peptide. � �
9.6 In the inflammatory response,a. endothelial nitric oxide production is stimulated by inflammatory mediators. � �b. gaps formed in arterial capillaries are responsible for plasma protein leakage. � �c. endothelial P-selectin initiates the rolling capture of circulating leukocytes. � �d. leukocyte arrest is brought about by β1 integrin insertion into the endothelial
surface. � �e. lack of β2 integrin expression by leukocytes can prevent leukocyte emigration. � �
9.7 Regarding angiogenesis, a. the primary event is often a lateral sprouting of capillary endothelium. � �b. VEGF is expressed abundantly by the placenta and other growing tissues. � �c. new capillaries are of abnormally low permeability. � �d. thrombospondin and angiostatin normally hold angiogenesis in check. � �e. tumour growth is critically dependent on new vessel formation. � �
9.8 In atheromatous arteries,a. cholesterol accumulates in the tunica media. � �b. acetylcholine may cause vasoconstriction rather than vasodilatation. � �c. superoxide production is impaired. � �d. nitric oxide availability is reduced. � �e. endothelial dysfunction promotes plaque formation. � �
The endothelial cell Questions 55
caveolae endothelin nitrous oxide initiates platelet activation
vesicles Factor VIII nitric oxide vasoconstriction
Weibel–Palade body adrenaline von Willebrand factor vasodilatation
cadherin prostacyclin platelet aggregation stimulates vascular myocyte growth
histamine anti-atheroma pro-atheroma vascular myocyte proliferation
bradykinin angiotensin II endothelium-derived hyperpolarizing factor natriuretic peptide
Answers
9.1 a. F – Endothelium lines the entire cardiovascular system, including the cardiac chambers.b. F – The junctional strands have breaks that allow water and small lipid-insoluble solutes
(glucose, etc.) to pass from blood to tissue (Figure 9.1).The blood–brain barrier is anexception to this rule.
c. T – Homocellular gap junctions are common in arterial endothelium (Figure 9.2).They arepart of the mechanism underlying conducted vasodilatation. Heterocellular(myoendothelial) gap junctions are common in small vessels (Figure 1.8).They oftenaccount for endothelium-dependent hyperpolarization of vascular smooth muscle(EDHF).
d. T – A thin polymer coating, the glycocalyx, renders endothelium semipermeable, i.e.permeable to water and small solutes but relatively impermeable to plasma proteins(Figure 9.3).
e. T – The integrins link up internally with the actin stress fibres and externally with thetype IV collagen of the basal lamina at focal contact points (Figure 9.3).
9.2 a. T – Inward rectifier Kir channels conduct an outward K� current that generates a negativeintracellular potential (Figure 9.2).The negative potential contributes to theelectrochemical force driving Ca2� entry, e.g. during inflammation.
b. F – Inflammatory agents activate receptor-operated Ca2� channels (Figure 9.2).c. T – Store-operated channels are an important route for Ca2� entry in endothelium
(Figure 9.2).d. F – Endothelial cells express KCa channels that conduct an outward K� current that
hyperpolarizes the cell.This increases the electrochemical gradient driving Ca2� entry.e. T – Endothelial nitric oxide synthase (eNOS) is activated by Ca2�–calmodulin complex and
generates the vasodilator nitric oxide (Figure 9.4).
9.3 a. F – NO is produced by cleavage of the nitro-group from the amino acid arginine by eNOS(endothelial nitric oxide synthase), leaving behind citrulline (Figure 9.4).
b. F – The half-life of NO is only seconds, so it only acts locally; it is not a circulatinghormone, such as adrenaline.
c. F – NO activates smooth muscle guanylate cyclase, which catalyses cGMP production(Figure 9.4). cAMP, by contrast, mediates the vasodilator effect of adrenaline-activatedβ2 receptors.
d. T – Shear stress is thought to be the main tonic stimulus to basal NO production. It activateseNOS via PI3 kinase (Figure 9.4).
e. T – Inflammatory mediators, such as bradykinin and histamine, and other agonists such asparasympathetic acetylcholine, activate eNOS through a rise in Ca2�–calmodulincomplex (Figure 9.4).The resulting vasodilatation increases local blood flow, whichcauses the characteristic heat and redness of inflammation.
9.4 Endothelial cells produce many biologically active agents.The well known vasodilator gasnitric oxide also inhibits platelet aggregation/vascular myocyte proliferation, andplatelet aggregation/vascular myocyte proliferation, so it has an anti-atheroma action.The identity of another endothelium-dependent vasodilator, called endothelial derivedhyperpolarizing factor, is controversial. Endothelium also secretes a derivative of arachidonicacid, prostacyclin, which inhibits platelet aggregation/vasoconstriction and plateletaggregation/vasoconstriction. In addition, endothelium secretes a peptide related to snake
56 Cardiovascular physiology Answers
venom, called endothelin, that causes long lasting vasoconstriction. Lung endotheliumpossess a surface peptide-degrading enzyme that generates the circulating hormoneangiotensin II, another agent that causes vasoconstriction. Not all endothelial secretions arevasoactive, however. For example, a glycoprotein involved in the clotting cascade, called vonWillebrand factor, is secreted continuously, as well as being stored inside endothelium in astructure called a Weibel–Palade body.
9.5 a. F – Glucose diffuses through the intercellular clefts, via breaks in the junctional strands(Figure 9.5). GLUT-1 carrier-based transport is only necessary in blood–brain barriercapillaries.
b. F – Gas permeation depends primarily on lipid solubility. Oxygen and carbon dioxide,being lipid-soluble (lipophilic), diffuse directly through the endothelial plasma membrane(Figure 9.6).
c. T – Plasma proteins can cross the wall via vesicles (Figure 9.6), although this may not bethe sole or even major route (controversial).
d. T – The glycocalyx is the semipermeable layer; it is permeable to water but largelyimpermeable to albumin and most other plasma proteins (Figure 9.6).
e. F – Beta2-adrenoceptor agonists raise endothelial cAMP, which increases the number ofjunctional strands and thereby reduces permeability.
f. T – VEGF was originally called vascular permeability factor. Newly grown capillaries aretherefore abnormally leaky.
g. F – Atrial natriuretic peptide is a hormone that reduces plasma volume, partly by actions onthe kidney and partly by increasing capillary permeability to water.
9.6 a. T – Bradykinin, histamine, etc., increase eNOS activity by raising cytosolic [Ca2�](Figure 9.4).
b. F – Gaps form in venular endothelium during inflammation, increasing immunoglobulinpermeation.
c. T – P selectin is translocated to the luminal membrane from a store in the Weibel–Paladebody (Figure 9.7).
d. F – Leukocytes are arrested by the insertion of vascular cell adhesion molecules (VCAM) andintercellular adhesion molecules (ICAM) into the luminal membrane (Figure 9.7).Abluminal endothelial β1 integrin attaches endothelium to its basement membrane(Figure 9.3).
e. T – Leukocyte β2 integrin is the ligand for the VCAM and ICAM (Figure 9.7). Rareindividuals lacking β2 integrin have difficulty dealing with bacterial infections.
9.7 a. T – New vessels often form from endothelial outgrowths, called sprouts (Figure 9.5).b. T – Vascular endothelial growth factor stimulates endothelial sprouting.c. F – They are hyperpermeable, e.g. to fibrinogen, creating a loose, hydrated matrix called
granulation tissue that is suitable for further angiogenesis.VEGF used to be called vascularpermeability factor.
d. T – These agents counter the angiogenic action of VEGF.e. T – Tumours bigger than �1 mm need a capillary blood supply. Drugs that block
angiogenesis are now being used clinically to inhibit tumour growth.
The endothelial cell Answers 57
9.8 a. F – Cholesterol, the major constituent of low density lipoprotein, accumulates in thesubendothelial space, not the tunica media.Atheroma (atherosclerosis) is primarily a diseaseof the tunica intima.
b. T – Acetylcholine normally causes vasodilatation, by stimulating endothelium to produceextra nitric oxide. NO availability is reduced, however, in atheromatous arteries.Thedirect vasoconstrictor action of acetylcholine on vascular smooth muscle is then revealed(Figure 9.8, bottom left).
c. F – Hypercholesterolaemia, smoking and diabetes increase superoxide production.d. T – The NO reacts with superoxide to form harmful peroxynitrite (Figure 9.8).e. T – Endothelial NO normally exerts multiple anti-atheroma actions.A fall in endothelial
NO thus contributes to atheroma formation.
58 Cardiovascular physiology Answers
T F10.1 Of the three main types of capillary,
a. continuous capillaries predominate in the liver. � �b. fenestrated capillaries are abundant in exocrine glands. � �c. discontinuous capillaries are found in the bone marrow. � �d. fenestrated capillaries are less permeable to water than continuous capillaries. � �e. discontinuous capillaries are more permeable to plasma proteins than
continuous capillaries. � �
10.2 Regarding the permeation of different solutes across the wall of a continuous capillary,a. general anaesthetics permeate rapidly, because they are lipid soluble. � �b. glucose is generally carried across the wall chiefly by plasma ultrafiltration. � �c. urea enters the capillary chiefly by diffusion down a concentration gradient. � �d. oxygen permeation is more than 1000 times faster than glucose permeation. � �e. net water transport depends on diffusion down the water concentration
gradient. � �f. plasma proteins do not cross the capillary wall. � �
10.3 When a solute diffuses from the capillary bloodstream into a tissue,a. the mass transported per unit time is proportional to the fourth power
of the concentration gradient. � �b. doubling the endothelial surface area will double the mass transported
per unit time, for a given concentration gradient. � �c. the diffusion rate is inversely proportional to the solute diffusion coefficient. � �d. the diffusion coefficient of a solute increases in proportion to its
molecular mass. � �e. the mean oxygen concentration along the capillary increases with blood flow. � �
10.4 The permeability of a continuous capillary a. equals the concentration gradient needed to drive 1 unit of solute across
unit wall area per second. � �b. to small lipid-insoluble solutes is mediated by small pores of radius �3–5 nm. � �c. to small lipid-insoluble solutes depends on the extent of the breaks in the
interendothelial junctional strands. � �d. is raised by steric exclusion of solute at the pore entrance and restricted
diffusion inside the pore. � �e. is much greater to small solutes than large solutes. � �
CHAPTER 10
The microcirculation andsolute exchange
10.5 The specialized capillaries of the brain a. are impermeable to many small, lipophobic molecules, such as L-glucose,
that readily permeate capillaries in other tissues. � �b. lack breaks in the intercellular junctional strands. � �c. have an abundant caveola–vesicle system to transport amino acids into
the brain. � �d. express the endothelial carrier protein GLUT-1 for glucose transport. � �e. depend on facilitated diffusion for oxygen transport into the brain. � �
10.6 When a metabolic substrate or drug diffuses from the bloodstreaminto the tissue,a. the mass leaving the blood per minute is called the ‘extraction’. � �b. the fraction of the substance removed per minute is called the ‘clearance’. � �c. the quantity removed per minute equals the blood flow � arterio-venous
concentration difference. � �d. the quantity removed per minute is given by the Fick principle. � �e. the mean capillary concentration of a drug is 6 mM if the arterial
concentration is 8 mM and local venous concentration is 4 mM. � �
10.7 Vasodilatation of the arterioles in skeletal muscle is likely toa. increase the number of capillaries perfused with blood at any one moment. � �b. increase the arterio-venous difference in oxygen content. � �c. reduce the partial pressure of CO2 in the local venous blood. � �d. lower muscle capillary blood pressure. � �e. neither increase nor decrease muscle lymph flow. � �
10.8 Regarding the effect of blood flow on transcapillary solute flux,a. the solute exchange is flow-limited if plasma and interstitial concentrations
equilibrate before the end of the capillary. � �b. O2 uptake by pulmonary capillaries is an example of diffusion-limited
exchange. � �c. doubling the blood flow doubles the transcapillary solute exchange when
exchange is flow-limited, if concentration outside the capillary is constant. � �d. exchange is diffusion-limited when the capillary plasma and interstitial
concentrations fail to equilibrate by the end of the capillary. � �e. raising the blood flow greatly enhances solute exchange if the latter is
diffusion-limited. � �
10.9 The diffusive transfer of glucose from blood to skeletal muscle is increased many fold during exercise by a. an increase in endothelial exchange area due to capillary recruitment � �b. a decrease in the average diffusion distance. � �c. a rise in interstitial glucose concentration. � �d. an increase in capillary permeability to glucose. � �e. a fall in the glucose concentration gradient. � �
60 Cardiovascular physiology Questions
T F
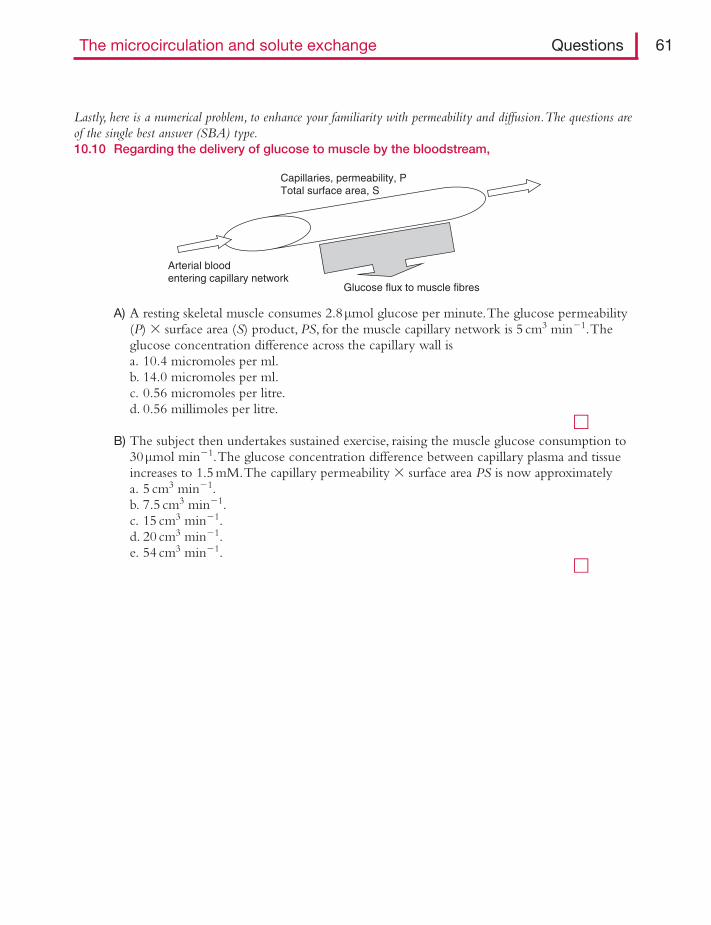
Lastly, here is a numerical problem, to enhance your familiarity with permeability and diffusion.The questions areof the single best answer (SBA) type.10.10 Regarding the delivery of glucose to muscle by the bloodstream,
A) A resting skeletal muscle consumes 2.8μmol glucose per minute.The glucose permeability(P) � surface area (S) product, PS, for the muscle capillary network is 5 cm3 min�1.Theglucose concentration difference across the capillary wall isa. 10.4 micromoles per ml.b. 14.0 micromoles per ml.c. 0.56 micromoles per litre.d. 0.56 millimoles per litre.
�B) The subject then undertakes sustained exercise, raising the muscle glucose consumption to
30μmol min�1.The glucose concentration difference between capillary plasma and tissueincreases to 1.5 mM.The capillary permeability � surface area PS is now approximatelya. 5 cm3 min�1.b. 7.5 cm3 min�1.c. 15 cm3 min�1.d. 20 cm3 min�1.e. 54 cm3 min�1.
�
Capillaries, permeability, PTotal surface area, S
Glucose flux to muscle fibres
Arterial bloodentering capillary network
The microcirculation and solute exchange Questions 61
Answers
10.1 a. F – Liver capillaries are discontinuous or ‘sinusoidal’ (Figure 10.1). Continuous capillariesare found in skin, muscle, connective tissue and the nervous system.
b. T – Fenestrated capillaries are found in tissues specialized for water exchange, including allthe exocrine glands, e.g. salivary glands, pancreas (Figure 10.1b).
c. T – The wide gaps in the wall allow red cells to enter the circulation (Figure 10.1c).d. F – The extremely thin fenestral membrane confers a very high permeability to water and
to small lipophobic solutes, but not plasma proteins.e. T – The gaps in the endothelial lining of discontinuous capillaries are wider than plasma
protein molecules, which therefore escape readily.
10.2 a. T – The vast surface area of the capillary network, comprising the entire lipid endothelialmembrane, is available for the diffusive permeation of lipid-soluble solutes(Figure 9.6). Consequently, general anaesthetics act on the brain extremely rapidly.
b. F – Transcapillary fluid filtration is too slow to carry much glucose across the wall, except inthe renal glomeruli (where the capillaries are fenestrated, not continuous).Transcapillaryglucose transport in skeletal muscle (continuous capillaries) is by diffusion down theglucose concentration gradient.
c. T – If a concentration gradient is present, the transport of any small solute across thecapillary wall is chiefly by diffusion, via the intercellular cleft (Figure 10.2).
d. T – The permeability to lipid-soluble O2 is huge (Figure 10.3).This is because O2 can accessthe entire (lipid) capillary surface (Figure 9.6).The diffusion of lipid-insoluble solutessuch as glucose is limited to the narrow, water-filled intercellular clefts (Figure 10.2).
e. F – This is a common ‘red herring’.The net transfer of water across capillaries is a processof hydraulic flow, not diffusion, being proportional to the net driving pressure(hydraulic pressure gradient minus osmotic pressure gradient).
f. F – The capillary reflection coefficient to plasma proteins, though high, is generally less than100%, so interstitial fluid has a substantial plasma protein concentration – contrary tothe impression given in some textbooks.
10.3 a. F – Fick’s first law of diffusion states that diffusive transport (mass/time) is directlyproportional to the concentration gradient dC/dx (Figure 10.4) (cf. Poiseuille’s law ofhydraulic flow – flow is proportional to radius4, Figure 8.19).
b. T – Diffusive transport ( Js, mass/time) is directly proportional to surface area A. Fick’s first lawof diffusion states: Js � �DA(dC/dx), where D is the diffusion coefficient. So the massivecapillary surface area A in the lungs allows a correspondingly massive rate of O2 uptake.
c. F – Fick’s first law states that diffusive transport (mass/time) is directly proportional to thediffusion coefficient D. D represents the speed at which the solute molecule slipsthrough the solvent molecules.
d. F – The bigger the solute (e.g. plasma protein compared with glucose), the more friction itencounters with the solvent, so the slower it diffuses. Diffusivity D is approximatelyinversely proportional to the square root of molecular mass (Figure 10.3, dashed line‘Free diffusion’).
e. T – The rate of O2 diffusion out of the capillaries ( Js) normally equals the tissue O2consumption, e.g. myocardial O2 consumption, so increasing the O2 delivery to thecapillary leaves more residual O2 in the venous capillary (concentration, CV), if tissueconsumption has not increased.This follows from the Fick principle; CA � CV �Js/blood flow (Figure 10.5).The rise in CV increases the mean O2 concentrationalong the capillary (Figure 10.6).
62 Cardiovascular physiology Answers
10.4 a. F – Permeability P is the solute transfer rate Js (mass/time) per unit concentration differenceΔC across unit surface area A of membrane, P � Js/C�A. It has units of velocity, cm s�1.
b. T – The fall-off in permeability as solute molecules approach 3–5 nm in radius reveals thepore size (Figure 10.3).The small pores are the spaces in the network of biopolymermolecules making up the glycocalyx, which covers the entrance to the intercellular cleft(Figure 9.3).
c. T – The more abundant the breaks, the greater the fraction of the intercellular junction thatis available for solute and water permeation (Figures 9.1, 9.3 top and 10.2).Agentsthat increase the number of junctional strands (cAMP-raising agents) reduce the openfraction of the cleft, and thus reduce capillary permeability.
d. F – When the ratio of solute radius to pore radius is 1:10, the solute experiences difficultyin entering the pore (steric exclusion) and diffusing inside it (restricted diffusion).Thesebiophysical effects reduce permeability.
e. T – Small solutes experience less steric exclusion and restriction to diffusion (Figure 10.3).
10.5 a. T – The endothelial cells create a blood–brain barrier. L-glucose, the stereoisomer of naturalD-glucose (dextrose) and other small molecules, such as mannitol and catecholamines,cannot penetrate this barrier.
b. T – The continuous junctional strands create the barrier.c. F – There are few caveolae or vesicles, so little protein is transported across the barrier.
Amino acids are transported across the barrier by specialized carrier proteins in theendothelial cell membrane.
d. T – This is how natural glucose, D-glucose, the brain’s primary energy source, is transportedacross the barrier.The process is a facilitated, carrier-mediated diffusion.
e. F – The respiratory gases are lipid soluble, so they diffuse through the cerebral capillary wallwithout hindrance (Figure 9.6).
10.6 a. F – Extraction is the fraction of the solute removed (Figure 10.5). For example, if thearterial concentration is 8 mM and the local venous concentration is 4 mM, half thesolute has been extracted; the extraction is 50%.
b. F – Clearance is the volume of plasma that would be cleared of the substance per minute, soits units are millilitres/minute – as in renal clearance.The clearance equals the mass ofsubstance removed per minute ( Js) divided by arterial plasma concentration (CA). Forexample, if Js is 2 millimoles/min and the arterial concentration is 8 millimoles/litre, theclearance is 2/8 � 0.25 litre/min � 250 ml/min.
c. T – This is the Fick principle (Figures 7.3 and 10.5). Example: if the arterialconcentration is 8 mM and local venous concentration is 4 mM, the A–V differenceis 4 millimoles/litre. If the blood flow is, say, 0.5 litre/min, the solute flux Js is(8 � 4) � 0.5 � 2 millimoles/min.
d. T – The statement in ‘c’ was in fact the Fick principle; solute flux Js � bloodflow � (CA � CV) (Figure 7.3).
e. F – Concentration does not fall linearly along a capillary, because outward diffusion is fastestin the early part of the capillary, where the concentration is highest (Figure 10.5).Thetrue mean is lower than the arithmetical average.
10.7 a. T – This is called capillary recruitment (Figure 10.7). Recruitment facilitates gas exchangein exercising muscle.
b. F – Vasodilatation increases the blood flow. If the metabolic demand of the tissue has notincreased, less O2 needs to be extracted from each ml of blood when flow is increased.
The microcirculation and solute exchange Answers 63
The venous O2 therefore rises and the A–V difference declines.This follows from theFick principle, (A � V)O2 � O2 consumption/blood flow (Figure 10.5).
c. T – Applying the Fick principle, we see that (V � A)CO2 � CO2 production/blood flow.A rise in blood flow will therefore reduce venous CO2 concentration (and thus PCO2),provided that muscle metabolic rate has not increased.
d. F – Vasodilatation reduces the arteriolar resistance guarding the capillaries. Blood losesless pressure energy in traversing the dilated arteriole and capillary pressure rises(Figure 11.7).
e. F – The rise in capillary pressure increases the capillary filtration rate, which increases therate of lymph production.
10.8 a. T – The flow Q· is delivering solute less rapidly than solute diffuses across the wall, due tothe high diffusion capacity of the wall (permeability–surface area product, PS). Flow-limited exchange occurs when the ratio PS/Q· is 5 (Figure 10.6a, curves 1–2).
b. F – Raising the blood flow through the lungs (cardiac output) during exercise increases theO2 uptake.This, then, is an example of flow-limited exchange.
c. T – Applying the Fick principle, solute flux Js � blood flow�(CA�CV). Doubling theblood flow doubles the solute exchange, if venous concentration CV (which hasequilibrated with the surrounding concentration) is unchanged on raising flow, e.g. inthe lungs (Figure 10.6a curves 1–3; Figure 10.6b points 1 and 2).
d. T – The flow Q· is delivering material faster than it can escape, due to the limited diffusioncapacity of the wall (PS) (Figure 10.6a curves 5–7).The ratio PS/Q· is �1.An exampleis glucose in exercising muscle.
e. F – Raising blood flow has little effect on diffusion-limited exchange (Figure 10.6b,points 5–7). This is because diffusion capacity PS, not blood flow, is limiting theexchange rate. In the Fick formula, flux Js � flow � (CA � CV), the effect of theincrease in flow is almost cancelled out by a rise in venous concentration CV. CV risesbecause each unit of blood has less time in the capillary to exchange its contents.
10.9 a. T – Metabolic vasodilatation of the muscle arterioles recruits capillaries that had little flowat a given instant during rest.This increases the homogeneity of perfusion and theendothelial surface area available for exchange (Figure 10.7).
b. T – Capillary recruitment reduces the radius of the Krogh cylinder, i.e. the cylinder ofmuscle fibres that a given capillary has to supply (Figure 10.7).
c. F – The increased glucose consumption of the muscle lowers the interstitial glucoseconcentration.This is reflected in the fall in venous glucose concentration(Figure 10.8, middle).
d. T – Capillary permeability to a range of small lipophobic solutes is increased by flow.e. F – The concentration gradient from plasma to tissue,ΔC/Δx, increases, due partly to the
fall in tissue glucose concentration (which raises the concentration difference ΔC) andpartly to capillary recruitment (which reduces the diffusion distance Δx).
10.10 Part A. The single correct answer is (d). Permeability P is by definition solute flux Js per unitsurface area S per unit concentration drop ΔC. Re-arranging this definition,ΔC � Js/PS � 2.8μmol min�1/5 cm3 min�1 � 0.56μmol/cm3 � 0.56 millimoles/litre.
Part B. The single correct answer is again (d). From the definition of permeability,PS � Js/ΔC � 30μmol min�1/1.5μmol cm�3 � 20 cm3 min�1. PS is four timesbigger than in resting muscle, due to capillary recruitment, and probably also anincrease in permeability stimulated by the increased blood flow.
64 Cardiovascular physiology Answers
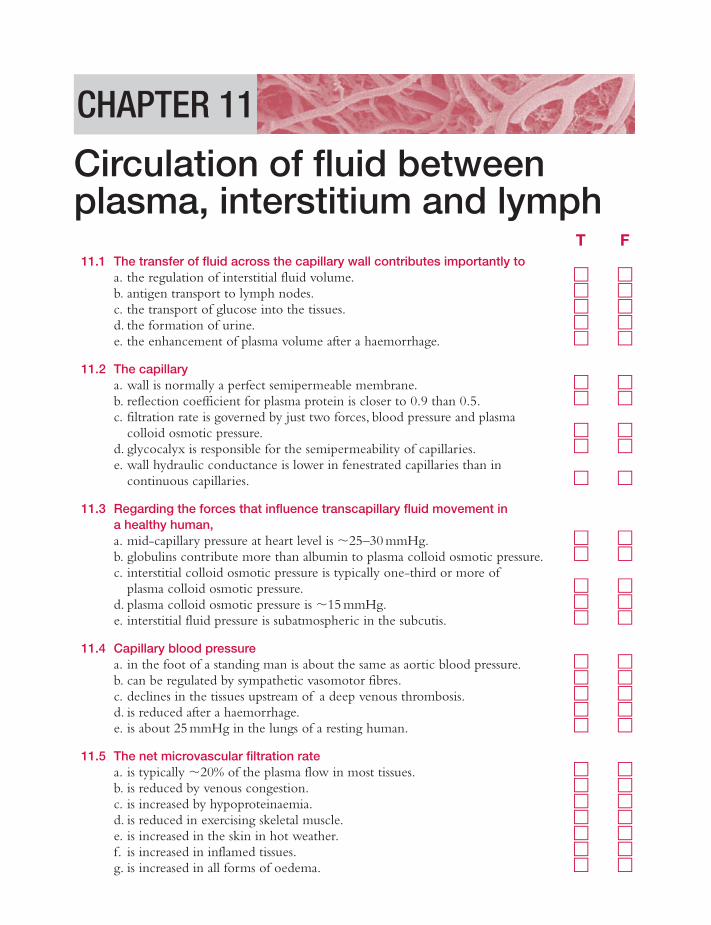
T F11.1 The transfer of fluid across the capillary wall contributes importantly to
a. the regulation of interstitial fluid volume. � �b. antigen transport to lymph nodes. � �c. the transport of glucose into the tissues. � �d. the formation of urine. � �e. the enhancement of plasma volume after a haemorrhage. � �
11.2 The capillarya. wall is normally a perfect semipermeable membrane. � �b. reflection coefficient for plasma protein is closer to 0.9 than 0.5. � �c. filtration rate is governed by just two forces, blood pressure and plasma
colloid osmotic pressure. � �d. glycocalyx is responsible for the semipermeability of capillaries. � �e. wall hydraulic conductance is lower in fenestrated capillaries than in
continuous capillaries. � �
11.3 Regarding the forces that influence transcapillary fluid movement in a healthy human,a. mid-capillary pressure at heart level is �25–30 mmHg. � �b. globulins contribute more than albumin to plasma colloid osmotic pressure. � �c. interstitial colloid osmotic pressure is typically one-third or more of
plasma colloid osmotic pressure. � �d. plasma colloid osmotic pressure is �15 mmHg. � �e. interstitial fluid pressure is subatmospheric in the subcutis. � �
11.4 Capillary blood pressurea. in the foot of a standing man is about the same as aortic blood pressure. � �b. can be regulated by sympathetic vasomotor fibres. � �c. declines in the tissues upstream of a deep venous thrombosis. � �d. is reduced after a haemorrhage. � �e. is about 25 mmHg in the lungs of a resting human. � �
11.5 The net microvascular filtration ratea. is typically �20% of the plasma flow in most tissues. � �b. is reduced by venous congestion. � �c. is increased by hypoproteinaemia. � �d. is reduced in exercising skeletal muscle. � �e. is increased in the skin in hot weather. � �f. is increased in inflamed tissues. � �g. is increased in all forms of oedema. � �
CHAPTER 11
Circulation of fluid betweenplasma, interstitium and lymph
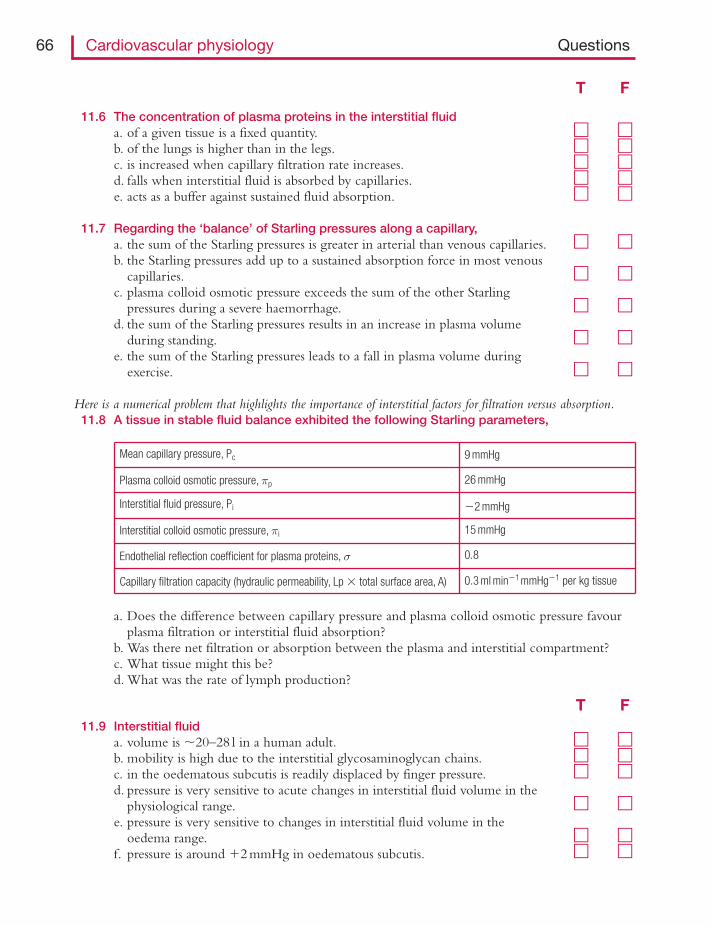
11.6 The concentration of plasma proteins in the interstitial fluida. of a given tissue is a fixed quantity. � �b. of the lungs is higher than in the legs. � �c. is increased when capillary filtration rate increases. � �d. falls when interstitial fluid is absorbed by capillaries. � �e. acts as a buffer against sustained fluid absorption. � �
11.7 Regarding the ‘balance’ of Starling pressures along a capillary,a. the sum of the Starling pressures is greater in arterial than venous capillaries. � �b. the Starling pressures add up to a sustained absorption force in most venous
capillaries. � �c. plasma colloid osmotic pressure exceeds the sum of the other Starling
pressures during a severe haemorrhage. � �d. the sum of the Starling pressures results in an increase in plasma volume
during standing. � �e. the sum of the Starling pressures leads to a fall in plasma volume during
exercise. � �
Here is a numerical problem that highlights the importance of interstitial factors for filtration versus absorption.11.8 A tissue in stable fluid balance exhibited the following Starling parameters,
66 Cardiovascular physiology Questions
a. Does the difference between capillary pressure and plasma colloid osmotic pressure favourplasma filtration or interstitial fluid absorption?
b. Was there net filtration or absorption between the plasma and interstitial compartment?c. What tissue might this be?d. What was the rate of lymph production?
T F11.9 Interstitial fluid
a. volume is �20–28 l in a human adult. � �b. mobility is high due to the interstitial glycosaminoglycan chains. � �c. in the oedematous subcutis is readily displaced by finger pressure. � �d. pressure is very sensitive to acute changes in interstitial fluid volume in the
physiological range. � �e. pressure is very sensitive to changes in interstitial fluid volume in the
oedema range. � �f. pressure is around �2 mmHg in oedematous subcutis. � �
Mean capillary pressure, Pc 9 mmHg
Plasma colloid osmotic pressure, πp 26 mmHg
Interstitial fluid pressure, Pi �2 mmHg
Interstitial colloid osmotic pressure, πi 15 mmHg
Endothelial reflection coefficient for plasma proteins, σ 0.8
Capillary filtration capacity (hydraulic permeability, Lp � total surface area, A) 0.3 ml min�1mmHg�1 per kg tissue
T F
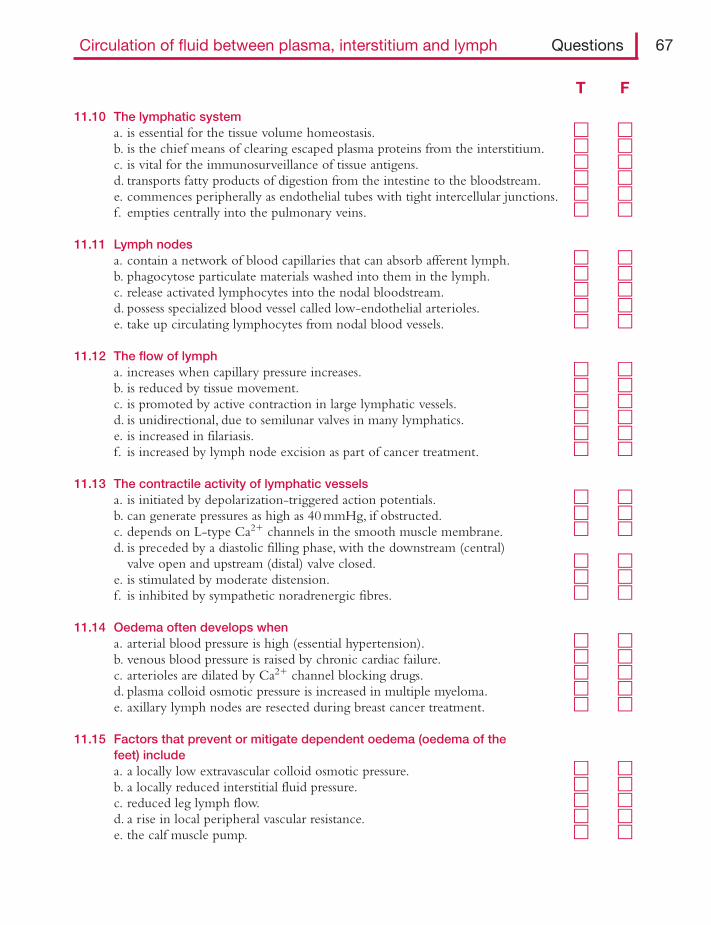
11.10 The lymphatic systema. is essential for the tissue volume homeostasis. � �b. is the chief means of clearing escaped plasma proteins from the interstitium. � �c. is vital for the immunosurveillance of tissue antigens. � �d. transports fatty products of digestion from the intestine to the bloodstream. � �e. commences peripherally as endothelial tubes with tight intercellular junctions. � �f. empties centrally into the pulmonary veins. � �
11.11 Lymph nodesa. contain a network of blood capillaries that can absorb afferent lymph. � �b. phagocytose particulate materials washed into them in the lymph. � �c. release activated lymphocytes into the nodal bloodstream. � �d. possess specialized blood vessel called low-endothelial arterioles. � �e. take up circulating lymphocytes from nodal blood vessels. � �
11.12 The flow of lympha. increases when capillary pressure increases. � �b. is reduced by tissue movement. � �c. is promoted by active contraction in large lymphatic vessels. � �d. is unidirectional, due to semilunar valves in many lymphatics. � �e. is increased in filariasis. � �f. is increased by lymph node excision as part of cancer treatment. � �
11.13 The contractile activity of lymphatic vesselsa. is initiated by depolarization-triggered action potentials. � �b. can generate pressures as high as 40 mmHg, if obstructed. � �c. depends on L-type Ca2� channels in the smooth muscle membrane. � �d. is preceded by a diastolic filling phase, with the downstream (central)
valve open and upstream (distal) valve closed. � �e. is stimulated by moderate distension. � �f. is inhibited by sympathetic noradrenergic fibres. � �
11.14 Oedema often develops whena. arterial blood pressure is high (essential hypertension). � �b. venous blood pressure is raised by chronic cardiac failure. � �c. arterioles are dilated by Ca2� channel blocking drugs. � �d. plasma colloid osmotic pressure is increased in multiple myeloma. � �e. axillary lymph nodes are resected during breast cancer treatment. � �
11.15 Factors that prevent or mitigate dependent oedema (oedema of the feet) includea. a locally low extravascular colloid osmotic pressure. � �b. a locally reduced interstitial fluid pressure. � �c. reduced leg lymph flow. � �d. a rise in local peripheral vascular resistance. � �e. the calf muscle pump. � �
Circulation of fluid between plasma, interstitium and lymph Questions 67
T F
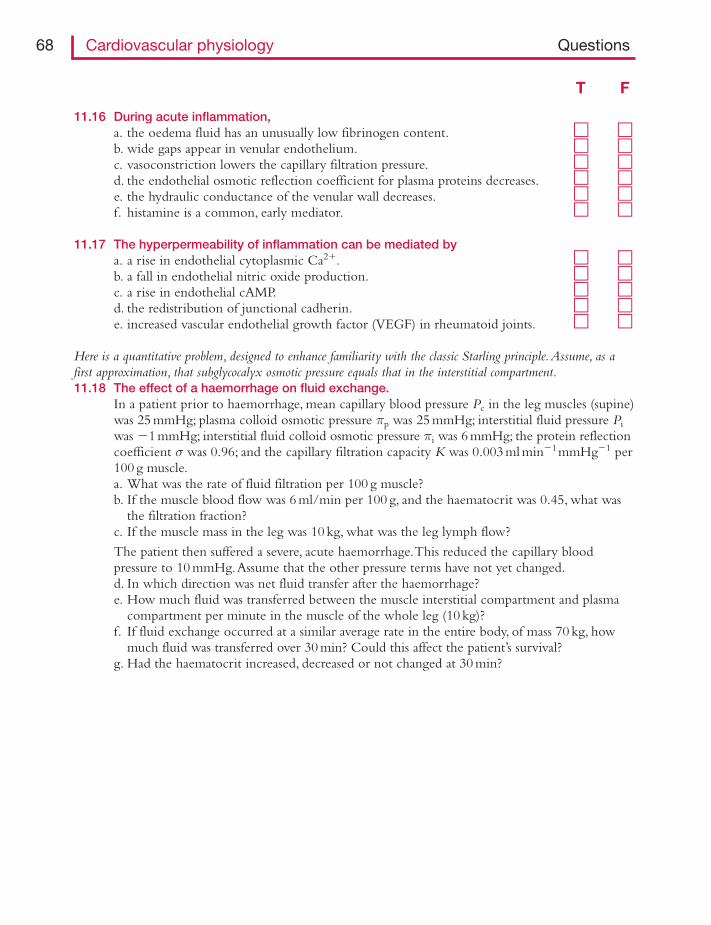
11.16 During acute inflammation,a. the oedema fluid has an unusually low fibrinogen content. � �b. wide gaps appear in venular endothelium. � �c. vasoconstriction lowers the capillary filtration pressure. � �d. the endothelial osmotic reflection coefficient for plasma proteins decreases. � �e. the hydraulic conductance of the venular wall decreases. � �f. histamine is a common, early mediator. � �
11.17 The hyperpermeability of inflammation can be mediated bya. a rise in endothelial cytoplasmic Ca2�. � �b. a fall in endothelial nitric oxide production. � �c. a rise in endothelial cAMP. � �d. the redistribution of junctional cadherin. � �e. increased vascular endothelial growth factor (VEGF) in rheumatoid joints. � �
Here is a quantitative problem, designed to enhance familiarity with the classic Starling principle.Assume, as afirst approximation, that subglycocalyx osmotic pressure equals that in the interstitial compartment.11.18 The effect of a haemorrhage on fluid exchange.
In a patient prior to haemorrhage, mean capillary blood pressure Pc in the leg muscles (supine)was 25 mmHg; plasma colloid osmotic pressure πp was 25 mmHg; interstitial fluid pressure Piwas �1 mmHg; interstitial fluid colloid osmotic pressure πi was 6 mmHg; the protein reflectioncoefficient σ was 0.96; and the capillary filtration capacity K was 0.003 ml min�1mmHg�1 per100 g muscle.a. What was the rate of fluid filtration per 100 g muscle?b. If the muscle blood flow was 6 ml/min per 100 g, and the haematocrit was 0.45, what was
the filtration fraction?c. If the muscle mass in the leg was 10 kg, what was the leg lymph flow?
The patient then suffered a severe, acute haemorrhage.This reduced the capillary bloodpressure to 10 mmHg.Assume that the other pressure terms have not yet changed.d. In which direction was net fluid transfer after the haemorrhage?e. How much fluid was transferred between the muscle interstitial compartment and plasma
compartment per minute in the muscle of the whole leg (10 kg)?f. If fluid exchange occurred at a similar average rate in the entire body, of mass 70 kg, how
much fluid was transferred over 30 min? Could this affect the patient’s survival?g. Had the haematocrit increased, decreased or not changed at 30 min?
68 Cardiovascular physiology Questions
T F
Answers
11.1 a. T – Interstitial fluid is continuously replenished by capillary filtrate (Figure 11.1). Excessivefiltration causes oedema.
b. T – Capillary filtrate forms interstitial fluid, which drains into lymphatics, carrying antigensfrom the tissue to the lymph nodes for immunosurveillance (Figure 11.2).
c. F – Glucose diffuses down its concentration gradient much faster than it is washed into thetissue by the relatively slow stream of capillary filtrate.
d. T – Glomerular capillary filtration is the first stage in urine formation.e. T – Capillaries absorb interstitial fluid after a haemorrhage, thus boosting the depleted
plasma volume – the ‘internal transfusion’.
11.2 a. F – The wall is an imperfect semipermeable membrane; it allows some plasma proteinpermeation (reflection coefficient σ � 1.0).A perfect semipermeable membrane totallyexcludes the osmotically active solute (σ � 1.0).
b. T – About 90% of the plasma protein osmotic pressure is exerted in practice; the osmoticreflection coefficient σ is 0.9 (90%). Sigma falls below 0.5 during inflammation, due togap formation.
c. F – Four forces must always be considered, not just two. Filtration rate is proportional to thedifference in hydraulic pressure across the membrane minus the difference in the effectivecolloid osmotic pressure across the membrane (Starling’s principle of fluid exchange,Figure 11.3).
d. T – The glycocalyx comprises a biopolymer network (Figure 9.3).The small poresbetween the polymer fibres impede plasma protein passage, relative to water and smallsolutes (Figure 11.3b).
e. F – The extremely thin membranes of the fenestrations are highly permeable to water andsmall solutes, though not to plasma proteins (Figure 10.1).
11.3 a. T – These are typical values in human skin at heart level, as measured through amicropipette (Figures 11.3, top and 11.4, left).
b. F – Albumin comprises only approximately half of the plasma protein mass, but accounts forapproximately two-thirds of the plasma colloid osmotic pressure (COP).This is becausefixed negative charges on the albumin molecule attract Na� ions, which contribute tothe osmotic pressure (Gibbs–Donnan effect).
c. T – The value depends on the tissue and on capillary filtration rate, but typically rangesfrom 23% (leg) to 70% (lung) of plasma COP (Figures 11.3, top and 11.4, left).There is a widespread misconception that interstitial COP is negligible.
d. F – Human plasma COP averages �25 mmHg (range, 21–29 mmHg) (Figure 11.3, top).A general rule across different species is that mid-capillary pressure and plasma COPare approximately equal.
e. T – Measurements using the wick-in-needle and servo-null micropipettes indicate thatinterstitial fluid pressure is �1 to �3 mmHg in skin and subcutis (Figures 11.3, topand 11.5).
11.4 a. T – Direct micropuncture studies show that capillary pressure in the human foot duringstanding is about 90 mmHg (120 cmH2O) (Figure 11.6).
b. T – Capillary pressure depends partly on the pre- to postcapillary resistance ratio(Figure 11.7), and the precapillary resistance vessel diameter is controlled by sympatheticvasoconstrictor fibres. Sympathetic activity raises the precapillary resistance, causingblood to lose more pressure before it reaches the capillary; capillary pressure thus falls.
Circulation of fluid between plasma, interstitium and lymph Answers 69
c. F – A deep vein thrombosis (DVT) raises the post-capillary resistance, and thus raisescapillary pressure.A DVT therefore causes acute limb oedema.
d. T – Haemorrhage triggers a reflex, sympathetic-mediated vasoconstriction.This raises thepre- to postcapillary resistance ratio (Figure 11.7); also arterial and venous pressuresmay fall.The resulting fall in capillary pressure allows the plasma colloid osmoticpressure to absorb interstitial fluid – the ‘internal transfusion’ (Figure 11.4, middle).
e. F – Pressures are much lower in the pulmonary circulation than the systemic circulation.Pulmonary capillary pressure is �9–13 mmHg at rest.
11.5 a. F – The filtration fraction is only 0.2–0.3% in most tissues. It reaches 20% in thespecialized, highly fenestrated capillaries of the renal glomerulus.
b. F – A rise in venous pressure increased the capillary pressure and therefore filtration rate.This is a common cause of oedema (Figure 11.8).
c. T – Hypoproteinaemia reduces plasma colloid osmotic pressure, the force retaining water inthe circulation.The increased capillary filtration rate can lead to oedema.
d. F – A rise in interstitial osmolarity in the exercising muscle increase filtration rate.This iscompounded by metabolic vasodilatation of the arterioles, which raises capillarypressure (Figure 11.7).
e. T – Heat causes cutaneous arterioles to dilate.This reduces precapillary resistance and thusraise capillary pressure (Figure 11.7).The resulting increase in interstitial fluid volumeexplains why a ring on the finger becomes much tighter in hot weather.
f. T – Inflammation causes gaps to form in the post-capillary venule wall. Gaps increase thewall’s hydraulic conductance and reduce its osmotic reflection coefficient, raising thefiltration rate (Figure 11.9).This leads to the rapid, severe tissue swelling that is a majorfeature of inflammation.
g. F – Although most forms of oedema are indeed caused by increased capillary filtration rate,lymphoedema is caused by reduced lymphatic drainage.
11.6 a. F – Interstitial protein concentration is set by the ratio of protein leakage rate to waterfiltration rate. Since the latter is a dynamic variable, dependent on capillary pressure, sotoo is interstitial protein concentration and COP (Figure 11.10).
b. T – Since capillary pressure is low in the pulmonary circulation, filtration rate and lymphflow are low, so interstitial protein concentration and COP are high (Figure 11.10).Due to the high interstitial COP, lung capillaries filter fluid despite their low capillarypressure.This illustrates the need to take account of the interstitial forces whenconsidering fluid exchange.
c. F – Raising the filtration rate reduces interstitial protein concentration (Figure 11.10).d. F – Extravascular plasma protein concentration increases as interstitial fluid is absorbed, due
to the reflection of the extravascular proteins by the capillary wall.e. T – The process described in (d) raises extravascular colloid osmotic pressure.This
progressively slows and eventually halts the absorption process (Figure 11.4, right).
11.7 a. T – Capillary blood pressure falls along the length of the capillary, so the net filtration forceis low in venous capillaries and venules (Figure 11.4, left).
b. F – This fallacy has been perpetuated for over half a century, based usually on inappropriatevalues for the interstitial forces.When all four Starling pressures are measured in thesame tissue, they add up to a slight net filtration force in most venous capillaries andvenules (Figures 11.4 and 11.11). Fluid absorption is not sustained at venous capillarypressure in most tissues (Figure 11.12, steady-state curve).
70 Cardiovascular physiology Answers
c. T – Capillary pressure falls during a severe haemorrhage.Transient fluid absorption ensues(Figure 11.4, middle panel).
d. F – During orthostasis the capillary pressure increases in the tissues below heart level.Consequently, the filtration rate increases over much of the body, reducing the plasmavolume by 6% or more.
e. T – In exercising muscle the arteriolar vasodilatation raises capillary blood pressure.Also,interstitial osmolarity is raised by crystalloids (lactate, K�) released by the contractingmuscle fibres.The resulting increase in local capillary filtration rate reduces plasmavolume by as much as 20%.
11.8 a. Since the osmotic suction pressure of the plasma proteins πp (26 mmHg) exceeds capillaryfiltration pressure Pc (9 mmHg), this difference strongly favours fluid absorption.
b. Despite the answer to (a), there is actually net filtration in this tissue – because fluidmovement depends on interstitial, as well as intravascular forces. Starling’s principle statesthat the net force driving fluid movement is (Pc � Pi) � σ(πp � πi) (neglecting differencesbetween interstitium and subglycocalyx).This is (9 � (�2)) � 0.8(26 � 15) � 2.2 mmHg.There is thus a net filtration gradient from plasma to interstitium.
c. The lung.The very low mean capillary pressure is typical of the low-pressure pulmonarycirculation (lowest, left point, Figure 11.11). So too are the high interstitial colloid osmoticpressure and high capillary filtration capacity (CFC).
d. According to the classic Starling principle (neglecting differences between interstitiumand subglycocalyx), the filtration rate Jv � LpA{(Pc � Pi) � σ(πp � πi)} � 0.3{2.2} �0.66 ml min�1kg�1. Over a day, therefore, the human lungs (which weigh �1 kg) shouldproduce �950 ml of prenodal lymph.
11.9 a. F – Interstitial fluid volume is �10–12 l (Figure 11.1). Intracellular fluid volume is doublethis, �20 l (female) to 28 l (male).
b. F – Interstitial glycosaminoglycan chains fill in the spaces between the collagen fibrils,thus creating a high resistance to flow (Figure 11.13). Consequently, interstitialfluid mobility is normally low and normal tissue does not pit readily to externalpressure.
c. T – Dilution of the interstitial glycosaminoglycans by oedema fluid raises the fluid mobility.Consequently, an oedematous tissue ‘pits’ readily – the clinical ‘pitting test’ for oedema(Figure 11.14).
d. T – The sigmoidal pressure–volume relation is steep at normal hydrations (Figure 11.5).This is because the suction effect of the glycosaminoglycans (their osmotic pressure or‘swelling pressure’), which contributes to the subatmospheric pressure, depends on theirconcentration – which is altered by acute changes in volume.
e. F – The pressure–volume relation is very flat in the oedema range (Figure 11.5).Theglycosaminoglycan osmotic pressure has been reduced to zero by dilution. Due tothe flatness of the relation, oedema fluid can accumulate with little increase inopposing force.
f. T – This is a typical value, e.g. in human limb lymphoedema.
11.10 a. T – The lymphatics are the normal route by which the capillary filtrate is returned to thebloodstream (Figures 11.1 and 11.2).
b. T – The hydraulic and diffusive gradients across the capillary wall prevent net reuptake ofescaped plasma proteins into the microcirculation.
Circulation of fluid between plasma, interstitium and lymph Answers 71
c. T – Lymph carries viral and other antigens to the lymph nodes.Although all vertebrateshave a lymphatic system, only mammals and certain birds have lymph nodes.
d. T – Intestinal lacteals transport chylomicra to the cisterna chyli (Figure 11.2).Theobservation of these milky vessels led to the discovery of the lymphatic system.
e. F – The initial lymphatics are indeed endothelial tubes, but the intercellular junctions arevery loose.They act as flap valves that allow interstitial fluid entry (Figure 11.15).
f. F – The main lymphatic vessel, the thoracic duct, drains into the left subclavian vein in theroot of the neck (Figure 11.2).
11.11 a. T – Lymph node capillaries absorb up to half the water and electrolytes in the incomingafferent lymph (Figures 11.1 and 11.2). Efferent lymph thus has a smaller volume andhigher protein concentration than afferent lymph.
b. T – The sinuses of a lymph node are lined by phagocytic cells that take up particles; carbonparticles blacken the hilar nodes in the lungs of smokers.
c. F – Nodes release lymphocytes into the efferent lymph, which therefore has a higherlymphocyte count than afferent lymph (Figure 11.2).
d. F – Nodes contain specialized blood vessels called high-endothelial venules (Figure 11.2).These vessels express a receptor for L-selectin on circulating lymphocytes.
e. T – Lymphocytes adhere to the high endothelial venules and migrate into the node throughthe high endothelium, completing their own ‘circulation’ between lymph and blood.
11.12 a. T – Increased capillary pressure raises capillary filtration rate. In the steady state, interstitialfluid drainage (lymph flow) must equal interstitial fluid formation (capillary filtration)(Figure 11.1).
b. F – Tissue movement causes cyclic squeezing of the small lymphatics, which promoteslymph flow.
c. T – Large lymphatics have smooth muscle in the wall and contract rhythmically.Thelymphatic pressure–volume loop is comparable with that of the ventricle(Figure 11.16).
d. T – The larger lymphatic vessels have semilunar valves (Figures 11.2 and 11.15a).e. F – Filariasis, a nematode worm infection, blocks lymphatics. It is the most common cause
of lymphoedema worldwide.f. F – Nodal excision obstructs lymphatic drainage. It is the most common cause of
lymphoedema in the West.
11.13 a. T – A slow depolarization triggers a burst of action potentials, which in turn triggercontraction (Figure 11.16a).
b. T – Human arm and leg lymphatics can pump to these pressures if obstructed.Therefore,the tourniquet pressure applied to cases of snake or spider envenomation has to be40–50 mmHg – otherwise venom-laden lymph can be pumped centrally.
c. T – Lymphatic smooth muscle action potentials are generated partly by activated Ca2�
channels.d. F – In the diastolic filling phase, the distal, upstream valve is open and the proximal,
downstream valve is closed – similar to the cardiac ventricular filling phase.(Figure 11.16b; compare to Figure 2.7).
e. T – Moderate lymphatic distension boosts both contractile force and frequency(Figure 11.16b). Excessive distension reduces contractile force.
72 Cardiovascular physiology Answers
f. F – Large lymphatics have a sympathetic noradrenergic innervation that increasescontractility and ejection fraction, e.g. after a haemorrhage (Figure 11.16b,dashed loop).
11.14 a. F – Oedema is not a feature of clinical hypertension, unless heart failure supervenes.Hypertension is due to increased precapillary resistance; so the pressure drop across theprecapillary resistance vessels is bigger than usual.This protects the capillary from anysubstantial rise in pressure.
b. T – A rise in venous pressure increases the capillary pressure and filtration rate (Figure 11.8),leading to peripheral and pulmonary oedema. Deep vein thrombosis has a similar effectin the drainage territory of the obstructed vein.
c. T – A fall in the precapillary resistance raises capillary pressure (Figure 11.7).This can leadto oedema, a recognized complication of Ca2� blockers.These drugs may also inhibitlymphatic contractility.
d. F – Multiple myeloma is a cancer of globulin-secreting cells that causes hyperproteinaemia.But it is hypoproteinaemia that causes oedema, by reducing plasma colloid osmoticpressure, the force retaining water in the circulation.
e. T – Up to a quarter of women treated in this way for breast cancer develop lymphoedemaof the arm.
11.15 a. T – The extravascular plasma protein concentration is low due to capillary filtration.Thisreduces the extravascular colloid osmotic pressure, which in turn attenuates the filtrationrate (Figure 11.17a).
b. F – Interstitial fluid pressure rises as capillary filtration and interstitial fluid volume areincreased by dependency (Figure 11.17b).The rise in interstitial pressure reduces thepressure gradient driving capillary filtration.
c. F – Lymph flow increases, because capillary filtration delivers more fluid to the interstitium,raising interstitial fluid volume (Figure 11.17c).
d. T – Precapillary resistance vessel contract in the dependent tissue (postural vasoconstriction)(Figure 11.6).The increased precapillary resistance reduces local capillary pressure toalmost the minimum possible, namely venous pressure.
e. T – The calf muscle pump lowers the venous pressure in the dependent leg (Figure 8.4).Since capillary pressure is close to venous pressure, it too falls, reducing the filtrationrate.
11.16 a. F – Inflammation oedema is an ‘exudate’, i.e. rich in plasma proteins, especially the largeones such as fibrinogen (due to gaps in the endothelium).The high fibrinogen contentcan cause problems, e.g. fibrin adhesions between loops of bowel following peritonitis.
b. T – The gaps between and/or through the venular endothelial cells increase the hydraulicpermeability of the wall, leading to rapid, severe tissue swelling (Figure 11.9a).
c. F – Inflammation is characterized by vasodilatation, which raises capillary filtration pressure(Figure 11.7).Vasodilatation accounts for two of the classic signs of inflammation –heat and redness.
d. T – The venular gaps allow easy passage of the plasma proteins.The resulting fall in theosmotic reflection coefficient contributes to the rapid fluid filtration.
e. F – The hydraulic conductance of the venule wall increases sharply, due to the gapformation (Figure 11.9b, slope of line).This promotes rapid tissue swelling.
f. T – Histamine is released from mast cells and basophilic leukocytes in inflammatoryreactions, such as urticaria, anaphylaxis and asthma. It causes intercellular gap formation.
Circulation of fluid between plasma, interstitium and lymph Answers 73
11.17 a. T – Endothelium expresses receptor-operated and store-operated Ca2�-conductingchannels (Figure 9.2).These raise endothelial Ca2� concentration between four- andten-fold at the onset of acute inflammation (Figure 11.18). If the rise in Ca2� issuppressed, so is the hyperpermeability response.
b. F – The rise in Ca2�-calmodulin increases the activity of eNOS and hence the productionof NO, a pro-inflammatory agent in venules (Figure 11.19). Deletion of eNOS blocksthe inflammatory response.
c. F – Agents that raise intracellular cAMP, such as isoprenaline, reduce permeability. One of thedownstream effects of NO is to activate a phosphodiesterase that degrades cAMP(Figure 11.19).
d. T – Fragmentation of the peripheral ring of actin, to which the junctional proteins areanchored (Figure 9.3), coupled with phosphorylation of the junctional proteinsthemselves, loosens the intercellular junction (Figure 11.19).
e. T – Vascular endothelial growth factor causes a chronic increase in endothelial permeability.It is raised at many chronic inflammatory sites, including rheumatoid joints.
11.18 a. From the classic Starling principle, filtration rate Jv � K{[Pc � Pi] � σ[πp � πi]} �0.003{[25 � (�1)] � 0.96[25 � 6]} � 0.0233 ml min�1 per 100 g muscle.This highlightthe fact that capillary filtration is normally a very slow process.
b. Plasma was 55% of the blood volume (1 � 0.45 � 0.55).The plasma flow was therefore6 � 0.55 � 3.3 ml min�1 per 100 g.The filtration fraction is therefore 0.0233 ml filtratemin�1/3.3 ml plasma min�1, or 0.007. Fluid filtration is thus very slow relative to plasmaflow in continuous capillaries.
c. Lymph flow equals capillary filtration rate in the steady state, i.e. 0.0233 ml min�1 per 100 g.This is 2.33 ml min�1 for the whole leg (10 kg muscle). Lymph production is thus very low.
d. After the haemorrhage, the classic Starling principle predicts a net filtration force of[10 � (�1)] � 0.96[25 � 6] � �7.24 mmHg.The minus sign means that the net force isnow a force directed into the capillary lumen, i.e. an absorption force. Fluid will move fromthe interstitial compartment into the bloodstream.
e. The rate of fluid absorption predicted by the classic Starling principle is JV � K{[PC � Pi] �σ[πp � πi]} � 0.003{�7.24} � �0.022 ml min�1 per 100 g. For 10 kg muscle this is2.2 ml min�1.
f. Over 30 min, scaling up to a 70 kg body mass, the volume of fluid transferred from theinterstitial compartment to the plasma compartment would be 2.2 � 30 � 7 � 462 ml.This rough calculation ignores differences in K between tissues and the progressive changesin the extravascular forces; but it suffices to indicate a major internal transfusion ofinterstitial fluid, of �0.5 l, into the volume-depleted circulation.This improves the patient’schances of survival.
g. The haematocrit would have declined, due to haemodilution by the internally transfusedfluid.
74 Cardiovascular physiology Answers
T F12.1 Vascular myocytes
a. are spindle-shaped cells aligned longitudinally along the vessel axis. � �b. form homocellular gap junctions that provide electrical coupling. � �c. are striated due to the presence of myosin and actin. � �d. have actin filaments that are rooted in Z lines. � �e. store Ca2� in the sarcoplasmic reticulum. � �
12.2 Vascular contraction differs from cardiac contraction in thata. vascular contraction does not always depend on depolarization, unlike
cardiac contraction. � �b. vascular contraction requires myosin activation, as opposed to actin
filament activation in cardiac myocytes. � �c. vascular contraction can be maintained despite a fall in cytosolic free Ca2�. � �d. cardiac contraction lasts much longer than vascular myocyte contraction,
in general. � �e. sympathetic fibres can initiate vascular contraction, but not cardiac contraction. � �
For a change, here is a ‘choose the right phrase’ question.12.3 The ion channels of vascular myocytes
Vascular myocytes typically have a basal membrane potential of around ______.This isgenerated in part by an ______ current of ______ through the abundant ______. Otherchannels that can increase the membrane potential (hyperpolarize it) include ______, whichhelp prevent vasospasm, and ______, which contribute to vasodilatation in ischaemic tissue.When the sympathetic fibres to a resistance vessel are activated, a slow depolarization calleda slow ______ may arise due to the activation of two currents – an ______ current carriedby ______ composed of TRP proteins, and an outward movement of negative chargethrough ______. In resistance vessels, the slow depolarization activates the abundantlyexpressed ______.The latter may result in an ______ in some vessels.
Insert the right word or phrase from the list below.A word can be used more than once ornot at all.
CHAPTER 12
Vascular smooth muscle:excitation, contraction andrelaxation
�94 mV �80 mV �55 mV Ca2� ions
inward outward Na� ions K� ions
ATP-dependent K� channels inward rectifier K� channels calcium-dependent K� channels voltage-dependent Na� channels
receptor-operated cationchannels
calcium-activated chloridechannels
acetylcholine-activated K�
channelsvoltage-sensitive Ca2� channels
inhibitory junction potential excitatory junction potential repolarization action potential
12.4 Vascular smooth muscle agonists can raise the cytosolic free Ca2� througha. inositol trisphosphate (IP3) mediated release of an intracellular Ca2� store. � �b. action potentials mediated by sarcolemmal voltage-sensitive sodium channels. � �c. diacylglycerol (DAG)-mediated activation of receptor-operated cation channels. � �d. the activation of calmodulin. � �e. Beta2-adrenergic receptor stimulation. � �
12.5 Large artery contraction is mediated by different pathways to resistancevessel contraction, becausea. resistance vessels usually express very few voltage-sensitive Ca2� channels. � �b. resistance vessels commonly show depolarization-dependent contraction. � �c. large arteries often exhibit depolarization-independent contraction. � �d. sympathetic stimulation inhibits contraction in small arterial vessels. � �
12.6 Calcium sensitization in vascular myocytesa. is achieved by maintaining a high level of free Ca2� ions in the cytosol. � �b. often contributes to the maintenance of vascular tone over long periods. � �c. is mediated by the activation of myosin light chain phosphatase. � �d. is brought about by receptor-induced activation of rhoA kinase. � �
12.7 Regarding adrenoceptors on vascular myocytes,a. the α1-,α2-adrenoceptor blocker phentolamine reduces vascular tone. � �b. Alpha1-adrenoceptors bind adrenaline more avidly than noradrenaline. � �c. the activation of α1-adrenoceptors inhibits the phospholipase C pathway. � �d. Alpha2-adrenoceptors activate the cAMP pathway. � �e. Beta1-adrenoceptors are more common than β2 in most blood vessels. � �f. Beta2-adrenoceptors bind adrenaline more avidly than noradrenaline. � �
12.8 Action potentials in vasomotor sympathetic fibres can triggera. the release of vesicles containing noradrenaline and ATP from varicosities. � �b. fast excitatory junction potentials on vascular myocytes mediated byα1-adrenoceptors. � �
c. a slow depolarization of vascular myocytes mediated by α1-adrenoceptors. � �d. the hydrolysis of phosphoinositol bisphosphate (PIP2) in the myocyte
membrane. � �e. the activation of vascular L-type Ca2� channels and/or non-selective
cation channels. � �
12.9 Vascular myocyte relaxation can be brought about bya. adrenaline via an increase in intracellular cGMP. � �b. the dephosphorylation of myosin heads by myosin light chain phosphatase. � �c. a fall in the cytosolic free Ca2� concentration. � �d. reduced sympathetic fibre activity. � �e. vascular myocyte hyperpolarization. � �
12.10 Pharmacological agents that alter vascular tone includea. adrenaline, which causes vasoconstriction in many tissues. � �b. nitrodilators, such as glyceryl trinitrate, which raise intracellular cAMP. � �
76 Cardiovascular physiology Questions
T F
c. sildenafil (Viagra), which raises intracellular cGMP. � �d. losartan, which inhibits angiotensin II receptors to evoke vasodilatation. � �e. nifedipine, which stimulates the sarcolemmal Ca2� pumps. � �
Here is a short quantitative problem that should help clarify the role of chloride ions.12.11 Regarding the role of chloride-conducting channels in vascular smooth muscle (VSM),
the concentration of chloride ions in extracellular fluid (Clo) is 120 mM, while theintracellular concentration (Cli) is 50 mM – considerably higher than in centralneurons (7 mM).a. What is the equilibrium potential for chloride in VSM?b. What effect does sympathetic activity have on chloride channels in the VSM membrane?c. If the membrane potential of VSM is �60 mV, in which direction would the potential
change if the chloride conductance of the membrane were increased.c. If the membrane potential of a central neuron is �70 mV, in which direction would neuron
potential change if the chloride conductance of the membrane increased?
Vascular smooth muscle Questions 77
T F
Answers
12.1 a. F – Vascular myocytes are wrapped around the circumference of the vessel, so that theirtension can regulate the vessel diameter (Figures 1.8 and 10.7).
b. T – Homocellular gap junctions, formed of connexin, connect the cytoplasm one myocyteto the next (Figure 12.1). Heterocellular, myoendothelial gap junctions also link theinnermost myocytes electrically to endothelial cells (Figures 1.8 and 9.5).
c. F – The myosin and actin are not aligned in register across the cell (Figure 12.1), unlikeskeletal and cardiac muscle Figure 3.3). Consequently, vascular smooth muscle is notstriated.
d. F – Vascular myocyte actin filaments are rooted in non-aligned dark bodies composed of α-actinin, and in the dense bands of the sarcolemma (Figure 12.1).
e. T – The release of the sarcolemmal Ca2� store by IP3 is an important factor in vascularcontraction (Figure 12.2).
12.2 a. T – Depolarization-independent contraction is common in large arteries (Figure 12.3c).It is triggered by biochemical signals (Figure 12.4b).Any associated change inmembrane potential is secondary, and not the cause of contraction (Figure 12.5a).Action potentials are essential for cardiac contraction, and for contraction in someblood vessels (resistance vessels, portal vein) (Figures 12.3a and 12.4a).
b. T – A rise in vascular Ca2�–calmodulin complex activates myosin light chain kinase(MLCK). MLCK phosphorylates the myosin heads to initiate crossbridge formation(Figure 12.6). By contrast, cardiac contraction is brought about by Ca2� binding totroponin, which exposes binding sites on the actin filament (Figure 3.4).
c. T – Vascular agonists, e.g. noradrenaline, can maintain contractile tension during the tonic,sustained phase by increasing the sensitivity of the myocyte to Ca2� (Figure 12.7).This is achieved by inhibiting the ‘relaxing enzyme’, myosin light chain phosphatase(Figure 12.6); and also through caldesmon, a protein that regulates actin binding siteavailability.
d. F – A cardiac contraction lasts �300 ms.Vascular contraction can be sustained almostindefinitely.
e. T – Sympathetic activity is a major mediator of vascular myocyte contraction (Figures 12.5and 12.8).The pathways involved are shown in Figure 12.4. In the heart, sympatheticactivity does not initiate cardiac contraction, though it can modify contractile strength.
12.3 Vascular myocytes typically have a basal membrane potential of around �55mV.This isgenerated in part by an outward current of K� ions through the abundant inwardrectifier K� channels. Other channels that can increase the membrane potentialhyperpolarize it include calcium-dependent K� channels, which help preventvasospasm, and ATP-dependent K� channels, which contribute to vasodilatation inischaemic tissue.When the sympathetic fibres to a resistance vessel are activated, a slowdepolarization called a slow excitatory junction potential may arise due to the activationof two currents – an inward current carried by receptor-operated cation channelscomposed of TRP proteins, and an outward movement of negative charge throughcalcium-activated chloride channels. In resistance vessels, the slow depolarizationactivates the abundantly expressed voltage-sensitive Ca2� channels.The latter may resultin an action potential in some vessels.
78 Cardiovascular physiology Answers
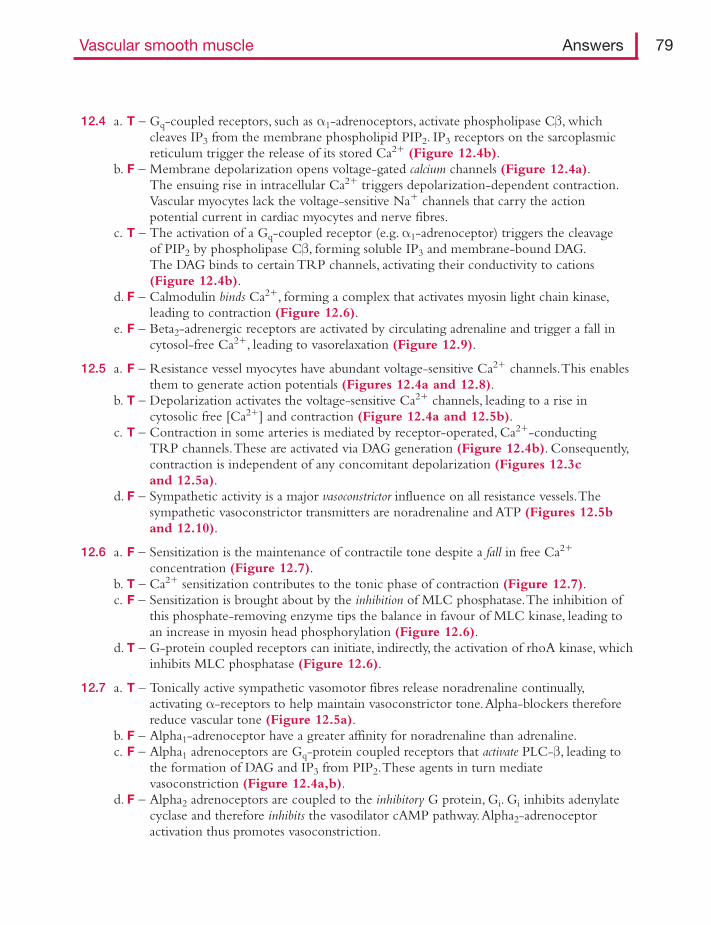
12.4 a. T – Gq-coupled receptors, such as α1-adrenoceptors, activate phospholipase Cβ, whichcleaves IP3 from the membrane phospholipid PIP2. IP3 receptors on the sarcoplasmicreticulum trigger the release of its stored Ca2� (Figure 12.4b).
b. F – Membrane depolarization opens voltage-gated calcium channels (Figure 12.4a).The ensuing rise in intracellular Ca2� triggers depolarization-dependent contraction.Vascular myocytes lack the voltage-sensitive Na� channels that carry the actionpotential current in cardiac myocytes and nerve fibres.
c. T – The activation of a Gq-coupled receptor (e.g.α1-adrenoceptor) triggers the cleavageof PIP2 by phospholipase Cβ, forming soluble IP3 and membrane-bound DAG.The DAG binds to certain TRP channels, activating their conductivity to cations(Figure 12.4b).
d. F – Calmodulin binds Ca2�, forming a complex that activates myosin light chain kinase,leading to contraction (Figure 12.6).
e. F – Beta2-adrenergic receptors are activated by circulating adrenaline and trigger a fall incytosol-free Ca2�, leading to vasorelaxation (Figure 12.9).
12.5 a. F – Resistance vessel myocytes have abundant voltage-sensitive Ca2� channels.This enablesthem to generate action potentials (Figures 12.4a and 12.8).
b. T – Depolarization activates the voltage-sensitive Ca2� channels, leading to a rise incytosolic free [Ca2�] and contraction (Figure 12.4a and 12.5b).
c. T – Contraction in some arteries is mediated by receptor-operated, Ca2�-conductingTRP channels.These are activated via DAG generation (Figure 12.4b). Consequently,contraction is independent of any concomitant depolarization (Figures 12.3cand 12.5a).
d. F – Sympathetic activity is a major vasoconstrictor influence on all resistance vessels.Thesympathetic vasoconstrictor transmitters are noradrenaline and ATP (Figures 12.5band 12.10).
12.6 a. F – Sensitization is the maintenance of contractile tone despite a fall in free Ca2�
concentration (Figure 12.7).b. T – Ca2� sensitization contributes to the tonic phase of contraction (Figure 12.7).c. F – Sensitization is brought about by the inhibition of MLC phosphatase.The inhibition of
this phosphate-removing enzyme tips the balance in favour of MLC kinase, leading toan increase in myosin head phosphorylation (Figure 12.6).
d. T – G-protein coupled receptors can initiate, indirectly, the activation of rhoA kinase, whichinhibits MLC phosphatase (Figure 12.6).
12.7 a. T – Tonically active sympathetic vasomotor fibres release noradrenaline continually,activating α-receptors to help maintain vasoconstrictor tone.Alpha-blockers thereforereduce vascular tone (Figure 12.5a).
b. F – Alpha1-adrenoceptor have a greater affinity for noradrenaline than adrenaline.c. F – Alpha1 adrenoceptors are Gq-protein coupled receptors that activate PLC-β, leading to
the formation of DAG and IP3 from PIP2.These agents in turn mediatevasoconstriction (Figure 12.4a,b).
d. F – Alpha2 adrenoceptors are coupled to the inhibitory G protein, Gi. Gi inhibits adenylatecyclase and therefore inhibits the vasodilator cAMP pathway.Alpha2-adrenoceptoractivation thus promotes vasoconstriction.
Vascular smooth muscle Answers 79
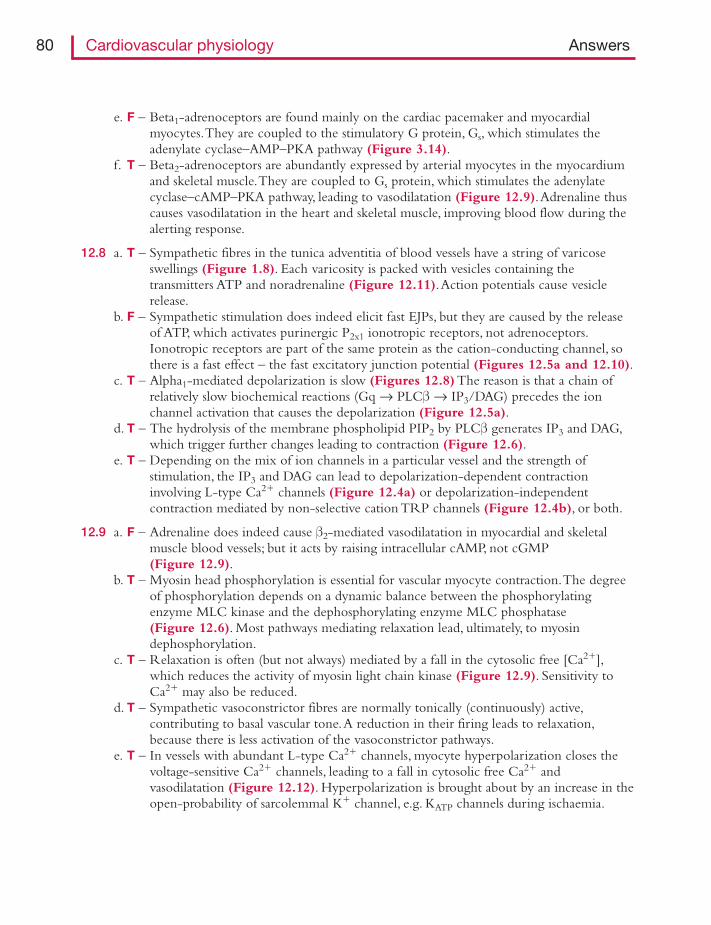
e. F – Beta1-adrenoceptors are found mainly on the cardiac pacemaker and myocardialmyocytes.They are coupled to the stimulatory G protein, Gs, which stimulates theadenylate cyclase–AMP–PKA pathway (Figure 3.14).
f. T – Beta2-adrenoceptors are abundantly expressed by arterial myocytes in the myocardiumand skeletal muscle.They are coupled to Gs protein, which stimulates the adenylatecyclase–cAMP–PKA pathway, leading to vasodilatation (Figure 12.9).Adrenaline thuscauses vasodilatation in the heart and skeletal muscle, improving blood flow during thealerting response.
12.8 a. T – Sympathetic fibres in the tunica adventitia of blood vessels have a string of varicoseswellings (Figure 1.8). Each varicosity is packed with vesicles containing thetransmitters ATP and noradrenaline (Figure 12.11).Action potentials cause vesiclerelease.
b. F – Sympathetic stimulation does indeed elicit fast EJPs, but they are caused by the releaseof ATP, which activates purinergic P2x1 ionotropic receptors, not adrenoceptors.Ionotropic receptors are part of the same protein as the cation-conducting channel, sothere is a fast effect – the fast excitatory junction potential (Figures 12.5a and 12.10).
c. T – Alpha1-mediated depolarization is slow (Figures 12.8)The reason is that a chain ofrelatively slow biochemical reactions (Gq Æ PLCβÆ IP3/DAG) precedes the ionchannel activation that causes the depolarization (Figure 12.5a).
d. T – The hydrolysis of the membrane phospholipid PIP2 by PLCβ generates IP3 and DAG,which trigger further changes leading to contraction (Figure 12.6).
e. T – Depending on the mix of ion channels in a particular vessel and the strength ofstimulation, the IP3 and DAG can lead to depolarization-dependent contractioninvolving L-type Ca2� channels (Figure 12.4a) or depolarization-independentcontraction mediated by non-selective cation TRP channels (Figure 12.4b), or both.
12.9 a. F – Adrenaline does indeed cause β2-mediated vasodilatation in myocardial and skeletalmuscle blood vessels; but it acts by raising intracellular cAMP, not cGMP(Figure 12.9).
b. T – Myosin head phosphorylation is essential for vascular myocyte contraction.The degreeof phosphorylation depends on a dynamic balance between the phosphorylatingenzyme MLC kinase and the dephosphorylating enzyme MLC phosphatase(Figure 12.6). Most pathways mediating relaxation lead, ultimately, to myosindephosphorylation.
c. T – Relaxation is often (but not always) mediated by a fall in the cytosolic free [Ca2�],which reduces the activity of myosin light chain kinase (Figure 12.9). Sensitivity toCa2� may also be reduced.
d. T – Sympathetic vasoconstrictor fibres are normally tonically (continuously) active,contributing to basal vascular tone.A reduction in their firing leads to relaxation,because there is less activation of the vasoconstrictor pathways.
e. T – In vessels with abundant L-type Ca2� channels, myocyte hyperpolarization closes thevoltage-sensitive Ca2� channels, leading to a fall in cytosolic free Ca2� andvasodilatation (Figure 12.12). Hyperpolarization is brought about by an increase in theopen-probability of sarcolemmal K� channel, e.g. KATP channels during ischaemia.
80 Cardiovascular physiology Answers
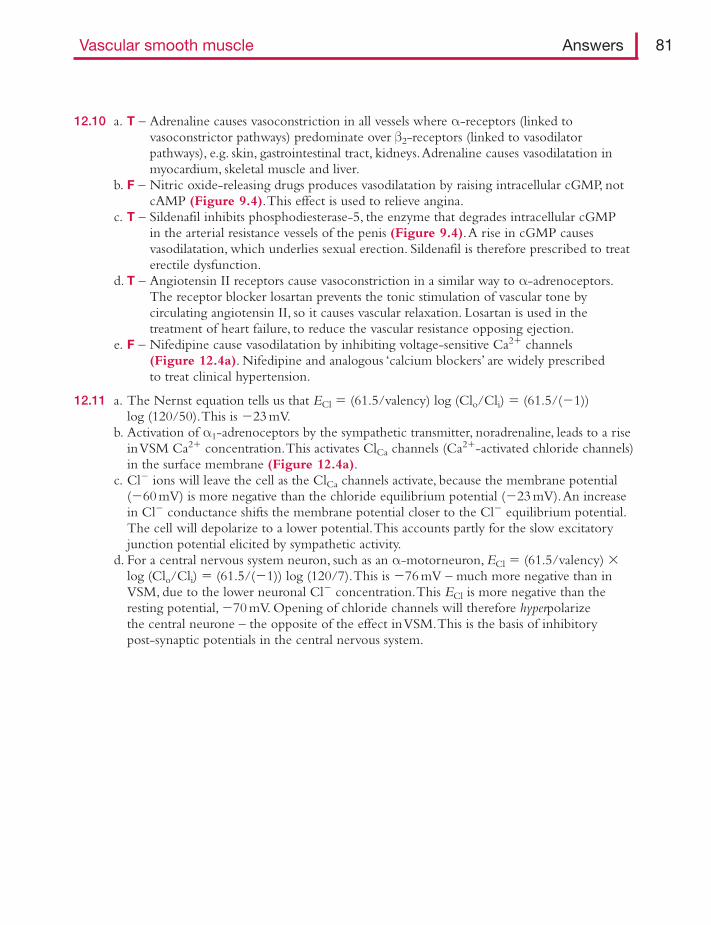
12.10 a. T – Adrenaline causes vasoconstriction in all vessels where α-receptors (linked tovasoconstrictor pathways) predominate over β2-receptors (linked to vasodilatorpathways), e.g. skin, gastrointestinal tract, kidneys.Adrenaline causes vasodilatation inmyocardium, skeletal muscle and liver.
b. F – Nitric oxide-releasing drugs produces vasodilatation by raising intracellular cGMP, notcAMP (Figure 9.4).This effect is used to relieve angina.
c. T – Sildenafil inhibits phosphodiesterase-5, the enzyme that degrades intracellular cGMPin the arterial resistance vessels of the penis (Figure 9.4).A rise in cGMP causesvasodilatation, which underlies sexual erection. Sildenafil is therefore prescribed to treaterectile dysfunction.
d. T – Angiotensin II receptors cause vasoconstriction in a similar way to α-adrenoceptors.The receptor blocker losartan prevents the tonic stimulation of vascular tone bycirculating angiotensin II, so it causes vascular relaxation. Losartan is used in thetreatment of heart failure, to reduce the vascular resistance opposing ejection.
e. F – Nifedipine cause vasodilatation by inhibiting voltage-sensitive Ca2� channels(Figure 12.4a). Nifedipine and analogous ‘calcium blockers’ are widely prescribedto treat clinical hypertension.
12.11 a. The Nernst equation tells us that ECl � (61.5/valency) log (Clo/Cli) � (61.5/(�1))log (120/50).This is �23 mV.
b. Activation of α1-adrenoceptors by the sympathetic transmitter, noradrenaline, leads to a riseinVSM Ca2� concentration.This activates ClCa channels (Ca2�-activated chloride channels)in the surface membrane (Figure 12.4a).
c. Cl� ions will leave the cell as the ClCa channels activate, because the membrane potential(�60 mV) is more negative than the chloride equilibrium potential (�23 mV).An increasein Cl� conductance shifts the membrane potential closer to the Cl� equilibrium potential.The cell will depolarize to a lower potential.This accounts partly for the slow excitatoryjunction potential elicited by sympathetic activity.
d. For a central nervous system neuron, such as an α-motorneuron, ECl � (61.5/valency) �log (Clo/Cli) � (61.5/(�1)) log (120/7).This is �76 mV – much more negative than inVSM, due to the lower neuronal Cl� concentration.This ECl is more negative than theresting potential, �70 mV. Opening of chloride channels will therefore hyperpolarizethe central neurone – the opposite of the effect in VSM.This is the basis of inhibitorypost-synaptic potentials in the central nervous system.
Vascular smooth muscle Answers 81
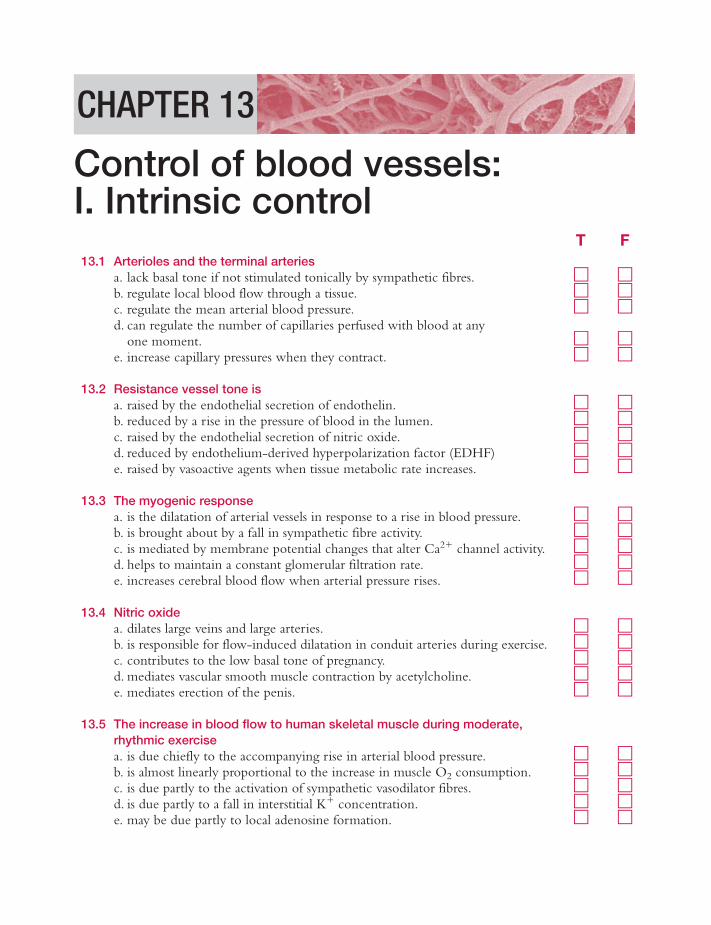
T F13.1 Arterioles and the terminal arteries
a. lack basal tone if not stimulated tonically by sympathetic fibres. � �b. regulate local blood flow through a tissue. � �c. regulate the mean arterial blood pressure. � �d. can regulate the number of capillaries perfused with blood at any
one moment. � �e. increase capillary pressures when they contract. � �
13.2 Resistance vessel tone isa. raised by the endothelial secretion of endothelin. � �b. reduced by a rise in the pressure of blood in the lumen. � �c. raised by the endothelial secretion of nitric oxide. � �d. reduced by endothelium-derived hyperpolarization factor (EDHF) � �e. raised by vasoactive agents when tissue metabolic rate increases. � �
13.3 The myogenic responsea. is the dilatation of arterial vessels in response to a rise in blood pressure. � �b. is brought about by a fall in sympathetic fibre activity. � �c. is mediated by membrane potential changes that alter Ca2� channel activity. � �d. helps to maintain a constant glomerular filtration rate. � �e. increases cerebral blood flow when arterial pressure rises. � �
13.4 Nitric oxidea. dilates large veins and large arteries. � �b. is responsible for flow-induced dilatation in conduit arteries during exercise. � �c. contributes to the low basal tone of pregnancy. � �d. mediates vascular smooth muscle contraction by acetylcholine. � �e. mediates erection of the penis. � �
13.5 The increase in blood flow to human skeletal muscle during moderate, rhythmic exercisea. is due chiefly to the accompanying rise in arterial blood pressure. � �b. is almost linearly proportional to the increase in muscle O2 consumption. � �c. is due partly to the activation of sympathetic vasodilator fibres. � �d. is due partly to a fall in interstitial K� concentration. � �e. may be due partly to local adenosine formation. � �
CHAPTER 13
Control of blood vessels: I. Intrinsic control
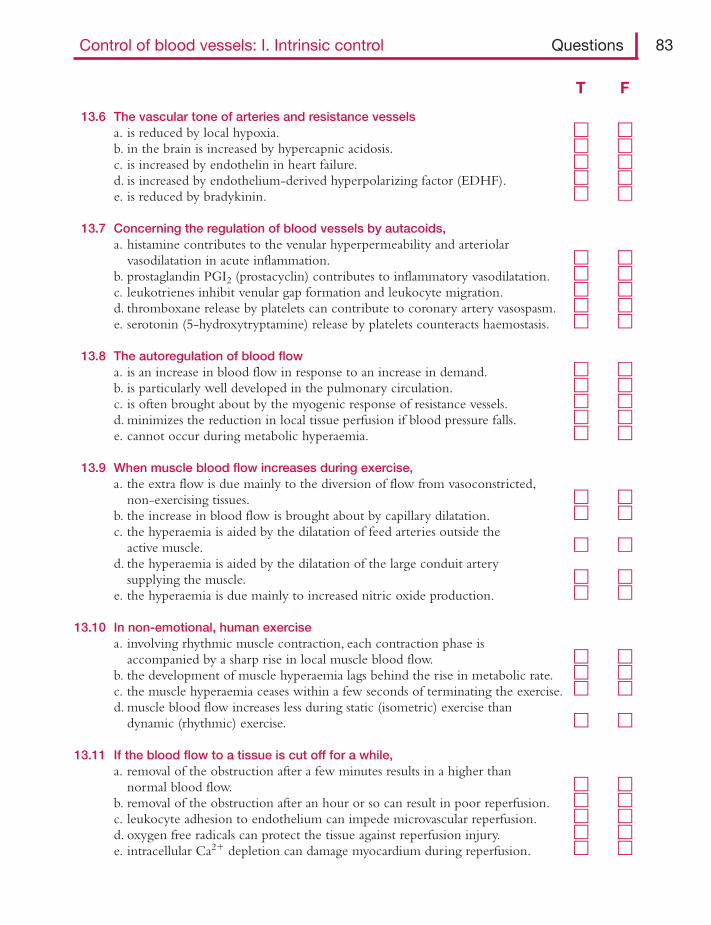
13.6 The vascular tone of arteries and resistance vesselsa. is reduced by local hypoxia. � �b. in the brain is increased by hypercapnic acidosis. � �c. is increased by endothelin in heart failure. � �d. is increased by endothelium-derived hyperpolarizing factor (EDHF). � �e. is reduced by bradykinin. � �
13.7 Concerning the regulation of blood vessels by autacoids,a. histamine contributes to the venular hyperpermeability and arteriolar
vasodilatation in acute inflammation. � �b. prostaglandin PGI2 (prostacyclin) contributes to inflammatory vasodilatation. � �c. leukotrienes inhibit venular gap formation and leukocyte migration. � �d. thromboxane release by platelets can contribute to coronary artery vasospasm. � �e. serotonin (5-hydroxytryptamine) release by platelets counteracts haemostasis. � �
13.8 The autoregulation of blood flowa. is an increase in blood flow in response to an increase in demand. � �b. is particularly well developed in the pulmonary circulation. � �c. is often brought about by the myogenic response of resistance vessels. � �d. minimizes the reduction in local tissue perfusion if blood pressure falls. � �e. cannot occur during metabolic hyperaemia. � �
13.9 When muscle blood flow increases during exercise,a. the extra flow is due mainly to the diversion of flow from vasoconstricted,
non-exercising tissues. � �b. the increase in blood flow is brought about by capillary dilatation. � �c. the hyperaemia is aided by the dilatation of feed arteries outside the
active muscle. � �d. the hyperaemia is aided by the dilatation of the large conduit artery
supplying the muscle. � �e. the hyperaemia is due mainly to increased nitric oxide production. � �
13.10 In non-emotional, human exercisea. involving rhythmic muscle contraction, each contraction phase is
accompanied by a sharp rise in local muscle blood flow. � �b. the development of muscle hyperaemia lags behind the rise in metabolic rate. � �c. the muscle hyperaemia ceases within a few seconds of terminating the exercise. � �d. muscle blood flow increases less during static (isometric) exercise than
dynamic (rhythmic) exercise. � �
13.11 If the blood flow to a tissue is cut off for a while,a. removal of the obstruction after a few minutes results in a higher than
normal blood flow. � �b. removal of the obstruction after an hour or so can result in poor reperfusion. � �c. leukocyte adhesion to endothelium can impede microvascular reperfusion. � �d. oxygen free radicals can protect the tissue against reperfusion injury. � �e. intracellular Ca2� depletion can damage myocardium during reperfusion. � �
Control of blood vessels: I. Intrinsic control Questions 83
T F
Finally, a quantitative problem relating to the intrinsic control of muscle blood flow:13.12 Regarding the perfusion of a skeletal muscle, the resting muscle had a blood flow of
9 ml min�1 at a mean arterial blood pressure (ABP) of 95 mmHg. When ABP was raisedto 140 mmHg, the non-exercised muscle blood flow increased to 10 ml min�1. When themuscle was exercised at the same raised ABP (140 mmHg), the blood flow increased to135 ml min�1. Venous pressure was 5 mmHg throughout.a. What was the conductance of the circulation in the resting muscle at ABP 95 mmHg?b. If the circulation were simply a set of non-expandable plastic tubes, what would the blood
flow be at 140 mmHg ABP.c. What was the conductance of the muscle circulation at 140 mmHg ABP? What caused the
change in conductance?d. What was the conductance of the exercising muscle? What is this phenomenon called?
84 Cardiovascular physiology Questions
Answers
13.1 a. F – Arterial vessels have basal tone, due to the Bayliss myogenic response and tonicendothelin secretion.
b. T – Arterioles and terminal arteries are the main site of vascular resistance (Figure 1.6).Changes in their radius adjust local blood flow over a very wide range (Figure 13.1).
c. T – Mean blood pressure � cardiac output � total peripheral resistance (TPR).TPR isdetermined chiefly by the tone of the resistance vessels.
d. T – When resistance vessel tone is high, flow through a fraction of the capillaries isvery slow or zero at any one moment. Dilatation of the resistance vessels ‘recruits’these capillaries, increasing the transfer capacity of the microcirculation(Figure 10.7).
e. F – Contraction of resistance vessel lowers capillary pressure (Figures 8.21 and 11.7).This can tip the balance of Starling forces in favour of interstitial fluid absorption(Figure 11.4, panel b).
13.2 a. T – Endothelin has a prolonged vasoconstrictor action.b. F – A rise in transmural pressure elicits contraction.This is the Bayliss myogenic response
(Figure 13.2).c. F – Nitric oxide causes vasodilatation (Figure 13.3a).d. T – EDHF cause vascular myocyte hyperpolarization and hence vasodilatation
(Figure 13.3b).e. F – Increased metabolic activity generates vasodilator agents.This causes metabolic
hyperaemia in skeletal muscle (Figure 13.4), myocardium (Figure 6.20) and brain(Figures 15.1 and 15.11).
13.3 a. F – A rise in transmural pressure causes a transient passive dilatation followed at once by asustained contraction.The latter is the Bayliss myogenic response (Figure 13.2).
b. F – The myogenic response is an intrinsic property of arterial smooth muscle, present inisolated, denervated vessels (Figure 13.2).
c. T – Stress-activated channels are thought to induce myocyte depolarization.This activatesvoltage-sensitive Ca2� channels, leading to myocyte contraction. Ca2� channelinhibitors block the myogenic response (Figure 13.2).
d. T – The myogenic response results in the autoregulation of capillary pressure when arterialblood pressure changes (Figure 13.5b).This is particularly important in stabilizingglomerular filtration pressure in the kidneys.
e. F – The myogenic stabilizes cerebral flow (prevents it from changing significantly) whenarterial flow changes.This is called flow autoregulation (Figure 13.6).Autoregulationhelps preserve cerebral blood flow during hypotension, e.g. spinal anaesthesia, moderatehaemorrhage.
13.4 a. T – Much of the angina-relieving effect of NO donors (e.g. nitroglycerine) is due tovenodilatation, which reduce cardiac preload, and large-artery relaxation, which reduceswave reflection and hence afterload.
b. T – The shear stress exerted by flow activates the PI3 kinase – eNOS pathway(Figure 9.4).Without the resulting conduit artery dilatation, large-vessel resistancewould limit the high blood flow to exercising muscle.
Control of blood vessels: I. Intrinsic control Answers 85
c. T – NO counteracts the tone generated by the myogenic response, endothelin andsympathetic nerves. In pregnancy, NO production is raised by high oestrogen levels.Consequently, blood pressure tends to fall during mid-term.
d. F – NO mediates the vasodilator effect of acetylcholine (Figure 13.3a).e. T – Dilatation by nitridergic parasympathetic nerves innervating the penis and clitoris
produces erection.
13.5 a. F – Darcy’s law of flow tells us that blood flow � pressure drop/resistance.There is arelatively small increase in blood pressure during dynamic exercise (�1.1–1.2-fold), buta 20-fold or more increase in muscle blood flow (Figure 13.1).The vast majority ofthe increase, therefore, is due to a fall in muscle vascular resistance (metabolicvasodilatation), not the minor rise in blood pressure.
b. T – The major role of metabolic hyperaemia is to ensure that O2 delivery matches demandas the metabolic rate increases (Figure 6.20).
c. F – Metabolic vasodilatation is purely intrinsic in nature, not neural. Moreover, primates(unlike lower species) have no sympathetic cholinergic dilator innervation to muscleblood vessels.
d. F – Increased muscle or brain activity raises interstitial K�.This causes hyperpolarization-mediated vasodilatation.The raised K� stimulates the electrogenic 3Na�–2K� pumpand increases Kir channel activation, shifting the vascular myocyte potential(basal �55 mV) closer to the Nernst equilibrium potential (�94 mV).
e. T – Adenosine is a vasodilator agent formed in the interstitial compartment from adenosinemonophosphate released by exercising muscle. It is particularly implicated in myocardialvasodilatation.
13.6 a. T – Local hypoxia dilates resistance vessels (Figure 13.7).b. F – Acidosis causes vasodilatation.The brain is especially sensitive to CO2 (Figure 13.6).
This helps to maintain cerebral O2 delivery during partial asphyxia.c. T – Increased levels of this vasoconstrictor peptide contribute to the peripheral
vasoconstriction that characterizes patients in heart failure.d. F – Hyperpolarization causes vasodilatation, by reducing the open state probability of
depolarization-gated Ca2� channels. EDHF accounts in part for the vasodilatationof small resistance vessels to acetylcholine and bradykinin (Figure 13.3b).
e. T – Bradykinin is a nonapeptide that mediates inflammatory vasodilatation. It activatesendothelial receptors, which stimulate the endothelium to produce vasodilators(NO, EDHF, prostanoids).
13.7 a. T – Histamine is released from mast cells and basophilic leukocytes in allergic reactions(urticaria, anaphylaxis, asthma) and trauma. H1 receptors on venules are coupled to theGq–PLC pathway to evoke intercellular gap formation (Figure 11.19). H2 receptors onarterioles are coupled to the Gs-adenylyl cyclase–cAMP pathway to evokevasodilatation (Figure 12.9).
b. T – Prostacyclin is a vasodilator eicosanoid (arachidonic acid-derived agent) (Figure 13.8,lower panels). It contributes to inflammatory vasodilatation and reactive hyperaemia.
c. F – Leukotrienes are ecosanoids produced by leukocytes.They powerfully stimulate gapformation and leukocyte migration during inflammation.
d. T – Thromboxane is a powerful eicosanoid vasoconstrictor stored in platelets. If plateletsbecome activated by an atheromatous plaque in a coronary artery, downstreamvasospasm may ensue, causing angina at rest (variant angina).
86 Cardiovascular physiology Answers
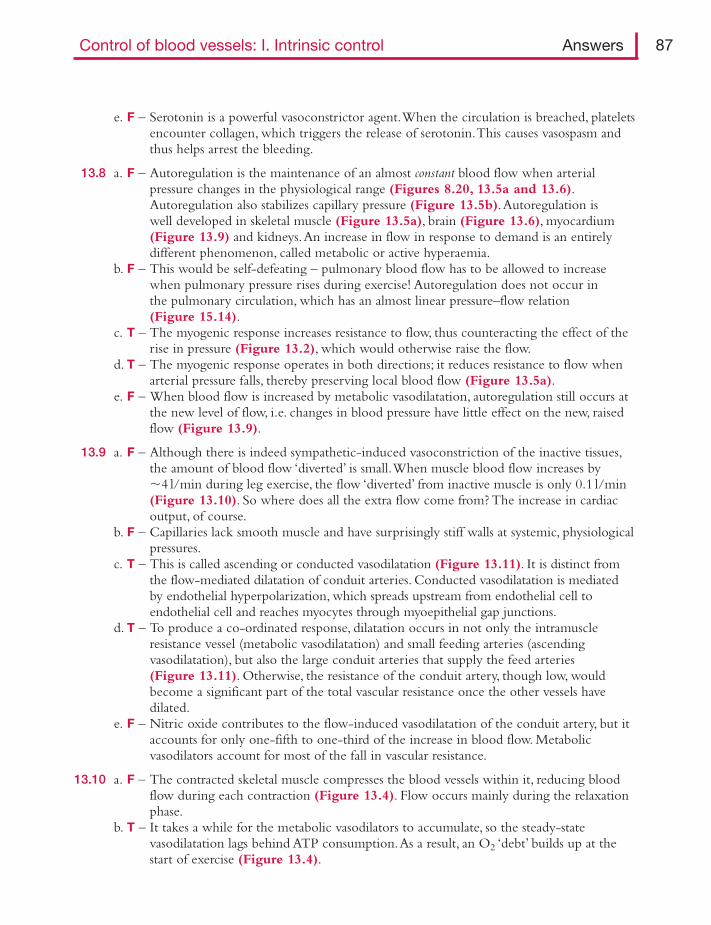
e. F – Serotonin is a powerful vasoconstrictor agent.When the circulation is breached, plateletsencounter collagen, which triggers the release of serotonin.This causes vasospasm andthus helps arrest the bleeding.
13.8 a. F – Autoregulation is the maintenance of an almost constant blood flow when arterialpressure changes in the physiological range (Figures 8.20, 13.5a and 13.6).Autoregulation also stabilizes capillary pressure (Figure 13.5b).Autoregulation iswell developed in skeletal muscle (Figure 13.5a), brain (Figure 13.6), myocardium(Figure 13.9) and kidneys.An increase in flow in response to demand is an entirelydifferent phenomenon, called metabolic or active hyperaemia.
b. F – This would be self-defeating – pulmonary blood flow has to be allowed to increasewhen pulmonary pressure rises during exercise! Autoregulation does not occur inthe pulmonary circulation, which has an almost linear pressure–flow relation(Figure 15.14).
c. T – The myogenic response increases resistance to flow, thus counteracting the effect of therise in pressure (Figure 13.2), which would otherwise raise the flow.
d. T – The myogenic response operates in both directions; it reduces resistance to flow whenarterial pressure falls, thereby preserving local blood flow (Figure 13.5a).
e. F – When blood flow is increased by metabolic vasodilatation, autoregulation still occurs atthe new level of flow, i.e. changes in blood pressure have little effect on the new, raisedflow (Figure 13.9).
13.9 a. F – Although there is indeed sympathetic-induced vasoconstriction of the inactive tissues,the amount of blood flow ‘diverted’ is small.When muscle blood flow increases by�4 l/min during leg exercise, the flow ‘diverted’ from inactive muscle is only 0.1 l/min(Figure 13.10). So where does all the extra flow come from? The increase in cardiacoutput, of course.
b. F – Capillaries lack smooth muscle and have surprisingly stiff walls at systemic, physiologicalpressures.
c. T – This is called ascending or conducted vasodilatation (Figure 13.11). It is distinct fromthe flow-mediated dilatation of conduit arteries. Conducted vasodilatation is mediatedby endothelial hyperpolarization, which spreads upstream from endothelial cell toendothelial cell and reaches myocytes through myoepithelial gap junctions.
d. T – To produce a co-ordinated response, dilatation occurs in not only the intramuscleresistance vessel (metabolic vasodilatation) and small feeding arteries (ascendingvasodilatation), but also the large conduit arteries that supply the feed arteries(Figure 13.11). Otherwise, the resistance of the conduit artery, though low, wouldbecome a significant part of the total vascular resistance once the other vessels havedilated.
e. F – Nitric oxide contributes to the flow-induced vasodilatation of the conduit artery, but itaccounts for only one-fifth to one-third of the increase in blood flow. Metabolicvasodilators account for most of the fall in vascular resistance.
13.10 a. F – The contracted skeletal muscle compresses the blood vessels within it, reducing bloodflow during each contraction (Figure 13.4). Flow occurs mainly during the relaxationphase.
b. T – It takes a while for the metabolic vasodilators to accumulate, so the steady-statevasodilatation lags behind ATP consumption.As a result, an O2 ‘debt’ builds up at thestart of exercise (Figure 13.4).
Control of blood vessels: I. Intrinsic control Answers 87
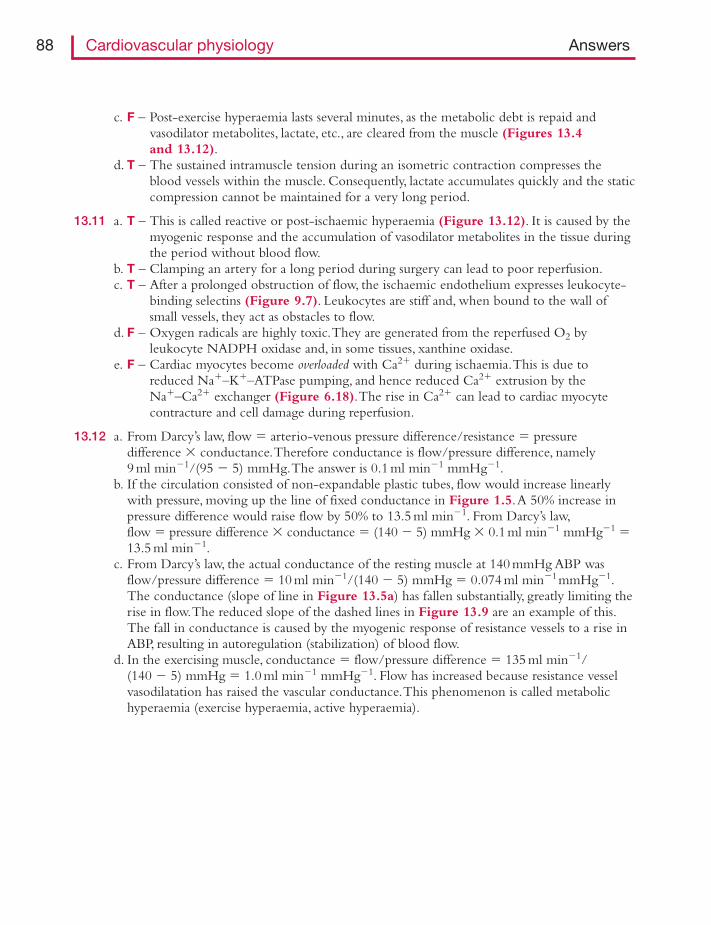
c. F – Post-exercise hyperaemia lasts several minutes, as the metabolic debt is repaid andvasodilator metabolites, lactate, etc., are cleared from the muscle (Figures 13.4and 13.12).
d. T – The sustained intramuscle tension during an isometric contraction compresses theblood vessels within the muscle. Consequently, lactate accumulates quickly and the staticcompression cannot be maintained for a very long period.
13.11 a. T – This is called reactive or post-ischaemic hyperaemia (Figure 13.12). It is caused by themyogenic response and the accumulation of vasodilator metabolites in the tissue duringthe period without blood flow.
b. T – Clamping an artery for a long period during surgery can lead to poor reperfusion.c. T – After a prolonged obstruction of flow, the ischaemic endothelium expresses leukocyte-
binding selectins (Figure 9.7). Leukocytes are stiff and, when bound to the wall ofsmall vessels, they act as obstacles to flow.
d. F – Oxygen radicals are highly toxic.They are generated from the reperfused O2 byleukocyte NADPH oxidase and, in some tissues, xanthine oxidase.
e. F – Cardiac myocytes become overloaded with Ca2� during ischaemia.This is due toreduced Na�–K�–ATPase pumping, and hence reduced Ca2� extrusion by theNa�–Ca2� exchanger (Figure 6.18).The rise in Ca2� can lead to cardiac myocytecontracture and cell damage during reperfusion.
13.12 a. From Darcy’s law, flow � arterio-venous pressure difference/resistance � pressuredifference � conductance.Therefore conductance is flow/pressure difference, namely9 ml min�1/(95 � 5) mmHg.The answer is 0.1 ml min�1 mmHg�1.
b. If the circulation consisted of non-expandable plastic tubes, flow would increase linearlywith pressure, moving up the line of fixed conductance in Figure 1.5.A 50% increase inpressure difference would raise flow by 50% to 13.5 ml min�1. From Darcy’s law,flow � pressure difference � conductance � (140 � 5) mmHg � 0.1ml min�1 mmHg�1 �13.5 ml min�1.
c. From Darcy’s law, the actual conductance of the resting muscle at 140 mmHg ABP wasflow/pressure difference � 10 ml min�1/(140 � 5) mmHg � 0.074 ml min�1mmHg�1.The conductance (slope of line in Figure 13.5a) has fallen substantially, greatly limiting therise in flow.The reduced slope of the dashed lines in Figure 13.9 are an example of this.The fall in conductance is caused by the myogenic response of resistance vessels to a rise inABP, resulting in autoregulation (stabilization) of blood flow.
d. In the exercising muscle, conductance � flow/pressure difference � 135 ml min�1/(140 � 5) mmHg � 1.0 ml min�1 mmHg�1. Flow has increased because resistance vesselvasodilatation has raised the vascular conductance.This phenomenon is called metabolichyperaemia (exercise hyperaemia, active hyperaemia).
88 Cardiovascular physiology Answers
T F14.1 The sympathetic vasoconstrictor system
a. has short preganglionic fibres that release acetylcholine. � �b. has long postganglionic fibres that release adrenaline. � �c. has preganglionic neurons located chiefly in the cervical spinal cord. � �d. is tonically excited by bulbospinal fibres originating in the ventrolateral medulla. � �e. innervates the inner tunica media of arterial blood vessels. � �
14.2 Sympathetic postganglionic vasomotor fibresa. terminate in motor-end plates, similar to those in skeletal muscle. � �b. are normally quiescent in a resting subject. � �c. activate α-adrenoceptors on blood vessels. � �d. activate P2x purinergic receptors on some blood vessels. � �e. ‘spill’ some noradrenaline into the circulation. � �
14.3 A rise in human sympathetic vasomotor fibre activitya. can raise arterial blood pressure. � �b. enhances local blood flow through a tissue. � �c. increases the capillary filtration rate. � �d. reduces the splanchnic venous blood volume. � �e. in skin can occur at the same time as sympathetic activity falls in skeletal muscle. � �
14.4 Neurally mediated vasodilatationa. can be achieved by reducing sympathetic vasomotor activity. � �b. in skin may be brought about by increased sympathetic cholinergic activity. � �c. in skin may be brought about by a C-fibre axon reflex. � �d. in salivary glands is associated with parasympathetic activity and secretion. � �e. by parasympathetic fibres contributes to vasodilatation in exercising muscle. � �f. by parasympathetic fibres can cause penile erection. � �
14.5 An intravenous infusion of adrenalinea. causes active constriction of resistance vessels in skeletal muscle. � �b. causes active constriction of resistance vessels in the skin. � �c. raises total peripheral resistance. � �d. raises systolic blood pressure more than diastolic pressure. � �e. elicits tachycardia, whereas intravenous noradrenaline causes bradycardia. � �f. reduces plasma glucose concentration. � �
CHAPTER 14
Control of blood vessels: II. Extrinsic control by nervesand hormones
14.6 Noradrenalinea. is stored in the vesicles of sympathetic varicosities. � �b. is formed from adrenaline by methyltransferase. � �c. raises mean blood pressure. � �d. increases cutaneous blood flow. � �e. has a greater affinity for α- than β-adrenoceptors. � �
14.7 Vasopressina. is a peptide synthesized by the posterior pituitary gland. � �b. is mainly a stimulus for water excretion. � �c. release is triggered by a rise in plasma osmolarity. � �d. release is reduced following a haemorrhage. � �e. secretion during nausea contributes to the grey pallor of skin. � �
14.8 The renin–angiotensin systema. is activated by angiotensinogen secreted by juxtaglomerular cells. � �b. is stimulated following a loss of blood. � �c. depends on endothelium to generate angiotensin II. � �d. can induce vasoconstriction. � �e. generally shows reduced activity in patients with hypertension. � �
14.9 Aldosterone secretiona. promotes NaCl reabsorption in the distal renal tubule. � �b. is stimulated by a fall in plasma angiotensin II concentration. � �c. is increased following a major haemorrhage. � �d. falls in response to a low salt diet. � �e. rises during pregnancy. � �
14.10 The natriuretic peptidea. ANP (atrial natriuretic peptide) is secreted by atrial myocytes when cardiac
filling pressure falls. � �b. ANP lowers blood pressure by both natriuresis and resistance vessel
dilatation. � �c. ANP increases plasma volume by reducing capillary and venular
filtration rates. � �d. BNP (brain natriuretic peptide) is produced in the brain, but not the heart. � �e. BNP can increase 200-fold in the circulation during heart failure. � �
14.11 Regarding the control of veins,a. peripheral venoconstriction can enhance cardiac filling pressure. � �b. splanchnic veins are poorly innerved by sympathetic vasoconstrictor fibres. � �c. skeletal muscle veins are well innervated by sympathetic vasoconstrictor
fibres. � �d. cutaneous veins are reflexly constricted during moderate exercise. � �e. veins dilate markedly in response to glyceryl trinitrate. � �
90 Cardiovascular physiology Questions
T F
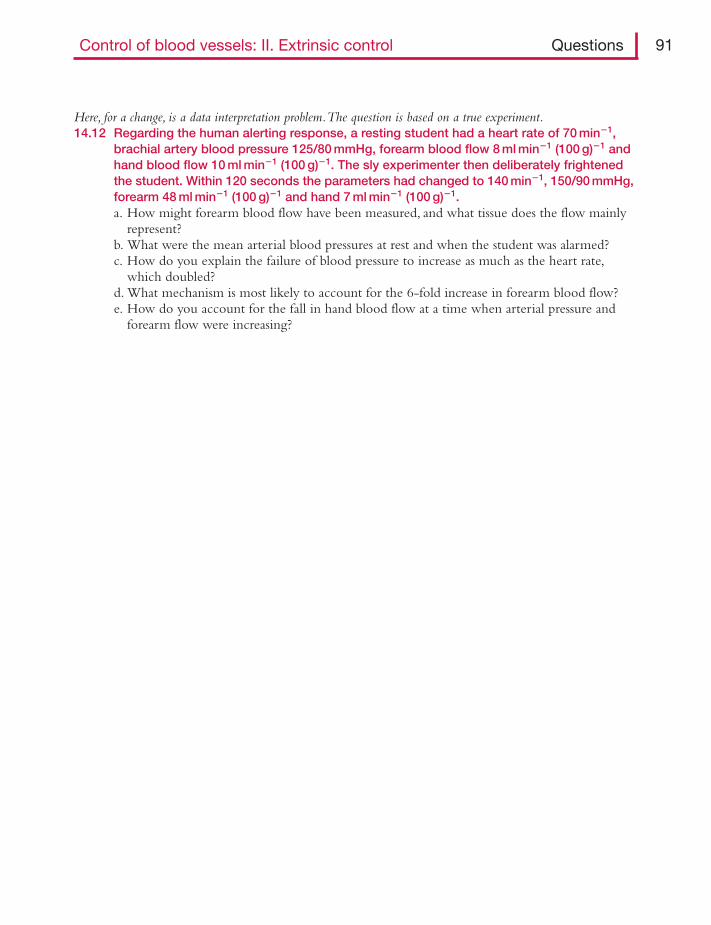
Here, for a change, is a data interpretation problem.The question is based on a true experiment.14.12 Regarding the human alerting response, a resting student had a heart rate of 70 min�1,
brachial artery blood pressure 125/80 mmHg, forearm blood flow 8 ml min�1 (100 g)�1 andhand blood flow 10 ml min�1 (100 g)�1. The sly experimenter then deliberately frightenedthe student. Within 120 seconds the parameters had changed to 140 min�1, 150/90 mmHg,forearm 48 ml min�1 (100 g)�1 and hand 7 ml min�1 (100 g)�1.a. How might forearm blood flow have been measured, and what tissue does the flow mainly
represent?b. What were the mean arterial blood pressures at rest and when the student was alarmed?c. How do you explain the failure of blood pressure to increase as much as the heart rate,
which doubled?d. What mechanism is most likely to account for the 6-fold increase in forearm blood flow?e. How do you account for the fall in hand blood flow at a time when arterial pressure and
forearm flow were increasing?
Control of blood vessels: II. Extrinsic control Questions 91
Answers
14.1 a. T – Preganglionic spinal neurons activate nicotinic receptors on the postganglionic fibres inthe sympathetic ganglia (Figure 14.1).
b. F – Postganglionic fibres are long, but they release the neuroeffector noradrenaline.Adrenaline is produced by chromaffin cells in the adrenal medulla (Figure 14.1).
c. F – The sympathetic preganglionic neurons are found in the thoracico-lumbar cord,T1-L3(Figure 14.1).
d. T – This is why spinal cord transection causes a sudden fall in sympathetic-mediatedvascular tone, causing hypotension.
e. F – The axons terminate in the adventitia; they do not penetrate the media (Figure 1.8).
14.2 a. F – Sympathetic fibres end in a string of varicosities containing noradrenaline-filled vesicles(Figures 1.8 and 12.11).
b. F – Tonic sympathetic vasoconstrictor activity helps maintain vessel tone and bloodpressure. Consequently, vasodilatation can be induced by reducing sympatheticvasoconstrictor activity.
c. T – The sympathetic neuroeffector noradrenaline has a high affinity for α-adrenoceptors,which are highly expressed by most vascular myocytes (Table 14.1).
d. T – Some sympathetic varicosities release vesicles containing ATP as well as noradrenaline.The ATP activates the ionotropic P2x purinergic receptors on vascular myocytes(Figure 12.11).The activated channels produce fast excitatory junction potentials,leading to contraction (Figure 12.10).
e. T – Much of the circulating noradrenaline derives from spillover from active sympatheticfibres (Figure 12.11).The rest is secreted by the adrenal medulla, along with its majorproduct, adrenaline.
14.3 a. T – Mean arterial blood pressure � total peripheral resistance (TPR) � cardiac output.A widespread increase in sympathetic activity raises TPR, which raises arterial pressure(Figures 8.21 and 14.2, line labelled ‘abdominal aorta’). Sympathetic activity is amajor part of our defence against postural and hypovolaemic hypotension.
b. F – Alpha-adrenoceptor-mediated vasoconstriction raises local vascular resistance, whichreduces local blood flow. Darcy’s law tells us that blood flow � pressure gradient/resistance (Figure 14.3, marker c).
c. F – Precapillary resistance vessel constriction lowers capillary pressure (Figure 11.7).Thisallows a gradual absorption of interstitial fluid, due to the colloid osmotic pressure ofthe plasma (Figure 14.3, arrow b).
d. T – Sympathetic fibres innervate splanchnic veins and cause venoconstriction (Figure 14.2).This displaces peripheral venous blood centrally, raising CVP and stroke volume(Starling’s law).
e. T – The brainstem control centre is organized organotopically – tissues are represented andcontrolled separately. During the alerting, fear–flight–fight response, sympathetic activityto skin increases (vasoconstriction – ‘white as a sheet’ with fear), but sympatheticvasoconstrictor activity to muscle decreases (vasodilatation, preparation for action).
14.4 a. T – Sympathetic vasoconstrictor fibres are tonically active, so a reduction in activity leads tovasodilatation, e.g. during the regulation of peripheral resistance and hence bloodpressure.
92 Cardiovascular physiology Answers
b. T – Cutaneous vessels are innervated by sympathetic cholinergic vasodilator fibres, as well assympathetic noradrenergic vasoconstrictor fibres. Cholinergic fibres are involved in coretemperature regulation; they elicit cutaneous vasodilatation and sweating.
c. T – The nociceptive C-fibre axon reflex mediates the spreading flare around a damagedarea.This is part of the Lewis triple response to trauma (Figure 14.4).
d. T – The cranial parasympathetic outflow mediates cholinergic vasodilatation in secretoryglands.The increased blood flow is needed to supply water for secretion.
e. F – Human skeletal muscle has no parasympathetic innervation. Human and primatemuscles also lack a sympathetic cholinergic innervation, unlike many species.
f. T – The sacral parasympathetic outflow induces erection through nitridergic (NO-producing)fibres.
14.5 a. F – The arterial resistance vessels of skeletal muscle, myocardium and liver strongly expressβ2-adrenoceptors, which are Gs-coupled to the dilator cAMP system (Figure 12.9).Adrenaline has a high affinity for β2-adrenoceptors, so it elicits vasodilatation in thesetissues (Table 14.1).
b. T – Cutaneous vessels express mainly α-adrenoceptors.Their activation by adrenaline causesvasoconstriction in skin and many other tissues (Table 14.1).
c. F – Vasodilatation in skeletal muscle (�40% of body mass) outweighs the effect ofvasoconstriction in skin, etc., so the total peripheral resistance falls a little (Figure 14.5).
d. T – Adrenaline has a positive inotropic action on the heart, raising the ejection fraction,stroke volume and ejection rate.These changes raise the pulse pressure (systolic minusdiastolic pressure). Diastolic pressure may even fall slightly, due to the fall in peripheralresistance (Figure 14.5).
e. T – Adrenaline stimulates the cardiac pacemaker β1 receptors to cause tachycardia andincreased contractility. Students often expect a rise in circulating noradrenaline to do thesame, since noradrenaline activates cardiac pacemaker β1 receptors. However, circulatingnoradrenaline, unlike adrenaline, vasoconstricts all peripheral tissues.This increasesperipheral resistance, raising blood pressure.The resulting baroreceptor reflex slows theheart rate by changing the autonomic outflow to the pacemaker (Figure 14.5).
f. F – Adrenaline stimulates liver glycogenolysis, which raises plasma glucose.
14.6 a. T – An action potential releases just a few hundred vesicles from the thousands of terminalvaricosities along a single sympathetic fibre (Figures 1.8 and 12.11).
b. F – It is the other way round – adrenaline is formed from noradrenaline bymethyltransferase, which add a methyl group (–CH3) to noradrenaline.
c. T – Noradrenaline causes widespread peripheral vasoconstriction, raising total peripheralresistance (Figure 14.5).
d. F – Noradrenaline causes vasoconstriction in all tissues, even muscle.e. T – This is why noradrenaline always causes vasoconstriction; the α-adrenoceptor is linked by
Gq protein to phospholipase C, which triggers vasoconstrictor pathways (Figure 12.4).
14.7 a. F – Vasopressin is synthesized by magnocellular neurons in the hypothalamus. It istransported along their axons for release in the posterior pituitary gland (Figure 14.6).
b. F – Vasopressin reduces water excretion, hence its alternative name ‘anti-diuretic hormone’(ADH).
c. T – Dehydration stimulates osmoreceptors in the hypothalamus, which project to thevasopressin-producing magnocellular neurons (Figure 14.6).The osmoreceptor–vasopressin pathway is a major factor in body fluid homeostasis.
Control of blood vessels: II. Extrinsic control Answers 93
d. F – A fall in arterial pressure and blood volume is sensed by cardiovascular receptors thattrigger a reflex increase in vasopressin secretion (Figure 14.6).
e. T – Nausea powerfully stimulates vasopressin secretion; circulating levels can increase50-fold.
14.8 a. F – The juxtaglomerular cells secrete the enzyme renin.Angiotensinogen is a circulatingplasma protein that is the substrate for renin, leading to the production of angiotensin 1.
b. T – A fall in blood pressure stimulates the renal arteriolar juxtaglomerular cells to secreterenin.A fall in pressure also reflexly increases renal sympathetic activity, which isanother trigger for renin secretion, along with reduced NaCl load at the macula densa(Figure 14.7).
c. T – Angiotensin-converting enzyme (ACE) on the surface of pulmonary endotheliumconvert the decapeptide angiotensin I into the active octapeptide, angiotensin II(Figure 14.7).
d. T – Angiotensin II causes resistance vessel constriction, partly by direct action and partlyby boosting sympathetic action.This supports the blood pressure after a haemorrhage.
e. F – The renin–angiotensin is tonically active in all humans.The hypotensive effect ofblocking it (by ACE inhibitors) is particularly marked in patients with hypertension.
14.9 a. T – This action retains salt and water in the water (Figure 14.7).b. F – Angiotensin II stimulates aldosterone secretion, completing a feedback loop that
regulates body salt and water content (Figure 14.7).c. T – The reduced renal artery pressure and increased renal sympathetic activity stimulate
the renin–angiotensin system, and angiotensin II stimulates aldosterone secretion(Figure 14.7).
d. F – A low salt load at the macula densa of the renal juxtaglomerular apparatus stimulatesthe renin–angiotensin–aldosterone system.This leads to the conservation of body salt(Figure 14.7).
e. T – Aldosterone contributes to the expansion of extracellular fluid and plasma volumeduring pregnancy.
14.10 a. F – ANP secretion is stimulated by a rise in cardiac filling pressure, which distends the atria.The actions of ANP then help lower the filling pressure (negative feedback).
b. T – ANP evokes renal natriuresis.ANP-evoked dilatation resembles that evoked by nitricoxide, because the intracellular portion of the ANP receptor possesses guanylate cyclaseactivity.
c. F – ANP reduces plasma volume by increasing capillary pressure (effect of precapillaryresistance vessel dilatation) and increasing venular permeability (effect of receptorguanylate cyclase activity).
d. F – BNP, despite its name, is also produced by myocardial cells in the ventricles.e. T – BNP may prove a useful biochemical and prognostic index of heart failure.
14.11 a. T – Blood displaced from constricted peripheral veins expands the thoracic blood pool,raising cardiac filling pressure and stroke volume (Figure 14.8).
b. F – Visceral veins are well innervated by sympathetic constrictor fibres (Figure 14.8).They are reflexly constricted when carotid sinus arterial pressure falls (Figure 14.2).
c. F – Muscle veins are poorly innervated by sympathetic constrictor fibres (Figure 14.8).d. T – Cutaneous venoconstriction is graded in proportion to exercise intensity (Figure 6.15).e. T – Nitrodilators relieve angina partly through venodilatation, which reduces cardiac filling
pressure (preload), and hence cardiac work and O2 demand.
94 Cardiovascular physiology Answers
14.12 a. Human forearm blood flow is usually measured by venous occlusion plethysmography(Figure 14.9). Plethysmography traces can be seen in Figure 13.12. Most of the soft tissuein the forearm is skeletal muscle, so the measured flow is largely muscle perfusion.
b. In the brachial artery, mean pressure � diastolic � one-third pulse pressure (Figure 8.7).So mean blood pressure was 85 mmHg at rest (80 � 45/3) and 110 mmHg when alarmed(90 � 60/3), a 29% increase.
c. Heart rate increased 2-fold but mean pressure increased only 1.29-fold. It is likely thatcardiac output, like the heart rate, at least doubled.The explanation for the relatively smallincrease in blood pressure must therefore be a substantial fall in total peripheral resistance,TPR; mean BP � cardiac output � TPR (so, 1.29 � 2 � 0.645). Peripheral resistancevessels must therefore have dilated in response to the alarm stimulus.
d. Darcy’s law tells us that flow � pressure gradient/resistance (Figure 1.5). Since the 1.29-fold rise in blood pressure is too small to cause a 6-fold rise in forearm blood flow, wecan conclude that the resistance vessels in the forearm dilated, lowering local vascularresistance 4.65-fold (1.29 � 4.65 � 6).What probably caused the vasodilatation? Humanmuscle has no vasodilator innervation and reduced sympathetic vasoconstrictor activitycannot increase flow this much.The most likely cause is the release of adrenalin by theadrenal medulla as part of the alerting (fear–fight–flight) reaction.Adrenaline causes β2-adrenoceptor-mediated vasodilatation in muscle (Table 14.1).
e. The only possible explanation for a fall in hand blood flow despite an increase in perfusingpressure is local vasoconstriction, raising the resistance to flow in the hand.This is inkeeping with a rise in circulating adrenaline, since adrenaline causes α-adrenoceptormediated vasoconstriction in cutaneous resistance vessels (Table 14.1).
Control of blood vessels: II. Extrinsic control Answers 95
T F15.1 In a healthy woman the local oxygen demand sometimes exceeds delivery
by the bloodstream toa. skeletal muscles during exercise. � �b. the myocardium during exercise. � �c. the skin during hot weather. � �d. the uterus during labour. � �e. the cerebral cortex during exercise. � �
15.2 The vascular resistance ofa. ventricular myocardium increases as cardiac output increases. � �b. skeletal muscle falls during dynamic exercise. � �c. the cutaneous circulation is raised in cold weather. � �d. the motor cortex increases during voluntary movement. � �e. the cerebral circulation is lower than that of the pulmonary circulation. � �
The coronary circulation15.3 In the coronary circulation of a healthy ventricle,
a. the myocardial capillary density is several times greater than in skeletal muscle. � �b. the coronary venous O2 concentration is about the same as in the right ventricle. � �c. the blood flow is almost directly proportional to the cardiac output. � �d. the blood flow is higher during ventricular ejection than during diastole. � �e. the blood flow can be increased by adrenaline. � �
15.4 In the human coronary circulation during exercise,a. increased O2 transfer is achieved mainly through increased O2 extraction
rather than increased blood flow. � �b. blood flow is increased by sympathetic cholinergic nerves. � �c. increased cardiac sympathetic fibre activity raises coronary perfusion. � �d. autoregulation is suppressed. � �e. a rise in interstitial adenosine may contribute to vasodilatation. � �
15.5 When a major human coronary vessel is obstructed by thrombosis,a. abundant arterio-arterial anastomoses greatly limit the ischaemic area. � �b. local hypoxia and acidosis cause downstream vasodilatation. � �c. a sharp pain is experienced over the heart on the left side of the chest. � �d. the ECG often shows ST segment elevation. � �e. the plasma level of myocardial lactic dehydrogenase falls. � �
CHAPTER 15
Specialization in individualcirculations
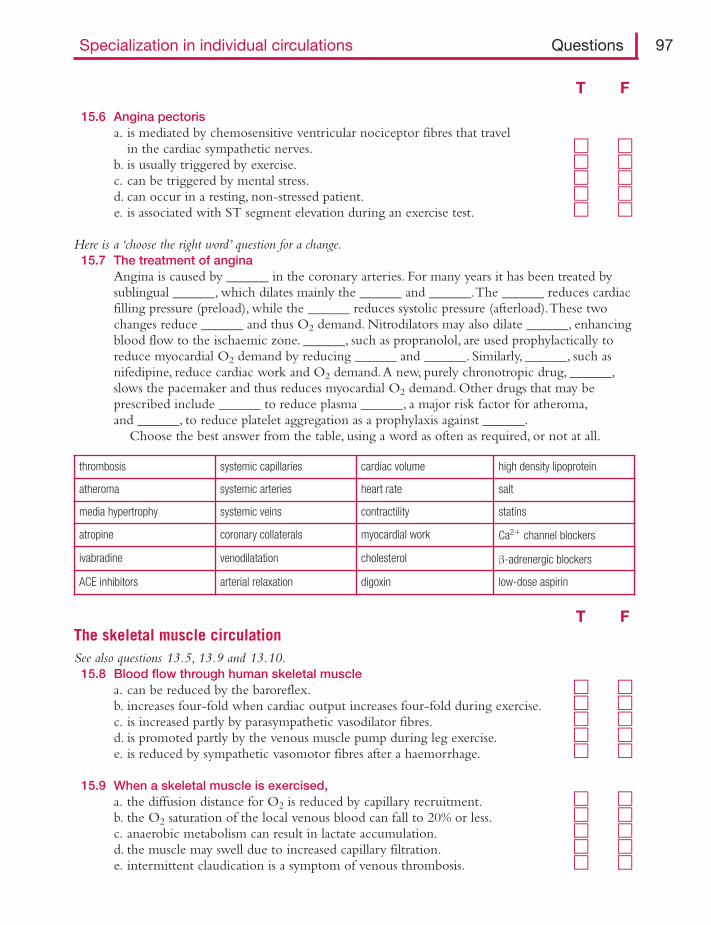
Specialization in individual circulations Questions 97
15.6 Angina pectorisa. is mediated by chemosensitive ventricular nociceptor fibres that travel
in the cardiac sympathetic nerves. � �b. is usually triggered by exercise. � �c. can be triggered by mental stress. � �d. can occur in a resting, non-stressed patient. � �e. is associated with ST segment elevation during an exercise test. � �
Here is a ‘choose the right word’ question for a change.15.7 The treatment of angina
Angina is caused by ______ in the coronary arteries. For many years it has been treated bysublingual ______, which dilates mainly the ______ and ______.The ______ reduces cardiacfilling pressure (preload), while the ______ reduces systolic pressure (afterload).These twochanges reduce ______ and thus O2 demand. Nitrodilators may also dilate ______, enhancingblood flow to the ischaemic zone. ______, such as propranolol, are used prophylactically toreduce myocardial O2 demand by reducing ______ and ______. Similarly, ______, such asnifedipine, reduce cardiac work and O2 demand.A new, purely chronotropic drug, ______,slows the pacemaker and thus reduces myocardial O2 demand. Other drugs that may beprescribed include ______ to reduce plasma ______, a major risk factor for atheroma,and ______, to reduce platelet aggregation as a prophylaxis against ______.
Choose the best answer from the table, using a word as often as required, or not at all.
thrombosis systemic capillaries cardiac volume high density lipoprotein
atheroma systemic arteries heart rate salt
media hypertrophy systemic veins contractility statins
atropine coronary collaterals myocardial work Ca2� channel blockers
ivabradine venodilatation cholesterol β-adrenergic blockers
ACE inhibitors arterial relaxation digoxin low-dose aspirin
T FThe skeletal muscle circulationSee also questions 13.5, 13.9 and 13.10.
15.8 Blood flow through human skeletal musclea. can be reduced by the baroreflex. � �b. increases four-fold when cardiac output increases four-fold during exercise. � �c. is increased partly by parasympathetic vasodilator fibres. � �d. is promoted partly by the venous muscle pump during leg exercise. � �e. is reduced by sympathetic vasomotor fibres after a haemorrhage. � �
15.9 When a skeletal muscle is exercised,a. the diffusion distance for O2 is reduced by capillary recruitment. � �b. the O2 saturation of the local venous blood can fall to 20% or less. � �c. anaerobic metabolism can result in lactate accumulation. � �d. the muscle may swell due to increased capillary filtration. � �e. intermittent claudication is a symptom of venous thrombosis. � �
T F
To add variety and promote a quantitative approach, here is a simple, numerical problem.15.10 Oxygen delivery to skeletal muscle. Human leg muscles receive a resting blood flow of
400 ml min�1. Arterial blood contains 200 ml O2 per litre and the muscle venous bloodcontains 150 ml O2 per litre at rest.a. What is the metabolic rate of the resting leg muscles, expressed as O2 consumption?
(Hint – think Fick!)b. If cycling raises the muscle blood flow to 4 litre min�1, and the venous O2 content falls to
90 ml O2 per litre, what is the new metabolic rate of the leg muscles? By what factor has itincreased?
T FCutaneous circulation15.11 The flow of blood though skin is
a. governed mainly by the contractile tone of the subpapillary venous plexus. � �b. controlled in part by the hypothalamus. � �c. reduced by sympathetic activity after a haemorrhage. � �d. reduced during the Lewis triple response. � �e. raised by disorders that raise blood viscosity. � �f. increased by adrenaline. � �
15.12 Cutaneous perfusiona. is increased when core temperature rises. � �b. is reduced when ambient temperature falls. � �c. can be increased in acral skin by contraction of arterio-venous
anastomoses (AVA). � �d. is increased by a fall in sympathetic activity in acral skin. � �e. is increased by a fall in sympathetic cholinergic activity in non-acral skin. � �f. can increase paradoxically after 5–10-min exposure to cold. � �
15.13 Blood flow through the skina. can be increased by sensory C-fibre activity. � �b. is increased during the alerting (fear–flight–fight) response. � �c. is reduced by sympathetic-mediated vasoconstriction during heart failure. � �d. is increased in skin below heart level due to the pull of gravity. � �e. increases above normal when a period of physical compression is terminated. � �f. shows an exaggerated response to cooling in Raynauld’s disease. � �
The cerebral circulation15.14 The human cerebral circulation
a. delivers 10% of the resting cardiac output to an organ that is only �2% of total body weight. � �
b. arises from anastomosing arteries surrounding the sella turcica. � �c. has an unusually large fraction of its total resistance located in the
large arteries. � �d. branches to provide a similar capillary density to skeletal muscle. � �e. has arteries that are innervated by perivascular nociceptive C fibres. � �
98 Cardiovascular physiology Questions
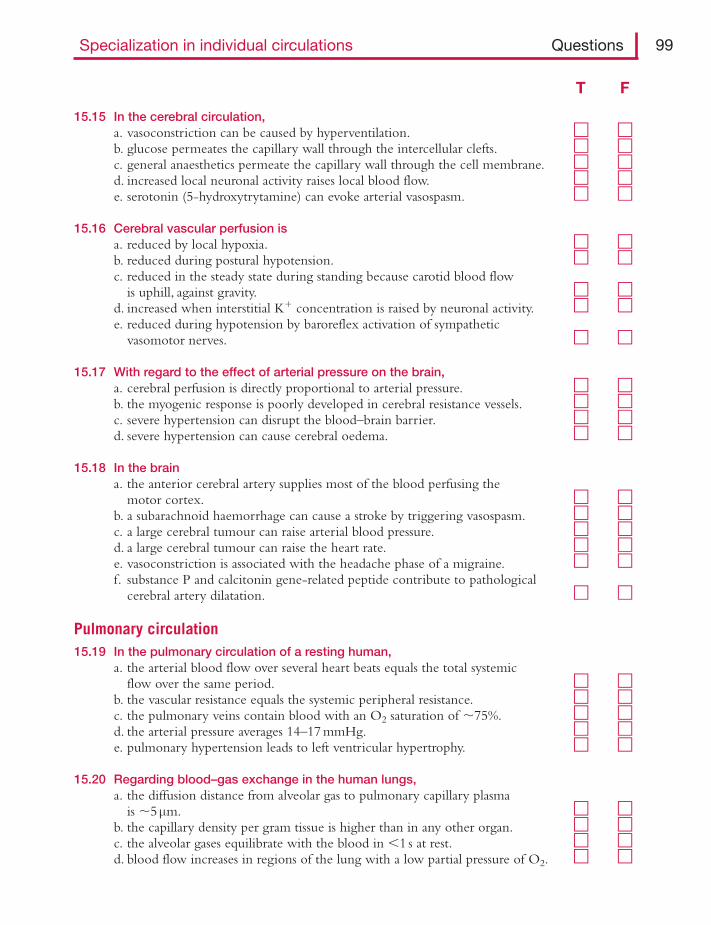
Specialization in individual circulations Questions 99
15.15 In the cerebral circulation,a. vasoconstriction can be caused by hyperventilation. � �b. glucose permeates the capillary wall through the intercellular clefts. � �c. general anaesthetics permeate the capillary wall through the cell membrane. � �d. increased local neuronal activity raises local blood flow. � �e. serotonin (5-hydroxytrytamine) can evoke arterial vasospasm. � �
15.16 Cerebral vascular perfusion isa. reduced by local hypoxia. � �b. reduced during postural hypotension. � �c. reduced in the steady state during standing because carotid blood flow
is uphill, against gravity. � �d. increased when interstitial K� concentration is raised by neuronal activity. � �e. reduced during hypotension by baroreflex activation of sympathetic
vasomotor nerves. � �
15.17 With regard to the effect of arterial pressure on the brain,a. cerebral perfusion is directly proportional to arterial pressure. � �b. the myogenic response is poorly developed in cerebral resistance vessels. � �c. severe hypertension can disrupt the blood–brain barrier. � �d. severe hypertension can cause cerebral oedema. � �
15.18 In the braina. the anterior cerebral artery supplies most of the blood perfusing the
motor cortex. � �b. a subarachnoid haemorrhage can cause a stroke by triggering vasospasm. � �c. a large cerebral tumour can raise arterial blood pressure. � �d. a large cerebral tumour can raise the heart rate. � �e. vasoconstriction is associated with the headache phase of a migraine. � �f. substance P and calcitonin gene-related peptide contribute to pathological
cerebral artery dilatation. � �
Pulmonary circulation15.19 In the pulmonary circulation of a resting human,
a. the arterial blood flow over several heart beats equals the total systemic flow over the same period. � �
b. the vascular resistance equals the systemic peripheral resistance. � �c. the pulmonary veins contain blood with an O2 saturation of �75%. � �d. the arterial pressure averages 14–17 mmHg. � �e. pulmonary hypertension leads to left ventricular hypertrophy. � �
15.20 Regarding blood–gas exchange in the human lungs,a. the diffusion distance from alveolar gas to pulmonary capillary plasma
is �5μm. � �b. the capillary density per gram tissue is higher than in any other organ. � �c. the alveolar gases equilibrate with the blood in �1 s at rest. � �d. blood flow increases in regions of the lung with a low partial pressure of O2. � �
T F
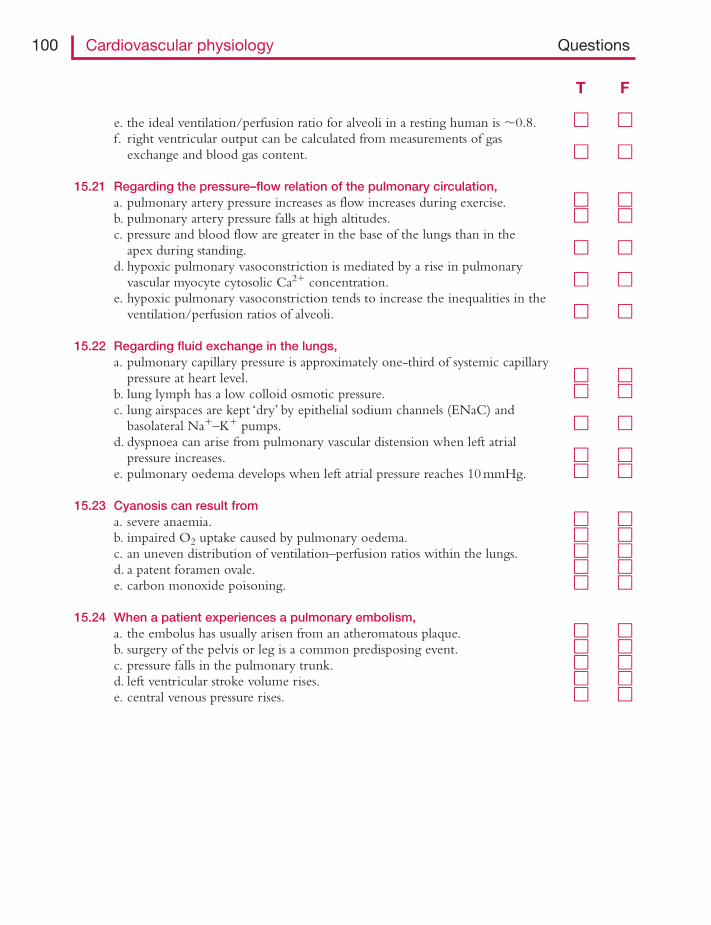
e. the ideal ventilation/perfusion ratio for alveoli in a resting human is �0.8. � �f. right ventricular output can be calculated from measurements of gas
exchange and blood gas content. � �
15.21 Regarding the pressure–flow relation of the pulmonary circulation,a. pulmonary artery pressure increases as flow increases during exercise. � �b. pulmonary artery pressure falls at high altitudes. � �c. pressure and blood flow are greater in the base of the lungs than in the
apex during standing. � �d. hypoxic pulmonary vasoconstriction is mediated by a rise in pulmonary
vascular myocyte cytosolic Ca2� concentration. � �e. hypoxic pulmonary vasoconstriction tends to increase the inequalities in the
ventilation/perfusion ratios of alveoli. � �
15.22 Regarding fluid exchange in the lungs,a. pulmonary capillary pressure is approximately one-third of systemic capillary
pressure at heart level. � �b. lung lymph has a low colloid osmotic pressure. � �c. lung airspaces are kept ‘dry’ by epithelial sodium channels (ENaC) and
basolateral Na�–K� pumps. � �d. dyspnoea can arise from pulmonary vascular distension when left atrial
pressure increases. � �e. pulmonary oedema develops when left atrial pressure reaches 10 mmHg. � �
15.23 Cyanosis can result froma. severe anaemia. � �b. impaired O2 uptake caused by pulmonary oedema. � �c. an uneven distribution of ventilation–perfusion ratios within the lungs. � �d. a patent foramen ovale. � �e. carbon monoxide poisoning. � �
15.24 When a patient experiences a pulmonary embolism,a. the embolus has usually arisen from an atheromatous plaque. � �b. surgery of the pelvis or leg is a common predisposing event. � �c. pressure falls in the pulmonary trunk. � �d. left ventricular stroke volume rises. � �e. central venous pressure rises. � �
100 Cardiovascular physiology Questions
T F
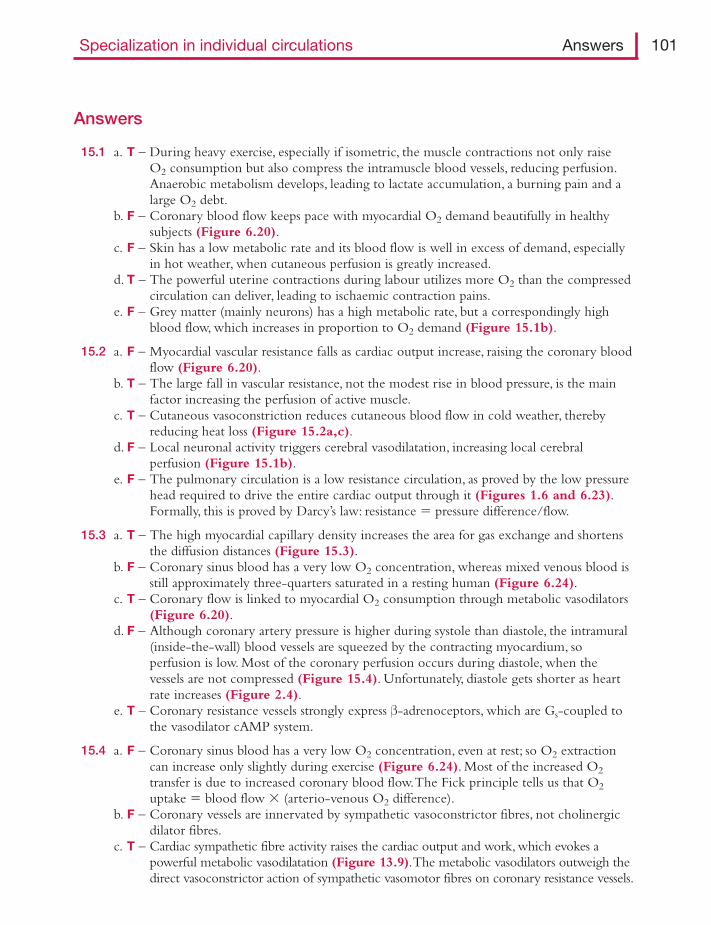
Specialization in individual circulations Answers 101
Answers
15.1 a. T – During heavy exercise, especially if isometric, the muscle contractions not only raiseO2 consumption but also compress the intramuscle blood vessels, reducing perfusion.Anaerobic metabolism develops, leading to lactate accumulation, a burning pain and alarge O2 debt.
b. F – Coronary blood flow keeps pace with myocardial O2 demand beautifully in healthysubjects (Figure 6.20).
c. F – Skin has a low metabolic rate and its blood flow is well in excess of demand, especiallyin hot weather, when cutaneous perfusion is greatly increased.
d. T – The powerful uterine contractions during labour utilizes more O2 than the compressedcirculation can deliver, leading to ischaemic contraction pains.
e. F – Grey matter (mainly neurons) has a high metabolic rate, but a correspondingly highblood flow, which increases in proportion to O2 demand (Figure 15.1b).
15.2 a. F – Myocardial vascular resistance falls as cardiac output increase, raising the coronary bloodflow (Figure 6.20).
b. T – The large fall in vascular resistance, not the modest rise in blood pressure, is the mainfactor increasing the perfusion of active muscle.
c. T – Cutaneous vasoconstriction reduces cutaneous blood flow in cold weather, therebyreducing heat loss (Figure 15.2a,c).
d. F – Local neuronal activity triggers cerebral vasodilatation, increasing local cerebralperfusion (Figure 15.1b).
e. F – The pulmonary circulation is a low resistance circulation, as proved by the low pressurehead required to drive the entire cardiac output through it (Figures 1.6 and 6.23).Formally, this is proved by Darcy’s law: resistance � pressure difference/flow.
15.3 a. T – The high myocardial capillary density increases the area for gas exchange and shortensthe diffusion distances (Figure 15.3).
b. F – Coronary sinus blood has a very low O2 concentration, whereas mixed venous blood isstill approximately three-quarters saturated in a resting human (Figure 6.24).
c. T – Coronary flow is linked to myocardial O2 consumption through metabolic vasodilators(Figure 6.20).
d. F – Although coronary artery pressure is higher during systole than diastole, the intramural(inside-the-wall) blood vessels are squeezed by the contracting myocardium, soperfusion is low. Most of the coronary perfusion occurs during diastole, when thevessels are not compressed (Figure 15.4). Unfortunately, diastole gets shorter as heartrate increases (Figure 2.4).
e. T – Coronary resistance vessels strongly express β-adrenoceptors, which are Gs-coupled tothe vasodilator cAMP system.
15.4 a. F – Coronary sinus blood has a very low O2 concentration, even at rest; so O2 extractioncan increase only slightly during exercise (Figure 6.24). Most of the increased O2transfer is due to increased coronary blood flow.The Fick principle tells us that O2uptake � blood flow � (arterio-venous O2 difference).
b. F – Coronary vessels are innervated by sympathetic vasoconstrictor fibres, not cholinergicdilator fibres.
c. T – Cardiac sympathetic fibre activity raises the cardiac output and work, which evokes apowerful metabolic vasodilatation (Figure 13.9).The metabolic vasodilators outweigh thedirect vasoconstrictor action of sympathetic vasomotor fibres on coronary resistance vessels.
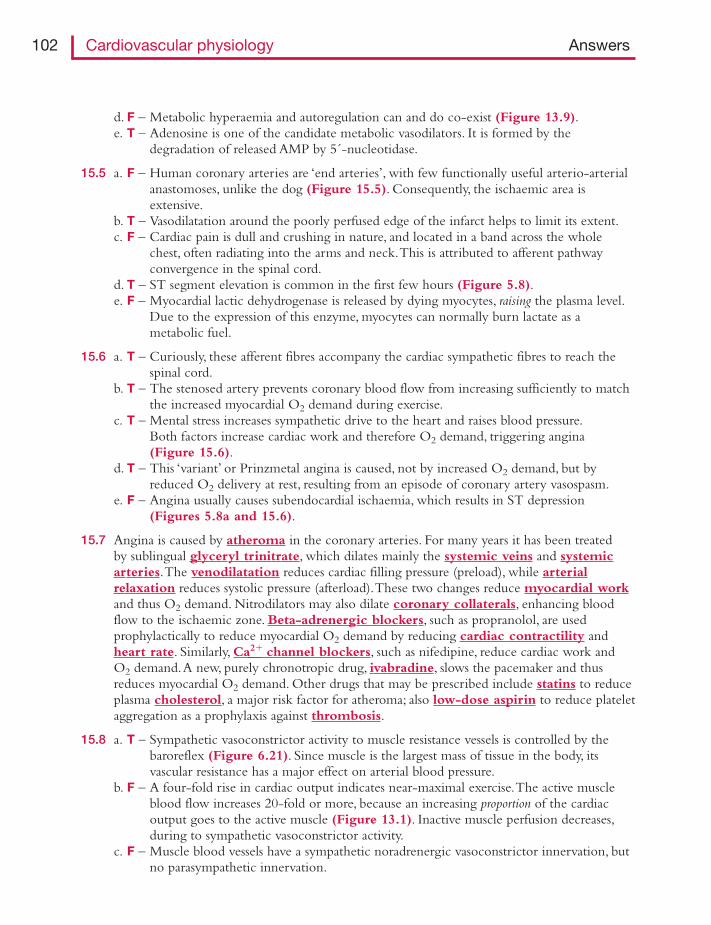
d. F – Metabolic hyperaemia and autoregulation can and do co-exist (Figure 13.9).e. T – Adenosine is one of the candidate metabolic vasodilators. It is formed by the
degradation of released AMP by 5´-nucleotidase.
15.5 a. F – Human coronary arteries are ‘end arteries’, with few functionally useful arterio-arterialanastomoses, unlike the dog (Figure 15.5). Consequently, the ischaemic area isextensive.
b. T – Vasodilatation around the poorly perfused edge of the infarct helps to limit its extent.c. F – Cardiac pain is dull and crushing in nature, and located in a band across the whole
chest, often radiating into the arms and neck.This is attributed to afferent pathwayconvergence in the spinal cord.
d. T – ST segment elevation is common in the first few hours (Figure 5.8).e. F – Myocardial lactic dehydrogenase is released by dying myocytes, raising the plasma level.
Due to the expression of this enzyme, myocytes can normally burn lactate as ametabolic fuel.
15.6 a. T – Curiously, these afferent fibres accompany the cardiac sympathetic fibres to reach thespinal cord.
b. T – The stenosed artery prevents coronary blood flow from increasing sufficiently to matchthe increased myocardial O2 demand during exercise.
c. T – Mental stress increases sympathetic drive to the heart and raises blood pressure.Both factors increase cardiac work and therefore O2 demand, triggering angina(Figure 15.6).
d. T – This ‘variant’ or Prinzmetal angina is caused, not by increased O2 demand, but byreduced O2 delivery at rest, resulting from an episode of coronary artery vasospasm.
e. F – Angina usually causes subendocardial ischaemia, which results in ST depression(Figures 5.8a and 15.6).
15.7 Angina is caused by atheroma in the coronary arteries. For many years it has been treatedby sublingual glyceryl trinitrate, which dilates mainly the systemic veins and systemicarteries.The venodilatation reduces cardiac filling pressure (preload), while arterialrelaxation reduces systolic pressure (afterload).These two changes reduce myocardial workand thus O2 demand. Nitrodilators may also dilate coronary collaterals, enhancing bloodflow to the ischaemic zone. Beta-adrenergic blockers, such as propranolol, are usedprophylactically to reduce myocardial O2 demand by reducing cardiac contractility andheart rate. Similarly, Ca2�__ channel blockers, such as nifedipine, reduce cardiac work andO2 demand.A new, purely chronotropic drug, ivabradine, slows the pacemaker and thusreduces myocardial O2 demand. Other drugs that may be prescribed include statins to reduceplasma cholesterol, a major risk factor for atheroma; also low-dose aspirin to reduce plateletaggregation as a prophylaxis against thrombosis.
15.8 a. T – Sympathetic vasoconstrictor activity to muscle resistance vessels is controlled by thebaroreflex (Figure 6.21). Since muscle is the largest mass of tissue in the body, itsvascular resistance has a major effect on arterial blood pressure.
b. F – A four-fold rise in cardiac output indicates near-maximal exercise.The active muscleblood flow increases 20-fold or more, because an increasing proportion of the cardiacoutput goes to the active muscle (Figure 13.1). Inactive muscle perfusion decreases,during to sympathetic vasoconstrictor activity.
c. F – Muscle blood vessels have a sympathetic noradrenergic vasoconstrictor innervation, butno parasympathetic innervation.
102 Cardiovascular physiology Answers
d. T – The calf muscle pump lowers local venous pressure, which increases the pressuredifference (artery to vein) driving blood through the active leg muscles (Figure 8.27).
e. T – Baroreflex-mediated vasoconstriction in skeletal muscle helps support the arterial bloodpressure after a haemorrhage.
15.9 a. T – Arteriolar dilatation increases the number of well-perfused capillaries (capillaryrecruitment).This reduces the radius of the Krogh cylinder of muscle supplied by eachcapillary (Figure 10.7).
b. T – Oxygen extraction can reach 80–90%, cf. 25% in resting muscle.c. T – The lactate represents the O2 debt.d. T – Arteriolar dilatation raises capillary pressure (Figures 8.21 and 11.7).This raises the
capillary filtration rate (Starling’s principle of fluid exchange).e. F – Intermittent claudication (ischaemic limb pain after walking a short distance) is caused
by stenosis of a major leg artery, by atheroma, often in a smoker or diabetic.
15.10 a. The Fick principle, which is simply a version of the law of conservation of mass, tells usthat O2 consumption � blood flow � (arterial concentration � venous concentration) (Figure 7.3).At rest, therefore, 0.4 l min�1 � (200 ml l�1 � 150 ml l�1) � 20 ml O2min�1.
b. During cycling, 4.0 l min�1 � (200 ml l�1 � 90 ml l�1) � 440 ml O2 min�1. Musclemetabolic rate has increased 22-fold.
15.11 a. F – As in all tissues, venous resistance is negligible compared with arteriolar resistance.It is the arterial resistance vessels that regulate flow through non-acral skin, along witharteriovenous anastomoses in acral skin (Figure 15.7).
b. T – The temperature-regulating centre in the hypothalamus controls the sympatheticcholinergic vasodilator outflow to blood vessels and sweat glands in the skin of the limbsand torso (Figure 15.8, lower panel).
c. T – During hypovolaemia the baroreflex increases sympathetic noradrenergic vasoconstrictoroutflow to the skin arterial and venous vessels – hence the patient’s pallor.
d. F – The Lewis triple response is a local redness at the site of trauma (vasodilatation), a wheal(inflammation oedema) and a spreading flare (vasodilatation) mediated by thenociceptive C fibre axon reflex (Figure 14.4).
e. F – A rise in blood viscosity increases the resistance to flow (Poiseuille’s law, Figure 8.19);compare the curves for Ringer’s solution (saline, low viscosity) and blood inFigure 8.20. Myeloma can raise the viscosity of plasma, impairing fingertip perfusion.Polycythaemia raises the viscosity of whole blood (Figure 8.13).
f. F – Skin vessels express mainly α-adrenoceptors, so adrenaline contracts skin vessels(cf. dilates muscle vessels).Adrenaline is often mixed with local anaesthetic for the skin;the resulting local cutaneous vasoconstriction prevents the anaesthetic from beingwashed away quickly.
15.12 a. T – Hypothalamic temperature sensors control the sympathetic cholinergic outflow tonon-acral skin and the sympathetic noradrenergic fibres innervating arterio-venousanastomoses in acral skin. Cutaneous vasodilatation increases sharply as coretemperature rises (Figure 15.2b), causing heat loss.
b. T – Skin resistance vessels vasoconstrict in response to local cooling, reducing perfusion andheat loss (Figure 15.2a,c).
c. F – Contraction of AVAs reduces skin blood flow and heat loss. Dilatation of AVAs increasesthe flow of hot blood through the skin, increasing heat loss (Figure 15.7).
Specialization in individual circulations Answers 103
d. T – At room temperature the arterio-venous anastomoses are tonically constricted by thetonic sympathetic noradrenergic fibre activity.A fall in sympathetic activity thereforeincreases the blood flow in acral skin (Figure 15.8, upper panel).
e. F – Sympathetic cholinergic fibres cause cutaneous vasodilatation and sweating, and thusincrease heat loss. If these nerves are blocked, there is little to no heat-inducedvasodilatation (Figure 15.8, lower panel).
f. T – Episodes of paradoxical cold vasodilatation restore flow to severely vasoconstricted, coldskin for short periods (Figure 15.2c).
15.13 a. T – Nociceptive C fibres can release the vasodilator neuropeptides, substance P andcalcitonin gene-related peptide (CGRP).This mediates the spreading flare response toskin trauma (Figure 14.4).
b. F – The alerting response increases sympathetic vasoconstrictor fibre discharge to skin – wego pale with fear.
c. T – Sympathetic activity is high during heart failure, reducing cutaneous perfusion.d. F – Gravity has no direct effect on flow through a rigid siphon (Figure 8.25). Skin blood
flow actually decreases below heart level, due to a veni-arteriolar contractile response tothe gravitation-induced rise in local vascular pressures (Figure 11.6).
e. T – This response, called reactive or post-ischaemic hyperaemia, helps resupply the tissuewith O2 and nutrients, and remove accumulated metabolites (Figure 13.12).
f. T – The mechanisms underlying the exaggerated, extreme vasoconstriction remain unclear.
15.14 a. T – Cerebral blood is �13–14% of the resting cardiac output (Figure 1.3).This isnecessitated by the exceptionally high O2 demands of cerebral neurons, which accountfor �18% of human resting O2 consumption.
b. T – The sella turcica (Turkish saddle) is the bony cavity in which the pituitary gland sits. Itis surrounded by the arterial circle of Willis, from which the cerebral arteries arise(Figure 15.9).
c. T – Cerebral arterioles are unusually short, so the large arteries account for �40% of thevascular resistance.
d. F – Grey matter has �10 times more capillaries per unit area than skeletal muscle, i.e.3000–4000/mm2, similar to myocardium.This improves O2 transport to the neurons.
e. T – The perivascular nociceptors are thought to mediate vascular headaches and migraine.
15.15 a. T – Hyperventilation causes hypocapnia (low arterial CO2). Cerebral vessels are verysensitive to CO2, which dilates them (Figure 13.6).
b. F – Cerebral capillaries have unusual, tightly sealed intercellular junctions, creating theblood–brain barrier.Although D-glucose crosses the wall through the intercellular cleftsof most capillaries, it cannot do so in the brain.Transport is by facilitated, GLUT-1carrier-mediated diffusion through the endothelial cells.
c. T – The membrane is mainly lipid, and general anaesthetics are lipid-soluble, so they diffusefor blood to neuron very quickly.There is no blood–brain barrier for lipid solublesolutes.
d. T – For example, movement increases blood flow in the motor cortex (Figure15.1).e. T – Release of the vasoconstrictor, serotonin, from platelets and perivascular nerves is
thought to contribute to the vasospasm triggered by cerebral haemorrhage, leading to ahaemorrhagic stroke.
15.16 a. F – Hypoxia causes cerebral vasodilatation, which increases flow and O2 delivery(Figures 13.7 and 15.10).
104 Cardiovascular physiology Answers
b. T – On standing, venous pooling in the lower body reduces stroke volume, which in turnreduces cerebral blood flow temporarily.This can cause the occasional transientdizziness that is familiar to most of us.
c. F – Cerebral flow is indeed reduced by 10–20% in the steady state during standing, but notfor the spurious reason given; flow in a rigid siphon (artery–capillaries–vein) is notaffected by orientation (Figure 8.25). Flow is reduced by (1) cerebral vasoconstriction(caused by reduced CO2 and increased sympathetic activity) and (2) gravity-relatedcollapse of unsupported draining veins (Figures 6.9b and 8.26).
d. T – Cerebral resistance vessels show marked metabolic vasodilatation.This is mediated inpart by a rise in interstitial K� concentration, brought about by increased neuronalactivity (Figure 15.11).
e. F – The role of the baroreflex is to safeguard cerebral perfusion, not strangle it! Othercirculations are strangled (vasoconstricted) to preserve cerebral and myocardial perfusionduring hypotension. Cerebral vessels are little affected by sympathetic activity orcirculating catecholamines, because they express relatively few α-adrenoceptors.
15.17 a. F – The cerebral circulation shows excellent autoregulation, i.e. near-constant flow despitechanges in blood pressure over the physiological range (Figure 13.6).
b. F – The myogenic response is very well developed in cerebral vessels (Figure 13.2). It islargely responsible for the excellent cerebral autoregulation.
c. T – This can be seen in the retina, which develops as an extension of the brain in theembryo. Severe hypertensive retinopathy is characterized by dots and blots(microhaemorrhages) and exudates (oedema).
d. T – Hypertensive encephalopathy is a serious condition. In eclamptic toxaemia ofpregnancy, severe hypertension can precipitate fits.
15.18 a. F – The primary motor and sensory cortex, located around the central sulcus, are perfusedby the middle cerebral artery (Figure 15.9). Most thrombo-embolic strokes involve themiddle cerebral artery, so they cause contralateral paralysis (hemiplegia).
b. T – The release of serotonin, endothelin and neuropeptideY causes arterial vasospasm,which leads to a haemorrhagic stroke (cerebral ischaemia).
c. T – The expanding tumour forces the brainstem against the wall of the foramen magnum.This raises the activity of presympathetic neurons in the vasomotor centres, leading to arise in blood pressure (part of Cushing’s reflex) (Figure 8.17).
d. F – The rise in blood pressure (see question c) stimulates the baroreceptors, which causes areflex bradycardia.This is called Cushing’s reflex (Figure 8.17).
e. F – The headache phase is associated with dilatation of the major cerebral vessels.Thedilatation and local inflammation stimulate nociceptive C fibres in the arterial adventitia.
f. T – These vasodilator neuropeptides are released from the nociceptive C fibres around themajor arteries.
15.19 a. T – Right ventricle output equals left ventricle output, due to the operation of Starling’slaw of the heart (Figure 6.8). Imbalances are transient, e.g. during inspiration/expiration, standing.
b. F – Resistance is the pressure difference needed to drive unit flow (Darcy’s law). Pressuresare low in the pulmonary circulation (Figures 1.6 and 6.23), so resistance must below. Pulmonary vascular resistance is approximately one-sixth of systemic vascularresistance, because pulmonary resistance vessels are short and numerous.
Specialization in individual circulations Answers 105
c. F – Pulmonary veins contain blood draining from the alveoli, so the O2 saturation is almost100% (Figure 1.4).
d. T – The low arterial pressure is the result of the low resistance to flow.e. F – Pulmonary arterial hypertension causes right ventricular hypertrophy, and eventually
failure.
15.20 a. F – This thickness would greatly impair O2 transfer.The alveolar membrane is extremelythin – only �0.3μm (Figure 15.12).
b. T – Capillary packing is extraordinarily dense in the alveoli (Figure 15.12).c. T – The transit time for blood in a pulmonary capillary is �1 s in a resting human. CO2 and
O2 equilibrate long before the end of the capillary is reached (Figure 10.6, curves 1–2,flow-limited exchange).
d. F – Hypoxia causes local pulmonary vasoconstriction (hypoxic pulmonary vasoconstriction,HPV) (Figure 15.13). HPV reduces the perfusion of underventilated alveoli and thushelps to normalize the ventilation/perfusion ratios and prevent hypoxaemia.
e. T – In a resting 70 kg human, the alveolar ventilation is �4 l min�1 and blood flow (cardiacoutput) is �5 l min�1, so the ratio is 0.8.
f. T – This is the Fick method. Cardiac output � pulmonary blood flow � oxygenconsumption per minute/arteriovenous difference in oxygen content (Figure 7.3).
15.21 a. T – The increase in right ventricular output during exercise raises pulmonary arterypressure (Figure 6.23).
b. F – High altitude causes hypoxia, which causes vasoconstriction in the pulmonarycirculation (unlike the vasodilator response of systemic vessels).This depresses thepressure–flow curve (Figure 15.14) and can lead to cardiac failure.
c. T – Gravity raises blood pressure in the base, distending the passive pulmonary vessels.Conversely, vessels in the apex collapse during diastole (Figure 15.15).This results inventilation/perfusion inequality between base and apex during standing.
d. T – Hypoxia inhibits certain K� channels in the vascular myocyte membrane, causingdepolarization and Ca2� entry. Over a longer interval, hypoxia also activated vascularrho kinase, which increases vascular sensitivity to Ca2�.
e. F – HPV is a clever way of normalizing the alveolar ventilation/perfusion ratios, and thusoptimizing gas exchange (Figure 15.13).
15.22 a. T – This keeps the tension low in the very thin alveolar–endothelial membrane, and slowsthe rate of fluid filtration into the lungs.
b. F – Lung lymph colloid osmotic pressure (COP) is �70% of the plasma level.This is due tothe inverse relation between capillary filtration rate and interstitial plasma proteinconcentration (Figure 11.10).The high interstitial COP maintains capillary filtrationdespite pulmonary capillary pressure being lower than plasma COP (Figure 11.11,lowest left point).
c. T – As Na� is absorbed from the airways through ENaC (rate-limiting step) and basolateralpump, water follows by osmosis.This is especially important in clearing fluid from theneonatal lungs at birth.
d. T – The rise in pulmonary venous pressure distends the lung vasculature (pulmonarycongestion), making the lungs stiff and difficult to inflate.
e. F – Due to the safety margin against oedema (Figure 11.17), left atrial pressure has toreach 20 mmHg or so before clinical pulmonary oedema appears (cough, dyspnoea,crepitations).This can happen in severe left ventricular failure and mitral stenosis.
106 Cardiovascular physiology Answers
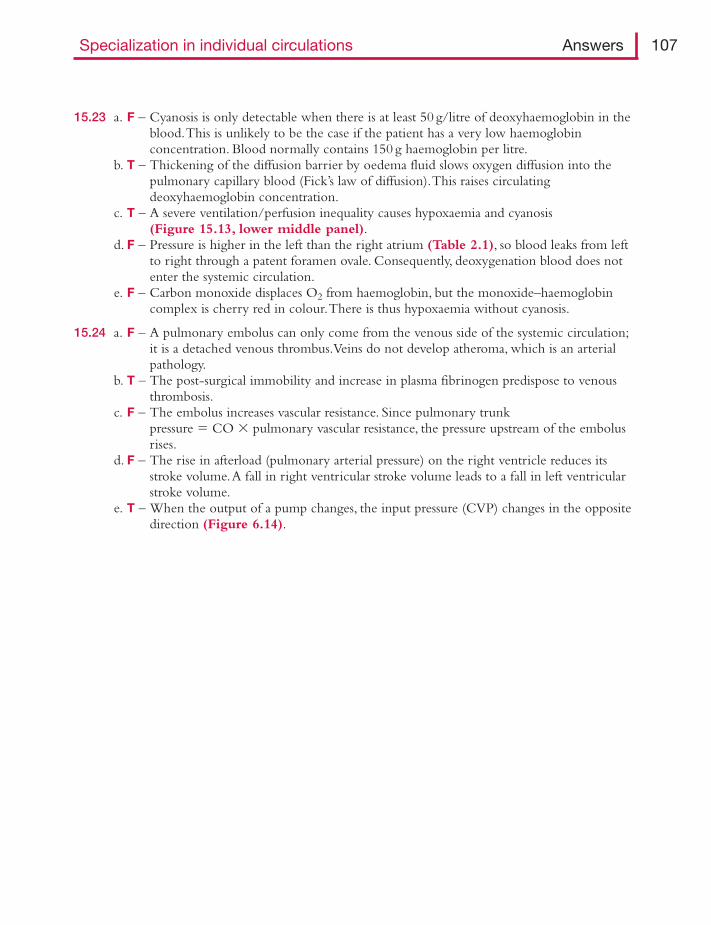
15.23 a. F – Cyanosis is only detectable when there is at least 50 g/litre of deoxyhaemoglobin in theblood.This is unlikely to be the case if the patient has a very low haemoglobinconcentration. Blood normally contains 150 g haemoglobin per litre.
b. T – Thickening of the diffusion barrier by oedema fluid slows oxygen diffusion into thepulmonary capillary blood (Fick’s law of diffusion).This raises circulatingdeoxyhaemoglobin concentration.
c. T – A severe ventilation/perfusion inequality causes hypoxaemia and cyanosis(Figure 15.13, lower middle panel).
d. F – Pressure is higher in the left than the right atrium (Table 2.1), so blood leaks from leftto right through a patent foramen ovale. Consequently, deoxygenation blood does notenter the systemic circulation.
e. F – Carbon monoxide displaces O2 from haemoglobin, but the monoxide–haemoglobincomplex is cherry red in colour.There is thus hypoxaemia without cyanosis.
15.24 a. F – A pulmonary embolus can only come from the venous side of the systemic circulation;it is a detached venous thrombus.Veins do not develop atheroma, which is an arterialpathology.
b. T – The post-surgical immobility and increase in plasma fibrinogen predispose to venousthrombosis.
c. F – The embolus increases vascular resistance. Since pulmonary trunkpressure � CO � pulmonary vascular resistance, the pressure upstream of the embolusrises.
d. F – The rise in afterload (pulmonary arterial pressure) on the right ventricle reduces itsstroke volume.A fall in right ventricular stroke volume leads to a fall in left ventricularstroke volume.
e. T – When the output of a pump changes, the input pressure (CVP) changes in the oppositedirection (Figure 6.14).
Specialization in individual circulations Answers 107
T F16.1 Arterial baroreceptors
a. respond primarily to stretch, not pressure. � �b. are located chiefly in the aortic and carotid bodies. � �c. can be stimulated by a rise in pulse pressure with no rise in mean pressure. � �d. reflexly attenuate fluctuations in the mean arterial pressure. � �e. have afferent fibres in both the trigeminal and vagus nerves. � �
16.2 The activity of carotid baroreceptor afferent fibres (action potentials)a. ceases completely below blood pressures in the range 50–100 mmHg. � �b. is pulsatile at normal blood pressures. � �c. elicits a ‘pressor’ reflex. � �d. causes a reflex tachycardia. � �e. causes a reflex decrease in sympathetic vasoconstrictor fibre activity. � �f. causes a reflex rise in cardiac contractility. � �
16.3 The baroreflexa. is an example of a positive feedback control system. � �b. reduces systemic arterial blood pressure. � �c. causes a reflex tachycardia on moving from lying to standing. � �d. is reset to a lower operating point during exercise. � �e. can be stimulated by massaging the neck just below the angle of the jaw. � �
16.4 Baroreceptor unloading during hypovolaemia reflexlya. helps to maintain the cardiac output. � �b. increases the total peripheral resistance. � �c. minimizes the fall in central venous pressure via sympathetic-mediated
venoconstriction. � �d. promotes capillary absorption of interstitial fluid. � �e. promotes renal fluid retention by inhibiting the renin–angiotensin system. � �f. promotes renal fluid retention by stimulating vasopressin secretion. � �
16.5 Cardiac afferentsa. that are mechanosensitive and are located in ventricular myocardium mediate
the pain of a heart attack. � �b. in the venoatrial region elicit a reflex tachycardia and diuresis when cardiac
filling pressure is elevated. � �c. that are chemosensitive and are located in ventricular myocardium mediate
the pain of angina pectoris. � �d. unlike baroreceptor afferents, do not relay in the nucleus ambiguus solitarius
of the medulla oblongata. � �
CHAPTER 16
Cardiovascular receptors,reflexes and central control
16.6 An acute increase in extracellular fluid volume in a humana. can stimulate both arterial baroreceptors and venoatrial stretch receptors. � �b. elicits a reflex vasoconstriction in the skin, muscle and renal circulations. � �c. elicits a reflex fall in circulating vasopressin. � �d. elicits a rise in circulating atrial natriuretic peptide. � �e. elicits a reflex activation of the renin–angiotensin system. � �
16.7 In the long-term control of arterial blood pressure,a. the cardiopulmonary stretch receptors help normalize arterial
blood pressure. � �b. blood pressure is influenced by extracellular fluid volume. � �c. the renal regulation of body salt mass is pivotal. � �d. body water mass is coupled to body salt mass via vasopressin. � �e. the kidneys regulate extracellular fluid volume, but not red cell mass. � �
16.8 Regarding the reflex regulation of the cardiovascular system,a. carotid chemoreceptors cause reflex peripheral vasodilatation during
asphyxiation. � �b. lung stretch receptors excited by inflation cause a reflex tachycardia. � �c. skeletal muscle mechanoreceptors (group III afferents) reflexly inhibit
cardiovagal tone. � �d. skeletal muscle metaboreceptors (group IV afferents) reflexly raise blood
pressure during isometric exercise. � �e. facial cold receptors cause a reflex tachycardia. � �
16.9 In the central control of the cardiovascular system,a. sensory integration begins in the nucleus tractus solitarius of the medulla. � �b. a projection from medullary expiratory neurons to the nucleus ambiguus
(cardiac vagal motorneurons) contributes to sinus arrhythmia. � �c. a projection from the nucleus tractus solitarius to the hypothalamus
reflexly influences sympathetic vasoconstrictor outflow. � �d. the cerebral cortex can raise cardiac output during exercise by
‘central command’. � �e. presympathetic neurons in the rostroventrolateral medulla are organized
topographically. � �f. spinal transection raises blood pressure, by interrupting the net
inhibition of spinal preganglionic sympathetic neurons by descending bulbospinal fibres. � �
16.10 The alerting response to sudden stress (fear–flight–fight response)a. involves the dilatation of resistance vessels in skeletal muscle. � �b. includes cutaneous venodilatation. � �c. causes a fall in blood pressure. � �d. involves a rise in heart rate. � �e. is organized by the limbic system and periaqueductal grey matter. � �f. is impaired in many patients with hypertension. � �
Cardiovascular receptors, reflexes and central control Questions 109
T F
Finally, here is a data interpretation problem.16.11 The regulation of heart rate and blood pressure at the onset of static exercise.
In a study of the human response to exercise, a subject was asked to squeeze an object in thehand with maximum voluntary force for 4 s.Within two heartbeats of starting the exercise,heart rate had increased from 68 min�1 to 80 min�1. Mean arterial pressure increased from98 to 110 mmHg by the end of the 4 s.Afferent input from the muscles of the arm was thenblocked by injections of local anaesthetic into the axillary and radial nerves, and the studyrepeated.The heart rate increased less, from 68 to 72 min�1 by the second beat; blood pressureincreased from 96 to 102 mmHg by the end of the 4 s effort.a. How could the heart rate be monitored so accurately that it was possibly to detect an
increase within two beats of starting the exercise?b. Which branch of the autonomic nervous system is more likely to account for a change in
heart rate in under 2 s?c. What can be inferred from the reduced cardiac response to static exercise after muscle
afferent block by local anaesthetic?d. What types of muscle receptor might mediate the exercise pressor response?e. Did afferent blockade completely block the tachycardia at the onset of exercise? How might
the result be interpreted?
110 Cardiovascular physiology Questions
Answers
16.1 a. T – Baroreceptors are spray endings that sense distension of the vessel wall (Figure 16.1,inset). If distension is prevented by a plaster cast, a rise in pressure does not stimulate thebaroreceptors. Normally, a rise in pressure distends the wall and increases firingfrequency (Figure 16.2a).
b. F – Peripheral chemoreceptors are located in the carotid and aortic bodies.Arterial baroreceptorsare located mainly in the walls of the carotid sinus and aortic arch (Figure 16.1).
c. T – Arterial baroreceptors respond to pulse amplitude as well as mean pressure(Figure 16.3b,c).
d. T – Baroreceptors trigger a negative feedback loop (Figure 16.4).The net effect of theloop is to reduce the fluctuation in arterial pressure (Figure 16.5a upper trace).
e. F – Afferent fibres from carotid sinus baroreceptors travel in the glossopharyngeal (ninth cranial)nerve.Aortic baroreceptor fibres travel in the vagus (tenth cranial nerve) (Figure 16.1).
16.2 a. T – Baroreceptors have a threshold below which they are silent.The threshold is typically�60 mmHg for A fibres and �100 mmHg for C fibres (Figure 16.3a).
b. T – Baroreceptors are dynamically sensitive, and are temporarily silenced as blood pressurefalls (Figure 16.2, fibre 2). Consequently, their firing pattern in response to thenormal, pulsatile arterial pressure is itself pulsatile (Figure 16.2, fibre 3).
c. F – ‘Pressor’ means ‘causes a rise in pressure’.The baroreflex is ‘depressor’, i.e. baroreceptoractivation causes a reflex depression of arterial blood pressure (Figure 8.16), via thepathways in Figures 16.4.
d. F – Baroreceptor stimulation causes a reflex bradycardia (Figure 8.16 and 6.21).e. T – There is reflex fall in sympathetic vasomotor activity (Figure 6.21).This reduces total
peripheral resistance, which helps bring a raised blood pressure back down to normal.f. F – The baroreflex reduces cardiac sympathetic nerve activity (Figure 6.21).This lowers
cardiac contractility and heart rate.
16.3 a. F – The baroreflex is an example of negative feedback, i.e. a rise in the sensed variable(blood pressure) causes changes in motor fibre output that lower the sensed variable(Figure 16.4).
b. T – There is a reflex fall in sympathetic activity and rise in cardiac vagal inhibition(Figure 6.21).This lowers the blood pressure (Figures 8.16 and 16.3c).
c. T – Blood pressure in the carotid sinus falls on standing, because the sinus is above heartlevel (effect of gravity, Figure 8.3).Also arterial pulse pressure falls on standing, due tovenous ‘pooling’ in the lower limbs, reducing cardiac filling pressure and hence strokevolume.The resulting unloading of baroreceptors, especially in the carotid sinus, triggersthe reflex tachycardia.
d. F – The baroreflex is reset to operate at a moderately higher pressures during exercise(Figure 16.6).This helps stabilize the raised blood pressure during exercise.
e. T – Massaging the carotid sinus, which is located just under the angle of the jaw, stimulatesthe sinus baroreceptors.The resulting reflex can sometimes arrest a supraventriculartachycardia.
16.4 a. T – Cardiac sympathetic activity is reflexly increased, and cardiac parasympathetic activity isreduced.This boosts heart rate and contractility. So haemorrhage evokes a tachycardia(Figure 8.11).
Cardiovascular receptors, reflexes and central control Answers 111
b. T – A reflex rise in sympathetic vasomotor activity promotes contraction of peripheralresistance vessels, raising peripheral resistance.This helps preserve the mean arterialpressure (Figure 8.11).
c. T – There is a reflex increase in sympathetic venomotor activity (Figure 8.11).The centralvenous pressure (CVP) is an important determinant of stroke volume (Starling’s law ofthe heart).
d. T – The sympathetic-mediated constriction of precapillary resistance vessels, along with thefall in venous pressure, reduces capillary pressure (Figure 11.7).This allows plasmacolloid osmotic pressure to predominate for a while (Figure 11.4b), causing theabsorption of interstitial fluid (Figure 8.11).
e. F – Baroreceptor unloading activates renin secretion (Figure 14.7).This leads to highercirculating levels of the vasoconstrictor peptide angiotensin II and the salt-retainingsteroid aldosterone.
f. T – Reflex vasopressin secretion causes renal anti-diuresis, and also helps raises peripheralresistance via its vasoconstrictor action (Figure 14.6).
16.5 a. F – These unmyelinated afferents travel in the vagus (Figure 16.7) and cause a depressorreflex, similar to the baroreflex. Being mechanoreceptors, they do not sense ischaemia.
b. T – Myelinated atrial afferents signal atrial distension and contraction (Figure 16.7).Theevoked reflex (tachycardia, diuresis) helps prevent over-distension.These receptors mayalso contribute to reflex peripheral vasodilatation when human CVP is raised.
c. T – These unmyelinated afferents travel with the cardiac sympathetic nerves to the spinalcord, then up the spinothalamic tract (Figure 16.7).They are stimulated by manysubstances released by ischaemic myocardium (bradykinin, K�, acid, prostaglandins,20-HETE) and thus mediate the pain of both angina and heart attack.
d. F – All cardiovascular afferents relay in the nucleus tractus solitarius of the brainstem(Figure 16.8).
16.6 a. T – An increase in extracellular fluid volume raises plasma volume and therefore cardiacfilling pressure, which stimulates venoatrial receptors.A large increase in filling pressuretends to raise the stroke volume (Starling’s law) and pulse pressure, thus stimulatingarterial baroreceptors too.
b. F – An increase in plasma volume elicits a reflex vasodilatation, which helps lower thevascular pressures.
c. T – An inhibitory synapse in the central relay pathway (nucleus tractus solitarius via thecaudal ventrolateral medulla to the magnocellular neurons) reduces vasopressin secretionwhen extracellular fluid (ECF) volume increases (Figure 14.6).
d. T – Atrial natriuretic peptide (ANP)-secreting atrial myocytes respond directly to stretch.e. F – The renin-secreting juxtaglomerular cells of the renal afferent arteriole are inhibited by
a rise in arterial pressure and tubular NaCl load, and by reduced sympathetic activity(Figure 14.7).The resulting fall in circulating aldosterone concentration promotesnatriuresis and diuresis.
16.7 a. T – Denervation of the arterial baroreceptors alone raises blood pressure a little; butdenervation of the baroreceptors and cardiopulmonary receptors raises blood pressuremarkedly (Figure 16.5b).
b. T – Plasma is part of the extracellular fluid compartment.A rise in plasma volume raises thecardiac filling pressure, which raises stroke volume through the Frank–Starlingmechanism.This raises arterial blood pressure.
112 Cardiovascular physiology Answers
c. T – In the long term the mean blood pressure is proportional to body water mass, which isdirectly proportional to body salt mass (Figure 16.9). Renal salt handling is crucial,therefore, to the long-term regulation of blood pressure.
d. T – The salt-to-water ratio determines extracellular fluid osmolarity, which is sensedby central osmoreceptors that regulate vasopressin (ADH) secretion (Figure 14.6).If body salt mass rises, the temporary increase in osmolarity cause ADH secretion andhence renal water retention, until water mass increases sufficiently to restore normalosmolarity.
e. F – The kidneys secrete the hormone erythropoietin, which stimulates red cell productionand release by the bone marrow.
16.8 a. F – Carotid body and aortic body chemoreceptors are excited by hypoxia and hypercapnia(asphyxia), but they cause a reflex peripheral vasoconstriction.This ‘pressor’ reflex helpsmaintain the arterial blood pressure perfusing the brain during asphyxia.
b. T – The lung inflation reflex contributes to sinus arrhythmia and the tachycardia ofasphyxia.
c. T – Group III muscle mechanoreceptors contribute to the very rapid increase in heart rateat the onset of exercise.
d. T – Group IV muscle metaboreceptors are stimulated by K� ions, lactic acid and otheragents in under-perfused muscle.Their afferent input reflexly raises sympatheticvasomotor and cardiac activity, contributing to the exercise pressor response(Figure 16.10).This reflex is especially strong in isometrically contracting muscle.
e. F – Facial cold receptors reflexly increase cardiac vagal activity, causing a marked bradycardia.This is part of the diving reflex; facial submersion in cold water greatly slows the humanheart, and that of diving mammals even more so.
16.9 a. T – When the inputs from several sources converge on one neuron (e.g. a baroreceptorinput and a venoatrial receptor input), the output of the neuron depends on thecombined input.This is called sensory integration.
b. F – Sinus arrhythmia is a regular tachycardia associated with inspiration (Figure 4.3a).This is largely due to an inhibitory projection from the inspiratory neurons to the vagalmotorneurons (Figure 16.11).The tachycardia helps compensate for the fall in leftventricle stroke volume during inspiration, caused by reduced venous return into theleft heart as the pulmonary circulation expands.
c. T – The parvocellular neurons of the hypothalamic paraventricular nucleus and depressorarea receive a projection from the nucleus tractus solitarius, and send projections to themedullary presympathetic vasomotor neurons (Figure 16.12).
d. T – Central command, along with the muscle mechanoreceptor reflex, accounts for the veryrapid increase in heart rate on starting exercise (Figure 16.12).
e. T – The most rostral part of the ventral vasopressor area controls renal sympathetic outflow;other zones control limb sympathetic outflow.This enables discrete control ofsympathetic outflow – outflow can increase to one tissue and at the same time decreaseto another tissue, e.g. during the alerting response.
f. F – There are both inhibitory and excitatory descending fibres, but the net bulbospinaldrive is excitatory (Figure 16.8). Spinal transection thus reduces peripheral sympatheticvasomotor activity and causes hypotension.
Cardiovascular receptors, reflexes and central control Answers 113
16.10 a. T – The increase in muscle blood flow anticipates fight or flight.b. F – The alerting response evokes cutaneous venoconstriction (‘startle’ response, Figure 6.15).
We grow pale with fear.c. F – Blood pressure rises.This is important for doctors to recognize; a tense patient will have
a raised blood pressure – ‘white coat hypertension’.d. T – The alerting tachycardia is evident in question 14.12, which describes a human study.e. T – The central long axis (amygdala of limbic system, perifornical hypothalamus and the
periaqueductal grey matter) generate this co-ordinated, stereotyped alerting responses(Figure 16.12).The output of the central long axis modulates the nucleus tractussolitarius, cardiac vagal motor neurons (Figure 16.11) and rostral vasopressor neuronsto produce the characteristic cardiac and vasomotor changes.
f. F – Hypertensive subjects often show an exaggerated rise in blood pressure in response tostress, as do their offspring.This may contribute to the establishment of chronichypertension.
16.11 a. Beat-by-beat heart rate can be obtained from a continuous ECG recording, by measuringeach R–R interval.Alternatively, a continuous recording of the pulse, based on an earoximeter or finger/wrist monitor, could be used to measure the beat-to-beat interval.
b. The extreme rapidity of the change in heart rate is typical of a disinhibition of thepacemaker by reduced vagal activity.The effect of the vagal parasympathetic fibres on heartis very quick (Figure 4.2), whereas the effect of increased sympathetic drive is of sloweronset (Figure 4.6).
c. The results indicate that afferent information from the contracting muscles contributes to areflex that raises heart rate and blood pressure during static exercise. In other words, thereare work receptors in skeletal muscle that help drive appropriate cardiac changes duringexercise (Figure 16.4).
d. Muscle work receptors (ergoreceptors) are of two kinds – mechanosensitive group IIIafferents and chemosensitive group IV afferents. Muscle mechanoreceptors reflexly inhibitvagal tone, so they probably account for the almost immediate change in heart rate. Musclechemosensitive afferents (metaboreceptors) are important contributors to the developingpressor response (Figure 16.10).
e. No.The most likely factor driving the persistent albeit lesser tachycardia is ‘centralcommand’, i.e. a signal from the motor areas of the brain to the cardiovascular autonomiccentres in the lower brain (Figure 16.12).
114 Cardiovascular physiology Answers
T F17.1 When a healthy subject moves from a supine to a standing position,
a. gravity causes a backflow of venous blood into the legs, leading to venous pooling. � �
b. the jugular veins in the neck collapse. � �c. the central venous pressure (CVP) increases. � �d. there is a sustained fall in arterial pulse pressure. � �e. the circulating blood volume decreases slowly. � �
17.2 On standing up,a. carotid sinus baroreceptor activity declines. � �b. peripheral resistance falls. � �c. the heart rate falls. � �d. mean arterial pressure dips (transient hypotension). � �e. mean arterial pressure in the steady state is higher than the supine value. � �f. postural dizziness can be treated with the α-blocker phentolamine. � �
17.3 Forced expiration against a closed glottis, e.g. during childbirth, elicitsa. an instantaneous rise in arterial blood pressure on starting the manoeuvre. � �b. a sustained increase in right ventricle stroke volume. � �c. an increase in aortic pulse pressure. � �d. a transient increase in venous return on ceasing the manoeuvre. � �e. a temporary slowing of the heart on ceasing the manoeuvre. � �
17.4 During upright, dynamic exercise, such as running or cycling,a. O2 uptake from the alveolar gas increases as pulmonary blood flow increases. � �b. cardiac output is increased mainly through a rise in stroke volume. � �c. cardiac β1-adrenoceptors are stimulated. � �d. the end-diastolic volume of the ventricles is increased. � �e. the end-systolic volume of the ventricles is increased. � �f. heart rate is raised quickly at the onset of exercise via reduced vagal activity. � �
17.5 The cardiovascular changes during exercise includea. a fall in gastrointestinal blood flow. � �b. a rise in renal blood flow. � �c. a rise in active muscle blood flow caused chiefly by the rise in blood pressure. � �d. a greater rise in systolic blood pressure than diastolic pressure. � �e. a rise in total peripheral resistance. � �f. a greater increase in stroke volume during supine than upright exercise. � �g. a greater increase in blood pressure during static than dynamic exercise. � �
CHAPTER 17
Co-ordinated cardiovascularresponses
17.6 In the microcirculation of exercising skeletal muscle,a. O2 transfer is enhanced by capillary recruitment. � �b. the average O2 concentration in the capillary in increased, relative to rest,
due to the increased blood flow. � �c. CO2 removal is enhanced by a fall in diffusion distance. � �d. glucose transfer is enhanced by active transport across the endothelium. � �e. glucose transfer is enhanced by a fall in interstitial glucose concentration. � �f. increased capillary fluid filtration can reduce the circulating plasma volume. � �
17.7 The cardiovascular adjustments during exercise can be initiated partly bya. central command by the cerebral cortex. � �b. central resetting of the baroreflex to a lower operating point. � �c. feedforward from muscle metaboreceptors. � �d. feedforward by the alerting response. � �e. a rise in circulating catecholamines in cardiac transplant patients. � �
For additional questions on exercise, see questions 13.5, 13.9, 13.10 and 15.9.
17.8 Dynamic, endurance training leads toa. a rise in resting stroke volume. � �b. a rise in resting heart rate. � �c. a rise in maximum heart rate. � �d. a rise in maximal O2 transport capacity, V·O2max
. � �e. a fall in blood volume. � �f. angiogenesis in the trained muscle groups. � �
17.9 The cardiovascular changes after a substantial meal include:a. an increase in gastrointestinal mucosal blood flow. � �b. an increase in cardiac output by �20%. � �c. a fall in blood flow to the limbs. � �d. a fall in vagal parasympathetic drive to pancreatic blood vessels. � �e. postprandial hypertension in patients with autonomic dysfunction. � �
17.10 Breath-hold immersion of the face in cold water evokesa. a rise in heart rate. � �b. a fall in limb blood flow due to peripheral vasoconstriction. � �c. a fall in arterial chemoreceptor activity. � �d. a reflex mediated by trigeminal nerve receptors. � �
17.11 The cardiovascular changes associated with normal ageing includea. arteriosclerosis, which is primarily an intimal accumulation of cholesterol. � �b. increased stiffness of the elastic arteries. � �c. a greater rise in diastolic blood pressure than systolic pressure. � �d. a rise in mean blood pressure due to an increase in total peripheral
resistance. � �e. a fall in the maximum heart rate during exercise. � �f. increased responsiveness of the myocardium to β-adrenoceptor stimulation. � �
116 Cardiovascular physiology Questions
T F
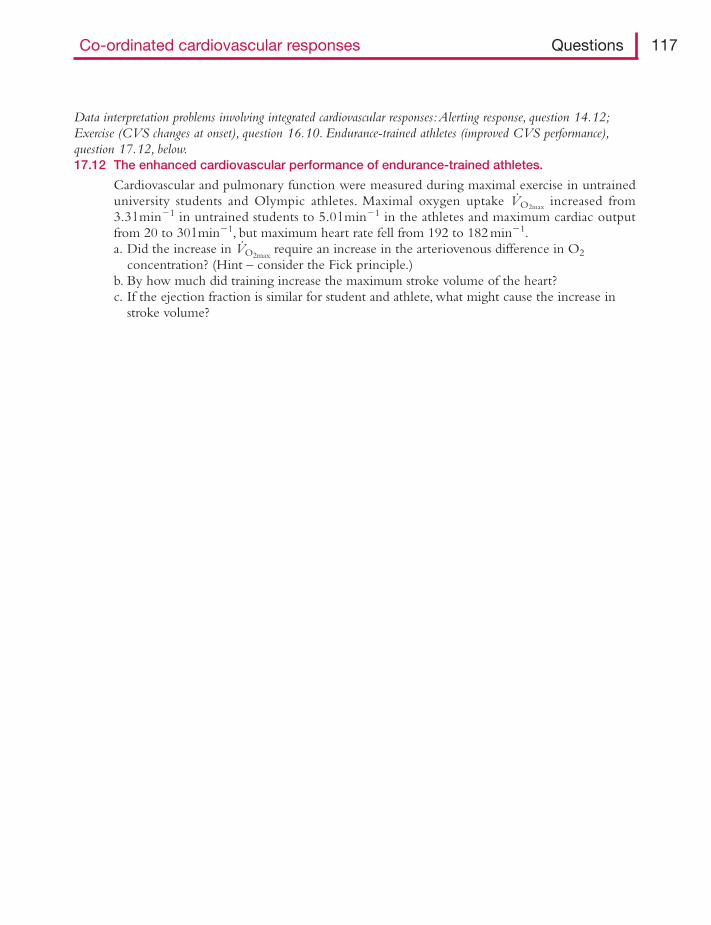
Data interpretation problems involving integrated cardiovascular responses:Alerting response, question 14.12;Exercise (CVS changes at onset), question 16.10. Endurance-trained athletes (improved CVS performance),question 17.12, below.17.12 The enhanced cardiovascular performance of endurance-trained athletes.
Cardiovascular and pulmonary function were measured during maximal exercise in untraineduniversity students and Olympic athletes. Maximal oxygen uptake V· O2max
increased from3.3 l min�1 in untrained students to 5.0 l min�1 in the athletes and maximum cardiac outputfrom 20 to 30 l min�1, but maximum heart rate fell from 192 to 182 min�1.a. Did the increase in V·O2max
require an increase in the arteriovenous difference in O2concentration? (Hint – consider the Fick principle.)
b. By how much did training increase the maximum stroke volume of the heart?c. If the ejection fraction is similar for student and athlete, what might cause the increase in
stroke volume?
Co-ordinated cardiovascular responses Questions 117
Answers
17.1 a. F – Semilunar valves in peripheral veins prevent any substantial reversal of flow, as wasshown by William Harvey almost 400 years ago.The venous ‘pooling’ is caused bythe gravity-induced rise in venous pressure (Figure 8.3).This distends the veins(Figure 6.9); but the ‘pooled’ blood reaches the veins by forward flow from thecapillaries, as usual.
b. T – Venous pressure above heart level falls, due to the effect of gravity (Figure 8.3).The fallin transmural pressure causes the jugular veins to collapse (Figures 6.9 and 8.24).
c. F – CVP falls, because the peripheral venous pooling reduces the intrathoracic bloodvolume (Figure 6.9).
d. T – The fall in CVP, acting via Starling s law of the heart, reduces stroke volume by �40%(Figure 17.1).This in turn reduces the pulse pressure (Figure 7.2).
e. T – Capillary pressure is greatly increased in the tissues below heart level (Figure 11.6).This raises the capillary filtration rate, which reduces the plasma volume by �12% overhalf an hour.
17.2 a. T – The carotid sinus is located well above heart level during orthostasis, so its transmuralpressure falls (Figure 8.3).Also, the pulse pressure falls on standing (Figure 17.1) andbaroreceptors are sensitive to pulse pressure (Figure 16.3).
b. F – Total peripheral resistance increases by 30–40% on standing (Figure 17.1).The resistance increase is brought about by a baroreflex-mediated increase in sympatheticvasomotor activity to the resistance vessels of muscle, splanchnic and renal circulations(Figure 17.2).This helps to maintain arterial blood pressure: BP � total peripheralresistance (raised) � cardiac output (reduced).
c. F – The baroreflex elicits tachycardia during orthostasis (Figures 17.1 and 17.2).d. T – The fall in stroke volume reduces arterial pressure transiently, before the reflex
tachycardia and peripheral vasoconstriction have had time to kick in.This sometimescauses transient dizziness on standing (postural hypotension), even in healthy people.
e. T – There is a sustained fall in carotid sinus and venoatrial receptors inputs (Figure 17.2).This evokes a sustained reflex elevation of mean arterial pressure during standing(Figure 17.1).
f. F – Postural hypotension is in fact a major side-effect of α-blockers; they prevent thecompensatory rise in peripheral resistance, by blocking the effect of increasedsympathetic vasomotor activity.
17.3 a. T – Forced expiration against a closed glottis is the Valsalva manoeuvre. In phase 1, theimmediate rise in intrathoracic pressure squeezes the aorta, raising arterial pressure(Figure 17.3a).
b. F – The rise in intrathoracic pressure squeezes the thoracic veins too, which impedesvenous return; so right and left ventricular stroke volumes fall.
c. F – The fall in stroke volume (see above) reduces the pulse pressure (Figure 17.3a).d. T – The pent up peripheral venous blood surges into the right ventricle as soon as
intrathoracic pressure is reduced.e. T – The increase in stroke volume resulting from the sudden increase in cardiac filling
(Starling’s law) raises the pulse pressure, which evokes a baroreflex bradycardia(phase 4, Figure 17.3a).This response is used to test autonomic function.
118 Cardiovascular physiology Answers
17.4 a. T – The relation between O2 uptake and pulmonary blood flow is shown in Figure 17.4.The Fick principle tells us that O2 uptake � blood flow � arteriovenous difference in O2concentration. Pulmonary O2 uptake is an example of flow-limited exchange (Figure 10.6,points 1, 2).
b. F – The tachycardia make a greater contribution than the increase in stroke volume(Table 17.1).
c. T – Increased cardiac sympathetic activity stimulates β1-adrenoceptors on the pacemaker,AV node and myocardium (Figure 4.1).The activated β1-adrenoceptors raiseintracellular cAMP, leading to increases in heart rate and contractility (Figure 3.14,upper panel).
d. T – During upright exercise the venous muscle pump, along with sympathetic-mediatedvenoconstriction in the splanchnic and other circulations, raise central venous pressuremoderately, distending the ventricle in diastole (Figure 6.10 and Table 17.1).Thisincreases stroke volume through the Frank–Starling mechanism.
e. F – A rise in ventricular contractility increases the ejection fraction and thus reduces theend-systolic volume.The heart becomes bigger at the end of diastole and smaller at theend of systole (Figure 6.10 and Table 17.1).
f. T – Parasympathetic fibres alter the heart rate more rapidly than sympathetic fibres(compare Figures 4.2 and 4.6,).This is because the acetylcholine–hyperpolarizationpathway is very direct (Figure 3.14, lower panel). Central command and musclemechanoreceptors trigger the sudden reduction of vagal cardiac motorneuron activity.
17.5 a. T – There is sympathetic-mediated vasoconstriction of inactive circulations (Figure 13.10).This helps stabilize arterial blood pressure in the face of the huge fall in vascularresistance in the exercising muscles.
b. F – There is sympathetic-mediated renal vasoconstriction (Figurer 13.10).As withgastrointestinal vasoconstriction, this helps stabilize arterial blood pressure by partiallyoffsetting the massive fall in resistance in the exercising muscle.
c. F – Most of the increase in muscle blood flow during dynamic exercise is caused by thereduced resistance to flow through the dilated arterioles of the active muscle (metabolicvasodilatation). In Figure 13.10, muscle blood flow increases approximately eight-fold,yet blood pressure increases only �1.2-fold (Figure 6.22). Since flow � pressuredifference/resistance, most of the increase in flow is clearly due to a fall in muscle vascularresistance.
d. T – Systolic pressure increases more than diastolic (Figure 6.22).This is because strokevolume and ejection velocity increase, raising the pulse pressure.
e. F – Total peripheral resistance (TPR) falls (Figure 6.22).This is because musclevasodilatation outweighs the vasoconstriction in other tissues. Blood pressure does notfall, despite the fall in TPR, because cardiac output rises: BP � cardiac output � TPR.
f. F – Central venous pressure and therefore stroke volume are already high at rest in thesupine position.There is more scope to raise the stroke volume when starting from therelatively low stroke volume of the upright position (Table 17.2).
g. T – Static, isometric exercise causes big increases in blood pressure (Figure 8.15), so isinadvisable for patients with ischaemic heart disease.The rise in pressure is due partly tothe exercise pressor reflex from muscle metaboreceptors (Figure 16.10), and partly tocentral command.
Co-ordinated cardiovascular responses Answers 119
17.6 a. T – Metabolic vasodilatation of the arterioles improves the uniformity of capillary perfusion(capillary recruitment, Figure 10.7).This boosts two factors affecting diffusion –surface area (number of capillaries perfused) and diffusion distance (Fick’s law ofdiffusion, Figure 10.4).
b. F – Mean capillary O2 concentration actually falls during exercise, despite the increaseddelivery (flow), because O2 extraction increases relatively more than the blood flow.However, without the rise in blood flow, the O2 level would fall catastrophically.
c. T – Capillary recruitment boosts CO2 uptake by the same mechanisms as boost O2 transfer(Figure 10.7).
d. F – Glucose diffuses passively out of the capillaries of skeletal muscle via the intercellularclefts (Figure 9.6).
e. T – Increased muscle consumption of glucose lowers its interstitial concentration, whichincreases the concentration gradients for diffusion.A fall in local venous glucose duringexercise reflects the fall in interstitial glucose (Figure 10.8).
f. T – Arteriolar vasodilatation raises capillary pressure (Figure 11.7); also, interstitialosmolarity increases.These forces raise the capillary filtration rate. Plasma volume canfall by over 0.5 litre during heavy, prolonged exercise, reducing the cardiac fillingpressure.
17.7 a. T – Attempts to exercise muscles paralysed by curare lead to tachycardia, a rise in bloodpressure and baroreflex resetting (Figure 16.6).
b. F – The baroreflex is reset to operate at a higher pressure during exercise (Figure 16.6).c. F – Muscle metaboreceptors are activated by the metabolic changes within the exercising
muscle, which take a little time to develop; so metaboreceptors provide feedback onmuscle metabolic status, not feedforward control (changes in anticipation of an event)(Figure 16.4).
d. T – If exercise has an emotional component (e.g. start of a race), the alerting responseincreases heart rate and muscle perfusion in anticipation of action.The alerting responseis mediated by the central long axis (amygdala, hypothalamus, periaqueductal grey)(Figure 16.12).
e. T – Circulating adrenaline and noradrenaline increase �10-fold during exercise, stimulatingcardiac β-adrenoceptors on the transplanted, denervated heart. Greyhounds withdenervated hearts can still increase their heart rates to 250 min�1 on the racetrack, butnot when the effect of adrenaline is blocked by β-blockers.
17.8 a. T – The cardiac myocytes are lengthened by the addition of sarcomeres in series.Thisenlarges the ventricular cavity (eccentric hypertrophy) and increases the resting strokevolume by up to 50%.
b. F – Increased vagal tone causes a resting bradycardia.This offsets the effect of the increasedresting stroke volume, so that the cardiac output remains normal at rest.
c. F – Maximum heart rate is not increased by training.d. T – V·O2max
is increased by an increase in maximal cardiac output, which results from thebigger stroke volume.
e. F – There is a small increase in blood volume, to match the increased resting ventricle size.f. T – Without the formation of additional capillaries, the hypertrophy of the skeletal muscle
fibres would increase the diffusion distance from capillary to muscle, making transportby diffusion less efficient.Also, arteriolar angiogenesis increases the muscle’s maximalperfusion capacity.
120 Cardiovascular physiology Answers
17.9 a. T – Mucosal hyperaemia is evoked by local gastrointestinal hormones (gastrin,cholecystokinin), digestion products (glucose and fatty acids) and vagal cholinergicparasympathetic fibres.
b. T – Postprandial tachycardia raises the cardiac output, to supply the hyperaemic mucosa andpancreas.
c. T – Reflex sympathetic vasoconstriction of limb resistance vessels helps to maintain totalperipheral resistance, and hence blood pressure, despite the fall in splanchnic vascularresistance.
d. F – The firing of parasympathetic fibres in the vagus increases, to induce pancreaticvasodilatation.This is necessary to supply the large volume of liquid secreted by thepancreas.The pancreatic parasympathetic vasodilator transmitter is mainly VIP(vasoactive intestinal polypeptide).
e. F – Some elderly subjects and diabetics with poor autonomic function develop postprandialhypotension, due to a failure of the autonomic-mediated tachycardia and peripheralvasoconstriction that normally maintain blood pressure after a meal.
17.10 a. F – The diving response evokes a marked vagal bradycardia (Figures 17.5).This cansometimes terminate a pathological supraventricular tachycardia.The response is verypronounced in seals, whales and diving birds.
b. T – Muscle perfusion is reduced by sympathetic vasoconstriction (Figure 17.5, inset).Thismaintains blood pressure (hence myocardial and cerebral perfusion) despite the markedvagal bradycardia.
c. F – The growing arterial hypoxaemia and hypercapnia stimulate the arterialchemoreceptors in the carotid and aortic bodies.The arterial chemoreflex contributesto the sympathetic-mediated peripheral vasoconstriction.
d. T – Cold receptors around the eyes, nose and nasal mucosa send afferent information alongthe trigeminal nerve to initiate the reflex apnoea, bradycardia and peripheralvasoconstriction.These changes conserve the O2 store for use by the brain.
17.11 a. F – Arteriosclerosis is indeed the primary arterial change with ageing, but it is quitedifferent from atheroma.Atheroma (atherosclerosis) is primarily a subendothelialdeposition of cholesterol.Arteriosclerosis is a stiffening of the tunica media (not intima)due to fibrosis (collagen), with loss of intact elastin and lumen dilatation (notnarrowing).
b. T – Arteriosclerosis increases the stiffness of the major arteries (elastance, 1/compliance).This increases the pulse pressure and hence systolic pressure, just as in hypertension(Figure 8.10). Faster return of the reflected pressure wave in the stiffened arteriesfurther augments the systolic pressure (Figure 8.12).
c. F – Systolic pressure increases much more than diastolic (Figure 8.14), due to a markedincrease in the pulse pressure, which results from the increased stiffness of the elasticarteries.The raised systolic pressure (afterload on the left ventricle) raises cardiac O2demand.
d. T – Mean blood pressure increases moderately (Figure 8.14), due partly to an increase insympathetic vasomotor activity with age.
e. T – Maximum cardiac output falls with age, due partly to a fall in the maximum attainableheart rate.As a rough rule, maximum rate � 220 min�1 � age in years.
f. F – The responsiveness of pacemaker and myocardium to β-adrenoceptor stimulationdecreases with age, so the ability to raise the ejection fraction and heart rate declines.
Co-ordinated cardiovascular responses Answers 121
17.12 a. From the Fick principle, oxygen uptake � cardiac output � arteriovenous concentration difference.The increase in O2 transport, 1.5-fold, can be explained fully by the increase in maximalcardiac output, which was likewise 1.5-fold.Therefore, the data provide no evidence forchanges in blood gas values between students and athletes.
b. Since cardiac output � heart rate � stroke volume, the maximum stroke volume was 104 mlin the students and 165 ml in the athletes – a 1.58-fold increase (61 ml).
c. If the ejection fraction has not increased, the volume of blood in the ventricle duringdiastole must have increased, raising the volume available for ejection.This is brought aboutby enlargement of the ventricular cavity as a result of training (eccentric hypertrophy).
122 Cardiovascular physiology Answers
T F18.1 At high altitudes chronic arterial hypoxaemia causes
a. stimulation of arterial chemoreceptors. � �b. an increase in the arteriovenous O2 difference. � �c. depression of the cardiac output. � �d. peripheral vasodilatation. � �e. a fall in systemic arterial blood pressure. � �f. a fall in pulmonary arterial blood pressure. � �
18.2 A patient in clinical shock (acute circulatory failure), due to a severehaemorrhage, usually exhibitsa. a reduced central venous pressure. � �b. a low mean arterial pressure, but normal pulse pressure. � �c. a pronounced tachycardia. � �d. an increased cardiac output. � �e. a rise in total peripheral resistance. � �
18.3 In response to a severe haemorrhage,a. baroreceptor activity declines. � �b. arterial chemoreceptor activity declines. � �c. venoatrial mechanoreceptor activity declines. � �d. the skin is pale, cold and venoconstricted. � �e. the haematocrit remains normal. � �
18.4 The responses to hypovolaemia may includea. a fall in circulating noradrenaline and adrenaline concentration. � �b. a glucose-mediated rise in interstitial fluid osmolarity. � �c. a fall in circulating vasopressin level. � �d. a fall in urine production. � �e. thirst mediated by a rise in circulating natriuretic peptide. � �
18.5 When a person faints (syncope),a. the heart rate abruptly increases. � �b. the peripheral resistance increases sharply. � �c. the mean arterial pressure falls below 70 mmHg. � �d. cerebral blood flow is markedly reduced. � �e. the patient should not be kept upright. � �
CHAPTER 18
Cardiovascular responsesin pathological situations
18.6 Clinical hypertensiona. is a chronic rise in systemic arterial blood pressure sufficient to increase
morbidity and mortality. � �b. increases the incidence of heart attacks, but not strokes. � �c. is usually diagnosed when diastolic pressure consistently exceeds
90–95 mmHg or systolic pressure exceeds 140–160 mmHg. � �d. can be caused by renal artery dilatation. � �e. can be caused by adrenal cortex failure (Addison’s disease). � �f. is usually symptomless and without readily identifiable organic cause. � �
18.7 Arterial hypertension in humansa. is often associated with a high dietary salt intake. � �b. is very rare during pregnancy. � �c. is characterized by a reduction in the bore of proximal resistance arteries. � �d. is characterized by dilated, stiffened elastic arteries. � �e. is always associated with an increase in circulating angiotensin II. � �
18.8 In a patient with established essential hypertension,a. the total peripheral resistance is raised, but the cardiac output is normal. � �b. systolic pressure and diastolic pressures increase by about the same amount. � �c. increased wave reflection contributes to the systolic hypertension. � �d. an increase in cardiac work causes left ventricular dilatation. � �e. the baroreflex remains functional around a higher set point. � �
18.9 In the treatment of essential hypertension,a. a reduction in dietary salt intake is not yet of proven efficacy. � �b. thiazide diuretics are a common initial treatment. � �c. Beta-adrenoceptor blockers reduce the sympathetic activation of renin
secretion. � �d. angiotensin converting enzyme (ACE) inhibitors aggravate left ventricular
hypertrophy. � �e. nifedipine reduces total peripheral resistance. � �
18.10 Chronic left ventricular failure isa. a reduced left ventricular stroke volume in a resting subject. � �b. an abnormal reduction in ventricular myocyte contractility. � �c. a steeper relation between stroke work and end-diastolic pressure. � �d. associated with a cardiothoracic ratio of less than 0.5. � �
18.11 In left ventricular failure,a. pulmonary venous pressure decreases. � �b. the compliance of the lungs is increased. � �c. dyspnoea is often relieved by lying down. � �d. pulmonary capillary pressure is reduced. � �e. crackles (crepitations) are audible during basal lung auscultation. � �
124 Cardiovascular physiology Questions
T F
18.12 Failure of the right ventricle can lead toa. visible distension of the jugular veins during orthostasis. � �b. facial oedema. � �c. pitting oedema of the lower leg. � �d. a right ventricular ejection fraction of �66%. � �e. hepatomegaly. � �
18.13 In a chronically failing ventricle the cardiac myocyte exhibitsa. an increased systolic Ca2� transient. � �b. increased expression of the Na�–Ca2� exchanger. � �c. increased expression of K� channels. � �d. increased proneness to delayed after-depolarization (DAD). � �e. prolonged action potentials. � �
18.14 In patients with biventricular chronic cardiac failure,a. the incidence of cardiac arrhythmia is markedly raised. � �b. there is rapid skeletal muscle fatigue during moderate physical exercise. � �c. ventricular dilatation increases the mechanical efficiency of contraction. � �d. the afterload may depress stroke volume more than in a normal heart. � �
18.15 In the systemic circulation of patients in heart failure,a. there is marked vasodilatation of peripheral resistance vessels. � �b. arterial blood pressure is often in the normal range. � �c. the pulse rate increases normally during exercise. � �d. there is marked peripheral venoconstriction. � �
18.16 The following are raised in a patient in chronic cardiac failure:a. peripheral and cardiac sympathetic nerve activity. � �b. circulating catecholamines. � �c. circulating angiotensin II. � �d. circulating endothelin. � �e. circulating brain natriuretic peptide (BNP). � �
18.17 The renal response to chronic cardiac failure includesa. reduced salt and water retention. � �b. reduced activation of the renin–angiotensin–aldosterone system. � �c. pronounced renal vasoconstriction. � �d. expansion of the extracellular fluid volume. � �
18.18 Some of the physiological objectives, when treating chronic heart failure, are toa. reduce myocardial O2 demand. � �b. raise arterial blood pressure. � �c. reduce the radius of curvature of the ventricle. � �d. boost the plasma volume. � �e. reduce the inotropic state of the heart. � �
Cardiovascular responses in pathological situations Questions 125
T F
18.19 The pharmacological treatment of heart failure often involvesa. angiotensin converting enzyme (ACE) inhibitors. � �b. potassium-losing diuretics. � �c. inhibition of renin production by spironolactone. � �d. peripheral vasodilators. � �e. Beta-adrenoceptor blockers. � �
18.20 Digoxina. inhibits the cardiac myocyte Ca2� pump. � �b. increases the size of the myocyte systolic Ca2� transient. � �c. causes a tachycardia. � �d. increases the risk of ventricular arrhythmia. � �e. toxicity is enhanced by hyperkalaemia. � �
126 Cardiovascular physiology Questions
T F
Answers
18.1 a. T – Hypoxaemia is detected by carotid and aortic body chemoreceptors (Figure 16.1).They drive a reflex increase in breathing.
b. F – Arterial PO2 falls, so there is a smaller diffusion gradient from blood to tissue.Consequently, the amount of O2 diffusing out of each unit volume of blood is reduced.
c. F – Heart rate and cardiac output increase (Figure 18.1).This helps to maintain a normalO2 delivery to the tissues despite the fall in arterial O2 content (Fick’s principle).
d. T – Hypoxia causes vasodilatation of systemic resistance vessels (Figure 13.7).This reducesperipheral resistance and facilitates the increases in local blood flow and O2 delivery(Figure 18.1).
e. T – Peripheral vasodilatation outweighs the effect of the raised cardiac output, so systemicarterial pressure falls (Figure 18.1): mean systemic arterial pressure � cardiac output �total peripheral resistance.
f. F – Hypoxia causes pulmonary arterial hypertension, due to hypoxic pulmonaryvasoconstriction (Figure 15.13) – the opposite of hypoxic systemic vasodilatation.Thisis reflected in the high pulmonary perfusion pressure for a given cardiac output at highaltitude (Figure 15.14). Eventually, right ventricular failure can develop.
18.2 a. T – Hypovolaemia (low blood volume) lowers CVP, because most of the circulating blood isin the venous system.
b. F – The fall in cardiac filling pressure reduces stroke volume, and therefore pulse pressure(Figure 8.11).The mean pressure may be normal, due to compensatory reflexes.
c. T – Reduced arterial baroreceptor and venoatrial stretch receptor traffic elicits a reflextachycardia (Figure 8.11).This partially compensates for the fall in stroke volume.
d. F – Cardiac output falls, because the fall in stroke volume outweighs the increase in heart rate –as during orthostasis, where there is a loss of central blood into the legs (Figure 17.1).
e. T – A reflex increase in sympathetic vasoconstrictor activity raises systemic resistance, exceptin the heart and brain (Figure 8.11).This helps maintain mean arterial blood pressure.
18.3 a. T – The fall in pulse pressure reduces baroreceptor traffic, even if mean arterial pressure doesnot fall (compensated haemorrhage).
b. F – Poor peripheral perfusion causes lactic acidosis.The fall in blood pH stimulates arterialchemoreceptors – hence the rapid breathing associated with clinical shock.
c. T – Atrial blood volume falls as cardiac filling pressure falls.Venoatrial receptors arenormally stimulated by atrial distension (Figure 16.7).
d. T – A reflex increases in sympathetic vasomotor activity and in circulating vasoconstrictorhormones (noradrenaline, adrenaline, angiotensin II, vasopressin) constricts the skinveins (causing pallor) and resistance vessels (reducing perfusion, hence the cold skin).
e. F – The haematocrit falls within 15–30 min, because the fall in capillary pressure allows theosmotic absorption of interstitial fluid into the circulation – the ‘internal transfusion’(Figure 8.11).
18.4 a. F – Plasma catecholamine concentration increases.This contributes to the cutaneous pallor,generalized venoconstriction and hepatic glycogenolysis.
b. T – Extracellular fluid osmolarity can rise by 20 mOs, following the addition of glucose byhepatic glycogenolysis, which is driven by adrenaline.The rise in extracellularosmolarity draws water from the intracellular compartment to ‘top-up’ the extracellularcompartment and depleted plasma volume.
Cardiovascular responses in pathological situations Answers 127
c. F – The fall in baroreceptor and venoatrial receptor traffic disinhibits the vasopressin-secreting, hypothalamic magnocellular neurons (Figure 14.6).Vasopressin secretioncauses an anti-diuresis and peripheral vasoconstriction.
d. T – Fluid excretion is reduced, due to sympathetic-mediated renal vasoconstriction(reducing glomerular filtration rate), activation of the renin–angiotensin–aldosteronesystem (boosting distal tubular salt reabsorption), and vasopressin (anti-diuretichormone, boosting water reabsorption by the collecting ducts).
e. F – There is indeed intense thirst, but the thirst is stimulated by angiotensin II, acting onthe subfornicular organ of the hypothalamus (Figure 14.7).
18.5 a. F – There is profound bradycardia (Figure 4.7).This is due to the stimulation ofpacemaker muscarinic receptors by acetylcholine released from vagal parasympatheticterminals (Figures 4.2).
b. F – There is a sharp fall in peripheral resistance, caused by a peripheral vasodilatation.c. T – The peripheral vasodilatation and bradycardia sharply reduce the arterial blood pressure.d. T – The fall in arterial blood pressure reduces cerebral perfusion and O2 supply, causing a
rapid loss of consciousness.e. T – The collapsed, supine position raises central venous pressure, which boosts stroke
volume during the period of bradycardia.To raise the patient would exacerbate thealready low blood pressure.
18.6 a. T – Since the distribution of blood pressure in the population is unimodal, themorbidity/mortality criterion helps define what is ‘normal’ versus ‘raised’ and requiringtreatment.
b. F – Hypertension increases the incidence of strokes, retinal disease, renal failure, heartattacks and cardiac failure.
c. T – These are the levels above which morbidity and mortality increase substantially.Thelower values apply to someone under 50, the higher values to older patients.
d. F – A small proportion of cases are caused by renal artery stenosis.The low pressure beyondthe stenosis activates the renin–angiotensin–aldosterone system (Figure 14.7).Thiscauses salt and water retention, resulting in hypertension (Figure 16.9).
e. F – Adrenal cortical failure in Addison’s disease causes a lack of aldosterone, which causeshypotension. Excessive secretion of aldosterone by an adrenal cortex tumour (Conn’ssyndrome) is a rare cause of hypertension.
f. T – Most cases are detected through routine health checks, and show no obvious organiccause (e.g. renal artery stenosis, Conn’s syndrome, phaeochromocytoma).
18.7 a. T – Both epidemiological and interventional studies show that a high salt intake can lead tohypertension. Blood pressure is related to body water content, which is related to bodyNa� content (Figure 16.9).
b. F – Pre-eclamptic toxaemia (hypertension in late pregnancy) affects �1 in 20 pregnancies.c. T – The internal diameter is reduced by eutrophic inward remodelling, which increases
total peripheral resistance (Figure 18.2). Rarefaction (loss of vessels) also contributes tothe increased resistance.
d. T – Elastic arteries show elastin fragmentation, dilatation and increased wall stiffness, similarto the changes of ageing.The fall in compliance raises the pulse pressure (Figure 8.10)and the systolic augmentation by wave reflection (Figures 18.3 and 8.12).
e. F – Although some hypertensives show increased renin–angiotensin levels, others do not.
128 Cardiovascular physiology Answers
18.8 a. T – Total peripheral resistance (TPR) is raised, primarily by the narrowing of proximalresistance vessels (Figure 18.2). Cardiac output is normal in established hypertension,despite the increased cardiac work.
b. T – The pulse pressure is greatly increased by the increased stiffness of the dilated, elasticarteries (Figure 8.10). Consequently, systolic pressure increases considerably more thandiastolic (Figure 18.3).This increases cardiac work (area inside the ventricularpressure–volume loop).
c. T – The stiffer elastic artery wall conducts the pressure wave faster. Consequently, thereflected pressure wave returns earlier, during systole rather than diastole (Figure 8.12).This is called systolic augmentation (Figure 18.3).
d. F – The increase in cardiac work caused by the increased afterload (systolic hypertension)evokes concentric hypertrophy of the ventricle, with no increase in chamber diameter.Cardiac dilatation only occurs if cardiac failure develops.
e. T – Arterial pressure fluctuations are still buffered by the baroreflex, albeit at a higher meanpressure.
18.9 a. F – Reducing dietary intake to 5 g/day has been shown to lower arterial pressure by�4 mmHg.
b. T – Thiazide diuretics reduce extracellular salt and water mass.A fall in salt and water lowersblood pressure (Figure 16.9).Thiazide diuretics also have a mild vasodilator action.
c. T – Beta-blockers act on β-adrenoceptors on the renal juxtaglomerular apparatus, thusinhibiting sympathetic-driven renin secretion (Figure 14.7). Beta-blockers also reduceheart rate and contractility to lower pressure; mean arterial pressure � cardiac output �total peripheral resistance.
d. F – ACE inhibitors, such as captopril, reverse the left ventricular hypertrophy evoked byhypertension.Angiotensin II is thought to be one of the growth factors drivingventricular hypertrophy.
e. T – Inhibitors of peripheral L-type Ca2� channels lower the vascular myocyte intracellularCa2� concentration (Figure 12.4, upper panel).This reduces vascular tone andlowers total peripheral resistance.
18.10 a. F – Stroke volume at rest is often within the normal range in mild, compensated failure(Table 17.1 and Figure 18.5).This is due to the compensatory increase in contractileforce evoked by ventricular distension (Frank–Starling mechanism, Figure 18.4).
b. T – Contractility is force of contraction at a given degree of distension. Reducedcontractility is the primary feature of heart failure. (Figure 18.4).
c. F – The slope of this plot (the ventricular function curve, or Starling curve) represents thecontractility of the ventricle (Figure 6.11).The slope is reduced in heart failure(Figure 18.4).
d. F – A rise in filling pressure dilates the ventricles, raising the cardiothoracic ratio to 0.5(Figure 6.16).
18.11 a. F – Pulmonary venous pressure, the filling pressure for the left side of the heart, is raised(Figure 18.4).The rise is caused by sump pump failure (Figure 6.14), plasma volumeexpansion through reduced renal excretion, and peripheral venoconstriction.
b. F – The compliance (distensibility) of the lungs is reduced, due to the congestion of thepulmonary veins and pulmonary oedema (caused by increased pulmonary venouspressure). Since the stiff lungs require more effort to inflate, the patient complains ofdyspnoea (difficulty in breathing).
Cardiovascular responses in pathological situations Answers 129
c. F – Cardiac dyspnoea gets worse on lying down (orthopnoea). Lying down increases thepulmonary venous pressure, which aggravates the pulmonary congestion and oedema.Paroxysmal nocturnal dyspnoea wakes the supine patient during the night.
d. F – The rise in pulmonary venous pressure raises pulmonary capillary pressure, which ofcourse exceeds venous pressure. Increased capillary pressure causes pulmonary oedema.
e. T – Air passing over the oedema fluid in the airways causes a crackly, bubbling noise.
18.12 a. T – In a standing, healthy human, gravity reduces jugular venous pressure to subatmosphericvalues in the neck (Figure 8.3), so the veins are normally collapsed (Figure 8.24).Therise in central venous pressure in right heart failure raises the jugular venous pressure topositive values, even when standing.
b. F – The oedema develops in dependent tissues, i.e. those below heart level, where gravityexacerbates the rise in venous pressures. Facial oedema is characteristic of the nephroticsyndrome.
c. T – Capillary filtration pressure is raised by the combination of increased central venouspressure and gravity.This causes pitting oedema of the feet, ankles and lower leg(Figure 11.14).
d. F – The normal resting ejection fraction is 66%. Due to the reduced contractility of heartfailure, the ejection fraction falls (Figure 18.5).
e. T – The increase in systemic venous pressure distends the liver, which can become tenderand palpable on examination.
18.13 a. F – The immediate cause of the reduced contractility of heart failure is a decreased, sluggishsystolic Ca2� transient (Figure 18.6).
b. T – Increased expression of the Na�–Ca2� exchanger contributes to the fall in Ca2� storesize, and hence contractility (Figure 18.6).The exchanger also increases the size of anyafterdepolarization (Figure 3.16), so it is pro-arrhythmogenic.
c. F – K� channel expression is reduced (Figure 18.6).This is a pro-arrhythmogenic change,because the reduced outward K� current allows larger DADs, and also lengthens theaction potentials in some myocytes.
d. T – After-depolarization is triggered by Ca2� store discharge during diastole (Figure 3.16).This is promoted by the high level of sympathetic activity in heart failure, and by leakyCa2� release channels (ryanodine receptors).The DAD is pro-arrhythmogenic.
e. T – The reduction in repolarizing outward K� current, due to reduced K� channelexpression, prolongs the plateau.Variation in action potential duration betweenmyocytes is pro-arrhythmogenic, because it establishes the right conditions for re-entrycircuits to develop (Figure 5.7).
18.14 a. T – The DADs and heterogeneous prolongation of the refractory period (question 18.13)can cause arrhythmia.This is a major cause of mortality in moderate heart failure.
b. T – Exercise intolerance is a major symptom of heart failure. It is due not only to thelimited cardiac output and dyspnoea during exercise, but also abnormal Ca2� handlingin the skeletal muscles.
c. F – The increase in chamber radius reduces the ability of the ventricle wall to convertcontractile tension into a rise in ventricular blood pressure.This is Laplace’s law: pressuregenerated � 2 � tension/radius (Figure 6.7). Excessive dilatation can also cause tricuspid/mitral valve incompetence.A goal of treatment is, therefore, to reduce cardiac dilatation.
d. T – The fall in contractility depresses the pump function curve (relation between strokevolume and arterial pressure or afterload (Figure 6.3).
130 Cardiovascular physiology Answers
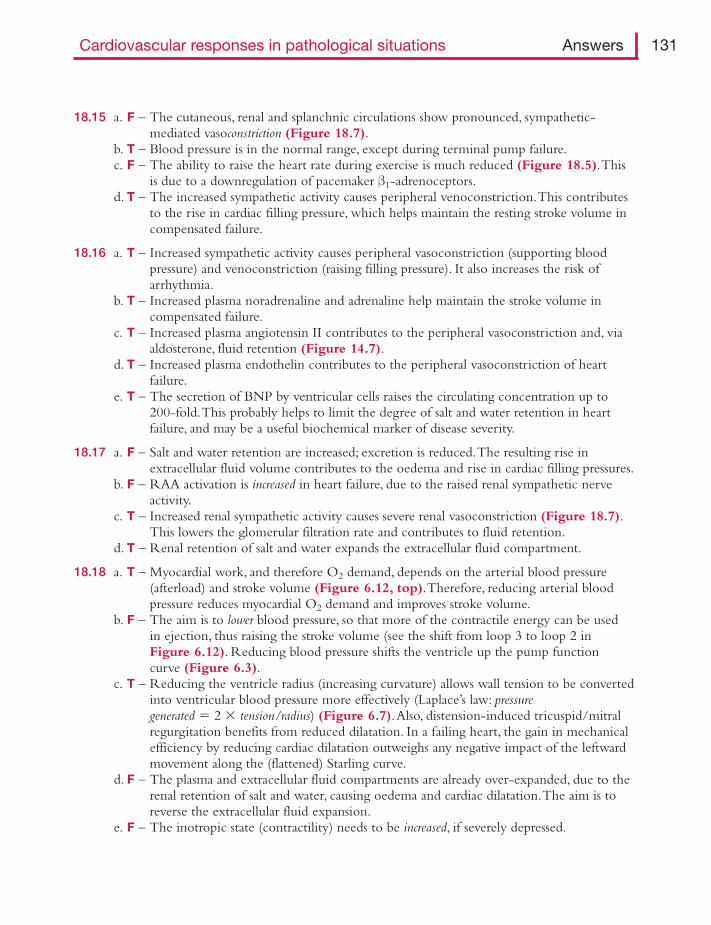
18.15 a. F – The cutaneous, renal and splanchnic circulations show pronounced, sympathetic-mediated vasoconstriction (Figure 18.7).
b. T – Blood pressure is in the normal range, except during terminal pump failure.c. F – The ability to raise the heart rate during exercise is much reduced (Figure 18.5).This
is due to a downregulation of pacemaker β1-adrenoceptors.d. T – The increased sympathetic activity causes peripheral venoconstriction.This contributes
to the rise in cardiac filling pressure, which helps maintain the resting stroke volume incompensated failure.
18.16 a. T – Increased sympathetic activity causes peripheral vasoconstriction (supporting bloodpressure) and venoconstriction (raising filling pressure). It also increases the risk ofarrhythmia.
b. T – Increased plasma noradrenaline and adrenaline help maintain the stroke volume incompensated failure.
c. T – Increased plasma angiotensin II contributes to the peripheral vasoconstriction and, viaaldosterone, fluid retention (Figure 14.7).
d. T – Increased plasma endothelin contributes to the peripheral vasoconstriction of heartfailure.
e. T – The secretion of BNP by ventricular cells raises the circulating concentration up to200-fold.This probably helps to limit the degree of salt and water retention in heartfailure, and may be a useful biochemical marker of disease severity.
18.17 a. F – Salt and water retention are increased; excretion is reduced.The resulting rise inextracellular fluid volume contributes to the oedema and rise in cardiac filling pressures.
b. F – RAA activation is increased in heart failure, due to the raised renal sympathetic nerveactivity.
c. T – Increased renal sympathetic activity causes severe renal vasoconstriction (Figure 18.7).This lowers the glomerular filtration rate and contributes to fluid retention.
d. T – Renal retention of salt and water expands the extracellular fluid compartment.
18.18 a. T – Myocardial work, and therefore O2 demand, depends on the arterial blood pressure(afterload) and stroke volume (Figure 6.12, top).Therefore, reducing arterial bloodpressure reduces myocardial O2 demand and improves stroke volume.
b. F – The aim is to lower blood pressure, so that more of the contractile energy can be usedin ejection, thus raising the stroke volume (see the shift from loop 3 to loop 2 inFigure 6.12). Reducing blood pressure shifts the ventricle up the pump functioncurve (Figure 6.3).
c. T – Reducing the ventricle radius (increasing curvature) allows wall tension to be convertedinto ventricular blood pressure more effectively (Laplace’s law: pressuregenerated � 2 � tension/radius) (Figure 6.7).Also, distension-induced tricuspid/mitralregurgitation benefits from reduced dilatation. In a failing heart, the gain in mechanicalefficiency by reducing cardiac dilatation outweighs any negative impact of the leftwardmovement along the (flattened) Starling curve.
d. F – The plasma and extracellular fluid compartments are already over-expanded, due to therenal retention of salt and water, causing oedema and cardiac dilatation.The aim is toreverse the extracellular fluid expansion.
e. F – The inotropic state (contractility) needs to be increased, if severely depressed.
Cardiovascular responses in pathological situations Answers 131
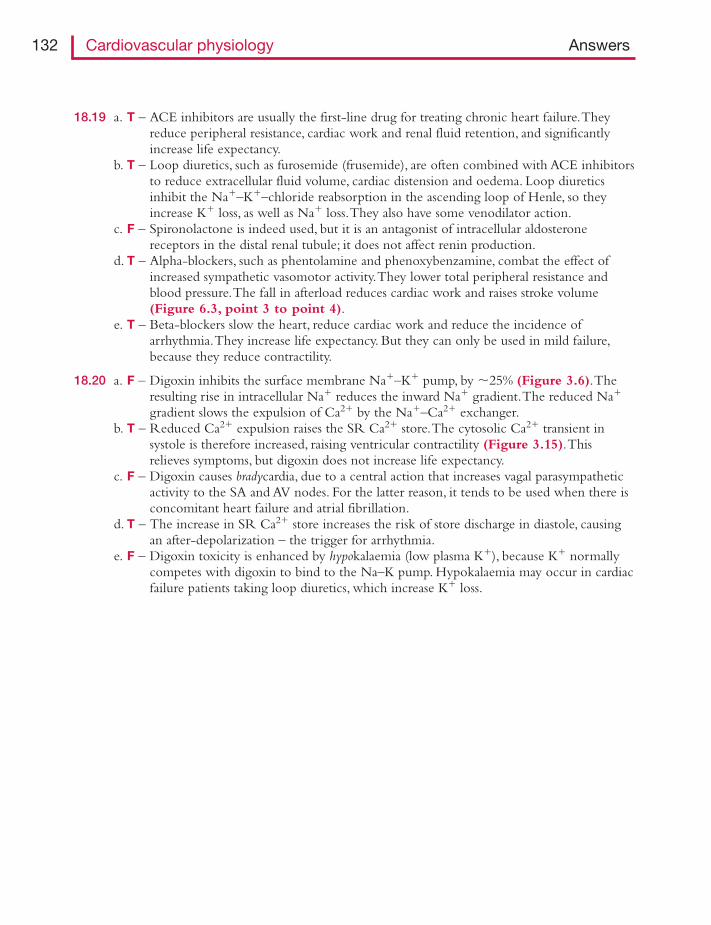
18.19 a. T – ACE inhibitors are usually the first-line drug for treating chronic heart failure.Theyreduce peripheral resistance, cardiac work and renal fluid retention, and significantlyincrease life expectancy.
b. T – Loop diuretics, such as furosemide (frusemide), are often combined with ACE inhibitorsto reduce extracellular fluid volume, cardiac distension and oedema. Loop diureticsinhibit the Na�–K�–chloride reabsorption in the ascending loop of Henle, so theyincrease K� loss, as well as Na� loss.They also have some venodilator action.
c. F – Spironolactone is indeed used, but it is an antagonist of intracellular aldosteronereceptors in the distal renal tubule; it does not affect renin production.
d. T – Alpha-blockers, such as phentolamine and phenoxybenzamine, combat the effect ofincreased sympathetic vasomotor activity.They lower total peripheral resistance andblood pressure.The fall in afterload reduces cardiac work and raises stroke volume(Figure 6.3, point 3 to point 4).
e. T – Beta-blockers slow the heart, reduce cardiac work and reduce the incidence ofarrhythmia.They increase life expectancy. But they can only be used in mild failure,because they reduce contractility.
18.20 a. F – Digoxin inhibits the surface membrane Na�–K� pump, by �25% (Figure 3.6).Theresulting rise in intracellular Na� reduces the inward Na� gradient.The reduced Na�
gradient slows the expulsion of Ca2� by the Na�–Ca2� exchanger.b. T – Reduced Ca2� expulsion raises the SR Ca2� store.The cytosolic Ca2� transient in
systole is therefore increased, raising ventricular contractility (Figure 3.15).Thisrelieves symptoms, but digoxin does not increase life expectancy.
c. F – Digoxin causes bradycardia, due to a central action that increases vagal parasympatheticactivity to the SA and AV nodes. For the latter reason, it tends to be used when there isconcomitant heart failure and atrial fibrillation.
d. T – The increase in SR Ca2� store increases the risk of store discharge in diastole, causingan after-depolarization – the trigger for arrhythmia.
e. F – Digoxin toxicity is enhanced by hypokalaemia (low plasma K�), because K� normallycompetes with digoxin to bind to the Na–K pump. Hypokalaemia may occur in cardiacfailure patients taking loop diuretics, which increase K� loss.
132 Cardiovascular physiology Answers

Figures and Tables

This page intentionally left blank
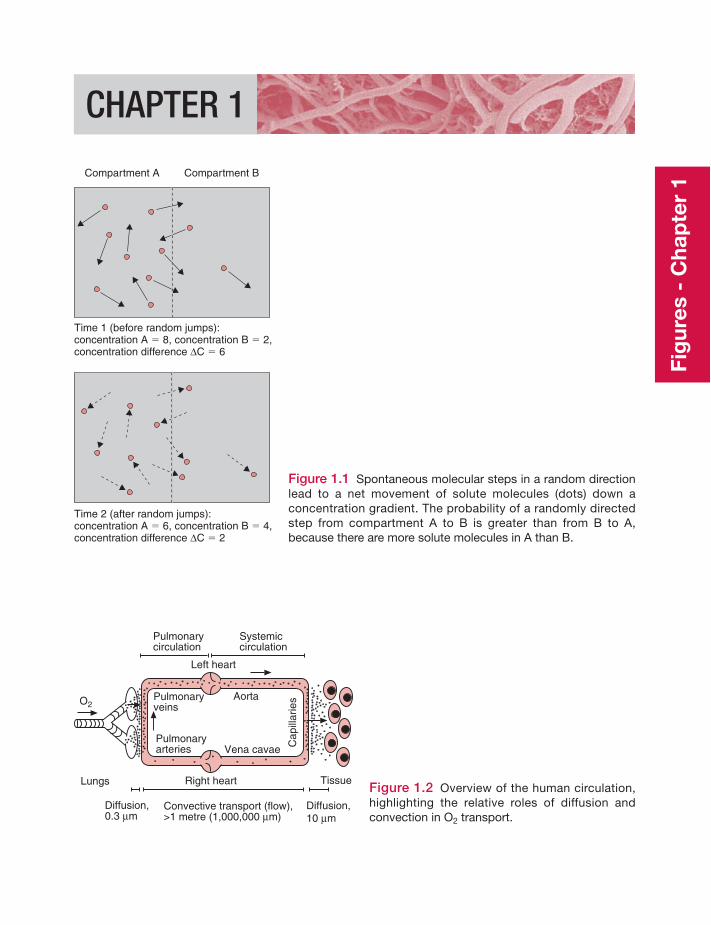
CHAPTER 1
Compartment A Compartment B
Time 1 (before random jumps):concentration A � 8, concentration B � 2,concentration difference ΔC � 6
Time 2 (after random jumps):concentration A � 6, concentration B � 4,concentration difference ΔC � 2
Figure 1.1 Spontaneous molecular steps in a random directionlead to a net movement of solute molecules (dots) down aconcentration gradient. The probability of a randomly directedstep from compartment A to B is greater than from B to A,because there are more solute molecules in A than B.
Pulmonaryveins
Pulmonaryarteries
Pulmonarycirculation
Left heart
Right heartLungs Tissue
Systemiccirculation
Diffusion,0.3 μm
Diffusion,10 μm
Convective transport (flow),>1 metre (1,000,000 μm)
Aorta
Vena cavae Cap
illar
iesO2
Figure 1.2 Overview of the human circulation,highlighting the relative roles of diffusion andconvection in O2 transport.
Fig
ures
- C
hap
ter
1
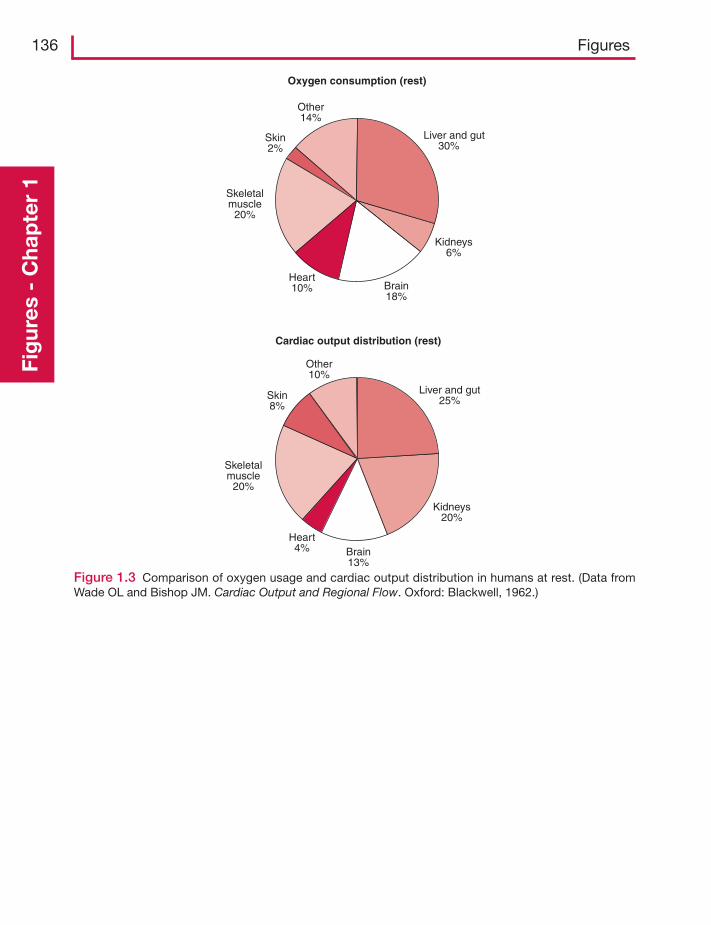
136 FiguresFi
gur
es -
Cha
pte
r 1
Oxygen consumption (rest)
Liver and gut30%
Kidneys6%
Brain18%
Heart10%
Skeletalmuscle
20%
Skin2%
Other14%
Cardiac output distribution (rest)
Liver and gut25%
Kidneys20%
Brain13%
Heart4%
Skeletalmuscle
20%
Skin8%
Other10%
Figure 1.3 Comparison of oxygen usage and cardiac output distribution in humans at rest. (Data fromWade OL and Bishop JM. Cardiac Output and Regional Flow. Oxford: Blackwell, 1962.)
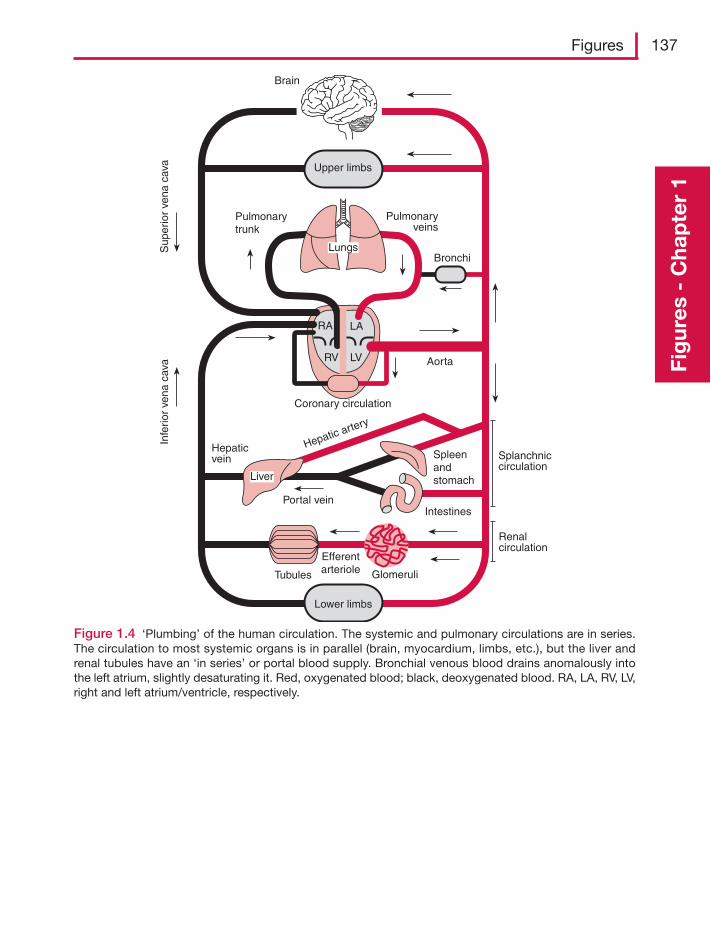
Figures 137
Fig
ures
- C
hap
ter
1
Spleenandstomach
Intestines
Glomeruli
EfferentarterioleTubules
Liver
Lower limbs
Upper limbs
RA LA
RV LV
Lungs
Brain
Sup
erio
r ve
na c
ava
Pulmonarytrunk
Hepaticvein
Portal vein
Coronary circulation
Hepatic artery
Aorta
Bronchi
Pulmonaryveins
Infe
rior
vena
cav
a
Splanchniccirculation
Renalcirculation
Figure 1.4 ‘Plumbing’ of the human circulation. The systemic and pulmonary circulations are in series.The circulation to most systemic organs is in parallel (brain, myocardium, limbs, etc.), but the liver andrenal tubules have an ‘in series’ or portal blood supply. Bronchial venous blood drains anomalously intothe left atrium, slightly desaturating it. Red, oxygenated blood; black, deoxygenated blood. RA, LA, RV, LV,right and left atrium/ventricle, respectively.
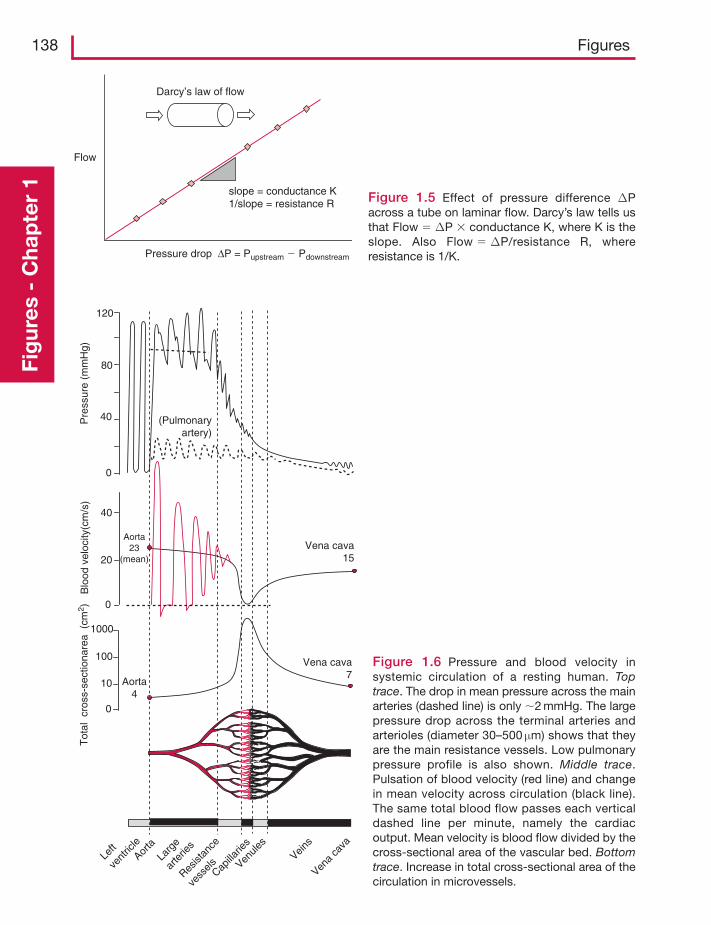
138 FiguresFi
gur
es -
Cha
pte
r 1
Flow
Pressure drop ΔP = Pupstream � Pdownstream
Darcy’s law of flow
slope = conductance K1/slope = resistance R Figure 1.5 Effect of pressure difference ΔP
across a tube on laminar flow. Darcy’s law tells usthat Flow � ΔP � conductance K, where K is theslope. Also Flow � ΔP/resistance R, whereresistance is 1/K.
Vena cava15
Vena cava7
0
10
100
1000
Tot
al c
ross
-sec
tiona
rea
(cm
2 )
Aorta4
Left
vent
ricle
Larg
e
arte
ries
Resist
ance
vess
elsCapilla
ries
Veins
0
40
80
120
Pre
ssur
e (m
mH
g)
(Pulmonaryartery)
0
20
Aorta23
(mean)
Blo
od v
eloc
ity(c
m/s
)
40
Aorta
Vena
cava
Venule
s
Figure 1.6 Pressure and blood velocity insystemic circulation of a resting human. Toptrace. The drop in mean pressure across the mainarteries (dashed line) is only �2 mmHg. The largepressure drop across the terminal arteries andarterioles (diameter 30–500 μm) shows that theyare the main resistance vessels. Low pulmonarypressure profile is also shown. Middle trace.Pulsation of blood velocity (red line) and changein mean velocity across circulation (black line).The same total blood flow passes each verticaldashed line per minute, namely the cardiacoutput. Mean velocity is blood flow divided by thecross-sectional area of the vascular bed. Bottomtrace. Increase in total cross-sectional area of thecirculation in microvessels.
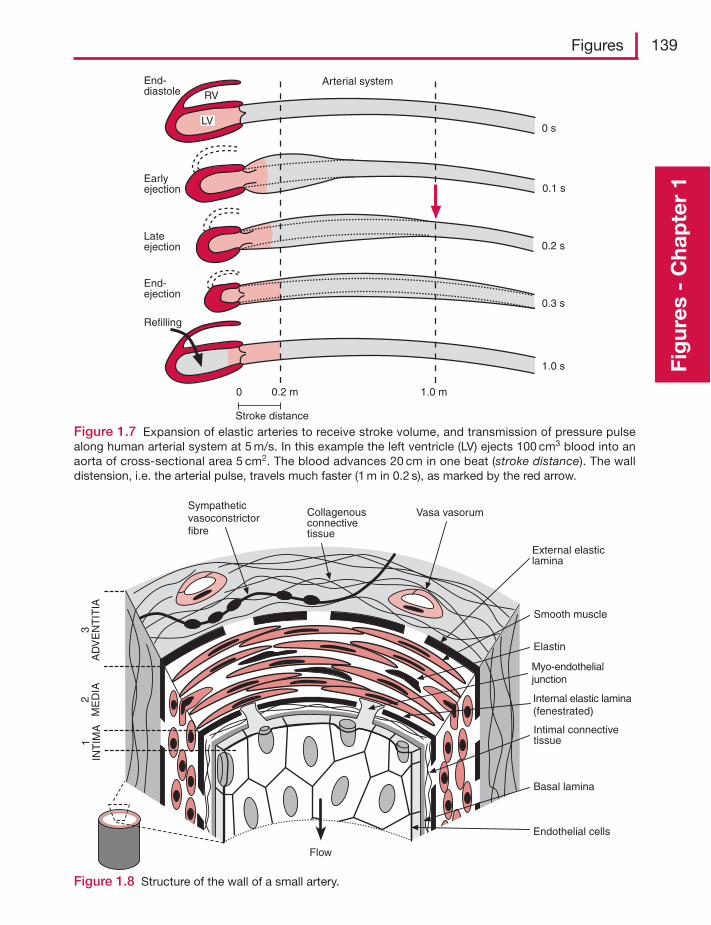
Figures 139
Fig
ures
- C
hap
ter
1
0 s
0.1 s
0.2 s
0.3 s
1.0 s
1.0 m0.2 m0
Stroke distance
Arterial systemRV
LV
End-diastole
Earlyejection
Lateejection
End-ejection
Refilling
Figure 1.7 Expansion of elastic arteries to receive stroke volume, and transmission of pressure pulsealong human arterial system at 5 m/s. In this example the left ventricle (LV) ejects 100 cm3 blood into anaorta of cross-sectional area 5 cm2. The blood advances 20 cm in one beat (stroke distance). The walldistension, i.e. the arterial pulse, travels much faster (1 m in 0.2 s), as marked by the red arrow.
Sympatheticvasoconstrictorfibre
Collagenousconnectivetissue
Vasa vasorum
External elasticlamina
Smooth muscle
Elastin
Internal elastic lamina(fenestrated)
Intimal connectivetissue
Basal lamina
Endothelial cells
Flow
1IN
TIM
A2
ME
DIA
3A
DV
EN
TIT
IA
Myo-endothelialjunction
Figure 1.8 Structure of the wall of a small artery.
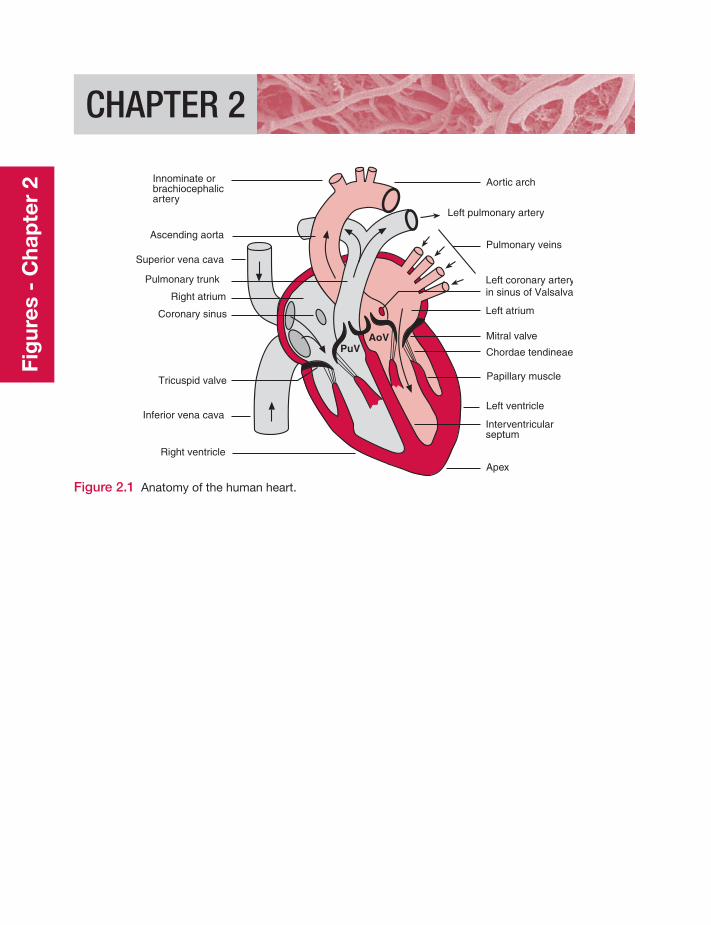
CHAPTER 2
Innominate orbrachiocephalicartery
Left coronary arteryin sinus of Valsalva
Superior vena cava
Left atrium
Aortic arch
Pulmonary veins
Mitral valve
Chordae tendineae
Papillary muscle
Left ventricle
Interventricularseptum
Apex
Ascending aorta
Pulmonary trunk
Right atrium
Tricuspid valve
Inferior vena cava
Right ventricle
PuVAoV
Left pulmonary artery
Coronary sinus
Figure 2.1 Anatomy of the human heart.
Fig
ures
- C
hap
ter
2
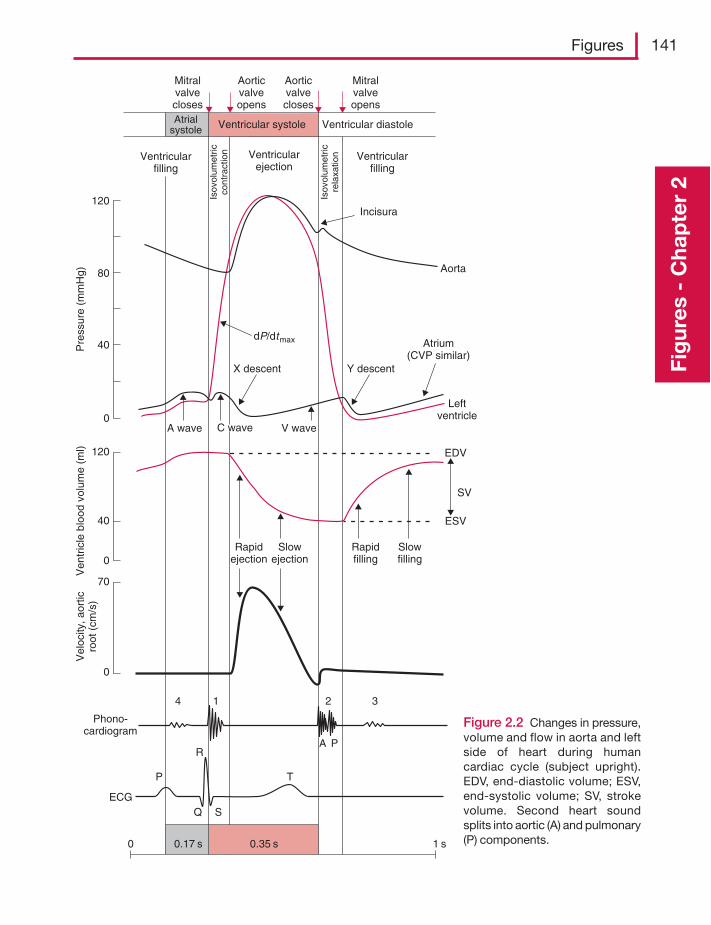
Figures 141
Fig
ures
- C
hap
ter
2
0.35 s0.17 s 1 s0
ECG
P
R
T
SQ
4 1 2 3
A P
Phono-cardiogram
0
70
0
120
40
Vel
ocity
, aor
ticro
ot (
cm/s
)V
entr
icle
blo
od v
olum
e (m
l)
0
120
40
80
Pre
ssur
e (m
mH
g)
Rapidejection
Slowejection
Rapidfilling
Slowfilling
ESV
SV
EDV
Leftventricle
Atrium(CVP similar)
Y descentX descent
dP/dtmax
Aorta
Incisura
Ventricularfilling
Ventricular diastole
Ventricularejection
Ventricular systoleAtrialsystole
Mitralvalvecloses
Mitralvalveopens
Aorticvalveopens
Aorticvalvecloses
Isov
olum
etric
rela
xatio
n
Isov
olum
etric
cont
ract
ionVentricular
filling
A wave C wave V wave
Figure 2.2 Changes in pressure,volume and flow in aorta and leftside of heart during humancardiac cycle (subject upright).EDV, end-diastolic volume; ESV,end-systolic volume; SV, strokevolume. Second heart soundsplits into aortic (A) and pulmonary(P) components.
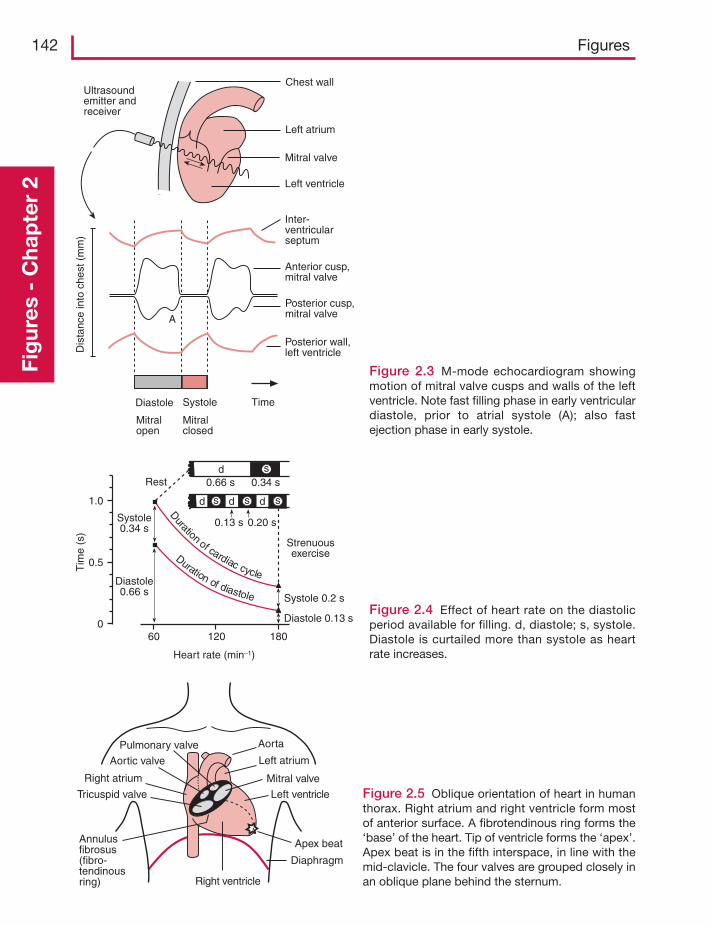
142 FiguresFi
gur
es -
Cha
pte
r 2
Posterior cusp,mitral valve
Dis
tanc
e in
to c
hest
(m
m)
Chest wallUltrasoundemitter andreceiver
Left atrium
Mitral valve
Left ventricle
Inter-ventricularseptum
Anterior cusp,mitral valve
Posterior wall,left ventricle
TimeDiastole Systole
Mitralopen
Mitralclosed
A
Figure 2.3 M-mode echocardiogram showingmotion of mitral valve cusps and walls of the leftventricle. Note fast filling phase in early ventriculardiastole, prior to atrial systole (A); also fastejection phase in early systole.
Duration of cardiac cycle
Duration of diastole
Strenuousexercise
Heart rate (min–1)
Tim
e (s
)
1.0
0.5
0
Systole 0.2 s
Diastole 0.13 s
Systole0.34 s
Diastole0.66 s
Rest
60 120 180
0.66 s
d
0.34 s
0.13 s 0.20 s
d
d d
s
sss
Figure 2.4 Effect of heart rate on the diastolicperiod available for filling. d, diastole; s, systole.Diastole is curtailed more than systole as heartrate increases.
Pulmonary valve
Aortic valve
Right atrium
Tricuspid valve
Annulusfibrosus(fibro-tendinousring)
Aorta
Left atrium
Mitral valve
Left ventricle
Apex beat
Diaphragm
Right ventricle
Figure 2.5 Oblique orientation of heart in humanthorax. Right atrium and right ventricle form mostof anterior surface. A fibrotendinous ring forms the‘base’ of the heart. Tip of ventricle forms the ‘apex’.Apex beat is in the fifth interspace, in line with themid-clavicle. The four valves are grouped closely inan oblique plane behind the sternum.
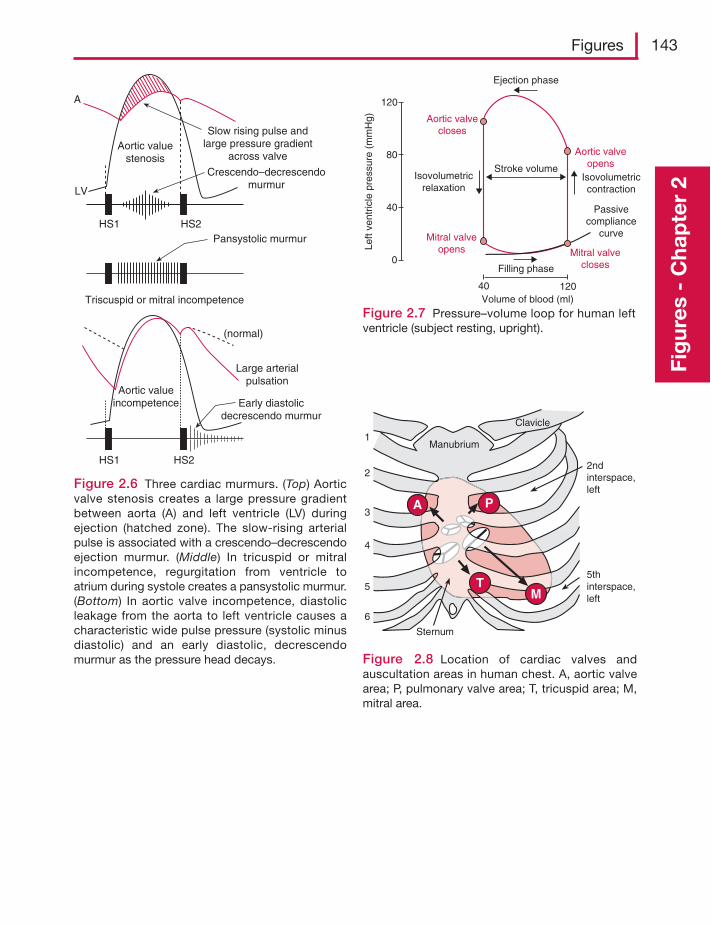
Figures 143
Fig
ures
- C
hap
ter
2
A
LV
HS1 HS2
Aortic valuestenosis
Slow rising pulse andlarge pressure gradient
across valve
Crescendo–decrescendomurmur
Pansystolic murmur
Triscuspid or mitral incompetence
HS1 HS2
Aortic valueincompetence
Large arterialpulsation
Early diastolicdecrescendo murmur
(normal)
Figure 2.6 Three cardiac murmurs. (Top) Aorticvalve stenosis creates a large pressure gradientbetween aorta (A) and left ventricle (LV) duringejection (hatched zone). The slow-rising arterialpulse is associated with a crescendo–decrescendoejection murmur. (Middle) In tricuspid or mitralincompetence, regurgitation from ventricle toatrium during systole creates a pansystolic murmur.(Bottom) In aortic valve incompetence, diastolicleakage from the aorta to left ventricle causes acharacteristic wide pulse pressure (systolic minusdiastolic) and an early diastolic, decrescendomurmur as the pressure head decays.
120
120
80
40
40
0
Left
vent
ricle
pre
ssur
e (m
mH
g) Aortic valvecloses
Aortic valveopens
Isovolumetricrelaxation
Isovolumetriccontraction
Stroke volume
Mitral valveopens Mitral valve
closesFilling phase
Volume of blood (ml)
Passivecompliance
curve
Ejection phase
Figure 2.7 Pressure–volume loop for human leftventricle (subject resting, upright).
2ndinterspace,left
5thinterspace,left
Sternum
Manubrium
A P
TM
1
2
3
4
5
6
Clavicle
Figure 2.8 Location of cardiac valves andauscultation areas in human chest. A, aortic valvearea; P, pulmonary valve area; T, tricuspid area; M,mitral area.
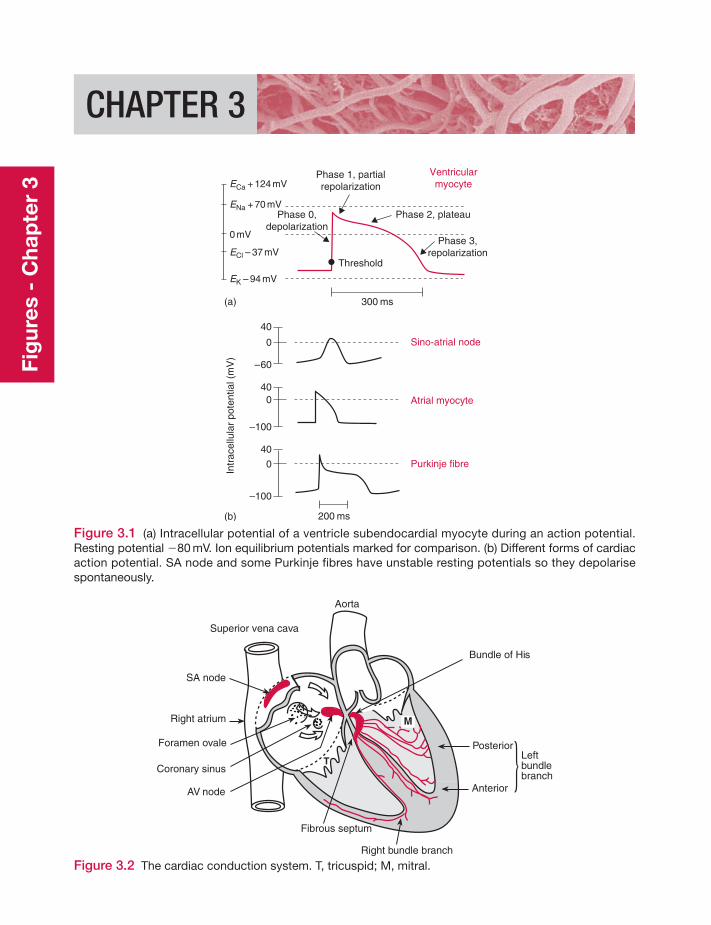
CHAPTER 3
40
0
–60
400
–100
40
0
–100
200 ms
300 ms(a)
(b)
Purkinje fibre
Atrial myocyte
Sino-atrial node
ECa + 124 mV
ENa + 70 mV
ECl – 37 mV
EK – 94 mV
0 mV
Phase 1, partialrepolarization
Phase 3,repolarization
Phase 0,depolarization
Phase 2, plateau
Ventricularmyocyte
Threshold
Intr
acel
lula
r po
tent
ial (
mV
)
Figure 3.1 (a) Intracellular potential of a ventricle subendocardial myocyte during an action potential.Resting potential �80 mV. Ion equilibrium potentials marked for comparison. (b) Different forms of cardiacaction potential. SA node and some Purkinje fibres have unstable resting potentials so they depolarisespontaneously.
Figure 3.2 The cardiac conduction system. T, tricuspid; M, mitral.
Aorta
Bundle of His
Superior vena cava
SA node
Right atrium
Foramen ovale
Coronary sinus
AV node
Fibrous septum
Anterior
Leftbundlebranch
Posterior
Right bundle branch
T
M
Fig
ures
- C
hap
ter
3
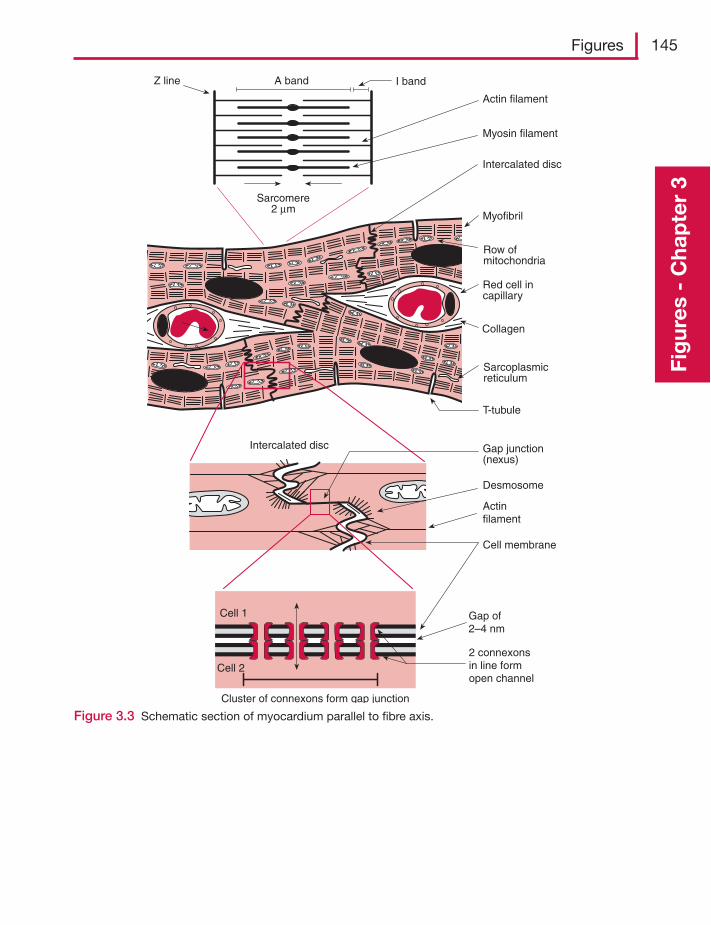
Figures 145
Fig
ures
- C
hap
ter
3
Z line A band I band
Myosin filament
Actin filament
Sarcomere2 μm
Intercalated disc
Myofibril
Row ofmitochondria
Red cell incapillary
Collagen
Sarcoplasmicreticulum
T-tubule
Gap junction(nexus)
Desmosom
Actinfilament
e
Cell membrane
Intercalated disc
Cluster of connexons form gap junction
Gap of2–4 nm
2 connexonsin line formopen channel
Cell 1
Cell 2
Figure 3.3 Schematic section of myocardium parallel to fibre axis.
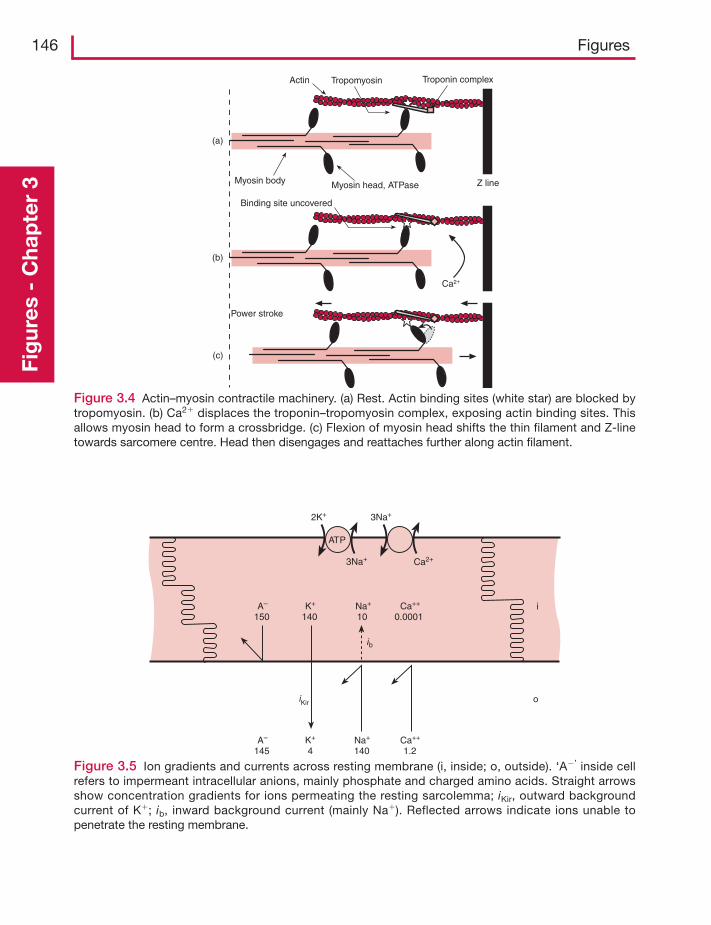
146 FiguresFi
gur
es -
Cha
pte
r 3
(a)
(b)
(c)
Z line
Power stroke
Binding site uncovered
Myosin body Myosin head, ATPase
Actin Troponin complexTropomyosin
Ca2+
Figure 3.4 Actin–myosin contractile machinery. (a) Rest. Actin binding sites (white star) are blocked bytropomyosin. (b) Ca2� displaces the troponin–tropomyosin complex, exposing actin binding sites. Thisallows myosin head to form a crossbridge. (c) Flexion of myosin head shifts the thin filament and Z-linetowards sarcomere centre. Head then disengages and reattaches further along actin filament.
2K+ 3Na+
3Na+ Ca2+
ATP
K+
140
ib
A–
150Na+
10Ca++
0.0001
K+
4A–
145Na+
140Ca++
1.2
iKir o
i
Figure 3.5 Ion gradients and currents across resting membrane (i, inside; o, outside). ‘A�’ inside cellrefers to impermeant intracellular anions, mainly phosphate and charged amino acids. Straight arrowsshow concentration gradients for ions permeating the resting sarcolemma; iKir, outward backgroundcurrent of K�; ib, inward background current (mainly Na�). Reflected arrows indicate ions unable topenetrate the resting membrane.
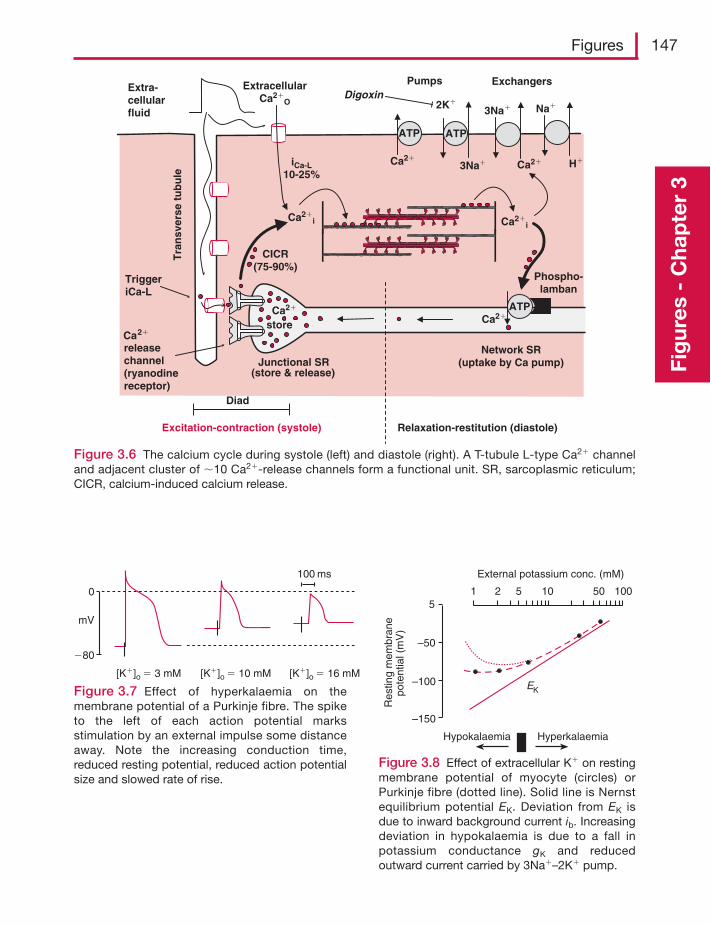
Figures 147
Fig
ures
- C
hap
ter
3
Figure 3.8 Effect of extracellular K� on restingmembrane potential of myocyte (circles) orPurkinje fibre (dotted line). Solid line is Nernstequilibrium potential EK. Deviation from EK isdue to inward background current ib. Increasingdeviation in hypokalaemia is due to a fall inpotassium conductance gK and reducedoutward current carried by 3Na�–2K� pump.
Figure 3.6 The calcium cycle during systole (left) and diastole (right). A T-tubule L-type Ca2� channeland adjacent cluster of �10 Ca2�-release channels form a functional unit. SR, sarcoplasmic reticulum;CICR, calcium-induced calcium release.
Phospho-lamban
ATP
store
ATP
Ca2�
Ca2�Ca2�
Ca2�i Ca2�
i
Ca2�
ExtracellularCa2�
O
iCa-L10-25%
Network SR(uptake by Ca pump)Junctional SR
(store & release)
3Na�
3Na�
ATP
2K�
Pumps ExchangersExtra-cellularfluid
Ca2�
releasechannel(ryanodinereceptor)
Tra
nsv
erse
tu
bu
le
CICR(75-90%)
TriggeriCa-L
Diad
Excitation-contraction (systole) Relaxation-restitution (diastole)
H�
Na�
Digoxin
Figure 3.7 Effect of hyperkalaemia on themembrane potential of a Purkinje fibre. The spiketo the left of each action potential marksstimulation by an external impulse some distanceaway. Note the increasing conduction time,reduced resting potential, reduced action potentialsize and slowed rate of rise.
100 ms
mV
[K�]o � 3 mM [K�]o � 10 mM [K�]o � 16 mM
0
�80
1 2 5 10 50 1005
–50
–100
–150
Hypokalaemia Hyperkalaemia
External potassium conc. (mM)
Res
ting
mem
bran
epo
tent
ial (
mV
)
EK
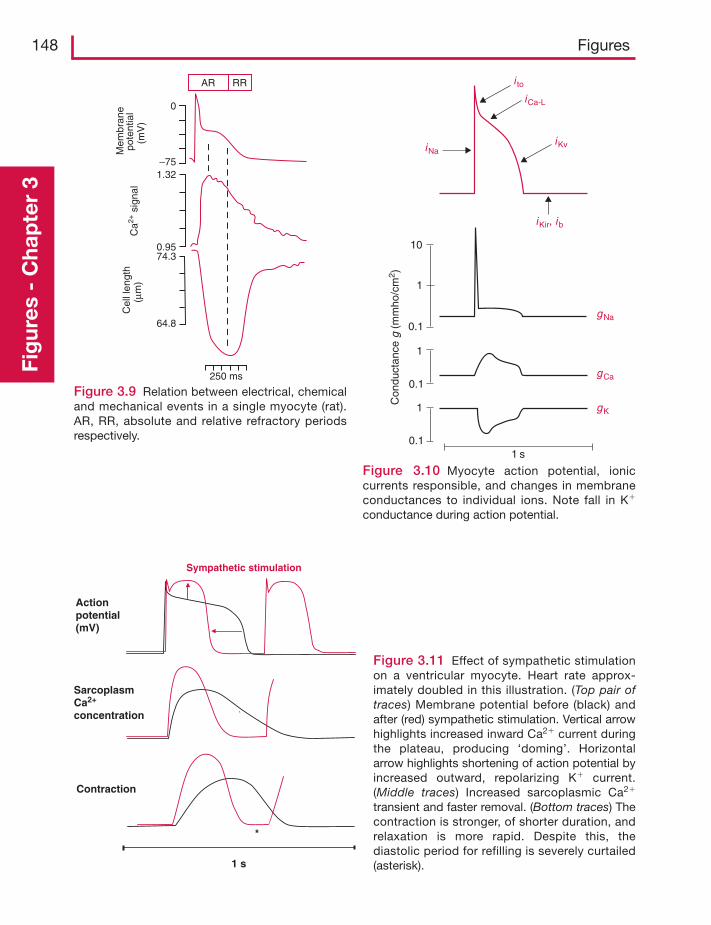
148 FiguresFi
gur
es -
Cha
pte
r 3
Figure 3.9 Relation between electrical, chemicaland mechanical events in a single myocyte (rat).AR, RR, absolute and relative refractory periodsrespectively.
Mem
bran
epo
tent
ial
(mV
)C
ell l
engt
h(μ
m)
Ca2+
sig
nal
0
–751.32
0.9574.3
64.8
AR RR
250 ms
Figure 3.10 Myocyte action potential, ioniccurrents responsible, and changes in membraneconductances to individual ions. Note fall in K�
conductance during action potential.
10
1
1
1
0.1
0.1
0.1
1 s
Con
duct
ance
g (m
mho
/cm
2 )
gNa
iKir, ib
iKviNa
i toiCa-L
gCa
gK
Figure 3.11 Effect of sympathetic stimulationon a ventricular myocyte. Heart rate approx-imately doubled in this illustration. (Top pair oftraces) Membrane potential before (black) andafter (red) sympathetic stimulation. Vertical arrowhighlights increased inward Ca2� current duringthe plateau, producing ‘doming’. Horizontalarrow highlights shortening of action potential byincreased outward, repolarizing K� current.(Middle traces) Increased sarcoplasmic Ca2�
transient and faster removal. (Bottom traces) Thecontraction is stronger, of shorter duration, andrelaxation is more rapid. Despite this, thediastolic period for refilling is severely curtailed(asterisk).
`
Actionpotential(mV)
SarcoplasmCa2+
concentration
Contraction
1 s
Sympathetic stimulation
*
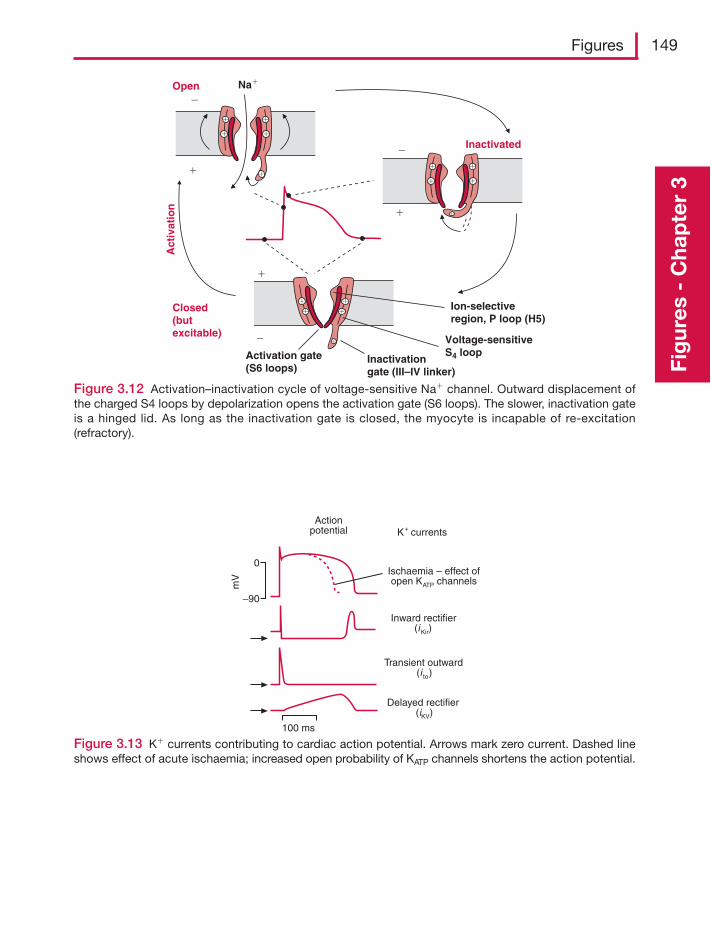
Figures 149
Fig
ures
- C
hap
ter
3
Figure 3.12 Activation–inactivation cycle of voltage-sensitive Na� channel. Outward displacement ofthe charged S4 loops by depolarization opens the activation gate (S6 loops). The slower, inactivation gateis a hinged lid. As long as the inactivation gate is closed, the myocyte is incapable of re-excitation(refractory).
�
�
�
�
Na�Open
Closed(butexcitable)
Inactivated
Inactivationgate (III–IV linker)
Activation gate(S6 loops)
Voltage-sensitiveS4 loop
Ion-selectiveregion, P loop (H5)
� �
�
��
�
�
Act
ivat
ion
�
�
�
�
�
�
�
�
�
�
Figure 3.13 K� currents contributing to cardiac action potential. Arrows mark zero current. Dashed lineshows effect of acute ischaemia; increased open probability of KATP channels shortens the action potential.
Actionpotential K+ currents
Ischaemia – effect ofopen KATP channels
Inward rectifier(iKir)
Transient outward(i to)
Delayed rectifier(iKV)
0
–90
mV
100 ms
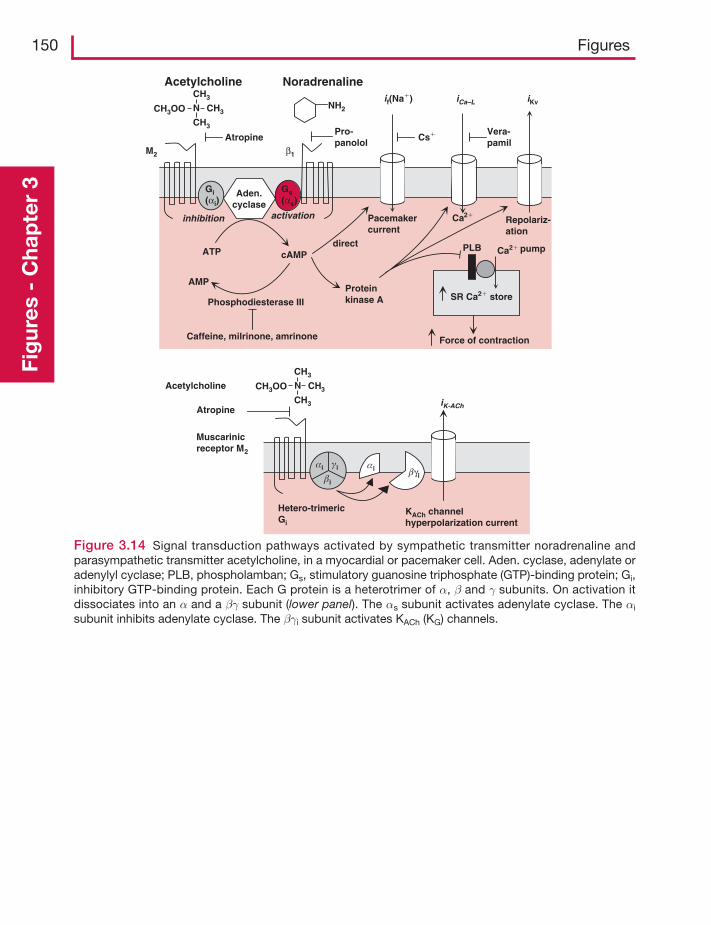
KACh channelhyperpolarization current
Noradrenaline
Pro-panolol
Acetylcholine
M2 β1
Atropine
Aden.cyclase
Gi(αi)
αi αi
βiβγi
γi
Gs(αs)
ATP cAMP
AMP
Phosphodiesterase III
Caffeine, milrinone, amrinone
direct
Pacemakercurrent
Ca2�
Ca2�
Repolariz-ation
Proteinkinase A SR Ca2� store
Force of contraction
pump
if(Na�) iCa–L iKv
Cs� Vera-pamil
iK-ACh
PLB
activationinhibition
Muscarinicreceptor M2
Hetero-trimericGi
Atropine
NH2N CH3
CH3
CH3
CH3OO
Acetylcholine N CH3
CH3
CH3
CH3OO
150 FiguresFi
gur
es -
Cha
pte
r 3
Figure 3.14 Signal transduction pathways activated by sympathetic transmitter noradrenaline andparasympathetic transmitter acetylcholine, in a myocardial or pacemaker cell. Aden. cyclase, adenylate oradenylyl cyclase; PLB, phospholamban; Gs, stimulatory guanosine triphosphate (GTP)-binding protein; Gi,inhibitory GTP-binding protein. Each G protein is a heterotrimer of α, β and γ subunits. On activation itdissociates into an α and a βγ subunit (lower panel). The αs subunit activates adenylate cyclase. The αi
subunit inhibits adenylate cyclase. The βγi subunit activates KACh (KG) channels.
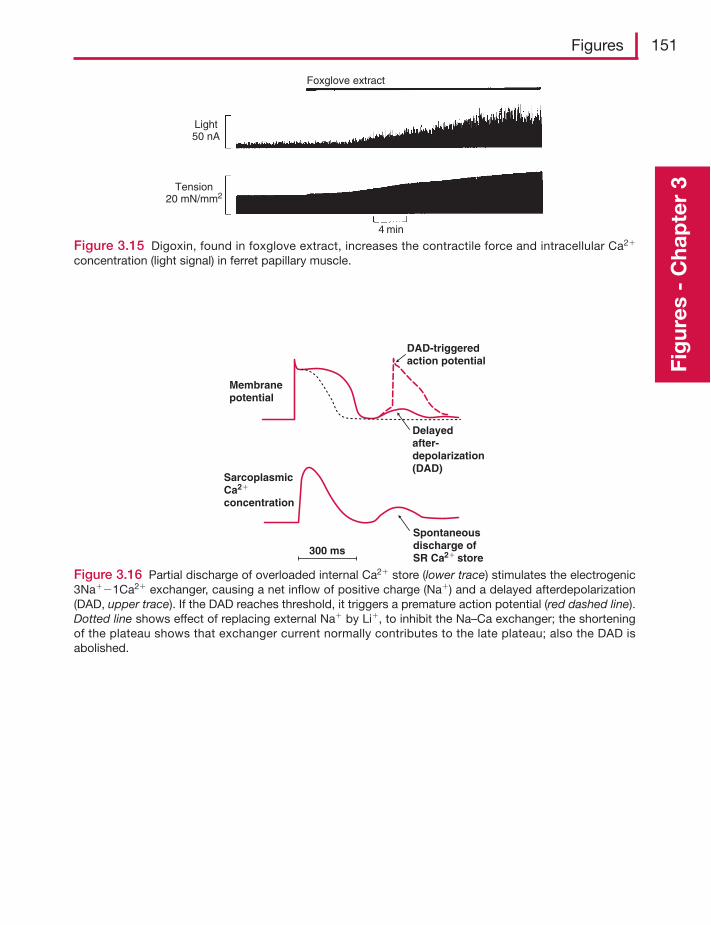
Figures 151
Fig
ures
- C
hap
ter
3
Figure 3.16 Partial discharge of overloaded internal Ca2� store (lower trace) stimulates the electrogenic3Na��1Ca2� exchanger, causing a net inflow of positive charge (Na�) and a delayed afterdepolarization(DAD, upper trace). If the DAD reaches threshold, it triggers a premature action potential (red dashed line).Dotted line shows effect of replacing external Na� by Li�, to inhibit the Na–Ca exchanger; the shorteningof the plateau shows that exchanger current normally contributes to the late plateau; also the DAD isabolished.
Membranepotential
Delayedafter-depolarization(DAD)
DAD-triggeredaction potential
SarcoplasmicCa2�
concentration
300 ms
Spontaneousdischarge ofSR Ca2� store
Figure 3.15 Digoxin, found in foxglove extract, increases the contractile force and intracellular Ca2�
concentration (light signal) in ferret papillary muscle.
Light50 nA
Tension20 mN/mm2
4 min
Foxglove extract
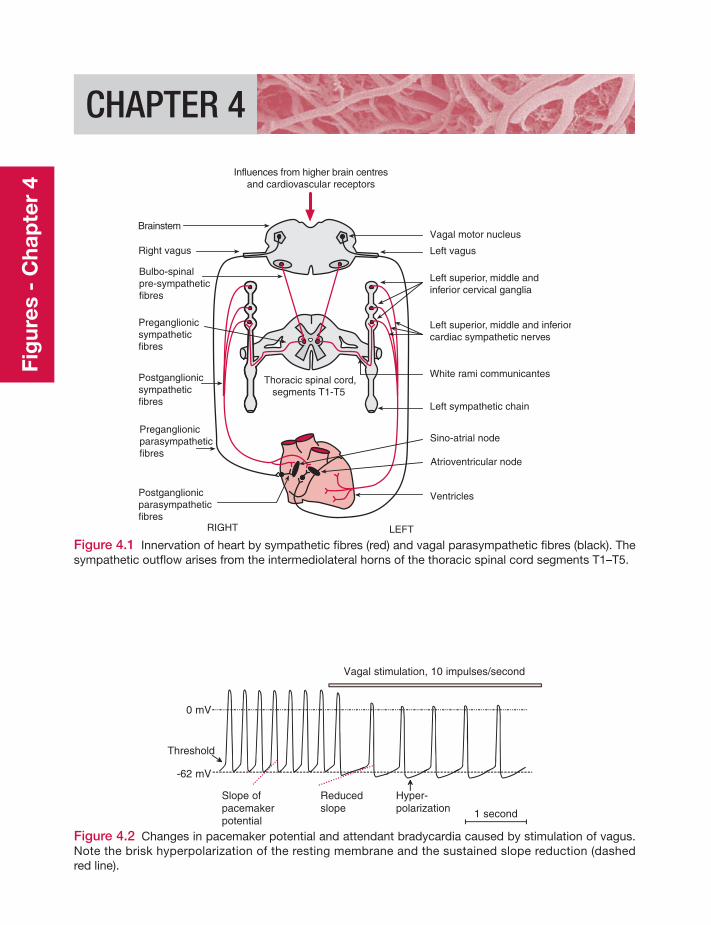
CHAPTER 4
Influences from higher brain centresand cardiovascular receptors
Brainstem
Right vagus
Bulbo-spinalpre-sympatheticfibres
Preganglionicsympatheticfibres
RIGHT LEFT
Vagal motor nucleus
Postganglionicsympatheticfibres
Preganglionicparasympatheticfibres
Postganglionicparasympatheticfibres
Left vagus
Left superior, middle andinferior cervical ganglia
White rami communicantes
Left sympathetic chain
Sino-atrial node
Atrioventricular node
Ventricles
Left superior, middle and inferiorcardiac sympathetic nerves
Thoracic spinal cord,segments T1-T5
Figure 4.1 Innervation of heart by sympathetic fibres (red) and vagal parasympathetic fibres (black). Thesympathetic outflow arises from the intermediolateral horns of the thoracic spinal cord segments T1–T5.
1 second
0 mV
-62 mV
Vagal stimulation, 10 impulses/second
Slope ofpacemakerpotential
Reducedslope
Hyper-polarization
Threshold
Figure 4.2 Changes in pacemaker potential and attendant bradycardia caused by stimulation of vagus.Note the brisk hyperpolarization of the resting membrane and the sustained slope reduction (dashedred line).
Fig
ures
- C
hap
ter
4
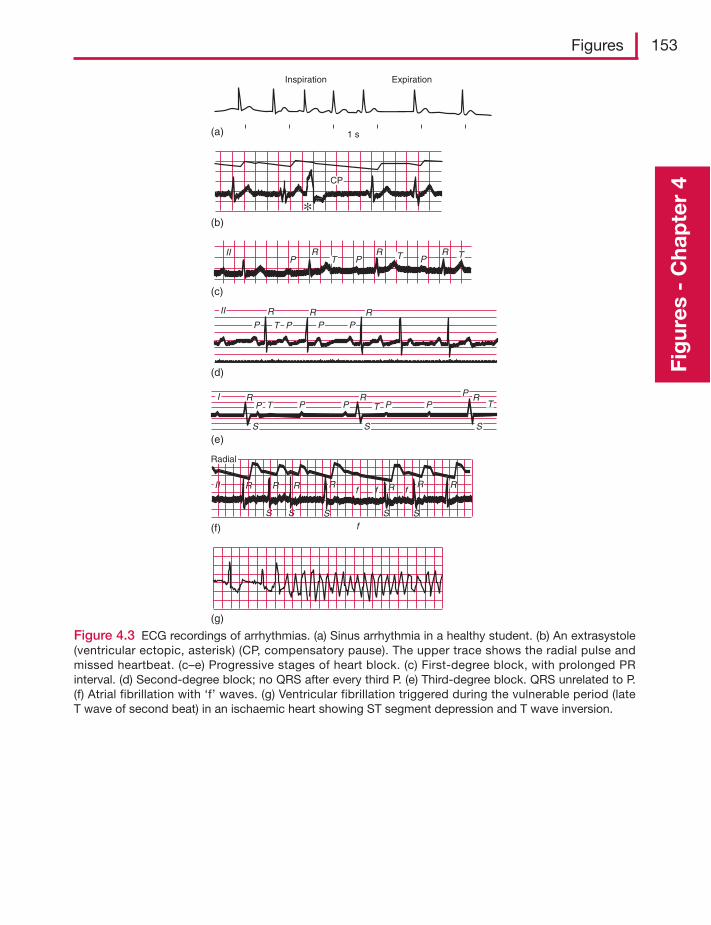
Figures 153
Fig
ures
- C
hap
ter
4
Inspiration Expiration
(a) 1 s
(b)
(c)
(d)
(e)
(f)
(g)
CP
II RP T P
R RT TP
II R R RP P P PT
I RP T P P
S SS
P PPR R
T T
II R R R R
S S S S
R R
Sf
f f fR
Radial
Figure 4.3 ECG recordings of arrhythmias. (a) Sinus arrhythmia in a healthy student. (b) An extrasystole(ventricular ectopic, asterisk) (CP, compensatory pause). The upper trace shows the radial pulse andmissed heartbeat. (c–e) Progressive stages of heart block. (c) First-degree block, with prolonged PRinterval. (d) Second-degree block; no QRS after every third P. (e) Third-degree block. QRS unrelated to P.(f) Atrial fibrillation with ‘f’ waves. (g) Ventricular fibrillation triggered during the vulnerable period (lateT wave of second beat) in an ischaemic heart showing ST segment depression and T wave inversion.
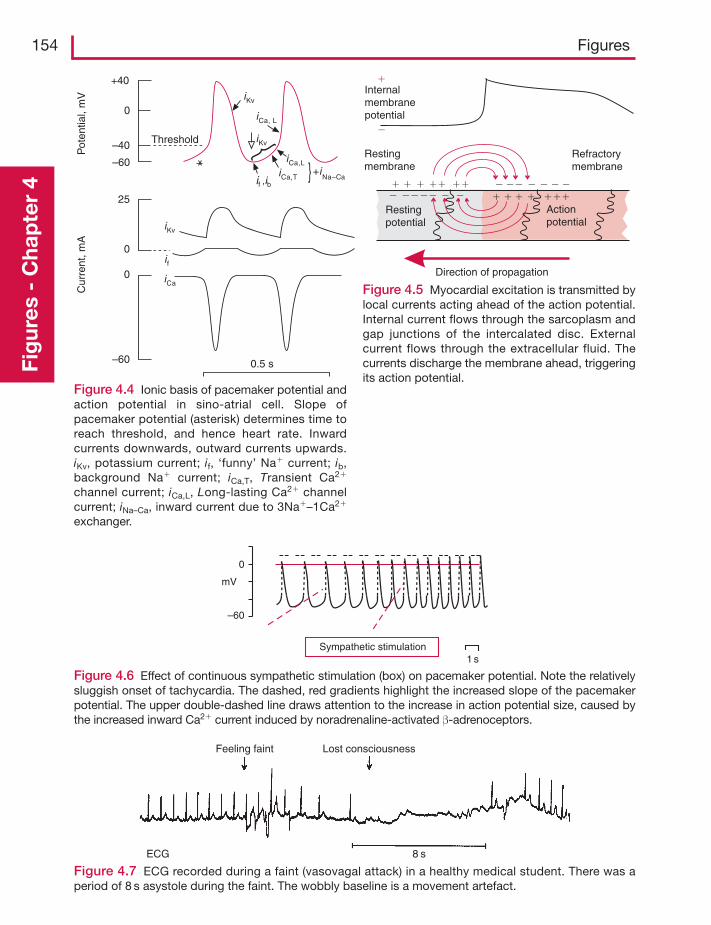
154 FiguresFi
gur
es -
Cha
pte
r 4
Threshold
+40
–40
–60
0
Pot
entia
l, m
VC
urre
nt, m
A
0
0
25
–60 0.5 s
if ,ibiCa,T
iKv
iCa,L+i
Na–Ca
iCa, L
iKv
if
iCa
iKv
Figure 4.4 Ionic basis of pacemaker potential andaction potential in sino-atrial cell. Slope ofpacemaker potential (asterisk) determines time toreach threshold, and hence heart rate. Inwardcurrents downwards, outward currents upwards.iKv, potassium current; if, ‘funny’ Na� current; ib,background Na� current; iCa,T, Transient Ca2�
channel current; iCa,L, Long-lasting Ca2� channelcurrent; iNa–Ca, inward current due to 3Na�–1Ca2�
exchanger.
Restingpotential
Actionpotential
Refractorymembrane
�� ������ ������
� � ������ ��� �
��
Direction of propagation
Restingmembrane
�
�
Internalmembranepotential
Figure 4.5 Myocardial excitation is transmitted bylocal currents acting ahead of the action potential.Internal current flows through the sarcoplasm andgap junctions of the intercalated disc. Externalcurrent flows through the extracellular fluid. Thecurrents discharge the membrane ahead, triggeringits action potential.
ECG 8 s
Lost consciousnessFeeling faint
Figure 4.7 ECG recorded during a faint (vasovagal attack) in a healthy medical student. There was aperiod of 8 s asystole during the faint. The wobbly baseline is a movement artefact.
Sympathetic stimulation
0
–60
mV
1 s
Figure 4.6 Effect of continuous sympathetic stimulation (box) on pacemaker potential. Note the relativelysluggish onset of tachycardia. The dashed, red gradients highlight the increased slope of the pacemakerpotential. The upper double-dashed line draws attention to the increase in action potential size, caused bythe increased inward Ca2� current induced by noradrenaline-activated β-adrenoceptors.
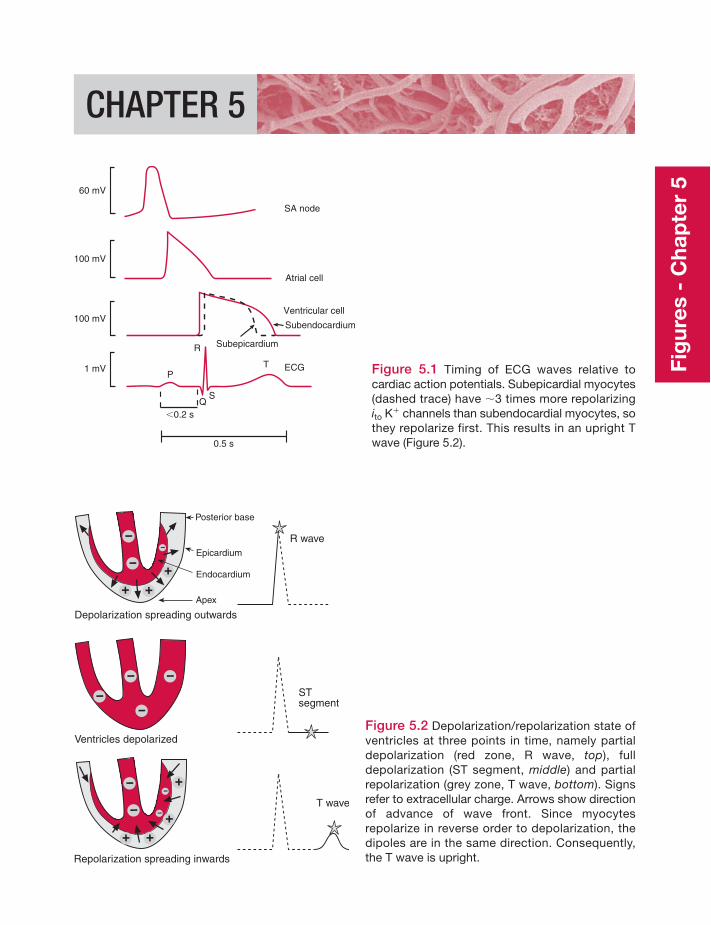
Fig
ures
- C
hap
ter
5
CHAPTER 5
60 mV
SA node
Atrial cell
Ventricular cell
Subendocardium
Subepicardium
T ECG
100 mV
100 mV
1 mV
R
P
SQ
0.5 s
�0.2 s
Figure 5.1 Timing of ECG waves relative tocardiac action potentials. Subepicardial myocytes(dashed trace) have �3 times more repolarizingito K� channels than subendocardial myocytes, sothey repolarize first. This results in an upright Twave (Figure 5.2).
Depolarization spreading outwards
Ventricles depolarized
Repolarization spreading inwards
STsegment
T wave
R wave
Posterior base
Epicardium
Endocardium
Apex
Figure 5.2 Depolarization/repolarization state ofventricles at three points in time, namely partialdepolarization (red zone, R wave, top), fulldepolarization (ST segment, middle) and partialrepolarization (grey zone, T wave, bottom). Signsrefer to extracellular charge. Arrows show directionof advance of wave front. Since myocytesrepolarize in reverse order to depolarization, thedipoles are in the same direction. Consequently,the T wave is upright.
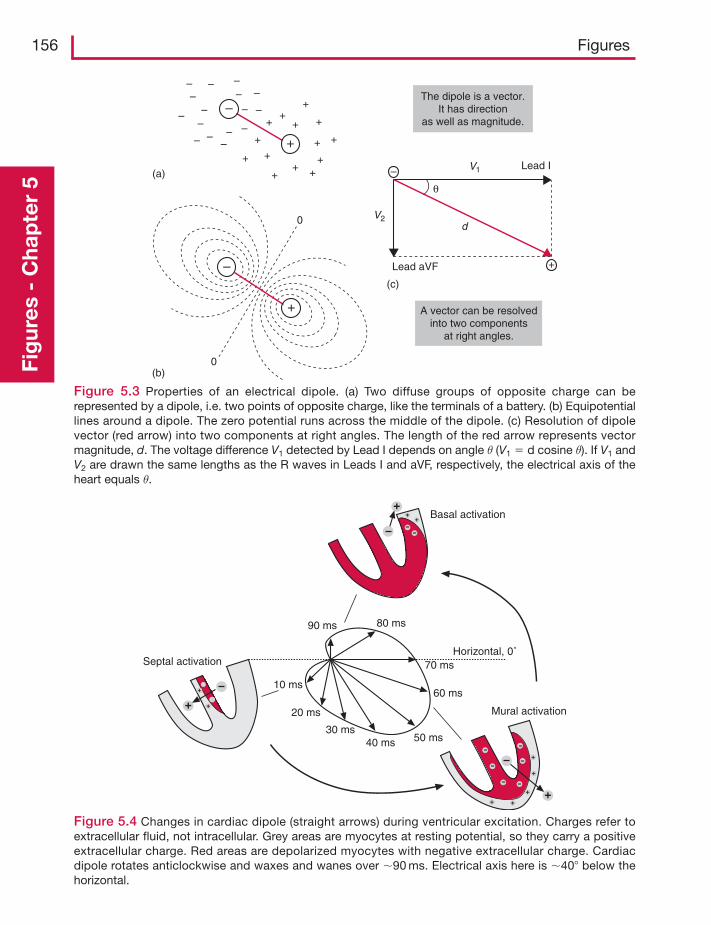
156 FiguresFi
gur
es -
Cha
pte
r 5
– – –
–––––
–
– ––
– – – –
–
–
+
++
+
+
+ +
++ +
+
+
+
+
–
+
+
+
(a)
(c)
A vector can be resolvedinto two components
at right angles.
Lead aVF
d
V1
θ
The dipole is a vector.It has direction
as well as magnitude.
V2
Lead I
(b)0
0
Figure 5.3 Properties of an electrical dipole. (a) Two diffuse groups of opposite charge can berepresented by a dipole, i.e. two points of opposite charge, like the terminals of a battery. (b) Equipotentiallines around a dipole. The zero potential runs across the middle of the dipole. (c) Resolution of dipolevector (red arrow) into two components at right angles. The length of the red arrow represents vectormagnitude, d. The voltage difference V1 detected by Lead I depends on angle θ (V1 � d cosine θ). If V1 andV2 are drawn the same lengths as the R waves in Leads I and aVF, respectively, the electrical axis of theheart equals θ.
90 ms
Septal activation
Basal activation
Mural activation
80 ms
70 ms
60 ms
50 ms40 ms30 ms
20 ms
10 ms
Horizontal, 0˚
Figure 5.4 Changes in cardiac dipole (straight arrows) during ventricular excitation. Charges refer toextracellular fluid, not intracellular. Grey areas are myocytes at resting potential, so they carry a positiveextracellular charge. Red areas are depolarized myocytes with negative extracellular charge. Cardiacdipole rotates anticlockwise and waxes and wanes over �90 ms. Electrical axis here is �40� below thehorizontal.
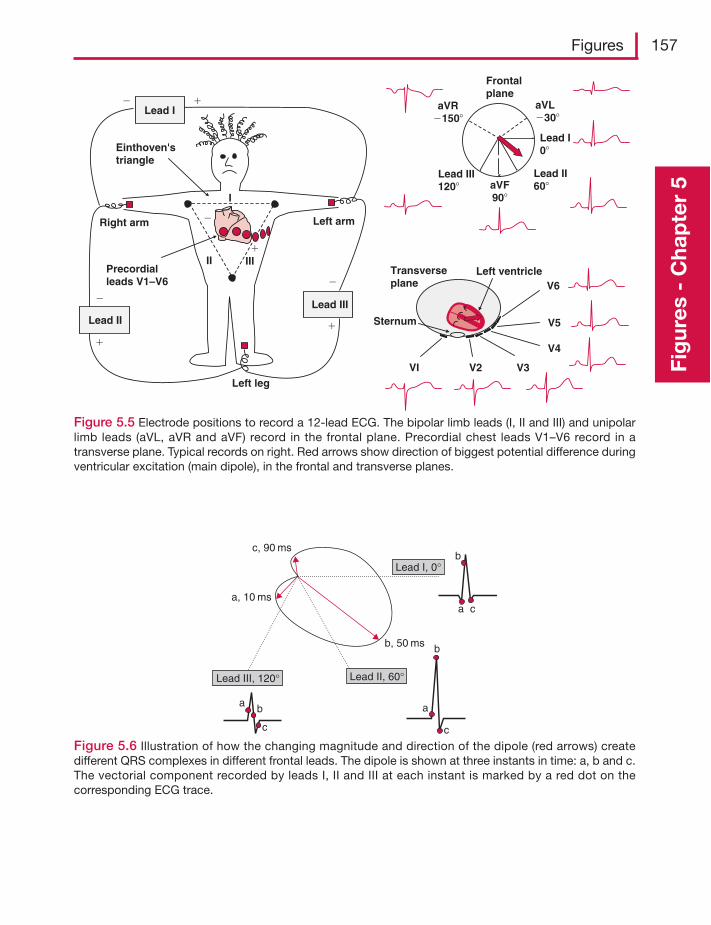
Figures 157
Fig
ures
- C
hap
ter
5
Lead I0�
Lead II60�
Lead III120�
Frontalplane
aVR�150�
aVL�30�
aVF90�
Transverseplane
VI V2 V3
V4
V5
V6Left ventricle
Sternum
�
�
Right arm Left arm
Left leg
I
II IIIPrecordialleads V1–V6
Lead II
�
�
Lead I��
Lead III
�
�
Einthoven'striangle
Figure 5.5 Electrode positions to record a 12-lead ECG. The bipolar limb leads (I, II and III) and unipolarlimb leads (aVL, aVR and aVF) record in the frontal plane. Precordial chest leads V1–V6 record in atransverse plane. Typical records on right. Red arrows show direction of biggest potential difference duringventricular excitation (main dipole), in the frontal and transverse planes.
Lead II, 60°Lead III, 120°
Lead I, 0°
c, 90 ms
a, 10 ms
b, 50 ms
a b
c
a
b
c
a
b
c
Figure 5.6 Illustration of how the changing magnitude and direction of the dipole (red arrows) createdifferent QRS complexes in different frontal leads. The dipole is shown at three instants in time: a, b and c.The vectorial component recorded by leads I, II and III at each instant is marked by a red dot on thecorresponding ECG trace.
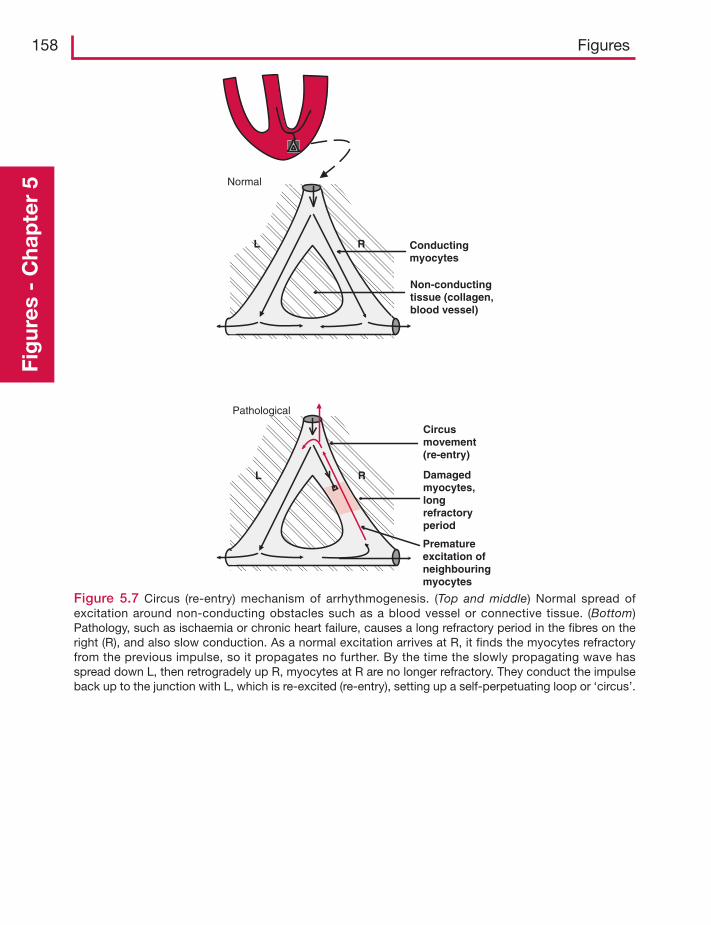
158 FiguresFi
gur
es -
Cha
pte
r 5
RL
Normal
Conductingmyocytes
Non-conductingtissue (collagen,blood vessel)
RL
Pathological
Damagedmyocytes,longrefractoryperiod
Circusmovement(re-entry)
Prematureexcitation ofneighbouringmyocytes
Figure 5.7 Circus (re-entry) mechanism of arrhythmogenesis. (Top and middle) Normal spread ofexcitation around non-conducting obstacles such as a blood vessel or connective tissue. (Bottom)Pathology, such as ischaemia or chronic heart failure, causes a long refractory period in the fibres on theright (R), and also slow conduction. As a normal excitation arrives at R, it finds the myocytes refractoryfrom the previous impulse, so it propagates no further. By the time the slowly propagating wave hasspread down L, then retrogradely up R, myocytes at R are no longer refractory. They conduct the impulseback up to the junction with L, which is re-excited (re-entry), setting up a self-perpetuating loop or ‘circus’.
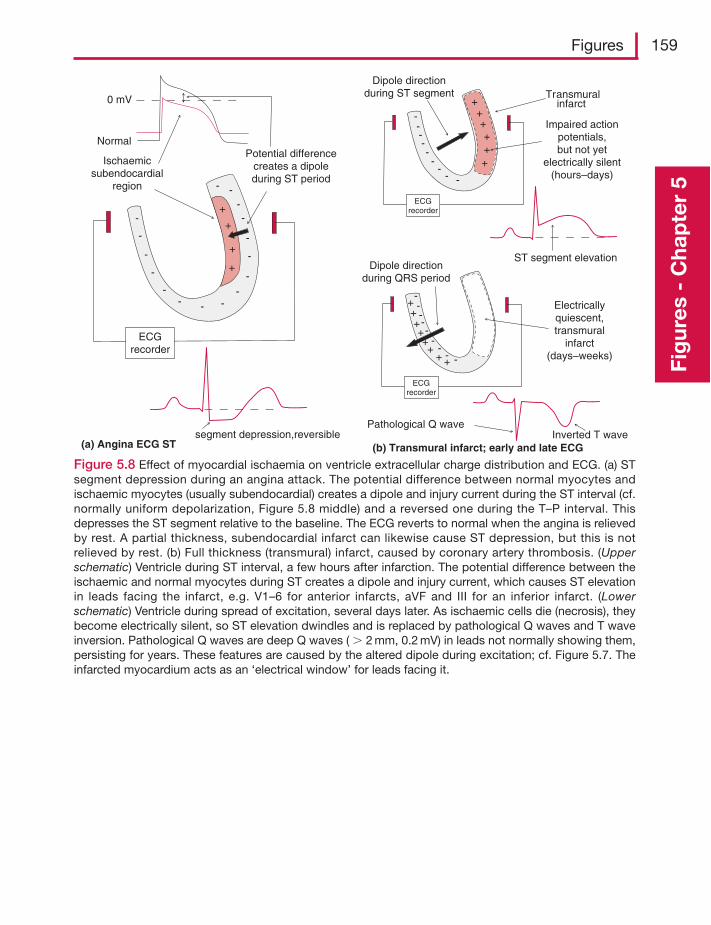
Figures 159
Fig
ures
- C
hap
ter
5
-
-
-
-
-
-
-
-- - -
-
-
-
-
+
+
+
+
-
ECGrecorder
Ischaemicsubendocardial
region
Potential differencecreates a dipoleduring ST period
0 mV
Normal
segment depression,reversible
-
-
---
--
-
-++++
ECGrecorder
Electricallyquiescent,transmural
infarct(days–weeks)
Pathological Q wave
++
+ +
Dipole directionduring QRS period
-
-
----
--
-
++++
ECGrecorder
++
ST segment elevation
Inverted T wave
Dipole directionduring ST segment
Impaired actionpotentials,but not yet
electrically silent(hours–days)
Transmuralinfarct
(b) Transmural infarct; early and late ECG(a) Angina ECG ST
Figure 5.8 Effect of myocardial ischaemia on ventricle extracellular charge distribution and ECG. (a) STsegment depression during an angina attack. The potential difference between normal myocytes andischaemic myocytes (usually subendocardial) creates a dipole and injury current during the ST interval (cf.normally uniform depolarization, Figure 5.8 middle) and a reversed one during the T–P interval. Thisdepresses the ST segment relative to the baseline. The ECG reverts to normal when the angina is relievedby rest. A partial thickness, subendocardial infarct can likewise cause ST depression, but this is notrelieved by rest. (b) Full thickness (transmural) infarct, caused by coronary artery thrombosis. (Upperschematic) Ventricle during ST interval, a few hours after infarction. The potential difference between theischaemic and normal myocytes during ST creates a dipole and injury current, which causes ST elevationin leads facing the infarct, e.g. V1–6 for anterior infarcts, aVF and III for an inferior infarct. (Lowerschematic) Ventricle during spread of excitation, several days later. As ischaemic cells die (necrosis), theybecome electrically silent, so ST elevation dwindles and is replaced by pathological Q waves and T waveinversion. Pathological Q waves are deep Q waves ( 2 mm, 0.2 mV) in leads not normally showing them,persisting for years. These features are caused by the altered dipole during excitation; cf. Figure 5.7. Theinfarcted myocardium acts as an ‘electrical window’ for leads facing it.
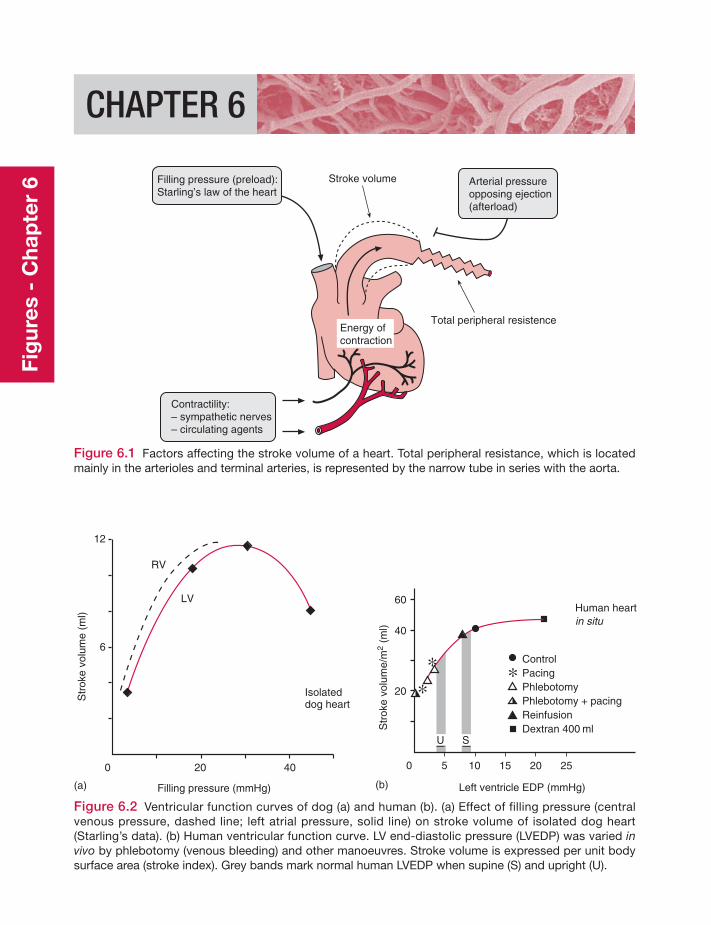
Fig
ures
- C
hap
ter
6
CHAPTER 6
Figure 6.1 Factors affecting the stroke volume of a heart. Total peripheral resistance, which is locatedmainly in the arterioles and terminal arteries, is represented by the narrow tube in series with the aorta.
Total peripheral resistence
Stroke volume
Contractility:– sympathetic nerves– circulating agents
Energy ofcontraction
Filling pressure (preload):Starling’s law of the heart
Arterial pressureopposing ejection(afterload)
LV
RV
Isolateddog heart
Filling pressure (mmHg)(a)
0 20 40
12
6
Str
oke
volu
me
(ml)
Human heartin situ
Left ventricle EDP (mmHg)(b)
0 5
60
40
Str
oke
volu
me/
m2
(ml)
10 15 20 25
20
ControlPacingPhlebotomyPhlebotomy + pacingReinfusionDextran 400 ml
U S
Figure 6.2 Ventricular function curves of dog (a) and human (b). (a) Effect of filling pressure (centralvenous pressure, dashed line; left atrial pressure, solid line) on stroke volume of isolated dog heart(Starling’s data). (b) Human ventricular function curve. LV end-diastolic pressure (LVEDP) was varied invivo by phlebotomy (venous bleeding) and other manoeuvres. Stroke volume is expressed per unit bodysurface area (stroke index). Grey bands mark normal human LVEDP when supine (S) and upright (U).
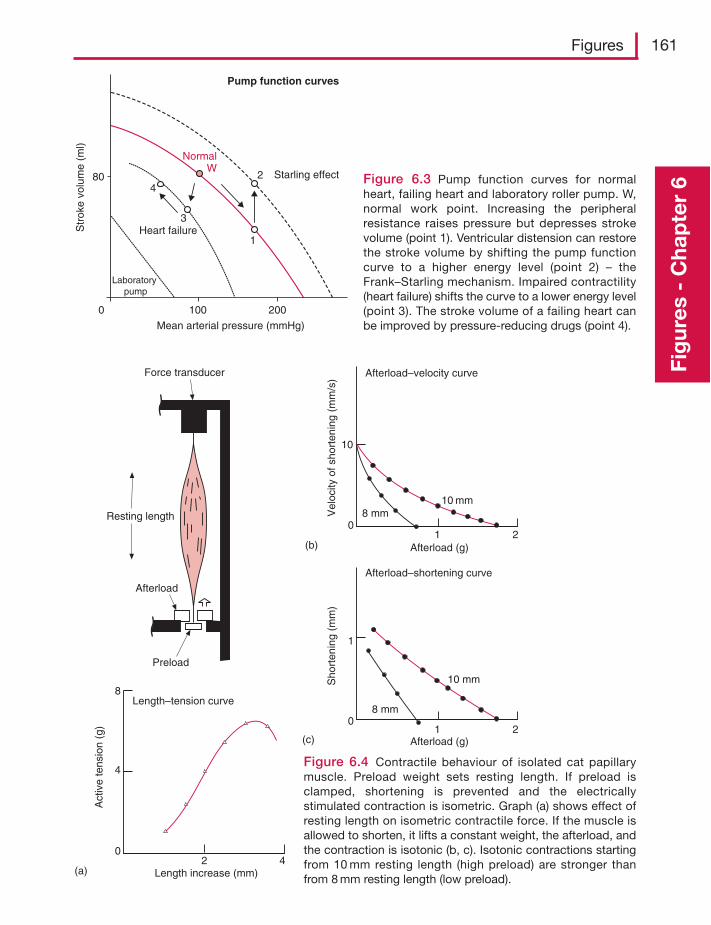
Figures 161
Fig
ures
- C
hap
ter
6Figure 6.3 Pump function curves for normalheart, failing heart and laboratory roller pump. W,normal work point. Increasing the peripheralresistance raises pressure but depresses strokevolume (point 1). Ventricular distension can restorethe stroke volume by shifting the pump functioncurve to a higher energy level (point 2) – theFrank–Starling mechanism. Impaired contractility(heart failure) shifts the curve to a lower energy level(point 3). The stroke volume of a failing heart canbe improved by pressure-reducing drugs (point 4).
0 100 200
80
Str
oke
volu
me
(ml)
Laboratory pump
Heart failure
NormalW
Starling effect2
1
3
4
Mean arterial pressure (mmHg)
Pump function curves
Resting length
Length–tension curve
Afterload–shortening curve
Afterload–velocity curve
Length increase (mm)2 4
4
8
0
(a)
Act
ive
tens
ion
(g)
Vel
ocity
of s
hort
enin
g (m
m/s
)S
hort
enin
g (m
m)
(b)
(c)
10
0
0
1
1 2
1 2
8 mm10 mm
Afterload (g)
Afterload (g)
10 mm
8 mm
Preload
Afterload
Force transducer
Figure 6.4 Contractile behaviour of isolated cat papillarymuscle. Preload weight sets resting length. If preload isclamped, shortening is prevented and the electricallystimulated contraction is isometric. Graph (a) shows effect ofresting length on isometric contractile force. If the muscle isallowed to shorten, it lifts a constant weight, the afterload, andthe contraction is isotonic (b, c). Isotonic contractions startingfrom 10 mm resting length (high preload) are stronger thanfrom 8 mm resting length (low preload).
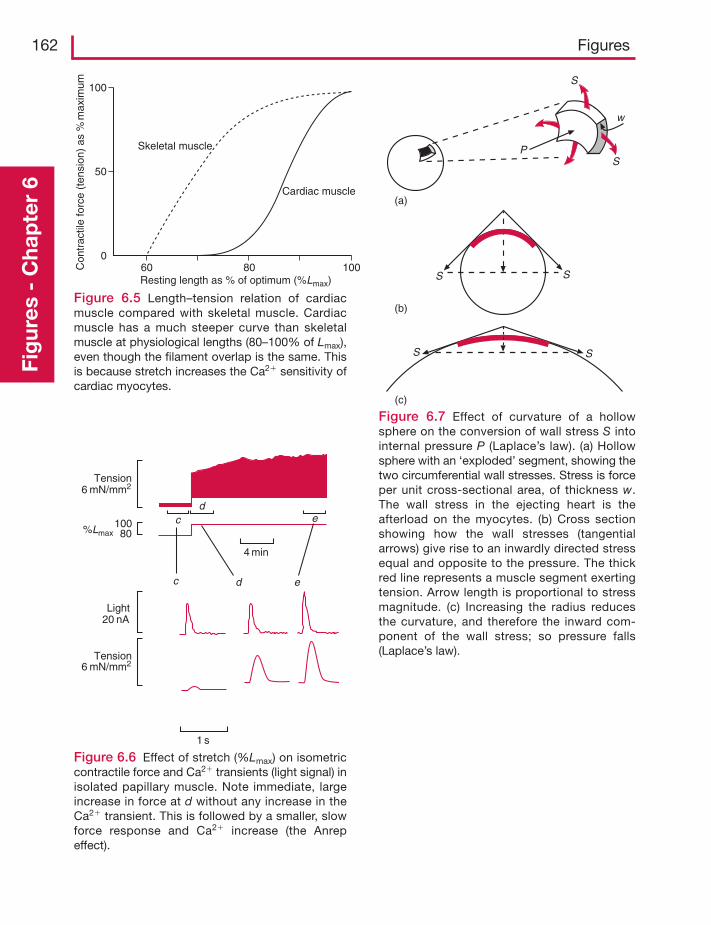
162 FiguresFi
gur
es -
Cha
pte
r 6
100
50
0
Con
trac
tile
forc
e (t
ensi
on)
as %
max
imum
Skeletal muscle
Cardiac muscle
60 80 100Resting length as % of optimum (%Lmax)
Figure 6.5 Length–tension relation of cardiacmuscle compared with skeletal muscle. Cardiacmuscle has a much steeper curve than skeletalmuscle at physiological lengths (80–100% of Lmax),even though the filament overlap is the same. Thisis because stretch increases the Ca2� sensitivity ofcardiac myocytes.
Figure 6.6 Effect of stretch (%Lmax) on isometriccontractile force and Ca2� transients (light signal) inisolated papillary muscle. Note immediate, largeincrease in force at d without any increase in theCa2� transient. This is followed by a smaller, slowforce response and Ca2� increase (the Anrepeffect).
c ed
dc e
4 min
Tension6 mN/mm2
6 mN/mm2
%Lmax10080
Tension
Light20 nA
1 s
S
w
SP
(a)
(b)
SS
SS
(c)
Figure 6.7 Effect of curvature of a hollowsphere on the conversion of wall stress S intointernal pressure P (Laplace’s law). (a) Hollowsphere with an ‘exploded’ segment, showing thetwo circumferential wall stresses. Stress is forceper unit cross-sectional area, of thickness w.The wall stress in the ejecting heart is theafterload on the myocytes. (b) Cross sectionshowing how the wall stresses (tangentialarrows) give rise to an inwardly directed stressequal and opposite to the pressure. The thickred line represents a muscle segment exertingtension. Arrow length is proportional to stressmagnitude. (c) Increasing the radius reducesthe curvature, and therefore the inward com-ponent of the wall stress; so pressure falls(Laplace’s law).
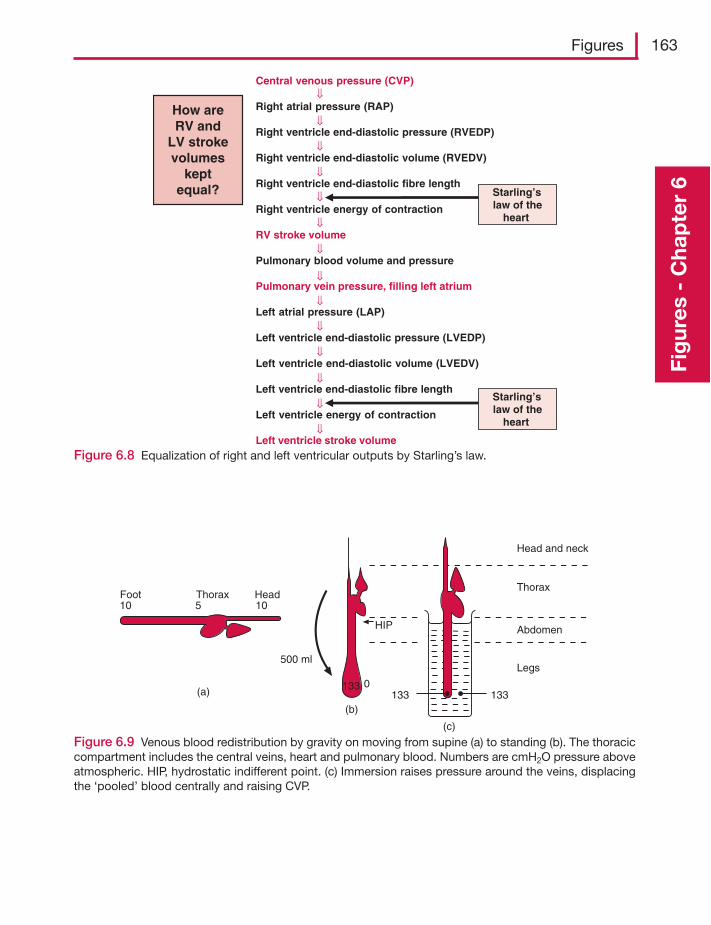
Figures 163
Fig
ures
- C
hap
ter
6
Figure 6.8 Equalization of right and left ventricular outputs by Starling’s law.
Central venous pressure (CVP)
Right atrial pressure (RAP)
Right ventricle end-diastolic pressure (RVEDP)
Right ventricle end-diastolic volume (RVEDV)
Right ventricle end-diastolic fibre length
Right ventricle energy of contraction
RV stroke volume
Pulmonary blood volume and pressure
Pulmonary vein pressure, filling left atrium
Left atrial pressure (LAP)
Left ventricle end-diastolic pressure (LVEDP)
Left ventricle end-diastolic volume (LVEDV)
Left ventricle end-diastolic fibre length
Left ventricle energy of contraction
Left ventricle stroke volume
How areRV and
LV strokevolumes
keptequal? Starling’s
law of theheart
Starling’slaw of the
heart
⇓
⇓
⇓
⇓
⇓
⇓
⇓
⇓
⇓
⇓
⇓
⇓
⇓
⇓
Figure 6.9 Venous blood redistribution by gravity on moving from supine (a) to standing (b). The thoraciccompartment includes the central veins, heart and pulmonary blood. Numbers are cmH2O pressure aboveatmospheric. HIP, hydrostatic indifferent point. (c) Immersion raises pressure around the veins, displacingthe ‘pooled’ blood centrally and raising CVP.
Foot Thorax Head10 105
(a)
500 ml
133
HIP
1330
133(b)
(c)
Head and neck
Thorax
Abdomen
Legs
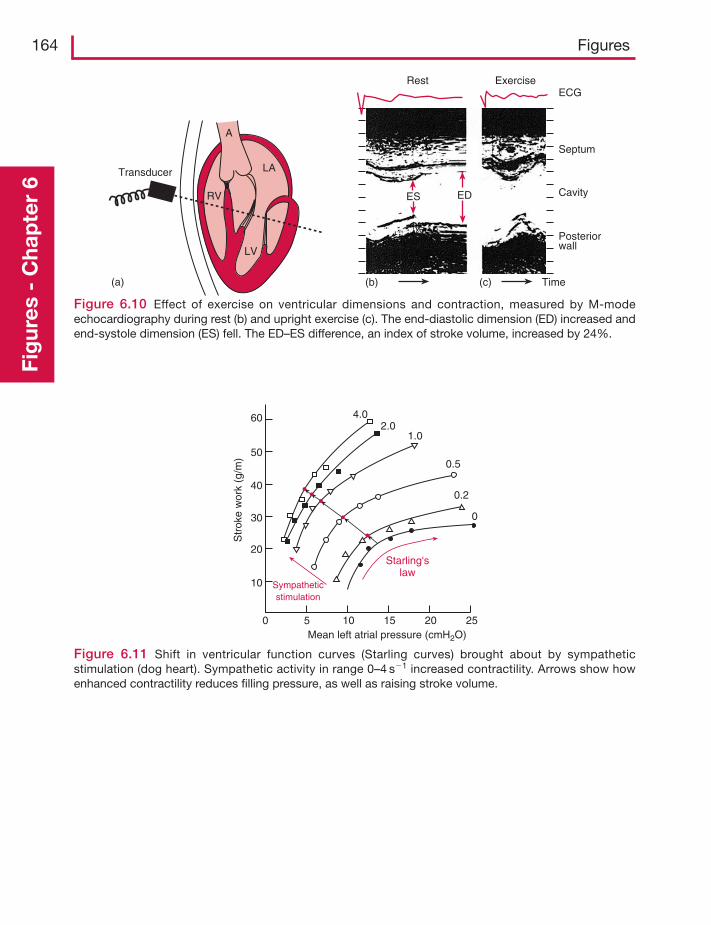
164 FiguresFi
gur
es -
Cha
pte
r 6
Figure 6.10 Effect of exercise on ventricular dimensions and contraction, measured by M-modeechocardiography during rest (b) and upright exercise (c). The end-diastolic dimension (ED) increased andend-systole dimension (ES) fell. The ED–ES difference, an index of stroke volume, increased by 24%.
Transducer
(a)
LA
LV
A
RV
Rest ExerciseECG
Septum
Cavity
Posteriorwall
ES ED
(b) (c) Time
Figure 6.11 Shift in ventricular function curves (Starling curves) brought about by sympatheticstimulation (dog heart). Sympathetic activity in range 0–4 s�1 increased contractility. Arrows show howenhanced contractility reduces filling pressure, as well as raising stroke volume.
60
50
40
30
20
10
0 5
Sympatheticstimulation
Starling'slaw
10 15 20 25Mean left atrial pressure (cmH2O)
Str
oke
wor
k (g
/m)
4.02.0
1.0
0.5
0.2
0
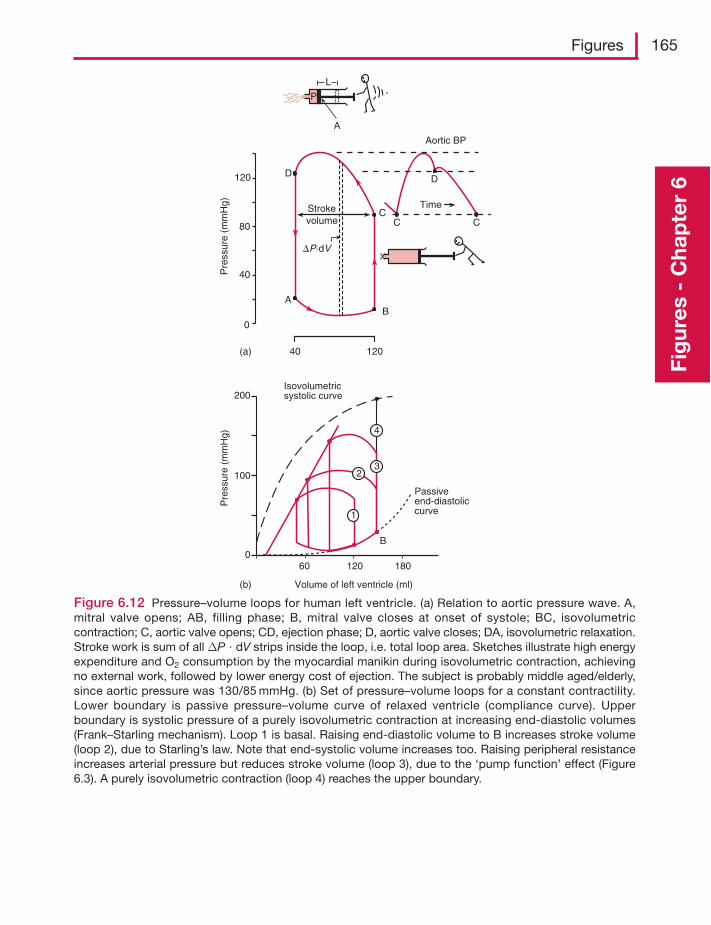
Figures 165
Fig
ures
- C
hap
ter
6
Figure 6.12 Pressure–volume loops for human left ventricle. (a) Relation to aortic pressure wave. A,mitral valve opens; AB, filling phase; B, mitral valve closes at onset of systole; BC, isovolumetriccontraction; C, aortic valve opens; CD, ejection phase; D, aortic valve closes; DA, isovolumetric relaxation.Stroke work is sum of all ΔP � dV strips inside the loop, i.e. total loop area. Sketches illustrate high energyexpenditure and O2 consumption by the myocardial manikin during isovolumetric contraction, achievingno external work, followed by lower energy cost of ejection. The subject is probably middle aged/elderly,since aortic pressure was 130/85 mmHg. (b) Set of pressure–volume loops for a constant contractility.Lower boundary is passive pressure–volume curve of relaxed ventricle (compliance curve). Upperboundary is systolic pressure of a purely isovolumetric contraction at increasing end-diastolic volumes(Frank–Starling mechanism). Loop 1 is basal. Raising end-diastolic volume to B increases stroke volume(loop 2), due to Starling’s law. Note that end-systolic volume increases too. Raising peripheral resistanceincreases arterial pressure but reduces stroke volume (loop 3), due to the ‘pump function’ effect (Figure6.3). A purely isovolumetric contraction (loop 4) reaches the upper boundary.
Pre
ssur
e (m
mH
g)
120
80
40
0
(a) 40 120
A
D
B
B
CC C
D
Time
Aortic BP
A
L
P
Strokevolume
�P·dV
Pre
ssur
e (m
mH
g)
Isovolumetricsystolic curve200
(b) Volume of left ventricle (ml)
Passiveend-diastoliccurve
100
060 120 180
4
32
1
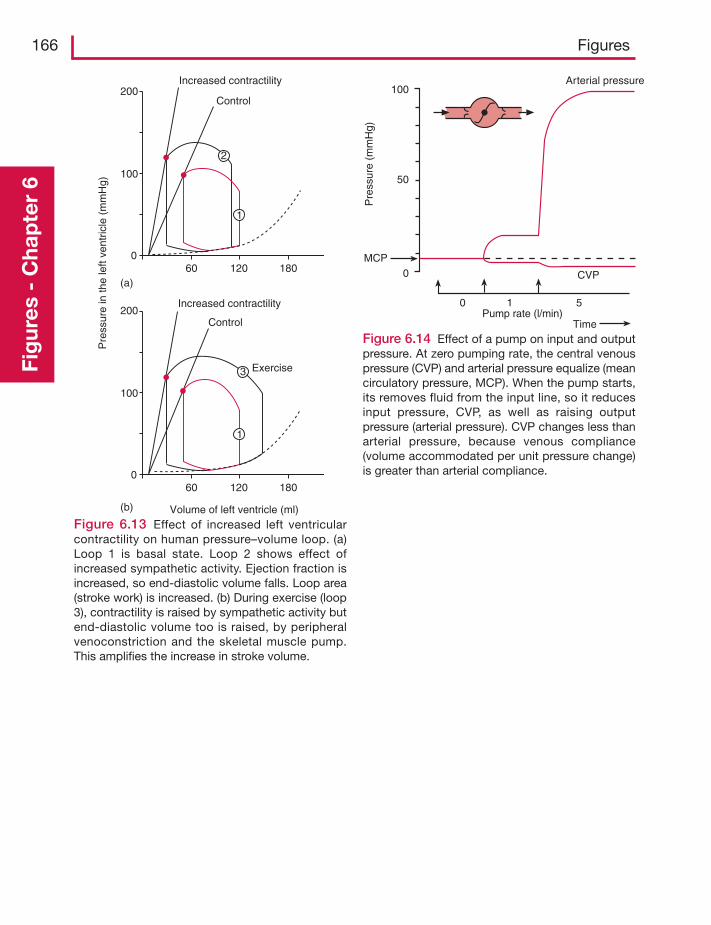
166 FiguresFi
gur
es -
Cha
pte
r 6
200
100
060 120 180
1
3
Increased contractility
Control
200
100
060 120 180
(a)
(b)
1
2
Increased contractility
Control
Volume of left ventricle (ml)
Pre
ssur
e in
the
left
vent
ricle
(m
mH
g)
Exercise
Figure 6.13 Effect of increased left ventricularcontractility on human pressure–volume loop. (a)Loop 1 is basal state. Loop 2 shows effect ofincreased sympathetic activity. Ejection fraction isincreased, so end-diastolic volume falls. Loop area(stroke work) is increased. (b) During exercise (loop3), contractility is raised by sympathetic activity butend-diastolic volume too is raised, by peripheralvenoconstriction and the skeletal muscle pump.This amplifies the increase in stroke volume.
Figure 6.14 Effect of a pump on input and outputpressure. At zero pumping rate, the central venouspressure (CVP) and arterial pressure equalize (meancirculatory pressure, MCP). When the pump starts,its removes fluid from the input line, so it reducesinput pressure, CVP, as well as raising outputpressure (arterial pressure). CVP changes less thanarterial pressure, because venous compliance(volume accommodated per unit pressure change)is greater than arterial compliance.
Arterial pressure
Pre
ssur
e (m
mH
g)
Pump rate (l/min)Time
CVP
MCP0
50
100
0 1 5
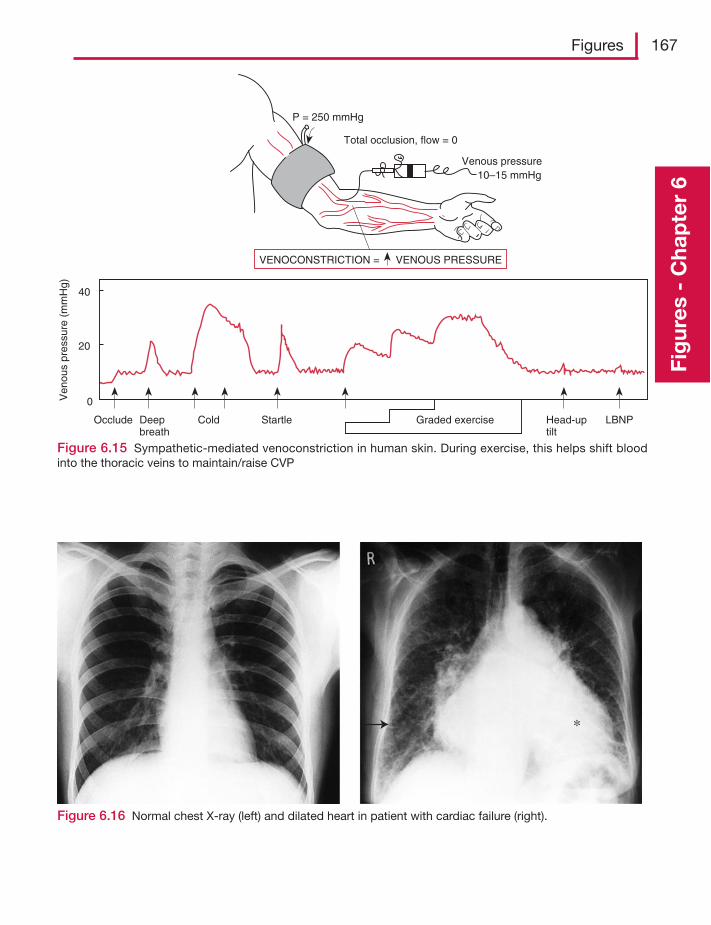
Figures 167
Fig
ures
- C
hap
ter
6
Venous pressure 10–15 mmHg
P = 250 mmHg
Total occlusion, flow = 0
VENOCONSTRICTION = VENOUS PRESSURE
Occlude Deepbreath
Cold Startle Graded exercise Head-uptilt
LBNP
Ven
ous
pres
sure
(m
mH
g)
40
20
0
Figure 6.15 Sympathetic-mediated venoconstriction in human skin. During exercise, this helps shift bloodinto the thoracic veins to maintain/raise CVP
Figure 6.16 Normal chest X-ray (left) and dilated heart in patient with cardiac failure (right).
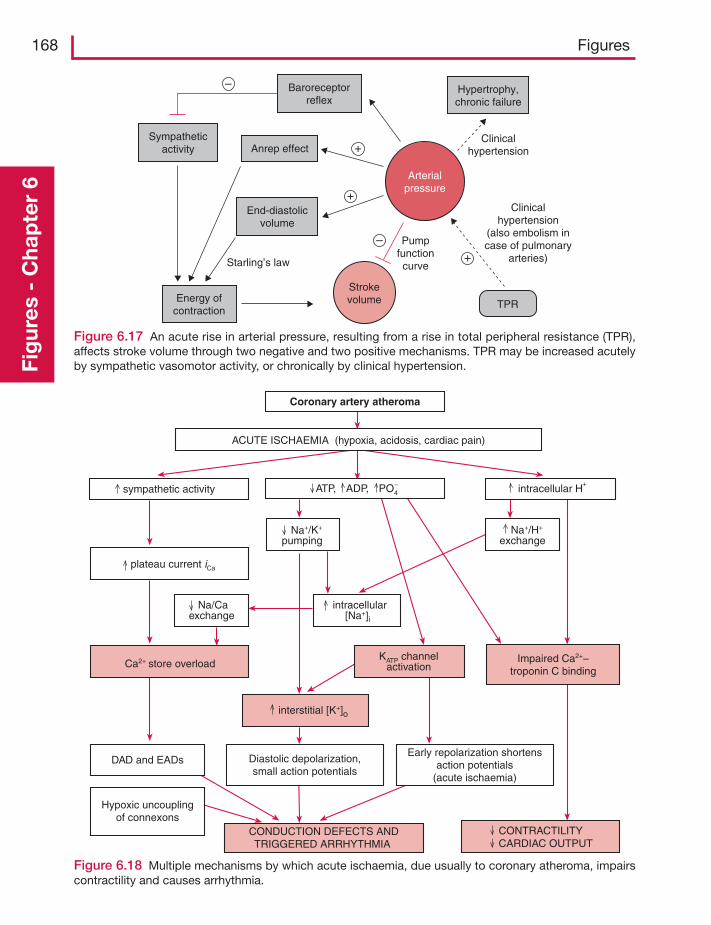
168 FiguresFi
gur
es -
Cha
pte
r 6
Figure 6.17 An acute rise in arterial pressure, resulting from a rise in total peripheral resistance (TPR),affects stroke volume through two negative and two positive mechanisms. TPR may be increased acutelyby sympathetic vasomotor activity, or chronically by clinical hypertension.
Hypertrophy,chronic failure
Clinicalhypertension
Clinicalhypertension
(also embolism incase of pulmonary
arteries)
Pumpfunctioncurve
End-diastolicvolume
Anrep effectSympathetic
activity
Energy ofcontraction
Starling’s law
Arterialpressure
Strokevolume TPR
+
–
–
+
+
Baroreceptorreflex
Figure 6.18 Multiple mechanisms by which acute ischaemia, due usually to coronary atheroma, impairscontractility and causes arrhythmia.
Coronary artery atheroma
ACUTE ISCHAEMIA (hypoxia, acidosis, cardiac pain)
ATP, ADP, PO4– intracellular H
+sympathetic activity
plateau current iCa
Ca2+ store overload
DAD and EADs
Hypoxic uncouplingof connexons
CONDUCTION DEFECTS ANDTRIGGERED ARRHYTHMIA
Diastolic depolarization,small action potentials
Early repolarization shortensaction potentials
(acute ischaemia)
interstitial [K+]o
KATP channelactivation
Impaired Ca2+–troponin C binding
CONTRACTILITYCARDIAC OUTPUT
Na+/K+
pumping Na+/H+
exchange
Na/Caexchange
intracellular[Na+]i
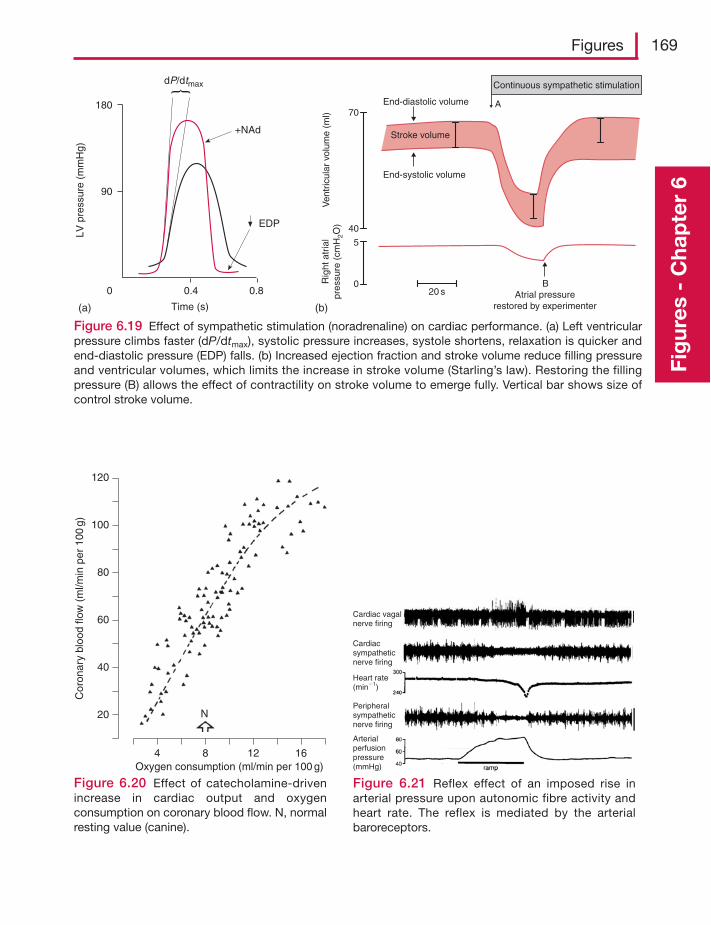
Figures 169
Fig
ures
- C
hap
ter
6
Figure 6.19 Effect of sympathetic stimulation (noradrenaline) on cardiac performance. (a) Left ventricularpressure climbs faster (dP/dtmax), systolic pressure increases, systole shortens, relaxation is quicker andend-diastolic pressure (EDP) falls. (b) Increased ejection fraction and stroke volume reduce filling pressureand ventricular volumes, which limits the increase in stroke volume (Starling’s law). Restoring the fillingpressure (B) allows the effect of contractility on stroke volume to emerge fully. Vertical bar shows size ofcontrol stroke volume.
0 0.4 0.8
Time (s)
90
180
EDP
+NAd
dP/dtmaxLV
pre
ssur
e (m
mH
g)
(a) (b)
20 s
40
70
Ven
tric
ular
vol
ume
(ml)
0
5
Rig
ht a
tria
lpr
essu
re (
cmH
2O)
Stroke volume
BAtrial pressure
restored by experimenter
End-systolic volume
End-diastolic volume
Continuous sympathetic stimulation
A
Figure 6.20 Effect of catecholamine-drivenincrease in cardiac output and oxygenconsumption on coronary blood flow. N, normalresting value (canine).
4 8 12 16
N
Oxygen consumption (ml/min per 100 g)
120
100
80
60
40
20
Cor
onar
y bl
ood
flow
(m
l/min
per
100
g)
Figure 6.21 Reflex effect of an imposed rise inarterial pressure upon autonomic fibre activity andheart rate. The reflex is mediated by the arterialbaroreceptors.
Cardiac vagalnerve firing
Cardiacsympatheticnerve firing
Peripheralsympatheticnerve firing
Heart rate(min�1)
Arterialperfusionpressure(mmHg)
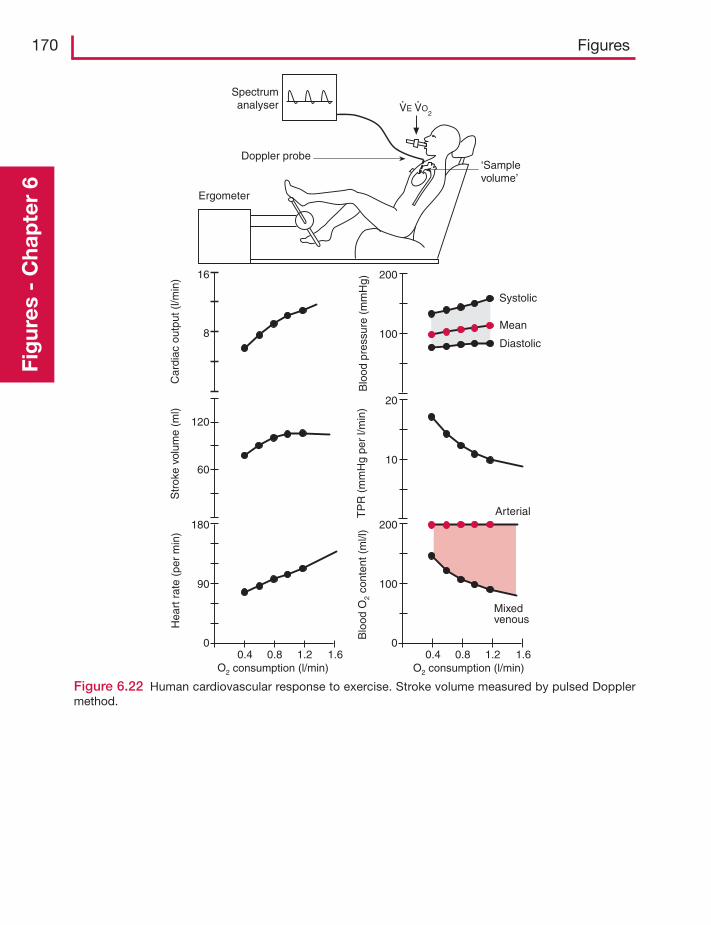
170 FiguresFi
gur
es -
Cha
pte
r 6
Figure 6.22 Human cardiovascular response to exercise. Stroke volume measured by pulsed Dopplermethod.
180
90
00.4 0.8 1.2 1.6
O2 consumption (l/min)
60
120
8
16
Str
oke
volu
me
(ml)
Hea
rt r
ate
(per
min
)C
ardi
ac o
utpu
t (l/m
in)
200
100
00.4 0.8 1.2 1.6
Blo
odO
2 co
nten
t (m
l/l)
O2 consumption (l/min)
Mixedvenous
20
10
200
100
ArterialTP
R (
mm
Hg
per
l/min
)B
lood
pre
ssur
e (m
mH
g)
Systolic
Mean
Diastolic
‘Samplevolume’
Spectrumanalyser
Doppler probe
Ergometer
VE VO2
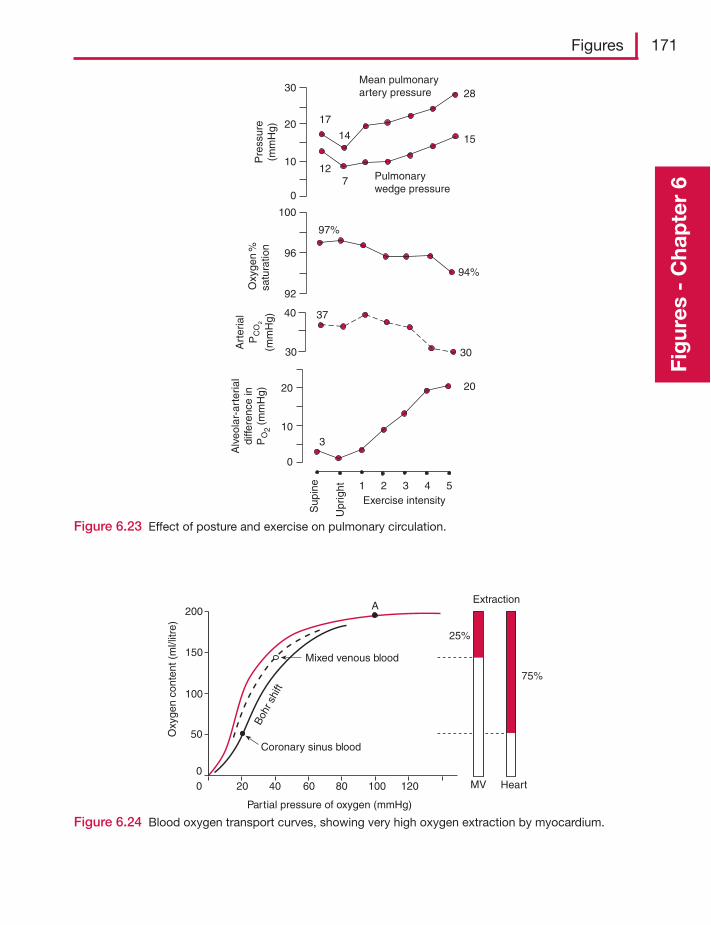
Figures 171
Fig
ures
- C
hap
ter
6
Figure 6.23 Effect of posture and exercise on pulmonary circulation.
Alv
eola
r-ar
teria
ldi
ffere
nce
inP
O2
(mm
Hg)
Sup
ine
Upr
ight 54321
Exercise intensity
0
10
20
Art
eria
lP
CO
2
(mm
Hg)
30
40
Oxy
gen
%sa
tura
tion
92
96
100
Pre
ssur
e(m
mH
g)
Mean pulmonaryartery pressure
Pulmonarywedge pressure
30
20
10
0
17
14
28
127
15
97%
94%
37
30
3
20
Figure 6.24 Blood oxygen transport curves, showing very high oxygen extraction by myocardium.
200
150
100
50
00 20 40 60 80 100 120
Partial pressure of oxygen (mmHg)
Coronary sinus blood
Mixed venous blood
Boh
r shi
ft
Oxy
gen
cont
ent (
ml/l
itre)
AExtraction
25%
75%
HeartMV
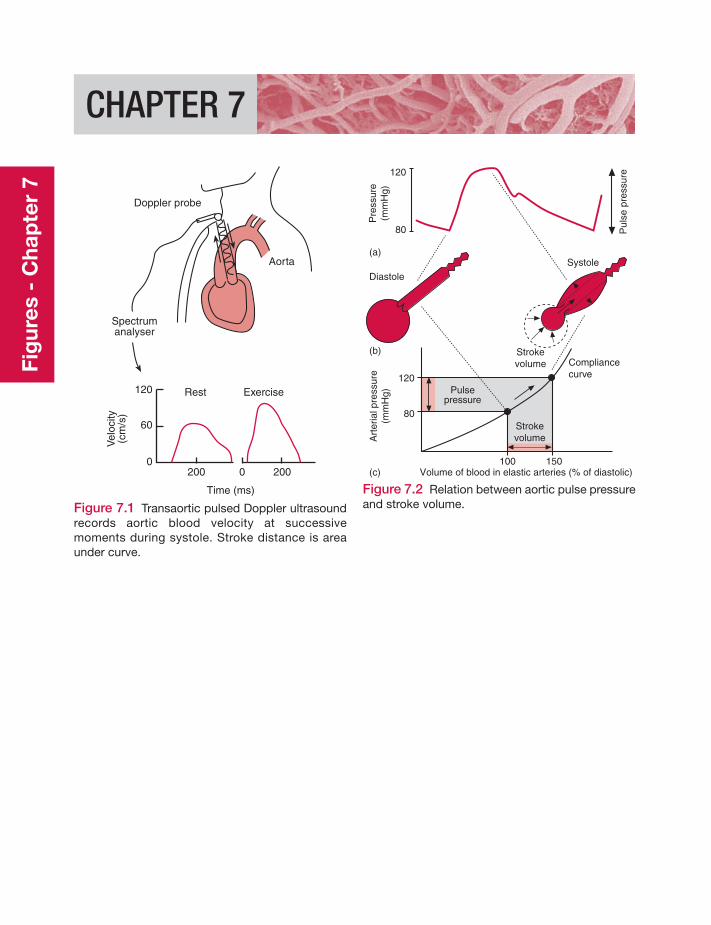
Fig
ures
- C
hap
ter
7
CHAPTER 7
Figure 7.1 Transaortic pulsed Doppler ultrasoundrecords aortic blood velocity at successivemoments during systole. Stroke distance is areaunder curve.
Rest Exercise120
60
0200 2000
Time (ms)
Vel
ocity
(cm
/s)
Doppler probe
Aorta
Spectrumanalyser
Figure 7.2 Relation between aortic pulse pressureand stroke volume.
120
80
100 150
Diastole
(a)
(b)
(c)
Systole
Strokevolume
120
80
Pre
ssur
e(m
mH
g)
Pul
se p
ress
ure
Art
eria
l pre
ssur
e(m
mH
g)
Volume of blood in elastic arteries (% of diastolic)
Compliancecurve
Pulsepressure
Strokevolume
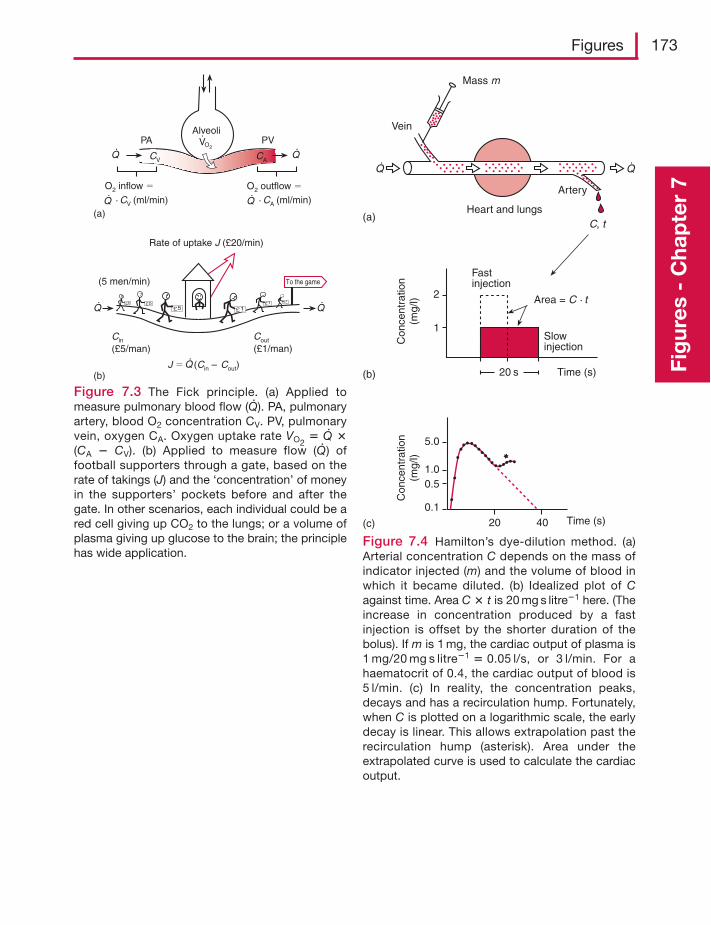
Figures 173
Fig
ures
- C
hap
ter
7
PVPA
CV CA
AlveoliVO2
O2 inflow � O2 outflow �
· CV (ml/min) · CA (ml/min)
To the game
Rate of uptake J (£20/min)
(5 men/min)
Cin
(£5/man)Cout
(£1/man)
J � (Cin – Cout)
(a)
(b)
Mass m
Vein
Artery
Heart and lungs(a)
Q
C, t
20 s Time (s)(b)
2
1
Fastinjection
Con
cent
ratio
n(m
g/l)
Con
cent
ratio
n(m
g/l)
Slowinjection
Area = C · t
(c) 20 40 Time (s)
5.0
1.00.5
0.1
Q
Figure 7.3 The Fick principle. (a) Applied tomeasure pulmonary blood flow (Q· ). PA, pulmonaryartery, blood O2 concentration CV. PV, pulmonaryvein, oxygen CA. Oxygen uptake rate VO2
� Q· �(CA � CV). (b) Applied to measure flow (Q· ) offootball supporters through a gate, based on therate of takings (J) and the ‘concentration’ of moneyin the supporters’ pockets before and after thegate. In other scenarios, each individual could be ared cell giving up CO2 to the lungs; or a volume ofplasma giving up glucose to the brain; the principlehas wide application.
Figure 7.4 Hamilton’s dye-dilution method. (a)Arterial concentration C depends on the mass ofindicator injected (m) and the volume of blood inwhich it became diluted. (b) Idealized plot of Cagainst time. Area C � t is 20 mg s litre�1 here. (Theincrease in concentration produced by a fastinjection is offset by the shorter duration of thebolus). If m is 1 mg, the cardiac output of plasma is1 mg/20 mg s litre�1 � 0.05 l/s, or 3 l/min. For ahaematocrit of 0.4, the cardiac output of blood is5 l/min. (c) In reality, the concentration peaks,decays and has a recirculation hump. Fortunately,when C is plotted on a logarithmic scale, the earlydecay is linear. This allows extrapolation past therecirculation hump (asterisk). Area under theextrapolated curve is used to calculate the cardiacoutput.
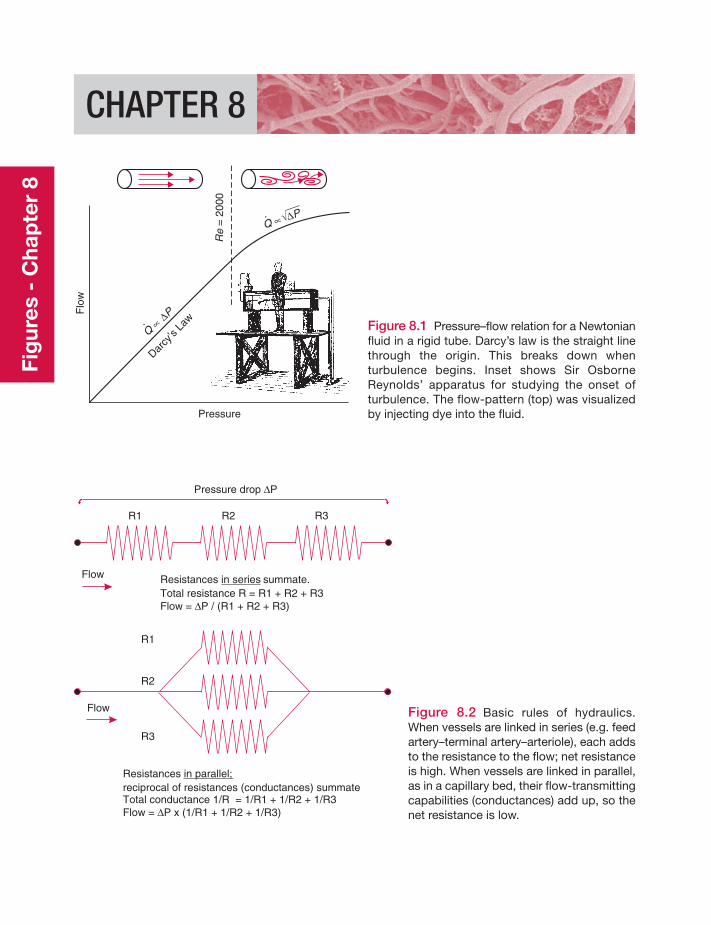
Fig
ures
- C
hap
ter
8
CHAPTER 8
Figure 8.1 Pressure–flow relation for a Newtonianfluid in a rigid tube. Darcy’s law is the straight linethrough the origin. This breaks down whenturbulence begins. Inset shows Sir OsborneReynolds’ apparatus for studying the onset ofturbulence. The flow-pattern (top) was visualizedby injecting dye into the fluid.Pressure
Flo
w
Re
= 2
000
Darcy
’s La
wQ
∝ΔP
Q ∝ ΔP
Figure 8.2 Basic rules of hydraulics.When vessels are linked in series (e.g. feedartery–terminal artery–arteriole), each addsto the resistance to the flow; net resistanceis high. When vessels are linked in parallel,as in a capillary bed, their flow-transmittingcapabilities (conductances) add up, so thenet resistance is low.
Pressure drop PΔ
Resistances summate.Total resistance R = R1 + R2 + R3Flow = P / (R1 + R2 + R3)
in series
Δ
Resistancesreciprocal of resistances (conductances) summateTotal conductance 1/R = 1/R1 + 1/R2 + 1/R3Flow = P x (1/R1 + 1/R2 + 1/R3)
in parallel;
Δ
R1
R2
R3
Flow
R1 R2 R3
Flow
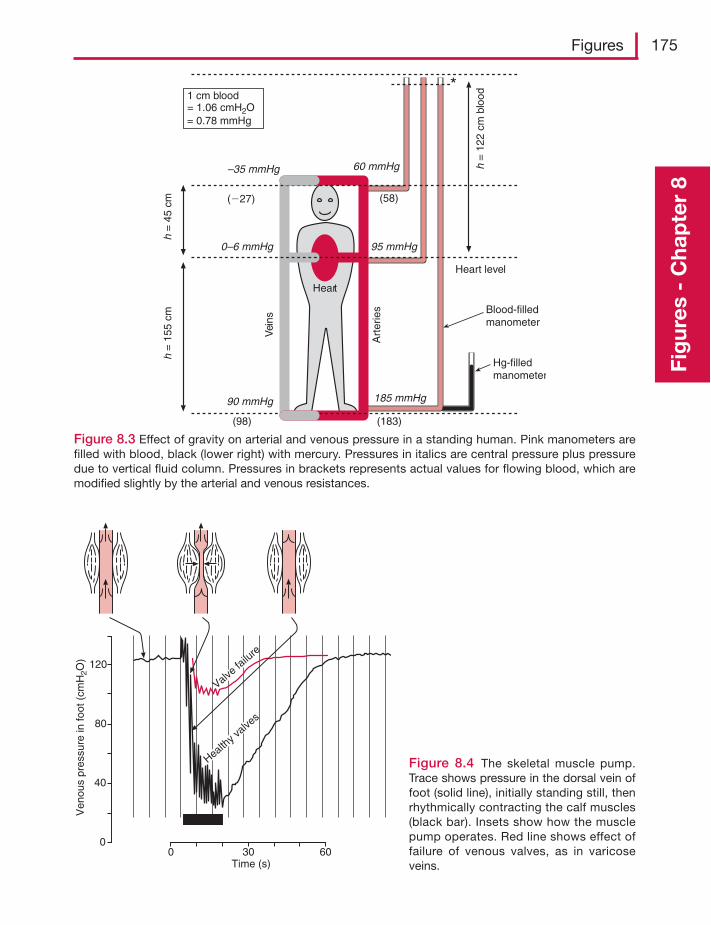
Figures 175
Fig
ures
- C
hap
ter
8
Figure 8.3 Effect of gravity on arterial and venous pressure in a standing human. Pink manometers arefilled with blood, black (lower right) with mercury. Pressures in italics are central pressure plus pressuredue to vertical fluid column. Pressures in brackets represents actual values for flowing blood, which aremodified slightly by the arterial and venous resistances.
Heart
185 mmHg
(183)
90 mmHg
95 mmHg0–6 mmHg
60 mmHg–35 mmHg
(58)(�27)
(98)
Heart level
Blood-filledmanometer
Hg-filledmanometer
Art
erie
s
Vei
ns
h =
122
cm
blo
od
h =
45
cmh
= 1
55 c
m
1 cm blood= 1.06 cmH2O= 0.78 mmHg
0
40
80
120
Ven
ous
pres
sure
in fo
ot (
cmH
2O)
Valve fa
ilure
Healthy v
alves
0 30 60Time (s)
Figure 8.4 The skeletal muscle pump.Trace shows pressure in the dorsal vein offoot (solid line), initially standing still, thenrhythmically contracting the calf muscles(black bar). Insets show how the musclepump operates. Red line shows effect offailure of venous valves, as in varicoseveins.
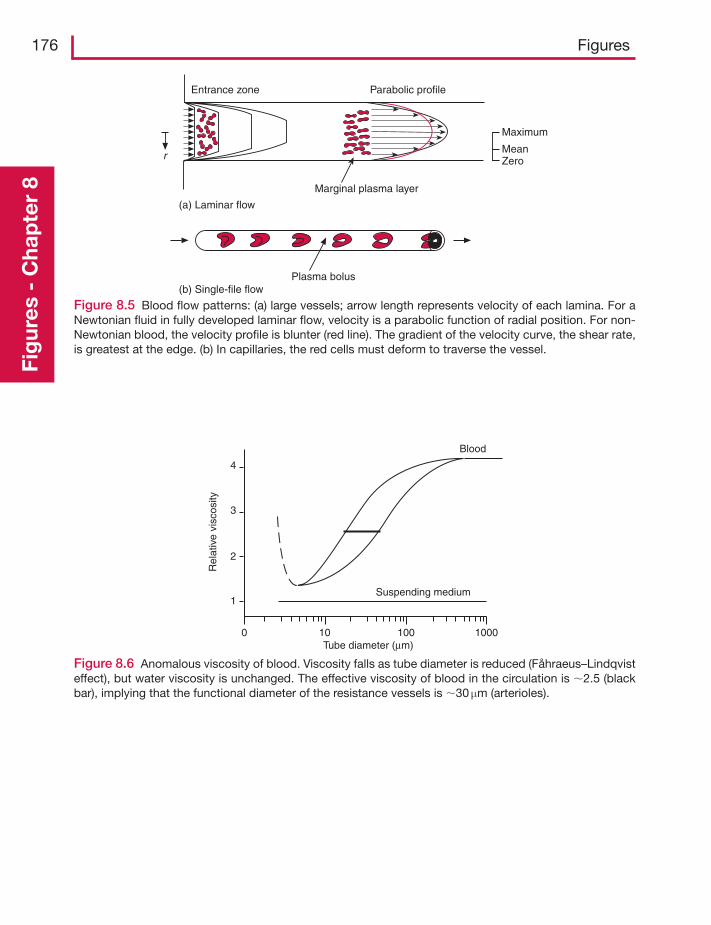
176 FiguresFi
gur
es -
Cha
pte
r 8
Entrance zone Parabolic profile
Marginal plasma layer
Maximum
MeanZero
(a) Laminar flow
(b) Single-file flow
r
Plasma bolus
Figure 8.5 Blood flow patterns: (a) large vessels; arrow length represents velocity of each lamina. For aNewtonian fluid in fully developed laminar flow, velocity is a parabolic function of radial position. For non-Newtonian blood, the velocity profile is blunter (red line). The gradient of the velocity curve, the shear rate,is greatest at the edge. (b) In capillaries, the red cells must deform to traverse the vessel.
Figure 8.6 Anomalous viscosity of blood. Viscosity falls as tube diameter is reduced (Fåhraeus–Lindqvisteffect), but water viscosity is unchanged. The effective viscosity of blood in the circulation is �2.5 (blackbar), implying that the functional diameter of the resistance vessels is �30 μm (arterioles).
Blood
Suspending medium
Rel
ativ
e vi
scos
ity
4
3
2
1
100 100 1000Tube diameter (μm)
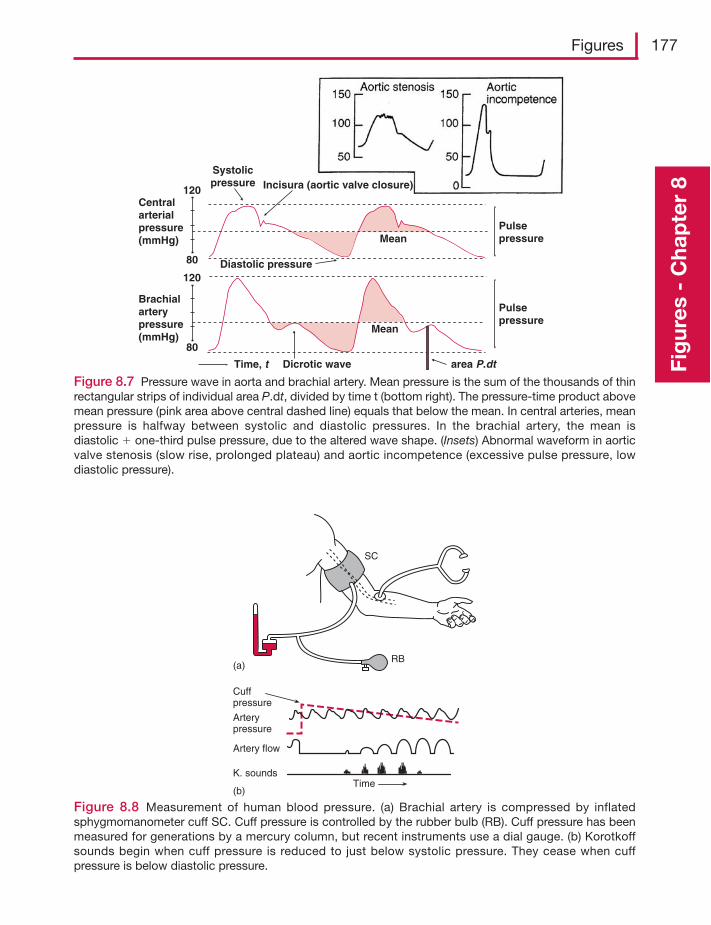
Figures 177
Fig
ures
- C
hap
ter
8
Figure 8.7 Pressure wave in aorta and brachial artery. Mean pressure is the sum of the thousands of thinrectangular strips of individual area P.dt, divided by time t (bottom right). The pressure-time product abovemean pressure (pink area above central dashed line) equals that below the mean. In central arteries, meanpressure is halfway between systolic and diastolic pressures. In the brachial artery, the mean isdiastolic � one-third pulse pressure, due to the altered wave shape. (Insets) Abnormal waveform in aorticvalve stenosis (slow rise, prolonged plateau) and aortic incompetence (excessive pulse pressure, lowdiastolic pressure).
80
120
Time, t
Systolicpressure
Diastolic pressure
Pulsepressure
Pulsepressure
Incisura (aortic valve closure)
Centralarterialpressure(mmHg)
Brachialarterypressure(mmHg)
Dicrotic wave
Mean
area P.dt
80
120
Mean
Figure 8.8 Measurement of human blood pressure. (a) Brachial artery is compressed by inflatedsphygmomanometer cuff SC. Cuff pressure is controlled by the rubber bulb (RB). Cuff pressure has beenmeasured for generations by a mercury column, but recent instruments use a dial gauge. (b) Korotkoffsounds begin when cuff pressure is reduced to just below systolic pressure. They cease when cuffpressure is below diastolic pressure.
Cuffpressure
Arterypressure
Artery flow
K. sounds
(b)Time
(a)
SC
RB
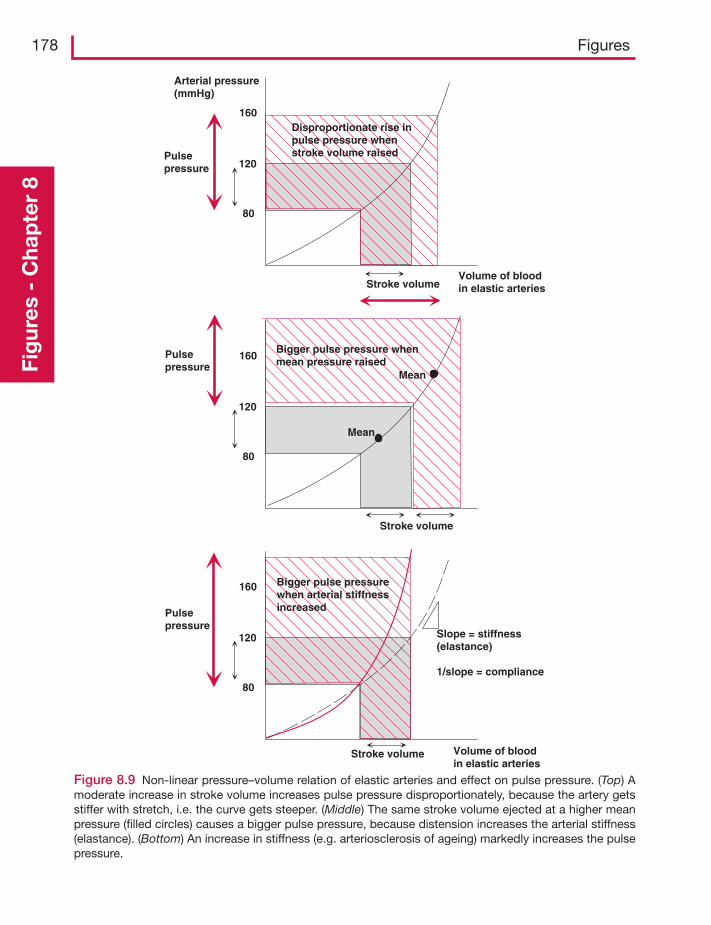
178 FiguresFi
gur
es -
Cha
pte
r 8
Figure 8.9 Non-linear pressure–volume relation of elastic arteries and effect on pulse pressure. (Top) Amoderate increase in stroke volume increases pulse pressure disproportionately, because the artery getsstiffer with stretch, i.e. the curve gets steeper. (Middle) The same stroke volume ejected at a higher meanpressure (filled circles) causes a bigger pulse pressure, because distension increases the arterial stiffness(elastance). (Bottom) An increase in stiffness (e.g. arteriosclerosis of ageing) markedly increases the pulsepressure.
Stroke volume
Arterial pressure(mmHg)
80
120
160
Volume of bloodin elastic arteries
80
120
160
Pulsepressure
Bigger pulse pressure whenmean pressure raised
Disproportionate rise inpulse pressure whenstroke volume raised
80
120
160 Bigger pulse pressurewhen arterial stiffnessincreased
Volume of bloodin elastic arteries
Pulsepressure
Pulsepressure
Stroke volume
Stroke volume
Mean
Mean
Slope = stiffness(elastance)
1/slope = compliance
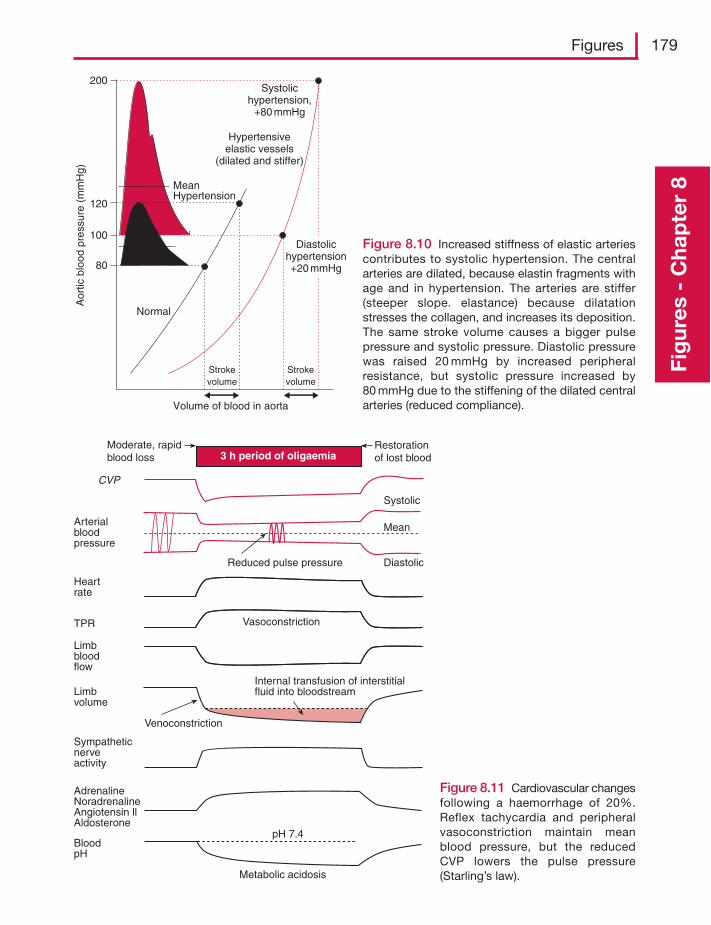
Figures 179
Fig
ures
- C
hap
ter
8
Figure 8.10 Increased stiffness of elastic arteriescontributes to systolic hypertension. The centralarteries are dilated, because elastin fragments withage and in hypertension. The arteries are stiffer(steeper slope. elastance) because dilatationstresses the collagen, and increases its deposition.The same stroke volume causes a bigger pulsepressure and systolic pressure. Diastolic pressurewas raised 20 mmHg by increased peripheralresistance, but systolic pressure increased by80 mmHg due to the stiffening of the dilated centralarteries (reduced compliance).
200
120
100
80
Normal
Strokevolume
Strokevolume
MeanHypertension
Diastolichypertension+20 mmHg
Systolichypertension,
+80 mmHg
Hypertensiveelastic vessels
(dilated and stiffer)
Aor
ticbl
ood
pres
sure
(m
mH
g)
Volume of blood in aorta
Figure 8.11 Cardiovascular changesfollowing a haemorrhage of 20%.Reflex tachycardia and peripheralvasoconstriction maintain meanblood pressure, but the reducedCVP lowers the pulse pressure(Starling’s law).
Moderate, rapidblood loss
Arterialbloodpressure
Restorationof lost blood
CVP
Systolic
Mean
DiastolicReduced pulse pressure
Heartrate
VasoconstrictionTPR
Limbbloodflow
Venoconstriction
Limbvolume
Internal transfusion of interstitialfluid into bloodstream
Sympatheticnerveactivity
AdrenalineNoradrenalineAngiotensin llAldosterone
BloodpH
Metabolic acidosis
pH 7.4
3 h period of oligaemia
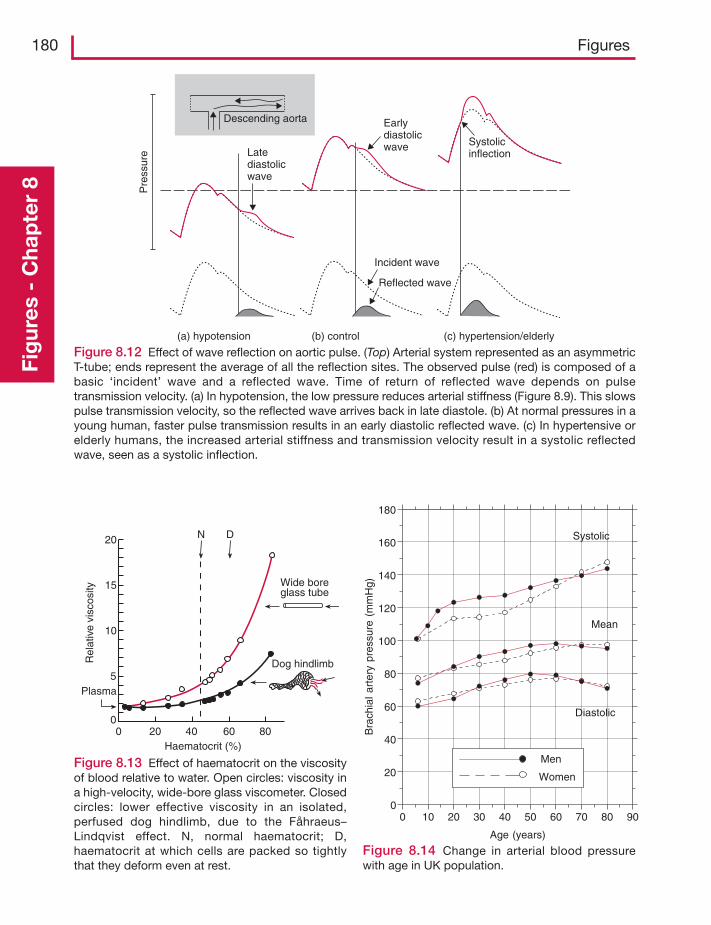
180 FiguresFi
gur
es -
Cha
pte
r 8
Descending aorta
Pre
ssur
e Latediastolicwave
Earlydiastolicwave Systolic
inflection
Incident wave
Reflected wave
(a) hypotension (b) control (c) hypertension/elderly
Figure 8.12 Effect of wave reflection on aortic pulse. (Top) Arterial system represented as an asymmetricT-tube; ends represent the average of all the reflection sites. The observed pulse (red) is composed of abasic ‘incident’ wave and a reflected wave. Time of return of reflected wave depends on pulsetransmission velocity. (a) In hypotension, the low pressure reduces arterial stiffness (Figure 8.9). This slowspulse transmission velocity, so the reflected wave arrives back in late diastole. (b) At normal pressures in ayoung human, faster pulse transmission results in an early diastolic reflected wave. (c) In hypertensive orelderly humans, the increased arterial stiffness and transmission velocity result in a systolic reflectedwave, seen as a systolic inflection.
20
15
10
5
0
Rel
ativ
e vi
scos
ity
Plasma
Wide boreglass tube
0 20 40 60 80
Dog hindlimb
Haematocrit (%)
N D
Figure 8.13 Effect of haematocrit on the viscosityof blood relative to water. Open circles: viscosity ina high-velocity, wide-bore glass viscometer. Closedcircles: lower effective viscosity in an isolated,perfused dog hindlimb, due to the Fåhraeus–Lindqvist effect. N, normal haematocrit; D,haematocrit at which cells are packed so tightlythat they deform even at rest.
0 10 20 30 40 50 60 70 80 900
20
40
60
80
100
120
140
160
180
Systolic
Mean
Diastolic
Men
Women
Age (years)
Bra
chia
lart
ery
pres
sure
(mm
Hg)
Figure 8.14 Change in arterial blood pressurewith age in UK population.
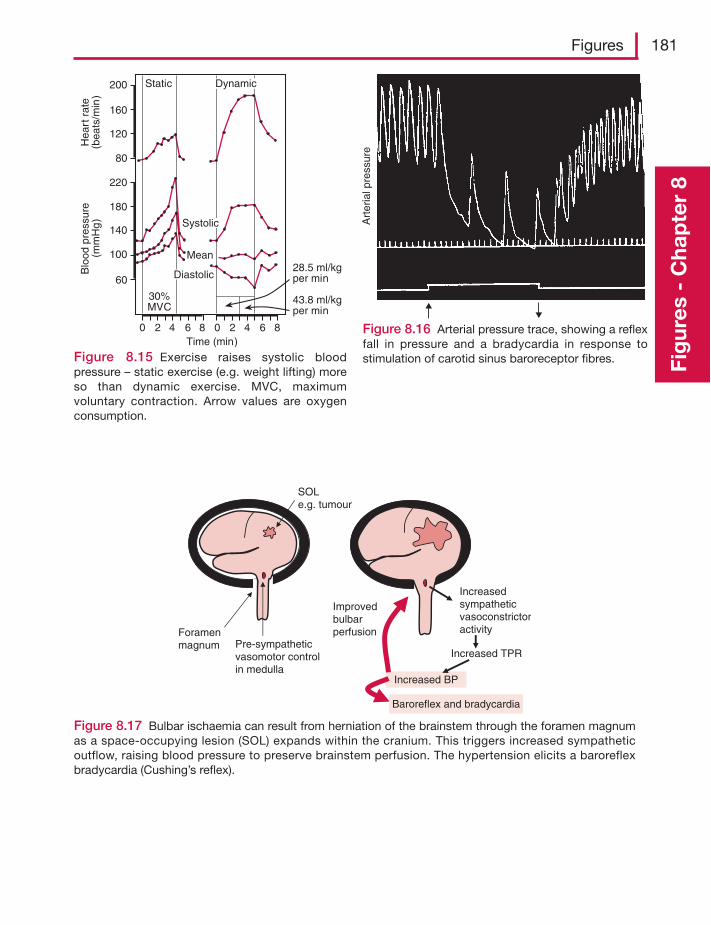
Figures 181
Fig
ures
- C
hap
ter
8
200
160
120
80
220
180
140
100
60
0 2 4 6 8 0 2 4 6 8Time (min)
Mean
30%MVC
28.5 ml/kgper min
43.8 ml/kgper min
Blo
od p
ress
ure
(mm
Hg
)H
eart
rat
e(b
eats
/min
)Static
Diastolic
Dynamic
Systolic
Figure 8.15 Exercise raises systolic bloodpressure – static exercise (e.g. weight lifting) moreso than dynamic exercise. MVC, maximumvoluntary contraction. Arrow values are oxygenconsumption.
Art
eria
l pre
ssur
e
Figure 8.16 Arterial pressure trace, showing a reflexfall in pressure and a bradycardia in response tostimulation of carotid sinus baroreceptor fibres.
SOLe.g. tumour
Foramenmagnum Pre-sympathetic
vasomotor controlin medulla
Increasedsympatheticvasoconstrictoractivity
Increased TPR
Increased BP
Improvedbulbarperfusion
Baroreflex and bradycardia
Figure 8.17 Bulbar ischaemia can result from herniation of the brainstem through the foramen magnumas a space-occupying lesion (SOL) expands within the cranium. This triggers increased sympatheticoutflow, raising blood pressure to preserve brainstem perfusion. The hypertension elicits a baroreflexbradycardia (Cushing’s reflex).
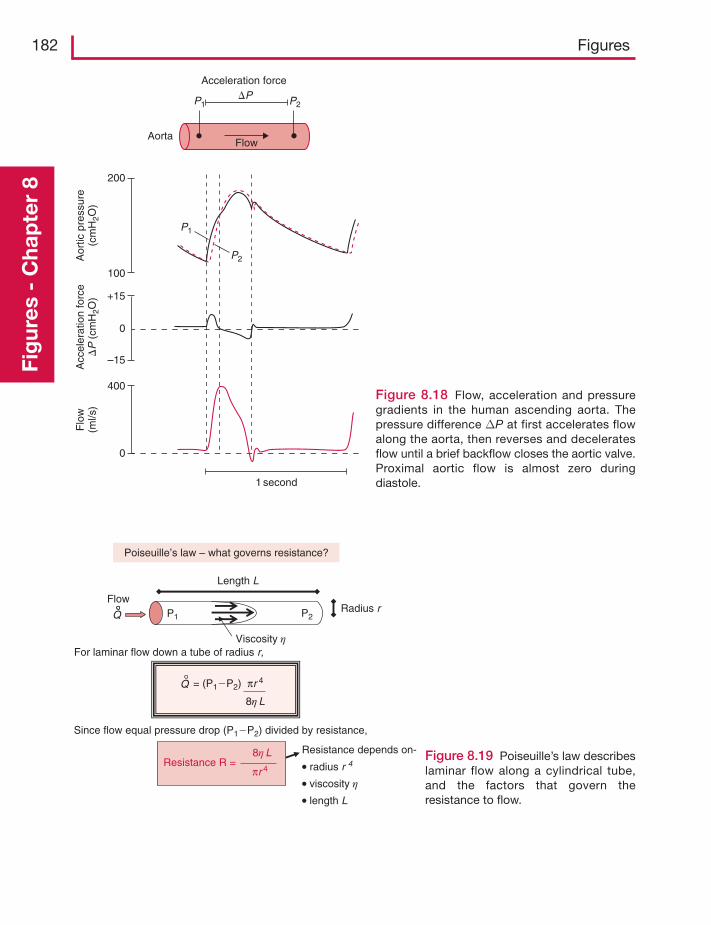
182 FiguresFi
gur
es -
Cha
pte
r 8
1 second
0
400
200
100
0
+15
–15
Aor
tic p
ress
ure
(cm
H2O
)A
ccel
erat
ion
forc
e�
P(c
mH
2O)
Flo
w(m
l/s)
Acceleration force
AortaFlow
�PP1
P1
P2
P2
Figure 8.18 Flow, acceleration and pressuregradients in the human ascending aorta. Thepressure difference ΔP at first accelerates flowalong the aorta, then reverses and deceleratesflow until a brief backflow closes the aortic valve.Proximal aortic flow is almost zero duringdiastole.
Length L
Resistance depends on-
• radius r 4
• viscosity η
• length L
For laminar flow down a tube of radius r,
Resistance R =8η L
πr 4
Flow
Viscosity η
Radius r
Poiseuille’s law – what governs resistance?
Q
= (P1�P2) πr 4
8η L
Q
Since flow equal pressure drop (P1�P2) divided by resistance,
P1 P2
Figure 8.19 Poiseuille’s law describeslaminar flow along a cylindrical tube,and the factors that govern theresistance to flow.
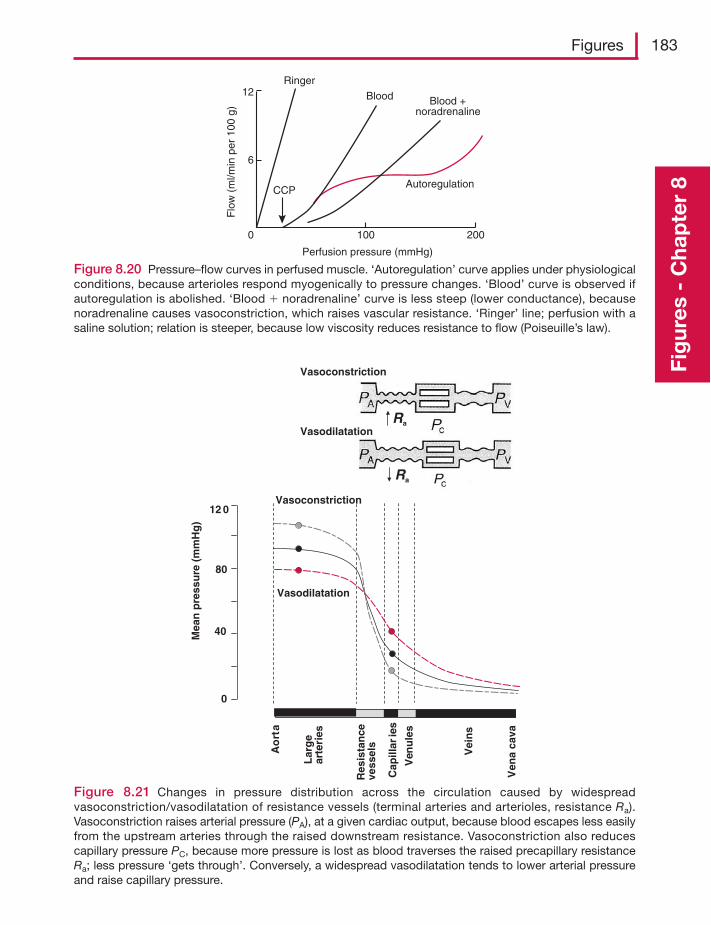
Figures 183
Fig
ures
- C
hap
ter
8
Ringer
CCP
Blood Blood +noradrenaline
Autoregulation
Perfusion pressure (mmHg)
Flo
w (
ml/m
in p
er 1
00 g
)
12
6
0 100 200
Figure 8.20 Pressure–flow curves in perfused muscle. ‘Autoregulation’ curve applies under physiologicalconditions, because arterioles respond myogenically to pressure changes. ‘Blood’ curve is observed ifautoregulation is abolished. ‘Blood � noradrenaline’ curve is less steep (lower conductance), becausenoradrenaline causes vasoconstriction, which raises vascular resistance. ‘Ringer’ line; perfusion with asaline solution; relation is steeper, because low viscosity reduces resistance to flow (Poiseuille’s law).
0
80
12 0
Mea
n p
ress
ure
(m
mH
g)
Lar
ge
arte
ries
Res
ista
nce
vess
els
Cap
illar
ies
Ven
ule
s
Vei
ns
40
Ao
rta
Ven
a ca
vaVasoconstriction
Vasodilatation
Vasoconstriction
VasodilatationRa
Ra
Figure 8.21 Changes in pressure distribution across the circulation caused by widespreadvasoconstriction/vasodilatation of resistance vessels (terminal arteries and arterioles, resistance Ra).Vasoconstriction raises arterial pressure (PA), at a given cardiac output, because blood escapes less easilyfrom the upstream arteries through the raised downstream resistance. Vasoconstriction also reducescapillary pressure PC, because more pressure is lost as blood traverses the raised precapillary resistanceRa; less pressure ‘gets through’. Conversely, a widespread vasodilatation tends to lower arterial pressureand raise capillary pressure.
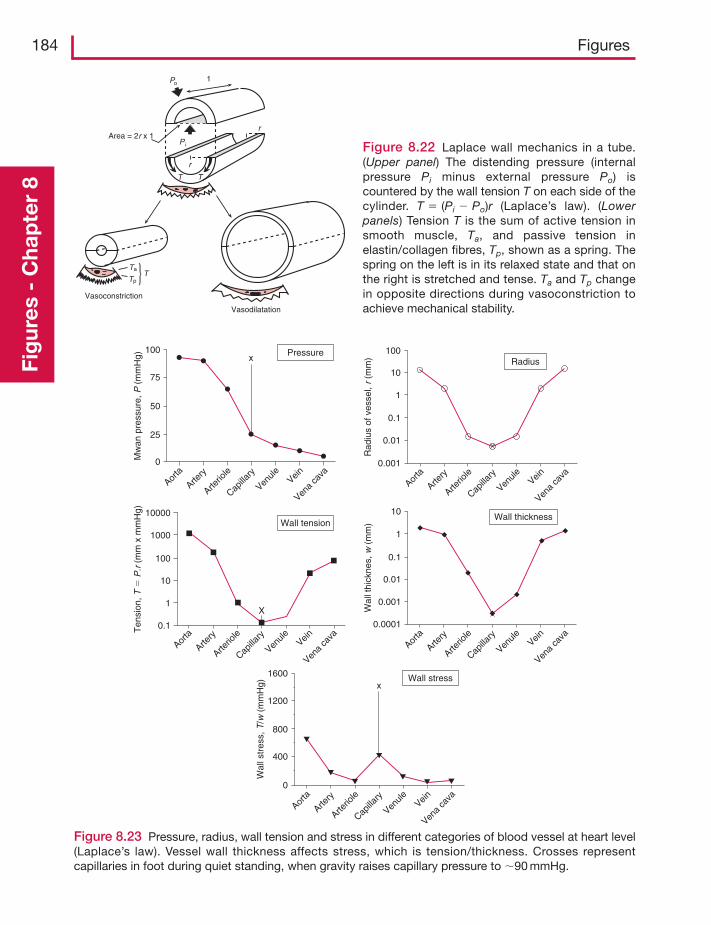
184 FiguresFi
gur
es -
Cha
pte
r 8
r
r
1
T T
Area = 2r x 1
Vasoconstriction
Ta
P i
Po
TpT
Vasodilatation
Figure 8.22 Laplace wall mechanics in a tube.(Upper panel) The distending pressure (internalpressure Pi minus external pressure Po) iscountered by the wall tension T on each side of thecylinder. T � (Pi � Po)r (Laplace’s law). (Lowerpanels) Tension T is the sum of active tension insmooth muscle, Ta, and passive tension inelastin/collagen fibres, Tp, shown as a spring. Thespring on the left is in its relaxed state and that onthe right is stretched and tense. Ta and Tp changein opposite directions during vasoconstriction toachieve mechanical stability.
100
75
Aorta
Artery
Arterio
le
Capilla
ry
Venule Vein
Vena
cava
Aorta
Artery
Arterio
le
Capilla
ry
Venule Vein
Vena
cava
Aorta
Artery
Arterio
le
Capilla
ry
Venule Vein
Vena
cava
Aorta
Artery
Arterio
le
Capilla
ry
Venule Vein
Vena
cava
Aorta
Artery
Arterio
le
Capilla
ry
Venule Vein
Vena
cava
0
400
800
1200
xWall stress1600
Wal
lstr
ess,
T/w
(m
mH
g)
Wall tension
Pressure
Wall thickness
0.0001
0.001
0.01
Wal
l thi
ckne
s,w
(m
m)
Ten
sion
,T�
P.r
(m
m x
mm
Hg)
Mw
an p
ress
ure,
P (
mm
Hg)
Rad
ius
of v
esse
l,r
(mm
)
0.1
1
10
Radius
0.001
0.01
0.1
1
10
100
0.1
1
10
X
100
1000
10000
x
0
25
50
Figure 8.23 Pressure, radius, wall tension and stress in different categories of blood vessel at heart level(Laplace’s law). Vessel wall thickness affects stress, which is tension/thickness. Crosses representcapillaries in foot during quiet standing, when gravity raises capillary pressure to �90 mmHg.
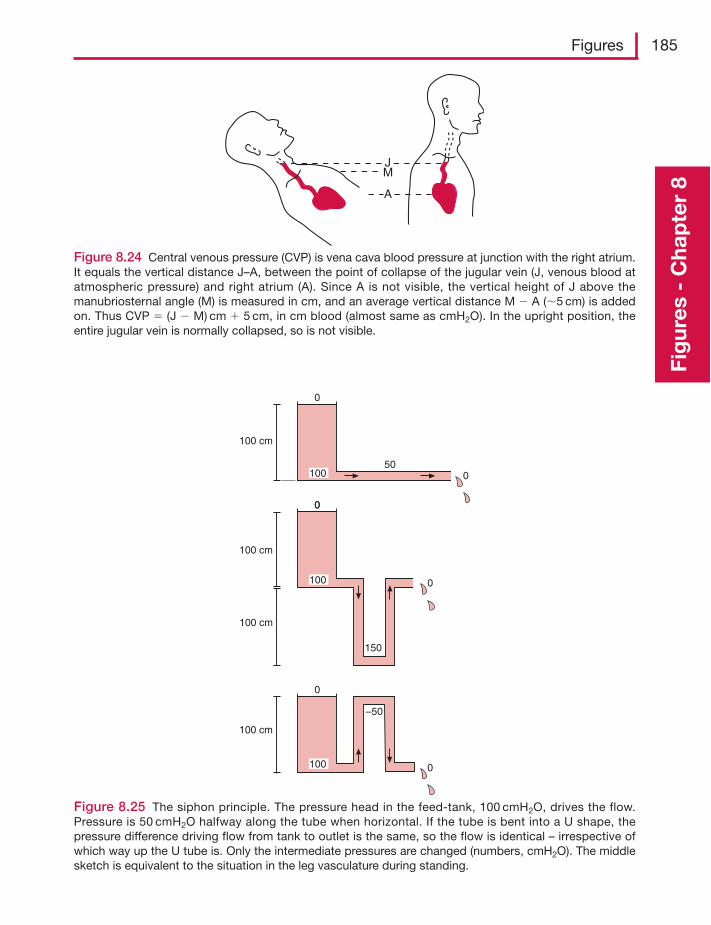
Figures 185
Fig
ures
- C
hap
ter
8
JM
A
Figure 8.24 Central venous pressure (CVP) is vena cava blood pressure at junction with the right atrium.It equals the vertical distance J–A, between the point of collapse of the jugular vein (J, venous blood atatmospheric pressure) and right atrium (A). Since A is not visible, the vertical height of J above themanubriosternal angle (M) is measured in cm, and an average vertical distance M � A (�5 cm) is addedon. Thus CVP � (J � M) cm � 5 cm, in cm blood (almost same as cmH2O). In the upright position, theentire jugular vein is normally collapsed, so is not visible.
100 cm
0
0
0
0
100
100
0
100 cm
150
50
100 cm
0
0
–50
100 cm
100
Figure 8.25 The siphon principle. The pressure head in the feed-tank, 100 cmH2O, drives the flow.Pressure is 50 cmH2O halfway along the tube when horizontal. If the tube is bent into a U shape, thepressure difference driving flow from tank to outlet is the same, so the flow is identical – irrespective ofwhich way up the U tube is. Only the intermediate pressures are changed (numbers, cmH2O). The middlesketch is equivalent to the situation in the leg vasculature during standing.
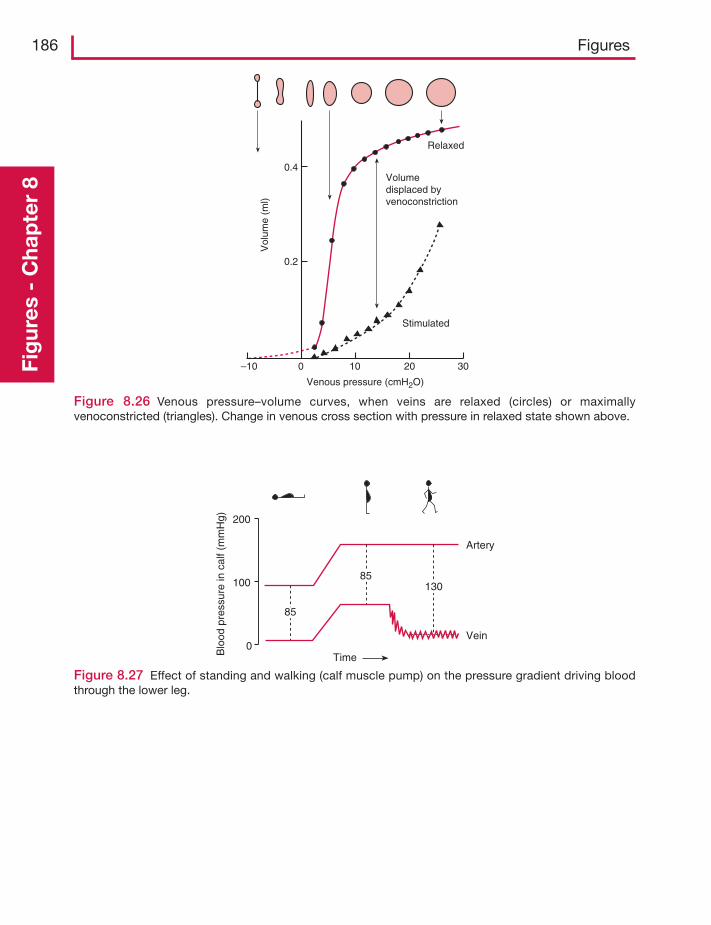
186 FiguresFi
gur
es -
Cha
pte
r 8
Figure 8.26 Venous pressure–volume curves, when veins are relaxed (circles) or maximallyvenoconstricted (triangles). Change in venous cross section with pressure in relaxed state shown above.
0.4
0.2
Stimulated
Relaxed
Volumedisplaced byvenoconstriction
Vol
ume
(ml)
–10 0 10 20 30
Venous pressure (cmH2O)
Figure 8.27 Effect of standing and walking (calf muscle pump) on the pressure gradient driving bloodthrough the lower leg.
200
100
0
Artery
Vein
85
85
TimeBlo
od p
ress
ure
in c
alf (
mm
Hg)
130
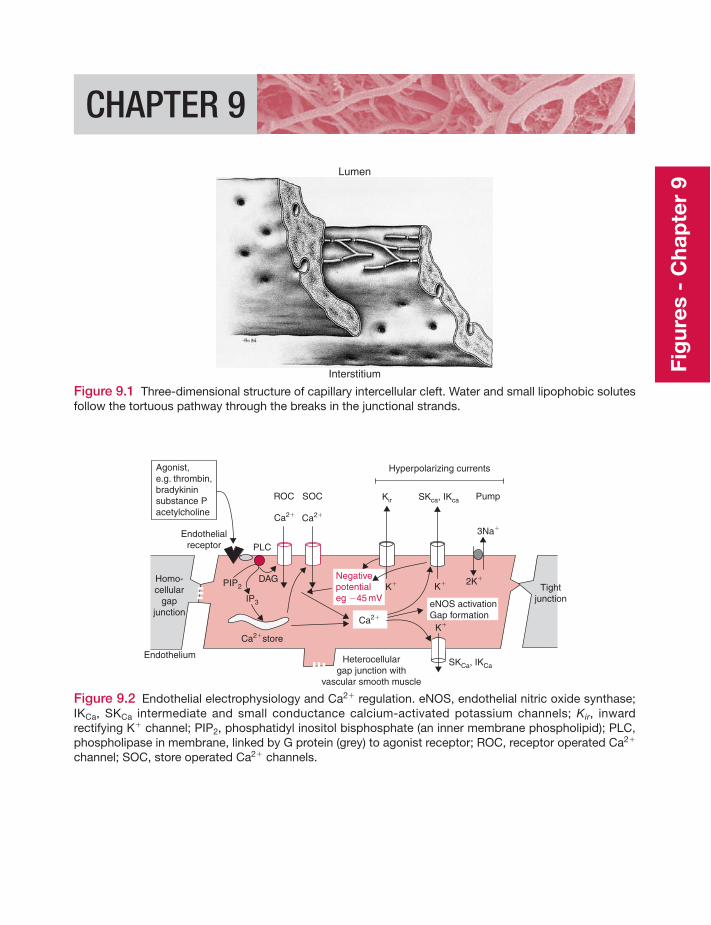
CHAPTER 9
Lumen
Interstitium
Figure 9.1 Three-dimensional structure of capillary intercellular cleft. Water and small lipophobic solutesfollow the tortuous pathway through the breaks in the junctional strands.
Ca2�
ROC
Endothelialreceptor
K�K�
Ca2�
Hyperpolarizing currents
3Na�
2K�Homo-cellular
gapjunction
Ca2�
SOC Kir SKca, IKca
Ca2�store
PIP2
IP3
DAG
PLC
K�
SKCa, IKCa
Pump
Agonist,e.g. thrombin,bradykininsubstance Pacetylcholine
Negativepotentialeg �45 mV
Endothelium
eNOS activationGap formation
Tightjunction
Heterocellulargap junction with
vascular smooth muscle
Figure 9.2 Endothelial electrophysiology and Ca2� regulation. eNOS, endothelial nitric oxide synthase;IKCa, SKCa intermediate and small conductance calcium-activated potassium channels; Kir, inwardrectifying K� channel; PIP2, phosphatidyl inositol bisphosphate (an inner membrane phospholipid); PLC,phospholipase in membrane, linked by G protein (grey) to agonist receptor; ROC, receptor operated Ca2�
channel; SOC, store operated Ca2� channels.
Fig
ures
- C
hap
ter
9
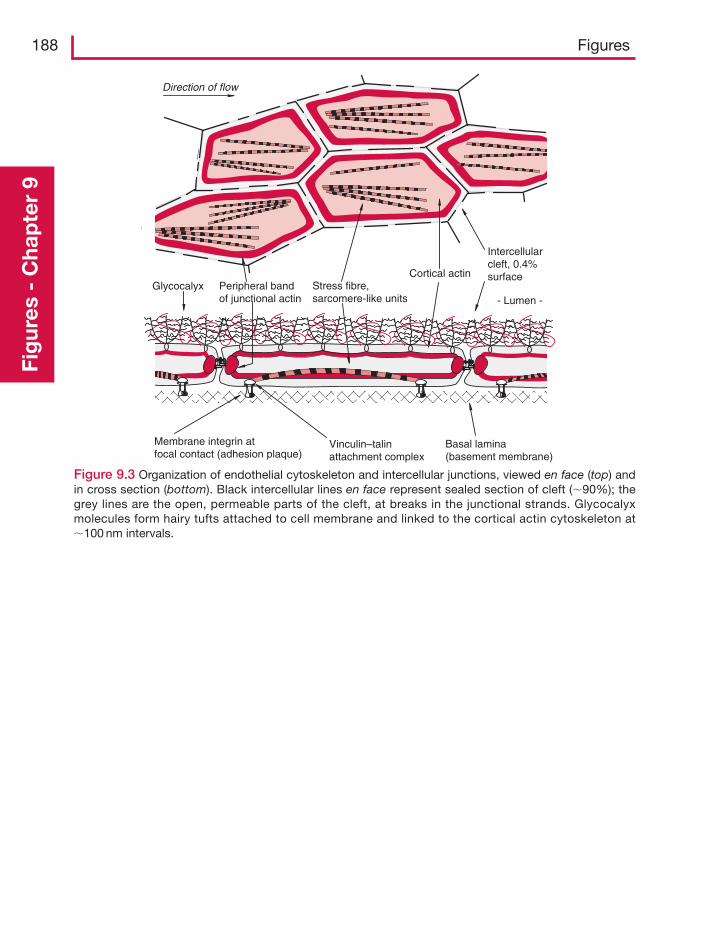
188 FiguresFi
gur
es -
Cha
pte
r 9
Direction of flow
Cortical actin
Membrane integrin atfocal contact (adhesion plaque)
Basal lamina(basement membrane)
Stress fibre,sarcomere-like units
Peripheral bandof junctional actin
Intercellularcleft, 0.4%surface
Vinculin–talinattachment complex
- Lumen - Glycocalyx
Figure 9.3 Organization of endothelial cytoskeleton and intercellular junctions, viewed en face (top) andin cross section (bottom). Black intercellular lines en face represent sealed section of cleft (�90%); thegrey lines are the open, permeable parts of the cleft, at breaks in the junctional strands. Glycocalyxmolecules form hairy tufts attached to cell membrane and linked to the cortical actin cytoskeleton at�100 nm intervals.
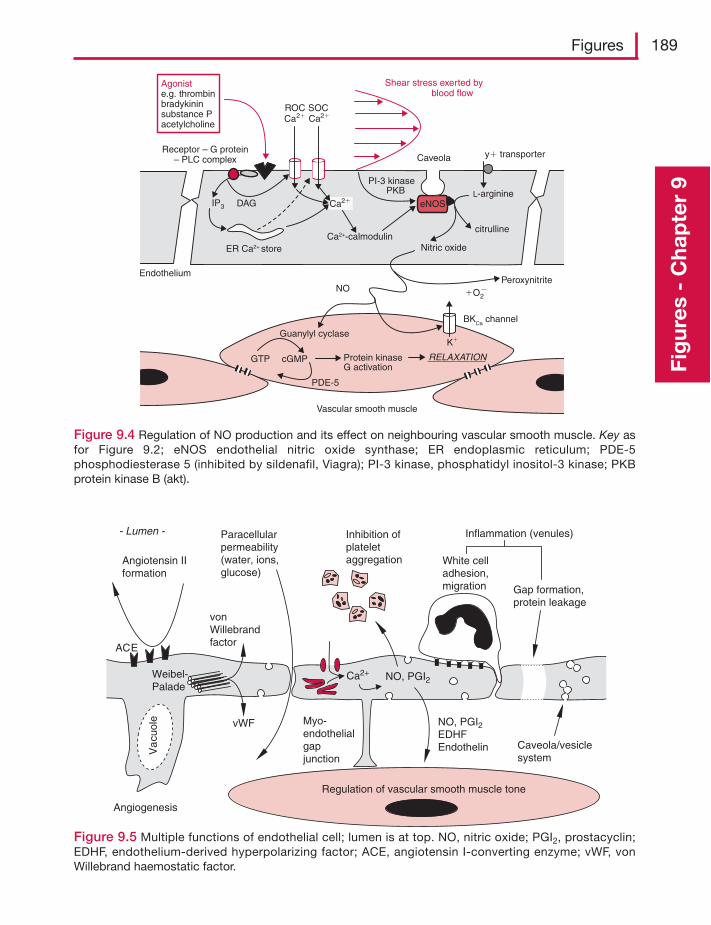
Figures 189
Fig
ures
- C
hap
ter
9
eNOS
ER Ca2+ store
IP3
Ca2+-calmodulin
L-arginineCa2�
Shear stress exerted by blood flow
Nitric oxide
citrulline
Peroxynitrite�O2
�
y� transporter
Endothelium
Ca2�ROC
Agoniste.g. thrombinbradykininsubstance Pacetylcholine
Receptor – G protein– PLC complex
Guanylyl cyclase
GTP cGMP Protein kinaseG activation
RELAXATION
Vascular smooth muscle
NO
PI-3 kinase PKB
DAG
Ca2�SOC
BKCa channel
K�
PDE-5
Caveola
Figure 9.4 Regulation of NO production and its effect on neighbouring vascular smooth muscle. Key asfor Figure 9.2; eNOS endothelial nitric oxide synthase; ER endoplasmic reticulum; PDE-5phosphodiesterase 5 (inhibited by sildenafil, Viagra); PI-3 kinase, phosphatidyl inositol-3 kinase; PKBprotein kinase B (akt).
NO, PGI2
NO, PGI2EDHFEndothelinV
acu
ole
Weibel-Palade
ACE
Angiotensin IIformation
vonWillebrandfactor
vWF
Paracellularpermeability(water, ions,glucose)
Inhibition ofplateletaggregation White cell
adhesion,migration Gap formation,
protein leakage
Inflammation (venules)
Angiogenesis
Regulation of vascular smooth muscle tone
Caveola/vesiclesystem
Ca2+
- Lumen -
Myo-endothelialgapjunction
Figure 9.5 Multiple functions of endothelial cell; lumen is at top. NO, nitric oxide; PGI2, prostacyclin;EDHF, endothelium-derived hyperpolarizing factor; ACE, angiotensin I-converting enzyme; vWF, vonWillebrand haemostatic factor.
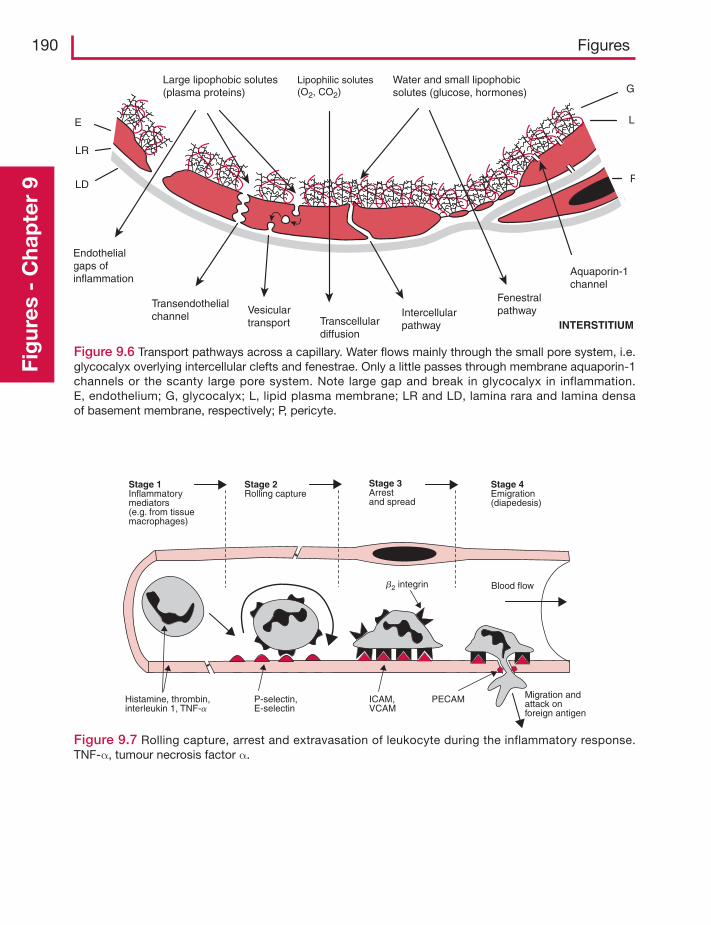
190 FiguresFi
gur
es -
Cha
pte
r 9 LD
LR
E L
G
P
INTERSTITIUM
Large lipophobic solutes(plasma proteins)
Lipophilic solutes(O2, CO2)
Water and small lipophobicsolutes (glucose, hormones)
Endothelialgaps ofinflammation
Transendothelialchannel
Vesiculartransport Transcellular
diffusion
Intercellularpathway
Fenestralpathway
Aquaporin-1channel
Figure 9.6 Transport pathways across a capillary. Water flows mainly through the small pore system, i.e.glycocalyx overlying intercellular clefts and fenestrae. Only a little passes through membrane aquaporin-1channels or the scanty large pore system. Note large gap and break in glycocalyx in inflammation.E, endothelium; G, glycocalyx; L, lipid plasma membrane; LR and LD, lamina rara and lamina densaof basement membrane, respectively; P, pericyte.
Stage 1Inflammatorymediators(e.g. from tissuemacrophages)
Stage 2Rolling capture
Stage 3Arrestand spread
Stage 4Emigration(diapedesis)
Histamine, thrombin,interleukin 1, TNF-a
P-selectin,E-selectin
ICAM,VCAM
PECAM Migration andattack onforeign antigen
b2 integrin Blood flow
Figure 9.7 Rolling capture, arrest and extravasation of leukocyte during the inflammatory response.TNF-α, tumour necrosis factor α.
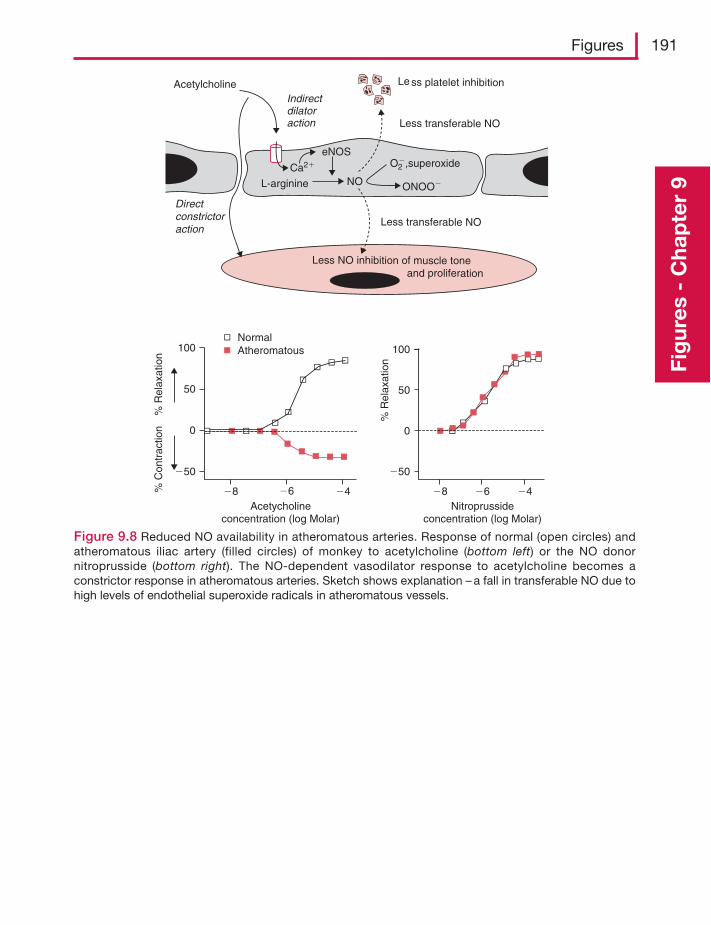
Figures 191
Fig
ures
- C
hap
ter
9
Figure 9.8 Reduced NO availability in atheromatous arteries. Response of normal (open circles) andatheromatous iliac artery (filled circles) of monkey to acetylcholine (bottom left) or the NO donornitroprusside (bottom right). The NO-dependent vasodilator response to acetylcholine becomes aconstrictor response in atheromatous arteries. Sketch shows explanation – a fall in transferable NO due tohigh levels of endothelial superoxide radicals in atheromatous vessels.
Less NO inhibition of muscle toneand proliferation
Le ss platelet inhibition
Less transferable NO
Less transferable NO
Acetylcholine
L-arginine NO
O2�,superoxide
eNOS
ONOO�
Ca2�
Directconstrictoraction
Indirectdilatoraction
% R
elax
atio
n%
Con
trac
tion
100
50
�50
�8 �8�6 �6�4 �4Acetycholine
concentration (log Molar)Nitroprusside
concentration (log Molar)
NormalAtheromatous
0
100
50
�50
0
% R
elax
atio
n
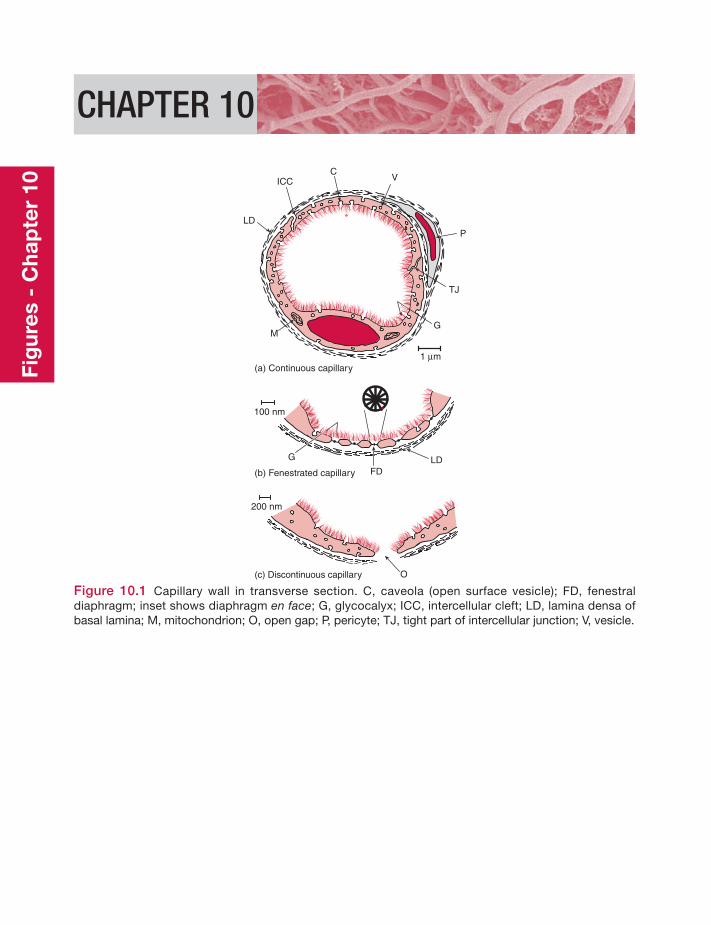
CHAPTER 10
ICCC
V
P
TJ
GM
LD
1 μm
G LDFD
O
(a) Continuous capillary
(b) Fenestrated capillary
(c) Discontinuous capillary
100 nm
200 nm
Figure 10.1 Capillary wall in transverse section. C, caveola (open surface vesicle); FD, fenestraldiaphragm; inset shows diaphragm en face; G, glycocalyx; ICC, intercellular cleft; LD, lamina densa ofbasal lamina; M, mitochondrion; O, open gap; P, pericyte; TJ, tight part of intercellular junction; V, vesicle.
Fig
ures
- C
hap
ter
10
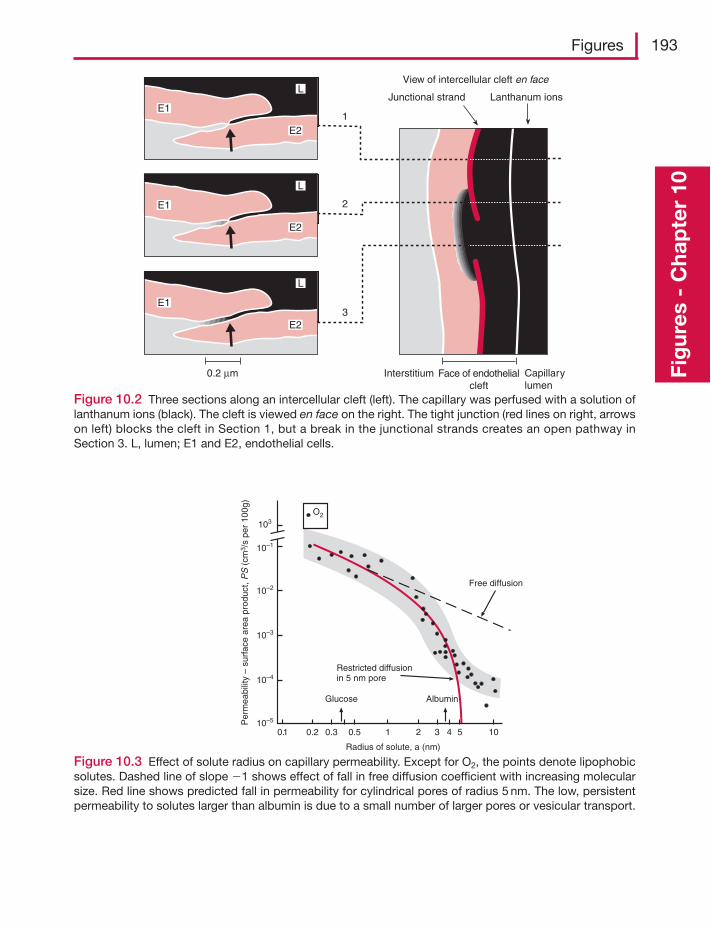
Figures 193
Fig
ures
- C
hap
ter
10L
E2
E1
L
E2
E1
L
E2
E1
View of intercellular cleft en face
Junctional strand Lanthanum ions
Interstitium Face of endothelialcleft
Capillarylumen
0.2 μm
3
2
1
Figure 10.2 Three sections along an intercellular cleft (left). The capillary was perfused with a solution oflanthanum ions (black). The cleft is viewed en face on the right. The tight junction (red lines on right, arrowson left) blocks the cleft in Section 1, but a break in the junctional strands creates an open pathway inSection 3. L, lumen; E1 and E2, endothelial cells.
103
10–1
10–2
10–3
10–4
10–5Per
mea
bilit
y –
surf
ace
area
pro
duct
, PS
(cm
3 /s
per
100g
)
0.1 0.2 0.3 0.5 1 2 3 4 5 10
Radius of solute, a (nm)
Glucose Albumin
Restricted diffusionin 5 nm pore
O2
Free diffusion
Figure 10.3 Effect of solute radius on capillary permeability. Except for O2, the points denote lipophobicsolutes. Dashed line of slope �1 shows effect of fall in free diffusion coefficient with increasing molecularsize. Red line shows predicted fall in permeability for cylindrical pores of radius 5 nm. The low, persistentpermeability to solutes larger than albumin is due to a small number of larger pores or vesicular transport.
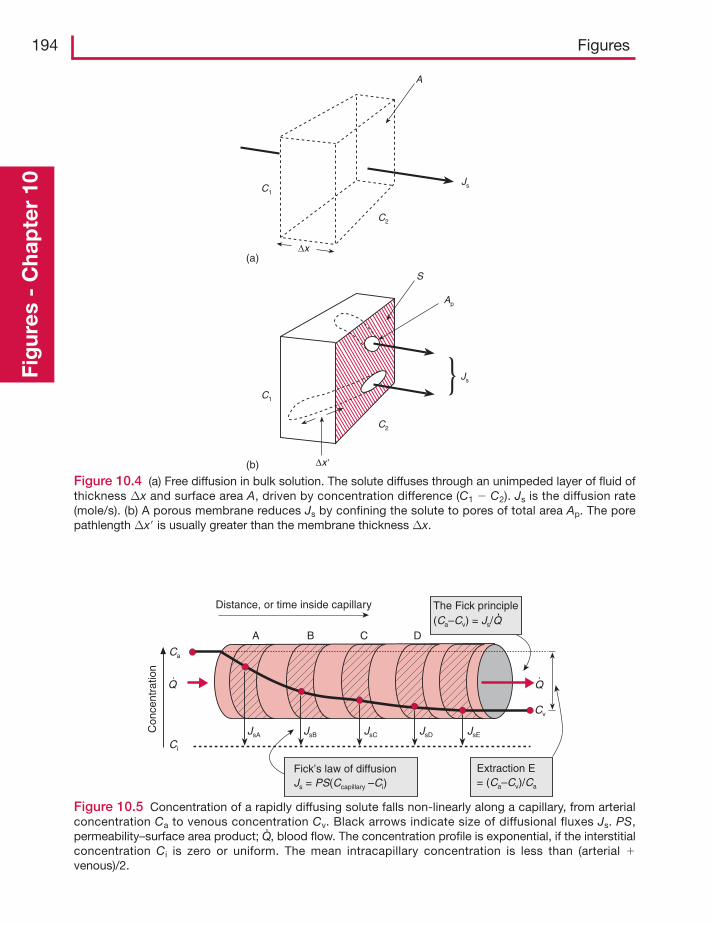
194 FiguresFi
gur
es -
Cha
pte
r 10
C1
C2
Ap
Js
S
(b) Δx
A
C1
C2
Js
(a)Δx
Figure 10.4 (a) Free diffusion in bulk solution. The solute diffuses through an unimpeded layer of fluid ofthickness Δx and surface area A, driven by concentration difference (C1 � C2). Js is the diffusion rate(mole/s). (b) A porous membrane reduces Js by confining the solute to pores of total area Ap. The porepathlength Δx is usually greater than the membrane thickness Δx.
A B C D
JsA JsB JsC JsD JsE
Ca
Ci
Cv
Distance, or time inside capillary The Fick principle(Ca–Cv) = Js/Q
Extraction E= (Ca–Cv)/Ca
Con
cent
ratio
n
Fick’s law of diffusionJs = PS(Ccapillary –Ci)
Q Q
Figure 10.5 Concentration of a rapidly diffusing solute falls non-linearly along a capillary, from arterialconcentration Ca to venous concentration Cv. Black arrows indicate size of diffusional fluxes Js. PS,permeability–surface area product; Q· , blood flow. The concentration profile is exponential, if the interstitialconcentration Ci is zero or uniform. The mean intracapillary concentration is less than (arterial �venous)/2.
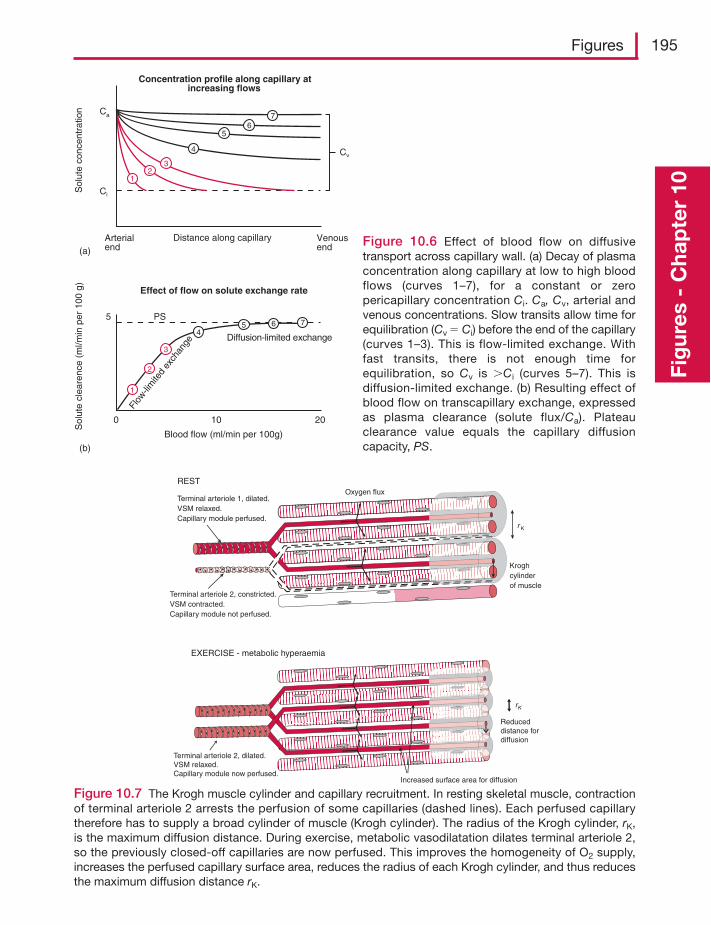
Figures 195
Fig
ures
- C
hap
ter
10
Distance along capillaryArterialend
Venousend(a)
Sol
ute
conc
entr
atio
n Ca
Ci
Cv4
56
7
1
2
3
45 6 7
(b)
Blood flow (ml/min per 100g)
Sol
ute
clea
renc
e (m
l/min
per
100
g)
PS5
100 20
Diffusion-limited exchange
Flow
-lim
ited
exch
ange
12
3
Concentration profile along capillary atincreasing flows
Effect of flow on solute exchange rate
Figure 10.6 Effect of blood flow on diffusivetransport across capillary wall. (a) Decay of plasmaconcentration along capillary at low to high bloodflows (curves 1–7), for a constant or zeropericapillary concentration Ci. Ca, Cv, arterial andvenous concentrations. Slow transits allow time forequilibration (Cv � Ci) before the end of the capillary(curves 1–3). This is flow-limited exchange. Withfast transits, there is not enough time forequilibration, so Cv is Ci (curves 5–7). This isdiffusion-limited exchange. (b) Resulting effect ofblood flow on transcapillary exchange, expressedas plasma clearance (solute flux/Ca). Plateauclearance value equals the capillary diffusioncapacity, PS.
Terminal arteriole 1, dilated.VSM relaxed.Capillary module perfused.
Terminal arteriole 2, constricted.VSM contracted.Capillary module not perfused.
REST
r K
Kroghcylinderof muscle
Oxygen flux
Terminal arteriole 2, dilated.VSM relaxed.Capillary module now perfused.
EXERCISE - metabolic hyperaemia
rK
Increased surface area for diffusion
Reduceddistance fordiffusion
Figure 10.7 The Krogh muscle cylinder and capillary recruitment. In resting skeletal muscle, contractionof terminal arteriole 2 arrests the perfusion of some capillaries (dashed lines). Each perfused capillarytherefore has to supply a broad cylinder of muscle (Krogh cylinder). The radius of the Krogh cylinder, rK,is the maximum diffusion distance. During exercise, metabolic vasodilatation dilates terminal arteriole 2,so the previously closed-off capillaries are now perfused. This improves the homogeneity of O2 supply,increases the perfused capillary surface area, reduces the radius of each Krogh cylinder, and thus reducesthe maximum diffusion distance rK.
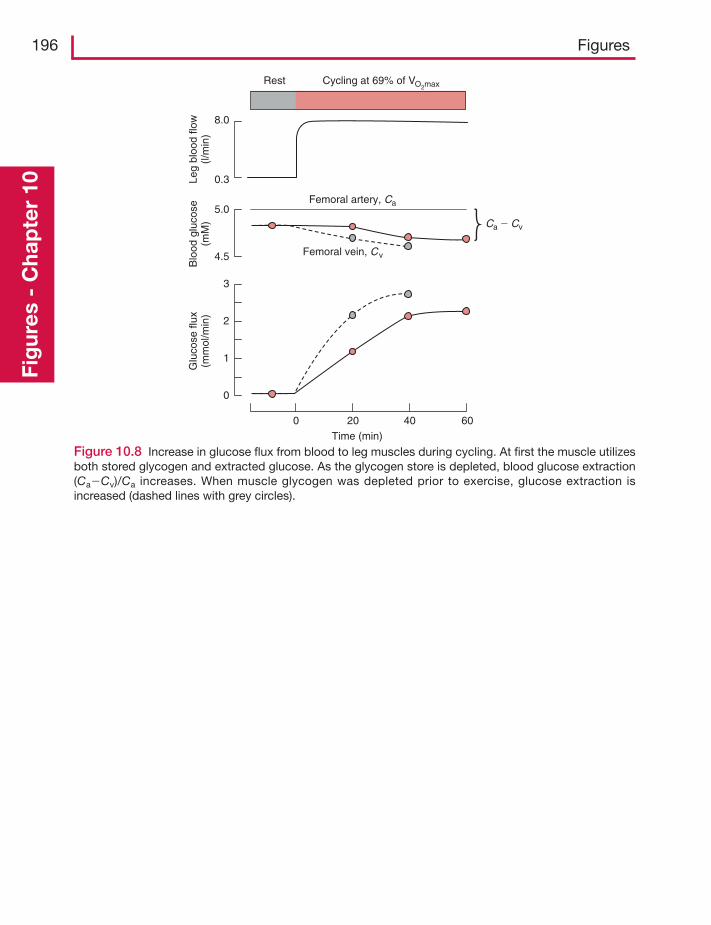
196 FiguresFi
gur
es -
Cha
pte
r 10
Time (min)
Glu
cose
flux
(mm
ol/m
in)
Blo
od g
luco
se(m
M)
Leg
bloo
d flo
w(l/
min
)
8.0
0.3
5.0
4.5
3
0
2
1
0 20 40 60
Femoral artery, Ca
Femoral vein, Cv
Rest Cycling at 69% of VO2max
Ca � Cv
Figure 10.8 Increase in glucose flux from blood to leg muscles during cycling. At first the muscle utilizesboth stored glycogen and extracted glucose. As the glycogen store is depleted, blood glucose extraction(Ca�Cv)/Ca increases. When muscle glycogen was depleted prior to exercise, glucose extraction isincreased (dashed lines with grey circles).
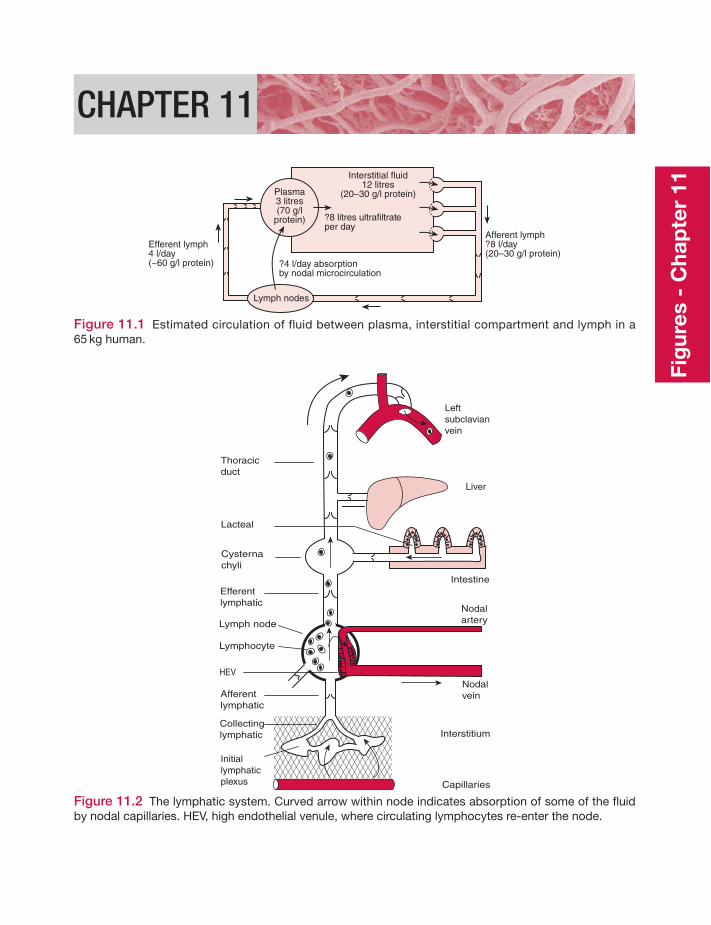
CHAPTER 11
?4 l/day absorptionby nodal microcirculation
Efferent lymph4 l/day(~60 g/l protein)
Afferent lymph?8 l/day(20–30 g/l protein)
Interstitial fluid12 litres
(20–30 g/l protein)
?8 litres ultrafiltrateper day
Plasma3 litres(70 g/l
protein)
Lymph nodes
Figure 11.1 Estimated circulation of fluid between plasma, interstitial compartment and lymph in a65 kg human.
Thoracicduct
Cysternachyli
Leftsubclavianvein
Liver
Intestine
Nodalartery
Nodalvein
Interstitium
Capillaries
Lacteal
Efferentlymphatic
Afferentlymphatic
Collectinglymphatic
Initiallymphaticplexus
Lymph node
Lymphocyte
HEV
Figure 11.2 The lymphatic system. Curved arrow within node indicates absorption of some of the fluidby nodal capillaries. HEV, high endothelial venule, where circulating lymphocytes re-enter the node.
Fig
ures
- C
hap
ter
11
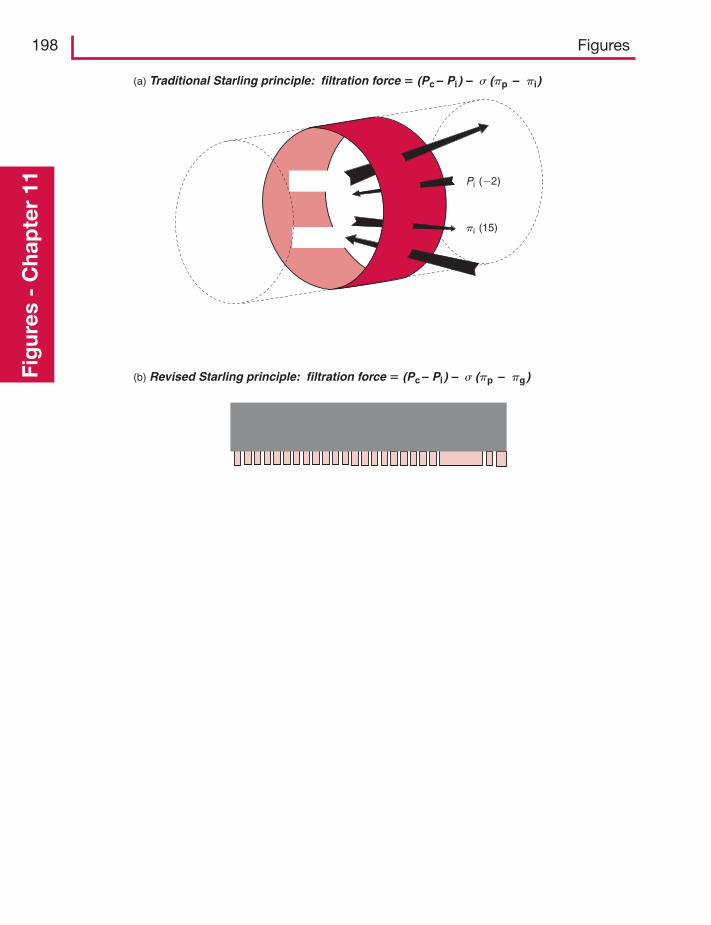
198 FiguresFi
gur
es -
Cha
pte
r 11 Pi (�2)
pi (15)
(a) Traditional Starling principle: filtration force � (Pc – Pi) – s (pp – pi)
(b) Revised Starling principle: filtration force � (Pc – Pi) – s (pp – pg)Pc
Pi pi
pg
pp
Plasma
Interstitialfluid
Endothelium
Small pore system, glycocalyx network
Intercellularcleft
Largepore system,transportingplasmaproteins(grey)
Plasma ultrafiltrate
Subglycocalyxspace
Pc (30)
pp (25)
Figure 11.3 (a) Four classic Starling pressures influencing fluid exchange (mmHg, human skin, heartlevel). Pc, capillary blood pressure Pi, interstitial fluid pressure. πp, plasma colloid osmotic pressure (COP).πi, interstitial fluid COP. Pressures are relative to atmospheric pressure (760 mmHg), so Pi � �2 mmHgmeans an absolute pressure of 758 mmHg – hence arrow direction. (b) Cross section of intercellular cleftto show gradient of extravascular plasma protein extending into subglycocalyx space (COP is πg);concentration indicated by shade of grey. Gradient is result of battle between upstream diffusion ofextravascular plasma protein (solid curves) and its washout by plasma ultrafiltrate emerging from theglycocalyx small pore system (dashed line).
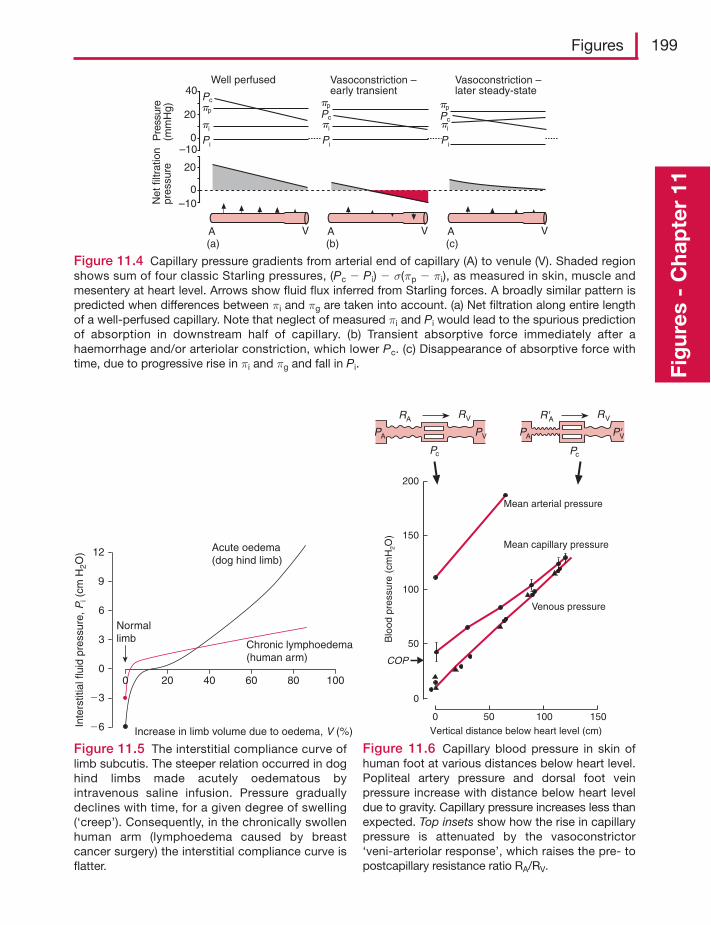
Figures 199
Fig
ures
- C
hap
ter
11
Net
filtr
atio
npr
essu
reP
ress
ure
(mm
Hg)
40
20
20
0–10
0–10
Pcpp
pi
Pi Pi
pi
pp
Pc
Pi
pi
pp
Pc
Well perfused Vasoconstriction –early transient
Vasoconstriction –later steady-state
A V A V A V(a) (b) (c)
Figure 11.4 Capillary pressure gradients from arterial end of capillary (A) to venule (V). Shaded regionshows sum of four classic Starling pressures, (Pc � Pi) � σ(πp � πi), as measured in skin, muscle andmesentery at heart level. Arrows show fluid flux inferred from Starling forces. A broadly similar pattern ispredicted when differences between πi and πg are taken into account. (a) Net filtration along entire lengthof a well-perfused capillary. Note that neglect of measured πi and Pi would lead to the spurious predictionof absorption in downstream half of capillary. (b) Transient absorptive force immediately after ahaemorrhage and/or arteriolar constriction, which lower Pc. (c) Disappearance of absorptive force withtime, due to progressive rise in πi and πg and fall in Pi.
12
9
6Normallimb
Acute oedema(dog hind limb)
Chronic lymphoedema(human arm)
0 20 40 60 80 100
Increase in limb volume due to oedema, V (%)
Inte
rstit
ial f
luid
pre
ssur
e,P
i (cm
H2O
)
3
0
�3
�6
Figure 11.5 The interstitial compliance curve oflimb subcutis. The steeper relation occurred in doghind limbs made acutely oedematous byintravenous saline infusion. Pressure graduallydeclines with time, for a given degree of swelling(‘creep’). Consequently, in the chronically swollenhuman arm (lymphoedema caused by breastcancer surgery) the interstitial compliance curve isflatter.
Mean arterial pressure
Mean capillary pressure
Venous pressure
Vertical distance below heart level (cm)
Blo
od p
ress
ure
(cm
H2O
)
200
150
100
50
0
COP
150100500
R'A RV
P'VPA
RA RV
PVPA
Pc Pc
Figure 11.6 Capillary blood pressure in skin ofhuman foot at various distances below heart level.Popliteal artery pressure and dorsal foot veinpressure increase with distance below heart leveldue to gravity. Capillary pressure increases less thanexpected. Top insets show how the rise in capillarypressure is attenuated by the vasoconstrictor‘veni-arteriolar response’, which raises the pre- topostcapillary resistance ratio RA/RV.
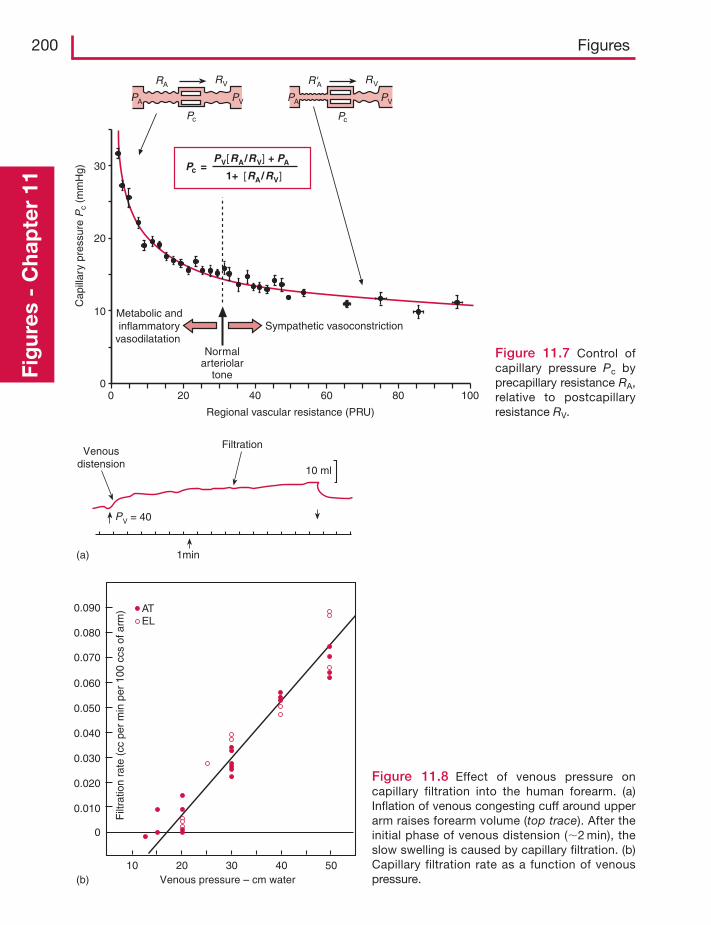
200 FiguresFi
gur
es -
Cha
pte
r 11
Pc =
0 20 40 60 80 100
Regional vascular resistance (PRU)
Sympathetic vasoconstriction
Normalarteriolar
tone
Metabolic andinflammatory
vasodilatation
Cap
illar
y pr
essu
re P
c (m
mH
g)
10
20
30
0
PV[RA/RV] + PA
1+ [RA/RV]
R'A RV
PVPA
RA RV
PVPA
Pc Pc
Figure 11.7 Control ofcapillary pressure Pc byprecapillary resistance RA,relative to postcapillaryresistance RV.
0.090
0.080
0.070
0.060
0.050
0.040
0.030
0.020
0.010
0
Venous pressure – cm water(b)10 20 30 40 50
Filt
ratio
nra
te(c
cpe
rm
inpe
r10
0cc
sof
arm
) ATEL
FiltrationVenous
distension
1min
PV = 40
10 ml
(a)
Figure 11.8 Effect of venous pressure oncapillary filtration into the human forearm. (a)Inflation of venous congesting cuff around upperarm raises forearm volume (top trace). After theinitial phase of venous distension (�2 min), theslow swelling is caused by capillary filtration. (b)Capillary filtration rate as a function of venouspressure.
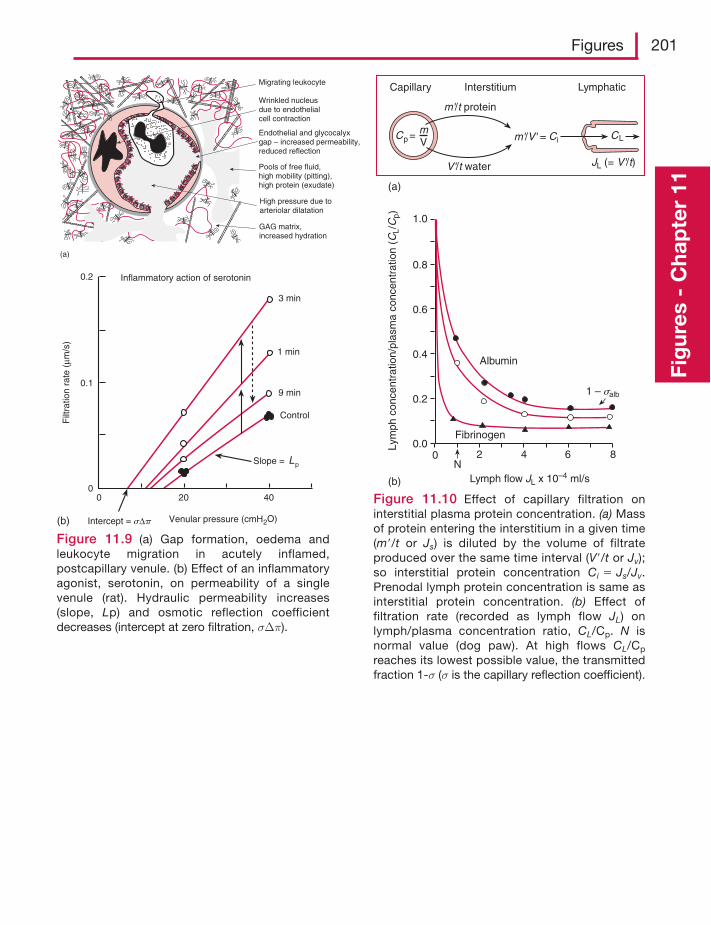
Figures 201
Fig
ures
- C
hap
ter
11
Inflammatory action of serotonin
Venular pressure (cmH2O)
Filt
ratio
n ra
te (
μm/s
)
0.2
0.1
00 20 40
Slope = Lp
3 min
1 min
9 min
Control
Intercept = sΔp(b)
(a)
Migrating leukocyte
Wrinkled nucleusdue to endothelialcell contraction
Endothelial and glycocalyxgap – increased permeability,reduced reflection
Pools of free fluid,high mobility (pitting),high protein (exudate)
GAG matrix,increased hydration
High pressure due toarteriolar dilatation
Figure 11.9 (a) Gap formation, oedema andleukocyte migration in acutely inflamed,postcapillary venule. (b) Effect of an inflammatoryagonist, serotonin, on permeability of a singlevenule (rat). Hydraulic permeability increases(slope, Lp) and osmotic reflection coefficientdecreases (intercept at zero filtration, σΔπ).
Lymph flow JL x 10–4 ml/s
Albumin
Fibrinogen
N0 2 4 6 8
1.0
0.8
0.6
0.4
0.2
0.0
(b)
Lym
ph c
once
ntra
tion/
plas
ma
conc
entr
atio
n (C
L/C
p)
(a)
Capillary Interstitium Lymphatic
Cp = CL
JL (= V'/t)
Ci
V'/t water
m'/V' =mV
m'/t protein
1 – salb
Figure 11.10 Effect of capillary filtration oninterstitial plasma protein concentration. (a) Massof protein entering the interstitium in a given time(m /t or Js) is diluted by the volume of filtrateproduced over the same time interval (V /t or Jv);so interstitial protein concentration Ci � Js/Jv.Prenodal lymph protein concentration is same asinterstitial protein concentration. (b) Effect offiltration rate (recorded as lymph flow JL) onlymph/plasma concentration ratio, CL/Cp. N isnormal value (dog paw). At high flows CL/Cp
reaches its lowest possible value, the transmittedfraction 1-σ (σ is the capillary reflection coefficient).
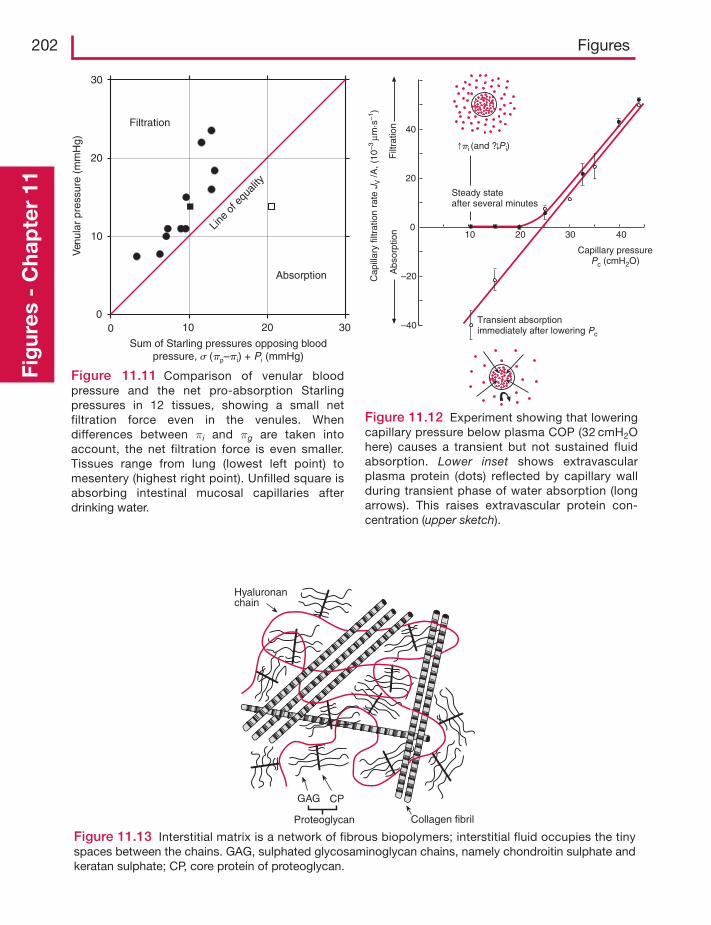
202 FiguresFi
gur
es -
Cha
pte
r 11
Ven
ular
pres
sure
(mm
Hg)
Sum of Starling pressures opposing bloodpressure, s (pp–pi) + Pi (mmHg)
Filtration
Absorption
00 10 20 30
10
20
30
Line
of e
quali
ty
Figure 11.11 Comparison of venular bloodpressure and the net pro-absorption Starlingpressures in 12 tissues, showing a small netfiltration force even in the venules. Whendifferences between πi and πg are taken intoaccount, the net filtration force is even smaller.Tissues range from lung (lowest left point) tomesentery (highest right point). Unfilled square isabsorbing intestinal mucosal capillaries afterdrinking water.
Cap
illar
y fil
trat
ion
rate
JV /A
, (10
–3μm
·s–1
)
Steady stateafter several minutes
Capillary pressurePc (cmH2O)
Transient absorptionimmediately after lowering Pc
pi (and ? P i)
Filt
ratio
nA
bsor
ptio
n
40
20
0
–20
–40
10 20 30 40
Figure 11.12 Experiment showing that loweringcapillary pressure below plasma COP (32 cmH2Ohere) causes a transient but not sustained fluidabsorption. Lower inset shows extravascularplasma protein (dots) reflected by capillary wallduring transient phase of water absorption (longarrows). This raises extravascular protein con-centration (upper sketch).
Hyaluronanchain
GAG CP
Proteoglycan Collagen fibril
Figure 11.13 Interstitial matrix is a network of fibrous biopolymers; interstitial fluid occupies the tinyspaces between the chains. GAG, sulphated glycosaminoglycan chains, namely chondroitin sulphate andkeratan sulphate; CP, core protein of proteoglycan.
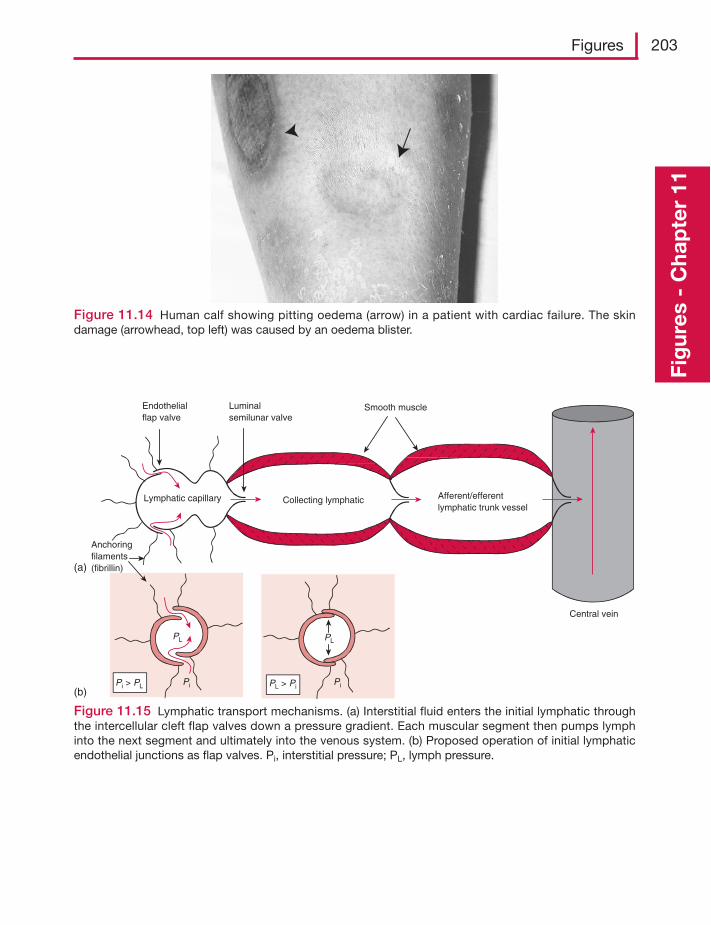
Figures 203
Fig
ures
- C
hap
ter
11
Figure 11.14 Human calf showing pitting oedema (arrow) in a patient with cardiac failure. The skindamage (arrowhead, top left) was caused by an oedema blister.
PL PL
Pi > PL Pi Pi
Collecting lymphatic Afferent/efferentlymphatic trunk vessel
Central vein
Smooth muscleLuminalsemilunar valve
Endothelialflap valve
Lymphatic capillary
Anchoringfilaments(fibrillin)
PL > Pi
(a)
(b)
Figure 11.15 Lymphatic transport mechanisms. (a) Interstitial fluid enters the initial lymphatic throughthe intercellular cleft flap valves down a pressure gradient. Each muscular segment then pumps lymphinto the next segment and ultimately into the venous system. (b) Proposed operation of initial lymphaticendothelial junctions as flap valves. Pi, interstitial pressure; PL, lymph pressure.

204 FiguresFi
gur
es -
Cha
pte
r 11
Intracellularpotential oflymphaticsmoothmuscle
Contractileactivity
2 sec
0 mV
–63 mV
Pre
ssur
e (c
mH
2O)
Volume (μL)
TP 10 cm
TP 8 cm
TP 6 cm
TP 4 cm
TP 2 cm
0 20 40
14
12
10
8
6
4
2
0
(a)
(b)
Figure 11.16 Electrical and contractile properties of lymphatic smooth muscle. (a) Periodicdepolarization triggers action potentials and contraction in a bovine lymphatic. (b) Pressure–volume cycleof contracting sheep mesenteric lymphatic vessels at various diastolic distensions (TP, transmuralpressure). Dashed loop shows increased contractility and ejection fraction after a haemorrhage.
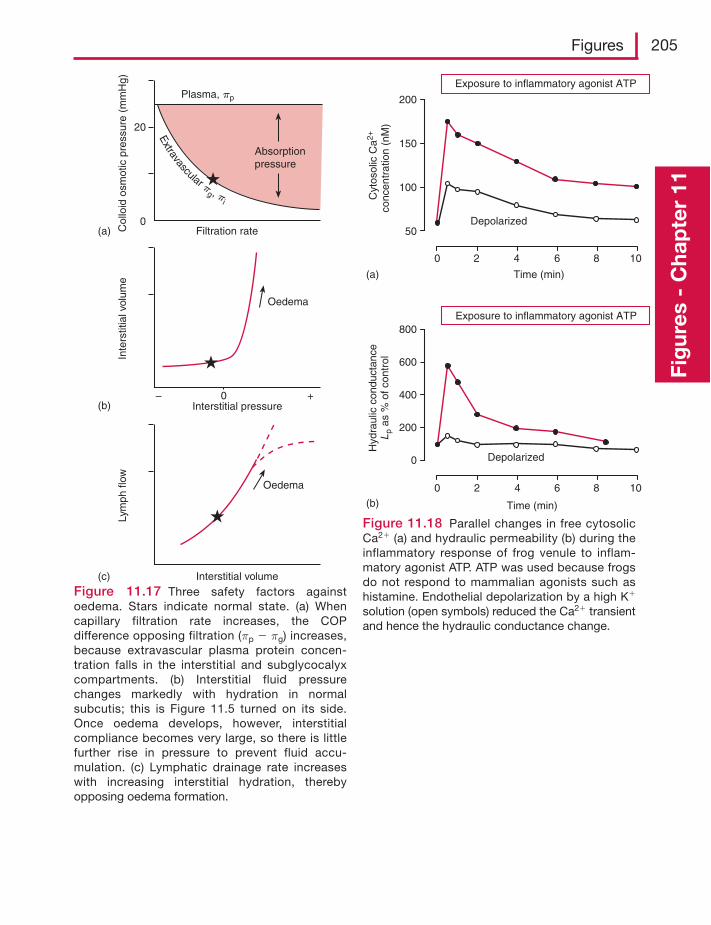
Figures 205
Fig
ures
- C
hap
ter
11
Plasma, pp
Absorptionpressure
Filtration rate(a)
20
0
Col
loid
osm
otic
pre
ssur
e (m
mH
g)
Oedema
Interstitial pressure(b)0
Inte
rstit
ial v
olum
e
– +
Oedema
Interstitial volume(c)
Lym
ph fl
ow
Extravascular p
g , pi
Figure 11.17 Three safety factors againstoedema. Stars indicate normal state. (a) Whencapillary filtration rate increases, the COPdifference opposing filtration (πp � πg) increases,because extravascular plasma protein concen-tration falls in the interstitial and subglycocalyxcompartments. (b) Interstitial fluid pressurechanges markedly with hydration in normalsubcutis; this is Figure 11.5 turned on its side.Once oedema develops, however, interstitialcompliance becomes very large, so there is littlefurther rise in pressure to prevent fluid accu-mulation. (c) Lymphatic drainage rate increaseswith increasing interstitial hydration, therebyopposing oedema formation.
Exposure to inflammatory agonist ATP
Depolarized
Time (min)(a)
(b)
Cyt
osol
ic C
a2+
conc
entr
atio
n (n
M)
200
150
100
50
0 2 4 6 8 10
Exposure to inflammatory agonist ATP
Depolarized
Time (min)
Hyd
raul
ic c
ondu
ctan
ceL
pas
% o
f con
trol
800
600
200
0
0 2 4 6 8 10
400
Figure 11.18 Parallel changes in free cytosolicCa2� (a) and hydraulic permeability (b) during theinflammatory response of frog venule to inflam-matory agonist ATP. ATP was used because frogsdo not respond to mammalian agonists such ashistamine. Endothelial depolarization by a high K�
solution (open symbols) reduced the Ca2� transientand hence the hydraulic conductance change.
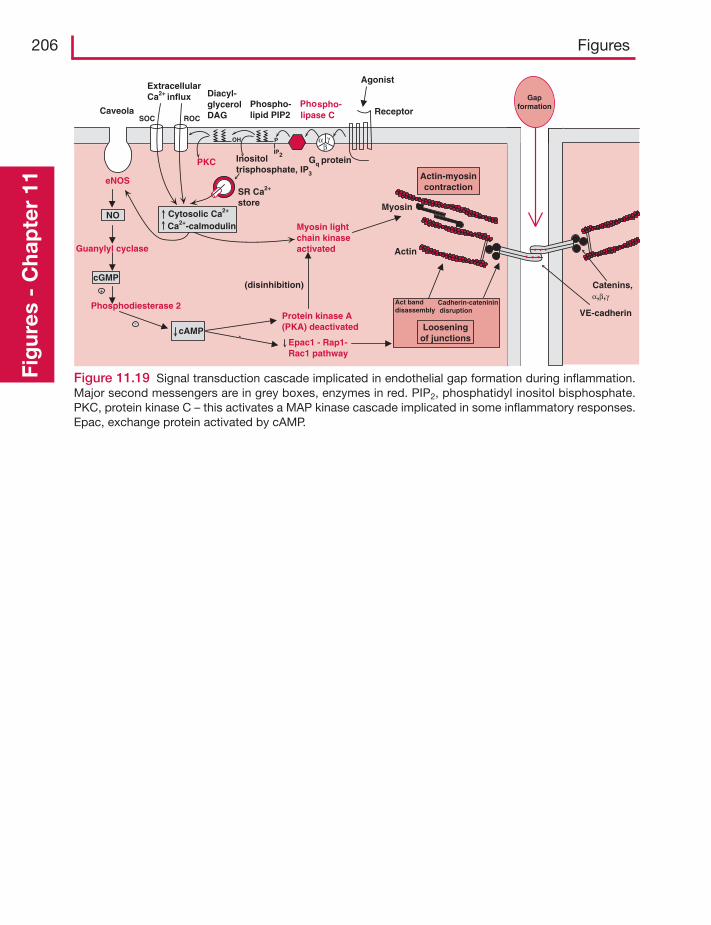
206 FiguresFi
gur
es -
Cha
pte
r 11
Figure 11.19 Signal transduction cascade implicated in endothelial gap formation during inflammation.Major second messengers are in grey boxes, enzymes in red. PIP2, phosphatidyl inositol bisphosphate.PKC, protein kinase C – this activates a MAP kinase cascade implicated in some inflammatory responses.Epac, exchange protein activated by cAMP.
PKC
Protein kinase A(PKA) deactivated
eNOS
Phosphodiesterase 2
Guanylyl cyclase
Myosin lightchain kinaseactivated
Actin-myosincontraction
Looseningof junctions
Gapformation
NO
+
cGMP
cAMP
Act banddisassembly
-
(disinhibition)
Epac1 - Rap1-Rac1 pathway
`
Phospho-lipase C
SR Ca2+
store
Inositoltrisphosphate, IP3
Phospho-lipid PIP2
Diacyl-glycerolDAG
ExtracellularCa2+ influx
Gq protein
P
IP2
OH
Agonist
Receptor
Actin
VE-cadherin
Catenins,α,β,γ
Myosin
Caveola
Cytosolic Ca2+
Ca2+-calmodulin
SOC ROC
α γβ
Cadherin-cateninin disruption
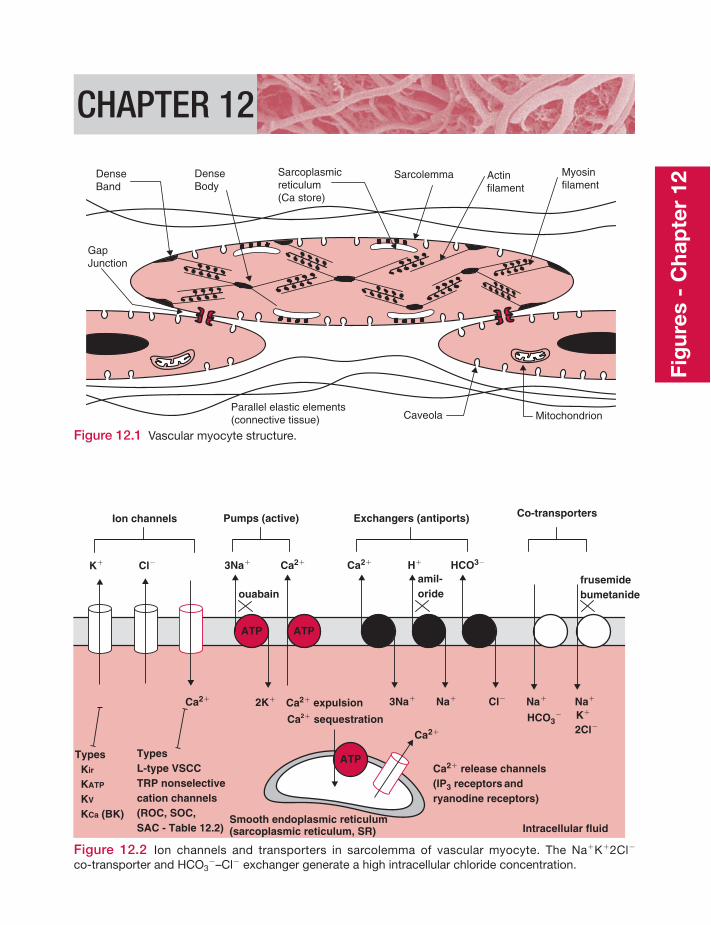
CHAPTER 12
GapJunction
Sarcoplasmicreticulum(Ca store)
DenseBand
DenseBody
Actinfilament
Myosinfilament
Parallel elastic elements(connective tissue) Caveola Mitochondrion
Sarcolemma
Figure 12.1 Vascular myocyte structure.
Ca2�
Cl�K�
Ion channels
Types Kir
KATP
KV
KCa (BK)
TypesL-type VSCCTRP nonselectivecation channels(ROC, SOC, SAC - Table 12.2)
Ca2�
ATP ATP
Ca2�3Na�
3Na� Na�2K�
H�
Cl�
HCO3�
ouabain
Na�
HCO3�
Na�
K�
2Cl�
frusemidebumetanide
Smooth endoplasmic reticulum(sarcoplasmic reticulum, SR) Intracellular fluid
Pumps (active) Exchangers (antiports) Co-transporters
amil-oride
Ca2� expulsion
Ca2+ATP
Ca2� sequestrationCa2�
Ca2� release channels(IP3 receptors andryanodine receptors)
Figure 12.2 Ion channels and transporters in sarcolemma of vascular myocyte. The Na�K�2Cl�
co-transporter and HCO3�–Cl� exchanger generate a high intracellular chloride concentration.
Fig
ures
- C
hap
ter
12
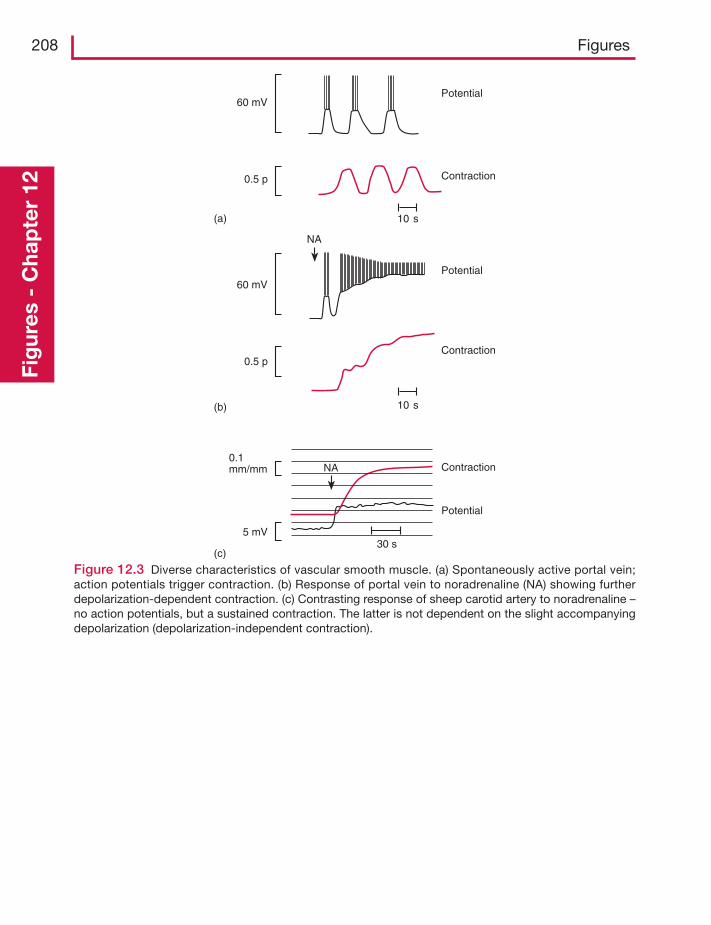
208 FiguresFi
gur
es -
Cha
pte
r 12
NA
30 s
0.1mm/mm
5 mV
Contraction
Potential
10 s
10 s
Contraction
Contraction
Potential
Potential
NA
60 mV
0.5 p
60 mV
0.5 p
(a)
(b)
(c)
Figure 12.3 Diverse characteristics of vascular smooth muscle. (a) Spontaneously active portal vein;action potentials trigger contraction. (b) Response of portal vein to noradrenaline (NA) showing furtherdepolarization-dependent contraction. (c) Contrasting response of sheep carotid artery to noradrenaline –no action potentials, but a sustained contraction. The latter is not dependent on the slight accompanyingdepolarization (depolarization-independent contraction).
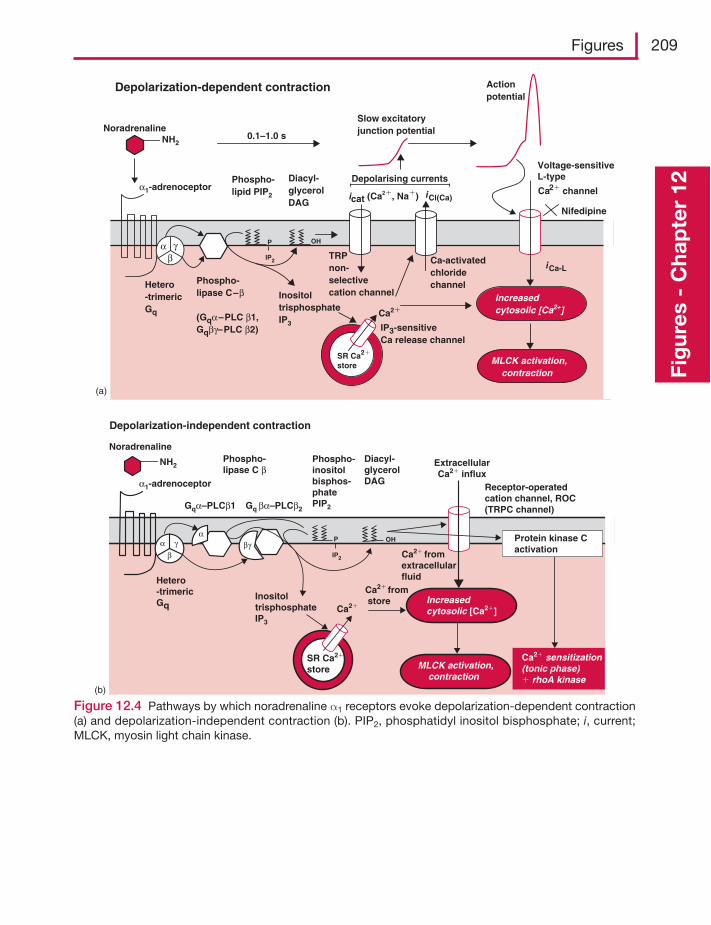
Figures 209
Fig
ures
- C
hap
ter
12
Phospho-lipase C–β
(Gqα–PLC β1,Gqβγ–PLC β2)
Slow excitatoryjunction potential
Voltage-sensitiveL-type
iCl(Ca)icat (Ca2�, Na�)
SR Ca2�
store
Ca2�
InositoltrisphosphateIP3
Hetero-trimericGq
Phospho-lipid PIP2
α1-adrenoceptorDiacyl-glycerolDAG
0.1–1.0 sNoradrenaline
TRPnon-selectivecation channel
Ca-activatedchloridechannel
Actionpotential
Depolarization-dependent contraction
Increasedcytosolic [Ca2+]
MLCK activation, contraction
iCa-L
Depolarising currents
P
IP2
OH
IP3-sensitiveCa release channel
NH2
(a)
βα γ
Nifedipine
Ca2� channel
Gqα–PLCβ1 Gq βα–PLCβ2
SR Ca2�
store
Ca2�
InositoltrisphosphateIP3
Hetero-trimericGq
Phospho-inositolbisphos-phatePIP2
Phospho-lipase C β
Diacyl-glycerolDAG
Receptor-operatedcation channel, ROC(TRPC channel)
Depolarization-independent contraction
Increasedcytosolic [Ca2�]
MLCK activation, contraction
P
IP2
OH
Ca2� from store
Ca2� fromextracellularfluid
Ca2� sensitization(tonic phase)� rhoA kinase
Protein kinase C activation
α1-adrenoceptor
Noradrenaline
(b)
NH2
γαα
ββγ
ExtracellularCa2� influx
Figure 12.4 Pathways by which noradrenaline α1 receptors evoke depolarization-dependent contraction(a) and depolarization-independent contraction (b). PIP2, phosphatidyl inositol bisphosphate; i, current;MLCK, myosin light chain kinase.
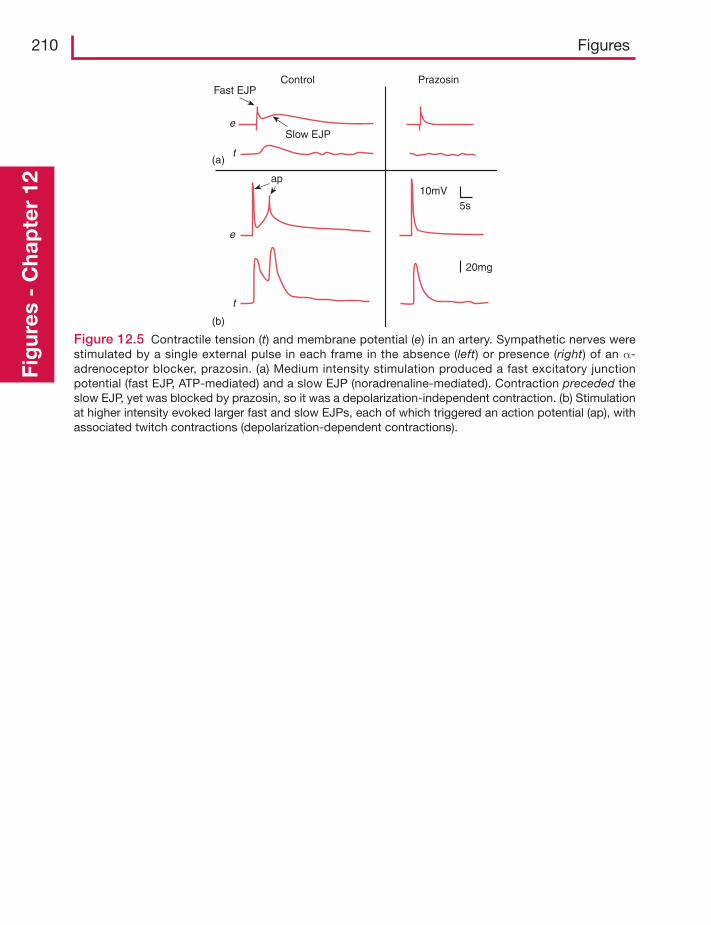
210 FiguresFi
gur
es -
Cha
pte
r 12
Control Prazosin
(a)
(b)
Fast EJP
ap
e
t
e
t
Slow EJP
10mV
20mg
5s
Figure 12.5 Contractile tension (t) and membrane potential (e) in an artery. Sympathetic nerves werestimulated by a single external pulse in each frame in the absence (left) or presence (right) of an α-adrenoceptor blocker, prazosin. (a) Medium intensity stimulation produced a fast excitatory junctionpotential (fast EJP, ATP-mediated) and a slow EJP (noradrenaline-mediated). Contraction preceded theslow EJP, yet was blocked by prazosin, so it was a depolarization-independent contraction. (b) Stimulationat higher intensity evoked larger fast and slow EJPs, each of which triggered an action potential (ap), withassociated twitch contractions (depolarization-dependent contractions).
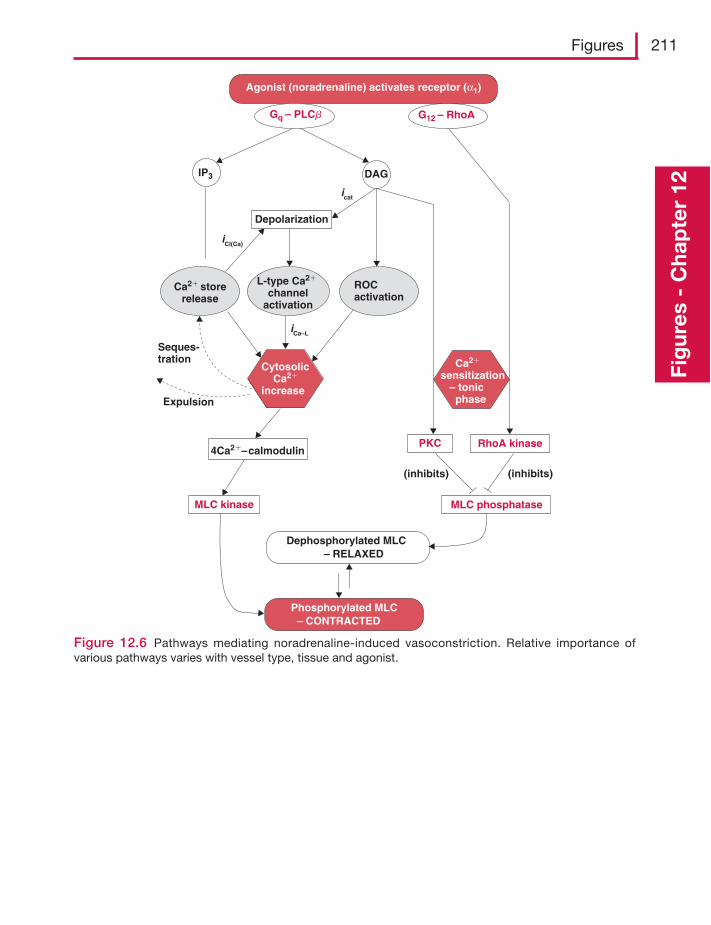
Figures 211
Fig
ures
- C
hap
ter
12
Cytosolic Ca2�
increase
IP3
Ca2� storerelease
ROCactivation
4Ca2�–calmodulin
MLC kinase MLC phosphatase
L-type Ca2�
channelactivation
PKC RhoA kinase
Ca2�
sensitization – tonic phase
Depolarization
Agonist (noradrenaline) activates receptor (α1)
iCa–L
Phosphorylated MLC – CONTRACTED
Dephosphorylated MLC – RELAXED
(inhibits)
DAG
G12 – RhoA Gq – PLCb
(inhibits)
Seques-tration
Expulsion
iCl(Ca)
icat
Figure 12.6 Pathways mediating noradrenaline-induced vasoconstriction. Relative importance ofvarious pathways varies with vessel type, tissue and agonist.
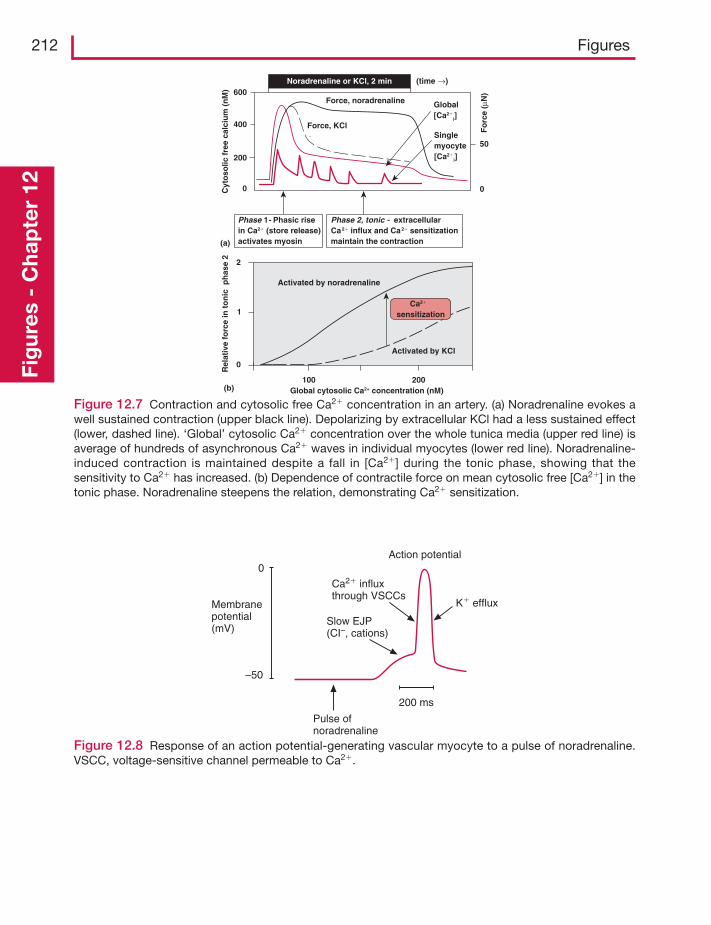
212 FiguresFi
gur
es -
Cha
pte
r 12
Force, noradrenaline Global[Ca2�
i]
Cyt
oso
lic f
ree
calc
ium
(n
M)
0
200
400
600
50
0
Noradrenaline or KCl, 2 min
Phase 1- Phasic rise in Ca2� (store release)activates myosin
Phase 2, tonic - extracellularCa2� influx and Ca2� sensitizationmaintain the contraction
2
1
0
100 200
Rel
ativ
e fo
rce
in t
on
ic p
has
e 2
Global cytosolic Ca2+ concentration (nM)(b)
(a)
Activated by KCl
Activated by noradrenaline
Ca2�
sensitization
Force, KCl Fo
rce
(μN
)
Singlemyocyte[Ca2�
i]
(time →)
Figure 12.7 Contraction and cytosolic free Ca2� concentration in an artery. (a) Noradrenaline evokes awell sustained contraction (upper black line). Depolarizing by extracellular KCl had a less sustained effect(lower, dashed line). ‘Global’ cytosolic Ca2� concentration over the whole tunica media (upper red line) isaverage of hundreds of asynchronous Ca2� waves in individual myocytes (lower red line). Noradrenaline-induced contraction is maintained despite a fall in [Ca2�] during the tonic phase, showing that thesensitivity to Ca2� has increased. (b) Dependence of contractile force on mean cytosolic free [Ca2�] in thetonic phase. Noradrenaline steepens the relation, demonstrating Ca2� sensitization.
Action potential
Membranepotential(mV)
0
–50
Pulse ofnoradrenaline
200 ms
Slow EJP(CI–, cations)
Ca2� influxthrough VSCCs
K� efflux
Figure 12.8 Response of an action potential-generating vascular myocyte to a pulse of noradrenaline.VSCC, voltage-sensitive channel permeable to Ca2�.
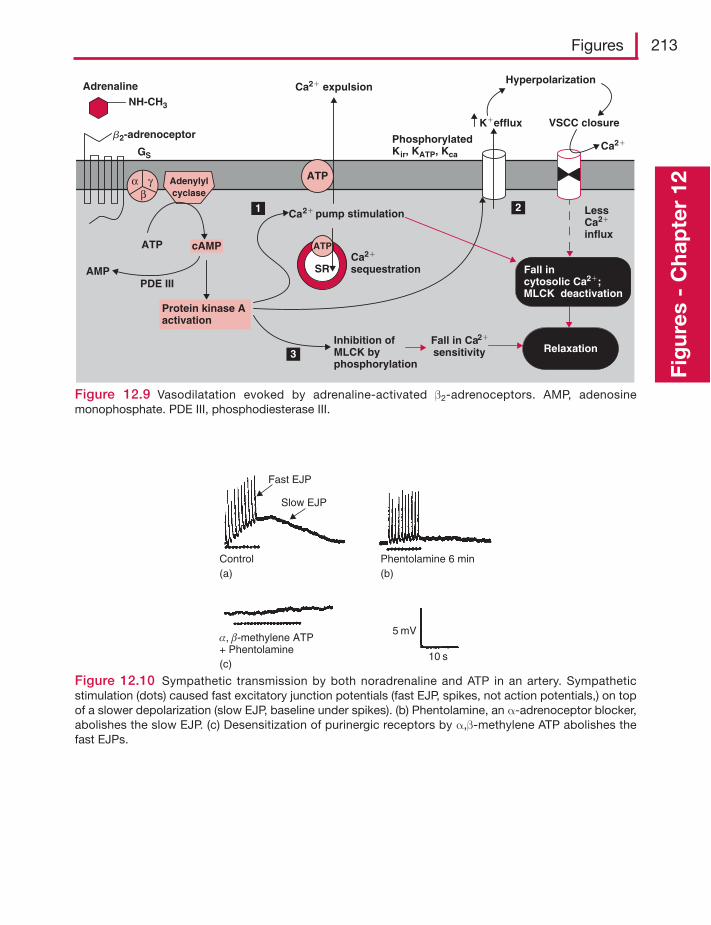
Figures 213
Fig
ures
- C
hap
ter
12Adenylylcyclase
K�efflux
ATP cAMP
Fall in Ca2�
sensitivity
Ca2� pump stimulation
Hyperpolarization
VSCC closure
2
3
Ca2�
Ca2� expulsion
SR
ATP
ATP
Ca2�
sequestration
LessCa2�
influx
Inhibition ofMLCK byphosphorylation
PhosphorylatedKir, KATP, Kca
Adrenaline
GS
Relaxation
Fall incytosolic Ca2�;MLCK deactivation
Protein kinase A activation
αβ
γ
NH-CH3
b2-adrenoceptor
AMPPDE III
1
Figure 12.9 Vasodilatation evoked by adrenaline-activated β2-adrenoceptors. AMP, adenosinemonophosphate. PDE III, phosphodiesterase III.
Fast EJP
Slow EJP
Control Phentolamine 6 min
10 s
5 mV
(a) (b)
(c)
α, β-methylene ATP+ Phentolamine
Figure 12.10 Sympathetic transmission by both noradrenaline and ATP in an artery. Sympatheticstimulation (dots) caused fast excitatory junction potentials (fast EJP, spikes, not action potentials,) on topof a slower depolarization (slow EJP, baseline under spikes). (b) Phentolamine, an α-adrenoceptor blocker,abolishes the slow EJP. (c) Desensitization of purinergic receptors by α,β-methylene ATP abolishes thefast EJPs.
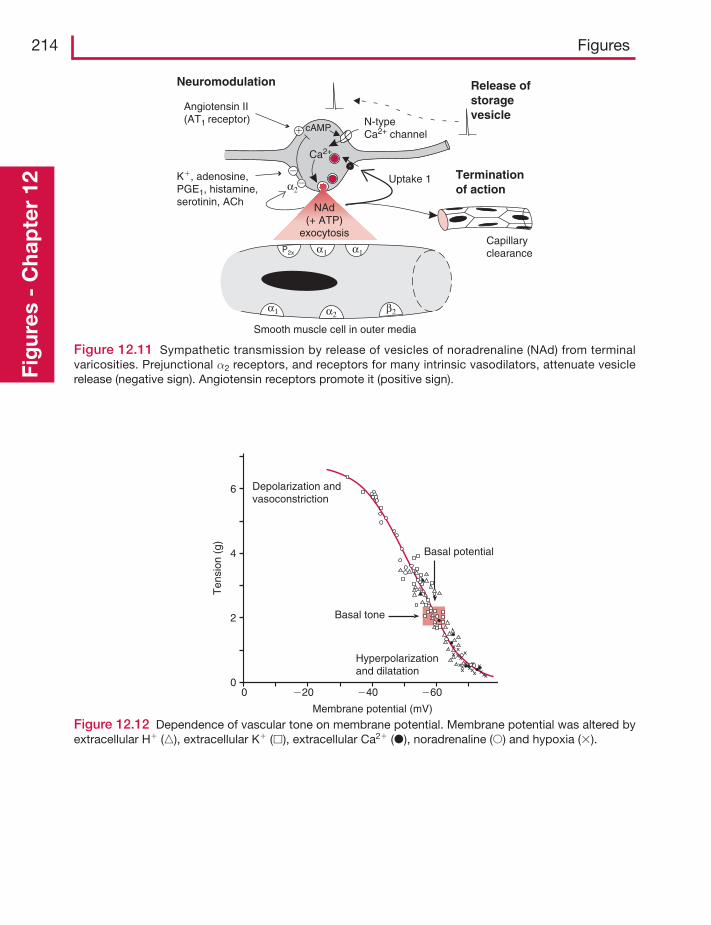
214 FiguresFi
gur
es -
Cha
pte
r 12
α1
Ca2+
N-typeCa2+ channel
Smooth muscle cell in outer media
Uptake 1
Capillaryclearance
Release ofstoragevesicle
Terminationof action
�
�
Neuromodulation
α2
Angiotensin II(AT1 receptor)
K�, adenosine,PGE1, histamine,serotinin, ACh
P2x
cAMP
�
α1
α1 α2β2
NAd(+ ATP)
exocytosis
Figure 12.11 Sympathetic transmission by release of vesicles of noradrenaline (NAd) from terminalvaricosities. Prejunctional α2 receptors, and receptors for many intrinsic vasodilators, attenuate vesiclerelease (negative sign). Angiotensin receptors promote it (positive sign).
0 �20 �40 �60
Membrane potential (mV)
Ten
sion
(g)
0
2
4
6 Depolarization andvasoconstriction
Hyperpolarizationand dilatation
Basal tone
Basal potential
Figure 12.12 Dependence of vascular tone on membrane potential. Membrane potential was altered byextracellular H� (�), extracellular K� (�), extracellular Ca2� (�), noradrenaline (�) and hypoxia (�).
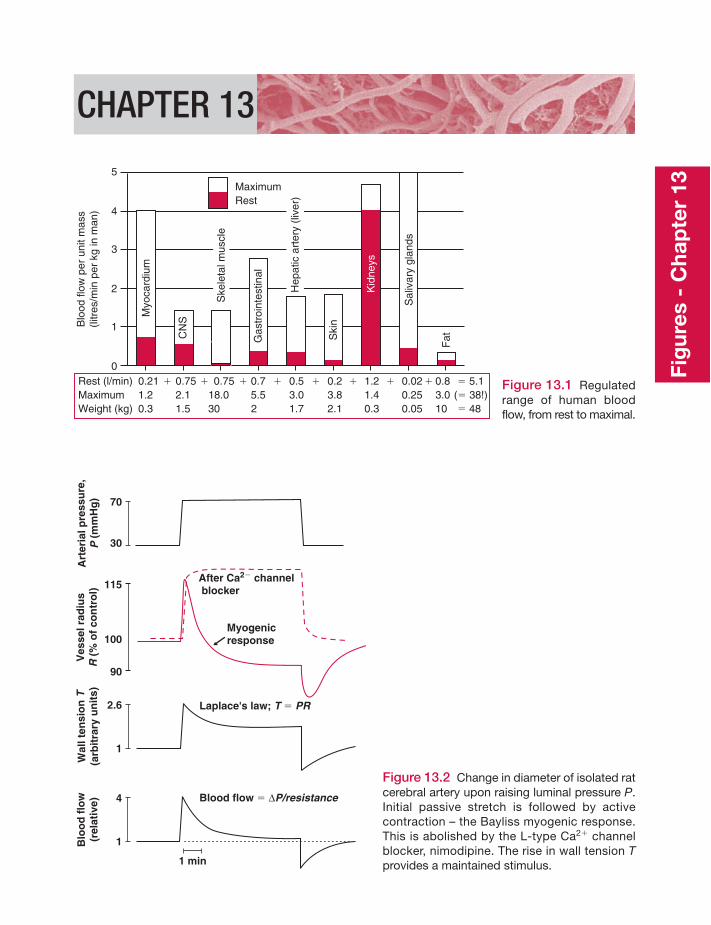
CHAPTER 13
MaximumRest
Blo
od fl
ow p
er u
nit m
ass
(litr
es/m
in p
er k
g in
man
)
5
4
3
2
1
0Rest (l/min) 0.21 � 0.75 � 0.75 � 0.7 � 0.5 � 0.2 � 1.2 � 0.02 � 0.8 � 5.1Maximum 1.2 2.1 18.0 5.5 3.0 3.8 1.4 0.25 3.0 (� 38!)Weight (kg) 0.3 1.5 30 2 1.7 2.1 0.3 0.05 10 � 48
Myo
card
ium
CN
S
Kid
neys
Ski
n
Gas
troi
ntes
tinal
Fat
Sal
ivar
y gl
ands
Ske
leta
l mus
cle
Hep
atic
art
ery
(live
r)
Figure 13.1 Regulatedrange of human bloodflow, from rest to maximal.
Art
eria
l pre
ssu
re,
P(m
mH
g)
30
70
Ves
sel r
adiu
sR
(% o
f co
ntr
ol)
100
115
90
Myogenicresponse
After Ca2� channel blocker
Wal
l ten
sio
nT
(arb
itra
ry u
nit
s)
1
2.6 Laplace's law; T � PR
Blood flow � ΔP/resistance
1 min
Blo
od
flo
w(r
elat
ive)
1
4
Figure 13.2 Change in diameter of isolated ratcerebral artery upon raising luminal pressure P.Initial passive stretch is followed by activecontraction – the Bayliss myogenic response.This is abolished by the L-type Ca2� channelblocker, nimodipine. The rise in wall tension Tprovides a maintained stimulus.
Fig
ures
- C
hap
ter
13
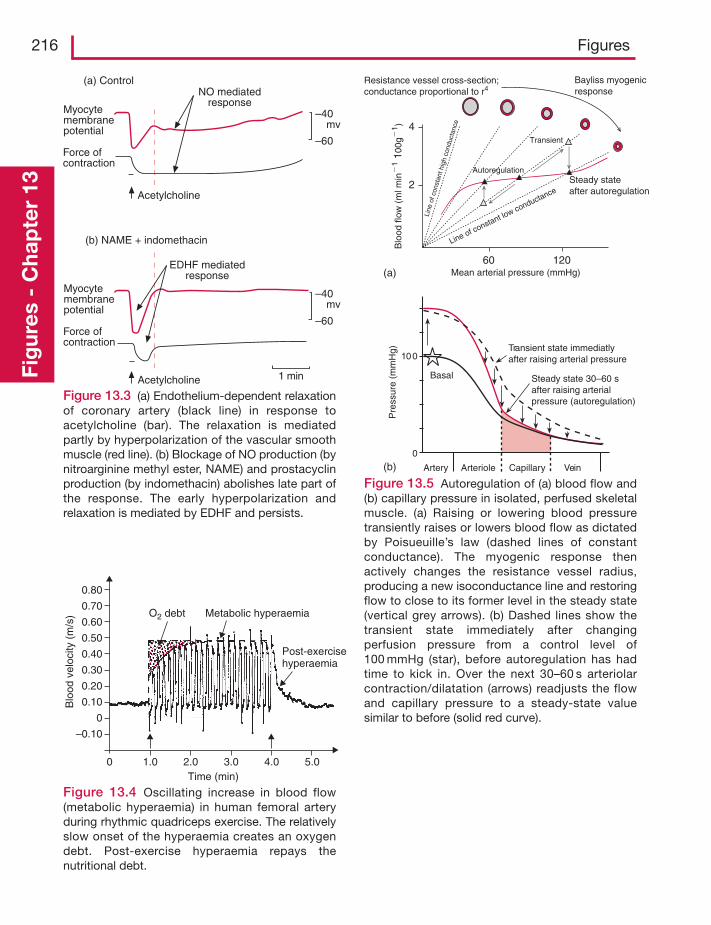
216 FiguresFi
gur
es -
Cha
pte
r 13
mvMyocytemembranepotential
Force ofcontraction
(a) Control
(b) NAME + indomethacin
NO mediatedresponse
Acetylcholine
Myocytemembranepotential
Force ofcontraction
Acetylcholine
–40
–60
mv–40
–60
1 min
EDHF mediatedresponse
0.80
0.70
0.60
0.50
0.40
0.30
0.20
0.10
0
0 1.0 2.0 3.0 4.0 5.0
–0.10
Blo
od v
eloc
ity (
m/s
)
Time (min)
O2 debt Metabolic hyperaemia
Post-exercisehyperaemia
Figure 13.4 Oscillating increase in blood flow(metabolic hyperaemia) in human femoral arteryduring rhythmic quadriceps exercise. The relativelyslow onset of the hyperaemia creates an oxygendebt. Post-exercise hyperaemia repays thenutritional debt.
(a)
100
0
(b) Artery
Pre
ssur
e (m
mH
g) Transient state immediatlyafter raising arterial pressure
Basal
Arteriole Capillary Vein
Steady state 30–60 safter raising arterialpressure (autoregulation)
Blo
od fl
ow (
ml m
in�
1 10
0g�
1 )
Mean arterial pressure (mmHg)
Bayliss myogenicresponse
Autoregulation
Resistance vessel cross-section;conductance proportional to r4
60 120
2
4Transient
Steady stateafter autoregulation
Line of constant low conductance
Line
of c
onst
ant h
igh
cond
ucta
nce
Figure 13.5 Autoregulation of (a) blood flow and(b) capillary pressure in isolated, perfused skeletalmuscle. (a) Raising or lowering blood pressuretransiently raises or lowers blood flow as dictatedby Poisueuille’s law (dashed lines of constantconductance). The myogenic response thenactively changes the resistance vessel radius,producing a new isoconductance line and restoringflow to close to its former level in the steady state(vertical grey arrows). (b) Dashed lines show thetransient state immediately after changingperfusion pressure from a control level of100 mmHg (star), before autoregulation has hadtime to kick in. Over the next 30–60 s arteriolarcontraction/dilatation (arrows) readjusts the flowand capillary pressure to a steady-state valuesimilar to before (solid red curve).
Figure 13.3 (a) Endothelium-dependent relaxationof coronary artery (black line) in response toacetylcholine (bar). The relaxation is mediatedpartly by hyperpolarization of the vascular smoothmuscle (red line). (b) Blockage of NO production (bynitroarginine methyl ester, NAME) and prostacyclinproduction (by indomethacin) abolishes late part ofthe response. The early hyperpolarization andrelaxation is mediated by EDHF and persists.
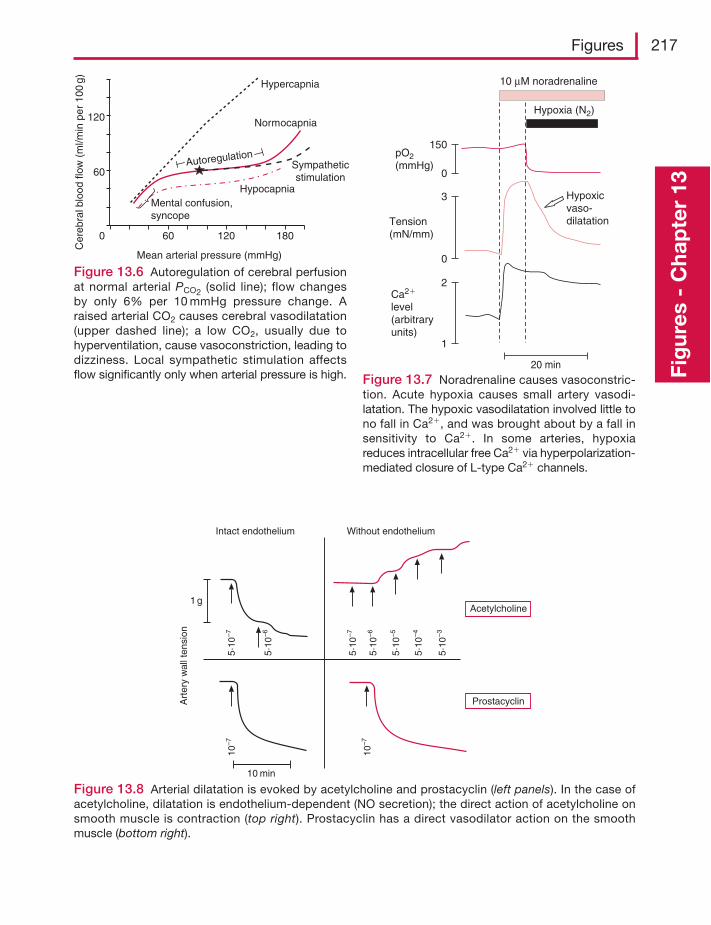
Figures 217
Fig
ures
- C
hap
ter
13
120
60
0 60 120 180
Mean arterial pressure (mmHg)
Cer
ebra
lblo
od fl
ow (
ml/m
in p
er 1
00g)
Sympatheticstimulation
Hypercapnia
Normocapnia
HypocapniaMental confusion,syncope
Autoregulation
Figure 13.6 Autoregulation of cerebral perfusionat normal arterial PCO2 (solid line); flow changesby only 6% per 10 mmHg pressure change. Araised arterial CO2 causes cerebral vasodilatation(upper dashed line); a low CO2, usually due tohyperventilation, cause vasoconstriction, leading todizziness. Local sympathetic stimulation affectsflow significantly only when arterial pressure is high.
20 min
Hypoxia (N2)
10 μM noradrenaline
pO2(mmHg)
Tension(mN/mm)
Ca2�
level(arbitraryunits)
150
0
3
0
1
2
Hypoxicvaso-dilatation
Figure 13.7 Noradrenaline causes vasoconstric-tion. Acute hypoxia causes small artery vasodi-latation. The hypoxic vasodilatation involved little tono fall in Ca2�, and was brought about by a fall insensitivity to Ca2�. In some arteries, hypoxiareduces intracellular free Ca2� via hyperpolarization-mediated closure of L-type Ca2� channels.
1 g
Without endothelium
Acetylcholine
Prostacyclin
Intact endothelium
Art
ery
wal
l ten
sion
10 min
10–7
10–7
5·10
–7
5·10
–7
5·10
–6
5·10
–6
5·10
–5
5·10
–4
5·10
–3
Figure 13.8 Arterial dilatation is evoked by acetylcholine and prostacyclin (left panels). In the case ofacetylcholine, dilatation is endothelium-dependent (NO secretion); the direct action of acetylcholine onsmooth muscle is contraction (top right). Prostacyclin has a direct vasodilator action on the smoothmuscle (bottom right).
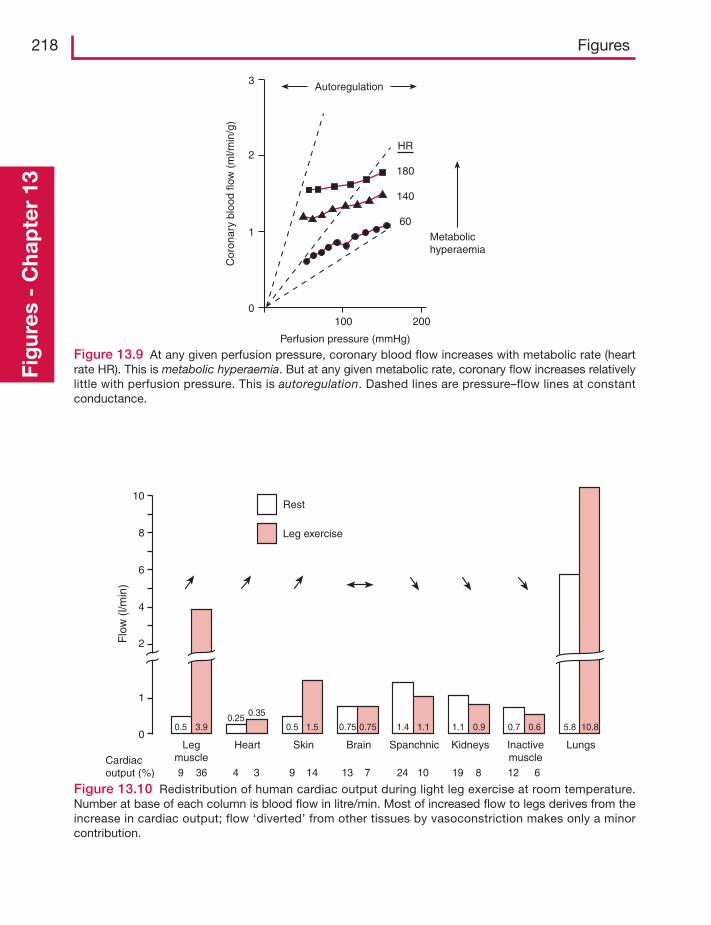
218 FiguresFi
gur
es -
Cha
pte
r 13
Autoregulation
Metabolichyperaemia
Perfusion pressure (mmHg)
100 2000
1
2
3
Cor
onar
ybl
ood
flow
(m
l/min
/g)
HR
180
140
60
Figure 13.9 At any given perfusion pressure, coronary blood flow increases with metabolic rate (heartrate HR). This is metabolic hyperaemia. But at any given metabolic rate, coronary flow increases relativelylittle with perfusion pressure. This is autoregulation. Dashed lines are pressure–flow lines at constantconductance.
10
8
6
4
2
1
0Leg
muscleHeart BrainSkin Spanchnic Kidneys Inactive
muscleLungs
Cardiacoutput (%)
Rest
Leg exercise
Flo
w (
l/min
)
9
0.5 0.5 1.5 0.75 0.75 1.4 1.1 1.1 0.9 0.7 0.6 5.8 10.83.90.25 0.35
36 13 24 10 12 619 879 144 3
Figure 13.10 Redistribution of human cardiac output during light leg exercise at room temperature.Number at base of each column is blood flow in litre/min. Most of increased flow to legs derives from theincrease in cardiac output; flow ‘diverted’ from other tissues by vasoconstriction makes only a minorcontribution.
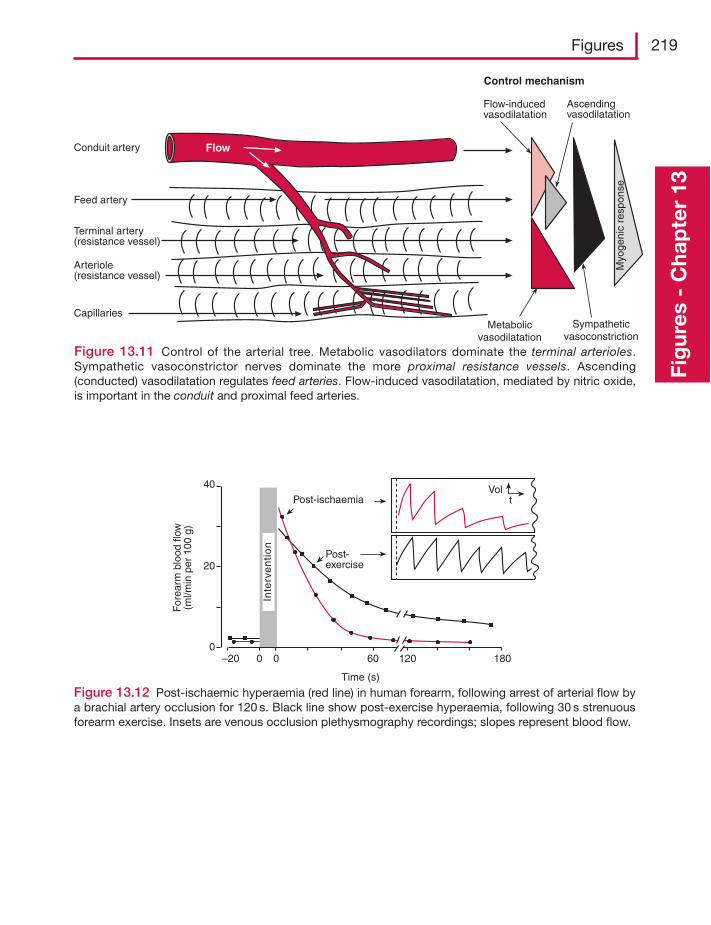
Figures 219
Fig
ures
- C
hap
ter
13
FlowConduit artery
Feed artery
Terminal artery(resistance vessel)
Arteriole(resistance vessel)
CapillariesMetabolic
vasodilatationSympathetic
vasoconstriction
Flow-inducedvasodilatation
Ascendingvasodilatation
Control mechanism
Myo
geni
c re
spon
se
Figure 13.11 Control of the arterial tree. Metabolic vasodilators dominate the terminal arterioles.Sympathetic vasoconstrictor nerves dominate the more proximal resistance vessels. Ascending(conducted) vasodilatation regulates feed arteries. Flow-induced vasodilatation, mediated by nitric oxide,is important in the conduit and proximal feed arteries.
Post-ischaemia
Post-exercise
Time (s)
–20 0 0 60 120 1800
20
40
For
earm
bloo
d flo
w(m
l/min
per
100
g)
Inte
rve
nti
on
Volt
Figure 13.12 Post-ischaemic hyperaemia (red line) in human forearm, following arrest of arterial flow bya brachial artery occlusion for 120 s. Black line show post-exercise hyperaemia, following 30 s strenuousforearm exercise. Insets are venous occlusion plethysmography recordings; slopes represent blood flow.
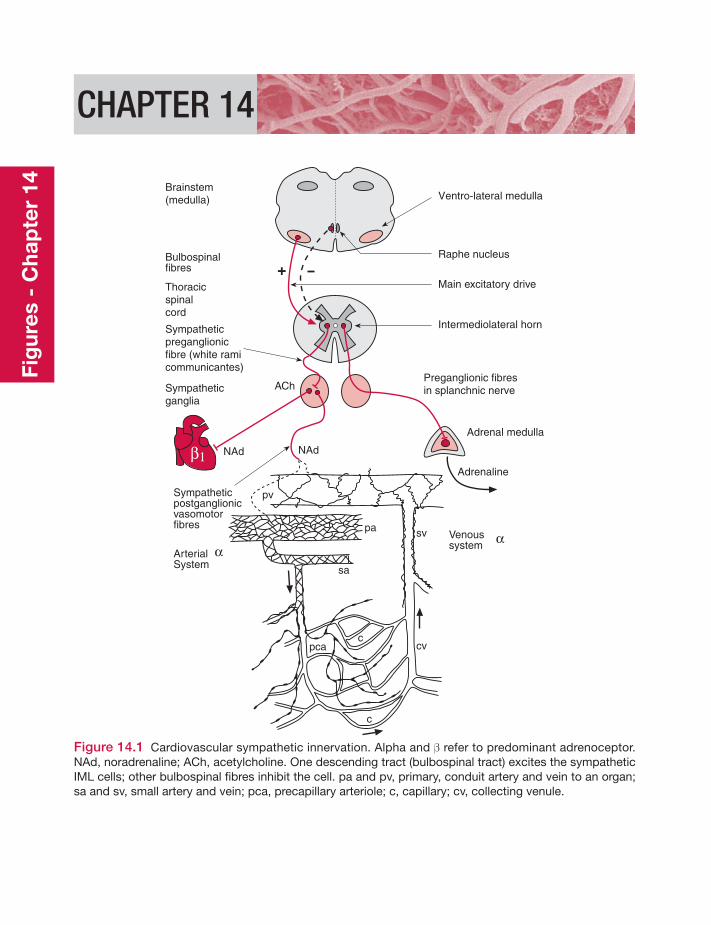
CHAPTER 14
Brainstem(medulla)
Bulbospinalfibres
Thoracicspinalcord
Sympatheticpreganglionicfibre (white ramicommunicantes)
Sympatheticganglia
Sympatheticpostganglionicvasomotorfibres
ArterialSystem
α
β1
α
Ventro-lateral medulla
Raphe nucleus
Main excitatory drive
Intermediolateral horn
Preganglionic fibresin splanchnic nerve
Adrenal medulla
Adrenaline
Venoussystem
NAdNAd
ACh
pa
sa
sv
pv
cvc
c
pca
Figure 14.1 Cardiovascular sympathetic innervation. Alpha and β refer to predominant adrenoceptor.NAd, noradrenaline; ACh, acetylcholine. One descending tract (bulbospinal tract) excites the sympatheticIML cells; other bulbospinal fibres inhibit the cell. pa and pv, primary, conduit artery and vein to an organ;sa and sv, small artery and vein; pca, precapillary arteriole; c, capillary; cv, collecting venule.
Fig
ures
- C
hap
ter
14
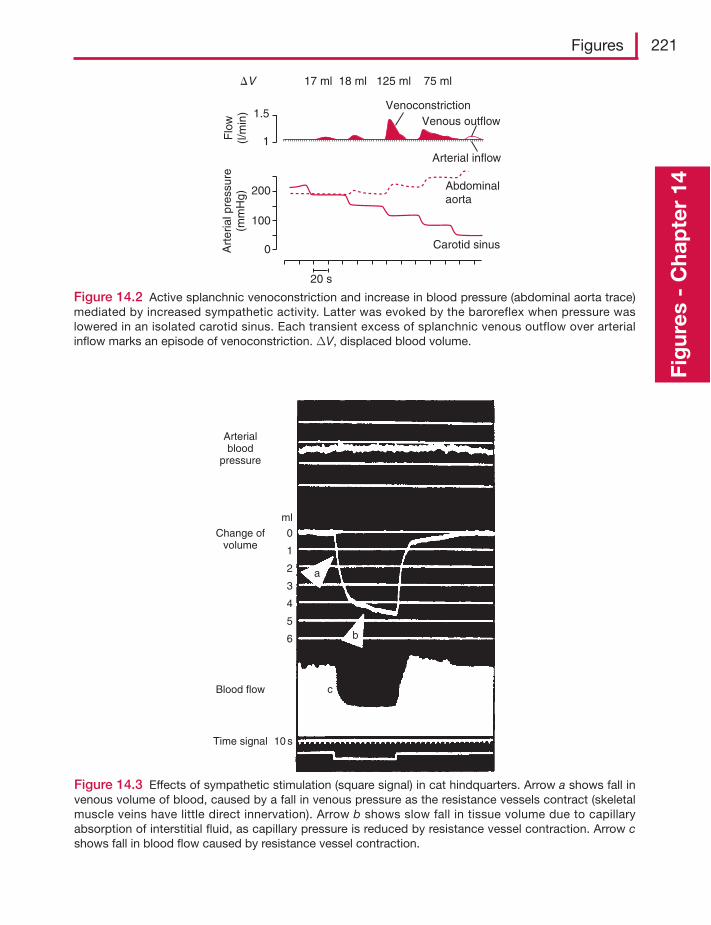
Figures 221
Fig
ures
- C
hap
ter
14
VenoconstrictionVenous outflow
17 ml 18 ml 125 ml 75 ml
Arterial inflow
Abdominalaorta
Carotid sinus
20 s
1.5
1
200
100
0
Flo
w(l/
min
)A
rter
ial p
ress
ure
(mm
Hg)
�V
Figure 14.2 Active splanchnic venoconstriction and increase in blood pressure (abdominal aorta trace)mediated by increased sympathetic activity. Latter was evoked by the baroreflex when pressure waslowered in an isolated carotid sinus. Each transient excess of splanchnic venous outflow over arterialinflow marks an episode of venoconstriction. ΔV, displaced blood volume.
Arterialblood
pressure
Change ofvolume
ml
0
1
2
3
4
6
5
Blood flow
Time signal 10 s
a
b
c
Figure 14.3 Effects of sympathetic stimulation (square signal) in cat hindquarters. Arrow a shows fall invenous volume of blood, caused by a fall in venous pressure as the resistance vessels contract (skeletalmuscle veins have little direct innervation). Arrow b shows slow fall in tissue volume due to capillaryabsorption of interstitial fluid, as capillary pressure is reduced by resistance vessel contraction. Arrow cshows fall in blood flow caused by resistance vessel contraction.
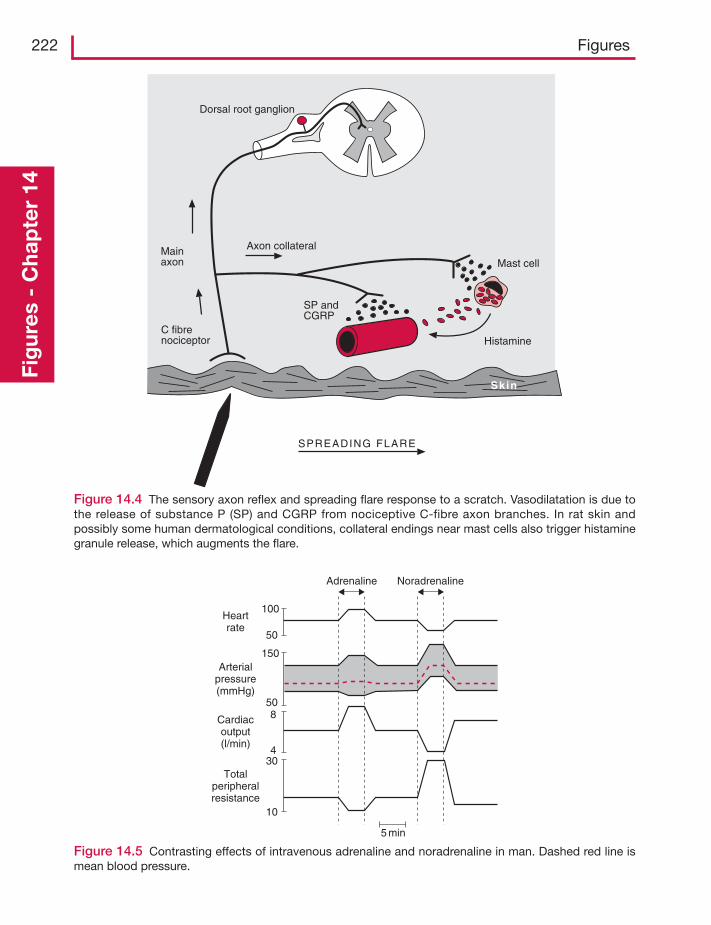
222 FiguresFi
gur
es -
Cha
pte
r 14
Dorsal root ganglion
Axon collateral
Mast cell
Histamine
Mainaxon
C fibrenociceptor
SP andCGRP
SPREADING FLARE
Sk in
Figure 14.4 The sensory axon reflex and spreading flare response to a scratch. Vasodilatation is due tothe release of substance P (SP) and CGRP from nociceptive C-fibre axon branches. In rat skin andpossibly some human dermatological conditions, collateral endings near mast cells also trigger histaminegranule release, which augments the flare.
100
50
150
508
430
10
Heartrate
Arterialpressure(mmHg)
Cardiacoutput(l/min)
Totalperipheralresistance
5 min
Adrenaline Noradrenaline
Figure 14.5 Contrasting effects of intravenous adrenaline and noradrenaline in man. Dashed red line ismean blood pressure.
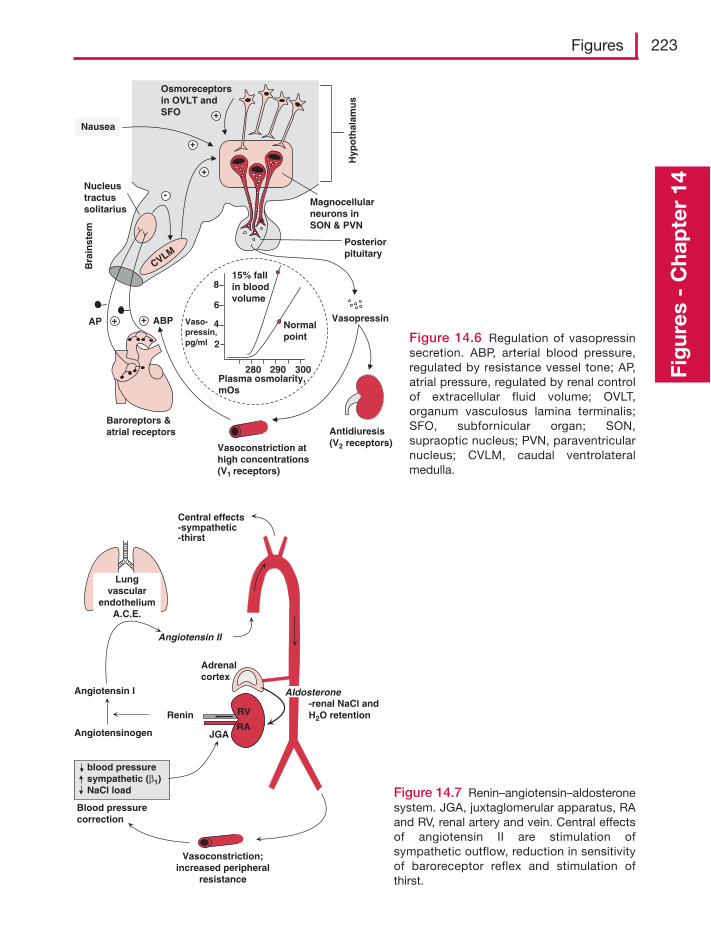
Figures 223
Fig
ures
- C
hap
ter
14
+
+
-
++
Antidiuresis(V2 receptors)
Hyp
oth
alam
us
Osmoreceptorsin OVLT andSFO
CVLM
Magnocellularneurons inSON & PVN
Posteriorpituitary
ABPAP
Bra
inst
em
Nucleustractussolitarius
Baroreptors &atrial receptors
Vasopressin
Vasoconstriction athigh concentrations(V1 receptors)
280 290 300
2
4
6
Vaso-pressin,pg/ml
Plasma osmolarity,mOs
Normalpoint
15% fallin bloodvolume
8
Nausea
+
Figure 14.6 Regulation of vasopressinsecretion. ABP, arterial blood pressure,regulated by resistance vessel tone; AP,atrial pressure, regulated by renal controlof extracellular fluid volume; OVLT,organum vasculosus lamina terminalis;SFO, subfornicular organ; SON,supraoptic nucleus; PVN, paraventricularnucleus; CVLM, caudal ventrolateralmedulla.
Angiotensinogen
Angiotensin I
Blood pressurecorrection
blood pressuresympathetic (β1)NaCl load
Lungvascular
endotheliumA.C.E.
Renin
Angiotensin II
AIdosterone
Vasoconstriction;increased peripheral
resistance
-renal NaCl andH2O retention
RA
RV
Adrenalcortex
Central effects-sympathetic-thirst
JGA
Figure 14.7 Renin–angiotensin–aldosteronesystem. JGA, juxtaglomerular apparatus, RAand RV, renal artery and vein. Central effectsof angiotensin II are stimulation ofsympathetic outflow, reduction in sensitivityof baroreceptor reflex and stimulation ofthirst.
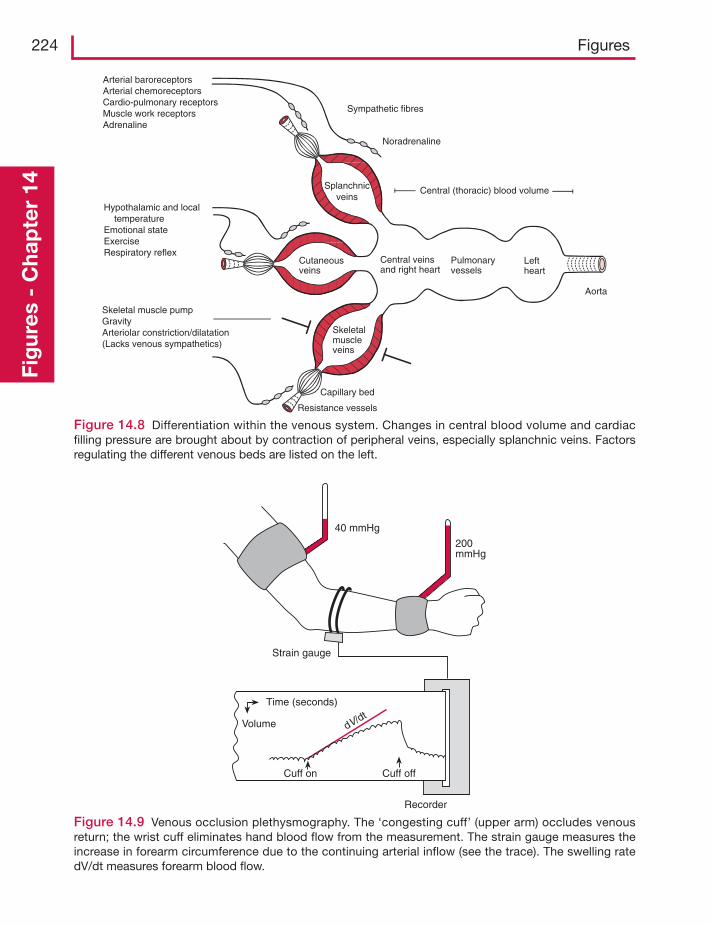
224 FiguresFi
gur
es -
Cha
pte
r 14
Cuff on Cuff off
Recorder
Time (seconds)
Volume dV/dt
40 mmHg
200mmHg
Strain gauge
Leftheart
Central veinsand right heart
Pulmonaryvessels
Aorta
Central (thoracic) blood volumeSplanchnicveins
Cutaneousveins
Skeletalmuscleveins
Resistance vessels
Capillary bed
Arterial baroreceptorsArterial chemoreceptorsCardio-pulmonary receptorsMuscle work receptorsAdrenaline
Sympathetic fibres
Noradrenaline
Hypothalamic and local temperatureEmotional stateExerciseRespiratory reflex
Skeletal muscle pumpGravityArteriolar constriction/dilatation(Lacks venous sympathetics)
Figure 14.8 Differentiation within the venous system. Changes in central blood volume and cardiacfilling pressure are brought about by contraction of peripheral veins, especially splanchnic veins. Factorsregulating the different venous beds are listed on the left.
Figure 14.9 Venous occlusion plethysmography. The ‘congesting cuff’ (upper arm) occludes venousreturn; the wrist cuff eliminates hand blood flow from the measurement. The strain gauge measures theincrease in forearm circumference due to the continuing arterial inflow (see the trace). The swelling ratedV/dt measures forearm blood flow.
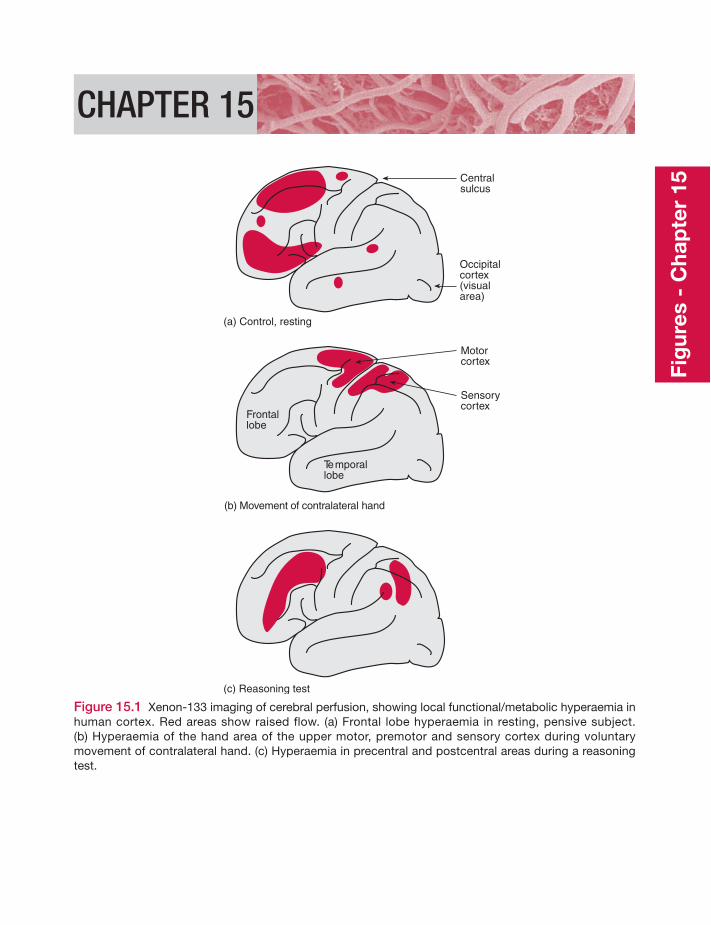
CHAPTER 15
(a) Control, resting
(b) Movement of contralateral hand
(c) Reasoning test
Centralsulcus
Occipitalcortex(visualarea)
Motorcortex
Sensorycortex
Temporallobe
Frontallobe
Figure 15.1 Xenon-133 imaging of cerebral perfusion, showing local functional/metabolic hyperaemia inhuman cortex. Red areas show raised flow. (a) Frontal lobe hyperaemia in resting, pensive subject.(b) Hyperaemia of the hand area of the upper motor, premotor and sensory cortex during voluntarymovement of contralateral hand. (c) Hyperaemia in precentral and postcentral areas during a reasoningtest.
Fig
ures
- C
hap
ter
15
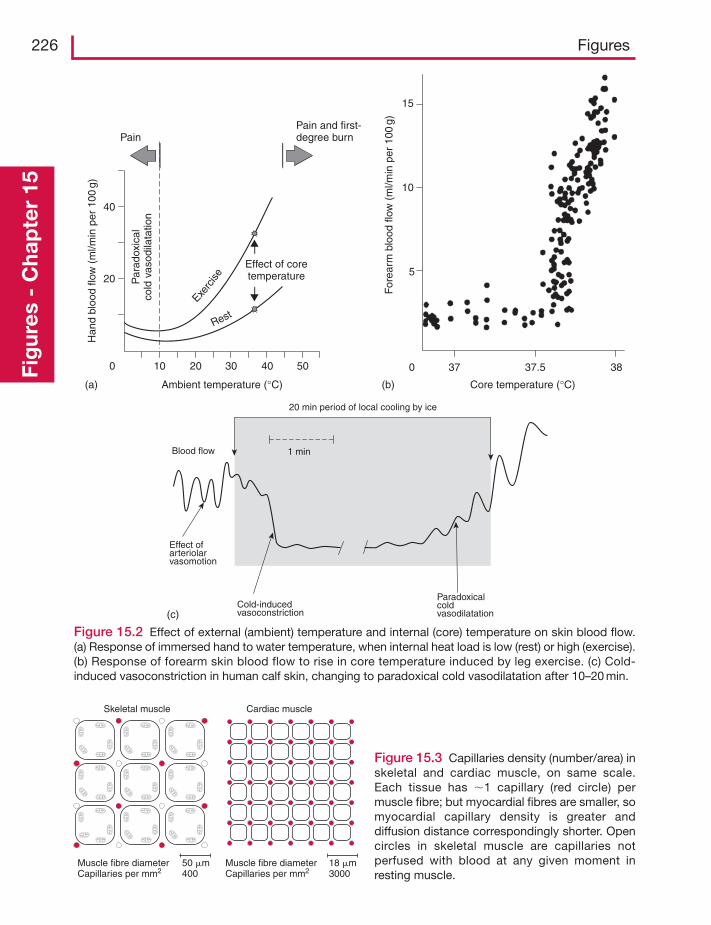
226 FiguresFi
gur
es -
Cha
pte
r 15
Ambient temperature (°C)
0 10 20
20
30 40
40
50
PainPain and first-degree burn
Par
adox
ical
cold
vas
odila
tatio
n
Han
d bl
ood
flow
(m
l/min
per
100
g)
Core temperature (°C)
0
5
37 37.5
15
10
38
For
earm
blo
od fl
ow (
ml/m
in p
er 1
00g)
(a) (b)
(c)
Effect of coretemperature
Exerc
ise
Rest
1 min
20 min period of local cooling by ice
Effect of arteriolarvasomotion
Cold-inducedvasoconstriction
Paradoxicalcoldvasodilatation
Blood flow
Figure 15.2 Effect of external (ambient) temperature and internal (core) temperature on skin blood flow.(a) Response of immersed hand to water temperature, when internal heat load is low (rest) or high (exercise).(b) Response of forearm skin blood flow to rise in core temperature induced by leg exercise. (c) Cold-induced vasoconstriction in human calf skin, changing to paradoxical cold vasodilatation after 10–20 min.
Muscle fibre diameter Capillaries per mm2
Muscle fibre diameter Capillaries per mm2
50 �m400
18 �m3000
Skeletal muscle Cardiac muscle
Figure 15.3 Capillaries density (number/area) inskeletal and cardiac muscle, on same scale.Each tissue has �1 capillary (red circle) permuscle fibre; but myocardial fibres are smaller, somyocardial capillary density is greater anddiffusion distance correspondingly shorter. Opencircles in skeletal muscle are capillaries notperfused with blood at any given moment inresting muscle.
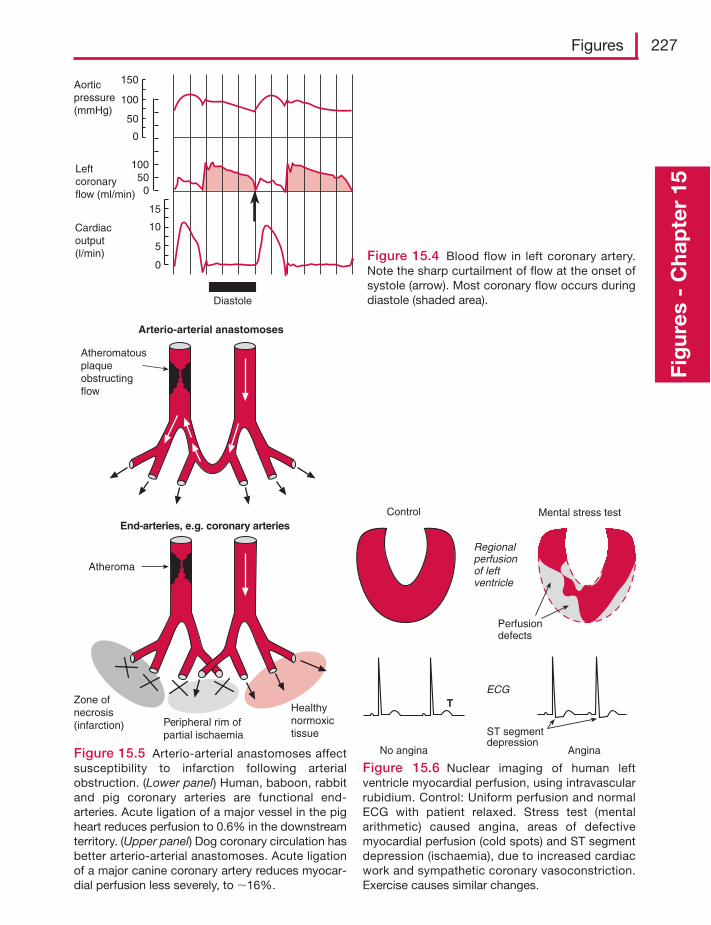
Figures 227
Fig
ures
- C
hap
ter
15
Aorticpressure(mmHg)
Leftcoronaryflow (ml/min)
Cardiacoutput(l/min)
150
100
50
0
10050
0
15
10
5
0
Diastole
Figure 15.4 Blood flow in left coronary artery.Note the sharp curtailment of flow at the onset ofsystole (arrow). Most coronary flow occurs duringdiastole (shaded area).
Arterio-arterial anastomoses
End-arteries, e.g. coronary arteries
Atheromatousplaqueobstructingflow
Zone ofnecrosis(infarction) Peripheral rim of
partial ischaemia
Healthynormoxictissue
Atheroma
Figure 15.5 Arterio-arterial anastomoses affectsusceptibility to infarction following arterialobstruction. (Lower panel) Human, baboon, rabbitand pig coronary arteries are functional end-arteries. Acute ligation of a major vessel in the pigheart reduces perfusion to 0.6% in the downstreamterritory. (Upper panel) Dog coronary circulation hasbetter arterio-arterial anastomoses. Acute ligationof a major canine coronary artery reduces myocar-dial perfusion less severely, to �16%.
Control Mental stress test
ECG
Regionalperfusionof leftventricle
Perfusiondefects
No angina Angina
ST segmentdepression
T
Figure 15.6 Nuclear imaging of human leftventricle myocardial perfusion, using intravascularrubidium. Control: Uniform perfusion and normalECG with patient relaxed. Stress test (mentalarithmetic) caused angina, areas of defectivemyocardial perfusion (cold spots) and ST segmentdepression (ischaemia), due to increased cardiacwork and sympathetic coronary vasoconstriction.Exercise causes similar changes.
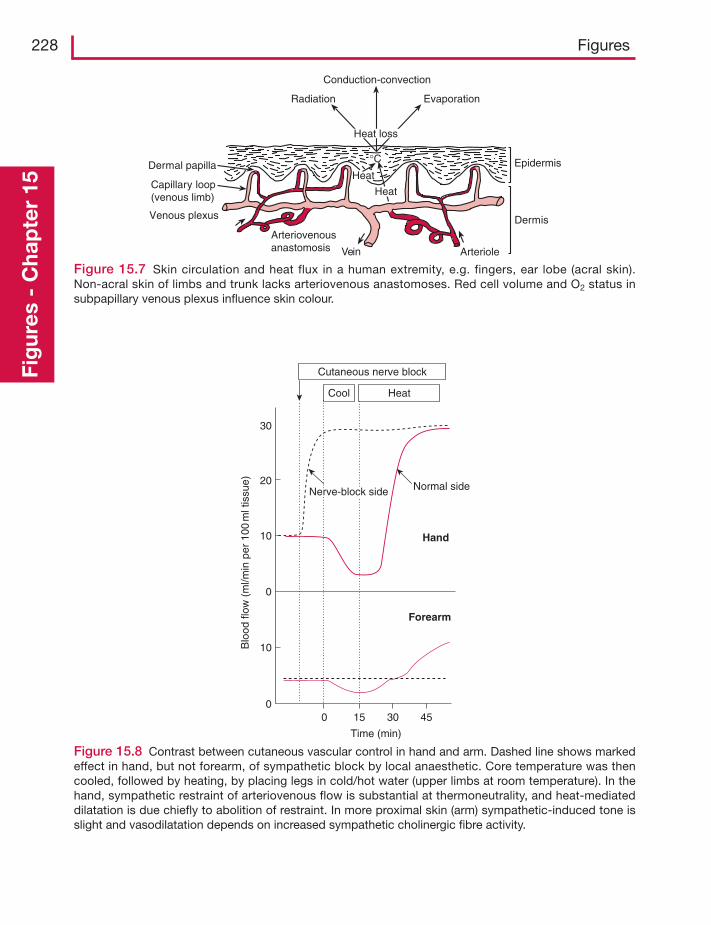
228 FiguresFi
gur
es -
Cha
pte
r 15
00
0
15 30 45
Time (min)
10
10
20
30
Forearm
Normal sideNerve-block side
Hand
Blo
od fl
ow (
ml/m
in p
er 1
00m
l tis
sue)
Cutaneous nerve block
Cool Heat
Figure 15.8 Contrast between cutaneous vascular control in hand and arm. Dashed line shows markedeffect in hand, but not forearm, of sympathetic block by local anaesthetic. Core temperature was thencooled, followed by heating, by placing legs in cold/hot water (upper limbs at room temperature). In thehand, sympathetic restraint of arteriovenous flow is substantial at thermoneutrality, and heat-mediateddilatation is due chiefly to abolition of restraint. In more proximal skin (arm) sympathetic-induced tone isslight and vasodilatation depends on increased sympathetic cholinergic fibre activity.
Dermal papilla
Conduction-convection
Radiation Evaporation
Heat
Vein
Epidermis
Dermis
Arteriole
Venous plexus
Capillary loop(venous limb)
Arteriovenousanastomosis
°C
Heat
Heat loss
Figure 15.7 Skin circulation and heat flux in a human extremity, e.g. fingers, ear lobe (acral skin).Non-acral skin of limbs and trunk lacks arteriovenous anastomoses. Red cell volume and O2 status insubpapillary venous plexus influence skin colour.
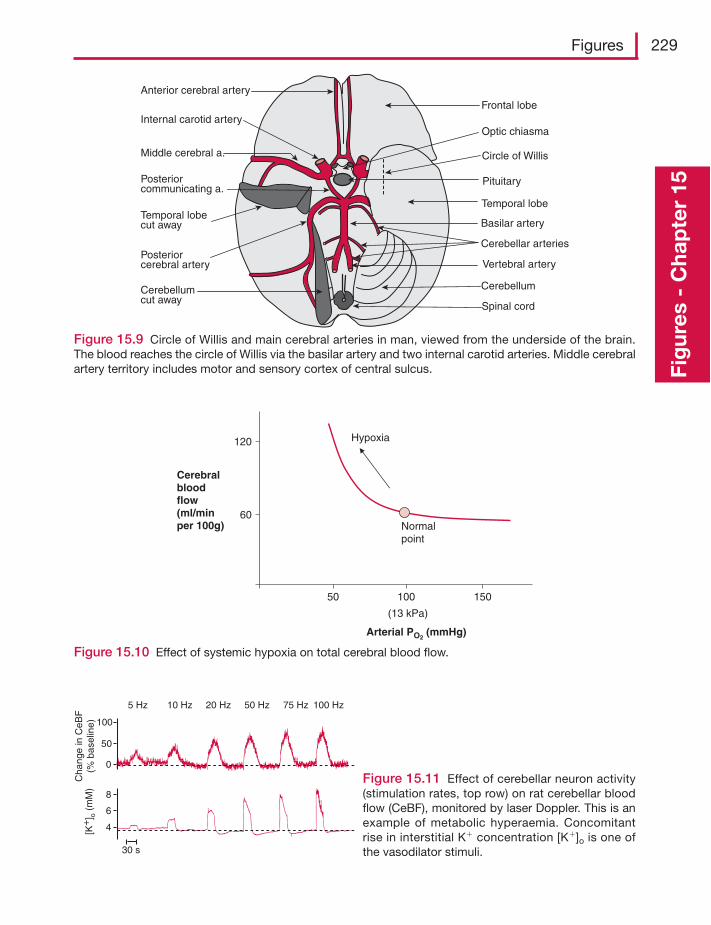
Figures 229
Fig
ures
- C
hap
ter
15
Cerebellum
Spinal cord
Temporal lobe
Frontal lobe
Optic chiasma
Pituitary
Cerebellumcut away
Temporal lobecut away
Anterior cerebral artery
Internal carotid artery
Middle cerebral a.
Posteriorcommunicating a.
Posteriorcerebral artery
Basilar artery
Vertebral artery
Circle of Willis
Cerebellar arteries
Figure 15.9 Circle of Willis and main cerebral arteries in man, viewed from the underside of the brain.The blood reaches the circle of Willis via the basilar artery and two internal carotid arteries. Middle cerebralartery territory includes motor and sensory cortex of central sulcus.
Cerebralbloodflow(ml/minper 100g)
120
60
50 100 150
Arterial PO2 (mmHg)
Normalpoint
Hypoxia
(13 kPa)
Figure 15.10 Effect of systemic hypoxia on total cerebral blood flow.
100
50
0
8
6
4[K+
] o (
mM
)
30 s
Cha
nge
in C
eBF
(% b
asel
ine)
5 Hz 10 Hz 20 Hz 50 Hz 75 Hz 100 Hz
Figure 15.11 Effect of cerebellar neuron activity(stimulation rates, top row) on rat cerebellar bloodflow (CeBF), monitored by laser Doppler. This is anexample of metabolic hyperaemia. Concomitantrise in interstitial K� concentration [K�]o is one ofthe vasodilator stimuli.
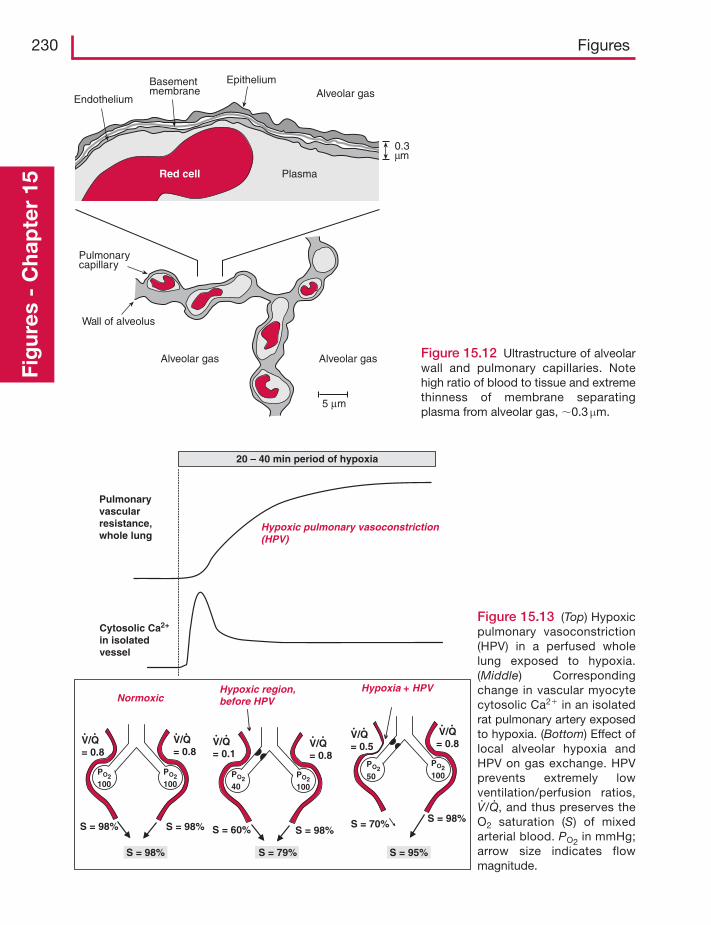
230 FiguresFi
gur
es -
Cha
pte
r 15
Cytosolic Ca2+
in isolatedvessel
20 – 40 min period of hypoxia
Pulmonaryvascularresistance,whole lung
Hypoxic region,before HPV
Hypoxia + HPVNormoxic
S = 98% S = 98%
S = 98%
PO2100
PO2100
V/Q= 0.8
V/Q= 0.8
S = 60% S = 98%
S = 79%
V/Q= 0.8
V/Q= 0.1
S = 98%S = 70%
S = 95%
V/Q= 0.5
V/Q= 0.8
Hypoxic pulmonary vasoconstriction(HPV)
PO240
PO250PO2
100
PO2100
Figure 15.13 (Top) Hypoxicpulmonary vasoconstriction(HPV) in a perfused wholelung exposed to hypoxia.(Middle) Correspondingchange in vascular myocytecytosolic Ca2� in an isolatedrat pulmonary artery exposedto hypoxia. (Bottom) Effect oflocal alveolar hypoxia andHPV on gas exchange. HPVprevents extremely lowventilation/perfusion ratios,V·/Q
·, and thus preserves the
O2 saturation (S) of mixedarterial blood. PO2 in mmHg;arrow size indicates flowmagnitude.
Endothelium
Basementmembrane
EpitheliumAlveolar gas
0.3μm
PlasmaRed cell
5 μm
Pulmonarycapillary
Wall of alveolus
Alveolar gas Alveolar gas Figure 15.12 Ultrastructure of alveolarwall and pulmonary capillaries. Notehigh ratio of blood to tissue and extremethinness of membrane separatingplasma from alveolar gas, �0.3 μm.
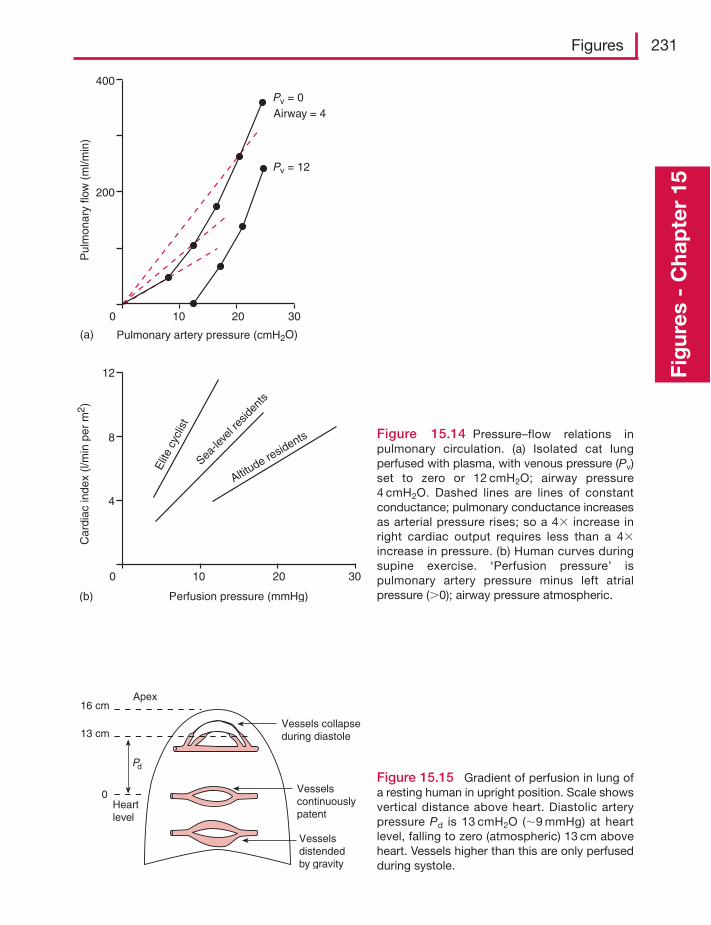
Figures 231
Fig
ures
- C
hap
ter
15
Figure 15.15 Gradient of perfusion in lung ofa resting human in upright position. Scale showsvertical distance above heart. Diastolic arterypressure Pd is 13 cmH2O (�9 mmHg) at heartlevel, falling to zero (atmospheric) 13 cm aboveheart. Vessels higher than this are only perfusedduring systole.
400
200
0 10 20 30
Pv = 0
Pulmonary artery pressure (cmH2O)(a)
Pul
mon
ary
flow
(m
l/min
)
Airway = 4
Pv = 12
Perfusion pressure (mmHg)(b)
8
0 10 20 30
Car
diac
inde
x (l/
min
per
m2 )
12
4
Elit
e cy
clis
t
Sea-le
vel r
eside
nts
Altitude re
sidents Figure 15.14 Pressure–flow relations inpulmonary circulation. (a) Isolated cat lungperfused with plasma, with venous pressure (Pv)set to zero or 12 cmH2O; airway pressure4 cmH2O. Dashed lines are lines of constantconductance; pulmonary conductance increasesas arterial pressure rises; so a 4� increase inright cardiac output requires less than a 4�increase in pressure. (b) Human curves duringsupine exercise. ‘Perfusion pressure’ ispulmonary artery pressure minus left atrialpressure (0); airway pressure atmospheric.
Apex
Vessels collapseduring diastole
Vesselscontinuouslypatent
Vesselsdistendedby gravity
16 cm
13 cm
Heartlevel
0
Pd
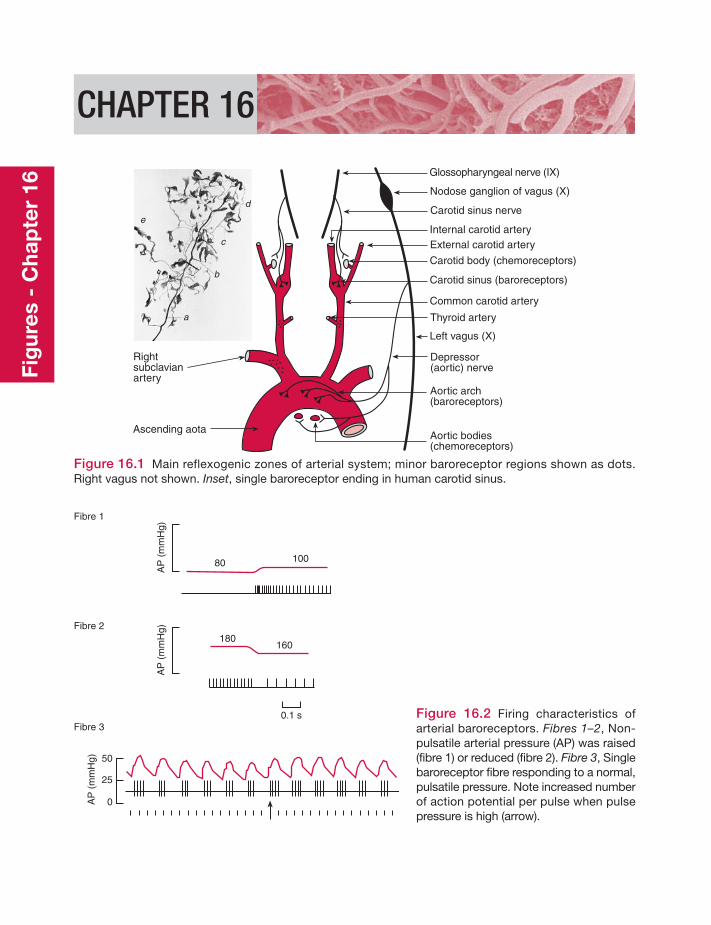
CHAPTER 16
Rightsubclavianartery
Ascending aota
Glossopharyngeal nerve (IX)
Nodose ganglion of vagus (X)
Carotid sinus nerve
Internal carotid arteryExternal carotid artery
Carotid body (chemoreceptors)
Carotid sinus (baroreceptors)
Common carotid artery
Thyroid artery
Left vagus (X)
Depressor(aortic) nerve
Aortic arch(baroreceptors)
Aortic bodies(chemoreceptors)
a
b
c
d
e
Figure 16.1 Main reflexogenic zones of arterial system; minor baroreceptor regions shown as dots.Right vagus not shown. Inset, single baroreceptor ending in human carotid sinus.
Fibre 1
Fibre 2
Fibre 3
80 100
AP
(m
mH
g)A
P (
mm
Hg)
180160
0.1 s
50
25
0AP
(m
mH
g)
Figure 16.2 Firing characteristics ofarterial baroreceptors. Fibres 1–2, Non-pulsatile arterial pressure (AP) was raised(fibre 1) or reduced (fibre 2). Fibre 3, Singlebaroreceptor fibre responding to a normal,pulsatile pressure. Note increased numberof action potential per pulse when pulsepressure is high (arrow).
Fig
ures
- C
hap
ter
16
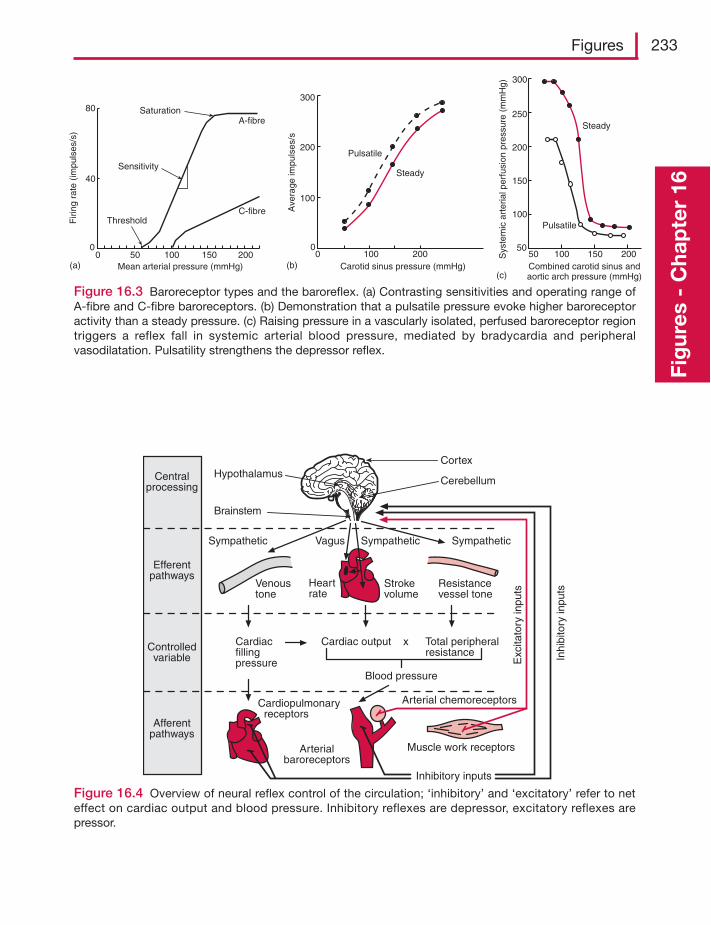
Figures 233
Fig
ures
- C
hap
ter
16
Carotid sinus pressure (mmHg)0
0
Ave
rage
impu
lses
/s
100
200
300
100 200
Pulsatile
Steady
Combined carotid sinus andaortic arch pressure (mmHg)
Sys
tem
icar
teria
l per
fusi
on p
ress
ure
(mm
Hg)
100 150 2005050
100
150
200
250
300
Pulsatile
Steady
(b)Mean arterial pressure (mmHg)0 50 100 150 200
ThresholdC-fibre
Sensitivity
SaturationA-fibre
80
40
0
Firi
ng r
ate
(impu
lses
/s)
(a)(c)
Figure 16.3 Baroreceptor types and the baroreflex. (a) Contrasting sensitivities and operating range ofA-fibre and C-fibre baroreceptors. (b) Demonstration that a pulsatile pressure evoke higher baroreceptoractivity than a steady pressure. (c) Raising pressure in a vascularly isolated, perfused baroreceptor regiontriggers a reflex fall in systemic arterial blood pressure, mediated by bradycardia and peripheralvasodilatation. Pulsatility strengthens the depressor reflex.
Cortex
CerebellumHypothalamus
Brainstem
Centralprocessing
Efferentpathways
Controlledvariable
Afferentpathways
Sympathetic SympatheticSympatheticVagus
Resistancevessel tone
Strokevolume
Heartrate
Venoustone
Exc
itato
ry in
puts
Inhi
bito
ry in
puts
Cardiacfillingpressure
Cardiac output x Total peripheralresistance
Blood pressure
Cardiopulmonary receptors
Arterialbaroreceptors
Muscle work receptors
Arterial chemoreceptors
Inhibitory inputs
Figure 16.4 Overview of neural reflex control of the circulation; ‘inhibitory’ and ‘excitatory’ refer to neteffect on cardiac output and blood pressure. Inhibitory reflexes are depressor, excitatory reflexes arepressor.
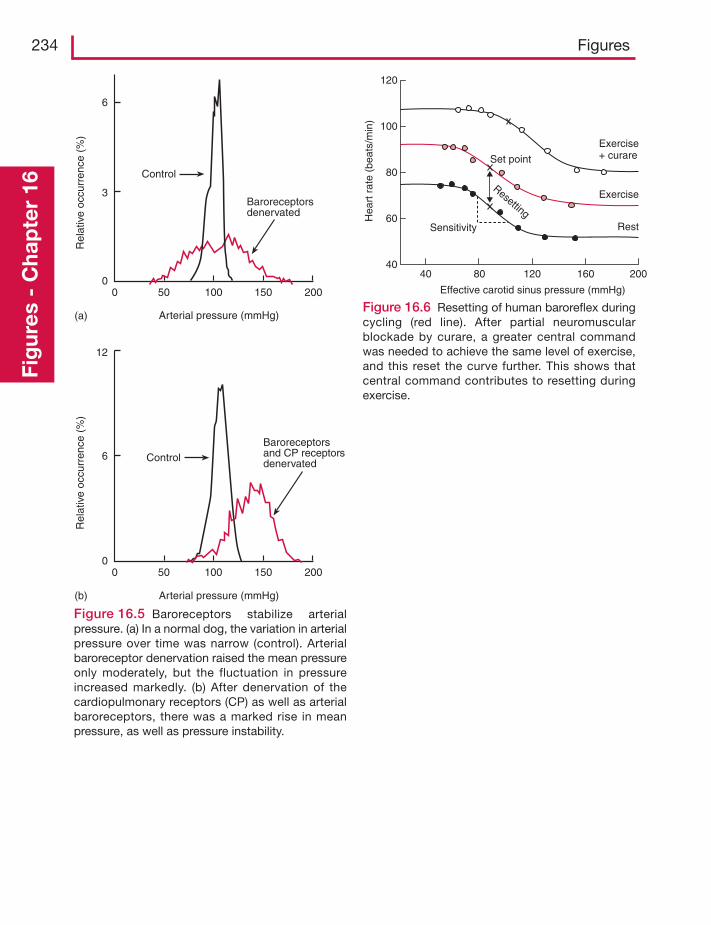
234 FiguresFi
gur
es -
Cha
pte
r 16
Baroreceptorsdenervated
Control
Arterial pressure (mmHg)
Rel
ativ
e oc
curr
ence
(%
)
6
3
00 50 150100 200
(a)
Baroreceptorsand CP receptorsdenervatedControl
Arterial pressure (mmHg)
Rel
ativ
e oc
curr
ence
(%
)
00 50 100 150 200
(b)
12
6
Figure 16.5 Baroreceptors stabilize arterialpressure. (a) In a normal dog, the variation in arterialpressure over time was narrow (control). Arterialbaroreceptor denervation raised the mean pressureonly moderately, but the fluctuation in pressureincreased markedly. (b) After denervation of thecardiopulmonary receptors (CP) as well as arterialbaroreceptors, there was a marked rise in meanpressure, as well as pressure instability.
Effective carotid sinus pressure (mmHg)
4040
80
80
60
120
120
100
160 200
Hea
rt r
ate
(bea
ts/m
in)
Set point
Sensitivity Rest
Exercise
Exercise+ curare
Resetting
Figure 16.6 Resetting of human baroreflex duringcycling (red line). After partial neuromuscularblockade by curare, a greater central commandwas needed to achieve the same level of exercise,and this reset the curve further. This shows thatcentral command contributes to resetting duringexercise.
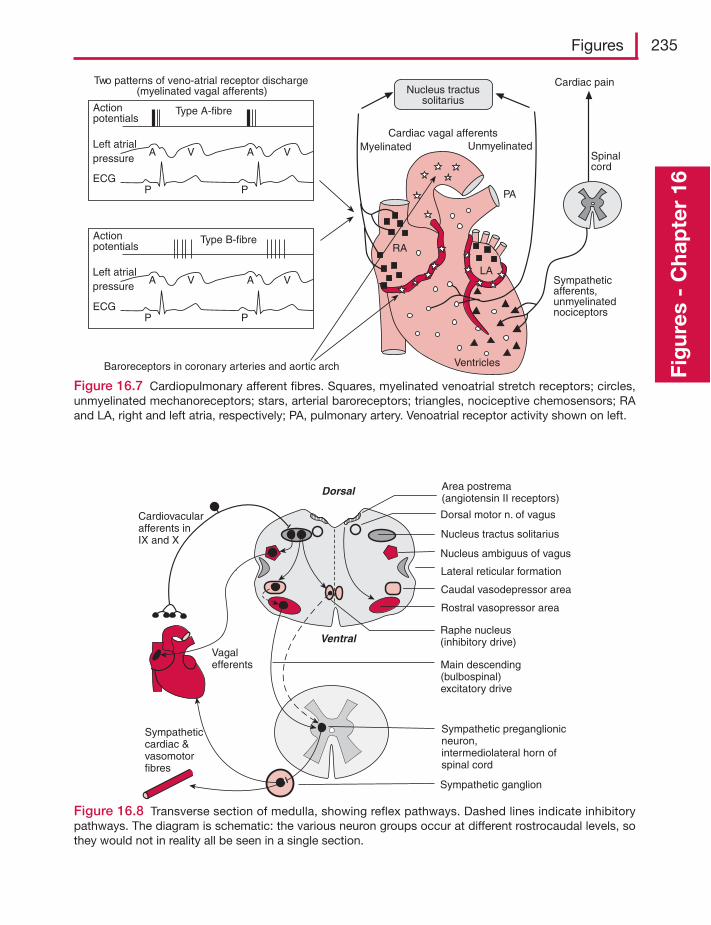
Figures 235
Fig
ures
- C
hap
ter
16
A V A V
PP
Type A-fibreActionpotentials
Left atrialpressure
ECG
A V A V
PP
Type B-fibreActionpotentials
ECG
Cardiac pain
Spinalcord
Sympatheticafferents,unmyelinatednociceptors
Ventricles
RA
PA
Baroreceptors in coronary arteries and aortic arch
Two patterns of veno-atrial receptor discharge(myelinated vagal afferents)
Cardiac vagal afferentsMyelinated Unmyelinated
Nucleus tractussolitarius
Left atrialpressure
LA
Figure 16.7 Cardiopulmonary afferent fibres. Squares, myelinated venoatrial stretch receptors; circles,unmyelinated mechanoreceptors; stars, arterial baroreceptors; triangles, nociceptive chemosensors; RAand LA, right and left atria, respectively; PA, pulmonary artery. Venoatrial receptor activity shown on left.
Cardiovacularafferents in IX and X
Vagalefferents
Sympatheticcardiac &vasomotorfibres
Ventral
Dorsal
Dorsal motor n. of vagus
Nucleus tractus solitarius
Nucleus ambiguus of vagus
Lateral reticular formation
Caudal vasodepressor area
Rostral vasopressor area
Raphe nucleus(inhibitory drive)
Sympathetic preganglionicneuron,intermediolateral horn ofspinal cord
Main descending(bulbospinal)excitatory drive
Sympathetic ganglion
Area postrema(angiotensin II receptors)
Figure 16.8 Transverse section of medulla, showing reflex pathways. Dashed lines indicate inhibitorypathways. The diagram is schematic: the various neuron groups occur at different rostrocaudal levels, sothey would not in reality all be seen in a single section.
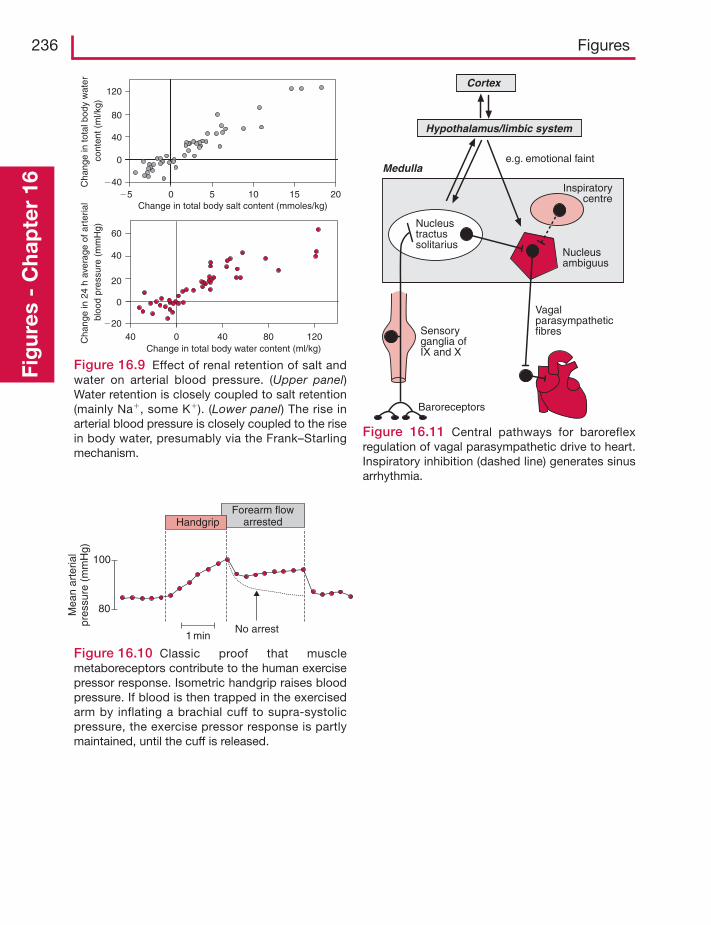
236 FiguresFi
gur
es -
Cha
pte
r 16
Change in total body water content (ml/kg)
Change in total body salt content (mmoles/kg)
Cha
nge
in 2
4 h
aver
age
of a
rter
ial
bloo
d pr
essu
re (
mm
Hg)
Cha
nge
in to
tal b
ody
wat
erco
nten
t (m
l/kg)
0
0
0
0 40 80 12040
5 10 15 20�5
60
40
20
�20
120
40
�40
80
Figure 16.9 Effect of renal retention of salt andwater on arterial blood pressure. (Upper panel)Water retention is closely coupled to salt retention(mainly Na�, some K�). (Lower panel) The rise inarterial blood pressure is closely coupled to the risein body water, presumably via the Frank–Starlingmechanism.
Forearm flowarrested
100
80
Handgrip
No arrest1 min
Mea
nar
teria
lpr
essu
re (
mm
Hg)
Figure 16.10 Classic proof that musclemetaboreceptors contribute to the human exercisepressor response. Isometric handgrip raises bloodpressure. If blood is then trapped in the exercisedarm by inflating a brachial cuff to supra-systolicpressure, the exercise pressor response is partlymaintained, until the cuff is released.
Cortex
Hypothalamus/limbic system
e.g. emotional faintMedulla
Inspiratorycentre
Nucleusambiguus
Nucleustractussolitarius
VagalparasympatheticfibresSensory
ganglia ofIX and X
Baroreceptors
Figure 16.11 Central pathways for baroreflexregulation of vagal parasympathetic drive to heart.Inspiratory inhibition (dashed line) generates sinusarrhythmia.
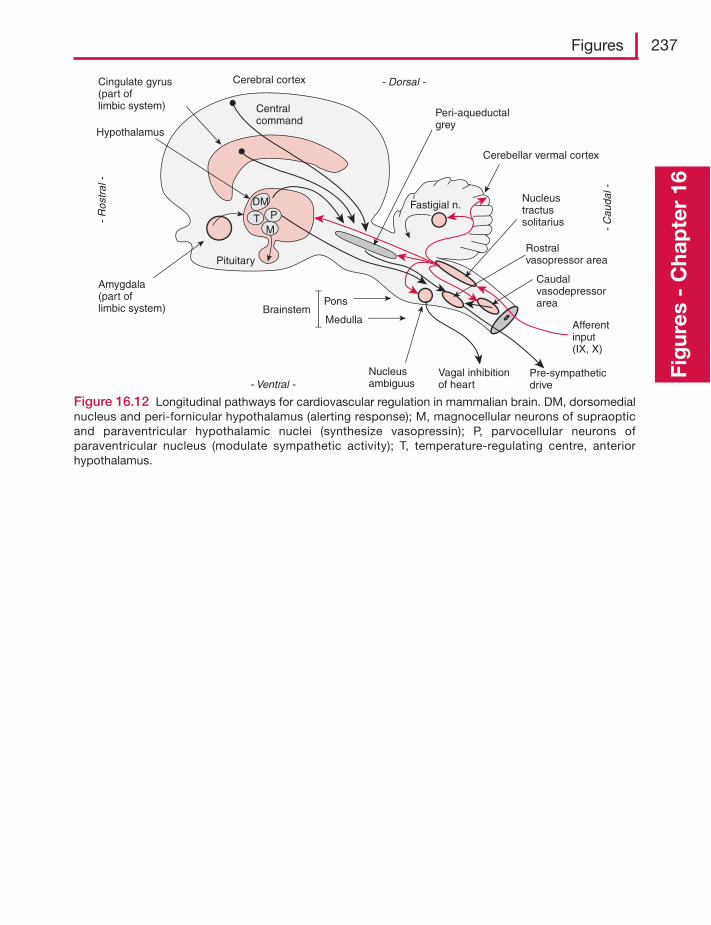
Figures 237
Fig
ures
- C
hap
ter
16
Figure 16.12 Longitudinal pathways for cardiovascular regulation in mammalian brain. DM, dorsomedialnucleus and peri-fornicular hypothalamus (alerting response); M, magnocellular neurons of supraopticand paraventricular hypothalamic nuclei (synthesize vasopressin); P, parvocellular neurons ofparaventricular nucleus (modulate sympathetic activity); T, temperature-regulating centre, anteriorhypothalamus.
Cerebral cortexCingulate gyrus(part oflimbic system)
Hypothalamus
Amygdala(part of limbic system)
Pituitary
Cerebellar vermal cortex
Pons
MedullaBrainstem
Peri-aqueductalgrey
Fastigial n.Nucleustractussolitarius
Rostralvasopressor area
Caudalvasodepressorarea
- R
ostr
al -
- C
auda
l -
- Dorsal -
- Ventral -Nucleusambiguus
DM
M
Centralcommand
Vagal inhibitionof heart
Pre-sympatheticdrive
Afferentinput(IX, X)
PT
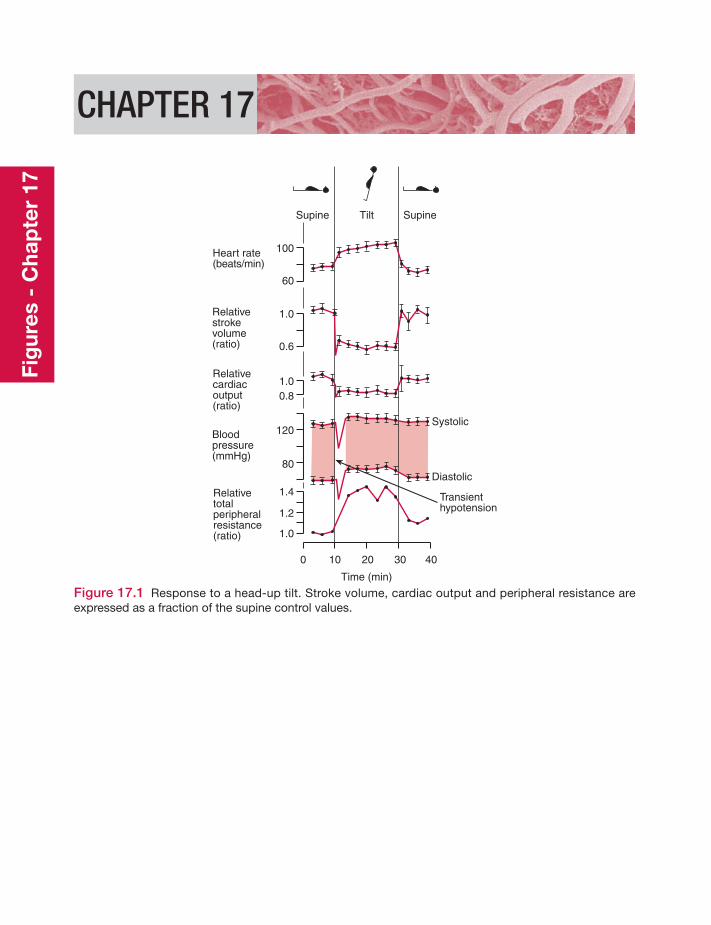
CHAPTER 17
Supine SupineTilt
Heart rate(beats/min)
Relativestrokevolume(ratio)
Relativecardiacoutput(ratio)
Bloodpressure(mmHg)
Relativetotalperipheralresistance(ratio)
100
60
1.0
0.6
1.00.8
120
80
1.4
1.2
1.0
0 10 20 30 40
Time (min)
Transienthypotension
Systolic
Diastolic
Figure 17.1 Response to a head-up tilt. Stroke volume, cardiac output and peripheral resistance areexpressed as a fraction of the supine control values.
Fig
ures
- C
hap
ter
17
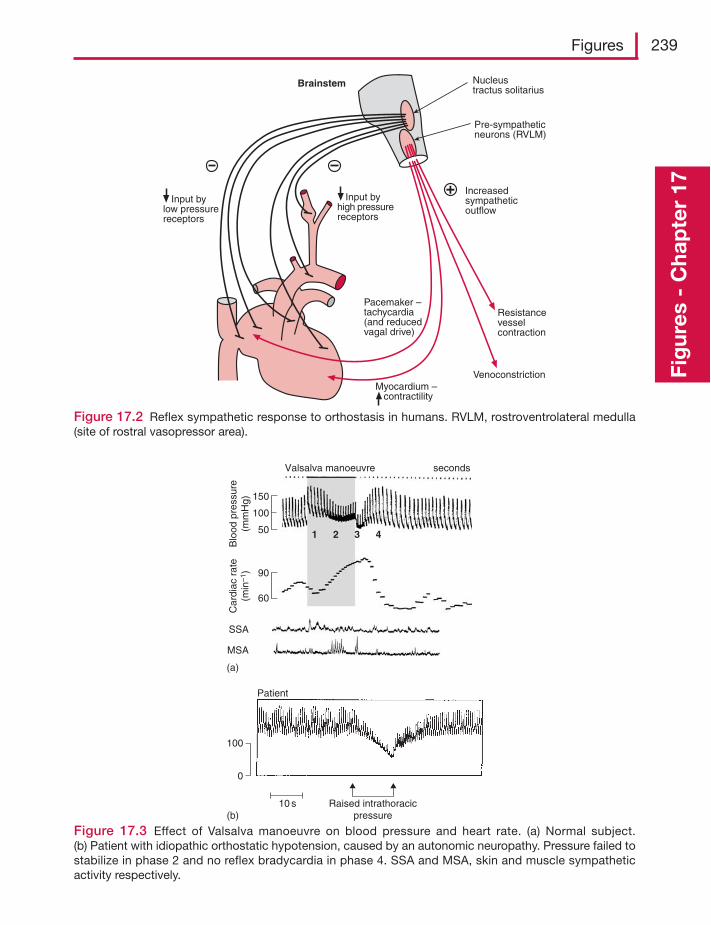
Figures 239
Fig
ures
- C
hap
ter
17
Pacemaker –tachycardia(and reducedvagal drive)
Pre-sympatheticneurons (RVLM)
Nucleustractus solitarius
Increasedsympatheticoutflow
Resistancevesselcontraction
VenoconstrictionMyocardium – contractility
Input bylow pressurereceptors
Brainstem
Input byhigh pressurereceptors
Figure 17.2 Reflex sympathetic response to orthostasis in humans. RVLM, rostroventrolateral medulla(site of rostral vasopressor area).
10 s Raised intrathoracicpressure
100
0
Patient
(b)
(a)
SSA
MSA
Car
diac
rat
e(m
in–1
)B
lood
pre
ssur
e(m
mH
g)
90
60
150
50
100
Valsalva manoeuvre
1 2 3 4
seconds
Figure 17.3 Effect of Valsalva manoeuvre on blood pressure and heart rate. (a) Normal subject.(b) Patient with idiopathic orthostatic hypotension, caused by an autonomic neuropathy. Pressure failed tostabilize in phase 2 and no reflex bradycardia in phase 4. SSA and MSA, skin and muscle sympatheticactivity respectively.
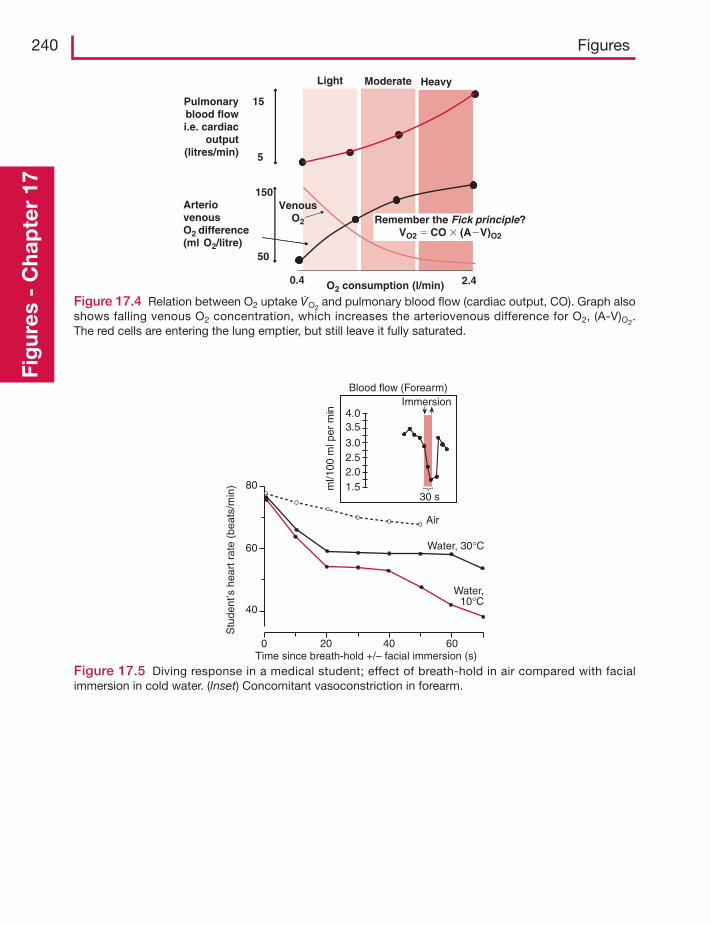
240 FiguresFi
gur
es -
Cha
pte
r 17
15
5
Pulmonaryblood flowi.e. cardiac
output(litres/min)
150
50
0.4 2.4O2 consumption (l/min)
Light Moderate Heavy
VenousO2 Remember the Fick principle?
VO2 � CO � (A�V)O2
ArteriovenousO2 difference(ml O2/litre)
Figure 17.4 Relation between O2 uptake V̇O2and pulmonary blood flow (cardiac output, CO). Graph also
shows falling venous O2 concentration, which increases the arteriovenous difference for O2, (A-V)O2.
The red cells are entering the lung emptier, but still leave it fully saturated.
Blood flow (Forearm)
ml/1
00 m
l per
min
Immersion
30 s
4.03.5
3.02.52.01.5
Air
Water, 30°C
Water,10°C
0 20 40 60
80
60
40
Time since breath-hold +/– facial immersion (s)
Stu
dent
’s h
eart
rat
e (b
eats
/min
)
Figure 17.5 Diving response in a medical student; effect of breath-hold in air compared with facialimmersion in cold water. (Inset) Concomitant vasoconstriction in forearm.
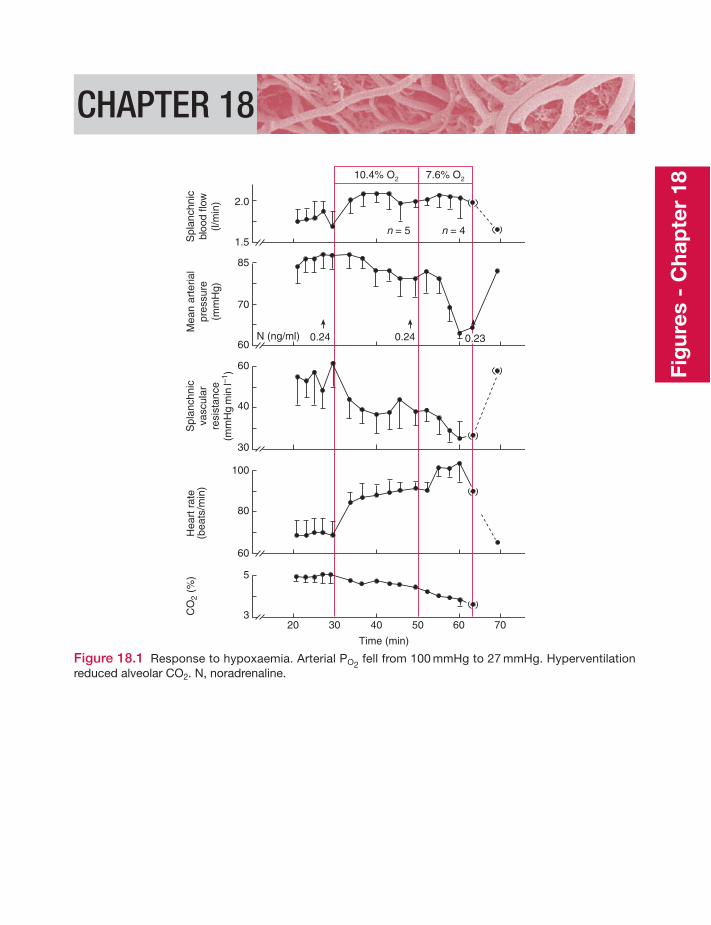
CHAPTER 18
Spl
anch
nic
bloo
d flo
w(l/
min
)
Mea
nar
teria
lpr
essu
re(m
mH
g)
Spl
anch
nic
vasc
ular
resi
stan
ce(m
mH
gm
inl–1
)
CO
2 (%
)H
eart
rat
e(b
eats
/min
)2.0
1.5
85
70
60
60
40
30
100
80
60
5
320 30 40 50 60 70
10.4% O2 7.6% O2
n = 5 n = 4
N (ng/ml) 0.24 0.230.24
Time (min)
Figure 18.1 Response to hypoxaemia. Arterial PO2fell from 100 mmHg to 27 mmHg. Hyperventilation
reduced alveolar CO2. N, noradrenaline.Fi
gur
es -
Cha
pte
r 18
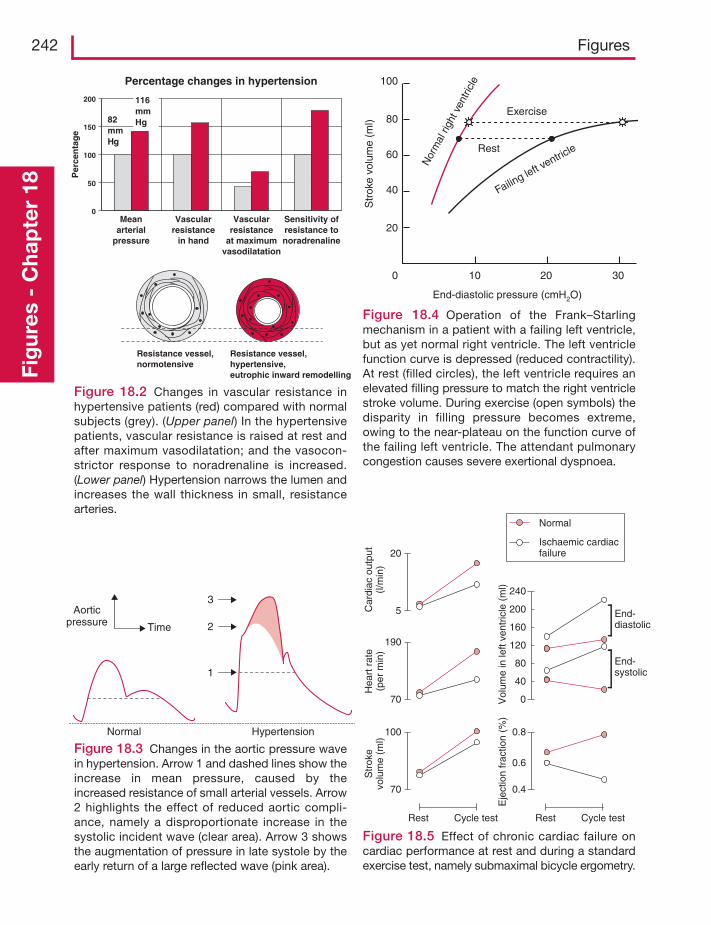
242 FiguresFi
gur
es -
Cha
pte
r 18
Percentage changes in hypertension
0
50
100
150
200
Meanarterial
pressure
Vascularresistance
in hand
Vascularresistance
at maximumvasodilatation
Sensitivity ofresistance tonoradrenaline
82mmHg
116mmHg
Per
cen
tag
e
Resistance vessel,normotensive
Resistance vessel,hypertensive,eutrophic inward remodelling
Figure 18.2 Changes in vascular resistance inhypertensive patients (red) compared with normalsubjects (grey). (Upper panel) In the hypertensivepatients, vascular resistance is raised at rest andafter maximum vasodilatation; and the vasocon-strictor response to noradrenaline is increased.(Lower panel) Hypertension narrows the lumen andincreases the wall thickness in small, resistancearteries.
Normal Hypertension
Aorticpressure Time
3
2
1
Figure 18.3 Changes in the aortic pressure wavein hypertension. Arrow 1 and dashed lines show theincrease in mean pressure, caused by theincreased resistance of small arterial vessels. Arrow2 highlights the effect of reduced aortic compli-ance, namely a disproportionate increase in thesystolic incident wave (clear area). Arrow 3 showsthe augmentation of pressure in late systole by theearly return of a large reflected wave (pink area).
100
80
60
40
20
0 10 20 30
End-diastolic pressure (cmH2O)
Failing left v
entricle
Exercise
Nor
mal
righ
t ven
tricl
e
Str
oke
volu
me
(ml)
Rest
Figure 18.4 Operation of the Frank–Starlingmechanism in a patient with a failing left ventricle,but as yet normal right ventricle. The left ventriclefunction curve is depressed (reduced contractility).At rest (filled circles), the left ventricle requires anelevated filling pressure to match the right ventriclestroke volume. During exercise (open symbols) thedisparity in filling pressure becomes extreme,owing to the near-plateau on the function curve ofthe failing left ventricle. The attendant pulmonarycongestion causes severe exertional dyspnoea.
20
5
190
70
240
200
160
120
80
40
0
100
70
0.8
0.6
0.4
Car
diac
out
put
(l/m
in)
Hea
rt r
ate
(per
min
)S
trok
evo
lum
e (m
l)
Rest Cycle test Rest Cycle test
End-diastolic
End-systolic
Normal
Ischaemic cardiacfailure
Vol
ume
in le
ft ve
ntric
le (
ml)
Eje
ctio
n fr
actio
n (%
)
Figure 18.5 Effect of chronic cardiac failure oncardiac performance at rest and during a standardexercise test, namely submaximal bicycle ergometry.
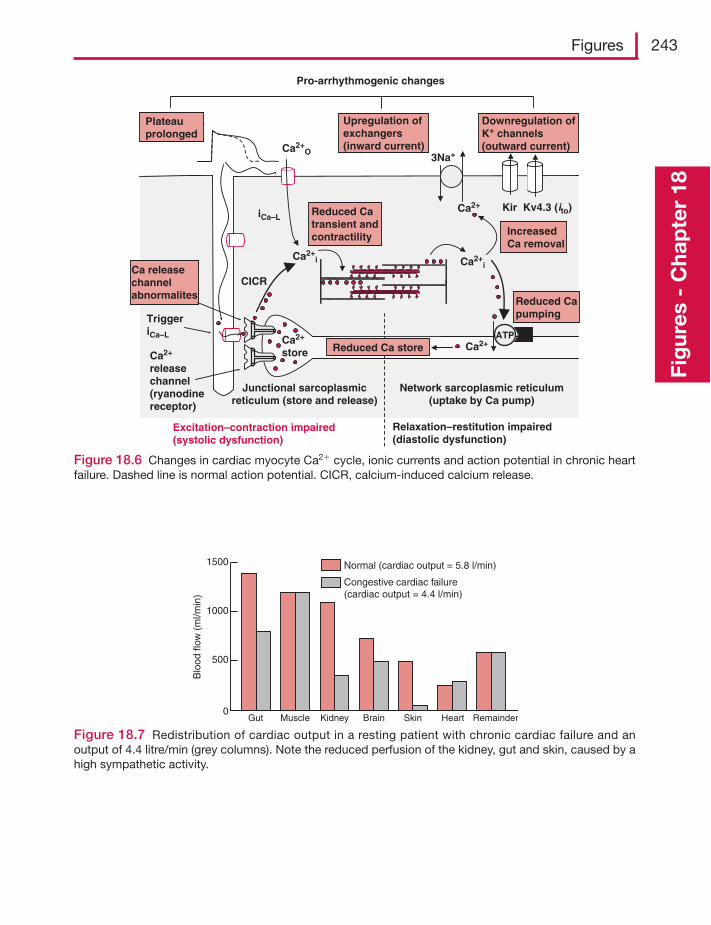
Figures 243
Fig
ures
- C
hap
ter
18
ATP
Ca2+i
Ca2+
store
Ca2+O
iCa–L
Network sarcoplasmic reticulum(uptake by Ca pump)
Junctional sarcoplasmicreticulum (store and release)
Ca2+
Ca2+i
3Na+
Ca2+
releasechannel(ryanodinereceptor)
CICR
TriggeriCa–L
Ca2+
Excitation–contraction impaired(systolic dysfunction)
Relaxation–restitution impaired(diastolic dysfunction)
Reduced Capumping
Reduced Ca store
IncreasedCa removal
Ca releasechannelabnormalites
Reduced Catransient andcontractility
Downregulation ofK+ channels(outward current)
Upregulation ofexchangers(inward current)
Plateauprolonged
Kir Kv4.3 (ito)
Pro-arrhythmogenic changes
Figure 18.6 Changes in cardiac myocyte Ca2� cycle, ionic currents and action potential in chronic heartfailure. Dashed line is normal action potential. CICR, calcium-induced calcium release.
1500
1000
500
0
Normal (cardiac output = 5.8 l/min)
Congestive cardiac failure(cardiac output = 4.4 l/min)
Blo
od fl
ow (
ml/m
in)
Gut Muscle Kidney Brain Skin Heart Remainder
Figure 18.7 Redistribution of cardiac output in a resting patient with chronic cardiac failure and anoutput of 4.4 litre/min (grey columns). Note the reduced perfusion of the kidney, gut and skin, caused by ahigh sympathetic activity.
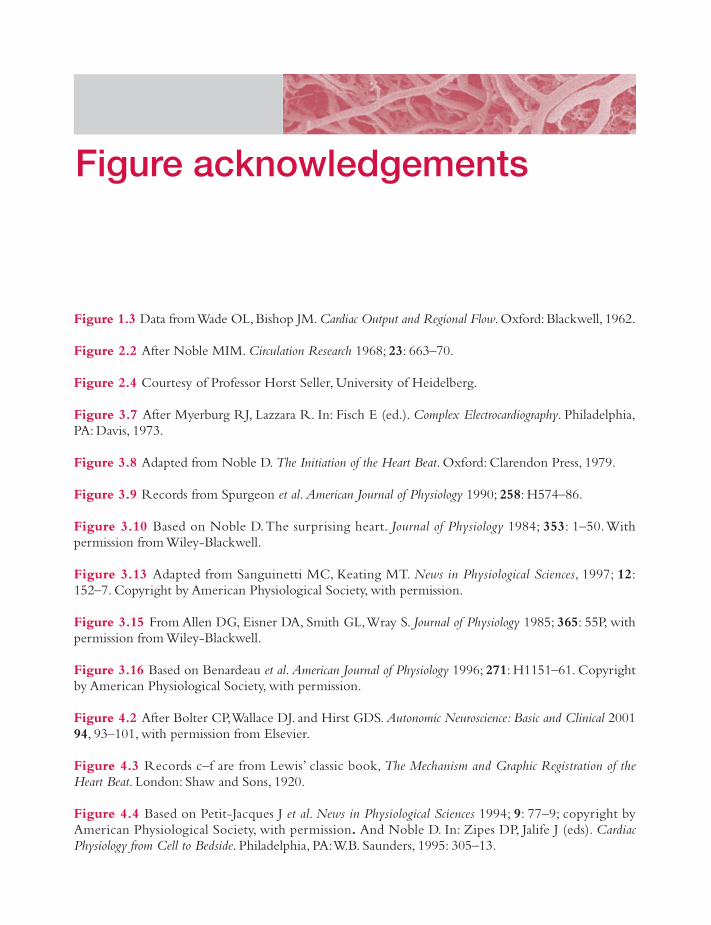
Figure 1.3 Data fromWade OL, Bishop JM. Cardiac Output and Regional Flow. Oxford: Blackwell, 1962.
Figure 2.2 After Noble MIM. Circulation Research 1968; 23: 663–70.
Figure 2.4 Courtesy of Professor Horst Seller, University of Heidelberg.
Figure 3.7 After Myerburg RJ, Lazzara R. In: Fisch E (ed.). Complex Electrocardiography. Philadelphia,PA: Davis, 1973.
Figure 3.8 Adapted from Noble D. The Initiation of the Heart Beat. Oxford: Clarendon Press, 1979.
Figure 3.9 Records from Spurgeon et al. American Journal of Physiology 1990; 258: H574–86.
Figure 3.10 Based on Noble D.The surprising heart. Journal of Physiology 1984; 353: 1–50.Withpermission from Wiley-Blackwell.
Figure 3.13 Adapted from Sanguinetti MC, Keating MT. News in Physiological Sciences, 1997; 12:152–7. Copyright by American Physiological Society, with permission.
Figure 3.15 From Allen DG, Eisner DA, Smith GL,Wray S. Journal of Physiology 1985; 365: 55P, withpermission from Wiley-Blackwell.
Figure 3.16 Based on Benardeau et al. American Journal of Physiology 1996; 271: H1151–61. Copyrightby American Physiological Society, with permission.
Figure 4.2 After Bolter CP,Wallace DJ. and Hirst GDS. Autonomic Neuroscience: Basic and Clinical 200194, 93–101, with permission from Elsevier.
Figure 4.3 Records c–f are from Lewis’ classic book, The Mechanism and Graphic Registration of theHeart Beat. London: Shaw and Sons, 1920.
Figure 4.4 Based on Petit-Jacques J et al. News in Physiological Sciences 1994; 9: 77–9; copyright byAmerican Physiological Society, with permission. And Noble D. In: Zipes DP, Jalife J (eds). CardiacPhysiology from Cell to Bedside. Philadelphia, PA:W.B. Saunders, 1995: 305–13.
Figure acknowledgements
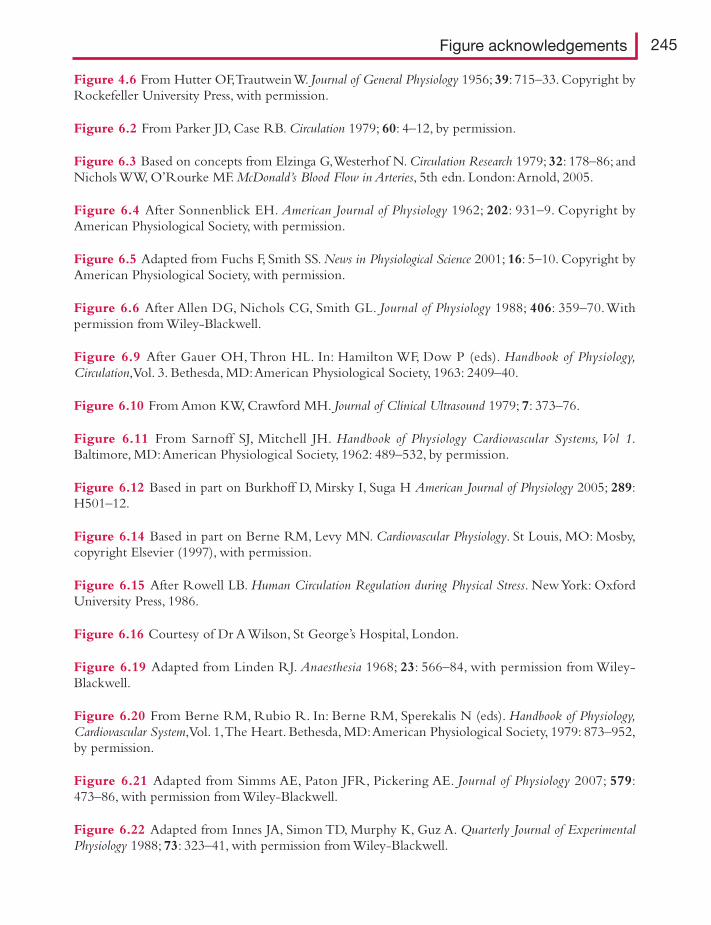
Figure 4.6 From Hutter OF,TrautweinW. Journal of General Physiology 1956; 39: 715–33. Copyright byRockefeller University Press, with permission.
Figure 6.2 From Parker JD, Case RB. Circulation 1979; 60: 4–12, by permission.
Figure 6.3 Based on concepts from Elzinga G,Westerhof N. Circulation Research 1979; 32: 178–86; andNichols WW, O’Rourke MF. McDonald’s Blood Flow in Arteries, 5th edn. London:Arnold, 2005.
Figure 6.4 After Sonnenblick EH. American Journal of Physiology 1962; 202: 931–9. Copyright byAmerican Physiological Society, with permission.
Figure 6.5 Adapted from Fuchs F, Smith SS. News in Physiological Science 2001; 16: 5–10. Copyright byAmerican Physiological Society, with permission.
Figure 6.6 After Allen DG, Nichols CG, Smith GL. Journal of Physiology 1988; 406: 359–70.Withpermission from Wiley-Blackwell.
Figure 6.9 After Gauer OH, Thron HL. In: Hamilton WF, Dow P (eds). Handbook of Physiology,Circulation,Vol. 3. Bethesda, MD:American Physiological Society, 1963: 2409–40.
Figure 6.10 From Amon KW, Crawford MH. Journal of Clinical Ultrasound 1979; 7: 373–76.
Figure 6.11 From Sarnoff SJ, Mitchell JH. Handbook of Physiology Cardiovascular Systems, Vol 1.Baltimore, MD:American Physiological Society, 1962: 489–532, by permission.
Figure 6.12 Based in part on Burkhoff D, Mirsky I, Suga H American Journal of Physiology 2005; 289:H501–12.
Figure 6.14 Based in part on Berne RM, Levy MN. Cardiovascular Physiology. St Louis, MO: Mosby,copyright Elsevier (1997), with permission.
Figure 6.15 After Rowell LB. Human Circulation Regulation during Physical Stress. NewYork: OxfordUniversity Press, 1986.
Figure 6.16 Courtesy of Dr A Wilson, St George’s Hospital, London.
Figure 6.19 Adapted from Linden RJ. Anaesthesia 1968; 23: 566–84, with permission from Wiley-Blackwell.
Figure 6.20 From Berne RM, Rubio R. In: Berne RM, Sperekalis N (eds). Handbook of Physiology,Cardiovascular System,Vol. 1,The Heart. Bethesda, MD:American Physiological Society, 1979: 873–952,by permission.
Figure 6.21 Adapted from Simms AE, Paton JFR, Pickering AE. Journal of Physiology 2007; 579:473–86, with permission from Wiley-Blackwell.
Figure 6.22 Adapted from Innes JA, Simon TD, Murphy K, Guz A. Quarterly Journal of ExperimentalPhysiology 1988; 73: 323–41, with permission from Wiley-Blackwell.
Figure acknowledgements 245
Figure 6.23 Data from Stickland et al. Journal of Physiology 2004; 561: 321–9.
Figure 7.1 From Innes JA, Simon TD, Murphy K, Guz A. Quarterly Journal of Experimental Physiology1988; 73: 323–41, by permission.
Figure 7.2 Based on Nichols WW, O’Rourke MF. McDonald’s Blood Flow in Arteries, 5th edn. London:Arnold, 2005.
Figure 7.4 After Asmussen E, Nielsen M. Acta Physiologica Scandinavica 1953; 27: 217.With permissionfrom Wiley-Blackwell.
Figure 8.5 From Chien S, Microvascular Research 1992; 44: 243–54, with permission from Elsevier.
Figure 8.6 After Gaetghens P. In: Gross DR,Wang NHC (eds). The Rheology of Blood, BloodVessels andAssociatedTissues.Amsterdam: Sijthoff and Noordhoff, with permission from Elsevier.
Figure 8.7 After Mills CJ, Gale IT, Gault JH et al. Cardiovascular Research 1970; 4: 405; by permission ofOxford University Press, and Nichols WW, O’Rourke MF. McDonald’s Blood Flow in Arteries, 5th edn.London:Arnold, 2005.
Figure 8.10 Based on NicholsWW, O’Rourke MF. McDonald’s Blood Flow in Arteries. London:Arnold,2005.
Figure 8.11 Adapted from Chien S. Physiological Reviews 1967; 47: 214–88; (copyright by AmericanPhysiological Society, with permission), Jacobsen J, Sofelt S, Sheikh S,Warberg J, Secher NH. ActaPhysiologica Scandinavica 1990; 138: 167–73; and Länne T, Lundvall J. Acta Physiologica Scandinavica 1992;146: 299–306, with permission from Wiley-Blackwell.
Figure 8.12 After Nichols WW, O’Rourke MF. McDonald’s Blood Flow in Arteries, 5th edn. London:Arnold, 2005.
Figure 8.13 After the classic experiment of Whittaker SRF, Winton FR. Journal of Physiology 1933;78: 339–69.
Figure 8.14 From Lind RA, McNicol GW. Canadian Medical Association Journal 1967; 96: 706, bypermission.
Figure 8.15 Public data from Department of Health National Statistics. Health Survey for England2003,Vol 2 Risk Factors for Cardiovascular Disease.
Figure 8.16 From Hering. Die Karotissinusreflexe auf Herz und Gefässe. Dresden:T. Steinkopf, 1927.
Figure 8.18 After Snell RE, Clements JM, Patel DJ, Fry DL, Luchsinger PC. Journal of AppliedPhysiology 1965; 20: 691. Copyright by American Physiological Society, with permission.
Figure 8.20 From Pappenheimer JR, Maes JP. American Journal of Physiology 1942; 137: 187–99; andStainsby WN, Renkin EM. American Journal of Physiology 1961; 201: 117–22. Copyright by AmericanPhysiological Society, with permission.
Figure 8.26 Canine saphenous vein, fromVanhoutte PM, Leusen I. Pfluger’s Archiv 1969; 306: 341–53,with kind permission from Springer Science and Business Media.
246 Figure acknowledgements
Figure 9.1 From Bundgaard M. Journal of Ultrastructural Research 1984; 88: 1–17, with permission fromElsevier.
Figure 9.3 Adapted using information from Drenckhahn D, NessW. In Born GVR, Schwartz CJ (eds).Vascular Endothelium. Stuttgart: Schattauer, 1997; and Weinbaum S,Tarbell JM, Damiano ER. AnnualReview Biomedical Engineering 2007; 9: 121–67.
Figure 9.8 Redrawn from Freiman PC, Mitchell GC, Heistad DD et al. Circulation Research 1986. 58:783–9.
Figure 10.2 Redrawn from Adamson, Michel. Journal of Physiology 1993; 466: 303–27. Withpermission from Wiley-Blackwell.
Figure 10.3 After Renkin EM, Curry FE. In: Giebisch G,Tosteson DC, Ussing HH (eds). MembraneTransport in Biology,Vol. IV. Berlin: Springer-Verlag, 1978: 1–45, with kind permission from SpringerScience and Business Media.
Figure 10.6 Data of Renkin EM. In: Marchetti G,Taccardi B (eds). International Symposium on CoronaryCirculation. Basel: Karger, 1967: 18–30.
Figure 10.8 From data of Blomstrand E, Saltin B. Journal of Physiology 1999; 514: 293–302.
Figure 11.1 After Renkin EM. American Journal of Physiology 1986; 250: H706–10. Copyright byAmerican Physiological Society, with permission.
Figure 11.3(a) From Levick JR, Michel CC. Journal of Physiology 1978; 274: 97–109; Bates DO et al.Journal of Physiology 1994; 477: 355–63.With permission from Wiley-Blackwell.
Figure 11.3(b) Adapted from Levick JR. Journal of Physiology 2004; 557: 704.
Figure 11.5 Drawn from data in Bates, Levick & Mortimer. International Journal of MicrocirculationClinical & Experimental 1992; 11: 359–373, and Guyton,Taylor and Granger. Circulation Physiology II;Dynamics and control of the Body Fluids. WB Saunders: Philadelphia. 1975.
Figure 11.6 From Levick JR, Michel CC. Journal of Physiology 1978; 274: 97–109, with permissionfrom Wiley-Blackwell.
Figure 11.7 Data from Maspers M, Björnberg J, Mellander S. Acta Physiologica Scandinavica 1990; 140:73–83, by permission.
Figure 11.8 From the classic study of Krogh A, Landis EM,Turner AH. Journal of Clinical Investigations1932; 11: 63–95.
Figure 11.9 Adapted from Michel CC, Kendall S. Journal of Physiology 1997; 501: 657–62, withpermission from Wiley-Blackwell.
Figure 11.10 In: Renkin EM, Michel CC (eds). Handbook of Physiology, Cardiovascular System,Vol.IV, Part II, Microcirculation. Bethesda, MD: American Physiological Society, 1984: 309–74,by permission.
Figure acknowledgements 247
Figure 11.11 Data from many laboratories, reviewed in Levick JR, Mortimer PS. Fluid balancebetween microcirculation and interstitium in skin and other tissues; revision of classical filtration-reabsorption scheme. In: Messmer K (ed.). Progress in Applied Microcirculation. Basle: Karger, 1999: 42–62.
Figure 11.12 Adapted from Michel CC, Phillips ME. Journal of Physiology 1987; 388: 421–35, withpermission from Wiley-Blackwell.
Figure 11.14 Courtesy of Professor P Mortimer, Department of Dermatology, St. George’s Hospital,London.
Figure 11.16 (a) From McHale N and colleagues. Journal of Physiology 1977; 272: 33P–4P; and Journalof Physiology 1991; 438: 168P, with permission from Wiley-Blackwell. (b) From Li B, Silver I, Szalai JP,Johnston MG. Microvascular Research 1998; 56: 127–38, with permission from Elsevier.
Figure 11.17 After Taylor AE,Townsley MI. News in Physiological Science 1987; 2: 48–52. Copyright byAmerican Physiological Society, with permission.
Figure 11.18 Redrawn from work of He P, Zhang X, Curry FE. American Journal of Physiology 1996;271: H2377–87. Copyright by American Physiological Society, with permission.
Figure 12.1 Based partly on Gabella G. Physiological Reviews 1984; 64: 455–77.
Figure 12.3 (a) and (b) From Golenhofen K, Hermstein N, Lammel E. Microvascular Research 1973; 5:73–80, with permission from Elsevier. (c) From Keatinge WR, Harman CM. Local MechanismsControlling Blood Vessels. London: Academic Press, 1980, with permission from Elsevier.
Figure 12.5 From Cheung DW. Pfluger’s Archiv 1984; 400: 335–7, with kind permission from SpringerScience and Business Media.
Figure 12.7 Based on Ito T, Kajikuri J, Kurigama H. Journal of Physiology 1992; 457: 297–314 withpermission from Wiley-Blackwell; and Wier WG, Morgan KG. Reviews of Physiology, Biochemistry andPharmacology 2003; 150: 91–139, with permission from Springer Science and Business Media.
Figure 12.8 Courtesy of Professor WA Large, Department of Pharmacology, St. George’s HospitalMedical School, London.
Figure 12.9 After Ushio-Fukai M et al. Journal of Physiology 1993; 462: 679–96.With permission fromWiley-Blackwell.
Figure 12.10 After Sneddon P, Burnstock G. European Journal of Pharmacology 1984; 106: 149–52,with permission from Elsevier.
Figure 12.12 Data from Siegel G et al. Journal of Vascular Medicine and Biology 1991; 3: 140–9.
Figure 13.1 Data from Mellander S, Johansson B. Pharmacological Reviews 1968; 20: 117–96,by permission.
Figure 13.2 Based on McCarron JG, Crichton CA, Langton PD, MacKenzie A, Smith GL. Journal ofPhysiology 1997; 498: 371–9, with permission from Wiley-Blackwell; and Carlson BE, Secomb TW.Microcirculation 2005; 12: 327–38, copyright Taylor & Francis Group, www.informaworld.com,reproduced with permission.
248 Figure acknowledgements
Figure 13.3 From Parkington HC,Tona MA, Coleman HA,Tare M. Journal of Physiology 1995; 484:469–80, with permission from Wiley-Blackwell.
Figure 13.4 From Walloe L,Wesche J. Journal of Physiology 1988; 405: 257–73, with permission fromWiley-Blackwell.
Figure 13.5 (a) Drawn partly from data of Jones RD, Berne RM. Circulation Research 1964; 14: 126.
Figure 13.6 After Heistad DD, Kontos HA. In: Shepherd JT,Abboud FM (eds). Handbook of Physiology,Cardiovascular System, Vol. III, Part 1, Peripheral Circulation. Bethesda, MD:American PhysiologicalSociety, 1983: 137–81, by permission.
Figure 13.7 Adapted from Bruce J,Taggart M,Austin C. Microvascular Research 2004; 68: 303–312,with permission from Elsevier.
Figure 13.8 Redrawn and modified using data from Altura B. Microcirculation, Endothelium andLymphatics 1988; 4: 97–110.
Figure 13.9 Data from Laird. In: Holland A, Noble M (eds). Cardiac Metabolism. Chichester: Wiley,1983: 257–78.
Figure 13.10 Based in part on data from Wade OL, Bishop JM. Cardiac Output and Regional BloodFlow. Oxford: Blackwell, 1962.
Figure 13.11 Adapted with permission from Brown MD. In: Jordan D, Marshall J (eds). CardiovascularRegulation. London: Portland Press, 1995: 113–26.
Figure 14.1 Adapted from Furness JB, Marshall JM. Journal of Physiology 1974; 239: 75–88, withpermission from Wiley-Blackwell.
Figure 14.2 After Hainsworth R, Karim F. Journal of Physiology 1976; 262: 659–77, with permissionfrom Wiley-Blackwell.
Figure 14.3 From Mellander S. Acta Physiologica Scandinavica 1960; 50 (Suppl.): 176, with permissionfrom Wiley-Blackwell.
Figure 14.4 After Foreman JC. Allergy 1987; 42: 1–11, with permission from Wiley-Blackwell.
Figure 14.5 From classic monograph, Barcroft H, Swan HJC. Sympathetic Control of Human BloodVessels. London: Edward Arnold, 1953, by permission.
Figure 15.1 Data from Ingvar DH. Brain Research 1976; 107: 188–97; and Lassen NA, Ingvar DH,Skinhoj E. Scientific American 1978; 239: 50–9.
Figure 15.2 (a) After Greenfield ADM. In: Hamilton WF, Dow P (eds). Handbook of Physiology,Cardiovascular System, Vol. III, Part II, Peripheral Circulation. Bethesda, MD:American PhysiologicalSociety, 1963: 1325–52; (b) from Johnson JM, Rowell JB. Journal of Applied Physiology 1975; 39: 920–4,copyright by American Physiological Society, with permission; (c) based on Van den Bande P,De Coninck A, Lievens P. International Journal of Microcirculation 1977; 55–60.
Figure 15.3 From Renkin EM. In: Marhetti G,Taccardi B (eds). International Symposium on CoronaryCirculation. Basel: Karger, 1967: 18–30.
Figure acknowledgements 249
Figure 15.4 After Khouris EM, Gregg DE, Rayford CR. Circulation Research 1965; 17: 427–37.
Figure 15.6 Redrawn from Deanfield JE, Shea M, Kensett M et al. Lancet 1984; 2: 1001–5, withpermission from Elsevier.
Figure 15.8 After Roddie IC. In: Shepherd JT,Abboud FM (eds). Handbook of Physiology, CardiovascularSystem,Vol. III, Part 1, Peripheral Circulation. Bethesda, MD:American Physiological Society, 1983:285–317.
Figure 15.11 From Caesar K,Akgören N, Mathiesen C, Lauritzen M. Journal of Physiology 1999; 520:281–92, by permission.
Figure 15.13 Based on Robertson TP, Aaronson PI,Ward JPT. American Journal of Physiology 1995;268: H301–7. Copyright by American Physiological Society, with permission.
Figure 15.14 (a) From Banister RJ,Torrance RW. Quarterly Journal of Experimental Physiology 1960; 45:352–7; (b) from Grover RF et al. Pulmonary circulation. In: Shepherd JT,Abboud FM (eds). Handbookof Physiology, Cardiovascular System, Vol III, Peripheral Circulation. Bethesda, MD: AmericanPhysiological Society, 1983: 103–36, by permission.
Figure 16.1 From Abraham A. Microscopic Innervation of the Heart and BloodVessels inVertebrates IncludingMan. Oxford: Pergamon Press, 1969, by permission.
Figure 16.2 Fibres 1 and 2 after Landgren S. Acta Physiologica Scandinavica 1952; 26: 1–34; fibre 3 fromDowning SE. Journal of Physiology 1960; 150: 210–13, with permission from Wiley-Blackwell.
Figure 16.3 From (a) Coleridge HM, Coleridge JCG, Schultz HD. Journal of Physiology 1987; 394:291–313 with permission from Wiley-Blackwell; (b) Korner PI. Physiological Reviews 1971; 51: 312–67,copyright by American Physiological Society, with permission; and (c) Angell-James JE, De BurghDaly M. Journal of Physiology 1970; 209: 257–93, with permission from Wiley-Blackwell.
Figure 16.5 (a) From Cowley AW, Liard JF, Guyton AC. Circulation Research 1973; 32: 564–78;(b) Persson PB, Ehmke H, Kirchheim HR. News in Physiological Sciences 1989; 4: 56–9. Copyright byAmerican Physiological Society, with permission.
Figure 16.6 Based on Gallagher KM, Fadel, PJ, Strömstad M et al. Journal of Physiology 2001; 533:861–70, with permission from Wiley-Blackwell.
Figure 16.7 Based on Kappagoda CT, Linden RJ, Sivananthan N. Journal of Physiology 1979; 291:393–412, with permission from Wiley-Blackwell.
Figure 16.9 Data redrawn from Seeliger, Wronski, Ladwig et al. Clinical and Experimental Pharmacologyand Physiology 2005; 32: 394–9, with permission from Wiley-Blackwell.
Figure 16.10 Data from Rusch NJ, Shepherd JT, Webb RC, Vanhoutte PM. Circulation Research 1981;48 (Suppl. 1): 118–25, by permission.
Figure 16.11 Based on Spyer KM. Journal of Physiology 1994; 474: 1–19, with permission fromWiley-Blackwell.
250 Figure acknowledgements
Figure 17.1 From Smith JJ, Bush JE,WeideierVT,Tristani FE. Journal of Applied Physiology 1970; 29:133. Copyright by American Physiological Society, with permission.
Figure 17.3 (a) From Bannister Sir R. In: Sleight P (ed.). Arterial Blood Pressure and Hypertension.Oxford: Oxford University Press, 1980: 117–21; and Wallin BG, Elam M. News in Physiological Sciences1994;9: 203–7; (b) from Johnson RH, Spalding JMK. Disorders of the Autonomic Nervous System. London:Blackwell, 1974, with permission from Wiley-Blackwell.
Figure 17.5 Courtesy of JR Henderson, unpublished. Inset from Heistad DD,Abboud FM,Eckstein JW.Journal of Applied Physiology 1968; 25: 542–49. Copyright by American Physiological Society, withpermission.
Figure 18.1 After Rowell LB. Human Circulation Regulation during Physical Stress. NewYork: OxfordUniversity Press, 1986 (fig 12.9, p. 342); adapted from Rowell & Blackman. American Journal ofPhysiology 1986; 251: H562–70. Copyright by American Physiological Society, with permission.
Figure 18.2 Results of Thybo NK, Stephens N, Cooper A,Aalkjaer C, Heagerty AM, Mulvany MJ.Hypertension 1995; 25: 474–81.
Figure 18.3 Based on NicholsWW, O’Rourke MF. McDonald’s Blood Flow in Arteries. London:Arnold,2005.
Figure 18.6 Based on information in Sipido KR, Eisner D. Cardiovascular Research 2005; 68: 167–74;and Bers DM. Physiology 2006; 21: 380–7.
Figure 18.7 From Wade OL, Bishop JM. Cardiac Output and Regional Flow. Oxford: Blackwell, 1962,by permission.
All figures reproduced with permission of American Physiological Society are done so via CopyrightClearance Center.
All figures reproduced with permission of Rockefeller University Press are done so via CopyrightClearance Center.
Figure acknowledgements 251
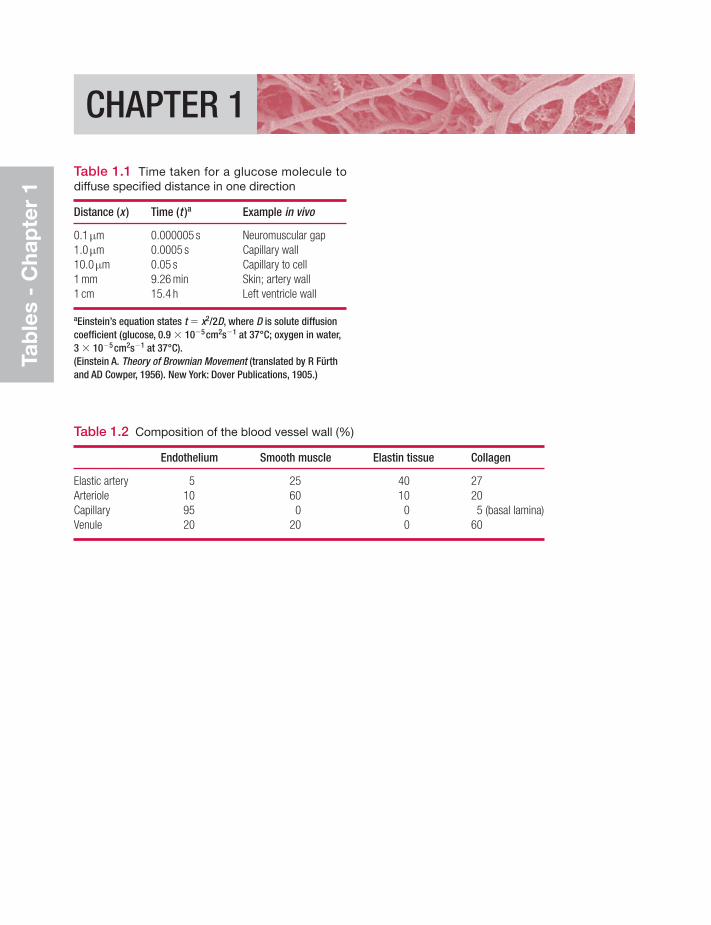
Tab
les
- C
hap
ter
1
CHAPTER 1
Table 1.1 Time taken for a glucose molecule todiffuse specified distance in one direction
Distance (x ) Time (t )a Example in vivo
0.1μm 0.000005 s Neuromuscular gap1.0μm 0.0005 s Capillary wall10.0μm 0.05 s Capillary to cell1 mm 9.26 min Skin; artery wall1 cm 15.4 h Left ventricle wall
aEinstein’s equation states t � x2/2D, where D is solute diffusioncoefficient (glucose, 0.9 � 10�5cm2s�1 at 37°C; oxygen in water,3 � 10�5cm2s�1 at 37°C).(Einstein A. Theory of Brownian Movement (translated by R Fürthand AD Cowper, 1956). New York: Dover Publications, 1905.)
Table 1.2 Composition of the blood vessel wall (%)
Endothelium Smooth muscle Elastin tissue Collagen
Elastic artery 5 25 40 27Arteriole 10 60 10 20Capillary 95 0 0 5 (basal lamina)Venule 20 20 0 60
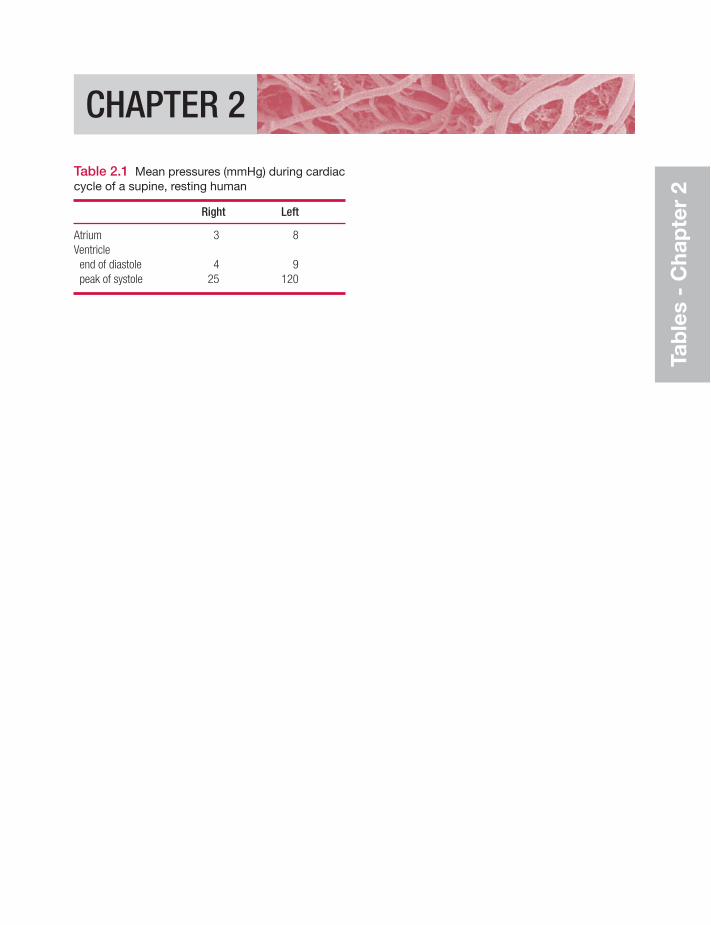
Tab
les
- C
hap
ter
2
CHAPTER 2
Table 2.1 Mean pressures (mmHg) during cardiaccycle of a supine, resting human
Right Left
Atrium 3 8Ventricleend of diastole 4 9peak of systole 25 120
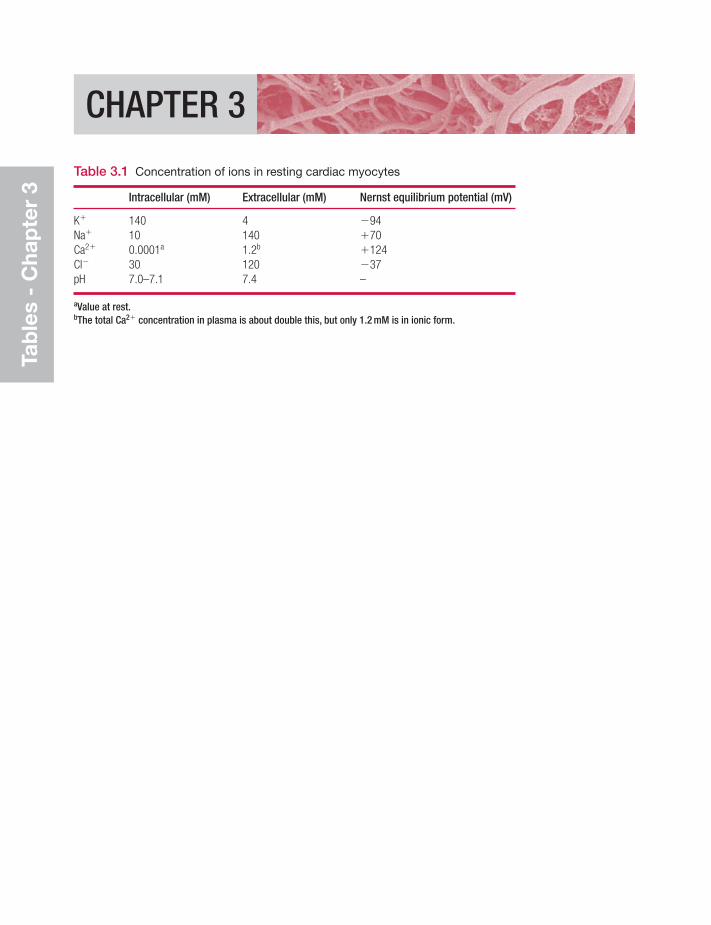
Tab
les
- C
hap
ter
3
CHAPTER 3
Table 3.1 Concentration of ions in resting cardiac myocytes
Intracellular (mM) Extracellular (mM) Nernst equilibrium potential (mV)
K� 140 4 �94Na� 10 140 �70Ca2� 0.0001a 1.2b �124Cl� 30 120 �37pH 7.0–7.1 7.4 –
aValue at rest.bThe total Ca2� concentration in plasma is about double this, but only 1.2 mM is in ionic form.
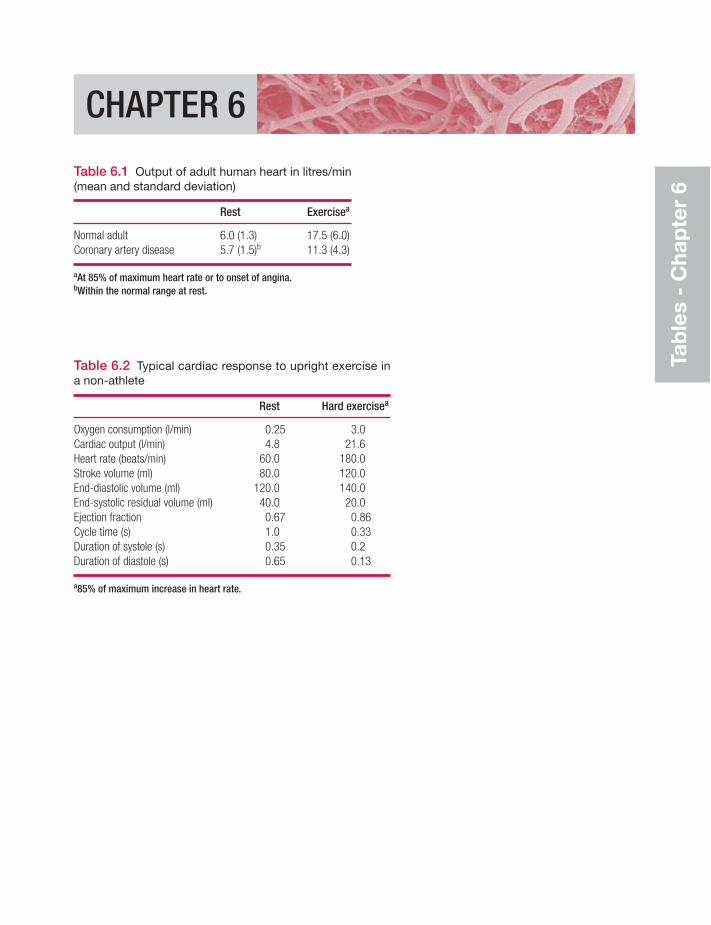
Tab
les
- C
hap
ter
6
CHAPTER 6
Table 6.1 Output of adult human heart in litres/min(mean and standard deviation)
Rest Exercisea
Normal adult 6.0 (1.3) 17.5 (6.0)Coronary artery disease 5.7 (1.5)b 11.3 (4.3)
aAt 85% of maximum heart rate or to onset of angina.bWithin the normal range at rest.
Table 6.2 Typical cardiac response to upright exercise ina non-athlete
Rest Hard exercisea
Oxygen consumption (l/min) 0.25 3.0Cardiac output (l/min) 4.8 21.6Heart rate (beats/min) 60.0 180.0Stroke volume (ml) 80.0 120.0End-diastolic volume (ml) 120.0 140.0End-systolic residual volume (ml) 40.0 20.0Ejection fraction 0.67 0.86Cycle time (s) 1.0 0.33Duration of systole (s) 0.35 0.2Duration of diastole (s) 0.65 0.13
a85% of maximum increase in heart rate.
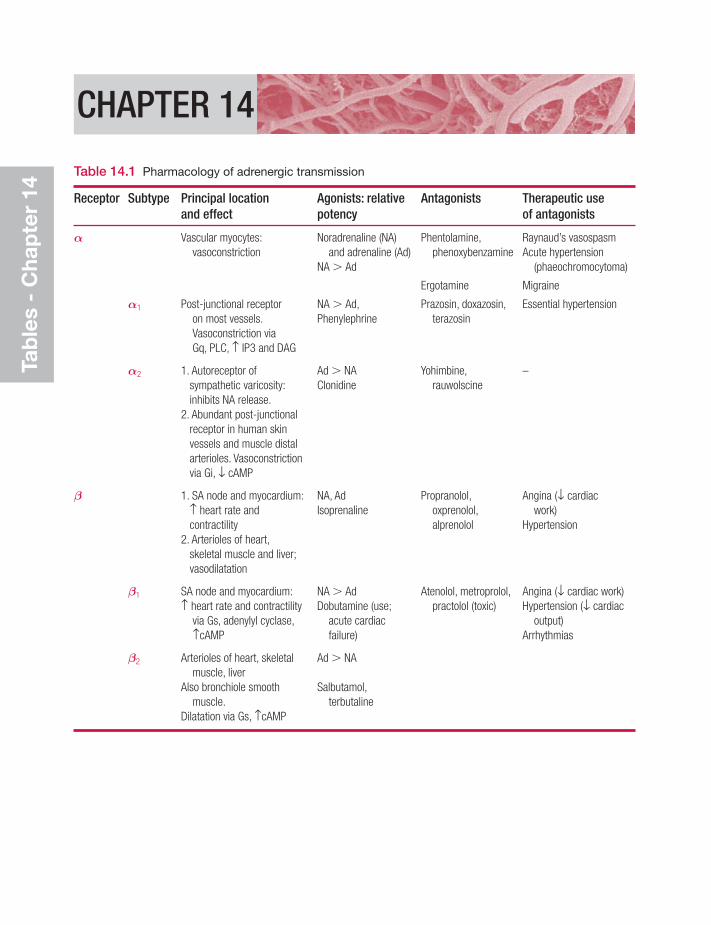
Tab
les
- C
hap
ter
14
CHAPTER 14
Table 14.1 Pharmacology of adrenergic transmission
Receptor Subtype Principal location Agonists: relative Antagonists Therapeutic use and effect potency of antagonists
α Vascular myocytes: Noradrenaline (NA) Phentolamine, Raynaud’s vasospasm vasoconstriction and adrenaline (Ad) phenoxybenzamine Acute hypertension
NA Ad (phaeochromocytoma)
Ergotamine Migraine
α1 Post-junctional receptor NA Ad, Prazosin, doxazosin, Essential hypertensionon most vessels. Phenylephrine terazosinVasoconstriction viaGq, PLC, ≠ IP3 and DAG
α2 1. Autoreceptor of Ad NA Yohimbine, –sympathetic varicosity: Clonidine rauwolscineinhibits NA release.
2. Abundant post-junctional receptor in human skin vessels and muscle distal arterioles. Vasoconstrictionvia Gi, ↓ cAMP
β 1. SA node and myocardium: NA, Ad Propranolol, Angina (↓ cardiac≠ heart rate and Isoprenaline oxprenolol, work)contractility alprenolol Hypertension
2. Arterioles of heart,skeletal muscle and liver; vasodilatation
β1 SA node and myocardium: NA Ad Atenolol, metroprolol, Angina (↓ cardiac work)≠ heart rate and contractility Dobutamine (use; practolol (toxic) Hypertension (↓ cardiac
via Gs, adenylyl cyclase, acute cardiac output)≠cAMP failure) Arrhythmias
β2 Arterioles of heart, skeletal Ad NAmuscle, liver
Also bronchiole smooth Salbutamol,muscle. terbutaline
Dilatation via Gs, ≠cAMP
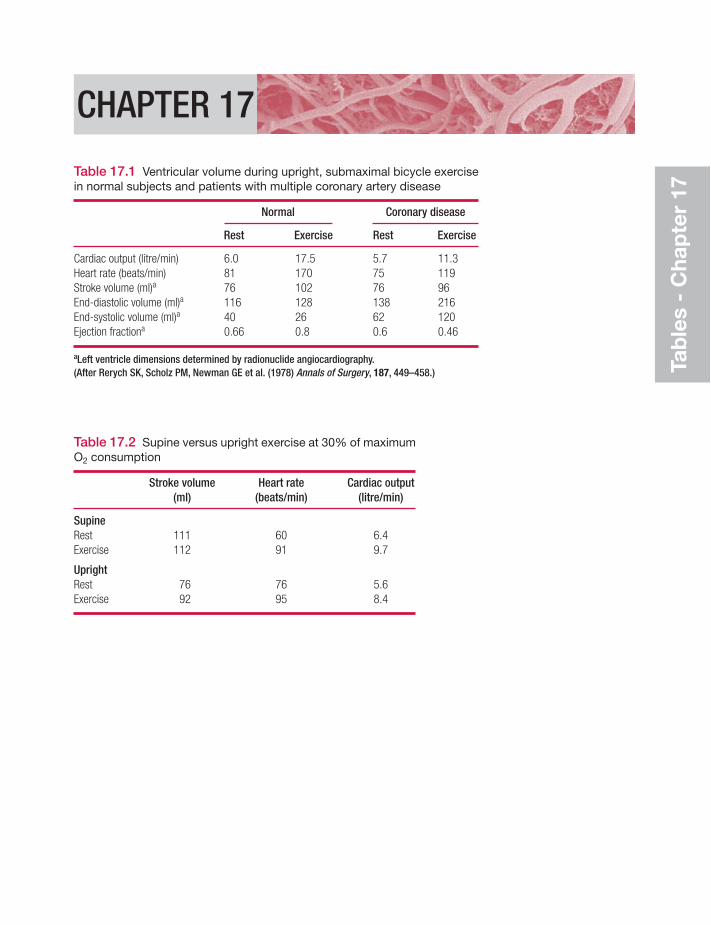
Tab
les
- C
hap
ter
17
CHAPTER 17
Table 17.1 Ventricular volume during upright, submaximal bicycle exercisein normal subjects and patients with multiple coronary artery disease
Normal Coronary disease
Rest Exercise Rest Exercise
Cardiac output (litre/min) 6.0 17.5 5.7 11.3Heart rate (beats/min) 81 170 75 119Stroke volume (ml)a 76 102 76 96End-diastolic volume (ml)a 116 128 138 216End-systolic volume (ml)a 40 26 62 120Ejection fractiona 0.66 0.8 0.6 0.46
aLeft ventricle dimensions determined by radionuclide angiocardiography.(After Rerych SK, Scholz PM, Newman GE et al. (1978) Annals of Surgery, 187, 449–458.)
Table 17.2 Supine versus upright exercise at 30% of maximumO2 consumption
Stroke volume Heart rate Cardiac output (ml) (beats/min) (litre/min)
SupineRest 111 60 6.4Exercise 112 91 9.7
UprightRest 76 76 5.6Exercise 92 95 8.4
Index
Note: references in the form ‘2.4’ denote the question and answer number. References to illustrations have been givenin the same form but enclosed in brackets (e.g.‘(2.4)’), usually following the question or answer which they are linkedto, but sometimes on their own. Bracketed references in italics denote tables.
absorption vs filtration (of fluid),importance of interstitialfactors 11.8
ACE inhibitors see angiotensin-converting enzyme inhibitors
acetylcholineblood vessel regulation and
13.4(13.3), 13.6(13.8)heart beat and 4.1(4.1), 4.2(4.2),
(4.9), (4.10)actin
cardiac myocyte 3.3(3.3, 3.4)vascular myocyte 12.1, 12.2
action potentialscarotid baroreceptor afferent
fibre 16.2heart (3.1)
atrial myocyte 3.7K� currents and 3.8(3.13)sympathetic stimulation and
3.7(3.11)ventricular myocyte 3.6, 3.7
vasomotor sympathetic fibres12.8(12.8)
ADH (vasopressin) 14.7(14.6),16.4(14.6)
adrenaline (epinephrine) effects onblood vessels 14.5(14.5)
on tone 12.10α-adrenoceptor(s) (14.1)
vascular myocyte 12.7α-adrenoceptor agonists (14.1)α-adrenoceptor antagonists/blockers
(14.1)vascular effects 12.7(12.5), (14.1)
β-adrenoceptor(s) (14.1)cardiac 4.2, 4.7, 4.8vascular myocyte 12.7β-adrenoceptor agonists (14.1)β-adrenoceptor antagonists/
blockers (14.1)cardiac effects 412, 6.14
in heart failure 18.19in hypertension 18.9
adventitia 1.7(1.8)afferent fibres
cardiac 16.5(16.7)carotid baroreceptor 16.2
after-depolarization, delayed 3.11age-related changes 17.11
arterial blood pressure 8.15(8.14),17.11(8.14)
aldosterone 14.8(14.7)alerting response 14.12, 16.10alpha-blockers and agonists
see adrenoceptoraltitude-induced chronic arterial
hypoxaemia 18.1angina pectoris 15.6
treatment 15.7angiogenesis 9.7angiotensin II 14.8(14.7),
14.9(14.7)receptor inhibitor effects on
vascular tone 12.10angiotensin-converting enzyme
(ACE) inhibitorsheart failure 18.19hypertension 18.9
Anrep effects 6.10(6.17)
antidiuretic hormone (vasopressin)14.7(14.6), 16.4(14.6)
antihypertensive drug therapy 18.9aorta
abdominal/distal 1.8pressure/volume/flow changes
during cardiac cycle (2.2)pressure wave 8.11(8.7), (8.12)
in chronic heart failure (18.5)proximal and ascending 1.8
flow/acceleration/pressuregradients (8.18)
flow of blood to dorsalis pedisartery during walking 8.3
pulse, wave reflection effects on(8.12)
pulse pressure, relationship tostroke volume
aortic body chemoreceptors16.1(16.1), 16.8, 17.10,18.1(16.1)
aortic valve 2.13incompetence (2.6)stenosis (2.6)
armsblood flow to, in alerting
response 14.12cutaneous vascular
control (15.8)see also hand
arrhythmias 5.4–5circus pathway in genesis of
5.5(5.7)ECG (4.3), 5.4–5sinus see sinus arrhythmia
arteriesatheromatous 9.8(9.8)baroreceptors see baroreceptorsblood pressure
age-related changes 8.15(8.14),17.11(8.14)
alerting response and 14.12cerebral effects of 15.17gravity effects in standing
(8.3)high see hypertensionlong-term control 16.7mean see mean arterial blood
pressurerise 6.10(6.17)systolic see systolic BPValsalva manoeuvre effects
17.3(17.3)compliance 8.9(c)elastic see elastic arterieshypoxaemia, responses
18.1(18.1)large, contraction, compared
with resistance vessels12.5
pulse pressure see pulse pressurereflexogenic zones 16.1terminal see resistance vesselstone 13.2, 13.6
arterio-arterial anastomoses,coronary 15.5(15.5)
arterioles 13.1intrinsic control 13.1terminal see resistance vesselsvasodilation in skeletal muscle
10.7(10.7)arteriosclerosis 8.7, 17.11assessment, clinical 2.15atheromatous arteries 9.8(9.8)atria
myocyte action potential 3.7systole (2.2)
atrial natriuretic peptide 14.10atrioventricular node 4.4auscultation
BP measurement 8.12(8.8)cardiac 2.14
autocoids in blood vesselregulation 13.7
autoregulationblood flow 13.8(13.5)capillary pressure 13.8(13.5)cerebral perfusion 13.8(13.6),
15.7(13.6)axon reflex 14.4(14.4)
baroreceptors and baroreflex6.13(6.20), 16.1–4(16.1–3,16.5–6)
cerebral perfusion and 15.16orthostasis and 17.2
Bayliss effect (myogenic response)13.2(13.2), 13.3(13.2),13.8(13.2), 15.7(13.2)
beta-blockers and agonists see adrenoceptor
bloodpressure see hypertension; pressurevelocity 8.17venous see venous bloodviscosity see viscositysee also plasma
blood flow 1.3–5(1.5), 8.4–6aorta and left heart, changes in
cardiac cycle (2.2)cerebellar (15.11)coronary, in leg exercise (13.10)cut off see ischaemiacutaneous (15.2), 15.11, 15.13to forearm and hand in alerting
response 14.12intrinsic control
autoregulation 13.8(13.5)regulated range of flow
13.1(13.1)patterns (8.5)from proximal aorta to dorsalis
pedis artery duringwalking 8.3
pulmonary, oxygen uptake and17.4(17.4)
to skeletal muscle 13.12, 15.8,15.10
in exercise see exercisetranscapillary solute exchange
and effects of 10.8(10.6)turbulence 8.5vasodilation mediated by
13.9(13.11)see also pressure–flow relations
blood gas exchange in lungs 15.19blood vessels 1.6–9(1.7–8)
extrinsic (neuroendocrine) control14.1–12
intrinsic control 13.1–12pressure/radius/wall tension and
stress in different categoriesof (8.23)
resistance see resistancesmooth muscle see smooth musclewalls see walls
body fluids see fluidsbowel (intestine), arterial supply 1.8brachial artery
blood pressurealerting response and 14.12systolic 8.15
pressure wave (8.7)brain 15.15–18
arterial pressure effects on 15.15capillaries 10.5perfusion (15.1), 15.16
autoregulation 13.8(13.6),15.7(13.6)
see also central nervous systembrain-derived natriuretic peptide
14.10brainstem herniation, bulbar
ischaemia in (8.17)bulbar ischaemia in brainstem
herniation (8.17)
calcium ion(s) (and calcium channels)cardiac 3.7, 3.9, 3.11(3.16), 4.3
in heart failure 18.13(18.6)vascular endothelial 9.2(9.2)
in inflammation 11.18(11.18)vascular smooth muscle and 12.4,
12.6(12.7)calcium ion antagonists (calcium
channel blockers)cardiac performance effects 4.12vascular smooth muscle and
effects of 12.10, 18.9calf muscle pump 6.8, 8.3(8.4),
8.24(8.27)capillaries 11.1–4
alveolar, density 15.20(15.12)blood pressure 11.4(11.6–7)
autoregulation 13.8(13.5)Starling pressures running along
capillaries (11.3), 11.7(11.4,11.11)
brain 10.5cardiac, density 15.20diffusion to tissues from blood in
see diffusionfiltration see filtrationfluid transfer across wall 11.1, 11.3myocardial, density 15.3(15.3)permeability (of wall/endothelium)
see permeabilityrecruitment 10.7(10.7)skeletal muscle, density (15.3)types 10.1(10.1)see also microcirculation
Index 259
cardiac… see heartcardiomyocytes see myocytescarotid
baroreceptors 16.2chemoreceptors 16.1, 16.8
catecholamines and coronary bloodflow (6.20)
central nervous system 16.10–11central venous pressure 8.21(8.24)cerebellar blood flow (15.11)cerebral vessels see brainchemoreceptors 16.1(16.1), 16.8,
17.10, 18.1(16.1)chloride ion channels, vascular
smooth muscle 12.11circle of Willis 15.14(15.9)circulation(s) 15.1–24
failure due to haemorrhage18.2
in parallel 8.4pulmonary see pulmonary
circulationsystemic see systemic circulation
and specific partstransport 1.1(1.1–2)
circus pathway in arrhythmogenesis5.5(5.7)
clinical assessment 2.16cold receptors, facial 16.8, 17.10compliance
arterial 8.9(c)lung, in left ventricular failure
18.11concentration gradient 1.1(1.1)conduction system 3.1(3.2)continuous capillaries (10.1)
permeability 10.4contractility
hearteffect on pressure–volume
loop (6.13)factors raising 6.11
lymphatic vessel 11.13(11.16)contraction
cardiac 3.1–12coupling with excitation 3.9difference from vascular
contraction 12.2exercise effects on (6.10)factors raising force 3.10of isolated myocardial muscle
strip 6.2isovolumetric, ventricles 2.6nervous system in see nervous
system
proteins 3.3(3.3, 3.4)ventricular load before and
during 6.3vascular 12.1–11
difference between largearteries and resistancevessels 12.5
difference from cardiaccontraction 12.2
coronary circulation 1.1, 15.3–7catecholamines and (6.20)endothelium-dependent
relaxation (13.3)in exercise 15.4
blood flow in leg exercise(13.10)
ischaemic disease see ischaemicheart disease
Cushing’s reflex 8.16(8.17),15.18(8.17)
cutaneous circulation see skincyanosis 15.23cytoskeleton, endothelial (9.3)
Darcy’s law 1.3(1.5), 13.12depolarization
cardiac contraction and (5.2)abnormal 3.11
vascular contraction and12.2(12.3, 12.4, 12.5), 12.3,12.4, 12.8
development, fetal cardiac 2.1diastole (2.2), 2.4(2.4)
stroke work in relation to pressureat end of 6.6
diffusion (incl. solutes) 1.1from capillary to tissues
10.3(10.4)effect of blood flow on
10.8(10.6)glucose (in skeletal muscle)
and effects of exercise10.9(10.8)
of metabolic substrates anddrugs 10.6(10.5)
digoxin 3.4(3.6), 3.9(3.15)heart failure 18.19
dipole, cardiac 5.3(5.3–4, 5.6)discontinuous capillaries (10.1)diuretics
heart failure 18.19hypertension 18.9
diving reflex 16.8, 17.10(17.5)Doppler ultrasound, cardiac output
assessment 7.1(7.1)
dorsalis pedis artery, blood flow fromproximal aorta to, duringwalking 8.3
drugscardiac performance-manipulating
4.12diffusion from bloodstream into
tissues 10.6(10.5)in heart failure 18.19in hypertension 18.9vascular tone altered by 12.10
dye dilution method of cardiacoutput assessment 7.3(7.4)
ECG see electrocardiographyechocardiography, cardiac output
assessment 7.1(7.1)eicosanoids in blood vessel
regulation 13.7ejection phase, ventricular 2.7elastic arteries 1.6(1.7)
pressure–volume relations (8.9)stiffness, effects of increase in
8.8(8.9–10)electrocardiography (ECG) 5.1–7
arrhythmias (4.3), 5.4–5electrode positions for 12 lead
recording (5.5)lead II, resting human 5.2
electrophysiologyconduction and
excitation–contractioncoupling 3.1–12
endothelial 9.2(9.2)lymphatic smooth muscle 11.16
embolism, pulmonary 15.24end-diastolic pressure, stroke work in
relation to 6.6endocrine control of blood vessels
14.5–10endothelial cells 9.1–8
factors produced by/functions of9.4(9.5)
in inflammation 9.6(9.7),11.17(11.19)
endothelium-dependent relaxationof coronary artery (13.3)
endurance training 17.8, 17.12epinephrine see adrenalineergoreceptors, muscle 16.11excitation
cardiac 3.1–12, 4.6(4.5)coupling with contraction 3.9
vascular smooth muscle12.1–11
260 Index
exercise (mainly upright) 6.5(6.2),6.16(6.22), 13.9–10, 17.4–8
baroreflex in 16.3(16.6)blood pressure and 16.11cardiac function in see heartcoronary circulation in
see coronary circulationdiffusive glucose transfer from
blood to skeletal muscleduring 10.9–10(10.8)
endurance training 17.8, 17.12pulmonary circulation and effects
of (6.23)skeletal muscle circulation/blood
flow 13.5, 13.9, 13.12, 15.9,17.6
increased (�metabolic/reactivehyperaemia) 13.2(13.4),13.9, 13.12, 15.4, 15.13
supine vs upright 17.5(17.2)systolic BP and effects of 8.15(8.15)ventricular dimensions and
contraction and effects of(6.10)
expiration against closed glottis,forced 17.3
extracellular fluidacute volume increase 16.6vascular smooth muscle and the
chloride concentrations in12.11
see also interstitial fluid; plasmaextremities see arms; foot; hand; legs
facial cold receptors 16.8, 17.10fainting 18.5fear–fight–flight (alerting) response
14.12, 16.10feet see footfenestrated capillaries (10.1)fetal cardiac development 2.1Fick principle 7.2(7.3), 10.6, 10.7,
10.8, 15.10, 17.4, 17.12fight or flight (alerting) response
14.12, 16.10filling, ventricles 2.4(2.4)filling pressures, heart 6.8filtration (microvascular/capillary)
absorption vs, importance ofinterstitial factors 11.8
plasma protein concentration andeffects of (11.10)
rate of 11.5(11.7)flare response 14.4(14.4),
15.11(14.4)
flight or fight (alerting) response14.12, 16.10
flowin tubes 8.1(8.1)
Poiseuille’s law and cylindricaltubes 8.18(8.19)
in vessels see blood flowfluids
circulation 11.1–18ions in, effects on heart 4.11pulmonary exchange 15.22see also extracellular fluid;
interstitial fluid; lymph;oedema; plasma
foot/feetblood flow from proximal aorta
to dorsalis pedis artery of,during walking 8.3
oedema, factors preventing ormitigating 11.15(11.17)
forced expiration against closedglottis 17.3
forearm, blood flow to, in alertingresponse 14.12
Frank–Starling mechanism seeStarling law of the heart
gap junctions 9.1(9.1)cardiac myocyte 3.2, 4.6endothelial 9.1vascular myocyte 12.1
gas exchange in lungs 15.19glottis, closed, forced expiration
against 17.3glucose transport 1.1(1.1)
from blood to skeletal muscle10.10
exercise effects 10.9(10.8), 10.10gravity effects 6.5(6.9), 6.8, 8.3(8.3)
haematocrit and viscosity 8.18(8.13)haemodynamics 8.1–24haemorrhage (8.11), 18.2–3
fluid exchange 11.18shock due to 18.2
Hamilton’s dye dilution method (7.4)hand
blood flow to, in alerting response14.12
cutaneous vascular control (15.8)head-up tilt (17.1)heart
afferent fibres 16.5(16.7)anatomy (2.1)
oblique orientation in chest (2.5)
auscultation 2.14beat
initiation 4.1–12nervous control see nervous
systemcontractility see contractilitycycle 2.1–17in exercise (6.2), 17.4(17.1),
17.5(17.2)rate 16.11
failure 6.9(6.16),18.10–19(18.4–7)
chronic 18.10(18.5), 18.14oedema 11.14, (11.14)treatment 18.18–19
fetal development 2.1filling see filling; filling pressuresischaemic disease see ischaemic
heart diseaseleft, pressure changes during
cardiac cycle (2.2, 2.1)left, volume and flow changes
during cardiac cycle (2.2)murmurs 2.12(2.6)output 1.2(1.3), 6.1–17(6.1)
assessment 7.1–5catecholamine-driven increase,
effects on coronary bloodflow (6.20)
equalization of left and rightventricle by Starling’s law6.8
in exercise (17.2)in heart failure (18.7)other haemodynamic factors in
relation to 8.2pacemaker 3.1, 4.1–3performance
noradrenaline effects (6.19)pharmacological manipulation
of 4.12pump function curves (6.3)rate 2.2(2.4), 2.4(2.4), 4.9
alerting response and 14.12exercise and 16.11, 17.5(17.2)haemodynamic factors in
relation to 8.2Valsalva manoeuvre effects
17.3(17.3)sounds see soundsStarling’s/Frank–Starling’s law of
the see Starling law of theheart
valves see valvesheat loss through skin 15.12(15.7)
Index 261
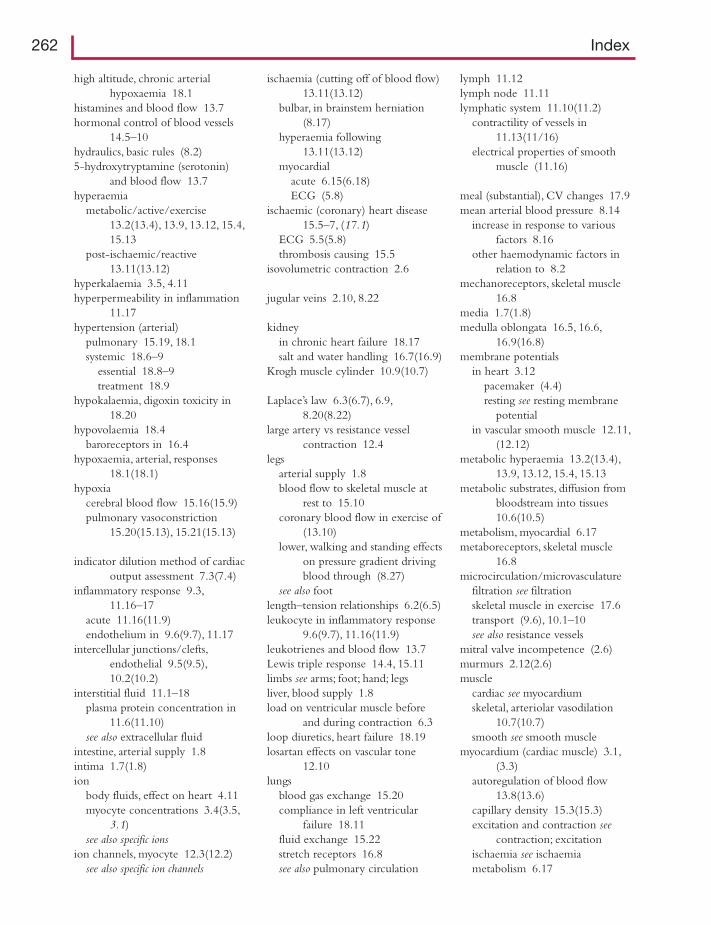
high altitude, chronic arterialhypoxaemia 18.1
histamines and blood flow 13.7hormonal control of blood vessels
14.5–10hydraulics, basic rules (8.2)5-hydroxytryptamine (serotonin)
and blood flow 13.7hyperaemia
metabolic/active/exercise13.2(13.4), 13.9, 13.12, 15.4,15.13
post-ischaemic/reactive13.11(13.12)
hyperkalaemia 3.5, 4.11hyperpermeability in inflammation
11.17hypertension (arterial)
pulmonary 15.19, 18.1systemic 18.6–9
essential 18.8–9treatment 18.9
hypokalaemia, digoxin toxicity in18.20
hypovolaemia 18.4baroreceptors in 16.4
hypoxaemia, arterial, responses18.1(18.1)
hypoxiacerebral blood flow 15.16(15.9)pulmonary vasoconstriction
15.20(15.13), 15.21(15.13)
indicator dilution method of cardiacoutput assessment 7.3(7.4)
inflammatory response 9.3,11.16–17
acute 11.16(11.9)endothelium in 9.6(9.7), 11.17
intercellular junctions/clefts,endothelial 9.5(9.5),10.2(10.2)
interstitial fluid 11.1–18plasma protein concentration in
11.6(11.10)see also extracellular fluid
intestine, arterial supply 1.8intima 1.7(1.8)ion
body fluids, effect on heart 4.11myocyte concentrations 3.4(3.5,
3.1)see also specific ions
ion channels, myocyte 12.3(12.2)see also specific ion channels
ischaemia (cutting off of blood flow)13.11(13.12)
bulbar, in brainstem herniation(8.17)
hyperaemia following13.11(13.12)
myocardialacute 6.15(6.18)ECG (5.8)
ischaemic (coronary) heart disease15.5–7, (17.1)
ECG 5.5(5.8)thrombosis causing 15.5
isovolumetric contraction 2.6
jugular veins 2.10, 8.22
kidneyin chronic heart failure 18.17salt and water handling 16.7(16.9)
Krogh muscle cylinder 10.9(10.7)
Laplace’s law 6.3(6.7), 6.9,8.20(8.22)
large artery vs resistance vesselcontraction 12.4
legsarterial supply 1.8blood flow to skeletal muscle at
rest to 15.10coronary blood flow in exercise of
(13.10)lower, walking and standing effects
on pressure gradient drivingblood through (8.27)
see also footlength–tension relationships 6.2(6.5)leukocyte in inflammatory response
9.6(9.7), 11.16(11.9)leukotrienes and blood flow 13.7Lewis triple response 14.4, 15.11limbs see arms; foot; hand; legsliver, blood supply 1.8load on ventricular muscle before
and during contraction 6.3loop diuretics, heart failure 18.19losartan effects on vascular tone
12.10lungs
blood gas exchange 15.20compliance in left ventricular
failure 18.11fluid exchange 15.22stretch receptors 16.8see also pulmonary circulation
lymph 11.12lymph node 11.11lymphatic system 11.10(11.2)
contractility of vessels in11.13(11/16)
electrical properties of smoothmuscle (11.16)
meal (substantial), CV changes 17.9mean arterial blood pressure 8.14
increase in response to variousfactors 8.16
other haemodynamic factors inrelation to 8.2
mechanoreceptors, skeletal muscle16.8
media 1.7(1.8)medulla oblongata 16.5, 16.6,
16.9(16.8)membrane potentials
in heart 3.12pacemaker (4.4)resting see resting membrane
potentialin vascular smooth muscle 12.11,
(12.12)metabolic hyperaemia 13.2(13.4),
13.9, 13.12, 15.4, 15.13metabolic substrates, diffusion from
bloodstream into tissues10.6(10.5)
metabolism, myocardial 6.17metaboreceptors, skeletal muscle
16.8microcirculation/microvasculature
filtration see filtrationskeletal muscle in exercise 17.6transport (9.6), 10.1–10see also resistance vessels
mitral valve incompetence (2.6)murmurs 2.12(2.6)muscle
cardiac see myocardiumskeletal, arteriolar vasodilation
10.7(10.7)smooth see smooth muscle
myocardium (cardiac muscle) 3.1,(3.3)
autoregulation of blood flow13.8(13.6)
capillary density 15.3(15.3)excitation and contraction see
contraction; excitationischaemia see ischaemiametabolism 6.17
262 Index
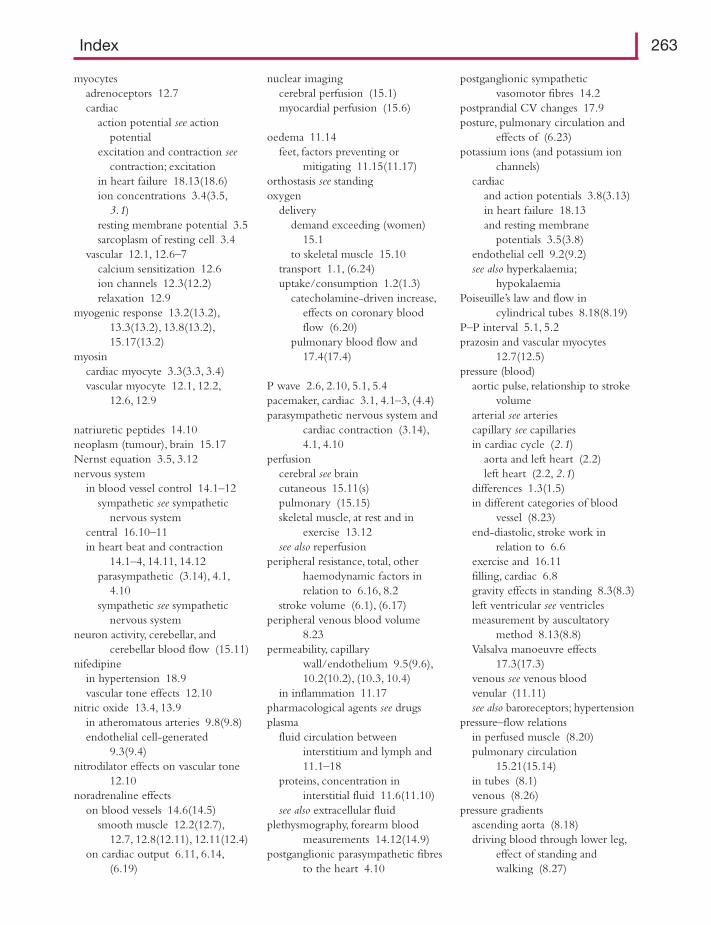
myocytesadrenoceptors 12.7cardiac
action potential see actionpotential
excitation and contraction seecontraction; excitation
in heart failure 18.13(18.6)ion concentrations 3.4(3.5,
3.1)resting membrane potential 3.5sarcoplasm of resting cell 3.4
vascular 12.1, 12.6–7calcium sensitization 12.6ion channels 12.3(12.2)relaxation 12.9
myogenic response 13.2(13.2),13.3(13.2), 13.8(13.2),15.17(13.2)
myosincardiac myocyte 3.3(3.3, 3.4)vascular myocyte 12.1, 12.2,
12.6, 12.9
natriuretic peptides 14.10neoplasm (tumour), brain 15.17Nernst equation 3.5, 3.12nervous system
in blood vessel control 14.1–12sympathetic see sympathetic
nervous systemcentral 16.10–11in heart beat and contraction
14.1–4, 14.11, 14.12parasympathetic (3.14), 4.1,
4.10sympathetic see sympathetic
nervous systemneuron activity, cerebellar, and
cerebellar blood flow (15.11)nifedipine
in hypertension 18.9vascular tone effects 12.10
nitric oxide 13.4, 13.9in atheromatous arteries 9.8(9.8)endothelial cell-generated
9.3(9.4)nitrodilator effects on vascular tone
12.10noradrenaline effects
on blood vessels 14.6(14.5)smooth muscle 12.2(12.7),
12.7, 12.8(12.11), 12.11(12.4)on cardiac output 6.11, 6.14,
(6.19)
nuclear imagingcerebral perfusion (15.1)myocardial perfusion (15.6)
oedema 11.14feet, factors preventing or
mitigating 11.15(11.17)orthostasis see standingoxygen
deliverydemand exceeding (women)
15.1to skeletal muscle 15.10
transport 1.1, (6.24)uptake/consumption 1.2(1.3)
catecholamine-driven increase,effects on coronary bloodflow (6.20)
pulmonary blood flow and17.4(17.4)
P wave 2.6, 2.10, 5.1, 5.4pacemaker, cardiac 3.1, 4.1–3, (4.4)parasympathetic nervous system and
cardiac contraction (3.14),4.1, 4.10
perfusioncerebral see braincutaneous 15.11(s)pulmonary (15.15)skeletal muscle, at rest and in
exercise 13.12see also reperfusion
peripheral resistance, total, otherhaemodynamic factors inrelation to 6.16, 8.2
stroke volume (6.1), (6.17)peripheral venous blood volume
8.23permeability, capillary
wall/endothelium 9.5(9.6),10.2(10.2), (10.3, 10.4)
in inflammation 11.17pharmacological agents see drugsplasma
fluid circulation betweeninterstitium and lymph and11.1–18
proteins, concentration ininterstitial fluid 11.6(11.10)
see also extracellular fluidplethysmography, forearm blood
measurements 14.12(14.9)postganglionic parasympathetic fibres
to the heart 4.10
postganglionic sympatheticvasomotor fibres 14.2
postprandial CV changes 17.9posture, pulmonary circulation and
effects of (6.23)potassium ions (and potassium ion
channels)cardiac
and action potentials 3.8(3.13)in heart failure 18.13and resting membrane
potentials 3.5(3.8)endothelial cell 9.2(9.2)see also hyperkalaemia;
hypokalaemiaPoiseuille’s law and flow in
cylindrical tubes 8.18(8.19)P–P interval 5.1, 5.2prazosin and vascular myocytes
12.7(12.5)pressure (blood)
aortic pulse, relationship to strokevolume
arterial see arteriescapillary see capillariesin cardiac cycle (2.1)
aorta and left heart (2.2)left heart (2.2, 2.1)
differences 1.3(1.5)in different categories of blood
vessel (8.23)end-diastolic, stroke work in
relation to 6.6exercise and 16.11filling, cardiac 6.8gravity effects in standing 8.3(8.3)left ventricular see ventriclesmeasurement by auscultatory
method 8.13(8.8)Valsalva manoeuvre effects
17.3(17.3)venous see venous bloodvenular (11.11)see also baroreceptors; hypertension
pressure–flow relationsin perfused muscle (8.20)pulmonary circulation
15.21(15.14)in tubes (8.1)venous (8.26)
pressure gradientsascending aorta (8.18)driving blood through lower leg,
effect of standing andwalking (8.27)
Index 263
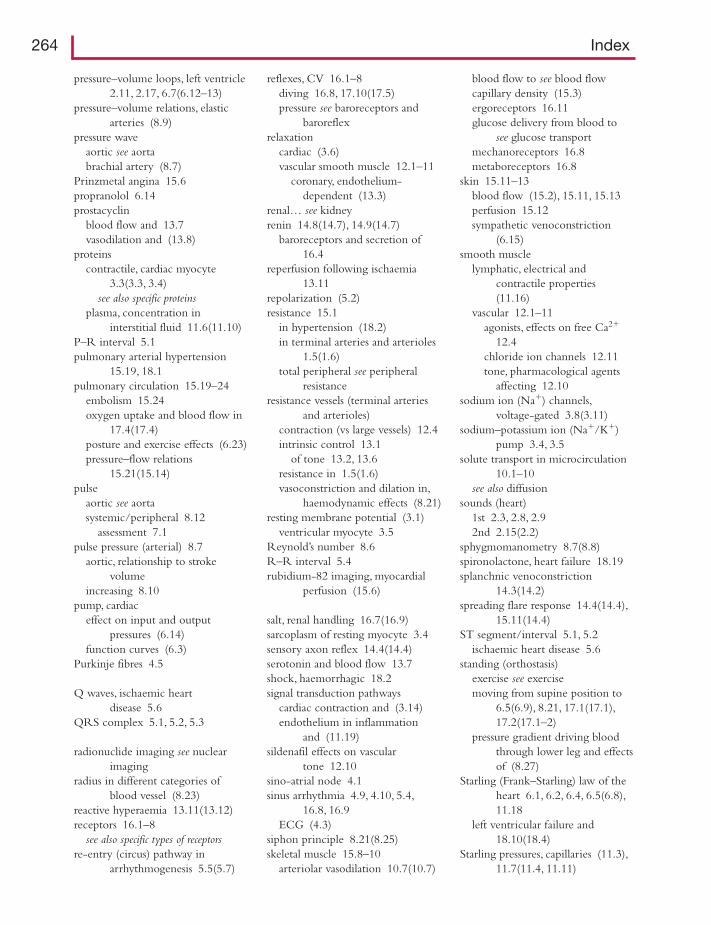
pressure–volume loops, left ventricle2.11, 2.17, 6.7(6.12–13)
pressure–volume relations, elasticarteries (8.9)
pressure waveaortic see aortabrachial artery (8.7)
Prinzmetal angina 15.6propranolol 6.14prostacyclin
blood flow and 13.7vasodilation and (13.8)
proteinscontractile, cardiac myocyte
3.3(3.3, 3.4)see also specific proteins
plasma, concentration ininterstitial fluid 11.6(11.10)
P–R interval 5.1pulmonary arterial hypertension
15.19, 18.1pulmonary circulation 15.19–24
embolism 15.24oxygen uptake and blood flow in
17.4(17.4)posture and exercise effects (6.23)pressure–flow relations
15.21(15.14)pulse
aortic see aortasystemic/peripheral 8.12
assessment 7.1pulse pressure (arterial) 8.7
aortic, relationship to strokevolume
increasing 8.10pump, cardiac
effect on input and outputpressures (6.14)
function curves (6.3)Purkinje fibres 4.5
Q waves, ischaemic heartdisease 5.6
QRS complex 5.1, 5.2, 5.3
radionuclide imaging see nuclearimaging
radius in different categories ofblood vessel (8.23)
reactive hyperaemia 13.11(13.12)receptors 16.1–8
see also specific types of receptorsre-entry (circus) pathway in
arrhythmogenesis 5.5(5.7)
reflexes, CV 16.1–8diving 16.8, 17.10(17.5)pressure see baroreceptors and
baroreflexrelaxation
cardiac (3.6)vascular smooth muscle 12.1–11
coronary, endothelium-dependent (13.3)
renal… see kidneyrenin 14.8(14.7), 14.9(14.7)
baroreceptors and secretion of16.4
reperfusion following ischaemia13.11
repolarization (5.2)resistance 15.1
in hypertension (18.2)in terminal arteries and arterioles
1.5(1.6)total peripheral see peripheral
resistanceresistance vessels (terminal arteries
and arterioles)contraction (vs large vessels) 12.4intrinsic control 13.1
of tone 13.2, 13.6resistance in 1.5(1.6)vasoconstriction and dilation in,
haemodynamic effects (8.21)resting membrane potential (3.1)
ventricular myocyte 3.5Reynold’s number 8.6R–R interval 5.4rubidium-82 imaging, myocardial
perfusion (15.6)
salt, renal handling 16.7(16.9)sarcoplasm of resting myocyte 3.4sensory axon reflex 14.4(14.4)serotonin and blood flow 13.7shock, haemorrhagic 18.2signal transduction pathways
cardiac contraction and (3.14)endothelium in inflammation
and (11.19)sildenafil effects on vascular
tone 12.10sino-atrial node 4.1sinus arrhythmia 4.9, 4.10, 5.4,
16.8, 16.9ECG (4.3)
siphon principle 8.21(8.25)skeletal muscle 15.8–10
arteriolar vasodilation 10.7(10.7)
blood flow to see blood flowcapillary density (15.3)ergoreceptors 16.11glucose delivery from blood to
see glucose transportmechanoreceptors 16.8metaboreceptors 16.8
skin 15.11–13blood flow (15.2), 15.11, 15.13perfusion 15.12sympathetic venoconstriction
(6.15)smooth muscle
lymphatic, electrical andcontractile properties(11.16)
vascular 12.1–11agonists, effects on free Ca2�
12.4chloride ion channels 12.11tone, pharmacological agents
affecting 12.10sodium ion (Na�) channels,
voltage-gated 3.8(3.11)sodium–potassium ion (Na�/K�)
pump 3.4, 3.5solute transport in microcirculation
10.1–10see also diffusion
sounds (heart)1st 2.3, 2.8, 2.92nd 2.15(2.2)
sphygmomanometry 8.7(8.8)spironolactone, heart failure 18.19splanchnic venoconstriction
14.3(14.2)spreading flare response 14.4(14.4),
15.11(14.4)ST segment/interval 5.1, 5.2
ischaemic heart disease 5.6standing (orthostasis)
exercise see exercisemoving from supine position to
6.5(6.9), 8.21, 17.1(17.1),17.2(17.1–2)
pressure gradient driving bloodthrough lower leg and effectsof (8.27)
Starling (Frank–Starling) law of theheart 6.1, 6.2, 6.4, 6.5(6.8),11.18
left ventricular failure and18.10(18.4)
Starling pressures, capillaries (11.3),11.7(11.4, 11.11)
264 Index
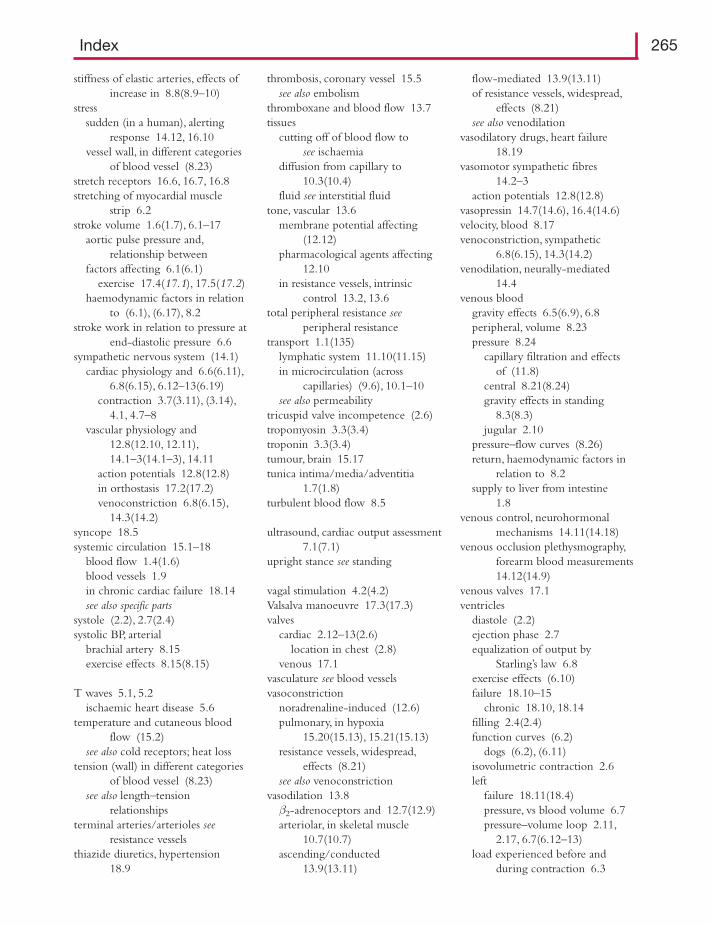
stiffness of elastic arteries, effects ofincrease in 8.8(8.9–10)
stresssudden (in a human), alerting
response 14.12, 16.10vessel wall, in different categories
of blood vessel (8.23)stretch receptors 16.6, 16.7, 16.8stretching of myocardial muscle
strip 6.2stroke volume 1.6(1.7), 6.1–17
aortic pulse pressure and,relationship between
factors affecting 6.1(6.1)exercise 17.4(17.1), 17.5(17.2)
haemodynamic factors in relationto (6.1), (6.17), 8.2
stroke work in relation to pressure atend-diastolic pressure 6.6
sympathetic nervous system (14.1)cardiac physiology and 6.6(6.11),
6.8(6.15), 6.12–13(6.19)contraction 3.7(3.11), (3.14),
4.1, 4.7–8vascular physiology and
12.8(12.10, 12.11),14.1–3(14.1–3), 14.11
action potentials 12.8(12.8)in orthostasis 17.2(17.2)venoconstriction 6.8(6.15),
14.3(14.2)syncope 18.5systemic circulation 15.1–18
blood flow 1.4(1.6)blood vessels 1.9in chronic cardiac failure 18.14see also specific parts
systole (2.2), 2.7(2.4)systolic BP, arterial
brachial artery 8.15exercise effects 8.15(8.15)
T waves 5.1, 5.2ischaemic heart disease 5.6
temperature and cutaneous bloodflow (15.2)
see also cold receptors; heat losstension (wall) in different categories
of blood vessel (8.23)see also length–tension
relationshipsterminal arteries/arterioles see
resistance vesselsthiazide diuretics, hypertension
18.9
thrombosis, coronary vessel 15.5see also embolism
thromboxane and blood flow 13.7tissues
cutting off of blood flow to see ischaemia
diffusion from capillary to10.3(10.4)
fluid see interstitial fluidtone, vascular 13.6
membrane potential affecting(12.12)
pharmacological agents affecting12.10
in resistance vessels, intrinsiccontrol 13.2, 13.6
total peripheral resistance seeperipheral resistance
transport 1.1(135)lymphatic system 11.10(11.15)in microcirculation (across
capillaries) (9.6), 10.1–10see also permeability
tricuspid valve incompetence (2.6)tropomyosin 3.3(3.4)troponin 3.3(3.4)tumour, brain 15.17tunica intima/media/adventitia
1.7(1.8)turbulent blood flow 8.5
ultrasound, cardiac output assessment7.1(7.1)
upright stance see standing
vagal stimulation 4.2(4.2)Valsalva manoeuvre 17.3(17.3)valves
cardiac 2.12–13(2.6)location in chest (2.8)
venous 17.1vasculature see blood vesselsvasoconstriction
noradrenaline-induced (12.6)pulmonary, in hypoxia
15.20(15.13), 15.21(15.13)resistance vessels, widespread,
effects (8.21)see also venoconstriction
vasodilation 13.8β2-adrenoceptors and 12.7(12.9)arteriolar, in skeletal muscle
10.7(10.7)ascending/conducted
13.9(13.11)
flow-mediated 13.9(13.11)of resistance vessels, widespread,
effects (8.21)see also venodilation
vasodilatory drugs, heart failure18.19
vasomotor sympathetic fibres14.2–3
action potentials 12.8(12.8)vasopressin 14.7(14.6), 16.4(14.6)velocity, blood 8.17venoconstriction, sympathetic
6.8(6.15), 14.3(14.2)venodilation, neurally-mediated
14.4venous blood
gravity effects 6.5(6.9), 6.8peripheral, volume 8.23pressure 8.24
capillary filtration and effects of (11.8)
central 8.21(8.24)gravity effects in standing
8.3(8.3)jugular 2.10
pressure–flow curves (8.26)return, haemodynamic factors in
relation to 8.2supply to liver from intestine
1.8venous control, neurohormonal
mechanisms 14.11(14.18)venous occlusion plethysmography,
forearm blood measurements14.12(14.9)
venous valves 17.1ventricles
diastole (2.2)ejection phase 2.7equalization of output by
Starling’s law 6.8exercise effects (6.10)failure 18.10–15
chronic 18.10, 18.14filling 2.4(2.4)function curves (6.2)
dogs (6.2), (6.11)isovolumetric contraction 2.6left
failure 18.11(18.4)pressure, vs blood volume 6.7pressure–volume loop 2.11,
2.17, 6.7(6.12–13)load experienced before and
during contraction 6.3
Index 265
ventricles (continued )myocytes 3.2
action potential 3.6, 3.7excitation 3.8resting membrane potential
3.5right
in cardiac cycle 2.5failure 18.12
systole (2.2)venular blood pressure (11.11)viscosity of blood 8.14(8.13),
8.18(8.17), 8.19anomalous (8.5)
volume (blood)in aorta and left heart during
cardiac cycle (2.2)in left ventricle in relation to LV
pressure 6.7peripheral veins 8.23see also hypovolaemia;
pressure–volume loop; strokevolume
walkingblood flow from proximal aorta to
dorsalis pedis artery of footduring 8.3
pressure gradient driving bloodthrough lower leg andeffects of (8.27)
walls of blood vessels 1.7capillary see capillariesstress and tension in different
categories of blood vessel(8.23)
see also endothelial cellswater, renal handling 16.7(16.9)work receptors, muscle 16.11
xenon-133 imaging of cerebralperfusion (15.1)
266 Index
Related Documents


