CARDIOVASCULAR PHYSIOLOGY Lecture 2 Electrocardiogram (ECG) Dr. Ana-Maria Zagrean

Welcome message from author
This document is posted to help you gain knowledge. Please leave a comment to let me know what you think about it! Share it to your friends and learn new things together.
Transcript
CARDIOVASCULAR PHYSIOLOGY
Lecture 2 Electrocardiogram (ECG)
Dr. Ana-Maria Zagrean
Electrocardiogram (ECG)
ECG is a non-invasive method to record time-dependent electrical
vectors of the heart representing the sum of the extracellular signals
produced by the movement of action potentials through cardiac
myocytes, using electrodes attached to the skin.
ECG detects the dynamic of electro-mechanic events
- the rate and regularity of heartbeats,
- the size and position of the chambers,
- the presence of any damage to the heart,
- the effects of drugs, ionic changes etc.
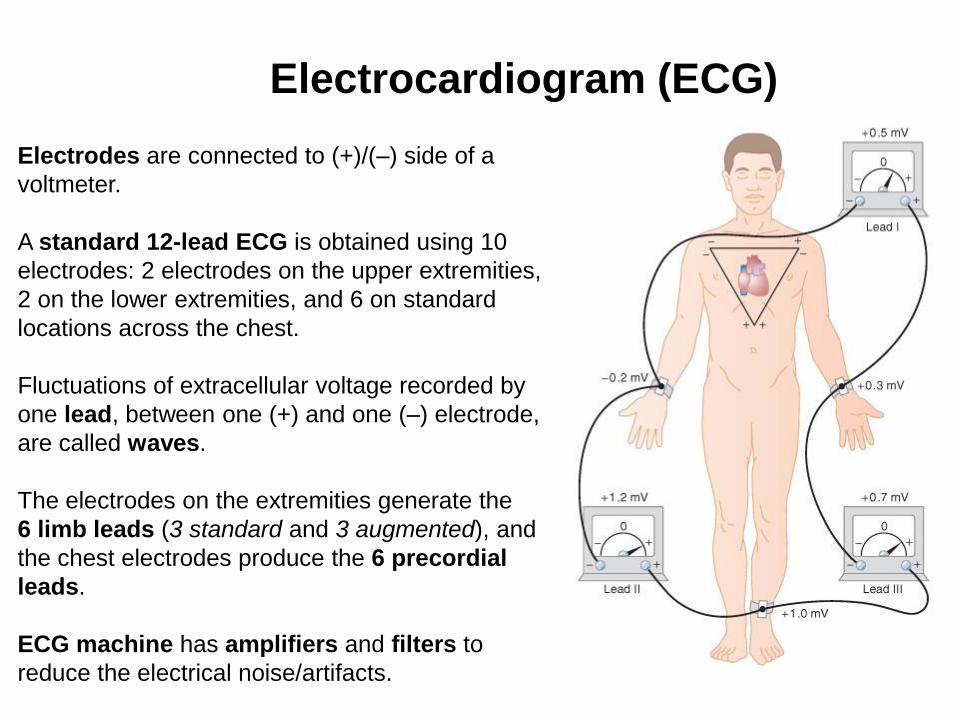
Electrodes are connected to (+)/(–) side of a
voltmeter.
A standard 12-lead ECG is obtained using 10
electrodes: 2 electrodes on the upper extremities,
2 on the lower extremities, and 6 on standard
locations across the chest.
Fluctuations of extracellular voltage recorded by
one lead, between one (+) and one (–) electrode,
are called waves.
The electrodes on the extremities generate the
6 limb leads (3 standard and 3 augmented), and
the chest electrodes produce the 6 precordial
leads.
ECG machine has amplifiers and filters to
reduce the electrical noise/artifacts.
Electrocardiogram (ECG)
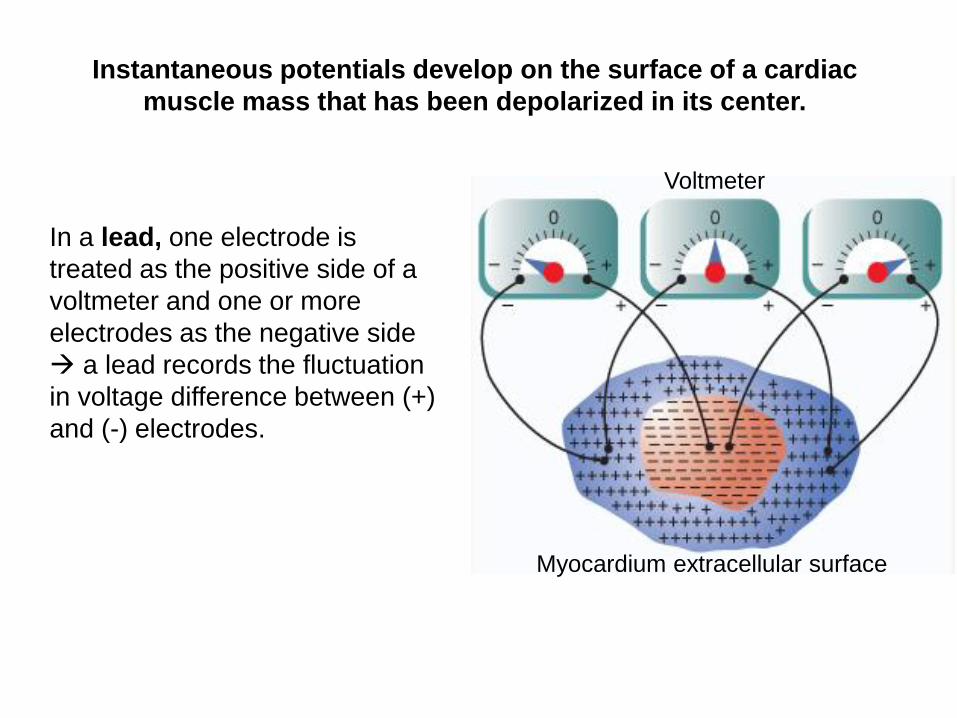
Instantaneous potentials develop on the surface of a cardiac
muscle mass that has been depolarized in its center.
Voltmeter
Myocardium extracellular surface
In a lead, one electrode is
treated as the positive side of a
voltmeter and one or more
electrodes as the negative side
→ a lead records the fluctuation
in voltage difference between (+)
and (-) electrodes.
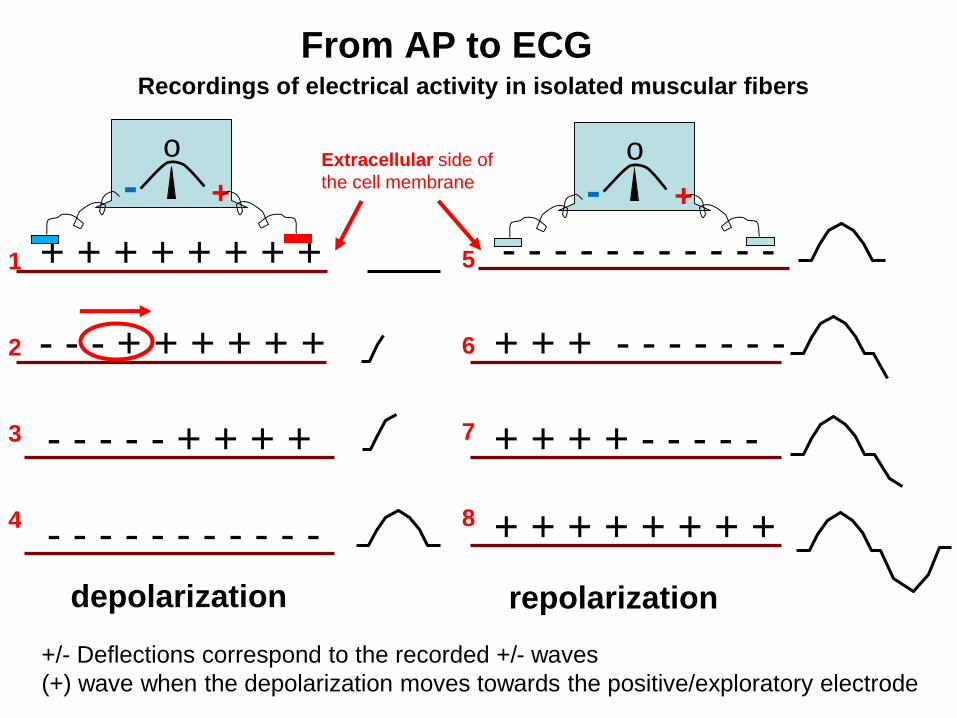
From AP to ECG
+ + + + + + + +
-o
+
- - - + + + + + +
- - - - - + + + +
- - - - - - - - - - -
depolarization
-o
+
- - - - - - - - - - -
+ + + - - - - - - -
+ + + + - - - - -
repolarization
+ + + + + + + +
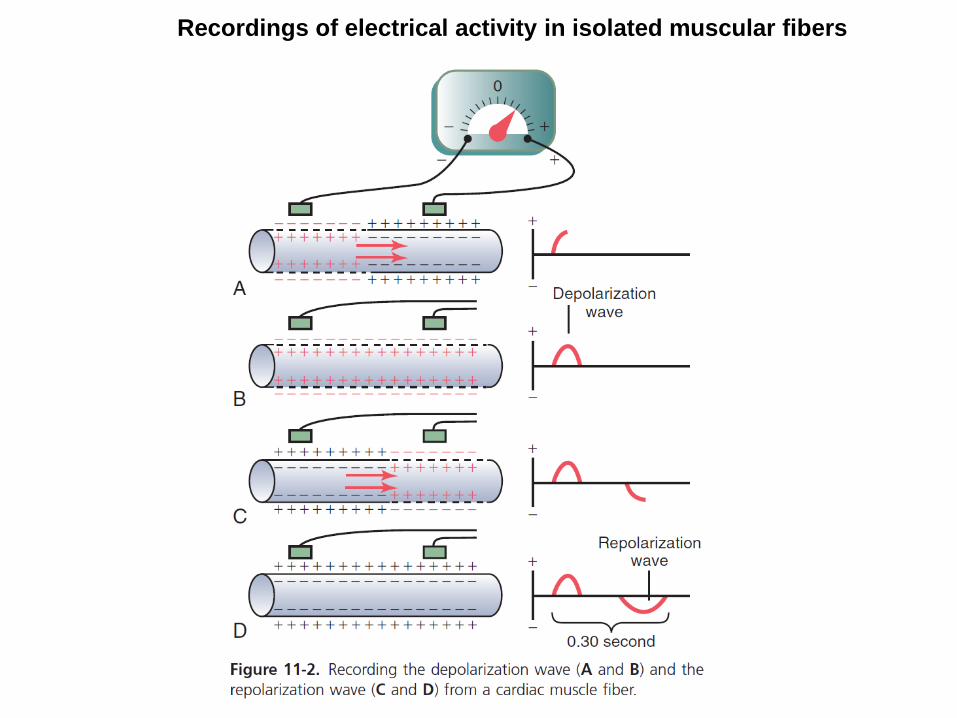
Recordings of electrical activity in isolated muscular fibers
+/- Deflections correspond to the recorded +/- waves
(+) wave when the depolarization moves towards the positive/exploratory electrode
Extracellular side of
the cell membrane
1
2
3
4
5
6
7
8
Recordings of electrical activity in isolated muscular fibers
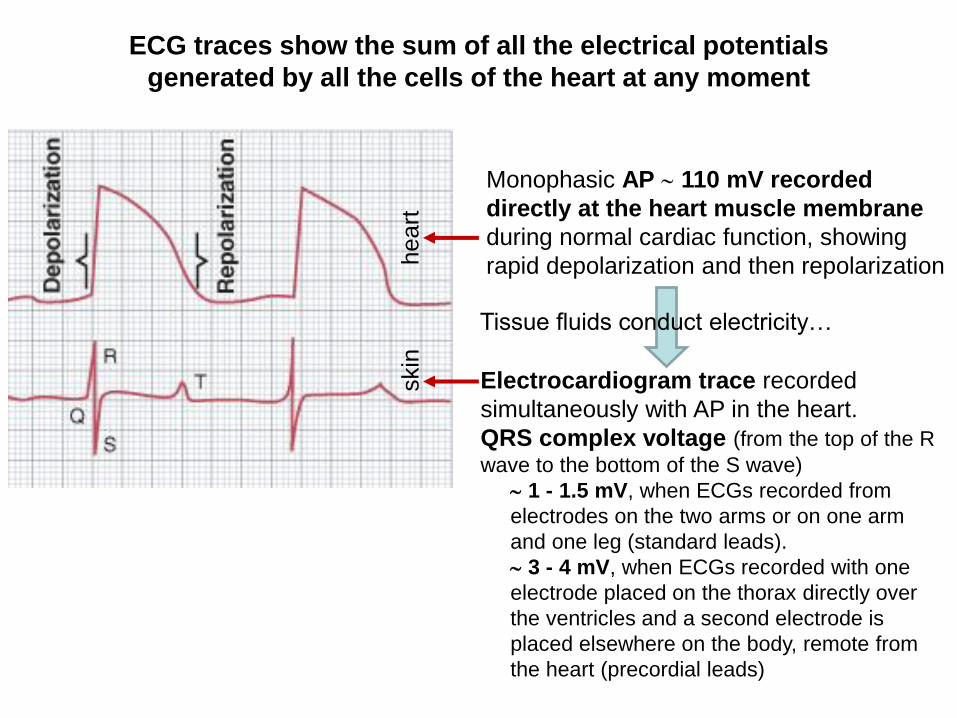
Electrocardiogram trace recorded
simultaneously with AP in the heart.
QRS complex voltage (from the top of the R
wave to the bottom of the S wave)
1 - 1.5 mV, when ECGs recorded from
electrodes on the two arms or on one arm
and one leg (standard leads).
3 - 4 mV, when ECGs recorded with one
electrode placed on the thorax directly over
the ventricles and a second electrode is
placed elsewhere on the body, remote from
the heart (precordial leads)
Monophasic AP 110 mV recorded
directly at the heart muscle membrane
during normal cardiac function, showing
rapid depolarization and then repolarization
ECG traces show the sum of all the electrical potentials
generated by all the cells of the heart at any moment
Tissue fluids conduct electricity…
heart
skin
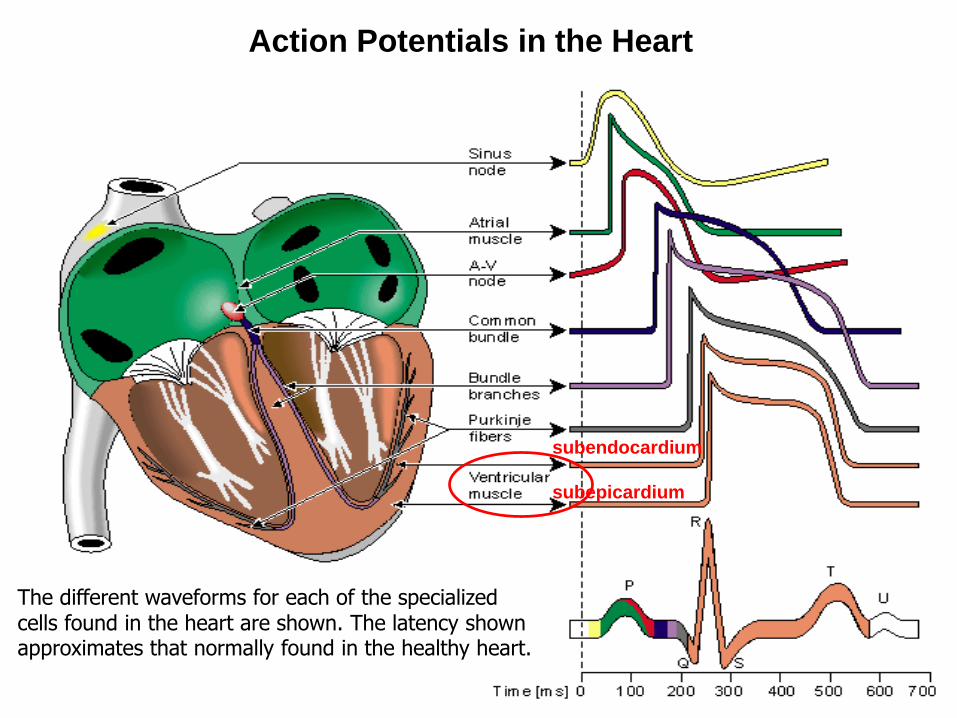
The different waveforms for each of the specialized cells found in the heart are shown. The latency shown approximates that normally found in the healthy heart.
Action Potentials in the Heart
subendocardium
subepicardium
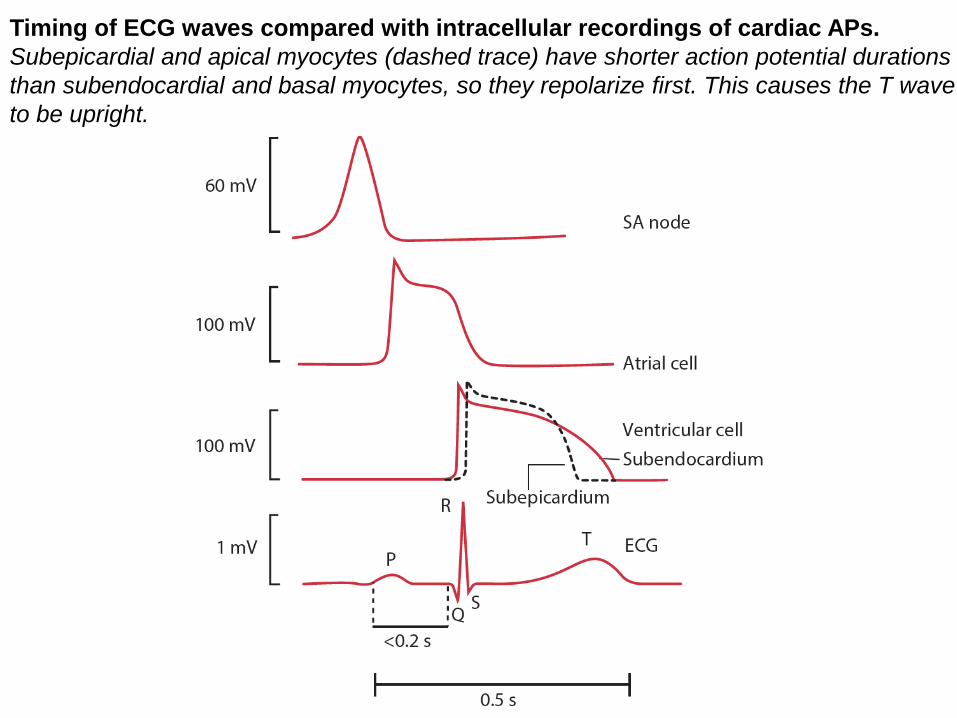
Timing of ECG waves compared with intracellular recordings of cardiac APs.
Subepicardial and apical myocytes (dashed trace) have shorter action potential durations
than subendocardial and basal myocytes, so they repolarize first. This causes the T wave
to be upright.
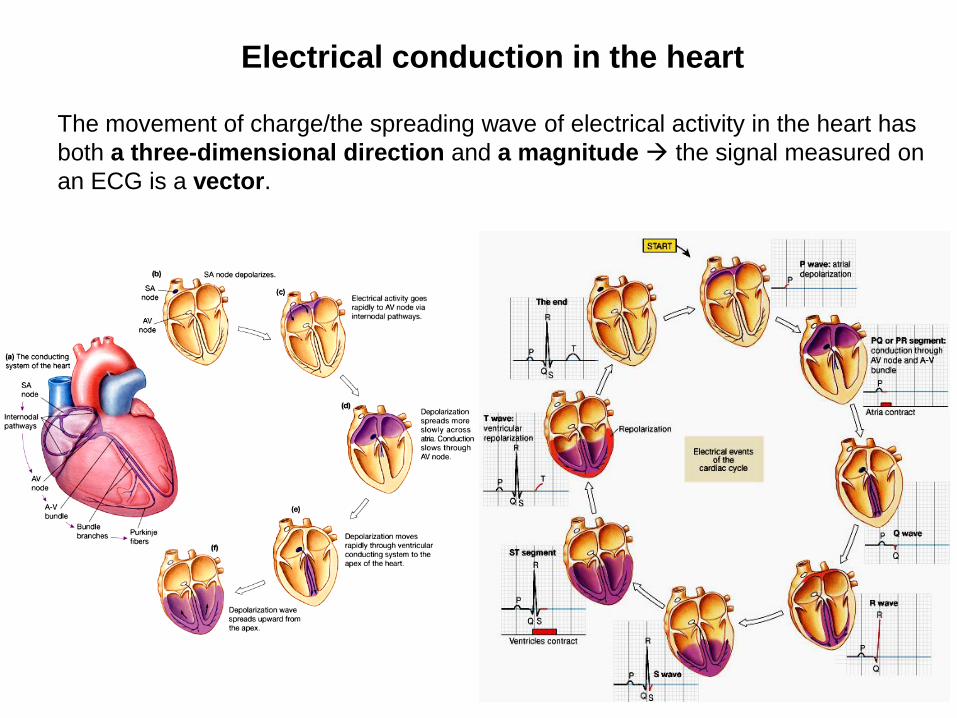
Electrical conduction in the heart
The movement of charge/the spreading wave of electrical activity in the heart has
both a three-dimensional direction and a magnitude → the signal measured on
an ECG is a vector.
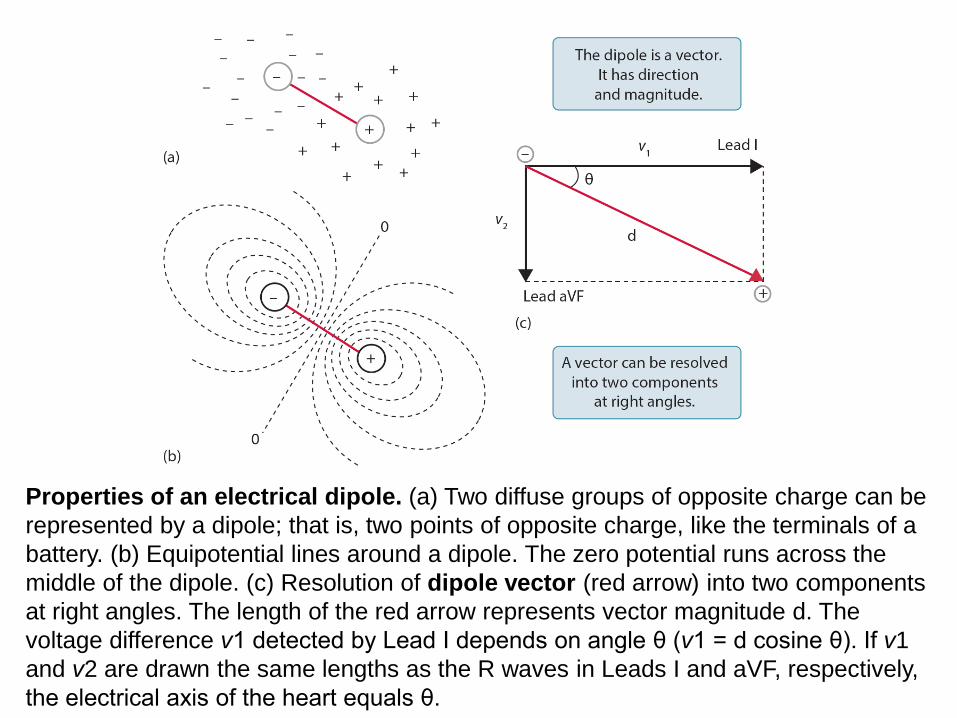
Properties of an electrical dipole. (a) Two diffuse groups of opposite charge can be
represented by a dipole; that is, two points of opposite charge, like the terminals of a
battery. (b) Equipotential lines around a dipole. The zero potential runs across the
middle of the dipole. (c) Resolution of dipole vector (red arrow) into two components
at right angles. The length of the red arrow represents vector magnitude d. The
voltage difference v1 detected by Lead I depends on angle θ (v1 = d cosine θ). If v1
and v2 are drawn the same lengths as the R waves in Leads I and aVF, respectively,
the electrical axis of the heart equals θ.
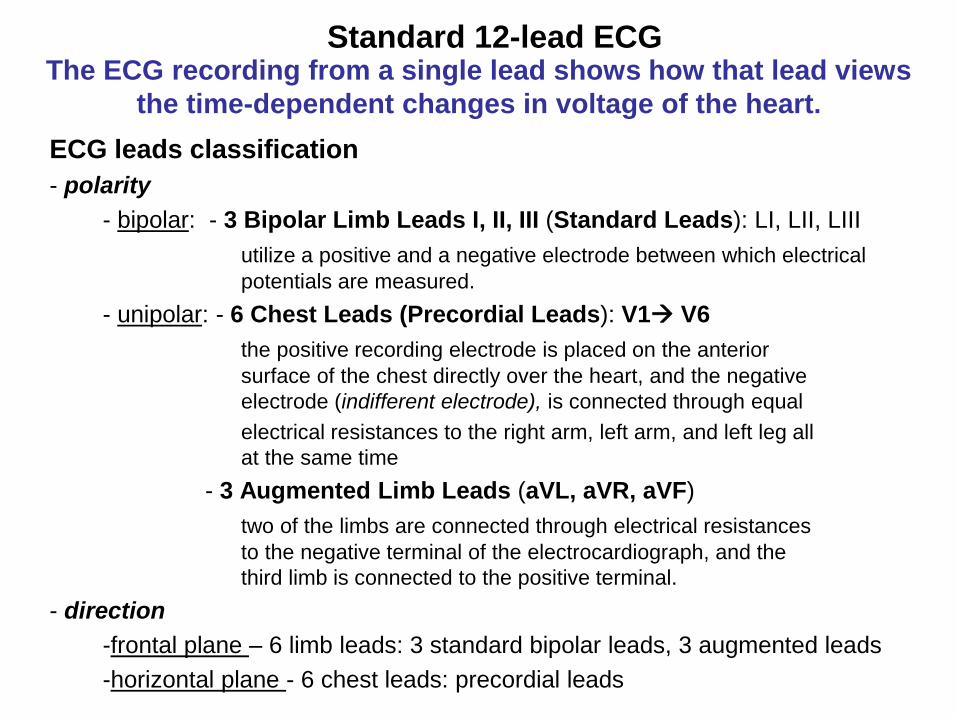
Standard 12-lead ECG
ECG leads classification
- polarity
- bipolar: - 3 Bipolar Limb Leads I, II, III (Standard Leads): LI, LII, LIII
utilize a positive and a negative electrode between which electrical
potentials are measured.
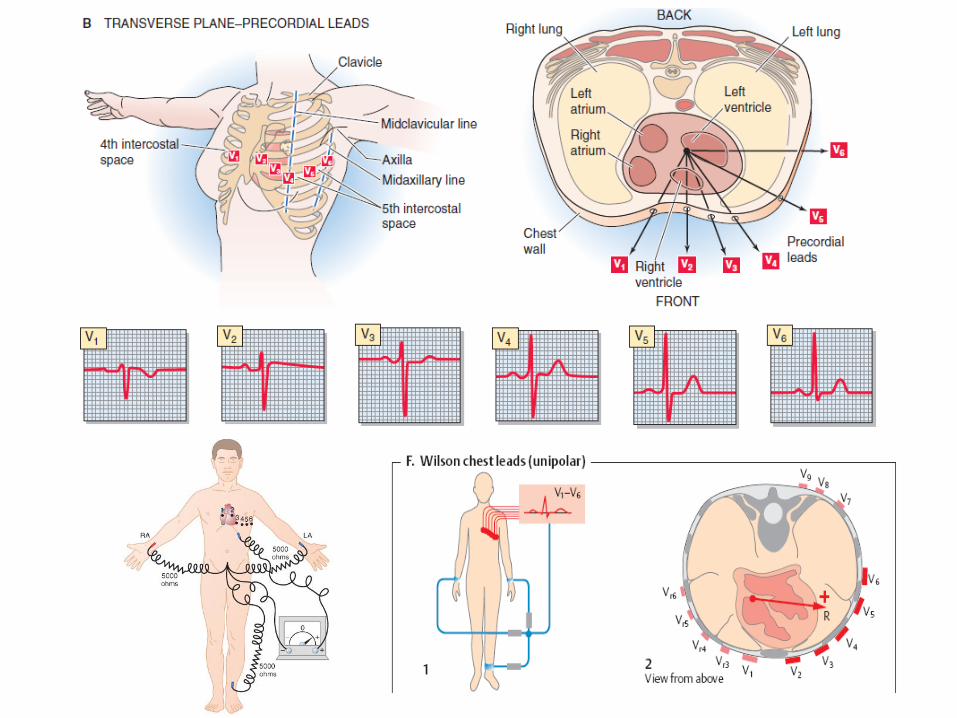
- unipolar: - 6 Chest Leads (Precordial Leads): V1→ V6
the positive recording electrode is placed on the anterior
surface of the chest directly over the heart, and the negative
electrode (indifferent electrode), is connected through equal
electrical resistances to the right arm, left arm, and left leg all
at the same time
- 3 Augmented Limb Leads (aVL, aVR, aVF)
two of the limbs are connected through electrical resistances
to the negative terminal of the electrocardiograph, and the
third limb is connected to the positive terminal.
- direction
-frontal plane – 6 limb leads: 3 standard bipolar leads, 3 augmented leads
-horizontal plane - 6 chest leads: precordial leads
The ECG recording from a single lead shows how that lead views
the time-dependent changes in voltage of the heart.
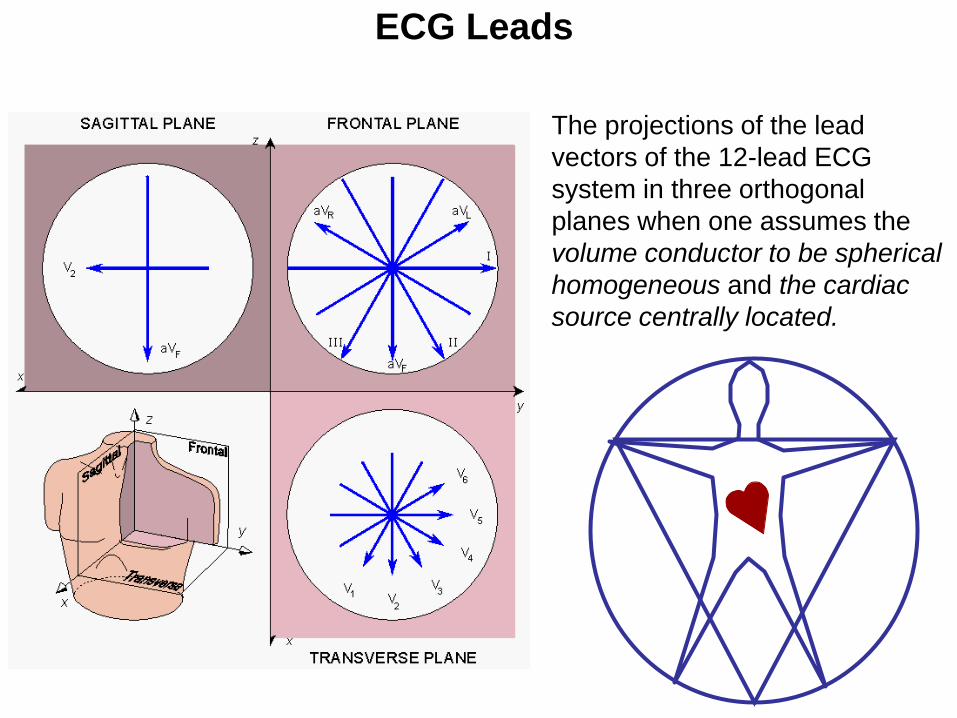
The projections of the lead
vectors of the 12-lead ECG
system in three orthogonal
planes when one assumes the
volume conductor to be spherical
homogeneous and the cardiac
source centrally located.
ECG Leads

Conventions / Rules, for recording and interpreting an ECG
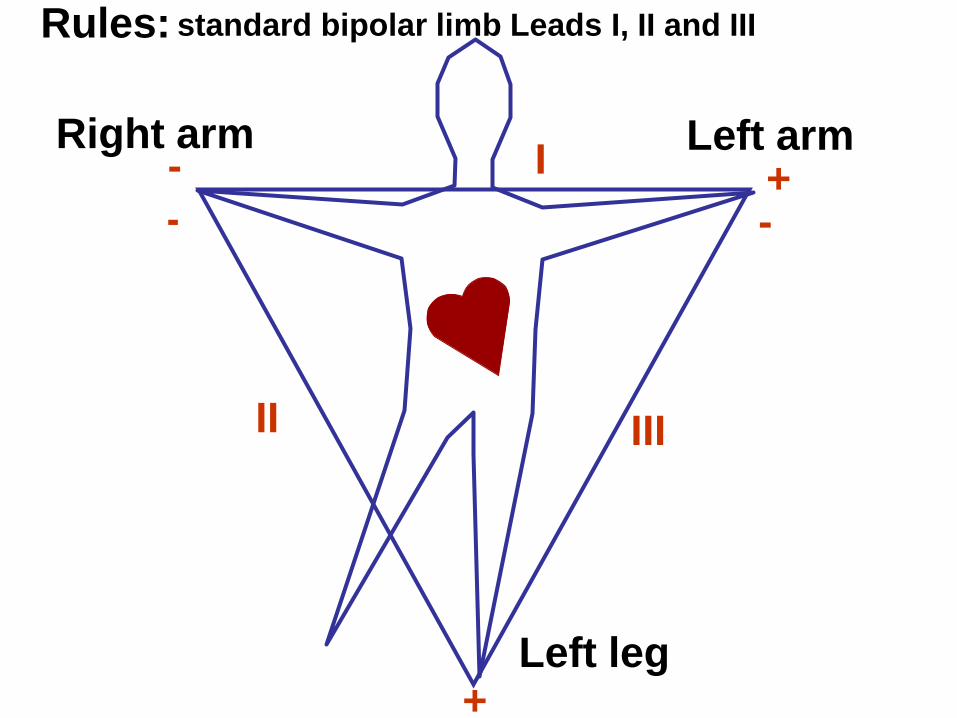
Rules:
Left leg
II
+
Right arm Left arm+I-
III
-
standard bipolar limb Leads I, II and III
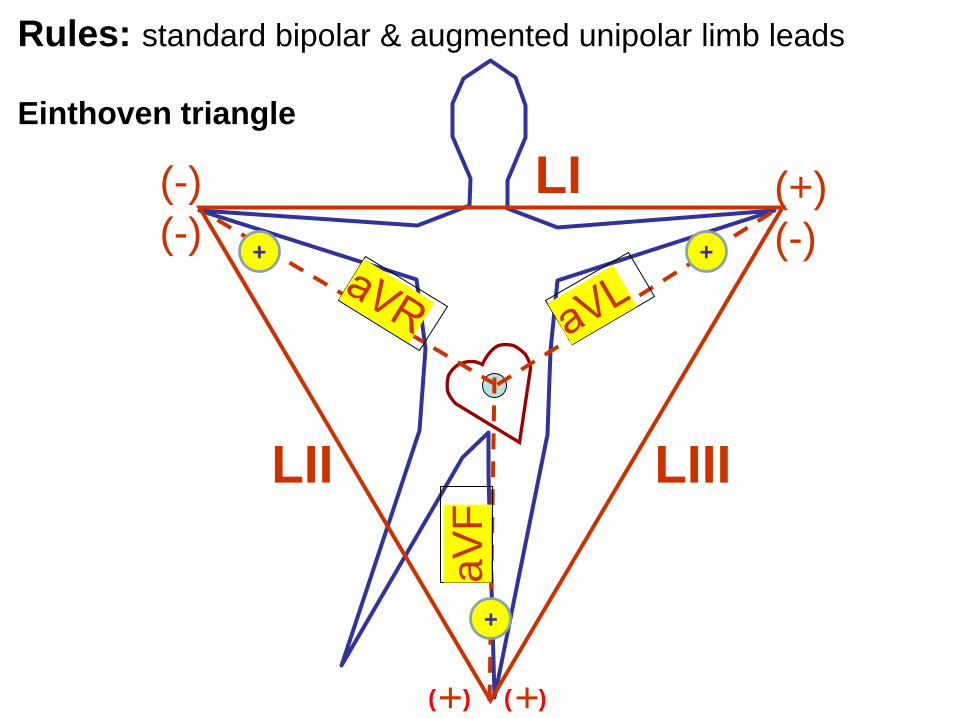
Rules: standard bipolar & augmented unipolar limb leads
Einthoven triangle
LI(-)
(-)(+)
(-)
LII LIII+ +
aV
F
+
+
+
( ) ( )
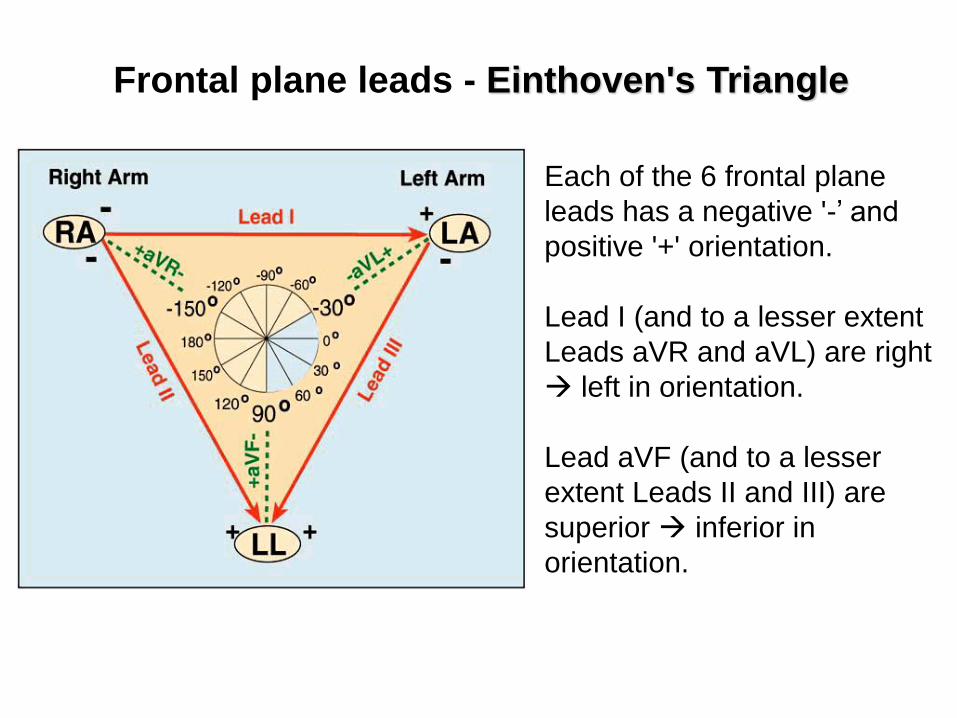
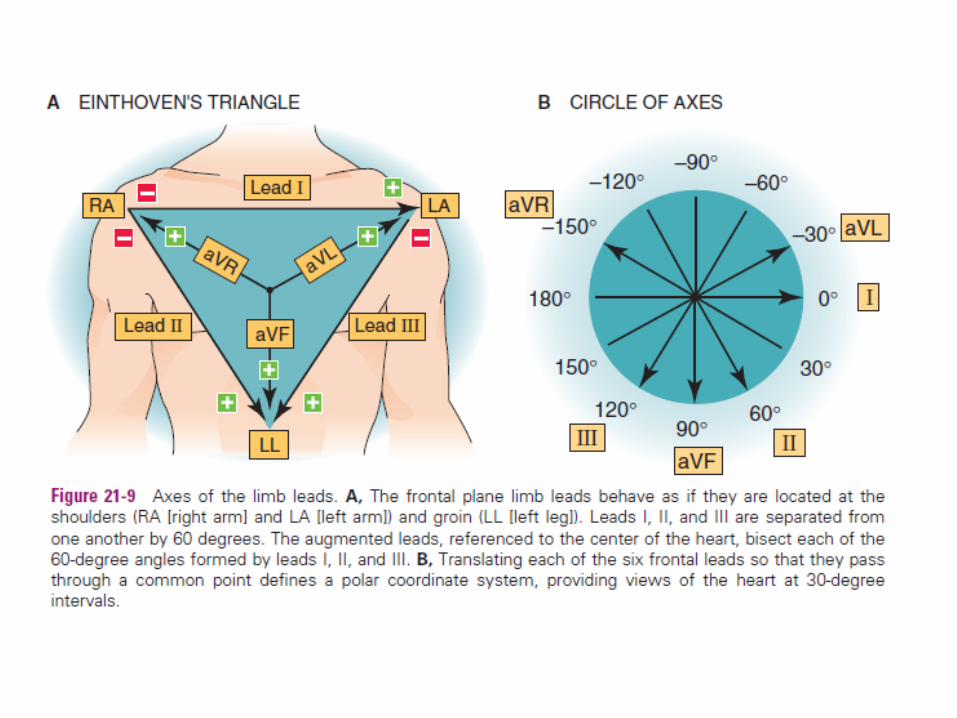
Each of the 6 frontal plane
leads has a negative '-’ and
positive '+' orientation.
Lead I (and to a lesser extent
Leads aVR and aVL) are right
→ left in orientation.
Lead aVF (and to a lesser
extent Leads II and III) are
superior → inferior in
orientation.
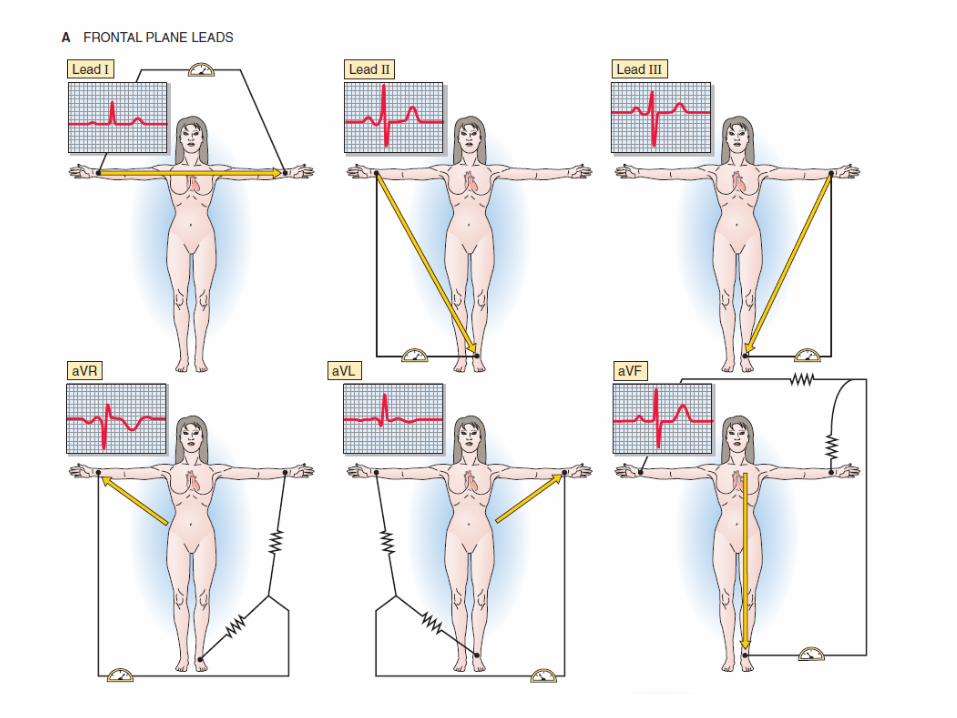
Frontal plane leads - Einthoven's Triangle
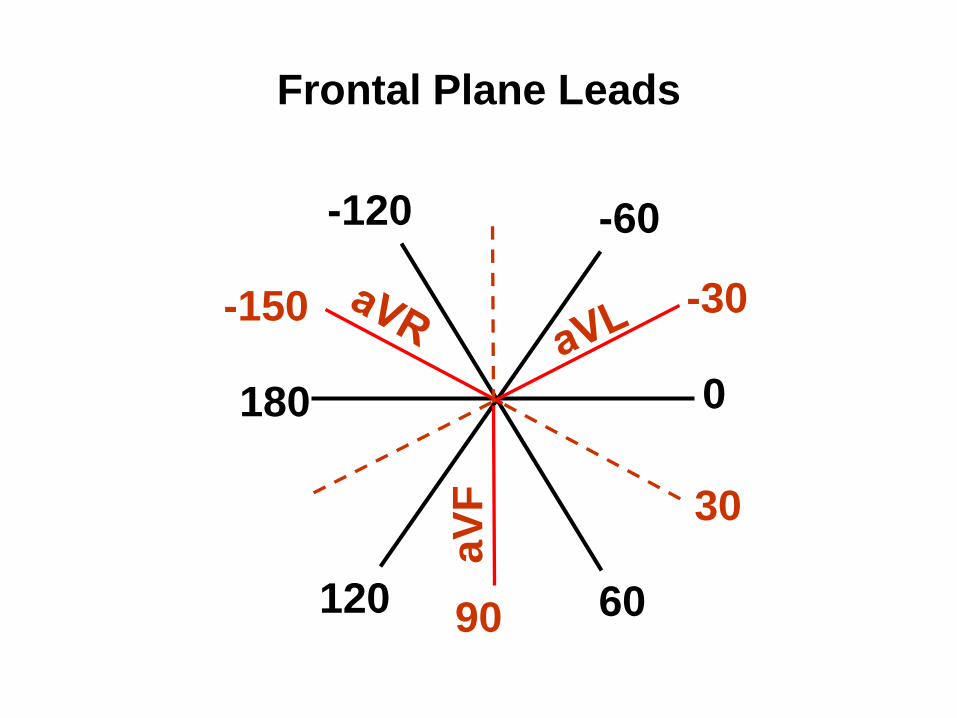
Frontal Plane Leads
0
-120
180
-60
120 60
-150
30
-30
90
aV
F
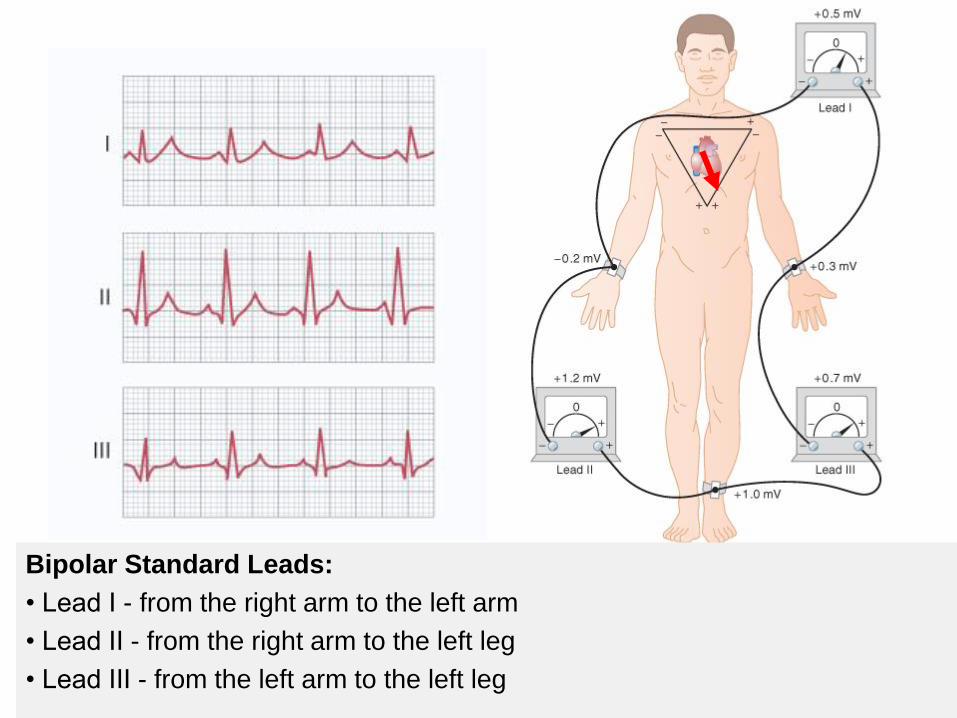
Bipolar Standard Leads:
• Lead I - from the right arm to the left arm
• Lead II - from the right arm to the left leg
• Lead III - from the left arm to the left leg
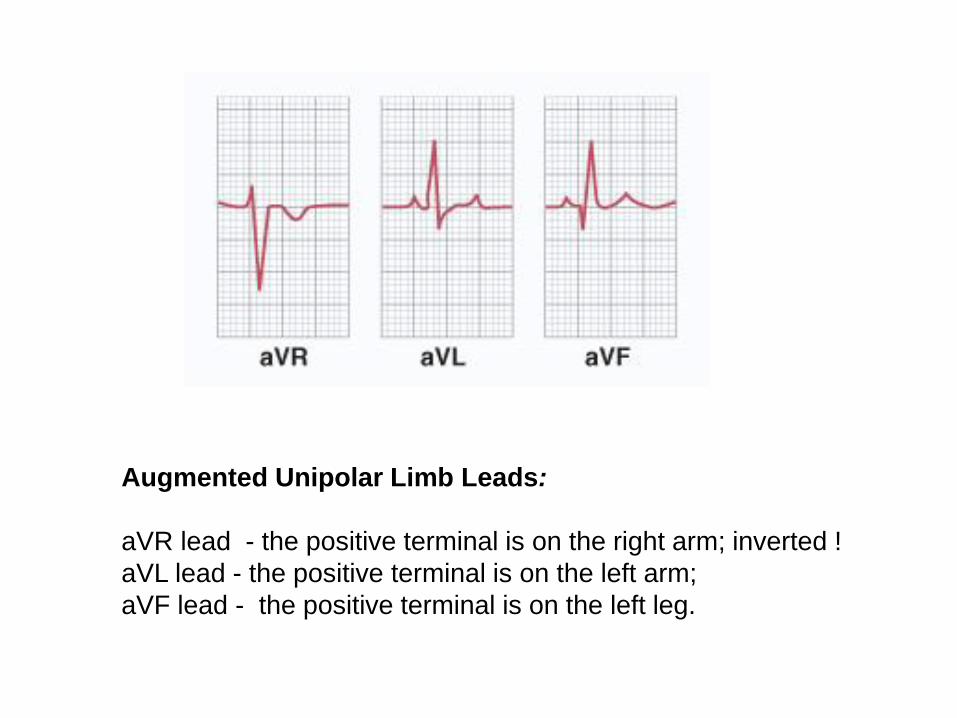
Augmented Unipolar Limb Leads:
aVR lead - the positive terminal is on the right arm; inverted !
aVL lead - the positive terminal is on the left arm;
aVF lead - the positive terminal is on the left leg.
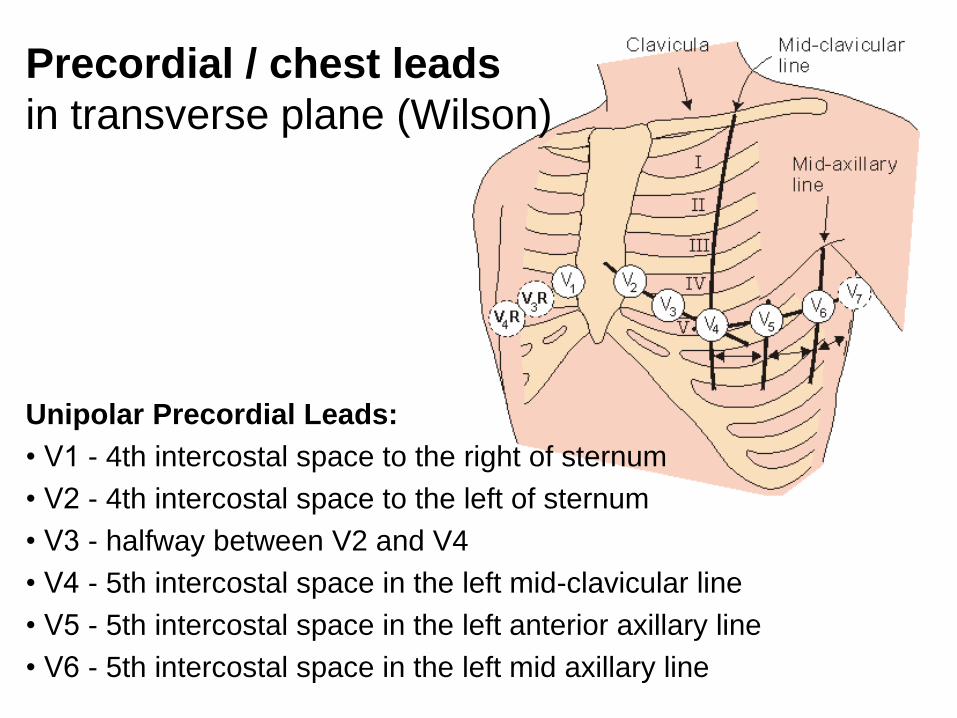
Precordial / chest leads
in transverse plane (Wilson)
Unipolar Precordial Leads:
• V1 - 4th intercostal space to the right of sternum
• V2 - 4th intercostal space to the left of sternum
• V3 - halfway between V2 and V4
• V4 - 5th intercostal space in the left mid-clavicular line
• V5 - 5th intercostal space in the left anterior axillary line
• V6 - 5th intercostal space in the left mid axillary line

When the wave of depolarization moves toward the positive lead, there is a positive deflection in the extracellular voltage difference.
When a lead is perpendicular to
the wave of depolarization, the
measured deflection on that lead
is isoelectric.
When the wave of depolarization
moves away from the positive
electrode, a negative deflection is
recorded.
Two-cell model of the ECG demonstrates that the wave of depolarization
behaves like a vector, with both magnitude and direction
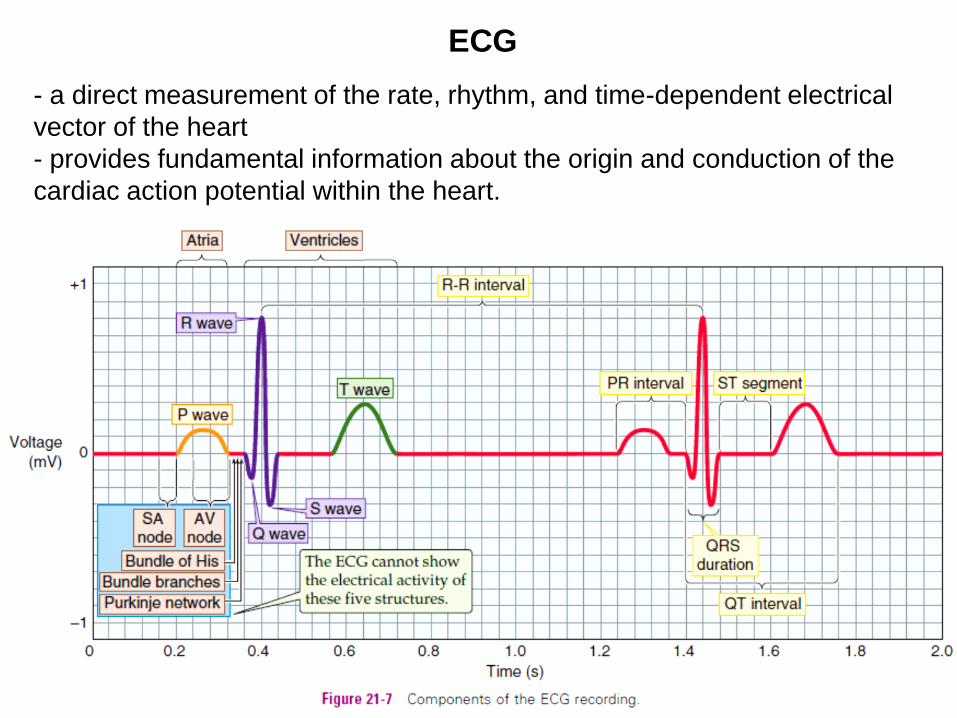
ECG
- a direct measurement of the rate, rhythm, and time-dependent electrical
vector of the heart
- provides fundamental information about the origin and conduction of the
cardiac action potential within the heart.
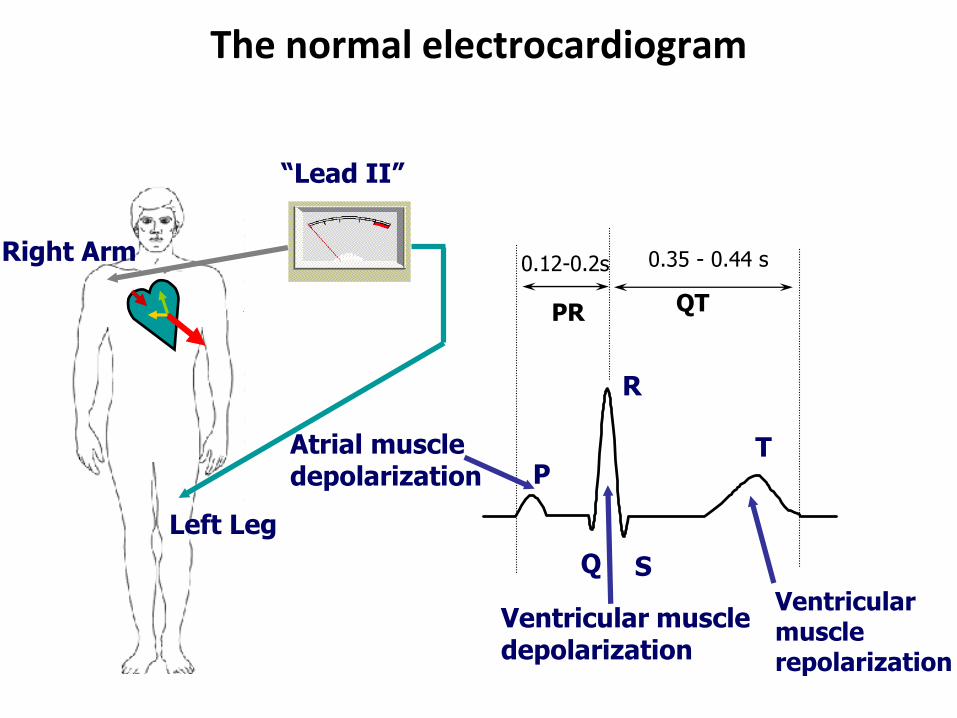
The normal electrocardiogram
P
Q
R
S
T
Right Arm
Left Leg
QTPR
0.12-0.2s 0.35 - 0.44 s
Atrial muscledepolarization
Ventricular muscledepolarization
Ventricularmusclerepolarization
“Lead II”
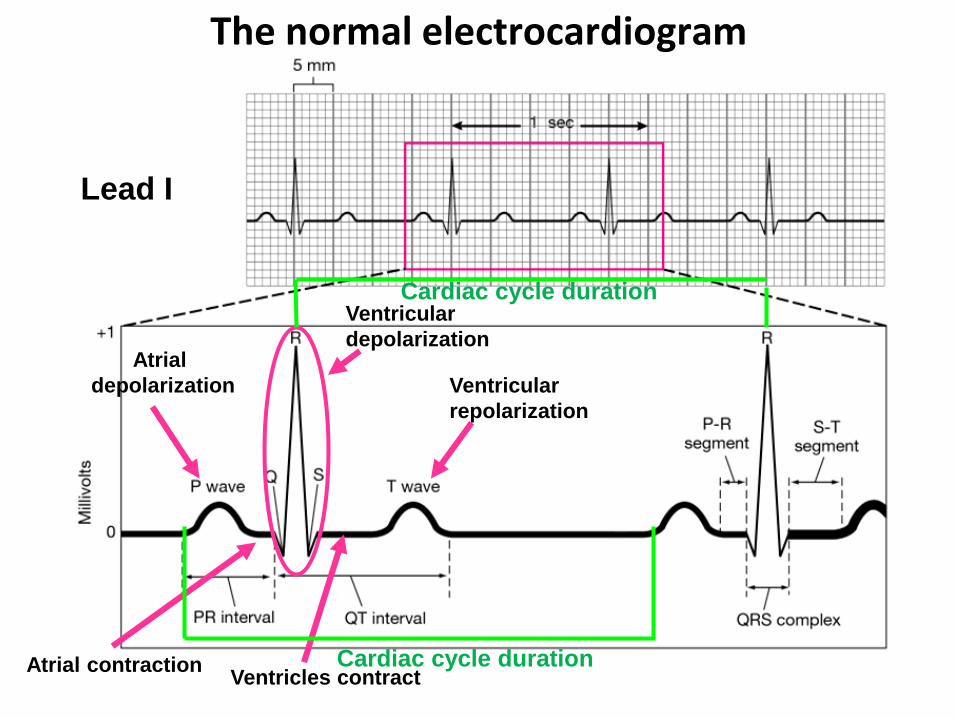
Atrial
depolarization
Atrial contraction
Ventricular
depolarization
Ventricles contract
Ventricular
repolarization
Lead I
Cardiac cycle duration
Cardiac cycle duration
The normal electrocardiogram
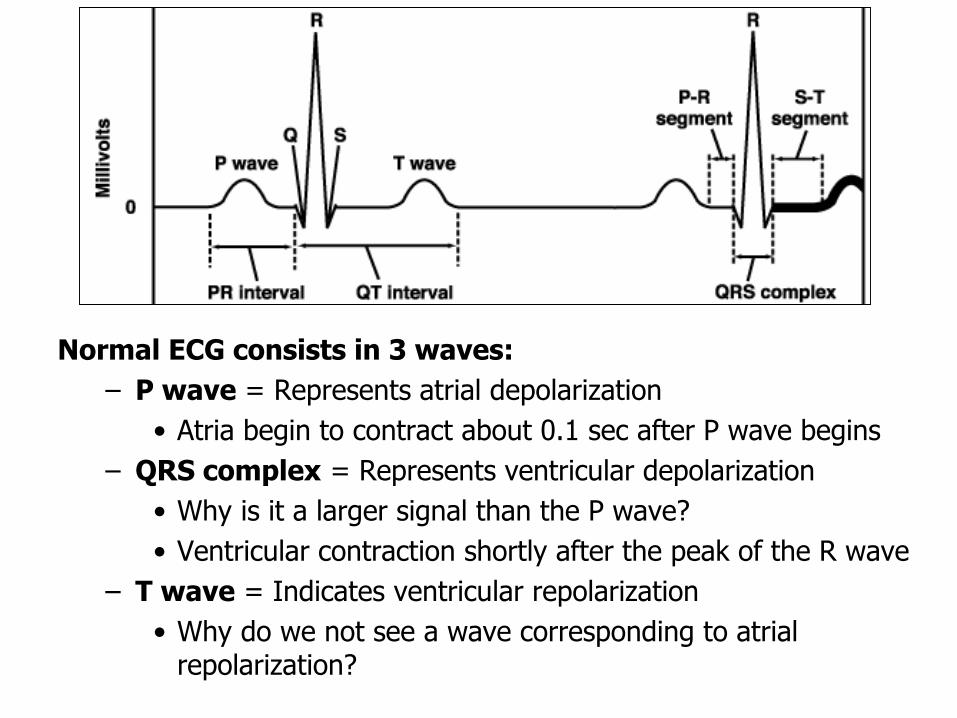
Normal ECG consists in 3 waves:
– P wave = Represents atrial depolarization
• Atria begin to contract about 0.1 sec after P wave begins
– QRS complex = Represents ventricular depolarization
• Why is it a larger signal than the P wave?
• Ventricular contraction shortly after the peak of the R wave
– T wave = Indicates ventricular repolarization
• Why do we not see a wave corresponding to atrial repolarization?
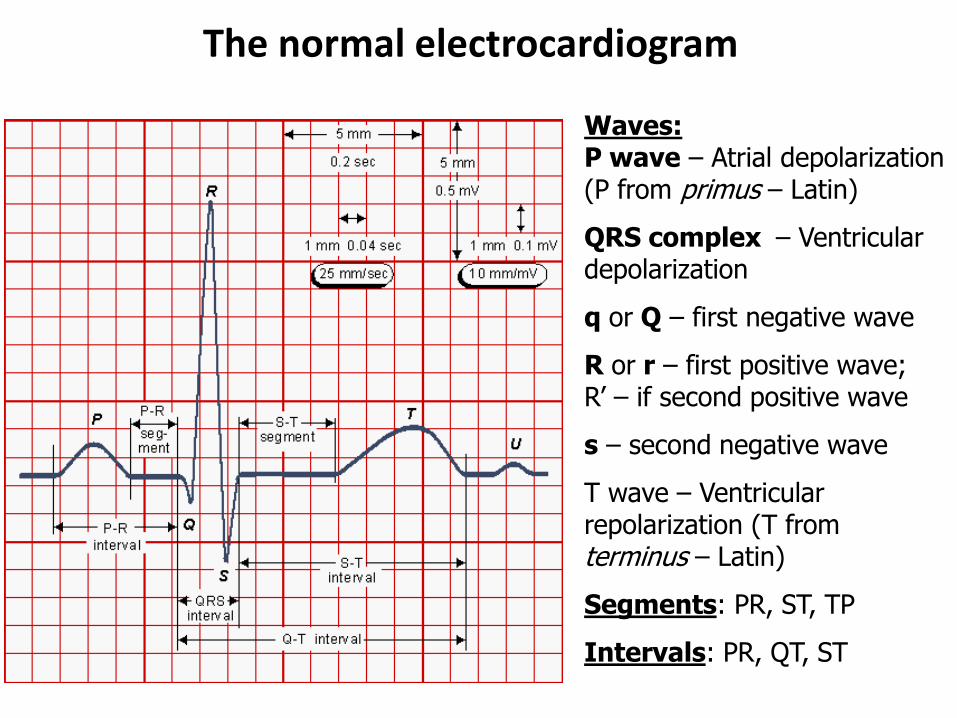
The normal electrocardiogram
Waves:P wave – Atrial depolarization(P from primus – Latin)
QRS complex – Ventricular depolarization
q or Q – first negative wave
R or r – first positive wave; R’ – if second positive wave
s – second negative wave
T wave – Ventricular repolarization (T from terminus – Latin)
Segments: PR, ST, TP
Intervals: PR, QT, ST
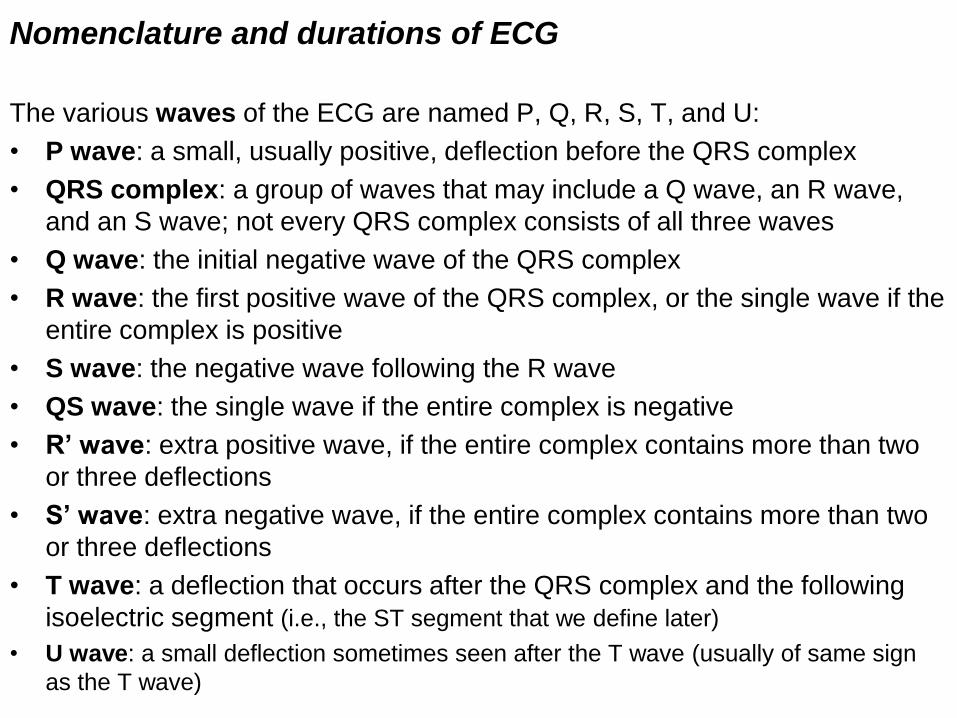
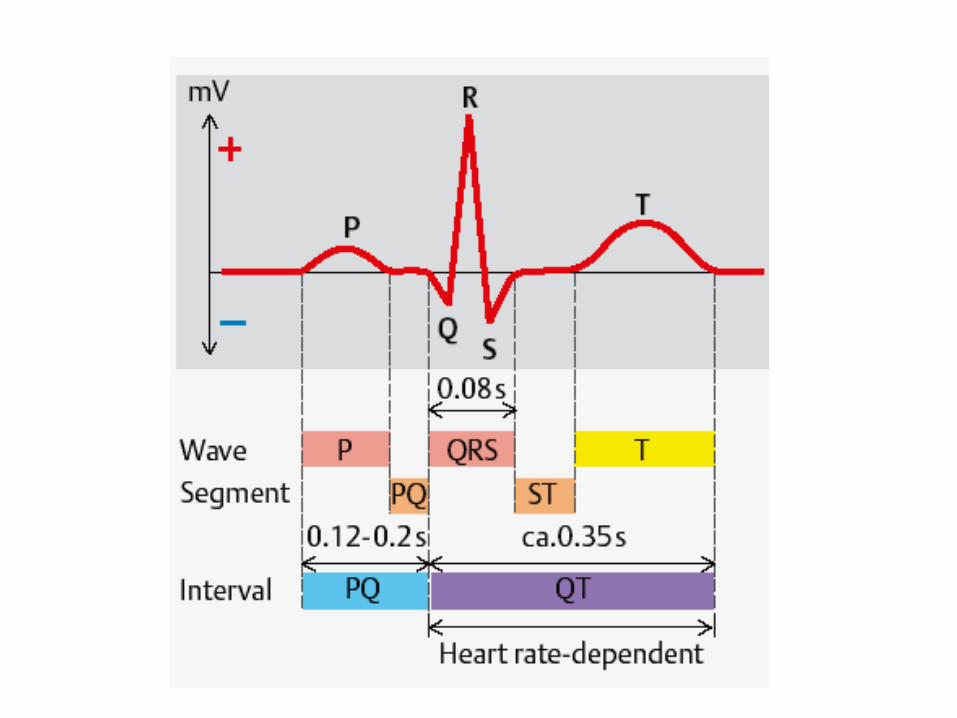
Nomenclature and durations of ECG
The various waves of the ECG are named P, Q, R, S, T, and U:
• P wave: a small, usually positive, deflection before the QRS complex
• QRS complex: a group of waves that may include a Q wave, an R wave,
and an S wave; not every QRS complex consists of all three waves
• Q wave: the initial negative wave of the QRS complex
• R wave: the first positive wave of the QRS complex, or the single wave if the
entire complex is positive
• S wave: the negative wave following the R wave
• QS wave: the single wave if the entire complex is negative
• R’ wave: extra positive wave, if the entire complex contains more than two
or three deflections
• S’ wave: extra negative wave, if the entire complex contains more than two
or three deflections
• T wave: a deflection that occurs after the QRS complex and the following
isoelectric segment (i.e., the ST segment that we define later)
• U wave: a small deflection sometimes seen after the T wave (usually of same sign
as the T wave)
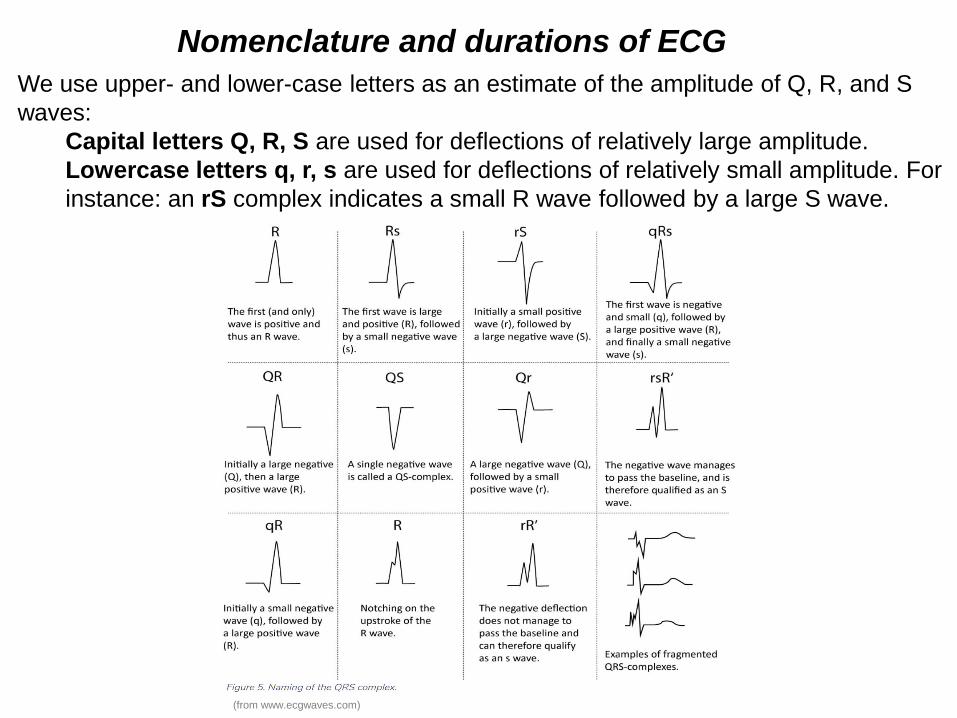
We use upper- and lower-case letters as an estimate of the amplitude of Q, R, and S
waves:
Capital letters Q, R, S are used for deflections of relatively large amplitude.
Lowercase letters q, r, s are used for deflections of relatively small amplitude. For
instance: an rS complex indicates a small R wave followed by a large S wave.
Nomenclature and durations of ECG
(from www.ecgwaves.com)
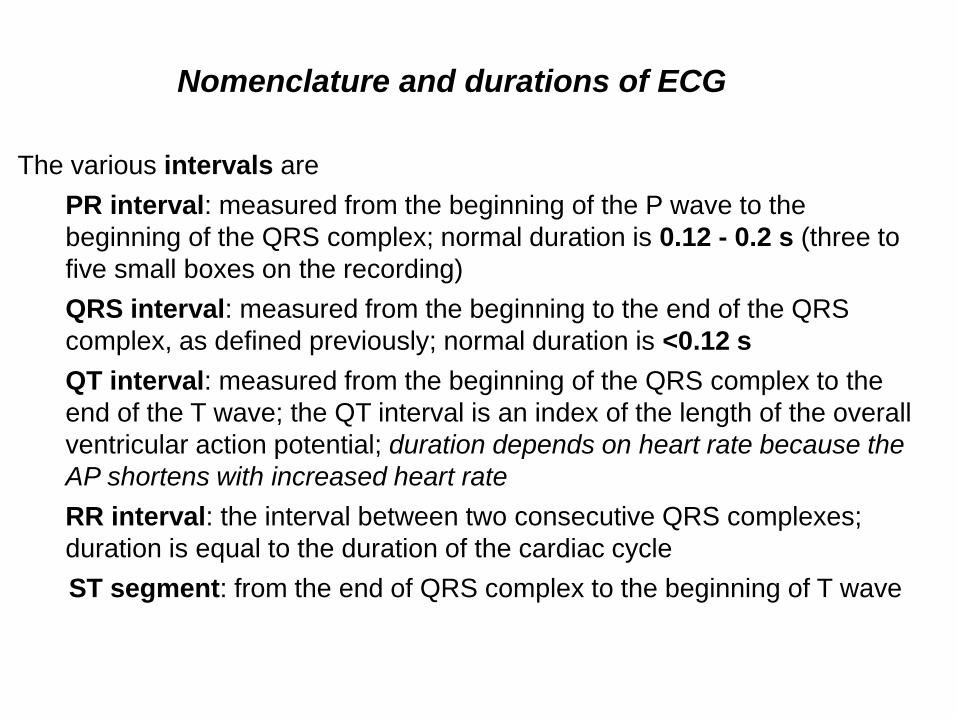
The various intervals are
PR interval: measured from the beginning of the P wave to the
beginning of the QRS complex; normal duration is 0.12 - 0.2 s (three to
five small boxes on the recording)
QRS interval: measured from the beginning to the end of the QRS
complex, as defined previously; normal duration is <0.12 s
QT interval: measured from the beginning of the QRS complex to the
end of the T wave; the QT interval is an index of the length of the overall
ventricular action potential; duration depends on heart rate because the
AP shortens with increased heart rate
RR interval: the interval between two consecutive QRS complexes;
duration is equal to the duration of the cardiac cycle
ST segment: from the end of QRS complex to the beginning of T wave
Nomenclature and durations of ECG
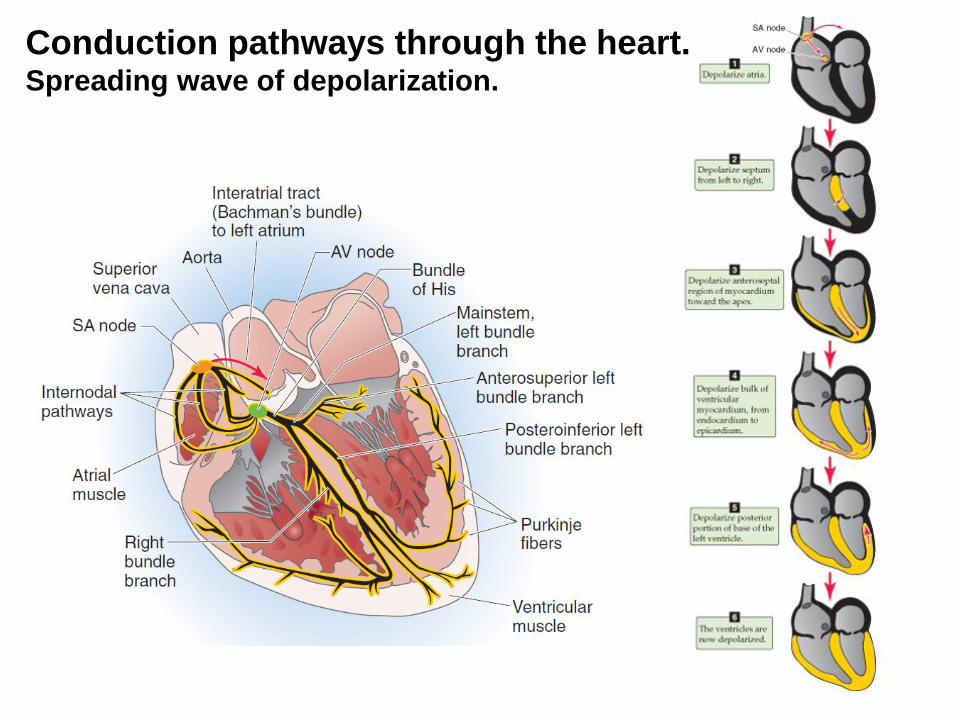
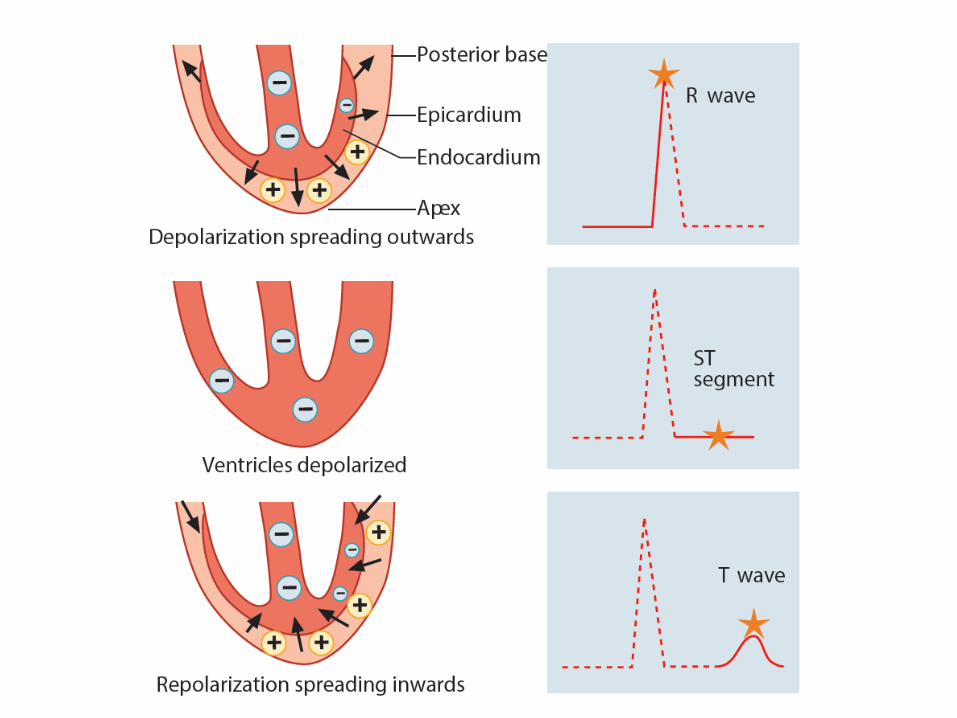
Conduction pathways through the heart.Spreading wave of depolarization.
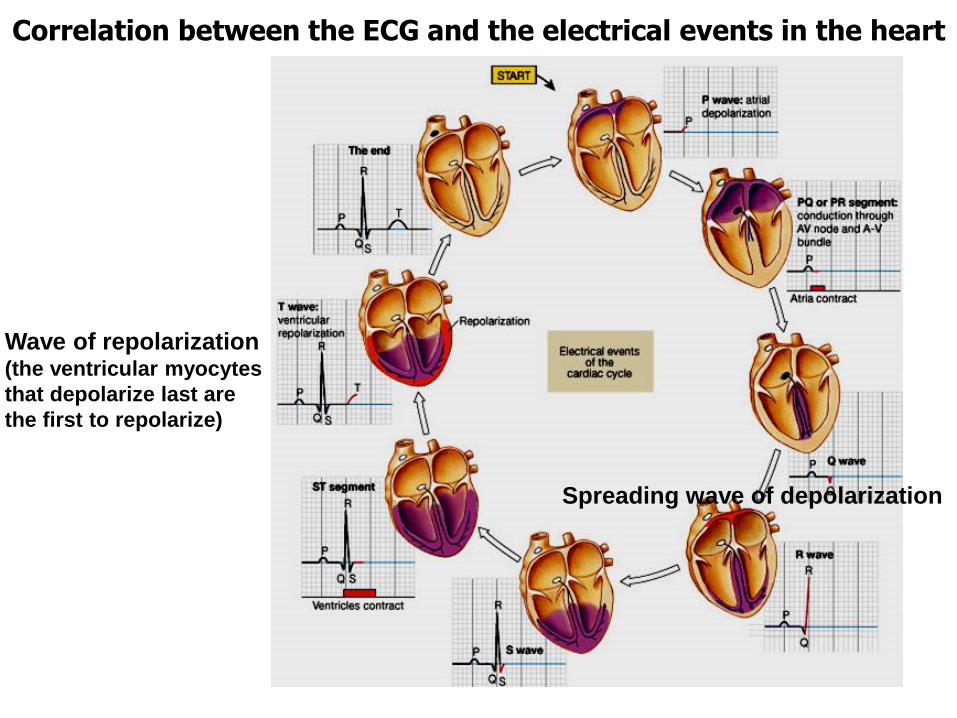
Correlation between the ECG and the electrical events in the heart
Wave of repolarization (the ventricular myocytes
that depolarize last are
the first to repolarize)
Spreading wave of depolarization
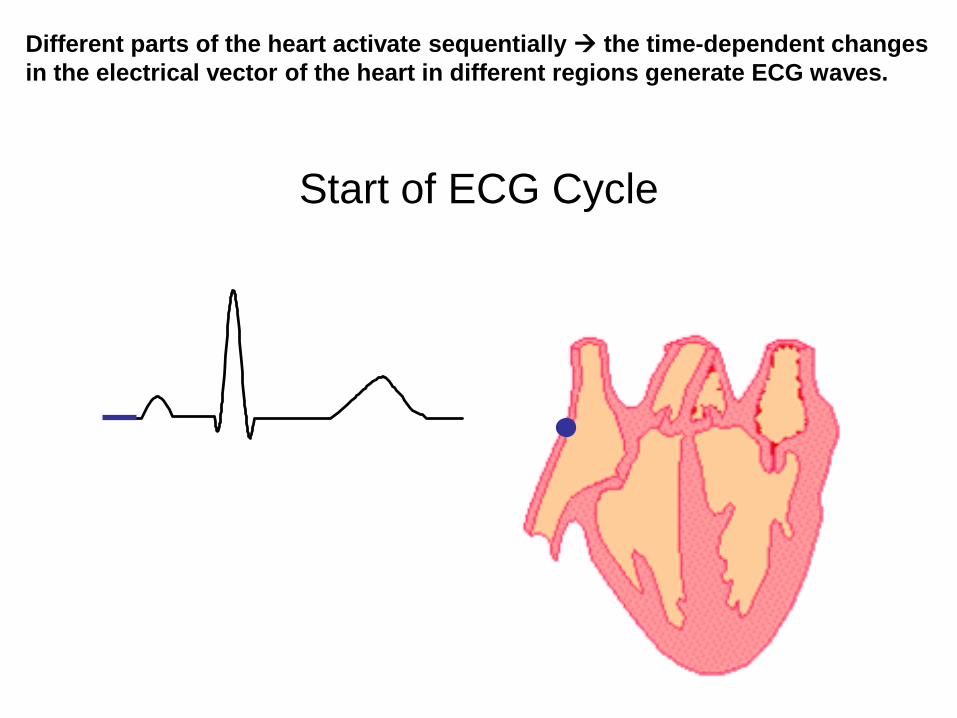
Start of ECG Cycle
Different parts of the heart activate sequentially → the time-dependent changes
in the electrical vector of the heart in different regions generate ECG waves.
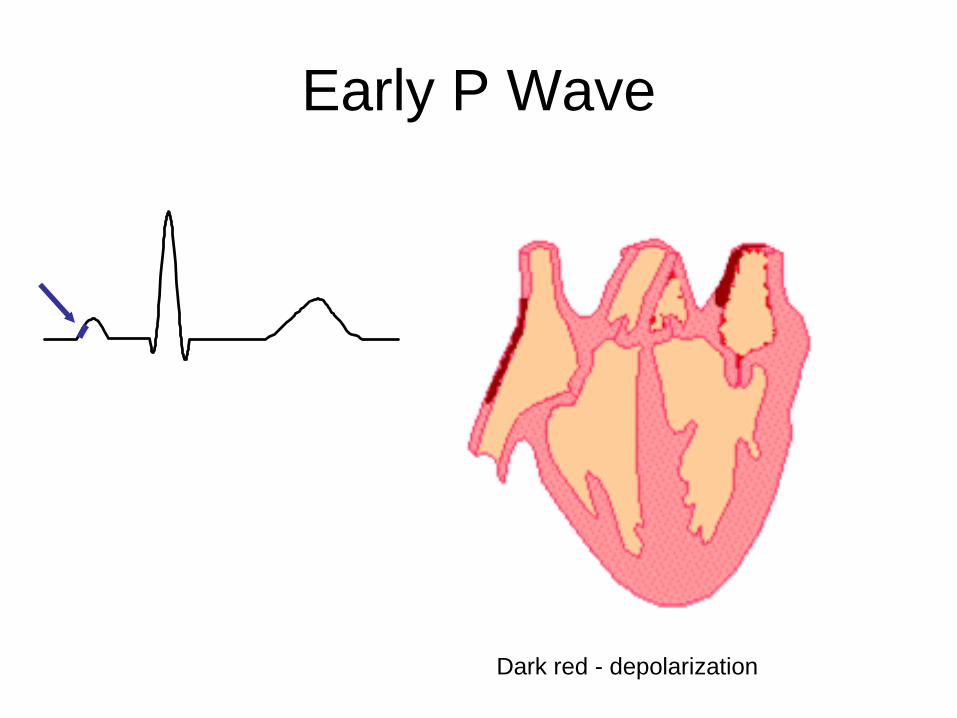
Early P Wave
Dark red - depolarization
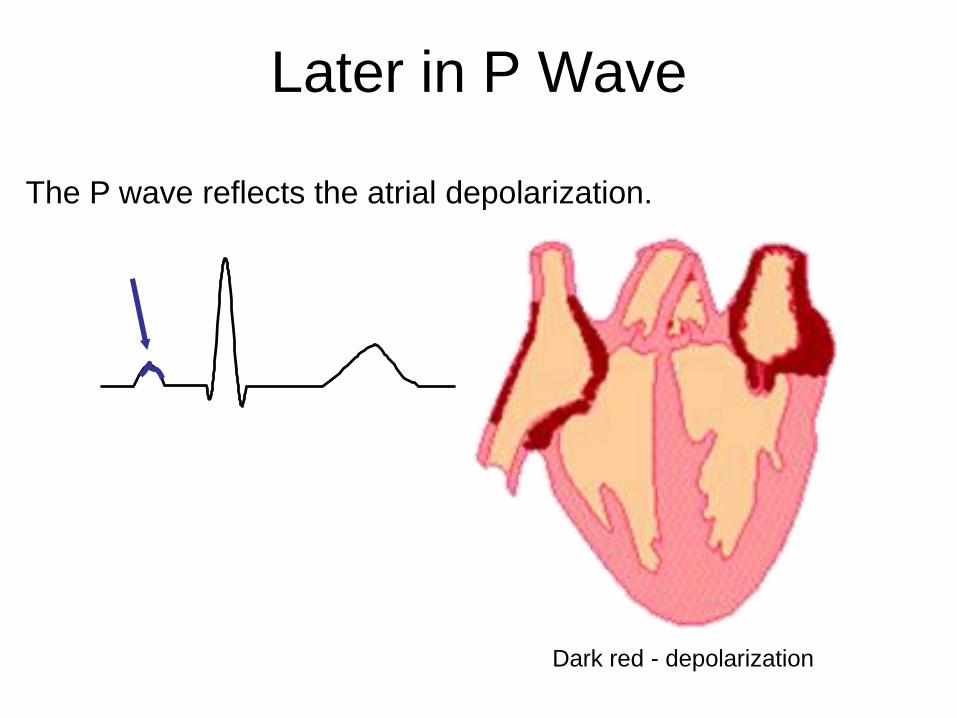
Later in P Wave
Dark red - depolarization
The P wave reflects the atrial depolarization.
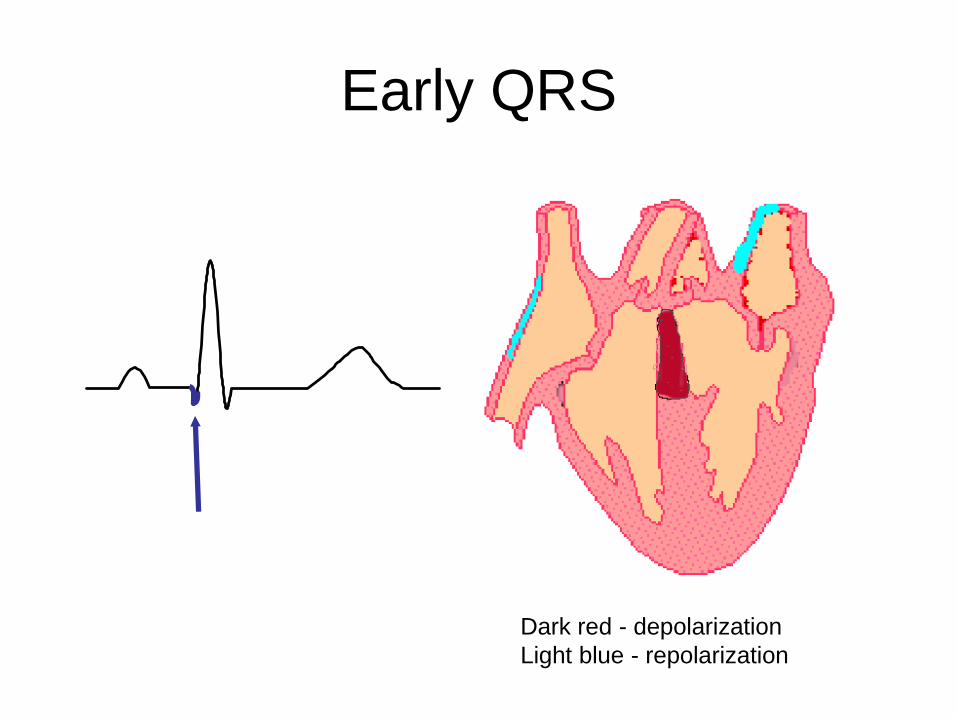
Early QRS
Dark red - depolarization
Light blue - repolarization
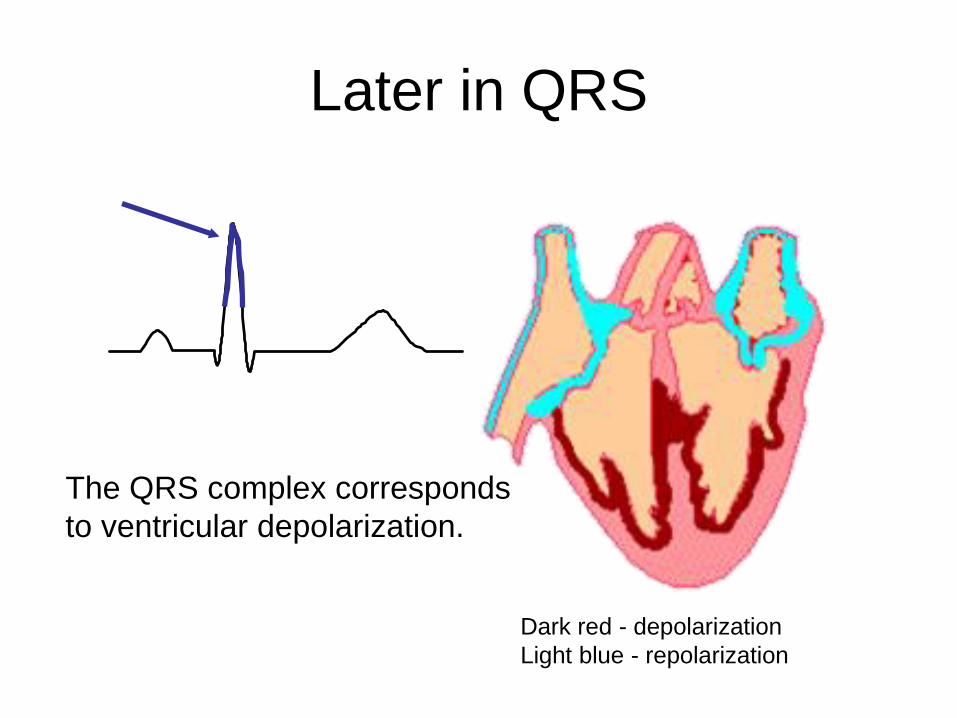
Later in QRS
Dark red - depolarization
Light blue - repolarization
The QRS complex corresponds
to ventricular depolarization.
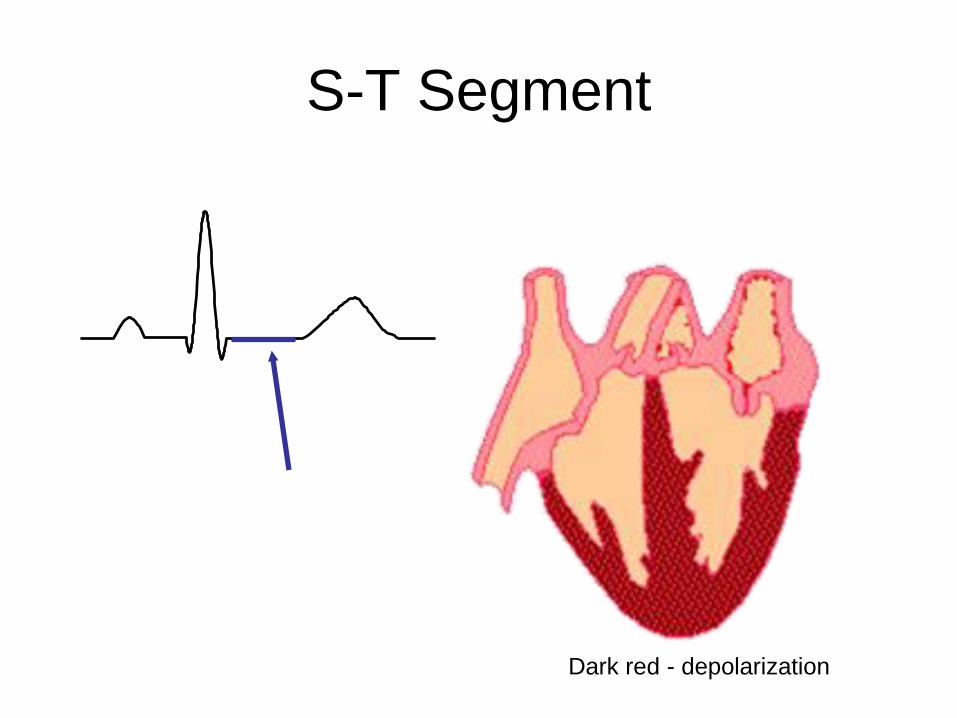
S-T Segment
Dark red - depolarization
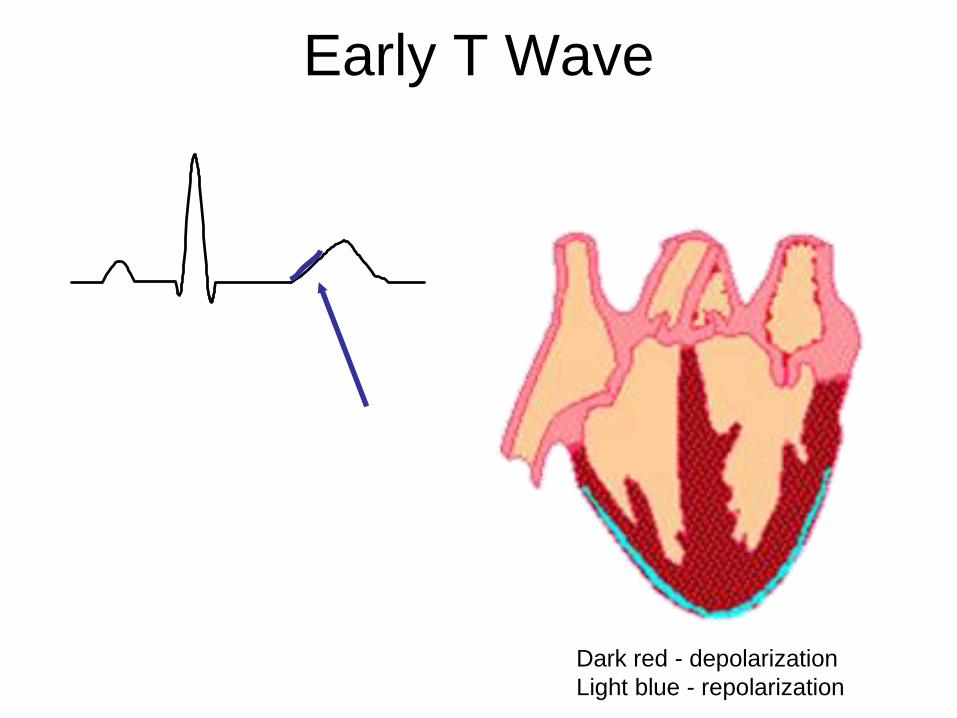
Early T Wave
Dark red - depolarization
Light blue - repolarization
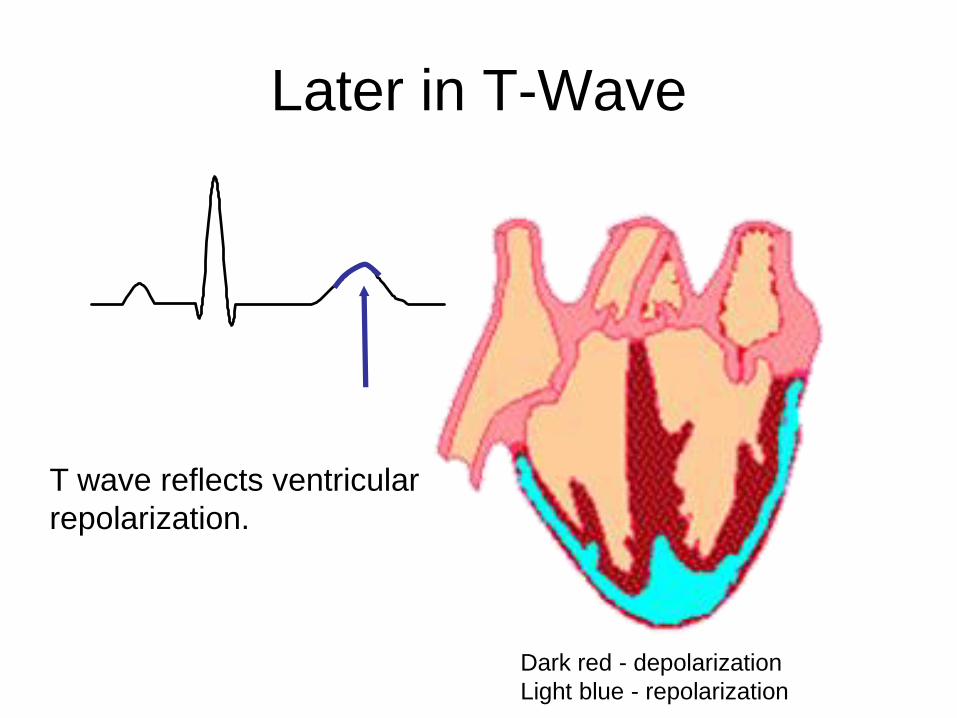
Later in T-Wave
Dark red - depolarization
Light blue - repolarization
T wave reflects ventricular
repolarization.
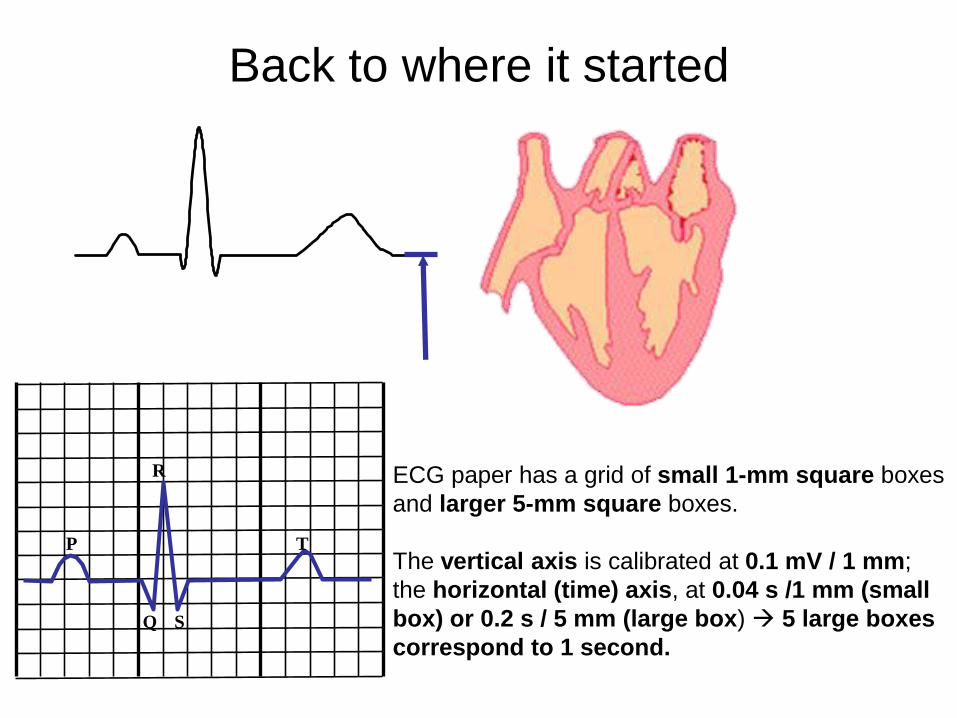
Back to where it started
Q
P
R
S
T
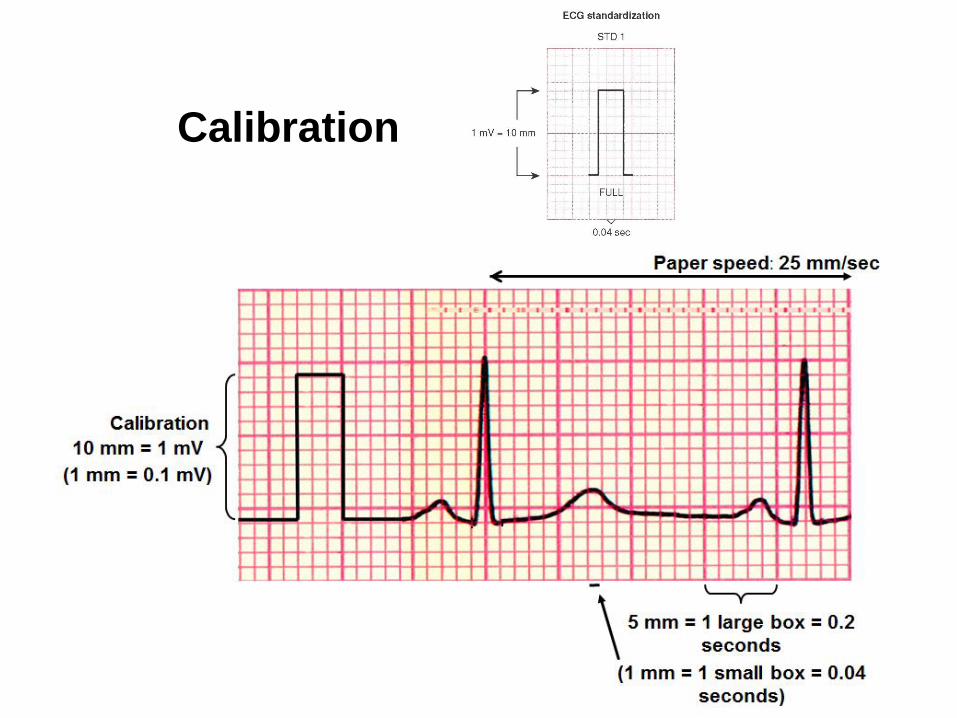
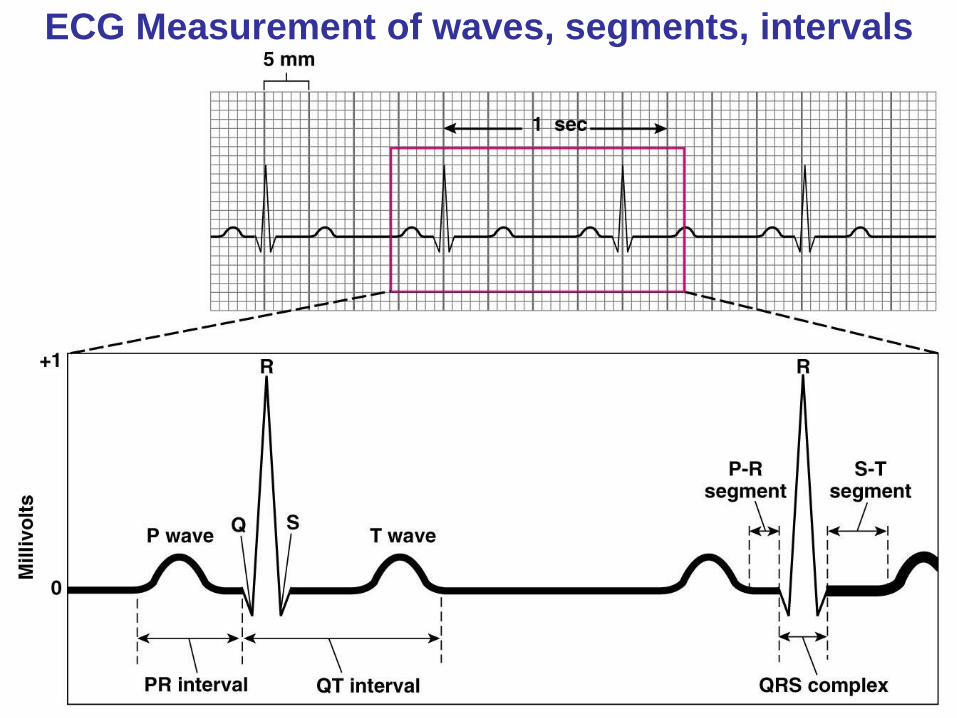
ECG paper has a grid of small 1-mm square boxes
and larger 5-mm square boxes.
The vertical axis is calibrated at 0.1 mV / 1 mm;
the horizontal (time) axis, at 0.04 s /1 mm (small
box) or 0.2 s / 5 mm (large box) → 5 large boxes
correspond to 1 second.
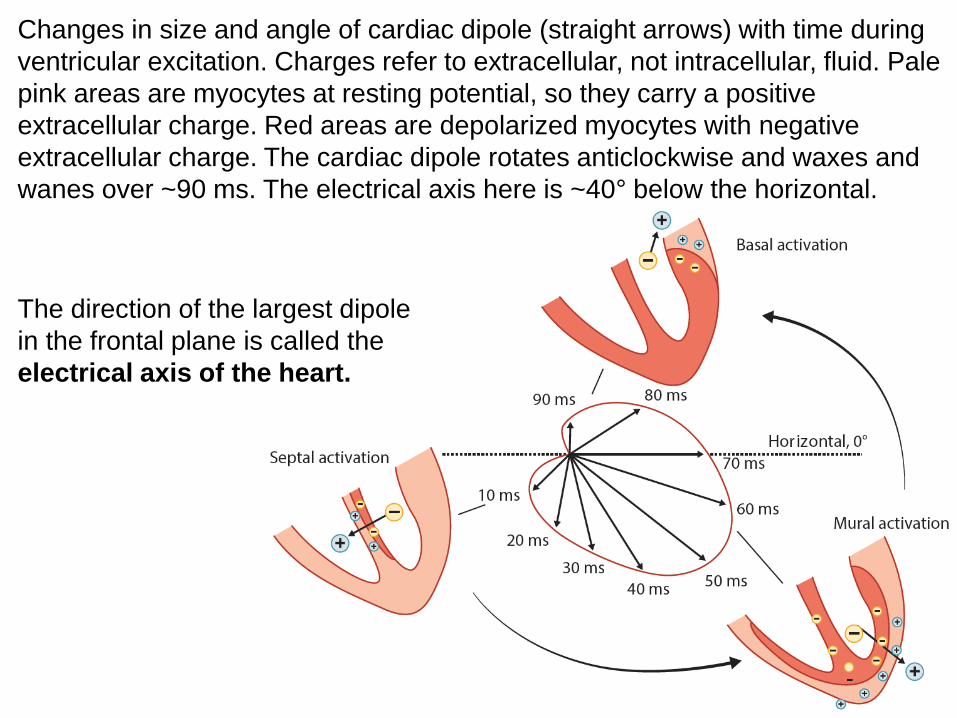
Changes in size and angle of cardiac dipole (straight arrows) with time during
ventricular excitation. Charges refer to extracellular, not intracellular, fluid. Pale
pink areas are myocytes at resting potential, so they carry a positive
extracellular charge. Red areas are depolarized myocytes with negative
extracellular charge. The cardiac dipole rotates anticlockwise and waxes and
wanes over ~90 ms. The electrical axis here is ~40° below the horizontal.
The direction of the largest dipole
in the frontal plane is called the
electrical axis of the heart.
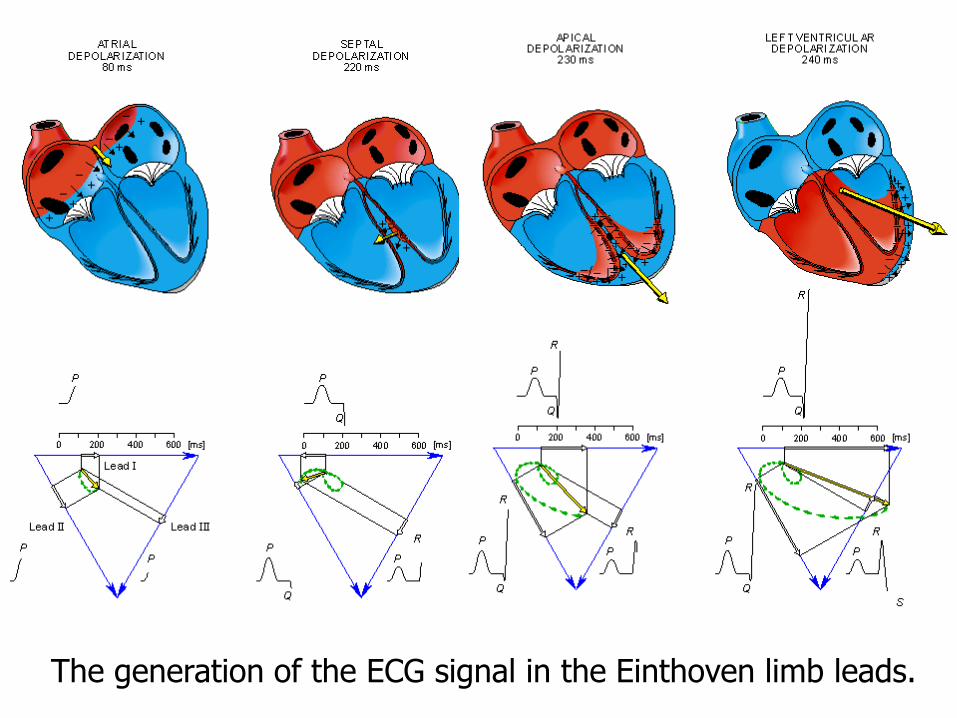
The generation of the ECG signal in the Einthoven limb leads.
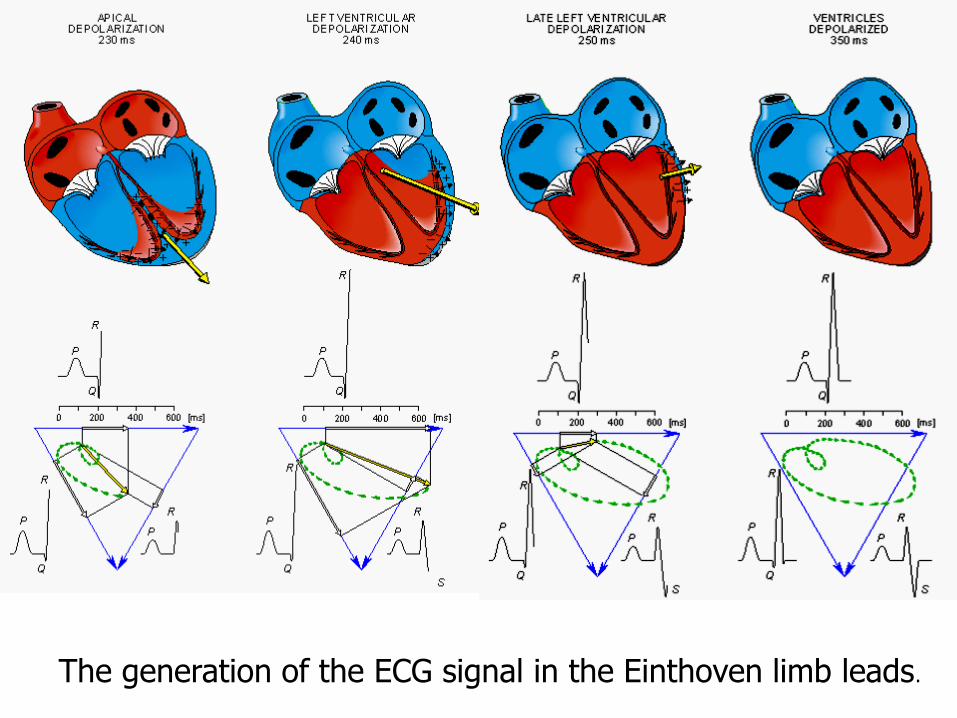
The generation of the ECG signal in the Einthoven limb leads.
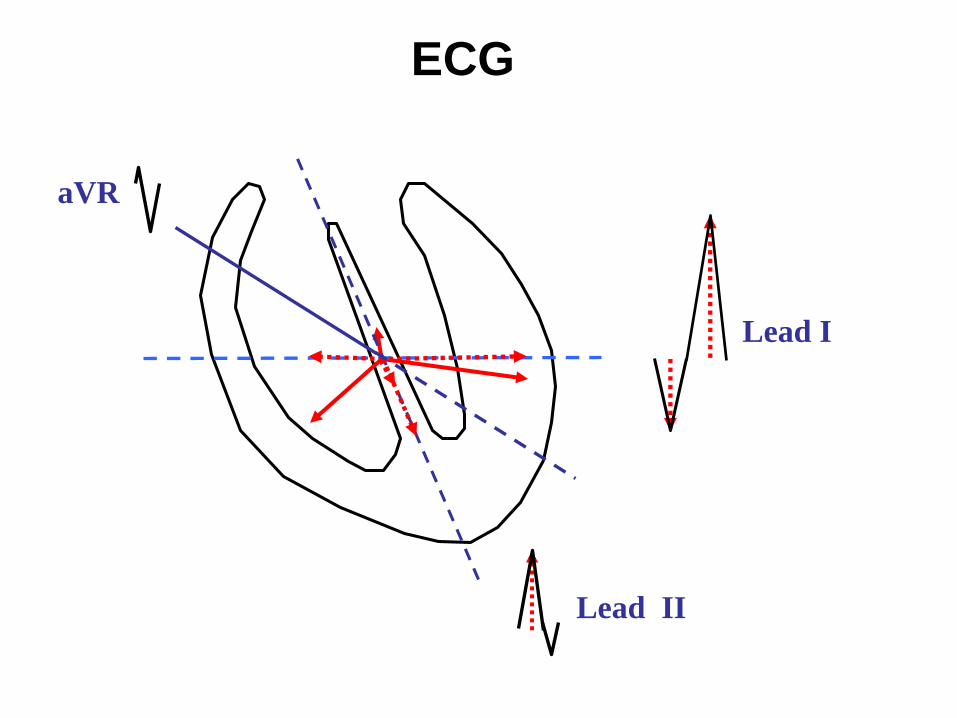
Lead I
Lead II
aVR
ECG
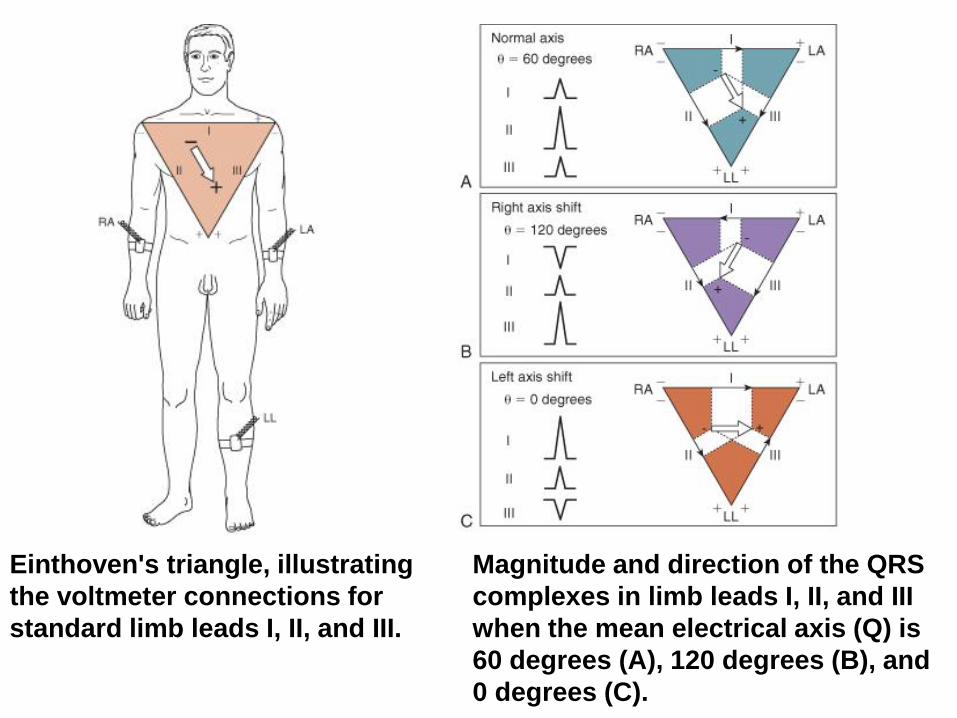
Einthoven's triangle, illustrating
the voltmeter connections for
standard limb leads I, II, and III.
Magnitude and direction of the QRS
complexes in limb leads I, II, and III
when the mean electrical axis (Q) is
60 degrees (A), 120 degrees (B), and
0 degrees (C).
Leads and electrical vectors of the heart
• The inferior leads (leads II, III and aVF) show the electrical activity
from the inferior region (wall) of the heart - the apex of the left ventricle.
• The lateral leads (I, aVL, V5 and V6) look at the electrical activity
from the lateral wall of the heart.
• The anterior leads, V1 through V6, and represent the anterior wall
of the heart.
The lateral and anterior leads record events from the left wall and front
walls of the left ventricle, respectively.
aVR is rarely used for diagnostic information, but indicates if the ECG leads
were placed correctly on the patient.
The right ventricle has very little muscle mass→ it leaves only a small
imprint on the ECG, making it more difficult to diagnose changes in the right
ventricle.
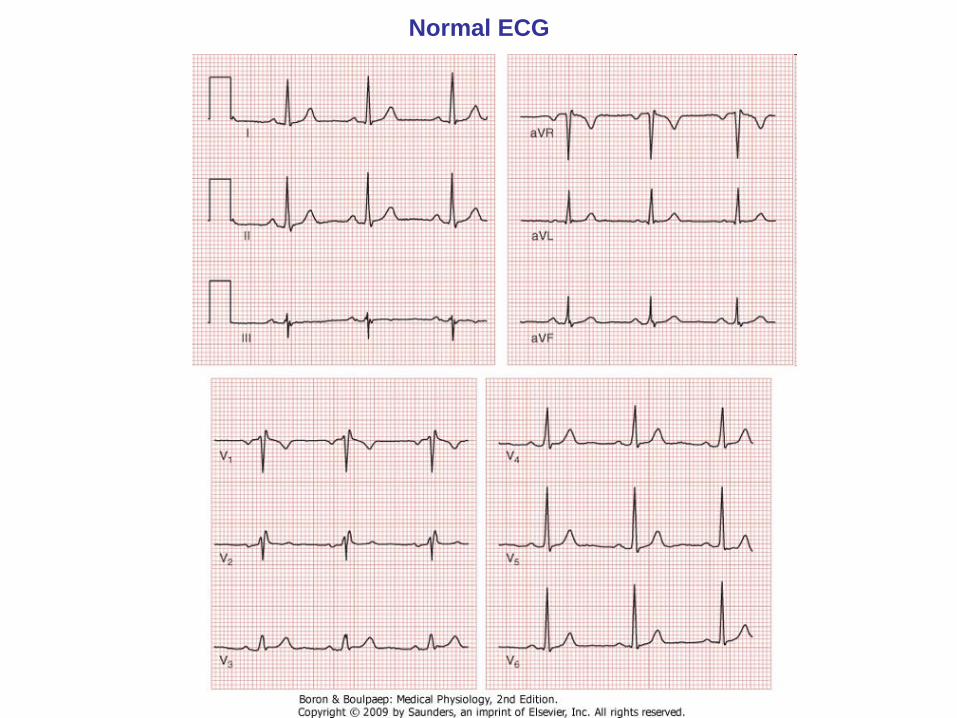
Normal ECG
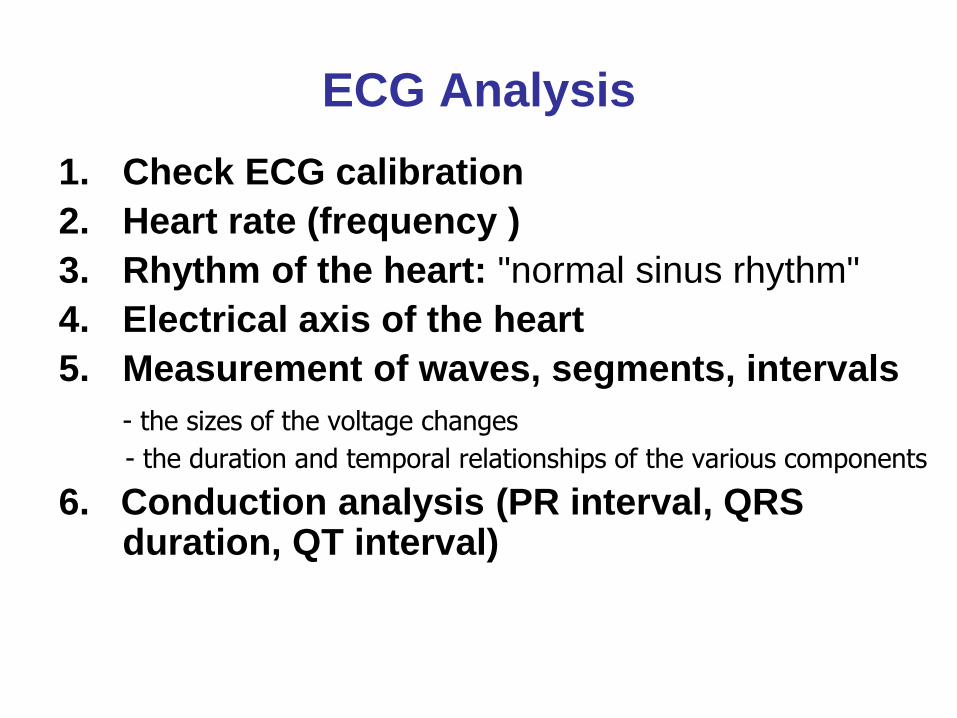
ECG Analysis
1. Check ECG calibration
2. Heart rate (frequency )
3. Rhythm of the heart: "normal sinus rhythm"
4. Electrical axis of the heart
5. Measurement of waves, segments, intervals
- the sizes of the voltage changes
- the duration and temporal relationships of the various components
6. Conduction analysis (PR interval, QRS duration, QT interval)
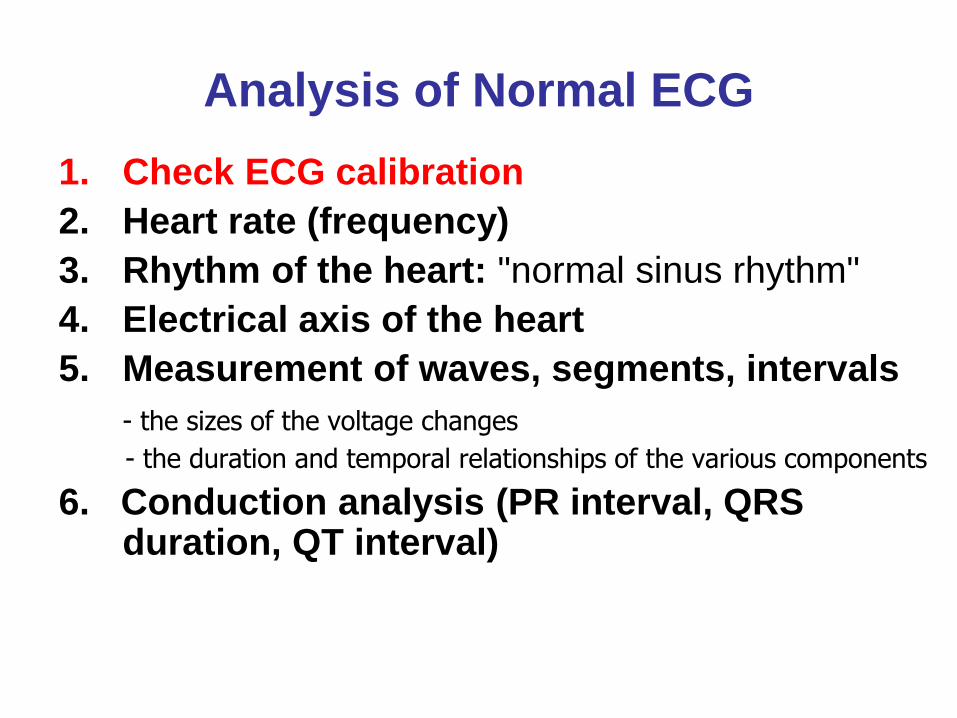
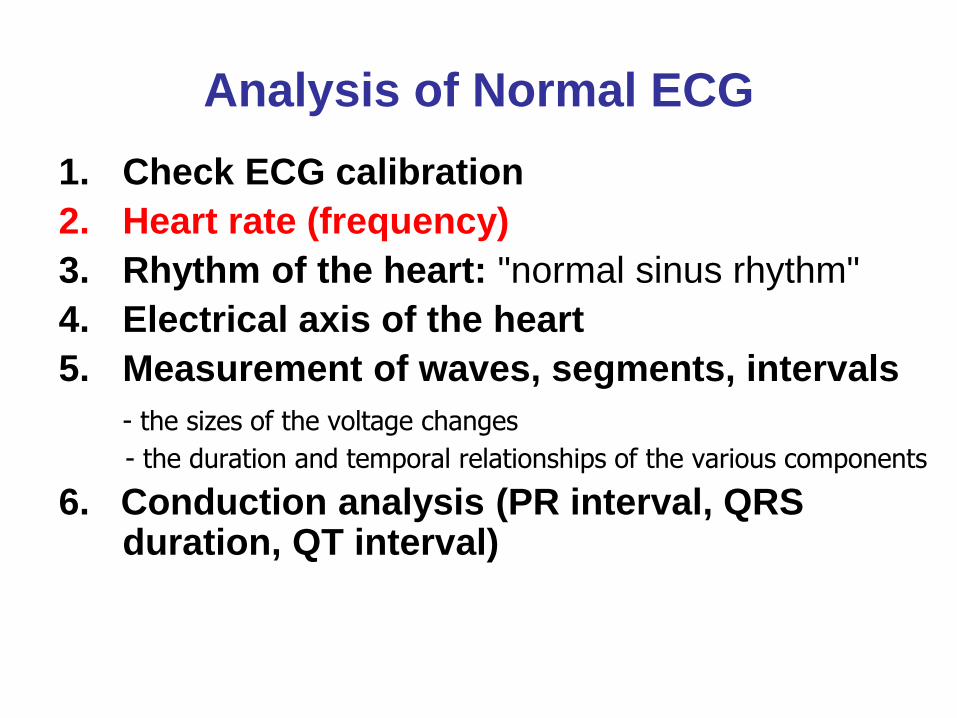
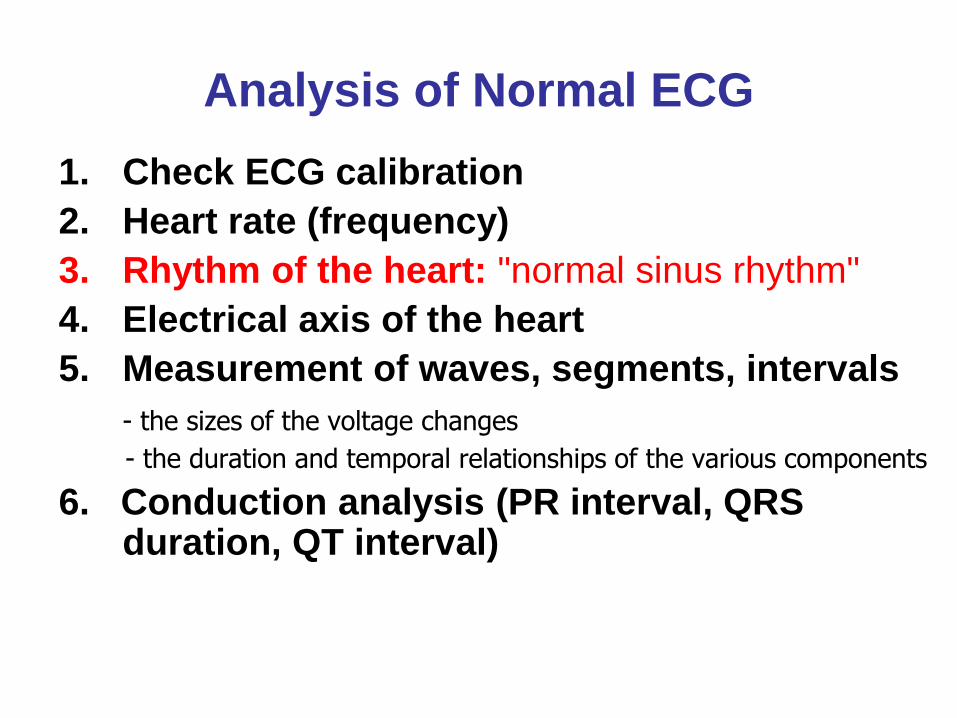
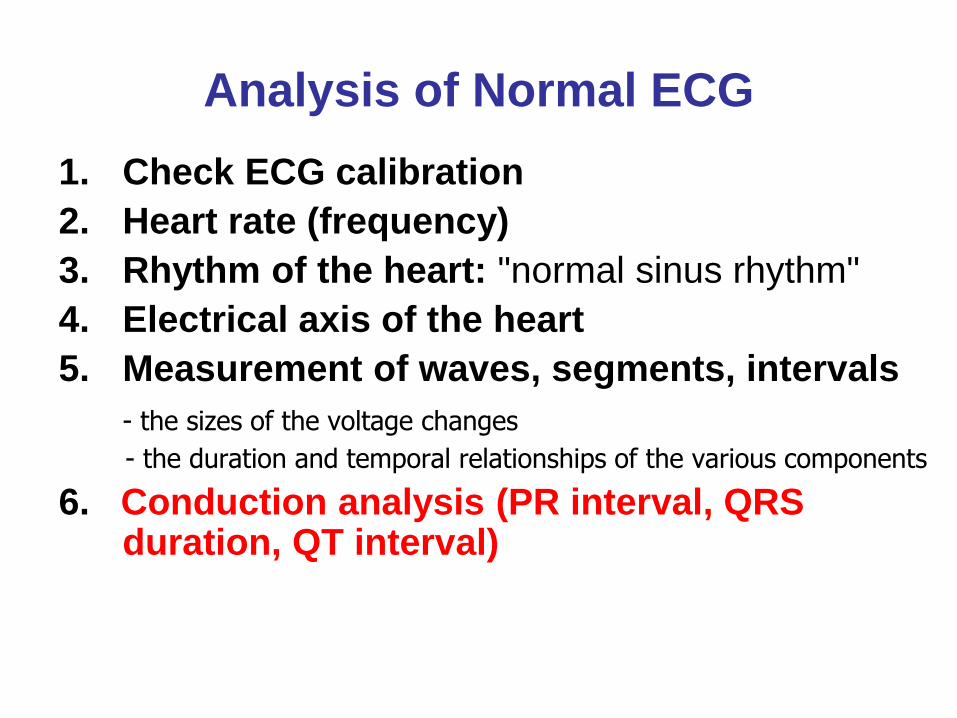
Analysis of Normal ECG
1. Check ECG calibration
2. Heart rate (frequency)
3. Rhythm of the heart: "normal sinus rhythm"
4. Electrical axis of the heart
5. Measurement of waves, segments, intervals
- the sizes of the voltage changes
- the duration and temporal relationships of the various components
6. Conduction analysis (PR interval, QRS duration, QT interval)
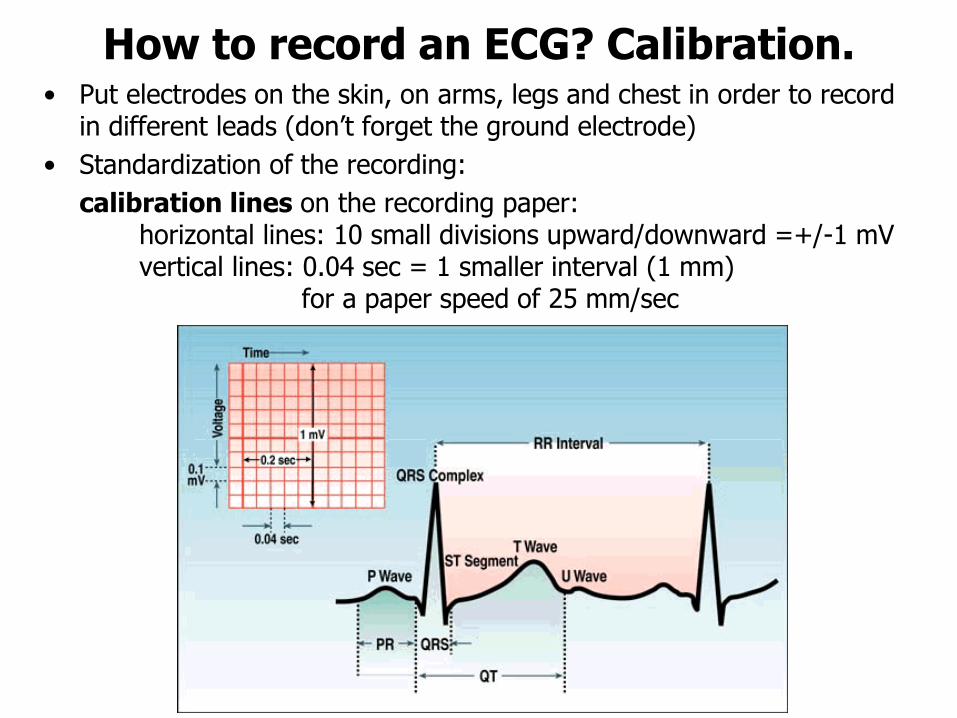
How to record an ECG? Calibration.• Put electrodes on the skin, on arms, legs and chest in order to record
in different leads (don’t forget the ground electrode)
• Standardization of the recording:
calibration lines on the recording paper:horizontal lines: 10 small divisions upward/downward =+/-1 mV vertical lines: 0.04 sec = 1 smaller interval (1 mm)
for a paper speed of 25 mm/sec
Calibration
Analysis of Normal ECG
1. Check ECG calibration
2. Heart rate (frequency)
3. Rhythm of the heart: "normal sinus rhythm"
4. Electrical axis of the heart
5. Measurement of waves, segments, intervals
- the sizes of the voltage changes
- the duration and temporal relationships of the various components
6. Conduction analysis (PR interval, QRS duration, QT interval)
Heart rate (HR)
• HR – number of beats / min
• Normal HR ~ 60-100 beats/min
• If the normal interval between 2 successive QRS complexes
(RR interval) is 0.83 sec, then HR = 60/0.83=72 beats/min
• Methods of determination: direct method
quick method
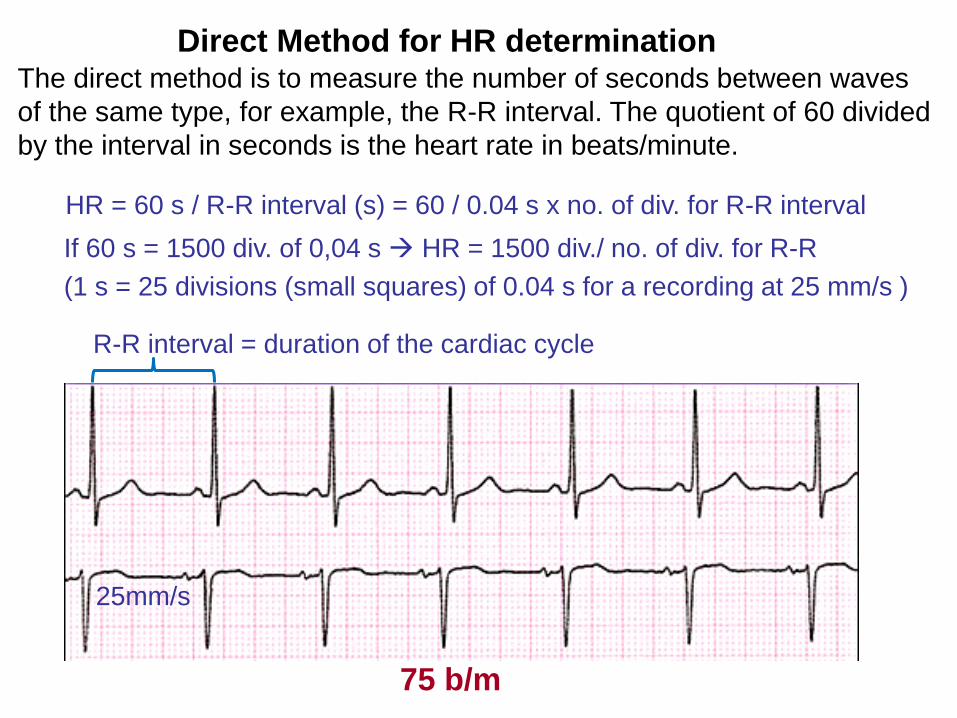
75 b/m
Direct Method for HR determination
25mm/s
If 60 s = 1500 div. of 0,04 s → HR = 1500 div./ no. of div. for R-R
(1 s = 25 divisions (small squares) of 0.04 s for a recording at 25 mm/s )
R-R interval = duration of the cardiac cycle
HR = 60 s / R-R interval (s) = 60 / 0.04 s x no. of div. for R-R interval
The direct method is to measure the number of seconds between waves
of the same type, for example, the R-R interval. The quotient of 60 divided
by the interval in seconds is the heart rate in beats/minute.
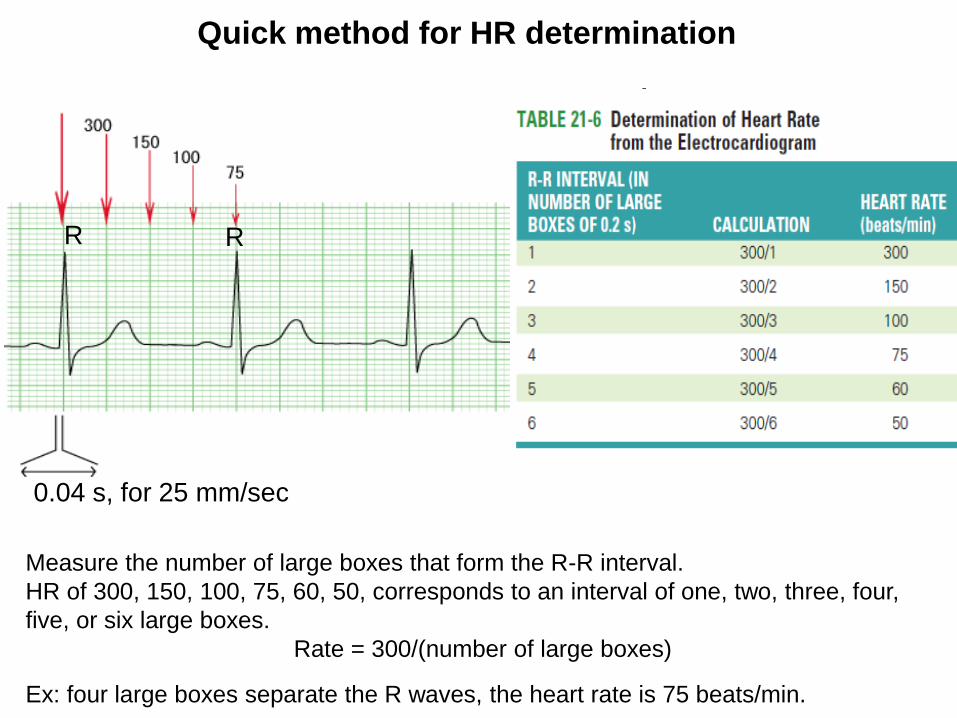
Quick method for HR determination
0.04 s, for 25 mm/sec
R R
Measure the number of large boxes that form the R-R interval.
HR of 300, 150, 100, 75, 60, 50, corresponds to an interval of one, two, three, four,
five, or six large boxes.
Rate = 300/(number of large boxes)
Ex: four large boxes separate the R waves, the heart rate is 75 beats/min.
Analysis of Normal ECG
1. Check ECG calibration
2. Heart rate (frequency)
3. Rhythm of the heart: "normal sinus rhythm"
4. Electrical axis of the heart
5. Measurement of waves, segments, intervals
- the sizes of the voltage changes
- the duration and temporal relationships of the various components
6. Conduction analysis (PR interval, QRS duration, QT interval)
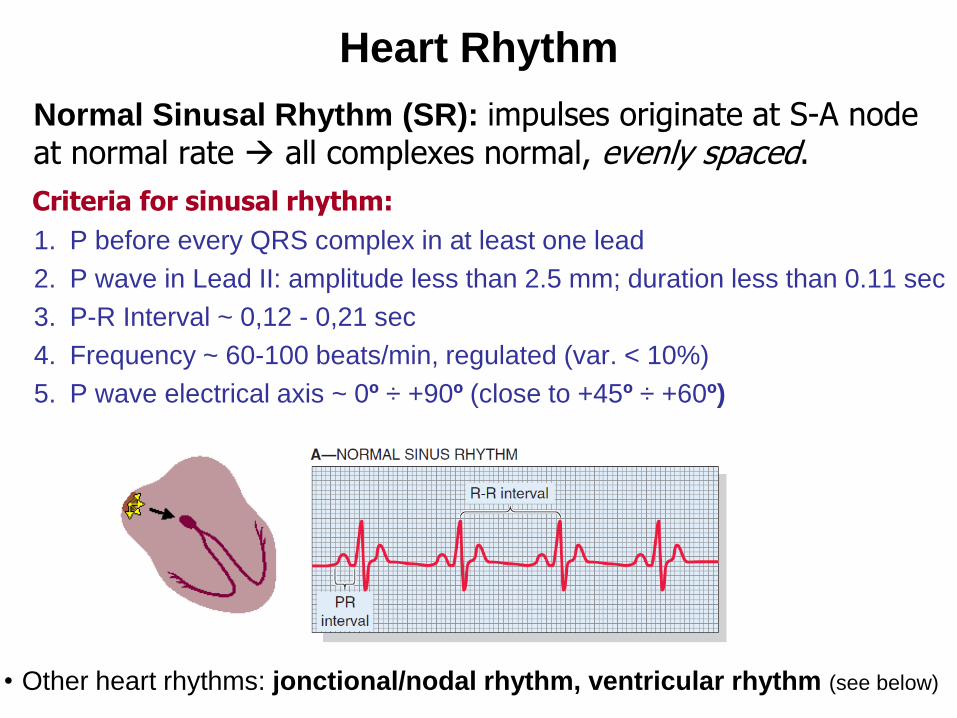
Heart Rhythm
Normal Sinusal Rhythm (SR): impulses originate at S-A node at normal rate → all complexes normal, evenly spaced.
Criteria for sinusal rhythm:
1. P before every QRS complex in at least one lead
2. P wave in Lead II: amplitude less than 2.5 mm; duration less than 0.11 sec
3. P-R Interval ~ 0,12 - 0,21 sec
4. Frequency ~ 60-100 beats/min, regulated (var. < 10%)
5. P wave electrical axis ~ 0º ÷ +90º (close to +45º ÷ +60º)
• Other heart rhythms: jonctional/nodal rhythm, ventricular rhythm (see below)
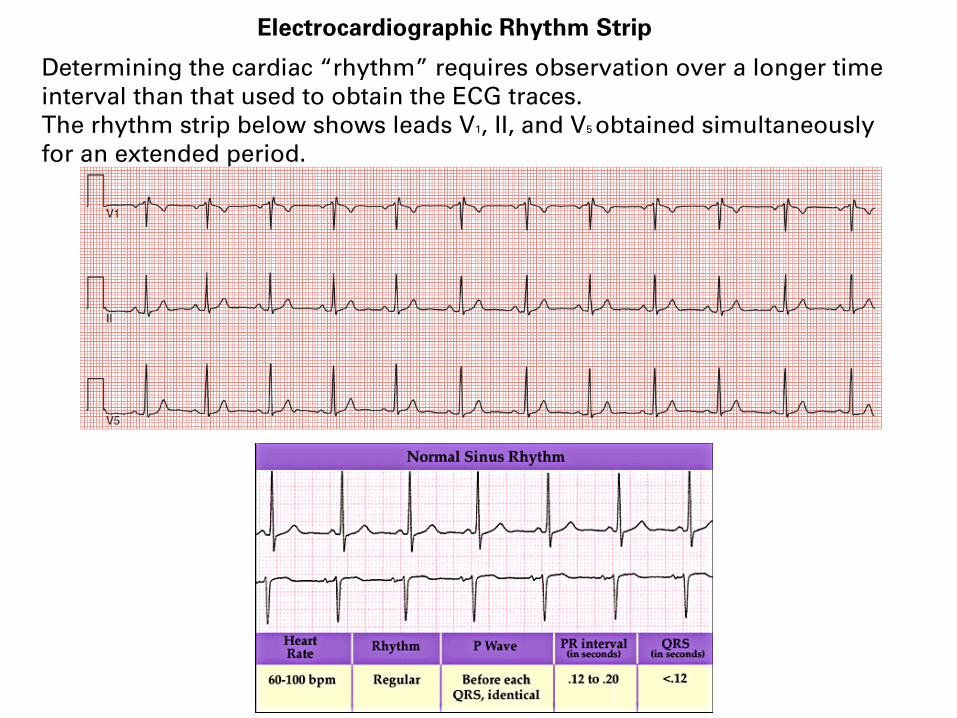
Electrocardiographic Rhythm Strip
Determining the cardiac “rhythm” requires observation over a longer time
interval than that used to obtain the ECG traces.
The rhythm strip below shows leads V1, II, and V5 obtained simultaneously
for an extended period.
Analysis of Normal ECG
1. Check ECG calibration
2. Heart rate (frequency )
3. Rhythm of the heart: "normal sinus rhythm"
4. Electrical axis of the heart
5. Measurement of waves, segments, intervals
- the sizes of the voltage changes
- the duration and temporal relationships of the various components
6. Conduction analysis (PR interval, QRS duration, QT interval)
Electrical axis of the heart
Electrical axis for a given electrical potential is
represented as a vector:
– vector = an arrow that points in the direction of the
electrical potential generated by the current flow, with
the arrowhead in the positive direction.
– by convention, the length of the arrow is drawn
proportional to the voltage of the potential
– the summated vector of the generated potential at
any particular instant is called instantaneous mean
vector
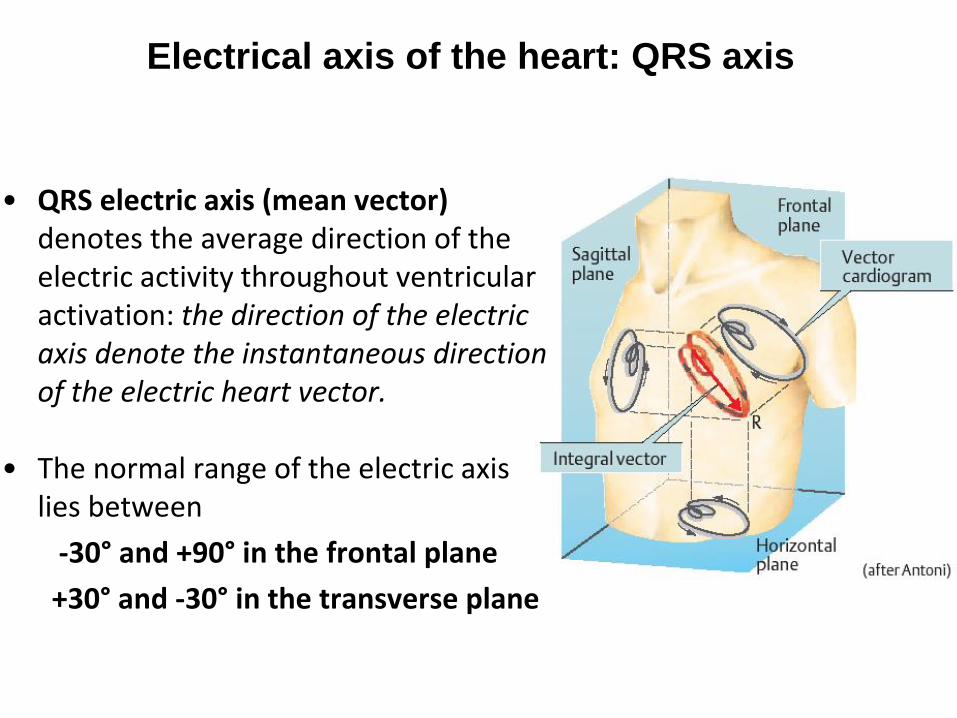
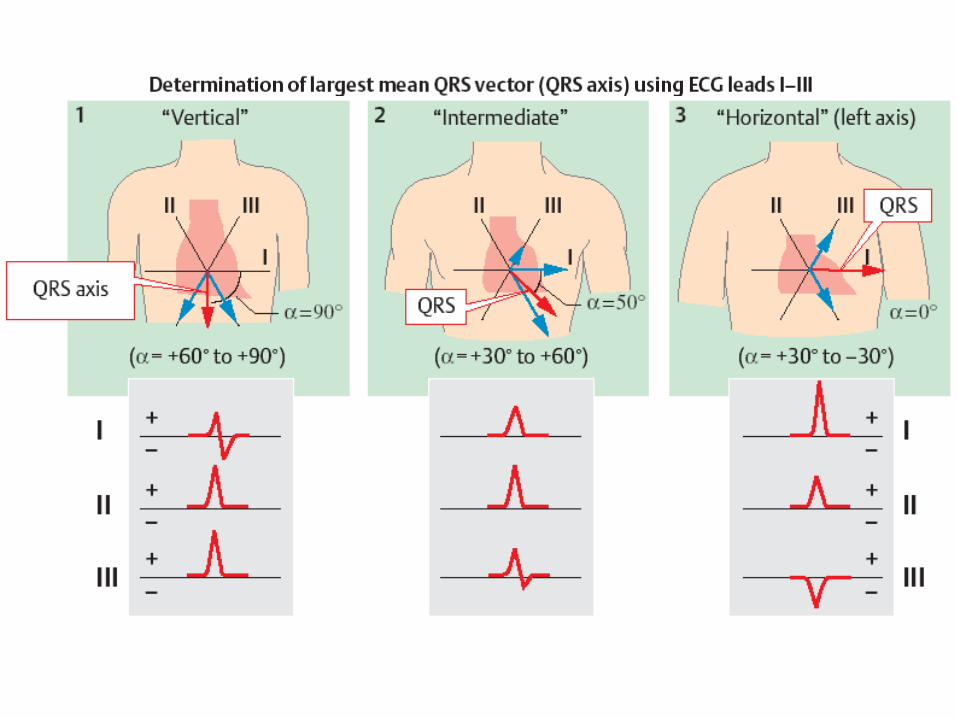
Electrical axis of the heart: QRS axis
• QRS electric axis (mean vector)denotes the average direction of the electric activity throughout ventricular activation: the direction of the electric axis denote the instantaneous direction of the electric heart vector.
• The normal range of the electric axis lies between
-30° and +90° in the frontal plane
+30° and -30° in the transverse plane
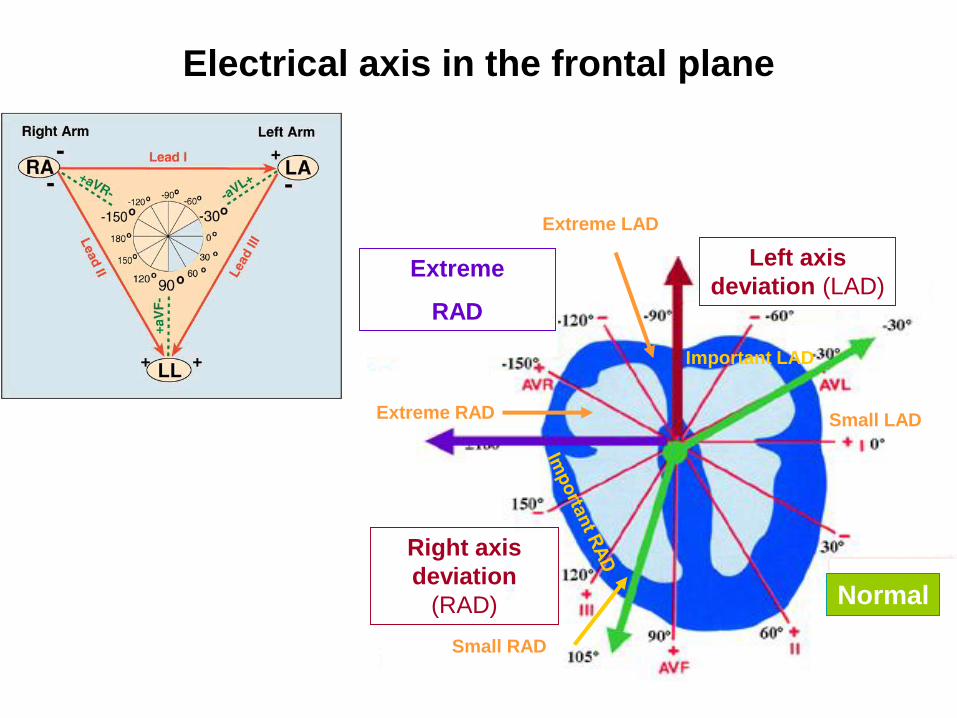
Left axis
deviation (LAD)
Right axis
deviation
(RAD)
Extreme
RAD
Normal
Small LAD
Small RAD
Important LAD
Extreme LAD
Extreme RAD
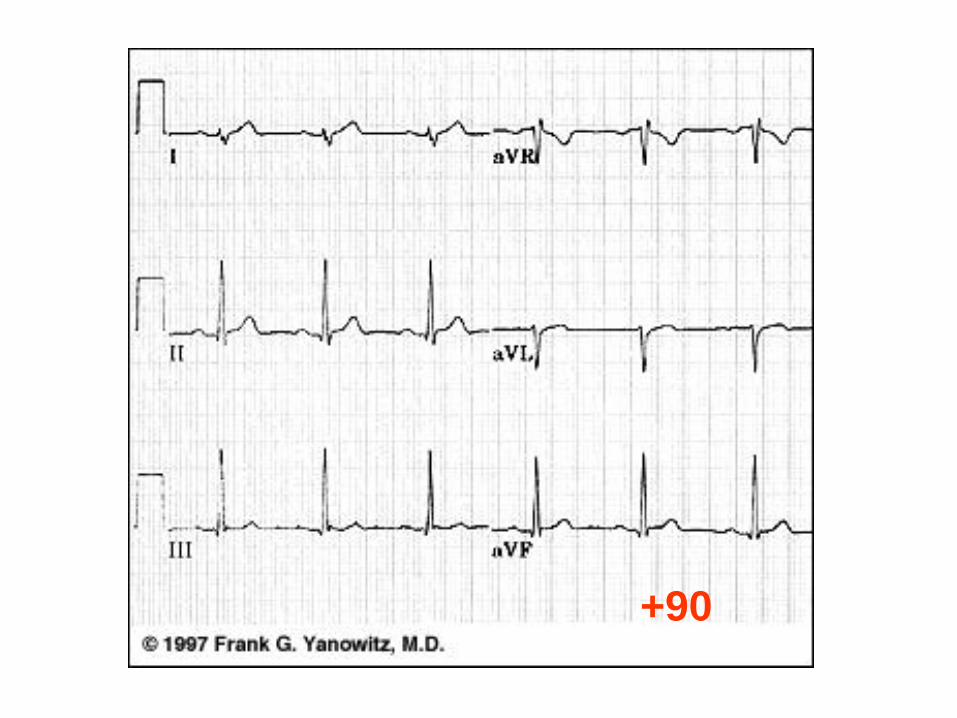
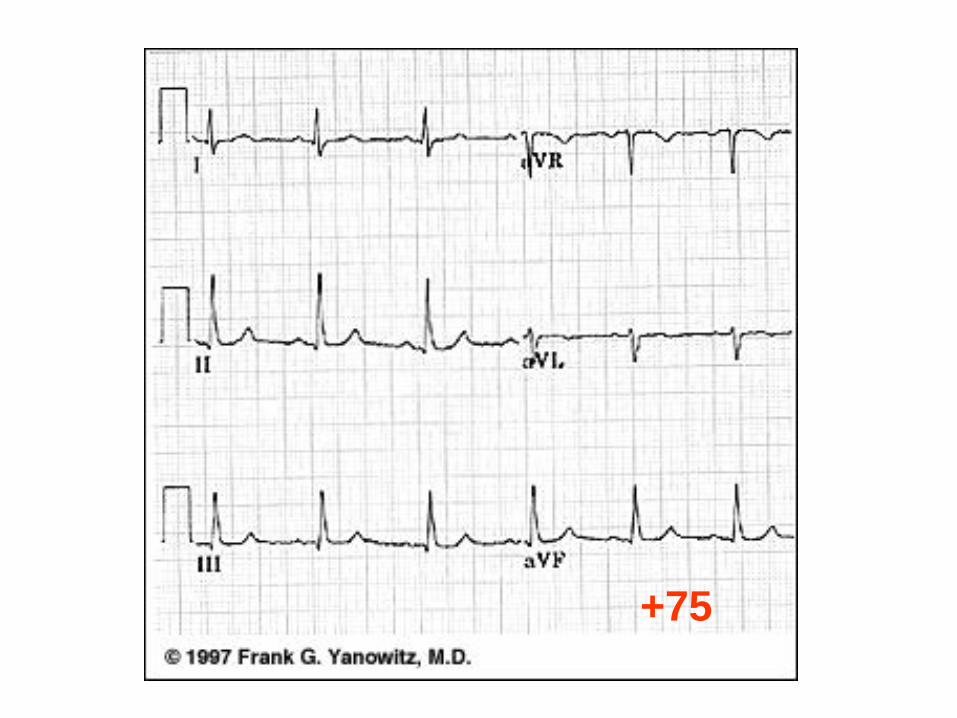
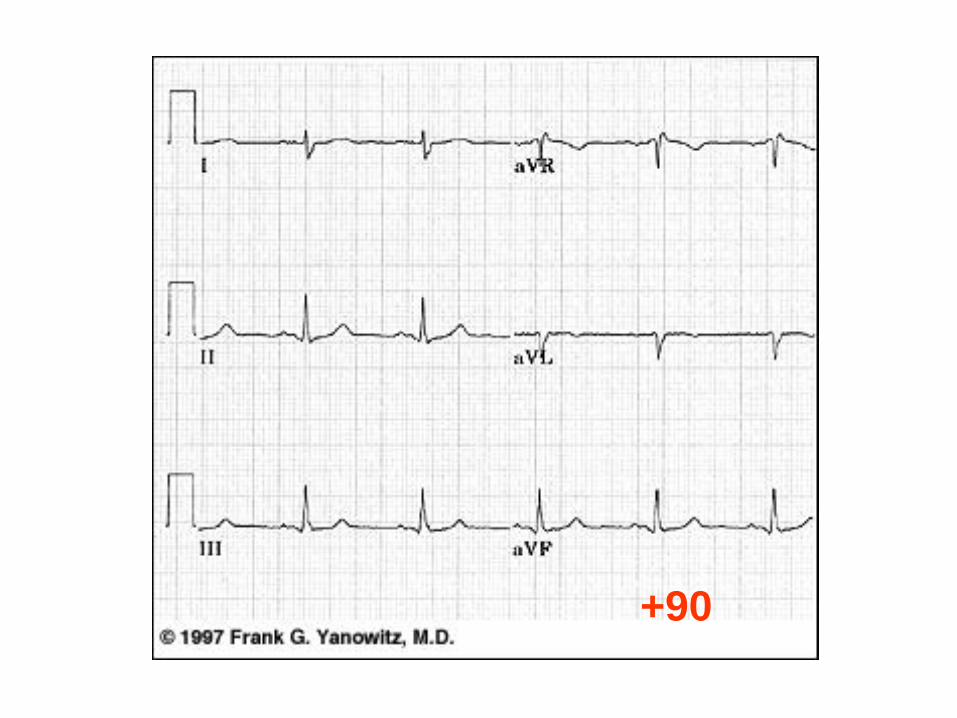
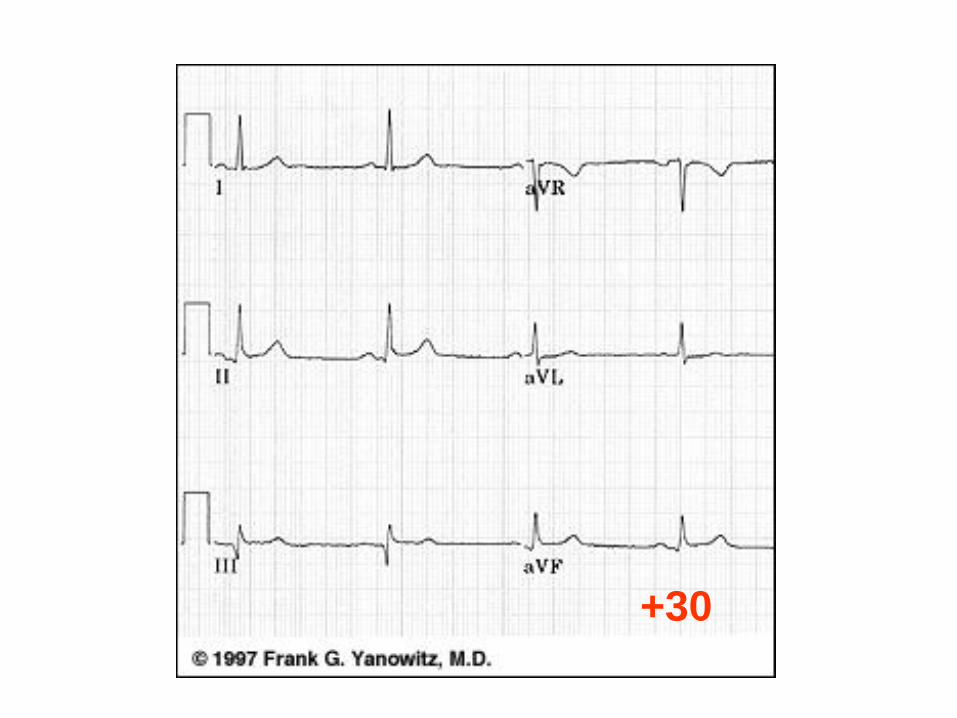
Electrical axis in the frontal plane
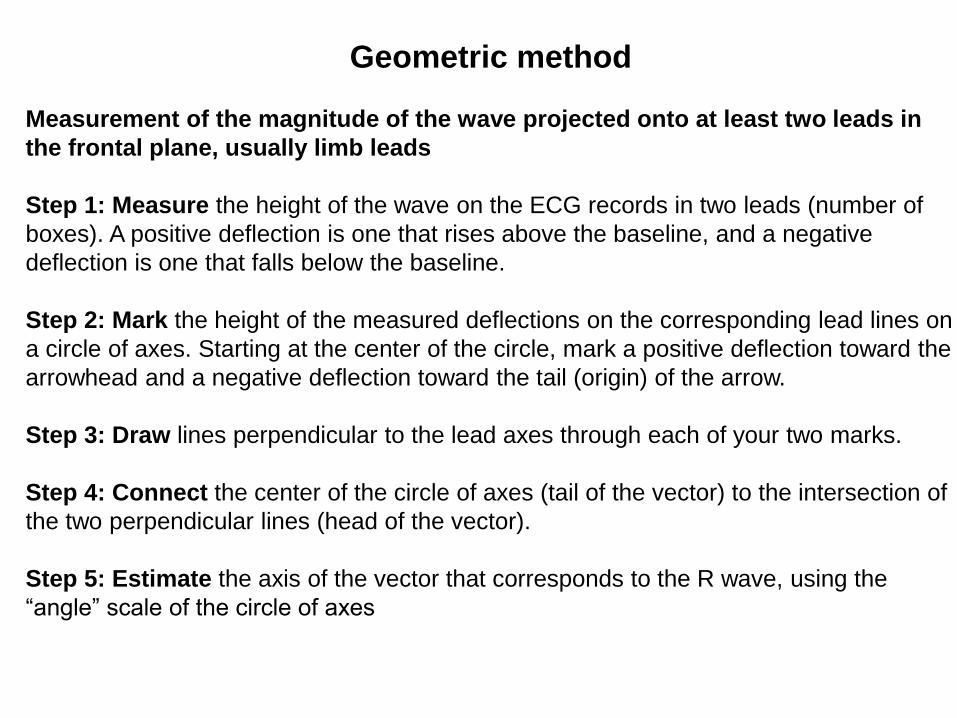
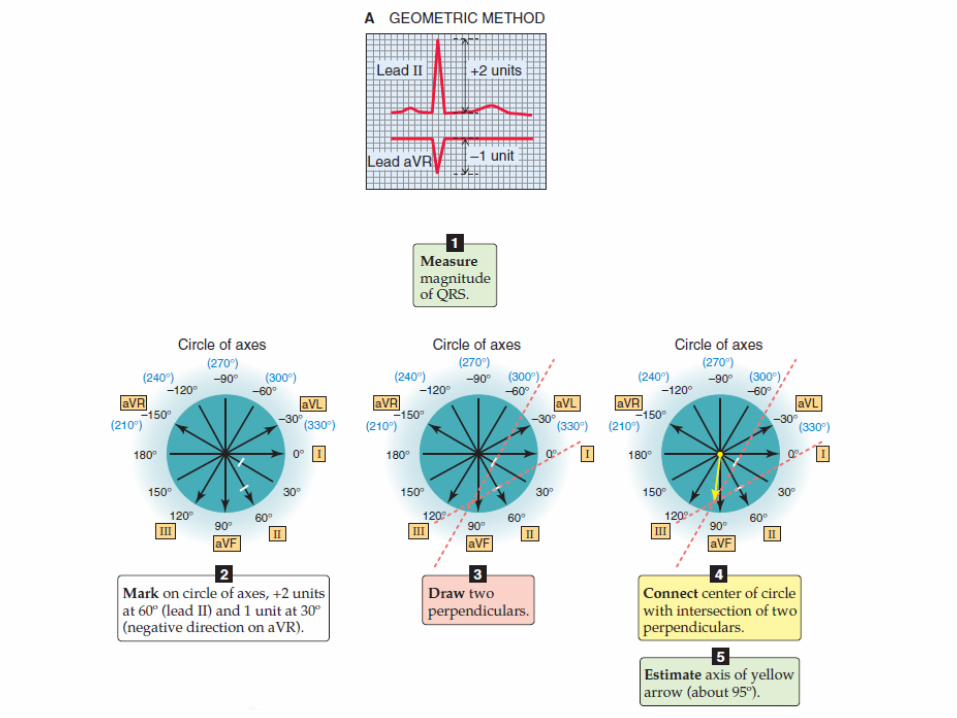
Geometric method
Measurement of the magnitude of the wave projected onto at least two leads in
the frontal plane, usually limb leads
Step 1: Measure the height of the wave on the ECG records in two leads (number of
boxes). A positive deflection is one that rises above the baseline, and a negative
deflection is one that falls below the baseline.
Step 2: Mark the height of the measured deflections on the corresponding lead lines on
a circle of axes. Starting at the center of the circle, mark a positive deflection toward the
arrowhead and a negative deflection toward the tail (origin) of the arrow.
Step 3: Draw lines perpendicular to the lead axes through each of your two marks.
Step 4: Connect the center of the circle of axes (tail of the vector) to the intersection of
the two perpendicular lines (head of the vector).
Step 5: Estimate the axis of the vector that corresponds to the R wave, using the
“angle” scale of the circle of axes

In a normal heart, the average direction of the vector
during spread of the depolarization wave through the
ventricles (mean QRS vector) is about +59 degrees.
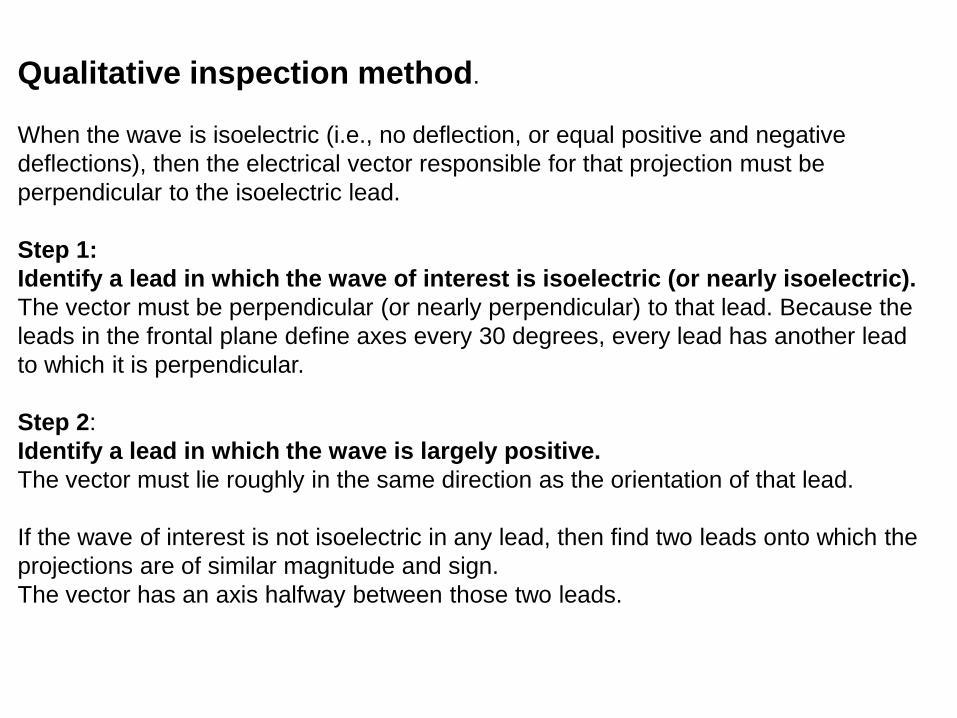
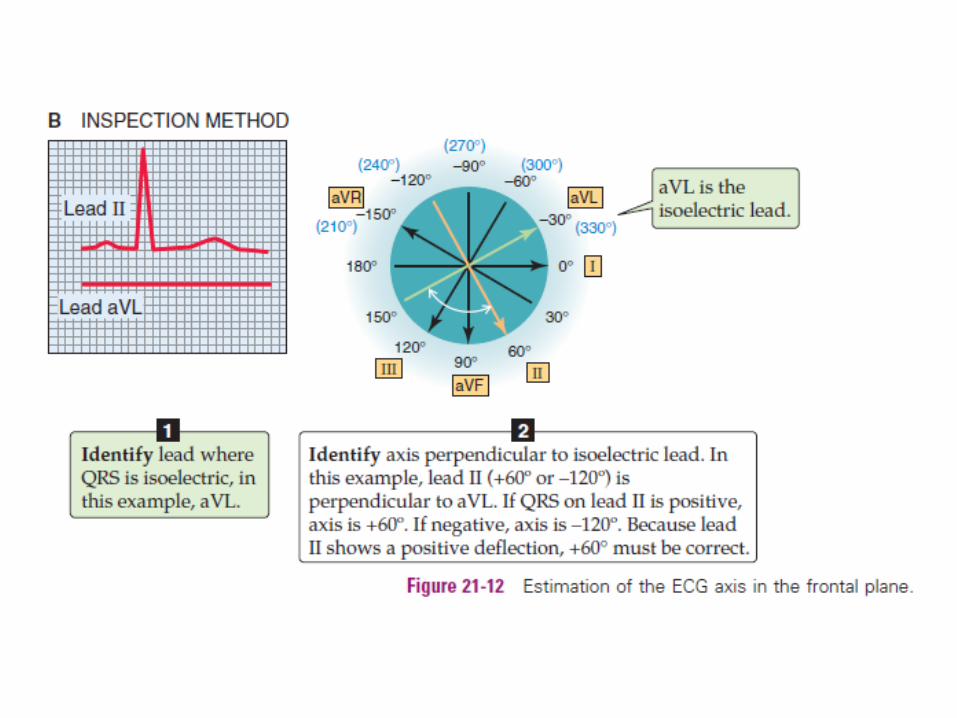
Qualitative inspection method.
When the wave is isoelectric (i.e., no deflection, or equal positive and negative
deflections), then the electrical vector responsible for that projection must be
perpendicular to the isoelectric lead.
Step 1:
Identify a lead in which the wave of interest is isoelectric (or nearly isoelectric).
The vector must be perpendicular (or nearly perpendicular) to that lead. Because the
leads in the frontal plane define axes every 30 degrees, every lead has another lead
to which it is perpendicular.
Step 2:
Identify a lead in which the wave is largely positive.
The vector must lie roughly in the same direction as the orientation of that lead.
If the wave of interest is not isoelectric in any lead, then find two leads onto which the
projections are of similar magnitude and sign.
The vector has an axis halfway between those two leads.
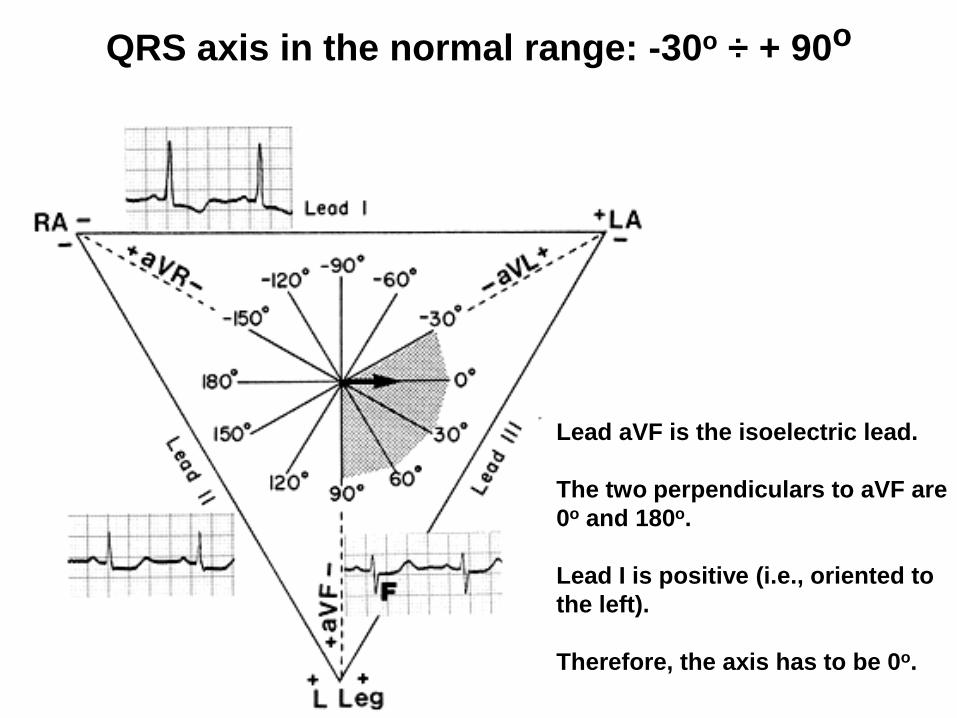
QRS axis in the normal range: -30o ÷ + 90o
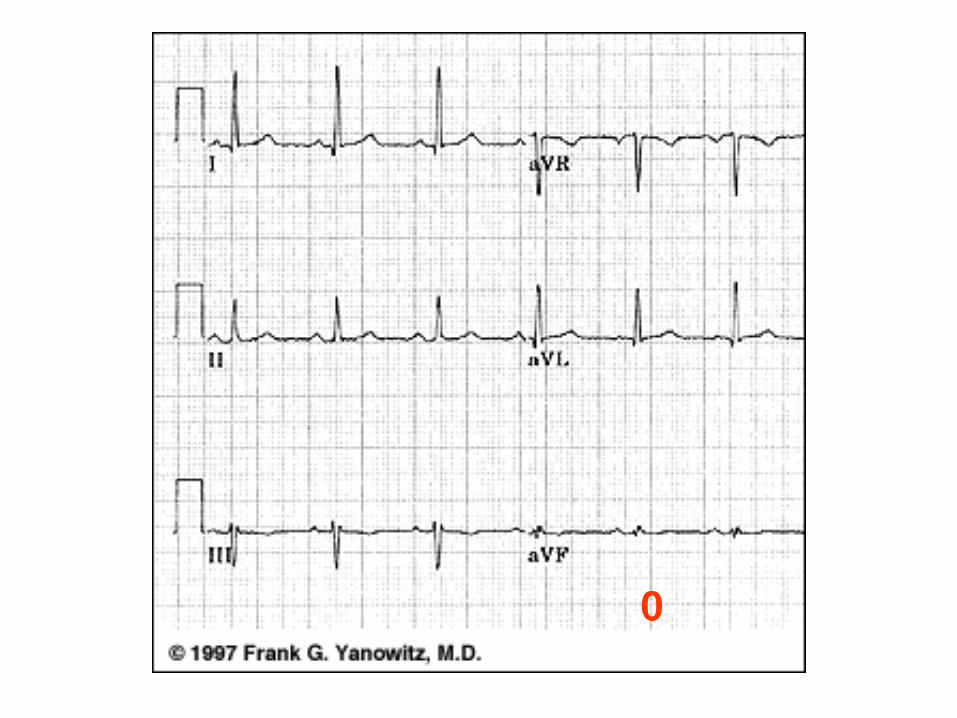
Lead aVF is the isoelectric lead.
The two perpendiculars to aVF are
0o and 180o.
Lead I is positive (i.e., oriented to
the left).
Therefore, the axis has to be 0o.

To determine how much of the voltage in vector A will be recorded in
lead I, a line perpendicular to the axis of lead I is drawn from the tip of
vector A to the lead I axis → projected vector (B) along the lead I axis,
with the arrow toward the positive end of the lead I axis, which means
that the record momentarily being recorded in the electrocardiogram of
lead I is positive.
C – projected vector along the L II axis
D – projected vector along the L III axis
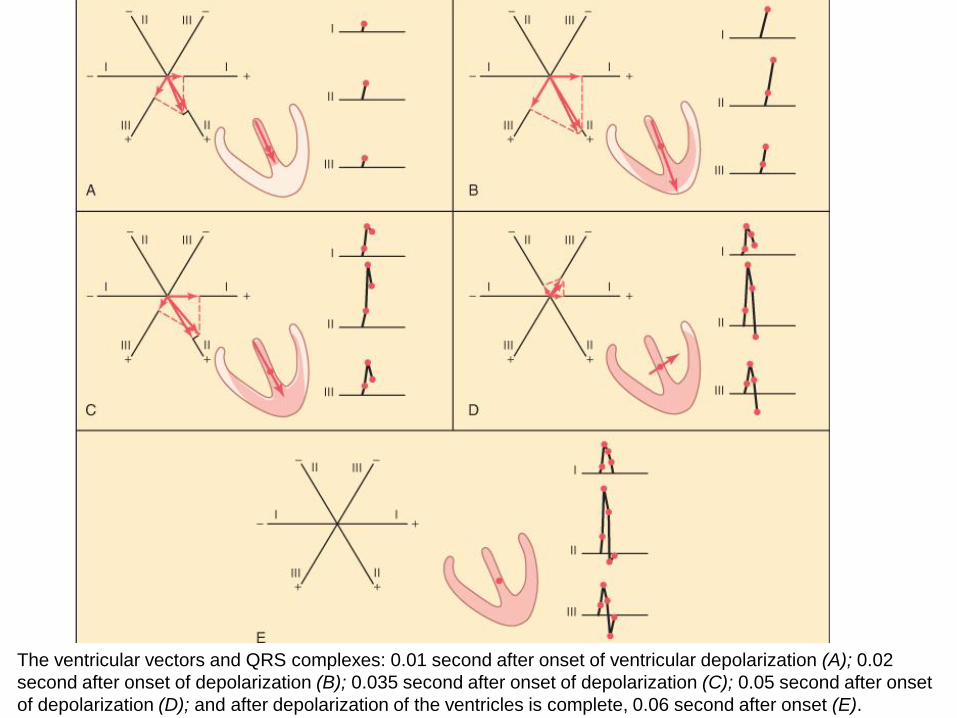
The ventricular vectors and QRS complexes: 0.01 second after onset of ventricular depolarization (A); 0.02
second after onset of depolarization (B); 0.035 second after onset of depolarization (C); 0.05 second after onset
of depolarization (D); and after depolarization of the ventricles is complete, 0.06 second after onset (E).
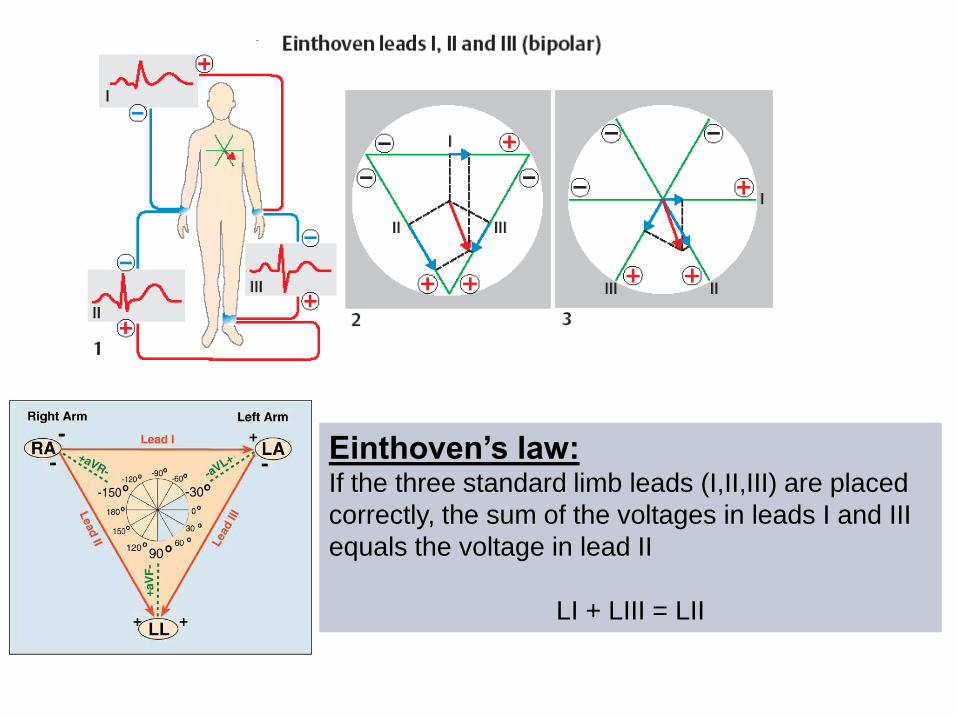
Einthoven’s law: If the three standard limb leads (I,II,III) are placed
correctly, the sum of the voltages in leads I and III
equals the voltage in lead II
LI + LIII = LII
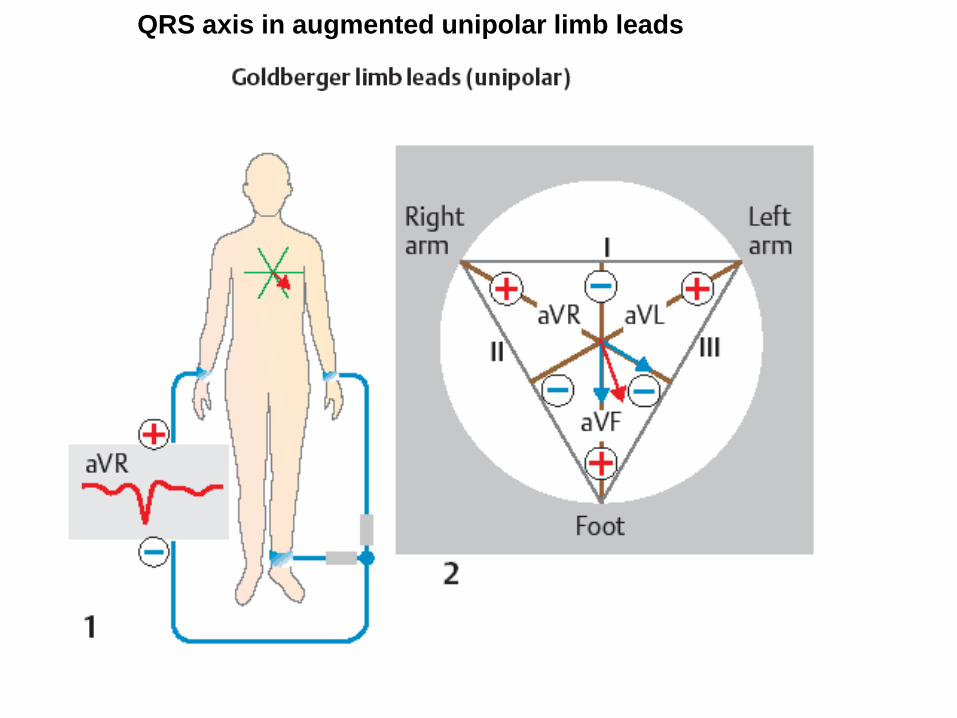
QRS axis in augmented unipolar limb leads
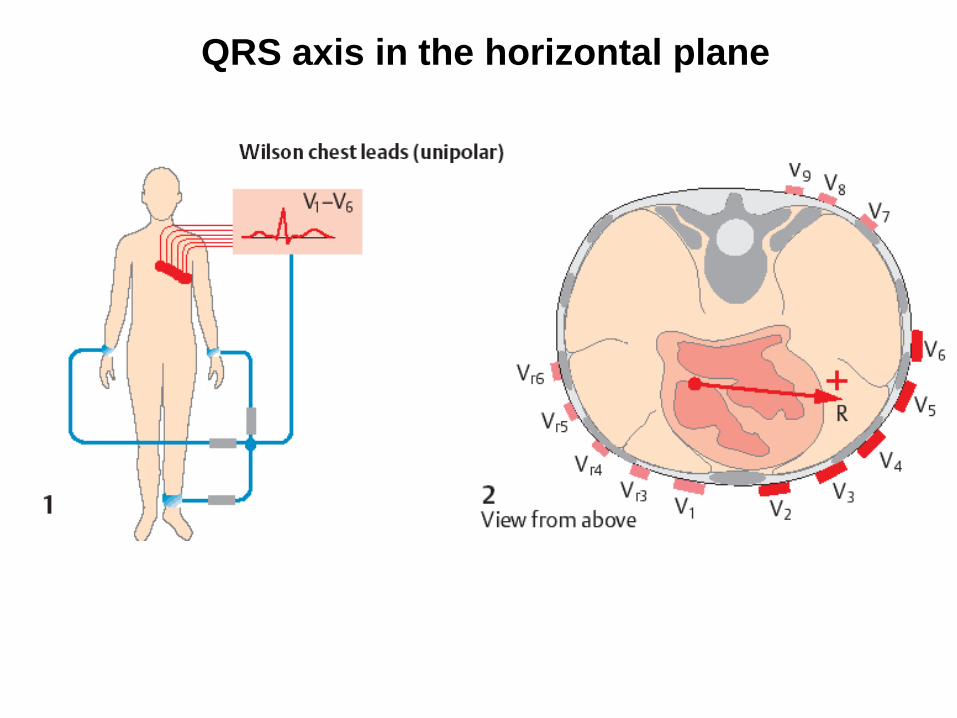
QRS axis in the horizontal plane
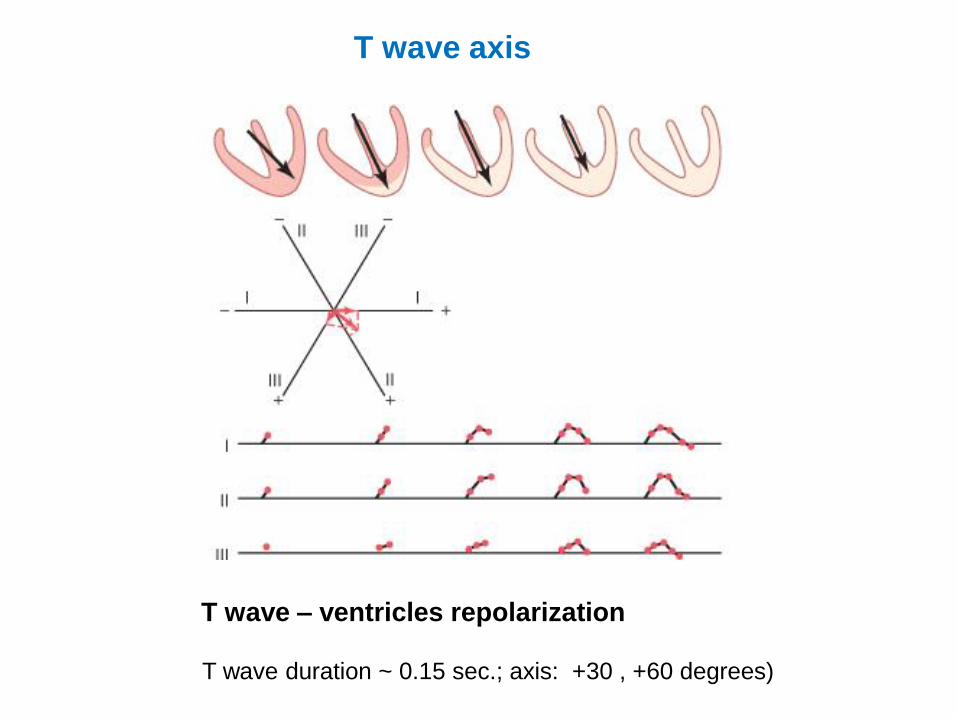
T wave – ventricles repolarization
T wave duration ~ 0.15 sec.; axis: +30 , +60 degrees)
T wave axis
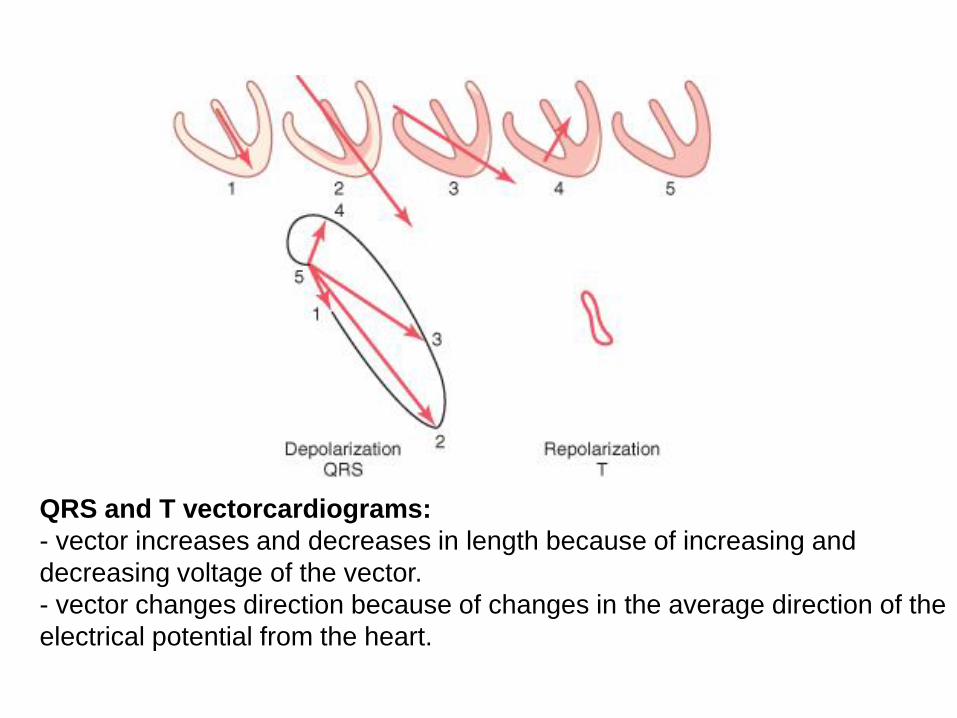
QRS and T vectorcardiograms:
- vector increases and decreases in length because of increasing and
decreasing voltage of the vector.
- vector changes direction because of changes in the average direction of the
electrical potential from the heart.
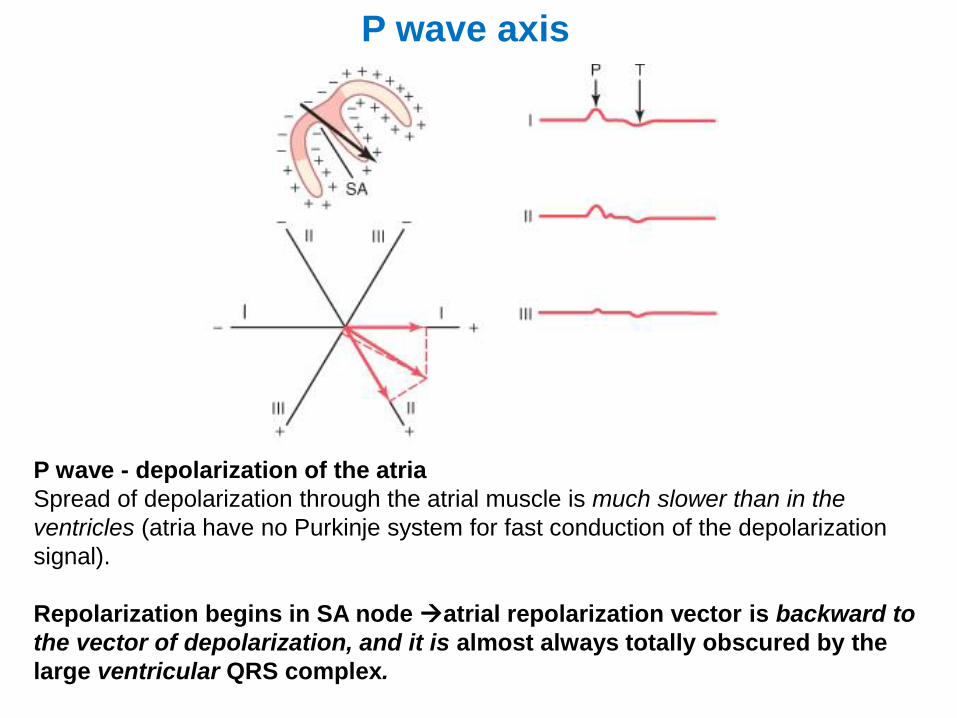
P wave axis
P wave - depolarization of the atria
Spread of depolarization through the atrial muscle is much slower than in the
ventricles (atria have no Purkinje system for fast conduction of the depolarization
signal).
Repolarization begins in SA node →atrial repolarization vector is backward to
the vector of depolarization, and it is almost always totally obscured by the
large ventricular QRS complex.

Analysis of Normal ECG
1. Check ECG calibration
2. Heart rate (frequency)
3. Rhythm of the heart: "normal sinus rhythm"
4. Electrical axis of the heart
5. Measurement of waves, segments, intervals
- the sizes of the voltage changes
- the duration and temporal relationships of the various components
6. Conduction analysis (PR interval, QRS duration, QT interval)
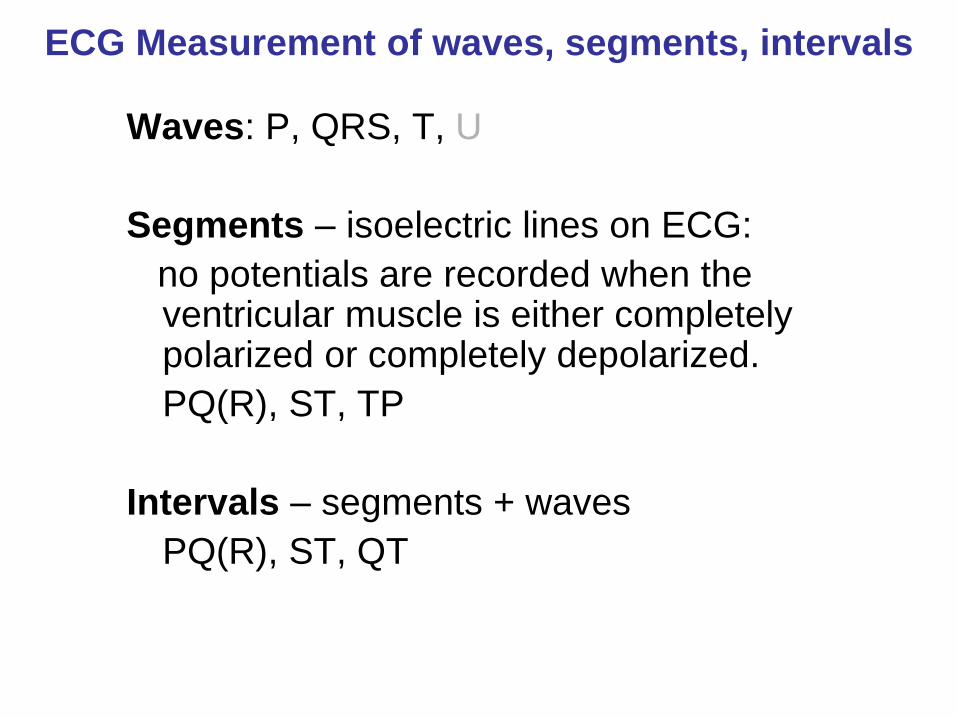
Waves: P, QRS, T, U
Segments – isoelectric lines on ECG:
no potentials are recorded when the ventricular muscle is either completely polarized or completely depolarized.
PQ(R), ST, TP
Intervals – segments + waves
PQ(R), ST, QT
ECG Measurement of waves, segments, intervals
ECG Measurement of waves, segments, intervals
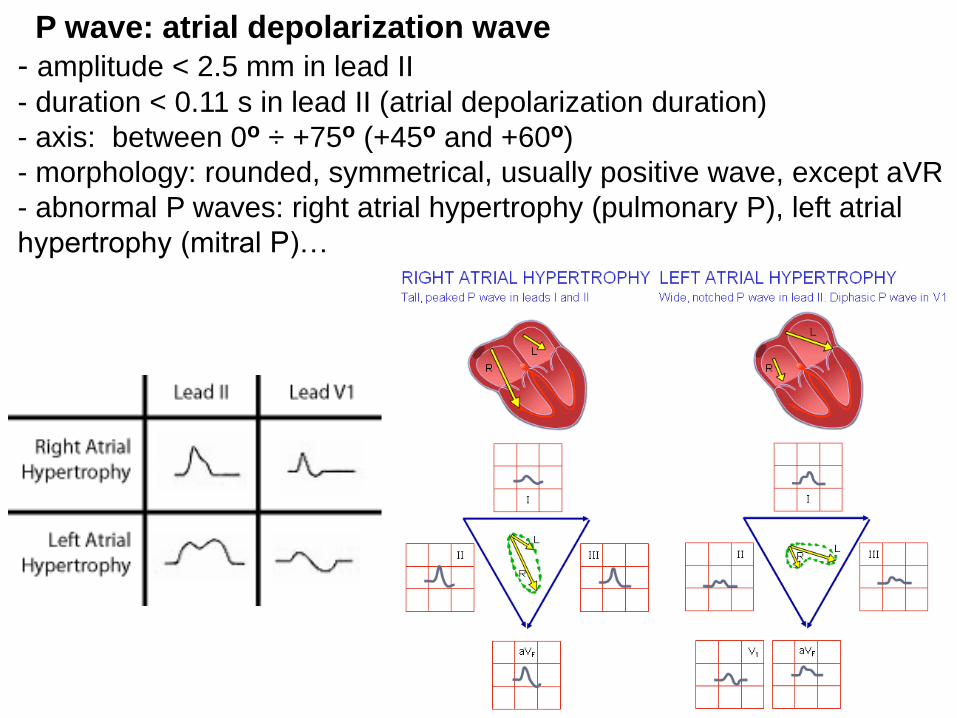
P wave: atrial depolarization wave
- amplitude < 2.5 mm in lead II
- duration < 0.11 s in lead II (atrial depolarization duration)
- axis: between 0o ÷ +75o (+45o and +60o)
- morphology: rounded, symmetrical, usually positive wave, except aVR
- abnormal P waves: right atrial hypertrophy (pulmonary P), left atrial
hypertrophy (mitral P)…
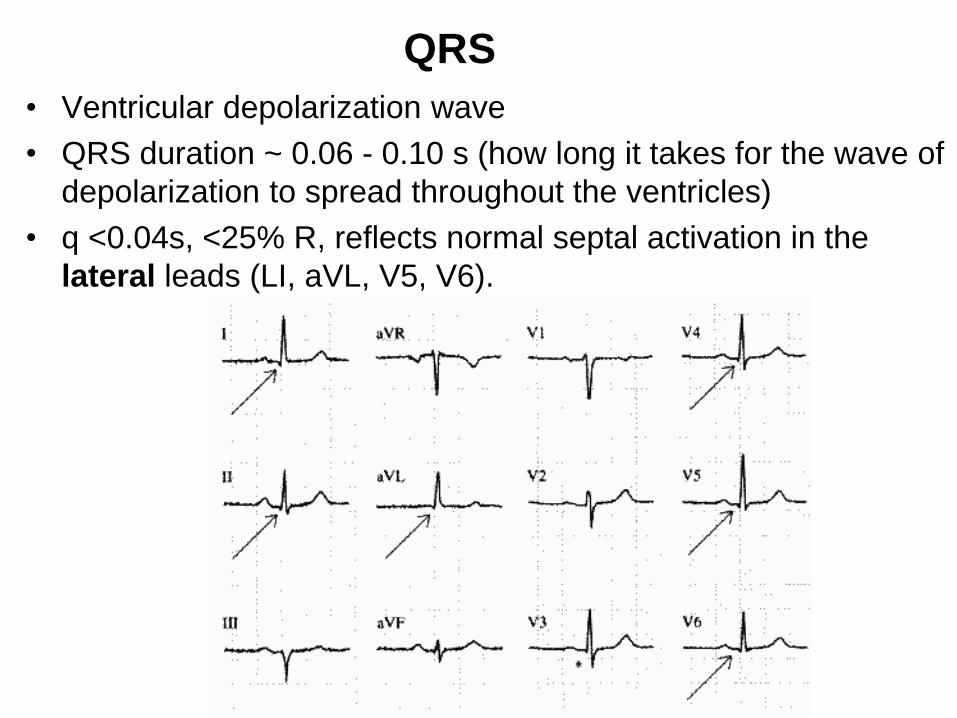
QRS
• Ventricular depolarization wave
• QRS duration ~ 0.06 - 0.10 s (how long it takes for the wave of
depolarization to spread throughout the ventricles)
• q <0.04s, <25% R, reflects normal septal activation in the
lateral leads (LI, aVL, V5, V6).
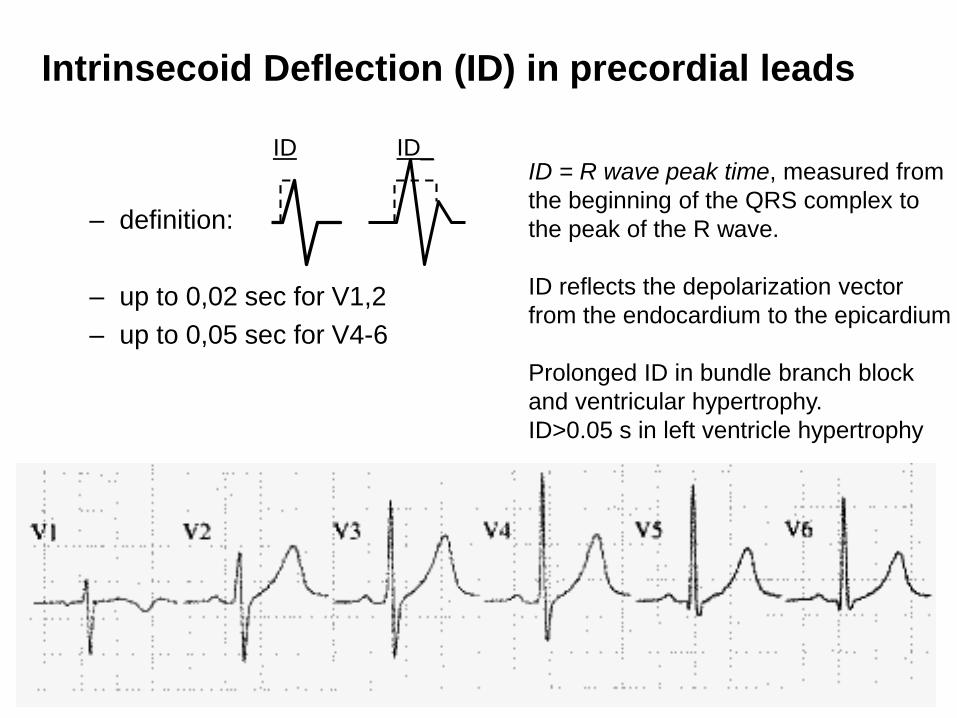
Intrinsecoid Deflection (ID) in precordial leads
– definition:
– up to 0,02 sec for V1,2
– up to 0,05 sec for V4-6
ID ID_ ID = R wave peak time, measured from
the beginning of the QRS complex to
the peak of the R wave.
ID reflects the depolarization vector
from the endocardium to the epicardium
Prolonged ID in bundle branch block
and ventricular hypertrophy.
ID>0.05 s in left ventricle hypertrophy
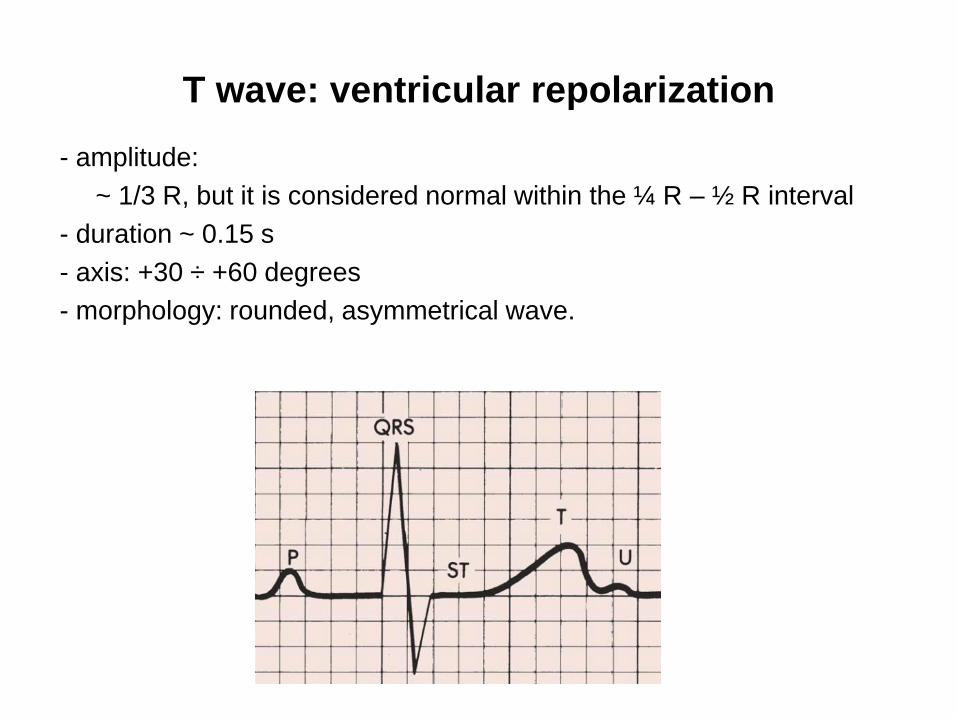
T wave: ventricular repolarization
- amplitude:
~ 1/3 R, but it is considered normal within the ¼ R – ½ R interval
- duration ~ 0.15 s
- axis: +30 ÷ +60 degrees
- morphology: rounded, asymmetrical wave.
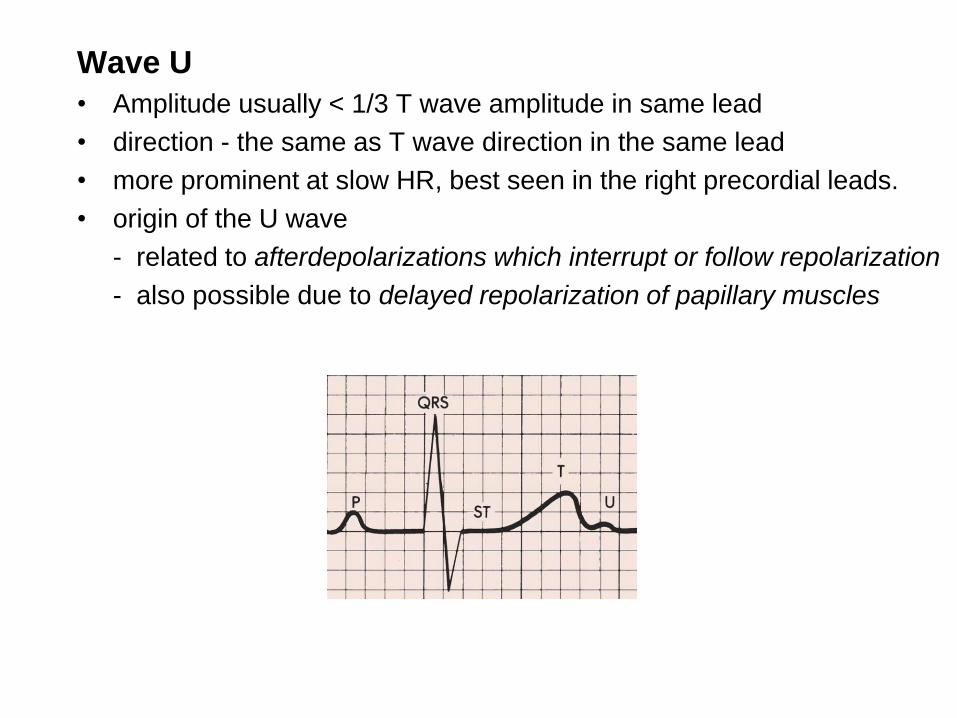
Wave U
• Amplitude usually < 1/3 T wave amplitude in same lead
• direction - the same as T wave direction in the same lead
• more prominent at slow HR, best seen in the right precordial leads.
• origin of the U wave
- related to afterdepolarizations which interrupt or follow repolarization
- also possible due to delayed repolarization of papillary muscles
Analysis of Normal ECG
1. Check ECG calibration
2. Heart rate (frequency)
3. Rhythm of the heart: "normal sinus rhythm"
4. Electrical axis of the heart
5. Measurement of waves, segments, intervals
- the sizes of the voltage changes
- the duration and temporal relationships of the various components
6. Conduction analysis (PR interval, QRS duration, QT interval)
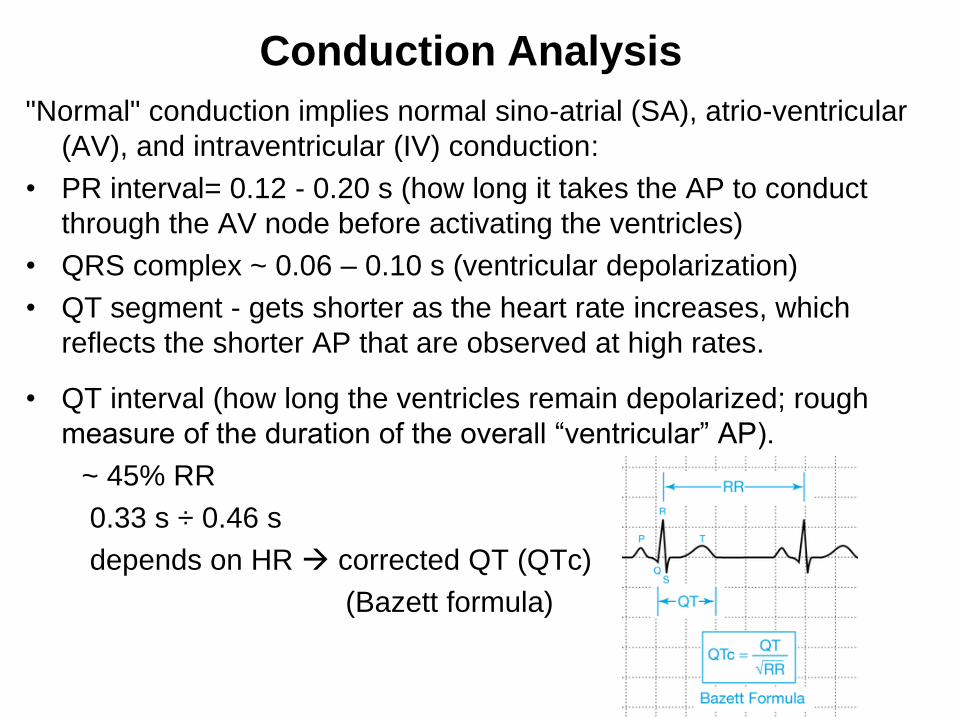
Conduction Analysis
"Normal" conduction implies normal sino-atrial (SA), atrio-ventricular
(AV), and intraventricular (IV) conduction:
• PR interval= 0.12 - 0.20 s (how long it takes the AP to conduct
through the AV node before activating the ventricles)
• QRS complex ~ 0.06 – 0.10 s (ventricular depolarization)
• QT segment - gets shorter as the heart rate increases, which
reflects the shorter AP that are observed at high rates.
• QT interval (how long the ventricles remain depolarized; rough
measure of the duration of the overall “ventricular” AP).
~ 45% RR
0.33 s ÷ 0.46 s
depends on HR → corrected QT (QTc)
(Bazett formula)
+90
+75

+150
+90
+30
0
Related Documents